Exhibit 99.1

November 7, 2024 Jackson Financial Inc. Third Quarter 2024 Financial Results
Forward - Looking Statements and Non - GAAP Measures The information in this document contains forward - looking statements about future events and circumstances and their effects upo n revenues, expenses and business opportunities. Generally speaking, any statement in this document not based upon historical fact is a forward - looking statement. Forward - lookin g statements can also be identified by the use of forward - looking or conditional words, such as “could,” “should,” “can,” “continue,” “estimate,” “forecast,” “intend,” “look,” “m ay,” “will,” “expect,” “believe,” “anticipate,” “plan,” “remain,” “confident” and “commit” or similar expressions. In particular, statements regarding plans, strategies, prospects, tar gets and expectations regarding the business and industry are forward - looking statements. They reflect expectations, are not guarantees of performance and speak only as of the dates the statements are made. We caution investors that these forward - looking statements are subject to known and unknown risks and uncertainties that may cause actual results to differ mate rially from those projected, expressed, or implied. Factors that could cause actual results to differ materially from those in the forward - looking statements include those reflecte d in Part I, Item 1A, Risk Factors and Part II, Item 7, Management’s Discussion and Analysis of Financial Condition and Results of Operations in the Form 10 - K for the year ended Decemb er 31, 2023, as filed with the U.S. Securities and Exchange Commission (“SEC”) on February 28, 2024, and elsewhere in Jackson Financial Inc.’s filings filed with the SEC. Excep t a s required by law, Jackson Financial Inc. does not undertake to update such forward - looking statements. You should not rely unduly on forward - looking statements. Certain financial data included in this document consists of non - GAAP (“Generally Accepted Accounting Principles”) financial mea sures. These non - GAAP financial measures may not be comparable to similarly titled measures presented by other entities, nor should they be construed as an alternative to other fin ancial measures determined in accordance with U.S. GAAP. Although the Company believes these non - GAAP financial measures provide useful information to investors in measuring the f inancial performance and condition of its business, investors are cautioned not to place undue reliance on any non - GAAP financial measures and ratios included in this document. A r econciliation of the non - GAAP financial measures to the most directly comparable U.S. GAAP financial measure can be found under “Non - GAAP Financial Measures” in the Appendix of thi s document. Certain financial data included in this document consists of statutory accounting principles (“statutory”) financial measures , i ncluding “total adjusted capital.” These statutory financial measures are included in or derived from the Jackson National Life Insurance Company (“JNLIC”) annual and/or quarterly statem ent s filed with the Michigan Department of Insurance and Financial Services and available in the investor relations section of the Company’s website at investors.jackson.com/fina nci als/statutory - filings. We routinely use our investor relations website as a primary channel for disclosing key information to our investors, some of wh ich may contain material and previously non - public information. We and certain of our senior executives may also use social media channels to communicate with our investors and th e public about our Company and other matters, and those communications could be deemed to be material information. The information contained on, or that may be accessed throug h, our website, our social media channels, or our executives’ social media channels is not incorporated by reference into and is not part of this document. 1
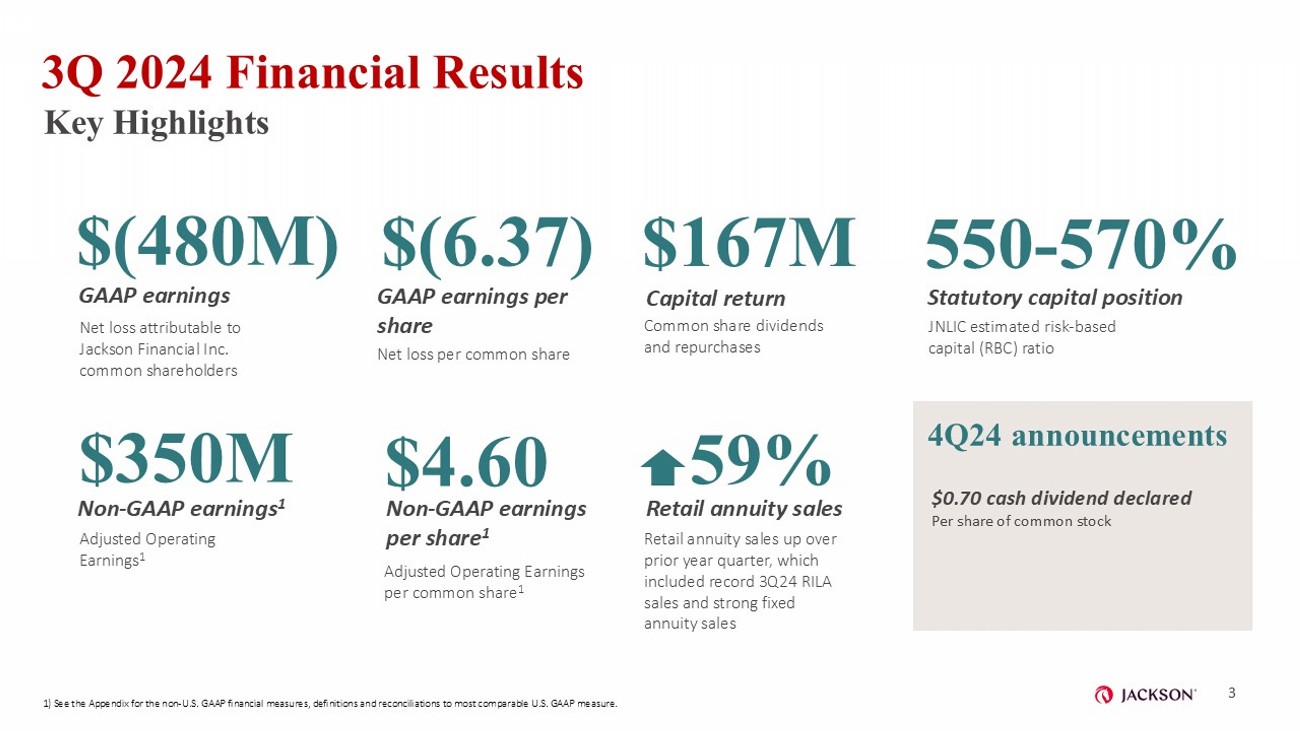
3 Q 2024 Financial Results Key Highlights $(480M) GAAP earnings $350M Non - GAAP earnings 1 $(6.37) GAAP earnings per share $4.60 Non - GAAP earnings per share 1 $167M Capital return $0.70 cash dividend declared Per share of common stock 550 - 570% Statutory capital position 59% Retail annuity sales Net loss attributable to Jackson Financial Inc. common shareholders Net loss per common share Common share dividends and repurchases JNLIC e stimated risk - based capital (RBC) ratio Adjusted Operating Earnings 1 Adjusted Operating Earnings per common share 1 Retail annuity sales up over prior year quarter, which included record 3Q24 RILA sales and strong fixed annuity sales 3 1) See the Appendix for the non - U.S. GAAP financial measures, definitions and reconciliations to most comparable U.S. GAAP measu re. 4Q24 announcements
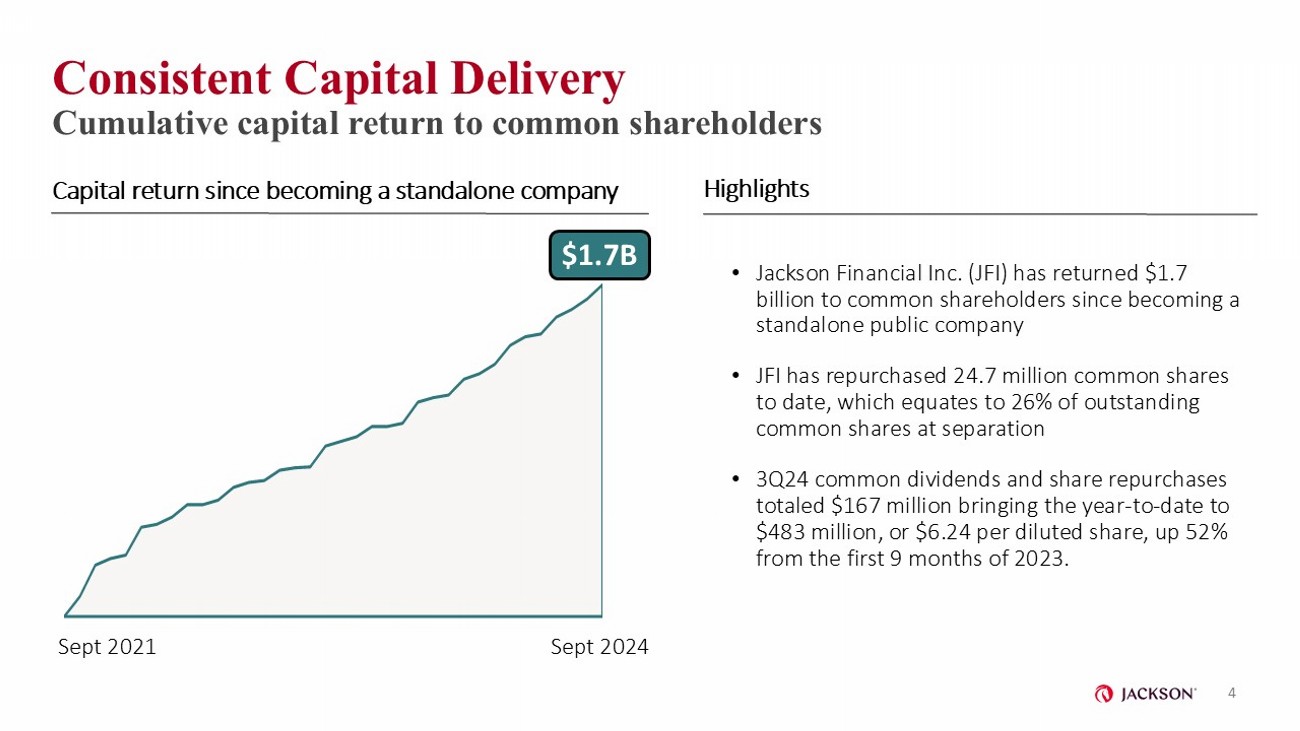
• Jackson Financial Inc. (JFI) has returned $1.7 billion to common shareholders since becoming a standalone public company • JFI has repurchased 24.7 million common shares to date, which equates to 26% of outstanding common shares at separation • 3Q24 common dividends and share repurchases totaled $167 million bringing the year - to - date to $483 million, or $6.24 per diluted share, up 52% from the first 9 months of 2023. Consistent Capital Delivery Cumulative capital return to common shareholders 4 Capital return since becoming a standalone company Highlights Sept 2021 Sept 2024 Oct 2021 Dec 2021 Mar 2022 Jun 2022 Sep 2022 Dec 2022 Mar 2023 Jun 2023 Sep 2023 Dec 2023 Mar 2024 Jun 2024 Sep 2024 $1.7B

425% Risk - Based Capital (RBC) ratio minimum Approximately two years of holding company fixed expenses Estimated JNLIC RBC ratio of 550 - 570% as of 3Q24, after reflecting $550 million of cumulative year to date distributions from JNLIC Holding company cash and highly liquid securities of nearly $650 million as of 3Q24, which is above Jackson’s $250 million minimum liquidity buffer 1 $550 - $650 million capital return to common shareholders In the first nine months of 2024, returned $483 million of capital to common shareholders On Track to Deliver on 2024 Financial Targets 5 Capital Return Holdco Liquidity JNLIC RBC Ratio YTD Progress 2024 Targets 1) Jackson intends to maintain a minimum amount of cash and highly liquid securities at Jackson Financial Inc. adequate to fund two years of holding company fixed net expenses, which is currently targeted at $250 million but may change over time as we refinance existing debt or make changes to our debt and cap ita l structure.
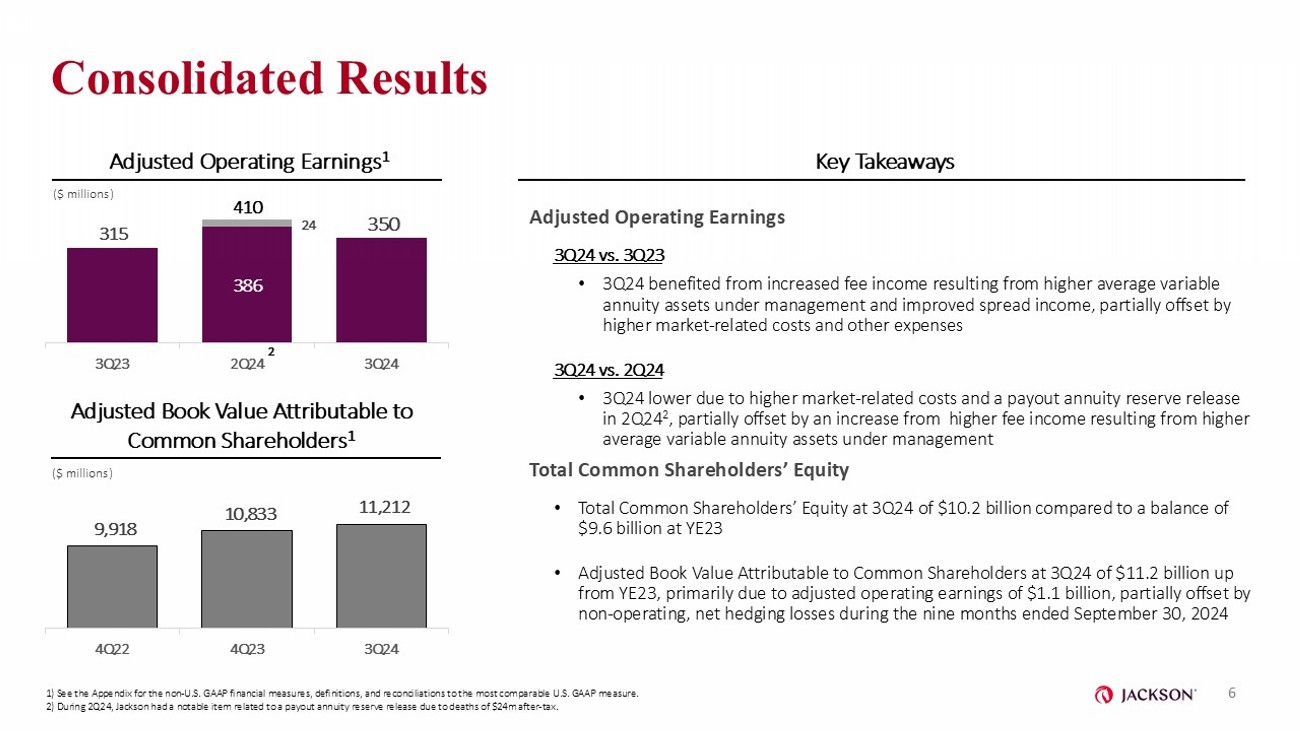
386 315 24 350 3Q23 2Q24 3Q24 410 9,918 10,833 11,212 4Q22 4Q23 3Q24 Consolidated Results Adjusted Operating Earnings 3Q24 vs. 3Q23 • 3Q24 benefited from increased fee income resulting from higher average variable annuity assets under management and improved spread income, partially offset by higher market - related costs and other expenses 3Q24 vs. 2Q24 • 3Q24 lower due to higher market - related costs and a payout annuity reserve release in 2Q24 2 , partially offset by an increase from higher fee income resulting from higher average variable annuity assets under management Total Common Shareholders’ Equity • Total Common Shareholders’ Equity at 3Q24 of $10.2 billion compared to a balance of $9.6 billion at YE23 • Adjusted Book Value Attributable to Common Shareholders at 3Q24 of $11.2 billion up from YE23, primarily due to adjusted operating earnings of $1.1 billion, partially offset by non - operating, net hedging losses during the nine months ended September 30, 2024 Adjusted Operating Earnings 1 ($ millions) Adjusted Book Value Attributable to Common Shareholders 1 ($ millions) Key Takeaways 1) See the Appendix for the non - U.S. GAAP financial measures, definitions, and reconciliations to the most comparable U.S. GAAP measure. 2) During 2Q24, Jackson had a notable item related to a payout annuity reserve release due to deaths of $24m after - tax. 6 2
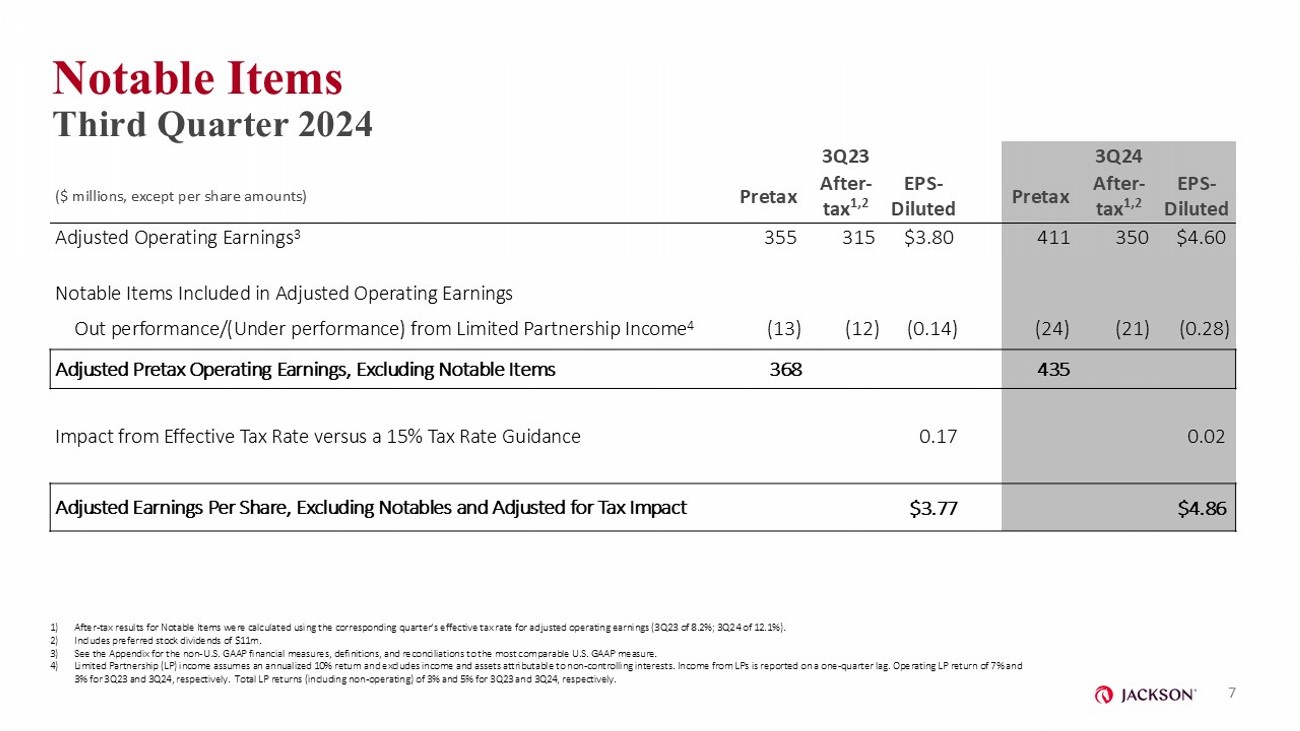
Notable Items Third Quarter 2024 3Q24 3Q23 EPS - Diluted After - tax 1,2 Pretax EPS - Diluted After - tax 1,2 Pretax ($ millions, except per share amounts) $4.60 350 411 $3.80 315 355 Adjusted Operating Earnings 3 Notable Items Included in Adjusted Operating Earnings (0.28) (21) (24) (0.14) (12) (13) Out performance/(Under performance) from Limited Partnership Income 4 435 368 Adjusted Pretax Operating Earnings, Excluding Notable Items 0.02 0.17 Impact from Effective Tax Rate versus a 15% Tax Rate Guidance $4.86 $3.77 Adjusted Earnings Per Share, Excluding Notables and Adjusted for Tax Impact 1) After - tax results for Notable Items were calculated using the corresponding quarter’s effective tax rate for adjusted operating earnings (3Q23 of 8.2%; 3Q24 of 12.1%). 2) Includes preferred stock dividends of $11m. 3) See the Appendix for the non - U.S. GAAP financial measures, definitions, and reconciliations to the most comparable U.S. GAAP mea sure. 4) Limited Partnership (LP) income assumes an annualized 10% return and excludes income and assets attributable to non - controlling interests. Income from LPs is reported on a one - quarter lag. Operating LP return of 7% and 3% for 3Q23 and 3Q24, respectively. Total LP returns (including non - operating) of 3% and 5% for 3Q23 and 3Q24, respectively. 7
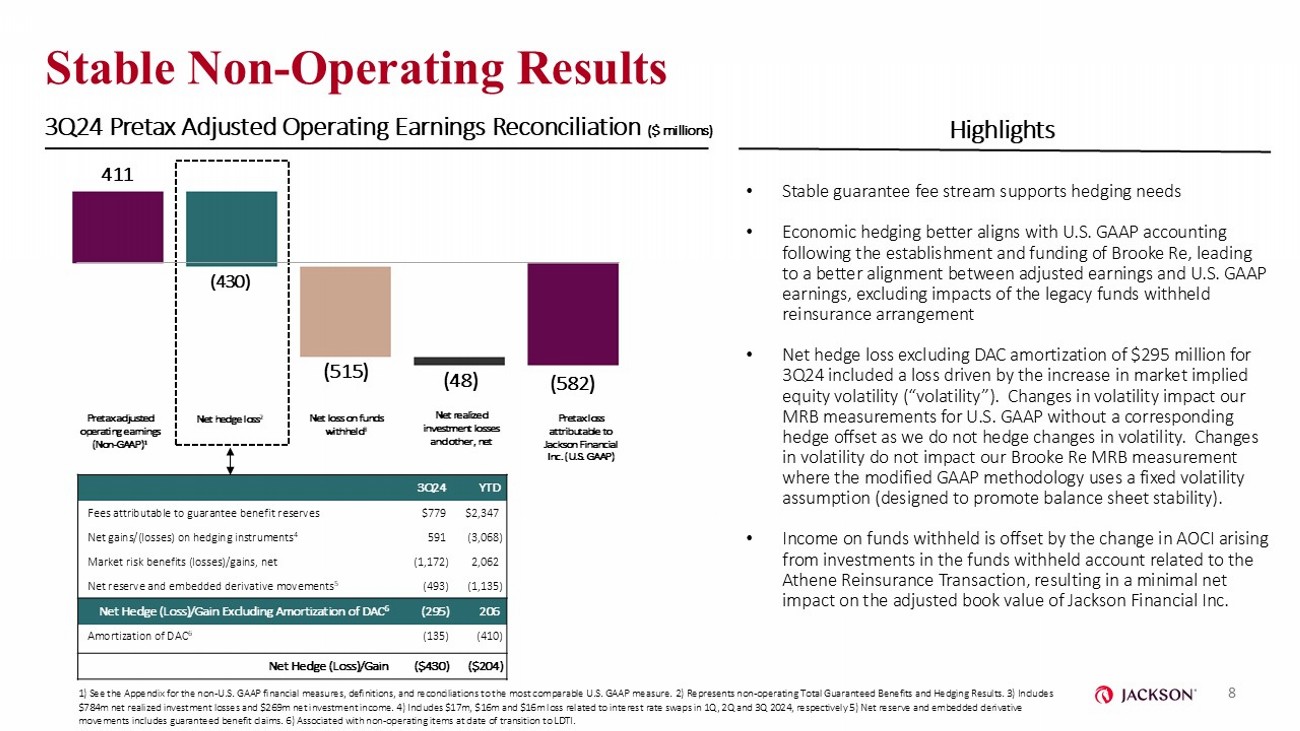
Stable Non - Operating Results Pretax loss attributable to Jackson Financial Inc. (U.S. GAAP) Pretax adjusted operating earnings (Non - GAAP) 1 Net loss on funds withheld 3 (582) 1) See the Appendix for the non - U.S. GAAP financial measures, definitions, and reconciliations to the most comparable U.S. GAAP measure. 2) Represents non - operating Total Guaranteed Benefits and Hedging Results. 3) Includes $784m net realized investment losses and $269m net investment income. 4) Includes $17m, $16m and $16m loss related to interes t r ate swaps in 1Q, 2Q and 3Q 2024, respectively 5) Net reserve and embedded derivative movements includes guaranteed benefit claims. 6) Associated with non - operating items at date of transition to LDTI. (48) 411 3Q24 Pretax Adjusted Operating Earnings Reconciliation ($ millions) (430) 8 (515) Net hedge loss 2 Net realized investment losses and other, net • Stable guarantee fee stream supports hedging needs • Economic hedging better aligns with U.S. GAAP accounting following the establishment and funding of Brooke Re, leading to a better alignment between adjusted earnings and U.S. GAAP earnings, excluding impacts of the legacy funds withheld reinsurance arrangement • Net hedge loss excluding DAC amortization of $295 million for 3Q24 included a loss driven by the increase in market implied equity volatility (“volatility”). Changes in volatility impact our MRB measurements for U.S. GAAP without a corresponding hedge offset as we do not hedge changes in volatility. Changes in volatility do not impact our Brooke Re MRB measurement where the modified GAAP methodology uses a fixed volatility assumption (designed to promote balance sheet stability). • Income on funds withheld is offset by the change in AOCI arising from investments in the funds withheld account related to the Athene Reinsurance Transaction, resulting in a minimal net impact on the adjusted book value of Jackson Financial Inc. Highlights YTD 3Q24 $2,347 $779 Fees attributable to guarantee benefit reserves (3,068) 591 Net gains/(losses) on hedging instruments 4 2,062 (1,172) Market risk benefits (losses)/gains, net (1,135) (493) Net reserve and embedded derivative movements 5 206 (295) Net Hedge (Loss)/Gain Excluding Amortization of DAC 6 (410) (135) Amortization of DAC 6 ($204) ($430) Net Hedge (Loss)/Gain
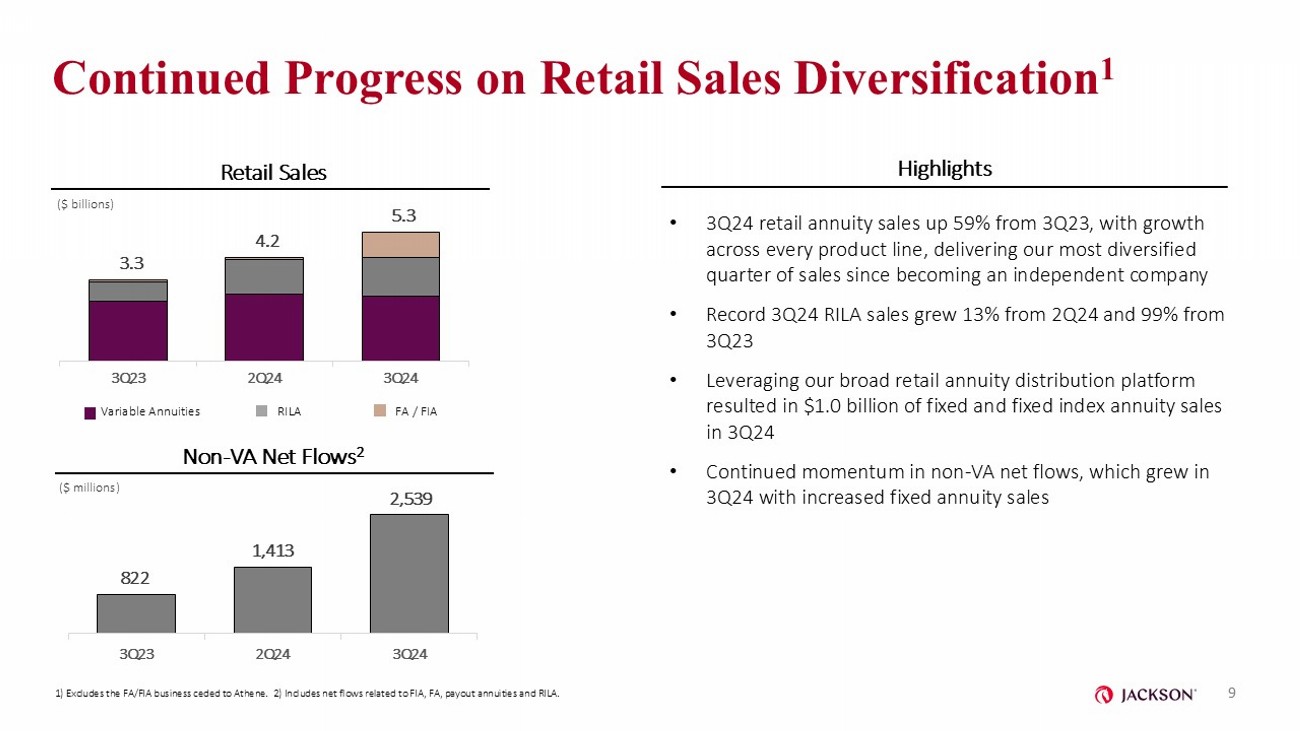
3.3 4.2 5.3 3Q23 2Q24 3Q24 822 1,413 2,539 3Q23 2Q24 3Q24 Continued Progress on Retail Sales Diversification 1 • 3Q24 retail annuity sales up 59% from 3Q23, with growth across every product line, delivering our most diversified quarter of sales since becoming an independent company • Record 3Q24 RILA sales grew 13% from 2Q24 and 99% from 3Q23 • Leveraging our broad retail annuity distribution platform resulted in $1.0 billion of fixed and fixed index annuity sales in 3Q24 • Continued momentum in non - VA net flows, which grew in 3Q24 with increased fixed annuity sales Retail Sales ($ billions) Non - VA Net Flows 2 Highlights 1) Excludes the FA/FIA business ceded to Athene. 2) Includes net flows related to FIA, FA, payout annuities and RILA. Variable Annuities RILA FA / FIA 9 ($ millions)
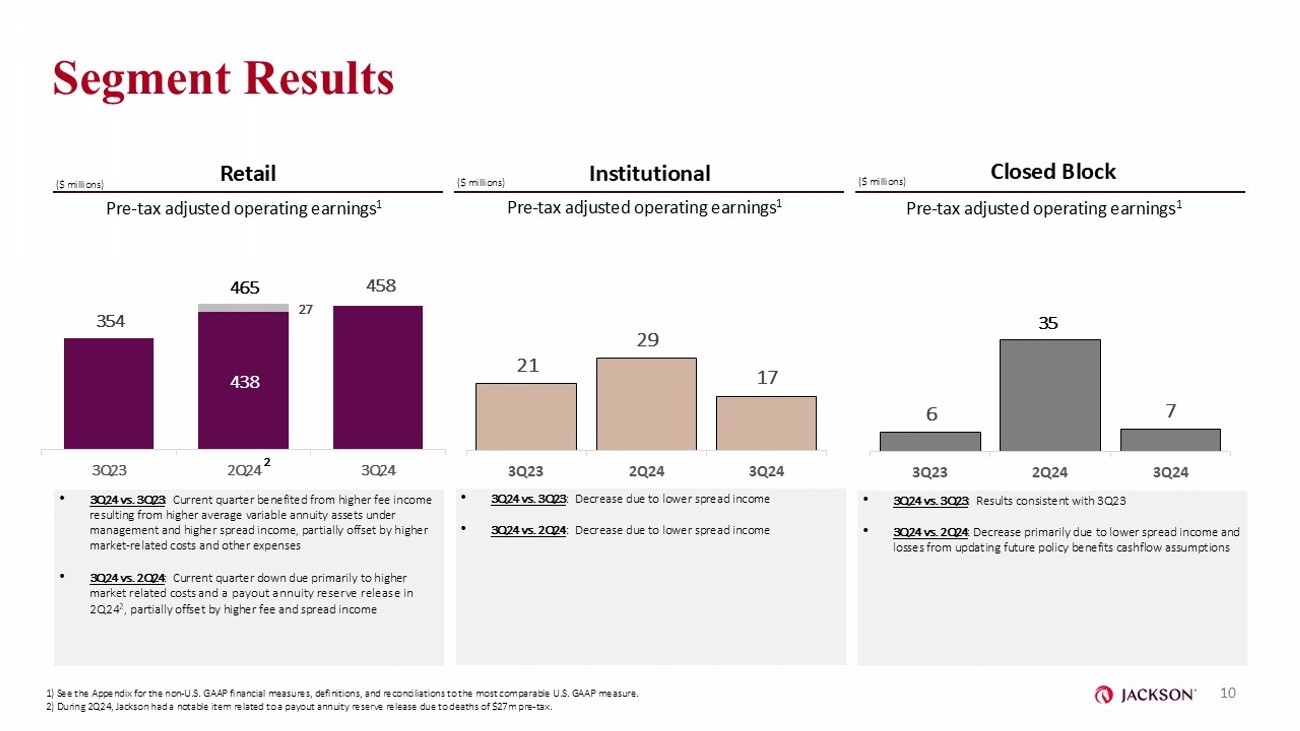
Segment Results Retail Institutional Closed Block • 3Q24 vs. 3Q23 : Results consistent with 3Q23 • 3Q24 vs. 2Q24 : Decrease primarily due to lower spread income and losses from updating future policy benefits cashflow assumptions • 3Q24 vs. 3Q23 : Current quarter benefited from higher fee income resulting from higher average variable annuity assets under management and higher spread income, partially offset by higher market - related costs and other expenses • 3Q24 vs. 2Q24 : Current quarter down due primarily to higher market related costs and a payout annuity reserve release in 2Q24 2 , partially offset by higher fee and spread income ($ millions) ($ millions) 6 35 7 3Q23 2Q24 3Q24 21 29 17 3Q23 2Q24 3Q24 ($ millions) ($ millions) ($ millions) Pre - tax adjusted operating earnings 1 Pre - tax adjusted operating earnings 1 Pre - tax adjusted operating earnings 1 • 3Q24 vs. 3Q23 : Decrease due to lower spread income • 3Q24 vs. 2Q24 : Decrease due to lower spread income 10 438 354 27 458 3Q23 2Q24 3Q24 465 2 1) See the Appendix for the non - U.S. GAAP financial measures, definitions, and reconciliations to the most comparable U.S. GAAP measure. 2) During 2Q24, Jackson had a notable item related to a payout annuity reserve release due to deaths of $27m pre - tax.
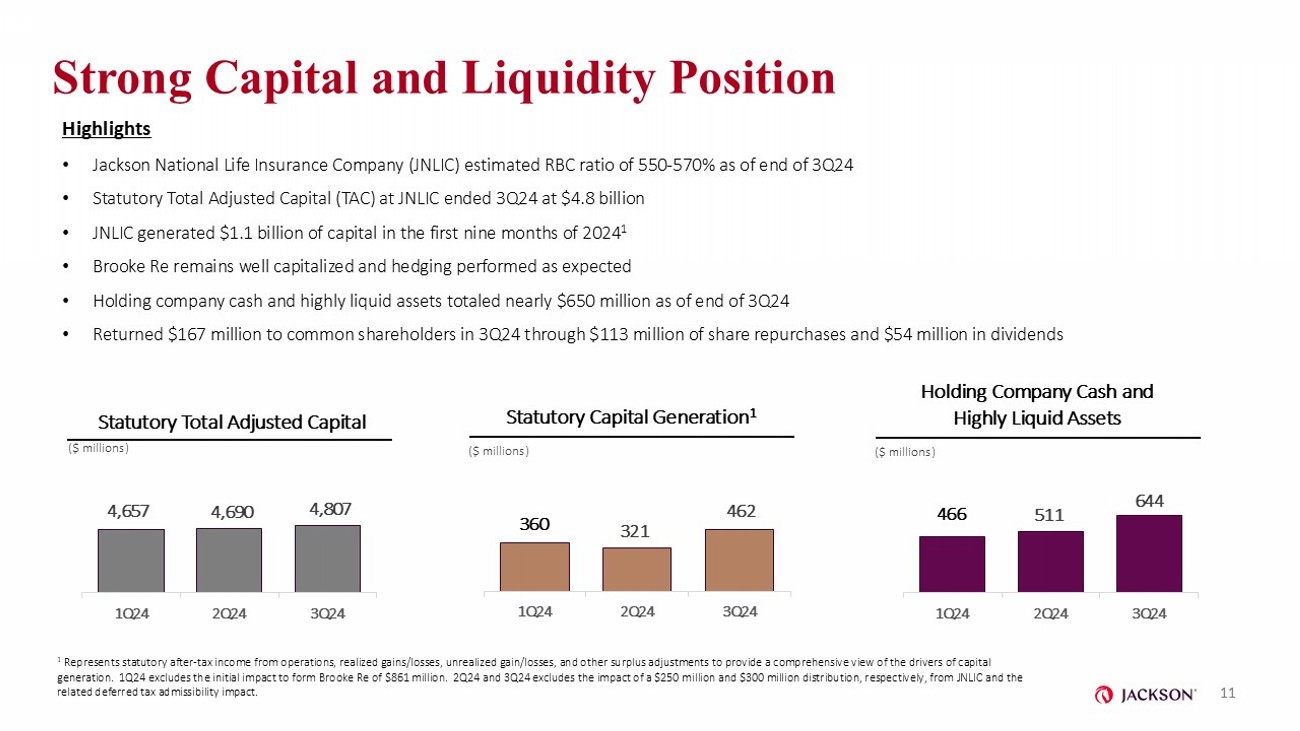
Strong Capital and Liquidity Position Highlights • Jackson National Life Insurance Company (JNLIC) estimated RBC ratio of 550 - 570% as of end of 3Q24 • Statutory Total Adjusted Capital (TAC) at JNLIC ended 3Q24 at $4.8 billion • JNLIC generated $1.1 billion of capital in the first nine months of 2024 1 • Brooke Re remains well capitalized and hedging performed as expected • Holding company cash and highly liquid assets totaled nearly $650 million as of end of 3Q24 • Returned $167 million to common shareholders in 3Q24 through $113 million of share repurchases and $54 million in dividends 11 4,657 4,690 4,807 1Q24 2Q24 3Q24 360 321 462 1Q24 2Q24 3Q24 Statutory Total Adjusted Capital ($ millions) Statutory Capital Generation 1 ($ millions) 1 Represents statutory after - tax income from operations, realized gains/losses, unrealized gain/losses, and other surplus adjustm ents to provide a comprehensive view of the drivers of capital generation. 1Q24 excludes the initial impact to form Brooke Re of $861 million. 2Q24 and 3Q24 excludes the impact of a $250 mi llion and $300 million distribution, respectively, from JNLIC and the related deferred tax admissibility impact. 466 511 644 1Q24 2Q24 3Q24 Holding Company Cash and Highly Liquid Assets ($ millions)
12 Continued Performance Against Targets Remains Positive 12 On track to achieve 2024 key financial targets Maintained strong balance sheet and robust levels of liquidity Demonstrated distribution strength and consistent capital generation Well - positioned for continued long - term value creation for shareholders

Investments
14 High Quality, Diversified Investment Portfolio 14 Corporate portfolio is concentrated in investment - grade securities Highly rated and diversified commercial mortgage loan office portfolio, which is less than 2% of the general account portfolio Strategic, conservative underwriting across our portfolio
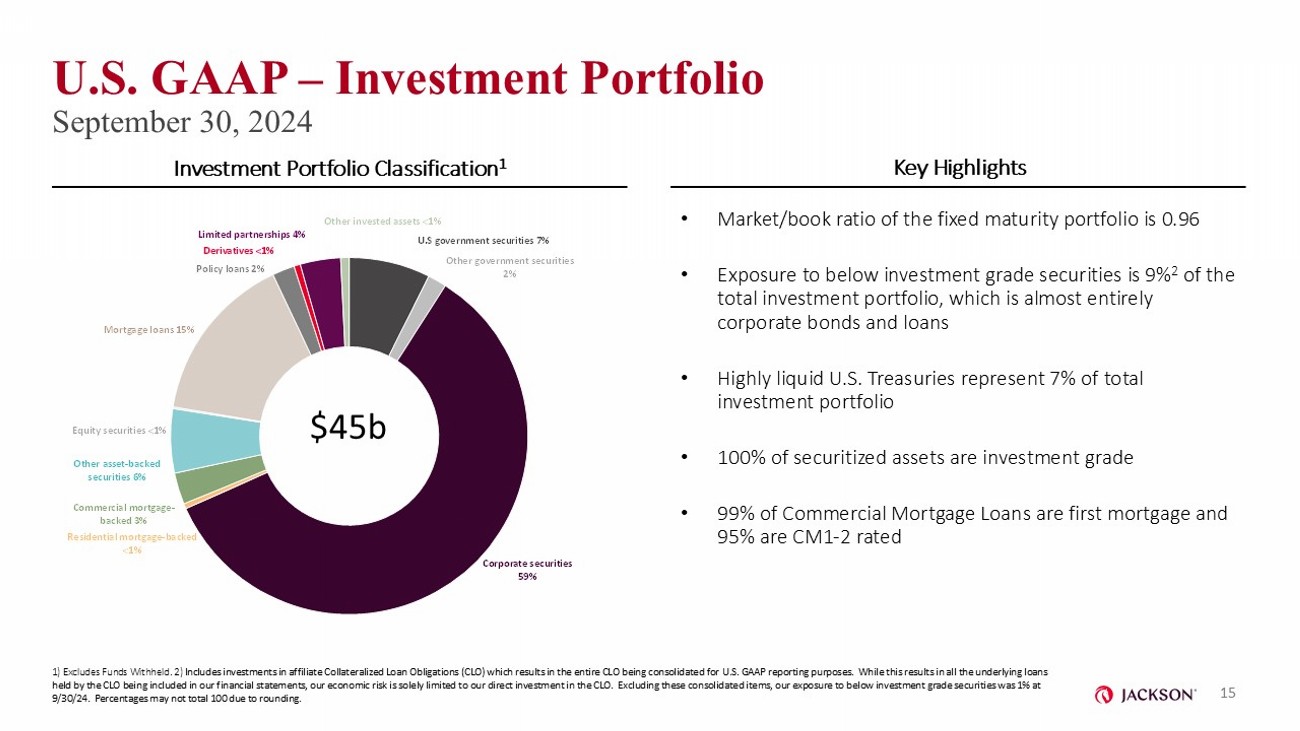
U.S government securities 7% Other government securities 2% Corporate securities 59% Residential mortgage - backed <1% Commercial mortgage - backed 3% Other asset - backed securities 6% Equity securities <1% Mortgage loans 15% Policy loans 2% Derivatives <1% Limited partnerships 4% Other invested assets <1% U.S. GAAP – Investment Portfolio September 30, 2024 • Market/book ratio of the fixed maturity portfolio is 0.96 • Exposure to below investment grade securities is 9% 2 of the total investment portfolio, which is almost entirely corporate bonds and loans • Highly liquid U.S. Treasuries represent 7% of total investment portfolio • 100% of securitized assets are investment grade • 99% of Commercial Mortgage Loans are first mortgage and 95% are CM1 - 2 rated Investment Portfolio Classification 1 Key Highlights 1) Excludes Funds Withheld. 2) I ncludes investments in affiliate Collateralized Loan Obligations (CLO) which results in the entire CLO being consolidated for U. S. GAAP reporting purposes. While this results in all the underlying loans held by the CLO being included in our financial statements, our economic risk is solely limited to our direct investment in t he CLO. Excluding these consolidated items, our exposure to below investment grade securities was 1 % at 9/30/24. Percentages may not total 100 due to rounding. $45b 15
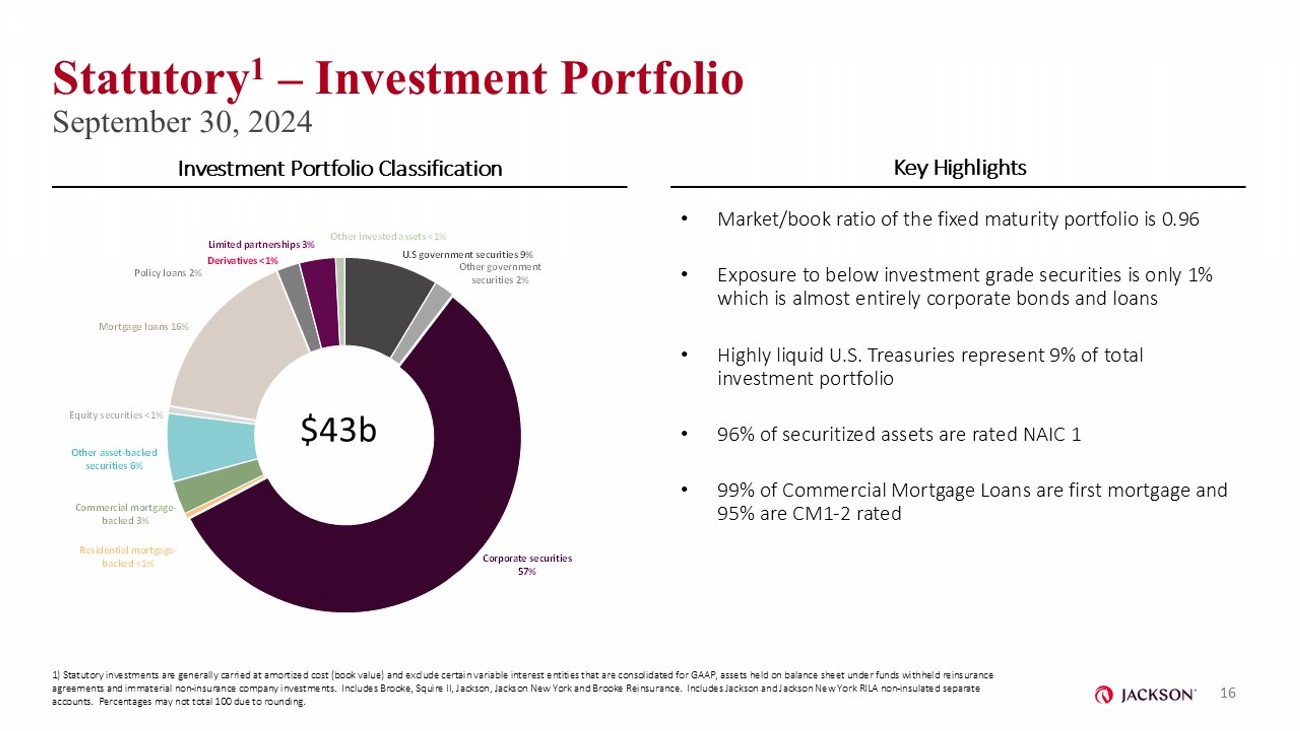
U.S government securities 9% Other government securities 2% Corporate securities 57% Residential mortgage - backed <1% Commercial mortgage - backed 3% Other asset - backed securities 6% Equity securities <1% Mortgage loans 16% Policy loans 2% Derivatives <1% Limited partnerships 3% Other invested assets <1% Statutory 1 – Investment Portfolio September 30, 2024 Investment Portfolio Classification Key Highlights • Market/book ratio of the fixed maturity portfolio is 0.96 • Exposure to below investment grade securities is only 1% which is almost entirely corporate bonds and loans • Highly liquid U.S. Treasuries represent 9% of total investment portfolio • 96% of securitized assets are rated NAIC 1 • 99% of Commercial Mortgage Loans are first mortgage and 95% are CM1 - 2 rated 16 $43b 1) Statutory investments are generally carried at amortized cost (book value) and exclude certain variable interest entities tha t are consolidated for GAAP, assets held on balance sheet under funds withheld reinsurance agreements and immaterial non - insurance company investments. Includes Brooke, Squire II, Jackson, Jackson New York and Brooke R einsurance. Includes Jackson and Jackson New York RILA non - insulated separate accounts. Percentages may not total 100 due to rounding.

US Treasuries 11% NAIC 1A - 1D (AAA - AA - ) 17% NAIC 1E - 1G (A) 33% NAIC 2A - 2C (BBB) 37% NAIC 3A - 3C (BB) 1% NAIC 4A - 4C (B) <1% NAIC 5/6 <0.1% Statutory – Fixed Maturity Rating Distribution September 30, 2024 $33b 17 98% of portfolio is investment grade Note: Percentages may not total 100 due to rounding.
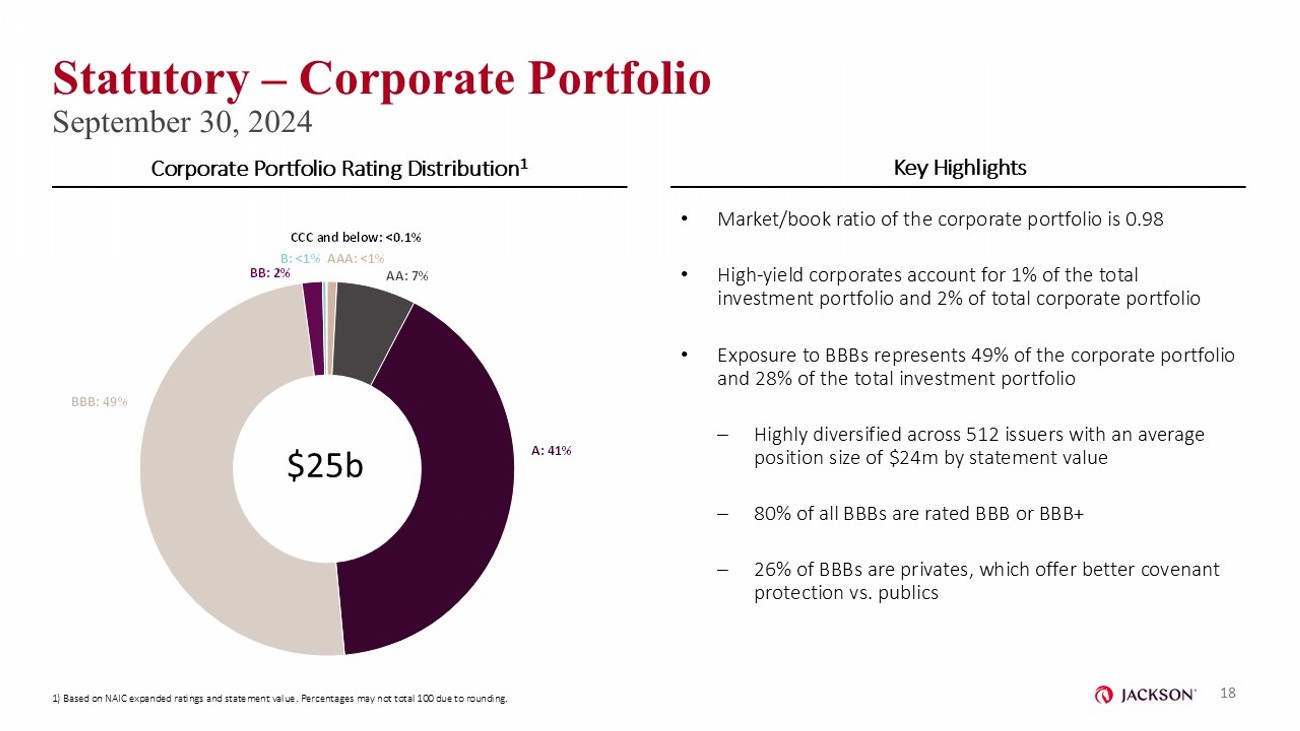
AAA: <1% AA: 7% A: 41% BBB: 49% BB: 2% B: <1% CCC and below: <0.1% Statutory – Corporate Portfolio September 30, 2024 Corporate Portfolio Rating Distribution 1 Key Highlights • Market/book ratio of the corporate portfolio is 0.98 • High - yield corporates account for 1% of the total investment portfolio and 2% of total corporate portfolio • Exposure to BBBs represents 49% of the corporate portfolio and 28% of the total investment portfolio ‒ Highly diversified across 512 issuers with an average position size of $24m by statement value ‒ 80% of all BBBs are rated BBB or BBB+ ‒ 26% of BBBs are privates, which offer better covenant protection vs. publics $25b 18 1) Based on NAIC expanded ratings and statement value. Percentages may not total 100 due to rounding.
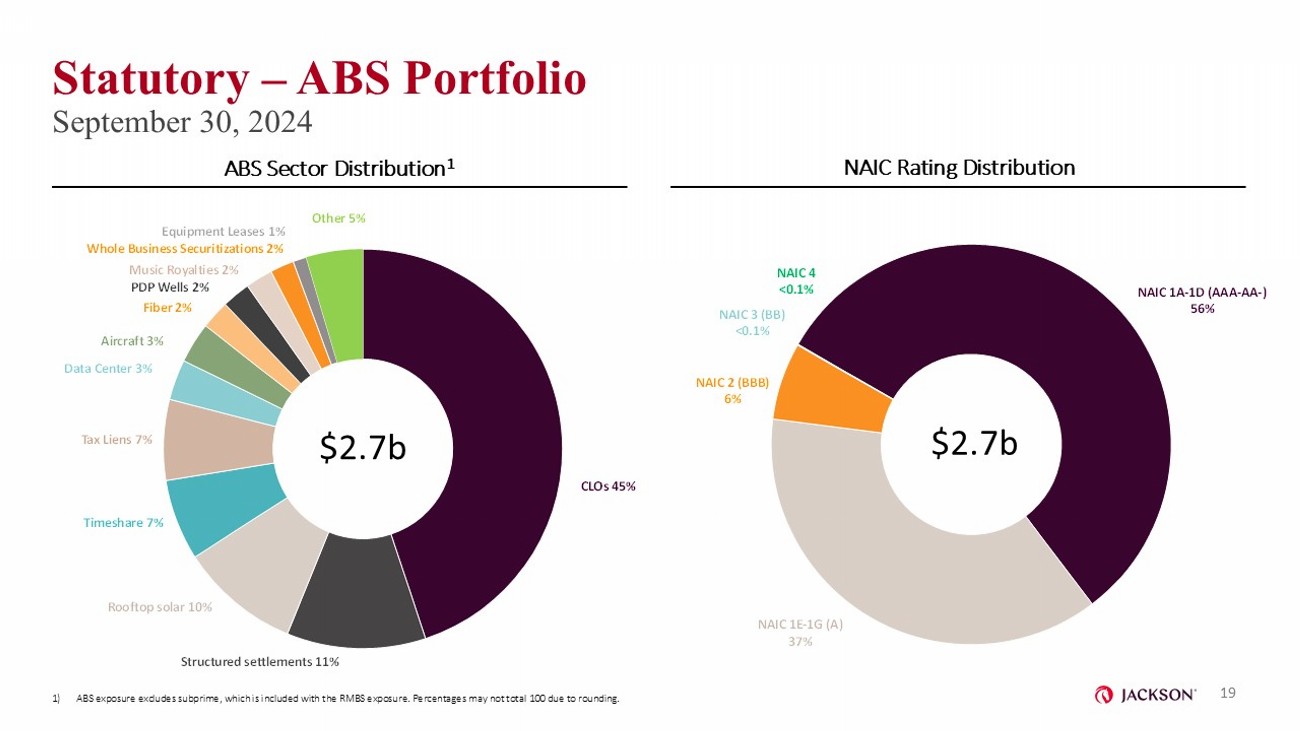
Statutory – ABS Portfolio September 30, 2024 $2.7b ABS Sector Distribution 1 NAIC Rating Distribution $2.7b 19 1) ABS exposure excludes subprime, which is included with the RMBS exposure. Percentages may not total 100 due to rounding. CLOs 45% Structured settlements 11% Rooftop solar 10% Timeshare 7% Tax Liens 7% Data Center 3% Aircraft 3% Fiber 2% PDP Wells 2% Music Royalties 2% Whole Business Securitizations 2% Equipment Leases 1% Other 5% NAIC 1A - 1D (AAA - AA - ) 56% NAIC 1E - 1G (A) 37% NAIC 2 (BBB) 6% NAIC 3 (BB) <0.1% NAIC 4 <0.1%
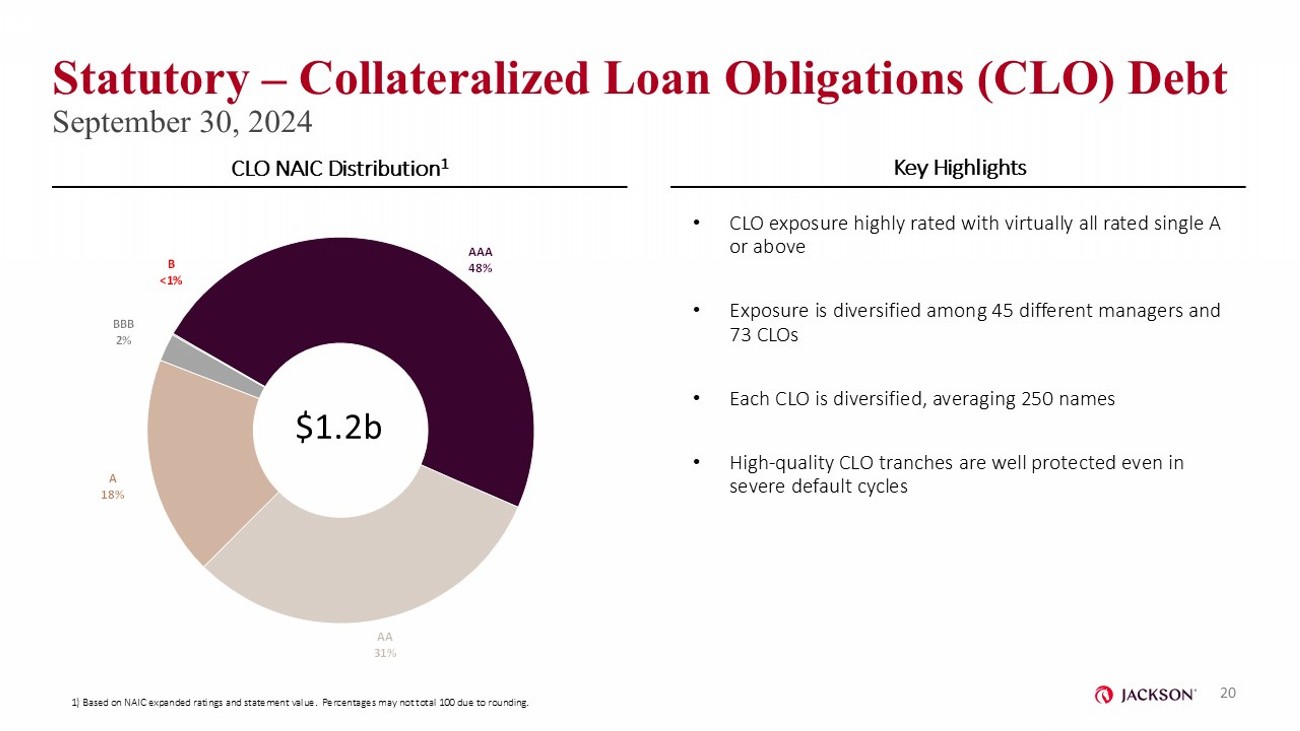
AAA 48% AA 31% A 18% BBB 2% B <1% Statutory – Collateralized Loan Obligations (CLO) Debt September 30, 2024 CLO NAIC Distribution 1 Key Highlights • CLO exposure highly rated with virtually all rated single A or above • Exposure is diversified among 45 different managers and 73 CLOs • Each CLO is diversified, averaging 250 names • High - quality CLO tranches are well protected even in severe default cycles $1.2b 20 1) Based on NAIC expanded ratings and statement value. Percentages may not total 100 due to rounding.

Office , 13% Retail , 8% Industrial , 8% Multi - family , 6% Hotel , 5% Other , 1% Single Asset/Single Borrower 41% Agency 4% Conduit 55% Statutory – Commercial Mortgage - Backed Securities (CMBS) September 30, 2024 CMBS Distribution Key Highlights • 95% are rated AA - or higher • 55% of CMBS portfolio are diversified pools of commercial mortgages (“Conduit”) • 65% are senior AAA and guaranteed Agency tranches • 32% average credit enhancement for the portfolio (excluding guaranteed agency bonds) • Single Asset/Single Borrower ($537 million) ‒ 34% average credit enhancement and 45% in the senior tranche ‒ $168 million of Office - related Single Asset/Single Borrower with 95% having the highest NAIC rating of 1A $1.3b 21 CMBS Single Asset/Single Borrower Distribution Note: Percentages may not total 100 due to rounding.
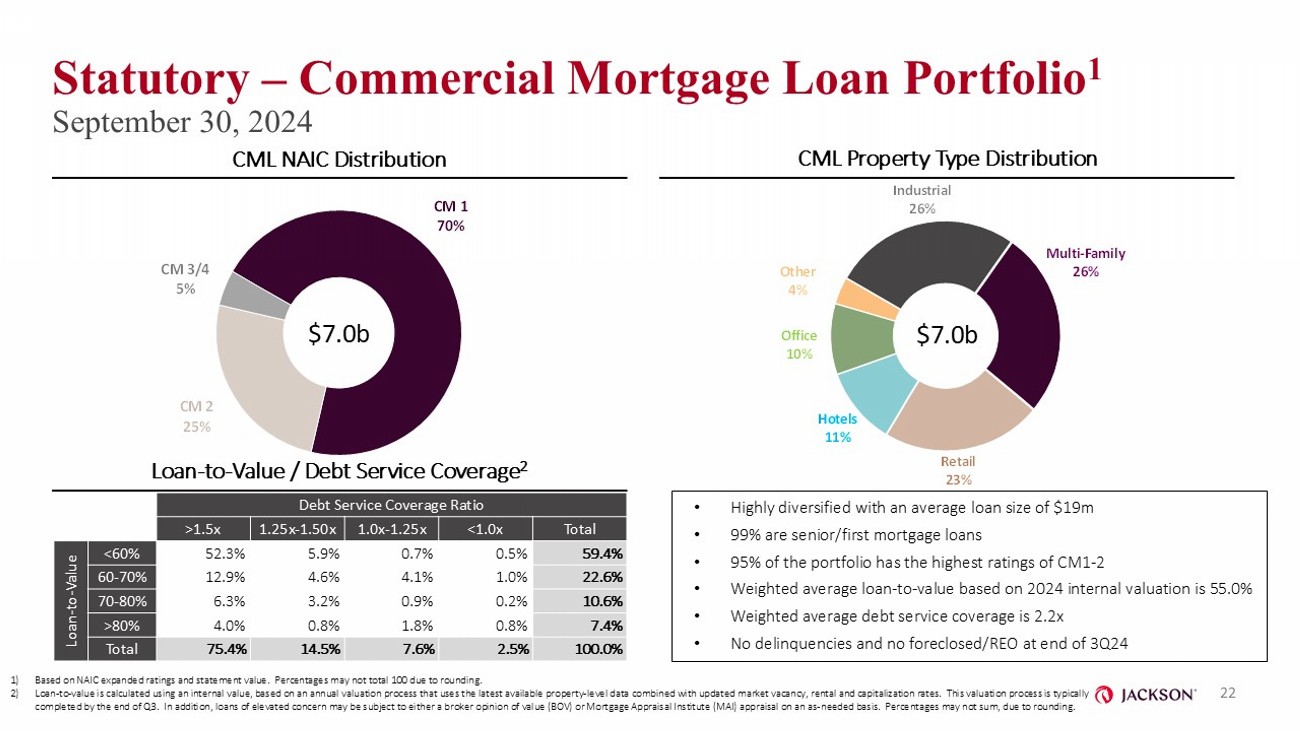
Industrial 26% Multi - Family 26% Retail 23% Hotels 11% Office 10% Other 4% Statutory – Commercial Mortgage Loan Portfolio 1 September 30, 2024 CML NAIC Distribution CML Property Type Distribution • Highly diversified with an average loan size of $19m • 99% are senior/first mortgage loans • 95% of the portfolio has the highest ratings of CM1 - 2 • Weighted average loan - to - value based on 2024 internal valuation is 55.0% • Weighted average debt service coverage is 2.2x • No delinquencies and no foreclosed/REO at end of 3Q24 $7.0b 22 Loan - to - Value / Debt Service Coverage 2 $7.0b Debt Service Coverage Ratio Total <1.0x 1.0x - 1.25x 1.25x - 1.50x >1.5x 59.4% 0.5% 0.7% 5.9% 52.3% <60% Loan - to - Value 22.6% 1.0% 4.1% 4.6% 12.9% 60 - 70% 10.6% 0.2% 0.9% 3.2% 6.3% 70 - 80% 7.4% 0.8% 1.8% 0.8% 4.0% >80% 100.0% 2.5% 7.6% 14.5% 75.4% Total 1) Based on NAIC expanded ratings and statement value. Percentages may not total 100 due to rounding. 2) Loan - to - value is calculated using an internal value, based on an annual valuation process that uses the latest available propert y - level data combined with updated market vacancy, rental and capitalization rates. This valuation process is typically completed by the end of Q3. In addition, loans of elevated concern may be subject to either a broker opinion of value (BOV) or Mortgage Appraisal Institute (MAI) appraisal on an as - needed basis. Percentages may not sum, due to rounding. CM 1 70% CM 2 25% CM 3/4 5%
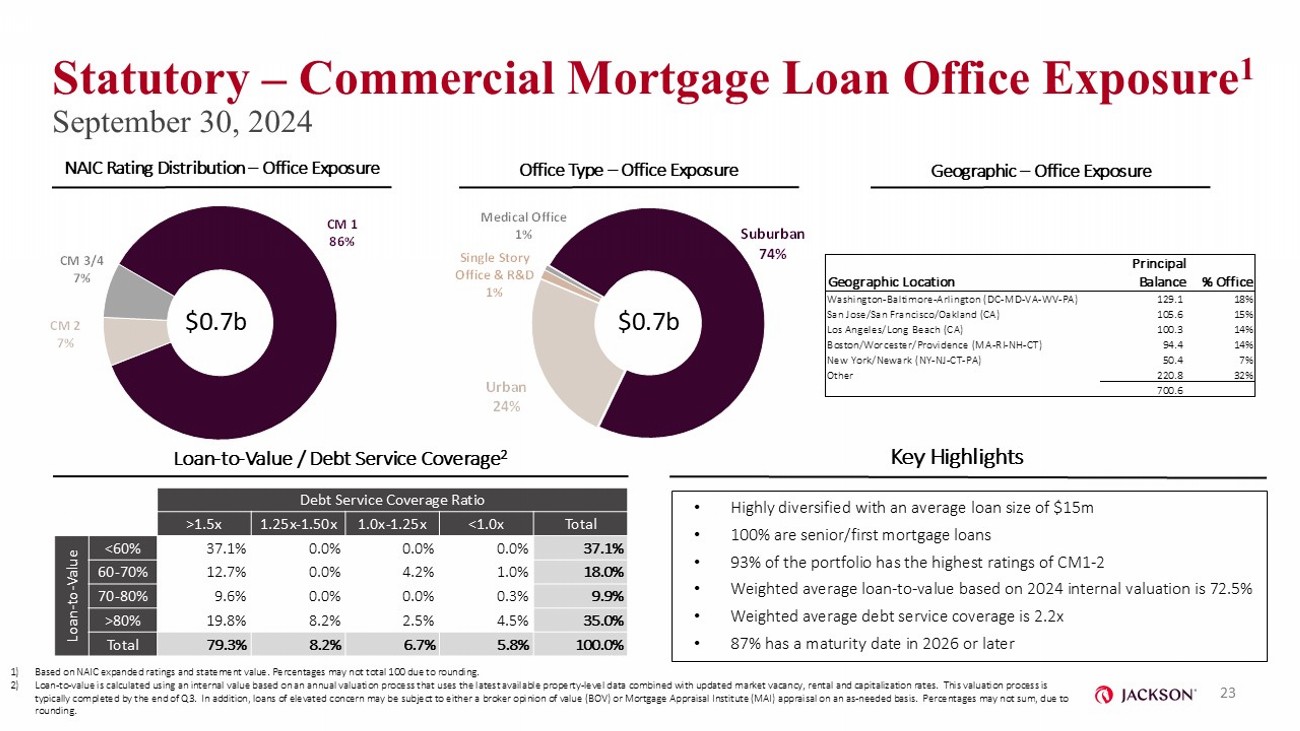
Statutory – Commercial Mortgage Loan Office Exposure 1 September 30, 2024 NAIC Rating Distribution – Office Exposure Key Highlights $0.7b 23 Loan - to - Value / Debt Service Coverage 2 1) Based on NAIC expanded ratings and statement value. Percentages may not total 100 due to rounding. 2) Loan - to - value is calculated using an internal value based on an annual valuation process that uses the latest available property - level data combined with updated market vacancy, rental and capitalization rates. This valuation process is typically completed by the end of Q3. In addition, loans of elevated concern may be subject to either a broker opinion of va lue (BOV) or Mortgage Appraisal Institute (MAI) appraisal on an as - needed basis. Percentages may not sum, due to rounding. Debt Service Coverage Ratio Total <1.0x 1.0x - 1.25x 1.25x - 1.50x >1.5x 37.1% 0.0% 0.0% 0.0% 37.1% <60% Loan - to - Value 18.0% 1.0% 4.2% 0.0% 12.7% 60 - 70% 9.9% 0.3% 0.0% 0.0% 9.6% 70 - 80% 35.0% 4.5% 2.5% 8.2% 19.8% >80% 100.0% 5.8% 6.7% 8.2% 79.3% Total • Highly diversified with an average loan size of $15m • 100% are senior/first mortgage loans • 93% of the portfolio has the highest ratings of CM1 - 2 • Weighted average loan - to - value based on 2024 internal valuation is 72.5% • Weighted average debt service coverage is 2.2x • 87% has a maturity date in 2026 or later Office Type – Office Exposure Geographic – Office Exposure $0.7b CM 1 86% CM 2 7% CM 3/4 7% Suburban 74% Urban 24% Single Story Office & R&D 1% Medical Office 1% Principal Geographic Location Balance % Office Washington-Baltimore-Arlington (DC-MD-VA-WV-PA) 129.1 18% San Jose/San Francisco/Oakland (CA) 105.6 15% Los Angeles/Long Beach (CA) 100.3 14% Boston/Worcester/Providence (MA-RI-NH-CT) 94.4 14% New York/Newark (NY-NJ-CT-PA) 50.4 7% Other 220.8 32% 700.6

Appendix

VA Market Risk Benefits 25 Description of Impact Drivers Runs Through Liability Effect Category Movement in risk - free rates (impacts both assumed future separate account returns and discounting of cash flows) Net Income Changes in Interest Rates Separate account returns gross of fees Net Income Fund Performance Movement in implied volatility Net Income Changes in Equity Index Volatility Policyholder behavior as assumed in reserving Net Income Expected Policyholder Behavior Difference between actual behavior during the period vs. assumptions Net Income Actual Policyholder Behavior Effect of passage of time – including reduction to separate account balances from fees, the change in proximity of future cash flows and impacts to policy features such as bonus credits Net Income Time Changes in assumptions resulting from annual review Net Income Changes in Assumptions Changes in Jackson’s own credit spread OCI Changes in Non - Performance Risk
Non - GAAP Financial Measures In addition to presenting our results of operations and financial condition in accordance with U.S. GAAP, we use and report s ele cted non - GAAP financial measures. Management believes that the use of these non - GAAP financial measures, together with relevant U.S. GAAP financial measures, provides a better understanding of our results of op era tions, financial condition and the underlying performance drivers of our business. These non - GAAP financial measures should be considered supplementary to our results of operations and financial condition that are pres ent ed in accordance with U.S. GAAP and should not be viewed as a substitute for the U.S. GAAP financial measures. Other companies may use similarly titled non - GAAP financial measures that are calculated differently from th e way we calculate such measures. Consequently, our non - GAAP financial measures may not be comparable to similar measures used by other companies. These non - GAAP financial measures should not be viewed as substitutes for the most directly comparable financial measures calculated in accordance with U.S. GAAP. Adjusted Operating Earnings Adjusted Operating Earnings is an after - tax non - GAAP financial measure, which we believe should be used to evaluate our financia l performance on a consolidated basis by excluding certain items that may be highly variable from period to period due to accounting treatment under U.S. GAAP or that are non - recurring in nature, as well as certa in other revenues and expenses that we do not view as driving our underlying performance. Adjusted Operating Earnings should not be used as a substitute for net income as calculated in accordance with U .S. GAAP. However, we believe the adjustments to net income are useful for gaining an understanding of our overall results of operations. Adjusted Operating Earnings equals our Net income (loss) attributable to Jackson Financial Inc. common shareholders (which ex clu des income attributable to non - controlling interest and dividends on preferred stock) adjusted to eliminate the impact of the items described in the following numbered paragraphs. These items are excluded as th ey may vary significantly from period to period due to near - term market conditions or are otherwise not directly comparable or reflective of the underlying performance of our business. We believe these exclusions p rov ide investors a better picture of the drivers of our underlying performance. 1) Net Hedging Results: Comprised of: (i) fees attributed to guaranteed benefits; (ii) net gains (losses on hedging instruments which includes: (a) c han ges in the fair value of freestanding derivatives , and related commissions and expenses, used to manage the risk associated with market risk benefits and other guaranteed benefit features, ex cluding earned income from periodic settlements and changes in settlement accruals on cross - currency swaps; and (b) investment income and change in fair value of certain non - derivative assets used to ma nage the risk associated with market risk benefits and other guaranteed benefit features; (iii) the movements in reserves, market risk benefits, guaranteed benefit features accounted for as embedded deriva tiv e instruments, and related claims and benefit payments; (iv) amortization of the balance of unamortized deferred acquisition costs, at January 1, 2021, the date of transition to LDTI, associated with items exc luded from adjusted operating earnings prior to transition; and (v) the impact on the valuation of Guaranteed Benefits and Net Hedging Results arising from changes in underlying actuarial assumptions. We believe ex cluding these items removes the impact to both revenue and related expenses associated with Guaranteed Benefits and Net Hedging Results. 2) Net Realized Investment Gains and Losses: Comprised of: (i) realized investment gains and losses associated with the periodic sales or disposals of securities, excludi ng those held within our trading portfolio; and (ii) impairments of securities, after adjustment for the non - credit component of the impairment charges. 3) Change in Value of Funds Withheld Embedded Derivative and Net investment income on funds withheld assets: Comprised of (i) the change in fair value of funds withheld embedded derivatives; and (ii) net investment income on funds withheld assets related to funds withheld reinsurance transactions. 4) Other items: Comprised of: (i) the impact of investments that are consolidated in our financial statements due to U.S. GAAP accounting req uir ements, such as our investments in collateralized loan obligations (CLOs), but for which the consolidation effects are not consistent with our economic interest or exposure to those entities; and (ii) one - time or other non - recurring items, such as costs relating to our separation from our former parent. Operating income taxes are calculated using the prevailing corporate federal income tax rate of 21% while taking into account any items recognized d iff erently in our financial statements and federal income tax returns, including the dividends received deduction and other tax credits. For interim reporting periods, the Company uses an es timated annual effective tax rate ("ETR") in computing its tax provision including consideration of discrete items. 26
Non - GAAP Financial Measures Adjusted Book Value Attributable to Common Shareholders Adjusted Book Value Attributable to Common Shareholders excludes Preferred Stock and Accumulated Other Comprehensive Income ( Los s) (AOCI) attributable to Jackson Financial Inc (JFI), which does not include AOCI arising from investments held within the funds withheld account related to the Athene Reinsurance Transaction. We exclude AOC I a ttributable to JFI from Adjusted Book Value Attributable to Common Shareholders because our invested assets are generally invested to closely match the duration of our liabilities, which are longer duratio n i n nature, and therefore we believe period - to - period fair market value fluctuations in AOCI to be inconsistent with this objective. We believe excluding AOCI attributable to JFI is more useful to investors in analyzing t ren ds in our business. Changes in AOCI within the funds withheld account related to the Athene Reinsurance Transaction offset the related non - operating earnings from the Athene Reinsurance Transactions resulting in a minima l net impact on Adjusted Book Value of Jackson Financial Inc. Adjusted Operating Return on Equity Attributable to Common Shareholders We use Adjusted Operating Return on Equity (ROE) Attributable to Common Shareholders to manage our business and evaluate our fin ancial performance which: (i) excludes items that vary from period - to - period due to accounting treatment under U.S. GAAP or that are non - recurring in nature, as such items may distort the underlying performanc e of our business; and (ii) is calculated by dividing our Adjusted Operating Earnings by average Adjusted Book Value Attributable to Common Shareholders. Adjusted Book Value Attributable to Common Shareholders and Adjusted Operating ROE Attributable to Common Shareholders should no t be used as substitutes for total shareholders’ equity and ROE as calculated using annualized net income and average equity in accordance with U.S. GAAP. However, we believe the adjustments to equity and earn ing s are useful to gaining an understanding of our overall results of operations. Notable Items Notable items reflect the impact on our results of certain items or events that may or may not have been anticipated and resu lte d in volatility in the Company's earnings expectations. The presentation of notable items is intended to help investors better understand our results for the period and to evaluate and forecast those results. 27
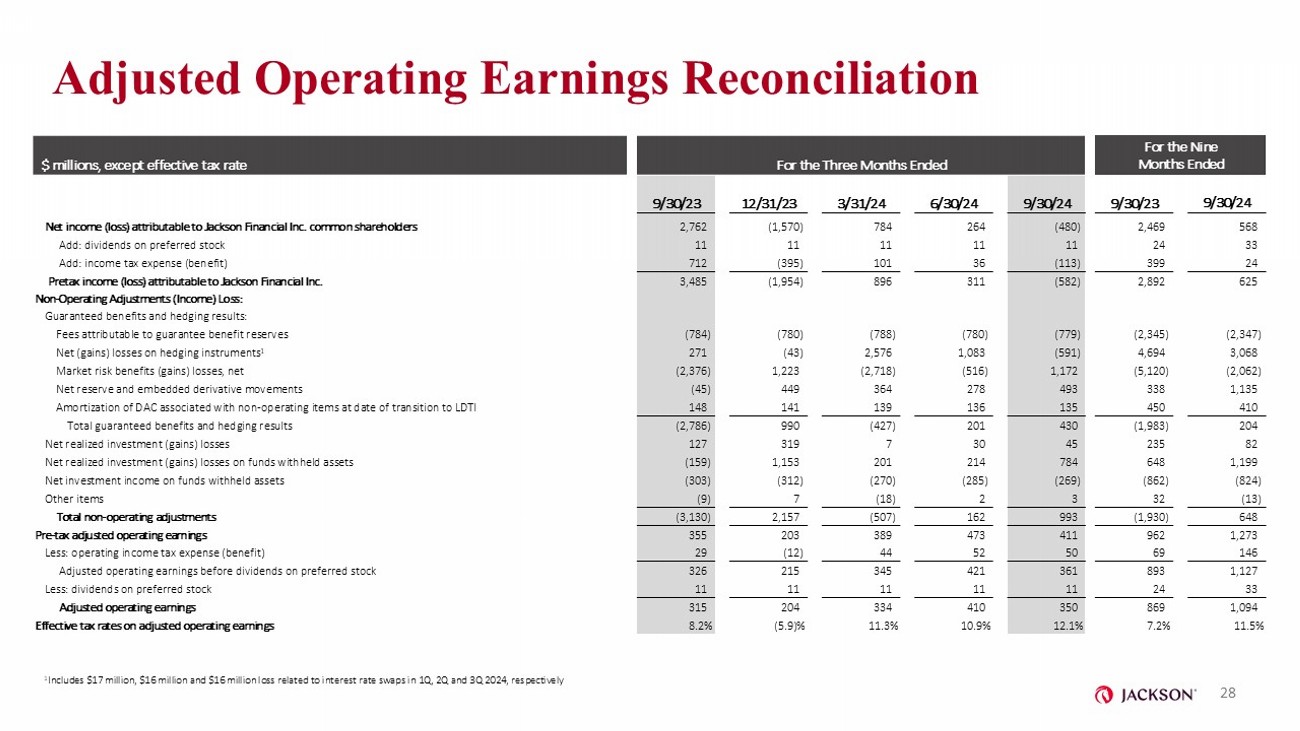
Adjusted Operating Earnings Reconciliation For the Nine Months Ended For the Three Months Ended $ millions, except effective tax rate 9/30/24 9/30/23 9/30/24 6/30/24 3/31/24 12/31/23 9/30/23 568 2,469 (480) 264 784 (1,570) 2,762 Net income (loss) attributable to Jackson Financial Inc. common shareholders 33 24 11 11 11 11 11 Add: dividends on preferred stock 24 399 (113) 36 101 (395) 712 Add: income tax expense (benefit) 625 2,892 (582) 311 896 (1,954) 3,485 Pretax income (loss) attributable to Jackson Financial Inc. Non - Operating Adjustments (Income) Loss: Guaranteed benefits and hedging results: (2,347) (2,345) (779) (780) (788) (780) (784) Fees attributable to guarantee benefit reserves 3,068 4,694 (591) 1,083 2,576 (43) 271 Net (gains) losses on hedging instruments 1 (2,062) (5,120) 1,172 (516) (2,718) 1,223 (2,376) Market risk benefits (gains) losses, net 1,135 338 493 278 364 449 (45) Net reserve and embedded derivative movements 410 450 135 136 139 141 148 Amortization of DAC associated with non - operating items at date of transition to LDTI 204 (1,983) 430 201 (427) 990 (2,786) Total guaranteed benefits and hedging results 82 235 45 30 7 319 127 Net realized investment (gains) losses 1,199 648 784 214 201 1,153 (159) Net realized investment (gains) losses on funds withheld assets (824) (862) (269) (285) (270) (312) (303) Net investment income on funds withheld assets (13) 32 3 2 (18) 7 (9) Other items 648 (1,930) 993 162 (507) 2,157 (3,130) Total non - operating adjustments 1,273 962 411 473 389 203 355 Pre - tax adjusted operating earnings 146 69 50 52 44 (12) 29 Less: operating income tax expense (benefit) 1,127 893 361 421 345 215 326 Adjusted operating earnings before dividends on preferred stock 33 24 11 11 11 11 11 Less: dividends on preferred stock 1,094 869 350 410 334 204 315 Adjusted operating earnings 11.5% 7.2% 12.1% 10.9% 11.3% (5.9)% 8.2% Effective tax rates on adjusted operating earnings 28 1 Includes $17 million, $16 million and $16 million loss related to interest rate swaps in 1Q, 2Q and 3Q 2024, respectively
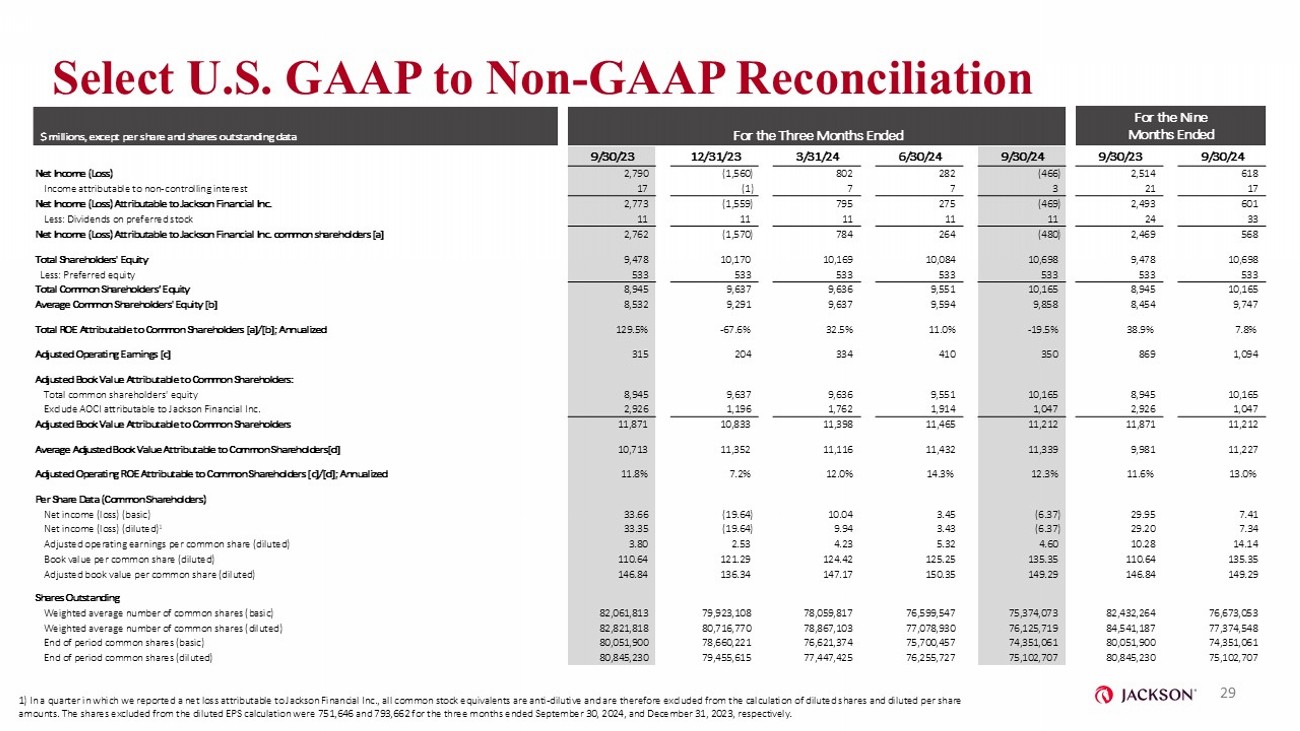
Select U.S. GAAP to Non - GAAP Reconciliation For the Nine Months Ended For the Three Months Ended $ millions, except per share and shares outstanding data 9/30/24 9/30/23 9/30/24 6/30/24 3/31/24 12/31/23 9/30/23 618 2,514 (466) 282 802 (1,560) 2,790 Net Income (Loss) 17 21 3 7 7 (1) 17 Income attributable to non - controlling interest 601 2,493 (469) 275 795 (1,559) 2,773 Net Income (Loss) Attributable to Jackson Financial Inc. 33 24 11 11 11 11 11 Less: Dividends on preferred stock 568 2,469 (480) 264 784 (1,570) 2,762 Net Income (Loss) Attributable to Jackson Financial Inc. common shareholders [a] 10,698 9,478 10,698 10,084 10,169 10,170 9,478 Total Shareholders' Equity 533 533 533 533 533 533 533 Less: Preferred equity 10,165 8,945 10,165 9,551 9,636 9,637 8,945 Total Common Shareholders’ Equity 9,747 8,454 9,858 9,594 9,637 9,291 8,532 Average Common Shareholders' Equity [b] 7.8% 38.9% - 19.5% 11.0% 32.5% - 67.6% 129.5% Total ROE Attributable to Common Shareholders [a]/[b]; Annualized 1,094 869 350 410 334 204 315 Adjusted Operating Earnings [c] Adjusted Book Value Attributable to Common Shareholders: 10,165 8,945 10,165 9,551 9,636 9,637 8,945 Total common shareholders' equity 1,047 2,926 1,047 1,914 1,762 1,196 2,926 Exclude AOCI attributable to Jackson Financial Inc. 11,212 11,871 11,212 11,465 11,398 10,833 11,871 Adjusted Book Value Attributable to Common Shareholders 11,227 9,981 11,339 11,432 11,116 11,352 10,713 Average Adjusted Book Value Attributable to Common Shareholders[d] 13.0% 11.6% 12.3% 14.3% 12.0% 7.2% 11.8% Adjusted Operating ROE Attributable to Common Shareholders [c]/[d]; Annualized Per Share Data (Common Shareholders) 7.41 29.95 (6.37) 3.45 10.04 (19.64) 33.66 Net income (loss) (basic) 7.34 29.20 (6.37) 3.43 9.94 (19.64) 33.35 Net income (loss) (diluted) 1 14.14 10.28 4.60 5.32 4.23 2.53 3.80 Adjusted operating earnings per common share (diluted) 135.35 110.64 135.35 125.25 124.42 121.29 110.64 Book value per common share (diluted) 149.29 146.84 149.29 150.35 147.17 136.34 146.84 Adjusted book value per common share (diluted) Shares Outstanding 76,673,053 82,432,264 75,374,073 76,599,547 78,059,817 79,923,108 82,061,813 Weighted average number of common shares (basic) 77,374,548 84,541,187 76,125,719 77,078,930 78,867,103 80,716,770 82,821,818 Weighted average number of common shares (diluted) 74,351,061 80,051,900 74,351,061 75,700,457 76,621,374 78,660,221 80,051,900 End of period common shares (basic) 75,102,707 80,845,230 75,102,707 76,255,727 77,447,425 79,455,615 80,845,230 End of period common shares (diluted) 29 1) In a quarter in which we reported a net loss attributable to Jackson Financial Inc., all common stock equivalents are anti - di lutive and are therefore excluded from the calculation of diluted shares and diluted per share amounts. The shares excluded from the diluted EPS calculation were 751,646 and 793,662 for the three months ended September 30, 2024, and December 31, 2023, respectively.

Glossary Assets Under Management (AUM) - Investment assets that are managed by one of our subsidiaries and includes: (i) assets managed by PPM America, Inc. (PPM), in c luding our investment portfolio (but excludes assets held in funds withheld accounts for reinsurance transactions), (ii) third - party assets (including our former parent and its affiliates, and (i ii) the separate account assets of our retail annuities managed and administered by Jackson National Asset Management LLC (JNAM). Athene Reinsurance Transaction - The funds withheld coinsurance agreement with Athene Life Re Ltd., entered on June 18, 2020, and effective June 1, 2020, to r e insure a 100% quota share of a block of our in - force fixed and fixed index annuity liabilities in exchange for approximately $1.2 billion in ceding commissions. Deferred Acquisition Cost (DAC) - Represent the incremental costs related directly to the successful acquisition of new, and certain renewal, insurance policie s and annuity contracts. The recognition of these costs has been deferred, and the deferred amounts are shown on the balance sheet as an asset, which is subject to amortization over the estimated lives of th ose policies and contracts. Derivative Instruments - Jackson Financial Inc.'s (JFI) business model includes the acceptance, monitoring and mitigation of risk. Specifically, JFI c onsiders, among other factors, exposures to interest rate and equity market movements, foreign exchange rates and other asset or liability prices. JFI uses derivative instruments to mitigate or reduce these risk s i n accordance with established policies and goals. JFI's derivative holdings, while effective in managing defined risks, are not structured to meet accounting requirements to be designated as hedging instruments. As a result, freestanding de rivatives are carried at fair value with changes each period recorded in net gains or losses on derivatives and investments. Earnings per Share (EPS) - Basic earnings per share is calculated by dividing net income (loss) attributable to JFI common shareholders by the weighted - a verage number of common shares outstanding during the period. Diluted earnings per share is calculated by dividing the net income (loss) attributable to JFI common shareholders, by the weighted - average numbe r of shares of common stock outstanding for the period, plus shares representing the dilutive effect of share - based awards. Fixed Annuity (FA) - An annuity that guarantees a set annual rate of return with interest at rates we determine, subject to specified minimums. C r edited interest rates are guaranteed not to change for certain limited periods of time, after which rates may reset. Fixed Index Annuity (FIA) - An annuity with an ability to share in the upside from certain financial markets such as equity indices and provides downside protection. Guaranteed Minimum Accumulation Benefit (GMAB) - An add - on benefit (enhanced benefits available for an additional cost) that entitles an owner to a minimum payment, typically in lump - sum, after a set period of time, referred to as the accumulation period. The minimum payment is based on the benefit base, which could be greater than the underlying accoun t v alue. Guaranteed Minimum Death Benefit (GMDB) - An add - on benefit (enhanced benefits available for an additional cost) that guarantees an owner's beneficiaries are entitled t o a minimum payment based on the benefit base, which could be greater than the underlying account value, upon the death of the owner. Guaranteed Minimum Income Benefit (GMIB) - An add - on benefit (available for an additional cost) where an owner is entitled to annuitize the policy and receive a minimum payment stream based on the benefit base, which could be greater than the payment stream resulting from current annuitization of the underlying account value. Guaranteed Minimum Withdrawal Benefit (GMWB) - An add - on benefit (available for an additional cost) where an owner is entitled to withdraw a maximum amount of their benefit base each year, for which cumulative payments to the owner could be greater than the underlying account value. Guaranteed Minimum Withdrawal Benefit for Life (GMWB for Life) - An add - on benefit (available for an additional cost) where an owner is entitled to withdraw the guaranteed annual withdrawal a mount each year for the duration of the policyholder's life, regardless of account performance. LDTI - Accounting Standards Update 2018 - 12, “Targeted Improvements to the Accounting for Long - Duration Contracts”, effective January 1, 2023, with a transition date of January 1, 2021. Net Amount at Risk (NAR) - The greater of Death Benefit NAR (DBNAR) and Living Benefit NAR (LBNAR), as applicable, where DBNAR is the GMDB benefit base i n excess of the account value, and the LBNAR is the actuarial present value of guaranteed living benefits in excess of the account value. 30

Glossary Net Flows - The net change in customer account balances during a period, including gross premiums, surrenders, withdrawals and benefits. Net flows exclude investment performance, interest credited to customer accounts and policy charges. Registered Index - Linked Annuity (RILA) - A registered index - linked annuity, which offers market index - linked investment options, subject to a cap, and offers a variety of guarantees designed to modify or limit losses. Return of Premium (ROP) Death Benefit - This death benefit pays the greater of the account value at the time of a claim following the owner's death or the total cont r ibutions to the contract (subject to adjustment for withdrawals). The charge for this benefit is usually included in the Mortality and Expense fee that is deducted daily from the net assets in ea ch variable investment option. We also refer to this death benefit as the Return of Principal death benefit. Risk Based Capital (RBC) - Statutory minimum level of capital that is required by regulators for an insurer to support its operations. Segment - Retail Annuities JFI's Retail Annuities segment offers a variety of retirement income and savings products through its diverse suite of produc ts, consisting primarily of variable annuities, fixed index annuities, fixed annuities, payout annuities and registered index - linked annuities (RILA). These products are distributed through various wirehouses, insurance brokers and inde pendent broker - dealers, as well as through banks and financial institutions, primarily to high - net - worth investors and the mass and affluent markets. The financial results of the variable annuity business within the Company’s Retail Annuities segment are largely dependent on th e performance of the contract holder account value, which impacts both the level of fees collected and the benefits paid to the contract holder. The financial results of the Company’s fixed annuities, including the fixed option on var iable annuities, RILA and fixed index annuities, are largely dependent on the Company's ability to earn a spread between earned investment rates on general account assets and the interest credited to contract holders. Segment - Institutional Products JFI's Institutional Products consist of traditional guaranteed investment contracts (GICs), funding agreements (including agr eem ents issued in conjunction with JFI's participation in the U.S. Federal Home Loan Bank (FHLB) program) and Medium - Term Note funding agreements. JFI's GIC products are marketed to defined contribution pension and profit - sharing retirem ent plans. Funding agreements are marketed to institutional investors, including corporate cash accounts and securities lending funds, as well as money market funds, and are issued to the FHLB in connection with its progr am. The financial results of JFI's Institutional Products business are primarily dependent on Company’s ability to earn a spread bet ween earned investment rates on general account assets and the interest credited on GICs and funding agreements. Segment - Closed Life and Annuity Blocks JFI’s Closed Life and Annuity Blocks segment is primarily composed of blocks of business that have been acquired since 2004. Th e segment includes various protection products, primarily whole life, universal life, variable universal life, and term life insurance products as well as fixed, fixed index, and payout annuities. The Closed Life and Annuity Blocks seg men t also includes a block of group payout annuities that we assumed from John Hancock Life Insurance Company (USA) and John Hancock Life Insurance Company of New York through reinsurance transactions in 2018 and 2019, respecti vel y. The Company historically offered traditional and interest - sensitive life insurance products but discontinued new sales of life insurance products in 2012, as we believe opportunistically acquiring mature blocks of life in sur ance policies is a more efficient means of diversifying our in - force business than selling new life insurance products. The profitability of JFI's Closed Life and Annuity Blocks segment is largely driven by its historical ability to appropriatel y p rice its products and purchase appropriately priced blocks of business, as realized through underwriting, expense and net gains (losses) on derivatives and investments, and the ability to earn an assumed rate of return on the assets suppor tin g that business. Variable Annuity (VA) - An annuity that offers tax - deferred investment into a range of asset classes and a variable return, which offers insurance fea tures related to potential future income payments. 31