|

| 2 |
| 3 |
| ••••••• |
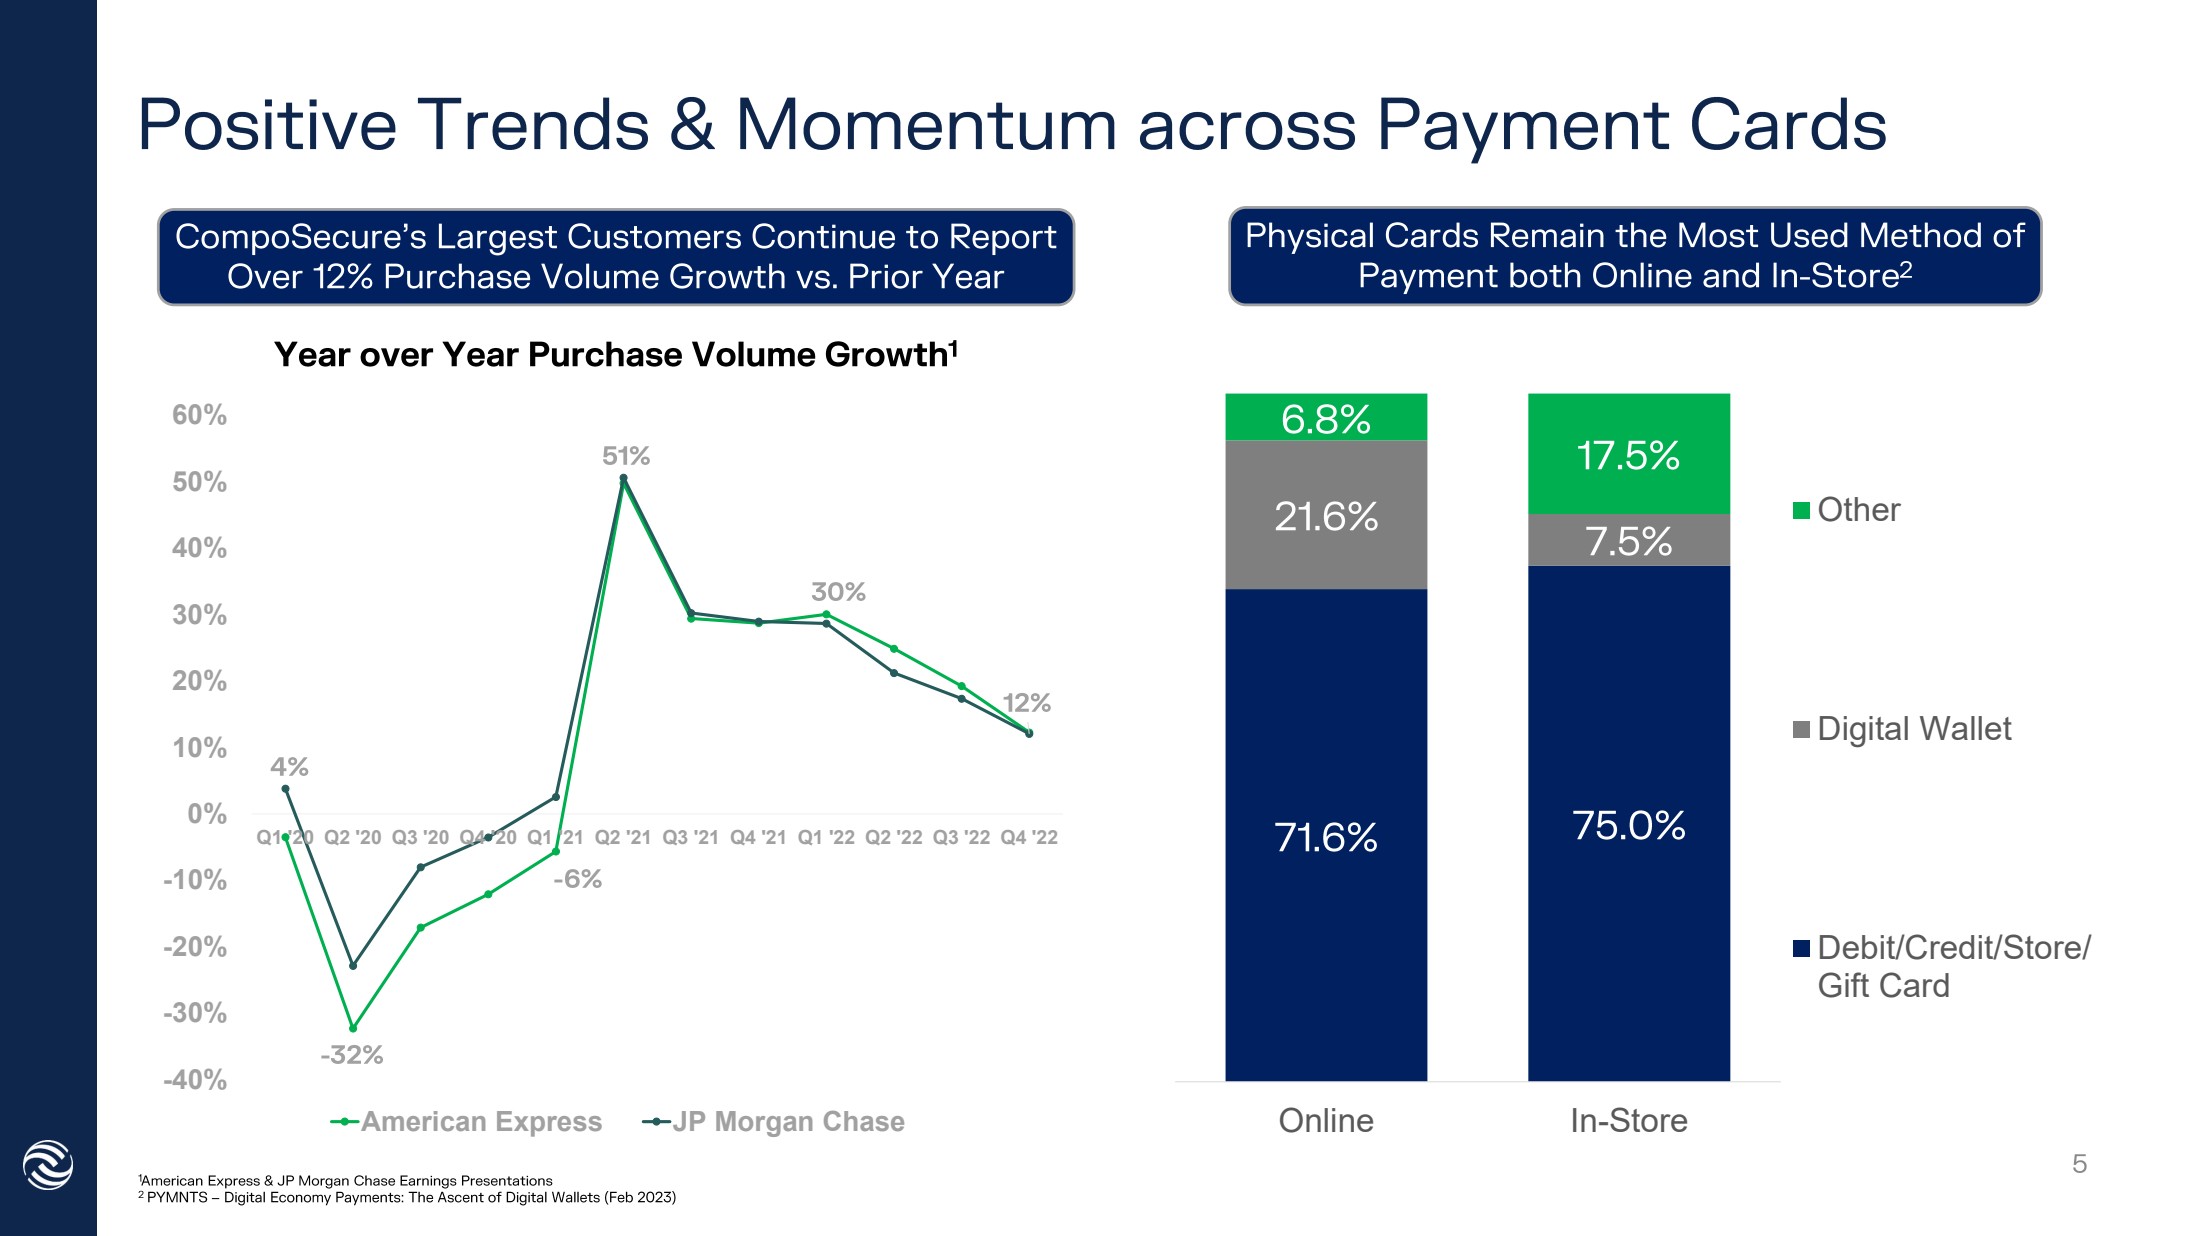
| -40% -30% -20% -10% 0% 10% 20% 30% 40% 50% 60% Q1 '20 Q2 '20 Q3 '20 Q4 '20 Q1 '21 Q2 '21 Q3 '21 Q4 '21 Q1 '22 Q2 '22 Q3 '22 Q4 '22 American Express JP Morgan Chase Online In-Store Other Digital Wallet Debit/Credit/Store/ Gift Card |
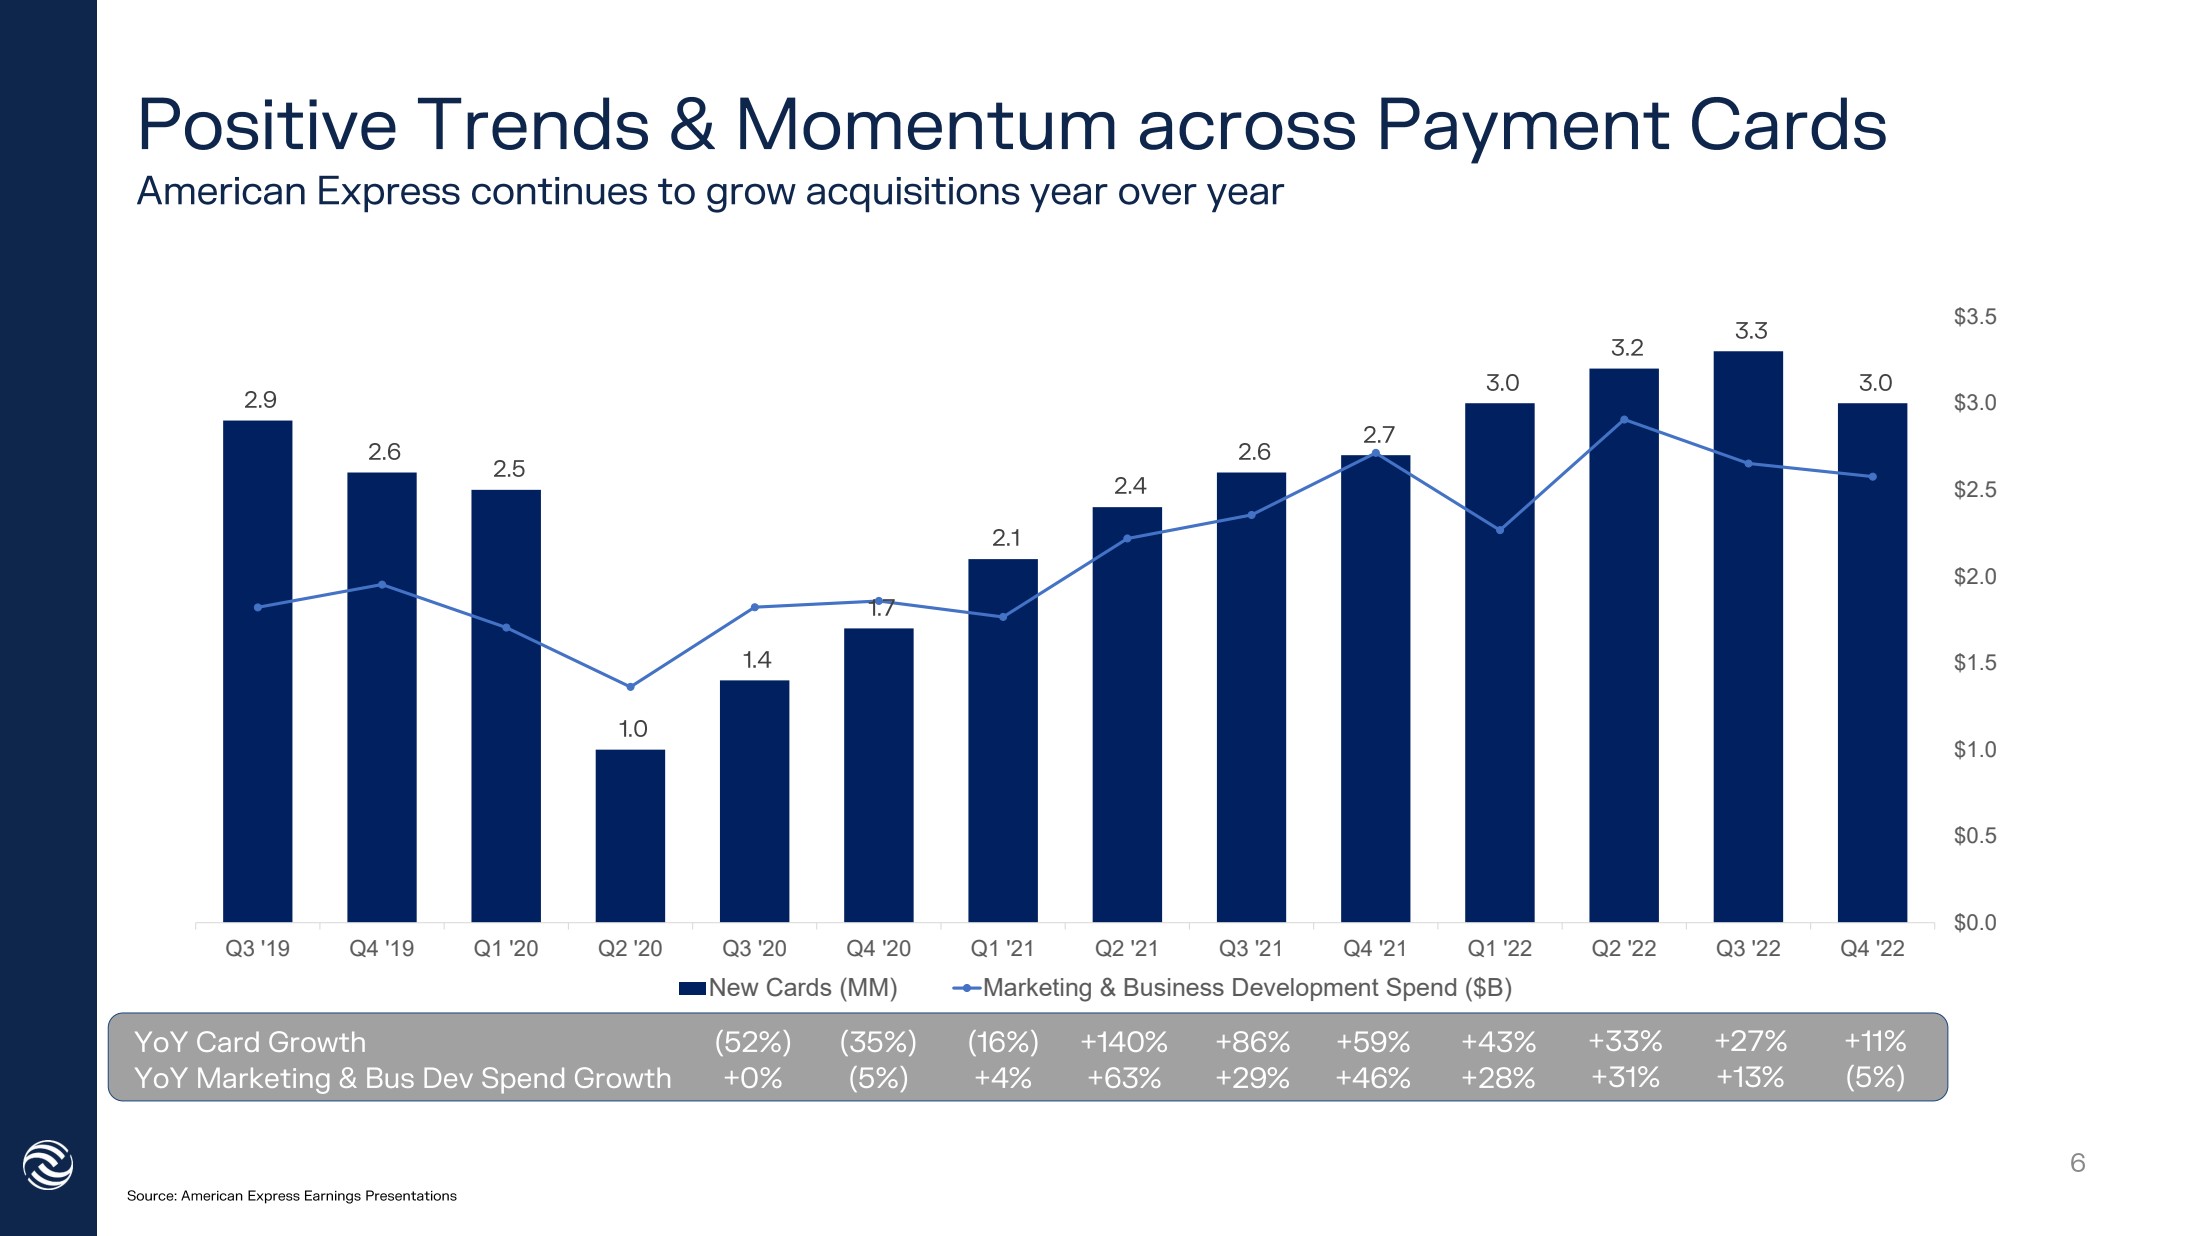
| Q3 '19 Q4 '19 Q1 '20 Q2 '20 Q3 '20 Q4 '20 Q1 '21 Q2 '21 Q3 '21 Q4 '21 Q1 '22 Q2 '22 Q3 '22 Q4 '22 $0.0 $0.5 $1.0 $1.5 $2.0 $2.5 $3.0 $3.5 New Cards (MM) Marketing & Business Development Spend ($B) |
|
|
|
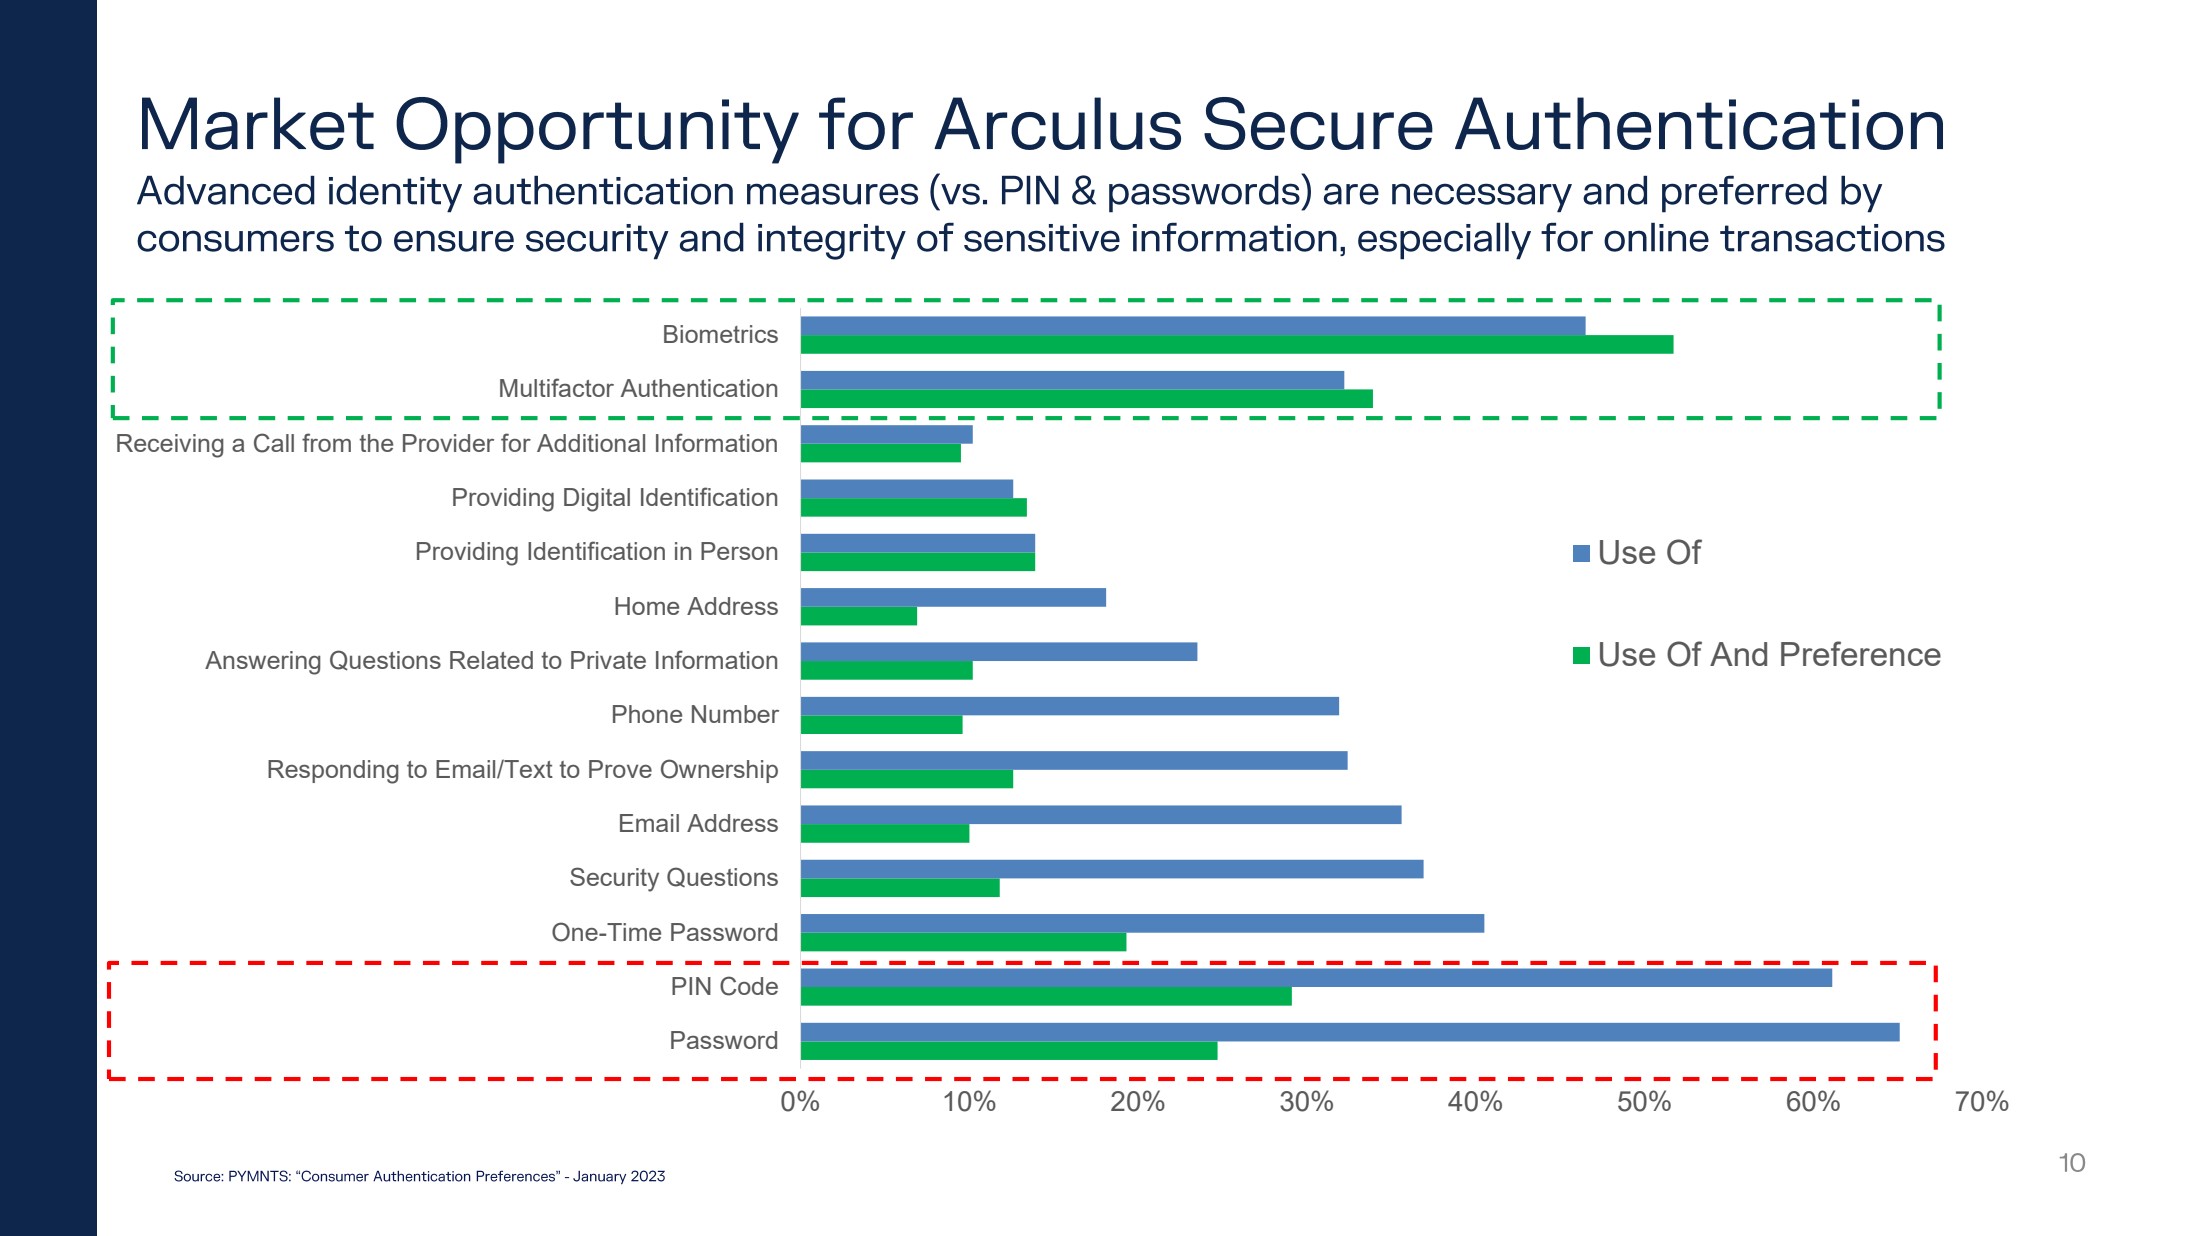
| 0% 10% 20% 30% 40% 50% 60% 70% Password PIN Code One-Time Password Security Questions Email Address Responding to Email/Text to Prove Ownership Phone Number Answering Questions Related to Private Information Home Address Providing Identification in Person Providing Digital Identification Receiving a Call from the Provider for Additional Information Multifactor Authentication Biometrics Use Of Use Of And Preference |
| •••••• |
|

|

|
|
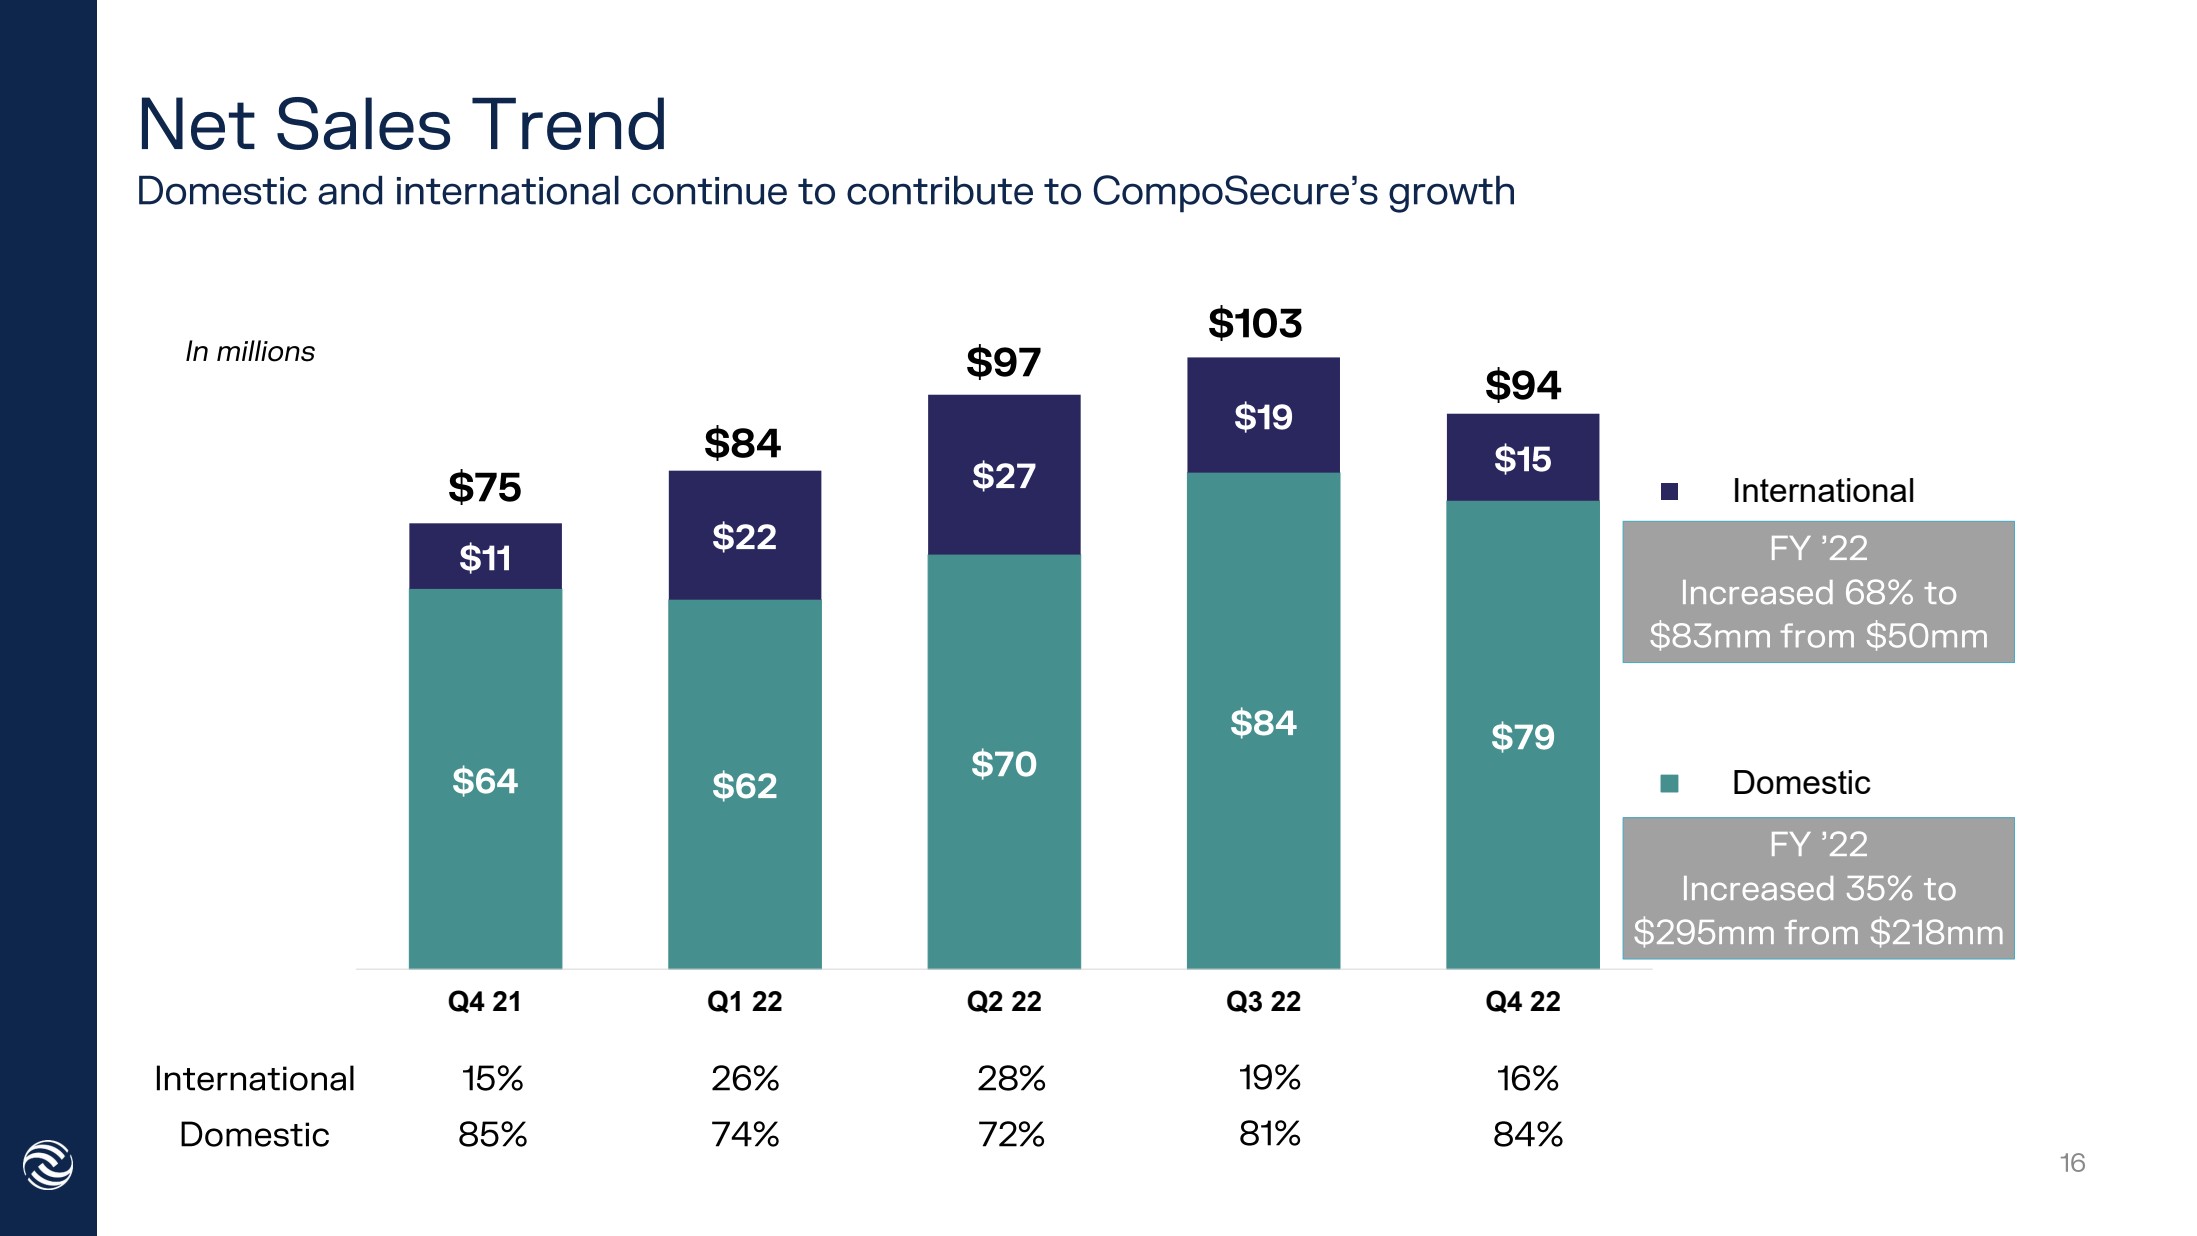
| Q4 21 Q1 22 Q2 22 Q3 22 Q4 22 International Domestic |
|
|
|
|

| 21 |

|

|
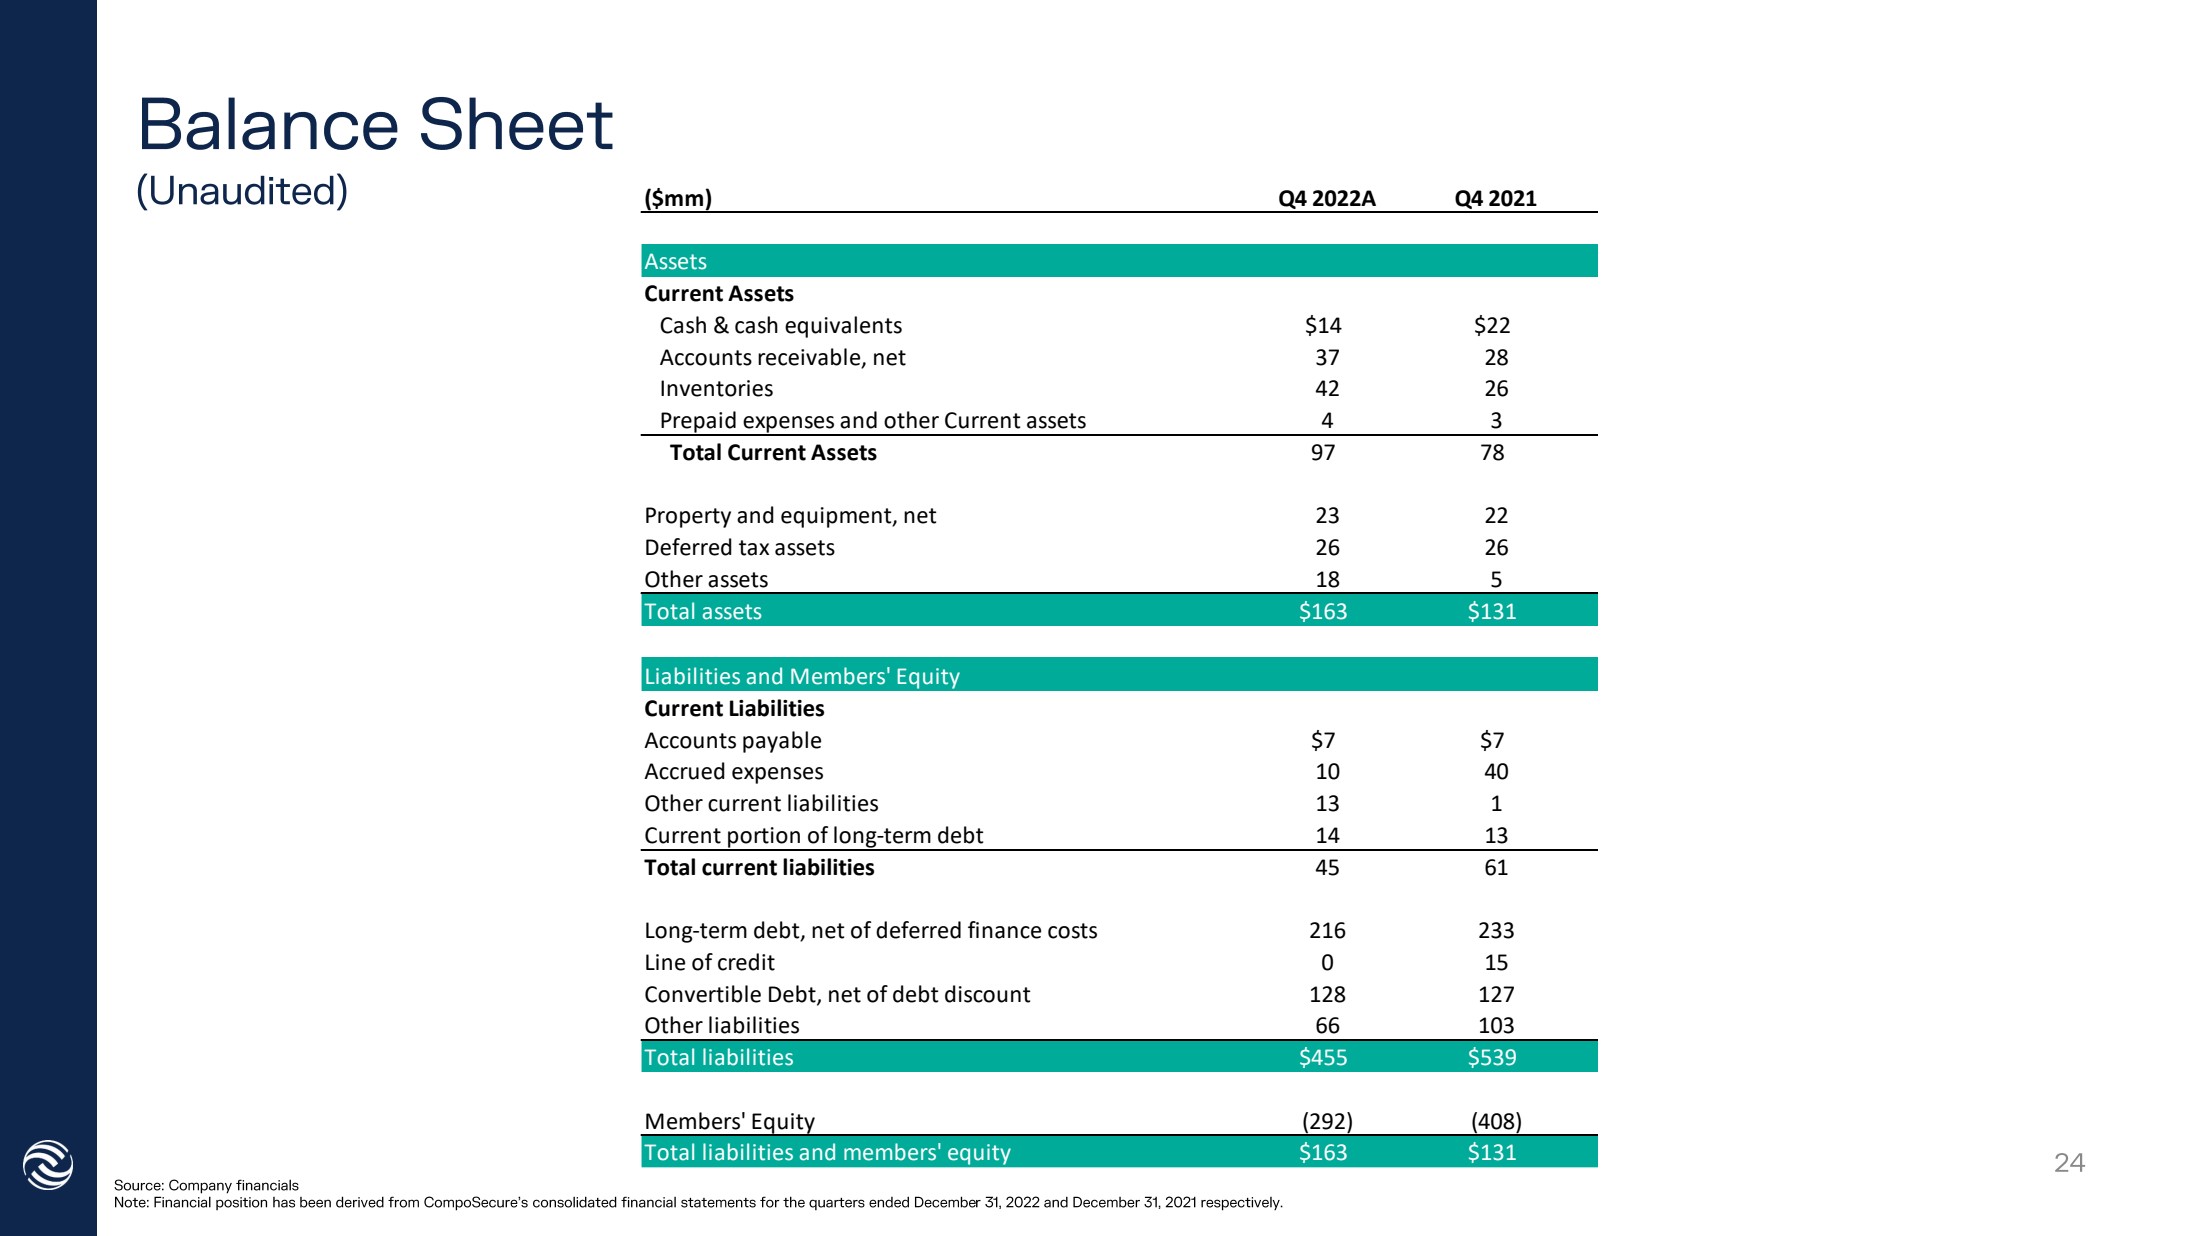
| ($mm) Q4 2022A Q4 2021 Assets Current Assets Cash & cash equivalents $14 $22 Accounts receivable, net 37 28 Inventories 42 26 Prepaid expenses and other Current assets 4 3 Total Current Assets 97 78 Property and equipment, net 23 22 Deferred tax assets 26 26 Other assets 18 5 Total assets $163 $131 Liabilities and Members' Equity Current Liabilities Accounts payable $7 $7 Accrued expenses 10 40 Other current liabilities 13 1 Current portion of long-term debt 14 13 Total current liabilities 45 61 Long-term debt, net of deferred finance costs 216 233 Line of credit 0 15 Convertible Debt, net of debt discount 128 127 Other liabilities 66 103 Total liabilities $455 $539 Members' Equity (292) (408) Total liabilities and members' equity $163 $131 |
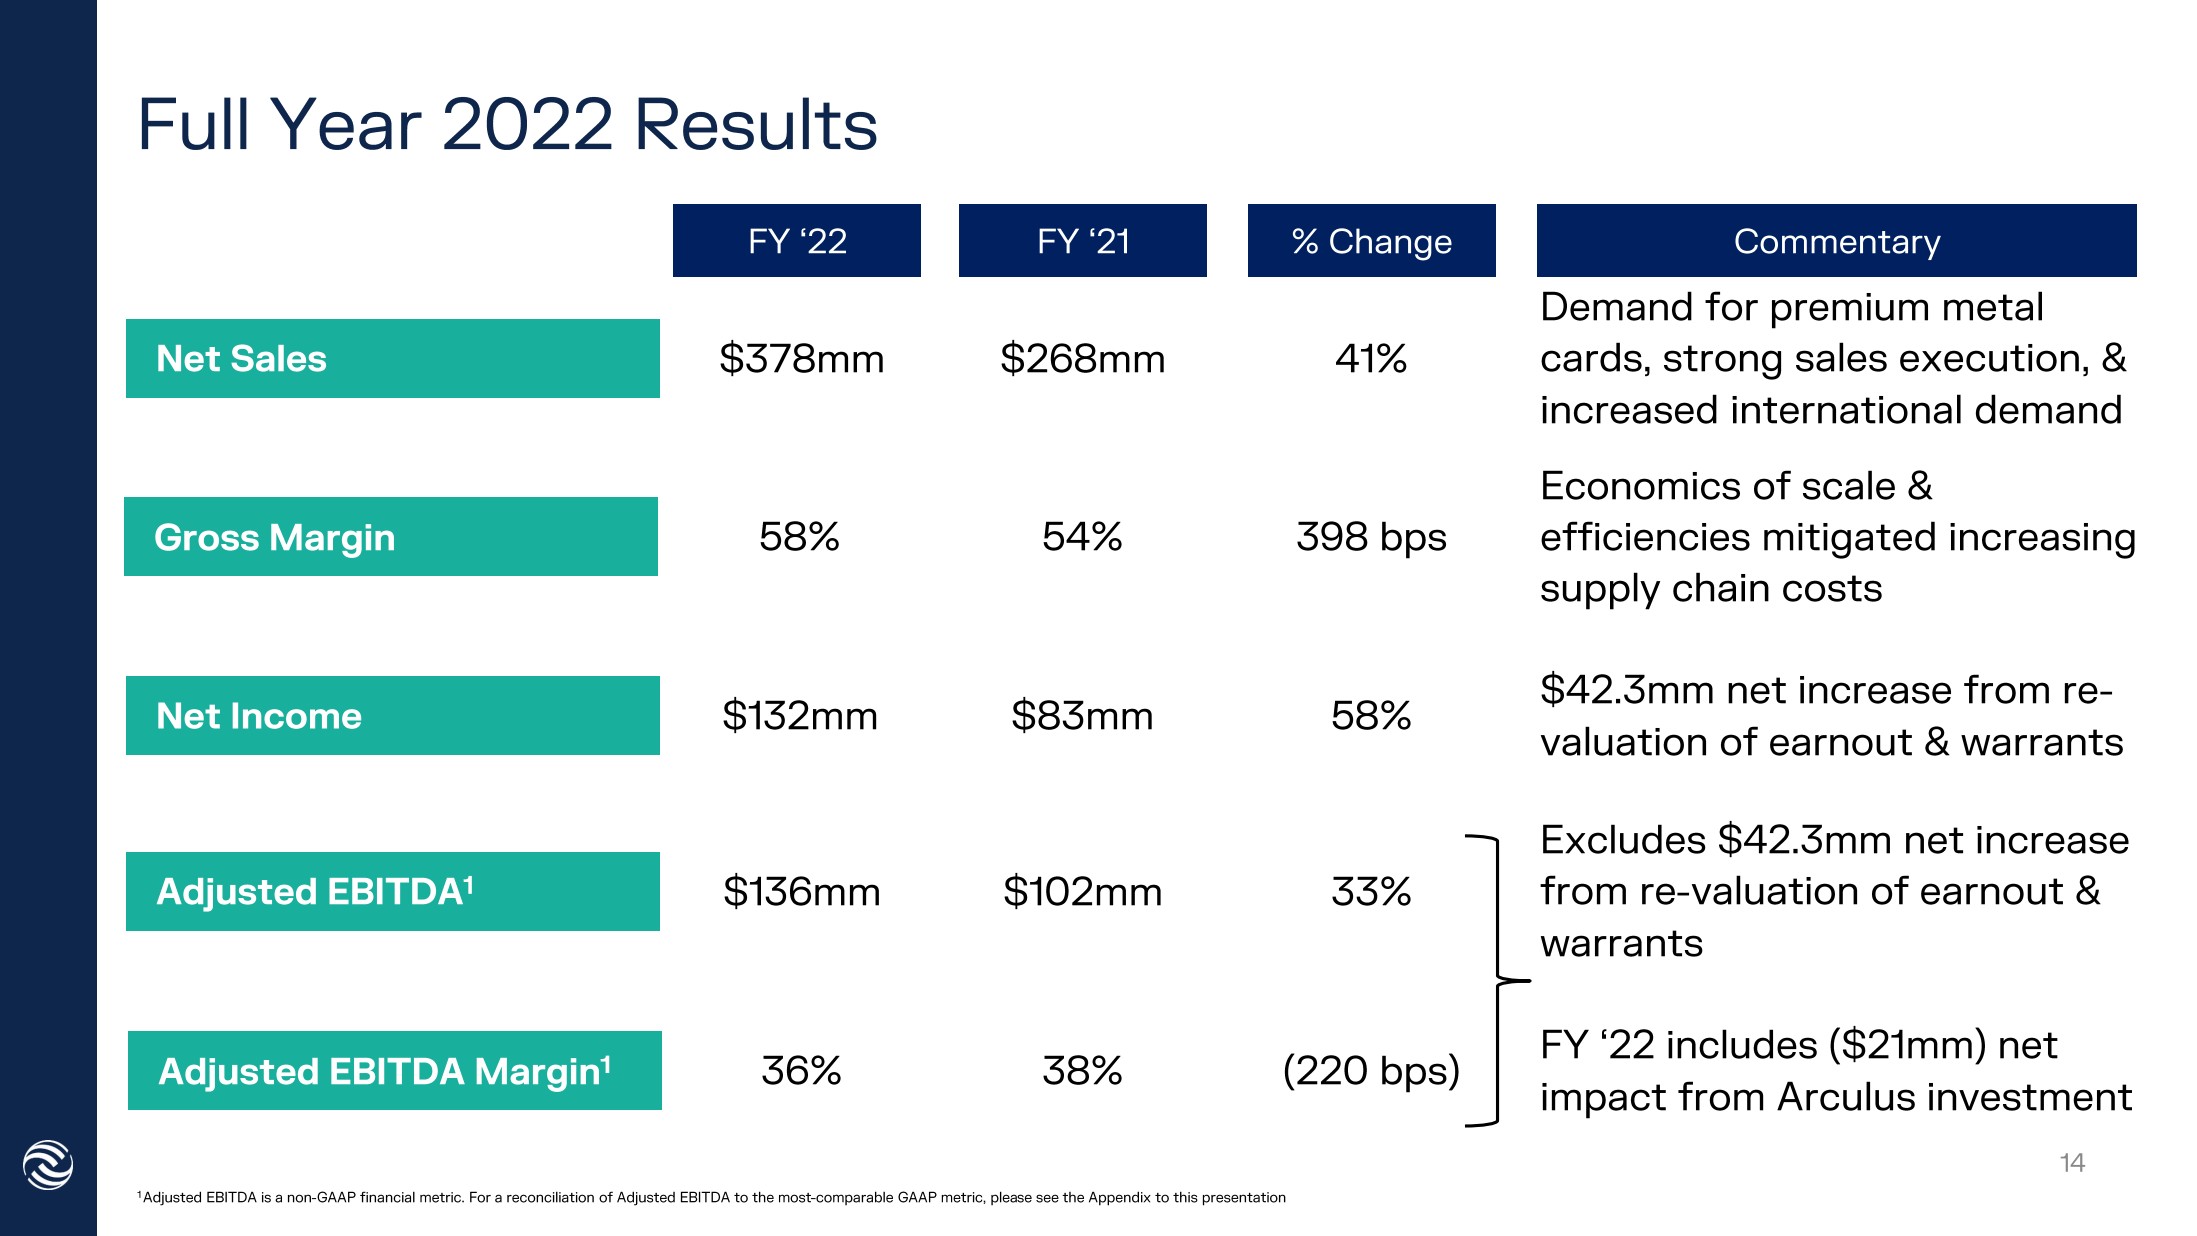
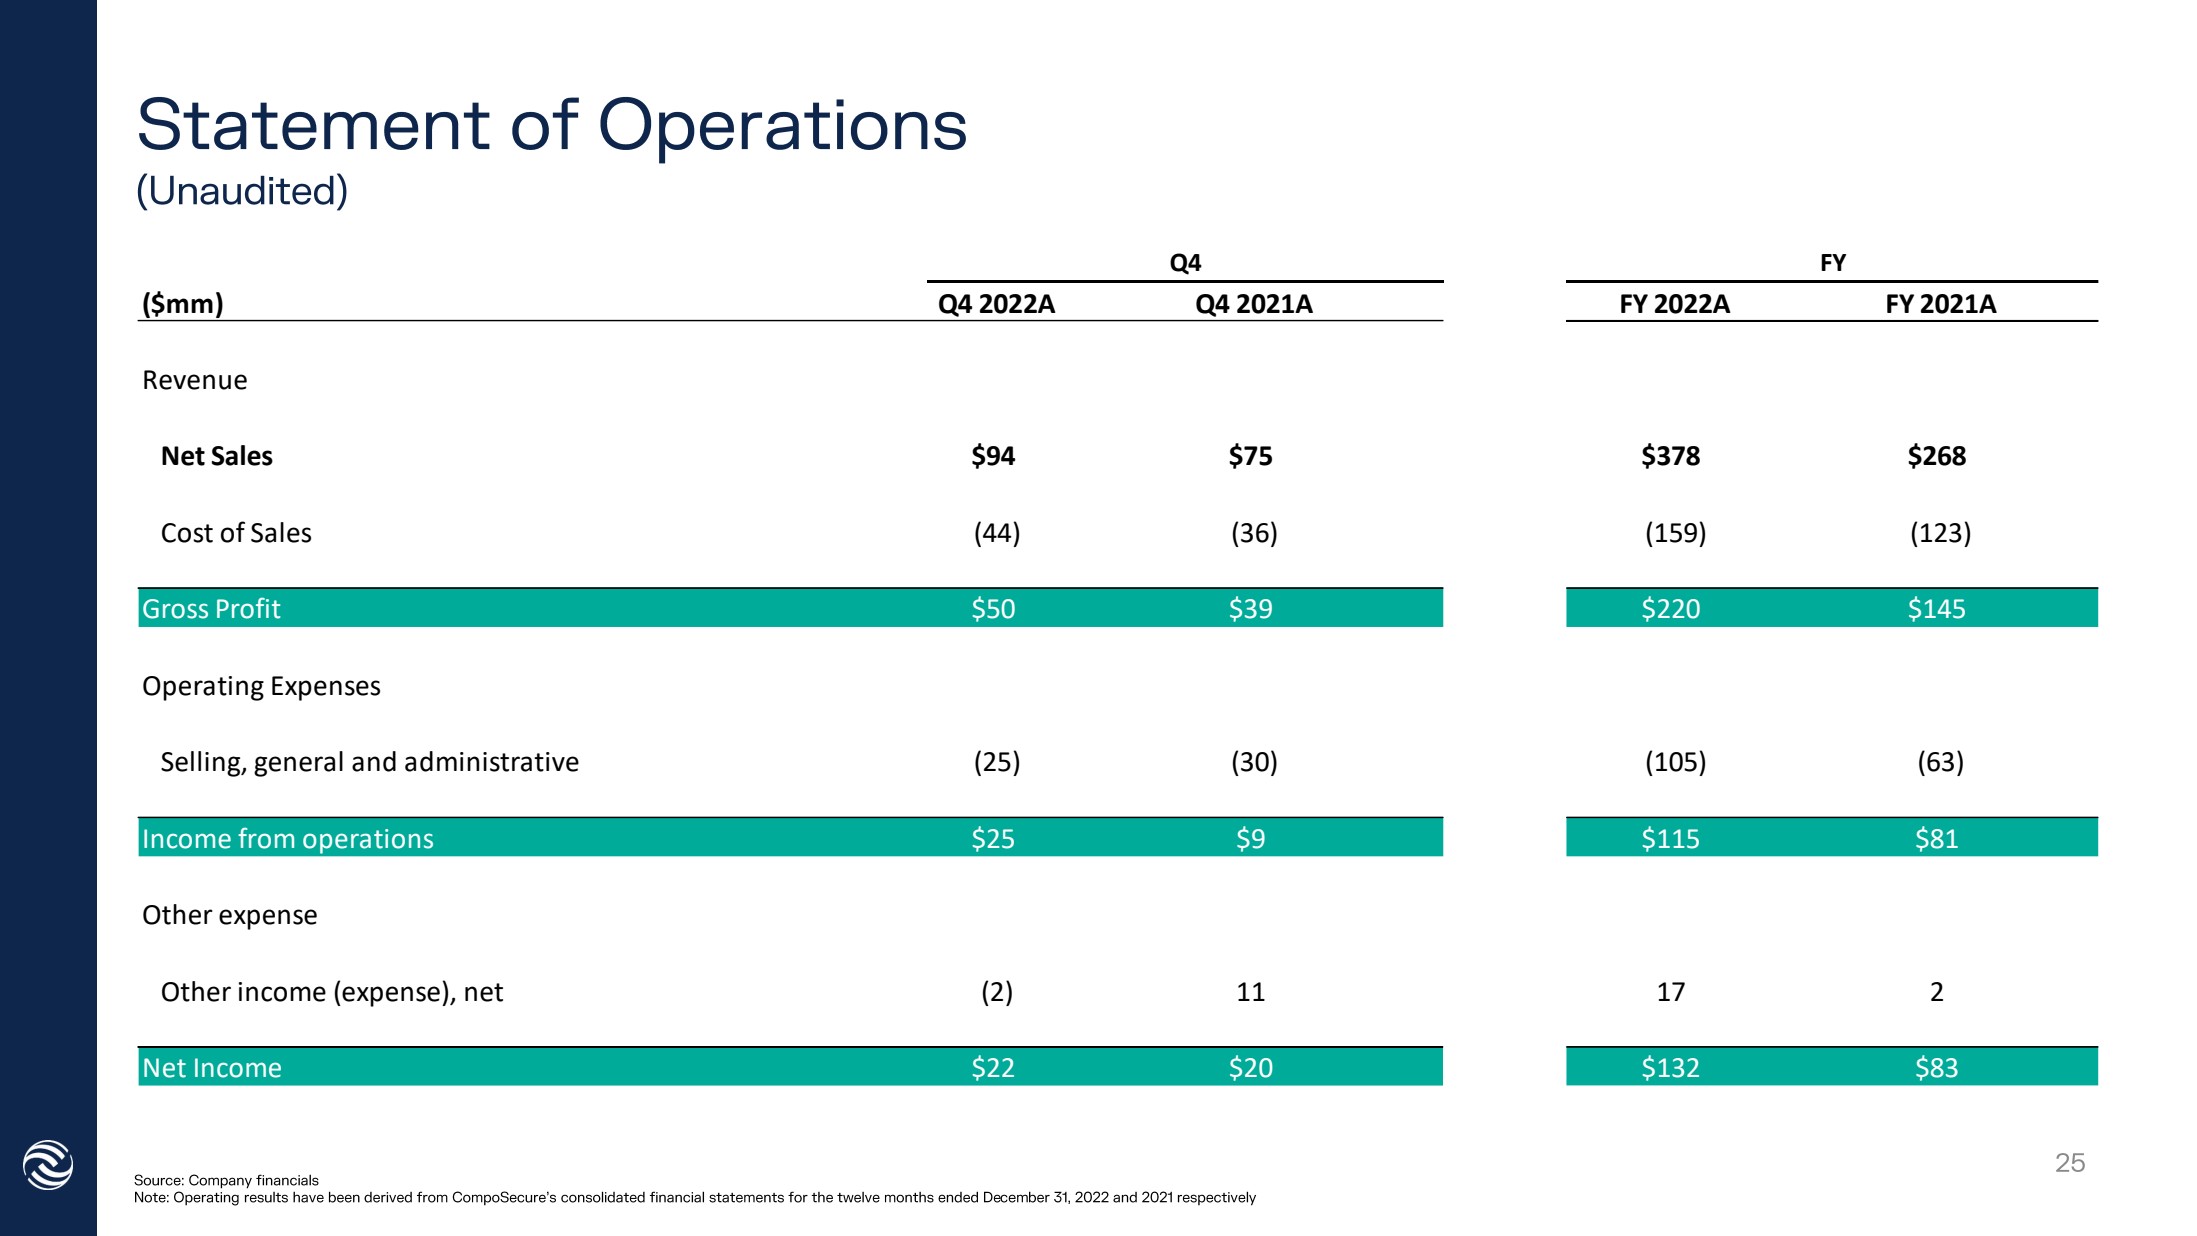
| ($mm) Q4 2022A Q4 2021A FY 2022A FY 2021A Revenue Net Sales $94 $75 $378 $268 Cost of Sales (44) (36) (159) (123) Gross Profit $50 $39 $220 $145 Operating Expenses Selling, general and administrative (25) (30) (105) (63) Income from operations $25 $9 $115 $81 Other expense Other income (expense), net (2) 11 17 2 Net Income $22 $20 $132 $83 Q4 FY |
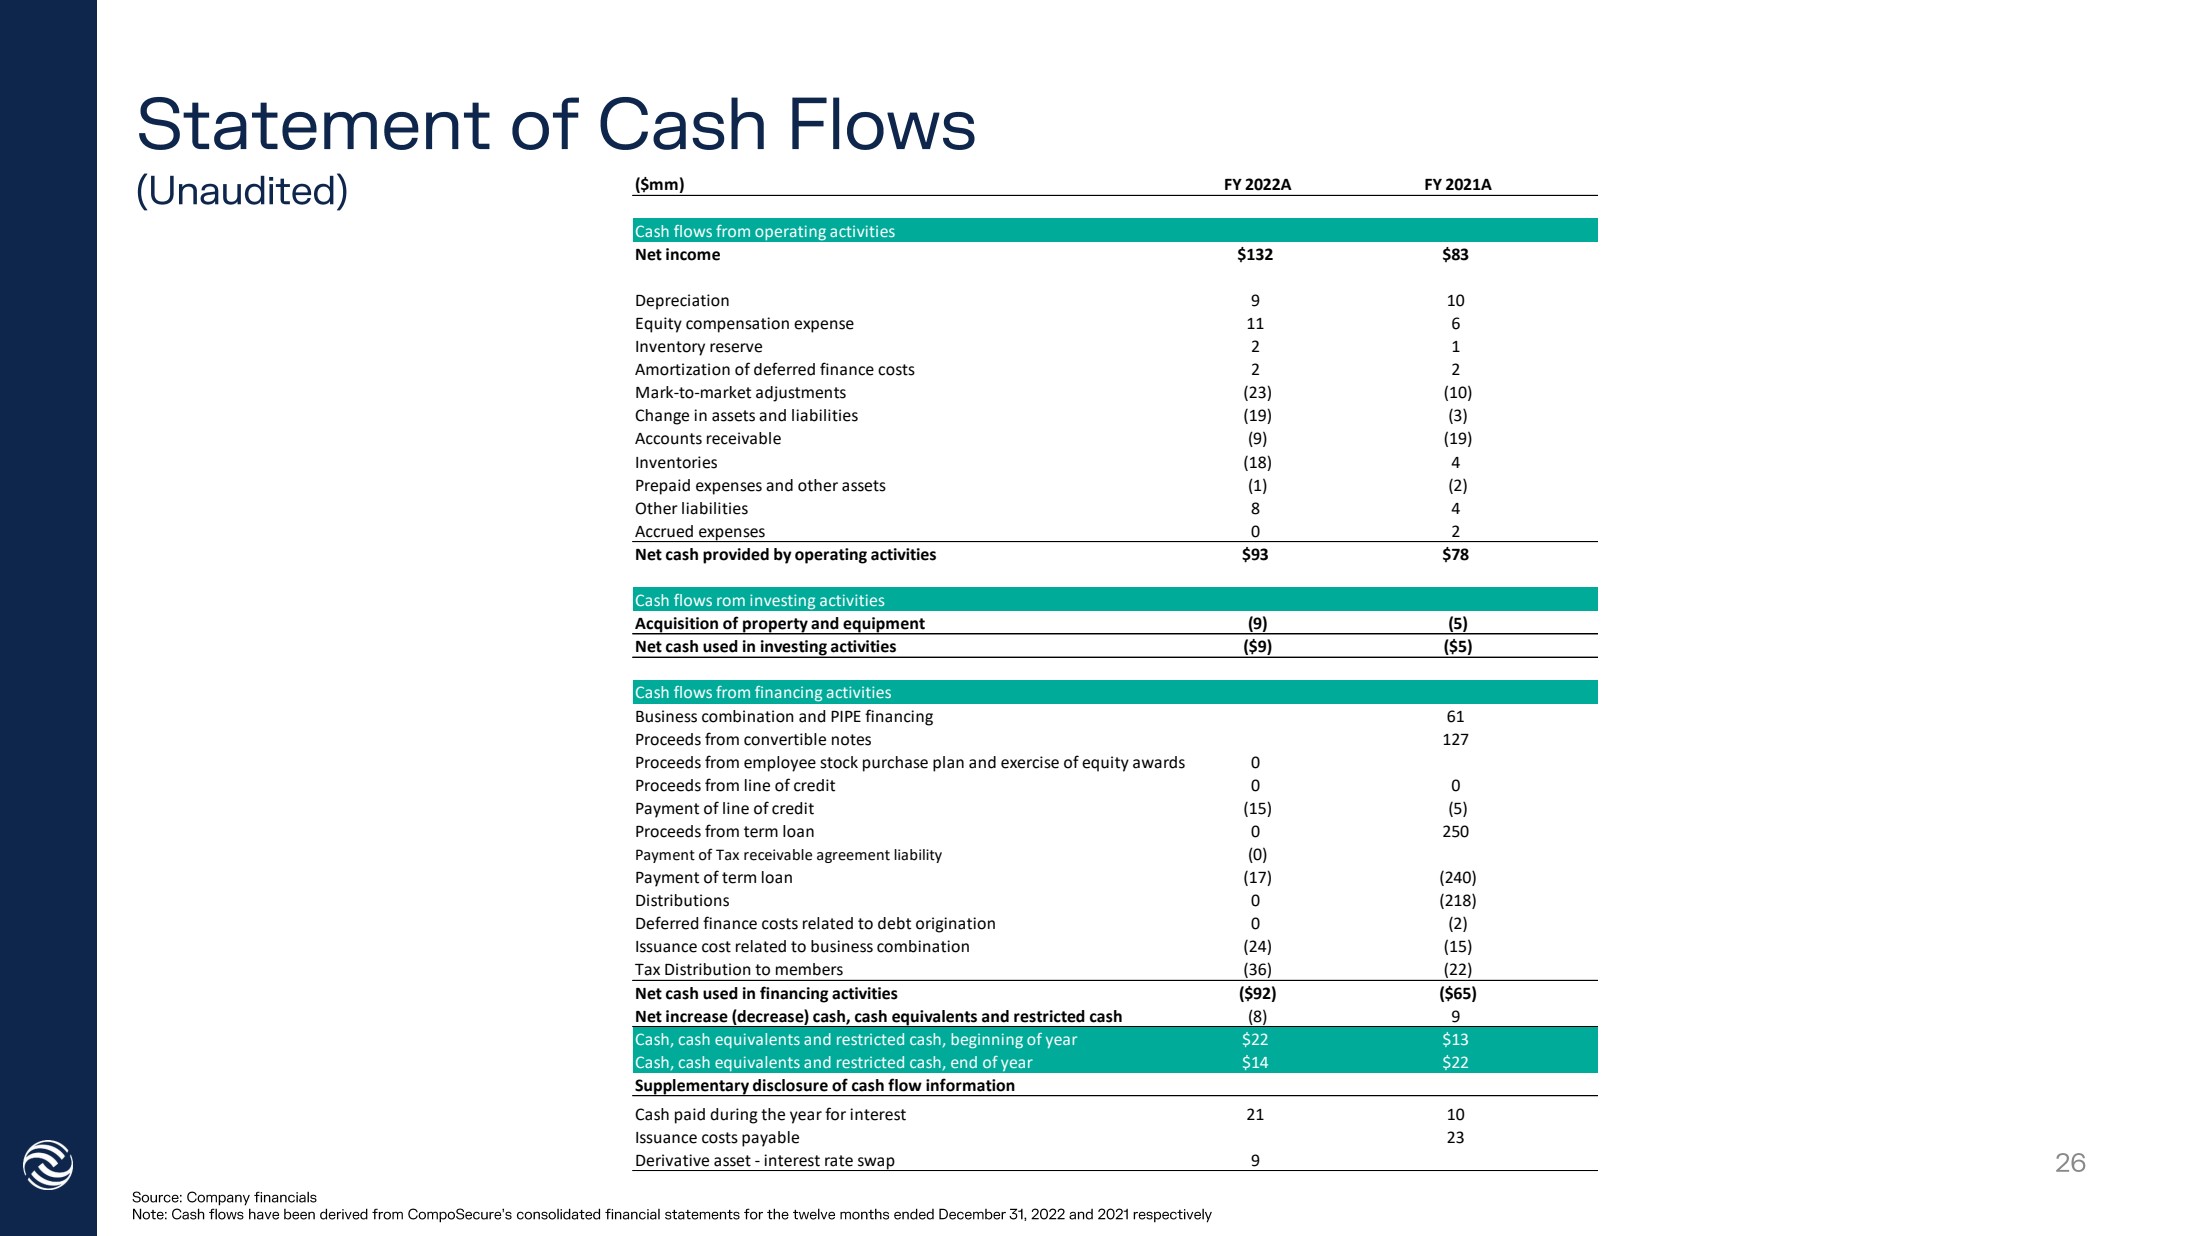
| ($mm) FY 2022A FY 2021A Cash flows from operating activities Net income $132 $83 Depreciation 9 10 Equity compensation expense 11 6 Inventory reserve 2 1 Amortization of deferred finance costs 2 2 Mark-to-market adjustments (23) (10) Change in assets and liabilities (19) (3) Accounts receivable (9) (19) Inventories (18) 4 Prepaid expenses and other assets (1) (2) Other liabilities 8 4 Accrued expenses 0 2 Net cash provided by operating activities $93 $78 Cash flows rom investing activities Acquisition of property and equipment (9) (5) Net cash used in investing activities ($9) ($5) Cash flows from financing activities Business combination and PIPE financing 61 Proceeds from convertible notes 127 Proceeds from employee stock purchase plan and exercise of equity awards 0 Proceeds from line of credit 0 0 Payment of line of credit (15) (5) Proceeds from term loan 0 250 Payment of Tax receivable agreement liability (0) Payment of term loan (17) (240) Distributions 0 (218) Deferred finance costs related to debt origination 0 (2) Issuance cost related to business combination (24) (15) Tax Distribution to members (36) (22) Net cash used in financing activities ($92) ($65) Net increase (decrease) cash, cash equivalents and restricted cash (8) 9 Cash, cash equivalents and restricted cash, beginning of year $22 $13 Cash, cash equivalents and restricted cash, end of year $14 $22 Supplementary disclosure of cash flow information Cash paid during the year for interest 21 10 Issuance costs payable 23 Derivative asset - interest rate swap 9 |
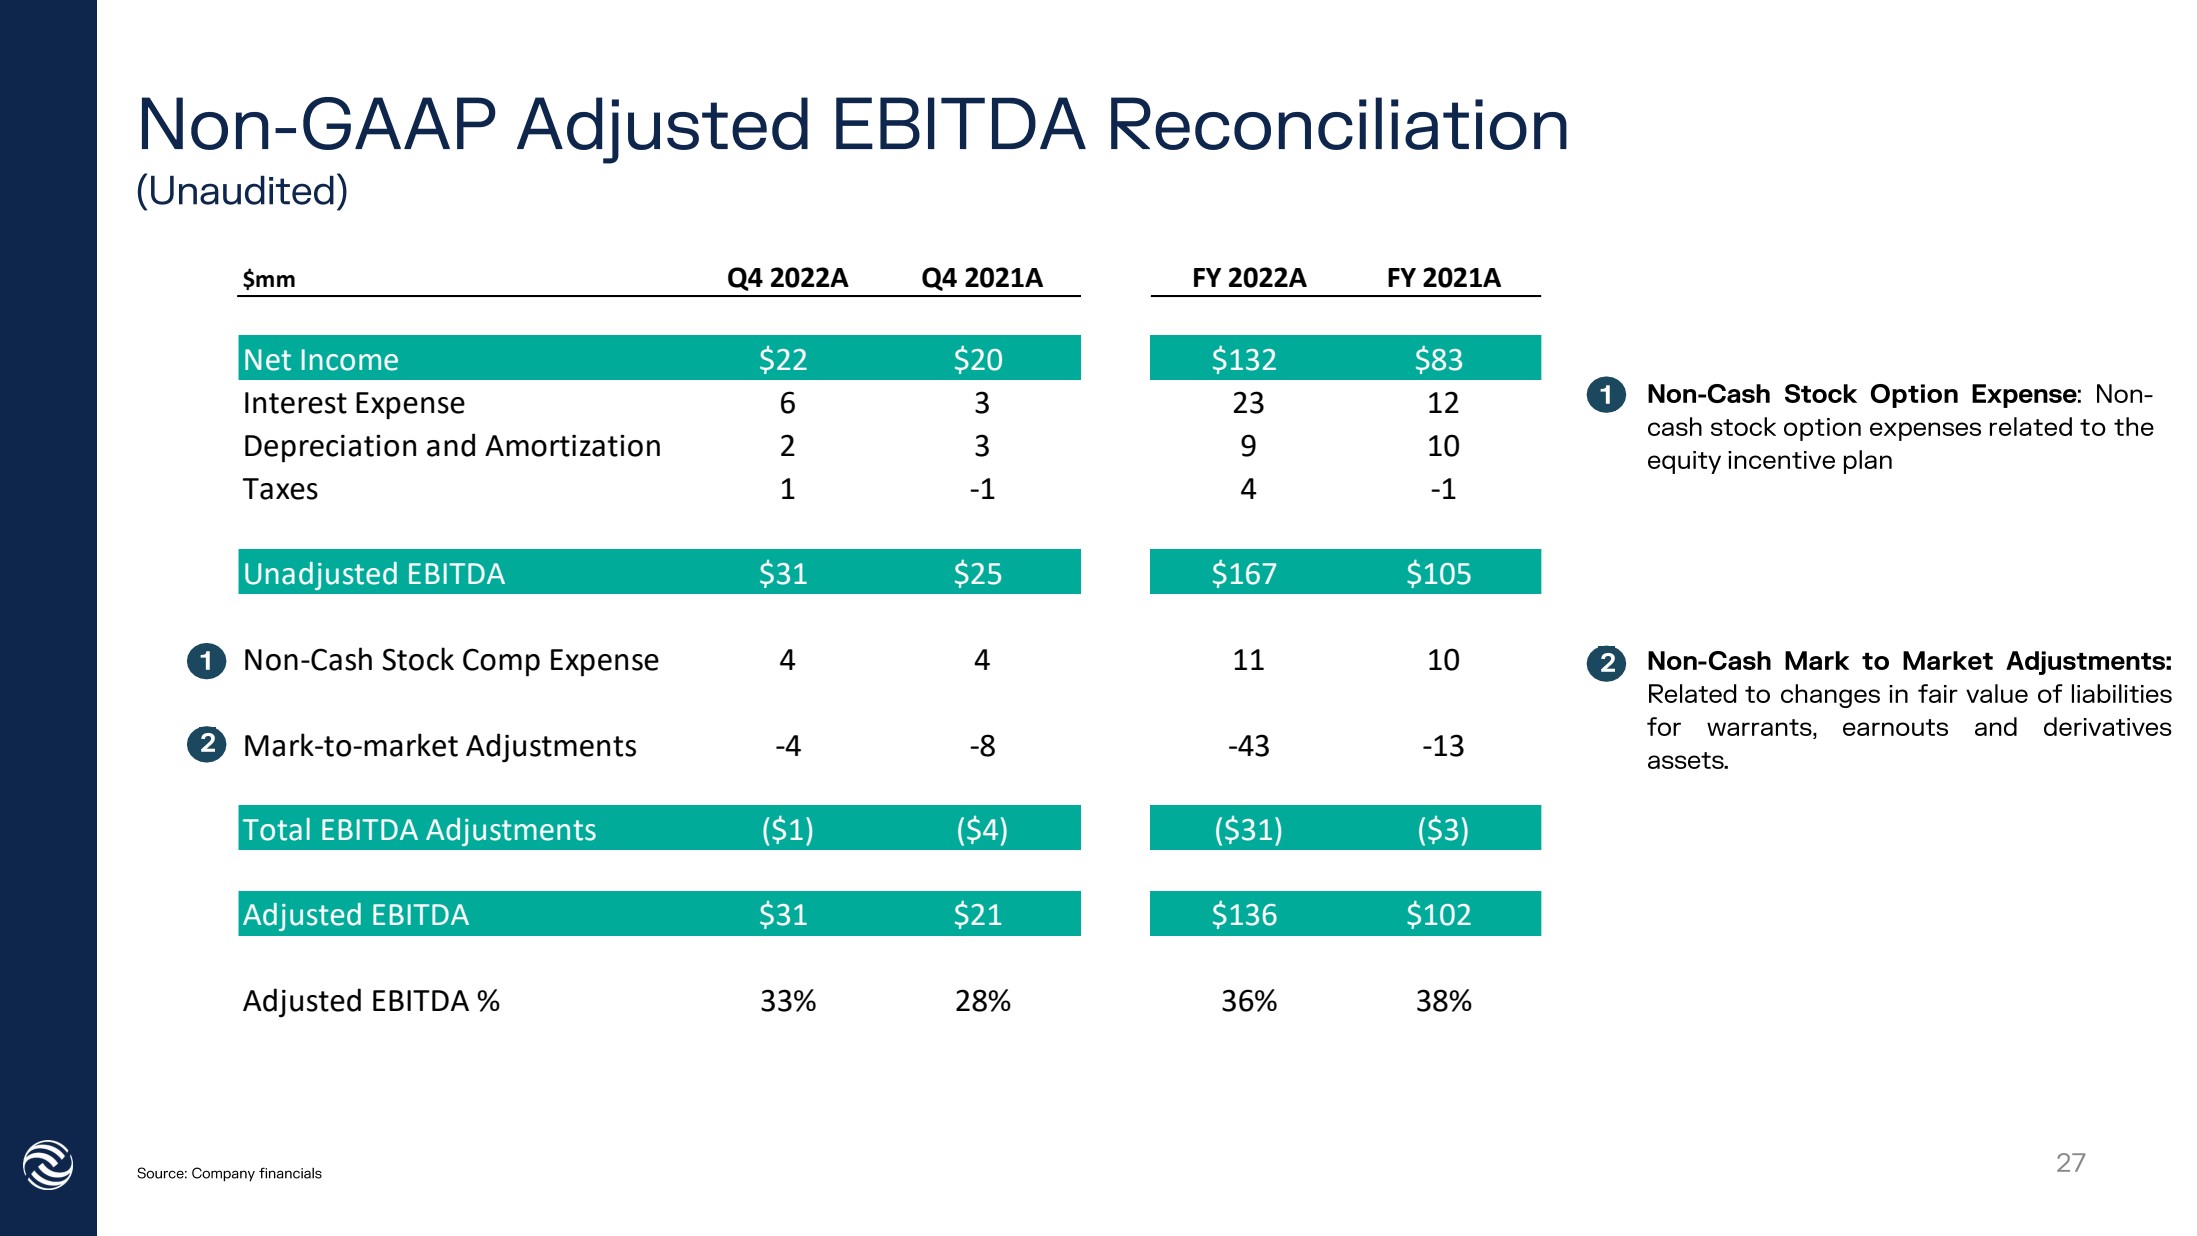
| $mm Q4 2022A Q4 2021A FY 2022A FY 2021A Net Income $22 $20 $132 $83 Interest Expense 6 3 23 12 Depreciation and Amortization 2 3 9 10 Taxes 1 -1 4 -1 Unadjusted EBITDA $31 $25 $167 $105 Non-Cash Stock Comp Expense 4 4 11 10 Mark-to-market Adjustments -4 -8 -43 -13 Total EBITDA Adjustments ($1) ($4) ($31) ($3) Adjusted EBITDA $31 $21 $136 $102 Adjusted EBITDA % 33% 28% 36% 38% |
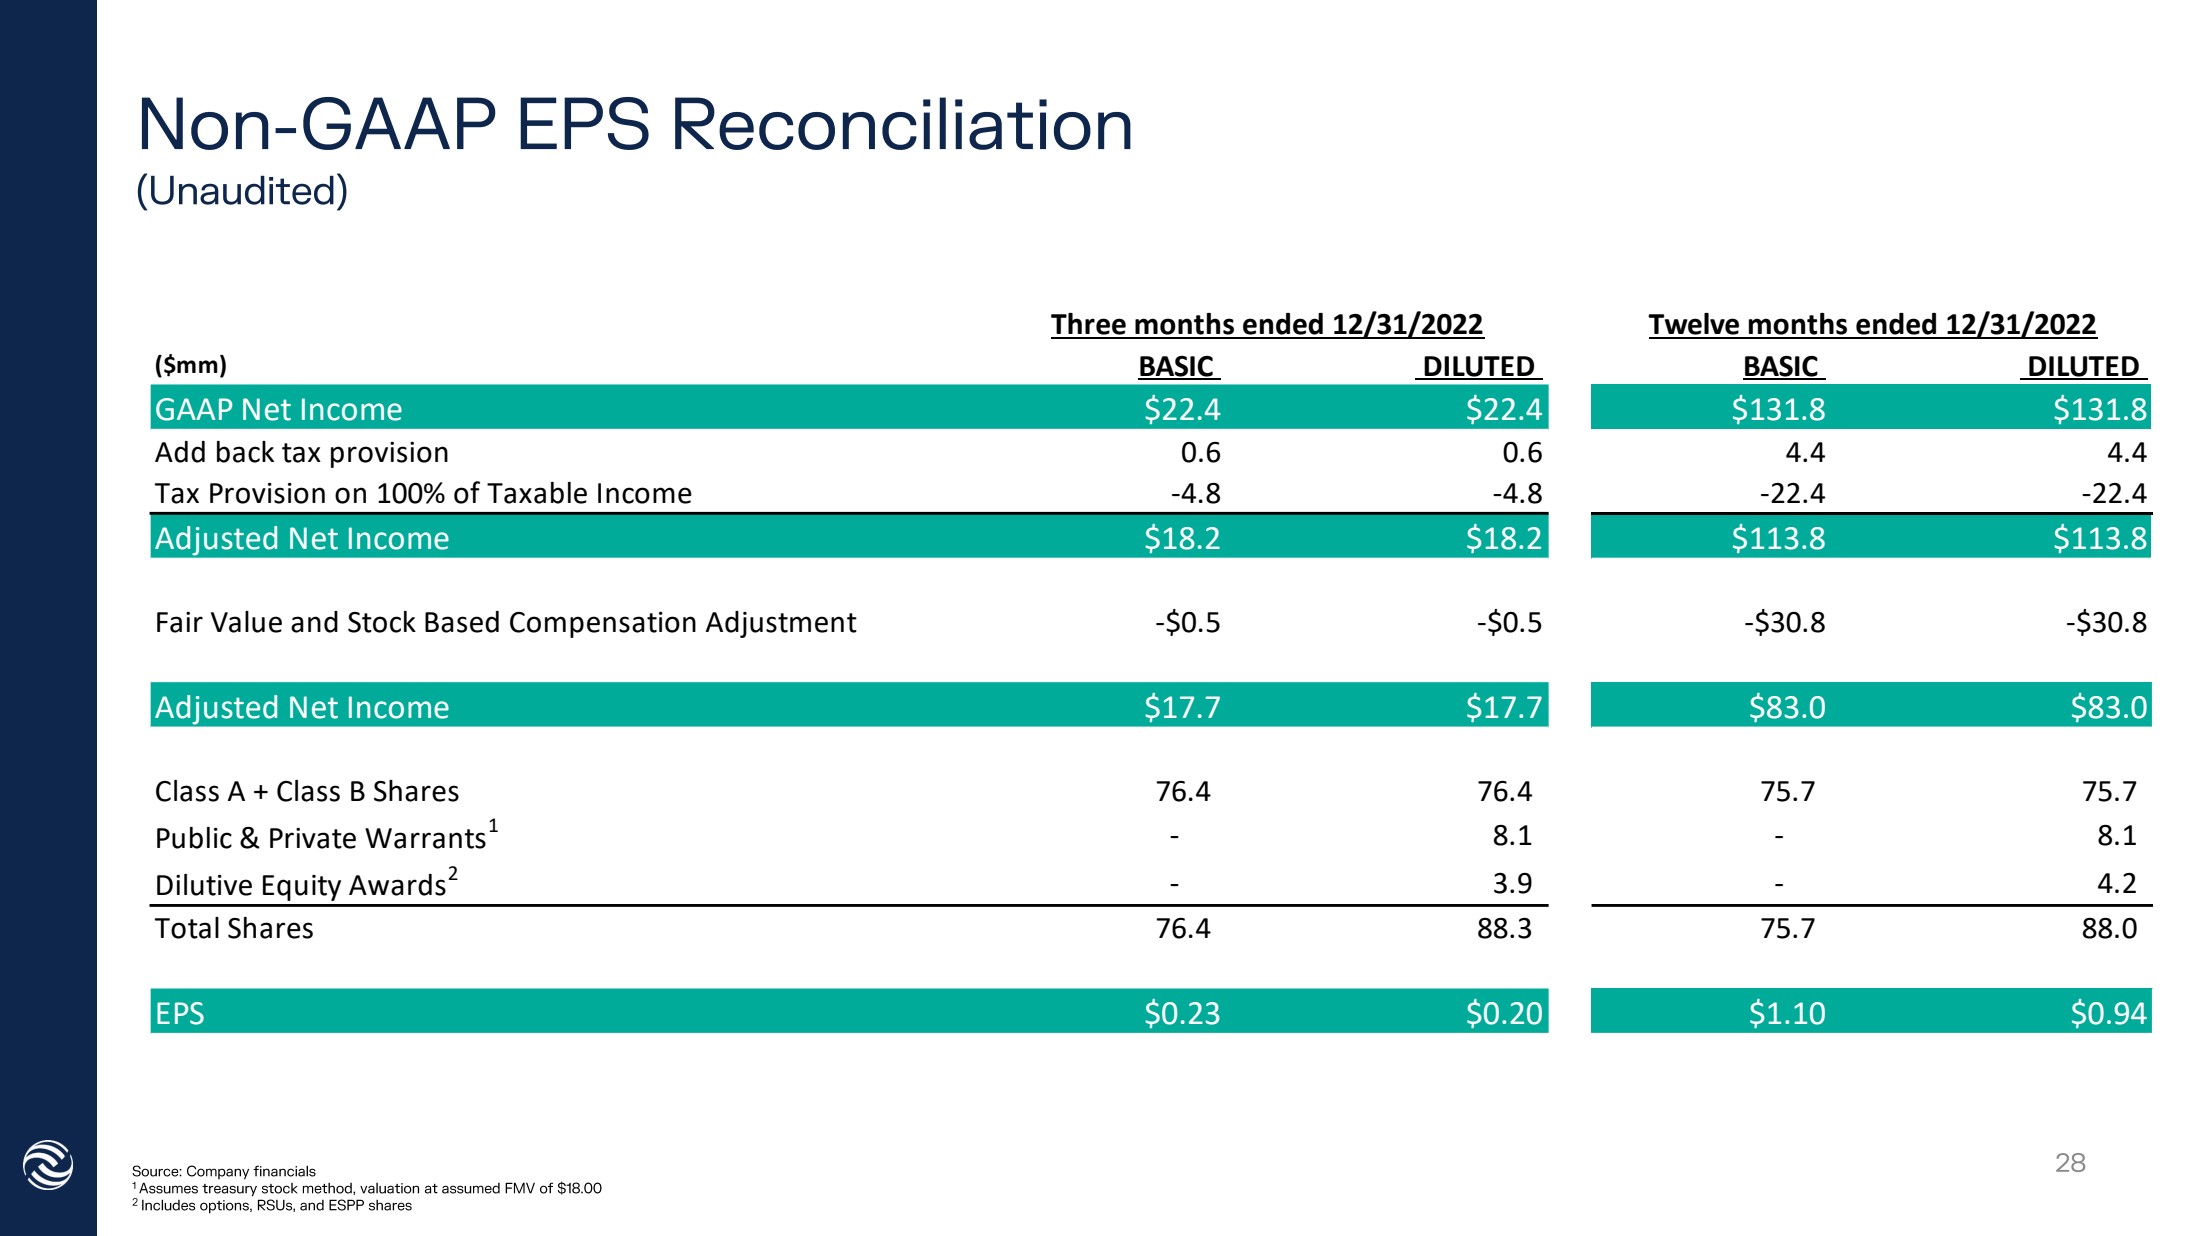
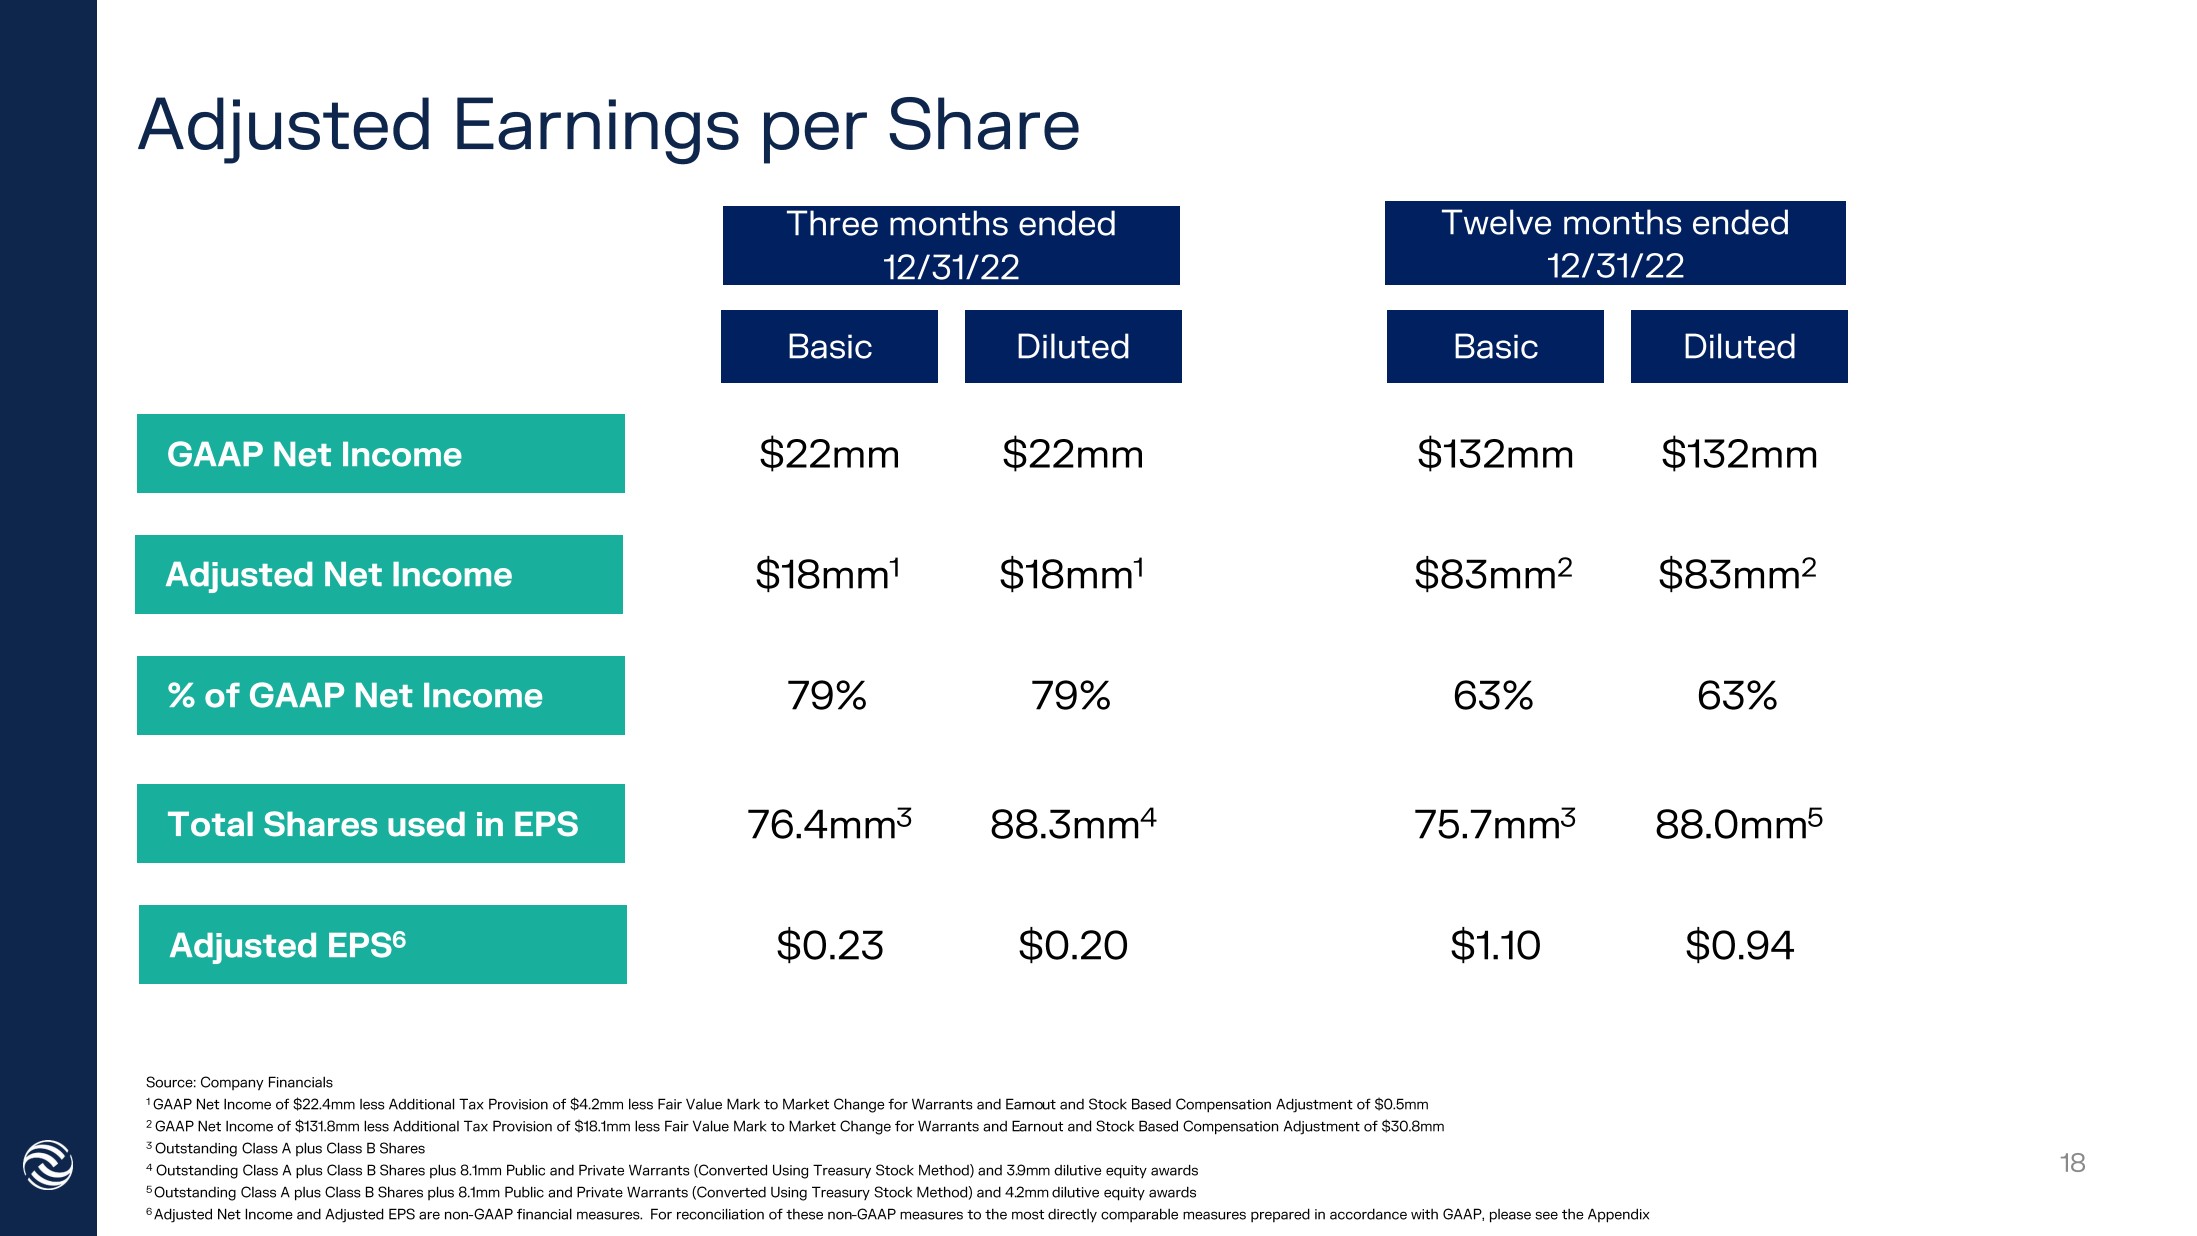
| ($mm) BASIC DILUTED BASIC DILUTED GAAP Net Income $22.4 $22.4 $131.8 $131.8 Add back tax provision 0.6 0.6 4.4 4.4 Tax Provision on 100% of Taxable Income -4.8 -4.8 -22.4 -22.4 Adjusted Net Income $18.2 $18.2 $113.8 $113.8 Fair Value and Stock Based Compensation Adjustment -$0.5 -$0.5 -$30.8 -$30.8 Adjusted Net Income $17.7 $17.7 $83.0 $83.0 Class A + Class B Shares 76.4 76.4 75.7 75.7 Public & Private Warrants1 - 8.1 - 8.1 Dilutive Equity Awards2 - 3.9 - 4.2 Total Shares 76.4 88.3 75.7 88.0 EPS $0.23 $0.20 $1.10 $0.94 Three months ended 12/31/2022 Twelve months ended 12/31/2022 |