
amalgamatedbank.com Member FDIC Amalgamated announces another perfect union September 2021 + amalgamatedbank.com Member FDIC
For Internal Use Only Safe Harbor Statements 2 INTRODUCTION On March 1 , 2021 (the “Effective Date”), Amalgamated Financial Corp . (the “Company” or “Amal” ) completed its holding company reorganization and acquired all of the outstanding stock of Amalgamated Bank (the “Bank”) . In this presentation, unless the context indicates otherwise, references to “we,” “us,” and “our” refer to the Company and the Bank . However, if the discussion relates to a period before the Effective Date, the terms refer only to the Bank . References to "Amalgamated Bank of Chicago" or "ABOC," if the context requires, refer to its subsidiaries and its parent company, "Amalgamated Investments Company" or "AIC . " FORWARD - LOOKING STATEMENTS This presentation contains forward - looking statements within the meaning of the Private Securities Litigation Reform Act, Sectio n 21E of the Securities Exchange Act of 1934, as amended. Any statement that does not describe historical or current facts is a forward - looking statement. These statements generally can be identified by forward - looking terminology, such as “plan,” “se ek to,” “outlook,” “guidance,” “may,” “will,” “anticipate,” “project,” “assume,” “approximately,” “focused,” “targeted,” “opportunity,” “should,” “would,” “believe,” “contemplate,” “expect,” “estimate,” “continue,” “initiatives,” and “intend,” as well as other sim ilar words and expressions of the future. These forward - looking statements include, but are not limited to, statements regarding the outlook and expectations of the Company with respect to its planned merger with AIC , the strategic and financial benefits of the merger, including the expected impact of the transaction on the combined compan y's scale, deposit franchise, growth and future financial performance, and the timing of the closing of the transaction. These forward - looking statements are subject to known and unknown risks, uncertainties and other factors, many of which are beyond our control and any or all of which could cause actual results to differ materially from the results expressed or implied by such forward - looking statements. These risks and uncertainties include, but are not limited to: • the failure to obtain necessary regulatory approvals when expected or at all (and the risk that such approvals may result in the imposition of conditions that could adversely affect the combined company or the expected benefits of the transaction); • the failure of AIC to obtain shareholder approval, or the failure of either company to satisfy any of the other closing condi tio ns to the transaction on a timely basis or at all; • the occurrence of any event, change or other circumstances that could give rise to the right of one or both of the parties to te rminate the merger agreement; • the possibility that the anticipated benefits of the transaction, including anticipated cost savings and strategic gains, are no t realized when expected or at all, including as a result of the impact of, or problems arising from, the integration of the two companies or as a result of the strength of the economy, competitive factors in the areas where we and AIC do business, or as a result of other unexpected factors or events; • the impact of purchase accounting with respect to the transaction, or any change in the assumptions used regarding the assets pu rchased and liabilities assumed to determine their fair value; • diversion of management's attention from ongoing business operations and opportunities; • potential adverse reactions or changes to business or employee relationships, including those resulting from the announcement or completion of the transaction; • the outcome of any legal proceedings that may be instituted against us or AIC; • our integration of the businesses and operations of AIC, which may take longer than anticipated or be more costly than anticipated or have unanticipated adverse results; • business disruptions following the merger ; • other factors that may affect our future results including changes in asset quality and credit risk; the inability to sustain revenue and earnings growth; chan ges in interest rates and capital markets; inflation; customer borrowing, repayment, investment and deposit practices; changes in general economic conditions, including due to the COVID - 19 pandemic; the impact, extent and ti ming of technological changes; capital management activities; and other actions of the Federal Reserve Board and legislative and regulatory actions and reforms. • the impact of competition with other financial institutions, many of which are larger and have greater resources, and fintech s, as well as changes in the competitive environment; • our ability to grow and retain low - cost core deposits and retain large, uninsured deposits; • any matter that would cause us to conclude that there was impairment of any asset, including intangible assets; • inability to comply with regulatory capital requirements, including those resulting from changes to capital calculation metho dol ogies, required capital maintenance levels or regulatory requests or directives; and • a failure in or breach of our operational or security systems or infrastructure, or those of third party vendors or other ser vic e providers, including as a result of unauthorized access, computer viruses, phishing schemes, spam attacks, human error, natural disasters, power loss and other security breaches, the risk of any of which could be exacerbated by employees and oth ers working remotely as a result of the effects of the COVID - 19 pandemic . Additional factors which could affect the forward - looking statements can be found in our Annual Report on Form 10 - K, Quarterly R eports on Form 10 - Q, and Current Reports on Form 8 - K filed with the SEC and available on the SEC’s website at www.sec.gov/. Forward - looking statements are based upon the current beliefs and expectations of management, and on information c urrently available to management. Annualized, pro forma, projected and estimated numbers are used for illustrative purpose only, are not forecasts and may not reflect actual results. We disclaim any obligation to update or revise any forwar d - l ooking statements contained in this presentation, which speak only as of the date hereof, or to update the reasons why actual results could differ from those contained in or implied by such statements, whether as a result of new information, future ev ent s or otherwise, except as required by law .
For Internal Use Only Safe Harbor Statements 3 NON - GAAP FINANCIAL MEASURES This presentation contains certain non - GAAP financial measures including, without limitation, “Core Operating Revenue,” “Core Non - Interest Expense,” “Tangible Common Equity,” “Average Tangible Common Equity,” “Core Efficiency Ratio,” “Core Net Income,” “Core ROAA,” and “Core ROATCE . ” We believe these non - GAAP financial measures provide useful information to management and investors that is supplementary to our financial condition, results of operations and cash flows computed in accordance with GAAP . Specifically, we believe these non - GAAP financial measures (a) allow management and investors to better assess our performance by removing volatility that is associated with discrete items that are unrelated to our core business, and (b) enable a more complete understanding of factors and trends affecting our business . Non - GAAP financial measures, however, have inherent limitations, are not required to be uniformly applied, and are not audited . Accordingly, these non - GAAP financial measures should not be considered as substitutes for GAPP financial measures, and we strongly encourage investors to review the GAAP financial measures included in this presentation and not to place undue reliance on any single financial measure . In addition, because non - GAAP financial measures are not standardized, it may not be possible to compare the non - GAAP financial measures presented in this presentation with other companies’ non - GAAP financial measures having the same or similar names . As such, you should not view these disclosures as a substitute for results determined in accordance with GAAP, and they are not necessarily comparable to non - GAAP financial measures that other companies use . Reconciliations of non - GAAP financial disclosures to what we believe to be the most directly comparable GAAP measures found in this presentation are set forth in the final pages of this presentation and also may be viewed on the bank’s website, amalgamatedbank . com . You should assume that all numbers presented are unaudited unless otherwise noted .
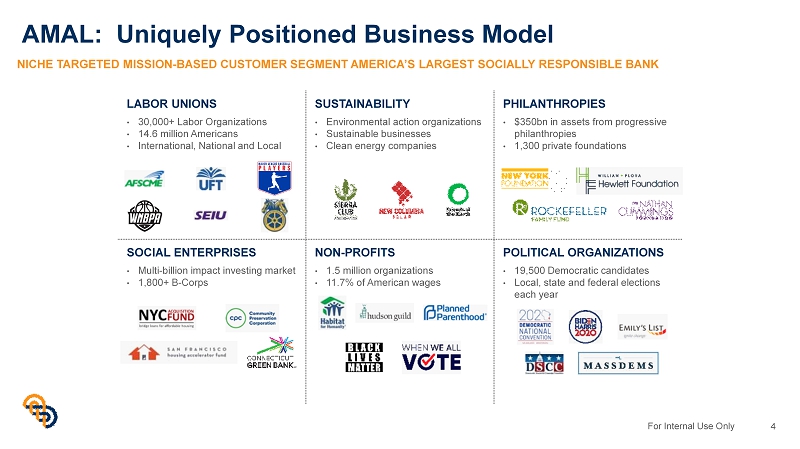
For Internal Use Only AMAL: Uniquely Positioned Business Model 4 NICHE TARGETED MISSION - BASED CUSTOMER SEGMENT AMERICA’S LARGEST SOCIALLY RESPONSIBLE BANK LABOR UNIONS • 30,000+ Labor Organizations • 14.6 million Americans • International, National and Local SUSTAINABILITY • Environmental action organizations • Sustainable businesses • Clean energy companies PHILANTHROPIES • $350bn in assets from progressive philanthropies • 1,300 private foundations SOCIAL ENTERPRISES • Multi - billion impact investing market • 1,800+ B - Corps NON - PROFITS • 1.5 million organizations • 11.7% of American wages POLITICAL ORGANIZATIONS • 19,500 Democratic candidates • Local, state and federal elections each year
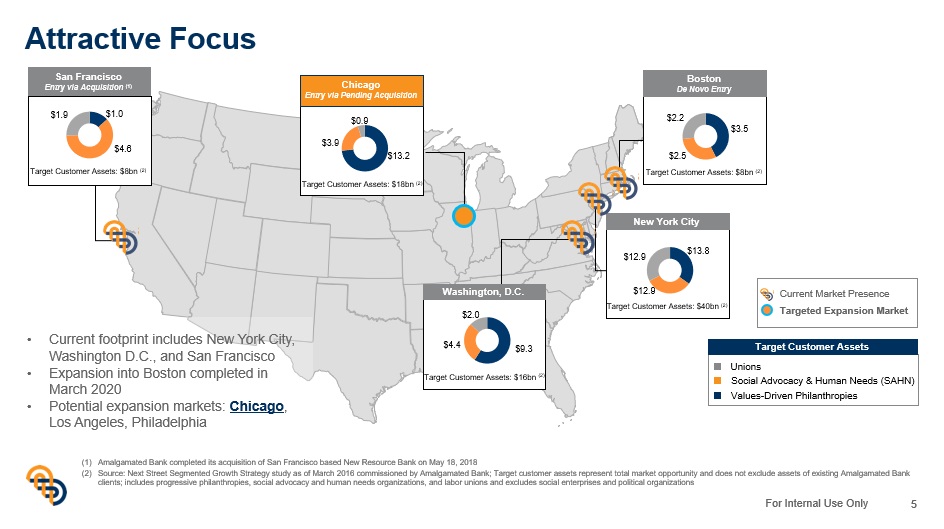
For Internal Use Only Attractive Focus 5 Washington, D.C. New York City San Francisco Entry via Acquisition (1) Chicago Entry via Pending Acquisition Current Market Presence Targeted Expansion Market Unions Social Advocacy & Human Needs (SAHN) Values - Driven Philanthropies Target Customer Assets • Current footprint includes New York City, Washington D.C., and San Francisco • Expansion into Boston completed in March 2020 • Potential expansion markets: Chicago , Los Angeles, Philadelphia (1) Amalgamated Bank completed its acquisition of San Francisco based New Resource Bank on May 18, 2018 (2) Source: Next Street Segmented Growth Strategy study as of March 2016 commissioned by Amalgamated Bank; Target customer assets re present total market opportunity and does not exclude assets of existing Amalgamated Bank clients; includes progressive philanthropies, social advocacy and human needs organizations, and labor unions and excludes so cia l enterprises and political organizations $1.0 $4.6 $1.9 Target Customer Assets: $8bn (2) $13.2 $3.9 $0.9 Target Customer Assets: $18bn (2) Boston De Novo Entry $3.5 $2.5 $2.2 Target Customer Assets: $8bn (2) $13.8 $12.9 $12.9 Target Customer Assets: $40bn (2) $9.3 $4.4 $2.0 Target Customer Assets: $16bn (2)
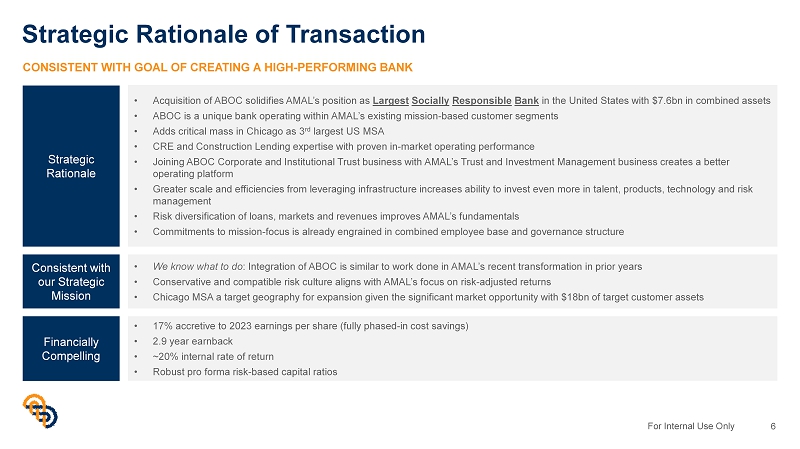
For Internal Use Only Strategic Rationale of Transaction 6 CONSISTENT WITH GOAL OF CREATING A HIGH - PERFORMING BANK Strategic Rationale • Acquisition of ABOC solidifies AMAL’s position as Largest Socially Responsible Bank in the United States with $7.6bn in combined assets • ABOC is a unique bank operating within AMAL’s existing mission - based customer segments • Adds critical mass in Chicago as 3 rd largest US MSA • CRE and Construction Lending expertise with proven in - market operating performance • Joining ABOC Corporate and Institutional Trust business with AMAL’s Trust and Investment Management business creates a better operating platform • Greater scale and efficiencies from leveraging infrastructure increases ability to invest even more in talent, products, technology and risk management • Risk diversification of loans, markets and revenues improves AMAL’s fundamentals • Commitments to mission - focus is already engrained in combined employee base and governance structure Consistent with our Strategic Mission • We know what to do : Integration of ABOC is similar to work done in AMAL’s recent transformation in prior years • Conservative and compatible risk culture aligns with AMAL’s focus on risk - adjusted returns • Chicago MSA a target geography for expansion given the significant market opportunity with $18bn of target customer assets Financially Compelling • 17% accretive to 2023 earnings per share (fully phased - in cost savings) • 2.9 year earnback • ~20% internal rate of return • Robust pro forma risk - based capital ratios
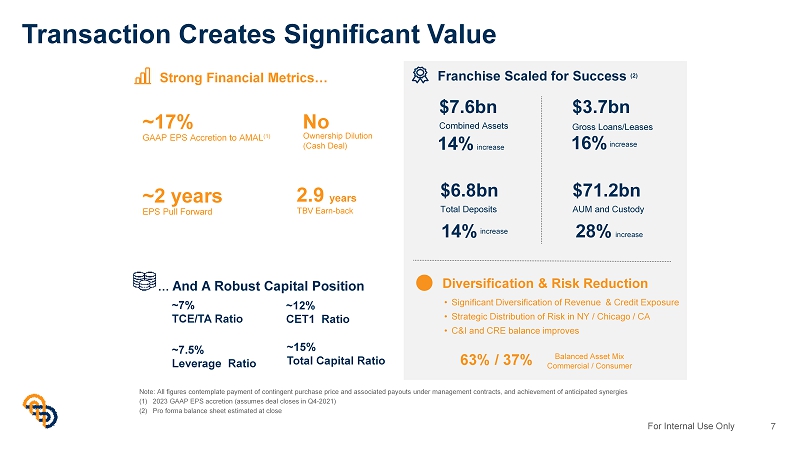
For Internal Use Only Transaction Creates Significant Value 7 Note: All figures contemplate payment of contingent purchase price and associated payouts under management contracts, and ach iev ement of anticipated synergies (1) 2023 GAAP EPS accretion (assumes deal closes in Q4 - 2021) (2) Pro forma balance sheet estimated at close Strong Financial Metrics… ~17% GAAP EPS Accretion to AMAL (1) $7.6bn Combined Assets $3.7bn Gross Loans/Leases $6.8bn Total Deposits Franchise Scaled for Success (2) ~2 years EPS Pull Forward No Ownership Dilution (Cash Deal) 63% / 37% Balanced Asset Mix Commercial / Consumer 14% increase • Significant Diversification of Revenue & Credit Exposure • Strategic Distribution of Risk in NY / Chicago / CA • C&I and CRE balance improves Diversification & Risk Reduction 14% increase 16% increase $71.2bn AUM and Custody 28% 2.9 years TBV Earn - back … And A Robust Capital Position ~12% CET1 Ratio ~15% Total Capital Ratio ~7% TCE/TA Ratio ~7.5% Leverage Ratio increase
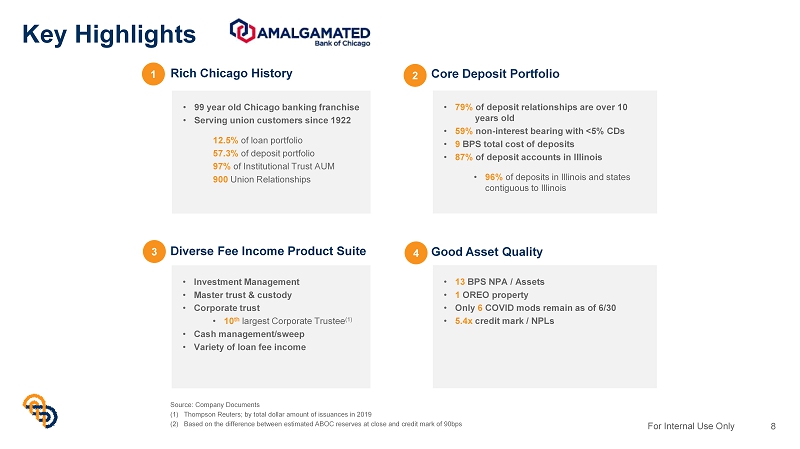
For Internal Use Only Key Highlights 8 • 99 year old Chicago banking franchise • Serving union customers since 1922 12.5% of loan portfolio 57.3% of deposit portfolio 97% of Institutional Trust AUM 900 Union Relationships • 79% of deposit relationships are over 10 years old • 59% non - interest bearing with <5% CDs • 9 BPS total cost of deposits • 87% of deposit accounts in Illinois • 96% of deposits in Illinois and states contiguous to Illinois • 13 BPS NPA / Assets • 1 OREO property • Only 6 COVID mods remain as of 6/30 • 5.4x credit mark / NPLs Rich Chicago History Core Deposit Portfolio Good Asset Quality • Investment Management • Master trust & custody • Corporate trust • 10 th largest Corporate Trustee (1) • Cash management/sweep • Variety of loan fee income Diverse Fee Income Product Suite Source: Company Documents (1) Thompson Reuters; by total dollar amount of issuances in 2019 (2) Based on the difference between estimated ABOC reserves at close and credit mark of 90bps 1 2 3 4

For Internal Use Only Snapshot 9 Dollars in Millions 12/31/18 12/31/19 12/31/20 6/30 YTD Balance Sheet Assets 915.8 930.7 1,082.4 950.1 Net Loans 459.0 492.0 505.7 511.0 Deposits 806.0 815.9 970.5 836.2 Tangible Common Equity 80.0 87.5 88.7 88.8 Balance Sheet Ratios Loans/ Deposits (%) 57.6% 61.1% 52.9% 62.1% TCE / TA (%) 8.74% 9.40% 8.20% 9.35% CET1 Ratio (%) 15.6% 16.3% 16.1% 16.8% Total Capital Ratio (%) 16.6% 17.4% 17.4% 18.0% Profitability Ratios Core ROAA (%) (2) 0.76% 1.06% 0.41% 0.36% Core ROATCE (%) (2) 8.2% 10.3% 3.9% 3.9% Net Interest Margin (%) 3.91% 4.36% 3.43% 2.92% Efficiency Ratio (%) 78.5% 74.0% 84.4% 85.8% Noninterest Inc/ Operating Rev (%) 40.6% 37.0% 39.5% 40.5% Asset Quality NPAs/ Loans + OREO (%) 1.93% 0.34% 0.25% 0.24% NCOs/ Avg Loans (%) 0.41% 0.26% 0.22% 0.17% CRE / TRBC (ex. OOC) (%) 292% 304% 328% 336% Demand Deposits 61.5% NOW & Other Trans. Accts 15.8% MMDA & Other Savings 18.8% Retail Time Deposits 1.2% Jumbo Time Deposits 2.7% Commercial and Industrial 4.9% Multifamily 29.2% Commercial Real Estate 44.0% Construction and Land Development 12.5% Residential Real Estate 9.3% Consumer and Other 0.1% Source: S&P Global Market Intelligence Note: All figures presented for Amalgamated Bank of Chicago Note: ABOC loan and deposit data as of 6/30/2021 per bank regulatory fillings; Retail Time Deposits < $100k and Jumbo Time De pos its >$100k (1) Loan balances and yield on loans adjusted for sale of the credit card business closed in 2021Q3 (2) Core Income excludes extraordinary items, non - recurring items and gains/losses on sale of securities FINANCIAL SNAPSHOT BRANCH LOCATIONS: CHICAGO & WARRENVILLE, IL LOANS HFI AND DEPOSIT COMPOSITION (1) Yield on Loans: 4.48% (1) Cost of IB Deposits: 0.09% $489mm $836mm FRANCHISE OVERVIEW • Founded in 1922 by Amalgamated Clothing Works of America, the same union that founded AMAL • Holding Company: Amalgamated Investments Company • Provides a wide variety of products and services including lending, checking, savings, cash management and trust services • Trust business holds $2.4Bn in AUM, $13.0Bn in AUC and $40.2Bn in AUA
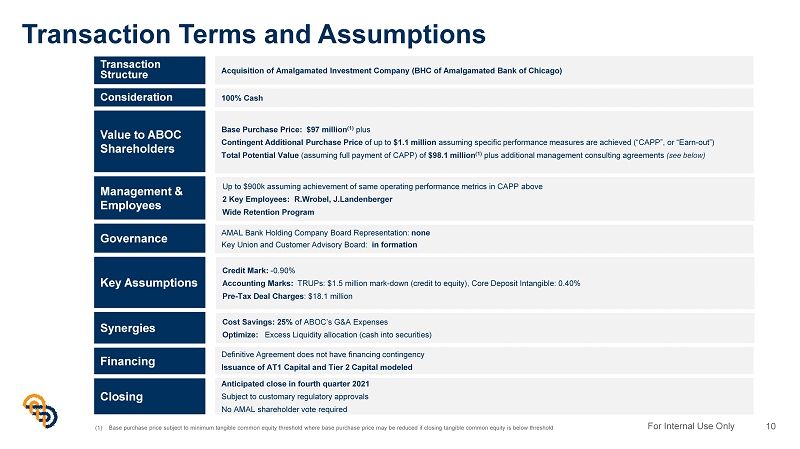
For Internal Use Only Transaction Terms and Assumptions 10 Transaction Structure Value to ABOC Shareholders Consideration Governance Key Assumptions Financing Acquisition of Amalgamated Investment Company (BHC of Amalgamated Bank of Chicago) Base Purchase Price: $97 million (1) plus Contingent Additional Purchase Price of up to $1.1 million assuming specific performance measures are achieved (“CAPP”, or “Earn - out”) Total Potential Value (assuming full payment of CAPP) of $98.1 million (1) plus additional management consulting agreements (see below) 100% Cash AMAL Bank Holding Company Board Representation: none Key Union and Customer Advisory Board: in formation Credit Mark: - 0.90% Accounting Marks: TRUPs: $1.5 million mark - down (credit to equity), Core Deposit Intangible: 0.40% Pre - Tax Deal Charges : $18.1 million Definitive Agreement does not have financing contingency Issuance of AT1 Capital and Tier 2 Capital modeled Management & Employees Up to $900k assuming achievement of same operating performance metrics in CAPP above 2 Key Employees: R.Wrobel , J.Landenberger Wide Retention Program Closing Anticipated close in fourth quarter 2021 Subject to customary regulatory approvals No AMAL shareholder vote required Synergies Cost Savings: 25% of ABOC’s G&A Expenses Optimize: Excess Liquidity allocation (cash into securities) (1) Base purchase price subject to minimum tangible common equity threshold where base purchase price may be reduced if closing t ang ible common equity is below threshold
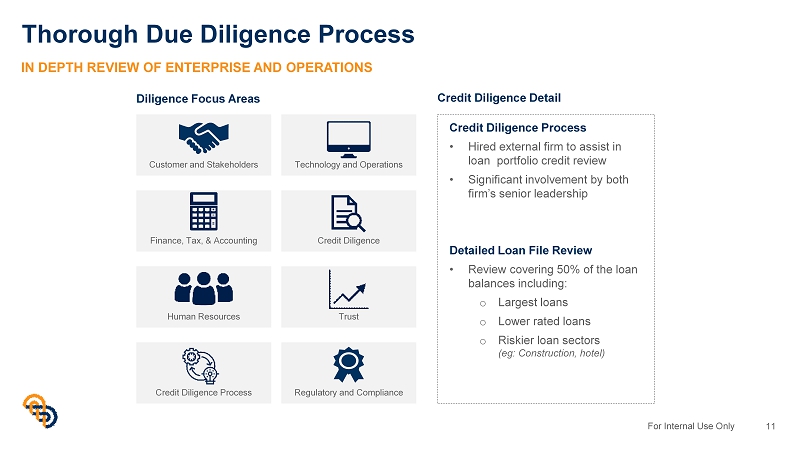
For Internal Use Only Thorough Due Diligence Process 11 Credit Diligence Process • Hired external firm to assist in loan portfolio credit review • Significant involvement by both firm’s senior leadership Detailed Loan File Review • Review covering 50% of the loan balances including: o Largest loans o Lower rated loans o Riskier loan sectors ( eg : Construction, hotel) Diligence Focus Areas IN DEPTH REVIEW OF ENTERPRISE AND OPERATIONS Customer and Stakeholders Technology and Operations Finance, Tax, & Accounting Credit Diligence Human Resources Trust Credit Diligence Process Regulatory and Compliance Credit Diligence Detail
For Internal Use Only Leadership, Management, & Governance 12 AMAL BOARD OF DIRECTORS – REMAINS INTACT • Strong, majority independent board, consistent with public company standards CONTINUITY IN LEADERSHIP • AMAL leadership team to run pro forma company • Continued engagement from ABOC leadership – contingent value payments align incentives DIVERSIFIED OWNERSHIP BASE • Public listing simplifies access to capital markets AMAL WILL SEEK TO FORM AN ADVISORY BOARD FROM KEY ABOC CONSTITUENTS • Continued involvement with select members of ABOC board of directors • Commitment to stakeholder groups including customers and employees
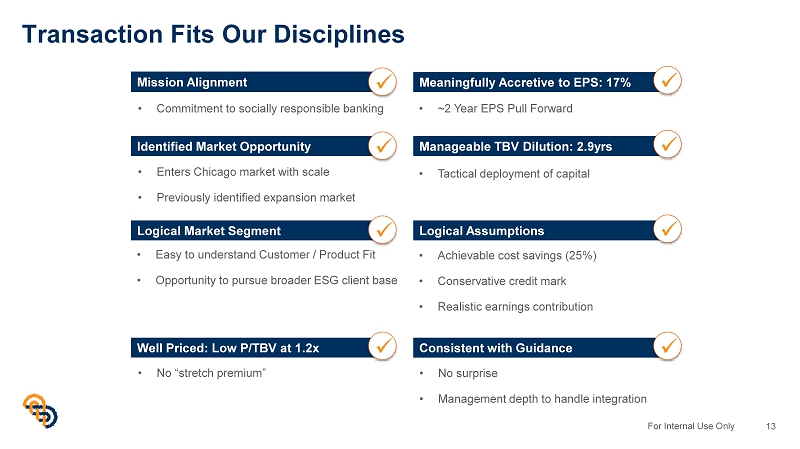
For Internal Use Only Transaction Fits Our Disciplines 13 • Commitment to socially responsible banking • Enters Chicago market with scale • Previously identified expansion market • Easy to understand Customer / Product Fit • Opportunity to pursue broader ESG client base • No “stretch premium” • ~2 Year EPS Pull Forward • Achievable cost savings (25%) • Conservative credit mark • Realistic earnings contribution • Tactical deployment of capital Mission Alignment x Identified Market Opportunity Logical Market Segment Well Priced: Low P/TBV at 1.2x Meaningfully Accretive to EPS: 17% Manageable TBV Dilution: 2.9yrs Logical Assumptions Consistent with Guidance x x x x x x x • No surprise • Management depth to handle integration
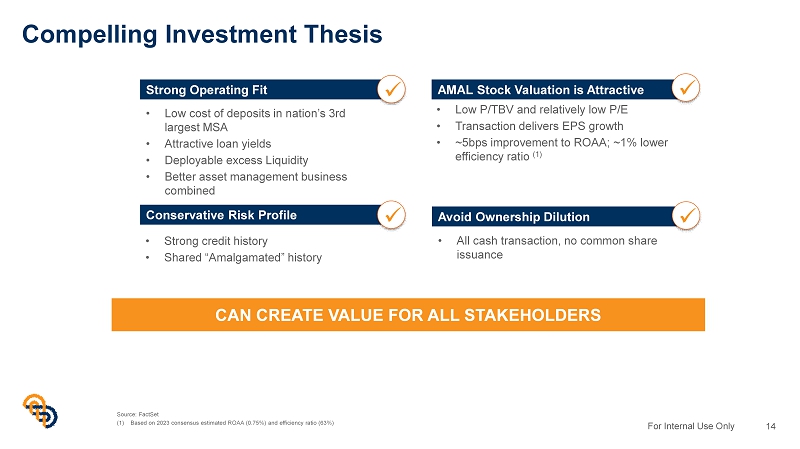
For Internal Use Only Compelling Investment Thesis 14 • All cash transaction, no common share issuance Strong Operating Fit Avoid Ownership Dilution x • Low cost of deposits in nation’s 3rd largest MSA • Attractive loan yields • Deployable excess Liquidity • Better asset management business combined Conservative Risk Profile x • Strong credit history • Shared “Amalgamated” history AMAL Stock Valuation is Attractive x • Low P/TBV and relatively low P/E • Transaction delivers EPS growth • ~5bps improvement to ROAA; ~1% lower efficiency ratio (1) CAN CREATE VALUE FOR ALL STAKEHOLDERS Source: FactSet (1) Based on 2023 consensus estimated ROAA (0.75%) and efficiency ratio (63%) x
Supplemental Information
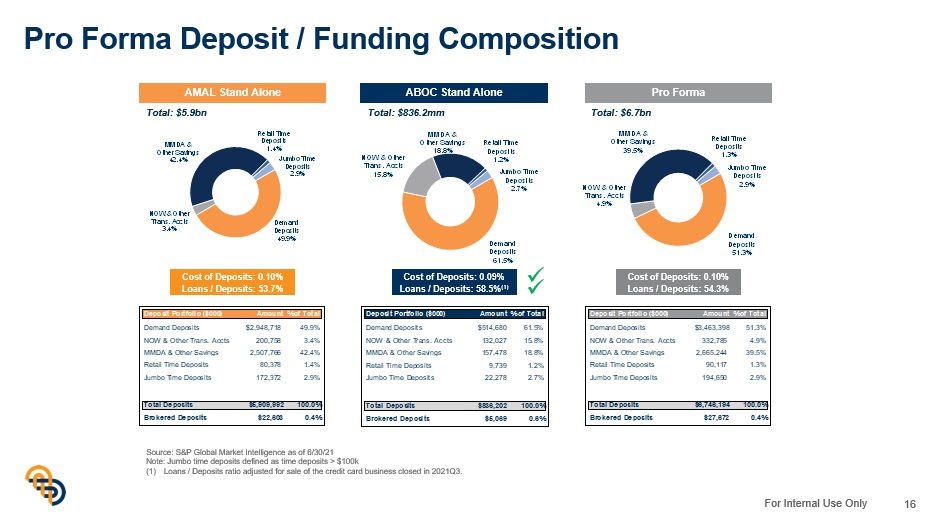
For Internal Use Only Pro Forma Deposit / Funding Composition 16 Demand Deposits 49.9% NOW & Other Trans. Accts 3.4% MMDA & Other Savings 42.4% Retail Time Deposits 1.4% Jumbo Time Deposits 2.9% Demand Deposits 61.5% NOW & Other Trans. Accts 15.8% MMDA & Other Savings 18.8% Retail Time Deposits 1.2% Jumbo Time Deposits 2.7% Demand Deposits 51.3% NOW & Other Trans. Accts 4.9% MMDA & Other Savings 39.5% Retail Time Deposits 1.3% Jumbo Time Deposits 2.9% Cost of Deposits: 0.10% Loans / Deposits: 53.7% Total: $5.9bn Total: $6.7bn Total: $836.2mm Cost of Deposits: 0.09% Loans / Deposits: 58.5% (1) Cost of Deposits: 0.10% Loans / Deposits: 54.3% AMAL Stand Alone ABOC Stand Alone Pro Forma Deposit Portfolio ($000) Amount% of Total Demand Deposits $2,948,718 49.9% NOW & Other Trans. Accts 200,758 3.4% MMDA & Other Savings 2,507,766 42.4% Retail Time Deposits 80,378 1.4% Jumbo Time Deposits 172,372 2.9% Total Deposits $5,909,992 100.0% Brokered Deposits $22,603 0.4% Deposit Portfolio ($000) Amount% of Total Demand Deposits $514,680 61.5% NOW & Other Trans. Accts 132,027 15.8% MMDA & Other Savings 157,478 18.8% Retail Time Deposits 9,739 1.2% Jumbo Time Deposits 22,278 2.7% Total Deposits $836,202 100.0% Brokered Deposits $5,069 0.6% Deposit Portfolio ($000) Amount% of Total Demand Deposits $3,463,398 51.3% NOW & Other Trans. Accts 332,785 4.9% MMDA & Other Savings 2,665,244 39.5% Retail Time Deposits 90,117 1.3% Jumbo Time Deposits 194,650 2.9% Total Deposits $6,746,194 100.0% Brokered Deposits $27,672 0.4% x x Source: S&P Global Market Intelligence as of 6/30/21 Note: Jumbo time deposits defined as time deposits > $100k (1) Loans / Deposits ratio adjusted for sale of the credit card business closed in 2021Q3.
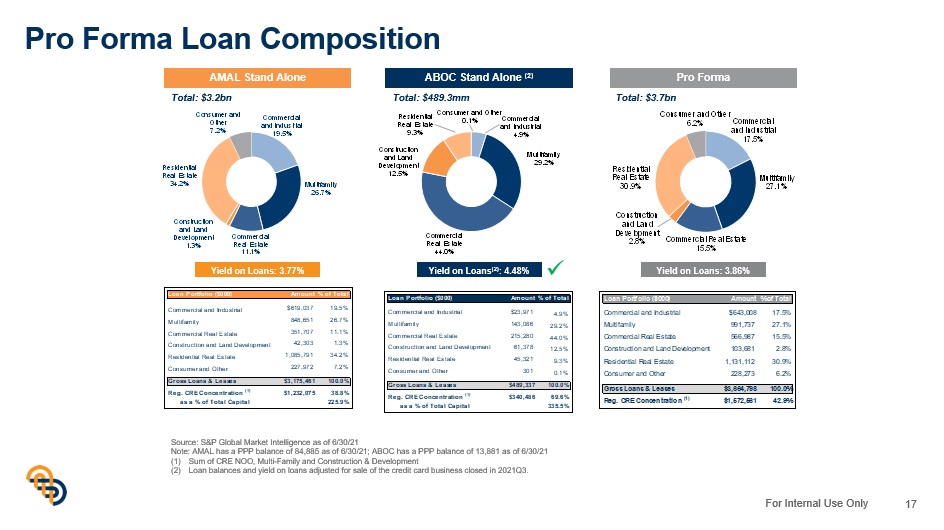
For Internal Use Only Pro Forma Loan Composition 17 Loan Portfolio ($000) Amount% of Total Commercial and Industrial $23,971 4.9% Multifamily 143,086 29.2% Commercial Real Estate 215,280 44.0% Construction and Land Development 61,378 12.5% Residential Real Estate 45,321 9.3% Consumer and Other 301 0.1% Gross Loans & Leases $489,337 100.0% Reg. CRE Concentration (1) $340,486 69.6% as a % of Total Capital 335.5% Loan Portfolio ($000) Amount% of Total Commercial and Industrial $619,037 19.5% Multifamily 848,651 26.7% Commercial Real Estate 351,707 11.1% Construction and Land Development 42,303 1.3% Residential Real Estate 1,085,791 34.2% Consumer and Other 227,972 7.2% Gross Loans & Leases $3,175,461 100.0% Reg. CRE Concentration (1) $1,232,075 38.8% as a % of Total Capital 225.9% Commercial and Industrial 17.5% Multifamily 27.1% Commercial Real Estate 15.5% Construction and Land Development 2.8% Residential Real Estate 30.9% Consumer and Other 6.2% Commercial and Industrial 4.9% Multifamily 29.2% Commercial Real Estate 44.0% Construction and Land Development 12.5% Residential Real Estate 9.3% Consumer and Other 0.1% Commercial and Industrial 19.5% Multifamily 26.7% Commercial Real Estate 11.1% Construction and Land Development 1.3% Residential Real Estate 34.2% Consumer and Other 7.2% AMAL Stand Alone ABOC Stand Alone (2) Pro Forma Yield on Loans (2) : 4.48% Yield on Loans: 3.86% Yield on Loans: 3.77% Total: $3.2bn Total: $489.3mm Total: $3.7bn Source: S&P Global Market Intelligence as of 6/30/21 Note: AMAL has a PPP balance of 84,885 as of 6/30/21; ABOC has a PPP balance of 13,881 as of 6/30/21 (1) Sum of CRE NOO, Multi - Family and Construction & Development (2) Loan balances and yield on loans adjusted for sale of the credit card business closed in 2021Q3. x
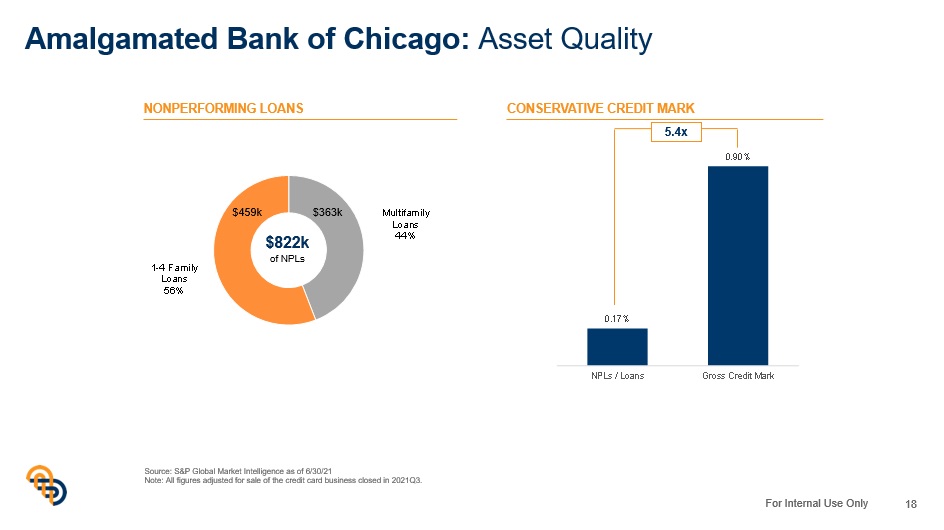
For Internal Use Only Amalgamated Bank of Chicago: Asset Quality 18 Multifamily Loans 44% 1 - 4 Family Loans 56% Source: S&P Global Market Intelligence as of 6/30/21 Note: All figures adjusted for sale of the credit card business closed in 2021Q3. $363k $459k $822k of NPLs NONPERFORMING LOANS 0.17% 0.90% NPLs / Loans Gross Credit Mark CONSERVATIVE CREDIT MARK 5.4x
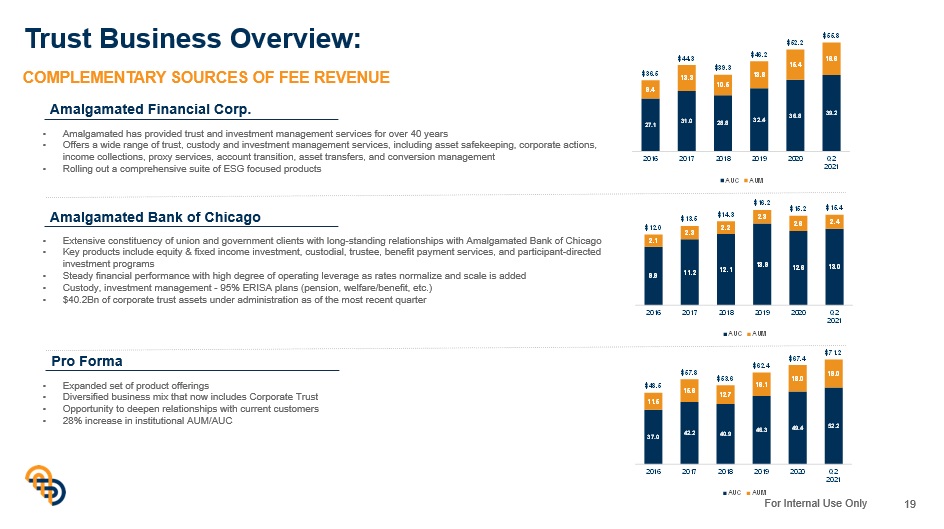
For Internal Use Only Trust Business Overview: 19 Amalgamated Financial Corp. • Amalgamated has provided trust and investment management services for over 40 years • Offers a wide range of trust, custody and investment management services, including asset safekeeping, corporate actions, income collections, proxy services, account transition, asset transfers, and conversion management • Rolling out a comprehensive suite of ESG focused products Amalgamated Bank of Chicago • Extensive constituency of union and government clients with long - standing relationships with Amalgamated Bank of Chicago • Key products include equity & fixed income investment, custodial, trustee, benefit payment services, and participant - directed investment programs • Steady financial performance with high degree of operating leverage as rates normalize and scale is added • Custody, investment management - 95% ERISA plans (pension, welfare/benefit, etc.) • $40.2Bn of corporate trust assets under administration as of the most recent quarter Pro Forma COMPLEMENTARY SOURCES OF FEE REVENUE • Expanded set of product offerings • Diversified business mix that now includes Corporate Trust • Opportunity to deepen relationships with current customers • 28% increase in institutional AUM/AUC
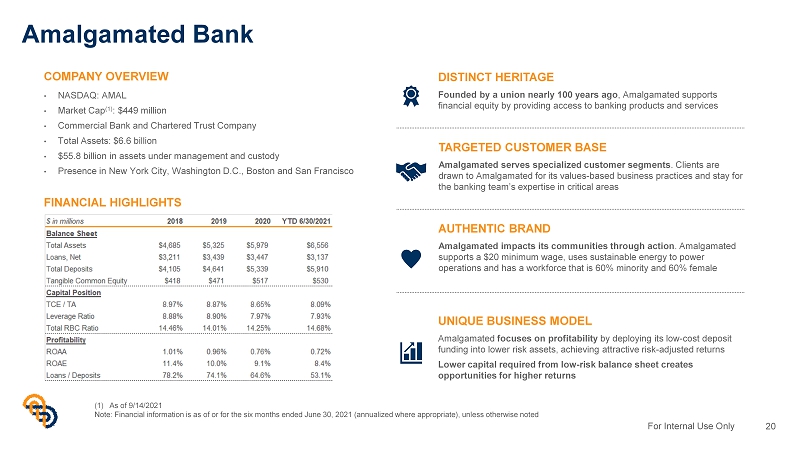
For Internal Use Only Amalgamated Bank 20 COMPANY OVERVIEW • NASDAQ: AMAL • Market Cap (1) : $449 million • Commercial Bank and Chartered Trust Company • Total Assets: $6.6 billion • $55.8 billion in assets under management and custody • Presence in New York City, Washington D.C., Boston and San Francisco DISTINCT HERITAGE Founded by a union nearly 100 years ago , Amalgamated supports financial equity by providing access to banking products and services UNIQUE BUSINESS MODEL Amalgamated focuses on profitability by deploying its low - cost deposit funding into lower risk assets, achieving attractive risk - adjusted returns Lower capital required from low - risk balance sheet creates opportunities for higher returns (1) As of 9/14/2021 Note: Financial information is as of or for the six months ended June 30, 2021 (annualized where appropriate), unless otherwi se noted AUTHENTIC BRAND Amalgamated impacts its communities through action . Amalgamated supports a $20 minimum wage, uses sustainable energy to power operations and has a workforce that is 60% minority and 60% female TARGETED CUSTOMER BASE Amalgamated serves specialized customer segments . Clients are drawn to Amalgamated for its values - based business practices and stay for the banking team’s expertise in critical areas FINANCIAL HIGHLIGHTS
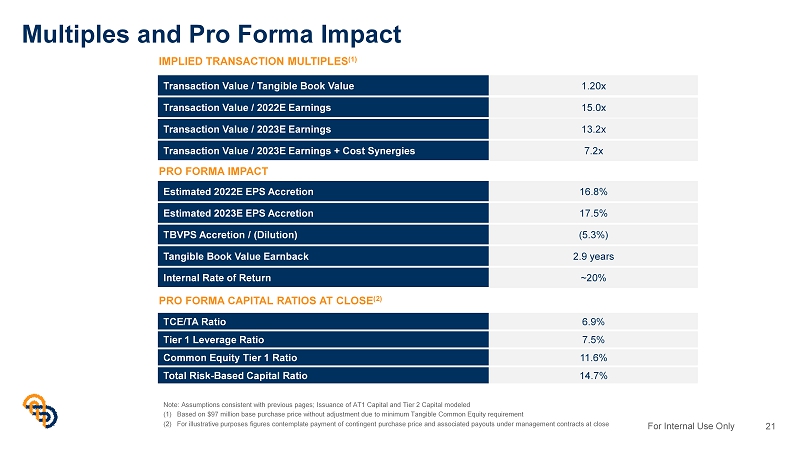
For Internal Use Only Multiples and Pro Forma Impact 21 Transaction Value / Tangible Book Value 1.20x Transaction Value / 2022E Earnings 15.0x Transaction Value / 2023E Earnings 13.2x Transaction Value / 2023E Earnings + Cost Synergies 7.2x Estimated 2022E EPS Accretion 16.8% Estimated 2023E EPS Accretion 17.5% TBVPS Accretion / (Dilution) (5.3%) Tangible Book Value Earnback 2.9 years Internal Rate of Return ~20% IMPLIED TRANSACTION MULTIPLES (1) PRO FORMA IMPACT TCE/TA Ratio 6.9% Tier 1 Leverage Ratio 7.5% Common Equity Tier 1 Ratio 11.6% Total Risk - Based Capital Ratio 14.7% PRO FORMA CAPITAL RATIOS AT CLOSE (2) Note: Assumptions consistent with previous pages; Issuance of AT1 Capital and Tier 2 Capital modeled (1) Based on $97 million base purchase price without adjustment due to minimum Tangible Common Equity requirement (2) For illustrative purposes figures contemplate payment of contingent purchase price and associated payouts under management co ntr acts at close