As filed with the Securities and Exchange Commission on April 21, 2022
Registration
No. 333-257190
SECURITIES AND EXCHANGE COMMISSION
Washington, D.C. 20549
POST-EFFECTIVE AMENDMENT NO. 1
to
FORM
S-1
REGISTRATION STATEMENT
UNDER
THE SECURITIES ACT OF 1933
BLUE OWL CAPITAL INC.
(Exact name of registrant as specified in its charter)
Delaware | 6282 | 86-3906032 | ||
(State or other jurisdiction of incorporation or organization) | (Primary Standard Industrial Classification Code Number) | (I.R.S. Employer Identification No.) |
399 Park Avenue
38th Floor
New York, NY 10022
(212)
419-3000
(Address, including zip code, and telephone number, including area code, of registrant’s principal executive offices)
Neena A. Reddy
399 Park Avenue
38th Floor
New York, NY 10022
(212)
419-3000
(Name, address, including zip code, and telephone number, including area code, of agent for service)
Copies of all communications, including communications sent to agent for service, should be sent to:
Philippa Bond, P.C.
H. Thomas Felix
Kirkland & Ellis LLP
2049 Century Park East
37th Floor
Los Angeles, CA 90067
+1 (310)
552-4200
Approximate date of commencement of proposed sale to the public
If any of the securities being registered on this Form are to be offered on a delayed or continuous basis pursuant to Rule 415 under the Securities Act of 1933 check the following box: ☒
If this form is filed to register additional securities for an offering pursuant to Rule 462(b) under the Securities Act, check the following box and list the Securities Act registration statement number of the earlier effective registration statement for the same offering. ☐
If this form is a post-effective amendment filed pursuant to Rule 462(c) under the Securities Act, check the following box and list the Securities Act registration statement number of the earlier effective registration statement for the same offering. ☐
If this form is a post-effective amendment filed pursuant to Rule 462(d) under the Securities Act, check the following box and list the Securities Act registration statement number of the earlier effective registration statement for the same offering. ☐
Indicate by check mark whether the registrant is a large accelerated filer, an accelerated filer, a
non-accelerated
filer, smaller reporting company, or an emerging growth company. See the definitions of “large accelerated filer,” “accelerated filer,” “smaller reporting company,” and “emerging growth company” in Rule12b-2
of the Exchange Act.| Large accelerated filer | ☒ | Accelerated filer | ☐ | |||
| Non-accelerated filer | ☐ | Smaller reporting company | ☐ | |||
| Emerging growth company | ☐ |
If an emerging growth company, indicate by check mark if the registrant has elected not to use the extended transition period for complying with any new or revised financial accounting standards provided pursuant to Section 7(a)(2)(B) of the Securities Act. ☐
The registrant hereby amends this registration statement on such date or dates as may be necessary to delay its effective date until the registrant shall file a further amendment which specifically states that this registration statement shall thereafter become effective in accordance with Section 8(a) of the Securities Act of 1933 or until this registration statement shall become effective on such date as the SEC, acting pursuant to said Section 8(a), may determine.
EXPLANATORY NOTE
On July 15, 2021, the registrant filed a Registration Statement on Form
S-1
(RegistrationNo. 333-257190),
which was subsequently declared effective by the U.S. Securities and Exchange Commission (the “SEC”) on August 2, 2021 (the “Registration Statement”). This post-effective amendment is being filed to update the Registration Statement to include information contained in the registrant’s Annual Report on Form10-K
and certain other information in such Registration Statement.No additional securities are being registered under this post-effective amendment. All applicable registration fees were paid at the time of the original filing of the Registration Statement.
The information in this prospectus is not complete and may be changed. We may not sell these securities until the registration statement filed with the Securities and Exchange Commission is effective. This prospectus is not an offer to sell these securities and it is not soliciting an offer to buy these securities in any jurisdiction where the offer or sale is not permitted.
SUBJECT TO COMPLETION, DATED APRIL 21, 2022
PRELIMINARY PROSPECTUS

BLUE OWL CAPITAL INC.
1,320,591,340 CLASS A SHARES
This prospectus relates to: (i) 159,964,103 shares of Class A common stock, par value $0.0001 per share (“Class A Shares”), that were issued by us under the Business Combination Agreement, dated as of December 23, 2020 (as the same has been or may be amended, modified, supplemented or waived from time to time, the “BCA” or the “Business Combination Agreement”), by and among Altimar Acquisition Corporation (“Altimar”), Owl Rock Capital Group LLC (“Owl Rock Group”), Owl Rock Capital Feeder LLC (“Owl Rock Feeder”), Owl Rock Capital Partners LP (“Owl Rock Capital Partners”) and Neuberger Berman Group LLC (“Neuberger”) to the former equityholders of Owl Rock Group (the “Owl Rock Equityholders”), the former equityholders (the “Dyal Equityholders”) of the Dyal Capital Partners division of Neuberger (“Dyal”), Altimar Sponsor LLC (“Altimar Sponsor”) and the former directors of Altimar, (ii) 617,093,768 Class A Shares issued upon the exchange of Common Units (as defined below) and the cancellation of an equal number of shares of Class C common stock, par value $0.0001 per share (“Class C Shares”), issued to former Electing Owl Rock Equityholders and Electing Dyal Equityholders (each as defined below), (iii) 294,656,373 Class A Shares issued upon the sale of shares of Class B common stock, par value $0.0001 per share (“Class B Shares”), issuable to the Owl Rock Principals and Dyal Principals (each as defined herein) upon the exchange of Common Units and the cancellation of an equal number of shares of Class D common stock, par value $0.0001 per share (“Class D Shares”), (iv) 14,954,302 Class A Shares issued in respect of the Seller Earnout Shares (as defined herein) upon the satisfaction of certain vesting conditions, (v) 59,447,040 Class A Shares issuable to certain Owl Rock Equityholders and Dyal Equityholders upon the exchange of Common Units and the cancellation of an equal number of Class C Shares, which were issued in respect of the Seller Earnout Units upon the satisfaction of certain vesting conditions, and (vi) 24,475,754 Class A Shares issuable upon the sale of Class B Shares issuable to the former Owl Rock Principals and Dyal Principals upon the exchange of Common Units and the cancellation of an equal number of Class D Shares which were issued in respect of the Seller Earnout Units upon the satisfaction of certain vesting conditions.
This prospectus also relates to the offer and sale from time to time by the selling stockholders who purchased shares in the subscription agreements dated as of December 23, 2020 (collectively, the “PIPE Investors” and, together with the Owl Rock Equityholders, the Dyal Equityholders and Altimar Sponsor, the “Selling Holders”) of 150,000,000 Class A Shares. We will not receive any proceeds from the sale of Class A Shares by the Selling Holders pursuant to this prospectus; however, we will bear all costs, expenses and fees in connection with the registration of the securities and will not receive any proceeds from the sale of the securities. The Selling Holders will bear all commissions and discounts, if any, attributable to their respective sales of the securities.
Our registration of the securities covered by this prospectus does not mean that either we or the Selling Holders will issue, offer or sell, as applicable, any of the Class A Shares. The Selling Holders may offer and sell the securities covered by this prospectus in a number of different ways and at varying prices. We provide more information about how the Selling Holders may sell the shares in the section entitled “.”
Plan of Distribution
You should read this prospectus and any prospectus supplement or amendment carefully before you invest in our Class A Shares.
Our Class A Shares are listed on the New York Stock Exchange (“NYSE”) under the symbols “OWL”. On April 20, 2022, the closing price of our Class A Shares was $14.33 per share.
Investing in our securities involves risks that are described in the “Risk Factors” section beginning on page
21
of this prospectus.Neither the Securities and Exchange Commission nor any state securities commission has approved or disapproved of the securities to be issued under this prospectus or determined if this prospectus is truthful or complete. Any representation to the contrary is a criminal offense.
The date of this prospectus is , 2022.
TABLE OF CONTENTS
| ii | ||||
| ii | ||||
| iii | ||||
| xii | ||||
| 1 | ||||
| 19 | ||||
| 20 | ||||
| 21 | ||||
| 61 | ||||
| 62 | ||||
| 63 | ||||
| 77 | ||||
| 99 | ||||
| 106 | ||||
| 118 | ||||
| 133 | ||||
| 139 | ||||
| 153 | ||||
| 161 | ||||
| 165 | ||||
| 171 | ||||
| 172 | ||||
| F-1 |
You should rely only on the information contained in this prospectus. No one has been authorized to provide you with information that is different from that contained in this prospectus. This prospectus is dated as of the date set forth on the cover hereof. You should not assume that the information contained in this prospectus is accurate as of any date other than that date.
i
MARKET AND INDUSTRY DATA
This prospectus includes market and industry data and forecasts from independent consultant reports, publicly available information, various industry publications, other published industry sources and our internal data, estimates and forecasts. Independent consultant reports, industry publications and other published industry sources generally indicate that the information contained therein was obtained from sources believed to be reliable.
Our internal data, estimates and forecasts are based upon information obtained from our investors, partners, trade and business organizations and other contacts in the markets in which we operate and our management’s understanding of industry conditions. While we are not aware of any misstatements regarding any market, industry or similar data presented herein, such data involves risks and uncertainties and is subject to change based on various factors, including those discussed under the heading “Risk Factors” in this prospectus.
TRADEMARKS AND TRADE NAMES
We own or have rights to trademarks, service marks, copyrights and trade names that we use in conjunction with the operation of our business. This prospectus also includes trademarks, service marks and trade names of other companies. Each trademark, tradename or service mark of any other company appearing in this prospectus is, to our knowledge, owned by such other company.
ii
SELECTED DEFINITIONS
This prospectus has been prepared using a number of stylistic conventions, which you should consider when reading the information herein or therein. Unless otherwise expressly stated or, unless the context otherwise requires, references in this prospectus to:
| • | “ Adjusted EBITDA non-GAAP measure, is used to assess the Company’s ability to service its borrowings. Adjusted EBITDA is derived from and reconciled to, but not equivalent to, its most directly comparable GAAP measure of net income (loss) before income taxes. Adjusted EBITDA represents Distributable Earnings plus (a) interest expense, (b) income tax expense (benefits), and (c) depreciation and amortization. |
| • | “ Adjusted Revenues non-GAAP measure, is used to assess the net revenue expected to be received by the Company. Adjusted Revenues are derived from and reconciled to, but not equivalent to its most directly comparable GAAP measure of total revenues, net. Adjusted Revenues differ from total revenues computed in accordance with GAAP as it excludes reimbursed expenses and dealer manager revenues, if applicable, that have an offsetting amount included within expenses on the consolidated and combined statement of operations. |
| • | “ Adjusted Compensation non-GAAP measure, is used to assess the net cash settled compensation to be paid by the Company. Adjusted Compensation is derived from and reconciled to, but not equivalent to its most directly comparable GAAP measure of compensation and benefits. Adjusted Compensation differs from compensation and benefits computed in accordance with GAAP as it excludes equity compensation expense and compensation and benefits reimbursed through the receipt of administrative revenues. The administrative revenues reflect allocable compensation and expenses incurred by certain professionals of the Company and reimbursed by products managed by the Company. |
| • | “ Advisers Act |
| • | “ Altimar |
| • | “ Altimar Founders |
| • | “ Altimar Sponsor |
| • | “ assets under management AUM |
| • | “ AUM not yet paying fees |
| • | “ available capital |
| • | “ BCA Business Combination Agreement |
| • | “ BDC |
iii
| • | “ Blue Owl, Company Registrant our we us |
| • | “ Blue Owl Carry |
| • | “ Blue Owl Carry Units |
| • | “ Blue Owl GP |
| • | “ Blue Owl Holdings |
| • | “ Blue Owl Holdings Units |
| • | “ Blue Owl Limited Partnership Agreements |
| • | “ Blue Owl Operating Group |
| • | “ Blue Owl Operating Group Unit |
| • | “ Blue Owl Operating Partnerships |
| • | “ Board |
| • | “ Business Combination |
| • | “ Business Combination Date |
| • | “ Business Securities |
| • | “ Business Services Platform |
| • | “ Capital Commitments |
| • | “ carried interest carried interest allocations |
| • | “ Class A Shares |
| • | “ Class B Shares |
| • | “ Class C Shares |
| • | “ Class D Shares |
| • | “ Class E Shares |
iv
| • | “ Class E-1 SharesClass E-1 common stock of the Company. The SeriesE-1 Class E Shares had a Class E Triggering Event on July 21, 2021, which occurred when the volume weighted-average price of a Class A Share exceeded $12.50 for 20 consecutive trading days, at which time 7,495,432 Class E Shares were converted into an equal number of Class A Shares. |
| • | “ Class E-2 SharesClass E-2 common stock of the Company. The SeriesE-2 Class E Shares had a Class E Triggering Event on November 3, 2021, which occurred when the volume weighted-average price of a Class A Share exceeded $15.00 for 20 consecutive trading days, at which time 7,495,432 Class E Shares were converted into an equal number of Class A Shares. |
| • | “ Closing |
| • | “ common stock |
| • | “ DE non-GAAP measure, which is used to assess performance and amounts available for dividends to members. DE is derived from and reconciled to, but not equivalent to its most directly comparable GAAP measure of net income (loss) before income taxes. Distributable Earnings is FRE less current income taxes and includes (other than with respect to Owl Rock) net realized gains, realized performance income and performance related compensation. DE differs from income before taxes computed in accordance with GAAP as it adjusts for certain items that we believe are indicative of our ability to make our dividend payments. Our presentation of DE represents our operating performance, as further adjusted for performance income and performance related compensation, as applicable. Management believes that these adjustments enable investors to better understand the Company’s earnings that are available for distribution. |
| • | “ DGCL |
| • | “ Direct Lending |
| • | “ dollars |
| • | “ Domestication |
| • | “ Dyal Capital |
| • | “ Dyal Equity Funds |
v
| • | “ Dyal Equityholders |
| • | “ Dyal Financing Fund |
| • | “ Dyal HomeCourt Fund |
| • | “ Dyal Principals |
| • | “ Electing Owl Rock Equityholders |
| • | “ fee paying AUM FPAUM |
| • | “ fee related earnings non-GAAP measure, is used to assess our operating performance by determining whether recurring revenue, primarily consisting of management fees, is sufficient to cover operating expenses and to generate profits. FRE is derived from and reconciled to, but not equivalent to its most directly comparable GAAP measure of net income (loss) before income taxes. FRE differs from income before taxes computed in accordance with GAAP as it adjusts for transaction-related charges, equity-based compensation,non-controlling interests in subsidiaries of the Company and certain other items that we believe reflects our operating performance. Other than for Owl Rock, the calculation of FRE also adjusts for performance income, performance related compensation and investment net gains (losses). Management believes that adding these adjustments assist in clarifying stable and predictable cash flows that cover operating expenses and lead to the generation of profits. |
| • | “ our funds co-managed by Blue Owl, Owl Rock or Dyal Capital. |
| • | “ FIC Assets |
| • | “ Financial Statements 10-K for the fiscal year ended December 31, 2021. |
| • | “ FINRA |
| • | “ GAAP |
| • | “ GP Capital Solutions co-investments and structured equity. GP Capital Solutions products are managed by the Dyal Capital division of Blue Owl. |
vi
| • | “ GP Debt Financing strategy |
| • | “ GP Minority Equity Investments strategy |
| • | “ incentive fees |
| • | “ Investment Company Act |
| • | “ Investor Rights Agreement |
| • | “ IPO |
| • | “ Key Individuals |
| • | “ long dated |
| • | “ management fees |
| • | “ NBA |
| • | “ Neuberger |
| • | “ NYSE |
| • | “ Oak Street |
| • | “ Oak Street Acquisition |
| • | “ our BDCs |
| • | “ Owl Rock |
vii
which was the predecessor of Blue Owl for accounting and financial reporting purposes. References to the Owl Rock division refer to Owl Rock Capital Group and its subsidiaries that manage our Direct Lending products. |
| • | “ Owl Rock Capital carve-out of Owl Rock Group and its consolidated operating subsidiaries (whichcarve-out excludes such operating subsidiaries constituting FIC assets) after giving effect to apre-Closing reorganization. |
| • | “ Owl Rock Capital Partners |
| • | “ Owl Rock Equityholders |
| • | “ Owl Rock Feeder |
| • | “ Owl Rock Group |
| • | “ Owl Rock Principals |
| • | “ Owl Rock Securities |
| • | “ Part I Fees |
| • | “ Part II Fees |
| • | “ partner manager |
| • | “ performance income |
| • | “ permanent capital lock-up periods. Such products may be required, or elect, to return all or a portion of capital gains and investment income. Permanent capital may be subject to management fee step downs or roll-offs over time. |
| • | “ PIPE Investment |
| • | “ PIPE Investors |
viii
| • | “ PIPE Securities |
| • | “ portfolio companies portfolio investments |
| • | “ Principals |
| • | “ Private Placement Warrants |
| • | “ Public Warrants |
| • | “ Real Estate |
| • | “ reimbursed expenses |
| • | “SEC” |
| • | “ Securities Act |
| • | “ Seller Earnout Securities |
| • | “ Seller Earnout Shares E-1 common stock and SeriesE-2 common stock that were issued to the Owl Rock Equityholders that are not Electing Owl Rock Equityholders in connection with the Business Combination. For the avoidance of doubt, a “Seller Earnout Share” shall refer to either (i) one share of SeriesE-1 common stock or (ii) one share of SeriesE-2 common stock, as applicable. The SeriesE-1 Class E Shares had a Class E Triggering Event on July 21, 2021, which occurred when the volume weighted-average price of a Class A Share exceeded $12.50 for 20 consecutive trading days, at which time 7,495,432 Class E Shares were converted into an equal number of Class A Shares. The SeriesE-2 Class E Shares had a Class E Triggering Event on November 3, 2021, which occurred when the volume weighted-average price of a Class A Share exceeded $15.00 for 20 consecutive trading days, at which time 7,495,432 Class E Shares were converted into an equal number of Class A Shares. |
| • | “ Seller Earnout Units E-1 Units and SeriesE-2 Units of each of Blue Owl Holdings and Blue Owl Carry that were issued to the Dyal Equityholders and the Electing Owl Rock Equityholders in connection with the Business Combination in lieu of Seller Earnout Shares. The SeriesE-1 Class E Shares had a Class E Triggering Event on July 21, 2021, which occurred when the volume weighted-average price of a Class A Share exceeded $12.50 for 20 consecutive trading days, at which time 7,495,432 Class E Shares were converted into an equal number of Class A Shares. The |
ix
Series E-2 Class E Shares had a Class E Triggering Event on November 3, 2021, which occurred when the volume weighted-average price of a Class A Share exceeded $15.00 for 20 consecutive trading days, at which time 7,495,432 Class E Shares were converted into an equal number of Class A Shares. |
| • | “ Specified Interests |
| • | “ Subscription Agreements |
| • | “Tax Receivable Agreement TRA |
| • | “ transfer agent |
| • | “ UBT |
| • | “ Warrant Agent |
| • | “ Warrants |
| • | “ Wellfleet |
| • | “ Wellfleet Acquisition |
| • | “ Working Capital |
Many of the terms used in this prospectus, including Adjusted Compensation, Adjusted EBITDA, Adjusted Revenues, AUM, DE, FPAUM and FRE, may not be comparable to similarly titled measures used by other companies. In addition, our definitions of AUM and FPAUM are not based on any definition of AUM or FPAUM that is set forth in the agreements governing the investment products that Owl Rock and Dyal Capital manage and may differ from definitions of AUM or FPAUM set forth in other agreements to which Owl Rock or Dyal Capital is a party or definitions used by the SEC or other regulatory bodies. Further, Adjusted Compensation, Adjusted EBITDA, Adjusted Revenues, DE and FRE are not measures of performance calculated in accordance with GAAP. We use Adjusted Compensation, Adjusted EBITDA, Adjusted Revenues, DE and FRE as measures of operating performance, not as measures of liquidity. They should not be considered in isolation or as substitutes for operating income, net income, operating cash flows, or other income or cash flow statement data prepared in accordance with GAAP. The use of these measures without consideration of related GAAP measures is not adequate due to the adjustments described above. Our management compensates for these limitations by using FRE as supplemental measures to our GAAP results. We present this measure to provide a more complete understanding of our performance as our management measures it. Amounts and percentages throughout this prospectus may reflect rounding adjustments and consequently totals may not appear to sum. For reconciliations of
non-GAAP
measures used by Blue Owl to Blue Owl’s GAAP results, see “Blue Owl’s
x
Management’s Discussion and Analysis of
Financial Condition and Results of Operations
Reconciliation of Consolidated GAAP Financial Measures to Certain
Non-GAAP
MeasuresWe disclose certain financial measures in this prospectus that are calculated and presented using methodologies other than in accordance with GAAP. We believe that providing these performance measures on a supplemental basis to our GAAP results is helpful to stockholders in assessing the overall performance of Blue Owl’s businesses. These financial measures should not be considered as a substitute for similar financial measures calculated in accordance with GAAP, if available. We caution readers that these
non-GAAP
financial measures may differ from the calculations of other investment managers, and as a result, may not be comparable to similar measures presented by other investment managers.xi
CAUTIONARY STATEMENT REGARDING FORWARD-LOOKING STATEMENTS
This prospectus contains forward-looking statements within the meaning of Section 27A of the Securities Act, and Section 21E of the Securities Exchange Act of 1934, as amended (the “Exchange Act”), which reflect our current views with respect to, among other things, future events, operations and financial performance. You can identify these forward-looking statements by the use of forward-looking words such as “outlook,” “believes,” “expects,” “potential,” “continues,” “may,” “will,” “should,” “seeks,” “approximately,” “predicts,” “projects,” “intends,” “plans,” “estimates,” “anticipates” or the negative version of those words, other comparable words or other statements that do not relate to historical or factual matters. The forward-looking statements are based on our beliefs, assumptions and expectations of our future performance, taking into account all information currently available to us. Such forward-looking statements are subject to various risks, uncertainties (some of which are beyond our control) or other assumptions relating to our operations, financial results, financial condition, business prospects, growth strategy and liquidity that may cause actual results or performance to be materially different from those expressed or implied by these forward-looking statements. Some of these factors are described under the sections entitled “” and “.” These factors should not be construed as exhaustive and should be read in conjunction with the risk factors and other cautionary statements that are included in this prospectus and in our other periodic filings. If one or more of these or other risks or uncertainties materialize, or if our underlying assumptions prove to be incorrect, our actual results may vary materially from those indicated in these forward-looking statements. New risks and uncertainties arise over time, and it is not possible for us to predict those events or how they may affect us. Therefore, you should not place undue reliance on these forward-looking statements. Any forward-looking statement speaks only as of the date on which it is made. We do not undertake any obligation to publicly update or review any forward-looking statement, whether as a result of new information, future developments or otherwise, except as required by law.
Risk Factors
Blue Owl
’
s Management
’
s Discussion and Analysis of Financial Condition and Results of Operations
xii
SUMMARY
This summary highlights selected information contained elsewhere in this prospectus and does not contain all of the information you should consider when making your investment decision. We urge you to read this prospectus in its entirety, including the consolidated financial statements and accompanying notes, carefully to gain a fuller understanding of our business and the terms of the notes, as well as some of the other considerations that may be important to you, before making your investment decision. You should pay special attention to the “Risk Factors” sections of this prospectus to determine whether an investment in the notes is appropriate for you.
Our Company
Blue Owl is a global alternative asset manager with $94.5 billion in AUM as of December 31, 2021. Anchored by a strong permanent capital base, the firm deploys private capital across Direct Lending, GP Capital Solutions and Real Estate strategies on behalf of institutional and private wealth clients. Blue Owl’s flexible, consultative approach helps position the firm as a partner of choice for businesses seeking capital solutions to support their sustained growth. The firm’s management team is comprised of seasoned investment professionals with more than 25 years of experience building alternative investment businesses. Blue Owl employs over 350 people across 9 offices globally.
Blue Owl was formed through the combination of Owl Rock and Dyal Capital in May 2021, at which time these businesses merged with and into Altimar Acquisition Corporation (“Altimar”), a blank check, special purpose acquisition company. The combination of Owl Rock and Dyal Capital creates a platform primed to continue servicing these markets. In December 2021, we acquired Oak Street, which expanded our firm’s offerings to include real estate-focused products.
Our breadth of offerings and permanent capital base enable us to offer a differentiated, holistic platform of capital solutions to middle market companies, large alternative asset managers and corporate real estate owners and tenants. We provide these solutions through our permanent capital vehicles, as well as long-dated private funds, that we believe provide our business with a high degree of earnings stability and predictability. Our permanent capital vehicles are products that do not have ordinary redemption provisions or a requirement to exit investments after a prescribed period of time to return invested capital to investors, except as required by applicable law or pursuant to redemption requests that can only be made after significant
lock-up
periods. For the quarter ended December 31, 2021, approximately 98% of our management fees were earned from permanent capital vehicles.Our global, high-caliber, investor base includes a diversified mix of institutional investors, including prominent public and private pension funds, endowments, foundations, family offices, private banks, high net worth individuals, asset managers and insurance companies, as well as retail clients, accessed through many well-known wealth management firms. We have continued to grow our investor base and presence in the growing private markets and alternative asset management sector by emphasizing our disciplined investment approach, client service, and portfolio performance.
While we currently offer Direct Lending, GP Capital Solutions and Real Estate products across three divisions (Owl Rock, Dyal Capital and Oak Street), our management takes a
one-firm
approach when making operating decisions and determining how to allocate resources. As a result, we currently operate as a single reportable segment. Management regularly reviews our revenues by product line and our expenses by type at the total firm level (e.g., compensation and benefits; general, administrative and other expenses), and therefore we have presented details of our operating results throughout this prospectus consistent with how management reviews our results.1
Our revenues are generated primarily from the investment advisory and administrative services agreements we have with our products. See Note 2 to our Financial Statements for a detailed description of how we earn our revenues and the significant impact that our FPAUM has on the amount of revenues we earn each period. Management’s Discussion and Analysis of Financial Condition and Results of Operations (“MD&A”) presents additional information on our revenues and operating results, as well as historical AUM and performance information for certain of our products; such information should be read in conjunction with this description of our business.
Our Products
We have three major product lines: Direct Lending, GP Capital Solutions and Real Estate. We believe our products, while distinct, are complementary to each other and together enable us to provide a differentiated platform of varied capital solutions. All of our products employ a disciplined investment philosophy with a focus on long-term investment horizons and are managed by tenured leadership and investment professionals with significant experience in their respective strategies.
Our products are generally structured as BDCs, REITs and private investments funds that aggregate capital from investors. As the investment manager of our products, we invest that capital with the goal of generating attractive, risk-based returns for the investors in our products. In many of our products, we may use leverage to increase the size of the investments our products are able to make. As further explained in Note 2 to our Financial Statements, we generally earn management fees on the amount of FPAUM that we manage; therefore, the growth and success of our product offerings is paramount to our success as an alternative asset manager.
Our products create a robust foundation for our holistic platform. We believe the success and growth in our businesses since inception has been driven by a singular, dedicated focus on providing capital solutions and the differentiating competitive features of our platform.
Blue Owl AUM: $94.5 billion FPAUM: $61.4 billion | ||||
Direct Lending Products AUM: $39.2 billion FPAUM: $32.0 billion | GP Capital Solutions Products AUM: $39.9 billion FPAUM: $21.2 billion | Real Estate Products AUM: $15.4 billion FPAUM: $8.2 billion | ||
Diversified Lending Commenced 2016 AUM: $25.8 billion FPAUM: $21.6 billion | GP Minority Equity Commenced 2010 AUM: $38.7 billion FPAUM: $20.4 billion | Net Lease Commenced 2009 AUM: $15.4 billion FPAUM: $8.2 billion | ||
Technology Lending Commenced 2018 AUM: $7.9 billion FPAUM: $6.9 billion | GP Debt Financing Commenced 2019 AUM: $1.0 billion FPAUM: $0.7 billion | |||
First Lien Lending Commenced 2018 AUM: $3.5 billion FPAUM: $2.3 billion | Professional Sports Minority Investments Commenced 2021 AUM: $0.2 billion FPAUM: $0.2 billion | |||
Opportunistic Lending Commenced 2020 AUM: $2.0 billion FPAUM: $1.2 billion | ||||
2
Direct Lending
Our Direct Lending products offer private credit products to middle-market companies seeking capital solutions. We believe our breadth of offerings establishes us as the lending partner of choice for private-equity sponsored companies, as well as other predominately
non-cyclical,
recession-resistant businesses. Since the launch of our flagship institutional product, ORCC, we have continued to prudently expand our offerings, focusing on adjacent strategies that are both additive and complementary to our existing product base. Our Direct Lending products are offered through a mix of BDCs, long-dated private funds and other vehicles across the following investment strategies:| • | Diversified Lending: |
| • | Technology Lending: |
| • | First Lien Lending: |
| • | Opportunistic Lending: (iv) debtor-in-possession |
3
GP Capital Solutions
Our GP Capital Solutions products position us as a leading capital solutions provider to large private capital managers. We primarily focus on acquiring equity stakes in, or providing debt financing to large, multi-product private equity and private credit firms, which we may refer to as “GPs.” Our GP Capital Solutions division also houses our Business Services Platform, which provides strategic support to our Partner Managers. Our GP Capital Solutions products are offered primarily through permanent capital vehicles across the following investment strategies:
| • | GP Minority Equity Investments: closed-end, permanent capital funds. A fundamental component of the fundraising efforts for our investment programs is the ability to identify and executeco-investment opportunities for our investors. We may offer, fromtime-to-time co-investment opportunities in certain fund investments, generally with no management or incentive-based fee. |
| • | GP Debt Financing: |
| • | Professional Sports Minority Investments: NBA-focused. |
Real Estate
Our real estate products primarily focus on structuring sale-leaseback transactions, which includes triple net leases.
| • | Net Lease: net-leased, long-term to investment grade and creditworthy tenants. Oak Street’s Net Lease real estate strategies focus on acquiring single tenant properties, across industrial, essential retail and mission critical office sectors. By combining our proprietary origination platform, enhanced lease structures and a disciplined investment criteria, we seek to provide investors with predictable current income, and potential for appreciation, while focusing on limiting downside risk. |
4
Our History
Blue Owl’s history is predicated on the key milestones of both Owl Rock and Dyal Capital. Owl Rock was founded in 2016 by Doug Ostrover, Marc Lipschultz and Craig Packer to address the evolving need for direct lending solutions by middle-market companies. Dyal Capital was founded in 2010 by Michael Rees to fill the need for flexible capital solutions for private capital managers. In December 2021, we acquired the Oak Street business, which allowed us to further diversify the products we offer our investors. Since its founding in 2009 by Marc Zahr, Oak Street has established itself as a leader in private equity real estate, offering flexible and unique capital solutions to a variety of corporations and other organizations.
The combination of these businesses creates a platform primed to continue servicing these markets. Blue Owl’s robust and diversified platform offerings will continue to serve as a response to the following sector dynamics:
| • | shifting allocations by retail institutional investors. |
| • | rotation onto alternatives given the search for yield and reliability of returns. |
| • | rising need for private debt driven by sponsor demand. |
| • | evolving landscape of the private debt market. |
| • | de-leveraging of the global banking system. |
| • | increasing need for flexible capital solutions by private capital managers. |
Across our businesses, our presence in the market combined with our constant dialogue with financial sponsors, companies and our investors, has allowed us to identify attractive opportunities in adjacent subsectors over time.
Since inception, Owl Rock, Dyal Capital and Oak Street have launched multiple new strategies and products, exclusively in areas where we believed we could leverage our competitive advantage and expertise, and where we believe we had identified critical mass of lending, capital and real estate solutions opportunities as well as heightened investor interest. We have focused on executing on key adjacencies that are natural extensions of existing core strategies in order to capitalize on the growing dislocations in the market and rising investor demand.
Our Competitive Strengths
| • | High proportion of permanent capital. closed-end, permanent (or potentially permanent) funds with no mandatory redemption and potentially unlimited duration once listed. Substantially all of the AUM in our GP Capital Solutions and Real Estate products are also structured as permanent capital vehicles. The high proportion of permanent capital in our AUM provides a stable base and allows for our AUM to grow more predictably without having reductions in our asset levels due to ordinary redemptions. Our permanent capital base also lends stability and flexibility to our portfolio companies and Partner Managers, providing us the opportunity to grow alongside these companies and positioning us to be a preferred source of capital and the incumbent lender forfollow-ons and other capital solutions to high-performing companies. As such, we are able to be a compelling partner for these firms as they seek capital to support their long-term vision and business development goals. The stability of our AUM base enables us to focus on generating attractive returns by investing in assets with a long-term focus across different periods in the market cycle. |
5
| • | Significant embedded growth in current AUM with built-in mechanisms for fee revenue increases. |
| • | Stable earnings model with attractive margin profile. |
| • | Extensive, long-term relationships with a robust and vast network of alternative asset managers. |
| • | Increasing benefits of scale. |
Within Direct Lending, there is significant competition for loans below $50 million, but there are much fewer lenders capable of providing solutions over $100 million. Our differentiated approach and scaled direct lending platform allow us to capitalize on opportunities across the sizing spectrum—from loans below $50 million to loans over $1.0 billion. Our platform’s scale has demonstrated the ability to originate larger deals, while also providing diversification in our portfolios. We believe our scale enables us to broaden our deal funnel and provides us access to more investment opportunities than many other direct lenders. We have significant available capital that allows us to provide scaled financing solutions, commit to full capital structures and support capital needs of borrowers. We believe being a total solutions provider also grants us a broader view of market opportunities, which allows us to continue operating as a market leader.
6
Within GP Capital Solutions, we have also established ourselves as a market leader, with a long track record, greatest amount of aggregate capital raised and largest number of publicly-announced deals. The target size of our current fund being raised, Fund V, is materially larger than the approximately $5 billion fund sizes of our main competitors. Our large base of stable capital not only enables participation in investments across the sizing spectrum, but also creates a competitive advantage by positioning us as a highly qualified buyer for minority stakes in large, established GPs. We believe that we also gain access to proprietary deal flow as a result of the market’s confidence in our ability to execute on large investments expeditiously. We believe our strong reputation in the market combined with our scale will continue to provide us with unique access to the most attractive sectors of the alternative asset management universe.
Within Real Estate, we have a targeted origination strategy that benefits from Oak Street’s strong network and allows us to be competitive with other net lease peers. Oak Street proactively builds and maintains strong relationships with large investment grade-rated and creditworthy companies whose businesses offer essential goods or services and which we believe are generally resistant to
e-commerce
and economic downside risks, and structures mutually beneficial transactions with long lease durations, and in many cases, favorable pricing. We intend to leverage Oak Street’s corporate partnerships to both source unique investment opportunities unavailable to other market participants and negotiate attractive lease terms. We believe our strong origination capabilities, conservative underwriting criteria and strong existing tenant relationships will allow our Real Estate products to purchase properties in the future at attractive terms and pricing, providing significant long-term opportunities for growth and scale.| • | Diverse, global and growing high-quality investor base. high-net worth investors. As we continue to grow, we expect to retain our existing clients through our breadth of offerings. As of December 31, 2021, approximately 36% of our institutional investors are invested in more than one product, with many increasing their commitment to their initial strategy and additionally committing additional capital across our other strategies. We believe our diligent management of investors’ capital, combined with our strong performance and increasingly diversified product offerings has helped retain and attract investors which has furthered our growth in FPAUM and facilitated further expansion of our strategies. We also believe the global nature of our investor base enables significant cross-selling opportunities between our products and strategies. We are committed to providing our clients with a superior level of service. We believe our client-focused nature, rooted in our culture of transparency will help us continue to retain and attract high quality investors to our platform. |
| • | Industry-leading management team with proven track record. best-in-class |
| • | Alignment of interests with stakeholders. |
7
totaled approximately $1.9 billion, which aligns their interests with our clients’ interests by motivating the continued high-performance and retention of our dedicated team of professionals. |
Our Growth Strategy
We aim to continue applying our core principles and values that have guided us since inception in order to expand our business through the following strategies:
| • | Organically grow our core business. |
| • | Expand our product offering. |
| • | Leverage complementary global distribution networks. |
| • | Enhance our distribution channels. |
8
In addition, we have continued to grow our relationships in the consultant community. We intend to be the premier direct lending and GP minority investing platform for investors across the institutional and retail distribution channels. |
| • | Deepen and expand strong strategic relationships with key institutional investors. |
| • | Opportunistically pursue accretive acquisitions. |
Competition
The investment management industry is intensely competitive, and we expect it to remain so. We compete globally and on a regional, industry and asset basis. We face competition both in the pursuit of investors for our products and investment opportunities. Generally, our competition varies across product lines, geographies and financial markets. We compete for investors based on a variety of factors, including investment performance, investor perception of investment managers’ drive, focus and alignment of interest, quality of service provided to and duration of relationship with investors, breath of our product offering, business reputation and the level of fees and expenses charged for services. We compete for investment opportunities at our funds based on a variety of factors, including breadth of market coverage and relationships, access to capital, transaction execution skills, the range of products and services offered, innovation and price, and we expect that competition will continue to increase.
Competition is also intense for the attraction and retention of qualified employees. Our ability to continue to compete effectively in our businesses will depend upon our ability to attract new employees and retain and motivate our existing employees. See “—”
Risk Factors—Risks Related to Our Business and Operations
Our future growth depends on our ability to attract, retain and develop human capital in a highly competitive talent market.
Direct Lending
Our competition as an asset manager and financing source to middle market companies consists primarily of other asset managers who focus principally on credit funds, including BDCs, and other credit products. We also compete with public and private funds, BDCs, commercial and investment banks, commercial finance companies and, to the extent they provide an alternative form of financing, private equity and hedge funds. Many of our competitors are substantially larger and may have more financial, technical, and marketing resources than we do.
9
Many of these competitors have similar investment objectives to us, which may create additional competition for investment opportunities. Some of these competitors may also have a lower cost of capital and access to funding sources that are not available to us, which may create competitive disadvantages for us with respect to investment opportunities. In addition, some of our competitors may have higher risk tolerances or different risk assessments, which could allow them to consider a wider variety of investments and establish more relationships than us. Further, many of our competitors are not subject to the regulatory restrictions that the Investment Company Act imposes on us as a business development company, or to the distribution and other requirements we must satisfy to qualify for RIC tax treatment. Lastly, institutional and individual investors are allocating increasing amounts of capital to alternative investment strategies. Several large institutional investors have announced a desire to consolidate their investments in a more limited number of managers. We expect that this will cause competition in our industry to intensify and could lead to a reduction in the size and duration of pricing inefficiencies that many of our products seek to exploit. See “”
Risk Factors—Risks Relating to Our Businesses and Operations—The investment management business is intensely competitive.
GP Capital Solutions
Our GP Capital Solutions products currently have limited direct competition from organizations dedicated to acquiring stakes in large institutionalized private capital managers. More recently, a limited number of asset managers have begun acquired minority stakes in certain private capital managers. Such institutions may compete with us for similar investments in the future. We believe, however, that this limited number of competitors is likely to persist, as conflicts of interest and regulatory restrictions make purchasing minority stakes in private capital managers challenging for financial institutions and private equity firms.
With respect to our GP Debt Financing strategy, many banks provide revolving lines of credit to private equity managers, but these credit lines are typically short duration, amortize and require blanket personal guarantees. A small number of firms, provide structured or preferred equity to private capital managers, but these investments are also structurally very different from our products’ long-term loans. We believe that this limited amount of competition is likely to persist, as conflicts of interest, regulatory restrictions, capital constraints and other considerations make lending to private capital managers challenging for financial institutions, insurance companies and other private market firms.
Our current GP Capital Solutions strategies compete with among others, a number of private equity funds, specialized funds, hedge funds, corporate buyers, traditional asset managers, real estate companies, commercial banks, investment banks, other investment managers and other financial institutions, including the owners of certain of our stockholders, as well as domestic and international pension funds and sovereign wealth funds, and we expect that competition will continue to increase. See “” We compete globally and on a regional, industry and asset basis.
Risk Factors—Risks Related to Our Business and Operations—The investment management business is intensely competitive.
Real Estate
Oak Street has remained the only net let lease private equity manager dedicated exclusively to transacting with investment grade rated and other creditworthy counterparties. The more stable and predictable nature of the net lease sector has brought additional competition into the space in recent years. Historically, such competition has primarily come from net lease REIT’s (publicly traded and
non-traded),
other private equity real estate funds, and high net worth buyers.Competitors in the publicly traded net lease sector generally exhibit less stringent criteria than us with respect to pricing and lease durations, and their portfolios are comprised substantially with
non-investment
grade credits, shorter average lease terms, and meaningful near-term lease rollover. Additionally, many net lease peers10
focus on acquiring retail properties with an average deal size of less $10 million, whereas our Real Estate products’ transactions are typically $100 million and greater in size.
Competition from other private equity funds has grown, as many have either shifted their current real estate focus to building net lease teams or acquired existing net lease strategies. Despite this increased activity, competition with our Real Estate products on the deal level has remained relatively low, as those strategies concentrate their efforts in the
non-investment
grade space, prefer to develop properties themselves, and to deploy capital in sectors that are outside of our traditional focus of: industrial assets, mission critical office properties and essential retail. High net worth buyers have been formidable competitors and active acquirers of retail assets under $8 million; they tend to be less price sensitive and there are usually wide pools of potential buyers for these assets. As the monetization of real estate through sale-leasebacks continues to gain traction as a capital allocation tool for companies, we expect the net lease sector to grow even larger, and that will continue to attract more competition into the space.Human Capital
As of December 31, 2021, we had approximately 350 full-time employees, including over 100 investment professionals across nine offices globally.
As an alternative asset manager, our people are the key to the success of our business. We rely significantly on our talented team, leveraging a wide variety of investment, management, business and other skills and expertise, to create value for stockholders and investors in our products. We aim to build a team that is driven and embraces an inclusive culture where our team members are engaged and work collaboratively across the organization.
Compensation and Benefits
We design our compensation programs to motivate and retain employees and align their interests with those of our stockholders. In particular, annual bonuses for our executives and other senior employees involves a combination of cash and deferred equity awards in the form of Incentive Units and RSUs (as defined in Note 1 to the Financial Statements). The proportion of compensation that is deferred and at risk of forfeiture generally increases as an employee’s level of compensation rises. Employees at higher total compensation levels are generally targeted to receive a greater percentage of their total compensation payable in Incentive Units and RSUs. To further align their interests with those of investors in our products, our employees have the opportunity to make investments in or alongside our products. We also provide our employees robust health and other wellness offerings, as well as a variety of quality of life benefits, includingtalent in our industry. Our senior management periodically reviews the effectiveness and competitiveness of our compensation program.
time-off
and family planning resources. We believe our approach to compensation and benefits are consistent with companies in the alternative asset management industry and enables us to attract and retainbest-in-class
Diversity, Equity and Inclusion
Blue Owl is committed to fostering, cultivating, and preserving a culture of diversity, equity and inclusion. We prize diversity in our team and seek to create an inclusive, merit-based environment that is supportive of people from all backgrounds.
| • | Embracing our differences. |
11
| • | Strategic priorities. |
| • | Corporate practices. |
| • | Leadership. |
MUTUAL RESPECT | EXCELLENCE | CONSTRUCTIVE DIALOGUE | ONE TEAM | |||
BLUE OWL’S CORE VALUES | ||||||
Recent Developments
Dividend
On February 17, 2022, the Company announced a cash dividend of $0.10 per Class A Share. The dividend was payable on March 7, 2022, to holders of record as of the close of business on February 28, 2022.
2032 Notes
On February 15, 2022, the Company, through its indirect subsidiary, Blue Owl Finance LLC, issued $400.0 million aggregate principal amount of 4.375% Senior Notes due 2032 (the “2032 Notes”). The 2032 Notes bear interest at a rate of 4.375% per annum and mature on February 15, 2032. Interest on the 2032 Notes will be payable semi-annually in arrears on February 15 and August 15 of each year, commencing August 15, 2022.
The 2032 Notes are fully and unconditionally guaranteed, jointly and severally, by the Blue Owl Operating Partnerships and certain of their subsidiaries. The guarantees are unsecured and unsubordinated obligations of the guarantors. All or a portion of the 2032 Notes may be redeemed at the Company’s option in whole, at any time, or in part, from time to time, prior to their stated maturity, subject to a make-whole redemption price; provided, however, that if the Company redeems any amounts on or after November 15, 2031, the redemption price for the 2032 Notes will be equal to 100% of the principal amount of the amounts redeemed, in each case, plus any accrued and unpaid interest. If a change of control repurchase event occurs, the 2032 Notes are subject to repurchase by the Company at a repurchase price in cash equal to 101% of the aggregate principal amount repurchased plus any accrued and unpaid interest. The 2032 Notes also provide for customary events of default and acceleration.
Wellfleet Acquisition
On April 1, 2022, the Company closed its acquisition of Wellfleet Credit Partners LLC (“Wellfleet”) from affiliates of Littlejohn & Co., LLC. The purchase price consisted of $108.0 million cash consideration on closing and earnout payments of up to an additional $15.0 million of cash and 940,668 Class A Shares payable in equal installments on each of the first three anniversaries from the closing date.
12
Charter Amendment
On April 6, 2022, the Board adopted resolutions authorizing an amendment to the Company’s certificate of incorporation (as amended, the “certificate of incorporation”) to change the aggregate voting power of the Class B Shares and Class D Shares, from 90% to 80% as set forth in the First Amendment to the Certificate of Incorporation (the “Charter Amendment”). The amendment is designed to position the Corporation for potential inclusion in the Russell indicies. The Charter Amendment was approved by the written consent of stockholders of the Company representing a majority of the voting power of the outstanding Class A Shares, Class B Shares, Class C Shares, and Class D Shares of the Company voting together as a single class, stockholders representing a majority of the Class B Shares and Class D Shares, voting together as a single class, and stockholders representing a majority of the Class B Shares and Class D Shares, voting as separate classes as of April 6, 2022. No other votes are required or necessary to adopt the certificate of incorporation. The Charter Amendment will become effective upon its filing with the Secretary of State of the State of Delaware on May 3, 2022.
Organizational Structure
Blue Owl is a publicly traded holding company, and its primary assets are ownership interests in the Blue Owl Operating Partnerships, which are held indirectly through Blue Owl GP. We conduct our business through the Blue Owl Operating Group. See Note 1 to our Financial Statements for a description of the various share and unit classes outstanding at the Blue Owl and Blue Owl Operating Partnership levels.
13
The diagram below depicts a simplified version of our organizational structure as of December 31, 2021. Ownership percentages are based on shares and units that are fully participating in dividends and distributions as of December 31, 2021.
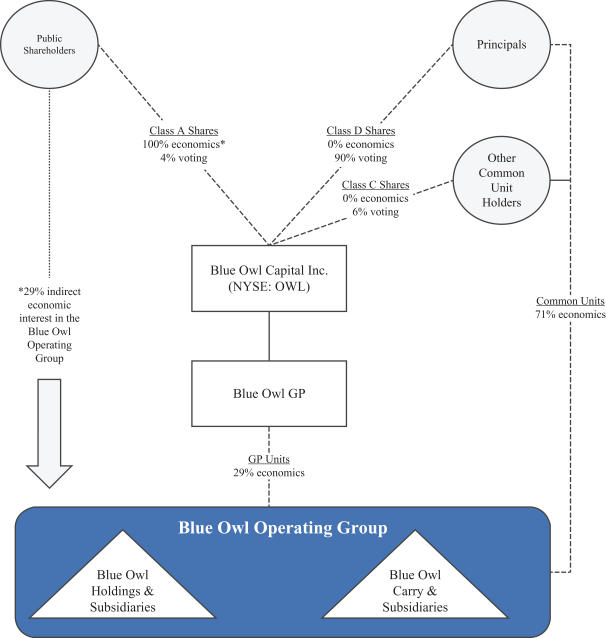
Economic and voting percentages above do not include the potential dilutive impact of the exercise of warrants to purchase Class A Shares, as well as RSUs, unvested Incentive Units and Oak Street Earnout Units, as these interests do not participate in dividends and distributions (other than to the extent of certain tax distributions on unvested Incentive Units). See Note 1 to our consolidated and combined financial statements for additional information on these interests.
14
Corporation Information
Blue Owl Capital Inc. is a Delaware corporation. Our principal executive offices are located at 399 Park Avenue, 38th Floor, New York, NY 10022 and our telephone number at that address is
(212) 419-3000.
Our website is located at www.blueowl.com. Our website and the information contained on, or accessed through, our website are not part of this prospectus, and you should rely only on the information contained in this prospectus when making a decision as to whether to invest in our Class A Shares.15
Risk Factor Summary
The following is a summary of the risks and uncertainties that could adversely affect our business and financial condition and should be read in conjunction with the complete discussion of risk factors set forth in “” Some of the factors that could materially and adversely affect our business, financial condition, results of operations and cash flows include, but are not limited to, the following:
Risk Factors.
| • | The COVID-19 pandemic has caused severe disruptions in the US and global economy, has disrupted, and may continue to disrupt, industries in which we, our products and our products’ portfolio companies and investments operate and could potentially negatively impact our business, financial condition and results of operations. |
| • | Intense competition among alternative asset managers may make fundraising and the deployment of capital more difficult, thereby limiting our ability to grow or maintain our FPAUM. Such competition may be amplified by changes in fund investor allocations away from alternative asset managers. |
| • | We recently ceased to be an emerging growth company, and now are being required to comply with certain heightened reporting requirements. Fulfilling our obligations incident to being a public company, including compliance with the Exchange Act and the requirements of the Sarbanes-Oxley Act and the Dodd-Frank Act, are expensive and time-consuming, and any delays or difficulties in satisfying these obligations could have a material adverse effect on our future results of operations and our stock price. |
| • | Difficult market and political conditions, including tensions between Russia and Ukraine, may reduce the value or hamper the performance of the investments made by our products or impair the ability of our products to raise or deploy capital, each of which could materially reduce our revenue, earnings and cash flow and adversely affect our financial prospects and condition. |
| • | Management fees comprise the majority of our revenues and a reduction in fees could have an adverse effect on our results of operations and the level of cash available for distributions to our shareholders. |
| • | Our growth depends in large part on our ability to raise new and successor funds. If we were unable to raise such funds, the growth of our FPAUM and management fees, and ability to deploy capital into investments, earning the potential for performance income, would slow or decrease, all of which would materially reduce our revenues and cash flows and adversely affect our financial condition. |
| • | Our GP Capital Solutions products may suffer losses if our Partner Managers are unable to raise new funds or grow their AUM. |
| • | Conflicts of interest may arise in our allocation of capital and co-investment opportunities or in circumstances where we hold investments at different levels of the capital structure. |
| • | Our business is currently focused on multiple investment strategies. |
| • | Our entitlement and that of certain of our shareholders, Principals and employees to receive realized performance income from certain of our funds may create an incentive for us to make more speculative investments and determinations on behalf of our funds than would be the case in the absence of such performance income. |
| • | Our use of leverage to finance our businesses exposes us to substantial risks. Any security interests or negative covenants required by a credit facility we enter into may limit our ability to create liens on assets to secure additional debt. |
| • | Employee misconduct could harm us by impairing our ability to attract and retain fund investors and subjecting us to significant legal liability, regulatory scrutiny and reputational harm. |
16
| • | Cybersecurity risks and cyber incidents could adversely affect our business by causing a disruption to our operations, a compromise or corruption of our confidential information and confidential information in our possession and damage to our business relationships, any of which could negatively impact our business, financial condition and operating results. |
| • | The use of leverage by our products may materially increase the returns of such funds but may also result in significant losses or a total loss of capital. |
| • | The multi-class structure of our common stock has the effect of concentrating voting power with the Principals, which will limit an investor’s ability to influence the outcome of important transactions, including a change in control. |
| • | The Registrant is a holding company and its only material source of cash is its indirect interest (held through Blue Owl GP) in the Blue Owl Operating Partnerships, and it is accordingly dependent upon distributions made by its subsidiaries to pay taxes, cause Blue Owl GP to make payments under the Tax Receivable Agreement, and pay dividends. |
17
The Offering
The following information is as of April 20, 2022 and does not give effect to issuances of our Class A Shares after such date.
Issuer | Blue Owl Capital Inc. |
Class A Shares offered by the Selling Holders | Up to 1,320,591,340 Class A Shares (including 1,010,627,237 Class A Shares that were issued upon the conversion or conversion and exchange of Seller Earnout Securities, as applicable, and the exchange of Common Units and the cancellation of an equal number of Class C or Class D Shares, as applicable) |
Class A Shares issued or issuable upon the exchange of all outstanding Common Units and the conversion or conversion and exchange of all Seller Earnout Securities | 1,343,042,262 |
Use of proceeds | We will not receive any of the proceeds from the sale of the Class A Shares by the Selling Holders. |
Market for our shares of common stock | Our Class A Shares are currently listed on the NYSE under the symbol “OWL.” |
Risk factors | Any investment in the securities offered hereby is speculative and involves a high degree of risk. You should carefully consider the information set forth under “ Risk Factors |
18
SELECTED HISTORICAL CONSOLIDATED AND
COMBINED FINANCIAL INFORMATION OF BLUE OWL
The following tables provide our selected historical consolidated and combined financial and other data for the periods indicated. We have derived the selected consolidated statement of operations data for the fiscal years ended December 31, 2021, 2020 and 2019 and the selected consolidated balance sheet data as of December 31, 2021 and 2020 from our audited consolidated financial statements included elsewhere in this prospectus. The following summary historical financial information should be read together with the consolidated financial statements and accompanying notes and “” appearing elsewhere in this prospectus. The summary historical financial information in this section is not intended to replace our consolidated financial statements and the related notes. Our historical results are not necessarily indicative of our future results, and our results as of and for the year ended December 31, 2021 are not necessarily indicative of our results in any future period.
Blue Owl’s Management’s Discussion and Analysis of Financial Condition and Results of Operations
($ amounts in thousands) | December 31, 2021 | December 31, 2020 | December 31, 2019 | |||||||||
Consolidated statements of financial condition data | ||||||||||||
Total assets | $ | 8,266,398 | $ | 121,597 | $ | 56,718 | ||||||
Debt obligations, net | 1,174,167 | 356,386 | 287,104 | |||||||||
Total liabilities | 2,418,828 | 622,758 | 407,215 | |||||||||
Non-controlling interests | 4,184,003 | 6,526 | 2,259 | |||||||||
Total shareholders’ equity attributable to Blue Owl Inc. (After May 19, 2021) / members of Owl Rock Capital and sole member of Owl Rock Capital Securities LLC (Prior to May 19, 2021) | 1,663,567 | (507,687 | ) | (352,756 | ) | |||||||
Total shareholders’ equity (deficit) | 5,847,570 | (501,161 | ) | (350,497 | ) | |||||||
For the Years Ended December 31, | ||||||||||||
($ amounts in thousands) | 2021 | 2020 | 2019 | |||||||||
Consolidated statements of operations data | ||||||||||||
Total revenues, net | $ | 823,878 | $ | 249,815 | $ | 190,850 | ||||||
Total expenses | 1,751,145 | 308,542 | 163,483 | |||||||||
Interest expense | (27,275) | (23,816) | (6,662) | |||||||||
Net income (loss) before income taxes | (1,867,477) | (82,543) | 20,705 | |||||||||
Income tax (benefit) expense | (65,211) | (102) | 240 | |||||||||
Net income (loss) including non-controlling interests | (1,802,266) | (82,441) | 20,465 | |||||||||
Add: Net (income) loss attributed to non-controlling interests | 1,426,095 | 4,610 | 2,493 | |||||||||
Net income (loss) attributable to Blue Owl Capital Inc. (After May 19, 2021) / members of Owl Rock Capital and sole member of Owl Rock Capital Securities LLC (Prior to May 19, 2021) | $ | (376,171) | $ | (77,831) | $ | 22,958 | ||||||
19
MARKET PRICE, TICKER SYMBOL, AND DIVIDEND INFORMATION
Market Price and Ticker Symbol
Blue Owl’s Class A Shares and public warrants are listed for trading on NYSE under the symbols “OWL” and “OWL.WS,” respectively.
The closing price of the Class A Shares on April 20, 2022 was $14.33. Holders of Class A Shares and warrants should obtain current market quotations for their securities.
Dividends
We intend to continue to pay to Class A Stockholders (and Class B Stockholders in the future to the extent any Class B Shares are outstanding) a quarterly dividend representing approximately 85% of Distributable Earnings following the end of each quarter. Blue Owl Capital Inc.’s share of Distributable Earnings, subject to adjustment as determined by our Board to be necessary or appropriate to provide for the conduct of our business, to make appropriate investments in our business and products, to comply with applicable law, any of our debt instruments or other agreements, or to provide for future cash requirements such as
tax-related
payments, operating reserves, clawback obligations and dividends to stockholders for any ensuing quarter. All of the foregoing is subject to the qualification that the declaration and payment of any dividends are at the sole discretion of our Board, and our Board may change our dividend policy at any time, including, without limitation, to reduce or eliminate dividends entirely.The Blue Owl Operating Partnerships will make cash distributions (“Tax Distributions”) to the partners of such partnerships, including to Blue Owl GP, if we determine that the taxable income of the relevant partnership will give rise to taxable income for its partners. Generally, Tax Distributions will be computed based on our estimate of the taxable income of the relevant partnership allocable to a partner multiplied by an assumed tax rate equal to the highest effective marginal combined U.S. federal, New York State and New York City income tax rates prescribed for an individual or corporate resident in New York City (taking into account certain assumptions set forth in the relevant partnership agreements). Tax Distributions will be made only to the extent distributions from the Blue Owl Operating Partnerships for the relevant year were otherwise insufficient to cover the estimated assumed tax liabilities.
Holders of our Class A and B Shares may not always receive distributions or may receive lower distributions on a per share basis at a time when we, indirectly through Blue Owl GP, and holders of our Common Units are receiving distributions on their interests, as distributions to the Registrant and Blue Owl GP may be used to settle tax and TRA liabilities, if any, and other obligations.
Dividends are expected to be treated as qualified dividends under current law to the extent of the Company’s current and accumulated earnings and profits, with any excess dividends treated as a return of capital to the extent of a stockholder’s basis, and any remaining excess generally treated as gain realized on the sale or other disposition of stock.
20
RISK FACTORS
In addition to the other information contained in this prospectus, the following risks have the potential to impact the business and operations of Blue Owl. These risk factors are not exhaustive and all investors are encouraged to perform their own investigation with respect to the business, financial condition and prospects of Blue Owl. Unless otherwise indicated or the context otherwise requires, references in this “Risk Factors” section to “Blue Owl,” “we,” “our,” “us” and other similar terms refer to Blue Owl Capital Inc. and its consolidated subsidiaries.
Risks Related to Our Business and Operations
The
COVID-19
pandemic has caused severe disruptions in the U.S. and global economy, has disrupted, and may continue to disrupt, industries in which we, our products and our products’ investments operate and could potentially negatively impact us, our products or our products’ investments.The
COVID-19
pandemic has adversely impacted global commercial and economic activity and contributed to significant volatility in certain equity and debt markets. The impact of the outbreak continues to develop and many countries, including the United States, and states and municipalities in which we and our products’ investments operate, have instituted quarantines, prohibitions on travel and the closure of offices, businesses, schools, retail stores and other public venues. Individual businesses and industries are also implementing similar precautionary measures. Those measures, as well as the general uncertainty surrounding the dangers and effects ofCOVID-19,
have created significant disruption in supply chains and economic activity and are having a particularly adverse impact on transportation, hospitality, tourism, commercial real estate, entertainment and other industries, including industries in which certain of our products, borrowers, Partner Managers and their respective investments operate and invest. The effects ofCOVID-19
have led to significant volatility and it is uncertain how long this volatility will continue. AsCOVID-19
continues to spread, particularly as new variants, including the Delta and Omicron variants, continue to emerge, the potential effects, including a global, regional or other economic recession, are increasingly uncertain and difficult to assess. This uncertainty has been exacerbated by issues with the availability and acceptance of vaccines both in the United States and globally. The continued spread of the virus globally could lead to a protracted world-wide economic downturn, the effects of which could last for some period after the pandemic is controlled and/or abated.The extent of the impact of theorders, travel restrictions and social distancing requirements implemented or undertaken in response to the
COVID-19
pandemic on us and our products’ operational and financial performance will depend on many factors, including the duration and scope of the public health emergency, the actions taken by governmental authorities to contain its financial and economic impact, the continued or renewed implementation of travel advisories and restrictions, the widespread availability and acceptance of vaccines, the impact of the public health emergency on overall supply and demand, staffing and attrition levels, consumer confidence and levels of economic activity and the extent of its disruption to global, regional and local supply chains and economic markets, all of which are uncertain and difficult to assess. Significant volatility and declines in valuations in the global markets as well as liquidity concerns may impair our ability to raise funds or deter fund investors from investing in new or successor funds that we are marketing. Actions taken in response to theCOVID-19
pandemic (whether imposed by governments or adopted by businesses or individuals) may give rise to difficulty marketing and raising new or successor funds due toshelter-in-place
COVID-19
pandemic, which may lower or delay anticipated fee revenues. For existing funds, those actions may slow the pace of investment activity, by, for example, hindering the diligence process. This, in turn, could adversely affect the timing of raising capital for new or successor funds, the terms that might be offered and the management fees we earn on our products that generate fees based on invested (and not committed) capital. In addition, cash flows from management fees may be impacted by, among other things, a failure of our clients to meet capital calls. Borrowers of loans and other credit instruments made by our products may be unable to make their loan payments on a timely basis and meet their loan covenants, resulting in a decrease in value of our products’ credit investments and lower than expected returns.21
We are continuing to monitor the impact of
COVID-19
and related risks, including risks related to the ongoing spread ofCOVID-19
(including the Delta and Omicron variants) and efforts to mitigate the spread and deployment of vaccines. However, the rapid development and fluidity of the situation precludes any prediction as to its ultimate impact on us. If the spread and related mitigation efforts continue, our business, financial condition, results of operations and cash flows could be materially adversely affected. The impact ofCOVID-19
could have the effect of heightening many of the other risk factors described herein.Difficult market and political conditions may reduce the value or hamper the performance of the investments made by our products or impair the ability of our products to raise or deploy capital, each of which could materially reduce our revenue, earnings and cash flow and adversely affect our financial prospects and condition.
Our businesses are affected by conditions and trends in the global financial markets and the global economic and political climate relating to, among other things, interest rates, the availability and cost of credit, inflation rates, economic uncertainty, changes in laws (including laws relating to our taxation, taxation of our clients and the possibility of changes to regulations applicable to alternative asset managers), trade policies, commodity prices, tariffs, currency exchange rates and controls, political elections and administration transitions, and national and international political events (including wars and the most recent and rapidly evolving tensions between Russia and Ukraine as well as other forms of conflict, terrorist acts, and security operations) and catastrophic events such as fires, floods, earthquakes, tornadoes, hurricanes and pandemics. Those factors are outside of our control and may affect the level and volatility of credit and securities prices and the liquidity and value of fund investments, and we and our products may not be able to or may choose not to manage our exposure to these conditions. The extent and impact of any sanctions imposed in connection with the escalation of hostilities between Russia and Ukraine may cause additional financial market volatility and impact the global economy as the situation continues to evolve.
During periods of difficult market conditions or slowdowns, which may be across one or more industries, sectors or geographies, companies in which our funds invest may experience decreased revenues, financial losses, credit rating downgrades, difficulty in obtaining access to financing and increased funding costs. During such periods, those companies may also have difficulty in pursuing growth strategies, expanding their businesses and operations (including to the extent that they are Partner Managers, raising additional capital) and be unable to meet their debt service obligations or other expenses as they become due, including obligations and expenses payable to our funds. Negative financial results in our funds’ portfolio companies may reduce the net asset value of our funds, result in the impairment of assets and reduce the investment returns for our products, which could have a material adverse effect on our operating results and cash flow or ability to raise additional capital through new or successor funds. In addition, those conditions would increase the risk of default with respect to credit-oriented or debt investments by our products.
We recently ceased to be an emerging growth company, and now are being required to comply with certain heightened reporting requirements. Fulfilling our obligations incident to being a public company, including compliance with the Exchange Act and the requirements of the Sarbanes-Oxley Act and the Dodd-Frank Act, are expensive and time-consuming, and any delays or difficulties in satisfying these obligations could have a material adverse effect on our future results of operations and our stock price.
As a public company, we are subject to the reporting, accounting and corporate governance requirements of the NYSE, the Exchange Act, the Sarbanes-Oxley Act of 2002 (the “Sarbanes-Oxley Act”) and Section 619 of the Dodd-Frank Wall Street Reform and Consumer Protection Act (the “Dodd-Frank Act”) that apply to issuers of listed equity, which impose certain significant compliance requirements, costs and obligations upon us. On October 7, 2021, we ceased to be an “emerging growth company” as defined in the JOBS Act. The changes necessitated by being a publicly listed company and ongoing compliance with these rules and regulations require a significant commitment of additional resources and management oversight, which increases our operating costs and could divert the attention of our management and personnel from other business concerns. Further, to
22
continue to comply with the requirements of being a public company, we have undertaken various actions, such as implementing new internal controls and procedures and hiring additional accounting and internal audit staff.
The Sarbanes-Oxley Act requires us, among other things, to maintain effective disclosure controls and procedures and internal control over financial reporting. In order to maintain and improve the effectiveness of our disclosure controls and procedures and internal control over financial reporting, we have expended, and anticipate that we will continue to expend, significant resources, including accounting-related costs and significant management oversight.
In addition, our internal resources and personnel may in the future be insufficient to avoid accounting errors, and our auditors may identify deficiencies, significant deficiencies or material weaknesses in our internal control environment in the future. Any failure to develop or maintain effective controls or any difficulties encountered implementing required new or improved controls could harm our operating results or cause us to fail to meet our reporting obligations and may result in a restatement of our financial statements for prior periods. Any failure to implement and maintain effective internal control over financial reporting also could adversely affect the results of periodic management evaluations and annual independent registered public accounting firm attestation reports regarding the effectiveness of our internal control over financial reporting that we will eventually be required to include in our periodic reports that will be filed with the SEC. Ineffective disclosure controls and procedures and internal control over financial reporting could also cause investors in our common stock or investors in our products to lose confidence in our reported financial and other information, which would likely have a negative effect on the trading price of our common stock and/or investors’ confidence in our products. In addition, if we are unable to continue to meet these requirements, we may not be able to remain listed on the NYSE.
The expenses associated with being a public company include increases in auditing, accounting and legal fees and expenses, investor relations expenses, increased directors’ fees and director and officer liability insurance costs, registrar and transfer agent fees and listing fees. As a public company, we are required to, among other things, institute comprehensive compliance and investor relations functions. These obligations and constituents require significant attention from our senior management and could divert their attention away from themanagement of our business, which could adversely affect our business, financial condition, cash flows and results of operation. Failure to comply with the requirements of being a public company could potentially subject us to sanctions or investigations by the SEC or other regulatory authorities.
day-to-day
In addition, changing laws, regulations and standards relating to corporate governance and public disclosure are creating uncertainty for public companies, increasing legal and financial compliance costs and making some activities more time consuming. We intend to invest resources to comply with evolving laws, regulations and standards, and this investment may result in increased general and administrative expenses. If our efforts to comply with new laws, regulations and standards differ from the activities intended by regulatory or governing bodies due to ambiguities related to their application and practice, regulatory authorities may initiate legal proceedings against us, and there could be a material adverse effect on our business, financial condition, cash flows and results of operations.
The management fees of our BDCs and management fees and performance income of our private funds comprise a substantial majority of our revenues and a reduction in fees could have an adverse effect on our results of operations and the level of cash available for distributions to our stockholders.
BDCs
The investment advisory agreements we have with each of our BDCs categorize the fees we receive as: (a) base management fees, which are paid quarterly and generally increase or decrease based on the average fair value of our BDC’s gross assets (excluding cash and cash equivalents) or average fair value of gross assets (excluding cash) plus undrawn commitments, (b) Part I Fees and (c) Part II Fees. We classify the Part I Fees as management fees because they are predictable and recurring in nature, not subject to contingent repayment and
23
generally cash-settled each quarter. If any of our BDCs’ gross assets or net investment income (before Part I Fees and Part II Fees) were to decline significantly for any reason, including, without limitation, due to fair value accounting requirements, the poor performance of its investments or the inability or increased cost to obtain or maintain borrowings for each of our BDCs, the amount of the fees we receive from our BDCs, including the base management fee and the Part I Fees, would also decline significantly, which could have an adverse effect on our revenues and results of operations. In addition, because the Part II Fees are not paid unless each of our BDCs achieves cumulative aggregate realized capital gains (net of cumulative aggregate realized capital losses and aggregate unrealized capital depreciation), each of our BDCs’ Part II Fees payable to us are variable and not predictable. Our advisory agreements typically provide that the rates at which we earn advisory fees from our BDCs increase after our BDCs are publicly listed (where before the listing the advisory fees typically are a reduced management fee with a reduced or no Part I or II fees). If our BDCs do not become publicly listed on anticipated timeframes or at all for any reason, including the poor share performance of our BDCs, Blue Owl will not benefit from this increase, and those BDCs may need to return their capital to investors, further reducing our management fees. We may also, from time to time, (a) waive or voluntarily defer any fees payable to us by our BDCs or any BDCs that we may manage after the date hereof and (b) restructure any existing fee waivers granted by us to our BDCs so that such of our BDCs will be obligated to pay fee amounts that are less than the full fee amounts owed to us pursuant to the terms of the applicable advisory agreement between us and such BDC, and the duration and extent of such waivers and deferrals in each of (a) and (b) may need to be significant to support continued fundraising. In addition to those arrangements, we have entered into and in the future may enter into expense supporting arrangements with certain of our BDCs where we pay or reimburse certain expenses of our BDCs in order to support their target dividend payments.
Our investment advisory and management agreements with our BDCs renew for successive annual periods subject to the approval of the applicable BDC’s board of directors or by the affirmative vote of the holders of a majority of such BDC’s outstanding voting securities. In addition, as required by the Investment Company Act, the investment advisory agreements with our BDCs generally may be terminated without penalty upon 60 days’ written notice to the other party. Termination or
non-renewal
of any of these agreements would reduce our revenues significantly and could have a material adverse effect on our financial condition.Private Funds: Management Fees
For our other
non-BDC
Direct Lending products, as well as GP Capital Solutions and certain Real Estate products, which we refer to as our private funds, we enter into investment advisory agreements whereby we generally receive base management fees from the inception of such fund through the liquidation of such fund or for most of our GP Capital Solutions products for a set period.Non-BDC
Direct Lending products have a base management fee that is typically based on a percentage of gross asset value (which includes the portion of such investments purchased with leverage), whereas our GP Capital Solutions products have a management fee that is initially a set percentage of capital committed by investors, and then, following a step down event for a Dyal Capital fund (generally either the end of the investment period or, for certain funds, when the fund’s commitments become substantially invested or drawn), is adjusted to a lower percentage of the fund’s cost of unrealized investments, subject to impairment losses for certain funds. Following the management fee step down event, the management fee we receive will be reduced when a fund realizes investments or in certain cases when there are permanent changes to the cost basis of unrealized investments. While those funds are not required to realize assets as of any date, there is an obligation to explore liquidity strategies with respect to a fund, and should a liquidity strategy event occur prior to the management fee end date, it could cause a reduction in the amount of management fees we are otherwise entitled to receive. Further, any realization of assets will be within the control of certain of our employees who own an interest in a portion of the carried interest that does not belong to us and who may have an incentive to effect a realization earlier than one otherwise would expect had carried interest not been applicable.As our private funds generally have end dates for paying management fees, our revenues will decline in respect of such funds if we are unable to successfully raise successor funds that replace the management fee
24
payments that terminate on the older funds or such successor funds do not generate fees at the same rate. Additionally, given that such management fees are often based on gross asset value, acquisition costs or invested capital, either throughout the fund term or, in some cases following their investment period, the management fee received in respect of such fund will be reduced when a fund realizes investments or if the value of an investment is impaired. During the investment period of many funds, the fund expects to actively recycle capital into new investments, which would have the impact of replacing investments that have been realized during the investment period, but there are many factors that may limit our ability to effectively recycle capital and realize the full fee potential of any particular fund. For many Direct Lending funds, the gross asset value used as the base for the management fee includes investments purchased with leverage. If we are unable to obtain leverage at the expected level, or at all, this will have a negative impact on our ability to realize the full fee potential of any particular fund.
Further, our right to receive management fees can be impaired by certain actions of investors in a private fund. Our private funds generally provide investors with: (1) the right to terminate such fund on both a cause basis and a no fault basis; (2) the right to remove us as manager of a fund for cause; and (3) the right to create an early step down event with respect to a fund on a cause basis. If the investors exercised their right to vote for an early termination, we would typically continue to receive management fee through the liquidation of such fund, but we could face pressure to liquidate investments earlier than we otherwise believe is appropriate to maximize the value of such investment. Certain funds also provide investors with the right to remove the general partner of such fund on a cause basis. Upon the removal of the general partner of a fund becoming effective, the investment advisory contract in respect of such fund will cease to exist and our rights to payment of management fee will terminate. In some cases, investors may also have the right to redeem after certain periods of time or following regulatory or key person concerns, which would also reduce the base on which fees are charged. In other cases, after an initial lock up period, investors may issue redemption notices with respect to their interests; as such interests are redeemed, the fees will decrease unless we are able to find new investors to replace those redeeming.
Notwithstanding the formulas for calculating management fees provided in the governing documents for our products, Blue Owl has provided (and expects to provide in the future) discounts to investors on such fees based on the size of their commitments to the fund (or Blue Owl funds generally), the timing of their commitments to the fund or other factors that Blue Owl deems relevant. Certain investors are effectively given management fee discounts through specified interests and discounts with respect to carried interest or performance income through the grant of participation rights, fee rebates or revenue shares. Although such discounts will typically be awarded in circumstances where Blue Owl management believes there will ultimately be long-term benefits to Blue Owl, there can be no assurance that the ultimate benefit attained will be commensurate with the discount awarded, or as to how long it may take to recoup such value.
Private Funds: Carried Interest
The general partner or an affiliate of certain of our private funds that are not BDCs may be entitled to receive carried interest from a fund based on cumulative fund performance to date. Carried interest entitles the general partner (or an affiliate) to a special allocation of income and gains from a fund, and is typically structured as a net profits interest in the applicable fund. Carried interest is generally calculated on a “realized” basis, and the recipient is generally entitled to a carried interest based upon the net realized income and gains often taking into account certain unrealized losses generated by such fund. Net realized income/gains or loss is not netted between or among funds.
If the investments we make on behalf of our funds or separate accounts perform poorly, we may suffer a decline in our realized performance income, which may limit our ability to pay dividends. For most funds, the carried interest is subject to a preferred return of 8%, subject in most cases to a
catch-up
allocation to the general partner. Generally, if at the termination of fund, the fund has not achieved investment returns that exceed the preferred return threshold, the general partner may not be entitled to a share of the carried interest. Additionally, similar to management fees as described above, if the fund is terminated early by the investors or the general25
partner is removed by the investors of a fund, this may have a negative impact on the value of investments, which will then reduce the carried interest allocations to the general partner, and, in the instance where the general partner is removed for cause, a penalty reduction may be assessed against any remaining carried interest. Amounts that could otherwise go to satisfy dividend payments may be deferred or reserved to satisfy potential repayment obligations.
Although Blue Owl is only entitled to 15% of this realized performance income, the remainder of this revenue stream is owned by entities not controlled by us, including to investors in such entities that otherwise might serve as professionals of Blue Owl. Blue Owl may be misaligned from these investors, as a portion of this income would qualify for long-term capital gains in the hands of such individuals, whereas Blue Owl, as a U.S. corporation, will not receive preferential treatment for long-term capital gains and may be limited in deducting capital losses. Furthermore, to the extent such investors currently benefit from such long-term capital gains treatment, they may not be entitled to this treatment in perpetuity. For example, U.S. federal income tax law now generally imposes a three-year holding period requirement for carried interest to be treated as long-term capital gain. The holding period requirement may result in some of the carried interest received by such persons being treated as ordinary income, which would materially increase the amount of taxes paid by such persons. The tax treatment of carried interest may continue to be area of attention for the federal and state governments.
Other Fee Income
We also receive fee income for providing services to certain portfolio companies of our products. Such services include arrangement, syndication, origination, structuring analysis, capital structure and business plan advice and other services. Certain types of transaction-related fees are required to be distributed to the Blue Owl funds and other products under the terms of ourbelow, or are required to be distributed to investors in our products or offset against management fees that would otherwise be payable pursuant to the terms of the governing agreements of the relevant vehicles, while other types of related fees may be retained by us with no offset against management fees and contribute to our revenues and, ultimately, to our net income. We may decide not to seek those fees for any reason, including market conditions and expectations. Our ability to receive and retain those fees, and to continue to receive and retain those fees in the future, is dependent on the terms we negotiate with investors in our products, our ability to successfully negotiate for those fees with underlying portfolio companies, the permissibility of receiving and retaining those fees under the relevant legal and regulatory frameworks, and our business determination to negotiate for those fees. As a result, any change to the willingness of portfolio companies to bear those fees, the terms of our products that permit us to receive and retain those fees, the legal and regulatory framework in which we operate or our willingness to negotiate for those fees with portfolio companies of our products, could result in a decrease to our revenues and net income, and ultimately decrease the value of our common stock and our dividends to our stockholders. In addition, the fees generated are typically dependent on transaction frequency and volume, and a slowdown in the pace or size of investments by our products could adversely affect the amount of fees generated.
Co-investment
Exemptive Order, as discussed in“Conflicts of interest may arise in connection with
co-investments
between our private funds and our BDCs”Our growth depends in large part on our ability to raise new and successor funds. If we were unable to raise such funds, the growth of our FPAUM and management fees, and ability to deploy capital into investments, earning the potential for performance income, would slow or decrease, all of which would materially reduce our revenues and cash flows and adversely affect our financial condition.
A significant portion of our revenue from our products in any given period is dependent on the size of our FPAUM in such period and fee rates charged on the FPAUM. We may not be successful in procuring investment returns and prioritizing services that will allow us to maintain our current fee structure, to maintain or grow our FPAUM, or to generate performance income. A decline in the size or pace of growth of FPAUM or applicable fee rates will reduce our revenues. A decline in the size or pace of growth of FPAUM or applicable fee rates may result from a range of factors, including:
| • | Volatile economic and market conditions, which could cause fund investors to delay making new commitments to alternative investment funds or limit the ability of our existing funds to deploy capital; |
26
| • | Intense competition among alternative asset managers may make fundraising and the deployment of capital more difficult, thereby limiting our ability to grow or maintain our FPAUM. Competition may be amplified by changes in fund investors allocating increased amounts of capital away from alternative asset managers; and |
| • | Continuation or amplification of general trends within the investment management industry towards lower fees including through direct reductions, deferrals, rebates or other means, which may also result in our competitors operating based on fee structures with which we are unable to successfully compete. |
In response to those trends, we may, in certain cases, lower the fees we charge or grant fee reductions or specified interests or periodic holidays in order to remain competitive;
| • | Poor performance of one or more of our products, either relative to market benchmarks or in absolute terms (e.g., based on market value or net asset value of our BDCs’ shares), or compared to our competitors may cause fund investors to regard our funds less favorably than those of our competitors, thereby adversely affecting our ability to raise new or successor funds; |
| • | Our funds may engage in strategic transactions or other dispositions that reduce the cost basis upon which we charge management fees with respect to one or more of our funds. For example, a fund may sell all or a portion of its interests in portfolio companies that causes such fund’s management fee base to be reduced; and |
| • | Certain of our funds contain “key person” provisions or other provisions allowing investors to take actions following certain specified events. The occurrence of one or more of those events prior to the end of a fund’s investment period could result in the termination of a fund’s investment period and a material decrease in the management fees paid by such fund or, in certain cases, cessation of the funds. |
Our products may suffer losses if our Partner Managers are unable to raise new funds or grow their AUM.
As our GP Capital Solutions products’ investments in Partner Managers are intended to be held for an indefinite duration, we are dependent upon the ability of our Partner Managers to execute successfully their investment program and grow their assets under management. In the event that a Partner Manager is unable to grow their assets under management or such Partner Manager’s investment returns fail to meet expectations, the returns attributable to such investment may be reduced or our products may suffer a loss on such investment. A Partner Manager’s failure to grow assets under management may result from a range of factors common to asset managers, including factors to which we are subject ourselves, or specific factors attributable to its business including the departure of key persons, the inability of such Partner Manager to diversify into new investment strategies, investment performance and regulatory enforcement actions.
The investment management business is intensely competitive.
The investment management business is intensely competitive, with competition based on a variety of factors, including investment performance, business relationships, quality of service provided to clients, fund investor liquidity, fund terms (including fees and economic sharing arrangements), brand recognition and business reputation. Maintaining our reputation is critical to attracting and retaining fund investors and for maintaining our relationships with our regulators, sponsors, Partner Managers, potential
co-investors
and joint venture partners, as applicable. Negative publicity regarding our company, our personnel or our Partner Managers could give rise to reputational risk that could significantly harm our existing business and business prospects. We are also currently subject to and may be subject in the future to litigation between ourselves and our Partner Managers, which may harm our reputation.Similarly, events could occur that damage the reputation of our industry generally, such as the insolvency or bankruptcy of large funds or a significant number of funds or highly publicized incidents of fraud or other scandals, any one of which could have a material adverse effect on our business, regardless of whether any of those events directly relate to our products or the investments made by our products.
27
Our products compete with a number of specialized funds, corporate buyers, traditional asset managers, real estate companies, commercial banks, investment banks, other investment managers and other financial institutions, including certain of our stockholders, as well as domestic and international pension funds and sovereign wealth funds, and we expect that competition will continue to increase. In addition, our BDCs and other Direct Lending products compete with a number of other BDCs, private funds, commercial banks, and other financial institutions.
Numerous factors increase our competitive risks, including, but not limited to:
| • | A number of our competitors may have or are perceived to have more expertise or financial, technical, marketing and other resources and more personnel than we do; |
| • | Some of our products may not perform as well as competitors’ funds or other available investment products; |
| • | Several of our competitors have raised significant amounts of capital, and many of them have similar investment objectives to ours, which may create additional competition for investment opportunities; |
| • | Some of our competitors may have lower fees or alternative fee arrangements that potential clients of ours may find more appealing; |
| • | Some of our competitors may have a lower cost of capital and access to funding sources that are not available to us, which may create competitive disadvantages for us with respect to our products, including our products that directly use leverage or rely on debt financing of their portfolio investments to generate superior investment returns; |
| • | Some of our competitors may have higher risk tolerances, different risk assessments or lower return thresholds than us, which could allow them to consider a wider variety of investments and to bid more aggressively than us or to agree to less restrictive legal terms and protections for investments that we want to make; |
| • | Some of our competitors may be subject to less regulation or conflicts of interest and, accordingly, may have more flexibility to undertake and execute certain businesses or investments than we do, bear less compliance expense than we do or be viewed differently in the marketplace; |
| • | Some of our competitors may have more flexibility than us in raising and deploying certain types of funds under the investment management contracts they have negotiated with their fund investors; and |
| • | Some of our competitors may offer a broader investment platform and more partnership opportunities to portfolio companies than we are able to offer. |
Certain of our strategic relationship investors (including early-stage investors in new products) may be granted the right to participate in the net profits of our advisory business attributable to certain strategies or products.
Certain investors in our products have been granted, and may in the future receive various forms of, participation rights. with respect to certain strategies, product lines or products, including, but not limited to, the right to: (1) the net profits or gross revenues of certain businesses; (2) the gross management fee revenue derived from certain strategies; (3) shares in net operating income that would otherwise be earned by us with respect to management fees, and (4) shares in a percentage of management fees. To the extent gross revenue participations or similar arrangements are offered, they will reduce the revenue earned by us, but we will continue to bear all applicable expenses, even if the product is not generating positive cash flow. We may also offer our employees the opportunity to participate in certain types of these arrangements in certain circumstances as a way of compensating or incentivizing employees. There is generally no limitation on the size or the duration of future economic sharing arrangements.
In addition, in the ordinary course we may offer fee discounts to investors in existing and future funds and we expect to continue to waive fees for many or all of our
co-investments.
We currently expect, at least in certain28
instances, to continue to offer these economic sharing arrangements to our strategic relationship investors (which may include certain of our stockholders) in the future, which may reduce the revenues ultimately earned by us in respect of these products, although it is hoped in many instances this will be balanced by the broader strategic benefits.
Conflicts of interest may arise in our allocation of capital and
co-investment
opportunities.As an asset manager with multiple clients, including our various product lines, we confront conflicts of interests relating to our investment activities and operations. In particular, our allocation of capital and
co-investment
opportunities across our products are subject to numerous actual or potential conflicts of interest. Although we have implemented policies and procedures to address those conflicts, our failure to effectively identify and address them could cause reputational harm and a loss of investor confidence in our business. It could also result in regulatory lapses that could lead to applicable penalties, as well as increased regulatory oversight of our business.Potential conflicts of interest in allocation among funds
Certain of our products may have overlapping investment objectives, including funds that have different fee structures, and potential conflicts may arise with respect to our decisions regarding how to allocate investment opportunities among those funds. We may allocate an investment opportunity that is appropriate for two or more investment funds in a manner that excludes one or more funds or results in a disproportionate allocation based on factors or criteria that we determine, including but not limited to differences with respect to available capital, the current or anticipated size of a fund, minimum investment amounts, the remaining life of a fund, differences in investment objectives, guidelines or strategies, diversification, portfolio construction considerations and other considerations deemed relevant to us and in accordance with our policy. Although we have adopted investment allocation policies and procedures that are designed to ensure fair and equitable treatment over time, and expect these policies and procedures to continue to evolve, those policies and procedures will not eliminate all potential conflicts. Certain investment opportunities may be allocated to certain funds that have lower fees or to our
co-investment
funds that pay no fees. To the extent that those investments could otherwise have been allocated to funds generating FPAUM, our revenues will be less than what would otherwise have been generated were those investments made through fee paying structures.Potential conflicts of interest in connection with
co-investments
between our private funds and our BDCsOur BDCs are permitted to
co-invest
in portfolio companies with each other and with affiliated investment funds in negotiated transactions pursuant to an SEC order (the“Co-investment
Exemptive Order”). Pursuant to that exemptive relief, our BDCs and other affiliated investment funds generally are permitted to make suchco-investments
if a “required majority” (as defined in Section 57(o) of the Investment Company Act) of such BDC’s directors (including the independent directors) makes certain conclusions in connection with theco-investment
transaction, including that (1) the terms of the transaction, including the consideration to be paid, are reasonable and fair to such BDC and its stockholders and do not involve overreaching in respect of such BDC or its stockholders on the part of any person concerned, (2) the transaction is consistent with the interests of such BDC’s stockholders and with its investment objective and strategies, and (3) the investment by one of our BDCs and other affiliated investment funds would not disadvantage any other of our BDCs, and such BDC’s participation would not be on a basis different from or less advantageous than that on which the other BDCs or other affiliated investment funds are investing. The different investment objectives or terms of the BDCs and affiliated investment funds may result in a potential conflict of interest, including in connection with the allocation of investments among our BDCs and/or our affiliated investment funds pursuant to theCo-investment
Exemptive Order or otherwise.As a result of our structure, our GP Capital Solutions products are affiliated investment funds of our BDCs and are prohibited from
co-investing
with our BDCs, except as permitted by the Investment Company Act and29
the
Co-investment
Exemptive Order. Those restrictions may limit the ability of our GP Capital Solutions products to make certain investments they otherwise may have made, and subject our products to additional compliance and regulatory risk. While it is not currently anticipated that there will be substantial overlap in the investment opportunities pursued by our BDCs, on the one hand, and our GP Capital Solutions products, on the other hand, theCo-investment
Exemptive Order will require that any opportunities that are appropriate for both our BDCs and our GP Capital Solutions products will need to be offered to our BDCs and any such investments, if made, will need to be conducted in compliance with the conditions of theCo-Investment
Exemptive Order and other requirements under the Investment Company Act. These restrictions also apply to our other Direct Lending and Real Estate products and may apply to additional product lines in the future.Conflicts related to investments by several of our products at different levels of the capital structure of a single portfolio company or Partner Manager.
Different funds that we advise and/or our BDCs may invest in a single portfolio company, including at different levels of the capital structure of the portfolio company. For example, in the normal course of business, one of our products may acquire debt positions in, or lend to, companies in which another of our products owns common equity securities or a subordinated debt position. This could occur at the time of, or subsequent to, the initial investment in the portfolio company. A direct conflict of interest could arise among the various debt holders and equity holders if the company were to experience financial distress. In addition, if one of our BDCs is an investor in a portfolio company alongside other of our BDCs or affiliated investment funds we advise that have invested in a different part of the portfolio company’s capital structure, the Investment Company Act may prohibit us from negotiating on behalf of any such fund in connection with a reorganization or restructuring of the portfolio company. While we have developed general guidelines regarding when two or more funds can invest in different parts of the same company’s capital structure and created a process that we employ to handle those conflicts when they arise, our decision to permit the investments to occur in the first instance or our judgment on how to minimize the conflict could be challenged. If we fail to appropriately address those conflicts, it could negatively impact our reputation and ability to raise additional funds and the willingness of counterparties to do business with us or result in potential litigation against us.
Conflicts of interest may arise in our allocation of costs and expenses, and we are subject to increased regulatory scrutiny and uncertainty with regard to those allocations.
As an asset manager with multiple funds, we regularly make determinations to allocate costs and expenses both among our funds and between our funds and their investment advisors. Certain of those allocation determinations are inherently subjective and virtually all of them are subject to regulatory oversight. Any allocation or allegation of, or investigation into, a potential violation could cause reputational harm and a loss of investor confidence in our business. It could also result in regulatory lapses and any applicable penalties, as well as increased regulatory oversight of our business. In addition, any determination to allocate fees to the applicable investment adviser or Blue Owl could negatively affect our net income, and ultimately decrease the value of our common stock and our dividends to our stockholders. Similar considerations arise when allocating expenses to, or away from vehicles to which specified interests apply.
Allocation of costs and expenses among our funds and between our funds and applicable management companies
We have a conflict of interest in determining whether certain costs and expenses are incurred in the course of operating our funds, including the extent to which services provided by certain employees and associated costs are allocable to certain funds. Our funds generally pay or otherwise bear all legal, accounting, filing, and other expenses incurred in connection with organizing and establishing the funds and the offering of interests in the funds. Such determinations often require subjective judgment and may result in the management company, rather than our funds, being allocated certain fees and expenses. In addition, our funds generally pay all expenses related to the operation of the funds and their investment activities, in certain cases subject to caps. We also
30
determine, in our sole discretion, the appropriate allocation of investment-related expenses, including broken deal expenses, incurred in respect of unconsummated investments and expenses more generally relating to a particular investment strategy, among our products, vehicles and accounts participating or that would have participated in such investments or that otherwise participate in the relevant investment strategy, as applicable. That often requires judgment and could result in one or more of our funds bearing more or less of these expenses than other investors or potential investors in the relevant investments or a fund paying a disproportionate share, including some or all, of the broken deal expenses or other expenses incurred by potential investors. Any dispute regarding such allocations could lead to our funds having to bear some portion of these costs as well as reputational risk. In addition, for funds that do not pay or otherwise bear the costs and expenses described above because of the application of caps or otherwise, such amounts may be borne by the applicable management company, which will reduce the amount of net fee income we receive for providing advisory services to the funds. For example, Dyal Capital has developed a Business Services Platform that provides strategic services to Partner Managers. Certain expenses associated with the Business Services Platform (“BSP Expenses”) are allocated among, and payable by, each of the GP Minority Equity Investment funds (“Dyal Equity Funds”). Those Dyal Equity Funds are generally allocated an amount equal to their pro rata allocation of BSP Expenses based on the relative number of Partner Managers in which investments are held from time to time by each of those funds; provided that the amount of BSP Expenses borne by a particular Dyal Equity Fund is subject to certain caps specified in its respective governing documents. In addition, Dyal Fund V provides for a minimum payment for BSP Expenses, which to the extent such minimum exceeds Dyal Fund V’s otherwise allocable share of such expenses, reduces the amounts of BSP Expenses borne by the other Dyal Equity Funds. It is expected that any successor fund to Dyal Fund V would similarly share in BSP Expenses.
We are required to bear any BSP Expenses allocated to a Dyal Equity Fund that exceeds the fund’s cap on those expenses. In addition, in certain instances, we expect to determine not to allocate or charge certain BSP Expenses to the Dyal Equity Funds, or to a particular fund, in response to regulatory, fund investor relations, governance or other applicable considerations and determine instead for those BSP Expenses to be borne by us. Any such determination could have the effect of materially reducing the reimbursement payments received by us with respect to the Business Services Platform or result in losses attributable to certain activities thereof. The allocation methodology for allocating BSP Expenses and other similar expenses is complex and subject to interpretation. Accordingly, there can be no assurance that any conflict arising from these allocations of expenses will be resolved in a manner responsive to the interests of all of our clients, which could damage our reputation.
The activities of the Business Services Platform and the allocation of BSP expenses have in the past been subject to an SEC order. These and other expense allocation practices could in the future be subject to regulatory scrutiny.
Existing and future relationships between or among our Partner Managers, our products and their limited partners could give rise to actual or perceived conflicts of interest.
Certain of our GP Capital Solutions products’ Partner Managers directly or through their investment funds, own securities in Blue Owl or its subsidiaries. Additionally, Dyal Fund IV has a passive minority equity interest in Owl Rock Feeder and became an indirect equityholder in Blue Owl upon consummation of the Business Combination. As a result, Dyal Fund IV will, to the extent it holds shares of Blue Owl, be entitled to vote on matters submitted to stockholders of Blue Owl generally, including with respect to the election of directors. In addition, a controlled affiliate of Blue Owl will serve as investment manager to Dyal Fund IV. Dyal Fund IV may have different interests, including different investment horizons, than Blue Owl generally or the Dyal Principals specifically. However, any decision made with respect to holding or disposing of Dyal Fund IV’s interest in Blue Owl will be determined by such Blue Owl affiliate, as investment manager to Dyal Fund IV, in a manner consistent with its statutory and contractual duties to Dyal Fund IV. Because those decisions will be made independent from consideration of Blue Owl’s interests, they may, due to a range of factors, conflict with Blue Owl’s own interests at such time.
31
GP Capital Solutions products hold minority, noncontrolling interests in a broad range of Partner Managers. Those Partner Managers may, from time to time, directly or through their funds, enter into transactions or other contractual arrangements with us or our products outside of the GP Minority Equity Investments strategy, including our private funds, BDCs and Real Estate products, or between or among one another in the ordinary course of business, which may result in additional conflicts of interest. None of those transactions or other contractual arrangements are believed to be currently material to our operations or performance but there may be material transactions entered into in the future.
Even if those relationships do not create actual conflicts, the perception of conflicts in the press or the financial community generally could create negative publicity with respect to Blue Owl, which could adversely affect the relationships of with our product investors.
Debt investments in Partner Manager investments by the funds.
Portfolio companies of funds managed by our Partner Managers may also be borrowers under debt facilities or instruments owned, arranged or managed by our BDCs or funds. In its capacity as agent or lender under such facilities or instruments, a BDC or fund is required to act in the best interests of its stockholders or investors. In certain circumstances, a BDC or fund may be required to take actions that may be adverse to the investments owned by funds managed by Partner Managers, which could adversely affect our relationships with the Partner Managers, or potentially impact the value of a GP Capital Solutions product’s investment in such Partner Manager. As a result, although we believe that the Business Combination has enhanced our ability to source investment opportunities for our BDCs and funds through, among other things, our enhanced relationships with Partner Managers, it also may result in additional conflicts of interest.
Our Real Estate products may enter into sale lease-back transactions with portfolio companies of funds managed by our Partner Managers or borrowers under debt facilities or instruments owned, arranged or managed by our BDCs or funds.
From time to time, companies in which our BDCs or funds, or funds managed by our Partner Managers, have invested or may invest, may enter into sale-leaseback transactions with our Real Estate products. These arrangements could result in our BDCs or funds, or funds managed by our Partner Managers, being creditors to, or equity owners of, such companies at the same time as those companies are tenants of our Real Estate products. If such a company were to encounter financial difficulty or default on its obligations as a borrower, our BDC or fund, or a fund managed by a Partner Manager, could be required to take actions that may be adverse to those of our Real Estate products in enforcing its rights under the relevant facilities or agreements, or vice versa.
Additional and unpredictable conflicts of interests may rise in the future.
In addition to the conflicts outlined above, we may experience conflicts of interest in connection with the management of our business affairs relating to and arising from a number of matters, including the amounts paid to us by our investment funds; services that may be provided by us and our affiliates to investments in which our investment funds invest (including the determination of whether or not to charge fees to our investments for our provision of such services); investments by our investment funds and our other clients, subject to the limitations of the Investment Company Act; our formation of additional investment funds; differing recommendations given by us to different clients; and our use of information gained from an investment funds’ investments used to inform investments by other clients, subject to applicable law.
Our products hold and make investments in Partner Managers and there may be provisions within our arrangements with Partner Managers that could affect our right to receive or share information or cause us to sell our interests in the Partner Manager.
The terms of our GP Capital Solutions products’ investments in Partner Managers generally include provisions relating to competitors of the Partner Managers, access to information about the Partner Managers and
32
their business, and affirmative and negative confidentiality obligations regarding the Partner Managers. While we have an information control policy with restrictions regarding the sharing of a Partner Manager’s confidential information, such policy and related procedures may not reduce a Partner Manager’s concern over the sharing of confidential and competitively sensitive information. Certain Partner Managers that are engaged in managing funds focused on similar businesses as our other product lines may consider Blue Owl to be a competitor with respect to their business and may seek to invoke remedies available to them under the investment agreements or pursue other remedies. Potential remedies available to them under the investment agreements, as applicable, include limiting the rights of our products to receive confidential information from the Partner Manager regarding its business, requiring us to sequester confidential information received from the Partner Manager, or requiring us to sell our interests in the Partner Manager for fair value as determined under the relevant investment agreement. A forced sale of a Partner Manager interest may reduce the amount of fees we receive with respect to the applicable GP Capital Solutions product, and any reduction in information may impede our ability to supervise our funds’ investments. Further, the affiliation may hinder our GP Capital Solutions products’ ability to make future investments in Partner Managers who are in the same space and who may consider Blue Owl a competitor, including
follow-on
investments in existing Partner Managers and investments with new Partner Managers.The operations of our business and related transactions may affect our reputation and relationship with our Partner Managers.
We are reliant upon our strong relationships with our Partner Managers for the continued growth and development of business. Due to the number of Partner Managers with which we have relationships, we may compete with existing or prospective Partner Managers, which could negatively impact our ability to attract new Partner Managers to our products who may seek relationships with
non-competitors
over concerns of sharing information with competitors or other potential conflicts, including the ability to exercise our fiduciary duties. Additionally, our investments in Partner Managers may affect our relationships with other sponsors that are key relationships for our lending businesses, because of similar concerns around information sharing or other reasons. While we intend to implement robust procedures to address any such conflict, such procedures may not reduce the perception that such conflicts exist and may make us a less attractive partner/investor.Our entitlement and that of certain of our stockholders, Principals and employees to receive performance income from certain of our products may create an incentive for us to make more speculative investments and determinations on behalf of our products than would be the case in the absence of such performance income.
Some of our products receive performance-based fees. With respect to Dyal Funds I—V and their related
co-investment
vehicles, none of the carried interest will be allocated to us. Further, we will be allocated a portion of the carried interest attributable to future GP Capital Solutions and Direct Lending products as well as 15% of the carried interest in existing Real Estate products. If a new GP Capital Solutions product is formed to facilitate a secondary transaction with respect to any of Dyal Funds I—V (which would include, without limitation, any continuation fund or other new fund whose primary purpose is to acquire directly or indirectly all or a portion of the assets of or interests in the existing Dyal Fund), any carried interest generated by such fund will not be allocated to us, notwithstanding that such secondary vehicle is formed in the future. Realized performance income not allocated to us is allocated to certain of our stockholders, Principals and employees in vehicles not controlled by us. Carried interest and performance based fees or allocations may create an incentive for us or our investment professionals to make more speculative or riskier investments and determinations, directly or indirectly on behalf of our products, or otherwise take or refrain from taking certain actions than it would otherwise make in the absence of such carried interest or performance-based fees or allocations. It may also create incentives to influence how we establish economic terms for future funds. In addition, we may have an incentive to make exit determinations based on factors that maximize economics in favor of certain of our stockholders, Principals and employees relative to us and ournon-participating
stockholders. Our failure to appropriately address any actual, potential or perceived conflicts of interest resulting from our entitlement to receive performance income from many of our products could have a material adverse effect on our reputation,33
which could materially and adversely affect our business in a number of ways, including limiting our ability to raise additional funds, attract new clients or retain existing clients.
Our business is currently focused on multiple investment strategies.
We currently pursue, through our products, multiple investment strategies. While we believe that there may be certain synergies amongst the various strategies, there can be no assurance that the benefits will manifest or that there will not be unanticipated consequences resulting therefrom. Although we are seeking additional investment strategies, relative to more diversified asset managers, our products’ limited and specialized focus also leaves us more exposed to risks affecting the dual sectors in which our products invest. As our investment management program is not broadly diversified, we may be uniquely exposed to market, tax, regulatory and other risks affecting the sectors in which we invest. There can be no assurance that we will be able to take actions necessary to mitigate the effect of such risks or otherwise diversify our investment program to minimize such exposure.
Rising interest rates could have a substantial adverse effect on our business.
Rising interest rates could have a dampening effect on overall economic activity, the financial condition of our customers and the financial condition of the end customers who ultimately create demand for the capital we supply, all of which could negatively affect demand for our capital. Additionally, an increase in interest rates could make it difficult for us to obtain financing at attractive rates, impacting our ability to execute on our growth strategies or future acquisitions.
The anticipated benefits of the Oak Street Acquisition and other acquisitions that we may pursue under our growth strategy, may not be realized or may take longer than expected to realize.
The optimization of our combined operations following the Oak Street Acquisition, or any other acquisition that we may pursue under our growth strategy, will be a complex, costly and time-consuming process and if we experience difficulties in this process, the anticipated benefits may not be realized fully or at all, or may take longer to realize than expected, which could have an adverse effect on us for an undetermined period. There can be no assurances that we will realize the potential operating efficiencies, synergies and other benefits currently anticipated from any acquisition.
The integration of our business and Oak Street may present material challenges, including, without limitation:
| • | combining the leadership teams and corporate cultures of us and Oak Street; |
| • | the diversion of management’s attention from ongoing business concerns and performance shortfalls at one or both of the businesses as a result of the devotion of management’s attention to the continuing integration of the businesses; |
| • | managing a larger combined business; |
| • | maintaining employee morale and retaining key management and other employees at the combined company, including by offering sufficiently attractive terms of employment; |
| • | retaining existing business and operational relationships, and attracting new business and operational relationships; |
| • | the possibility of faulty assumptions underlying expectations regarding the integration process; |
| • | consolidating corporate and administrative infrastructures and eliminating duplicative operations; |
| • | managing expense loads and maintaining currently anticipated operating margins given that our two businesses are different in nature and therefore may require additional personnel and compensation expenses, which expenses may be borne by us, rather than our products; |
34
| • | difficulty replicating or replacing functions, systems and infrastructure provided by Neuberger or certain of its affiliates or the loss of benefits from Neuberger’s global contracts; and |
| • | unanticipated issues in integrating information technology, communications and other systems. |
In addition, our growth strategy contemplates that we will pursue acquisitions of assets or business that are complementary to our business, such as the recently completed Wellfleet Acquisition. Some or all of the foregoing risks may arise in connection with integrating these acquisitions. Some of those factors are outside of our control, and any one of them could result in delays, increased costs, decreases in the amount of potential revenues or synergies, potential cost savings, and diversion of management’s time and energy, which could materially affect our financial position, results of operations, and cash flows.
We may continue to enter into new lines of business and expand into new investment strategies, geographic markets and businesses, each of which may result in upfront costs and additional risks and uncertainties in our businesses.
We intend, if market conditions warrant, to grow our businesses by increasing FPAUM in existing businesses and expanding into new investment strategies, geographic markets (including in both U.S. and
non-U.S.
markets) and businesses. For example, we recently completed both the Oak Street Acquisition, which focuses on structuring sale-leasebacks, including triple net leases, and the acquisition Wellfleet Credit Partners LLC, the performing credit arm of Littlejohn & Co., LLC which focuses on the management of CLO portfolios of broadly syndicated leveraged loans. Subject to the consent rights of Neuberger as set forth in the Investor Rights Agreement (as described below), we may pursue growth through acquisitions of other investment management companies, expansion into new markets, acquisitions of critical business partners or other strategic initiatives, in each case, which may include entering into new lines of business.Attempts to expand our businesses involve a number of special risks, including some or all of the following:
| • | the required investment of capital and other resources; |
| • | the diversion of management’s attention from our core businesses; |
| • | the assumption of liabilities in any acquired business; |
| • | the disruption of our ongoing businesses; |
| • | entry into markets or lines of business in which we may have limited or no experience, and which may subject us to new laws and regulations which we are not familiar or from which we are currently exempt; |
| • | increasing demands on our operational and management systems and controls; |
| • | compliance with or applicability to our businesses or our funds’ portfolio companies of regulations and laws, including, in particular, local regulations and laws (for example, consumer protection related laws) and the impact that noncompliance or even perceived noncompliance could have on us and our funds’ portfolio companies; |
| • | conflicts between business lines in deal flow or objectives; |
| • | we may be dependent upon, and subject to liability, losses or reputational damage relating to, systems, controls and personnel that are not under our control; |
| • | potential increase in fund investor concentration; and |
| • | the broadening of our geographic footprint, increasing the risks associated with conducting operations in foreign jurisdictions where we currently have little or no presence, such as different legal, tax and regulatory regimes and currency fluctuations, which require additional resources to address. |
35
Because we have not yet identified these potential new investment strategies, geographic markets or lines of business, we cannot identify all of the specific risks we may face and the potential adverse consequences on us and their investment that may result from any attempted expansion.
Rapid growth of our businesses may be difficult to sustain and may place significant demands on our administrative, operational and financial resources.
Our AUM has grown significantly in the past, and we intend to pursue further growth in the near future, including through acquisitions. Our rapid growth has placed, and future growth, if successful, will continue to place, significant demands on our legal, compliance, accounting and operational infrastructure and will result in increased expenses. In addition, we are, and will continue to be, required to continuously develop our systems and infrastructure in response to the increasing sophistication of the investment management market; legal, accounting, regulatory and tax developments and continually evolving cybersecurity risks.
Our future growth will depend in part on our ability to maintain an operating platform and management system sufficient to address our growth and may require us to incur significant additional expenses and to commit additional senior management and operational resources. As a result, we may face significant challenges in:
| • | maintaining adequate financial, regulatory (legal, tax and compliance) and business controls; |
| • | providing current and future fund investors and stockholders with accurate and consistent reporting; |
| • | implementing new or updated information and financial systems and procedures; and |
| • | training, managing and appropriately sizing our work force and other components of our businesses on a timely and cost-effective basis. |
We may not be able to manage our expanding operations effectively and may not be ready to continue to grow because of operational needs, and any failure to do so could adversely affect our ability to generate revenue and control our expenses. In addition, if we are unable to consummate or successfully integrate development opportunities, acquisitions or joint ventures, we may not be able to implement our growth strategy successfully.
Our Professional Sports Minority Investments strategy is new, subject to significant risk and uncertainty.
We have established and are continuing to build a new relationship with the NBA in furtherance of our Professional Sports Minority Investments strategy. Our Dyal HomeCourt Fund makes minority investments in NBA franchises. The NBA provides certain services with respect to the Dyal HomeCourt Fund and receives a share of management fees and incentive allocations attributable to the fund. There is no assurance that we will be able to raise sufficient funds to continue to execute this strategy in the future. As advisor to the Dyal HomeCourt Fund, we may be exposed to liability to the NBA in a range of circumstances including as a result of a violation of rules applicable to NBA franchise owners by us or investors in our Dyal HomeCourt Fund or, in certain circumstances, by our
co-owners
of a team (regardless of whether such persons were acting under our direction or control), the departure of certain Dyal Capital key persons or the occurrence of certain events constituting cause. Any failure of the Professional Sports Minority Investments strategy could result in a decrease in our FPAUM growth potential and have an adverse effect on our reputation. In addition, we associate from time to time with different businesses and managers in different ways. This may include Partner Managers, Dyal Home Court, and our seeding business through Oak Street. To differing degrees, these present the potential for a reputational risk that may have consequences that exceed the current materiality of the revenue from these businesses.We depend on our senior management team, senior investment professionals and other key personnel, and the loss of their services would have a material adverse effect on us and our products.
Our success depends on the efforts, judgment and personal reputations of our senior management team, senior investment professionals and other key personnel. Their reputations, expertise in investing, relationships
36
with fund investors and with other members of the business communities on whom we and our products depend on for investment opportunities and financing are each critical elements in operating and expanding our business. The loss of the services of our senior management team, senior investment professionals or other key personnel could have a material adverse effect on us and our products, and on the performance of our products, including on our ability to retain and attract fund investors and raise capital.
The departure of some or all of those individuals could also trigger certain provisions tied to the departure of, or cessation of committed time, by those persons (known as “key person” provisions) in the documentation governing certain of our products, which could permit the investors in those funds to suspend or terminate those funds’ investment periods. We do not carry any “key person” insurance that would provide us with proceeds in the event of the death or disability of any of our senior professionals, and we do not have a policy that prohibits our senior professionals from traveling together.
In addition, each of our Key Individuals is entitled to significant compensation payments and under certain circumstances (including the Key Individual’s death or disability), the Key Individual (or his estate) is entitled to retain those payments for up to five years following such person’s ceasing to be employed by us. While we continue to make such payments, we may need to find or promote new employees to replace the former Key Individual, which may require additional significant compensation to be paid by us, which could adversely affect our earnings.
Employee misconduct could harm us by impairing our ability to attract and retain fund investors and subjecting us to significant legal liability, regulatory scrutiny and reputational harm.
Our ability to attract and retain fund investors and to pursue investment opportunities for our clients depends heavily upon the reputation of our professionals, especially our senior professionals as well as third-party service providers. We are subject to a number of obligations and standards arising from our investment management business and our authority and statutory fiduciary status over the assets managed by our investment management business. Further, our employees are subject to various internal policies including a Code of Ethics and policies covering conflicts of interest, information systems, business continuity and information security. The violation of those obligations, standards and policies by any of our employees or misconduct by one of our third-party service providers could adversely affect investors in our products and us. Our businesses often require that we deal with confidential matters of great significance to companies in which our products may invest. If our employees, former employees or third-party service providers were to use or disclose confidential information improperly, we could suffer serious harm to our reputation, financial position and current and future business relationships. Employee or third-party service provider misconduct could also include, among other things, binding us to transactions that exceed authorized limits or present unacceptable risks and other unauthorized activities or concealing unsuccessful investments (which, in either case, may result in unknown and unmanaged risks or losses), or otherwise charging (or seeking to charge) inappropriate expenses or inappropriate or unlawful behavior or actions directed towards other employees.
It is not always possible to detect or deter misconduct by employees or third-party service providers, and the extensive precautions we take to detect and prevent this activity may not be effective in all cases. If one or more of our employees, former employees or third-party service providers were to engage in misconduct or were to be accused of such misconduct, our businesses and our reputation could be adversely affected and a loss of fund investor confidence could result, which would adversely impact our ability to raise future funds. Our current and former employees and those of our products’ investments as well as our third-party service providers may also become subject to allegations of sexual harassment, racial and gender discrimination or other similar misconduct, which, regardless of the ultimate outcome, may result in adverse publicity that could harm our and such portfolio company’s brand and reputation.
37
Our future growth depends on our ability to attract, retain and develop human capital in a highly competitive talent market.
The success of our business will continue to depend upon us attracting, developing and retaining human capital. Competition for qualified, motivated, and highly-skilled executives, professionals and other key personnel in asset management firms is significant. Turnover and associated costs of rehiring, the loss of human capital through attrition, death, or disability and the reduced ability to attract talent could impair our ability to implement our growth strategy and maintain our standards of excellence. Our future success will depend upon our ability to find, attract, retain and motivate highly-skilled and highly-qualified individuals. We seek to provide our personnel with competitive benefits and compensation packages. However, our efforts may not be sufficient to enable us to attract, retain and motivate qualified individuals to support our growth. Moreover, if our personnel join competitors or form businesses that compete with ours, that could adversely affect our ability to raise new or successor funds.
We are subject to risks related to corporate social responsibility.
We and our products face increasing public scrutiny related to environmental, social and governance (“ESG”) activities, including diversity and inclusion, environmental stewardship, support for local communities, corporate governance and transparency. Before making an investment on behalf of our products, we analyze a wide array of considerations, risks, and potential rewards related to the prospective investment. Among the pecuniary considerations we analyze are the present and future material ESG implications of investments. It is expected that investor demands and the prevailing legal environment will require us to spend additional resources and place increasing importance on ESG matters in our review of prospective investments and management of existing ones. Devoting additional resources to ESG matters could increase the amount of expenses we or our investments are required to bear. Further, emphasis on ESG criteria in evaluating an investment by us or our products could lead to reduced profits.
ESG matters have been the subject of increased focus by certain regulators, including in the United States and the European Union. A lack of harmonization globally in relation to ESG legal and regulatory reform leads to a risk of fragmentation in group level priorities as a result of the different pace of sustainability transition across global jurisdictions. This may create conflicts across our global business and funds in which we invest which could risk inhibiting our future implementation of, and compliance with, rapidly developing ESG standards and requirements.
The European Commission has adopted legislative reforms, which include, without limitation: (a) Regulation 2019/2088 regarding the introduction of transparency and disclosure obligations for fund investors, funds and asset managers in relation to ESG factors, for which most rules took effect beginning on March 10, 2021; (b) a regulation regarding the introduction of an
EU-wide
taxonomy of environmentally sustainable activities, which takes effect in part in January 2022 and in part in January 2023; and (c) amendments to existing regulations including MiFID II and the European Union (“EU”) Alternative Investment Fund Managers Directive (the “AIFMD”) to embed ESG requirements.As a result of these legislative and regulatory initiatives, we may be required to provide additional disclosure to investors in our products with respect to ESG matters. This exposes us to increased disclosure risks, for example due to a lack of available or credible data, and the potential for conflicting disclosures may also expose us to an increased risk of misstatement litigation or miss-selling allegations. Failure to manage these risks could result in a material adverse effect on our business in a number of ways.
The effect of global climate change may impact the operations of our products’ investments.
There is evidence of global climate change. Climate change creates physical and financial risk and some of our products and their investments may be adversely affected by climate change. For example, the needs of
38
customers of energy companies vary with weather conditions, primarily temperature and humidity. To the extent weather conditions are affected by climate change, energy use could increase or decrease depending on the duration and magnitude of any changes. Increases in the cost of energy could adversely affect the cost of operations of our investments if the use of energy products or services is material to their business. A decrease in energy use due to weather changes may affect some of our investments’ financial condition through, for example, decreased revenues. Extreme weather conditions in general require more system backup, adding to costs, and can contribute to increased system stresses, including service interruptions.
We are subject to risks in using custodians, counterparties, administrators and other agents.
Many of our products depend on the services of custodians, counterparties, administrators and other agents to carry out certain transactions and other administrative services, including compliance with regulatory requirements in U.S. and
non-U.S.
jurisdictions. We are subject to risks of errors and mistakes made by these third parties, which may be attributed to us and subject us or our products’ investors to reputational damage, penalties or losses. We depend on third parties to provide primary and back up communications and information systems. Any failure or interruption of those systems, including as a result of the termination of an agreement with any third-party service providers, could cause delays or other problems in our activities. Our financial, accounting, data processing, portfolio monitoring, backup or other operating systems and facilities may fail to operate properly or become disabled or damaged as a result of a number of factors including events that are wholly or partially beyond our control.The terms of the contracts with third-party service providers are often customized and complex, and many of these arrangements occur in markets or relate to products that are not subject to regulatory oversight. Accordingly, we may be unsuccessful in seeking reimbursement or indemnification from these third-party service providers. In addition, we rely on a select number of third-party services providers and replacement of any one of our service providers could be difficult and result in disruption and expense.
Cybersecurity risks and cyber incidents could adversely affect our business by causing a disruption to our operations, a compromise or corruption of our confidential information and confidential information in our possession and damage to our business relationships, any of which could negatively impact our business, financial condition and operating results.
There has been an increase in the frequency and sophistication of the cyber and security threats we face, with attacks ranging from those common to businesses generally to those that are more advanced and persistent, which may target us because, as an alternative asset management firm, we hold confidential and other price sensitive information about existing and potential investments. Cyber-attacks and other security threats could originate from a wide variety of sources, including cyber criminals, nation state hackers, hacktivists and other outside parties. As a result, we may face a heightened risk of a security breach or disruption with respect to sensitive information resulting from an attack by computer hackers, foreign governments or cyber terrorists.
The efficient operation of our business is dependent on computer hardware and software systems, as well as data processing systems and the secure processing, storage and transmission of information, which are vulnerable to security breaches and cyber incidents. A cyber incident is considered to be any adverse event that threatens the confidentiality, integrity or availability of our information resources. These incidents may be an intentional attack or an unintentional event and could involve gaining unauthorized access to our information systems for purposes of misappropriating assets, stealing confidential information, corrupting data or causing operational disruption. In addition, we and our employees may be the target of fraudulent emails or other targeted attempts to gain unauthorized access to proprietary or sensitive information. The result of these incidents may include disrupted operations, misstated or unreliable financial data, fraudulent transfers or requests for transfers of money, liability for stolen assets or information, increased cybersecurity protection and insurance costs, litigation and damage to our business relationships, causing our business and results of operations to suffer. As our reliance on technology has increased, so have the risks posed to our information systems, both internal and those provided by third-party
39
service providers. We have implemented processes, procedures and internal controls designed to mitigate cybersecurity risks and cyber intrusions and rely on industry accepted securities measures and technology to securely maintain confidential and proprietary information maintained on our information systems; however, these measures, as well as our increased awareness of the nature and extent of a risk of a cyber-incident, do not guarantee that a cyber-incident will not occur and/or that our financial results, operations or confidential information will not be negatively impacted by such an incident, especially because the cyber-incident techniques change frequently or are not recognized until launched and because cyber-incidents can originate from a wide variety of sources.
Those risks are exacerbated by the rapidly increasing volume of highly sensitive data, including our proprietary business information and intellectual property, and personally identifiable information of our employees, our clients and others, that we collect and store in our data centers and on our networks. Our products may also invest in strategic assets having a national or regional profile or in infrastructure assets, the nature of which could expose them to a greater risk of being subject to a terrorist attack or security breach than other assets or businesses. The secure processing, maintenance and transmission of this information are critical to our operations. A significant actual or potential theft, loss, corruption, exposure, fraudulent use or misuse of fund investor, employee or other personally identifiable or proprietary business data, whether by third parties or as a result of employee malfeasance (or the negligence or malfeasance of third party service providers that have access to such confidential information) or otherwise,
non-compliance
with our contractual or other legal obligations regarding such data or intellectual property or a violation of our privacy and security policies with respect to such data could result in significant remediation and other costs, fines, litigation or regulatory actions against us and significant reputational harm.Increased data protection regulation may result in increased complexities and risk in connection with the operation of our business and our products.
We operate in businesses that are highly dependent on information systems and technology. The costs related to cyber or other security threats or disruptions may not be fully insured or indemnified by other means. Cybersecurity has become a priority for regulators in the U.S. and around the world. Many jurisdictions in which we operate have laws and regulations relating to data privacy, cybersecurity and protection of personal information, including the California Consumer Privacy Act that went into effect on January 1, 2020, and the New York SHIELD Act, which went into effect on March 1, 2020. In addition, one of the 2019 examination priorities for the SEC’s Office of Compliance Inspections and Examinations was to continue to examine cybersecurity procedures and controls, including testing the implementation of these procedures and controls. Further, the European General Data Protection Regulation (the “GDPR”) came into effect in May 2018. Data protection requirements under the GDPR are more stringent than those imposed under prior European legislation. There are substantial financial penalties for breach of the GDPR, including up to the higher of 20 million Euros or 4% of group annual worldwide turnover.
Non-compliance
with any of the aforementioned laws or other similar laws, therefore, represents a serious risk to our business. Some jurisdictions have also enacted laws requiring companies to notify individuals of data security breaches involving certain types of personal data. Breaches in security could potentially jeopardize our, our employees’ or our product investors’ or counterparties’ confidential and other information processed and stored in, and transmitted through, our computer systems and networks, or otherwise cause interruptions or malfunctions in our, our employees’, our product investors’, our counterparties’ or third parties’ operations, which could result in significant losses, increased costs, disruption of our business, liability to our product investors and other counterparties, regulatory intervention or reputational damage. Furthermore, if we fail to comply with the relevant laws and regulations, it could result in regulatory investigations and penalties, which could lead to negative publicity and may cause our product investors and clients to lose confidence in the effectiveness of our security measures.40
We are subject to litigation risks, and consequently, we may face liabilities and damage to our professional reputation as a result.
Legal liability could have a material adverse effect on our businesses, financial condition or results of operations or cause reputational harm to us, which could harm our businesses. We depend to a large extent on our business relationships and our reputation for integrity and high-caliber professional services to attract and retain fund investors and to pursue investment opportunities for our products. As a result, allegations of improper conduct asserted by private litigants or regulators, regardless of whether the ultimate outcome is favorable or unfavorable to us, as well as negative publicity and press speculation about us, our investment activities or the investment industry in general, whether or not valid, may harm our reputation, which may be damaging to our businesses.
In addition, the laws and regulations governing the limited liability of such issuers and investments vary from jurisdiction to jurisdiction, and in certain contexts the laws of certain jurisdictions may provide not only for carve-outs from limited liability protection for the issuer or portfolio company that has incurred the liabilities, but also for recourse to assets of other entities under common control with, or that are part of the same economic group as, such issuer. For example, if any of our products’ investments is subject to bankruptcy or insolvency proceedings in a jurisdiction and is found to have liabilities under the local consumer protection, labor, tax or bankruptcy laws, the laws of that jurisdiction may permit authorities or creditors to file a lien on, or to otherwise have recourse to, assets held by other investments (including assets held by our products) in that jurisdiction. There can be no assurance that we will not be adversely affected as a result of the foregoing risks.
We may not be able to maintain sufficient insurance to cover us for potential litigation or other risks.
We may not be able to maintain sufficient insurance on commercially reasonable terms or with adequate coverage levels against potential liabilities we may face in connection with potential claims, which could have a material adverse effect on our business. We may face a risk of loss from a variety of claims, including related to securities, antitrust, contracts, cybersecurity, fraud and various other potential claims, whether or not such claims are valid. Insurance and other safeguards might only partially reimburse us for our losses, if at all, and if a claim is successful and exceeds or is not covered by our insurance policies, we may be required to pay a substantial amount in respect of such successful claim. Certain losses of a catastrophic nature, such as losses arising as a result of wars, earthquakes, typhoons, terrorist attacks or other similar events, may be uninsurable or may only be insurable at rates that are so high that maintaining coverage would cause an adverse impact on our business, our investment funds and their investments. In general, losses related to terrorism are becoming harder and more expensive to insure against. Some insurers are excluding terrorism coverage from their
all-risk
policies. In some cases, insurers are offering significantly limited coverage against terrorist acts for additional premiums, which can greatly increase the total cost of casualty insurance for a property. As a result, we, our products and their investments may not be insured against terrorism or certain other catastrophic losses.Our use of leverage to finance our businesses exposes us to substantial risks. Any security interests or negative covenants required by a credit facility we enter into may limit our ability to create liens on assets to secure additional debt.
We may choose to finance our businesses operations through the issuance of senior notes, borrowings under our Revolving Credit Facility or by issuing additional debt in the future. Our existing and future indebtedness exposes us to the typical risks associated with the use of leverage. The occurrence or continuation of any of these events or trends could cause us to suffer a decline in the credit ratings assigned to our debt by rating agencies, which could cause the interest rate applicable to borrowings under the Revolving Credit Facility to increase and could result in other material adverse effects on our businesses. We depend on financial institutions extending credit to us on terms that are reasonable to us. There is no guarantee that such institutions will continue to extend credit to us or renew any existing credit agreements we may have with them, or that we will be able to refinance outstanding facilities when they mature. In addition, the incurrence of additional debt in the future could result in
41
potential downgrades of our existing corporate credit ratings, which could limit the availability of future financing and increase our cost of borrowing. Furthermore, our Revolving Credit Facility contains certain covenants with which we need to comply.
Non-compliance
with any of the covenants without cure or waiver would constitute an event of default, and an event of default resulting from a breach of certain covenants could result, at the option of the lenders, in an acceleration of the principal and interest outstanding. In addition, if we incur additional debt, our credit rating could be adversely impacted.Blue Owl may provide financial guarantees of performance in connection with certain investments, particularly in the Real Estate product-line, to certain lenders to its products and investments. Lenders in commercial real estate financing customarily will require such guarantees, which typically provides that the lender can recover losses from the guarantors for certain bad acts, such as fraud or intentional misrepresentation, intentional waste, willful misconduct, criminal acts, misappropriation of funds, voluntary incurrence of prohibited debt and environmental losses sustained by lender. It is expected that commercial real estate financing arrangements will generally require such guarantees and in the event that such a guarantee is called, Blue Owl’s assets could be materially and adversely affected.
As borrowings under our senior notes, Revolving Credit Facility and any future indebtedness mature, we may be required to either refinance them by entering into new facilities or issuing additional debt, which could result in higher borrowing costs, or issuing equity, which would dilute existing stockholders. We could also repay these borrowings by using cash on hand, cash provided by our continuing operations or cash from the sale of our assets. We may be unable to enter into new facilities or issue debt or equity in the future on attractive terms, or at all. Borrowings under the Revolving Credit Facility are SOFR-based obligations. As a result, an increase in short-term interest rates will increase our interest costs if such borrowings are not been hedged into fixed rates in the future.
Risks Related to Legal and Regulatory Environment
Our businesses are subject to extensive domestic and foreign regulations that may subject us to significant costs and compliance requirements, and our failure to comply with such regulations could have a material adverse effect on our business.
Our businesses, as well as the financial services industry, generally are subject to extensive regulation, including periodic examinations, by governmental agencies and self-regulatory organizations or exchanges in the U.S. and foreign jurisdictions in which we operate relating to, among other things, securities, antitrust, anti-money laundering, anti-bribery, tax and privacy. Each of the regulatory bodies with jurisdiction over us has regulatory powers dealing with many aspects of financial services, including the authority to grant, and in specific circumstances to cancel, permissions to carry on particular activities. The financial services industry may face an increasingly difficult political and regulatory environment, especially as a result of the recent change in presidential administration. The current administration has expressed support for proposals that call for greater regulatory oversight of the financial services industry. If these proposals were to become policy, such developments, including investors’ perceptions of and responses to such proposals, could potentially have a material adverse effect on our business, our products and the businesses of the companies in which our products invest.
We recently expanded our business to Canada, the U.K., Hong Kong and Singapore. Differences between the laws and rules governing our businesses in these jurisdictions compared to the United States result in inconsistent regulatory requirements that it may not be possible to fully reconcile in a cost-efficient manner across our businesses.
The SEC oversees the activities of certain of our subsidiaries that are registered investment advisers under the Investment Advisers Act of 1940 (the “Advisers Act”) and the activities of our BDCs that are regulated under the Investment Company Act.
42
Investment Advisers Act of 1940:
Under the Advisers Act, an investment adviser (whether or not registered under the Advisers Act) has fiduciary duties to its clients. The SEC has interpreted those duties to impose standards, requirements and limitations on, among other things, trading for proprietary, personal and client accounts; allocations of investment opportunities among clients; execution of transactions; and recommendations to clients.
Investment Company Act:
While we exercise broad discretion over themanagement of our BDCs, each of our BDCs is also subject to oversight and management by a board of directors, a majority of whom are not “interested persons” as defined under the Investment Company Act. The responsibilities of each of our BDC’s boards include, among other things, approving our advisory contract with the applicable BDC that we manage; approving certain service providers; determining the valuation and the method for valuing assets; and monitoring transactions involving affiliates; and approving certain
day-to-day
co-investment
transactions. The advisory contracts with each of our BDCs may be terminated by the stockholders or directors of such BDC on not more than 60 days’ notice, and are subject to annual renewal by each respective BDC’s board of directors after an initialtwo-year
term.Our BDCs are also prohibited from knowingly participating in certain transactions with their affiliates, except as permitted by the Investment Company Act and the.
Co-investment
Exemptive Order. For additional details, see“Conflicts of interest may arise in connection with
co-investments
between our private funds and our BDCs”In addition, the Dodd-Frank Act authorizes federal regulatory agencies to review and, in certain cases, prohibit compensation arrangements at financial institutions that give employees incentives to engage in conduct deemed to encourage inappropriate risk-taking by covered financial institutions. In 2016, federal bank regulatory authorities and the SEC revised and
re-proposed
a rule that generally (1) prohibits incentive-based payment arrangements that are determined to encourage inappropriate risks by certain financial institutions by providing excessive compensation or that could lead to material financial loss and (2) requires those financial institutions to disclose information concerning incentive-based compensation arrangements to the appropriate federal regulator. The Dodd-Frank Act also directs the SEC to adopt a rule that requires public companies to adopt and disclose policies requiring, in the event the company is required to issue an accounting restatement, the contingent repayment of obligations of related incentive compensation from current and former executive officers. The SEC has proposed but not yet adopted such rule. To the extent the aforementioned rules are adopted, our ability to recruit and retain investment professionals and senior management executives could be limited.Other Securities Laws:
43
us to regulatory action or third-party claims, which could have a material adverse effect on our businesses. For example, Rule 506 of Regulation D under the Securities Act includes “bad actor” disqualification provisions that ban an issuer from offering or selling securities pursuant to the safe harbor in Rule 506 if the issuer, or any other “covered person,” is the subject of a criminal, regulatory or court order or other “disqualifying event” under the rule which has not been waived by the SEC. The definition of a “covered person” under the rule includes an issuer’s directors, general partners, managing members and executive officers and promoters and persons compensated for soliciting investors in the offering. Accordingly, our ability to rely on Rule 506 to offer or sell our products and therefore a significant portion of our business would be impaired if we or any “covered person” is the subject of a disqualifying event under the rule and we are unable to obtain a waiver or, in certain circumstances, terminate our involvement with such “covered person”.
Compliance with existing and new regulations subjects us to significant costs. Any changes or other developments in the regulatory framework applicable to our businesses and changes to formerly accepted industry practices, may impose additional costs on us, require the attention of our senior management or limit the manner in which we conduct our businesses. We may be adversely affected by changes in the interpretation or enforcement of existing laws and rules by these governmental authorities and self-regulatory organizations. Additional legislation, increasing global regulatory oversight of fundraising activities, changes in rules promulgated by self-regulatory organizations or exchanges or changes in the interpretation or enforcement of existing laws and rules, either in the United States or elsewhere, may directly affect our mode of operation and profitability. Moreover, our failure to comply with applicable laws or regulations, including labor and employment laws, could result in fines, censure, suspensions of personnel or other sanctions, including revocation of the registration of our relevant subsidiaries as investment advisers or our broker-dealer affiliate as a registered broker-dealer.
Even if a sanction is imposed against us, one of our subsidiaries or our affiliates or our personnel by a regulator for a small monetary amount, the costs incurred in responding to such matters could be material. The adverse publicity related to the sanction could harm our reputation, which in turn could have a material adverse effect on our businesses, making it harder for us to raise new and successor funds and discouraging others from doing business with us or accepting investments from our products.
Heightened scrutiny of the financial services industry by regulators may materially and adversely affect our business.
The financial services industry has been the subject of heightened scrutiny by regulators around the globe. In particular, the SEC and its staff have focused more narrowly on issues relevant to alternative asset management firms, including by forming specialized units devoted to examining such firms and, in certain cases, bringing enforcement actions against the firms, their Principals and employees. In recent periods there have been a number of enforcement actions within the industry, and it is expected that the SEC will continue to pursue enforcement actions against asset managers. This increased enforcement activity has caused, and could further cause us to reevaluate certain practices and adjust our compliance control function as necessary and appropriate.
While the SEC’s recent lists of examination priorities include such items as cybersecurity compliance and controls and conducting risk-based examinations of investment advisory firms, it is generally expected that the SEC’s oversight of alternative asset managers will continue to focus substantially on concerns related to fiduciary duty transparency and investor disclosure practices (See “—”). Although the SEC has cited improvements in disclosures and industry practices in this area, it has also indicated that there is room for improvement in particular areas, including fees and expenses (and the allocation of such fees and expenses) and
Conflicts of interest may arise in our allocation of capital and
co-investment
opportunitiesco-investment
practices. To this end, many firms have received inquiries during examinations or directly from the SEC’s Division of Enforcement regarding various transparency-related topics, including the acceleration of monitoring fees, the allocation of broken-deal expenses, outside business activities of firm Principals and employees, group purchasing arrangements and general conflicts of interest disclosures. While we believe we have made appropriate and timely disclosures regarding the foregoing, the SEC staff may disagree.44
Further, the SEC has highlighted BDC board oversight and valuation practices as one of its areas of focus in investment adviser examinations and has instituted enforcement actions against advisers for misleading investors about valuation. If the SEC were to investigate and find errors in our methodologies or procedures, we and/or members of our board and management could be subject to penalties and fines, which could harm our reputation and our business, financial condition and results of operations could be materially and adversely affected.
Regulations governing the operations of our BDCs as business development companies affect their ability to raise, and the way in which they raise, additional capital.
Our BDCs have elected to be regulated as business development companies under the Investment Company Act. Many of the regulations governing business development companies restrict, among other things, leverage incurrence,
co-investments
and other transactions with other entities within Blue Owl. Certain of our products may be restricted from engaging in transactions with our BDCs and their subsidiaries. As business development companies regulated under the Investment Company Act, our BDCs may issue debt securities or preferred stock and borrow money from banks or other financial institutions, which we refer to collectively as “senior securities,” up to the maximum amount permitted by the Investment Company Act.BDCs are not generally able to issue and sell their common stock at a price below net asset value per share. BDCs may, however, issue and sell their common stock, or warrants, options or rights to acquire such common stock, at a price below the then-current net asset value of such common stock if (1) the applicable BDC’s board of directors determines that such sale is in the BDC’s best interests and the best interests of the BDC’s stockholders, and (2) the applicable BDC’s stockholders have approved a policy and practice of making such sales within the preceding
12-months.
In any such case, the price at which the securities of BDCs are to be issued and sold may not be less than a price which, in the determination of the applicable board of directors, closely approximates the market value of such securities.In addition, as business development companies that are subject to regulations under the Investment Company Act, our BDCs are currently permitted to incur indebtedness or issue senior securities only in amounts such that their asset coverage ratio equals at least 150% after each such issuance, except in the instance of ORCC II, which is required to maintain an asset coverage ratio of at least 200%. Our BDCs’ ability to pay dividends will be restricted if such BDC’s asset coverage ratio falls below the required asset coverage ratio and any amounts that it uses to service its indebtedness are not available for dividends to its common stockholders. Any of the foregoing circumstances could have a material adverse effect on our BDCs, and as a result, on our financial condition, results of operations and cash flow.
For U.S. federal income tax purposes, our BDCs have elected to be treated as regulated investment companies (“RICs”) under Subchapter M of the Code. To maintain their status as RICs, our BDCs must meet, among other things, certain source of income, asset diversification and annual distribution requirements. Each of our BDCs is required to generally distribute to its stockholders at least 90% of such BDC’s investment company taxable income to maintain its RIC status.
Changes to the method of determining the London Interbank Offered Rate (“LIBOR”) or the selection of a replacement for LIBOR may affect the value of investments held by our products and could affect our results of operations and financial results.
LIBOR, the London Interbank Offered Rate, is the basic rate of interest used in lending transactions between banks on the London interbank market and is widely used as a reference for setting the interest rate on loans globally. Our products, and in particular our BDCs, typically use LIBOR as a reference rate in term loans they extend to investments such that the interest due to us pursuant to a term loan extended to a portfolio company is calculated using LIBOR. The terms of our debt investments generally include minimum interest rate floors which are calculated based on LIBOR.
45
The United Kingdom’s Financial Conduct Authority (the “FCA”), which regulates LIBOR, announced that it will not compel panel banks to contribute to LIBOR after 2021. In addition, in March 2021, the FCA announced that LIBOR will no longer be provided for the
one-week
andtwo-month
U.S. dollar settings after December 21, 2021 and that publication of the U.S. dollar settings for the overnight,one-month,
three-month,six-month
and12-month
LIBOR rates will cease after June 30, 2023. It is unclear if at that time LIBOR will cease to exist or if new methods of calculating LIBOR will be established such that it continues to exist after 2023. The discontinuance of LIBOR, as well as uncertainty related to the establishment of any alternative reference rate, may adversely affect our cost of capital and the market for LIBOR-based securities, which could have an adverse impact on the earnings from or value of our investment portfolio.Central banks and regulators in a number of major jurisdictions (for example, United States, United Kingdom, European Union, Switzerland and Japan) have convened working groups to find, and implement the transition to, suitable replacements for interbank offered rates (“IBORs”). To identify a successor rate for U.S. dollar LIBOR, the Alternative Reference Rates Committee (“ARRC”), a U.S.-based group convened by the Federal Reserve Board and the Federal Reserve Bank of New York, was formed. The ARRC has recommended the Secured Overnight Financing Rate (“SOFR”) plus a recommended spread adjustment as its preferred alternative rate for LIBOR. SOFR is a measure of the cost of borrowing cash overnight, collateralized by U.S. Treasury securities, and is based on directly observable U.S. Treasury-backed repurchase transactions. However, given that SOFR is a secured rate backed by government securities, it will be a rate that does not take into account bank credit risk (as is the case with LIBOR). SOFR is therefore likely to be lower than LIBOR and is less likely to correlate with the funding costs of financial institutions. Although SOFR plus the recommended spread adjustment appears to be the preferred replacement rate for U.S. dollar LIBOR, and its use continues to steadily grow, at this time it is not possible to predict the effect of any such changes, any establishment of alternative reference rates or other reforms to LIBOR that may be enacted in the United States, United Kingdom or elsewhere.
As such, if LIBOR in its current form does not survive and a replacement rate is not widely agreed upon or if a replacement rate is significantly different from LIBOR, it could cause a disruption in the credit markets generally. The elimination of LIBOR or any other changes or reforms to the determination or supervision of LIBOR could have an adverse impact on the market for or value of any LIBOR-linked securities, loans, and other financial obligations or extensions of credit held by or due to our investments or on our overall financial condition or results of operations. In addition, if LIBOR ceases to exist, our products, borrowers of our products and our Partner Managers and their respective portfolio companies may need to renegotiate the credit agreements extending beyond 2023 that utilize LIBOR as a factor in determining the interest rate, in order to replace LIBOR with the new standard that is established, which may have an adverse effect on our overall financial condition or results of operations. Following the replacement of LIBOR, some or all of these credit agreements may bear interest at a lower interest rate, which, to the extent our products are lenders, could have an adverse impact on their performance, could have an adverse impact on our products’ and their portfolio companies’ results of operations. Moreover, if LIBOR ceases to exist, our products and their portfolio companies may need to renegotiate certain terms of their credit facilities. If our products and their portfolio companies are unable to do so, amounts drawn under their credit facilities may bear interest at a higher rate, which would increase the cost of their borrowings and, in turn, affect their results of operations.
Failure to comply with “pay to play” regulations implemented by the SEC and certain states, and changes to the “pay to play” regulatory regimes, could adversely affect our businesses.
Since 2010, states and other regulatory authorities have begun to require investment managers to register as lobbyists. We are registered as a lobbyist in California. These registration requirements impose significant compliance obligations on registered lobbyists and their employers, which may include annual registration fees, periodic disclosure reports and internal record keeping, and may also prohibit the payment of contingent fees.
Under applicable SEC rules, investment advisers are required to implement compliance policies designed, among other matters, to track contributions by certain of the adviser’s employees and engagements of third
46
parties that solicit government entities and to keep certain records to enable the SEC to determine compliance with the rule. In addition, there have been similar rules on a state level regarding “pay to play” practices by investment advisers. FINRA has its own set of “pay to play” regulations that are similar to the SEC’s regulations.
As we have public pension plans that are investors in our products, these rules could impose significant economic sanctions on our businesses if we or one of the other persons covered by the rules make any prohibited contribution or payment, whether or not material or with an intent to secure an investment from a public pension plan. We may also acquire other investment managers or hire additional personnel who are not subject to the same restrictions as us, but whose activity, and the activity of their Principals, prior to our ownership or employment of such person, could affect our product raising. Any failure on our part to comply with these rules could cause us to lose compensation for our advisory services or expose us to significant penalties and reputational damage.
Failure to comply with regulations regarding the prevention of money laundering or terrorism or national security could adversely affect our business.
As part of our responsibility for the prevention of money laundering under applicable laws, we may require detailed verification of a prospective investor’s identity and the source of such prospective investor’s funds. In the event of delay or failure by a prospective investor to produce any such information required for verification purposes, we may refuse to admit the investor to our products. We may fromrequest (outside of the subscription process), and our products’ limited partners will be obligated to provide to us as appropriate upon such request, additional information as from time to time may be required for us to satisfy our obligations under these and other laws that may be adopted in the future. Additionally, we may from time to time be obligated to file reports with regulatory authorities in various jurisdictions with regard to, among other things, the identity of our products’ limited partners and suspicious activities involving the interests of our products. In the event it is determined that any investor, or any direct or indirect owner of any investor, is a person identified in any of these laws as a prohibited person, or is otherwise engaged in activities of the type prohibited under these laws, we may be obligated, among other actions to be taken, to withhold distributions of any funds otherwise owing to such investor or to cause such investor’s interests to be cancelled or otherwise redeemed (without the payment of any consideration in respect of those interests).
time-to-time
The Bank Secrecy Act of 1970 and the USA PATRIOT Act require that financial institutions (a term that includes banks, broker-dealers and investment companies) establish and maintain compliance programs to guard against money laundering activities. Laws or regulations may presently or in the future require us, our products or any of our affiliates or other service providers to establish additional anti-money laundering procedures, to collect information with respect to our products’ limited partners, to share information with governmental authorities with respect to our products’ limited partners or to implement additional restrictions on the transfer of the interests. These requirements can lead to increased expenses and exposure to enforcement actions
Economic sanction laws in the U.S. and other jurisdictions may prohibit us and our affiliates from transacting with certain countries, individuals and companies, which could negatively impact our business, financial condition and operating results.
Economic sanction laws in the U.S. and other jurisdictions may restrict or prohibit us or our affiliates from transacting with certain countries, territories, individuals and entities. In the U.S., the U.S. Department of the Treasury’s Office of Foreign Assets Control (“OFAC”) administers and enforces laws, executive orders and regulations establishing U.S. economic and trade sanctions, which restrict or prohibit, among other things, direct and indirect transactions with, and the provision of services to, certain
non-U.S.
countries, territories, individuals and entities. These types of sanctions may significantly restrict or completely prohibit lending activities in certain jurisdictions, and violation of any such laws or regulations, may result in significant legal and monetary penalties, as well as reputational damage. OFAC sanctions programs change frequently, which may make it more difficult for us or our affiliates to ensure compliance. Moreover, OFAC enforcement is increasing, which may47
increase the risk that we become subject of such actual or threatened enforcement. In addition, any sanctions imposed in connection with the escalation of hostilities between Russia and Ukraine may impact portfolio companies of our funds, which may in turn impact us.
Additionally, Section 2019 of the Iran Threat Reduction and Syria Human Rights Act of 2012 (the “ITRA”) amended the Exchange Act to require companies subject to SEC reporting obligations under Section 13 of the Exchange Act to disclose in their periodic reports specified dealings or transactions involving Iran or other individuals and entities targeted by OFAC during the period covered by the relevant periodic report. In some cases, the ITRA requires companies to disclose these types of transactions even if they were permissible under U.S. law. Companies that currently may be or may have been at the time considered our affiliates, may have from time to time publicly filed and/or provided to us such disclosures. We do not independently verify or participate in the preparation of these disclosures. We and our publicly traded funds are required, either periodically or annually to separately file with the SEC a notice when such activities have been disclosed, and the SEC is required to post such notice of disclosure on its website and send the report to the President and certain U.S. Congressional committees. Disclosure of such activity, even if such activity is not subject to sanctions under applicable law, and any sanctions actually imposed on us or our affiliates as a result of these activities, could harm our reputation and have a negative impact on our business, financial condition and results of operations, and any failure to disclose any such activities as required could additionally result in fines or penalties.
We are subject to laws and regulations in the EEA, including the Alternative Investment Fund Managers Directive, which may increase our regulatory costs and burdens.
The AIFMD regulates the activities of certain private fund managers undertaking fund management activities or marketing fund interests to investors within the EEA.
To the extent any one of our products is actively marketed to investors domiciled or having their registered office in the EEA: (i) we and such fund will be subject to certain reporting, disclosure and other compliance obligations under the AIFMD, which will result in such funds incurring additional costs and expenses; (ii) we and such fund may become subject to additional regulatory or compliance obligations arising under national law in certain EEA jurisdictions, which would result in such fund incurring additional costs and expenses or may otherwise affect the management and operation of such fund; (iii) we will be required to make detailed information relating to such fund and its investments available to regulators and third parties; and (iv) the AIFMD will also restrict certain activities of such fund in relation to EEA investments, including, in some circumstances, such fund’s ability to recapitalize, refinance or potentially restructure an EEA portfolio company within the first two years of ownership, which may in turn affect operations of such fund generally. In addition, it is possible that some EEA jurisdictions will elect to restrict or prohibit the marketing of
non-EEA
funds to investors based in those jurisdictions, which may make it more difficult for our products to raise their targeted amount of commitments. We rely on a third party provider to ensure our compliance with these regulations, including required registrations, which may increase our compliance costs and risk ofnon-compliance.
In the future, it may be possible for
non-EEA
alternative investment fund managers (“AIFMs”) to market an alternative investment fund (“AIF”) within the EEA pursuant to apan-European
marketing “passport”, instead of under national private placement regimes. Access to this passport may be subject to thenon-EEA
AIFM complying with various additional requirements under the AIFMD, which may include one or more of the following: additional conduct of business and organizational requirements; rules relating to the remuneration of certain personnel; minimum regulatory capital requirements; restrictions on the use of leverage; additional disclosure and reporting requirements to both investors and EEA home state regulators; independent valuation of an AIF’s assets; and the appointment of an independent depositary. Certain EEA Member States have indicated that they will cease to operate national private placement regimes when, or shortly after, the passport becomes available, which would mean thatnon-EEA
AIFMs to whom the passport is available would be required to comply with all relevant provisions of the AIFMD in order to market to professional investors in those jurisdictions. As a result, if in the futurenon-EEA
AIFMs may only market in certain EEA jurisdictions pursuant48
to a passport, we may not seek to market interests in our products in those jurisdictions, which may lead to a reduction in the overall amount of capital invested in our products. Alternatively, if we sought to comply with the requirements to use the passport, this could have adverse effects including, amongst other things, increasing the regulatory burden and costs of operating and managing certain of our products and their investments, and potentially requiring changes to compensation structures for key personnel, thereby affecting our ability to recruit and retain these personnel.
Certain of the funds or accounts we advise or manage are subject to the fiduciary responsibility and prohibited transaction provisions of ERISA and Section 4975 of the Code, and our businesses could be adversely affected if certain of our other funds or accounts fail to satisfy an exception under the “plan assets” regulation under ERISA.
A number of investors in our products are subject to the fiduciary and prohibited transaction provisions of Title I of ERISA and the parallel provisions of the Internal Revenue Code; however, the substantial majority of our products rely on the “insignificant participation” exception under the “plan assets” regulation under ERISA. We are not, therefore subject to the requirements of ERISA (or the parallel provision of the Internal Revenue Code) with respect to the management of those funds. However, if those funds fail to satisfy that exception for any reason and if no other exception is available, that failure could materially interfere with our activities in relation to those funds or expose us to risks related to our failure to comply with the applicable requirements. For example, the governing documents of a fund generally impose certain obligations on the general partner or manager of the fund to cause the assets of the fund to not be treated as “plan assets” and a breach of that obligation could create liability for us. Further, if the assets of a fund become plan assets (whether because of our breach, a change in law or otherwise), the application of ERISA-related requirements on our product may prevent us from operating the fund as intended and may cause the fund to breach its obligations with Partner Managers or other investments, which would create significant liabilities for our products and could significantly impact the fund’s ability to make any further investments. Further, we have formed a small number of holding vehicles to facilitate
co-investments
alongside our products by ERISA investors, the assets of which holding vehicles constitute “plan assets” and with respect to which we serve as a fiduciary. While we may be required to satisfy applicable fiduciary standards and avoid the prohibited transaction provisions of ERISA with respect to such holding vehicles and their assets, in each case, our authority with respect to the management and control of those vehicles is limited by contract with the relevant fund investor. Accordingly, we do not anticipate any liabilities with respect to our serving as a fiduciary with respect to such vehicles.Risks Related to Our Products
The historical returns attributable to our products should not be considered as indicative of the future results of our products or of our future results or of any returns expected on an investment in our Class A Shares.
The historical performance of our products is relevant to us primarily insofar as it is indicative of performance income we have earned in the past and may earn in the future and our reputation and ability to raise new funds. The historical and potential returns of the funds we advise are not, however, directly linked to returns on shares of our Class A Shares. Therefore, holders of our Class A Shares should not conclude that positive performance of the funds we advise will necessarily result in positive returns on a return on investment in our Class A Shares. However, poor performance of our products we advise would likely cause a decline in our revenues and would therefore likely have a negative effect on our operating results, returns on our Class A Shares and a negative impact on our ability to raise new funds. Also, there is no assurance that projections in respect of our products or unrealized valuations will be realized.
Moreover, the historical returns of our products should not be considered indicative of the future returns of these or from any future funds we may raise, in part because:
| • | market conditions during previous periods may have been significantly more favorable for generating positive performance than the market conditions we may experience in the future; |
49
| • | our products’ rates of returns, which are calculated on the basis of net asset value of the funds’ investments, reflect unrealized gains, which may never be realized; |
| • | our products’ returns have previously benefited from investment opportunities and general market conditions that may not recur, including the availability of debt capital on attractive terms and the availability of distressed debt opportunities, and we may not be able to achieve the same returns or profitable investment opportunities or deploy capital as quickly; |
| • | the historical returns that we present in this prospectus derive largely from the performance of our earlier funds, whereas future fund returns will depend increasingly on the performance of our newer funds or funds not yet formed, which may have little or no realized investment track record; |
| • | our products’ historical investments were made over a long period of time and over the course of various market and macroeconomic cycles, and the circumstances under which our current or future funds may make future investments may differ significantly from those conditions prevailing in the past; |
| • | the attractive returns of certain of our products have been driven by the rapid return on invested capital, which has not occurred with respect to all of our products and we believe is less likely to occur in the future; |
| • | in recent years, there has been increased competition for investment opportunities resulting from the increased amount of capital invested in alternative funds and high liquidity in debt markets, and the increased competition for investments may reduce our returns in the future; and |
| • | our newly established funds may generate lower returns during the period that they take to deploy their capital. |
The future internal rate of return for any current or future fund may vary considerably from the historical internal rate of return generated by any particular fund, or for our products as a whole. Future returns will also be affected by the risks described elsewhere in this proxy statement, including risks of the industries and businesses in which a particular fund invests.
Valuation methodologies for certain assets of our products can be subject to significant subjectivity.
Many of the investments in our products are illiquid and thus have no readily ascertainable market prices. We value these investments based on our estimate, or an independent third party’s estimate, of their value as of the date of determination. The determination of fair value, and thus the amount of unrealized appreciation or depreciation our products may recognize in any reporting period, is to a degree subjective. Our products generally value their investments quarterly at fair value, as determined in good faith by our products’ respective boards or a valuation committee, as applicable, based on, among other things, the input of third party valuation firms and taking into account the nature and realizable value of any collateral, the portfolio company’s ability to make payments and its earnings, the markets in which the portfolio company operates, comparison to publicly traded companies, discounted cash flow, current market interest rates and other relevant factors. Because such valuations, and particularly valuations of private securities, private companies and privately owned real estate, are inherently uncertain, the valuations may fluctuate significantly over short periods of time due to changes in current market conditions. A fund’s net asset value could be adversely affected if the determinations regarding the fair value of the investments were materially higher than the values that are ultimately realized upon the disposal of such investments. These valuations could, in turn, affect the management fees or performance income that our business receives.
The use of leverage by our products may materially increase the returns of such funds but may also result in significant losses or a total loss of capital.
Our products, particularly our Direct Lending and Real Estate products, use leverage as part of their respective investment programs and in certain products regularly borrow a substantial amount of their capital.
50
The use of leverage poses a significant degree of risk and enhances the possibility of a significant loss in the value of the investment portfolio. A fund may borrow money from time to time to purchase or carry securities or may enter into derivative transactions with counterparties that have embedded leverage. The use of leverage by our products increases the volatility of investments by magnifying the potential for gain or loss on invested equity capital. If the value of a fund’s assets were to decrease, leverage would cause net asset value to decline more sharply than it otherwise would if the fund had not employed leverage. Similarly, any decrease in the fund’s income would cause net income to decline more sharply than it would have if it had not borrowed and employed leverage. Such a decline could negatively affect the fund’s ability to service its debt, which could have a material adverse effect on our products, and as a result, on our financial condition, results of operations and cash flow.
Our private funds often rely on obtaining credit facilities secured principally by the undrawn capital commitments of their investors. These credit lines are an important part of managing the cash flow of the funds, including facilitating a fund’s acquisition or funding of investments, enhancing the regularity of cash distributions to investors and facilitating the payment of management fees to us. The inability to secure or maintain these lines of credit would have an adverse impact on our products and their returns and on us, including increasing administrative costs associated with managing a fund.
Our real estate funds are subject to the risks inherent in the ownership and operation of real estate and the construction and development of real estate.
Investments in our real estate funds will be subject to the risks inherent in the ownership and operation of real estate and real estate-related businesses and assets. These risks include the following:
| • | general and local economic conditions; |
| • | changes in supply of and demand for competing properties in an area (as a result, for example, of overbuilding); |
| • | the financial resources of tenants; |
| • | changes in building, environmental and other laws; |
| • | energy and supply shortages; |
| • | various uninsured or uninsurable risks; |
| • | natural disasters; |
| • | changes in government regulations (such as rent control and tax laws); |
| • | changes in interest rates; |
| • | the reduced availability of mortgage funds which may render the sale or refinancing of properties difficult or impracticable; |
| • | negative developments in the economy that depress travel activity; |
| • | environmental liabilities; |
| • | contingent liabilities on disposition of assets; |
| • | unexpected cost overruns in connection with development projects; and |
| • | terrorist attacks, war (including tensions between Russia and Ukraine) and other factors that are beyond our control. |
Additionally, our funds’ properties are generally self-managed by the tenant or managed by a third party, which makes us dependent upon such third parties and subjects us to risks associated with the actions of such third parties. Any of these factors may cause the value of the investments in our real estate funds to decline, which may have a material impact on our results of operations.
51
Risks Related to our Structure and Governance
Blue Owl has elected to be treated as, a “controlled company” within the meaning of the NYSE listing standards and, as a result, our stockholders may not have certain corporate governance protections that are available to stockholders of companies that are not controlled companies.
So long as more than 50% of the voting power for the election of directors of Blue Owl is held by an individual, a group or another company, Blue Owl will qualify as a “controlled company” under the NYSE listing requirements. The Principals control a majority of the voting power of our outstanding capital stock. As a result, Blue Owl qualifies as, and has elected to be treated as, a “controlled company” under the NYSE listing standards and will not be subject to the requirements that would otherwise require us to have: (i) a majority of “independent directors,” as defined under the listing standards of the NYSE; (ii) a nominating committee comprised solely of independent directors; (iii) compensation of our executive officers determined by a majority of the independent directors or a compensation committee comprised solely of independent directors; and (iv) director nominees selected, or recommended for the Board’s selection, either by a majority of the independent directors or a nominating committee comprised solely of independent directors.
The Principals may have their interest in Blue Owl diluted due to future equity issuances or their own actions in selling Class A Shares, in each case, which could result in a loss of the “controlled company” exemption under the NYSE listing rules. Blue Owl would then be required to comply with those provisions of the NYSE listing requirements.
The multi-class structure of Blue Owl common stock has the effect of concentrating voting power with the Principals, which limits an investor’s ability to influence the outcome of important transactions, including a change in control.
Entities controlled by the Principals hold all of the issued and outstanding Class B and Class D Shares. Accordingly, until such time as the Principals own less than 25% of their aggregate ownership as of immediately after the Closing, the Principals will hold 80% of the voting power of Blue Owl’s capital stock on a fully-diluted basis and will be able to control matters submitted to our stockholders for approval, including the election of directors, amendments of our organizational documents and any merger, consolidation, sale of all or substantially all of our assets or other major corporate transactions. The Principals may have interests that differ from our stockholders and may vote in a way with which you disagree and which may be adverse to your interests. This concentrated control may have the effect of delaying, preventing or deterring a change in control of Blue Owl, could deprive our stockholders of an opportunity to receive a premium for their capital stock as part of a sale of Blue Owl, and might ultimately affect the market price of Class A Shares.
Potential conflicts of interest may arise among the holders of Class B and Class D Shares and the holders of our Class A and Class C Shares.
The Principals (and certain former employees of Dyal Capital) hold all of the Class B and Class D Shares. As a result, conflicts of interest may arise among the Principals, on the one hand, and us and our holders of our Class A and Class C Shares, on the other hand. The Principals have the ability to influence our business and affairs through their ownership of the high vote shares of our common stock, their general ability to appoint our board of directors, and provisions under the Investor Rights Agreement and our certificate of incorporation requiring their approval for certain corporate actions (in addition to approval by our board of directors). If the holders of our Class A and Class C Shares are dissatisfied with the performance of our board of directors, they have no ability to remove any of our directors, with or without cause.
Further, through their ability to elect our board of directors, the Principals have the ability to indirectly influence the determination of the amount and timing of our investments and dispositions, cash expenditures, allocation of expenses, indebtedness, issuances of additional partnership interests, tax liabilities and amounts of reserves, each of which can affect the amount of cash that is available for distribution to holders of Common Units and our Class A Shares.
52
In addition, conflicts may arise relating to the selection, structuring and disposition of investments and other transactions, declaring dividends and other distributions and other matters due to the fact that the Principals hold their Common Units directly or through pass-through entities that are not subject to corporate income taxation.
Delaware law, our certificate of incorporation and our bylaws contain certain provisions, including anti-takeover provisions, that limit the ability of stockholders to take certain actions and could delay or discourage takeover attempts that stockholders may consider favorable.
Our certificate of incorporation and the DGCL contain provisions that could have the effect of rendering more difficult, delaying, or preventing an acquisition deemed undesirable by the Board and therefore depress the trading price of Blue Owl’s Class A Shares. These provisions could also make it difficult for stockholders to take certain actions, including electing directors who are not nominated by the current members of the Board or taking other corporate actions, including effecting changes in management. Among other things, our certificate of incorporation and bylaws include provisions regarding:
| • | a classified board of directors with three-year staggered terms, which could delay the ability of stockholders to change the membership of a majority of the Board; |
| • | the ability of the Board to issue preferred stock, including “blank check” preferred stock and to determine the price and other terms of those shares, including preferences and voting rights, without stockholder approval, which could be used to significantly dilute the ownership of a hostile acquirer; |
| • | the limitation of the liability of, and the indemnification of, our directors and officers; |
| • | the right of the Board to elect a director to fill a vacancy created by the expansion of the Board or the resignation, death or removal of a director, which prevents stockholders from being able to fill vacancies on the Board; |
| • | the requirement that directors may only be removed from the Board for cause; |
| • | the inability of stockholders to act by written consent following the Sunset Date; |
| • | the requirement that a special meeting of stockholders may be called only by the Board, the chairman of the Board of directors or Blue Owl’s chief executive officer, which could delay the ability of stockholders to force consideration of a proposal or to take action, including the removal of directors; |
| • | controlling the procedures for the conduct and scheduling of the Board and stockholder meetings; |
| • | the ability of the Board of directors to amend the bylaws, which may allow the Board to take additional actions to prevent an unsolicited takeover and inhibit the ability of an acquirer to amend the bylaws to facilitate an unsolicited takeover attempt; and |
| • | advance notice procedures with which stockholders must comply to nominate candidates to the Board or to propose matters to be acted upon at a stockholders’ meeting, which could preclude stockholders from bringing matters before annual or special meetings of stockholders and delay changes in the composition of the Board and also may discourage or deter a potential acquirer from conducting a solicitation of proxies to elect the acquirer’s own slate of directors or otherwise attempting to obtain control of the Company. |
These provisions, alone or together, could delay or prevent hostile takeovers and changes in control or changes in the Board or management.
In addition, as a Delaware corporation, the Registrant is generally subject to provisions of Delaware law, including the DGCL, although we have elected not to be governed by Section 203 of the DGCL.
Any provision of our certificate of incorporation, our bylaws or Delaware law that has the effect of delaying or preventing a change in control could limit the opportunity for stockholders to receive a premium for their shares of our capital stock and could also affect the price that some investors are willing to pay for our common stock.
53
In addition, the provisions of the Investor Rights Agreement, as described below, provide the stockholders party thereto with certain board representation and other consent rights that could also have the effect of delaying or preventing a change in control.
Our certificate of incorporation designates the Court of Chancery of the State of Delaware as the sole and exclusive forum for certain types of actions and proceedings that may be initiated by our stockholders, which could limit our stockholders’ ability to obtain a favorable judicial forum for disputes with us or our directors, officers or other employees.
Our certificate of incorporation provides that, unless we consent in writing to the selection of an alternative forum, (a) any derivative action or proceeding brought on behalf of us, (b) any action asserting a claim of breach of a fiduciary duty owed by any current or former director, officer, other employee, agent or stockholder of Blue Owl to Blue Owl or our stockholders, or any claim for aiding and abetting such alleged breach, (c) any action asserting a claim against us or any of our current or former directors, officers, other employees, agents or stockholders (i) arising pursuant to any provision of the DGCL, our certificate of incorporation (as it may be amended or restated) or our bylaws or (ii) as to which the DGCL confers jurisdiction on the Delaware Court of Chancery or (d) any action asserting a claim against us or any of our current or former directors, officers, other employees, agents or stockholders governed by the internal affairs doctrine of the law of the State of Delaware shall, as to any action in the foregoing clauses (a) through (b), to the fullest extent permitted by law, be solely and exclusively brought in the Delaware Court of Chancery; provided, however, that the foregoing shall not apply to any claim (1) as to which the Delaware Court of Chancery determines that there is an indispensable party not subject to the jurisdiction of the Delaware Court of Chancery (and the indispensable party does not consent to the personal jurisdiction of the Court of Chancery within ten days following such determination), (2) which is vested in the exclusive jurisdiction of a court or forum other than the Delaware Court of Chancery, or (3) arising under federal securities laws, including the Securities Act as to which the federal district courts of the United States of America shall, to the fullest extent permitted by law, be the sole and exclusive forum. Notwithstanding the foregoing, the provisions of Article XIII of our certificate of incorporation does not apply to suits brought to enforce any liability or duty created by the Exchange Act, or any other claim for which the federal district courts of the United States of America shall be the sole and exclusive forum.
Thisprovision may limit a stockholder’s ability to bring a claim in a judicial forum that it finds favorable for disputes with us or our or its directors, officers, stockholders, agents or other employees, which may discourage such lawsuits. Alternatively, if a court were to find this provision of our certificate of incorporation inapplicable or unenforceable with respect to one or more of the specified types of actions or proceedings, we may incur additional costs associated with resolving such matters in other jurisdictions, which could materially and adversely affect our business, financial condition and results of operations and result in a diversion of the time and resources of management and our board of directors.
choice-of-forum
The Registrant is a holding company and its only material source of cash is its indirect interest (held through Blue Owl GP) in the Blue Owl Operating Partnerships, and it is accordingly dependent upon distributions made by its subsidiaries to pay taxes, cause Blue Owl GP to make payments under the Tax Receivable Agreement, and pay dividends.
The Registrant is a holding company with no material assets other than its indirect ownership of the GP Units through Blue Owl GP and certain deferred tax assets that arose in connection with the purchase of Common Units with proceeds from the Business Combination. As a result, the Registrant has no independent means of generating revenue or cash flow. The Registrant’s ability to pay taxes, cause Blue Owl GP to make payments under the Tax Receivable Agreement, and pay dividends will depend on the financial results and cash flows of the Blue Owl Operating Partnerships and the distributions it receives (directly or indirectly) from the Blue Owl Operating Partnerships. Deterioration in the financial condition, earnings or cash flow of the Blue Owl Operating Partnerships for any reason could limit or impair the Blue Owl Operating Partnerships’ ability to pay such distributions. Additionally, to the extent that the Registrant or Blue Owl GP needs funds and the Blue Owl
54
Operating Partnerships are restricted from making such distributions under applicable law or regulation or under the terms of any financing arrangements, or the Blue Owl Operating Partnerships are otherwise unable to provide such funds, it could materially adversely affect Blue Owl’s liquidity and financial condition.
Subject to the discussion herein, the Blue Owl Operating Partnerships will continue to be treated as partnerships for U.S. federal income tax purposes and, as such, generally will not be subject to any entity-level U.S. federal income tax. Instead, taxable income will be allocated to holders of Common Units and GP Units. Accordingly, Blue Owl GP will be required to pay income taxes on its allocable share of any net taxable income of the Blue Owl Operating Partnerships. Under the terms of the Blue Owl Limited Partnership Agreements, the Blue Owl Operating Partnerships are obligated to make tax distributions to holders of the Common Units and GP Units calculated at certain assumed tax rates. In addition to tax expenses, Blue Owl will also incur expenses related to its operations, including Blue Owl GP’s payment obligations under the Tax Receivable Agreement, which could be significant, and some of which will be reimbursed by the Blue Owl Operating Partnerships (excluding payment obligations under the Tax Receivable Agreement). Blue Owl intends to cause Blue Owl GP to cause the Blue Owl Operating Partnerships to make ordinary distributions and tax distributions to holders of the Common Units and GP units on a pro rata basis in amounts sufficient to cover all applicable taxes, relevant operating expenses, payments by Blue Owl GP under the Tax Receivable Agreement and dividends, if any, declared by Blue Owl. However, as discussed above, the Blue Owl Operating Partnerships’ ability to make such distributions may be subject to various limitations and restrictions including, but not limited to, retention of amounts necessary to satisfy the obligations of the Blue Owl Operating Partnerships and restrictions on distributions that would violate any applicable restrictions contained in the Blue Owl Operating Partnerships’ debt agreements, or any applicable law, or that would have the effect of rendering the Blue Owl Operating Partnerships insolvent. To the extent that Blue Owl GP is unable to make payments under the Tax Receivable Agreement for any reason, such payments will be deferred and will accrue interest until paid; provided, however, that nonpayment for a specified period may constitute a breach of a material obligation under the Tax Receivable Agreement and therefore accelerate payments under the Tax Receivable Agreement, which could be substantial.
Additionally, although the Blue Owl Operating Partnerships generally will not be subject to any entity-level U.S. federal income tax, they may be liable under recent U.S. federal tax legislation for adjustments to prior year tax returns, absent an election to the contrary. In the event the Blue Owl Operating Partnerships’ calculations of taxable income are incorrect, the Blue Owl Operating Partnerships and/or their partners, including the Registrant or Blue Owl GP, in later years may be subject to material liabilities pursuant to this legislation and its related guidance.
If either of the Blue Owl Operating Partnerships were treated as a corporation for U.S. federal income tax or state tax purposes, then the amount available for distribution by such Blue Owl Operating Partnerships could be substantially reduced and the value of the Registrant’s shares could be adversely affected.
An entity that would otherwise be classified as a partnership for U.S. federal income tax purposes (such as either of the Blue Owl Operating Partnerships) may nonetheless be treated as, and taxable as, a corporation if it is a “publicly traded partnership” unless an exception to such treatment applies. An entity that would otherwise be classified as a partnership for U.S. federal income tax purposes will be treated as a “publicly traded partnership” if interests in such entity are traded on an established securities market or interests in such entity are readily tradable on a secondary market or the substantial equivalent thereof. If either of the Blue Owl Operating Partnerships were determined to be treated as a “publicly traded partnership” (and taxable as a corporation) for U.S. federal income tax purposes, such Blue Owl Operating Partnership would be taxable on its income at the U.S. federal income tax rates applicable to corporations and distributions by such Blue Owl Operating Partnership to its partners (including Blue Owl GP) could be taxable as dividends to such partners to the extent of the earnings and profits of such Blue Owl Operating Partnership. In addition, we would no longer have the benefit of increases in the tax basis of the Blue Owl Operating Partnership’s assets as a result of exchanges of Common Units. Pursuant to the Exchange Agreement, certain Blue Owl equity holders may, from time to time, subject to the terms of the Exchange Agreement, exchange their interests in the Blue Owl Operating Partnerships
55
and have such interests redeemed by Blue Owl Operating Partnerships for cash or the Registrant’s stock. While such exchanges could be treated as trading in the interests of the Blue Owl Operating Partnerships for purposes of testing “publicly traded partnership” status, the Exchange Agreement contains restrictions on redemptions and exchanges of interests in the Blue Owl Operating Partnerships that are intended to prevent either of the Blue Owl Operating Partnerships from being treated as a “publicly traded partnership” for U.S. federal income tax purposes. Such restrictions are designed to comply with certain safe harbors provided for under applicable U.S. federal income tax law. Blue Owl GP may also impose additional restrictions on exchanges that the Registrant or Blue Owl GP determines to be necessary or advisable so that neither of the Blue Owl Operating Partnerships is treated as a “publicly traded partnership” for U.S. federal income tax purposes. Accordingly, while such position is not free from doubt, each of the Blue Owl Operating Partnerships is expected to be operated such that it is not treated as a “publicly traded partnership” taxable as a corporation for U.S. federal income tax purposes and we intend to take the position that neither of the Blue Owl Operating Partnerships is so treated as a result of exchanges of its interests pursuant to the Exchange Agreement.
Pursuant to the Tax Receivable Agreement, Blue Owl GP will be required to make payments to certain equity holders for certain tax benefits the Registrant and Blue Owl GP may claim and those payments may be substantial.
Certain equity holders may in the future exchange their Common Units, together with the cancellation of an equal number of Class C Shares or Class D Shares, for Class A Shares or Class B Shares, respectively, or cash pursuant to the Blue Owl Operating Partnership Agreements and the Exchange Agreement, subject to certain conditions and transfer restrictions as set forth therein and in the Investor Rights Agreement. Additionally, Blue Owl GP may acquire from certain former Owl Rock equity holders corporations formed by such former Owl Rock equity holders to hold partnership interests in Owl Rock. Such transactions are expected to result in increases in the Registrant’s (and Blue Owl GP’s) allocable share of the tax basis of the tangible and intangible assets of the Blue Owl Operating Partnerships. These increases in tax basis may increase (for income tax purposes) depreciation and amortization deductions and therefore reduce the amount of income or franchise tax that the Registrant or Blue Owl GP would otherwise be required to pay in the future had such sales and exchanges never occurred.
In connection with the Business Combination, Blue Owl GP entered into the Tax Receivable Agreement, which generally provides for the payment by it of 85% of certain tax benefits, if any, that Blue Owl GP realizes (or in certain cases is deemed to realize) as a result of these increases in tax basis and certain other tax attributes of Blue Owl GP, the corporations acquired from certain former Owl Rock equity holders in the transaction, and tax benefits related to entering into the Tax Receivable Agreement. Those payments are the obligation of Blue Owl (including Blue Owl GP) and not of Blue Owl Operating Partnerships. The actual increase in Blue Owl GP’s allocable share of the Blue Owl Operating Partnerships’ tax basis in their assets, as well as the amount and timing of any payments under the Tax Receivable Agreement, will vary depending upon a number of factors, including the timing of exchanges, the market price of the Class A Shares at the time of the exchange, the extent to which such exchanges are taxable and the amount and timing of the recognition of the Registrant’s (and Blue Owl GP’s) income. While many of the factors that will determine the amount of payments that Blue Owl GP will make under the Tax Receivable Agreement are outside of its control, Blue Owl GP expects that the payments it will make under the Tax Receivable Agreement will be substantial and could have a material adverse effect on Blue Owl’s financial condition. Any payments made by Blue Owl GP under the Tax Receivable Agreement will generally reduce the amount of overall cash flow that might have otherwise been available to the Registrant and Blue Owl GP. To the extent that Blue Owl GP is unable to make timely payments under the Tax Receivable Agreement for any reason, the unpaid amounts will be deferred and will accrue interest until paid; however, nonpayment for a specified period may constitute a breach of a material obligation under the Tax Receivable Agreement and therefore accelerate payments due under the Tax Receivable Agreement, as further described below. Furthermore, Blue Owl GP’s future obligation to make payments under the Tax Receivable Agreement could make Blue Owl a less attractive target for an acquisition, particularly in the case of an acquirer that cannot
56
use some or all of the tax benefits that may be realized or deemed realized under the Tax Receivable Agreement. See the section entitled “Certain Relationships and Related Party Transactions—Tax Receivable Agreement.”
In certain cases, payments under the Tax Receivable Agreement may exceed the actual tax benefits
he Registrant or Blue Owl GP realizes or be accelerated.
Payments under the Tax Receivable Agreement will be based on the tax reporting positions that the Registrant or Blue Owl GP determines, and the IRS or another taxing authority may challenge all or any part of the tax basis increases, as well as other tax positions that the Registrant or Blue Owl GP takes, and a court may sustain such a challenge. In the event that any tax benefits initially claimed by the Registrant or Blue Owl GP are disallowed, the former Owl Rock and Dyal Capital equityholders will not be required to reimburse the Registrant or Blue Owl GP for any excess payments that may previously have been made under the Tax Receivable Agreement, for example, due to adjustments resulting from examinations by taxing authorities. Rather, excess payments made to such holders will be netted against any future cash payments otherwise required to be made by Blue Owl GP under the Tax Receivable Agreement, if any, after the determination of such excess. However, a challenge to any tax benefits initially claimed by the Registrant or Blue Owl GP may not arise for a number of years following the initial time of such payment or, even if challenged early, such excess cash payment may be greater than the amount of future cash payments that Blue Owl GP might otherwise be required to make under the terms of the Tax Receivable Agreement and, as a result, there might not be future cash payments against which to net. As a result, in certain circumstances Blue Owl GP could make payments under the Tax Receivable Agreement in excess of Blue Owl’s or Blue Owl GP’s actual income or franchise tax savings, which could materially impair Blue Owl’s financial condition.
Moreover, the Tax Receivable Agreement provides that, in certain events, including a change of control, breach of a material obligation under the Tax Receivable Agreement, or Blue Owl GP’s exercise of early termination rights, Blue Owl GP’s obligations under the Tax Receivable Agreement will accelerate and Blue Owl GP will be required to make a
lump-sum
cash payment to the former Owl Rock and Dyal Capital equityholders and other applicable parties to the Tax Receivable Agreement equal to the present value of all forecasted future payments that would have otherwise been made under the Tax Receivable Agreement, whichlump-sum
payment would be based on certain assumptions, including those relating to Blue Owl GP’s future taxable income. Thelump-sum
payment could be substantial and could exceed the actual tax benefits that the Registrant or Blue Owl GP realizes subsequent to such payment because such payment would be calculated assuming, among other things, that the Registrant and Blue Owl GP would have certain tax benefits available to it and that the Registrant and Blue Owl GP would be able to use the potential tax benefits in future years.There may be a material negative effect on the Registrant’s liquidity if the payments required to be made by Blue Owl GP under the Tax Receivable Agreement exceed the actual income or franchise tax savings that the Registrant (or Blue Owl GP) realizes. Furthermore, Blue Owl GP’s obligations to make payments under the Tax Receivable Agreement could also have the effect of delaying, deferring or preventing certain mergers, asset sales, other forms of business combinations or other changes of control.
Adverse developments in U.S. and
non-U.S.
tax laws could have a material and adverse effect on our business, financial condition and results of operations. Our effective tax rate and the amount of “tax distributions” that the Blue Owl Operating Partnerships are required to make to equity holders could also change materially as a result of various evolving factors, including changes in income tax law resulting from the most recent U.S. presidential and congressional elections or changes in the scope of our operations.The Registrant is subject to U.S. federal income taxation, and the Registrant and the Blue Owl Operating Partnerships and their subsidiaries are subject to income taxation by certain states and municipalities and certain foreign jurisdictions in which they operate. In addition, the Blue Owl Operating Partnerships are required to make tax distributions to their partners pursuant to the Blue Owl Limited Partnership Agreements. In determining our tax liability and obligation to make tax distributions, we must monitor changes to the applicable tax laws and
57
related regulations. While our existing operations have been implemented in a manner we believe is in compliance with current prevailing laws, one or more taxing U.S. or
non-U.S.
jurisdictions could seek to impose incremental, retroactive, or new taxes on us. In addition, the current U.S. presidential administration has called for changes to fiscal and tax policies, which may include comprehensive tax reform. These and other tax laws and related regulation changes, to the extent adopted, may increase tax uncertainty and/or our effective tax rate, result in higher compliance cost and result in a corresponding increase in the amount of payments under the Tax Receivable Agreement and/or a corresponding increase in the tax distributions that the Blue Owl Operating Partnerships will be required to make. In addition, there may be changes in law related to the Base Erosion and Profit Shifting Project of the Organization for EconomicCo-Operation
and Development (“OECD”), the European Commission’s state aid investigations and other initiatives. Such changes may include (but are not limited to) the taxation of operating income, investment income, dividends received or (in the specific context of withholding tax) dividends paid, or the taxation of partnerships and other pass-through entities. Any adverse developments in these and other U.S. or foreign laws or regulations, including legislative changes, judicial holdings or administrative interpretations, could have a material and adverse effect on our business, financial condition and results of operations. Finally, changes in the scope of our operations, including expansion to new geographies, could increase the amount of taxes to which we are subject, and could increase our effective tax rate, which could similarly adversely affect our financial condition and results of operations.Reports published by analysts, including projections in those reports that differ from our actual results, could adversely affect the price and trading volume of our Class A Shares.
Securities research analysts may establish and publish their own periodic projections for Blue Owl from time to time. Those projections may vary widely and may not accurately predict the results we actually achieve. Our share price may decline if our actual results do not match the projections of these securities research analysts. Similarly, if one or more of the analysts who write reports on us downgrades our stock or publishes inaccurate or unfavorable research about our business, our share price could decline. In addition, securities research analysts may compare Blue Owl to companies that are not appropriately comparable, which could lead to lower than expected valuations. If one or more analysts cease coverage of us or fail to publish reports on us regularly, our share price or trading volume could decline.
The Blue Owl Operating Partnerships may directly or indirectly make distributions of cash to us substantially in excess of the amounts we use to make distributions to our stockholders and pay our expenses (including our taxes and payments by Blue Owl GP under the Tax Receivable Agreement). To the extent we do not distribute such excess cash as dividends to our stockholders, the direct or indirect holders of Common Units would benefit from any value attributable to such cash as a result of their ownership of our stock upon an exchange of their Common Units.
Blue Owl GP receives a pro rata portion of any distributions made by the Blue Owl Operating Partnerships. Any cash received from such distributions is first be used to satisfy any tax liability and then used to make any payments required to be made by Blue Owl GP under the Tax Receivable Agreement. Subject to having available cash and subject to limitations imposed by applicable law and contractual restrictions, the Blue Owl Operating Group Agreements require the Blue Owl Operating Partnerships to make certain distributions to holders of Common Units and to Blue Owl GP pro rata to facilitate the payment of taxes with respect to the income of the Blue Owl Operating Partnerships that is allocated to them. To the extent that the tax distributions we directly or indirectly receive exceed the amounts we actually require to pay taxes, Tax Receivable Agreement payments and other expenses (which is likely to be the case given that the assumed tax rate for such distributions will generally exceed our effective tax rate), we will not be required to distribute such excess cash. Our board of directors may, in its sole discretion, choose to use such excess cash for certain purposes, including to make distributions to the holders of our stock. Unless and until our board of directors chooses, in its sole discretion, to declare a distribution, we will have no obligation to distribute such cash (or other available cash other than any declared dividend) to our stockholders.
58
No adjustments to the exchange ratio of Common Units for shares of our common stock will be made as a result of either (i) any cash distribution by us or (ii) any cash that we retain and do not distribute to our stockholders. To the extent we do not distribute such cash as dividends and instead, for example, hold such cash balances or use such cash for certain other purposes, this may result in shares of our stock increasing in value relative to the Common Units. The holders of Common Units may benefit from any value attributable to such cash balances if they acquire shares of our stock in an exchange of Common Units.
Risks Related to Our Class A Shares
An active trading market for our Class A Shares may not be sustained, which may make it difficult to sell the Class A Shares you purchase.
Our Class A Shares are currently listed on the NYSE under the symbol “OWL.” However, we cannot assure you that an active trading market for our Class A Shares will be sustained. Accordingly, we cannot assure you of the likelihood that an active trading market for our Class A Shares will be maintained, the liquidity of any trading market, your ability to sell your Class A Shares when desired or the prices that you may obtain for your shares.
The market price and trading volume of our Class A Shares may be volatile, which could result in rapid and substantial losses for holders of our Class A Shares.
The market price of our Class A Shares is likely to be highly volatile and may be subject to wide fluctuations in response to a variety of factors. In addition, the volume of trading in our Class A Shares may fluctuate and cause significant price variations to occur. If the market price of our Class A Shares declines significantly, holders of our Class A Shares may be unable to resell their shares at or above their purchase price, if at all. Some of the factors that could negatively affect the price of our Class A Shares or result in fluctuations in the price or trading volume of shares of our Class A Shares include:
| • | the impact of COVID-19 pandemic on Blue Owl’s business; |
| • | the inability to recognize the anticipated benefits of the Business Combination, which may be affected by, among other things, competition, Blue Owl’s inability to grow and manage growth profitably, and retain its key employees; |
| • | adverse market reaction to any indebtedness we may incur or securities we may issue in the future; |
| • | changes in market valuations of similar companies; |
| • | speculation in the press or investment community; |
| • | a lack of liquidity in the trading of our Class A Shares; |
| • | changes in applicable laws or regulations; |
| • | risks relating to the uncertainty of Blue Owl’s projected financial information; and |
| • | risks related to the organic and inorganic growth of Blue Owl’s business and the timing of expected business milestones. |
In addition, the stock markets have experienced extreme price and volume fluctuations that have affected and continue to affect the market prices of equity securities of many companies. These fluctuations have often been unrelated or disproportionate to the operating performance of those companies. Broad market and industry factors, as well as general economic, political, regulatory and market conditions, may negatively affect the market price of our Class A Shares, regardless of Blue Owl’s actual operating performance.
Volatility in our share price could subject us to securities class action litigation.
In the past, securities class action litigation has often been brought against a company following a decline in the market price of its securities. If we face such litigation, it could result in substantial costs and a diversion of management’s attention and resources, which could harm its business.
59
If securities or industry analysts do not publish research or reports about us, or publish negative reports, our stock price and trading volume could decline.
The trading market for our Class A Shares will depend, in part, on the research and reports that securities or industry analysts publish about us. We do not have any control over these analysts. If our financial performance fails to meet analyst estimates or one or more of the analysts who cover our performance downgrade our common stock or change their opinion, our stock price would likely decline. If one or more of these analysts cease coverage of us or fail to regularly publish reports on our performance, it could lose visibility in the financial markets, which could cause our stock price or trading volume to decline.
Future offerings of debt or offerings or issuances of equity securities by us may adversely affect the market price of our Class A Shares or otherwise dilute all other stockholders.
In the future, we may attempt to obtain financing or to further increase our capital resources by issuing additional Class A Shares or offering debt or other equity securities, including commercial paper, medium-term notes, senior or subordinated notes, debt securities convertible into equity or preferred stock. We also expect to grant equity awards to employees, directors, and consultants under stock incentive plans. Future acquisitions could require substantial additional capital in excess of cash from operations. We would expect to obtain the capital required for acquisitions through a combination of additional issuances of equity, corporate indebtedness and/or cash from operations.
Issuing additional Class A Shares or other equity securities or securities convertible into equity may dilute the economic and voting rights of our existing stockholders or reduce the market price of our Class A Shares or both. Upon liquidation, holders of such debt securities and preferred stock, if issued, and lenders with respect to other borrowings would receive a distribution of our available assets prior to the holders of our Class A Shares. Debt securities convertible into equity could be subject to adjustments in the conversion ratio pursuant to which certain events may increase the number of equity securities issuable upon conversion. Preferred stock, if issued, could have a preference with respect to liquidating distributions or a preference with respect to dividend payments that could limit our ability to pay dividends to the holders of our Class A Shares. Our decision to issue securities in any future offering will depend on market conditions and other factors beyond our control, which may adversely affect the amount, timing and nature of our future offerings.
60
USE OF PROCEEDS
All of the Class A Shares offered by the Selling Holders pursuant to this prospectus will be sold by Selling Holders for their respective accounts. We will not receive any of the proceeds from these sales.
The Selling Holders will pay any underwriting discounts and commissions and expenses incurred by the Selling Holders for brokerage, accounting, tax or legal services or any other expenses incurred by the Selling Holders in disposing of the securities. We will bear the costs, fees and expenses incurred in effecting the registration of the securities covered by this prospectus, including all registration and filing fees, NYSE listing fees and fees and expenses of our counsel and our independent registered public accounting firm.
61
DIVIDEND POLICY
It shall be the policy of the Company to pay to holders of classes of outstanding Class A and Class B Shares a quarterly dividend representing approximately 85% of the Company’s share of Distributable Earnings for the most recently completed fiscal quarter, subject to approval of the board of directors and adjustment by amounts determined by the board of directors to be necessary or appropriate to provide for the conduct of the Company’s business, to make appropriate investments in the Company’s business and funds, to comply with applicable law, any of the Company’s debt instruments or other agreements, or to provide for future cash requirements such
as tax-related payments,
operating reserves, clawback obligations and dividends to stockholders for any ensuing quarter.We intend to continue to pay to Class A Stockholders (and Class B Stockholders in the future to the extent any Class B Shares are outstanding) a quarterly dividend representing approximately 85% of Distributable Earnings following the end of each quarter. Blue Owl Capital Inc.’s share of Distributable Earnings, subject to adjustment as determined by our Board to be necessary or appropriate to provide for the conduct of our business, to make appropriate investments in our business and products, to comply with applicable law, any of our debt instruments or other agreements, or to provide for future cash requirements such as
tax-related
payments, operating reserves, clawback obligations and dividends to stockholders for any ensuing quarter. All of the foregoing is subject to the qualification that the declaration and payment of any dividends are at the sole discretion of our Board, and our Board may change our dividend policy at any time, including, without limitation, to reduce or eliminate dividends entirely.The Blue Owl Operating Partnerships Tax Distributions to the partners of such partnerships, including to Blue Owl GP, if we determine that the taxable income of the relevant partnership will give rise to taxable income for its partners. Generally, Tax Distributions will be computed based on our estimate of the taxable income of the relevant partnership allocable to a partner multiplied by an assumed tax rate equal to the highest effective marginal combined U.S. federal, New York State and New York City income tax rates prescribed for an individual or corporate resident in New York City (taking into account certain assumptions set forth in the relevant partnership agreements). Tax Distributions will be made only to the extent distributions from the Blue Owl Operating Partnerships for the relevant year were otherwise insufficient to cover the estimated assumed tax liabilities.
Holders of our Class A and B Shares may not always receive distributions or may receive lower distributions on a per share basis at a time when we, indirectly through Blue Owl GP, and holders of our Common Units are receiving distributions on their interests, as distributions to the Registrant and Blue Owl GP may be used to settle tax and TRA liabilities, if any, and other obligations.
Dividends are expected to be treated as qualified dividends under current law to the extent of the Company’s current and accumulated earnings and profits, with any excess dividends treated as a return of capital to the extent of a stockholder’s basis, and any remaining excess generally treated as gain realized on the sale or other disposition of stock.
62
BUSINESS OF BLUE OWL
“We”, “us” and “our” generally refer to Blue Owl Capital Inc., a Delaware corporation (together with its subsidiaries, “Blue Owl”) unless the context otherwise requires.
Our Company
Blue Owl is a global alternative asset manager with $94.5 billion in AUM as of December 31, 2021. Anchored by a strong permanent capital base, the firm deploys private capital across Direct Lending, GP Capital Solutions and Real Estate strategies on behalf of institutional and private wealth clients. Blue Owl’s flexible, consultative approach helps position the firm as a partner of choice for businesses seeking capital solutions to support their sustained growth. The firm’s management team is comprised of seasoned investment professionals with more than 25 years of experience building alternative investment businesses. Blue Owl employs over 350 people across 9 offices globally.
Blue Owl was formed through the combination of Owl Rock and Dyal Capital in May 2021, at which time these businesses merged with and into Altimar Acquisition Corporation (“Altimar”), a blank check, special purpose acquisition company.
The combination of Owl Rock and Dyal Capital creates a platform primed to continue servicing these markets. In December 2021, we acquired Oak Street, which expanded our firm’s offerings to include real estate-focused products.
Our breadth of offerings and permanent capital base enable us to offer a differentiated, holistic platform of capital solutions to middle market companies, large alternative asset managers and corporate real estate owners and tenants. We provide these solutions through our permanent capital vehicles, as well as long-dated private funds, that we believe provide our business with a high degree of earnings stability and predictability. Our permanent capital vehicles are products that do not have ordinary redemption provisions or a requirement to exit investments after a prescribed period of time to return invested capital to investors, except as required by applicable law or pursuant to redemption requests that can only be made after significant
lock-up
periods. For the quarter ended December 31, 2021, approximately 98% of our management fees were earned from permanent capital vehicles.Our global, high-caliber, investor base includes a diversified mix of institutional investors, including prominent public and private pension funds, endowments, foundations, family offices, private banks, high net worth individuals, asset managers and insurance companies, as well as retail clients, accessed through many well-known wealth management firms. We have continued to grow our investor base and presence in the growing private markets and alternative asset management sector by emphasizing our disciplined investment approach, client service, and portfolio performance.
While we currently offer Direct Lending, GP Capital Solutions and Real Estate products across three divisions (Owl Rock, Dyal Capital and Oak Street), our management takes a
one-firm
approach when making operating decisions and determining how to allocate resources. As a result, we currently operate as a single reportable segment. Management regularly reviews our revenues by product line and our expenses by type at the total firm level (e.g., compensation and benefits; general, administrative and other expenses), and therefore we have presented details of our operating results throughout this prospectus consistent with how management reviews our results.Our revenues are generated primarily from the investment advisory and administrative services agreements we have with our products. See Note 2 to our Financial Statements for a detailed description of how we earn our revenues and the significant impact that our FPAUM has on the amount of revenues we earn each period. Management’s Discussion and Analysis of Financial Condition and Results of Operations (“MD&A”) presents
63
additional information on our revenues and operating results, as well as historical AUM and performance information for certain of our products; such information should be read in conjunction with this description of our business.
Our Products
We have three major product lines: Direct Lending, GP Capital Solutions and Real Estate. We believe our products, while distinct, are complementary to each other and together enable us to provide a differentiated platform of varied capital solutions. All of our products employ a disciplined investment philosophy with a focus on long-term investment horizons and are managed by tenured leadership and investment professionals with significant experience in their respective strategies.
Our products are generally structured as BDCs, REITs and private investments funds that aggregate capital from investors. As the investment manager of our products, we invest that capital with the goal of generating attractive, risk-based returns for the investors in our products. In many of our products, we may use leverage to increase the size of the investments our products are able to make. As further explained in Note 2 to our Financial Statements, we generally earn management fees on the amount of FPAUM that we manage; therefore, the growth and success of our product offerings is paramount to our success as an alternative asset manager.
Our products create a robust foundation for our holistic platform. We believe the success and growth in our businesses since inception has been driven by a singular, dedicated focus on providing capital solutions and the differentiating competitive features of our platform.
Blue Owl AUM: $94.5 billion FPAUM: $61.4 billion | ||||
Direct Lending Products AUM: $39.2 billion FPAUM: $32.0 billion | GP Capital Solutions Products AUM: $39.9 billion FPAUM: $21.2 billion | Real Estate Products AUM: $15.4 billion FPAUM: $8.2 billion | ||
Diversified Lending Commenced 2016 AUM: $25.8 billion FPAUM: $21.6 billion | GP Minority Equity Commenced 2010 AUM: $38.7 billion FPAUM: $20.4 billion | Net Lease Commenced 2009 AUM: $15.4 billion FPAUM: $8.2 billion | ||
Technology Lending Commenced 2018 AUM: $7.9 billion FPAUM: $6.9 billion | GP Debt Financing Commenced 2019 AUM: $1.0 billion FPAUM: $0.7 billion | |||
First Lien Lending Commenced 2018 AUM: $3.5 billion FPAUM: $2.3 billion | Professional Sports Minority Investments Commenced 2021 AUM: $0.2 billion FPAUM: $0.2 billion | |||
Opportunistic Lending Commenced 2020 AUM: $2.0 billion FPAUM: $1.2 billion | ||||
64
Direct Lending
Our Direct Lending products offer private credit products to middle-market companies seeking capital solutions. We believe our breadth of offerings establishes us as the lending partner of choice for private-equity sponsored companies, as well as other predominately
non-cyclical,
recession-resistant businesses. Since the launch of our flagship institutional product, ORCC, we have continued to prudently expand our offerings, focusing on adjacent strategies that are both additive and complementary to our existing product base. Our Direct Lending products are offered through a mix of BDCs, long-dated private funds and other vehicles across the following investment strategies:| • | Diversified Lending: |
| • | Technology Lending: |
| • | First Lien Lending: |
| • | Opportunistic Lending: (iv) debtor-in-possession |
GP Capital Solutions
Our GP Capital Solutions products position us as a leading capital solutions provider to large private capital managers. We primarily focus on acquiring equity stakes in, or providing debt financing to large, multi-product
65
private equity and private credit firms, which we may refer to as “GPs.” Our GP Capital Solutions division also houses our Business Services Platform, which provides strategic support to our Partner Managers. Our GP Capital Solutions products are offered primarily through permanent capital vehicles across the following investment strategies:
| • | GP Minority Equity Investments: closed-end, permanent capital funds. A fundamental component of the fundraising efforts for our investment programs is the ability to identify and executeco-investment opportunities for our investors. We may offer, fromtime-to-time co-investment opportunities in certain fund investments, generally with no management or incentive-based fee. |
| • | GP Debt Financing: |
| • | Professional Sports Minority Investments: NBA-focused. |
Real Estate
Our real estate products primarily focus on structuring sale-leaseback transactions, which includes triple net leases.
| • | Net Lease: net-leased, long-term to investment grade and creditworthy tenants. Oak Street’s Net Lease real estate strategies focus on acquiring single tenant properties, across industrial, essential retail and mission critical office sectors. By combining our proprietary origination platform, enhanced lease structures and a disciplined investment criteria, we seek to provide investors with predictable current income, and potential for appreciation, while focusing on limiting downside risk. |
Our History
Blue Owl’s history is predicated on the key milestones of both Owl Rock and Dyal Capital. Owl Rock was founded in 2016 by Doug Ostrover, Marc Lipschultz and Craig Packer to address the evolving need for direct lending solutions by middle-market companies. Dyal Capital was founded in 2010 by Michael Rees to fill the need for flexible capital solutions for private capital managers. In December 2021, we acquired the Oak Street business, which allowed us to further diversify the products we offer our investors. Since its founding in 2009 by
66
Marc Zahr, Oak Street has established itself as a leader in private equity real estate, offering flexible and unique capital solutions to a variety of corporations and other organizations.
The combination of these businesses creates a platform primed to continue servicing these markets. Blue Owl’s robust and diversified platform offerings will continue to serve as a response to the following sector dynamics:
| • | shifting allocations by retail institutional investors. |
| • | rotation onto alternatives given the search for yield and reliability of returns. |
| • | rising need for private debt driven by sponsor demand. |
| • | evolving landscape of the private debt market. |
| • | de-leveraging of the global banking system. |
| • | increasing need for flexible capital solutions by private capital managers. |
Across our businesses, our presence in the market combined with our constant dialogue with financial sponsors, companies and our investors, has allowed us to identify attractive opportunities in adjacent subsectors over time.
Since inception, Owl Rock, Dyal Capital and Oak Street have launched multiple new strategies and products, exclusively in areas where we believed we could leverage our competitive advantage and expertise, and where we believe we had identified critical mass of lending, capital and real estate solutions opportunities as well as heightened investor interest. We have focused on executing on key adjacencies that are natural extensions of existing core strategies in order to capitalize on the growing dislocations in the market and rising investor demand.
Our Competitive Strengths
| • | High proportion of permanent capital. closed-end, permanent (or potentially permanent) funds with no mandatory redemption and potentially unlimited duration once listed. Substantially all of the AUM in our GP Capital Solutions and Real Estate products are also structured as permanent capital vehicles. The high proportion of permanent capital in our AUM provides a stable base and allows for our AUM to grow more predictably without having reductions in our asset levels due to ordinary redemptions. Our permanent capital base also lends stability and flexibility to our portfolio companies and Partner Managers, providing us the opportunity to grow alongside these companies and positioning us to be a preferred source of capital and the incumbent lender forfollow-ons and other capital solutions to high-performing companies. As such, we are able to be a compelling partner for these firms as they seek capital to support their long-term vision and business development goals. The stability of our AUM base enables us to focus on generating attractive returns by investing in assets with a long-term focus across different periods in the market cycle. |
| • | Significant embedded growth in current AUM with built-in mechanisms for fee revenue increases. |
67
| • | Stable earnings model with attractive margin profile. |
| • | Extensive, long-term relationships with a robust and vast network of alternative asset managers. |
| • | Increasing benefits of scale. |
Within Direct Lending, there is significant competition for loans below $50 million, but there are much fewer lenders capable of providing solutions over $100 million. Our differentiated approach and scaled direct lending platform allow us to capitalize on opportunities across the sizing spectrum—from loans below $50 million to loans over $1.0 billion. Our platform’s scale has demonstrated the ability to originate larger deals, while also providing diversification in our portfolios. We believe our scale enables us to broaden our deal funnel and provides us access to more investment opportunities than many other direct lenders. We have significant available capital that allows us to provide scaled financing solutions, commit to full capital structures and support capital needs of borrowers. We believe being a total solutions provider also grants us a broader view of market opportunities, which allows us to continue operating as a market leader.
Within GP Capital Solutions, we have also established ourselves as a market leader, with a long track record, greatest amount of aggregate capital raised and largest number of publicly-announced deals. The target size of our current fund being raised, Fund V, is materially larger than the approximately $5 billion fund sizes of our main competitors. Our large base of stable capital not only enables participation in investments across the sizing spectrum, but also creates a competitive advantage by positioning us as a highly qualified buyer for minority stakes in large, established GPs. We believe that we also gain access to proprietary deal flow as a result of the market’s confidence in our ability to execute on large investments expeditiously. We believe our strong reputation in the market combined with our scale will continue to provide us with unique access to the most attractive sectors of the alternative asset management universe.
68
Within Real Estate, we have a targeted origination strategy that benefits from Oak Street’s strong network and allows us to be competitive with other net lease peers. Oak Street proactively builds and maintains strong relationships with large investment grade-rated and creditworthy companies whose businesses offer essential goods or services and which we believe are generally resistant to
e-commerce
and economic downside risks, and structures mutually beneficial transactions with long lease durations, and in many cases, favorable pricing. We intend to leverage Oak Street’s corporate partnerships to both source unique investment opportunities unavailable to other market participants and negotiate attractive lease terms. We believe our strong origination capabilities, conservative underwriting criteria and strong existing tenant relationships will allow our Real Estate products to purchase properties in the future at attractive terms and pricing, providing significant long-term opportunities for growth and scale.| • | Diverse, global and growing high-quality investor base. high-net worth investors. As we continue to grow, we expect to retain our existing clients through our breadth of offerings. As of December 31, 2021, approximately 36% of our institutional investors are invested in more than one product, with many increasing their commitment to their initial strategy and additionally committing additional capital across our other strategies. We believe our diligent management of investors’ capital, combined with our strong performance and increasingly diversified product offerings has helped retain and attract investors which has furthered our growth in FPAUM and facilitated further expansion of our strategies. We also believe the global nature of our investor base enables significant cross-selling opportunities between our products and strategies. We are committed to providing our clients with a superior level of service. We believe our client-focused nature, rooted in our culture of transparency will help us continue to retain and attract high quality investors to our platform. |
| • | Industry-leading management team with proven track record. best-in-class |
| • | Alignment of interests with stakeholders. |
Our Growth Strategy
We aim to continue applying our core principles and values that have guided us since inception in order to expand our business through the following strategies:
| • | Organically grow our core business. |
69
successor products in existing strategies, will continue to play a key role in our growth profile. We also expect to enhance our AUM growth by expanding our current investor relationships and also continuing to attract new investors. |
| • | Expand our product offering. |
| • | Leverage complementary global distribution networks. |
| • | Enhance our distribution channels. |
| • | Deepen and expand strong strategic relationships with key institutional investors. |
70
organically and through product and geographic expansion, we will continue to pursue the addition of incremental key strategic partners. |
| • | Opportunistically pursue accretive acquisitions. |
Competition
The investment management industry is intensely competitive, and we expect it to remain so. We compete globally and on a regional, industry and asset basis. We face competition both in the pursuit of investors for our products and investment opportunities. Generally, our competition varies across product lines, geographies and financial markets. We compete for investors based on a variety of factors, including investment performance, investor perception of investment managers’ drive, focus and alignment of interest, quality of service provided to and duration of relationship with investors, breath of our product offering, business reputation and the level of fees and expenses charged for services. We compete for investment opportunities at our funds based on a variety of factors, including breadth of market coverage and relationships, access to capital, transaction execution skills, the range of products and services offered, innovation and price, and we expect that competition will continue to increase.
Competition is also intense for the attraction and retention of qualified employees. Our ability to continue to compete effectively in our businesses will depend upon our ability to attract new employees and retain and motivate our existing employees. See “—”
Risk Factors—Risks Related to Our Business and Operations
Our future growth depends on our ability to attract, retain and develop human capital in a highly competitive talent market.
Direct Lending
Our competition as an asset manager and financing source to middle market companies consists primarily of other asset managers who focus principally on credit funds, including BDCs, and other credit products. We also compete with public and private funds, BDCs, commercial and investment banks, commercial finance companies and, to the extent they provide an alternative form of financing, private equity and hedge funds. Many of our competitors are substantially larger and may have more financial, technical, and marketing resources than we do. Many of these competitors have similar investment objectives to us, which may create additional competition for investment opportunities. Some of these competitors may also have a lower cost of capital and access to funding sources that are not available to us, which may create competitive disadvantages for us with respect to investment opportunities. In addition, some of our competitors may have higher risk tolerances or different risk assessments, which could allow them to consider a wider variety of investments and establish more relationships than us. Further, many of our competitors are not subject to the regulatory restrictions that the Investment Company Act imposes on us as a business development company, or to the distribution and other requirements we must satisfy to qualify for RIC tax treatment. Lastly, institutional and individual investors are allocating increasing amounts of capital to alternative investment strategies. Several large institutional investors have announced a desire to consolidate their investments in a more limited number of managers. We expect that this will cause competition in our industry to intensify and could lead to a reduction in the size and duration of pricing inefficiencies that many of our products seek to exploit. See “”
Risk Factors—Risks Relating to Our Businesses and Operations—The investment management business is intensely competitive.
GP Capital Solutions
Our GP Capital Solutions products currently have limited direct competition from organizations dedicated to acquiring stakes in large institutionalized private capital managers. More recently, a limited number of asset
71
managers have begun acquired minority stakes in certain private capital managers. Such institutions may compete with us for similar investments in the future. We believe, however, that this limited number of competitors is likely to persist, as conflicts of interest and regulatory restrictions make purchasing minority stakes in private capital managers challenging for financial institutions and private equity firms.
With respect to our GP Debt Financing strategy, many banks provide revolving lines of credit to private equity managers, but these credit lines are typically short duration, amortize and require blanket personal guarantees. A small number of firms, provide structured or preferred equity to private capital managers, but these investments are also structurally very different from our products’ long-term loans. We believe that this limited amount of competition is likely to persist, as conflicts of interest, regulatory restrictions, capital constraints and other considerations make lending to private capital managers challenging for financial institutions, insurance companies and other private market firms.
Our current GP Capital Solutions strategies compete with among others, a number of private equity funds, specialized funds, hedge funds, corporate buyers, traditional asset managers, real estate companies, commercial banks, investment banks, other investment managers and other financial institutions, including the owners of certain of our stockholders, as well as domestic and international pension funds and sovereign wealth funds, and we expect that competition will continue to increase. See “” We compete globally and on a regional, industry and asset basis.
Risk Factors—Risks Related to Our Business and Operations—The investment management business is intensely competitive.
Real Estate
Oak Street has remained the only net let lease private equity manager dedicated exclusively to transacting with investment grade rated and other creditworthy counterparties. The more stable and predictable nature of the net lease sector has brought additional competition into the space in recent years. Historically, such competition has primarily come from net lease REIT’s (publicly traded and
non-traded),
other private equity real estate funds, and high net worth buyers.Competitors in the publicly traded net lease sector generally exhibit less stringent criteria than us with respect to pricing and lease durations, and their portfolios are comprised substantially with
non-investment
grade credits, shorter average lease terms, and meaningful near-term lease rollover. Additionally, many net lease peers focus on acquiring retail properties with an average deal size of less $10 million, whereas our Real Estate products’ transactions are typically $100 million and greater in size.Competition from other private equity funds has grown, as many have either shifted their current real estate focus to building net lease teams or acquired existing net lease strategies. Despite this increased activity, competition with our Real Estate products on the deal level has remained relatively low, as those strategies concentrate their efforts in the
non-investment
grade space, prefer to develop properties themselves, and to deploy capital in sectors that are outside of our traditional focus of: industrial assets, mission critical office properties and essential retail. High net worth buyers have been formidable competitors and active acquirers of retail assets under $8 million; they tend to be less price sensitive and there are usually wide pools of potential buyers for these assets. As the monetization of real estate through sale-leasebacks continues to gain traction as a capital allocation tool for companies, we expect the net lease sector to grow even larger, and that will continue to attract more competition into the space.Human Capital
As of December 31, 2021, we had approximately 350 full-time employees, including over 100 investment professionals across nine offices globally.
As an alternative asset manager, our people are the key to the success of our business. We rely significantly on our talented team, leveraging a wide variety of investment, management, business and other skills and
72
expertise, to create value for stockholders and investors in our products. We aim to build a team that is driven and embraces an inclusive culture where our team members are engaged and work collaboratively across the organization.
Compensation and Benefits
We design our compensation programs to motivate and retain employees and align their interests with those of our stockholders. In particular, annual bonuses for our executives and other senior employees involves a combination of cash and deferred equity awards in the form of Incentive Units and RSUs (as defined in Note 1 to the Financial Statements). The proportion of compensation that is deferred and at risk of forfeiture generally increases as an employee’s level of compensation rises. Employees at higher total compensation levels are generally targeted to receive a greater percentage of their total compensation payable in Incentive Units and RSUs. To further align their interests with those of investors in our products, our employees have the opportunity to make investments in or alongside our products. We also provide our employees robust health and other wellness offerings, as well as a variety of quality of life benefits, includingtalent in our industry. Our senior management periodically reviews the effectiveness and competitiveness of our compensation program.
time-off
and family planning resources. We believe our approach to compensation and benefits are consistent with companies in the alternative asset management industry and enables us to attract and retainbest-in-class
Diversity, Equity and Inclusion
Blue Owl is committed to fostering, cultivating, and preserving a culture of diversity, equity and inclusion. We prize diversity in our team and seek to create an inclusive, merit-based environment that is supportive of people from all backgrounds.
| • | Embracing our differences. |
| • | Strategic priorities. |
| • | Corporate practices. |
| • | Leadership. |
MUTUAL RESPECT | EXCELLENCE | CONSTRUCTIVE DIALOGUE | ONE TEAM | |||
BLUE OWL’S CORE VALUES | ||||||
Regulatory and Compliance Matters
Our business, as well as the financial services industry, generally are subject to extensive regulation, including periodic examinations, by governmental agencies and self-regulatory organizations or exchanges in the U.S. and foreign jurisdictions in which we operate relating to, among other things, antitrust laws, anti-money laundering laws, anti-bribery laws relating to foreign officials, tax laws and privacy laws with respect to client and other information, and some of our funds invest in businesses that operate in highly regulated industries.
73
Each of the regulatory bodies with jurisdiction over us has regulatory powers dealing with many aspects of financial services, including the authority to grant, and in specific circumstances to cancel, permissions to carry on particular activities. Any failure to comply with these rules and regulations could limit our ability to carry on particular activities or expose us to liability and/or reputational damage. Additional legislation, increasing global regulatory oversight of fundraising activities, changes in rules promulgated by self-regulatory organizations or exchanges or changes in the interpretation or enforcement of existing laws and rules, either in the United States or elsewhere, may directly affect our mode of operation and profitability. See “”
Risk Factors—Risks Related to Our Business and Operations—Difficult market and political conditions may reduce the value or hamper the performance of the investments made by our products or impair the ability of our products to raise or deploy capital, each of which could materially reduce our revenue, earnings and cash flow and adversely affect our financial prospects and condition.
Rigorous legal and compliance analysis of our businesses and investments made by our products is important to our culture. We strive to maintain a culture of compliance through the use of policies and procedures such as oversight compliance, codes of ethics, compliance systems, communication of compliance guidance and employee education and training. All employees must annually certify their understanding of and compliance with key global policies, procedures and code of ethics. We have a compliance group that monitors our compliance with the regulatory requirements to which we are subject and manages our compliance policies and procedures. Our Chief Compliance Officer supervises our compliance group, which is responsible for monitoring all regulatory and compliance matters that affect our activities. Our compliance policies and procedures address a variety of regulatory and compliance risks such as the handling of material
non-public
information, personal securities trading, valuation of investments, document retention, potential conflicts of interest and the allocation of investment opportunities.Many jurisdictions in which we operate have laws and regulations relating to data privacy, cybersecurity and protection of personal information, including the General Data Protection Regulation, which expands data protection rules for individuals within the European Union (the “EU”) and for personal data exported outside the EU, and the California Consumer Privacy Act, which creates new rights and obligations related to personal data of residents (and households) in California. Any determination of a failure to comply with any such laws or regulations could result in fines or sanctions or both, as well as reputational harm. As these laws and regulations or the enforcement of the same become more stringent, or if new laws or regulations or enacted, our financial performance or plans for growth may be adversely impacted.
SEC Regulations
We provide investment advisory services through several entities that are registered as investment advisers with the SEC pursuant to the Advisers Act. Our BDCs elect to be regulated under the Investment Company Act and the Exchange Act and, in certain cases, the Securities Act. As compared to other, more disclosure-oriented U.S. federal securities laws, the Advisers Act and the Investment Company Act, together with the SEC’s regulations and interpretations thereunder, are highly restrictive regulatory statutes. The SEC is authorized to institute proceedings and impose sanctions for violations of the Advisers Act and the Investment Company Act, ranging from fines and censures to termination of an adviser’s registration.
Under the Advisers Act, an investment adviser (whether or not registered under the Advisers Act) has fiduciary duties to its clients. The SEC has interpreted these duties to impose standards, requirements and limitations on, among other things, trading for proprietary, personal and client accounts; allocations of investment opportunities among clients; and conflicts of interest.
The Advisers Act also imposes specific restrictions on an investment adviser’s ability to engage in principal and agency cross transactions. Our registered investment advisers are subject to many additional requirements that cover, among other things, disclosure of information about our business to clients; maintenance of written policies and procedures; maintenance of extensive books and records; restrictions on the types of fees we may
74
charge, including realized performance income or carried interest; solicitation arrangements; maintaining effective compliance program; custody of client assets; client privacy; advertising; and proxy voting. The SEC has authority to inspect any registered investment adviser and typically inspects a registered investment adviser periodically to determine whether the adviser is conducting its activities in compliance with (i) applicable laws, (ii) disclosures made to clients and (iii) adequate systems, policies and procedures to ensure compliance.
A significant portion of our revenues are derived from our advisory services to our BDCs. The Investment Company Act imposes significant requirements and limitations on BDCs, including with respect to their capital structure, investments and transactions. While we exercise broad discretion over themanagement of our BDCs, each of our BDCs is also subject to oversight and management by a board of directors, a majority of whom are not “interested persons” as defined under the Investment Company Act. The responsibilities of each board include, among other things, approving our advisory contract with our BDC; approving certain service providers; determining the valuation and the method for valuing assets; and monitoring transactions involving affiliates and; approving certain
day-to-day
co-investment
transactions. The advisory contracts with each of our BDCs may be terminated by the stockholders or directors of such BDC on not more than 60 days’ notice, and are subject to annual renewal by each respective BDC’s board of directors after an initialtwo-year
term.Generally, affiliates of our BDCs are prohibited under the Investment Company Act from knowingly participating in certain transactions with their affiliated BDCs without prior approval of the BDC’s board of directors who are not interested persons and, in some cases, prior approval by the SEC. The SEC has interpreted the prohibition on transactions with affiliates to prohibit “joint transactions” among entities that share a common investment adviser.
Certain of our products are permitted to
co-invest
with other products managed by us as a result of exemptive relief granted by the SEC, so long as such transactions are negotiated in a manner consistent with our BDCs’ investment objectives, positions, policies, strategies and restrictions as well as regulatory requirements and other pertinent factors, provided that certain directors of any of our participating BDCs make certain determinations. Our investment allocation policy incorporates the conditions of the exemptive relief. As a result of the exemptive relief, there could be significant overlap in the investment portfolios of our BDCs and other of our products that could avail themselves of the exemptive relief. Additionally, we have been granted exemptive relief to permit certain of our BDCs to offer multiple classes of shares of common stock and to impose asset-based distribution fees and early withdrawal fees.Other Regulators; Self-Regulatory Organizations
In addition to the SEC regulatory oversight we are subject to under the Investment Company Act and the Advisers Act, there are a number of other regulatory bodies that have or could potentially have jurisdiction to regulate our business activities.
Blue Owl Securities is registered as a broker-dealer with the SEC, which maintains registrations in many states, and is a member of FINRA. As a broker-dealer, Blue Owl Securities is subject to regulation and oversight by the SEC and state securities regulators. In addition, FINRA, a self-regulatory organization that is subject to oversight by the SEC, promulgates and enforces rules governing the conduct of, and examines the activities of, its member firms. Due to the limited authority granted to Blue Owl Securities in its capacity as a broker-dealer, it is not required to comply with certain regulations covering trade practices among broker-dealers and the use and safekeeping of customers’ funds and securities. As a registered broker-dealer and member of a self-regulatory organization, Blue Owl Securities is, however, subject to the SEC’s uniform net capital rule. Rule
15c3-1
of the Exchange Act, which specifies the minimum level of net capital a broker-dealer must maintain and also requires that a significant part of a broker-dealer’s assets be kept in relatively liquid form.Blue Owl Capital UK Limited (“Blue Owl UK”) is an entity organized and operating in the United Kingdom whose employees assist in the marketing and distribution of Blue Owl funds in Europe, the Middle East, and
75
Africa. Blue Owl Capital HK Limited (“Blue Owl HK”) is an entity organized and operating in Hong Kong whose employees together with the employees of Blue Owl Capital Singapore Pte. Ltd. (“Blue Owl Singapore”), an entity organized and operating in Singapore assist in the marketing and distribution of Blue Owl funds in the Asia-Pacific region. Blue Owl HK is registered with the Hong Kong Securities & Futures Commission. Blue Owl Capital Canada ULC (“Blue Owl Canada”) is an entity organized and operating in Canada whose employees assist in the marketing and distribution of Blue Owl funds in Canada.
Legal Proceedings
We may from time to time be involved in litigation and claims incidental to the conduct of our business. Our businesses are also subject to extensive regulation, which may result in regulatory proceedings against us. SeeWe are not currently subject to any pending legal (including judicial, regulatory, administrative or arbitration) proceedings that we expect to have a material impact on our consolidated and combined financial statements. However, given the inherent unpredictability of these types of proceedings and the potentially large and/or indeterminate amounts that could be sought, an adverse outcome in certain matters could have a material effect on Blue Owl’s financial results in any particular period. See Note 11 to our Financial Statements for additional information.
“Risk Factors.”
76
BLUE OWL’S MANAGEMENT’S DISCUSSION AND ANALYSIS OF FINANCIAL CONDITION
AND RESULTS OF OPERATIONS
In this section, unless the context otherwise requires, references to “Blue Owl,” “we,” “us,” “our,” and the “Company” are intended to mean the business and operations of Blue Owl Capital Inc. and its consolidated subsidiaries. The following discussion analyzes the financial condition and results of operations of the Company. Additional terms used by the Company are defined in the Glossary and throughout Blue Owl’s Management’s Discussion and Analysis in this prospectus.
The following discussion and analysis contains forward-looking statements and involves numerous risks and uncertainties, including, but not limited to those described in the section entitled “
”
and should be read in conjunction with the consolidated and combined financial statements and the related notes included in this prospectus.
Overview
2021 was a pivotal year for Blue Owl. We completed our transition to a publicly traded company, a successful combination of Owl Rock and Dyal Capital, record level of AUM and FPAUM, over $1.0 billion raised in the debt markets and closed out the year with the closing of the Oak Street Acquisition.
2021 GAAP and
Non-GAAP
ResultsYear Ended December 31, | ||||||||
(dollars in thousands) | 2021 | 2020 | ||||||
Net Loss Attributable to Blue Owl Capital Inc. (After May 19, 2021) / Owl Rock (Prior to May 19, 2021) | $ | (376,171 | ) | $ | (77,831 | ) | ||
Fee-Related Earnings(1) | $ | 451,684 | $ | 36,408 | ||||
Distributable Earnings (1) | $ | 427,322 | $ | 12,219 | ||||
| (1) | For the specific components and calculations of these Non-GAAP measures, as well as a reconciliation of these measures to the most comparable measure in accordance with GAAP, see“—Non-GAAP Analysis”“—Non-GAAP Reconciliations.” |
Net Loss Attributable to Blue Owl Capital Inc. (“Net Loss”) during the year ended December 31, 2021 was impacted by significantandfor a detailed discussion of the underlying drivers of our results, including the accretive impacts of the Dyal Acquisition.
non-cash
equity-based compensation expenses recognized in connection with the Business Combination. Our results for periods prior to the Business Combination Date do not include the results of Dyal Capital; therefore, prior period amounts are not comparable to current period. Additionally, since the Oak Street Acquisition closed on December 29, 2021, their results were not material to our 2021 results. We expect Oak Street, which will be part of our single reportable segment, to be accretive to our results in 2022. Please see “—GAAP Results of Operations Analysis”
“—Non-GAAP
Analysis”77
Assets Under Management
Blue Owl | ||||
| AUM: $94.5 billion | ||||
| FPAUM: $61.4 billion | ||||
Direct Lending Products AUM: $39.2 billion FPAUM: $32.0 billion | GP Capital Solutions Products AUM: $39.9 billion FPAUM: $21.2 billion | Real Estate Products AUM: $15.4 billion FPAUM: $8.2 billion | ||
Diversified Lending Commenced 2016 AUM: $25.8 billion FPAUM: $21.6 billion | GP Minority Equity Commenced 2010 AUM: $38.7 billion FPAUM: $20.4 billion | Net Lease Commenced 2009 AUM: $15.4 billion FPAUM: $8.2 billion | ||
Technology Lending Commenced 2018 AUM: $7.9 billion FPAUM: $6.9 billion | GP Debt Financing Commenced 2019 AUM: $1.0 billion FPAUM: $0.7 billion | |||
First Lien Lending Commenced 2018 AUM: $3.5 billion FPAUM: $2.3 billion | Professional Sports Minority Investments Commenced 2021 AUM: $0.2 billion FPAUM: $0.2 billion | |||
Opportunistic Lending Commenced 2020 AUM: $2.0 billion FPAUM: $1.2 billion | ||||
We finished the year with $94.5 billion of AUM, which included $61.4 billion of FPAUM. During the fourth quarter of 2021, approximately 98% of our management fees were earned on AUM that we refer to as permanent capital. As of December 31, 2021, we have approximately $11.0 billion in AUM not yet paying fees, providing approximately $140.0 million of annualized management fees once deployed or upon the expiration of certain fee holidays. Seefor additional information, including important information on how we define these metrics.
“—Assets Under Management”
Oak Street Acquisition
On December 29, 2021, we closed the Oak Street Acquisition, expanding our product offering into real estate. Please see Note 3 to our Financial Statements for additional information.
Business Environment
Our business is impacted by conditions in the financial markets and economic conditions in the U.S., and to a lesser extent, elsewhere in the world.
In the alternative asset management industry, 2021 was a year of robust levels of fundraising and investment activity across the industry. Allocations to alternative strategies have continued to rise across institutional and retail investors, driven by a need for yield and demand for differentiated, uncorrelated returns. Alternative asset managers were able to deploy their dry powder across a wide spectrum of investment opportunities, driving record M&A activity for the year. We have benefited from these ongoing secular tailwinds, providing the capital that managers require to finance acquisitions in their funds through our Direct Lending products, and the capital that managers need to expand and diversify their platforms through our GP Capital Solutions products.
78
Higher than expected inflation has impacted expectations for the pace of rate hikes, driving market volatility and adjusting investors’ views on earnings growth for many public companies. We anticipate a net positive effect on our business from a rising rate environment. We expect our Direct Lending products to benefit from rising rates, as investor demand would increase for senior secured floating rate assets, and over time, the effect of rising rates would be positive for the net interest income of our Direct Lending products’ loan portfolios. For GP Capital Solutions, market volatility should drive demand for products managed by large, diversified managers, benefiting the types of firms our GP Capital Solutions products have typically taken stakes in. With respect to our Real Estate products, we believe there will continue to be strong demand for real estate strategies with long-term, contractual income that are positively correlated to inflation and backed by investment grade tenants.
We believe that our disciplined investment philosophy across our distinct but complementary products contributes to the stability of our performance throughout market cycles. Our products have a stable base of permanent or long-term capital enabling us to invest in assets with a long-term focus over different points in a market cycle.
Assets Under Management
We present information regarding our AUM, FPAUM and various other related metrics throughout this MD&A to provide context around our fee generating revenues results, as well as indicators of the potential for future earnings from existing and new products. Our calculations of AUM and FPAUM may differ from the calculation methodologies of other asset managers, and as a result these measures may not be comparable to similar measures presented by other asset managers. In addition, our calculation of AUM includes amounts that are fee exempt (i.e., not subject to fees).
As of December 31, 2021, our assets under management include approximately $1.9 billion related to executives and other employees and approximately $1.0 billion related to other related parties. A portion of these assets under management relate to accrued carried interests, as well as investments that are not charged fees.
Composition of Assets Under Management
Our AUM consists of FPAUM, AUM not yet paying fees,
fee-exempt
AUM and net appreciation and leverage in products on which fees are based on commitments or investment cost. AUM not yet paying fees generally relates to unfunded capital commitments (to the extent such commitments are not already subject to fees), undeployed debt (to the extent we earn fees based on total asset values or investment cost, inclusive of assets purchased using debt) and AUM that is subject to a temporary fee holiday.Fee-exempt
AUM represents certain investments by us, our employees, other related parties and third parties, as well as certainco-investment
vehicles on which we do not earn fees.Management uses AUM not yet paying fees as an indicator of management fees that will be coming online as we deploy existing assets in products that charge fees based on deployed and not uncalled capital, as well as AUM that is currently subject to a fee holiday that will expire at a predetermined time in the future. AUM not yet paying fees could provide approximately $140.0 million of additional annualized management fees once
79
deployed or upon the expiration of the relevant fee holidays. Approximately $2.2 billion of AUM not yet paying fees moved to FPAUM on January 1, 2022, driven primarily by the expiration of certain fee holidays in Dyal Fund V.
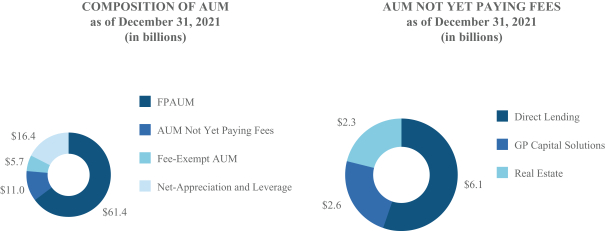
Permanency and Duration of Assets Under Management
Our capital base is heavily weighted toward permanent capital. We use the term “permanent capital” to refer to AUM in our products that do not have ordinary redemption provisions or a requirement to exit investments and return the proceeds to investors after a prescribed period of time. Some of these products, however, may be required, or elect, to return all or a portion of capital gains and investment income. Permanent capital includes certain products that are subject to management fee step downs and/or roll-offs over time. Substantially all of our remaining AUM is in what we refer to as “long-dated funds.” These are funds in which the contractual remaining life is five years or more.
We view the permanency and duration of the products that we manage as a differentiator in our industry and as a means of measuring the stability of our future revenues stream. The chart below presents the composition of our management fees by remaining product duration. Changes in these relative percentages will occur over time as the mix of products we offer investors change. For example, our Real Estate products have a higher concentration in long-dated funds, which in isolation may cause our percentage of management fees from permanent capital to decline.

80
Changes in AUM
Year Ended December 31, 2021 | Year Ended December 31, 2020 | |||||||||||||||||||||||||||||||
(dollars in millions) | Direct Lending | GP Capital Solutions | Real Estate | Total | Direct Lending | GP Capital Solutions | Real Estate | Total | ||||||||||||||||||||||||
Beginning Balance | $ | 27,101 | $ | 26,220 | $ | — | $ | 53,321 | $ | 18,636 | $ | 23,001 | $ | — | $ | 41,637 | ||||||||||||||||
Acquisition | — | — | 15,362 | 15,362 | — | 2,130 | — | 2,130 | ||||||||||||||||||||||||
New capital raised | 4,163 | 4,466 | — | 8,629 | 4,160 | — | — | 4,160 | ||||||||||||||||||||||||
Change in debt | 7,325 | — | — | 7,325 | 4,458 | — | — | 4,458 | ||||||||||||||||||||||||
Distributions | (848 | ) | (579 | ) | — | (1,427 | ) | (779 | ) | (1,104 | ) | — | (1,883 | ) | ||||||||||||||||||
Change in value | 1,486 | 9,799 | — | 11,285 | 626 | 2,193 | — | 2,819 | ||||||||||||||||||||||||
Ending Balance | $ | 39,227 | $ | 39,906 | $ | 15,362 | $ | 94,495 | $ | 27,101 | $ | 26,220 | $ | — | $ | 53,321 | ||||||||||||||||
Direct Lending.
| • | $2.5 billion new capital raised in Diversified Lending, primarily driven by retail fundraising in ORCIC. |
| • | $0.9 billion new capital raised in Technology Lending, driven by the initial launch of ORTF II, our second technology-focused BDC. |
| • | $0.6 billion new capital raised in Opportunistic Lending, driven by additional commitments to our Owl Rock Opportunistic private fund. |
| • | $7.3 billion of debt deployment across all of Direct Lending, as we continue to opportunistically deploy leverage in our BDCs. |
GP Capital Solutions.
Real Estate.
Changes in FPAUM
Year Ended December 31, 2021 | Year Ended December 31, 2020 | |||||||||||||||||||||||||||||||
(dollars in millions) | Direct Lending | GP Capital Solutions | Real Estate | Total | Direct Lending | GP Capital Solutions | Real Estate | Total | ||||||||||||||||||||||||
Beginning Balance | $ | 20,862 | $ | 17,608 | $ | — | $ | 38,470 | $ | 15,278 | $ | 17,546 | $ | — | $ | 32,824 | ||||||||||||||||
Acquisition | — | — | 8,203 | 8,203 | — | — | — | — | ||||||||||||||||||||||||
New capital raised / deployed | 10,598 | 3,700 | — | 14,298 | 5,766 | 353 | — | 6,119 | ||||||||||||||||||||||||
Distributions | (824 | ) | (96 | ) | — | (920 | ) | (764 | ) | (291 | ) | — | (1,055 | ) | ||||||||||||||||||
Change in value | 1,393 | — | — | 1,393 | 582 | — | — | 582 | ||||||||||||||||||||||||
Ending Balance | $ | 32,029 | $ | 21,212 | $ | 8,203 | $ | 61,444 | $ | 20,862 | $ | 17,608 | $ | — | $ | 38,470 | ||||||||||||||||
Direct Lending.
GP Capital Solutions.
81
Real Estate.
Product Performance
Product performance for certain of our products is included throughout this discussion with analysis to facilitate an understanding of our results of operations for the periods presented. The performance information of our products reflected is not indicative of our performance. An investment in Blue Owl is not an investment in any of our products. Past performance is not indicative of future results. As with any investment, there is always the potential for gains as well as the possibility of losses. There can be no assurance that any of these products or our other existing and future products will achieve similar returns. MoIC and IRR data has not been presented for products that have launched within the last two years as such information is generally not meaningful (“NM”).
Direct Lending
Year of | Capital Raised | Invested Capital | Realized Proceeds | Unrealized Value | Total | MoIC | IRR | |||||||||||||||||||||||||||||||||||||
(dollars in millions) | Inception | AUM | (1) | (2) | (3) | (4) | Value | Gross (5) | Net (6) | Gross (7) | Net (8) | |||||||||||||||||||||||||||||||||
Diversified Lending | ||||||||||||||||||||||||||||||||||||||||||||
ORCC | 2016 | $ | 14,515 | $ | 6,006 | $ | 6,006 | $ | 1,901 | $ | 5,938 | $ | 7,839 | 1.39x | 1.30x | 12.1 | % | 9.3 | % | |||||||||||||||||||||||||
ORCC II (9) | 2017 | $ | 2,633 | $ | 1,387 | $ | 1,360 | $ | 246 | $ | 1,360 | $ | 1,606 | NM | 1.18x | NM | 7.3 | % | ||||||||||||||||||||||||||
ORCC III | 2020 | $ | 3,497 | $ | 1,702 | $ | 1,653 | $ | 64 | $ | 1,668 | $ | 1,732 | NM | NM | NM | NM | |||||||||||||||||||||||||||
ORCIC | 2020 | $ | 3,996 | $ | 1,584 | $ | 1,577 | $ | 31 | $ | 1,581 | $ | 1,612 | NM | NM | NM | NM | |||||||||||||||||||||||||||
Technology Lending | ||||||||||||||||||||||||||||||||||||||||||||
ORTF | 2018 | $ | 7,084 | $ | 3,187 | $ | 3,187 | $ | 230 | $ | 3,531 | $ | 3,761 | 1.23x | 1.18x | 18.6 | % | 14.1 | % | |||||||||||||||||||||||||
First Lien Lending (10) | ||||||||||||||||||||||||||||||||||||||||||||
Owl Rock First Lien Fund Levered | 2018 | $ | 2,960 | $ | 1,161 | $ | 813 | $ | 101 | $ | 848 | $ | 949 | 1.21x | 1.17x | 11.2 | % | 8.9 | % | |||||||||||||||||||||||||
Owl Rock First Lien Fund Unlevered | 2019 | $ | 150 | $ | 137 | $ | 6 | $ | 141 | $ | 147 | 1.11x | 1.08x | 5.6 | % | 3.8 | % | |||||||||||||||||||||||||||
| (1) | Includes reinvested dividends, if applicable. |
| (2) | Invested capital includes capital calls, reinvested dividends and periodic investor closes, as applicable. |
| (3) | Realized proceeds represent the sum of all cash distributions to investors. |
| (4) | Unrealized value represents the product’s NAV. There can be no assurance that unrealized values will be realized at the valuations indicated. |
| (5) | Gross multiple of invested capital (“MoIC”) is calculated by adding total realized proceeds and unrealized values of a product’s investments and dividing by the total amount of invested capital. Gross MoIC is before giving effect to management fees (including Part I Fees) and Part II Fees, as applicable. |
| (6) | Net MoIC measures the aggregate value generated by a product’s investments in absolute terms. Net MoIC is calculated by adding total realized proceeds and unrealized values of a product’s investments and dividing by the total amount of invested capital. Net MoIC is calculated after giving effect to management fees (including Part I Fees) and Part II Fees, as applicable, and all other expenses. |
| (7) | Gross IRR is an annualized since inception gross internal rate of return of cash flows to and from the product and the product’s residual value at the end of the measurement period. Gross IRRs are calculated before giving effect to management fees (including Part I Fees) and Part II Fees, as applicable. |
| (8) | Net IRRs are calculated consistent with gross IRRs, but after giving effect to management fees (including Part I Fees) and Part II Fees, as applicable, and all other expenses. An individual investor’s IRR may be different to the reported IRR based on the timing of capital transactions. |
| (9) | For the purposes of calculating Gross IRR, the expense support provided to the fund would be impacted when assuming a performance excluding management fees (including Part I Fees) and Part II Fees, and therefore is not meaningful for ORCC II. |
82
| (10) | Owl Rock First Lien Fund is comprised of three feeder funds: Onshore Levered, Offshore Levered and Insurance Unlevered. The gross and net MoIC and IRR presented in the chart are for Onshore Levered and Insurance Unlevered as those are the largest of the levered and unlevered feeder funds. The gross and net MoIC for the Offshore Levered feeder fund is 1.20x and 1.14x, respectively. The gross and net IRR for the Offshore Levered feeder is 10.4% and 7.0%, respectively. All other values for Owl Rock First Lien Fund Levered are for Onshore Levered and Offshore Levered combined. AUM is presented as the aggregate of the three Owl Rock First Lien Fund feeders. Owl Rock First Lien Fund Unlevered Investor equity and note commitments are both treated as capital for all values. |
GP Capital Solutions
Year of | Capital | Invested Capital | Realized Proceeds | Unrealized Value | Total | MoIC | IRR | |||||||||||||||||||||||||||||||||||||
(dollars in millions) | Inception | AUM | Raised | (2) | (3) | (4) | Value | Gross (5) | Net (6) | Gross (7) | Net (8) | |||||||||||||||||||||||||||||||||
GP Minority Equity (1) | ||||||||||||||||||||||||||||||||||||||||||||
Dyal Fund I | 2011 | $ | 930 | $ | 1,284 | $ | 1,248 | $ | 583 | $ | 697 | $ | 1,280 | 1.17x | 1.03x | 3.5 | % | 0.5 | % | |||||||||||||||||||||||||
Dyal Fund II | 2014 | $ | 2,681 | $ | 2,153 | $ | 1,846 | $ | 421 | $ | 2,087 | $ | 2,508 | 1.48x | 1.36x | 12.5 | % | 9.0 | % | |||||||||||||||||||||||||
Dyal Fund III | 2015 | $ | 8,359 | $ | 5,318 | $ | 3,241 | $ | 2,493 | $ | 4,231 | $ | 6,724 | 2.48x | 2.07x | 32.3 | % | 24.2 | % | |||||||||||||||||||||||||
Dyal Fund IV | 2018 | $ | 14,244 | $ | 9,041 | $ | 4,076 | $ | 2,178 | $ | 6,142 | $ | 8,320 | 2.44x | 2.04x | 146.5 | % | 96.0 | % | |||||||||||||||||||||||||
Dyal Fund V | 2020 | $ | 6,724 | $ | 5,826 | $ | 593 | $ | — | $ | 1,321 | $ | 1,321 | NM | NM | NM | NM | |||||||||||||||||||||||||||
| (1) | Valuation-related amounts and performance metrics are presented on a quarter lag and are exclusive of investments made by us and the related carried interest vehicles of the respective products. |
| (2) | Invested capital includes capital calls. |
| (3) | Realized proceeds represent the sum of all cash distributions to investors. |
| (4) | Unrealized value represents the product’s NAV. There can be no assurance that unrealized values will be realized at the valuations indicated. |
| (5) | Gross MoIC is calculated by adding total realized proceeds and unrealized values of a product’s investments and dividing by the total amount of invested capital. Gross MoIC is before giving effect to management fees and carried interest, as applicable. |
| (6) | Net MoIC measures the aggregate value generated by a product’s investments in absolute terms. Net MoIC is calculated by adding total realized proceeds and unrealized values of a product’s investments and dividing by the total amount of invested capital. Net MoIC is calculated after giving effect to management fees and carried interest, as applicable, and all other expenses. |
| (7) | Gross IRR is an annualized since inception gross internal rate of return of cash flows to and from the product and the product’s residual value at the end of the measurement period. Gross IRRs are calculated before giving effect to management fees and carried interest, as applicable. |
| (8) | Net IRR is an annualized since inception net internal rate of return of cash flows to and from the product and the product’s residual value at the end of the measurement period. Net IRRs reflect returns to all investors. Net IRRs are calculated after giving effect to management fees and carried interest, as applicable, and all other expenses. An individual investor’s IRR may be different to the reported IRR based on the timing of capital transactions. |
83
Real Estate
Year of | Capital | Invested Capital | Realized Proceeds | Unrealized Value | Total | MoIC | IRR | |||||||||||||||||||||||||||||||||||||
(dollars in millions) | Inception | AUM | Raised | (2) | (3) | (4) | Value | Gross (5) | Net (6) | Gross (7) | Net (8) | |||||||||||||||||||||||||||||||||
Net Lease (1) | ||||||||||||||||||||||||||||||||||||||||||||
Oak Street Real Estate Capital Fund IV | 2017 | $ | 1,358 | $ | 1,250 | $ | 1,239 | $ | 911 | $ | 821 | $ | 1,732 | 1.52x | 1.40x | 26.1 | % | 20.3 | % | |||||||||||||||||||||||||
Oak Street Real Estate Capital Net Lease Property | 2019 | $ | 5,669 | $ | 3,161 | $ | 1,732 | $ | 126 | $ | 1,972 | $ | 2,098 | 1.21x | 1.21x | 21.3 | % | 20.3 | % | |||||||||||||||||||||||||
Oak Street Real Estate Capital Fund V | 2020 | $ | 3,818 | $ | 2,500 | $ | 637 | $ | 108 | $ | 747 | $ | 855 | NM | NM | NM | NM | |||||||||||||||||||||||||||
Oak Street Asset-Backed Securitization (9) | 2020 | $ | 3,001 | $ | 2,716 | $ | 258 | $ | 16 | $ | 296 | $ | 312 | NM | NM | NM | NM | |||||||||||||||||||||||||||
| (1) | Valuation-related amounts and performance metrics, as well as invested capital and realized proceeds, are presented on a quarter lag where applicable. |
| (2) | Invested capital includes investments by the general partner, capital calls, dividends reinvested and periodic investors closes, as applicable. |
| (3) | Realized proceeds represent the sum of all cash distributions to all investors. |
| (4) | Unrealized value represents the fund’s NAV. There can be no assurance that unrealized values will be realized at the valuations indicated. |
| (5) | Gross MoIC is calculated by adding total realized proceeds and unrealized values of a product’s investments and dividing by the total amount of invested capital. Gross MoIC is before giving effect to management fees and carried interest, as applicable. |
| (6) | Net MoIC measures the aggregate value generated by a product’s investments in absolute terms. Net MoIC is calculated by adding total realized proceeds and unrealized values of a product’s investments and dividing by the total amount of invested capital. Net MoIC is calculated after giving effect to management fees and carried interest, as applicable, and all other expenses. |
| (7) | Gross IRR is an annualized since inception gross internal rate of return of cash flows to and from the product and the product’s residual value at the end of the measurement period. Gross IRRs are calculated before giving effect to management fees and carried interest, as applicable. |
| (8) | Net IRR is an annualized since inception net internal rate of return of cash flows to and from the product and the product’s residual value at the end of the measurement period. Net IRRs reflect returns to all investors. Net IRRs are calculated after giving effect to management fees and carried interest, as applicable, and all other expenses. An individual investor’s IRR may be different to the reported IRR based on the timing of capital transactions. |
| (9) | Capital raised for this product includes the par value of notes issued in the securitization. Invested capital, realized proceeds, unrealized and total values relate to the subordinated notes/equity of the securitization. |
GAAP Results of Operations Analysis
As a result of the Dyal Acquisition, prior year amounts are not comparable to current year amounts or expected future trends. Dyal Capital’s results of operations are included from the Business Combination Date.
For a discussion of our results for the year ended December 31, 2020, compared to the year ended December 31, 2019, please refer to “Owl Rocks Management’s Discussion and Analysis of Financial Condition and Results of Operations” in our Proxy Statement/Prospectus, filed May 3, 2021.
84
Year Ended December 31, 2021, Compared to the Year Ended December 31, 2020
Year Ended December 31, | ||||||||||||
(dollars in thousands) | 2021 | 2020 | $ Change | |||||||||
Revenues | ||||||||||||
Management fees, net (includes Part I Fees of $150,370 and $34,404) | $ | 667,935 | $ | 194,906 | $ | 473,029 | ||||||
Administrative, transaction and other fees | 150,037 | 54,909 | 95,128 | |||||||||
Realized performance income | 5,906 | — | 5,906 | |||||||||
Total Revenues, Net | 823,878 | 249,815 | 574,063 | |||||||||
Expenses | ||||||||||||
Compensation and benefits | 1,496,988 | 240,731 | 1,256,257 | |||||||||
Amortization of intangible assets | 113,889 | — | 113,889 | |||||||||
General, administrative and other expenses | 140,268 | 67,811 | 72,457 | |||||||||
Total Expenses | 1,751,145 | 308,542 | 1,442,603 | |||||||||
Other Loss | ||||||||||||
Net losses on investments | (3,526 | ) | — | (3,526 | ) | |||||||
Net losses on retirement of debt | (17,636 | ) | — | (17,636 | ) | |||||||
Interest expense | (27,275 | ) | (23,816 | ) | (3,459 | ) | ||||||
Change in TRA liability | (13,848 | ) | — | (13,848 | ) | |||||||
Change in warrant liability | (43,670 | ) | — | (43,670 | ) | |||||||
Change in earnout liability | (834,255 | ) | — | (834,255 | ) | |||||||
Total Other Loss | (940,210 | ) | (23,816 | ) | (916,394 | ) | ||||||
Loss Before Income Taxes | (1,867,477 | ) | (82,543 | ) | (1,784,934 | ) | ||||||
Income tax benefit | (65,211 | ) | (102 | ) | (65,109 | ) | ||||||
Consolidated and Combined Net Loss | (1,802,266 | ) | (82,441 | ) | (1,719,825 | ) | ||||||
Net loss attributable to noncontrolling interests | 1,426,095 | 4,610 | 1,421,485 | |||||||||
Net Loss Attributable to Blue Owl Capital Inc. | $ | (376,171 | ) | $ | (77,831 | ) | $ | (298,340 | ) | |||
Revenues, Net
Management Fees
Administrative, Transaction and Other Fees
Realized Performance Income.
85
Expenses
Compensation and Benefits.
non-cash
equity-based compensation charges totaling $1.2 billion in connection with Common Units issued in connection with the Business Combination and the additional $72.1 million was primarily related to subsequent compensation and acquisitions related equity grants and growth in our employee headcount.Amortization of Intangible Assets.
General, Administrative and Other Expenses
Other Loss
Net losses on retirement of debt
write-off
of unamortized deferred financing costs related to the Term Loan and terminated revolving credit facilities. See Note 4 to our Financial Statements for additional information.Interest expense
Change in TRA liability.
Change in warrant liability.
Change in earnout liability.
Income Tax Benefit
Prior to the Business Combination, our income was generally subject to New York City UBT, as the operating entities are partnerships for U.S. federal income tax purposes. In connection with the Business Combination, the portion of income allocable to the Registrant is also generally subject to corporate tax rates at
86
the U.S. federal and state and local levels. This resulted in an increase in income tax benefit in the current year period. Please see Note 10 to our Financial Statements for a discussion of the significant tax differences that impacted our effective tax rate.
Net Loss Attributable to Noncontrolling Interest
Net loss attributable to noncontrolling interests in the current year primarily represents the allocation to Common Units of their pro rata share of the Blue Owl Operating Group’s post-Business Combination net loss due to the drivers discussed above. The Common Units represent an approximately 74% weighted average economic interest in the Blue Owl Operating Group. Prior to the Business Combination, amounts attributable to noncontrolling interests were not significant, and related primarily to third-party interests held in certain of our consolidated investment advisor holding companies.
Non-GAAP
AnalysisIn addition to presenting our consolidated and combined results in accordance with GAAP, we present certain other financial measures that are not presented in accordance with GAAP. Management uses these measures to assess the performance of our business, and we believe that this information enhances the ability of stockholders to analyze our performance from period to period. Thesefor reconciliations of these measures to the most comparable measures prepared in accordance with GAAP.
non-GAAP
financial measures supplement and should be considered in addition to and not in lieu of our GAAP results, and such measures should not be considered as indicative of our liquidity. Ournon-GAAP
measures may not be comparable to other similarly titled measured used by other companies. Please see“—Non-GAAP
Reconciliations”Fee-Related
Earnings and Related ComponentsFee-Related
Earnings is a supplementalnon-GAAP
measure of operating performance used to make operating decisions and assess our operating performance.Fee-Related
Earnings excludes certain items that are required for the presentation of our results on a GAAP basis. Management also reviews the components that compriseFee-Related
Earnings (i.e., FRE Revenues and FRE Expenses) on the same basis used to calculateFee-Related
Earnings, and such components are alsonon-GAAP
measures and have been identified with the prefix “FRE” in the tables and discussion below. Management believes that by excluding these items, which are described below,Fee-Related
Earnings and its components can be useful as supplemental measures to our GAAP results in assessing our operating performance and focusing on whether our recurring revenues, primarily consisting of management fees, are sufficient to cover our recurring operating expenses.Fee-Related
Earnings exclude various items that are required for the presentation of our results under GAAP, including the following: noncontrolling interests in the Blue Owl Operating Partnerships; equity-based compensation expense; compensation expenses related to capital contributions in certain subsidiary holding companies that arein-turn
paid as compensation to certain employees, as such contributions are not included inFee-Related
Earnings or Distributable Earnings; amortization of intangible assets; “Transaction Expenses” as defined below; net gains (losses) on investments, changes in TRA, earnout and warrant liabilities; net losses on retirement of debt; interest and taxes. In addition, management reviews revenues by reducing GAAP administrative, transaction and other fees for certain expenses related to reimbursements from our products, which are presented gross for GAAP but net fornon-GAAP
measures. Transaction Expenses are expenses incurred in connection with the Business Combination and other acquisitions and strategic transactions, including subsequent adjustments related to such transactions, that were not eligible to be netted against consideration or recognized as acquired assets and assumed liabilities in the relevant transaction.Distributable Earnings
Distributable Earnings is a supplemental
non-GAAP
measure of operating performance that equalsFee-Related
Earnings plus or minus, as relevant, realized performance income and related compensation, interest87
expense, as well as amounts payable for taxes and payments made pursuant to the TRA. Amounts payable for taxes presents the current income taxes payable related to the respective period’s earnings, assuming that all Distributable Earnings were allocated to the Registrant, which would occur following the exchange of all Common Units for Class A Shares. Current income taxes payable and payments made pursuant to the TRA reflect the benefit of tax deductions that are excluded when calculating Distributable Earnings (e.g., equity-based compensation expenses, net losses on retirement of debt, Transaction Expenses, tax goodwill, etc.). If these tax deductions were to be excluded from amounts payable for taxes, Distributable Earnings would be lower and our effective tax rate would appear to be higher, even though a lower amount of income taxes would have been paid or payable for a period’s earnings. We make these adjustments when calculating Distributable Earnings to more accurately reflect the net realized earnings that are expected to be or become available for distribution or reinvestment into our business. Management believes that Distributable Earnings can be useful as a supplemental performance measure to our GAAP results assessing the amount of earnings available for distribution.
Fee-Related
Earnings and Distributable Earnings SummaryYear Ended December 31, | ||||||||
(dollars in thousands) | 2021 | 2020 | ||||||
FRE revenues | $ | 785,901 | $ | 233,310 | ||||
FRE expenses | (330,256 | ) | (201,512 | ) | ||||
Net (income) loss allocated to noncontrolling interests included in Fee-Related Earnings | (3,961 | ) | 4,610 | |||||
Fee-Related Earnings | $ | 451,684 | $ | 36,408 | ||||
Distributable Earnings | $ | 427,322 | $ | 12,219 | ||||
Fee-Related
Earnings and Distributable Earnings increased year-over-year as a result of the accretive impact of the Dyal Acquisition, as well as higher FRE revenues from our Direct Lending products as certain fee waivers in ORCC, our largest BDC, expired in the fourth quarter of 2020. These increases were offset by higher FRE expenses, primarily due to compensation and benefits as discussed further below.FRE Revenues
Year Ended December 31, | ||||||||
(dollars in thousands) | 2021 | 2020 | ||||||
Direct Lending Products | ||||||||
Diversified lending | $ | 348,363 | $ | 140,153 | ||||
Technology lending | 66,089 | 42,052 | ||||||
First lien lending | 15,185 | 12,335 | ||||||
Opportunistic lending | 3,993 | 366 | ||||||
Management Fees, Net | 433,630 | 194,906 | ||||||
Administrative, transaction and other fees | 106,973 | 38,404 | ||||||
FRE Revenues—Direct Lending Products | 540,603 | 233,310 | ||||||
GP Capital Solutions Products | ||||||||
GP minority equity investments | 233,505 | — | ||||||
GP debt financing | 10,215 | — | ||||||
Professional sports minority investments | 477 | — | ||||||
Management Fees, Net | 244,197 | — | ||||||
Administrative, transaction and other fees | 1,101 | — | ||||||
FRE Revenues—GP Capital Solutions Products | 245,298 | — | ||||||
Total FRE Revenues | $ | 785,901 | $ | 233,310 | ||||
88
FRE revenues increased primarily due to higher management fees from our Direct Lending products due to the fee waivers in ORCC, our largest BDC, that expired in October 2020. These waivers totaled $130.9 million (inclusive of $74.8 million of Part I Fees) for the year ended December 31, 2020. The remaining increase was driven primarily by the overall growth in FPAUM across all of our Diversified Lending product strategies. Also contributing to the increase were higher administrative, transaction and other fees due to higher fee income earned for services provided to portfolio companies. FRE revenues also increased due to the accretive impact of Dyal Capital’s management fees from the Business Combination Date.
FRE Expenses
Year Ended December 31, | ||||||||
(dollars in thousands) | 2021 | 2020 | ||||||
FRE compensation and benefits | $ | (255,626 | ) | $ | (137,197 | ) | ||
FRE general, administrative and other expenses | (74,630 | ) | (64,315 | ) | ||||
Total FRE Expenses | $ | (330,256 | ) | $ | (201,512 | ) | ||
FRE expenses increased primarily due to higher FRE compensation and benefits as a result of increased headcount, both in the legacy Owl Rock business, as well as due to an increase related to the Dyal Acquisition. FRE general, administrative and other expenses were up primarily due to placement fees related to Dyal Fund V, expenses related to being a public company and increased travel and office-related expenses as we transition from working remotely back to the office. These increases were partially offset by lower expense support to certain products. Seefor additional information on these drivers.
“—GAAP Results of Operations Analysis”
89
Non-GAAP
ReconciliationsThe table below presents the reconciliation of thefor important information regarding these measures.
non-GAAP
measures presented throughout this MD&A. Please see“—Non-GAAP
Analysis”Year Ended December 31, | ||||||||
(dollars in thousands) | 2021 | 2020 | ||||||
GAAP Loss Before Income Taxes | $ | (1,867,477 | ) | $ | (82,543 | ) | ||
Net (income) loss allocated to noncontrolling interests included in Fee-Related Earnings | (3,961 | ) | 4,610 | |||||
Strategic Revenue-Share Purchase consideration amortization | 9,892 | — | ||||||
Realized performance compensation | 2,067 | — | ||||||
Equity-based compensation | 1,205,336 | 90,525 | ||||||
Capital-related compensation | 1,416 | — | ||||||
Amortization of intangible assets | 113,889 | — | ||||||
Transaction Expenses | 56,218 | — | ||||||
Interest expense | 27,275 | 23,816 | ||||||
Realized performance income | (5,906 | ) | — | |||||
Net losses on investments | 3,526 | — | ||||||
Net losses on early retirement of debt | 17,636 | — | ||||||
Change in TRA liability | 13,848 | — | ||||||
Change in warrant liability | 43,670 | — | ||||||
Change in earnout liability | 834,255 | — | ||||||
Fee-Related Earnings | 451,684 | 36,408 | ||||||
Realized performance income | 5,906 | — | ||||||
Realized performance compensation | (2,067 | ) | — | |||||
Interest expense | (27,275 | ) | (23,816 | ) | ||||
Taxes and TRA payments | (926 | ) | (373 | ) | ||||
Distributable Earnings | 427,322 | 12,219 | ||||||
Interest expense | 27,275 | 23,816 | ||||||
Taxes and TRA payments | 926 | 373 | ||||||
Fixed assets depreciation and amortization | 665 | 673 | ||||||
Adjusted EBITDA | $ | 456,188 | $ | 37,081 | ||||
Year Ended December 31, | ||||||||
(dollars in thousands) | 2021 | 2020 | ||||||
GAAP Revenues | $ | 823,878 | $ | 249,815 | ||||
Strategic Revenue-Share Purchase consideration amortization | 9,892 | — | ||||||
Realized performance income | (5,906 | ) | — | |||||
Administrative and other fees | (41,963 | ) | (16,505 | ) | ||||
FRE Revenues | $ | 785,901 | $ | 233,310 | ||||
90
Year Ended December 31, | ||||||||
(dollars in thousands) | 2021 | 2020 | ||||||
GAAP Compensation and Benefits | $ | 1,496,988 | $ | 240,731 | ||||
Realized performance compensation | (2,067 | ) | — | |||||
Equity-based compensation | (1,204,119 | ) | (90,525 | ) | ||||
Capital-related compensation | (1,416 | ) | — | |||||
Administrative and other expenses | (33,760 | ) | (13,009 | ) | ||||
FRE Compensation and Benefits | $ | 255,626 | $ | 137,197 | ||||
Year Ended December 31, | ||||||||
(dollars in thousands) | 2021 | 2020 | ||||||
GAAP General, Administrative and Other Expenses | $ | 140,268 | $ | 67,811 | ||||
Transaction Expenses | (56,218 | ) | — | |||||
Equity-based compensation | (1,217 | ) | — | |||||
Administrative and other expenses | (8,203 | ) | (3,496 | ) | ||||
FRE General, Administrative and Other Expenses | $ | 74,630 | $ | 64,315 | ||||
Liquidity and Capital Resources
Overview
We rely on management fees as the primary source of our operating liquidity. Fromwe may rely on the use of revolving credit facilities between management fee collection dates, which generally occur on a quarterly basis. We may also rely on our Revolving Credit Facility for liquidity needed to fund acquisitions, which we may replace with longer-term financing, subject to market conditions. To the extent that we have excess liquidity, we may invest such excess liquidity in corporate bonds, agency securities and other investments.
time-to-time
We ended 2021 with $42.6 million of cash and cash equivalents, excess liquidity investments of $1.3 million and $487.0 million available under our Revolving Credit Facility. We had $153.0 million outstanding on our Revolving Credit Facility, and such amounts were repaid in January 2022 in connection with revenues collected at the start of the quarter. In February, we increased the capacity of our Revolving Credit Facility, and as of the date of this filing, we have $715.0 million available under the Revolving Credit Facility, which is available for general corporate purposes. In February 2022, we also issued the $400.0 million 2032 Notes, providing additional liquidity for general corporate purposes, including to fund future strategic acquisitions or related transactions and growth initiatives.
Based on management’s experience and our current level of liquidity and assets under management, we believe that our current liquidity position and cash generated from management fees will continue to be sufficient to meet our anticipated working capital needs for at least the next 12 months.
Over the short and long term, we may use cash and cash equivalents, issue additional debt or equity securities, or may seek other sources of liquidity to:
| • | Grow our existing investment management business. |
| • | Expand, or acquire, into businesses that are complementary to our existing investment management businesses or other strategic growth initiatives. |
| • | Pay operating expenses, including cash compensation to our employees. |
| • | Repay debt obligations and interest thereon. |
| • | Opportunistically repurchase Class A Shares pursuant to the Share Repurchase Program (as defined below). |
91
| • | Pay income taxes and amounts due under the TRA. |
| • | Pay dividends to holders of our Class A Shares, as well as make corresponding distributions to holders of Common Units at the Blue Owl Operating Group level. |
| • | Fund investment commitments to existing or future products. |
Debt Obligations
Our long-term debt obligations consisted of the $700.0 million 2031 Notes and the $350.0 million 2051 Notes as of December 31, 2021. We also had $153.0 million outstanding on our Revolving Credit Facility, and such amounts were repaid in January 2022, as discussed above, and issued the $400.0 million 2032 Notes in February 2022. We expect to use cash on hand to pay interest and principal due on our financing arrangements over time, which would reduce amounts available for dividends and distributions to our stockholders. We may choose to refinance all or a portion of any amounts outstanding on or prior to their respective maturity dates by issuing new debt, which could result in higher borrowing costs. We may also choose to repay borrowing by using proceeds from the issuance of equity or other securities, which would dilute stockholders. See Note 4 to our consolidated and combined financial statements in this prospectus for additional information regarding our debt obligations.
Management regularly reviews Adjusted EBITDA to assess our ability to service our debt obligations. Adjusted EBITDA is equal to Distributable Earnings plus interest expense, taxes and TRA payable, and fixed assets depreciation and amortization. Adjusted EBITDA is afor reconciliations of Adjusted EBITDA to the most comparable measures prepared in accordance with GAAP.
non-GAAP
financial measure that supplements and should be considered in addition to and not in lieu of our GAAP results, and such measure should not be considered as indicative of our liquidity. Adjusted EBITDA may not be comparable to other similarly titled measured used by other companies. Adjusted EBITDA was $169.4 million for the quarter ended December 31, 2021. Please see“—Non-GAAP
Reconciliations”Tax Receivable Agreement
As discussed in Note 11 to our consolidated and combined financial statements in this prospectus, we may in the future be required to make payments under the TRA. As of December 31, 2021, assuming no material changes in the relevant tax law and that we generate sufficient taxable income to realize the full tax benefit of the increased amortization resulting from the increase in tax basis of certain Blue Owl Operating Group assets, we expect to pay approximately $670.7 million under the TRA, net of fair value adjustments. Future cash savings and related payments under the TRA in respect of subsequent exchanges of Common Units for Class A or B Shares would be in addition to these amounts.
Payments under the tax receivable agreement are anticipated to increase the tax basis adjustment and, consequently, result in increasing annual amortization deductions in the taxable years of and after such increases to the original basis adjustments, and potentially will give rise to increasing tax savings with respect to such years and correspondingly increasing payments under the TRA.
The obligation to make payments under the tax receivable agreement is an obligation of Blue Owl GP, and any other corporate taxpaying entities that in the future may hold GP Units, and not of the Blue Owl Operating Group. We may need to incur debt to finance payments under the TRA to the extent the Blue Owl Operating Group does not distribute cash to Registrant or Blue Owl GP in an amount sufficient to meet our obligations under the TRA.
92
The actual increase in tax basis of the Blue Owl Operating Group assets resulting from an exchange or from payments under the TRA, as well as the amortization thereof and the timing and amount of payments under the TRA, will vary based upon a number of factors, including the following:
| • | The amount and timing of our taxable income will impact the payments to be made under the TRA. To the extent that we do not have sufficient taxable income to utilize the amortization deductions available as a result of the increased tax basis in the Blue Owl Operating Partnerships’ assets, payments required under the TRA would be reduced. |
| • | The price of our Class A Shares at the time of any exchange will determine the actual increase in tax basis of the Blue Owl Operating Partnerships’ assets resulting from such exchange; payments under the TRA resulting from future exchanges, if any, will be dependent in part upon such actual increase in tax basis. |
| • | The composition of the Blue Owl Operating Group assets at the time of any exchange will determine the extent to which we may benefit from amortizing the increased tax basis in such assets and thus will impact the amount of future payments under the TRA resulting from any future exchanges. |
| • | The extent to which future exchanges are taxable will impact the extent to which we will receive an increase in tax basis of the Blue Owl Operating Group assets as a result of such exchanges, and thus will impact the benefit derived by us and the resulting payments, if any, to be made under the TRA. |
| • | The tax rates in effect at the time any potential tax savings are realized, which would affect the amount of any future payments under the TRA. |
Depending upon the outcome of these and other factors, payments that we may be obligated to make under the TRA in respect of exchanges could be substantial. In light of the numerous factors affecting our obligation to make payments under the TRA, the timing and amounts of any such actual payments are not reasonably ascertainable.
Warrants
We classify the warrants issued in connection with the Business Combination as liabilities in our consolidated and combined statements of financial condition, as in the event of a change in control, warrant holders have the ability to demand cash settlement from us. In addition, we have the option to cash settle outstanding warrants when certain criteria is met, as described in Note 2 to our Financial Statements. To the extent we have insufficient cash on hand or that we opt to, we may rely on debt or equity financing to facilitate these transactions in the future if needed.
Earnout Securities and Oak Street Cash Earnout
We classified certain Earnout Securities as liabilities in our consolidated and combined statements of financial condition, as described in Note 2 to our Financial Statements. The settlement of these liabilities during 2021 was in the form of Class A Shares and Common Units that were issued upon the relevant Class E Triggering Events and did not require cash settlement.
A portion of the Oak Street Cash Earnouts are also liability classified and represent the fair value of the obligation to make future cash payments that would need to be made if all the respective Oak Street Triggering Events occur. Further, the portion classified as compensation expense will be expensed and a corresponding accrued compensation liability will be recorded over the service period. To the extent we have insufficient cash on hand or that we opt to, we may rely on debt or equity financing to facilitate these transactions in the future. See Note 2 to our Financial Statements for additional information.
Dividends and Distributions
We intend to continue to pay to Class A Stockholders (and Class B Stockholders in the future to the extent any Class B Shares are outstanding) a quarterly dividend representing approximately 85% of Distributable
93
Earnings following the end of each quarter. Blue Owl Capital Inc.’s share of Distributable Earnings, subject to adjustment as determined by our Board to be necessary or appropriate to provide for the conduct of our business, to make appropriate investments in our business and products, to comply with applicable law, any of our debt instruments or other agreements, or to provide for future cash requirements such as
tax-related
payments, operating reserves, clawback obligations and dividends to stockholders for any ensuing quarter. All of the foregoing is subject to the qualification that the declaration and payment of any dividends are at the sole discretion of our Board, and our Board may change our dividend policy at any time, including, without limitation, to reduce or eliminate dividends entirely.The Blue Owl Operating Partnerships will make cash distributions (“Tax Distributions”) to the partners of such partnerships, including to Blue Owl GP, if we determine that the taxable income of the relevant partnership will give rise to taxable income for its partners. Generally, Tax Distributions will be computed based on our estimate of the taxable income of the relevant partnership allocable to a partner multiplied by an assumed tax rate equal to the highest effective marginal combined U.S. federal, New York State and New York City income tax rates prescribed for an individual or corporate resident in New York City (taking into account certain assumptions set forth in the relevant partnership agreements). Tax Distributions will be made only to the extent distributions from the Blue Owl Operating Partnerships for the relevant year were otherwise insufficient to cover the estimated assumed tax liabilities.
Holders of our Class A and B Shares may not always receive distributions or may receive lower distributions on a per share basis at a time when we, indirectly through Blue Owl GP, and holders of our Common Units are receiving distributions on their interests, as distributions to the Registrant and Blue Owl GP may be used to settle tax and TRA liabilities, if any, and other obligations.
Dividends are expected to be treated as qualified dividends under current law to the extent of the Company’s current and accumulated earnings and profits, with any excess dividends treated as a return of capital to the extent of a stockholder’s basis, and any remaining excess generally treated as gain realized on the sale or other disposition of stock.
Risks to our Liquidity
Our ability to obtain financing provides us with additional sources of liquidity. Any new financing arrangement that we may enter into may have covenants that impose additional limitations on us, including with respect to making distributions, entering into business transactions or other matters, and may result in increased interest expense. If we are unable to secure financing on terms that are favorable to us, our business may be adversely impacted. No assurance can be given that we will be able to issue new debt, enter into new credit facilities or issue equity or other securities in the future on attractive terms or at all.
Adverse market conditions, including from the
COVID-19
pandemic or any other market dislocation event, may negatively impact our liquidity. Cash flows from management fees may be impacted by a slowdown or a decline in fundraising and deployment, as well as declines in the value of investments held in certain of our products.LIBOR Transition
On March 5, 2021, the UK Financial Conduct Authority announced that it would phase out LIBOR as a benchmark immediately after December 31, 2021, for sterling, euro, Japanese yen, Swiss franc and
1-week
and2-month
U.S. Dollar settings and immediately after June 30, 2023, the remaining U.S. Dollar settings. Our Notes are fixed rate borrowings, and therefore the LIBOR phase out will not have an impact on this borrowing. The Revolving Credit Facility is subject to SOFR rates at our option, or alternative rates that are not tied to LIBOR. Certain of our products hold investments and have borrowings that are tied to LIBOR, and we continue to focus on managing any risk related to those exposures. Our senior management has oversight of these transition efforts.94
See “”
Risk Factors—Risks Related to Legal and Regulatory Environment—Changes to the method of determining the London Interbank Offered Rate (“LIBOR”) or the selection of a replacement for LIBOR may affect the value of investments held by our products and could affect our results of operations and financial results.
Cash Flows Analysis
Year Ended December 31, | ||||||||||||
(dollars in thousands) | 2021 | 2020 | $ Change | |||||||||
Net cash provided by (used in): | ||||||||||||
Operating activities | $ | 281,658 | $ | 5,234 | $ | 276,424 | ||||||
Investing activities | (1,598,872 | ) | (652 | ) | (1,598,220 | ) | ||||||
Financing activities | 1,348,151 | (295 | ) | 1,348,446 | ||||||||
Net Change in Cash and Cash Equivalents | $ | 30,937 | $ | 4,287 | $ | 26,650 | ||||||
Operating Activities.
Net cash flows from operating activities increased from the prior year period due to the inclusion of the Dyal Capital related cash flows, as well as higher management fees from our Direct Lending products. These increases were partially offset by higher 2020 discretionary bonuses, which were paid in the first quarter of 2021, as compared to discretionary bonuses in 2019, which were paid in the first quarter of 2020.
Investing Activities.
Financing Activities.
pre-Business
Combination Owl Rock owners. Additionally, distributions ofpre-Business
Combination-related earnings were also made during 2021, with a final distribution of $52.0 million related topre-Business
Combination-related earnings made during the third quarter of 2021. Cash flows related to financing activities in 2021 also included the proceeds from our 2031 Notes, which proceeds were used in part to repay our previously outstanding Term Loan and proceeds from our 2051 Notes, which proceeds were used to finance working capital needs and general capital purposes. We also made various short-term borrowings and repayments under our revolving credit facilities. Such borrowings were fully repaid by January 2022.Our 2020 cash flows related to financing activities included borrowings and repayments under our previously outstanding revolving credit facilities. In addition, distributions related to
pre-Business
Combination-related earnings was another significant financing cash flow in the prior-year period.Critical Accounting Estimates
We prepare our Financial Statements in accordance with U.S. GAAP. In applying many of these accounting principles, we make estimates that affect the reported amounts of assets, liabilities, revenues and expenses in our consolidated and combined financial statements. We base our estimates on historical experience and other factors
95
that we believe are reasonable under the circumstances. These estimates, however, are subjective and subject to change, and actual results may differ materially from our current estimates due to the inherent nature of these estimates, including uncertainty in the current economic environment due to the
COVID-19
pandemic and other factors. For a summary of our significant accounting policies, see Note 2 to our Financial Statements.Estimation of Fair Values
Investments Held by our Products
The fair value of the investments held by our Direct Lending products is the primary input to the calculation for the majority of our management fees. Management fees from our GP Capital Solutions and Real Estate products are generally based on commitments or investment cost, so our management fees are generally not impacted by changes in the estimated fair values of investments held by these products. However, to the extent that management fees are calculated based on investment cost of the product’s investments, the amount of fees that we may charge will increase or decrease from the effect of changes in the cost basis of the product’s investments, including potential impairment losses. In the absence of observable market prices, we use valuation methodologies applied on a consistent basis and assumptions that we believe market participants would use to determine the fair value of the investments. For investments where little market activity exists, the determination of fair value is based on the best information available, we incorporate our own assumptions and involves a significant degree of judgment, and the consideration of a combination of internal and external factors.
Our products generally value their investments at fair value, as determined in good faith by each product’s respective board of directors or valuation committee, as applicable, based on, among other things, the input of third party valuation firms and taking into account the nature and realizable value of any collateral, an investee’s ability to make payments and its earnings, the markets in which the investee operates, comparison to publicly traded companies, discounted cash flow, current market interest rates and other relevant factors. Because such valuations are inherently uncertain, the valuations may fluctuate significantly over time due to changes in market conditions. These valuations would, in turn, have corresponding proportionate impacts on the amount management fees that we may earn from certain products on which revenues are based on the fair value of investments.
TRA Liability
We carry a portion of our TRA liability at fair value, as it is contingent consideration related to the Dyal Acquisition. The valuation of this portion of the TRA liability is mostly sensitive to our expectation of future cash savings that we may ultimately realize related to our tax goodwill and other intangible assets deductions. We then apply a discount rate that we believe is appropriate given the nature of and expected timing of payments of the liability. A decrease in the discount rate assumption would result in an increase in the fair value estimate of the liability, which would have a correspondingly negative impact on our GAAP results of operations. However, payments under the TRA are ultimately only made to the extent we realize the offsetting cash savings on our income taxes due to the tax goodwill and other intangibles deduction. See Note 9 to our Financial Statements for additional details.
Earnout Liability and Private Placement Warrants Liability
The fair values of our Earnout Securities liability and Private Placement Warrants liability were determined using Monte Carlo simulations that have various significant unobservable inputs. The assumptions used could have a material impact on the valuation of these liabilities, and include our best estimate of expected volatility, expected holding periods and appropriate discounts for lack of marketability. Changes in the estimated fair values of these liabilities may have material impacts on our results of operations in any given period, as any increases in these liabilities have a corresponding negative impact on our GAAP results of operations in the period in which the changes occur. See Note 9 to our Financial Statements for additional details.
96
Equity-based Compensation
The fair values of our equity-based compensation RSU and Incentive Unit grants are generally determined using our Class A Share price on the grant date, adjusted for the lack of dividend participation during the vesting period, and the application of a discount for lack of marketability on RSUs and Incentive Units that are subject to a
one-year
post-vesting transfer restriction. The higher these discounts, the lower the compensation expense taken over time for these grants.For the Seller Earnout Securities and Oak Street Earnout Units that were classified as equity-based compensation for GAAP, we used Monte Carlo simulations that had various significant unobservable inputs. The assumptions used have a material impact on the valuation of these grants, and include our best estimate of expected volatility, expected holding periods and appropriate discounts for lack of marketability. The higher the expected volatility, the higher the compensation expense taken each period for these grants. The higher the expected holding periods and discount for lack of marketability, the lower the compensation expense taken each period for these grants. See Note 8 to our Financial Statements for additional details.
Deferred Tax Assets
As a result of the Business Combination, deferred tax assets comprise one of our largest assets in our consolidated and combined statements of financial condition. Substantially all of our deferred tax assets relate to the goodwill and other intangible assets deductible for tax purposes that arose in connection with the purchase of Common Units with proceeds from the Business Combination, as well as subsequent payments expected to be made under the TRA and other capital transactions that have occurred since the Business Combination. In accordance with relevant tax rules, we expect to take substantially all of these goodwill and other intangible deductions over the
15-year
period following the Business Combination Date. To the extent we generate insufficient taxable income to take the full deduction in any given year, we will generate a net operating loss (“NOL”) that is available for us to use over an indefinite carryforward period in order to fully realize the deferred tax assets.When evaluating the realizability of deferred tax assets, all evidence—both positive and negative—is considered. This evidence includes, but is not limited to, expectations regarding future earnings, future reversals of existing temporary tax differences and tax planning strategies. We did not take into account any tax planning strategies when arriving at this conclusion; however, the other assumptions underlying the taxable income estimates, are based on our near-term operating model. If we experience a significant decline in AUM for any extended time during the period for which these estimates relate and we do not otherwise experience offsetting growth rates in other periods, we may not generate taxable income sufficient to realize the deferred tax assets and may need to record a valuation allowance. However, given the indefinite carryforward period available for NOLs and the conservative estimates used to prepare the taxable income projections, the sensitivity of our estimates and assumptions are not likely to have a material impact on our conclusion that a valuation allowance is not needed.
Impairment of Goodwill and Other Intangible Assets
Our ongoing accounting for goodwill and other intangible assets acquired as part of the Business Combination requires us to make significant estimates and assumptions as we exercise judgement to evaluate these assets for impairment. We generally undertake a qualitative review of factors that may indicate whether an impairment exists. We take into account factors such as the growth in AUM and FPAUM, general economic conditions, and various other factors that require judgement in deciding whether a quantitative analysis should be undertaken. Our evaluation for indicators of impairment may not capture a potential impairment, which could result in an overstatement of the carrying values of goodwill and other intangible assets.
97
Impact of Changes in Accounting on Recent and Future Trends
We believe that none of the changes to GAAP that went into effect during the year ended December 31, 2021, or that have been issued but that we have not yet adopted, are expected to substantively impact our future trends.
98
MANAGEMENT
Executive Officers and Directors
The following persons are the members of the board of directors of Blue Owl (the “Board”) and Blue Owl’s executive officers as of the date of this prospectus:
Name | Age | Position with Blue Owl | ||||
Douglas I. Ostrover | 59 | Chief Executive Officer and Chairman of the Board | ||||
Marc S. Lipschultz | 53 | Co-President and Director | ||||
Michael Rees | 47 | Co-President and Director | ||||
Craig W. Packer | 55 | Senior Managing Director and Director | ||||
Sean Ward | 43 | Senior Managing Director and Director | ||||
Marc Zahr | 42 | President of the Oak Street Division and Director | ||||
Alan J. Kirshenbaum | 50 | Chief Financial Officer | ||||
Andrew Laurino | 46 | Senior Managing Director | ||||
Andrew R. Polland | 47 | Chief Operating Officer | ||||
Neena A. Reddy | 44 | General Counsel and Secretary | ||||
Dana Weeks | 51 | Director | ||||
Claudia Holz | 64 | Director | ||||
Andrew S. Komaroff | 53 | Director | ||||
Stacy Polley | 53 | Director | ||||
Douglas I. Ostrover
Co-Founder
and Chief Executive Officer of Blue Owl Capital Inc., a member of the firm’s Executive Committee and the Chairman of the firm’s Board of Directors. Mr. Ostrover is also aCo-Founder
of Owl Rock and is a member of the Owl Rock Investment Committees. In addition, Mr. Ostrover served on the boards of ORCC and ORCC II from 2016 to 2021, on the board of ORTF from 2018 to 2021 and on the boards of ORCC III and ORCIC from 2020 to 2021. Prior toco-founding
Owl Rock, Mr. Ostrover was one of the founders of GSO Capital Partners (GSO), Blackstone’s alternative credit platform, and a Senior Managing Director at Blackstone until 2015. Prior toco-founding
GSO in 2005, Mr. Ostrover was a Managing Director and Chairman of the Leveraged Finance Group of Credit Suisse First Boston (CSFB). Prior to his role as Chairman, Mr. Ostrover was GlobalCo-Head
of CSFB’s Leveraged Finance Group, during which time he was responsible for all of CSFB’s origination, distribution and trading activities relating to high yield securities, leveraged loans, high yield credit derivatives and distressed securities. Mr. Ostrover was a member of CSFB’s Management Council and the Fixed Income Operating Committee. Mr. Ostrover joined CSFB in November 2000 when CSFB acquired Donaldson, Lufkin & Jenrette (“DLJ”), where he was a Managing Director in charge of High Yield and Distressed Sales, Trading and Research. Mr. Ostrover had been a member of DLJ’s high yield team since he joined the firm in 1992. Mr. Ostrover is actively involved innon-profit
organizations including serving on the Board of Directors of the Michael J. Fox Foundation and the Mt. Sinai Health System. Mr. Ostrover also serves on the investment committee of the Brunswick School. Mr. Ostrover received a B.A. in Economics from the University of Pennsylvania and an M.B.A. from New York University Stern School of Business.Marc S. Lipschultz
Co-Founder
and theCo-President
of Blue Owl Capital Inc., a member of the firm’s Executive Committee and a member of the firm’s Board of Directors. Mr. Lipschultz is also aCo-Founder
and President of Owl Rock, serves as theCo-Chief
Investment Officer of each of the Owl Rock Advisers and is a member of the Investment Committees of each of the Owl Rock Advisors. Prior toco-founding
Owl Rock, Mr. Lipschultz spent more than two decades at KKR, and he served on the firm’s Management Committee and as the Global Head of Energy and Infrastructure. Mr. Lipschultz has a wide range of experience in alternative investments, including leadership roles in private equity, infrastructure and direct-asset investing. Prior to joining KKR, Mr. Lipschultz was with Goldman, Sachs & Co., where he focused on mergers and acquisitions and principal investment activities. Mr. Lipschultz serves on the board of the Hess Corporation and is actively involved in a99
variety of nonprofit organizations, serving as a trustee and board member of the American Enterprise Institute for Public Policy Research, Michael J. Fox Foundation, Mount Sinai Health System, Riverdale Country School, Stanford University Board of Trustees and as the Chairman Emeritus of the Board of the 92nd Street Y. Mr. Lipschultz received an A.B. with honors and distinction, Phi Beta Kappa, from Stanford University and an M.B.A. with high distinction, Baker Scholar, from Harvard Business School.
Michael Rees
Co-Founder
and theCo-President
of Blue Owl Capital Inc., a member of the firm’s Executive Committee and a member of the firm’s Board of Directors. Mr. Rees also serves as the Head of Dyal Capital, a division of Blue Owl, which he founded when it was a division of Neuberger Berman Group. Prior to founding Dyal Capital, Mr. Rees was a founding employee and stockholder of Neuberger Berman Group, transitioning from Lehman Brothers as part of the management buyout transaction in May 2009, and was the first Chief Operating Officer of Neuberger’s alternatives business. Mr. Rees was an employee of Lehman Brothers from April 2001 through May 2009. He had numerous roles at Lehman Brothers and was responsible for strategic acquisitions for the Investment Management Division at Lehman Brothers. From 2003 through 2006, he was Head of Asset Management Strategy. Prior to joining Lehman Brothers, he was an associate at Marakon Associates. He received a master’s degree in Mechanical Engineering and a master’s degree in Technology Policy from Massachusetts Institute of Technology. Mr. Rees currently serves on the Board of Directors of The Opportunity Network, an education focusednon-profit
that supports underserved students with postsecondary and career readiness education. Mr. Rees received a B.S. in Mechanical Engineering and a B.A. in Political Science from the University of Pittsburgh.Craig W. Packer
Co-Founder
and Senior Managing Director of Blue Owl Capital Inc., a member of the firm’s Executive Committee and a member of the firm’s Board of Directors. Mr. Packer is also aCo-Founder
of Owl Rock Capital Partners, serves asCo-Chief
Investment Officer and a member of the Executive Committees of the Owl Rock Advisers and President and Chief Executive Officer of each of the Owl Rock BDCs and is a member of the Owl Rock Investment Committees. In addition, Mr. Packer has served on the boards of the Company and ORCC since 2016, on the board of ORTF since 2018 and on the boards of ORCC III and on ORCIC since 2020. Prior toco-founding
Owl Rock, Mr. Packer wasCo-Head
of Leveraged Finance in the Americas at Goldman, Sachs & Co. where he served on the Firmwide Capital Committee. Mr. Packer joined Goldman, Sachs & Co. as a Managing Director and Head of High Yield Capital Markets in 2006 and was named partner in 2008. Prior to joining Goldman Sachs, Mr. Packer was the Global Head of High Yield Capital Markets at Credit Suisse First Boston, and before that he worked at Donaldson, Lufkin & Jenrette. Mr. Packer serves as Treasurer and member of the Board of Trustees of Greenwich Academy,Co-Chair
of the Honorary Board of Kids in Crisis, anon-profit
organization that serves children in Connecticut, Board Member of the University of Virginia Athletics Foundation and is on the Foundation Board for the McIntire School of Commerce, University of Virginia. Mr. Packer earned a B.S. from the University of Virginia and an M.B.A. from Harvard Business School.Sean Ward
Marc Zahr
Co-Founder
of Oak Street – real estate division of Blue Owl, a member of the Blue Owl Capital Inc.’s Executive Committee, and a member of the firm’s Board of Directors. In his role, Mr. Zahr is responsible for the overall direction and leadership of Oak Street. He100
manages and oversees Oak Street’s investment activities which include sourcing, underwriting and negotiating Oak Street’s acquisitions. Mr. Zahr also leads the Investment Committee and new product development. Additionally, Mr. Zahr spearheaded the integration of Oak Street’s Seeding & Strategic Capital platform. Prior to Oak Street, Mr. Zahr served as Vice President at American Realty Capital where he was responsible for the analytics and acquisition activities within the company’s real estate portfolios. He also served as a Fixed Income Trader at TM Associates and an Associate at Merrill Lynch. Mr. Zahr received a B.A. in Communications from the University of Dayton.
Alan J. Kirshenbaum
non-profit
organizations including the Boy Scouts of America and as trustee for the Jewish Federation of Greater MetroWest NJ. Mr. Kirshenbaum also is a member of the Rutgers University Dean’s Cabinet. Mr. Kirshenbaum received a B.S. from Rutgers University and an M.B.A. from New York University Stern School of Business.Andrew Laurino
Andrew R. Polland
Co-Chair
of its Operating Committee. Prior to Blue Owl, Andrew was the Chief Operating Officer of Dyal Capital, when it was a division of Neuberger Berman. Prior to Dyal Capital, Andrew was the Chief Operating Officer, General Counsel and Chief Compliance Officer of Hoplite Capital Management, L.P. Prior to Hoplite, Andrew was the General Counsel and Chief Compliance Officer of MSD Partners, L.P. and the Chief Compliance Officer of MSD Capital, L.P. Prior to MSD, Andrew served as the Deputy Chief Compliance Officer and Head of Litigation of Fortress Investment Group LLC, and the Chief Compliance Officer of its affiliated broker-dealer (Fortress Capital Formation LLC). Prior to that, Andrew was a litigation associate at Davis Polk & Wardwell LLP. Andrew began his career as a federal law clerk to United States District Court Judge Charles P. Sifton. He received a J.D., magna cum laude, from the University of Pennsylvania, and a B.S. (with honors) in Industrial Labor Relations from Cornell University.Neena Reddy
101
Sachs & Co LLC, dedicated to Goldman Sachs Asset Management L.P. (“GSAM”), where she was responsible for GSAM managed direct alternative products, including private credit. Prior to GSAM, Ms. Reddy practiced as a corporate attorney at Boies Schiller & Flexner LLP and at Debevoise & Plimpton LLP. Prior to becoming an attorney, Ms. Reddy was a financial analyst in the private wealth division at Goldman, Sachs & Co. Ms. Reddy received a B.A. in English, magna cum laude, from Georgetown University and a J.D. from New York University School of Law.
Dana Weeks
Co-Founder
of MedTrans Go, a healthcare technologystart-up
based in Atlanta, GA. Prior to joining MedTrans Go, Ms. Weeksco-founded
the Black Angel Tech Foundation, created to support and increase the number of underrepresented minorities in technology, and served in her role as President from April 2016 to September 2019. Ms. Weeks has also held positions at AT&T, Pfizer, and in several innovative entrepreneurial ventures. Ms. Weeks is a member of the Board of Trustees of The Westminster Schools of Atlanta, the Treasurer of the Atlanta Chapter of Jack & Jill, an advisory board member of Stride: Win Your Way, a sports optimization platform for coaches and athletes, and a Board Member for the Alliance Theater of Atlanta. She also serves on several Task Forces and Committees at both Stanford and Columbia Business School, including serving as aco-chair
of the Stanford LEAD Council, a member of the Stanford Humanities & Sciences Council, and a founding member of the Women’s Circle at Columbia Business School. Ms. Weeks earned a B.A. with Honors from Stanford University and an MBA from Columbia Business School.Claudia Holz
partner-in-charge
Andrew S. Komaroff
employee-led
buyout in 2009. Prior to joining the firm, Mr. Komaroff was a management consultant at McKinsey & Co., a principal at Ripplewood Holdings, a New York and Tokyo-based private equity firm, and the Executive Vice President of the Equavant Group, an internet exchange acquired in 2001. Mr. Komaroff serves on the Board of Trustees for The Writing Revolution, a nationalnot-for-profit
Stacy Polley
to 2016 and was a founding member of Goldman Sachs’ Client and Business Standards Committee (CBSC) formed in response to the 2008 financial crisis and served as the
Co-Chair
of the Securities Division of CBSC from 2008 to 2015. She also served as the Global Head of Client Relationship Management & Strategy from September 2014 to December 2018 and as a member of the Americas Diversity Committee from 2012 to 2015. Previously, Ms. Polley worked as a Consultant in the Information Technology Practice of EY from August 1989 to July 1992. Ms. Polley is currently a board advisor of HighPost Capital, a consumer-focused growth equity firm, where she has served since November 2019, as well as fintech startup Bumped, where she has served since January 2021. She has also served on the board of New York102
City Center since September 2012. She has served on the board of directors of the Company since May 2021 and is a member of the Company’s audit committee. Ms. Polley earned a B.S. in Finance and Management Information Systems from State University of New York at Albany and an MBA in finance from the Wharton School of the University of Pennsylvania.
Family Relationships
There are no family relationships among any of our executive officers or directors.
Board Structure
Our Board consists of ten members. Effective as of the Closing, the following people were appointed as directors of the Company:
Class
I directors
Class
II directors
Class
III directors
Our directors are divided into three classes serving staggered three-year terms. Class I, Class II and Class III directors will serve until our annual meetings of stockholders in 2025, 2023 and 2024, respectively. At each annual meeting of stockholders, directors will be elected to succeed the class of directors whose terms have expired. This classification of our Board could have the effect of increasing the length of time necessary to change the composition of a majority of the Board.
In addition, in connection with the Business Combination, we entered into an investor rights agreement with the Owl Rock Equityholders and Dyal Equityholders. This agreement grants the Owl Rock Equityholders and the Dyal Equityholders and Neuberger the right to designate nominees to our Board subject to the maintenance of certain ownership requirements. See “” for additional information.
Certain Relationships and Related Party Transactions—Investor Rights Agreement
Independence of the Board of Directors
NYSE listing standards require that a majority of the board of directors be independent, subject to the controlled company exception. An “independent director” is defined generally as a person other than an officer or employee of the company or its subsidiaries or any other individual having a relationship which in the opinion of the board of directors would interfere with the director’s exercise of independent judgment in carrying out the responsibilities of a director.
The Board has determined that each of Dana Weeks, Claudia Holz and Stacy Polley is an independent director under applicable SEC and NYSE rules. In addition, we anticipate that each of them will qualify as independent directors for the purpose of serving on the audit committee of Blue Owl under SEC rules.
Controlled Company Exemption
The Owl Rock Principals and Dyal Principals are the beneficial owners of 80% of the voting control of our outstanding capital stock, as a result of which the Owl Rock Principals and Dyal Principals will have the power to elect a majority of Blue Owl’s directors and have agreed to vote in favor of each other’s director designees. Pursuant to the New York Stock Exchange listing standards, a company of which more than 50% of the voting power for the election of directors is held by an individual, a group or another company qualifies as a “controlled
103
company.” Therefore, we are not subject to the NYSE listing standards that would otherwise require us to have: (i) a majority of “independent directors,” as defined under the listing standards of the NYSE; (ii) a nominating committee comprised solely of independent directors; (iii) compensation of our executive officers determined by a majority of the independent directors or a compensation committee comprised solely of independent directors; and (iv) director nominees selected, or recommended for the Board’s selection, either by a majority of the independent directors or a nominating committee comprised solely of independent directors.
Pursuant to the New York Stock Exchange listing standards, as a controlled company Blue Owl is not required to have a board of directors composed of a majority of independent directors. An “independent director” is defined generally as a person other than an officer or employee of the company or its subsidiaries or any other individual having a relationship which in the opinion of the board of directors would interfere with the director’s exercise of independent judgment in carrying out the responsibilities of a director.
Committees of the Board of Directors
The Board of Blue Owl maintains an audit committee. The responsibilities of this committee of the Board and its composition are as follows.
Audit Committee
The Board of Blue Owl maintains an audit committee. The audit committee’s duties, which are specified in Blue Owl’s audit committee charter, include, but are not limited to:
| • | maintain open communications with the independent accountants, internal auditors or other personnel responsible for the internal audit function outside valuation experts, executive management, and the Board; |
| • | meet separately, from time to time, with management, internal auditors or other personnel responsible for the internal audit function and the independent accountants to discuss matters warranting attention by the audit committee; |
| • | regularly report committee actions to the Board and make recommendations as the audit committee deems appropriate; |
| • | review the financial results presented in all reports filed with the SEC; |
| • | review reports issued by regulatory examinations and consider the results of those reviews to determine if any findings could have a material effect on the Company’s financial statements or its internal controls and procedures; |
| • | discuss the Company’s disclosure, oversight of and conformity with the Company’s Code of Business Conduct and Code of Ethics, and matters that may have a material effect on the Company’s financial statements, operations, compliance policies, and programs; |
| • | review and reassess the adequacy of the audit committee’s charter at least annually and recommend any changes to the full Board; and |
| • | take other actions required of the audit committee by law, applicable regulations, or as requested by the Board. |
The members of the audit committee are Dana Weeks, Claudia Holz and Stacy Polley, with Claudia Holz serving as the chair of the committee. Under the rules of the SEC, members of the audit committee must also meet heightened independence standards. Our Board has determined that all of the members of the audit committee are independent directors as defined under the applicable rules and regulations of the SEC and the New York Stock Exchange with respect to audit committee membership. We also believe that Claudia Holz qualifies as our “audit committee financial expert,” as such term is defined in Item 401(h) of Regulation
S-K.
104
Code of Business Conduct and Ethics
Blue Owl adopted a code of business conduct and ethics that applies to all of its employees, officers and directors, including those officers responsible for financial reporting. The code of business conduct and ethics is available on Blue Owl’s website at www.blueowl.com. Blue Owl expects that, to the extent required by law, any amendments to the code, or any waivers of its requirements, will be disclosed on its website.
Limitation on Liability and Indemnification Matters
Blue Owl’s certificate of incorporation contains provisions that limit the liability of Blue Owl’s directors for damages to the fullest extent permitted by Delaware law. Consequently, Blue Owl’s directors are not personally liable to Blue Owl or its stockholders for damages as a result of an act or failure to act in his or her capacity as a director, unless:
| • | the presumption that directors are acting in good faith, on an informed basis, and with a view to the interests of Blue Owl has been rebutted; and |
| • | it is proven that the director’s act or failure to act constituted a breach of his or her fiduciary duties as a director and such breach involved intentional misconduct, fraud or a knowing violation of law. |
105
EXECUTIVE COMPENSATION
Compensation Discussion & Analysis
In this Compensation Discussion & Analysis we describe our executive compensation philosophy and programs and compensation decisions regarding the 2021 compensation of our NEOs listed below in the “Summary Compensation Table,” who consist of our principal executive officer, principal financial officer, and the three other most highly compensated executive officers. For fiscal year 2021, our NEOs were Douglas Ostrover, Chief Executive Officer; Alan Kirshenbaum, Chief Financial Officer; Michael Rees,
Co-President;
Sean Ward, Senior Managing Director; and Marc Zahr, President of Oak Street Division of Blue Owl.Compensation Philosophy
Our business as a global alternative asset manager is dependent on the performance of our NEOs and other key employees. Among other things, we depend on their ability to find, select and execute investments, oversee and improve the operations of our portfolio companies, find and develop relationships with fund investors and other sources of capital and provide other services essential to our success.
Our compensation philosophy has several primary objectives: (i) attract, motivate and retain talented and experienced executives in our industry, (ii) reward executives whose knowledge, skills and performance are critical to our success, (iii) align executives’ interests with our fund investors and stockholders, (iv) foster a shared commitment among executives by aligning their individual goals with the goals of the executive management team and our company, (v) compensate our executives in a manner that incentivizes them to manage our business to meet our long-term objectives, and (vi) reinforce our culture and values.
One of our most important values is our
“one-firm”
approach with shared responsibility and success. Therefore, compensation is based on the performance of the Company as a whole, as well as on an individual’s contributions to the Company. For example, we do not compensate people based merely on an individual’s accomplishments in relation to the profits and losses of his or her division. In addition, we conduct, at least annually, an evaluation process of each employee’s contribution to the firm, including his or her commitment to the firm’s culture and values.Base salaries reflect our NEOs’ proficiency and experience in their respective roles. In addition to base salary, we utilize a blend of variable and long-term pay vehicles to further incentivize and retain talent and provide an overall compensation package that is competitive with the market. Performance-based discretionary bonuses are generally paid annually to employees based on our profitability, market analysis and employee performance.
Management equity ownership is a guiding principle for us, and we apply that principle to employees: every professional employee of the firm is expected to have an equity interest in OWL. This equity ownership serves to align the interests of our employees with those of our stockholders.
Our compensation program is a management tool supporting our mission and values. We believe our program supports, reinforces and aligns our values, business strategy and operations with the goal of increasing distributable earnings. Compensation arrangements with our NEOs are described below under “Elements of Compensation.”
We did not engage a compensation consultant with respect to determining our NEOs’ compensation in 2021. We do not benchmark or set our NEOs’ compensation by reference to the compensation of a specific peer group.
Determination of Compensation for NEOs
We do not have a compensation committee. Other than with respect to Messrs. Ostrover’s, Zahr’s and Rees’s compensation, our Board has delegated its authority to approve our NEOs’ compensation to the
106
Management Committee. Messrs. Kirshenbaum’s and Ward’s compensation was approved by our Management Committee upon the recommendation of our Chief Executive Officer. Our Management Committee recommended Messrs. Ostrover’s, Zahr’s and Rees’s compensation after considering their experience and contributions to the business, which was approved by the Board at the time of the Business Combination in respect of Messrs. Ostrover and Rees, and in connection with the Oak Street Acquisition in respect of Mr. Zahr. The Board makes all final determinations regarding equity grants to our NEOs.
Mitigation of Risk
The Company has determined that any risks arising from its compensation programs and policies are not reasonably likely to have a material adverse effect on the Company. The Company’s compensation programs and policies mitigate risk by combining performance-based, long-term compensation elements with payouts that are highly correlated to the value delivered to stockholders.
Elements of Compensation
Our current executive compensation program consists of a combination of the following components: (i) base salary, (ii) cash incentive awards linked to our overall performance, (iii) periodic grants of long-term equity-based compensation, such as Incentive Units and RSUs (each as defined below), and (iv) other executive benefits and perquisites. We combine these elements in order to formulate competitive compensation packages that provide competitive pay, reward the achievement of financial, operational and strategic objectives and align the interests of our NEOs and other senior personnel with those of our stockholders.
Base Salary
For 2021, each of our NEOs (other than Mr. Zahr, who did not receive a base salary from Blue Owl in 2021 since the Oak Street Acquisition closed on December 29, 2021) was paid a salary at an annualized rate of $500,000. Although we believe that the base salaries of our NEOs should not typically be the most significant amount of total compensation, our Management Committee determined that this amount was sufficient to attract and retain top talent, and to assist with the payment of living costs throughout the year.
Short-Term Cash Bonus Payments
Our Management Committee has authority to award cash bonuses to our NEOs at certain times during the year and at the end of the year. The cash bonuses are intended to offer incentive compensation by rewarding the achievement of corporate and individual performance objectives. Such cash bonuses are subject to annual review by the Management Committee. We believe that establishing cash bonus opportunities helps us attract and retain qualified and highly skilled executives. These bonuses are intended to reward executives who have a positive impact on corporate results.
At this time, we are not disclosing the specific performance targets because disclosure of the specific targets would signal areas of strategic focus and give competitors harmful insight into the direction of our business. We are committed to the long-term success and growth of our enterprise and disclosing short-term objectives would run counter to both our compensation and business philosophy of focusing on long-term goals and, as a result, could result in confusion for investors. As we gain experience as a public company and expand, we will continue to assess whether the disclosure of specific performance metrics will cause us competitive harm.
Performance-Based Bonus Payments
With respect to Messrs. Ostrover and Rees, performance-based
non-equity
compensation is paid quarterly, in an amount equal to 1.33% of the management fees of Blue Owl (subject to, in certain circumstances, approval rights in each case as set forth in the Investor Rights Agreement) less the NEOs’ base salary (subject to a 10%107
holdback and an annual
true-up
following the completion of the Company’s annual audit). Prior to the Business Combination, Mr. Ostrover received 2.5% of gross revenues of Owl Rock. With respect to Mr. Zahr, there was no performance-basednon-equity
compensation paid by Blue Owl in 2021, as the Oak Street Acquisition closed on December 29, 2021. Mr. Zahr has similar performance-basednon-equity
compensation as Messrs. Ostrover and Rees, which begins at 0.60% of the management fees of Blue Owl and increases to 1.33% of the management fees of Blue Owl based upon the achievement of the Oak Street Triggering Events.Discretionary Bonus Payments
Messrs. Kirshenbaum and Ward received discretionary bonus payments for their performance in 2021. The discretionary bonuses awarded to Messrs. Kirshenbaum and Ward recognize each individual’s contributions to our overall goals and performance. We intend the discretionary bonus payments to reward Messrs. Kirshenbaum and Ward for assisting us in achieving our annual goals, both for the Company as a whole and in each individual’s respective area of responsibility. Factors that were included in determining the size of the bonus payments include Messrs. Kirshenbaum’s and Ward’s accomplishments in driving our results, their leadership and management of their respective teams and our overall performance. Comparisons were made to prior-year performance, to our other senior professionals, and compensation that is commensurate within our industry with the intention to reward, motivate and retain Messrs. Kirshenbaum and Ward.
Long-Term Equity-Based Compensation
We believe that equity-based compensation awards enable us to attract, motivate, retain and adequately compensate executive talent. To that end, we have awarded equity-based compensation in the form of profits interests (“Incentive Units”). We believe equity awards provide executives with a significant long-term interest in our success by rewarding the creation of stockholder value over time.
In 2021, our Chief Executive Officer and Board determined the size of equity granted to our NEOs. Our Chief Executive Officer and Board considered each NEO’s current position with the Company, the size of their total compensation package and the amount of existing vested and unvested equity awards, if any, then held by the NEO when determining the size of equity granted to our NEOs. No formal benchmarking efforts are made by our Chief Executive Officer or Board with respect to the size of equity grants made to NEOs and, in general, the determination process is informal.
2021 Omnibus Equity Incentive Plan
At the special meeting of the Altimar stockholders held on May 18, 2021, the Altimar stockholders considered and approved the Blue Owl Capital Inc. 2021 Omnibus Equity Incentive Plan (as amended, the “2021 Omnibus Plan”). The 2021 Omnibus Plan was previously approved, subject to stockholder approval, by the board of Altimar on May 17, 2021. The 2021 Omnibus Plan became effective immediately upon the completion of the Business Combination. The 2021 Omnibus Plan allows for the grant of equity incentives, such as restricted stock units (“RSUs”), Incentive Units, stock options, stock appreciation rights, restricted stock.
In 2021, the Company granted Messrs. Kirshenbaum and Ward Incentive Units. Incentive Units entitle the recipients to receive, through Blue Owl Management Vehicle LP (“Blue Owl MV”), distributions from Blue Owl Capital Holdings LP (“Blue Owl Holdings”) and Blue Owl Capital Carry LP (“Blue Owl Carry”) in accordance with the terms of, and subject to any restrictions contained in, the applicable limited partnership agreement for each of Blue Owl Carry, Blue Owl Holdings and Blue Owl MV, and will be counted against the share limit under the 2021 Omnibus Plan on a 1.25:1.00 basis.
On October 22, 2021, the Company awarded 1,500,000 Incentive Units to Mr. Ward. Such Incentive Units will vest in substantially equal installments on August 15 of 2024, 2025 and 2026, subject to Mr. Ward’s continued employment by, or service to, the Company on each applicable vesting date. If Mr. Ward’s
108
employment or service is terminated by the Company without cause or due to death or disability, the plan administrator has discretion to accelerate and vest any Incentive Units upon such termination, and, upon any other termination, any unvested profits interests will be immediately terminated and forfeited for no consideration. Upon a Change in Control (as defined in the 2021 Omnibus Plan), the vesting of all or a portion of any unvested Incentive Units may be accelerated in the discretion of the plan administrator.
On December 15, 2021, the Company awarded 100,000 Incentive Units to Mr. Kirshenbaum, and such Incentive Units were fully vested on grant.
In addition to any awards that it may grant on an ongoing basis, the Company expects to make grants pursuant to the 2021 Omnibus Plan under annual or
year-end
incentive programs, including grants of Incentive Units and/or RSUs pursuant to the 2021 Omnibus Plan to certain of its NEOs on an annual basis on or around December or January of each year.Business Combination Awards
On the date of the Business Combination, Owl Rock merged with Dyal Capital, a former division of Neuberger Berman Group LLC (“Neuberger Berman”), to form the Company. Prior to the Business Combination, Neuberger Berman granted profits interest to certain Dyal Capital employees (the “Dyal Profits Interests”), which were treated as equity-based compensation grants. In connection with the closing of the Business Combination, the Dyal Profits Interests were replaced with grants of Common Units of the Blue Owl Operating Partnerships, which were immediately vested on grant. Incrementally, the Dyal Capital employees also received seller earnout units (“Seller Earnout Units”). The exchange of Dyal Profits Interests for Common Units and Seller Earnout Units was treated as a replacement award under GAAP. Additionally, Mr. Kirshenbaum (and other related parties of Mr. Kirshenbaum) also received Seller Earnout Units incremental to Mr. Kirshenbaum’s
pre-Business
Combination equity. The exchange of Dyal Profits Interests and the issuance of Seller Earnout Units to Mr. Kirshenbaum in connection with the Business Combination were not as a result of any compensation decisions made by the Management Committee; however, such amounts were required to be accounted for as compensation under GAAP. As a result, pursuant to SEC rules, the incremental fair value associated with such awards was required to be reflected in the “2021 Summary Compensation Table” and the “2021 Grants of Plan-Based Awards” table, but this value was not reflective of any new compensation granted by the Management Committee to Messrs. Rees, Ward and Kirshenbaum.The Seller Earnout Units were issued as two series: Series
E-1
and SeriesE-2.
SeriesE-1
andE-2
vested upon anE-1
andE-2
triggering event (an“E-1
Triggering Event” and an“E-2
Triggering Event”), respectively, which occurred when the volume weighted-average price of our Class A Share exceeded $12.50 and $15.00, respectively, for 20 consecutive trading days. The SeriesE-1
Seller Earnout Units experienced anE-1
Triggering Event on July 21, 2021. The SeriesE-2
Seller Earnout Units experienced anE-2
Triggering Event on November 3, 2021. Upon theE-1
Triggering Event andE-2
Triggering Event, the Seller Earnout Units were settled with Common Units.Oak Street Earnouts
In connection with the Oak Street Acquisition, the Company agreed to make additional payments of Common Units to Mr. Zahr in two tranches upon the occurrence of certain Oak Street triggering events (such units, “Oak Street Earnout Units”). Such triggering events (each, an “Oak Street Triggering Event”) are based on achieving a certain level of quarterly management fee revenues from existing and future Oak Street products. These Oak Street Earnout Units issued as consideration in the Oak Street Acquisition were not as a result of any compensation decisions made by the Management Committee; however, such amounts were required to be accounted for as compensation under GAAP. As a result, pursuant to SEC rules, the fair value associated with such award is required to be reflected in the “2021 Summary Compensation Table” and the “2021 Grants of Plan-Based Awards” table, but this value is not reflective of any new compensation granted by the Management Committee to Mr. Zahr.
109
The Oak Street Triggering Events are subject to meeting a minimum level of quarterly management fees from Oak Street products, and the Oak Street Triggering Event for the second tranche may not occur in the same quarter as the first tranche. The first and second Oak Street Triggering Events will occur when quarterly management fees from Oak Street products reaches $22.0 million and $28.0 million, respectively. The earliest dates on which the first and second Oak Street Triggering Events can occur are January 1, 2023 and January 1, 2024, respectively.
The Oak Street Earnout Units are also subject to acceleration and will be settled upon the occurrence of: (i) any event where any “person” or “group” (as such terms are used in Section 13(d) and 14(d) of the Exchange Act) is or becomes the “beneficial owner” (as defined in Rules
13d-3
and13d-5
under the Exchange Act), directly or indirectly, of more than 50% of the voting power of the outstanding voting securities of certain Blue Owl affiliates; (ii) any sale of all or substantially all of the assets of certain Blue Owl affiliates to another person in one transaction or series of related transactions; (iii) the termination of Mr. Zahr’s employment by the Company without Cause or the resignation by Mr. Zahr with Good Reason (each as defined in Mr. Zahr’s Employment Agreement); or (iv) a Change of Control (as defined in the Agreement and Plan of Merger, dated as of October 17, 2021, by and among Blue Owl and the other parties thereto (the “Merger Agreement”)) (each, an “Oak Street Earnout Unit Acceleration Event”).Other Executive Benefits and Perquisites
We provide the following benefits to our NEOs: (i) health insurance, (ii) life insurance and supplemental life insurance, (iii) short-term and long-term disability, and (iv) 401(k) plan. We also provide wealth management services to certain of our NEOs. We believe these benefits are generally consistent with those offered by other companies and specifically with those companies with which we compete for employees.
Termination Payments
We believe that a strong, experienced management team is essential to the best interests of the Company and our stockholders. We have entered into agreements with some of our NEOs pursuant to which such NEOs are entitled to certain benefits upon certain terminations. These termination benefits are enumerated and quantified in the section captioned “”
Executive Compensation – Potential Payments upon Termination or Change in Control.
Section 280G of the Internal Revenue Code
Section 280G of the Code disallows a tax deduction with respect to “excess parachute payments” to certain executive officers of companies that undergo a change in control. In addition, Section 4999 of the Code imposes a 20% excise tax penalty on the individual receiving the “excess parachute payment.” Parachute payments are compensation that is linked to or triggered by a change in control and may include, but are not limited to, bonus payments, severance payments, certain fringe benefits, and payments and acceleration of vesting from long-term incentive plans or programs and other equity-based compensation. “Excess parachute payments” are parachute payments that exceed a threshold determined under Section 280G of the Internal Revenue Code based on an executive officer’s prior compensation. In approving compensation arrangements for our NEOs in the future, we expect that the Board will consider all elements of the cost to us of providing such compensation, including the potential impact of Section 280G of the Code. However, the Board may, in its judgment, authorize compensation arrangements that could give rise to loss of deductibility of Section 280G of the Code and the imposition of excise taxes under Section 4999 of the Code when it believes that such arrangements are appropriate to attract and retain executive talent.
Section 162(m) Compliance
Section 162(m) of the Internal Revenue Code limits us to a deduction for federal income tax purposes of no more than $1 million of compensation paid to certain executive officers in a taxable year. The Management Committee will consider the impact of Section 162(m) when making compensation decisions.
110
Section 409A Considerations
Another section of the Code, Section 409A, affects the manner by which deferred compensation opportunities are offered to our employees because Section 409A requires, among other things, that
“non-qualified
deferred compensation” be structured in a manner that limits employees’ abilities to accelerate or further defer certain kinds of deferred compensation. We intend to operate our existing compensation arrangements that are covered by Section 409A in accordance with the applicable rules thereunder, and we will continue to review and amend our compensation arrangements where necessary to comply with Section 409A.Accounting for Equity-Based Compensation
We follow Financial Accounting Standards Board Accounting Standards Codification Topic 718 (“ASC 718”) for our equity-based compensation awards. ASC 718 requires companies to calculate the grant date fair value of their equity-based awards using a variety of assumptions. ASC 718 also requires companies to recognize the compensation cost of their equity-based awards in their income statements over the period that an associate is required to render service in exchange for the award. Future grants of equity- based awards under our equity incentive award plans will be accounted for under ASC 718. We anticipate that the Management Committee will regularly consider the accounting implications of significant compensation decisions, especially in connection with decisions that relate to our equity incentive award plans and programs. As accounting standards change, we may revise certain programs to appropriately align accounting expenses of our equity awards with our overall executive compensation philosophy and objectives.
Stockholderand
Say-on-Pay
Say-on
Frequency VoteOur stockholders will have their first opportunity to cast an advisory vote to approve our NEOs’ compensation at our upcoming annual meeting of stockholders and to determine the frequency of these advisory votes. In the future, we intend to consider the outcome of theandvotes when making compensation decisions regarding our NEOs.
say-on-pay
say-on-frequency
2021 Summary Compensation Table
The following table summarizes the total compensation paid to or earned by each of our NEOs in 2020 and 2021.
Name and Principal Position | Year | Salary ($)(1) | Bonus ($)(2) | Stock Awards ($)(3) | Non-Equity Incentive Plan Compensation ($)(4) | All Other Compensation ($)(5) | Total ($) | |||||||||||||||||||||
Douglas Ostrover | 2021 | 500,000 | — | — | 10,898,160 | 239,018 | 11,637,178 | |||||||||||||||||||||
Chief Executive Officer | 2020 | 500,000 | — | — | 5,238,236 | 72,159 | 5,810,395 | |||||||||||||||||||||
Alan Kirshenbaum | 2021 | 500,000 | 3,233,781 | 3,662,481 | — | 55,046 | 7,451,308 | |||||||||||||||||||||
Chief Financial Officer | ||||||||||||||||||||||||||||
Michael Rees | 2021 | 311,546 | — | 693,673,522 | 6,606,809 | 75,616 | 700,667,493 | |||||||||||||||||||||
Co-President | 2020 | 500,000 | — | 99,520,200 | 41,412,500 | 11,087,500 | 152,520,200 | |||||||||||||||||||||
Sean Ward | 2021 | 311,546 | 3,829,654 | 170,614,779 | — | — | 174,755,979 | |||||||||||||||||||||
Senior Managing Director | 2020 | 500,000 | — | 21,461,400 | 12,712,500 | 3,337,500 | 38,011,400 | |||||||||||||||||||||
Marc Zahr | 2021 | — | — | 284,992,422 | — | — | 284,992,422 | |||||||||||||||||||||
President of Oak Street Division | ||||||||||||||||||||||||||||
| (1) | Represents annualized based salaries of $500,000 per NEO. For Messrs. Rees and Ward, salaries paid by the Company represent amounts earned from the date of the Business Combination. For Mr. Zahr, no amounts are reported, as the Oak Street Acquisition closed on December 29, 2021. |
111
| (2) | Represents the discretionary cash bonuses described in further detail above under the section titled “Elements of Compensation — Short-Term Cash Bonus Payments.” |
| (3) | Represents the grant date fair value of awards computed in accordance with ASC 718. For Messrs. Rees and Ward, $693,673,522 and $149,589,779, respectively, of these amounts relate to the exchange of Messrs. Rees’s and Ward’s pre-merger Dyal Profits Interests for (i) Common Units and (ii) Seller Earnout Units in connection with the Business Combination and not as a result of any compensation decisions made by the Management Committee; however, such amounts are required to be accounted for as compensation under GAAP. For Mr. Kirshenbaum, $2,206,481 of the amount relates to the issuance of Seller Earnout Units to Mr. Kirshenbaum (and other related parties of Mr. Kirshenbaum) in connection with the Business Combination. The remaining portion of the amounts presented for Messrs. Kirshenbaum and Ward relate to Incentive Units. For Mr. Zahr, this amount represents the Oak Street Earnouts issued in connection with the Oak Street Acquisition that were required to be accounted for as compensation rather than consideration under GAAP. See the table below and Note 13 to our Financial Statements for additional information. |
| (4) | For 2021, with respect to Messrs. Ostrover and Rees, represents quarterly payments in an amount equal to 1.33% of the management fees of Blue Owl that were earned subsequent to the date of the Business Combination (subject to, in certain circumstances, approval rights in each case as set forth in the Investor Rights Agreement) less the NEO’s base salary. For 2021, with respect to Mr. Ostrover, for periods prior to the date of the Business Combination, represents 2.5% of gross revenues of Owl Rock that Mr. Ostrover received. |
| (5) | For 2021, represents (i) with respect to Mr. Ostrover, $217,397 for wealth management services, $9,396 for supplemental medical insurance provided to certain executives, and $12,225 for tax gross-ups paid to Mr. Ostrover to cover the costs of the employee portion of the related payroll taxes due in respect of Mr. Ostrover’s compensation prior to the Business Combination; (ii) with respect to Mr. Kirshenbaum, $33,425 for wealth management services, $9,396 for supplemental medical insurance provided to certain executives, and $12,225 for taxgross-ups paid prior to the Business Combination; and (iii) with respect to Mr. Rees, $75,616 for wealth management services. |
2021 Grants of Plan-Based Awards
The following table sets forth certain information with respect to grants of plan-based awards for the year ended December 31, 2021, with respect to our NEOs. The amounts presented for the grant date fair value of the awards below were calculated in accordance with ASC 718.
Name | Grant Date | All Other Stock Awards: Number of Shares of Stock or Units (#) | Grant Date Fair Value of Stock and Option Awards ($) | |||||||||
Alan Kirshenbaum | 5/19/2021 | (1)(2) | 203,175 | 1,298,288 | ||||||||
| 5/19/2021 | (3)(4) | 203,175 | 908,192 | |||||||||
| 12/15/2021 | (5) | 100,000 | 1,456,000 | |||||||||
Michael Rees | 5/19/2021 | (6) | 73,428,587 | 660,857,292 | ||||||||
| 5/19/2021 | (1) | 3,021,752 | 19,308,997 | |||||||||
| 5/19/2021 | (3) | 3,021,753 | 13,507,233 | |||||||||
Sean Ward | 5/19/2021 | (6) | 15,834,778 | 142,513,002 | ||||||||
| 5/19/2021 | (1) | 651,637 | 4,163,960 | |||||||||
| 5/19/2021 | (3) | 651,637 | 2,912,817 | |||||||||
| 10/22/2021 | (7) | 1,500,000 | 21,025,000 | |||||||||
Marc Zahr | 12/29/2021 | (8) | 11,376,943 | 144,373,407 | ||||||||
| 12/29/2021 | (9) | 11,376,943 | 140,619,015 | |||||||||
| (1) | (Represents Series E-1 Seller Earnout Units issued in connection with the Business Combination. Such SeriesE-1 Seller Earnout Units vested upon the occurrence of theE-1 Triggering Event. |
112
| (2) | 196,403 of these Series E-1 Seller Earnout Units were deposited into the Alan Kirshenbaum 2015 Family Trust and the Kirshenbaum 2019 Family Trust on the grant date. Additionally, 3,386 of these SeriesE-1 Seller Earnout Units were transferred to a third party during 2021. |
| (3) | Represents Series E-2 Seller Earnout Units issued in connection with the Business Combination. Such SeriesE-2 Seller Earnout Units vested upon the occurrence of theE-2 Triggering Event. |
| (4) | 196,403 of these Series E-2 Seller Earnout Units were deposited into the Alan Kirshenbaum 2015 Family Trust and the Kirshenbaum 2019 Family Trust on the grant date. Additionally, 3,386 of these SeriesE-2 Seller Earnout Units were transferred to a third party during 2021. |
| (5) | Represents Incentive Units that were fully vested at grant. |
| (6) | Represents Common Units issued in exchange for Messrs. Rees’s and Ward’s Dyal Profits Interests in connection with the Business Combination. Such Common Units were fully vested at grant. |
| (7) | Represents Incentive Units that will vest in three equal installments on August 15, 2024, 2025 and 2026, subject to continued service of Mr. Ward and in accordance with the applicable Incentive Unit grant certificate. |
| (8) | Represents the grant of the first Oak Street Earnout Units in connection with the Oak Street Acquisition. Such earnouts will be settled in Common Units upon occurrence of the first Oak Street Earnout Triggering Event. |
| (9) | Represents the grant of the second Oak Street Earnout Units in connection with the Oak Street Acquisition. Such earnouts will be settled in Common Units upon occurrence of the second Oak Street Earnout Triggering Event. |
Narrative Description to the Summary Compensation Table and the Grant of Plan-Based Awards Table for 2021
Written Agreements
Blue Owl has entered into an employment and restrictive covenant agreement with each of Messrs. Ostrover, Rees and Zahr (each, an “Employment Agreement”), which were amended on February 25, 2022. The term of each Employment Agreement is perpetual until terminated in accordance with its terms. Messrs. Ostrover, Rees and Zahr each have the right to terminate their employment voluntarily at any time, subject to minimum notice requirements. With respect to Messrs. Ostrover and Rees, Blue Owl may only terminate such NEO’s employment for cause (i.e., as required by a final,
non-appealable
court order or the conviction of (or plea of no contest to) any felony) or by reason of the NEO’s death or disability.Pursuant to Messrs. Ostrover’s and Rees’s Employment Agreements during 2021, each of Messrs. Ostrover and Rees were entitled during their employment to a base salary of $500,000, additional compensation, paid quarterly, in an amount equal to 1.33% of the management fees of Blue Owl (subject to downward adjustment and, in certain circumstances, approval rights in each case as set forth in the Investor Rights Agreement) less the NEO’s base salary (subject to a 10% holdback and an annual
true-up
following the completion of the Company’s financial statement audit), and to participate in Blue Owl’s employee benefit plans, as in effect from time to time. Pursuant to Mr. Zahr’s Employment Agreement during 2021, Mr. Zahr was entitled during his employment to a base salary of $500,000, additional compensation beginning in 2022, paid quarterly, in an amount equal to a specified percentage of the management fees of Blue Owl (depending on the applicable date and achievement of first and second Oak Street Triggering Events as described above under the section titled “Elements of Compensation — Performance-Based Bonus Payments.”) less Mr. Zahr’s base salary (subject to a 10% holdback and an annualtrue-up
following the completion of the Company’s financial statement audit), and to participate in Blue Owl’s employee benefit plans, as in effect from time to time.As amended in February 2022, the Employment Agreements provide that (i) a portion of the NEO’s right to receive up to 1.33% (with respect to Messrs. Ostrover and Rees) or the applicable percentage (with respect to Mr. Zahr) of the Company’s annual management fee revenues that exceed such NEO’s base compensation (the “Additional Amounts”) will be paid in the form of Incentive Units, if offered by the Company and elected by the
113
NEO, and (ii) the remainder of any such Additional Amounts will be in the form of cash; provided that (a) for 2022, the amount received in Incentive Units will not be less than 20% of such Additional Amounts, and (b) for periods subsequent to 2022, the proportional amounts of cash and Incentive Units will be subject to required consent under the Investor Rights Agreement. The number of Incentive Units issued would be calculated based on the volume weighted average trading price for the ten trading days prior to the payment date. The terms of such Incentive Units are expected to be substantially similar to Incentive Units previously awarded by the Company except that they would be fully vested upon grant and subject to a
one-year
lockup period and additional limitations on conversion to Class A or B Shares.In respect of 2022, the Company offered, and each of Messrs. Ostrover, Rees and Zahr elected to receive, 100% of such Additional Amounts in Incentive Units.
Each Employment Agreement requires the NEO to protect the confidential information of Blue Owl both during and after employment. In addition, during the NEO’s employment and (i) until two years after the NEO’s employment terminates (such NEO’s “Termination Date,” and such period, the “Restricted Period”), such NEO is required to refrain from soliciting employees under the circumstances specified therein, (ii) until one year after the NEO’s Termination Date (with respect to Messrs. Ostrover and Rees) or during the Restricted Period (with respect to Mr. Zahr, subject to certain conditions set forth therein), such NEO is required to refrain from soliciting Blue Owl’s clients under the circumstances specified therein and (iii) until five years after the NEO’s Termination Date (with respect to Messrs. Ostrover and Rees) or the later of (x) the five-year anniversary of the effective date (as defined therein) and (y) the
one-year
anniversary of the Termination Date (with respect to Mr. Zahr) (each, the“Non-Compete
Restricted Period”), such NEO is required to refrain from interfering with Blue Owl’s relationships with investors and from competing with (a) a business line of Blue Owl’s as of the NEO’s Termination Date or (b) a business line planned (and, with respect to Mr. Zahr, that Mr. Zahr has knowledge of), as of the NEO’s Termination Date, to be implemented within the12-month
period following such Termination Date. Pursuant to Mr. Zahr’s Employment Agreement, if his employment is terminated by the Company without “cause” and without “intermediate cause” (each as defined therein) (and not due to his death or disability) or if Mr. Zahr resigns for “good reason” (as defined therein), theNon-Compete
Restricted Period will terminate and will be deemed to have terminated as of the Termination Date.Under Messrs. Ostrover’s and Rees’s Employment Agreements, each NEO’s employment may be terminated by Blue Owl solely for cause or by reason of the NEO’s death or disability (as such terms are defined in the NEO’s Employment Agreement). Furthermore, (i) if Blue Owl terminates such NEO’s employment for cause or such NEO’s employment is terminated by reason of death or disability, or if such NEO terminates employment voluntarily, such NEO will be paid accrued but unpaid salary through the date of termination and (ii) if the NEO’s employment is terminated for any reason, such NEO shall be entitled to an annual amount of 1.33% of annual management fee revenues of Blue Owl during the
Non-Compete
Restricted Period, but such entitlement does not apply in the case of a termination of such NEO’s employment (a) for cause or (b) as a result of voluntary departure by such NEO prior to the fifth anniversary of the date of the Business Combination. The continued compensation described in clause (ii) in the preceding sentence is subject to the NEO’s execution and delivery to Blue Owl of a general release of claims and continued compliance with the NEO’s covenants not to compete with Blue Owl and its affiliates during theNon-Compete
Restricted Period.Under Mr. Zahr’s Employment Agreement, if Mr. Zahr’s employment is terminated by Blue Owl without cause or he resigns for good reason (as each such term is defined in the Employment Agreement), Mr. Zahr will be entitled to receive, depending on his termination date, up to three years of continued base salary and Additional Compensation if his termination occurs prior to January 1, 2026, one year of continued base salary payments and Additional Compensation through the 2026
year-end
if his termination occurs during 2026, or one year of continued base salary payments if his termination occurs after 2026. The continued compensation described in the preceding sentence is subject to Mr. Zahr’s execution and delivery to Blue Owl of a general release of claims and continued compliance with his covenants not to compete with Blue Owl and its affiliates during the applicable restricted period. Additionally, pursuant to the Merger Agreement, Mr. Zahr’s Oak Street114
Earnout Units will accelerate and be settled upon the occurrence of an Oak Street Earnout Unit Acceleration Event. See “” for additional information.
Long-Term Equity-Based Compensation — Oak Street Earnouts
Mr. Kirshenbaum is party to a letter agreement with Owl Rock Capital Partners LP, dated as of July 22, 2016, which provides for certain termination benefits. Under this letter agreement, in connection with a termination of Mr. Kirshenbaum’s employment for any reason, he is entitled to (i) continued base salary and health benefits for the
12-month
period following such termination, and (ii) a lump sum cash payment of $1 million to be paid upon the one year anniversary of such termination. The letter agreement was entered into in exchange for Mr. Kirshenbaum’s agreement to a12-month
post-employmentnon-solicitation
period and12-month
post-employment period of continued duties of fidelity and good faith.Outstanding Equity Awards at 2021 Fiscal Year End
The following table sets forth certain information with respect to outstanding equity awards of our NEOs as of December 31, 2021. The dollar amounts shown in the table below do not reflect the value of compensation actually received by the NEOs, but instead are calculated by multiplying the number of unvested equity awards held by the NEOs by the closing price of $14.91 per Class A Share on December 31, 2021.
Stock Awards | ||||||||
Name | Number of Shares or Units of Stock That Have Not Vested (#) | Market Value of Shares or Units of Stock That Have Not Vested ($) | ||||||
Sean Ward | 1,500,000 | 22,365,000 | (1) | |||||
Marc Zahr | 11,376,943 | 169,630,220 | (2) | |||||
| 11,376,943 | 169,630,220 | (2) | ||||||
| (1) | Represents unvested Incentive Units that will vest in three equal installments on August 15, 2024, 2025 and 2026. |
| (2) | Represents unvested first and second Oak Street Earnouts, which will vest when each respective Oak Street Triggering Event occurs. |
Option Exercises and Stock Vested in the 2021 Fiscal Year
The following table sets forth certain information with respect to the vesting of Blue Owl Operating Group Units during in 2021, with respect to our NEOs.
Stock Awards | ||||||||
Name | Number of Shares Acquired on Vesting (#) | Value Realized on Vesting ($) | ||||||
Alan Kirshenbaum | 506,350 | 7,728,012 | (1) | |||||
Michael Rees | 79,472,092 | 828,301,660 | (2) | |||||
Sean Ward | 17,138,052 | 178,622,159 | (3) | |||||
| (1) | Represents 203,175 E-1 Earnout Units and 203,175E-2 Earnout Units settled in Common Units that occurred in connection with theE-1 Triggering Event andE-2 Triggering Event, respectively, as well as 100,000 Incentive Units that were immediately vested on grant. |
| (2) | Represents the vesting of 3,021,752 E-1 Earnout Units and 3,021,753E-2 Earnout Units that occurred in connection with theE-1 Triggering Event andE-2 Triggering Event, respectively, as well as 73,428,587 Common Units issued in exchange for Mr. Rees’pre-merger Dyal Capital profits interests in connection with the Business Combination. Such Common Units were fully vested at grant. |
115
| (3) | Represents 651,637 E-1 Earnout Units and 651,637E-2 Earnout Units settled in Common Units that occurred in connection with theE-1 Triggering Event andE-2 Triggering Event, respectively, as well as 15,834,778 Common Units issued in exchange for Mr. Wards’pre-merger Dyal Capital profits interests in connection with the Business Combination. Such Common Units were fully vested at grant. |
Potential Payments upon Termination or a Change in Control
As described in the section titled “Narrative Description to the Summary Compensation Table and the Grant of Plan-Based Awards Table for the 2021 Fiscal Year – Written Agreements,” our NEOs have certain entitlements to payment upon termination. Under Messrs. Ostrover’s and Rees’s employment agreements, in the event either of Messrs. Ostrover’s or Rees’s employment had terminated on December 31, 2021, for any reason other than (a) for cause or (b) as a result of voluntary departure by such NEO prior to the fifth anniversary of the date of the Business Combination, each of Messrs. Ostrover and Rees would have been entitled to an annual amount of approximately $44,417,678 each (based on total GAAP management fees earned by Blue Owl in 2021), which amount would comprise 1.33% of annual management fee revenues of Blue Owl during the five-year
Non-Compete
Restricted Period. Under Mr. Zahr’s employment agreement, in the event Mr. Zahr’s employment had terminated on December 31, 2021 due to (a) a termination by the Company without cause or (b) a resignation by Mr. Zahr for good reason, Mr. Zahr would have been entitled to approximately $13,522,830 (based on total GAAP management fees earned by Blue Owl in 2021), which amount would comprise three years of Mr. Zahr’s base salary and 0.60% of annual management fee revenues of Blue Owl. Additionally, under the Merger Agreement, Mr. Zahr is entitled to full acceleration of his unsettled first and second Oak Street Earnout Units in the event of (a) his termination by the Company without cause, (b) a resignation for good reason, or (c) a change in control (such acceleration valued at approximately $339,260,440 for a termination occurring on December 31, 2021). In accordance with the terms of Mr. Kirshenbaum’s letter agreement described above, in the event Mr. Kirshenbaum’s employment had terminated for any reason on December 31, 2021, he would have been entitled to approximately $1,555,631, which amount comprises one year of Mr. Kirshenbaum’s base salary and health benefits and a lump sum cash payment of $1 million to be paid upon theone-year
anniversary of such termination.Pension Benefits
Our NEOs did not participate in or have account balances in qualified or nonqualified defined benefit plans sponsored by us. Our Board or Management Committee may elect to adopt qualified or nonqualified benefit plans in the future if it determines that doing so is in our best interest.
Nonqualified Deferred Compensation
Our NEOs did not participate in or have account balances in nonqualified defined contribution plans or other nonqualified deferred compensation plans maintained by us. The Board or the Management Committee may elect to provide our NEOs and other employees with nonqualified defined contribution or other nonqualified deferred compensation benefits in the future if it determines that doing so is in our best interest.
Compensation of Our Directors
Each director who is not an employee of any entity related to Blue Owl (“independent directors”) receives an annual cash retainer of $150,000 per year for service as a member of the Board, as well as an annual equity grant of restricted stock units equal to $100,000, which fully vest one year following the date of grant, subject to the Board member’s continued service on our Board. Members of the audit committee (other than its chair) are entitled to receive an additional cash retainer of $25,000 per year for committee service, and the chair of the audit committee is entitled to receive an additional cash retainer of $50,000 for Iris or her committee service.
During 2021, each independent director received an equity grant pursuant to the Blue Owl Capital Inc. 2021 Equity Incentive Plan of 10,000 RSUs, each of which represents the right to receive one Class A Share upon vesting. Each of these, with certain limited exceptions, vests on May 19, 2022.
116
We also reimburse independent directors for reasonable out-of-pocket expenses incurred in connection with the performance of their duties as directors, including travel expenses in connection with their attendance in-person at Board and committee meetings. Directors who are employees of or provide services to (other than as a director) any entity related to Blue Owl Capital Inc. did not receive any compensation for their services as directors.
The Board periodically reviews the compensation of the independent directors in order to ensure the appropriateness of the compensation program.
Directors’ Compensation Table
The following table contains information concerning the compensation of the non-employee directors in 2021.
Name | Fees Earned or Paid in Cash ($) | Stock Awards ($)(1)(2) | All Other Compensation ($) | Total ($) | ||||||||||||
Stacy Polley | 175.000 | 170.800 | — | 345.800 | ||||||||||||
Claudia A. Holz | 200.000 | 170.000 | — | 370.800 | ||||||||||||
Dana Weeks | 175.000 | 170.000 | — | 345.800 | ||||||||||||
| (1) | On November 4, 2021, Mmes. Polley, Holz, and Weeks each received equity grants of 10,000 RSUs pursuant to the Blue Owl, Inc. 2021 Equity Incentive Plan, each of which vests, with certain limited exceptions, on May 19, 2022. Amounts in this column represent the grant date fair value of restricted units in respect of our Class A Shares computed in accordance with ASC Topic 718. See Note 8 to our Financial Statements. |
| (1) | As of December 31, 2021, the aggregate number of stock awards held by each of our non-employee directors was as follows: Ms. Polley: 10,000; Ms. Holz: 10,000; Ms. Weeks: 10,000. |
117
DESCRIPTION OF SECURITIES
The following summary of certain provisions of Blue Owl’s securities does not purport to be complete and is subject to our certificate of incorporation, our bylaws, the Investor Rights Agreement and the provisions of applicable law.
Authorized Capitalization
General
Our certificate of incorporation authorizes the issuance of 4,906,875,000 shares of capital stock, par value $0.0001 per share, of Blue Owl, consisting of:
| • | 2,500,000,000 Class A Shares, |
| • | 350,000,000 Class B Shares, |
| • | 1,500,000,000 Class C Shares, |
| • | 350,000,000 Class D Shares, |
| • | 100,000,000 Class E Shares, which consists of 50,000,000 Series E-1 Shares and 50,000,000 SeriesE-2 Shares; and |
| • | 100,000,000 shares of preferred stock. |
On July 21, 2021, all shares of our
Class E-1
common stock automatically converted into Class A Shares and all of ourClass E-1
Seller Earnout Units converted into Common Units with the holders thereof receiving an equal number of Class C Shares or Class D Shares, as applicable, following the occurrence of a Triggering Event.On November 3, 2021, all shares of our
Class E-2
common stock automatically converted into Class A Shares and all of ourClass E-2
Seller Earnout Units converted into Common Units with the holders thereof receiving an equal number of Class C Shares or Class D Shares, as applicable, following the occurrence of a Triggering Event.As of April 20, 2022, we had: (i) 407,639,908 Class A Shares outstanding, (ii) zero Class B Shares outstanding, (iii) 670,147,025 Class C Shares outstanding and (iv) 319,132,127 Class D Shares outstanding.
The following summary describes all material provisions of our securities. We urge you to read our certificate of incorporation, our bylaws, the Investor Rights Agreement and the provisions of applicable law.
Common Stock
Class A Shares
Voting rights
118
Stockholders do not have the ability to cumulate votes for the election of directors. Our certificate of incorporation provides for a classified board of directors consisting of three classes of approximately equal size, each serving staggered three-year terms. Only one class of directors will be elected at each annual meeting of our stockholders, with the other classes continuing for the remainder of their respective three-year terms.
Notwithstanding the foregoing, to the fullest extent permitted by law, holders of common stock, as such, have no voting power with respect to, and are not entitled to vote on, any amendment to the certificate of
incorporation (including any certificate of designations relating to any series of preferred stock) that relates solely to the terms of one or more outstanding series of preferred stock, if the holders of such affected series are entitled, either separately or together with the holders of one or more other such series, to vote thereon pursuant to the certificate of incorporation (including any certificate of designations relating to any series of preferred stock) or pursuant to the DGCL.
Dividend Rights
Rights upon liquidation
Other rights.
Subject to the transfer and exchange restrictions set forth in the Blue Owl Limited Partnership Agreements and the Exchange Agreement, holders of Common Units may exchange these units for Class A Shares or Class B Shares, depending on the holder, on abasis or, at the election of an exchange committee of Blue Owl GP, for cash. When a Common Unit is exchanged, a corresponding Class C Share or Class D Share, depending on the holder, will automatically be transferred to us and retired for no consideration.
one-for-one
Class B Shares
All Class B Shares are fully paid and
non-assessable.
There is no trading market for the Class B Shares.Voting Rights
Dividend Rights
Rights upon liquidation.
119
Other rights.
Subject to the transfer and exchange restrictions set forth in the Blue Owl Limited Partnership Agreements and the Exchange Agreement, holders of Common Units may exchange these units for Class A or Class B Shares, depending on the holder, on abasis or, at the election of an exchange committee of Blue Owl GP, for cash. When a Common Unit is exchanged, a corresponding Class C Share or Class D Share, depending on the holder, will automatically be transferred to us and retired for no consideration.
one-for-one
Issuance and Conversion of Class
B Shares
Class C Shares
All Class C Shares are fully paid and
non-assessable.
There is no trading market for the Class C Shares.Voting Rights
Dividend Rights
Rights upon liquidation.
Other rights.
Issuance and Transfer
Class D Shares
All Class D Shares are fully paid and
non-assessable.
There is no trading market for the Class D Shares.120
Voting Rights
Dividend Rights
Rights upon liquidation.
Other rights.
Issuance, Conversion and Transfer
Preferred Stock
Our certificate of incorporation authorizes the Board to establish one or more series of preferred stock in one or more classes or series and to fix the rights, preferences, privileges and related restrictions, including dividend rights, dividend rates, conversion rights, voting rights, the right to elect directors, terms of redemption, redemption prices, liquidation preferences and the number of shares constituting any class or series, or the designation of the class or series, without the approval of our stockholders.
The authority of the Board to issue preferred stock without approval of our stockholders may have the effect of delaying, deferring or preventing a change in control of our company and may adversely affect the voting and other rights of the holders of our common stock. The issuance of preferred stock with voting and conversion rights may adversely affect the voting power of the holders of our common stock, including the loss of voting control to others. As a result of these or other factors, the issuance of preferred stock could have an adverse impact on the market price of the Class A Shares. At present, we have no plans to issue any preferred stock.
Authorized but Unissued Capital Stock
Delaware law does not require stockholder approval for any issuance of authorized shares. However, the listing requirements of The New York Stock Exchange, which would apply so long as the Class A Shares remains listed on the New York Stock Exchange, require stockholder approval of certain issuances equal to or exceeding 20% of the then outstanding voting power or then outstanding number of Class A Shares. These additional shares may be used for a variety of corporate purposes, including future public offerings, to raise additional capital or to facilitate acquisitions.
121
One of the effects of the existence of unissued and unreserved common stock or preferred stock may be to enable the Board to issue shares to persons friendly to current management, which issuance could render more difficult or discourage an attempt to obtain control of our company by means of a merger, tender offer, proxy contest or otherwise, and thereby protect the continuity of our management and possibly deprive the stockholders of opportunities to sell their shares of common stock at prices higher than prevailing market prices.
Anti-Takeover Effects of Provisions of Delaware Law and our certificate of incorporation and Bylaws
Certain provisions of our certificate of incorporation and bylaws could discourage potential acquisition proposals and could delay or prevent a change in control. These provisions are intended to enhance the likelihood of continuity and stability in the composition of the Board and in the policies formulated by the Board and to discourage certain types of transactions that may involve an actual or threatened change of control. These provisions are designed to reduce our vulnerability to an unsolicited acquisition proposal or proxy fight. Such provisions could have the effect of discouraging others from making tender offers for our shares and, as a consequence, they also may inhibit fluctuations in the market price of our Class A Shares that could result from actual or rumored takeover attempts. Such provisions also may have the effect of preventing changes in our management or delaying or preventing a transaction that might benefit you or other minority stockholders.
These provisions include:
Super Voting Stock.
Action by Written Consent; Special Meetings of Stockholders.
Election and Removal of Directors.
Authorized but Unissued Shares
.
122
rules of The New York Stock Exchange. The existence of authorized but unissued and unreserved common stock and preferred stock could make more difficult or discourage an attempt to obtain control of us by means of a proxy contest, tender offer, merger or otherwise. See “—” and “—” above.
Description of Securities
Preferred Stock
Description of Securities
Authorized but Unissued Capital Stock
Business Combinations with Interested Stockholders.
We elected in our certificate of incorporation not to be subject to Section 203.
Other Limitations on Stockholder Actions.
| • | make nominations in the election of directors; |
| • | propose that a director be removed; or |
| • | propose any other business to be brought before an annual or special meeting of stockholders. |
Under these procedural requirements, in order to bring a proposal before a meeting of stockholders, a stockholder must deliver timely notice of a proposal pertaining to a proper subject for presentation at the meeting to our corporate secretary containing, among other things, the following:
| • | the stockholder’s name and address; |
| • | the number of shares beneficially owned by the stockholder and evidence of such ownership; |
| • | the names of all persons with whom the stockholder is acting in concert and a description of all arrangements and understandings with those persons; |
| • | a description of any agreement, arrangement or understanding reached with respect to shares of our stock, such as borrowed or loaned shares, short positions, hedging or similar transactions; |
| • | a description of the business or nomination to be brought before the meeting and the reasons for conducting such business at the meeting; and |
| • | any material interest of the stockholder in such business. |
Our bylaws set out the timeliness requirements for delivery of notice.
In order to submit a nomination for the Board, a stockholder must also submit any information with respect to the nominee that we would be required to include in a proxy statement, as well as some other information. If a stockholder fails to follow the required procedures, the stockholder’s proposal or nominee will be ineligible and will not be voted on by our stockholders.
Certain provisions of the Blue Owl Limited Partnership Agreements could have the effect of deterring or facilitating a control transaction.
Limitations on Liability and Indemnification of Officers and Directors
Our certificate of incorporation and bylaws provide indemnification for our directors and officers to the fullest extent permitted by the DGCL. We entered into indemnification agreements with each of our directors and executive officers that may, in some cases, be broader than the specific indemnification provisions contained
123
under Delaware law. In addition, as permitted by Delaware law, our certificate of incorporation includes provisions that eliminate the personal liability of our directors for monetary damages resulting from breaches of certain fiduciary duties as a director. The effect of this provision is to restrict our rights and the rights of our stockholders in derivative suits to recover monetary damages against a director for breach of fiduciary duties as a director, except that a director will be personally liable for:
| • | any breach of his duty of loyalty to us or our stockholders; |
| • | acts or omissions not in good faith, or which involve intentional misconduct or a knowing violation of law; |
| • | unlawful payments of dividends or unlawful stock repurchases or redemptions as provided in Section 174 of the DGCL; or |
| • | any transaction from which the director derived an improper personal benefit. |
These provisions may be held not to be enforceable for violations of the federal securities laws of the United States.
Approval of Certain Matters
As long as Neuberger holds at least (x) 10% of the fully-diluted Class A Shares (assuming an exchange of all Common Units immediately prior to the time of determination) and (y) 50% of such equity interests held by Neuberger as of May 19, 2021, Neuberger’s approval is required for the following (subject to agreed-upon carve-outs and exceptions):
| • | amendment of organizational documents that are disproportionately adverse to Neuberger, as an equityholder; |
| • | creation of new employee equity incentive plans or amendments to existing employee equity incentive plans, including by expansion of pool sizes; |
| • | dividends and stock repurchases beyond an approved policy or on a non-pro rata basis; |
| • | acquisitions/investments in excess of $2 billion and 20% of the total value of Blue Owl’s outstanding Class A Shares (subject to certain walls, conflicts of interest and confidentiality requirements) (assuming an exchange of all Common Units immediately prior to the time of determination); |
| • | amendments to make less restrictive the restrictive covenant arrangements of any Key Individual; |
| • | material related-party agreements or transactions between Blue Owl and the former Owl Rock or Dyal Principals (or amendments thereto); |
| • | entering into a new business line that subjects Neuberger to a new regulatory regime; |
| • | for three years after May 19, 2021, the merger or sale of all or a majority of Blue Owl’s common stock or Common Units or assets at a valuation below $13.50 per Class A Share and Class B Share (assuming an exchange of all Common Units immediately prior to the time of determination); and |
| • | for five years after May 19, 2021, for any issuance of equity securities that are dilutive to Blue Owl or its subsidiaries to any Key Individual under any employee equity incentive plan, other than as part of a broad-based compensation program generally applicable to employees of Blue Owl or its subsidiaries (and subject to certain further limitations under such broad-based program). |
As long as Neuberger holds at least (x) 5% of the fully-diluted Class A Shares (assuming an exchange of all Common Units immediately prior to the time of determination) and (y) 25% of such equity interests held by Neuberger as of May 19, 2021, Neuberger’s approval is required for the following (subject to agreed-upon carve-outs and exceptions):
| • | annual aggregate cash compensation for the Key Individuals that exceeds 4% of the management fee revenue of Blue Owl and its subsidiaries; and |
124
| • | Blue Owl Carry’s aggregate share of carried interest in any private equity-style fund sponsored by Blue Owl or its subsidiaries to be less than 15% of the total carried interest in such fund (in each case net of certain investor and other third party arrangements). |
Exclusive Forum
Our certificate of incorporation provides that, unless the Company consents in writing to the selection of an alternative forum, (i) any derivative action or proceeding brought on behalf of the Company, (ii) any action asserting a claim of breach of a fiduciary duty owed by any current or former director, officer, other employee, agent or stockholder of the Company to the Company or the Company’s stockholders, or any claim for aiding and abetting such alleged breach, (iii) any action asserting a claim against the Company or any current or former director, officer, other employee, agent or stockholder of the Company (a) arising pursuant to any provision of the DGCL, our certificate of incorporation (as it may be amended or restated) or our bylaws or (b) as to which the DGCL confers jurisdiction on the Delaware Court of Chancery or (iv) any action asserting a claim against the Company or any current or former director, officer, other employee, agent or stockholder of the Company governed by the internal affairs doctrine of the law of the State of Delaware shall, as to any action in the foregoing clauses (i) through (iv), to the fullest extent permitted by law, be solely and exclusively brought in the Delaware Court of Chancery; provided, however, that the foregoing shall not apply to any claim (a) as to which the Delaware Court of Chancery determines that there is an indispensable party not subject to the jurisdiction of the Delaware Court of Chancery (and the indispensable party does not consent to the personal jurisdiction of the Court of Chancery within ten days following such determination), (b) which is vested in the exclusive jurisdiction of a court or forum other than the Delaware Court of Chancery, or (c) arising under federal securities laws, including the Securities Act of 1933, as amended, as to which the federal district courts of the United States of America shall, to the fullest extent permitted by law, be the sole and exclusive forum. Notwithstanding the foregoing, the provisions of Article XIII of our certificate of incorporation will not apply to suits brought to enforce any liability or duty created by the Exchange Act, or any other claim for which the federal district courts of the United States of America shall be the sole and exclusive forum. Any person or entity purchasing or otherwise acquiring any interest in any shares of the Company’s capital stock shall be deemed to have notice of and to have consented to the forum provisions in our certificate of incorporation. If any action the subject matter of which is within the scope of the forum provisions is filed in a court other than a court located within the State of Delaware (a “foreign action”) in the name of any stockholder, such stockholder shall be deemed to have consented to: (x) the personal jurisdiction of the state and federal courts located within the State of Delaware in connection with any action brought in any such court to enforce the forum provisions (an “enforcement action”); and (y) having service of process made upon such stockholder in any such enforcement action by service upon such stockholder’s counsel in the foreign action as agent for such stockholder. However, it is possible that a court could find the Company’s forum selection provisions to be inapplicable or unenforceable. Although the Company believes this provision benefits it by providing increased consistency in the application of Delaware law in the types of lawsuits to which it applies, the provision may have the effect of discouraging lawsuits against the Company’s directors, officers and other employees.
Stockholder Registration Rights
The Investor Rights Agreement provides the former Owl Rock Equityholders and the former Dyal Equityholders with certain registration rights whereby, at any time, subject to certain lockup restrictions and the other terms and conditions of the Investor Rights Agreement, they have the right to require us to register under the Securities Act certain Registrable Securities (as defined in the Investor Rights Agreement). The Investor Rights Agreement also provides for piggyback registration rights for certain other parties thereto, subject to certain conditions and exceptions. See “.”
Certain Relationships and Related Party Transactions—Blue Owl Related Person Transactions—Investor Rights Agreement
125
Warrants
Public Warrants
.
We will not be obligated to issue any Class A Shares pursuant to the exercise of a warrant and will have no obligation to settle such warrant exercise unless the registration statement under the Securities Act with respect to the Class A Shares underlying the warrants is then effective and a prospectus relating thereto is current or a valid exemption from registration is available. In the event that the conditions in the immediately preceding sentence are not satisfied with respect to a warrant, the holder of such warrant will not be entitled to exercise such warrant and such warrant may have no value and expire worthless.
We have filed with the SEC a registration statement for the registration, under the Securities Act, of the warrants and the Class A Shares issuable upon exercise of the warrants. We will use our commercially reasonable efforts to maintain the effectiveness of such registration statement and a current prospectus relating to those warrants and underlying shares of Class A Shares until the warrants expire or are redeemed, as specified in the warrant agreement; provided that if our shares of Class A Shares are not listed on a national securities exchange at the time of any exercise of a warrant such that they satisfy the definition of a “covered security” under Section 18(b)(1) of the Securities Act, we may, at our option, require holders of public warrants who exercise their warrants to do so on a “cashless basis” in accordance with Section 3(a)(9) of the Securities Act and, in the event we so elect, we will not be required to file or maintain in effect a registration statement, but we will use our commercially reasonably efforts to register or qualify the shares under applicable blue sky laws to the extent an exemption is not available. If a registration statement covering the Class A Shares issuable upon exercise of the warrants is not effective by the 60th day after the Closing, warrant holders may, until such time as there is an effective registration statement and during any period when we will have failed to maintain an effective registration statement, exercise warrants on a “cashless basis” in accordance with Section 3(a)(9) of the Securities Act or another exemption, but we will use our commercially reasonably efforts to register or qualify the shares under applicable blue sky laws to the extent an exemption is not available. In such event, each holder would pay the exercise price by surrendering the warrants for that number of Class A Shares equal to the lesser of (A) the quotient obtained by dividing (x) the product of the number of Class A Shares underlying the warrants, multiplied by the excess of the “fair market value” (defined below) less the exercise price of the warrants by (y) the fair market value and (B) 0.361 per warrant. The “fair market value” as used in this paragraph shall mean the volume weighted average price of the Class A Shares for the 10 trading days ending on the trading day prior to the date on which the notice of exercise is received by the warrant agent.
Redemption of warrants when the price per Class A Share equals or exceeds $18.00.
Once the warrants become exercisable, we may redeem the outstanding warrants (except as described herein with respect to the private placement warrants):
| • | in whole and not in part; |
| • | at a price of $0.01 per warrant; |
| • | upon a minimum of 30 days’ prior written notice of redemption to each warrant holder; and |
| • | if, and only if, the reported last sale price of the Class A Shares equals or exceeds $18.00 per share (as adjusted for adjustments to the number of shares issuable upon exercise or the exercise price of a |
126
warrant as described under the heading “ —Warrants—Public Stockholders’ Warrants-Anti-Dilution Adjustments |
We will not redeem the warrants as described above unless a registration statement under the Securities Act covering the issuance of the Class A Shares issuable upon exercise of the warrants is then effective and a current prospectus relating to those Class A Shares is available throughout the
30-day
redemption period. If and when the warrants become redeemable by us, we may exercise our redemption right even if we are unable to register or qualify the underlying securities for sale under all applicable state securities laws.We have established the last of the redemption criterion discussed above to prevent a redemption call unless there is a significant premium to the warrant exercise price at the time of the call. If the foregoing conditions are satisfied and we issue a notice of redemption of the warrants, each warrant holder will be entitled to exercise such holder’s warrants prior to the scheduled redemption date. Any such exercise would not be done on a “cashless” basis and would require the exercising warrant holder to pay the exercise price for each warrant being exercised. However, the price of the Class A Shares may fall below the $18.00 redemption trigger price (as adjusted for adjustments to the number of shares issuable upon exercise or the exercise price of a warrant as described under the heading “”) as well as the $11.50 (for whole shares) warrant exercise price after the redemption notice is issued.
—Warrants—Public Stockholders’ Warrants—Anti-dilution Adjustments
Redemption of warrants when the price per Class A Share equals or exceeds $10.00.
Once the warrants become exercisable, we may redeem the outstanding warrants (except as described herein with respect to the private placement warrants):
| • | in whole and not in part; |
| �� | • | at $0.10 per warrant upon a minimum of 30 days’ prior written notice of redemption provided |
| • | if, and only if, the last sale price of our Class A Shares equals or exceeds $10.00 per public share (as adjusted for adjustments to the number of shares issuable upon exercise or the exercise price of a warrant as described under the heading “ —Warrants-Public Stockholders’ Warrants-Anti-Dilution Adjustments |
Beginning on the date the notice of redemption is given until the warrants are redeemed or exercised, holders may elect to exercise their warrants on a cashless basis. The numbers in the table below represent the number of Class A Shares that a warrant holder will receive upon such cashless exercise in connection with a redemption by us pursuant to this redemption feature, based on the “fair market value” of our Class A Shares on the corresponding redemption date (assuming holders elect to exercise their warrants and such warrants are not redeemed for $0.10 per warrant), determined for these purposes based on volume weighted average price of our Class A Shares for the 10 trading days ending on the third trading day prior to the date on which the notice of redemption is sent to the holders of warrants, and the number of months that the corresponding redemption date precedes the expiration date of the warrants, each as set forth in the table below. We will provide our warrant holders with the final fair market value no later than one business day after the
10-trading
day period described above ends.Pursuant to the warrant agreement, references above to Class A Shares shall include a security other than Class A Shares into which the Class A Shares have been converted or exchanged for in the event of a merger or consolidation of the Company with or into another corporation in which the Company is not the surviving
127
company. The numbers in the table below will not be adjusted when determining the number of Class A Shares to be issued upon exercise of the warrants if we are not the surviving entity following any such transaction.
The share prices set forth in the column headings of the table below will be adjusted as of any date on which the number of shares issuable upon exercise of a warrant or the exercise price of a warrant is adjusted as set forth under the heading “” below. If the number of shares issuable upon exercise of a warrant is adjusted, the adjusted share prices in the column headings will equal the share prices immediately prior to such adjustment, multiplied by a fraction, the numerator of which is the exercise price of the warrant after such adjustment and the denominator of which is the price of the warrant immediately prior to such adjustment. In such an event, the number of shares in the table below shall be adjusted by multiplying such share amounts by a fraction, the numerator of which is the number of shares issuable upon exercise of a warrant immediately prior to such adjustment and the denominator of which is the number of shares issuable upon exercise of a warrant as so adjusted. If the exercise price of a warrant is adjusted, (a) in the case of an adjustment pursuant to the fifth paragraph under the heading “” below, the adjusted share prices in the column headings will equal the unadjusted share price multiplied by a fraction, the numerator of which is the higher of the Market Value and the Newly Issued Price as set forth under the heading “—” and the denominator of which is $10.00 and (b) in the case of an adjustment pursuant to the second paragraph under the heading “” below, the adjusted share prices in the column headings will equal the unadjusted share price less the decrease in the exercise price of a warrant pursuant to such exercise price adjustment.
—Anti-dilution Adjustments
—Anti-dilution Adjustments
Anti-dilution Adjustments
—Anti-dilution Adjustments
Redemption Date | Fair Market Value of Class A Shares | |||||||||||||||||||||||||||||||||||
(period to expiration of warrants) | ≤ $10.00 | $11.00 | $12.00 | $13.00 | $14.00 | $15.00 | $16.00 | $17.00 | ≥ $18.00 | |||||||||||||||||||||||||||
60 months | 0.261 | 0.281 | 0.297 | 0.311 | 0.324 | 0.337 | 0.348 | 0.358 | 0.361 | |||||||||||||||||||||||||||
57 months | 0.257 | 0.277 | 0.294 | 0.310 | 0.324 | 0.337 | 0.348 | 0.358 | 0.361 | |||||||||||||||||||||||||||
54 months | 0.252 | 0.272 | 0.291 | 0.307 | 0.322 | 0.335 | 0.347 | 0.357 | 0.361 | |||||||||||||||||||||||||||
51 months | 0.246 | 0.268 | 0.287 | 0.304 | 0.320 | 0.333 | 0.346 | 0.357 | 0.361 | |||||||||||||||||||||||||||
48 months | 0.241 | 0.263 | 0.283 | 0.301 | 0.317 | 0.332 | 0.344 | 0.356 | 0.361 | |||||||||||||||||||||||||||
45 months | 0.235 | 0.258 | 0.279 | 0.298 | 0.315 | 0.330 | 0.343 | 0.356 | 0.361 | |||||||||||||||||||||||||||
42 months | 0.228 | 0.252 | 0.274 | 0.294 | 0.312 | 0.328 | 0.342 | 0.355 | 0.361 | |||||||||||||||||||||||||||
39 months | 0.221 | 0.246 | 0.269 | 0.290 | 0.309 | 0.325 | 0.340 | 0.354 | 0.361 | |||||||||||||||||||||||||||
36 months | 0.213 | 0.239 | 0.263 | 0.285 | 0.305 | 0.323 | 0.339 | 0.353 | 0.361 | |||||||||||||||||||||||||||
33 months | 0.205 | 0.232 | 0.257 | 0.280 | 0.301 | 0.320 | 0.337 | 0.352 | 0.361 | |||||||||||||||||||||||||||
30 months | 0.196 | 0.224 | 0.250 | 0.274 | 0.297 | 0.316 | 0.335 | 0.351 | 0.361 | |||||||||||||||||||||||||||
27 months | 0.185 | 0.214 | 0.242 | 0.268 | 0.291 | 0.313 | 0.332 | 0.350 | 0.361 | |||||||||||||||||||||||||||
24 months | 0.173 | 0.204 | 0.233 | 0.260 | 0.285 | 0.308 | 0.329 | 0.348 | 0.361 | |||||||||||||||||||||||||||
21 months | 0.161 | 0.193 | 0.223 | 0.252 | 0.279 | 0.304 | 0.326 | 0.347 | 0.361 | |||||||||||||||||||||||||||
18 months | 0.146 | 0.179 | 0.211 | 0.242 | 0.271 | 0.298 | 0.322 | 0.345 | 0.361 | |||||||||||||||||||||||||||
15 months | 0.130 | 0.164 | 0.197 | 0.230 | 0.262 | 0.291 | 0.317 | 0.342 | 0.361 | |||||||||||||||||||||||||||
12 months | 0.111 | 0.146 | 0.181 | 0.216 | 0.250 | 0.282 | 0.312 | 0.339 | 0.361 | |||||||||||||||||||||||||||
9 months | 0.090 | 0.125 | 0.162 | 0.199 | 0.237 | 0.272 | 0.305 | 0.336 | 0.361 | |||||||||||||||||||||||||||
6 months | 0.065 | 0.099 | 0.137 | 0.178 | 0.219 | 0.259 | 0.296 | 0.331 | 0.361 | |||||||||||||||||||||||||||
3 months | 0.034 | 0.065 | 0.104 | 0.150 | 0.197 | 0.243 | 0.286 | 0.326 | 0.361 | |||||||||||||||||||||||||||
0 months | — | — | 0.042 | 0.115 | 0.179 | 0.233 | 0.281 | 0.323 | 0.361 | |||||||||||||||||||||||||||
The exact fair market value and redemption date may not be set forth in the table above, in which case, if the fair market value is between two values in the table or the redemption date is between two redemption dates in the table, the number of Class A Shares to be issued for each warrant exercised will be determined by a straight-line interpolation between the number of shares set forth for the higher and lower fair market values and the earlier and later redemption dates, as applicable, based on a 365 or
366-day
year, as applicable. For example, if the volume weighted average price of our Class A Shares for the 10 trading days ending on the third trading day prior to the date on which the notice of redemption is sent to the holders of the warrants is $11.00 per share, and128
at such time there are 57 months until the expiration of the warrants, holders may choose to, in connection with this redemption feature, exercise their warrants for 0.277 Class A Shares for each whole warrant. For an example where the exact fair market value and redemption date are not as set forth in the table above, if the volume weighted average price of our Class A Shares for the 10 trading days ending on the third trading day prior to the date on which the notice of redemption is sent to the holders of the warrants is $13.50 per share, and at such time there are 38 months until the expiration of the warrants, holders may choose to, in connection with this redemption feature, exercise their warrants for 0.298 Class A Shares for each whole warrant. In no event will the warrants be exercisable on a cashless basis in connection with this redemption feature for more than 0.361 Class A Shares per warrant (subject to adjustment). Finally, as reflected in the table above, if the warrants are out of the money and about to expire, they cannot be exercised on a cashless basis in connection with a redemption by us pursuant to this redemption feature, since they will not be exercisable for any Class A Shares.
This redemption feature differs from the typical warrant redemption features used in many other blank check offerings, which typically only provide for a redemption of warrants for cash (other than the private placement warrants) when the trading price for the Class A Shares exceeds $18.00 per share for a specified period of time. This redemption feature is structured to allow for all of the outstanding warrants to be redeemed when the Class A Shares are trading at or above $10.00 per public share, which may be at a time when the trading price of our Class A Shares is below the exercise price of the warrants. We have established this redemption feature to provide us with the flexibility to redeem the warrants without the warrants having to reach the $18.00 per share threshold set forth above under “—” Holders choosing to exercise their warrants in connection with a redemption pursuant to this feature will, in effect, receive a number of shares for their warrants based on an option pricing model with a fixed volatility input as of this prospectus. This redemption right provides us with an additional mechanism by which to redeem all of the outstanding warrants, and therefore have certainty as to our capital structure as the warrants would no longer be outstanding and would have been exercised or redeemed. We will be required to pay the applicable redemption price to warrant holders if we choose to exercise this redemption right and it will allow us to quickly proceed with a redemption of the warrants if we determine it is in our best interest to do so. As such, we would redeem the warrants in this manner when we believe it is in our best interest to update our capital structure to remove the warrants and pay the redemption price to the warrant holders.
Redemption of warrants when the price per Class
A Share equals or exceeds $18.00.
As stated above, we can redeem the warrants when the Class A Shares are trading at a price starting at $10.00, which is below the exercise price of $11.50, because it will provide certainty with respect to our capital structure and cash position while providing warrant holders with the opportunity to exercise their warrants on a cashless basis for the applicable number of shares. If we choose to redeem the warrants when the Class A Shares are trading at a price below the exercise price of the warrants, this could result in the warrant holders receiving fewer Class A Shares than they would have received if they had chosen to wait to exercise their warrants if and when our Class A Shares were trading at a price higher than the exercise price of $11.50.
No fractional Class A Shares will be issued upon exercise. If, upon exercise, a holder would be entitled to receive a fractional interest in a share, we will round down to the nearest whole number of the number of Class A Shares to be issued to the holder.
Redemption procedures.
A holder of a warrant may notify us in writing in the event it elects to be subject to a requirement that such holder will not have the right to exercise such warrant, to the extent that after giving effect to such exercise, such person (together with such person’s affiliates), to the warrant agent’s actual knowledge, would beneficially own in excess of 9.8% (or such other amount as a holder may specify) of the total number of Class A Shares issued and outstanding immediately after giving effect to such exercise.
129
Anti-dilution Adjustments
.
If the number of outstanding Class A Shares is increased by a capitalization or share dividend payable in Class A Shares, or stock split or other similar event, then, on the effective date of such capitalization or share dividend,
split-up
or similar event, the number of Class A Shares issuable on exercise of each warrant will be increased in proportion to such increase in the outstanding Class A Shares. A rights offering made to all or substantially all holders of Class A Shares entitling holders to purchase Class A Shares at a price less than the “historical fair market value” (as defined below) will be deemed a share dividend of a number of Class A Shares equal to the product of (i) the number of Class A Shares actually sold in such rights offering (or issuable under any other equity securities sold in such rights offering that are convertible into or exercisable for Class A Shares) and (ii) one minus the quotient of (x) the price per Class A Share paid in such rights offering and (y) the historical fair market value. For these purposes, (i) if the rights offering is for securities convertible into or exercisable for Class A Shares, in determining the price payable for Class A Shares, there will be taken into account any consideration received for such rights, as well as any additional amount payable upon exercise or conversion and (ii) “historical fair market value” means the volume weighted average price of Class A Shares as reported during the 10 trading day period ending on the trading day prior to the first date on which the Class A Shares trade on the applicable exchange or in the applicable market, regular way, without the right to receive such rights.In addition, if we, at any time while the warrants are outstanding and unexpired, pay a dividend or make a distribution in cash, securities or other assets to all or substantially all of the holders of Class A Shares on account of such Class A Shares, other than (a) as described above, (b) any cash dividends or cash distributions which, when combined on a per share basis with all other cash dividends and cash distributions paid on the Class A Shares during the
365-day
period ending on the date of declaration of such dividend or distribution does not exceed $0.50 (as adjusted to appropriately reflect any other adjustments and excluding cash dividends or cash distributions that resulted in an adjustment to the exercise price or to the number of Class A Shares issuable on exercise of each warrant) but only with respect to the amount of the aggregate cash dividends or cash distributions equal to or less than $0.50 per share, (c) to satisfy the redemption rights of the holders of Class A Shares, or (d) in connection with the distribution of the Company’s assets upon its liquidation, then the warrant exercise price will be decreased, effective immediately after the effective date of such event, by the amount of cash and/or the fair market value of any securities or other assets paid on each Class A Share in respect of such event.If the number of outstanding Class A Shares is decreased by a consolidation, combination, reverse share
sub-division
or reclassification of Class A Shares or other similar event, then, on the effective date of such consolidation, combination, reverse sharesub-division,
reclassification or similar event, the number of Class A Shares issuable on exercise of each warrant will be decreased in proportion to such decrease in outstanding Class A Shares.Whenever the number of Class A Shares purchasable upon the exercise of the warrants is adjusted, as described above, the warrant exercise price will be adjusted by multiplying the warrant exercise price immediately prior to such adjustment by a fraction (x) the numerator of which will be the number of Class A Shares purchasable upon the exercise of the warrants immediately prior to such adjustment and (y) the denominator of which will be the number of Class A Shares so purchasable immediately thereafter.
In case of any reclassification or reorganization of the outstanding Class A Shares (other than those described above or that solely affects the par value of such Class A Shares), or in the case of any merger or consolidation of us with or into another corporation (other than a consolidation or merger in which we are the continuing corporation and that does not result in any reclassification or reorganization of our outstanding Class A Shares), or in the case of any sale or conveyance to another corporation or entity of the assets or other property of us as an entirety or substantially as an entirety in connection with which we are dissolved, the holders of the warrants will thereafter have the right to purchase and receive, upon the basis and upon the terms and
130
conditions specified in the warrants and in lieu of the Class A Shares immediately theretofore purchasable and receivable upon the exercise of the rights represented thereby, the kind and amount of of Class A Shares or other securities or property (including cash) receivable upon such reclassification, reorganization, merger or consolidation, or upon a dissolution following any such sale or transfer, that the holder of the warrants would have received if such holder had exercised their warrants immediately prior to such event. However, if such holders were entitled to exercise a right of election as to the kind or amount of securities, cash or other assets receivable upon such consolidation or merger, then the kind and amount of securities, cash or other assets for which each warrant will become exercisable will be deemed to be the weighted average of the kind and amount received per share by such holders in such consolidation or merger that affirmatively make such election, and if a tender, exchange or redemption offer has been made to and accepted by such holders (other than a tender, exchange or redemption offer made by the Company if provided for in the Company’s organizational documents) under circumstances in which, upon completion of such tender or exchange offer, the maker thereof, together with members of any group (within the meaning ofmarket, or is to be so listed for trading or quoted immediately following such event, and if the registered holder of the warrant properly exercises the warrant within thirty days following public disclosure of such transaction, the warrant exercise price will be reduced as specified in the warrant agreement based on the Black-Scholes value (as defined in the warrant agreement) of the warrant. The purpose of such exercise price reduction is to provide additional value to holders of the warrants when an extraordinary transaction occurs during the exercise period of the warrants pursuant to which the holders of the warrants otherwise do not receive the full potential value of the warrants.
Rule 13d-5(b)(1)
under the Exchange Act) of which such maker is a part, and together with any affiliate or associate of such maker (within the meaning of Rule12b-2
under the Exchange Act) and any members of any such group of which any such affiliate or associate is a part, own beneficially (within the meaning ofRule 13d-3 under
the Exchange Act) more than 50% of the issued and outstanding Class A Shares, the holder of a warrant will be entitled to receive the highest amount of cash, securities or other property to which such holder would actually have been entitled as a stockholder if such warrant holder had exercised the warrant prior to the expiration of such tender or exchange offer, accepted such offer and all of the Class A Shares held by such holder had been purchased pursuant to such tender or exchange offer, subject to adjustment (from and after the consummation of such tender or exchange offer) as nearly equivalent as possible to the adjustments provided for in the warrant agreement. If less than 70% of the consideration receivable by the holders of Class A Shares in such a transaction is payable in the form of Class A Shares in the successor entity that is listed for trading on a national securities exchange or is quoted in an establishedover-the-counter
The warrants are issued in registered form under a warrant agreement with Computershare Trust Company, N.A. and Computershare, Inc. The warrant agreement provides that the terms of the warrants may be amended without the consent of any holder for the purpose of: (i) curing any ambiguity or correcting any mistake, including to conform the provisions of the warrant agreement to the description of the terms of the warrants and the warrant agreement set forth in the proxy statement/prospectus, or defective provision (ii) amending the provisions relating to cash dividends on Class A Shares as contemplated by and in accordance with the warrant agreement or (iii) adding or changing any provisions with respect to matters or questions arising under the warrant agreement as the parties to the warrant agreement may deem necessary or desirable and that the parties deem to not adversely affect the rights of the registered holders of the warrants, provided that the approval by the holders of at least 50% of the then-outstanding public warrants is required to make any change that adversely affects the interests of the registered holders.
The warrant holders do not have the rights or privileges of holders of Class A Shares or any voting rights until they exercise their warrants and receive Class A Shares. After the issuance of Class A Shares upon exercise of the warrants, each holder will be entitled to one vote for each share held of record on all matters to be voted on by stockholders.
We have agreed that, subject to applicable law, any action, proceeding or claim against us arising out of or relating in any way to the warrant agreement will be brought and enforced in the courts of the State of New York or the United States District Court for the Southern District of New York, and we irrevocably submit to such
131
jurisdiction, which jurisdiction will be the exclusive forum for any such action, proceeding or claim. This provision applies to claims under the Securities Act but does not apply to claims under the Exchange Act or any claim for which the federal district courts of the United States of America are the sole and exclusive forum.
Private Placement Warrants
Except as described below, the private placement warrants have terms and provisions that are identical to those of the warrants sold as part of the units in Altimar’s IPO. The private placement warrants (including the Class A Shares issuable upon exercise of the private placement warrants) are not redeemable by us so long as they are held by Altimar Sponsor or its permitted transferees. Altimar Sponsor, or its permitted transferees, has the option to exercise the private placement warrants on a cashless basis. If the private placement warrants are held by holders other than Altimar Sponsor or its permitted transferees, the private placement warrants will be redeemable by us in all redemption scenarios and exercisable by the holders on the same basis as the warrants included in the units sold in connection with Altimar’s IPO. Any amendment to the terms of the private placement warrants or any provision of the warrant agreement with respect to the private placement warrants will require a vote of holders of at least 50% of the number of the then outstanding private placement warrants.
If holders of the private placement warrants elect to exercise them on a cashless basis, they would pay the exercise price by surrendering their warrants for that number of Class A Shares equal to the quotient obtained by dividing (x) the product of the number of Class A Shares underlying the warrants, multiplied by the excess of the “Sponsor fair market value” (defined below) over the exercise price of the warrants by (y) Altimar Sponsor fair market value. For these purposes, the “Sponsor fair market value” shall mean the average reported last sale price of the Class A Shares for the 10 trading days ending on the third trading day prior to the date on which the notice of warrant exercise is sent to the warrant agent.
We have adopted policies that restrict insiders from selling our securities except during specific periods of time. Even during such periods of time when insiders will be permitted to sell our securities, an insider cannot trade in our securities if he or she is in possession of material
non-public
information. Accordingly, unlike public stockholders who could exercise their warrants and sell the Class A Shares received upon such exercise freely in the open market in order to recoup the cost of such exercise, the insiders are significantly restricted from selling such securities. As a result, we believe that allowing the holders to exercise such warrants on a cashless basis is appropriate.Transfer Agent, Warrant Agent and Registrar
The transfer agent and registrar for the Blue Owl common stock and the warrant agent for the warrants is Computershare Trust Company, N.A and Computershare, Inc.
Listing
Our Class A Shares and our warrants to purchase Class A Shares are listed on The New York Stock Exchange under the symbols “OWL” and “OWL.WS,” respectively.
132
BENEFICIAL OWNERSHIP
The following table sets forth certain information regarding the beneficial ownership of our Class A Shares, Class C Shares and Class D Shares as of the date hereof based on their reported ownership as of April 20, 2022 with respect to
(i) each person known by us to beneficially own 5% or more of our outstanding Class A Shares, Class C Shares or our Class D Shares;
(ii) each member of the Board and each NEO; and
(iii) the members of the Board and our NEOs as a group.
Beneficial ownership is determined according to the rules of the Securities and Exchange Commission, which generally provide that a person has beneficial ownership of a security if he, she or it possesses sole or shared voting or investment power over that security, including options and warrants that are currently exercisable or exercisable within 60 days. Company stock issuable upon exercise of options and warrants currently exercisable within 60 days are deemed outstanding solely for purposes of calculating the percentage of total voting power of the beneficial owner thereof. On May 3, 2022, the aggregate voting power of the Class B Shares and Class D Shares will change from 90% to 80%, pursuant to the Charter Amendment. See “ ” as well as our Current Report on Form 8-K filed with the SEC on April 11, 2022 and our Information Statement on Schedule 14C filed with the SEC on April 11, 2022. The percentage of total voting power set forth in the table is calculated based on this change.
Summary
— Recent Developments
The following beneficial ownership percentages are based on 407,639,908 Class A Shares, 670,147,025 Class C Shares and 319,132,127 Class D Shares issued and outstanding as of April 20, 2022.
Unless otherwise indicated, the Company believes that each person named in the table below has sole voting and investment power with respect to all shares of Company common stock beneficially owned by them.
Name of Beneficial Owner(1) | Class A Shares Beneficially Owned(2) | Class C Shares Beneficially Owned | Class D Shares Beneficially Owned | Combined Total Voting Power | ||||||||||||||||||||||||
Shares | Percent | Shares | Percent | Shares | Percent | |||||||||||||||||||||||
Directors and Executive Officers of Blue Owl | ||||||||||||||||||||||||||||
Douglas I. Ostrover(3), † | — | — | 116,540,000 | 17.4 | % | 175,392,700 | 55.0 | % | 46.1 | % | ||||||||||||||||||
Marc S. Lipschultz(4), † | — | — | — | — | 0 | * | * | |||||||||||||||||||||
Michael Rees(5), † | — | — | — | — | 143,739,427 | 45.0 | % | 36.0 | % | |||||||||||||||||||
Alan J. Kirshenbaum(6), † | — | — | — | — | 0 | * | * | |||||||||||||||||||||
Craig W. Packer(7), † | — | — | — | — | 0 | * | * | |||||||||||||||||||||
Sean Ward(8), † | — | — | — | — | 0 | * | * | |||||||||||||||||||||
Marc Zahr(9) | — | — | — | — | — | — | — | |||||||||||||||||||||
Dana Weeks(10) | 10,000 | * | — | — | — | — | * | |||||||||||||||||||||
Claudia Holz(11) | 40,000 | * | — | — | — | — | * | |||||||||||||||||||||
Andrew S. Komaroff | — | — | — | — | — | — | — | |||||||||||||||||||||
Andrew Laurino(12), † | — | — | — | — | 0 | * | * | |||||||||||||||||||||
Andrew Polland(13) | — | — | — | — | 0 | * | * | |||||||||||||||||||||
Neena A. Reddy(14) | — | — | — | — | — | — | — | |||||||||||||||||||||
Stacy Polley(15) | 10,000 | * | — | — | — | — | * | |||||||||||||||||||||
All Directors and Executive Officers of Blue Owl as a Group (14 Individuals) | 60,000 | * | 116,540,000 | 17.4 | % | 319,132,127 | 100.0 | % | 82.2 | % | ||||||||||||||||||
133
Name of Beneficial Owner(1) | Class A Shares Beneficially Owned(2) | Class C Shares Beneficially Owned | Class D Shares Beneficially Owned | Combined Total Voting Power | ||||||||||||||||||||||||
Shares | Percent | Shares | Percent | Shares | Percent | |||||||||||||||||||||||
Five Percent Holders | ||||||||||||||||||||||||||||
Owl Rock Capital Feeder LLC(3)(16), † | — | — | 116,540,000 | 17.4 | % | 175,392,700 | 55.0 | % | 46.1 | % | ||||||||||||||||||
BB Holdings AA LP and Affiliates(17) | 50,000,000 | 12.3 | % | — | — | — | — | * | ||||||||||||||||||||
Dyal Capital SLP LP(18), † | — | — | — | — | 143,739,427 | 45.0 | % | 36.0 | % | |||||||||||||||||||
NBSH Blue Investments, LLC(19) | — | — | 444,328,208 | 66.3 | % | — | — | 8.2 | % | |||||||||||||||||||
PSPE II Limited(20) | 49,005,191 | 12.0 | % | — | — | — | — | * | ||||||||||||||||||||
Quantum Strategic Partners Ltd.(21) | 19,220,989 | 4.7 | % | — | — | — | — | * | ||||||||||||||||||||
MSD Owl Rock Investments, LLC(22) | — | — | 41,721,673 | 6.2 | % | — | — | * | ||||||||||||||||||||
Koch Industries, Inc.(23) | 35,967,671 | 8.8 | % | — | — | — | — | * | ||||||||||||||||||||
Capital International Investors(24) | 22,936,362 | 5.6 | % | — | — | — | — | * | ||||||||||||||||||||
The Vanguard Group(25) | 33,800,460 | 8.3 | % | — | — | — | — | * | ||||||||||||||||||||
Capital World Investors(26) | 39,418,038 | 9.7 | % | — | — | — | — | * | ||||||||||||||||||||
| † | The Principals, Owl Rock Feeder and Dyal Capital SLP LP have agreed to vote the securities reported as beneficially owned by Owl Rock Feeder and Dyal Capital SLP LP in favor of each other’s director designees. Such agreement may be deemed to create a group that beneficially owns all of the securities by each of Owl Rock Feeder and Dyal Capital SLP LP, which holdings would represent 82.2% of the Issuer’s aggregate voting power. |
| * | Less than one percent. |
| (1) | Unless otherwise noted, the addresses of each of Blue Owl’s directors, officers and five percent holders is 399 Park Avenue, 38th Floor, New York, NY 10019. |
| (2) | Does not include (a) 41,453 RSUs granted to Neena Reddy under the Blue Owl Capital Inc. 2021 Omnibus Plan or (b) Incentive Units issued under the Blue Owl Capital Inc. 2021 Omnibus Plan as follows: (i) Alan Kirshenbaum — 1,100,000, (ii) Andrew Polland — 818,648, (iii) Neena Reddy — 314,263, (iv) Andrew Laurino — 1,250,000, (v) Sean Ward — 1,500,000. Each RSU represents the contingent right to receive one Class A Share upon vesting and each Incentive Unit, upon vesting and when settled, will be issued in an equal number of Common Units and either Class C or Class D Shares as applicable. |
| (3) | Owl Rock Capital Partners LP, as the managing member of Owl Rock Capital Feeder LLC, exercises voting control over 38,534,736 Class D Shares and an equal number of Common Units on behalf of Mr. Ostrover; 15,727,292 Class D Shares and an equal number of Common Units on behalf of Mr. Ostrover’s spouse, Julie J. Ostrover; and 18,087,459 Class D Shares and an equal number of Common Units on behalf of The Douglas I. Ostrover 2016 Descendants’ Trust over which Mr. Ostrover has sole investment and voting power. Due to certain provisions in the organizational documents of Owl Rock Capital Partners LP, Mr. Ostrover may be deemed to beneficially own the Class C Shares and Class D Shares and the Common Units held by Owl Rock Capital Feeder LLC. Mr. Ostrover expressly disclaims beneficial ownership of the shares and units held by Owl Rock Capital Feeder LLC, including any of our Class A Shares or Class B Shares that may be acquired upon exchange of Common Units and Class C Shares or Class D Shares, as applicable, in each case, except to the extent of his pecuniary interest therein. |
| (4) | Owl Rock Capital Partners LP, as the managing member of Owl Rock Capital Feeder LLC, will exercise voting control over 23,412,440 Class D Shares and an equal number of Common Units on behalf of Mr. Lipschultz; 24,231,887 Class D Shares and an equal number of Common Units on behalf of Mr. Lipschultz’s spouse, Jennifer Lipschultz, and 11,550,711 Class D Shares and an equal number of Common Units on behalf of the Lipschultz Family OR Trust over which Mr. Lipschultz has sole investment and voting power. Mr. Lipschultz expressly disclaims beneficial ownership of the Class C Shares and Class D Shares and the Common Units held by Owl Rock Capital Feeder LLC, and any of our Class A Shares or Class B Shares that may be acquired upon exchange of Common Units and Class C Shares or |
134
| Class D Shares, as applicable, held by Owl Rock Capital Feeder LLC, in each case, except to the extent of his pecuniary interest therein. |
| (5) | Dyal Capital SLP LP holds 79,472,092 Class D Shares and an equal number of Common Units on behalf of Mr. Rees, his spouse, or one or more entities controlled by him. The foregoing amounts reflect an estimate and are subject to change. By virtue of Mr. Rees’s indirect control of the general partner of and his indirect interests in Dyal Capital SLP LP, Mr. Rees may be deemed to beneficially own the Class D Shares beneficially owned by Dyal Capital SLP LP. Mr. Rees disclaims beneficial ownership of the Class D Shares held by Dyal Capital SLP LP, except to the extent of his pecuniary interest therein. The business address for each of Mr. Rees and Dyal Capital SLP LP is 1290 Avenue of the Americas, New York, NY 10104. |
| (6) | Owl Rock Capital Partners LP, as the managing member of Owl Rock Capital Feeder LLC, will exercise voting control over 87,696 Class D Shares and an equal number of Common Units on behalf of Mr. Kirshenbaum; 2,630,891 Class D Shares and an equal number of Common Units on behalf of the Alan Kirshenbaum 2015 Family Trust and 2,455,498 Class D Shares and an equal number of Common Units on behalf of Kirshenbaum 2019 Family Trust, in each case, over which Mr. Kirshenbaum has sole investment and voting power. In addition, Blue Owl MV holds 1,100,000 Incentive Units on behalf of Mr. Kirshenbaum. Mr. Kirshenbaum expressly disclaims beneficial ownership of the Class C Shares and Class D Shares and the Common Units held by or issuable to Owl Rock Capital Feeder LLC and Blue Owl MV, as applicable, and any of our Class A Shares or Class B Shares that may be acquired upon exchange of Common Units and Class C Shares or Class D Shares, as applicable, held by or issuable to Owl Rock Capital Feeder LLC and Blue Owl MV, in each case, except to the extent of his pecuniary interest therein. |
| (7) | Owl Rock Capital Partners LP, as the managing member of Owl Rock Capital Feeder LLC, will exercise voting control over 25,598,731 Class D Shares and an equal number of Common Units on behalf of Mr. Packer; 4,393,421 Class D Shares and an equal number of Common Units on behalf of Packer Family Trust 2017, over which Mr. Packer has sole investment and voting power; and 5,086,388 Class D Shares and an equal number of Common Units on behalf of Mr. Packer’s spouse, Suzanne Packer. Mr. Packer expressly disclaims beneficial ownership of the Class C Shares and Class D Shares and the Common Units held by Owl Rock Capital Feeder LLC, and any of our Class A Shares or Class B Shares that may be acquired upon exchange of Common Units and Class C Shares or Class D Shares, as applicable, held by Owl Rock Capital Feeder LLC, in each case, except to the extent of his pecuniary interest therein. |
| (8) | The number of shares and class ownership percentages reported for Sean Ward excludes 17,138,152 Class D Shares and an equal number of Common Units, in each case, held by Dyal Capital SLP LP and 1,500,000 Incentive Units held by Blue Owl MV; in each case, on behalf of Mr. Ward, his spouse or one or more entities controlled by him. Mr. Ward expressly disclaims beneficial ownership of Class C Shares and Class D Shares and the Common Units held by or issuable to Dyal Capital SLP LP and Blue Owl MV, as applicable, and any of our Class A Shares or Class B Shares that may be acquired upon exchange of Common Units and Class C Shares or Class D Shares, as applicable, held by or issuable to Dyal Capital SLP LP and Blue Owl MV, in each case, except to the extent of his pecuniary interest therein. |
| (9) | Augustus, LLC, an Illinois limited liability company (“Augustus”), holds 22,753,886 Class C Shares, 22,753,886 Common Units and 22,753,886 Earnout Units, as defined in the Amendment to the Agreement and Plan of Merger, dated as of December 23, 2021, by and among the Company, Blue Owl Capital GP LLC, Blue Owl Capital Holdings LP, Blue Owl Capital Carry LP, Flyer Merger Sub I, LLC, Flyer Merger Sub II, LP, OSREC GP Holdings, LP, Oak Street Real Estate Capital, LLC, SASC Feeder, LP and Augustus (the “Oak Street Acquisition Agreement”), on behalf of Mr. Zahr, his spouse and one or more vehicles controlled by him. |
| (10) | Includes 10,000 RSUs granted under the Blue Owl Capital Inc. 2021 Omnibus Equity Incentive Plan, each of which represents the right to receive one Class A Share upon vesting. Each of these, with certain limited exceptions, vests on May 19, 2022. |
| (11) | Includes 10,000 RSUs granted under the Blue Owl Capital Inc. 2021 Omnibus Equity Incentive Plan, each of which represents the right to receive one Class A Share upon vesting. Each of these, with certain limited exceptions, vests on May 19, 2022. Additionally, includes 30,000 Class A Shares indirectly beneficially owned by Ms. Holz through her spouse. |
135
| (12) | The number of shares and class ownership percentages reported for Andrew Laurino excludes 11,056,437 Class D Shares and an equal number of Common Units, in each case, held by Dyal Capital SLP LP and 1,250,000 Incentive Units held by Blue Owl MV; in each case, on behalf of Mr. Laurino, his spouse or one or more entities controlled by him. Mr. Laurino expressly disclaims beneficial ownership of Class C Shares and Class D Shares and the Common Units held by or issuable to Dyal Capital SLP LP and Blue Owl MV, as applicable, and any of our Class A Shares or Class B Shares that may be acquired upon exchange of Common Units and Class C Shares or Class D Shares, as applicable, held by or issuable to Dyal Capital SLP LP and Blue Owl MV, in each case, except to the extent of his pecuniary interest therein. |
| (13) | The number of shares and class ownership percentages reported for Andrew Polland excludes 248,669 Class D Shares, and an equal number of Common Units, in each case, held by Dyal Capital SLP LP and 818,648 Incentive Units held by Blue Owl MV; in each case, on behalf of Mr. Polland, his spouse or one or more vehicles controlled by him. Mr. Polland expressly disclaims beneficial ownership of the Class C Shares and Class D Shares and the Common Units held by or issuable to Dyal Capital SLP LP and Blue Owl MV, as applicable, and any of our Class A Shares or Class B Shares that may be acquired upon exchange of Common Units and Class C Shares or Class D Shares, as applicable, held by or issuable to Dyal Capital SLP LP and Blue Owl MV, in each case, except to the extent of his pecuniary interest therein. |
| (14) | The number of shares and class ownership percentages reported for Ms. Reddy excludes 314,263 Incentive Units on behalf of Ms. Reddy. Ms. Reddy expressly disclaims beneficial ownership of the Class C Shares and Class D Shares and the Common Units held by or issuable to Blue Owl MV, as applicable, and any of our Class A Shares or Class B Shares that may be acquired upon exchange of Common Units and Class C Shares or Class D Shares, as applicable, held by or issuable to Blue Owl MV, in each case, except to the extent of her pecuniary interest therein. |
| (15) | Includes 10,000 RSUs granted under the Blue Owl Capital Inc. 2021 Omnibus Equity Incentive Plan, each of which represents the right to receive one Class A Share upon vesting. Each of these, with certain limited exceptions, vests on May 19, 2022. |
| (16) | Owl Rock Capital Partners LP, as the managing member of Owl Rock Capital Feeder LLC, will exercise voting control over 175,392,700 Class D Shares on behalf of the Owl Rock Principals and 116,540,000 Class C Shares, each of which represents the right to receive one Common Unit and one Class C Share, subject to certain vesting conditions, on behalf of Dyal Capital Partners IV Holdings (A) LP. Owl Rock Capital Partners LP is managed by Owl Rock Capital Partners (GP) LLC, which is governed by an executive committee comprised of Messrs. Ostrover, Lipschultz and Packer with decisions over certain matters requiring the vote of Mr. Ostrover. As such, Mr. Ostrover may be deemed to beneficially own all such shares and units. Each of these individuals and entities disclaims any beneficial ownership of these shares and units, except to the extent of their pecuniary interest therein. |
| (17) | Based solely upon information contained in the Schedule 13G filed with the SEC on June 1, 2021. Includes 3,500,000 Class A Shares held by BB Holdings AC LP, a Delaware limited partnership (“BB Holdings AC”), 2,000,000 Class A Shares held by Glide Path Solutions 2021 LP, a Delaware limited partnership (“Glide Path Solutions 2021”), 4,500,000 Class A Shares held by Glide Path Solutions 2020 LP, a Delaware limited partnership (“Glide Path Solutions 2020”), 20,000,000 Class A Shares held by BB Holdings AA LP, a Delaware limited partnership (“BB Holdings AA” and, together with BB Holdings AC, Glide Path Solutions 2021 and Glide Path Solutions 2020, the “ICQ Limited Partnerships”), 10,000,000 Class A Shares held by Co-Investment Portfolio 2021 LP, a Delaware limited partnership(“Co-Investment Portfolio 2021”) and 10,000,000 Class A Shares held by Tactical Opportunities Portfolio 2020 LP, a Delaware limited partnership (“Tactical Opportunities 2020” and, together withCo-Investment Portfolio 2021 and the ICQ Limited Partnerships, the “Limited Partnerships”). ICQ BB GP, LLC, a Delaware limited liability company (“ICQ BB”), is the general partner of the ICQ Limited Partnerships,Co-Investment Portfolio GP II LP, a Delaware limited partnership(“Co-Investment Portfolio GP”), is the general partner ofCo-Investment Portfolio 2021, ICQCo-Investment II TT GP LLC, a Delaware limited liability company (“ICQCo-Investment”), is the general partner ofCo-Investment Portfolio GP, Tactical Opportunities Portfolio GP, LP, a Delaware limited partnership (“Tactical Opportunities Portfolio GP”), is a the general partner of Tactical Opportunities 2020 and ICQ Tactical Opportunities TT GP, LLC, a Delaware limited liability company (“ICQ Tactical Opportunities” and, together with ICQ BB and ICQCo-Investment, the “General |
136
| Partners”) is the general partner of Tactical Opportunities Portfolio GP. Divesh Makan, a citizen of the United States, is the managing member of each of the General Partners and may be deemed to have voting, investment, and dispositive power with respect to the shares held by the Limited Partnerships. The address of the foregoing entities and person is c/o ICONIQ Capital, 394 Pacific Avenue, 2nd Floor, San Francisco, CA 94111. |
| (18) | By virtue of his indirect control of the general partner of, and his indirect interest in, Dyal Capital SLP LP, Mr. Rees may be deemed to beneficially own the Class D Shares and the Common Units beneficially owned by Dyal Capital SLP LP. Mr. Rees disclaims beneficial ownership of the shares and units held by Dyal Capital SLP LP, including and any of our Class B Shares that may be acquired upon exchange of Common Units and Class D Shares, and any Common Units and Class C Shares and Class D Shares, in each case, except to the extent of his pecuniary interest therein. The business address for each of Mr. Rees and Dyal Capital SLP LP is 1290 Avenue of the Americas, New York, NY 10104. |
| (19) | NBSH Blue Investments, LLC is the beneficial owner of 444,328,208 Class C Shares and an equal number of Common Units. By virtue of the control of NBSH Blue Investments, LLC by affiliates of NBSH Acquisition, LLC, NBSH Acquisition, LLC may be deemed to beneficially own the Class C Shares beneficially owned by NBSH Blue Investments, LLC. Three or more individuals are expected to have decision making authority with respect to the Class C Shares held indirectly by NBSH Acquisition, LLC, and therefore no individual is a beneficial holder of the shares held by NBSH Acquisition, LLC. The business address for each of NBSH Acquisition, LLC and NBSH Blue Investments, LLC is 1290 Avenue of the Americas, New York, NY 10104. |
| (20) | Based solely upon information contained in the Schedule 13G filed with the SEC on February 14, 2022, by Blue Pool Capital Limited, a company incorporated in Hong Kong (“BPCL”), Blue Pool Management Ltd., a Cayman Islands exempted company (“BPM”) and Oliver Paul Weisberg, a citizen of the Hong Kong Special Administrative Region of the People’s Republic of China (“Mr. Weisberg”). PSPE II Limited is an exempted company organized under the laws of the Cayman Islands. BPCL is the investment manager of PSPE II Limited and, in such capacity, exercises voting and investment power over the Shares held for the account of PSPE II Limited. BPM is the sole shareholder of BPCL. Mr. Weisberg is the sole shareholder and a director of BPM. Mr. Weisberg is also a director of BPCL. The principal business address of each of the Reporting Persons is 25/F Hysan Place, 500 Hennessy Road, Causeway Bay, Hong Kong. |
| (21) | Soros Fund Management LLC (“SFM LLC”) serves as principal investment manager to Quantum Strategic Partners Ltd. As such, SFM LLC has been granted investment advisory discretion over all portfolio investments held for the account of such entities. George Soros serves as Chairman of SFM LLC and may be deemed to beneficially own all of the shares held by Quantum Strategic Partners Ltd. The address of Quantum Strategic Partners Ltd. is c/o Walkers Corporate Limited, Cayman Corporate Centre, 27 Hospital Road, George Town, Grand Cayman KY1-9008, Cayman Islands. |
| (22) | The common stock owned by MSD Owl Rock Investments, LLC (“MSD Owl Rock”) is comprised of 41,721,673 Class C Shares. The shares are held of record by MSD Owl Rock. MSD Private Capital Investments, L.P., a Delaware limited partnership, is the sole owner of MSD Owl Rock and may be deemed to beneficially own the securities beneficially owned by MSD Owl Rock. MSD Capital, L. P. (“MSD Capital”) is the investment manager of MSD Owl Rock and the general partner of MSD Private Capital Investments, L.P., and may be deemed to beneficially own the securities beneficially owned by MSD Owl Rock. MSD Capital Management, LLC (“MSD Capital Management”), is the general partner of MSD Capital, and may be deemed to beneficially own the securities beneficially owned by MSD Capital. Each of John C. Phelan and Marc R. Lisker is a manager of, and may be deemed to beneficially own the securities beneficially owned by MSD Capital Management. Michael S. Dell is the controlling member of MSD Capital Management and may be deemed to beneficially own securities beneficially owned by MSD Capital Management. Each of Messrs. Dell, Phelan and Lisker disclaims beneficial ownership of such securities except to the extent of any pecuniary interest therein. The address of the principal business office of MSD Capital, L.P. is 645 Fifth Avenue, 21st Floor, New York, NY 10022. |
| (23) | Based solely upon information contained in the Schedule 13G jointly filed with the SEC on September 30, 2021 by Koch Industries, Inc. (“Koch Industries”) with respect to (i) 7,167,817 Class A Shares of Issuer held by Koch Financial Assets III, LLC (“KFA”) and (ii) 28,799,854 Class A Shares of Issuer held by Koch |
137
| Companies Defined Benefit Master Trust (“Koch Pension”). Koch Industries may be deemed to beneficially own the Issuer securities beneficially owned by (i) KFA as a result of its 100% ownership of KFA and (ii) the Koch Pension because of the involvement of certain of Koch Industries’ employees on Koch Pension’s investment committee. |
| (24) | Based solely upon information contained in the Schedule 13G jointly filed with the SEC on February 11, 2022, by and on behalf of Capital International Investors (“CII”), a division of Capital Research and Management Company (“CRMC”), as well as its investment management subsidiaries and affiliates Capital Bank and Trust Company, Capital International, Inc., Capital International Limited, Capital International Sarl, Capital International K.K., and Capital Group Private Client Services, Inc. (together with CRMC, the “investment management entities”). CII’s divisions of each of the investment management entities collectively provide investment management services under the name “Capital International Investors.” The address of the principal business office of CII is 333 South Hope Street, 55th Floor, Los Angeles, CA 90071. |
| (25) | Based solely upon information contained in the Schedule 13G jointly filed with the SEC on February 9, 2022, by and on behalf of The Vanguard Group. The address of the principal business office of The Vanguard Group is 100 Vanguard Blvd. Malvern, PA 19355. |
| (26) | Based solely upon information contained in the Schedule 13G jointly filed with the SEC on January 10, 2022, by and on behalf of Capital World Investors (“CWI”), a division of CRMC, as well as its investment management entities. CWI’s divisions of each of the investment management entities collectively provide investment management services under the name “Capital World Investors.” The address of the principal business office of CWI is 333 South Hope Street, 55th Floor, Los Angeles, CA 90071. |
138
SELLING HOLDERS
This prospectus relates to the resale by the Selling Holders from time to time of Class A Shares. The Selling Holders may from time to time offer and sell any or all of the Class A Shares set forth below pursuant to this prospectus and any accompanying prospectus supplement. When we refer to the “Selling Holders” in this prospectus, we mean the persons listed in the table below, and the pledgees, donees, transferees, assignees, successors, designees and others who later come to hold any of the Selling Holders’ interest in the Class A Shares other than through a public sale.
The following table and the accompanying footnotes, based primarily on information initially provided to us by the Selling Holders, sets forth, as of August 2, 2021, the Class A Shares they wished to be covered by this registration statement and eligible for sale under this prospectus. A Selling Holder may have sold or transferred some or all of the securities indicated below with respect to such SElling Holder, and may in the future sell or transfer some or all of the securities indicated below in transactions exempt from the registration requirements of the SEcurities Act rather than under this prospectus.
We cannot advise you as to whether the Selling Holders will in fact sell any or all of such
Class A Shares Beneficially Owned Prior to Offering | Class A Shares Offered | Class A Shares Beneficially Owned After the Offered Shares are Sold | ||||||||||||||||||||||
Number of Shares | %(1) | Number of Shares | %(1) | Number of Shares | %(1) | |||||||||||||||||||
Alyeska Master Fund, L.P.(2) | 4,068,427 | * | 3,000,000 | * | 1,068,427 | * | ||||||||||||||||||
Blue Investors, L.L.C.(3) | 3,254,000 | * | 3,254,000 | * | — | — | ||||||||||||||||||
Blue Warehouse, L.L.C.(4) | 11,746,000 | * | 11,746,000 | * | — | — | ||||||||||||||||||
Chescaplq LLC(5) | 750,000 | * | 750,000 | * | — | — | ||||||||||||||||||
CIBC Mellon Trust Company, Trustee of the CN Canadian Master Trust Fund(6) | 3,500,000 | * | 3,500,000 | * | — | — | ||||||||||||||||||
Citadel Multi-Strategy Equities Master Fund Ltd.(7) | 3,000,000 | * | 3,000,000 | * | — | — | ||||||||||||||||||
CVI Investments, Inc.(8) | 2,810,961 | * | 2,250,000 | * | 560,961 | * | ||||||||||||||||||
Affiliates of DSAM Partners (London) Ltd.(9) | 1,360,000 | * | 1,360,000 | * | — | — | ||||||||||||||||||
Vazirani Family Trust(10) | 250,000 | * | 250,000 | * | ||||||||||||||||||||
Federated Funds(11) | 10,000,000 | * | 10,000,000 | * | — | — | ||||||||||||||||||
XN Exponent Master Fund LP(12) | 3,250,000 | * | 3,250,000 | * | — | — | ||||||||||||||||||
Ghisallo Master Fund LP (13) | 3,000,000 | * | 2,000,000 | * | 1,000,000 | * | ||||||||||||||||||
Hedosophia Public Investments Limited(14) | 8,000,000 | * | 8,000,000 | * | — | — | ||||||||||||||||||
Highbridge Tactical Credit Master Fund, L.P.(15) | 1,500,000 | * | 1,500,000 | * | — | — | ||||||||||||||||||
BB Holdings AA LP and Affiliates(16) | 50,000,000 | 3.72 | % | 50,000,000 | 3.72 | % | — | — | ||||||||||||||||
Illiquid Markets 1888 Fund, LLC(17) | 2,000,000 | * | 2,000,000 | * | — | — | ||||||||||||||||||
Entities affiliated with Millennium Management LLC(18) | 2,712,284 | * | 2,640,000 | * | 72,284 | * | ||||||||||||||||||
Jane Street Global Trading, LLC(19) | 639,249 | * | 500,000 | * | 139,249 | * | ||||||||||||||||||
Koch Companies Defined Benefit Master Trust(20) | 10,000,000 | * | 10,000,000 | * | — | — | ||||||||||||||||||
139
Class A Shares Beneficially Owned Prior to Offering | Class A Shares Offered | Class A Shares Beneficially Owned After the Offered Shares are Sold | ||||||||||||||||||||||
Number of Shares | %(1) | Number of Shares | %(1) | Number of Shares | %(1) | |||||||||||||||||||
Liberty Mutual Investment Holdings LLC(21) | 10,000,000 | * | 10,000,000 | * | — | — | ||||||||||||||||||
Linden Capital L.P.(22) | 250,000 | * | 250,000 | * | — | — | ||||||||||||||||||
Funds managed by Luxor Capital Group, LP(23) | 6,002,020 | * | 6,000,000 | * | 2,020 | * | ||||||||||||||||||
Tech Opportunities LLC(24) | 500,000 | * | 500,000 | * | — | — | ||||||||||||||||||
The Phoenix Insurance Ltd.(25) | 680,931 | * | 650,000 | * | 30,931 | |||||||||||||||||||
Affiliates of MSD Capital, L.P.(26) | 3,375,000 | * | 3,375,000 | * | — | — | ||||||||||||||||||
Affiliates of MSD Partners, L.P.(27) | 4,125,000 | * | 4,125,000 | * | — | — | ||||||||||||||||||
PFMO4 LLC(28) | 500,000 | * | 500,000 | * | — | — | ||||||||||||||||||
Shotfut Menayot Chool Phoenix Amitim(29) | 3,600,088 | * | 2,600,000 | * | 1,000,088 | * | ||||||||||||||||||
Suvretta Master Fund, Ltd. and Suvretta Long Master Fund, Ltd.(30) | 1,000,000 | * | 1,000,000 | * | — | — | ||||||||||||||||||
TOMS Capital Investment Management LP(31) | 2,000,000 | * | 2,000,000 | * | — | — | ||||||||||||||||||
Aaron Kim(32) | 192,208 | * | 192,208 | * | — | — | ||||||||||||||||||
Anne Ray Foundation(33) | 768,839 | * | 768,839 | * | — | — | ||||||||||||||||||
Moore Management Trust(34) | 384,419 | * | 384,419 | * | — | — | ||||||||||||||||||
Co-Investment Fund (Parallel) L.P.—CF IV Series(35) | 592,774 | * | 592,774 | * | — | — | ||||||||||||||||||
Project Owl Rock LLC(36) | 392,005 | * | 392,005 | * | — | — | ||||||||||||||||||
PSPE II Limited(37) | 63,673,188 | 4.74 | % | 63,673,188 | 4.74 | % | — | — | ||||||||||||||||
Brown University(38) | 38,792,761 | 2.89 | % | 38,792,761 | 2.89 | % | — | — | ||||||||||||||||
Carl Daikeler Living Trust(39) | 51,255 | * | 51,255 | * | — | — | ||||||||||||||||||
CHCP Direct Investors (Owl Rock), L.P.(40) | 3,844,197 | * | 3,844,197 | * | — | — | ||||||||||||||||||
The Cox-Vadakan 2015 Irrevocable Trust(41) | 25,627 | * | 25,627 | * | — | — | ||||||||||||||||||
Co-Investment Fund IV, L.P US Tax Exempt Series(42) | 140,388 | * | 140,388 | * | — | — | ||||||||||||||||||
Common Pension Fund E(43) | 12,813,992 | * | 12,813,992 | * | — | — | ||||||||||||||||||
Donald and Catherine Marron Charitable Trust(44) | 256,279 | * | 256,279 | * | — | — | ||||||||||||||||||
Fexos Owl Rock, Inc.(45) | 1,281,399 | * | 1,281,399 | * | — | — | ||||||||||||||||||
JMC Investments, LLC(46) | 384,419 | * | 384,419 | * | — | — | ||||||||||||||||||
John J. Mack(47) | 128,139 | * | 128,139 | * | — | — | ||||||||||||||||||
Katherine M. Gehl 2005 Trust(48) | 96,103 | * | 96,103 | * | — | — | ||||||||||||||||||
Quantum Strategic Partners Ltd.(49) | 19,220,989 | 1.43 | % | 19,220,989 | 1.43 | % | — | — | ||||||||||||||||
Leesa Gidaro Living Trust(50) | 128,139 | * | 128,139 | * | — | — | ||||||||||||||||||
Margaret A. Cargill Foundation(51) | 512,559 | * | 512,559 | * | — | — | ||||||||||||||||||
ORC Partners, L.P.(52) | 3,075,358 | * | 3,075,358 | * | — | — | ||||||||||||||||||
ORCH Partners, L.P.(53) | 768,839 | * | 768,839 | * | — | — | ||||||||||||||||||
140
Class A Shares Beneficially Owned Prior to Offering | Class A Shares Offered | Class A Shares Beneficially Owned After the Offered Shares are Sold | ||||||||||||||||||||||
Number of Shares | %(1) | Number of Shares | %(1) | Number of Shares | %(1) | |||||||||||||||||||
Owl Capital, LLC(54) | 1,922,098 | * | 1,922,098 | * | — | — | ||||||||||||||||||
Rural India Supporting Trust(55) | 3,203,498 | * | 3,203,498 | * | — | — | ||||||||||||||||||
The Dalton School, Inc.(56) | 256,279 | * | 256,279 | * | — | — | ||||||||||||||||||
The Regents of the University of California(57) | 16,017,491 | 1.19 | % | 16,017,491 | 1.19 | % | — | — | ||||||||||||||||
W2M2H LLC(58) | 128,139 | * | 128,139 | * | — | — | ||||||||||||||||||
WVP Insurance Fund I Series Interests of the SALI Multi-Series Fund IV, LP(59) | 1,281,399 | * | 1,281,399 | * | — | |||||||||||||||||||
2006 Popowitz Family Trust(60) | 79,628 | * | 79,628 | * | — | — | ||||||||||||||||||
BCF IV (OS), Inc.(61) | 565,762 | * | 565,762 | * | — | — | ||||||||||||||||||
BRHF Custom, LLC(62) | 512,559 | * | 512,559 | * | — | — | ||||||||||||||||||
Brian Kwait(63) | 129,139 | * | 128,139 | * | 1,000 | |||||||||||||||||||
Bryan White(64) | 1,116,646 | * | 1,116,646 | * | — | — | ||||||||||||||||||
Chinn Bai Revocable Trust(65) | 32,034 | * | 32,034 | * | — | — | ||||||||||||||||||
Co-Investment Fund IV, L.P. US Taxable Series(66) | 695,696 | * | 695,696 | * | — | — | ||||||||||||||||||
Co-Investment Fund IV, L.P.Z US Taxable Series(67) | 176,166 | * | 176,166 | * | — | — | ||||||||||||||||||
Crescent Holdings, LLC(68) | 1,281,399 | * | 1,281,399 | * | — | — | ||||||||||||||||||
David R. Salomon(69) | 227,905 | * | 227,905 | * | — | — | ||||||||||||||||||
Dawn Creek Investments LLC(70) | 1,018,710 | * | 1,018,710 | * | — | — | ||||||||||||||||||
Effem Private Credit Fund Ltd.(71) | 922,607 | * | 922,607 | * | — | — | ||||||||||||||||||
GAC Diversified IDF OR, LLC(72) | 256,279 | * | 256,279 | * | — | — | ||||||||||||||||||
GAC Long OR, LLC(73) | 384,419 | * | 384,419 | * | — | — | ||||||||||||||||||
Glate, LLC(74) | 51,255 | * | 51,255 | * | — | — | ||||||||||||||||||
Good Ventures Foundation(75) | 2,405,003 | * | 2,405,003 | * | — | — | ||||||||||||||||||
Gracie Partners, LLC(76) | 1,848,874 | * | 1,848,874 | * | — | — | ||||||||||||||||||
Halper Irrevocable Trust(77) | 128,139 | * | 128,139 | * | — | — | ||||||||||||||||||
Halper Living Trust(78) | 128,139 | * | 128,139 | * | — | — | ||||||||||||||||||
Marlene Hess(79) | 192,208 | * | 192,208 | * | — | — | ||||||||||||||||||
Marron Direct Investments, LLC(80) | 704,768 | * | 704,768 | * | — | — | ||||||||||||||||||
Merrick R. Kleeman 2016 Irrevocable Trust(81) | 256,279 | * | 256,279 | * | — | — | ||||||||||||||||||
Michael S. Baldock(82) | 128,139 | * | 128,139 | * | — | — | ||||||||||||||||||
Miriam and Peter Haas Investments LP(83) | 192,208 | * | 192,208 | * | — | — | ||||||||||||||||||
MLH Trust(84) | 384,419 | * | 384,419 | * | — | — | ||||||||||||||||||
MPM Investments LLC(85) | 256,279 | * | 256,279 | * | — | — | ||||||||||||||||||
MSD Owl Rock Investments, LLC(86) | 41,721,673 | 3.11 | % | 41,721,673 | 3.11 | % | — | — | ||||||||||||||||
Naomi Gleit Living Trust(87) | 203,740 | * | 203,740 | * | — | — | ||||||||||||||||||
OCA Investment Partners LLC(88) | 3,587,918 | * | 3,587,918 | * | — | — | ||||||||||||||||||
RE Salomon Family LLC(89) | 805,450 | * | 805,450 | * | — | — | ||||||||||||||||||
141
Class A Shares Beneficially Owned Prior to Offering | Class A Shares Offered | Class A Shares Beneficially Owned After the Offered Shares are Sold | ||||||||||||||||||||||
Number of Shares | %(1) | Number of Shares | %(1) | Number of Shares | %(1) | |||||||||||||||||||
RES Revocable Trust(90) | 659,004 | * | 659,004 | * | — | — | ||||||||||||||||||
Schrage Family Trust Agreement(91) | 265,431 | * | 265,431 | * | — | — | ||||||||||||||||||
Stuart Investment Partners, LLC(92) | 384,419 | * | * | 384,419 | * | — | — | |||||||||||||||||
The Bruce and Elizabeth Dunlevie Living Trust(93) | 203,740 | * | 203,740 | * | — | — | ||||||||||||||||||
The Richard Salomon Family Foundation Inc.(94) | 137,291 | * | 137,291 | * | — | — | ||||||||||||||||||
The State of Oregon, by and through the Oregon Investment Council on behalf of the Oregon Public Employees Retirement Fund(95) | 4,805,246 | * | 4,805,246 | * | — | — | ||||||||||||||||||
Kevin Beebe(96) | 25,000 | * | 25,000 | * | — | — | ||||||||||||||||||
Payne Brown(97) | 25,000 | * | 25,000 | * | — | — | ||||||||||||||||||
Rick Jelinek(98) | 25,000 | * | 25,000 | * | — | — | ||||||||||||||||||
Roma Khanna(99) | 25,000 | * | 25,000 | * | — | — | ||||||||||||||||||
John Kim(100) | 25,000 | * | 25,000 | * | — | — | ||||||||||||||||||
Michael Rubenstein(101) | 25,000 | * | 25,000 | * | — | — | ||||||||||||||||||
Vijay Sondhi(102) | 25,000 | * | 25,000 | * | — | — | ||||||||||||||||||
Michael Vorhaus(103) | 25,000 | * | 25,000 | * | — | — | ||||||||||||||||||
Altimar Sponsor LLC(104) | 4,385,625 | * | 4,385,625 | * | — | — | ||||||||||||||||||
NBSH Blue Investments, LLC(105) | 487,356,098 | 36.29% | 487,356,098 | 36.29 | % | — | — | |||||||||||||||||
Owl Rock Capital Feeder LLC(106) | 291,932,700 | 21.74% | 291,932,700 | 21.74 | % | — | — | |||||||||||||||||
Dyal Capital SLP LP(107) | 143,739,427 | 10.70% | 143,739,427 | 10.70 | % | — | — | |||||||||||||||||
Workplay Ventures LLC(108) | 1,990,744 | * | 1,990,744 | * | — | — | ||||||||||||||||||
Dustin A. Moskovitz Trust dated December 27, 2005(109) | 3,806,395 | * | 3,806,395 | * | — | — | ||||||||||||||||||
| * | Less than 1%. |
| (1) | Based upon 1,343,042,262 Class A Shares (including 320,005,528 Class A Shares outstanding as of June 14, 2021 and 1,023,036,734 Class A Shares that were issued in respect of Common Units and Seller Earnout Securities that vested upon the occurrence of certain Triggering Events). Ownership percentages do not include Class A Shares issued or issuable upon the exercise of warrants or pursuant to the 2021 Omnibus Incentive Plan. Class A Shares offered and beneficially owned are based primarily on information initially provided to us by the Selling Holders indicating the Class A Shares they wished to be covered by this registration statement and eligible for sale under this prospectus. A Selling Holder may have sold or transferred some or all of the securities set forth in the table and accompanying footnotes, and consequently the securities indicated to be offered may exceed the number of seucriites to be sold by the Selling Holder or the number of securities outstanding. |
| (2) | Consists of 4,068,427 Class A Shares (3,000,000 of which are being offered by this prospectus) held by Alyeska Master Fund, L.P., a Cayman Islands limited partnership (“Alyeska”). Alyeska Investment Group, L.P., the investment manager of Alyeska, has voting and investment control of the shares held by Alyeska. Mr. Anand Parekh is the Chief Executive Officer of Alyeska Investment Group, L.P. and may be deemed to be the beneficial owner of such shares. Mr. Parekh, however, disclaims any beneficial ownership of the |
142
| shares held by Alyeska Master Fund, L.P. The address of Alyeska is 77 West Wacker Drive, Suite 700, Chicago, Illinois 60601. |
| (3) | Consists of 3,254,000 Class A Shares held by Blue Investors, L.L.C. (“Blue Investors”). Blue Investors is a Delaware limited liability company. While Oak Lawn Direct Investors GP, L.L.C. (“Oak Lawn”) is the managing member of Blue Investors, CH Investment Partners, L.L.C. (“CHIP”) serves as the investment manager to Blue Investors. As investment manager, CHIP has been granted exclusive investment discretion and investment management authority with respect to Blue Investors and its investments, including the common stock of Altimar held by Blue Investors. Michael Silverman and Kirk Rimer serve as Co-Presidents of CHIP and ultimately control both CHIP and Oak Lawn. The business address for each of Blue Investors, CHIP, Oak Lawn, Mr. Silverman and Mr. Rimer is c/o CH Investment Partners, L.L.C., 3953 Maple Avenue, Suite 250, Dallas, Texas 75219. |
| (4) | Consists of 11,746,000 Class A Shares held by Blue Warehouse, L.L.C. (“Blue Warehouse”). Blue Warehouse is a Delaware limited liability company. While Oak Lawn Direct Investors GP, L.L.C. (“Oak Lawn”) is the managing member of Blue Warehouse. CH Investment Partners, L.L.C. (“CHIP”) serves as the investment manager to Blue Warehouse. As investment manager, CHIP has been granted exclusive investment discretion and investment management authority with respect to Blue Warehouse and its investments, including the common stock of Blue Owl held by Blue Warehouse. Michael Silverman and Kirk Rimer serve as Co-Presidents of CHIP and ultimately control both CHIP and Oak Lawn. The business address for each of Blue Warehouse, CHIP, Oak Lawn, Mr. Silverman and Mr. Rimer is c/o CH Investment Partners, L.L.C., 3953 Maple Avenue, Suite 250, Dallas, Texas 75219. |
| (5) | Consists of 750,000 Class A Shares held by Chescaplq LLC, a Delaware limited liability company. Traci Lerner has the power to vote or dispose of the shares held by Chescaplq LLC. The address of Chescaplq LLC is 2800 Quarry Lake Drive, Suite 300 Baltimore, MD 21209. |
| (6) | Consists of 3,500,000 Class A Shares held by the CN Canadian Master Trust Fund, a Canadian pension fund. CIBC Mellon Trust Company is the trustee of the CN Canadian Master Trust Fund. Marlene Kaye Puffer is the President and Chief Executive Officer of CN Investment Division. CIBC Mellon Trust Company is the trustee and may be deemed to beneficially own, the shares held by CN Canadian Master Trust Fund. The business address of the foregoing entities is 5 Place Ville Marie, Suite 1100, Montreal, Quebec H3C 4T2. |
| (7) | Consists of 3,000,000 Class A Shares held by Citadel Multi-Strategy Equities Master Fund Ltd., a Cayman Islands limited company. Pursuant to a portfolio management agreement, Citadel Advisors LLC, an investment advisor registered under the U.S. Investment Advisers Act of 1940 (“CAL”), holds the voting and dispositive power with respect to the shares held by Citadel Multi-Strategy Equities Master Fund Ltd. Citadel Advisors Holdings LP (“CAH”) is the sole member of CAL. Citadel GP LLC is the general partner of CAH. Kenneth Griffin (“Griffin”) is the President and Chief Executive Officer of and sole member of Citadel GP LLC. Citadel GP LLC and Griffin may be deemed to be the beneficial owners of the Class A Shares through their control of CAL and/or certain other affiliated entities. The address of Citadel Multi-Strategy Equities Master Fund Ltd. is c/o Citadel Americas LLC, 131 South Dearborn Street, Chicago, IL 60603. |
| (8) | Consists of 2,810,961 Class A Shares (2,250,000 of which are being offered by this prospectus) held by CVI Investments, Inc., a Cayman Islands exempted corporation (“CVI”). Heights Capital Management, Inc., the authorized agent of CVI, has discretionary authority to vote and dispose of the shares held by CVI and may be deemed to be the beneficial owner of these shares. Martin Kobinger, in his capacity as Investment Manager of Heights Capital Management, Inc., may also be deemed to have investment discretion and voting power over the shares held by CVI. Mr. Kobinger disclaims any such beneficial ownership of the shares. The principal business address of CVI is c/o Heights Capital Management, Inc., 101 California Street, Suite 3250, San Francisco, California 94111. |
| (9) | Consists of 280,000 Class A Shares held by DSAM Alpha+ Master Fund, a Cayman Islands limited liability company, and 1,080,000 Class A Shares held by DSAM+ Master Fund, a Cayman Islands limited liability company (collectively, the “DSAM Funds”). DSAM Partners (London) Ltd. (the “Investment Advisor”) is the investment advisor to the DSAM Funds and as such may be deemed to have voting and investment power over the securities held by the DSAM Funds. The Investment Advisor is ultimately |
143
| controlled by Mr. Guy Shahar. The DSAM Funds and Mr. Shahar disclaim beneficial ownership of the securities listed above. The address of each of the DSAM Funds is c/o Maples Corporate Services Limited, PO Box 309, Ugland House, Grand Cayman KY1-1104. |
| (10) | Consists of 250,000 Class A Shares held by Vazirani Family Trust, a California trust. Pravin Vazirani is the Trustee of Vazirani Family Trust. The address of Pravin Vazirani is 1940 Camino a los Cerros, Menlo Park, CA 94025. |
| (11) | Consists of 9,725,000 Class A Shares held by Federated Hermes Kaufmann Fund, a Massachusetts business trust (“FHK I”), a portfolio of Federated Hermes Equity Funds (“FH Equity”) and 275,000 Class A Shares held by Federated Hermes Kaufmann Fund II, a Massachusetts business trust (“FHK II”), a portfolio of Federated Hermes Insurance Series (“FH Insurance”). Both FH Equity and FH Insurance are managed by Federated Equity Management Company of Pennsylvania and subadvised by Federated Global Investment Management Corp., which are wholly owned subsidiaries of FII Holdings, Inc., which is a wholly owned subsidiary of Federated Hermes, Inc. (the “Parent”). All of the Parent’s outstanding voting stock is held in the Voting Shares Irrevocable Trust (the “Trust”), for which Thomas R. Donahue, Rhodora J. Donahue and J. Christopher Donahue, who are collectively referred to as the “Trustees,” act as trustees. The Parent’s subsidiaries have the power to direct the vote and disposition of the securities held by the Fund. Each of the Parent, its subsidiaries, the Trust, and each of the Trustees expressly disclaim beneficial ownership of such securities. The address of FHK Fund I and FHK Fund II is 4000 Ericsson Drive, Warrendale, Pennsylvania 15086-7561. |
| (12) | Consists of 3,250,000 Class A Shares held by XN Exponent Master Fund LP, a Cayman Islands limited partnership. XN Exponent Advisors LLC serves as investment manager to XN Exponent Master Fund LP (the “Fund”) and has discretionary authority to make investment decisions and determine how to vote any securities held by the Fund. XN Exponent Advisors LLC is wholly owned by XN LP, a registered investment advisor. The general partner of XN LP is XN Management GP LLC, which is indirectly controlled by Gaurav Kapadia. The principal business address of the entities referenced herein is 412 West 15th Street, 13th Floor, New York, New York 10011. |
| (13) | Consists of 3,000,000 Class A Shares (2,000,000 of which are being offered by this prospectus) held by Ghisallo Capital Management LLC, a Cayman Islands limited partnership. Michael Germino is the authorized signatory of Ghisallo Capital Management LLC. The address of Michael Germino is 27 Hospital Road, Grand Cayman KYI-9008. |
| (14) | Consists of 8,000,000 Class A Shares held by Hedosophia Public Investments Limited, a Guernsey limited company. The address of Hedosophia Public Investments Limited is PO Box 255, Trafalgar Court, Les Banques, St. Peter Port, Guernsey, GY1 3QL. |
| (15) | Consists of 1,500,000 Class A Shares held by Highbridge Tactical Credit Master Fund, L.P., a Cayman Islands limited partnership (the “Highbridge Fund”). Excludes 161,445 Class A Shares underlying warrants held by the Highbridge Fund that are not exercisable within 60 days. Highbridge Capital Management, LLC (“HCM”), the trading manager of the Highbridge Fund, may be deemed to be the beneficial owner of the shares held by the Highbridge Fund. Jonathan Segal and Jason Hempel are responsible for the investment and voting decisions made by HCM with respect to the shares held by the Highbridge Fund. The Highbridge Fund and the foregoing individuals disclaim any beneficial ownership of the shares held by the Highbridge Fund. The business address of HCM and the Highbridge Fund is 277 Park Avenue, 23rd Floor, New York, NY 10172. |
| (16) | Consists of (i) 3,500,000 Class A Shares held by BB Holdings AC LP, a Delaware limited partnership (“BB Holdings AC”), (ii) 2,000,000 Class A Shares held by Glide Path Solutions 2021 LP, a Delaware limited partnership (“Glide Path Solutions 2021”), (iii) 4,500,000 Class A Shares held by Glide Path Solutions 2020 LP, a Delaware limited partnership (“Glide Path Solutions 2020”), (iv) 20,000,000 Class A Shares held by BB Holdings AA LP, a Delaware limited partnership (“BB Holdings AA” and, together with BB Holdings AC, Glide Path Solutions 2021 and Glide Path Solutions 2020, the “ICQ Limited Partnerships”), (v) 10,000,000 Class A Shares held by Co-Investment Portfolio 2021 LP, a Delaware limited partnership(“Co-Investment Portfolio 2021”) and (vi) 10,000,000 Class A Shares held by Tactical Opportunities Portfolio 2020 LP, a Delaware limited partnership (“Tactical Opportunities 2020” and, together withCo-Investment Portfolio 2021 and the ICQ Limited Partnerships, the “Limited |
144
| Partnerships”). ICQ BB GP, LLC, a Delaware limited liability company (“ICQ BB”), is the general partner of the ICQ Limited Partnerships, Co-Investment Portfolio GP II LP, a Delaware limited partnership(“Co-Investment Portfolio GP”), is the general partner ofCo-Investment Portfolio 2021, ICQCo-Investment II TT GP LLC, a Delaware limited liability company (“ICQCo-Investment”), is the general partner ofCo-Investment Portfolio GP, Tactical Opportunities Portfolio GP, LP, a Delaware limited partnership (“Tactical Opportunities Portfolio GP”), is a the general partner of Tactical Opportunities 2020 and ICQ Tactical Opportunities TT GP, LLC, a Delaware limited liability company (“ICQ Tactical Opportunities” and, together with ICQ BB and ICQCo-Investment, the “General Partners”) is the general partner of Tactical Opportunities Portfolio GP. Divesh Makan is the managing member of each of the General Partners and may be deemed to have voting, investment, and dispositive power with respect to the shares held by the Limited Partnerships. Tactical Opportunities Portfolio 2020 LP and BB Holdings OR LP, an affiliate of the Limited Partnerships, entered into revenue share agreements across the Owl Rock Opportunistic Platform on or around July 2020. The address of the foregoing entities and person is c/o ICONIQ Capital, 394 Pacific Avenue, 2nd Floor, San Francisco, CA 94111. |
| (17) | Consists of 2,000,000 Class A Shares held by Illiquid Markets 1888 Fund, LLC, a Delaware limited liability company. Christopher Dries and Jeffrey Straayer have the power to vote or dispose of, and may be deemed to beneficially own, the securities held by the Selling Holder. The address of Illiquid Markets 1888 Fund, LLC is 1401 Lawrence St, Suite 1920, Denver, CO 80202. |
| (18) | Consists of 2,712,284 Class A Shares (2,640,000 of which are being offered by this prospectus) held by Integrated Core Strategies (US) LLC, a Delaware limited liability company (“Integrated Core Strategies”). Millennium Management LLC, a Delaware limited liability company (“Millennium Management”), is the general partner of the managing member of Integrated Core Strategies and may be deemed to have shared voting control and investment discretion over securities owned by Integrated Core Strategies. The number of shares and class ownership percentages reported for Integrated Core Strategies do not include the Class A Share and 311,263 Class A Shares issuable upon exercise of warrants held by ICS Opportunities, Ltd., an exempted company organized under the laws of the Cayman Islands (“ICS Opportunities”), an affiliate of Integrated Core Strategies. Millennium Management is also the general partner of the 100% owner of ICS Opportunities and may also be deemed to have shared voting control and investment discretion over securities owned by ICS Opportunities. Millennium Group Management LLC, a Delaware limited liability company (“Millennium Group Management”), is the managing member of Millennium Management and may also be deemed to have shared voting control and investment discretion over securities owned by Integrated Core Strategies and ICS Opportunities. The managing member of Millennium Group Management is a trust of which Israel A. Englander, a United States citizen (“Mr. Englander”), currently serves as the sole voting trustee. Therefore, Mr. Englander may also be deemed to have shared voting control and investment discretion over securities owned by Integrated Core Strategies and ICS Opportunities. The foregoing should not be construed in and of itself as an admission by Millennium International Management, Millennium Management, Millennium Group Management or Mr. Englander as to beneficial ownership of the securities owned by Integrated Core Strategies or ICS Opportunities. The address of Integrated Core Strategies (US) LLC is c/o Millenium Management LLC, 399 Park Avenue, New York, NY 10022. |
| (19) | Consists of 639,249 Class A Shares (500,000 of which are being offered by this prospectus) held by Jane Street Global Trading, LLC, a Delaware limited liability company. Jane Street Global Trading, LLC is a wholly owned subsidiary of Jane Street Group, LLC. Michael A. Jenkins and Robert. A. Granieri are the members of the Operating Committee of Jane Street Group, LLC. The address of Jane Street Global Trading, LLC is 250 Vesey Street, 3rd Floor, New York, NY 10281. |
| (20) | Consists of 10,000,000 Class A Shares held by Koch Companies Defined Benefit Master Trust, a New York trust. The Koch Companies Pension Investment Committee has voting and investment power relating to the shares. The Committee has delegated to its member, Randall A. Bushman, decision making rights with respect to the shares. The address of Koch Companies Defined Benefit Master Trust is 500 Grant Street, Room 151-1065, Pittsburgh, PA 15258-0001. |
| (21) | Consists of 10,000,000 Class A Shares held by Liberty Mutual Investment Holdings LLC, a Delaware limited liability company (“LMIH”). LMIH’s six insurance company managing members are each |
145
| ultimately controlled by Liberty Mutual Holding Company Inc., a mutual holding company. The Chief Investment Officer of each of the managing members of LMIH exercises dispositive power over the Class A Shares being registered for resale in this prospectus. The address of LMIH is 175 Berkeley Street, Boston, MA 02116. |
| (22) | Consists of 250,000 Class A Shares held by Linden Capital L.P., a Bermuda limited partnership. The securities directly held by Linden Capital L.P. are indirectly held by Linden Advisors LP (the investment manager of Linden Capital L.P.), Linden GP LLC (the general partner of Linden Capital L.P.), and Mr. Siu Min (Joe) Wong (the principal owner and the controlling person of Linden Advisors LP and Linden GP LLC). Linden Capital L.P., Linden Advisors LP, Linden GP LLC and Mr. Wong share voting and dispositive power with respect to the securities held by Linden Capital L.P. The addresses of Linden Capital L.P. are Victoria Place, 31 Victoria Street, Hamilton HM10, Bermuda and c/o Linden Advisors LP, 590 Madison Avenue, 15th Fl, New York, NY 10022. |
| (23) | Consists of 862,223 Class A Shares held by Luxor Capital Partners, LP., a Delaware limited partnership (861,132 of which are being offered by this prospectus), 523,536 Class A Shares held by Luxor Capital Partners Offshore Master Fund, LP., a Cayman Islands limited partnership (522,871 of which are being offered by this prospectus) and 399,585 Class A Shares (399,321 of which are being offered by this prospectus) held by Luxor Wavefront, LP, a Delaware limited partnership, (collectively, the “Luxor Funds”) and 4,216,676 Class A Shares held by Lugard Road Capital Master Fund, LP., a Cayman Islands limited partnership. Christian Leone is acting on behalf of Luxor Capital Group, LP, the investment manager of each of the Luxor Funds. Jonathan Green, on behalf of Lugard Road Capital GP, LLC, the general partner of Lugard Road Capital Master Fund, LP, has the power to vote or dispose of, and may be deemed to beneficially own, the shares held by Lugard Road Capital Master Fund, LP. The address of each of the Luxor Funds and Lugard Road Capital Master Fund, LP is 1114 Avenue of the Americas, 28th Fl, New York, NY 10036. |
| (24) | Consists of 500,000 Class A Shares held by Tech Opportunities LLC, a Delaware limited liability company. Hudson Bay Capital Management LP, the investment manager of Tech Opportunities LLC, has voting and investment power over the securities held by the Selling Holder. Sander Gerber is the managing member of Hudson Bay Capital GP LLC, which is the general partner of Hudson Bay Capital Management LP. Each of Tech Opportunities LLC and Sander Gerber disclaims beneficial ownership over the securities held by the Selling Holder. The address of Tech Opportunities LLC is C/o Hudson Bay Capital Management LP, 777 Third Avenue, 30th Floor, New York, NY 10017. |
| (25) | Consists of 680,931 Class A Shares (650,000 of which are being offered by this prospectus) held by The Phoenix Insurance Company Ltd.. The address of The Phoenix Insurance Company Ltd. is 53 Derech HaShalom St, Givatayim, Israel. 5345433. |
| (26) | Consists of 3,187,500 shares held by MSD Value Investments, L.P., a Delaware limited partnership (“MSDVI”), and 187,500 shares held by Black Marlin Investments, LLC, a Delaware limited liability company (“Black Marlin”). MSD Capital, LP., a Delaware limited partnership (“MSD Capital”), is the general partner of MSDVI and the manager of Black Marlin and may be deemed to beneficially own securities beneficially owned by each of them. MSD Capital Management, LLC, a Delaware limited liability company (“MSD Capital Management”), is the general partner of MSD Capital, and may be deemed to beneficially own securities beneficially owned by MSD Capital. John Phelan and Marc Lisker are managers of, and Michael S. Dell is the controlling member of, MSD Capital Management, and may be deemed to beneficially own securities beneficially owned by MSD Capital Management. The address of MSDVI and Black Marlin is c/o MSD Capital, LP. 645 Fifth Ave, 21st Fl, NY, NY 10022. |
| (27) | Consists of 629,208 shares held by MSD Credit Opportunity Master Fund, L.P., a Cayman Islands limited partnership (“MSDC”), 1,978,331 shares held by MSD Special Investments Fund, L.P., a Delaware limited partnership (“MSDS”), 892,461 shares held by MSD SIF Holdings, L.P., a Cayman Islands limited partnership (“MSDSIF”), and 625,000 shares held by MSD EIV Private, LLC, a Delaware limited liability company (“MSDEIV” and, together with MSDC, MSDS and MSDSIF, the “MSD Funds”). MSD Partners, L.P. (“MSD Partners”) is the investment manager of the MSD Funds and may be deemed to beneficially own securities beneficially owned by MSD Partners. MSD Partners (GP), LLC, a Delaware limited liability company (“MSD GP”), is the general partner of MSD Partners, and may be deemed to beneficially |
146
| own securities beneficially owned by MSD Partners. Each of John C. Phelan, Marc R. Lisker and Brendan P. Rogers is a manager of, and may be deemed to beneficially own securities beneficially owned by MSD GP. MSDC, MSDS, MSDSIF and MSDEIV (collectively, the “MSD Partners Affiliates”) are the record and direct beneficial owners of the PIPE Securities. MSD Partners is the investment manager of the MSD Partners Affiliates. MSD GP is the general partner of MSD Partners and may be deemed to beneficially owned securities beneficially owned by MSD Partners. Each of John C. Phelan, Marc R. Lisker and Brendan Rodgers is a manager of, and may be deemed to beneficially own securities beneficially owned by, MSD GP. The address of MSDC and MSDSIF is c/o Maples and Calder, PO Box 309, Ugland House KY1-1104, Cayman Islands. The address of MSDS and MSDEIV is c/o MSD Partners, L.P., 645 Fifth Avenue, 21st Floor, New York, NY 10022. |
| (28) | Consists of 500,000 Class A Shares held by PFMO4 LLC, a Delaware limited liability company. Richard Perry, as manager of PFM04 LLC, may be deemed to have voting and investment power over the PIPE Securities and thus may be deemed to indirectly beneficially own the shares held by PFM04 LLC. The address of PFMO4 LLC is c/o 2912 Advisors LP, 405 Lexington Avenue, 34th Fl, New York, New York 10174. |
| (29) | Consists of 3,600,088 Class A Shares (2,600,000 of which are being offered by this prospectus) held by Shotfut Menayot Chool Phoenix Amitim. The address of Shotfut Menayot Chool Phoenix Amitim is 53 Derech HaShalom St, Givatayim, Israel. 5345433. |
| (30) | Consists of 995,000 shares held by Suvretta Master Fund, Ltd., a Cayman Islands exempted company, and 5,000 shares held by Suvretta Long Master Fund, Ltd., a Cayman Islands exempted company. Aaron Cowen as control person of Suvretta Capital Management, LLC, the investment manager of Suvretta Master Fund, Ltd. and Suvretta Long Master Fund, Ltd. may be deemed to beneficially own the shares held by them. The address of the foregoing entities is 540 Madison Ave, 7th Floor New York, NY 10022. |
| (31) | Consists of 1,333,333 Class A Shares held by TOMS Capital Investments LLC, a Delaware limited liability company (“TOMS”), and 666,667 Class A Shares held by TCIM Opportunities I Ltd., a Cayman Islands exempted company (“TCIM”). Benjamin Pass is the CIO of TOMS Capital Investment Management LP, the investment manager of the TOMS and TCIM. The address of TOMS Capital Investment Management LP is c/o TOMS Capital Investment Management LP, 450 West 14th Street, 13th Floor, New York, NY 10014. |
| (32) | Consists of 192,208 Class A Shares (including 16,874 Class A Shares issued upon conversion of Seller Earnout Shares subject to certain vesting conditions). |
| (33) | Consists of 768,839 Class A Shares (including 67,500 Class A Shares issued upon conversion of Seller Earnout Shares subject to certain vesting conditions). |
| (34) | Consists of 384,419 Class A Shares (including 33,750 Class A Shares issued upon conversion of Seller Earnout Shares subject to certain vesting conditions). The Trustee of Moore Management Trust is Ardon E. Moore. The address of the Selling Holder is 201 Main Street Suite 3200, Fort Worth, TX 76102. |
| (35) | Consists of 592,774 Class A Shares (including 52,042 Class A Shares issued upon conversion of Seller Earnout Shares subject to certain vesting conditions). |
| (36) | Consists of 392,005 Class A Shares (including 34,416 Class A Shares issued upon conversion of Seller Earnout Shares subject to certain vesting conditions). |
| (37) | Consists of 63,673,188 Class A Shares (including 5,590,164 Class A Shares issued upon conversion of Seller Earnout Shares subject to certain vesting conditions). The address of the Selling Holder is 25/F Hysan Place, 500 Hennessy Cause Way Bay, HKG. |
| (38) | Consists of 38,792,761 Class A Shares (including 3,405,796 Class A Shares issued upon conversion of Seller Earnout Shares subject to certain vesting conditions). The address of the Selling Holder is 121 South Main Street, 9th Floor, Providence, RI 02903. |
| (39) | Consists of 51,255 Class A Shares (including 4,500 Class A Shares issued upon conversion of Seller Earnout Shares subject to certain vesting conditions). |
| (40) | Consists of 3,844,197 Class A Shares (including 337,500 Class A Shares issued upon conversion of Seller Earnout Shares subject to certain vesting conditions). |
| (41) | Consists of 25,627 Class A Shares (including 2,250 Class A Shares issued upon conversion of Seller Earnout Shares subject to certain vesting conditions). |
147
| (42) | Consists of 140,388 Class A Shares (including 12,324 Class A Shares issued upon conversion of Seller Earnout Shares subject to certain vesting conditions). |
| (43) | Consists of 12,813,992 Class A Shares (including 1,125,000 Class A Shares issued upon conversion of Seller Earnout Shares subject to certain vesting conditions). |
| (44) | Consists of 256,279 Class A Shares (including 22,500 Class A Shares issued upon conversion of Seller Earnout Shares subject to certain vesting conditions). The Trustee of the Donald and Catherine Marron Charitable Trust is Catherine C. Marron. The address of the Selling Holder is 595 Madison Ave, 24th Floor, New York, NY 10022. |
| (45) | Consists of 1,281,399 Class A Shares (including 112,500 Class A Shares issued upon conversion of Seller Earnout Shares subject to certain vesting conditions). |
| (46) | Consists of 384,419 Class A Shares (including 33,750 Class A Shares issued upon conversion of Seller Earnout Shares subject to certain vesting conditions). |
| (47) | Consists of 128,139 Class A Shares (including 11,250 Class A Shares issued upon conversion of Seller Earnout Shares subject to certain vesting conditions). |
| (48) | Consists of 96,103 Class A Shares (including 8,436 Class A Shares issued upon conversion of Seller Earnout Shares subject to certain vesting conditions). |
| (49) | Consists of 19,220,989 Class A Shares (including 1,687,500 Class A Shares issued upon conversion of Seller Earnout Shares subject to certain vesting conditions). The address of the Selling Holder is c/o Newlight Partners LP, 320 Park Avenue, New York, NY 10022. |
| (50) | Consists of 128,139 Class A Shares (including 11,250 Class A Shares issued upon conversion of Seller Earnout Shares subject to certain vesting conditions). |
| (51) | Consists of 512,559 Class A Shares (including 45,000 Class A Shares issued upon conversion of Seller Earnout Shares subject to certain vesting conditions). |
| (52) | Consists of 3,075,358 Class A Shares (including 270,000 Class A Shares issued upon conversion of Seller Earnout Shares subject to certain vesting conditions). The address of the Selling Holder is 201 Main Street Suite 3200 6102. |
| (53) | Consists of 768,839 Class A Shares (including 67,500 Class A Shares issued upon conversion of Seller Earnout Shares subject to certain vesting conditions). The address of the Selling Holder is 201 Main Street Suite 3200, Fort Worth, TX 76102. |
| (54) | Consists of 1,922,098 Class A Shares (including 168,750 Class A Shares issued upon conversion of Seller Earnout Shares subject to certain vesting conditions). |
| (55) | Consists of 3,203,498 Class A Shares (including 281,250 Class A Shares issued upon conversion of Seller Earnout Shares subject to certain vesting conditions). The address of the Selling Holder is 38955 Hills Tech Drive, Farmington, MI 48331. |
| (56) | Consists of 256,279 Class A Shares (including 22,500 Class A Shares issued upon conversion of Seller Earnout Shares subject to certain vesting conditions). |
| (57) | Consists of 16,017,491 Class A Shares (including 1,406,250 Class A Shares issued upon conversion of Seller Earnout Shares subject to certain vesting conditions). |
| (58) | Consists of 128,139 Class A Shares (including 11,250 Class A Shares issued upon conversion of Seller Earnout Shares subject to certain vesting conditions) held by W2M2H, LLC. Joseph S. Monaco is the manager of W2M2H, LLC. The address of the Selling Holder is 321 South Main Street, Suite 550, Providence, RI 02903. |
| (59) | Consists of 1,281,399 Class A Shares (including 112,500 Class A Shares issued upon conversion of Seller Earnout Shares subject to certain vesting conditions). |
| (60) | Consists of 79,628 Class A Shares issued or issuable upon the exchange of Common Units and the cancellation of an equal number of Class C Shares (including 6,990 Common Units and an equal number of Class C Shares issuable to the Selling Holder upon the conversion of Seller Earnout Units subject to certain vesting conditions). |
| (61) | Consists of 565,762 Class A Shares issued or issuable upon the exchange of Common Units and the cancellation of an equal number of Class C Shares (including 49,670 Common Units and an equal number of Class C Shares issued or issuable to the Selling Holder upon the conversion of Seller Earnout Units subject to certain vesting conditions). |
148
| (62) | Consists of 512,559 Class A Shares issued or issuable upon the exchange of Common Units and the cancellation of an equal number of Class C Shares (including 45,000 Common Units and an equal number of Class C Shares issued or issuable to the Selling Holder upon the conversion of Seller Earnout Units subject to certain vesting conditions). |
| (63) | Consists of 128,139 Class A Shares issued or issuable upon the exchange of Common Units and the cancellation of an equal number of Class C Shares (including 11,250 Common Units and an equal number of Class C Shares issued or issuable to the Selling Holder upon the conversion of Seller Earnout Units subject to certain vesting conditions). |
| (64) | Consists of 1,116,646 Class A Shares issued or issuable upon the exchange of Common Units and the cancellation of an equal number of Class C Shares (including 98,034 Common Units and an equal number of Class C Shares issued or issuable to the Selling Holder upon the conversion of Seller Earnout Units subject to certain vesting conditions). The address of the Selling Holder is 600 University Street, Suite 3247, Seattle, WA 98101. |
| (65) | Consists of 32,034 Class A Shares issued or issuable upon the exchange of Common Units and the cancellation of an equal number of Class C Shares (including 2,812 Common Units and an equal number of Class C Shares issued or issuable to the Selling Holder upon the conversion of Seller Earnout Units subject to certain vesting conditions). |
| (66) | Consists of 695,696 Class A Shares issued or issuable upon the exchange of Common Units and the cancellation of an equal number of Class C Shares (including 61,078 Common Units and an equal number of Class C Shares issued or issuable to the Selling Holder upon the conversion of Seller Earnout Units subject to certain vesting conditions). |
| (67) | Consists of 176,166 Class A Shares issued or issuable upon the exchange of Common Units and the cancellation of an equal number of Class C Shares (including 15,466 Common Units and an equal number of Class C Shares issued or issuable to the Selling Holder upon the conversion of Seller Earnout Units subject to certain vesting conditions). |
| (68) | Consists of 1,281,399 Class A Shares issued or issuable upon the exchange of Common Units and the cancellation of an equal number of Class C Shares (including 112,500 Common Units and an equal number of Class C Shares issued or issuable to the Selling Holder upon the conversion of Seller Earnout Units subject to certain vesting conditions). The address of the Selling Holder is 6810 South Minnesota Avenue Suite 103 Sioux Falls, SD 57108. |
| (69) | Consists of 227,905 Class A Shares issued or issuable upon the exchange of Common Units and the cancellation of an equal number of Class C Shares (including 20,008 Common Units and an equal number of Class C Shares issued or issuable to the Selling Holder upon the conversion of Seller Earnout Units subject to certain vesting conditions). The address of the Selling Holder is c/o East End Advisors LLC, 610 Fifth Avenue 5th Floor, New York, NY 10020. |
| (70) | Consists of 1,018,710 Class A Shares issued or issuable upon the exchange of Common Units and the cancellation of an equal number of Class C Shares (including 89,436 Common Units and an equal number of Class C Shares issued or issuable to the Selling Holder upon the conversion of Seller Earnout Units subject to certain vesting conditions). |
| (71) | Consists of 922,607 Class A Shares issued or issuable upon the exchange of Common Units and the cancellation of an equal number of Class C Shares (including 81,000 Common Units and an equal number of Class C Shares issued or issuable to the Selling Holder upon the conversion of Seller Earnout Units subject to certain vesting conditions). |
| (72) | Consists of 256,279 Class A Shares issued or issuable upon the exchange of Common Units and the cancellation of an equal number of Class C Shares (including 22,500 Common Units and an equal number of Class C Shares issued or issuable to the Selling Holder upon the conversion of Seller Earnout Units subject to certain vesting conditions). |
| (73) | Consists of 384,419 Class A Shares issued or issuable upon the exchange of Common Units and the cancellation of an equal number of Class C Shares (including 33,750 Common Units and an equal number of Class C Shares issued or issuable to the Selling Holder upon the conversion of Seller Earnout Units subject to certain vesting conditions). |
149
| (74) | Consists of 51,255 Class A Shares issued or issuable upon the exchange of Common Units and the cancellation of an equal number of Class C Shares (including 4,500 Common Units and an equal number of Class C Shares issued or issuable to the Selling Holder upon the conversion of Seller Earnout Units subject to certain vesting conditions). |
| (75) | Consists of 2,405,003 Class A Shares issued or issuable upon the exchange of Common Units and the cancellation of an equal number of Class C Shares (including 211,146 Common Units and an equal number of Class C Shares issued or issuable to the Selling Holder upon the conversion of Seller Earnout Units subject to certain vesting conditions). |
| (76) | Consists of 1,848,874 Class A Shares issued or issuable upon the exchange of Common Units and the cancellation of an equal number of Class C Shares (including 162,320 Common Units and an equal number of Class C Shares issued or issuable to the Selling Holder upon the conversion of Seller Earnout Units subject to certain vesting conditions). The address of the Selling Holder is c/o East End Advisors LLC, Attn: David R. Salomon, 610 Fifth Avenue 5th Floor, New York, NY 10020. |
| (77) | Consists of 128,139 Class A Shares issued or issuable upon the exchange of Common Units and the cancellation of an equal number of Class C Shares (including 11,250 Common Units and an equal number of Class C Shares issued or issuable to the Selling Holder upon the conversion of Seller Earnout Units subject to certain vesting conditions). |
| (78) | Consists of 128,139 Class A Shares issued or issuable upon the exchange of Common Units and the cancellation of an equal number of Class C Shares. (including 11,250 Common Units and an equal number of Class C Shares issued or issuable to the Selling Holder upon the conversion of Seller Earnout Units subject to certain vesting conditions). |
| (79) | Consists of 192,208 Class A Shares issued or issuable upon the exchange of Common Units and the cancellation of an equal number of Class C Shares (including 16,874 Common Units and an equal number of Class C Shares issued or issuable to the Selling Holder upon the conversion of Seller Earnout Units subject to certain vesting conditions). The address of the Selling Holder is TAG Associates LLC 810 7th Avenue 7th Floor, New York, NY 10019. |
| (80) | Consists of 704,768 Class A Shares issued or issuable upon the exchange of Common Units and the cancellation of an equal number of Class C Shares (including 61,874 Common Units and an equal number of Class C Shares issued or issuable to the Selling Holder upon the conversion of Seller Earnout Units subject to certain vesting conditions). The address of the Selling Holder is 595 Madison Ave., 24th Floor, New York, NY 10022. |
| (81) | Consists of 256,279 Class A Shares issued or issuable upon the exchange of Common Units and the cancellation of an equal number of Class C Shares (including 22,500 Common Units and an equal number of Class C Shares issued or issuable to the Selling Holder upon the conversion of Seller Earnout Units subject to certain vesting conditions). Merrick R. Kleeman is the Trustee of the Merrick R. Kleeman 2016 Irrevocable Trust. The address of the Selling Holder is 18 Rocky Point Road Rowayton, CT 06853. |
| (82) | Consists of 128,139 Class A Shares issued or issuable upon the exchange of Common Units and the cancellation of an equal number of Class C Shares (including 11,250 Common Units and an equal number of Class C Shares issued or issuable to the Selling Holder upon the conversion of Seller Earnout Units subject to certain vesting conditions). |
| (83) | Consists of 192,208 Class A Shares issued or issuable upon the exchange of Common Units and the cancellation of an equal number of Class C Shares (including 16,874 Common Units and an equal number of Class C Shares issued or issuable to the Selling Holder upon the conversion of Seller Earnout Units subject to certain vesting conditions). |
| (84) | Consists of 384,419 Class A Shares issued or issuable upon the exchange of Common Units and the cancellation of an equal number of Class C Shares (including 33,750 Common Units and an equal number of Class C Shares issued or issuable to the Selling Holder upon the conversion of Seller Earnout Units subject to certain vesting conditions). |
| (85) | Consists of 256,279 Class A Shares issued or issuable upon the exchange of Common Units and the cancellation of an equal number of Class C Shares (including 22,500 Common Units and an equal number of Class C Shares issued or issuable to the Selling Holder upon the conversion of Seller Earnout Units |
150
| subject to certain vesting conditions). The address of the Selling Holder is c/o TAG Associates, LLC, 810 Seventh Avenue 7th Floor, New York, NY 10019. |
| (86) | Consists of 41,721,673 Class A Shares issued or issuable upon the exchange of Common Units and the cancellation of an equal number of Class C Shares (including 3,662,938 Common Units and an equal number of Class C Shares issued or issuable to the Selling Holder upon the conversion of Seller Earnout Units subject to certain vesting conditions). |
| (87) | Consists of 203,740 Class A Shares issued or issuable up upon the exchange of Common Units and the cancellation of an equal number of Class C Shares (including 17,886 Common Units and an equal number of Class C Shares issued or issuable to the Selling Holder upon the conversion of Seller Earnout Units subject to certain vesting conditions). |
| (88) | Consists of 3,587,918 Class A Shares issued or issuable upon the exchange of Common Units and the cancellation of an equal number of Class C Shares (including 315,000 Common Units and an equal number of Class C Shares issued or issuable to the Selling Holder upon the conversion of Seller Earnout Units subject to certain vesting conditions). |
| (89) | Consists of 805,450 Class A Shares issued or issuable upon the exchange of Common Units and the cancellation of an equal number of Class C Shares (including 70,714 Common Units and an equal number of Class C Shares issued or issuable to the Selling Holder upon the conversion of Seller Earnout Units subject to certain vesting conditions). The address of the Selling Holder is c/o East End Advisors LLC 610 Fifth Avenue 5th Floor, Attn: Richard E. Salomon, New York, NY 10020. |
| (90) | Consists of 659,004 Class A Shares issued or issuable upon the exchange of Common Units and the cancellation of an equal number of Class C Shares (including 57,856 Common Units and an equal number of Class C Shares issued or issuable to the Selling Holder upon the conversion of Seller Earnout Units subject to certain vesting conditions). The Trustee of RES Revocable Trust is Richard E. Salomon. The address of the Selling Holder is c/o East End Advisors LLC, 610 Fifth Avenue 5th Floor, Attn: Richard E. Salomon, New York, NY 10020. |
| (91) | Consists of 265,431 Class A Shares issued or issuable upon the exchange of Common Units and the cancellation of an equal number of Class C Shares (including 23,302 Common Units and an equal number of Class C Shares issued or issuable to the Selling Holder upon the conversion of Seller Earnout Units subject to certain vesting conditions). |
| (92) | Consists of 384,419 Class A Shares issued or issuable upon the exchange of Common Units and the cancellation of an equal number of Class C Shares (including 33,750 Common Units and an equal number of Class C Shares issued or issuable to the Selling Holder upon the conversion of Seller Earnout Units subject to certain vesting conditions). |
| (93) | Consists of 203,740 Class A Shares issued or issuable upon the exchange of Common Units and the cancellation of an equal number of Class C Shares (including 17,886 Common Units and an equal number of Class C Shares issued or issuable to the Selling Holder upon the conversion of Seller Earnout Units subject to certain vesting conditions). |
| (94) | Consists of 137,291 Class A Shares issued or issuable upon the exchange of Common Units and the cancellation of an equal number of Class C Shares (including 12,052 Common Units and an equal number of Class C Shares issued or issuable to the Selling Holder upon the conversion of Seller Earnout Units subject to certain vesting conditions). The address of the Selling Holder is c/o East End Advisors LLC, 610 Fifth Avenue 5th Floor, Attn: Richard E. Salomon, New York, NY 10020. |
| (95) | Consists of 4,805,246 Class A Shares issued or issuable upon the exchange of Common Units and the cancellation of an equal number of Class C Shares (including 421,874 Common Units and an equal number of Class C Shares issued or issuable to the Selling Holder upon the conversion of Seller Earnout Units subject to certain vesting conditions). |
| (96) | Consists of 25,000 Class A Shares held directly by Kevin Beebe, a U.S. citizen. The address of the Selling Holder is 40 West 57th Street, 33rd Floor, New York, NY 10019. |
| (97) | Consists of 25,000 Class A Shares held directly by Payne Brown, a U.S. citizen. The address of the Selling Holder is 40 West 57th Street, 33rd Floor, New York, NY 10019. |
| (98) | Consists of 25,000 Class A Shares held directly by Rick Jelinek, a U.S. citizen. The address of the Selling Holder is 40 West 57th Street, 33rd Floor, New York, NY 10019. |
151
| (99) | Consists of 25,000 Class A Shares held directly by Roma Khanna, a U.S. citizen. The address of the Selling Holder is 40 West 57th Street, 33rd Floor, New York, NY 10019. |
| (100) | Consists of 25,000 Class A Shares held directly by John Kim, a U.S. citizen. The address of the Selling Holder is 40 West 57th Street, 33rd Floor, New York, NY 10019. |
| (101) | Consists of 25,000 Class A Shares held directly by Michael Rubenstein, a U.S. citizen. The address of the Selling Holder is 40 West 57th Street, 33rd Floor, New York, NY 10019. |
| (102) | Consists of 25,000 Class A Shares held directly by Vijay Sondhi, a U.S. citizen. The address of the Selling Holder is 40 West 57th Street, 33rd Floor, New York, NY 10019. |
| (103) | Consists of 25,000 Class A Shares held directly by Michael Vorhaus, a U.S. citizen. The address of the Selling Holder is 40 West 57th Street, 33rd Floor, New York, NY 10019. |
| (104) | Consists of 4,385,625 Class A Shares held directly by Altimar Sponsor LLC. These 4,835,625 Class A Shares do not include the 5,000,000 shares that were issued or will be issuable upon exercise of the Private Placement Warrants held by Altimar Sponsor LLC. Altimar Sponsor is controlled by HPS Partners LLC. The address of the Selling Holder is 40 West 57th Street, 33rd Floor, New York, NY 10019. |
| (105) | Consists of (i) 443,286,854 Class A Shares issued or issuable upon the sale of Class C Shares issued or issuable upon the exchange of Common Units and cancellation of an equal number of Class D Shares currently outstanding and (ii) 44,069,244 Class A Shares issued or issuable upon the conversion of Seller Earnout Units subject to certain vesting conditions. The address of the Selling Holder is 1290 Avenue of the Americas, New York, NY 10104. |
| (106) | Consists of (i) 161,847,700 Class A Shares issued or issuable upon the sale of Class B Shares issuable to Owl Rock Feeder on behalf of Owl Rock Capital Partners LP upon the exchange of Common Units and cancellation of an equal number of Class D Shares currently outstanding, (ii) 13,545,000 Class A Shares issued or issuable upon the sale of Class B Shares issuable to Owl Rock Feeder on behalf of Owl Rock Capital Partners LP upon the exchange of Common Units and cancellation of an equal number of Class D Shares issued or issuable in respect of Seller Earnout Units upon the satisfaction of certain vesting conditions, (iii) 107,540,000 Class A Shares issued or issuable to Owl Rock Feeder on behalf of Dyal Fund IV upon the exchange of Common Units and cancellation of an equal number of Class C Shares currently outstanding and (iv) 9,000,000 Class A Shares issued or issuable to Owl Rock Feeder on behalf of Dyal Fund IV upon the exchange of Common Units and cancellation of an equal number of Class C Shares issued or issuable in respect of Seller Earnout Units upon the satisfaction of certain vesting conditions. The address of the Selling Holder is 399 Park Avenue, 38th Floor, New York, NY 10022. |
| (107) | Consists of (i) 132,808,673 Class A Shares issued or issuable upon the sale of Class B Shares issuable to Dyal Capital SLP LP on behalf of the Dyal Principals upon the exchange of Common Units and cancellation of an equal number of Class D Shares currently outstanding and (ii) 10,930,754 Class A Shares issued or issuable upon the sale of Class B Shares issuable to Dyal Capital SLP LP on behalf of the Dyal Principals upon the exchange of Common Units and cancellation of an equal number of Class D Shares issued or issuable in respect of Seller Earnout Units upon the satisfaction of certain vesting conditions. The address of the Selling Holder is 399 Park Avenue, 38th Floor, New York, NY 10022. |
| (108) | Consists of 1,990,744 Class A Shares issued or issuable upon the exchange of Common Units and the cancellation of an equal number of Class C Shares (including 174,776 Common Units and an equal number of Class C Shares issued or issuable to the Selling Holder upon the conversion of Seller Earnout Units subject to certain vesting conditions). |
| (109) | Consists of 3,806,395 Class A Shares issued or issuable upon the exchange of Common Units and the cancellation of an equal number of Class C Shares (including 334,180 Common Units and an equal number of Class C Shares issued or issuable to the Selling Holder upon the conversion of Seller Earnout Units subject to certain vesting conditions). |
152
CERTAIN RELATIONSHIPS AND RELATED PARTY TRANSACTIONS
Blue Owl Related Person Transactions
Investor Rights Agreement
At the Closing of the Business Combination, Blue Owl, Altimar Sponsor, the Altimar Founders, certain of the Owl Rock Equityholders and the Dyal Equityholders and certain other parties thereto entered into the Investor Rights Agreement.
The Investor Rights Agreement provided for an initial nine-person board of directors, consisting of (i) three individuals to be designated by the Owl Rock Principals, which initially include Doug Ostrover, Marc Lipschultz and one other individual to be designated by the Owl Rock Principals, (ii) two individuals designated by the Dyal Principals, which initially include Michael Rees and Sean Ward, (iii) one individual designated by Neuberger and (iv) three independent directors selected by a majority of the Key Individuals. The Oak Street Investor Rights Agreement (discussed below) expanded the board of directors to 10 members upon consummation of the Oak Street Acquisition. Neuberger has certain continued nomination rights for one director while they maintain in excess of certain ownership percentages, as determined in accordance with the Investor Rights Agreement, and the Owl Rock Principals and Dyal Principals have severally agreed on an individual basis with Blue Owl to take actions to approve such nominations. Blue Owl has qualified as, and has elected to be treated as, a controlled company within the meaning of the NYSE rules at the Closing, and has agreed to certain covenants in accordance therewith.
Pursuant to the Investor Rights Agreement, the Board has delegatedmanagement of Blue Owl and its subsidiaries, subject to certain limitations (including as noted below), to an “Executive Committee” consisting initially of the Owl Rock Principals and Dyal Principals. Certain actions of the Executive Committee require the unanimous consent of the Key Individuals.
day-to-day
The Investor Rights Agreement provides that certain material actions of Blue Owl and/or its subsidiaries require approval of its Board, the Executive Committee and/or, until certain ownership thresholds are no longer maintained or (in some cases) an applicable time period has not expired, Neuberger.
The Investor Rights Agreement also provides Neuberger with certain preemptive rights with respect to future equity offerings by Blue Owl, Blue Owl Holdings, Blue Owl Carry and their subsidiaries, subject to certain exceptions, such as for equity issued as part of an underwritten public offering for cash or as acquisition consideration to unrelated third parties. Neuberger also has certain information rights and confidentiality obligations under the Investor Rights Agreement.
The parties to the Investor Rights Agreement have agreed (subject to exceptions for permitted transfers) to the following
Lock-Up
Periods: (i) in the case of Owl Rock Principals and Dyal Principals, 24 months from Closing; (ii) in the case of Altimar Sponsor and the Altimar Founders, 12 months from Closing; and (iii) in the case of all other parties thereto, six months from the Closing. Notwithstanding the foregoing, 40% of the equity issued to Owl Rock Feeder, which is attributable to a person other than the Owl Rock Principals, will be released fromthe lock-up six
months from Closing. The Seller Earnout Shares and the Seller Earnout Units received by the parties thereto are also subjectto lock-up until
the later of the date the holder thereof is otherwise subject toa lock-up with
respect to its other equity securities and the date such shares or units have vested, as described above.Under the terms of the Investor Rights Agreement, Blue Owl, Blue Owl Holdings and Blue Owl Carry grant the Owl Rock Equityholders and the Dyal Equityholders certain customary demand, shelf and piggyback registration rights. Blue Owl also grants the Altimar Founders certain customary shelf and piggyback registration rights.
153
Oak Street Investor Rights Agreement
Effective upon the consummation of the Oak Street Acquisition pursuant to the terms of the Oak Street Acquisition Agreement, Blue Owl, Blue Owl GP, Blue Owl Holdings LP, Blue Owl Carry LP, each of Douglas Ostrover, Marc Lipschultz and Michael Rees (the “Key Individuals”) and Marc Zahr entered into an Investor Rights Agreement (the “Oak Street Investor Rights Agreement”). The Oak Street Investor Rights Agreement provides, among other things, that Blue Owl, each of the Key Individuals and Marc Zahr shall take all Necessary Action (as defined under the Oak Street Investor Rights Agreement) to elect Marc Zahr as a member of the Board and executive committee of Blue Owl, and Mr. Zahr will enter into a contractual
lock-up
with respect to Blue Owl common stock or Common Units held by Mr. Zahr and his affiliated entities.Oak Street Registration Rights Agreement
Upon consummation of the Oak Street Acquisition, pursuant to the Oak Street Acquisition Agreement, Blue Owl, the holders party thereto, including Mr. Zahr and Augustus, entered into a Registration Rights Agreement (the “Oak Street Registration Rights Agreement”), that provides each of the holder parties, including Mr. Zahr and Augustus, with certain registration rights. The Oak Street Registration Rights Agreement will, among other things, require Blue Owl to use its reasonable best efforts to file a resale shelf registration statement in the future registering each Holder’s (as defined under Registration Rights Agreement) resale of the shares of Blue Owl’s common stock and will provide each Holder with certain customary piggyback registration rights with respect to such shares of common stock, subject to the limitations set forth therein.
Exchange Agreement
At the Closing of the Business Combination, Blue Owl GP, Blue Owl Holdings, Blue Owl Carry, Blue Owl and the holders of Common Units entered into the Exchange Agreement. The Exchange Agreement provides that such holders, subject to any applicable transfer restrictions (including restrictions on Seller Earnout Securities and applicable
Lock-Up
Periods), may (subject to the terms of the Exchange Agreement) exchange an equal number of Common Units and cancel an equal number of Class C Shares or Class D Shares, as applicable, for an equal number of Class A Shares or Class B Shares, as applicable, or cash. Under certain circumstances, an exchange committee to be established by Blue Owl GP may elect on behalf of Blue Owl Holdings and Blue Owl Carry to pay holders of Common Units a cash payment in lieu of delivery of Class A Shares or Class B Shares described in the foregoing sentence, with such cash payment equal to thefive-day
volume weighted average price of Class A Shares immediately prior to the applicable exchange date. A holder must exchange at least 10,000 Common Units in each Exchange, unless such holder owns a lesser amount of such units and is exchanging all of the Common Units held by them at such time.The Exchange Agreement contains restrictions on the timing and amount of Exchanges of the Common Units that are intended to prevent either of the Blue Owl Operating Partnerships from being treated as a “publicly traded partnership” for U.S. federal income tax purposes; such restrictions are modeled on certain safe harbors provided for under applicable U.S. federal income tax law. Blue Owl GP may also impose additional restrictions on exchanges that Blue Owl or Blue Owl GP determines to be necessary or advisable so that neither of the Blue Owl Operating Partnerships is treated as a “publicly traded partnership” for U.S. federal income tax purposes.
Tax Receivable Agreement
The Blue Owl Operating Partnerships have made an election under Section 754 of the Code for the taxable year in which the Business Combination occurs, and such election will remain in effect for any future taxable year in which an exchange of Common Units for Class A and Class B Shares (or cash) under the Exchange Agreement occurs. Such elections have resulted in increases to the tax basis of the assets of the Blue Owl Operating Partnerships at the time of the Business Combination transactions and are expected to result in such increases for any future exchange of Common Units for Class A and Class B Shares (or cash) under the
154
Exchange Agreement. Additionally, we have acquired from certain of the Owl Rock Equityholders certain corporations formed to hold interests in Owl Rock and are therefore entitled to utilize certain tax attributes of such corporations and are also entitled to utilize other tax attributes of the Blue Owl Operating Partnerships as a result of the Business Combination. Such increases in the tax basis of the tangible and intangible assets of the Blue Owl Operating Partnerships, as well as these other tax attributes, have reduced the amount of tax that Blue Owl or Blue Owl GP would otherwise be required to pay in the future. Such increases in tax basis and other tax attributes have also decreased gains (or increase losses) on future dispositions of certain capital assets to the extent tax basis is allocated to those capital assets. The IRS may challenge all or part of the tax basis increase, other tax attributes, and associated increased deductions, and a court could sustain such a challenge.
At the Closing of the Business Combination, we entered into the Tax Receivable Agreement with the Owl Rock Equityholders and Dyal Equityholders (the “TRA Recipients”) that provides for the payment by Blue Owl GP to the TRA Recipients of 85% of the amount of cash tax savings, if any, in U.S. federal, state, local and
non-U.S.
income tax that we actually realize (or are deemed to realize in the case of an early termination payment by us or a change in control, as discussed below) as a result of the increases in tax basis, existing tax attributes, and certain other tax benefits related to our entering into the Tax Receivable Agreement, as described above. This payment obligation is the obligation of Blue Owl GP and not the obligation of the Blue Owl Operating Partnerships. We will benefit from the remaining 15% of cash tax savings, if any, that we realize as a result of such tax attributes. For purposes of the Tax Receivable Agreement, the cash tax savings have been computed by comparing our actual income tax liability to the amount of such taxes that we would have been required to pay had there been no increase to the tax basis of our assets as a result of the Business Combination or the exchanges and no other existing tax attributes (as described above) and had we not entered into the Tax Receivable Agreement (calculated by making certain assumptions).The term of the Tax Receivable Agreement will continue until all such tax benefits have been utilized or expired, unless we exercise our right to terminate the Tax Receivable Agreement for an amount based on the present value of the agreed payments remaining to be made under the agreement (as described in more detail below), there is a change of control (as described in more detail below) or we breach any of our material obligations under the Tax Receivable Agreement, in which case all obligations will generally be accelerated and due as if we had exercised our right to terminate the Tax Receivable Agreement. Estimating the amount of payments that may be made under the Tax Receivable Agreement is by its nature imprecise, as the calculation depends on a variety of factors. The actual increase in tax basis of the assets of the Blue Owl Operating Partnerships, as well as the amount and timing of any payments under the Tax Receivable Agreement, will vary depending upon a number of factors, including:
| • | the timing of exchanges of Common Units for our Class A and Class B Shares (or cash) under the Exchange Agreement—for instance, the increase in any tax deductions will vary depending on the fair value, which may fluctuate over time, of the relevant Common Units at the time of each exchange; |
| • | the price of our Class A Shares and Class B Shares at the time of the exchange—the increase in any tax deductions, as well as the tax basis increase in other assets or other tax attributes, is proportional to the price of our Class A Shares and Class B Shares at the time of the exchange; |
| • | the extent to which such exchanges are taxable—if an exchange is not taxable for any reason, an increase in the tax basis of the assets of the Blue Owl Operating Partnerships (and thus increased deductions) may not be available as a result of such exchange; and |
| • | the amount and timing of our income—we will be required to pay 85% of the cash tax savings, if any, as and when realized. |
If we do not have taxable income (determined without regard to the tax basis and other tax attributes that are subject to the Tax Receivable Agreement), we will generally not be required (absent a change of control or other circumstances requiring an early termination payment) to make payments under the Tax Receivable Agreement for that taxable year because no cash tax savings will have been actually realized. However, any cash tax savings
155
that do not result in realized benefits in a given tax year may generate tax attributes that may be utilized to generate benefits in future tax years (with possibly some carry back potential to prior tax years for certain tax purposes). The utilization of such tax attributes will result in payments under the Tax Receivable Agreement.
Future payments under the Tax Receivable Agreement in respect of subsequent exchanges of Common Units for our Class A and Class B Shares (or cash) under the Exchange Agreement are expected to be substantial. It is possible that future transactions or events could increase or decrease the actual cash tax savings realized and the corresponding payments under the Tax Receivable Agreement. There may be a material negative effect on our liquidity if, as a result of timing discrepancies or otherwise, the payments under the Tax Receivable Agreement exceed the actual cash tax savings we realize in respect of the tax attributes subject to the Tax Receivable Agreement and/or distributions to us by the Blue Owl Operating Partnerships are not sufficient to permit the Blue Owl GP to make payments under the Tax Receivable Agreement after it has paid taxes. The payments under the Tax Receivable Agreement are not conditioned upon the TRA Recipients’ continued ownership of us or the Blue Owl Operating Partnerships.
In addition, the Tax Receivable Agreement provides that upon a change of control, our obligations under the Tax Receivable Agreement would be accelerated as if we had exercised our early termination right based on certain assumptions, (as described below) including that we would have sufficient taxable income to fully utilize the deductions arising from the increased tax deductions and tax basis and other benefits related to entering into the Tax Receivable Agreement.
Furthermore, we may elect to terminate the Tax Receivable Agreement early by making an immediate payment equal to the present value of the anticipated future cash tax savings. In determining such anticipated future cash tax savings, the Tax Receivable Agreement includes several assumptions, including (1) that any Common Units that have not been exchanged are deemed exchanged for the market value of our Class A and Class B Shares and the amount of cash that would have been transferred if the exchange had occurred at the time of termination, (2) we will have sufficient taxable income in each future taxable year to fully utilize all relevant tax attributes subject to the Tax Receivable Agreement, (3) the tax rates for future years will be those specified in the law as in effect at the time of termination, and (4) certain
non-amortizable,
non-deductible
assets are deemed disposed of within specified time periods. In addition, the present value of such anticipated future cash tax savings are discounted at a rate equal to the lesser of (i) 6.5% and (ii) LIBOR plus 100 basis points.As a result of the change in control provisions and the early termination right, we could be required to make payments under the Tax Receivable Agreement that are greater than or less than 85% of the actual cash tax savings that we realize in respect of the tax attributes subject to the Tax Receivable Agreement. In these situations, our obligations under the Tax Receivable Agreement could have a substantial negative impact on our liquidity.
Decisions made in the course of running our businesses may influence the timing and amount of payments that are received by the TRA Recipients under the Tax Receivable Agreement. For example, the earlier disposition of assets following an exchange or acquisition transaction will generally accelerate payments under the Tax Receivable Agreement and increase the present value of such payments, and the disposition of assets before an exchange or acquisition transaction will increase the tax liability of an exchanging holder without giving rise to any rights to payments under the Tax Receivable Agreement.
Payments under the Tax Receivable Agreement are based on the tax reporting positions that we will determine. Although we are not aware of any issue that would cause the IRS to challenge an increase in the tax basis of the assets of the Blue Owl Operating Partnerships that would otherwise be subject to the Tax Receivable Agreement, we will not be reimbursed for any payments previously made under the Tax Receivable Agreement with respect to a tax basis increase that is successfully challenged. As a result, in certain circumstances, payments could be made under the Tax Receivable Agreement in excess of our cash tax savings.
156
Blue Owl Limited Partnership Agreements
In connection with the Closing of the Business Combination, Blue Owl Holdings and Blue Owl Carry each entered into their respective Blue Owl Limited Partnership Agreements, which, among other things, permit the issuance and ownership of Blue Owl Holdings Common Units and Blue Owl Carry Common Units as contemplated to be issued and owned upon the consummation of the Business Combination, admit Blue Owl GP as the general partner of Blue Owl Holdings and Blue Owl Carry, and otherwise amend and restate the rights and preferences of the Blue Owl Holdings Common Units and the Blue Owl Carry Common Units set forth therein. A portion of the Common Units consist of Seller Earnout Units, as further described herein.
Subject to certain limitations, Blue Owl GP, as the general partner of each of the Blue Owl Operating Partnerships, will have the sole authority to manage the Blue Owl Operating Partnerships in accordance with the Blue Owl Limited Partnership Agreements and applicable law, provided that (i) such authority is subject to the consent rights of Neuberger described below and (ii) Blue Owl GP is not permitted to override the rights or protections of Blue Owl, its governing bodies and its stockholders pursuant to our certificate of incorporation, the Investor Rights Agreement or any agreement binding on Blue Owl.
Each of the Blue Owl Operating Partnerships has an identical number of Common Units outstanding which are held, in each such entity and in the same proportion, by the same persons. Further, subject to certain exceptions and limitations, the Blue Owl Limited Partnership Agreements permit the applicable Blue Owl Operating Partnership, Blue Owl GP and Blue Owl to undertake all actions necessary to maintain theratios between (i) the number of units in each of the applicable Blue Owl Operating Partnerships held by Blue Owl GP and the number of Class A Shares and Class B Shares issued and outstanding and (ii) the number of Blue Owl Holdings Common Units, the number of Blue Owl Carry Common Units and the number of Class C Shares or Class D Shares, as applicable, held by any person.
one-to-one
Pursuant to the Blue Owl Limited Partnership Agreements, except with respect to “tax distributions” described below, Blue Owl GP has the right to determine when distributions will be made to the partners of the Blue Owl Operating Partnerships (including to Blue Owl GP, with respect to its economic general partner interest in the Blue Owl Operating Partnerships) and the amount of any such distributions, provided that (i) any such distribution is made to all of the partners pro rata in accordance with their respective ownership of Common Units and (ii) any distribution (other than a “tax distribution” described below) otherwise payable with respect to a Seller Earnout Unit for which a Triggering Event has not yet occurred will be held back and reserved by the applicable Blue Owl Operating Partnership.
If a Triggering Event occurs with respect to a Seller Earnout Unit with an amount reserved pursuant to the preceding sentence, such reserved amount will be paid to the holder of such Seller Earnout Unit. If a Triggering Event has not occurred with respect to a Seller Earnout Unit prior to the fifth anniversary of the Closing, then (i) the cumulative amount of distributions reserved for such Seller Earnout Unit (if any) will be released back to the applicable Blue Owl Operating Partnership and (ii) such Seller Earnout Unit will be forfeited and cancelled for no consideration.
The Blue Owl Limited Partnership Agreements provide for mandatory “tax distributions” to the partners of the Blue Owl Operating Partnerships if the taxable income of the relevant Blue Owl Operating Partnership gives rise to taxable income for its partners. Generally, these tax distributions are computed based on an estimate of the net taxable income of the relevant entity multiplied by an assumed tax rate, equal to the highest combined maximum marginal U.S. federal, state and local income tax rate prescribed for an individual or corporate resident in New York, New York.
The Common Units are subject to a post-Closing
Lock-Up
Period during which such units cannot be transferred (including by way of Exchange), other than to certain permitted transferees under certain conditions. TheLock-Up
Period for Common Units held by the Owl Rock Principals and the Dyal Principals ends on the 24157
month anniversary of the Closing (or until a Triggering Event occurs, if later, in the case of Seller Earnout Units). Subject to the aforementioned restrictions during the applicable
Lock-Up
Period, the Common Units may be exchanged by the holder for Class A Shares or Class B Shares, as described under the subsection entitled “Exchange Agreement” above.The Blue Owl Limited Partnership Agreements also provide Neuberger with the same rights it has under the Investor Rights Agreement with respect to Blue Owl and its subsidiaries, including preemptive rights on certain future equity issuances, consent rights on certain material matters and the right to receive information with respect to the Blue Owl Operating Partnerships, as is more fully described under the subsection entitled “” above.
Investor Rights Agreement
On October 22, 2021, we amended the 2021 Omnibus Plan and the Blue Owl Limited Partnership Agreements (as amended, the “Second Amended and Restated Blue Owl Limited Partnership Agreements”) of the Blue Owl Partnerships to increase the share limit under the 2021 Omnibus Plan and to allow for the issuance, from time to time of certain Incentive Units to Blue Owl MV, a vehicle formed for the benefit of certain management employees of Blue Owl, by Blue Owl Carry and Blue Owl Holdings, which Incentive Units issuances would be in addition to the issuance of certain Restricted Stock Units (“RSUs” and, together with the Incentive Units, the “Awards”). The Incentive Units entitle the recipient to receive, through Blue Owl MV, distributions from either Blue Owl Holdings or Blue Owl Carry in accordance with the terms of, and subject to any restrictions contained in, the applicable limited partnership agreement for each of Blue Owl Carry, Blue Owl Holdings and Blue Owl MV, and will be counted against the share limit under the Plan on a 1.25:1.00 basis.
In addition to any awards that it may grant on an ongoing basis, Blue Owl expects to make grants pursuant to the 2021 Omnibus Plan under annual or
year-end
incentive programs, including grants of Incentive Units and / or RSUs pursuant to the 2021 Omnibus Plan to its executive officers on an annual basis on or around December or January of each year, including certain of its NEOs. Any Incentive Units or RSUs granted by Blue Owl under such programs will be subject to time vesting, and if the recipient’s employment or service is terminated by Blue Owl without cause or due to death or disability, the plan administrator has discretion to accelerate and vest any unvested Incentive Units or RSUs, as applicable, upon such termination, and, upon any other termination, any unvested Incentive Units or RSUs, as applicable, will be immediately terminated and forfeited for no consideration. Upon a Change in Control (as defined in the 2021 Omnibus Plan), the vesting of all or a portion of any unvested Incentive Units may be accelerated in the discretion of the plan administrator and the treatment of any unvested RSUs will be determined in accordance with the terms of the 2021 Omnibus Plan. Awards under such programs will vest over three to five years, subject to continued employment by, or service to, Blue Owl on each applicable vesting date. The Incentive Units will be settled by delivery of an equal number of Common Units of the Blue Owl Partnerships and either Class C or Class D Shares of Blue Owl, as applicable, upon the vesting and liquidation of such Incentive Units, and the RSUs will be settled by delivery of an equal number of Class A Shares of Blue Owl. The Incentive Units or RSUs will be subject to other conditions set forth in the award agreement, such as, for the Incentive Units, specified minimum ownership terms and, for both Incentive Units and RSUs, compliance with the recipient’s applicable restrictive covenant obligations.Dyal Fund IV’s Investment in Owl Rock
Prior to the Business Combination, Dyal Fund IV owned a 20% interest in Owl Rock and continues to own Blue Owl interests issued in respect of such interests. One of Blue Owl’s controlled affiliates is the investment adviser to Dyal Fund IV. The management fees payable by Dyal Fund IV to the Blue
Owl-controlled
adviser were established as part of the offering of interests in Dyal Fund IV to its investors, and the calculation of such fees is not being modified because Blue Owl is both an investment of, and the adviser, to Dyal Fund IV.Neuberger Berman, certain employees of Dyal and of Neuberger Berman and certain investors in Blue Owl are entitled to receive distributions of carried interest attributable to Dyal Fund IV. Such carried interest
158
distributions may include profits generated by the performance of Blue Owl. As Blue Owl does not own carried interest in respect of Dyal Fund IV, Blue Owl will not be entitled to receive any distributions of carried interest attributable to Dyal Fund IV.
Investments by Related Parties in our Funds
As of December 31, 2021, our assets under management include approximately $1.9 billion related to executives and other employees and approximately $1.0 billion related to other related parties. A portion of these assets under management relate to accrued carried interests, as well as investments that are not charged fees.
Family Relationships
Dyal has certain employees who are related to our executive officers. In 2020, the founder and head of Dyal had a related party employed by Dyal who earned total compensation above $120,000. The employee’s compensation and benefits are consistent with total compensation and benefits provided to other employees of the same level with similar responsibilities.
Transition Services Agreement between Blue Owl and Neuberger Berman
At the Closing of the Business Combination, Blue Owl entered into a Transition Services Agreement with Neuberger (the “Transition Services Agreement”), pursuant to which Neuberger has agreed to provide certain transition services, including, among other things, the sublease of Dyal office space at 1290 Avenue of the Americas, New York, New York. Blue Owl will reimburse Neuberger for certain third party expenses incurred by Neuberger in connection with providing the transition services.
Use of Private Aircraft
Blue Owl may make use of aircraft owned by its related parties for business purposes in the ordinary course of its operations and in accordance with any applicable travel policy. Blue Owl will reimburse such related parties for this use based on current market rates which will generally be determined based on a comparable quote from a third-party charter company. The reimbursement may be recovered from a Blue Owl fund to the extent such reimbursement is eligible under such fund’s agreements and in accordance with applicable policies and procedures. Blue Owl will not bear any operating, personnel or maintenance costs associated with the aircraft. Personal use of the aircraft will not be charged to Blue Owl. The Company recorded expenses for aircraft reimbursements of $0.6 million for the year ended December 31, 2021.
Related Person Transaction Policy
Blue Owl’s Board adopted a written related person transaction policy that sets forth the following policies and procedures for the review and approval or ratification of related person transactions.
A “Related Person Transaction” is a transaction, arrangement or relationship or any series of similar transactions, arrangements, or relationships, in which Blue Owl or any of its subsidiaries was, is or will be a participant, the amount of which involved exceeds $120,000 in any fiscal year, and in which any related person had, has or will have a direct or indirect material interest. In the future, our executive officers, other employees and directors may make similar investments in our products in the ordinary course.
A “Related Person” means:
| • | any person who is, or was (since the beginning of the last fiscal year for which Blue Owl has filed an Annual Report on Form 10-K and proxy statement, even if such person does not presently serve in that role), one of Blue Owl’s executive officers or a member, or nominee for director, of the Blue Owl Board; |
159
| • | any person who is known by Blue Owl to be the beneficial owner of more than five percent (5%) of our voting stock; |
| • | any immediate family member of any of the foregoing persons, which means any child, stepchild, parent, stepparent, spouse, sibling, mother-in-law, father-in-law, son-in-law, daughter-in-law, brother-in-law sister-in-law |
| • | any entity in which any of the foregoing persons serves as an executive officer or principal or in a similar position, or in the case of a partnership, serves as a general partner or holds any positions other than that of a limited partner; |
| • | any firm, corporation or other entity in which any of the foregoing persons is a partner or principal or in a similar position or in which such person or together with any of the foregoing persons, has a 10 percent (10%) or greater beneficial ownership interest; or |
| • | an entity at which any of the foregoing persons above is employed if (a) the person is directly involved in the negotiation of the Related Party Transaction or will have or share primary responsibility at such entity for the performance of the Related Party Transaction or (b) the person’s compensation from the entity is directly tied to the Related Party Transaction. |
Blue Owl has policies and procedures designed to minimize potential conflicts of interest arising from any dealings it may have with its affiliates and to provide appropriate procedures for the disclosure of any real or potential conflicts of interest that may exist from time to time. For example, Blue Owl has a Code of Business Conduct and Ethics that generally prohibits officers or directors of Blue Owl from engaging in any transaction where there is a conflict between such individual’s personal interest and the interests of Blue Owl. Waivers to the Code of Business Conduct and Ethics will generally only be obtained from the audit committee, or if for an executive officer, by the Board, and are publicly disclosed as required by applicable law and regulations. In addition, the audit committee will be required to review and approve all related-party transactions (as defined in Item 404 of
Regulation S-K).
Indemnification
Upon the consummation of the Business Combination, we entered into indemnification agreements with each of the newly elected directors and newly appointed executive officers which provide that we will indemnify such directors and executive officers under the circumstances and to the extent provided for therein, from and against all losses, claims, damages, liabilities, joint or several, expenses (including legal fees and expenses), judgments, fines, penalties, interest, settlements or other amounts arising from any and all threatened, pending or completed claim, demand, action, suit or proceeding, whether civil, criminal, administrative or investigative, and whether formal or informal, and including appeals, in which he or she may be involved, or is threatened to be involved, as a party or otherwise, to the fullest extent permitted under Delaware law and our bylaws.
160
UNITED STATES FEDERAL INCOME TAX CONSIDERATIONS
The following is a discussion of certain material U.S. federal income tax consequences of the acquisition, ownership and disposition of our common stock issued pursuant to this offering by
non-U.S.
holders (as defined below). This discussion is limited to certain U.S. federal income tax considerations to beneficial owners of our common stock that will hold our common stock as capital assets within the meaning of Section 1221 of the U.S. Internal Revenue Code of 1986, as amended (the “Code”). This discussion assumes that any distributions made by us on our common stock and any consideration received by a holder in consideration for the sale or other disposition of our common stock will be in U.S. dollars.This summary is based upon U.S. federal income tax laws as of the date of this registration statement, which is subject to change or differing interpretation, possibly with retroactive effect. This discussion is a summary only and does not describe all of the tax consequences that may be relevant to you in light of your particular circumstances. In particular, this discussion does not address the effects of the alternative minimum tax, the Medicare tax on certain net investment income, the effects of Section 451 of the Code, or the different consequences that may apply if you are subject to special rules that apply to certain types of investors, including but not limited to:
| • | financial institutions or financial services entities; |
| • | broker-dealers; |
| • | governments or agencies or instrumentalities thereof; |
| • | regulated investment companies; |
| • | real estate investment trusts; |
| • | expatriates or former long-term residents of the United States; |
| • | persons that actually or constructively own five percent or more (by vote or value) of our shares; |
| • | persons that acquired our common stock pursuant to an exercise of employee share options, in connection with employee share incentive plans or otherwise as compensation; |
| • | insurance companies; |
| • | dealers or traders subject to a mark-to-market |
| • | persons holding our common stock as part of a “straddle,” constructive sale, hedge, conversion or other integrated or similar transaction; |
| • | U.S. holders (as defined below) whose functional currency is not the U.S. dollar; |
| • | partnerships (or entities or arrangements classified as partnerships or other pass-through entities for U.S. federal income tax purposes) and any beneficial owners of such entities or arrangements; |
| • | tax-exempt entities; |
| • | controlled foreign corporations; and |
| • | passive foreign investment companies. |
If a partnership (including an entity or arrangement treated as a partnership or other pass-through entity for U.S. federal income tax purposes) holds our common stock, the tax treatment of a partner, member or other beneficial owner in such entity will generally depend upon the status of the partner, member or other beneficial owner, the activities of the entity, and certain determinations made at the partner, member or other beneficial owner level. If you are a partner, member or other beneficial owner of a partnership (or other pass-through entity) that holds our common stock, you are urged to consult your own tax advisor regarding the tax consequences of the acquisition, ownership and disposition of our common stock.
161
This discussion is based on the Code, and administrative pronouncements, judicial decisions and final, temporary and proposed Treasury regulations as of the date hereof, which are subject to change, possibly on a retroactive basis, and changes to any of which subsequent to the date of this registration statement may affect the tax consequences described herein. This discussion does not address any aspect of state, local or
non-U.S.
taxation, or any U.S. federal taxes other than income taxes (such as gift and estate taxes).We have not sought, and do not expect to seek, a ruling from the U.S. Internal Revenue Service (the “IRS”) as to any U.S. federal income tax consequence described herein. The IRS may disagree with the discussion herein, and its determination may be upheld by a court. Moreover, there can be no assurance that future legislation, regulations, administrative rulings or court decisions will not adversely affect the accuracy of the statements in this discussion. You are urged to consult your own tax advisor with respect to the application of U.S. federal tax laws to your particular situation, as well as any tax consequences arising under the laws of any state, local or
non-U.S.
jurisdiction.THIS DISCUSSION IS ONLY A SUMMARY OF CERTAIN U.S. FEDERAL INCOME TAX CONSIDERATIONS ASSOCIATED WITH THE ACQUISITION, OWNERSHIP AND DISPOSITION OF OUR COMMON STOCK. EACH PROSPECTIVE INVESTOR IN OUR COMMON STOCK IS URGED TO CONSULT ITS OWN TAX ADVISOR WITH RESPECT TO THE PARTICULAR TAX CONSEQUENCES TO SUCH INVESTOR OF THE ACQUISITION, OWNERSHIP AND DISPOSITION OF OUR COMMON STOCK, INCLUDING THE APPLICABILITY AND EFFECT OF ANY U.S. FEDERAL
NON-INCOME,
STATE, LOCAL, ANDNON-U.S.
TAX LAWS.Non-U.S.
Holder DefinedAs used herein, the term
“non-U.S.
holder” means a beneficial owner of our common stock who or that is for U.S. federal income tax purposes:| • | a non-resident alien individual (other than certain former citizens and residents of the United States subject to U.S. tax as expatriates); |
| • | a foreign corporation; or |
| • | an estate or trust that is not a U.S. holder; |
but generally does not include an individual who is present in the United States for 183 days or more in the taxable year of the disposition of our common stock. If you are such an individual, you should consult your own tax advisor regarding the U.S. federal income tax consequences of the acquisition, ownership or sale or other disposition of our common stock.
Taxation of Distributions
non-U.S.
holder of shares of our common stock, to the extent paid out of our current or accumulated earnings and profits (as determined under U.S. federal income tax principles), will constitute dividends for U.S. federal income tax purposes. If such dividends are not effectively connected with thenon-U.S.
holder’s conduct of a trade or business within the United States, we will be required to withhold tax from the gross amount of the dividend at a rate of 30% unless suchnon-U.S.
holder is eligible for a reduced rate of withholding tax under an applicable income tax treaty and provides proper certification of its eligibility for such reduced rate (usually on an IRS FormW-8BEN
orW-8BEN-E).
non-U.S.
holder’s adjusted tax basis in its shares of our common stock and, to the extent such distribution exceeds thenon-U.S.
holder’s adjusted tax basis, as gain realized from the sale or other disposition of the common stock, which will be treated as described under “Gain on Sale, Taxable Exchange or Other Taxable Disposition of Common Stock
The 30% withholding tax described above generally does not apply to dividends paid to a
non-U.S.
holder who provides an IRS FormW-8ECI
certifying that the dividends are effectively connected with thenon-U.S.
holder’s162
conduct of a trade or business within the United States. Instead, the effectively connected dividends will be subject to regular U.S. federal income tax as if the
non-U.S.
holder were a U.S. resident, subject to an applicable income tax treaty providing otherwise. A corporatenon-U.S.
holder receiving dividends that are effectively connected with such holder’s conduct of a U.S. trade or business may also be subject to an additional “branch profits tax” imposed at a rate of 30% (or such lower rate as may apply under an applicable income tax treaty).Gain on Sale, Taxable Exchange or Other Taxable Disposition of Common Stock
non-U.S.
holder generally will not be subject to U.S. federal income or withholding tax in respect of gain recognized on a sale, taxable exchange or other taxable disposition of our common stock, unless:| • | the gain is effectively connected with the conduct by the non-U.S. holder of a trade or business within the United States (and, under certain income tax treaties, is attributable to a United States permanent establishment or fixed base maintained by thenon-U.S. holder); or |
| • | we are or have been a “United States real property holding corporation” for U.S. federal income tax purposes at any time during the shorter of the five-year period ending on the date of disposition or the period that the non-U.S. holder held our common stock, and, in the case where shares of our common stock are regularly traded on an established securities market, thenon-U.S. holder has owned, directly or constructively, more than 5% of our common stock at any time within the shorter of the five-year period preceding the disposition or suchnon-U.S. holder’s holding period for the shares of our common stock. |
Unless an applicable treaty provides otherwise, gain described in the first bullet point above will be subject to tax at generally applicable U.S. federal income tax rates as if the
non-U.S.
holder were a U.S. resident. Any gains described in the first bullet point above of anon-U.S.
holder that is treated as anon-U.S.
corporation for U.S. federal income tax purposes may also be subject to an additional “branch profits tax” imposed at a 30% rate (or such lower rate as may apply under an applicable income tax treaty).If the second bullet point above applies to a
non-U.S.
holder, gain recognized by such holder on the sale, exchange or other disposition of our common stock will be subject to tax at generally applicable U.S. federal income tax rates. In addition, a buyer of our common stock from such holder may be required to withhold U.S. federal income tax at a rate of 15% of the amount realized upon such disposition. We believe that we are not and have not been at any time since our formation a United States real property holding corporation and, while no assurances can be given in this regard, we do not expect to be treated as United States real property holding corporation in the future.Information Reporting and Backup Withholding.
Information returns will be filed with the IRS in connection with payments of dividends and the proceeds from a sale or other disposition of our shares of common stock. A
non-U.S.
holder may have to comply with certification procedures to establish that it is not a United States person in order to avoid information reporting and backup withholding requirements. The certification procedures required to claim a reduced rate of withholding under a treaty generally will satisfy the certification requirements necessary to avoid the backup withholding as well. Backup withholding is not an additional tax. The amount of any backup withholding from a payment to anon-U.S.
holder will be allowed as a credit against such holder’s U.S. federal income tax liability and may entitle such holder to a refund, provided that the required information is timely furnished to the IRS.FATCA.
Provisions commonly referred to as “FATCA” impose withholding of 30% on payments of dividends (including constructive dividends) on our common stock to “foreign financial institutions” (which is broadly defined for this purpose and in general includes investment vehicles) and certain other
non-U.S.
entities unless various U.S. information reporting and due diligence requirements (generally relating to ownership by United States persons163
of interests in or accounts with those entities) have been satisfied by, or an exemption applies to, the payee (typically certified as to by the delivery of a properly completed IRS FormForeign financial institutions located in jurisdictions that have an intergovernmental agreement with the United States governing FATCA may be subject to different rules. Under certain circumstances, a
W-8BEN-E).
non-U.S.
holder might be eligible for refunds or credits of such withholding taxes, and anon-U.S.
holder might be required to file a U.S. federal income tax return to claim such refunds or credits. The above withholding tax under FATCA was scheduled to apply to payments of gross proceeds from the sale or other disposition of property that would produce U.S.-source interest or dividends beginning on January 1, 2019; however, the IRS has released proposed regulations upon which taxpayers may rely that eliminate the obligation to withhold on gross proceeds. Such proposed regulations also delayed withholding on certain other payments received from other foreign financial institutions that are allocable, as provided for under final Treasury Regulations, to payments of U.S.-source dividends, and other fixed or determinable annual or periodic income. Although these proposed Treasury Regulations are not final, taxpayers generally may rely on them until final Treasury Regulations are issued. Prospective investors should consult their own tax advisors regarding the effects of FATCA on their investment in our common stock.164
PLAN OF DISTRIBUTION
We are registering the possible resale by the Selling Holders of up to 1,320,591,340 Class A Shares.
We will not receive any of the proceeds from the sale of the securities by the Selling Holders. The aggregate proceeds to the Selling Holders will be the purchase price of the securities less any discounts and commissions borne by the Selling Holders.
The Selling Holders will pay any underwriting discounts and commissions and expenses incurred by the Selling Holders for brokerage, accounting, tax or legal services or any other expenses incurred by the Selling Holders in disposing of the securities. We will bear all other costs, fees and expenses incurred in effecting the registration of the securities covered by this prospectus, including, without limitation, all registration and filing fees, Nasdaq listing fees and fees and expenses of our counsel and our independent registered public accountants.
The securities beneficially owned by the Selling Holders covered by this prospectus may be offered and sold from time to time by the Selling Holders. The term “Selling Holders” includes donees, pledgees, transferees or other successors in interest selling securities received after the date of this prospectus from a Selling Holders as a gift, pledge, partnership distribution or other transfer. The Selling Holders will act independently of us in making decisions with respect to the timing, manner and size of each sale. Such sales may be made on one or more exchanges or in themarket or otherwise, at prices and under terms then prevailing or at prices related to the then current market price or in negotiated transactions. Each Selling Holders reserves the right to accept and, together with its respective agents, to reject, any proposed purchase of securities to be made directly or through agents. The Selling Holders and any of their permitted transferees may sell their securities offered by this prospectus on any stock exchange, market or trading facility on which the securities are traded or in private transactions. If underwriters are used in the sale, such underwriters will acquire the shares for their own account. These sales may be at a fixed price or varying prices, which may be changed, or at market prices prevailing at the time of sale, at prices relating to prevailing market prices or at negotiated prices. The securities may be offered to the public through underwriting syndicates represented by managing underwriters or by underwriters without a syndicate. The obligations of the underwriters to purchase the securities will be subject to certain conditions. The underwriters will be obligated to purchase all the securities offered if any of the securities are purchased.
over-the-counter
Subject to the limitations set forth in any applicable registration rights agreement, the Selling Holders may use any one or more of the following methods when selling the securities offered by this prospectus:
| • | purchases by a broker-dealer as principal and resale by such broker-dealer for its own account pursuant to this prospectus; |
| • | ordinary brokerage transactions and transactions in which the broker solicits purchasers; |
| • | block trades in which the broker-dealer so engaged will attempt to sell the securities as agent but may position and resell a portion of the block as principal to facilitate the transaction; |
| • | an over-the-counter |
| • | through trading plans entered into by a Selling Holder pursuant to Rule 10b5-1 under the Exchange Act that are in place at the time of an offering pursuant to this prospectus and any applicable prospectus supplement hereto that provide for periodic sales of their securities on the basis of parameters described in such trading plans; |
| • | through one or more underwritten offerings on a firm commitment or best efforts basis; |
| • | settlement of short sales entered into after the date of this prospectus; |
| • | agreements with broker-dealers to sell a specified number of the securities at a stipulated price per share or warrant; |
165
| • | in “at the market” offerings, as defined in Rule 415 under the Securities Act, at negotiated prices, at prices prevailing at the time of sale or at prices related to such prevailing market prices, including sales made directly on a national securities exchange or sales made through a market maker other than on an exchange or other similar offerings through sales agents; |
| • | directly to purchasers, including through a specific bidding, auction or other process or in privately negotiated transactions; |
| • | through the writing or settlement of options or other hedging transactions, whether through an options exchange or otherwise; |
| • | through the distributions by any Selling Holder or its affiliates to its partners, members or stockholders |
| • | through a combination of any of the above methods of sale; or |
| • | any other method permitted pursuant to applicable law. |
In addition, a Selling Holder that is an entity may elect to make a pro rata
in-kind
distribution of securities to its members, partners or stockholders pursuant to the registration statement of which this prospectus is a part by delivering a prospectus with a plan of distribution. Such members, partners or stockholders would thereby receive freely tradeable securities pursuant to the distribution through a registration statement. To the extent a distributee is an affiliate of ours (or to the extent otherwise required by law), we may file a prospectus supplement in order to permit the distributees to use the prospectus to resell the securities acquired in the distribution.There can be no assurance that the Selling Holders will sell all or any of the securities offered by this prospectus. In addition, the Selling Holders may also sell securities under Rule 144 under the Securities Act, if available, or in other transactions exempt from registration, rather than under this prospectus. The Selling Holders have the sole and absolute discretion not to accept any purchase offer or make any sale of securities if they deem the purchase price to be unsatisfactory at any particular time.
The Selling Holders also may transfer the securities in other circumstances, in which case the transferees, pledgees or otherwill be the selling beneficial owners for purposes of this prospectus. Upon being notified by a Selling Holder that a donee, pledgee, transferee, otherintends to sell our securities, we will, to the extent required, promptly file a supplement to this prospectus to name specifically such person as a Selling Holder.
successors-in-interest
successor-in-interest
With respect to a particular offering of the securities held by the Selling Holders, to the extent required, an accompanying prospectus supplement or, if appropriate, a post-effective amendment to the registration statement of which this prospectus is part, will be prepared and will set forth the following information:
| • | the specific securities to be offered and sold; |
| • | the names of the Selling Holders; |
| • | the respective purchase prices and public offering prices, the proceeds to be received from the sale, if any, and other material terms of the offering; |
| • | settlement of short sales entered into after the date of this prospectus; |
| • | the names of any participating agents, broker-dealers or underwriters; and |
| • | any applicable commissions, discounts, concessions and other items constituting compensation from the Selling Holders. |
In connection with distributions of the securities or otherwise, the Selling Holders may enter into hedging transactions with broker-dealers or other financial institutions. In connection with such transactions, broker-
166
dealers or other financial institutions may engage in short sales of the securities in the course of hedging the positions they assume with Selling Holders. The Selling Holders may also sell the securities short and redeliver the securities to close out such short positions. The Selling Holders may also enter into option or other transactions with broker-dealers or other financial institutions which require the delivery to such broker-dealer or other financial institution of securities offered by this prospectus, which securities such broker-dealer or other financial institution may resell pursuant to this prospectus (as supplemented or amended to reflect such transaction). The Selling Holders may also pledge securities to a broker-dealer or other financial institution, and, upon a default, such broker-dealer or other financial institution, may effect sales of the pledged securities pursuant to this prospectus (as supplemented or amended to reflect such transaction).
In order to facilitate the offering of the securities, any underwriters or agents, as the case may be, involved in the offering of such securities may engage in transactions that stabilize, maintain or otherwise affect the price of our securities. Specifically, the underwriters or agents, as the case may be, may overallot in connection with the offering, creating a short position in our securities for their own account. In addition, to cover overallotments or to stabilize the price of our securities, the underwriters or agents, as the case may be, may bid for, and purchase, such securities in the open market. Finally, in any offering of securities through a syndicate of underwriters, the underwriting syndicate may reclaim selling concessions allotted to an underwriter or a broker-dealer for distributing such securities in the offering if the syndicate repurchases previously distributed securities in transactions to cover syndicate short positions, in stabilization transactions or otherwise. Any of these activities may stabilize or maintain the market price of the securities above independent market levels. The underwriters or agents, as the case may be, are not required to engage in these activities, and may end any of these activities at any time.
The Selling Holders may solicit offers to purchase the securities directly from, and it may sell such securities directly to, institutional investors or others. In this case, no underwriters or agents would be involved. The terms of any of those sales, including the terms of any bidding or auction process, if utilized, will be described in the applicable prospectus supplement.
It is possible that one or more underwriters may make a market in our securities, but such underwriters will not be obligated to do so and may discontinue any market making at any time without notice. We cannot give any assurance as to the liquidity of the trading market for our securities. Blue Owl’s Class A Shares are currently listed on the NYSE under the symbol “OWL” and Blue Owl’s warrants are currently listed on the NYSE under the symbol “OWL.WS”.
The Selling Holders may authorize underwriters, broker-dealers or agents to solicit offers by certain purchasers to purchase the securities at the public offering price set forth in the prospectus supplement pursuant to delayed delivery contracts providing for payment and delivery on a specified date in the future. The contracts will be subject only to those conditions set forth in the prospectus supplement, and the prospectus supplement will set forth any commissions we or the Selling Holders pay for solicitation of these contracts.
A Selling Holder may enter into derivative transactions with third parties, or sell securities not covered by this prospectus to third parties in privately negotiated transactions. If the applicable prospectus supplement indicates, in connection with those derivatives, the third parties may sell securities covered by this prospectus and the applicable prospectus supplement, including in short sale transactions. If so, the third party may use securities pledged by any Selling Holders or borrowed from any Selling Holders or others to settle those sales or to close out any related open borrowings of stock, and may use securities received from any Selling Holder in settlement of those derivatives to close out any related open borrowings of stock. The third party in such sale transactions will be an underwriter and will be identified in the applicable prospectus supplement (or a post-effective amendment). In addition, any Selling Holder may otherwise loan or pledge securities to a financial institution or other third party that in turn may sell the securities short using this prospectus. Such financial institution or other third party may transfer its economic short position to investors in our securities or in connection with a concurrent offering of other securities.
167
In effecting sales, broker-dealers or agents engaged by the Selling Holders may arrange for other broker-dealers to participate. Broker-dealers or agents may receive commissions, discounts or concessions from the Selling Holders in amounts to be negotiated immediately prior to the sale.
In compliance with the guidelines of the Financial Industry Regulatory Authority (“FINRA”), the aggregate maximum discount, commission, fees or other items constituting underwriting compensation to be received by any FINRA member or independent broker-dealer will not exceed 8% of the gross proceeds of any offering pursuant to this prospectus and any applicable prospectus supplement.
If at the time of any offering made under this prospectus a member of FINRA participating in the offering has a “conflict of interest” as defined in FINRA Rule 5121 (“Rule 5121”), that offering will be conducted in accordance with the relevant provisions of Rule 5121.
To our knowledge, there are currently no plans, arrangements or understandings between the Selling Holders and any broker-dealer or agent regarding the sale of the securities by the Selling Holders. Upon our notification by a Selling Holder that any material arrangement has been entered into with an underwriter or broker-dealer for the sale of securities through a block trade, special offering, exchange distribution, secondary distribution or a purchase by an underwriter or broker-dealer, we will file, if required by applicable law or regulation, a supplement to this prospectus pursuant to Rule 424(b) under the Securities Act disclosing certain material information relating to such underwriter or broker-dealer and such offering.
Underwriters, broker-dealers or agents may facilitate the marketing of an offering online directly or through one of their affiliates. In those cases, prospective investors may view offering terms and a prospectus online and, depending upon the particular underwriter, broker-dealer or agent, place orders online or through their financial advisors.
In offering the securities covered by this prospectus, the Selling Holders and any underwriters, broker-dealers or agents who execute sales for the Selling Holders may be deemed to be “underwriters” within the meaning of the Securities Act in connection with such sales. Any discounts, commissions, concessions or profit they earn on any resale of those securities may be underwriting discounts and commissions under the Securities Act.
The underwriters, broker-dealers and agents may engage in transactions with us or the Selling Holders, or perform services for us or the Selling Holders, in the ordinary course of business.
In order to comply with the securities laws of certain states, if applicable, the securities must be sold in such jurisdictions only through registered or licensed brokers or dealers. In addition, in certain states the securities may not be sold unless they have been registered or qualified for sale in the applicable state or an exemption from the registration or qualification requirement is available and is complied with.
The Selling Holders and any other persons participating in the sale or distribution of the securities will be subject to applicable provisions of the Securities Act and the Exchange Act, and the rules and regulations thereunder, including, without limitation, Regulation M. These provisions may restrict certain activities of, and limit the timing of purchases and sales of any of the securities by, the Selling Holders or any other person, which limitations may affect the marketability of the shares of the securities.
We will make copies of this prospectus available to the Selling Holders for the purpose of satisfying the prospectus delivery requirements of the Securities Act. The Selling Holders may indemnify any agent, broker-dealer or underwriter that participates in transactions involving the sale of the securities against certain liabilities, including liabilities arising under the Securities Act.
We have agreed to indemnify the Selling Holders against certain liabilities, including certain liabilities under the Securities Act, the Exchange Act or other federal or state law. Agents, broker-dealers and underwriters
168
may be entitled to indemnification by us and the Selling Holders against certain civil liabilities, including liabilities under the Securities Act, or to contribution with respect to payments which the agents, broker-dealers or underwriters may be required to make in respect thereof.
169
LEGAL MATTERS
Kirkland & Ellis LLP has passed upon the validity of the common stock of Blue Owl offered by this prospectus and certain other legal matters related to this prospectus.
170
EXPERTS
The consolidated and combined financial statements of Blue Owl Capital Inc. as of December 31, 2021 and 2020, and for the years ended December 31, 2021, 2020 and 2019, have been included herein in reliance upon the report of KPMG LLP (“KPMG”), independent registered public accounting firm, appearing elsewhere herein, and upon the authority of said firm as experts in accounting and auditing.
171
WHERE YOU CAN FIND MORE INFORMATION
We have filed with the SEC a registration statement on Form
S-1
under the Securities Act with respect to the securities offered by this prospectus. This prospectus, which forms a part of such registration statement, does not contain all of the information included in the registration statement. For further information pertaining to us and our securities, you should refer to the registration statement and to its exhibits. The registration statement has been filed electronically and may be obtained in any manner listed below. Whenever we make reference in this prospectus to any of our contracts, agreements or other documents, the references are not necessarily complete. If a contract or document has been filed as an exhibit to the registration statement or a report we file under the Exchange Act, you should refer to the copy of the contract or document that has been filed. Each statement in this prospectus relating to a contract or document filed as an exhibit to a registration statement or report is qualified in all respects by the filed exhibit.We also file annual, quarterly and current reports, proxy statements and other information with the SEC. Our SEC filings are available to the public over the Internet at the SEC’s website at www.sec.gov and on our website at www.blueowl.com. The information contained on, or that may be accessed through, our website is not part of, and is not incorporated into, this prospectus. You may inspect a copy of the registration statement through the SEC’s website, as provided herein.
172
INDEX TO CONSOLIDATED AND COMBINED FINANCIAL STATEMENTS
BLUE OWL CAPITAL INC.
Page (s) | ||||
| F-2 | ||||
| F-5 | ||||
| F-6 | ||||
| F-7 | ||||
| F-10 | ||||
| F-11 | ||||
F-1
Report of Independent Registered Public Accounting Firm
To the Shareholders and Board of Directors
Blue Owl Capital Inc.:
Opinion on the Consolidated and Combined Financial Statements
We have audited the accompanying consolidated and combined statements of financial condition of Blue Owl Capital Inc. and subsidiaries (the Company) as of December 31, 2021 and 2020, the related consolidated and combined statements of operations, changes in shareholders’ equity (deficit), and cash flows for each of the years in the three-year period ended December 31, 2021, and the related notes (collectively, the consolidated and combined financial statements). In our opinion, the consolidated and combined financial statements present fairly, in all material respects, the financial position of the Company as of December 31, 2021 and 2020, and the results of its operations and its cash flows for each of the years in the three-year period ended December 31, 2021, in conformity with U.S. generally accepted accounting principles.
Basis for Opinion
These consolidated and combined financial statements are the responsibility of the Company’s management. Our responsibility is to express an opinion on these consolidated and combined financial statements based on our audits. We are a public accounting firm registered with the Public Company Accounting Oversight Board (United States) (PCAOB) and are required to be independent with respect to the Company in accordance with the U.S. federal securities laws and the applicable rules and regulations of the Securities and Exchange Commission and the PCAOB.
We conducted our audits in accordance with the standards of the PCAOB. Those standards require that we plan and perform the audit to obtain reasonable assurance about whether the consolidated and combined financial statements are free of material misstatement, whether due to error or fraud. Our audits included performing procedures to assess the risks of material misstatement of the consolidated and combined financial statements, whether due to error or fraud, and performing procedures that respond to those risks. Such procedures included examining, on a test basis, evidence regarding the amounts and disclosures in the consolidated and combined financial statements. Our audits also included evaluating the accounting principles used and significant estimates made by management, as well as evaluating the overall presentation of the consolidated and combined financial statements. We believe that our audits provide a reasonable basis for our opinion.
Critical Audit Matters
The critical audit matters communicated below are matters arising from the current period audit of the consolidated and combined financial statements that were communicated or required to be communicated to the audit committee and that: (1) relate to accounts or disclosures that are material to the consolidated and combined financial statements and (2) involved our especially challenging, subjective, or complex judgments. The communication of critical audit matters does not alter in any way our opinion on the consolidated and combined financial statements, taken as a whole, and we are not, by communicating the critical audit matters below, providing separate opinions on the critical audit matters or on the accounts or disclosures to which they relate.
Evaluation of the fair value of certain acquired intangible assets
As discussed in Note 1 to the consolidated and combined financial statements, the Company acquired Dyal Capital Partners (Dyal) and Oak Street Real Estate Capital LLC (Oak Street) on May 19, 2021 and December 29, 2021, respectively. The acquisitions were accounted for as business combinations using the acquisition method of accounting as discussed in Note 2. As discussed in Note 3, the Company acquired Dyal and Oak Street for total purchase consideration of $5,607.2 million and $1,083.4 million, respectively.
F-2
In connection with the acquisitions, the Company recognized intangible assets acquired at their acquisition-date fair value. The intangible assets acquired included investment management agreements related to the Dyal and Oak Street acquisitions of $1,859.9 million and $323.3 million, respectively. The intangible assets acquired also included investor relationships related to the Dyal and Oak Street acquisitions of $291.4 million and $157.4 million, respectively.
We identified the evaluation of the fair value of the investment management agreements and investor relationships acquired in the Dyal and Oak Street business combinations as a critical audit matter. Subjective and complex auditor judgment was required to evaluate the following assumptions:
— projected revenue on assets under management used to value the investment management agreements
— investor retention rates used to value the investor relationships
— discount rates used to value the investment management agreements and investor relationships.
The acquisition-date fair value of investment management agreements and investor relationships were sensitive to changes in the above assumptions. In addition, the projected revenue on assets under management was based on expectations of future market and economic conditions that are uncertain.
The following are the primary procedures we performed to address this critical audit matter. We evaluated the design of certain internal controls related to the valuation process for the investment management agreements and investor relationships. This included controls related to the development of the above assumptions. We evaluated the reasonableness of the projected revenue on assets under management by comparing it to historical revenue on assets under management. We involved valuation professionals with specialized skills and knowledge, who assisted in:
— evaluating the discount rates used to determine the fair value of the investment management agreements and the investor relationships by (1) comparing their inputs to publicly available market data for comparable entities, (2) recalculating the Company’s determination of its weighted average cost of capital (WACC) used to determine its discount rates, and (3) reconciling the Company’s determination of its WACC to the Company’s weighted average return on assets and internal rate of return
— evaluating the discount rates used to determine the fair value of the investment management agreements and the fair value of the investor relationships acquired in the Oak Street business combination by comparing the Company’s determination of the WACC to market information such as venture capital rates of return used to value companies in various stages of development
— evaluating the investor retention rates used to determine the fair value of the investor relationships by comparing them to historical retention rates of investors participating in new funds and investment strategies.
Fair value of earnout securities on date of Business Combination
As discussed in Note 1 to the consolidated and combined financial statements, in connection with the Business Combination on May 19, 2021, the Company issued two series of Class E Shares and the Blue Owl Operating Partnerships issued Seller Earnout Units (collectively, the Earnout Securities). As discussed in Note 9, the Company recorded an earnout liability of $635.1 million, of which $491.3 million related to the Earnout Securities. As discussed in Note 2, the liability for Earnout Securities is carried at fair value with changes in fair value included within change in earnout liability in the Company’s consolidated and combined financial statements. In addition, as discussed in Note 2, Earnout Securities issued to certain employees in connection with the Business Combination were accounted for as equity-based compensation. As discussed in Note 8, the Company recorded total equity-based compensation expense for Earnout Securities of $63 million. As discussed in Notes 1 and 8, the Earnout Securities had Triggering Events on July 21, 2021 and November 3, 2021, and as a result, none remained outstanding as of December 31, 2021.
F-3
We identified the evaluation of the fair value of Earnout Securities issued on May 19, 2021 in connection with the Business Combination as a critical audit matter. A higher degree of subjective and complex auditor judgment was required to evaluate the volatility rate developed from guideline public companies and the discount for lack of marketability (DLOM) used to estimate the fair value of the Earnout Securities. The development of these assumptions involved unobservable data or company adjustments of observable data.
The following are the primary procedures we performed to address this critical audit matter. We evaluated the design of certain internal controls related to the valuation process for Earnout Securities, including controls related to the determination of the volatility rate. We involved valuation professionals with specialized skills and knowledge, who assisted in:
— evaluating the DLOM by comparing it to an independently developed range of DLOMs
— assessing the volatility rate used in the valuation of Earnout Securities by comparing it to (1) an independently developed volatility rate using comparable peer companies, (2) historical and implied volatility rates of relevant public peer companies, and (3) an independently developed range of volatility rates using the capital structure of the Company.
/s/ KPMG LLP
We have served as the Company’s auditor since 2016.
New York, New York
February 28, 2022
F-4
Blue Owl Capital Inc.
(Prior to May 19, 2021, Owl Rock)
Consolidated and Combined Statements of Financial Condition
(Dollars in Thousands, Except Per Share Data)
December 31, 2021 | December 31, 2020 | |||||||
Assets | ||||||||
Cash and cash equivalents | $ | 42,567 | $ | 11,630 | ||||
Due from related parties | 224,576 | 92,698 | ||||||
Operating lease assets | 86,033 | 0 | ||||||
Strategic Revenue-Share Purchase consideration, net | 495,322 | 0 | ||||||
Deferred tax assets | 635,624 | 800 | ||||||
Intangible assets, net | 2,611,411 | 0 | ||||||
Goodwill | 4,132,245 | 0 | ||||||
Other assets, net | 38,620 | 16,469 | ||||||
Total Assets | $ | 8,266,398 | $ | 121,597 | ||||
Liabilities | ||||||||
Debt obligations, net | $ | 1,174,167 | $ | 356,386 | ||||
Accrued compensation | 155,606 | 207,957 | ||||||
Operating lease liabilities | 88,480 | 0 | ||||||
Deferred tax liabilities | 48,962 | 0 | ||||||
TRA liability (includes $111,325 and $0 at fair value) | 670,676 | 0 | ||||||
Warrant liability, at fair value | 68,798 | 0 | ||||||
Earnout liability | 143,800 | 0 | ||||||
Accounts payable, accrued expenses and other liabilities | 68,339 | 58,415 | ||||||
Total Liabilities | 2,418,828 | 622,758 | ||||||
Commitments and Contingencies (Note 11) | 0 | 0 | ||||||
Shareholders’ Equity (Deficit) | ||||||||
Members’ deficit prior to the Business Combination | 0 | (507,687 | ) | |||||
Class A Shares, par value $0.0001 per share, 2,500,000,000 and NaN authorized, 404,919,411 and NaN issued and outstanding | 40 | 0 | ||||||
Class C Shares, par value $0.0001 per share, 1,500,000,000 and NaN authorized, 674,766,200 and NaN issued and outstanding | 67 | 0 | ||||||
Class D Shares, par value $0.0001 per share, 350,000,000 and NaN authorized, 319,132,127 and NaN issued and outstanding | 32 | 0 | ||||||
Additional paid-in capital | 2,160,934 | 0 | ||||||
Accumulated deficit | (497,506 | ) | 0 | |||||
Total Shareholders’ Equity Attributable to Blue Owl Capital Inc. | 1,663,567 | 0 | ||||||
Shareholders’ equity attributable to noncontrolling interests | 4,184,003 | 6,526 | ||||||
Total Shareholders’ Equity (Deficit) | 5,847,570 | (501,161 | ) | |||||
Total Liabilities and Shareholders’ Equity (Deficit) | $ | 8,266,398 | $ | 121,597 | ||||
The accompanying notes are an integral part of these consolidated and combined financial statements.
F-5
Blue Owl Capital Inc.
Consolidated and Combined Statements of Operations
(Prior to May 19, 2021, Owl Rock)
(Dollars in Thousands, Except Per Share Data)
Year Ended December 31, | ||||||||||||
2021 | 2020 | 2019 | ||||||||||
Revenues | ||||||||||||
Management fees, net (includes Part I Fees of $150,370, $34,404 and $11,515) | $ | 667,935 | $ | 194,906 | $ | 123,957 | ||||||
Administrative, transaction and other fees | 150,037 | 54,909 | 66,893 | |||||||||
Realized performance income | 5,906 | — | — | |||||||||
Total Revenues, Net | 823,878 | 249,815 | 190,850 | |||||||||
Expenses | ||||||||||||
Compensation and benefits | 1,496,988 | 240,731 | 111,773 | |||||||||
Amortization of intangible assets | 113,889 | — | — | |||||||||
General, administrative and other expenses | 140,268 | 67,811 | 51,710 | |||||||||
Total Expenses | 1,751,145 | 308,542 | 163,483 | |||||||||
Other Loss | ||||||||||||
Net losses on investments | (3,526 | ) | — | — | ||||||||
Net losses on retirement of debt | (17,636 | ) | — | — | ||||||||
Interest expense | (27,275 | ) | (23,816 | ) | (6,662 | ) | ||||||
Change in TRA liability | (13,848 | ) | — | — | ||||||||
Change in warrant liability | (43,670 | ) | — | — | ||||||||
Change in earnout liability | (834,255 | ) | — | — | ||||||||
Total Other Loss | (940,210 | ) | (23,816 | ) | (6,662 | ) | ||||||
Loss Before Income Taxes | (1,867,477 | ) | (82,543 | ) | 20,705 | |||||||
Income tax benefit | (65,211 | ) | (102 | ) | 240 | |||||||
Consolidated and Combined Net Loss | (1,802,266 | ) | (82,441 | ) | 20,465 | |||||||
Net loss attributable to noncontrolling interests | 1,426,095 | 4,610 | 2,493 | |||||||||
Net Loss Attributable to Blue Owl Capital Inc. (After May 19, 2021) / Owl Rock (Prior to May 19, 2021) | $ | (376,171 | ) | $ | (77,831 | ) | $ | 22,958 | ||||
May 19, 2021 through December 31, 2021 | ||||||||||||
Net Loss Attributable to Class A Shares | $ | (450,430 | ) | |||||||||
Net Loss per Class A Share | ||||||||||||
Basic | $ | (1.27 | ) | |||||||||
Diluted | $ | (1.34 | ) | |||||||||
Weighted-Average Class A Shares | ||||||||||||
Basic (1) | 354,949,067 | |||||||||||
Diluted | 1,315,186,416 | |||||||||||
| (1) | Included in the weighted-average Class A Shares outstanding for the period from May 19, 2021 to December 31, 2021, were 9,191,642 RSUs that have vested but have not been settled in Class A Shares. These RSUs do not participate in dividends until settled in Class A Shares. See Note 13. |
The accompanying notes are an integral part of these consolidated and combined financial statements.
F-6
Blue Owl Capital Inc.
Consolidated and Combined Statements of Changes in Shareholders’ Equity (Deficit)
(Prior to May 19, 2021, Owl Rock)
(Dollars in Thousands, Except Per Share Data)
Year Ended December 31, | ||||||||||||
2021 | 2020 | 2019 | ||||||||||
Members’ Deficit Prior to the Business Combination | ||||||||||||
Beginning balance | $ | (507,687 | ) | $ | (352,756 | ) | $ | (69,916 | ) | |||
Contributions | 0 | 0 | 13,435 | |||||||||
Distributions | (103,143 | ) | (77,100 | ) | (319,233 | ) | ||||||
Comprehensive income (loss) prior to the Business Combination Date | 74,259 | (77,831 | ) | 22,958 | ||||||||
Transfer of predecessor members’ deficit to additional paid-in capital and noncontrolling interests | 536,571 | 0 | 0 | |||||||||
Ending Balance | $ | 0 | $ | (507,687 | ) | $ | (352,756 | ) | ||||
Class A Shares Par Value | ||||||||||||
Beginning balance | $ | 0 | $ | 0 | $ | 0 | ||||||
Impact of the Business Combination | 32 | 0 | 0 | |||||||||
Share issuance in connection with Strategic Revenue-Share Purchase | 3 | 0 | 0 | |||||||||
Settlement of Earnout Securities | 1 | 0 | 0 | |||||||||
Class C Shares and Common Units exchanged for Class A Shares | 4 | 0 | 0 | |||||||||
Ending Balance | $ | 40 | $ | 0 | $ | 0 | ||||||
Class C Shares Par Value | ||||||||||||
Beginning balance | $ | 0 | $ | 0 | $ | 0 | ||||||
Impact of the Business Combination | 63 | 0 | 0 | |||||||||
Settlement of Earnout Securities | 6 | 0 | 0 | |||||||||
Class C Shares and Common Units exchanged for Class A Shares | (4 | ) | 0 | 0 | ||||||||
Class C Shares issued as consideration related to the Oak Street Acquisition | 2 | 0 | 0 | |||||||||
Ending Balance | $ | 67 | $ | 0 | $ | 0 | ||||||
Class D Shares Par Value | ||||||||||||
Beginning balance | $ | 0 | $ | 0 | $ | 0 | ||||||
Impact of the Business Combination | 29 | 0 | 0 | |||||||||
Settlement of Earnout Securities | 3 | 0 | 0 | |||||||||
Ending Balance | $ | 32 | $ | 0 | $ | 0 | ||||||
Class E Shares Par Value | ||||||||||||
Beginning balance | $ | 0 | $ | 0 | $ | 0 | ||||||
Impact of the Business Combination | 1 | 0 | 0 | |||||||||
Settlement of Earnout Securities | (1 | ) | 0 | 0 | ||||||||
Ending Balance | $ | 0 | $ | 0 | $ | 0 | ||||||
Additional Paid-in Capital | ||||||||||||
Beginning balance | $ | 0 | $ | 0 | $ | 0 | ||||||
Transfer of predecessor Owl Rock members’ deficit to additional paid-in capital and noncontrolling interests | (138,133 | ) | 0 | 0 | ||||||||
Cash proceeds from the Business Combination | 1,738,478 | 0 | 0 | |||||||||
Offering costs related to the Business Combination | (126,309 | ) | 0 | 0 | ||||||||
Allocation of cash proceeds to warrant liability | (25,128 | ) | 0 | 0 | ||||||||
F-7
Blue Owl Capital Inc.
Consolidated and Combined Statements of Changes in Shareholders’ Equity (Deficit)
(Prior to May 19, 2021, Owl Rock)
(Dollars in Thousands, Except Per Share Data)
Year Ended December 31, | ||||||||||||
2021 | 2020 | 2019 | ||||||||||
Allocation to earnout liability for Class E Shares issued in connection with the Business Combination | (83,949 | ) | 0 | 0 | ||||||||
Deferred taxes recognized in the Business Combination | 504,551 | 0 | 0 | |||||||||
TRA liability recognized in the Business Combination | (359,388 | ) | 0 | 0 | ||||||||
Reallocation between additional paid-in capital and noncontrolling interests related to the Business Combination | (325,222 | ) | 0 | 0 | ||||||||
Share issuance in connection with Strategic Revenue-Share Purchase | 455,020 | 0 | 0 | |||||||||
Offering costs related to share issuance in connection with Strategic Revenue-Share Purchase | (687 | ) | 0 | 0 | ||||||||
Exercise of warrants | 2 | 0 | 0 | |||||||||
Equity-based compensation | 331,926 | 0 | 0 | |||||||||
Settlement of Earnout Securities | 198,704 | 0 | 0 | |||||||||
Acquisition of noncontrolling interests | (74,684 | ) | 0 | 0 | ||||||||
Deferred taxes on capital transactions subsequent to the Business Combination | 164,741 | 0 | 0 | |||||||||
TRA liability recognized on capital transactions subsequent to the Business Combination | (195,795 | ) | 0 | 0 | ||||||||
Reallocation between additional paid-in capital and noncontrolling interests due to changes in Blue Owl Operating Group ownership subsequent to the Business Combination | 96,807 | 0 | 0 | |||||||||
Ending Balance | $ | 2,160,934 | $ | 0 | $ | 0 | ||||||
Accumulated Deficit | ||||||||||||
Beginning balance | $ | 0 | $ | 0 | $ | 0 | ||||||
Cash dividends declared on Class A Shares | (47,076 | ) | 0 | 0 | ||||||||
Comprehensive loss following the Business Combination Date | (450,430 | ) | 0 | 0 | ||||||||
Ending Balance | $ | (497,506 | ) | $ | 0 | $ | 0 | |||||
Total Shareholders’ Equity Attributable to Blue Owl Capital Inc. | $ | 1,663,567 | $ | 0 | $ | 0 | ||||||
Shareholders’ Equity Attributable to Noncontrolling Interests | ||||||||||||
Beginning balance | $ | 6,526 | $ | 2,259 | $ | (2,689 | ) | |||||
Transfer of predecessor Owl Rock members’ deficit to additional paid-in capital and noncontrolling interests | (398,438 | ) | 0 | 0 | ||||||||
Common Units issued as consideration related to the Dyal Acquisition | 4,285,359 | 0 | 0 | |||||||||
Acquisition of noncontrolling interests in the Blue Owl Operating Group in connection with the Business Combination | (491,956 | ) | 0 | 0 | ||||||||
Allocation to earnout liability for Seller Earnout Units issued in the Business Combination | (160,540 | ) | 0 | 0 | ||||||||
Reallocation between additional paid-in capital and noncontrolling interests related to the Business Combination | 325,222 | 0 | 0 | |||||||||
Common Units issued as consideration related to the Oak Street Acquisition | 329,767 | 0 | 0 | |||||||||
Equity-based compensation | 1,026,020 | 0 | 0 | |||||||||
Settlement of Earnout Securities | 1,126,828 | 0 | 0 | |||||||||
Acquisition of noncontrolling interests | (222,370 | ) | 0 | 0 | ||||||||
F-8
Blue Owl Capital Inc.
Consolidated and Combined Statements of Changes in Shareholders’ Equity (Deficit)
(Prior to May 19, 2021, Owl Rock)
(Dollars in Thousands, Except Per Share Data)
Year Ended December 31, | ||||||||||||
2021 | 2020 | 2019 | ||||||||||
Contributions | 15,734 | 9,831 | 8,460 | |||||||||
Distributions | (135,244 | ) | (954 | ) | (1,019 | ) | ||||||
Reallocation between additional paid-in capital and noncontrolling interests due to changes in Blue Owl Operating Group ownership subsequent to the Business Combination | (96,810 | ) | 0 | 0 | ||||||||
Comprehensive income (loss) | (1,426,095 | ) | (4,610 | ) | (2,493 | ) | ||||||
Ending Balance | $ | 4,184,003 | $ | 6,526 | $ | 2,259 | ||||||
Total Shareholders’ Equity | $ | 5,847,570 | $ | (501,161 | ) | $ | (350,497 | ) | ||||
Cash Dividends Paid per Class A Share | $ | 0.13 | $ | 0 | $ | 0 | ||||||
Number of Class A Shares | ||||||||||||
Beginning balance | 0 | 0 | 0 | |||||||||
Impact of the Business Combination | 320,005,258 | 0 | 0 | |||||||||
Shares issued in connection with Strategic Revenue-Share Purchase | 29,701,013 | 0 | 0 | |||||||||
Settlement of Earnout Securities | 14,990,864 | 0 | 0 | |||||||||
Class C Shares and Common Units exchanged for Class A Shares | 40,222,143 | 0 | 0 | |||||||||
Exercise of warrants | 133 | 0 | 0 | |||||||||
Ending Balance | 404,919,411 | 0 | 0 | |||||||||
Number of Class C Shares | ||||||||||||
Beginning balance | 0 | 0 | 0 | |||||||||
Impact of the Business Combination | 628,380,707 | 0 | 0 | |||||||||
Settlement of Earnout Securities | 60,533,306 | 0 | 0 | |||||||||
Class C Shares and Common Units exchanged for Class A Shares | (40,222,143 | ) | 0 | 0 | ||||||||
Common Units issued as consideration for Oak Street Acquisition | 26,074,330 | 0 | 0 | |||||||||
Ending Balance | 674,766,200 | 0 | 0 | |||||||||
Number of Class D Shares | ||||||||||||
Beginning balance | 0 | 0 | 0 | |||||||||
Impact of the Business Combination | 294,656,373 | 0 | 0 | |||||||||
Settlement of Earnout Securities | 24,475,754 | 0 | 0 | |||||||||
Ending Balance | 319,132,127 | 0 | 0 | |||||||||
Number of Class E Shares | ||||||||||||
Beginning balance | 0 | 0 | 0 | |||||||||
Impact of the Business Combination | 14,990,864 | 0 | 0 | |||||||||
Settlement of Earnout Securities | (14,990,864 | ) | 0 | 0 | ||||||||
Ending Balance | 0 | 0 | 0 | |||||||||
The accompanying notes are an integral part of these consolidated and combined financial statements.
F-9
Blue Owl Capital Inc.
Consolidated and Combined Statements of Cash Flows
(Prior to May 19, 2021, Owl Rock)
(Dollars in Thousands)
Year Ended December 31, | ||||||||||||
2021 | 2020 | 2019 | ||||||||||
Cash Flows from Operating Activities | ||||||||||||
Consolidated and combined net (loss) income | $ | (1,802,266 | ) | $ | (82,441 | ) | $ | 20,465 | ||||
Adjustments to reconcile consolidated and combined net loss to net cash from operating activities: | ||||||||||||
Amortization of intangible assets | 113,889 | 0 | 0 | |||||||||
Equity-based compensation | 1,205,336 | 0 | 0 | |||||||||
Depreciation and amortization of fixed assets | 665 | 673 | 829 | |||||||||
Amortization of debt discounts and deferred financing costs | 1,868 | 787 | 225 | |||||||||
Amortization of investment discounts and premiums | 1,692 | 0 | 0 | |||||||||
Non-cash lease expense | 1,974 | 0 | 0 | |||||||||
Net losses on retirement of debt | 17,636 | 0 | 0 | |||||||||
Net losses on investments, net of dividends | 3,583 | 0 | 0 | |||||||||
Change in TRA liability | 13,848 | 0 | 0 | |||||||||
Change in warrant liability | 43,670 | 0 | 0 | |||||||||
Change in earnout liability | 834,255 | 0 | 0 | |||||||||
Deferred income taxes | (66,138 | ) | (475 | ) | 159 | |||||||
Changes in operating assets and liabilities: | ||||||||||||
Due from related parties | (105,376 | ) | (49,824 | ) | (12,407 | ) | ||||||
Strategic Revenue-Share Purchase consideration | (40,997 | ) | 0 | 0 | ||||||||
Other assets, net | (2,095 | ) | (9,747 | ) | 2,060 | |||||||
Accrued compensation | 92,742 | 135,108 | 39,295 | |||||||||
Accounts payable, accrued expenses and other liabilities | (32,628 | ) | 11,153 | (6,562 | ) | |||||||
Net Cash Provided by Operating Activities | 281,658 | 5,234 | 44,064 | |||||||||
Cash Flows from Investing Activities | ||||||||||||
Purchase of fixed assets | (5,261 | ) | (652 | ) | (1,173 | ) | ||||||
Purchase of investments | (328,797 | ) | 0 | 0 | ||||||||
Proceeds from investment sales and maturities | 314,052 | 0 | 0 | |||||||||
Cash consideration paid for Dyal Acquisition and Oak Street Acquisition, net of cash acquired | (1,578,866 | ) | 0 | 0 | ||||||||
Proceeds from promissory note | 0 | (30,000 | ) | 0 | ||||||||
Repayments of promissory note | 0 | 30,000 | 0 | |||||||||
Net Cash Used in Investing Activities | (1,598,872 | ) | (652 | ) | (1,173 | ) | ||||||
Cash Flows from Financing Activities | ||||||||||||
Cash proceeds from the Business Combination | 1,738,603 | 0 | 0 | |||||||||
Offering costs related to the Business Combination | (126,309 | ) | 0 | 0 | ||||||||
Acquisition of noncontrolling interests in the Blue Owl Operating Group in connection with the Business Combination | (491,956 | ) | 0 | 0 | ||||||||
Acquisition of noncontrolling interests | (297,054 | ) | 0 | 0 | ||||||||
Proceeds from debt obligations | 1,390,296 | 240,547 | 344,944 | |||||||||
Debt issuance costs | (17,864 | ) | (594 | ) | (4,151 | ) | ||||||
Repayments of debt obligations, including retirement costs | (577,835 | ) | (171,458 | ) | (83,590 | ) | ||||||
Contributions from members prior to the Business Combination | 0 | 9,264 | 20,042 | |||||||||
Dividends paid on Class A Shares | (47,076 | ) | 0 | 0 | ||||||||
Distributions to members prior to the Business Combination | (103,144 | ) | (78,054 | ) | (320,252 | ) | ||||||
Contributions from noncontrolling interests | 15,734 | 0 | 0 | |||||||||
Distributions to noncontrolling interests | (135,244 | ) | 0 | 0 | ||||||||
Net Cash Provided by (Used in) Financing Activities | 1,348,151 | (295 | ) | (43,007 | ) | |||||||
Net Increase (Decrease) in Cash and Cash Equivalents | 30,937 | 4,287 | (116 | ) | ||||||||
Cash and cash equivalents, beginning of period | 11,630 | 7,343 | 7,459 | |||||||||
Cash and Cash Equivalents, End of Period | $ | 42,567 | $ | 11,630 | $ | 7,343 | ||||||
Supplemental Information | ||||||||||||
Cash paid for interest | $ | 25,009 | $ | 23,231 | $ | 2,697 | ||||||
Cash paid for income taxes | $ | 4,353 | $ | 142 | $ | 359 | ||||||
The accompanying notes are an integral part of these consolidated and combined financial statements.
F-10
Blue Owl Capital Inc.
(Prior to May 19, 2021, Owl Rock)
Notes to Consolidated and Combined Financial Statements
1. | ORGANIZATION |
Blue Owl Capital Inc. (the “Registrant”), a Delaware corporation, together with its consolidated subsidiaries (collectively, the “Company” or “Blue Owl”), is a global alternative asset manager. Anchored by a strong permanent capital base, the Company deploys private capital across Direct Lending, GP Capital Solutions and Real Estate strategies on behalf of institutional and private wealth clients.
The Company’s primary sources of revenues are management fees, which are generally based on the amount of the Company’s
fee-paying
assets under management. The Company generates substantially all of its revenues in the United States. The Company operates through 1 operating and reportable segment. This single reportable segment reflects how the chief operating decision makers allocate resources and assess performance under the Company’s“one-firm
approach,” which includes operating collaboratively across product lines, with predominantly a single expense pool.The Company conducts its operations through Blue Owl Capital Holdings LP (“Blue Owl Holdings”) and Blue Owl Capital Carry LP (“Blue Owl Carry”). Blue Owl Holdings and Blue Owl Carry are referred to, collectively, as the “Blue Owl Operating Partnerships,” and collectively with their consolidated subsidiaries, as the “Blue Owl Operating Group.” The Registrant holds its controlling financial interests in the Blue Owl Operating Group indirectly through Blue Owl Capital Holdings GP LLC and Blue Owl Capital GP LLC (collectively, “Blue Owl GP”), which are directly or indirectly wholly owned subsidiaries of the Registrant.
Business Combination, Including Dyal Acquisition
The Registrant was initially incorporated in the Cayman Islands as Altimar Acquisition Corporation (“Altimar”), a special purpose acquisition company. Pursuant to the Business Combination Agreement dated December 23, 2020, as amended, modified, supplemented or waived from time to time, (the “Business Combination Agreement”), on May 19, 2021 (“Business Combination Date”) (i) Altimar was redomiciled as a Delaware corporation and changed its name to Blue Owl Capital Inc., (ii) Altimar merged with Owl Rock (as defined below) (the “Altimar Merger”) and (iii) the Company acquired Dyal Capital Partners (“Dyal Capital”), a former division of Neuberger Berman Group LLC (the “Dyal Acquisition”) (collectively with the Altimar Merger, the “Business Combination”). As further discussed in Note 2, for both the Altimar Merger and the Dyal Acquisition, Owl Rock was deemed to be the acquirer for accounting purposes. Therefore, the predecessor to Blue Owl is “Owl Rock,” a combined
carve-out
of Owl Rock Capital Group LLC and Blue Owl Securities LLC (formerly, Owl Rock Capital Securities LLC) (“Securities”). See Note 3 for additional information.Oak Street Acquisition
On December 29, 2021, the Company completed its acquisition of Oak Street Real Estate Capital, LLC (“Oak Street”) and its advisory business (the “Oak Street Acquisition,” and together with the Dyal Acquisition, the “Acquisitions”). See Note 3 for additional information.
Registrant’s Capital Structure
In 2021, the Registrant had the following instruments outstanding:
| • | Class A Shares |
F-11
Blue Owl Capital Inc.
(Prior to May 19, 2021, Owl Rock)
Notes to Consolidated and Combined Financial Statements
| • | Class B Shares 1-for-one |
| • | Class C Shares non-Principals, 1 Class C Share is issued to grant a corresponding voting interest in the Registrant. |
| • | Class D Shares |
| • | Class E Shares |
In connection with the Business Combination, the Company issued two series of Class E Shares: Series
E-1
and SeriesE-2.
SeriesE-1
andE-2
vested upon a Class E Triggering Event, which occurred when the volume weighted-average price of a Class A Share exceeded $12.50 and $15.00, respectively, for 20 consecutive trading days. The SeriesE-1
Class E Shares had a Class E Triggering Event on July 21, 2021, at which time 7,495,432 Class E Shares were converted into an equal number of Class A Shares. The SeriesE-2
Class E Shares had a Class E Triggering Event on November 3, 2021, at which time 7,495,432 Class E Shares were converted into an equal number of Class A Shares.| • | RSUs to-date do not accrue dividend equivalents. NaN RSUs were issued prior to the Business Combination. RSU grants are accounted for as equity-based compensation. See Note 8 for additional information. |
| • | Warrants |
F-12
Blue Owl Capital Inc.
(Prior to May 19, 2021, Owl Rock)
Notes to Consolidated and Combined Financial Statements
Company’s Class A Share price equals or exceeds $18.00 per share. If the Company’s Class A Share price is greater than $10.00 per share but less than $18.00 per share, the Company generally may redeem all Public Warrants for $0.10 per warrant. In each case, any redemptions require a 30-day notice to the warrant holders, during which time the holders may elect to exercise their warrants, and such redemptions must be done for not less than all of the outstanding Public Warrants. Holders may elect to exercise their warrants on a cashless basis. |
The following table presents the number of shares of the Registrant, RSUs and warrants that were outstanding as of December 31, 2021:
December 31, 2021 | ||||
Class A Shares | 404,919,411 | |||
Class C Shares | 674,766,200 | |||
Class D Shares | 319,132,127 | |||
RSUs | 21,059,443 | |||
Warrants | 14,159,248 | |||
Blue Owl Operating Partnerships’ Capital Structure
In 2021, the Blue Owl Operating Partnerships had outstanding the following instruments, which are collectively referred to as “Blue Owl Operating Group Units”:
| • | GP Units |
| • | Common Units one-for-one non-Principal) or Class B Shares (if held by a Principal). Common Unit exchanges may be settled in cash, only at the election of the Company’s Exchange Committee (currently composed of independent members of the Board), and only if funded from proceeds of a new permanent equity offering. Common Units held by Principals are exchangeable after thetwo-year anniversary of the Business Combination Date. References to Common Units refer collectively to a Common Unit in each of the Blue Owl Operating Partnerships, but excludes any Common Units held directly or indirectly by the Registrant. Upon an exchange of Common Units for an equal number of Class A Shares or Class B Shares, a corresponding number of Class C Shares or Class D Shares, respectively, will be cancelled. Common Unitholders are entitled to distributions in the same amount per unit as declared on GP Units. |
| • | Incentive Units |
F-13
Blue Owl Capital Inc.
(Prior to May 19, 2021, Owl Rock)
Notes to Consolidated and Combined Financial Statements
distributions in the same amount per unit as declared on GP Units and Common Units. Unvested Incentive Unitholders generally are not entitled to distributions; however, consistent with other Blue Owl Operating Group Units (other than Oak Street Earnout Units), unvested Incentive Units receive taxable income allocations that may subject holders to tax liabilities. As a result, Incentive Unitholders (consistent with other Blue Owl Operating Group Units other than Oak Street Earnout Units) may receive tax distributions on unvested units to cover a portion or all of such tax liabilities. |
| • | Seller Earnout Units |
The Series
E-1
Seller Earnout Units had a Class E Triggering Event on July 21, 2021. As a result, (i) 7,495,432 Seller Earnout Units underlying an equal number of SeriesE-1
Class E Shares were converted into an equal number of GP Units, (ii) 42,504,530 Seller Earnout Units were converted into an equal number of Common Units, and (iii) 42,504,530non-economic,
voting shares of the Registrant were issued to the holders of the converted Common Units (30,266,653 Class C Shares and 12,237,877 Class D Shares).The Series
E-2
Seller Earnout Units had a Class E Triggering Event on November 3, 2021. As a result, (i) 7,495,432 Seller Earnout Units underlying an equal number of SeriesE-2
Class E Shares were converted into an equal number of GP Units, (ii) 42,504,530 Seller Earnout Units were converted into an equal number of Common Units, and (iii) 42,504,530non-economic,
voting shares of the Registrant were issued to the holders of the converted Common Units (30,266,653 Class C Shares and 12,237,877 Class D Shares).| • | Oak Street Earnout Units |
The following table presents the number of Blue Owl Operating Group Units that were outstanding as of December 31, 2021:
Units | December 31, 2021 | |||
GP Units | 404,919,411 | |||
Common Units | 993,898,327 | |||
Incentive Units | 23,244,373 | |||
Oak Street Earnout Units | 26,074,330 | |||
Share Repurchase Program
On May 19, 2021, Blue Owl’s Board authorized the repurchase of up to $100.0 million of Class A Shares. Under the repurchase program, repurchases may be made from time to time in open market transactions, in privately negotiated transactions or otherwise. The timing and the actual numbers repurchased will depend on a variety of factors, including legal requirements, price and economic and market conditions. The repurchase program may be changed, suspended or discontinued at any time and will
F-14
Blue Owl Capital Inc.
(Prior to May 19, 2021, Owl Rock)
Notes to Consolidated and Combined Financial Statements
terminate upon the earlier of May 19, 2022 and the purchase of all shares available under the repurchase program. As of December 31, 2021, the Company had not repurchased any of its Class A Shares.
Common Unit Exchanges
During the fourth quarter of 2021, the Company exchanged 40,222,143 Common Units and Class C Shares for an equal number of Class A Shares. As a result of the exchange, the Company reallocated equity from noncontrolling interests to the Company’s additional
paid-in
capital and recorded additional net deferred tax assets and TRA liability in connection with the exchanges. See the consolidated and combined statement of shareholders’ equity and Note 10 for additional information, including the amounts related to these adjustments.2. | SUMMARY OF SIGNIFICANT ACCOUNTING POLICIES |
Basis of Presentation
These consolidated and combined financial statements are prepared in accordance with U.S. generally accepted accounting principles (“GAAP”) as set forth in the Financial Accounting Standards Board’s (“FASB”) Accounting Standards Codification (“ASC”). All intercompany transactions and balances have been eliminated in consolidation and combination. The notes are an integral part of the Company’s consolidated and combined financial statements. In the opinion of management, all adjustments necessary for a fair presentation of the Company’s consolidated and combined financial statements have been included and are of a normal and recurring nature. The Company’s comprehensive income (loss) is comprised solely of consolidated and combined net income (i.e., the Company has no other comprehensive income).
Prior to the Business Combination, Blue Owl’s financial statements were prepared on a consolidated and combined basis. As part of the Business Combination, Securities was contributed to the Blue Owl Operating Group. Following the Business Combination, the financial statements are prepared on a consolidated basis.
The merger between Owl Rock and Altimar was accounted for as a reverse asset acquisition, with no
step-up
to fair value on any assets or liabilities, and therefore no goodwill or other intangible assets were recorded. The Acquisitions were accounted for using the acquisition method of accounting. As a result, the Company recorded the fair value of the net assets acquired as of the closing date of each respective acquisition, and operating results for each acquired business are included starting as of such each respective date. See Note 3 for additional information regarding the Acquisitions.Use of Estimates
The preparation of financial statements in conformity with GAAP requires management to make assumptions and estimates that affect the amounts reported in the consolidated and combined financial statements. The most critical of these estimates are related to (i) the fair value of the investments held by the products the Company manages, as for many products, this impacts the amount of revenues the Company recognizes each period; (ii) the fair value of equity-based compensation grants; (iii) the fair values of liabilities with respect to the TRA (the portion considered contingent consideration), warrants and earnout liability; (iv) the estimate of future taxable income, which impacts the realizability and carrying amount of the Company’s deferred income tax assets; and (v) the qualitative and quantitative assessments of whether impairments of acquired intangible assets and goodwill exist. Inherent in such estimates and judgements relating to future cash flows, which include the Company’s interpretation of current economic indicators
F-15
Blue Owl Capital Inc.
(Prior to May 19, 2021, Owl Rock)
Notes to Consolidated and Combined Financial Statements
and market valuations, and assumptions about the Company’s strategic plans with regard to its operations. While management believes that the estimates utilized in preparing the consolidated and combined financial statements are reasonable and prudent, actual results could differ materially from those estimates.
Principles of Consolidation
The Company consolidates entities in which it has a controlling financial interest based on the application of either the variable interest model or the voting interest model.
An entity is considered to be a variable interest entity (“VIE”) if any of the following conditions exist: (a) the total equity investment at risk is not sufficient to permit the entity to finance its activities without additional subordinated financial support, (b) the holders of equity investment at risk, as a group, lack either the direct or indirect ability through voting rights or similar rights to make decisions that have a significant effect on the success of the entity or the obligation to absorb the expected losses or right to receive the expected residual returns, or (c) the voting rights of some equity investors are disproportionate to their obligation to absorb losses of the entity, their rights to receive returns from an entity, or both and substantially all of the entity’s activities either involve or are conducted on behalf of an investor with disproportionately few voting rights.
The Company is required to consolidate any VIEs for which it is the primary beneficiary. The Company is the primary beneficiary if it holds a controlling financial interest, which is defined as having (a) the power to direct the activities of the VIE that most significantly impact the entity’s economic performance and (b) the obligation to absorb losses of the entity or the right to receive benefits from the entity that could potentially be significant to the VIE. The Company does not consolidate any of the products it manages, as it does not hold any direct or indirect interests in such entities that could expose the Company to an obligation to absorb losses of an entity or the right to receive benefits from an entity that could potentially be significant to such entities.
Fees that are customary and commensurate with the level of services provided by the Company, and where the Company does not hold other economic interests in the entity that would absorb more than an insignificant amount of the expected losses or returns of the entity, are not be considered to be variable interests. The Company factors in all economic interests, including proportionate interests held through related parties, to determine if fees are variable interests. The Company’s interests in the products it manages are primarily in the form of management fees, realized performance income, and insignificant direct or indirect equity interests, and therefore does not have variable interests in such entities.
The Company determines whether it is the primary beneficiary of a VIE at the time it becomes involved with a VIE and continuously reconsiders that conclusion. In evaluating whether the Company is the primary beneficiary, the Company evaluates its direct and indirect economic interests in the entity. The consolidation analysis is generally performed qualitatively; however, if the primary beneficiary is not readily determinable, a quantitative analysis may also be performed. This analysis requires judgment, including: (1) determining whether the equity investment at risk is sufficient to permit the entity to finance its activities without additional subordinated financial support, (2) evaluating whether the equity holders, as a group, can make decisions that have a significant effect on the success of the entity, (3) determining whether two or more parties’ equity interests should be aggregated, (4) determining whether the equity investors have proportionate voting rights to their obligations to absorb losses or rights to receive returns from an entity and (5) evaluating the nature of relationships and activities of the parties involved in determining which party within a related-party group is most closely associated with a VIE and therefore would be deemed the primary beneficiary.
F-16
Blue Owl Capital Inc.
(Prior to May 19, 2021, Owl Rock)
Notes to Consolidated and Combined Financial Statements
For entities that are not VIEs, the Company evaluates such entities (“VOEs”) under the voting interest model. The Company consolidates VOEs where the Company controls a majority voting interest. The Company will generally not consolidate VOEs where a single investor or simple majority of third-party investors with equity have the ability to exercise substantive
kick-out
or participation rights.Acquisitions
For business combinations accounted for under the acquisition method, management recognizes the fair value of assets acquired and liabilities assumed on the acquisition date. The excess of purchase price consideration over the fair value of net assets acquired is recorded as goodwill. Management’s determination of fair value of assets acquired and liabilities assumed at the acquisition date is based on the best information available in the circumstances and incorporates management’s own assumptions and involve a significant degree of judgment.
Cash and Cash Equivalents
The Company considers highly-rated liquid investments that have an original maturity of three months or less from the date of purchase to be cash equivalents. As of December 31, 2021 and 2020, the Company holds the majority of its cash balances with a single financial institution and such balances are in excess of Federal Deposit Insurance Corporation insured limits, which exposes the Company to a certain degree of credit risk concentration.
Investments
Investments are primarily comprised of investments for which the Company has elected the fair value option in order to simplify the accounting for these instruments, and therefore changes in unrealized gains or losses are included in current-period earnings. Such elections are irrevocable and are applied on anbasis at initial recognition. Investments are included within other assets in the consolidated and combined statements of financial condition. Realized and changes in unrealized gains (losses) on these investments are included within net gains (losses) on investments in the consolidated and combined statements of operations. Investments for which the Company has not elected the fair value option are primarily comprised of equity-method investments in its products. See Note 9 for additional information.
investment-by-investment
Leases
Right-of-use
The Company adopted Accounting Standards Update (“ASU”), as amended, on January 1, 2021 (“ASC 842”). The Company did not restate prior periods and there were no adjustments to retained earnings upon adoption of ASC 842. The Company applied the package of practical expedients permitted under the transition guidance within the new standard, including carrying forward the historical lease classification and not reassessing whether certain costs capitalized under the prior guidance are eligible for capitalization under ASC 842. The adoption of ASC 842 resulted in the recognition of $13.8 million of operating lease assets and $14.4 million of operating lease liabilities, with the net of these amounts offsetting the deferred rent credit liability in existence immediately prior to adoption.
2016-02,
Leases (Topic 842)
The Company determines if an arrangement is a lease at inception.lease assets and lease liabilities are recognized at commencement date based on the present value of lease payments over the lease
Right-of-use
F-17
Blue Owl Capital Inc.
(Prior to May 19, 2021, Owl Rock)
Notes to Consolidated and Combined Financial Statements
term.lease assets represent the Company’s right to use a leased asset for the lease term and lease liabilities represent the Company’s obligation to make lease payments arising from the lease. The Company does not recognizelease assets and lease liabilities for leases with an initial term of one year or less.
Right-of-use
right-of-use
As the Company’s leases do not provide an implicit rate, the Company uses its estimated incremental borrowing rate based on information available at the lease commencement date in determining the present value of lease payments. The determination of an appropriate incremental borrowing rate requires judgment. The Company determines its incremental borrowing rate based on data for instruments with similar characteristics, including recently issued debt, as well as other factors.
The operating lease assets include any lease payments made and lease incentives. Lease terms include options to extend or terminate when it is reasonably certain that the Company will exercise that option. In addition, the Company separates lease andassets and interest accretion on lease liabilities, over the lease term and included within general, administrative and other expenses in the consolidated and combined statements of operations. The Company does not have any material finance leases.
non-lease
components embedded within lease agreements. Lease expense for operating lease payments is recognized on a straight-line basis, which consists of amortization ofright-of-use
Strategic Revenue-Share Purchase Consideration
On September 20, 2021, the Company entered into certain Agreements of Purchase and Sale (the “Strategic Revenue-Share Purchase”), whereby certain fund investors relinquished their rights to receive management fee shares with respect to certain existing and future GP Capital Solutions products. In exchange for the foregoing, the Company issued 29,701,013 Class A Shares with a fair value of $455.0 million and paid cash of $50.2 million (net of previously accrued management fee shares payable and other receivable) to such fund investors.
The Company determined that it was not receiving a distinct good or service from the customers as a result of the Strategic Revenue-Share Purchase, and therefore determined that the consideration paid to the customers represents a reduction of the transaction price (i.e., a reduction to revenue). Accordingly, the total consideration paid was recorded within Strategic Revenue-Share Purchase consideration in the Company’s consolidated statements of financial condition and is being amortized as a reduction of management fees, net in the Company’s consolidated statements of operations. See Note 6 for additional information.
Intangible Assets, Net and Goodwill
The Company recognized certain finite-lived intangible assets and goodwill as a result of the Acquisitions. The Company’s finite-lived intangible assets consist of contractual rights to earn future management fees from the acquired investment management agreements and value associated with the acquired client relationships and trademarks. Finite-lived intangible assets are amortized on a straight-line basis over their estimated useful lives.
The Company uses its best estimates and assumptions to accurately assign fair value to identifiable intangible assets acquired at the acquisition date as well as the useful lives of those acquired intangible assets. Examples of critical estimates in valuing certain of the intangible assets acquired include, but are not limited to, future expected cash inflows and outflows, expected useful life and discount rates. The Company’s estimates for future cash flows are based on historical data, various internal estimates and certain external sources, and are based on assumptions that are consistent with the plans and estimates the Company uses to manage the underlying assets acquired. The Company estimates the useful lives of the
F-18
Blue Owl Capital Inc.
(Prior to May 19, 2021, Owl Rock)
Notes to Consolidated and Combined Financial Statements
intangible assets based on the expected period over which the Company anticipates generating economic benefit from the asset. The Company bases its estimates on assumptions it believes to be reasonable but that are unpredictable and inherently uncertain. Unanticipated events and circumstances may occur that could affect the accuracy or validity of such assumptions, estimates or actual results.
The Company tests finite-lived intangible assets for impairment if certain events occur or circumstances change indicating that the carrying amount of the intangible asset may not be recoverable. The Company evaluates impairment by comparing the estimated fair value attributable to the intangible asset with its carrying amount. If an impairment exists, the Company adjusts the carrying value to equal the fair value by taking a charge through earnings. NaN impairments have been recognized
to-date
on the Company’s acquired intangible assets.Goodwill represents the excess of consideration over identifiable net assets of an acquired business. The Company tests goodwill annually for impairment. If, after assessing qualitative factors, the Company believes that it is
more-likely-than-not
that the fair value of the reporting unit inclusive of goodwill is less than its carrying amount, the Company will perform a quantitative assessment to determine whether an impairment exists. If an impairment exists, the Company adjusts the carrying value of goodwill so that the carrying value of the reporting unit is equal to its fair value by taking a charge through earnings. The Company also tests goodwill for impairment in other periods if an event occurs or circumstances change such that it ismore-likely-than-not
to reduce the fair value of the reporting unit below its carrying amount. NaN impairments have been recognizedto-date
on the Company’s goodwill. See Note 3 for additional information.Fixed Assets
Fixed assets are recorded at cost, less accumulated depreciation and amortization, and are included within other assets, net in the Company’s consolidated and combined statements of financial condition. Fixed assets are depreciated or amortized on a straight-line basis, with the corresponding depreciation and amortization expense included within general, administrative and other expenses in the Company’s consolidated and combined statements of operations. The estimated useful life for leasehold improvements is the lesser of the remaining lease term and the life of the asset, while other fixed assets are generally depreciated over a period of three to seven years. Fixed assets are reviewed for impairment whenever events or changes in circumstances indicate that the carrying amount of an asset may not be recoverable.
Debt Obligations, Net
The Company’s debt obligations, other than revolving credit facilities, are recorded at amortized cost, net of any debt issuance costs, discounts and premiums. Debt issuance costs are deferred and along with discounts and premiums are amortized to interest expense in the consolidated and combined statements of operations over the life of the related debt instrument using the effective interest method. Unamortized debt issuance costs, discounts and premiums are written off to net losses on retirement of debt in the consolidated and combined statements of operations when the Company prepays borrowings prior to maturity. The Company defers debt issuance costs associated with revolving credit facilities and presents them within other assets, net in the consolidated and combined statements of financial condition, and such amounts are amortized to interest expense in the consolidated and combined statements of operations on a straight-line basis over the life of the related facility.
F-19
Blue Owl Capital Inc.
(Prior to May 19, 2021, Owl Rock)
Notes to Consolidated and Combined Financial Statements
TRA Liability
The tax receivable agreement (“TRA”) liability represents amounts payable to certain
pre-Business
Combination equity holders of Owl Rock and Dyal Capital. The portion of the TRA liability related to the Dyal Acquisition is deemed contingent consideration payable to the previous owners of Dyal Capital, and therefore is carried at fair value, with changes in fair value reported within other loss in the consolidated and combined statements of operations. The remaining portion of the TRA is carried at a value equal to the expected future payments due under the TRA. The Company recorded its initial estimate of future payments under the TRA portion that was not related to the Dyal Acquisition as a decrease to additionalpaid-in
capital in the consolidated and combined statements of financial condition. Subsequent adjustments to the liability for future payments under the tax receivable agreement related to changes in estimated future tax rates or state income tax apportionment are recognized through current period earnings in the consolidated and combined statements of operations. See Note 11 for additional information.Warrant Liability
The Company’s warrants are recorded as liabilities carried at fair value, with changes in fair value included within other loss in the Company’s consolidated and combined statements of operations.
The Private Placement Warrants contain exercise and settlement features that may change with a change in the holder, which precludes the Private Placement Warrants from being considered indexed to the Company’s own stock, and therefore the Private Placement Warrants are precluded from being classified within equity and are accounted for as derivative liabilities.
The Public Warrants include a provision that, in the event of a tender offer or exchange offer made to and accepted by holders of more than 50% of the outstanding Class A Shares, all holders of the warrants would be entitled to receive cash for their warrants. Such an event would not constitute a change in control because the Class A Shares do not represent a majority of the Registrant’s voting shares. Accordingly, the Public Warrants are also precluded from being classified within equity and are accounted for as derivative liabilities. This provision also applies to the Private Placement Warrants.
Earnout Liability
Earnout liability is comprised of the Oak Street Cash Earnout (as defined in Note 3) and prior to the Class E Triggering Events, included the Earnout Securities.
The Oak Street Cash Earnout represents contingent consideration on the Oak Street Acquisition and is recorded at fair value until the contingency has been resolved, with changes in fair value included within change in earnout liability in the Company’s consolidated and combined statements of operations.
Earnout Securities issued in connection with the Dyal Acquisition to the former owners of Dyal Capital who are not part of the continuing management team were treated as contingent consideration and not considered indexed to the Company’s equity. Similarly, Earnout Securities issued to certain former owners of Owl Rock were not considered indexed to the Company’s equity. These Earnout Securities were accounted for as liabilities carried at fair value, with changes in fair value included within change in earnout liability in the Company’s consolidated and combined statements of operations. Earnout Securities issued to certain employees in connection with the Business Combination were treated as compensation for post-combination employment services and accounted for as equity-based compensation. As a result of the Class E Triggering Events, the Earnout Securities were settled in 2021.
F-20
Blue Owl Capital Inc.
(Prior to May 19, 2021, Owl Rock)
Notes to Consolidated and Combined Financial Statements
Once recognized, earnout liabilities are not derecognized until the contingencies are resolved and the consideration is paid or becomes payable. Earnout liabilities may expire and upon expiration, the consideration would not be paid or payable.
Noncontrolling Interests
Noncontrolling interests are primarily comprised of Common Units, which are interests in the Blue Owl Operating Group not held by the Company. Noncontrolling interest also included Seller Earnout Units not held by the Company until such interests were settled upon the satisfaction of the Class E Triggering Events.
Allocations to noncontrolling interests in the consolidated and combined statements of operations are based on the substantive profit-sharing arrangements in the operating agreements of the Blue Owl Operating Partnerships. The Company does not record income or loss allocations to noncontrolling interests to the extent that such allocations would be provisional in nature, such as for unvested Incentive Units and Seller Earnout Units (other than certain minimum tax distributions). Provisional allocations to these interests would be subject to reversal in the event the unvested Incentive Units are forfeited or if the Seller Earnout Units would not have achieved their Class E Triggering Events.
Certain consolidated holding companies for investment advisor subsidiaries of the Blue Owl Operating Group are partially owned by third-party investors. Such interests are also presented as noncontrolling interests.
Revenue Recognition
Revenues consist of management fees; administrative, transaction and other fees; and realized performance income. The Company recognizes revenues when such amounts are probable that a significant reversal would not occur. The Company recognizes revenue at the time of transfer of promised goods or services to customers in an amount that reflects the consideration to which the Company expects to be entitled in exchange for those goods or services (i.e., the transaction price). Under this method, revenue is based on a contract with a determinable transaction price and distinct performance obligations with probable collectability. Revenues cannot be recognized until the performance obligations are satisfied and control is transferred to the customer.
Management Fees, Net
Management fees are recognized over the period in which the investment management services are performed because customers simultaneously consume and receive benefits continuously over time. Payment terms and fee rates of management fees vary by product but are generally collected on a quarterly basis and are not subject to clawback.
Management fees for the Company’s business development company (“BDC”) products are typically based on a percentage of average fair value of gross assets excluding cash. For certain BDCs, the management fee base may also include uncalled capital commitments. For the Company’s other Direct Lending products, management fees are typically based on gross or net asset value or investment cost, and also may include uncalled capital.
Management fees also include a fee based on the net investment income of the Company’s BDCs and similarly structured products (“Part I Fees”), which are subject to performance hurdles. Such Part I Fees are classified as management fees in the consolidated and combined statements of operations as they are predictable and recurring in nature, not subject to repayment and cash-settled each quarter.
F-21
Blue Owl Capital Inc.
(Prior to May 19, 2021, Owl Rock)
Notes to Consolidated and Combined Financial Statements
Management fees for the Company’s GP minority equity investments strategy are generally based on a percentage of capital committed during the investment period, and thereafter generally based on the cost of unrealized investments. For the other GP Capital Solutions strategies, management fees are generally determined based on a percentage of investment cost.
Because management fees, including Part I Fees, are generally cash settled every quarter, the uncertainty underlying these fees are resolved each quarter. As such, on a quarterly basis, a subsequent significant reversal in relation to the cumulative revenue recognized is not probable for the quarter in arrears.
As discussed above, amortization of the Strategic Revenue-Share Purchase consideration is recorded as a reduction of management fees, net in the Company’s consolidated and combined statements of operations.
Administrative, Transaction and Other Fees
Administrative, transaction and other fees primarily include fee income, administrative fees and dealer manager revenue.
Fee income is earned for services provided to portfolio companies, which may include arrangement, syndication, origination, structuring analysis, capital structure and business plan advice and other services. The fees are generally recognized as income at the point in time when the services rendered are completed, as there is no ongoing performance requirement.
Administrative fees represent expenses incurred by certain professionals of the Company and reimbursed by products managed by the Company. The Company may incur certain costs in connection with satisfying its performance obligations under administrative agreements – including, but not limited to, employee compensation and travel costs – for which it receives reimbursements from the products it manages. The Company reports these expenses within compensation and benefits and general, administrative and other expenses and reports the related reimbursements as revenues within administrative, transaction and other fees (i.e., on a gross basis) in the consolidated and combined statements of operations.
Dealer manager revenue consists of commissions earned for providing distribution services to certain products. Dealer manager revenue is recorded on an accrual basis at the point in time when the services are completed, as there is no ongoing performance requirement.
Realized Performance Income
The Company is entitled to receive certain realized performance income in the form of realized performance income and carried interest from the products that it manages. Realized performance income is based on the investment performance generated over time, subject to the achievement of minimum return levels in certain products. Realized performance income from the Company’s BDCs and certain products within the GP debt financing strategy (“Part II Fees”) are realized at the end of a measurement period, typically quarterly or annually. Once realized, such realized performance income is no longer subject to reversal.
For certain
non-BDC
Direct Lending products and substantially all of the GP Capital Solutions products, realized performance income is in the form of carried interest that is allocated to the Company based on cumulative fund performance over time, subject to the achievement of minimum return levels in certain products. The Company recognizes carried interest only to the extent that it is not probable that a significant reversal will occur for amounts recognized. Generally carried interest is earned after a return of all contributions and may be subject to a preferred return to investors; however, the Company is able toF-22
Blue Owl Capital Inc.
(Prior to May 19, 2021, Owl Rock)
Notes to Consolidated and Combined Financial Statements
catch-up amounts subject to the preferred return in certain cases. Substantially all of the carried interest generated by the Company’s products is allocable to investors, including certain related parties, in vehicles in which the Company does not have a controlling financial interest, and therefore is not included in the Company’s consolidated and combined financial statements.
Compensation and Benefits
Cash-Based Compensation
Compensation and benefits consist of salaries, bonuses, commissions, long-term deferral programs, benefits and payroll taxes. Compensation is accrued over the related service period.
Equity-Based Compensation
Equity-based compensation awards are reviewed to determine whether such awards are equity-classified or liability-classified. Compensation expense related to equity-classified awards is equal to their grant-date fair value and generally recognized on a straight-line basis over the awards’ requisite service period. When certain settlement features require an award to be liability-classified, compensation expense is recognized over the service period, and such amount is adjusted at each balance sheet date through the settlement date to the then current fair value of such award.
The Company accounts for forfeitures on equity-based compensation arrangements as they occur. The Company recognizes deferred income tax benefits throughout the service period, based on the grant date fair value. Any tax deduction shortfall or windfall due to the difference between grant date fair value and the ultimate deduction taken for tax purposes is recognized at the time of vesting. Expenses related to equity-based grants to employees are included within compensation and benefits, while amounts related to grants to
non-employees
are within general, administrative and other expenses in the consolidated and combined statements of operations.See Note 8 for additional information on the Company’s equity-based compensation plans.
Foreign Currency
The functional currency of the Company’s foreign consolidated subsidiaries is the U.S. dollar, as their operations are considered extensions of U.S. parent operations. Monetary assets and liabilities denominated in foreign currencies are remeasured into U.S. dollars at the closing rates of exchange on the balance sheet date.
Non-monetary
assets and liabilities denominated in foreign currencies are remeasured into U.S. dollars using the historical exchange rate. The profit or loss arising from foreign currency transactions are remeasured using the rate in effect on the date of any relevant transaction. Gains and losses on transactions denominated in foreign currencies due to changes in exchange rates are recorded within general, administrative and other expenses.Income Taxes
Prior to the Business Combination, the Company’s earnings were subject to New York City unincorporated business tax (“UBT”), as well as certain U.S. federal and foreign taxes. Subsequent to the Business Combination, substantially all of the earnings of the Blue Owl Operating Group remain subject to New York City UBT and additionally, the portion of earnings allocable to the Registrant is subject to corporate tax rates at the U.S. federal and state and local levels. Therefore, the amount of income taxes recorded prior to the Business Combination is not representative of the expenses expected in the future.
F-23
Blue Owl Capital Inc.
(Prior to May 19, 2021, Owl Rock)
Notes to Consolidated and Combined Financial Statements
Deferred income tax assets and liabilities resulting from temporary differences between the GAAP and tax bases of assets and liabilities are measured at the balance sheet date using enacted income tax rates expected to apply to taxable income in the years the temporary differences are expected to reverse. The Company offsets deferred income tax assets and liabilities for presentation in its consolidated and combined statements of financial condition when such assets and liabilities are within the same taxpayer and related to the same taxing jurisdiction.
The realization of deferred tax assets depends upon the existence of sufficient taxable income within the carryback or carryforward periods under the enacted tax law in the applicable tax jurisdiction. A valuation allowance is established when management determines, based on available information, that it is
more-likely-than-not
that deferred income tax assets will not be realized. Significant judgment is required in determining whether a valuation allowance should be established, as well as the amount of such valuation allowance.The Company recognizes uncertain income tax positions when it is not
more-likely-than-not
a tax position will be sustained upon examination. If the Company were to recognize an uncertain tax position, the Company would accrue interest and penalties related to uncertain tax positions as a component of the income tax provision in the consolidated and combined statements of operations.New Accounting Pronouncements
The Company considers the applicability and impact of all ASUs issued by the FASB. None of the ASUs that have been issued but not yet adopted are expected to have a material impact on the Company’s consolidated and combined financial statements.
F-24
Blue Owl Capital Inc.
(Prior to May 19, 2021, Owl Rock)
Notes to Consolidated and Combined Financial Statements
3. | ACQUISITIONS AND INTANGIBLE ASSETS, NET |
Dyal Acquisition
The following table presents the consideration and net identifiable assets acquired and goodwill related to the Dyal Acquisition:
(dollars in thousands) | ||||
Consideration | ||||
Equity consideration (1) | $ | 4,285,359 | ||
Cash consideration (2) | 973,457 | |||
Tax receivable agreement (3) | 101,645 | |||
Earnout Securities (3) | 246,788 | |||
Total Consideration | $ | 5,607,249 | ||
Net Identifiable Assets Acquired and Goodwill | ||||
Assets acquired: | ||||
Due from related parties | $ | 13,442 | ||
Intangible assets: | ||||
Investment management agreements | 1,859,900 | |||
Investor relationships | 291,400 | |||
Trademarks | 66,700 | |||
Total intangible assets | 2,218,000 | |||
Deferred tax asset | 29,770 | |||
Other assets, net | 2,096 | |||
Total assets acquired | 2,263,308 | |||
Liabilities assumed: | ||||
Accrued compensation | 7,376 | |||
Deferred tax liability | 170,753 | |||
Accounts payable, accrued expenses and other liabilities | 41,352 | |||
Total liabilities assumed | 219,481 | |||
Net Identifiable Assets Acquired | $ | 2,043,827 | ||
Goodwill (4) | $ | 3,563,422 | ||
| (1) | Represents share consideration issued to the Dyal Capital selling shareholders based on the fair value of the acquired business, reflecting a discount for lack of control. |
| (2) | Includes cash consideration paid to reimburse seller for certain pre-acquisition expenses. |
| (3) | The TRA and Earnout Securities represent contingent consideration. See Note 9 for additional information on the valuation of these instruments. |
| (4) | Goodwill represents the amount of total consideration in excess of net identifiable assets acquired. NaN of the goodwill recognized is expected to be deductible by the Blue Owl Operating Partnerships for tax purposes. |
During the third quarter of 2021, goodwill was adjusted due to a corresponding change in the investor relationship intangible assets. The acquired investment management agreements, investor relationships and trademarks had a weighted-average amortization period from the date of acquisition of 14.3 years, 10.0 years and
7.0
years, respectively.F-25
Blue Owl Capital Inc.
(Prior to May 19, 2021, Owl Rock)
Notes to Consolidated and Combined Financial Statements
In addition, the Company granted Common Units and Earnout Securities that were treated as equity-based compensation, rather than additional consideration on the acquisition, in connection with the Business Combination. See Note 8 for additional information on these grants.
Dyal Capital’s results are included in the Company’s consolidated results starting from the Closing Date. For the year ended December 31, 2021, the Company’s consolidated results included $252.9 million of GAAP revenues related to the acquired business. Given the Company operates through 1 operating and reportable segment, the impact of the Dyal Acquisition to GAAP consolidated net income is not tracked on a standalone basis. We incurred $166.7 million of acquisition-related costs, of which $40.4 million was expensed and included in general, administrative and other expenses in the Company’s consolidated and combined statements of operations and the remaining $126.3 million was eligible to be netted against consideration.
Oak Street Acquisition
The following table presents the consideration and net identifiable assets acquired and goodwill related to the Oak Street Acquisition:
(dollars in thousands) | ||||
Consideration | ||||
Equity consideration (1) | $ | 329,767 | ||
Cash consideration (2) | 609,820 | |||
Earnout consideration (3) | 143,800 | |||
Total Consideration | $ | 1,083,387 | ||
Net Identifiable Assets Acquired and Goodwill | ||||
Assets acquired: | ||||
Cash and cash equivalents | $ | 4,411 | ||
Due from related parties | 13,060 | |||
Operating lease assets | 1,001 | |||
Intangible assets: | ||||
Investment management agreements | 323,300 | |||
Investor relationships | 157,400 | |||
Trademarks | 26,600 | |||
Total intangible assets | 507,300 | |||
Other assets, net | 198 | |||
Total assets acquired | 525,970 | |||
Liabilities assumed: | ||||
Operating lease liabilities | 1,001 | |||
Deferred tax liabilities | 8,587 | |||
Accounts payable, accrued expenses and other liabilities | 1,818 | |||
Total liabilities assumed | 11,406 | |||
Net Identifiable Assets Acquired | $ | 514,564 | ||
Goodwill (4) | $ | 568,823 | ||
| (1) | Represents Common Units issued to Oak Street selling shareholders, reflecting a discount for lack of marketability. |
F-26
Blue Owl Capital Inc.
(Prior to May 19, 2021, Owl Rock)
Notes to Consolidated and Combined Financial Statements
| (2) | Includes cash consideration paid to reimburse seller for certain pre-acquisition expenses. |
| (3) | Represent the fair value of contingent cash consideration payable to certain sellers upon the occurrence of certain Oak Street Triggering Events as defined below. The amount presented does not include contingent cash and equity payments subject to the same Oak Street Triggering Events that were deemed to be compensation, rather than consideration, as further discussed below. See Note 9 for additional information on the valuation of this liability. |
| (4) | Goodwill represents the amount of total consideration in excess of net identifiable assets acquired. Approximately $540.0 million of the goodwill and intangible assets recognized are expected to be deductible by the Blue Owl Operating Partnerships for tax purposes. |
The acquired investment management agreements, investor relationships and trademarks had a weighted-average amortization period from the date of acquisition of 11.6 years, 13.0 years and 7.0 years, respectively.
For the year ended December 31, 2021, Oak Street’s results were not material to the Company’s consolidated results, as the transaction closed on December 29, 2021. We incurred $5.8 million of acquisition-related costs, which amount was included in general, administrative and other expenses in the Company’s consolidated and combined statements of operations.
Oak Street Earnouts
The table below summarizes the Oak Street Earnouts and their respective Oak Street Triggering Events. The Oak Street Triggering Events are subject to meeting a minimum level of quarterly management fees from Oak Street products, and the triggering event for the second tranche may not occur in the same quarter as the first tranche. Oak Street Cash Earnout payable to a
non-employee
seller has been classified as contingent consideration on the Oak Street Acquisition, whereas Oak Street Earnouts payable to sellers that are subject to ongoing employment arrangements with the Company have been classified as compensation and are being amortized over the service period. See Note 8 for additional information on the compensation-classified Oak Street Earnout Units.(dollars in thousands) Oak Street Earnouts | ||||||||||||||||
Quarterly Management Fee Trigger | Earliest Date Trigger May Occur | Cash | Units | |||||||||||||
Contingent consideration: | ||||||||||||||||
First Oak Street Earnout | $ | 22 million | January 1, 2023 | $ | 81,250 | 0 | ||||||||||
Second Oak Street Earnout | $ | 28 million | January 1, 2024 | 82,875 | 0 | |||||||||||
Compensation: | ||||||||||||||||
First Oak Street Earnout | $ | 22 million | January 1, 2023 | 43,484 | 13,037,165 | |||||||||||
Second Oak Street Earnout | $ | 28 million | January 1, 2024 | 48,358 | 13,037,165 | |||||||||||
Total | $ | 255,967 | 26,074,330 | |||||||||||||
Pro Forma Financial Information
Unaudited pro forma revenues were $997.4 million and $591.2 million for the years ended December 31, 2021 and 2020, respectively. Unaudited pro forma net income (loss) allocated to Class A Shareholders was $(157.0) million and $(26.0) million for the years ended December 31, 2021 and 2020, respectively. This pro forma financial information was computed by combining the historical financial information of the predecessor Owl Rock and acquired Dyal Capital and Oak Street businesses as though the acquisitions were consummated on January 1, 2020, assuming a consistent ownership structure, effective
F-27
Blue Owl Capital Inc.
(Prior to May 19, 2021, Owl Rock)
Notes to Consolidated and Combined Financial Statements
tax rate and amortization of the fair value of acquired assets as of each acquisition date. The pro forma information does not reflect the potential benefits of cost and funding synergies, opportunities to earn additional revenues, or other factors, and therefore does not represent what the actual revenues and net income would have been had the businesses actually been combined as of January 1, 2020.
Repurchase of Noncontrolling Interests
In November 2021, the Company repurchased the noncontrolling interests outstanding for a consolidated holding company of one of its investment advisors. Total cash consideration of $297.1 million was paid using cash on hand. The excess of cash consideration over the book value acquired was recorded as an adjustment to the Company’s additional
paid-in
capital in the consolidated and combined statement of shareholders’ equity.Intangible Assets, Net
The following table summarizes the Company’s intangible assets, net:
(dollars in thousands) | December 31, 2021 | Useful Life (in years) | Remaining Weighted-Average Amortization Period as of December 31, 2021 | |||||||||||||
Investment management agreements | $ | 2,183,200 | 1.0 - | 20.0 | 13.4 years | |||||||||||
Investor relationships | 448,800 | 10.0 - | 13.0 | 10.7 years | ||||||||||||
Trademarks | 93,300 | 7.0 - | 7.0 | 6.6 years | ||||||||||||
Total Intangible Assets | 2,725,300 | |||||||||||||||
Less: accumulated amortization | (113,889 | ) | ||||||||||||||
Total Intangible Assets, Net | $ | 2,611,411 | ||||||||||||||
As of December 31, 2021, future amortization of finite-lived intangible assets is estimated to be:
(dollars in thousands) | ||||
Period | Amortization | |||
2022 | $ | 247,593 | ||
2023 | 227,296 | |||
2024 | 227,919 | |||
2025 | 224,946 | |||
2026 | 213,389 | |||
Thereafter | 1,470,268 | |||
Total | $ | 2,611,411 | ||
F-28
Blue Owl Capital Inc.
(Prior to May 19, 2021, Owl Rock)
Notes to Consolidated and Combined Financial Statements
4. | DEBT OBLIGATIONS, NET |
The table below summarizes outstanding debt obligations of the Company:
December 31, 2021 | ||||||||||||||||||||||||
(dollars in thousands) | Maturity Date | Aggregate Facility Size | Outstanding Debt | Amount Available | Net Carrying Value | Average Interest Rate | ||||||||||||||||||
2031 Notes | 6/10/2031 | $ | 700,000 | $ | 700,000 | $ | 0 | $ | 684,154 | 3.13 | % | |||||||||||||
2051 Notes | 10/7/2051 | 350,000 | 350,000 | 0 | 337,013 | 4.13 | % | |||||||||||||||||
Revolving Credit Facility | 12/7/2024 | 640,000 | 153,000 | 487,000 | 153,000 | 1.86 | % | |||||||||||||||||
Total | $ | 1,690,000 | $ | 1,203,000 | $ | 487,000 | $ | 1,174,167 | ||||||||||||||||
December 31, 2020 | ||||||||||||||||||||||||
Maturity Date | Aggregate Facility Size | Outstanding Debt | Amount Available | Net Carrying Value | Average Interest Rate | |||||||||||||||||||
Prior Revolving Credit Facility #1 | 2/28/2022 | $ | 105,000 | $ | 92,895 | $ | 10,377 | $ | 92,522 | 4.35 | % | |||||||||||||
Prior Revolving Credit Facility #2 | 8/20/2021 | 22,000 | 17,365 | 4,635 | 17,303 | 4.40 | % | |||||||||||||||||
Term Loan | 10/25/2029 | 250,000 | 250,000 | 0 | 246,561 | 7.86 | % | |||||||||||||||||
Total | $ | 377,000 | $ | 360,260 | $ | 15,012 | $ | 356,386 | ||||||||||||||||
Amounts available for the Company’s revolving credit facilities as presented in the tables above are reduced by outstanding letters of credit related to certain leases. Average interest rates exclude the impact of deferred financing costs and undrawn commitment fees.
2031 Notes
On June 10, 2021, the Company, through its indirect subsidiary, Blue Owl Finance LLC, issued $700.0 million aggregate principal amount of 3.125% Senior Notes due 2031 (the “2031 Notes”). The 2031 Notes bear interest at a rate of 3.125% per annum and mature on June 10, 2031. Interest on the 2031 Notes is payable semi-annually in arrears on June 10 and December 10 of each year.
The 2031 Notes are fully and unconditionally guaranteed, jointly and severally, by the Blue Owl Operating Partnerships and certain of their respective subsidiaries. The guarantees are unsecured and unsubordinated obligations of the guarantors. All or a portion of the 2031 Notes may be redeemed at the Company’s option in whole, at any time, or in part, from time to time, prior to their stated maturity, subject to a make-whole redemption price; provided, however, that if the Company redeems any amounts on or after March 10, 2031, the redemption price for the 2031 Notes will be equal to 100% of the principal amount of the amounts redeemed, in each case, plus any accrued and unpaid interest. If a change of control repurchase event occurs, the 2031 Notes are subject to repurchase by the Company at a repurchase price in cash equal to 101% of the aggregate principal amount repurchased plus any accrued and unpaid interest. The 2031 Notes also provide for customary events of default and acceleration.
2051 Notes
On October 7, 2021, the Company, through its indirect subsidiary, Blue Owl Finance LLC, issued $350.0 million aggregate principal amount of 4.125% Senior Notes due 2051 (the “2051 Notes”). The 2051
F-29
Blue Owl Capital Inc.
(Prior to May 19, 2021, Owl Rock)
Notes to Consolidated and Combined Financial Statements
Notes bear interest at a rate of 4.125% per annum and mature on October 7, 2051. Interest on the 2051 Notes is payable semi-annually in arrears on April 7 and October 7 of each year, commencing April 7, 2022.
The 2051 Notes are fully and unconditionally guaranteed, jointly and severally, by the Blue Owl Operating Partnerships and certain of their subsidiaries. The guarantees are unsecured and unsubordinated obligations of the guarantors. All or a portion of the 2051 Notes may be redeemed at the Company’s option in whole, at any time, or in part, from time to time, prior to their stated maturity, subject to a make-whole redemption price; provided, however, that if the Company redeems any amounts on or after April 7, 2051, the redemption price for the 2051 Notes will be equal to 100% of the principal amount of the amounts redeemed, in each case, plus any accrued and unpaid interest. If a change of control repurchase event occurs, the 2051 Notes are subject to repurchase by the Company at a repurchase price in cash equal to 101% of the aggregate principal amount repurchased plus any accrued and unpaid interest. The 2051 Notes also provide for customary events of default and acceleration. The 2031 Notes and the 2051 Notes are collectively referred to as the “Notes.”
Revolving Credit Facility
On December 7, 2021, the Company entered into a new credit facility (“Revolving Credit Facility”), which was supplemented on December 23, 2021, and provides the Company with up to $640.0 million of borrowing capacity and replaced the Company’s previously existing revolving credit facility. The Revolving Credit Facility matures on December 7, 2024. In February 2022, the Company increased the capacity of its Revolving Credit Facility to $715.0 million. Borrowings under the Revolving Credit Facility may only be used to finance working capital needs and general corporate purposes.
Borrowings under the Revolving Credit Facility bear interest at a rate per annum of (a) adjusted-term secured overnight financing rate (“SOFR”) plus a margin of 1.25% to 1.875%, or (b) the greater of (i) prime rate, (ii) New York Fed Bank Rate plus 0.50% and (iii) adjusted-term SOFR plus 1%, plus a margin of 0.25% to 0.875%. The Company is subject to an undrawn commitment fee rate of 0.15% to 0.40% of the daily amount of available revolving commitment. The Revolving Credit Facility contains customary events of defaults, as well as a financial covenant generally providing for a maximum net leverage ratio of 3.5 to 1. The net leverage ratio is generally calculated as the ratio of total consolidated debt less unrestricted cash and cash equivalents (up to $300.0 million) to the trailing
12-month
consolidated EBITDA (each as defined in the agreement).Prior Revolving Credit Facilities
All prior revolving credit facilities were repaid and terminated prior to December 31, 2021. The Company recognized net losses on early retirement of debt in the amount of $1.5 million during the year ended December 31, 2021, as a result of the
write-off
of deferred financing costs related to previously existing revolving credit facilities.Term Loan
In June 2021, the Company prepaid the $250.0 million term loan agreement (the “Term Loan”) owed to a product managed by the Company with proceeds from the 2031 Notes. This prepayment resulted in a net loss on the retirement of debt of $15.8 million, which was inclusive of call protection premium and
write-off
of deferred financing costs.F-30
Blue Owl Capital Inc.
(Prior to May 19, 2021, Owl Rock)
Notes to Consolidated and Combined Financial Statements
5. | LEASES |
The Company primarily has
non-cancelable
operating leases for its headquarters in New York and various other offices. The operating lease for the Company’s headquarters does not include any renewal options.(dollars in thousands) Lease Cost | Year Ended December 31, 2021 | |||
Operating lease cost | $ | 7,930 | ||
Short term lease cost | 286 | |||
Net Lease Cost | $ | 8,216 | ||
Supplement Lease Cash Flow Information | Year Ended December 31, 2021 | |||
Cash paid for amounts included in the measurement of lease liabilities: | ||||
Operating cash flows for operating leases | $ | 5,956 | ||
Right-of-use | ||||
Operating leases | $ | 78,677 | ||
Lease Term and Discount Rate | December 31, 2021 | |||
Weighted-average remaining lease term: | ||||
Operating leases | 10.2 years | |||
Weighted-average discount rate: | ||||
Operating leases | 3.1 | % | ||
Future Maturity of Operating Lease Payments | Operating Leases | |||
2022 (1) | $ | 1,199 | ||
2023 | 12,672 | |||
2024 | 10,062 | |||
2025 | 9,964 | |||
2026 | 9,799 | |||
Thereafter | 61,957 | |||
Total Lease Payments | 105,653 | |||
Imputed interest | (17,173 | ) | ||
Total Lease Liabilities | $ | 88,480 | ||
| (1) | Presented net of $8.0 million of tenant improvement allowance and reflects the impact of a $4.8 million rent holiday period on certain leases. |
F-31
Blue Owl Capital Inc.
(Prior to May 19, 2021, Owl Rock)
Notes to Consolidated and Combined Financial Statements
6. | REVENUES |
The following table presents a disaggregated view of the Company’s revenues:
Year Ended December 31, | ||||||||||||
(dollars in thousands) | 2021 | 2020 | 2019 | |||||||||
Direct Lending Products | ||||||||||||
Diversified lending | $ | 348,363 | $ | 140,153 | $ | 87,268 | ||||||
Technology lending | 66,089 | 42,052 | 24,706 | |||||||||
First lien lending | 15,185 | 12,335 | 11,983 | |||||||||
Opportunistic lending | 3,993 | 366 | 0 | |||||||||
Management Fees, Net | 433,630 | 194,906 | 123,957 | |||||||||
Administrative, transaction and other fees | 131,461 | 54,909 | 66,893 | |||||||||
Realized performance income | 5,906 | 0 | 0 | |||||||||
Total GAAP Revenues—Direct Lending Products | 570,997 | 249,815 | 190,850 | |||||||||
GP Capital Solutions Products | ||||||||||||
GP minority equity investments | 233,505 | 0 | 0 | |||||||||
GP debt financing | 10,215 | 0 | 0 | |||||||||
Professional sports minority investments | 477 | 0 | 0 | |||||||||
Strategic Revenue-Share Purchase consideration amortization | (9,892 | ) | 0 | 0 | ||||||||
Management Fees, Net | 234,305 | 0 | 0 | |||||||||
Administrative, transaction and other fees | 18,576 | 0 | 0 | |||||||||
Total GAAP Revenues—GP Capital Solutions Products | 252,881 | 0 | 0 | |||||||||
Total GAAP Revenues | $ | 823,878 | $ | 249,815 | $ | 190,850 | ||||||
F-32
Blue Owl Capital Inc.
(Prior to May 19, 2021, Owl Rock)
Notes to Consolidated and Combined Financial Statements
The table below presents the beginning and ending balances of the Company’s management fees, realized performance income and administrative, transaction and other fees receivable and unearned management fees. Substantially all of the amounts receivable are collected during the following quarter. A liability for unearned management fees is generally recognized when management fees are paid to the Company in advance. The entire change in unearned management fees shown below relates to amounts recognized as revenues in the current year period. Management fees, realized performance income and administrative, transaction and other fees receivable are included within due from related parties and unearned management fees are included within accounts payable, accrued expenses and other liabilities in the Company’s consolidated and combined statements of financial condition.
Year Ended December 31, | ||||||||
(dollars in thousands) | 2021 | 2020 | ||||||
Management Fees Receivable | ||||||||
Beginning balance | $ | 78,586 | $ | 32,473 | ||||
Ending balance | $ | 168,057 | $ | 78,586 | ||||
Administrative, Transaction and Other Fees Receivable | ||||||||
Beginning balance | $ | 9,876 | $ | 8,667 | ||||
Ending balance | $ | 19,535 | $ | 9,876 | ||||
Realized Performance Income Receivable | ||||||||
Beginning balance | $ | 0 | $ | 0 | ||||
Ending balance | $ | 10,496 | $ | 0 | ||||
Unearned Management Fees | ||||||||
Beginning balance | $ | 11,846 | $ | 0 | ||||
Ending balance | $ | 10,299 | $ | 11,846 | ||||
The table below presents the changes in the Company’s Strategic Revenue-Share Purchase consideration. The consideration paid, which includes $455.0 million paid in Class A Shares and the remainder in cash, is being amortized as a reduction of management fees, net in the Company’s consolidated statements of operations over a weighted-average period of 12 years, which represents the average period over which the related customer revenues are expected to be recognized.
(dollars in thousands) | Strategic Revenue-Share Purchase Consideration | |||
December 31, 2020 | $ | 0 | ||
Consideration paid | 505,214 | |||
Amortization | (9,892 | ) | ||
December 31, 2021 | $ | 495,322 | ||
F-33
Blue Owl Capital Inc.
(Prior to May 19, 2021, Owl Rock)
Notes to Consolidated and Combined Financial Statements
7. | OTHER ASSETS, NET |
(dollars in thousands) | December 31, 2021 | December 31, 2020 | ||||||
Fixed assets, net: | ||||||||
Leasehold improvements | $ | 6,692 | $ | 2,133 | ||||
Furniture and fixtures | 1,631 | 1,612 | ||||||
Computer hardware and software | 1,968 | 1,286 | ||||||
Accumulated depreciation and amortization | (2,340 | ) | (1,675 | ) | ||||
Fixed assets, net | 7,951 | 3,356 | ||||||
Investments (includes $1,311 and $0 at fair value and $8,522 and $5 of investments in the Company’s products) | 12,143 | 2,678 | ||||||
Prepaid expenses | 8,496 | 874 | ||||||
Deferred transaction costs | 347 | 8,255 | ||||||
Other assets | 9,683 | 1,306 | ||||||
Total | $ | 38,620 | $ | 16,469 | ||||
8. | EQUITY-BASED COMPENSATION |
The Company grants equity-based compensation awards in the form of RSUs and Incentive Units to its management, employees and independent members of the Board under the 2021 Omnibus Equity Incentive Plan (“2021 Equity Incentive Plan”). The total number of Class A Shares and Blue Owl Operating Group Units, collectively, that may be issued under the 2021 Equity Incentive Plan is 101,230,522, of which 51,115,613 remain available as of December 31, 2021. To the extent that an award expires or is canceled, forfeited, terminated, surrendered, exchanged or withheld to cover tax withholding obligations, the unissued awards will again be available for grant under the 2021 Equity Incentive Plan.
In connection with the Business Combination, the Company granted Common Units and Seller Earnout Units, which grants were not made under the 2021 Equity Incentive Plan. A portion of these Common Units and Seller Earnout Units were granted to certain
pre-Business
Combination owners that are also ongoing members of management. As a result, these grants were accounted for as equity-based compensation and are included in the disclosures below.In connection with the Oak Street Acquisition, the Company has agreed to contingently issue 26,074,330 Common Units upon achieving the Oak Street Triggering Events described in Note 3. These Oak Street Earnout Units were granted to certain sellers that are subject to ongoing employment arrangements with the Company, and are therefore being accounted for as equity-based compensation grants subject to performance vesting conditions that are probable of occurring.
F-34
Blue Owl Capital Inc.
(Prior to May 19, 2021, Owl Rock)
Notes to Consolidated and Combined Financial Statements
The table below presents information regarding equity-based compensation expense included within compensation and benefits in the Company’s consolidated and combined statements of operations. As of December 31, 2021, no RSUs have been settled in cash or Class A Shares.
Year Ended December 31, | ||||||||||||
(dollars in thousands) | 2021 | 2020 | 2019 | |||||||||
Included within compensation and benefits: | ||||||||||||
Common Units | $ | 1,121,139 | $ | 0 | $ | 0 | ||||||
Seller Earnout Units | 63,031 | 0 | 0 | |||||||||
Oak Street Earnout Units | 0 | 0 | 0 | |||||||||
Incentive Units | 13,469 | 0 | 0 | |||||||||
RSUs | 6,480 | 0 | 0 | |||||||||
Included within general, administrative and other expenses | ||||||||||||
Incentive Units | 1,066 | 0 | 0 | |||||||||
RSUs | 151 | 0 | 0 | |||||||||
Equity-Based Compensation Expense | $ | 1,205,336 | $ | 0 | $ | 0 | ||||||
Corresponding tax benefit | $ | 123 | $ | 0 | $ | 0 | ||||||
The table below presents activity related to the Company’s unvested equity-based compensation awards for the year ended December 31, 2021.
Common Units | Seller Earnout Units | Oak Street Earnout Units | ||||||||||||||||||||||
Number of Units | Weighted-Average Grant Date Fair Value Per Unit | Number of Units | Weighted-Average Grant Date Fair Value Per Unit | Number of Units | Weighted-Average Grant Date Fair Value Per Unit | |||||||||||||||||||
December 31, 2020 | 0 | $ | 0 | 0 | $ | 0 | 0 | $ | 0 | |||||||||||||||
Granted | 132,808,673 | 9.00 | 11,608,004 | 5.43 | 26,074,330 | 12.53 | ||||||||||||||||||
Vested | (132,808,673 | ) | 9.00 | (11,608,004 | ) | 5.43 | 0 | 0 | ||||||||||||||||
Forfeited | 0 | 0 | 0 | 0 | 0 | 0 | ||||||||||||||||||
December 31, 2021 | 0 | $ | 0 | 0 | $ | 0 | 26,074,330 | $ | 12.53 | |||||||||||||||
Incentive Units | RSUs | |||||||||||||||
Number of Units | Weighted-Average Grant Date Fair Value Per Unit | Number of Units | Weighted-Average Grant Date Fair Value Per Unit | |||||||||||||
December 31, 2020 | 0 | $ | 0 | 0 | $ | 0 | ||||||||||
Granted | 23,294,373 | 13.87 | 12,022,943 | 13.92 | ||||||||||||
Modified from liability award | 0 | 0 | 9,050,000 | 10.00 | ||||||||||||
Vested | (163,528 | ) | 14.56 | (10,941,339 | ) | 10.75 | ||||||||||
Forfeited | (50,000 | ) | 14.02 | (13,500 | ) | 14.02 | ||||||||||
December 31, 2021 | 23,080,845 | 13.87 | 10,118,104 | $ | 13.84 | |||||||||||
Common Units
Prior to the Business Combination, certain members of Dyal Capital were entitled to receive rights to distributions of certain future profits (the “Profit Interest Units”) that were subject to certain forfeiture conditions. Immediately preceding the Business Combination, the forfeiture conditions of the Profit Interest
F-35
Blue Owl Capital Inc.
(Prior to May 19, 2021, Owl Rock)
Notes to Consolidated and Combined Financial Statements
Units were modified to eliminate any future service requirements and were replaced with Common Units on the Business Combination Date. The Company recognized a
one-time
non-cash
equity-based compensation expense of $1.1 billion related to the replacement award, which represents the fair value under GAAP of the replacement awards (excluding the portion attributable to the Profit Interest Units prior to the Business Combination, which was included as equity consideration in Note 3). The fair value of the Common Units replacement award was based on the Company’s Class A Share price on the transaction date with the application of a 10% discount for lack of marketability.Seller Earnout Units
The fair value of the Seller Earnout Units was determined using a Monte Carlo simulation valuation model, with the following assumptions: volatility of 22%, discount for lack of marketability of 12% and expected holding period of approximately 3 years. As a result of the Class E Triggering Events in 2021, the Company recognized all of the compensation expense related to the Seller Earnout Units and 0 unamortized expense remained as of December 31, 2021.
Oak Street Earnout Units
The fair value of the Oak Street Earnout Units was determined using a Monte Carlo simulation valuation model, with the following weighted average assumptions: annualized revenue volatility of 38%, revenue discount rate of 15%, discount for lack of marketability of 13% and expected holding period of approximately 2 years. As of December 31, 2021, unamortized expense related to the Oak Street Earnout Units was $326.6 million, with a weighted average amortization period of 2 years.
Incentive Units
During the fourth quarter of 2021, the Company granted Incentive Units in connection with the closing of the Business Combination, as well as other compensation-related grants. The Company also converted various previously existing deferred cash compensation awards, which resulted in the reclassification of $5.3 million of previously accrued compensation liability to equity on the conversion date. The remaining fair value of the replacement awards will be expensed over the remaining service period.
The grant date fair value of Incentive Units was determined using the Company’s Class A Share price on the grant date, adjusted for the lack of dividend participation during the vesting period, and the application of an 11% to 12% discount for lack of marketability on certain Incentive Units that are subject to a
one-year
post-vesting transfer restriction.As of December 31, 2021, unamortized expense related to Incentive Units was $303.9 million, with a weighted average amortization period of 4.6 years.
RSUs
RSUs Modified from Liability Award on Business Combination Date
On September 15, 2020, the Company issued an award that was based on the fair value of Owl Rock and that was fully vested upon issuance. The original terms of the award required cash settlement at a future date and was, therefore, classified as a liability that was remeasured to its settlement value at each reporting period. The Company recorded compensation expense and a corresponding liability of $90.5 million in 2020 related to the award. Prior to and contingent on the close of the Business Combination, the Company
F-36
Blue Owl Capital Inc.
(Prior to May 19, 2021, Owl Rock)
Notes to Consolidated and Combined Financial Statements
modified this award to be settled in 9,050,000 RSUs that were immediately vested but would be settled in Class A Shares in future years. The modification did not result in any incremental compensation expense, as the value immediately prior to modification was greater than the value immediately following the modification. Accordingly, the Company reclassified the existing liability to equity on the Business Combination Date.
Other RSU Grants
During the fourth quarter of 2021, the Company granted RSUs in connection with the closing of the Business Combination, as well as other compensation-related grants. The Company also converted various previously existing deferred cash compensation awards, which resulted in the reclassification of $56.8 million of previously accrued compensation liability to equity on the conversion date. The remaining fair value of the replacement awards will be expensed over the remaining service period.
The fair value of RSUs was determined using the Company’s Class A Share price on the grant date, adjusted for the lack of dividend participation during the vesting period, and the application of an 11% to 12% discount for lack of marketability on RSUs that are subject to a
one-year
post-vesting transfer restriction.As of December 31, 2021, unamortized expense related to RSUs was $104.1 million, with a weighted average amortization period of 3.7 years.
9. | FAIR VALUE DISCLOSURES |
Fair value represents the price that would be received upon the sale of an asset or paid to transfer a liability in an orderly transaction between market participants as of the measurement date (i.e., an exit price). The Company and the products it manages hold a variety of assets and liabilities, certain of which are not publicly traded or that are otherwise illiquid. Significant judgement and estimation go into the assumptions that drive the fair value of these assets and liabilities. The fair value of these assets and liabilities may be estimated using a combination of observed transaction prices, prices from third parties (including independent pricing services and relevant broker quotes), models or other valuation methodologies based on pricing inputs that are neither directly nor indirectly market observable. Due to the inherent uncertainty of valuations of assets and liabilities that are determined to be illiquid or do not have readily ascertainable fair values, the estimates of fair value may differ from the values ultimately realized, and those differences can be material.
GAAP prioritizes the level of market price observability used in measuring assets and liabilities at fair value. Market price observability is impacted by a number of factors, including the type of assets and liabilities and the specific characteristics of the financial assets and liabilities. Financial assets and liabilities with readily available, actively quoted prices or for which fair value can be measured from actively quoted prices generally will have a higher degree of market price observability and lesser degree of judgment used in measuring fair value.
Financial assets and liabilities measured at fair value are classified and disclosed into one of the following categories based on the observability of inputs used in the determination of fair values:
| • | Level I – Quoted prices that are available in active markets for identical financial assets or liabilities as of the reporting date. |
| • | Level II – Valuations obtained from independent third-party pricing services, the use of models or other valuation methodologies based on pricing inputs that are either directly or indirectly market |
F-37
Blue Owl Capital Inc.
(Prior to May 19, 2021, Owl Rock)
Notes to Consolidated and Combined Financial Statements
observable as of the measurement date. These financial assets and liabilities exhibit higher levels of liquid market observability as compared to Level III financial assets and liabilities. |
| • | Level III – Pricing inputs that are unobservable in the market and includes situations where there is little, if any, market activity for the financial asset or liability. The inputs into the determination of fair value of financial assets and liabilities in this category may require significant management judgment or estimation. The fair value of these financial assets and liabilities may be estimated using a combination of observed transaction prices, independent pricing services, models or other valuation methodologies based on pricing inputs that are neither directly nor indirectly market observable (e.g., cash flows, implied yields). |
In certain cases, the inputs used to measure fair value may fall into different levels of the fair value hierarchy. In such cases, a financial asset or liability’s level within the fair value hierarchy is based on the lowest level of input that is significant to the fair value measurement. The assessment of the significance of a particular input to the fair value measurement in its entirety requires judgment and considers factors specific to the financial asset or liability when the fair value is based on unobservable inputs.
Fair Value Measurements Categorized within the Fair Value Hierarchy
The table below summarizes the Company’s assets and liabilities measured at fair value on a recurring basis as of December 31, 2021. The Company did not have any assets or liabilities measured at fair value on a recurring basis as of December 31, 2020.
December 31, 2021 | ||||||||||||||||
(dollars in thousands) | Level I | Level II | Level III | Total | ||||||||||||
Investments, at Fair Value | ||||||||||||||||
Corporate bonds | $ | 0 | $ | 1,311 | $ | 0 | $ | 1,311 | ||||||||
Liabilities, at Fair Value | ||||||||||||||||
TRA liability | $ | 0 | $ | 0 | $ | 111,325 | $ | 111,325 | ||||||||
Warrant liability | 43,048 | 0 | 25,750 | 68,798 | ||||||||||||
Earnout liability | 0 | 0 | 143,800 | 143,800 | ||||||||||||
Total Liabilities, at Fair Value | $ | 43,048 | $ | 0 | $ | 280,875 | $ | 323,923 | ||||||||
F-38
Blue Owl Capital Inc.
(Prior to May 19, 2021, Owl Rock)
Notes to Consolidated and Combined Financial Statements
Reconciliation of Fair Value Measurements Categorized within Level III
Unrealized gains and losses on the Company’s liabilities carried at fair value on a recurring basis are included within other loss in the consolidated and combined statements of operations. There were no transfers in or out of Level III. The following table sets forth a summary of changes in the fair value of the Level III measurements for the year ended December 31, 2021:
(dollars in thousands) | Level III Liabilities | |||||||||||||||
TRA Liability | Warrant Liability | Earnout Liability | Total | |||||||||||||
Beginning balance | $ | 0 | $ | 0 | $ | 0 | $ | 0 | ||||||||
Issuances | 101,645 | 9,131 | 635,077 | 745,853 | ||||||||||||
Settlements | 0 | 0 | (1,325,532 | ) | (1,325,532 | ) | ||||||||||
Net losses | 9,680 | 16,619 | 834,255 | 860,554 | ||||||||||||
Ending Balance | $ | 111,325 | $ | 25,750 | $ | 143,800 | $ | 280,875 | ||||||||
Change in net unrealized losses on liabilities still recognized at the reporting date | $ | 9,680 | $ | 16,619 | $ | 0 | $ | 26,299 | ||||||||
The settlement of Earnout Securities and additional TRA resulting from the settlement of such liability are
non-cash
transactions, and as such have not been reflected in the consolidated and combined statements of cash flows.Valuation Methodologies for Fair Value Measurements Categorized within Levels II and III
Corporate Bonds
The fair value of corporate bonds are estimated based on quoted market prices, dealer quotations or alternative pricing sources supported by observable inputs. These investments are generally classified as Level II. The Company obtains prices from independent pricing services that generally utilize broker quotes and may use various other pricing techniques, which take into account appropriate factors such as yield, quality, coupon rate, maturity, type of issue, trading characteristics and other data.
TRA Liability
The TRA related to the Dyal Acquisition is considered contingent consideration and is measured at fair value based on discounted future cash flows. The remaining TRA liability on the Company’s consolidated and combined statements of financial condition is not measured at fair value.
Warrant Liability
The Company uses a Monte Carlo simulation model to value the Private Placement Warrants. The Company estimates the volatility of its Class A Shares based on the volatility implied by the Public Warrants. The risk-free interest rate is based on U.S. Treasuries for a maturity similar to the expected remaining life of the warrants. The expected term of the warrants is assumed to be equivalent to their remaining contractual term. The Public Warrants are traded on the NYSE and are stated at the last reported sales price without any valuation adjustments, and therefore are classified as Level I.
F-39
Blue Owl Capital Inc.
(Prior to May 19, 2021, Owl Rock)
Notes to Consolidated and Combined Financial Statements
Earnout Liability
The fair value of the earnout liability was comprised of the Earnout Securities, which were settled prior to December 31, 2021, and the Oak Street Cash Earnout that was deemed to be contingent consideration on the Oak Street Acquisition.
The fair value of the Earnout Securities was determined using a Monte Carlo simulation model. The Company estimated the volatility of its Class A Shares based on the volatility implied by a review of historical volatility for similar publicly traded companies over a horizon that matched the expected remaining life of the Earnout Securities at each measurement date and the risk-free interest rate was based on U.S. Treasuries for a maturity similar to the expected remaining life.
The fair value of the Oak Street Cash Earnout was determined using a Monte Carlo simulation model. The model incorporates management revenue forecast and makes the following adjustments: historical revenue volatility, risk free rate based on U.S. Treasuries for a maturity similar to the expected remaining life and a discount rate to adjust management’s revenue forecast from a risk-based forecast to a risk-neutral forecast.
Quantitative Inputs and Assumptions for Fair Value Measurements Categorized within Level III
The following table summarizes the quantitative inputs and assumptions used for the Company’s Level III measurements as of December 31, 2021:
(dollars in thousands) | Fair Value | Valuation Technique | Significant Unobservable Inputs | Input | Impact to Valuation from an Increase in Input | |||||||||||||||
TRA liability | $ | 111,325 | Discounted cash flow | Discount rate | 10 | % | Decrease | |||||||||||||
Warrant liability | 25,750 | Monte Carlo simulation | Volatility | 26 | % | Increase | ||||||||||||||
Earnout liability | 143,800 | Monte Carlo simulation | Revenue volatility | 38 | % | Increase | ||||||||||||||
| Discount rate | 15 | % | Decrease | |||||||||||||||||
Total Liabilities, at Fair Value | $ | 280,875 | ||||||||||||||||||
Fair Value of Other Financial Instruments
Management estimates that the carrying value of the Company’s other investments and debt obligations, which are not carried at fair value, approximated their fair values as of December 31, 2021. The fair value measurements for the Company’s other investments are categorized as Level III and its debt obligations are categorized as Level I within the fair value hierarchy.
10. | INCOME TAXES |
The Company’s income tax provision and related income tax assets and liabilities are based on, among other things, an estimate of the impact of the Business Combination and exchanges of Common Units for Class A Shares, inclusive of an analysis of tax basis and state tax implications of the Blue Owl Operating Group and their underlying assets and liabilities. The Company’s estimate is based on the most recent information available; however, the impact of the Business Combination cannot be finally determined until the Company’s 2021 tax returns have been filed. The tax basis and state impact of the Blue Owl Operating Group and their underlying assets and liabilities are based on estimates subject to finalization of the Company’s tax returns, and the impact of the Business Combination may differ, possibly materially, from the current estimates described herein.
F-40
Blue Owl Capital Inc.
(Prior to May 19, 2021, Owl Rock)
Notes to Consolidated and Combined Financial Statements
The Blue Owl Operating Partnerships, and prior to the Business Combination, Owl Rock, are partnerships for U.S. federal income tax purposes subject to New York City unincorporated business tax (“UBT”). Effective upon the consummation of the Business Combination, generally all of the income the Registrant earns will be subject to corporate-level income taxes in the United States. Further, the amount of income taxes recorded prior to the Business Combination are not representative of the expenses expected in the future. Substantially all of the Company’s income before tax is earned in the United States.
The following table presents the components of the Company’s income tax expense (benefit):
(dollars in thousands) | Year Ended December 31, | |||||||||||
2021 | 2020 | 2019 | ||||||||||
Current Income Tax Expense (Benefit) | ||||||||||||
U.S. federal | $ | 0 | $ | 0 | $ | 0 | ||||||
State and local | 716 | 359 | 81 | |||||||||
Foreign | 211 | 14 | 0 | |||||||||
| 927 | 373 | 81 | ||||||||||
Deferred Income Tax Expense (Benefit) | ||||||||||||
U.S. federal | (43,905 | ) | 0 | 0 | ||||||||
State and local | (22,232 | ) | (475 | ) | 159 | |||||||
Foreign | (1 | ) | 0 | 0 | ||||||||
| (66,138 | ) | (475 | ) | 159 | ||||||||
Total Income Tax Expense (Benefit) | ||||||||||||
U.S. federal | (43,905 | ) | 0 | 0 | ||||||||
State and local | (21,516 | ) | (116 | ) | 240 | |||||||
Foreign | 210 | 14 | 0 | |||||||||
$ | (65,211 | ) | $ | (102 | ) | $ | 240 | |||||
The following table sets forth the reconciliation of the Company’s effective rate to the statutory rate:
Year Ended December 31, | ||||||||||||
2021 | 2020 | 2019 | ||||||||||
Statutory rate (1) | 21.00 | % | 4.00 | % | 4.00 | % | ||||||
Income passed through to noncontrolling interest holders | -14.95 | % | 0 | % | 0 | % | ||||||
State and local income taxes | 0.98 | % | -3.73 | % | 0.10 | % | ||||||
Non-deductible compensation expense | -3.54 | % | -0.08 | % | -3.28 | % | ||||||
Other | 0 | % | -0.07 | % | 0.34 | % | ||||||
Total Effective Rate | 3.49 | % | 0.12 | % | 1.16 | % | ||||||
| (1) | The statutory rate presented is using the U.S. federal corporate tax rate for the year ended December 31, 2021, and the UBT rate for the years ended December 31, 2020 and 2019. |
F-41
Blue Owl Capital Inc.
(Prior to May 19, 2021, Owl Rock)
Notes to Consolidated and Combined Financial Statements
As of December 31, 2021 and 2020 the income tax effects of temporary differences that give rise to significant portions of deferred tax assets and liabilities were as follows:
(dollars in thousands) | December 31, 2021 | December 31, 2020 | ||||||
Deferred Tax Assets | ||||||||
Basis difference in subsidiaries | $ | 439,826 | $ | 69 | ||||
Tax receivable agreement | 158,616 | 0 | ||||||
Net operating losses | 36,500 | 180 | ||||||
Other | 2,057 | 551 | ||||||
Deferred Tax Assets | $ | 636,999 | $ | 800 | ||||
Goodwill and intangible assets | 47,924 | 0 | ||||||
Other | 2,413 | 0 | ||||||
Deferred Tax Liabilities | $ | 50,337 | $ | 0 | ||||
The Company has U.S. federal and UBT net operating losses of $152.1 million and $9.6 million, respectively, that can be carried forward indefinitely until they are used. The Company evaluates the realizability of its deferred tax assets on a quarterly basis and may recognize or adjust any valuation allowance when it is
more-likely-than-not
that all or a portion of the deferred tax asset may not be realized. The Company believes it ismore-likely-than-not
that its deferred tax assets will be realized based on historic and projected earnings and the reversal of taxable temporary differences. As of December 31, 2021, the Company has 0not recorded any valuation allowances.The Company files its tax returns as prescribed by the tax laws of the jurisdictions in which it operates. In the normal course of business, the tax years that remain open under the statute of limitations will be subject to examinations by the appropriate tax authorities. The Company is generally no longer subject to state or local examinations by tax authorities for tax years prior to 2017.
As of December 31, 2021, the Company has 0not recorded any unrecognized tax positions and does not expect a material increase or decrease in gross unrecognized tax positions in the next 12 months. NaN penalties or interest were incurred during the years ended December 31, 2021, 2020 and 2019.
In connection with and subsequent to the Business Combinations, the Company recorded to additional
paid-in
capital various adjustments to deferred tax assets and liabilities, as well as related impacts to the TRA liability, related to capital transactions. These adjustments primarily resulted from differences between the Company’s GAAP and tax basis in its investment in the Blue Owl Operating Partnerships, as well as portions related to the TRA liability that will eventually lead to additional tax basis in the Blue Owl Operating Partnerships upon future TRA payments. The deferred tax assets will be recovered as the basis is amortized. See the Company’s consolidated and combined statements of shareholders’ equity for these amounts.11. | COMMITMENTS AND CONTINGENCIES |
Tax Receivable Agreement
Pursuant to the TRA, the Company will pay 85% of certain tax benefits, if any, that it realizes (or in certain cases is deemed to realize) as a result of any increases in tax basis of the assets of the Blue Owl Operating Group related to the Business Combination and any subsequent exchanges of Blue Owl Operating Group Units for shares of the Registrant or cash.
F-42
Blue Owl Capital Inc.
(Prior to May 19, 2021, Owl Rock)
Notes to Consolidated and Combined Financial Statements
Payments under the TRA will continue until all such tax benefits have been utilized or expired unless (i) the Company exercises its right to terminate the TRA and paying recipients an amount representing the present value of the remaining payments, (ii) there is a change of control or (iii) the Company breaches any of the material obligations of the TRA, in which case all obligations will generally be accelerated and due as if the Company had exercised its right to terminate the TRA. In each case, if payments are accelerated, such payments will be based on certain assumptions, including that the Company will have sufficient taxable income to fully utilize the deductions arising from the increased tax deductions.
The estimate of the timing and the amount of future payments under the TRA involves several assumptions that do not account for the significant uncertainties associated with these potential payments, including an assumption that the Company will have sufficient taxable income in the relevant tax years to utilize the tax benefits that would give rise to an obligation to make payments.
The table below presents management’s estimate as of December 31, 2021, of the maximum amounts that would be payable under the TRA assuming that the Company will have sufficient taxable income each year to fully realize the expected tax savings. In light of the numerous factors affecting the Company’s obligation to make such payments, the timing and amounts of any such actual payments may differ materially from those presented in the table.
(dollars in thousands) | Potential Payments Under the Tax Receivable Agreement | |||
2022 | $ | 0 | ||
2023 | 44,059 | |||
2024 | 47,486 | |||
2025 | 56,735 | |||
2026 | 47,642 | |||
Thereafter | 595,661 | |||
Total Payments | $ | 791,583 | ||
Less adjustment to fair value for contingent consideration | (120,907 | ) | ||
Total TRA Liability | $ | 670,676 | ||
Unfunded Product Commitments
As of December 31, 2021, the Company had unfunded investment commitments to its products of $46.5 million, which is exclusive of commitments that employees and other related parties have directly to the Company’s products.
Indemnification and Guarantee Arrangements
In the normal course of business, the Company enters into contracts that contain indemnities or guarantees for related parties of the Company, including the Company’s products, as well as persons acting on behalf of the Company or such related parties and third parties. The terms of the indemnities and guarantees vary from contract to contract and the Company’s maximum exposure under these arrangements cannot be determined or the risk of material loss is remote, and therefore no amounts have been recorded in the consolidated statements of financial condition. As of December 31, 2021, the Company has not had prior claims or losses pursuant to these arrangements.
F-43
Blue Owl Capital Inc.
(Prior to May 19, 2021, Owl Rock)
Notes to Consolidated and Combined Financial Statements
Litigation
From time to time, the Company is involved in legal actions in the ordinary course of business. Although there can be no assurance of the outcome of such legal actions, in the opinion of management, the Company does not have a potential liability related to any current legal proceeding or claim that would individually or in the aggregate materially affect its results of operations, financial condition or cash flows.
12. | RELATED PARTY TRANSACTIONS |
The majority of the Company’s revenues, including all management fees and certain administrative, transaction and other fees, are earned from the products it manages, which are related parties of the Company.
The Company also has arrangements in place with products that it manages, whereby certain costs are initially paid by the Company and subsequently are reimbursed by the products. These amounts are included within due from related parties in the Company’s consolidated and combined statements of financial condition.
(dollars in thousands) | December 31, 2021 | December 31, 2020 | ||||||
Management fees | $ | 168,057 | $ | 78,586 | ||||
Realized performance income | 10,496 | 0 | ||||||
Administrative fees and other expenses paid on behalf of the Company’s products and other related parties | 46,023 | 14,112 | ||||||
Due from Related Parties | $ | 224,576 | $ | 92,698 | ||||
Reimbursements from the Company’s Products
Administrative fees represent allocable compensation and other expenses incurred by the Company, pursuant to administrative and other agreements, that are reimbursed by products it manages. These administrative fees are included within administrative, transaction and other fees on the consolidated and combined statements of operations and totaled $37.2 million, $13.0 million and $12.0 million during the years ended December 31, 2021, 2020 and 2019, respectively.
Dealer Manager Revenues
Dealer manager revenues represent commissions earned from certain of the Company’s products for distribution services provided. These dealer manager revenues are included within administrative, transaction and other fees on the consolidated and combined statements of operations and totaled $8.2 million, $3.9 million and $9.6 million during the years ended December 31, 2021, 2020 and 2019, respectively.
Expense Support and Caps Arrangements
The Company is party to expense support and cap arrangements with certain of the products it manages. Pursuant to these arrangements, the Company may absorb certain expenses of these products when in excess of stated expense caps or until such products reach certain profitability and cash flow
F-44
Blue Owl Capital Inc.
(Prior to May 19, 2021, Owl Rock)
Notes to Consolidated and Combined Financial Statements
thresholds. In certain cases, the Company is able to recover these expenses once certain profitability and cash flow thresholds are met. The Company recorded net expenses (recoveries) related to these arrangements of $(3.2) million, $18.7 million and $7.0 million for the years ended December 31, 2021, 2020 and 2019, respectively. These net expenses (recoveries) are included in general, administrative and other expenses within the consolidated and combined statements of operations.
Aircraft and Other Services
In the normal course of business, the Company reimburses certain related parties for business use of their aircraft based on current market rates. Personal use of the aircraft is not charged to the Company. The Company recorded expenses for these aircraft reimbursements of $0.6 million, $0.9 million and $1.0 million for the years ended December 31, 2021, 2020 and 2019, respectively.
Promissory Note
The Company was a party to an interest-bearing promissory note with a product it manages, allowing the product to borrow from the Company up to an aggregate of $50.0 million. The Company lent and was repaid $30.0 million and recorded $4 thousand of interest income during the year ended December 31, 2020. The unpaid principal balance and accrued interest were payable on demand upon 120 days written notice by the Company. The promissory note matured on December 31, 2020.
13. | EARNINGS (LOSS) PER SHARE |
Basic earnings (loss) per share attributable to Class A Shareholders is computed by dividing the earnings or loss attributable to Class A Shares by the weighted-average number of shares of Class A Shares outstanding during the period.
Seller Earnout Units are included in the denominator in computing dilutive earnings (loss) per Class A Share only when a Class E Triggering Event has occurred, and therefore the contingency has been met. As of December 31, 2021, the Class E Triggering Events on the
E-2
Seller Earnout Units have been met.The table below presents the Company’s treatment for basic and diluted earnings (loss) per share for instruments outstanding at the Registrant and the Blue Owl Operating Group. Potentially dilutive instruments are only considered in the calculation to the extent they would be dilutive.
Basic | Diluted | |||
| Class A Shares | Included | Included | ||
| Class B Shares | N/A—None outstanding | N/A—None outstanding | ||
| Class C Shares and Class D Shares | Excluded Non-economic voting shares of the Registrant | Excluded Non-economic voting shares of the Registrant | ||
| Vested RSUs(1) | Included Contingently issuable shares | Included Contingently issuable shares | ||
| Unvested RSUs | Excluded | Included Treasury stock method | ||
| Warrants | Excluded | Included Treasury stock method(4) |
F-45
Blue Owl Capital Inc.
(Prior to May 19, 2021, Owl Rock)
Notes to Consolidated and Combined Financial Statements
Basic | Diluted | |||
| Potentially Dilutive Instruments of the Blue Owl Operating Group: | ||||
| Vested Common and Incentive Units | Excluded | Included If-converted method(5) | ||
| Unvested Incentive Units | Excluded | Included The Company first applies the treasury stock method to determine the number of units that would have been issued, then applies the if-converted method to the resulting number of units(5) | ||
| Oak Street Earnout Units(2) | Excluded | Excluded Performance condition not satisfied as of year end | ||
| Earnout Securities(3) | Excluded | Included Market condition satisfied as of year end If-converted method(5) | ||
| (1) | Included in the weighted-average Class A Shares outstanding for the period from May 19, 2021 to December 31, 2021, were 9,191,642 RSUs that have vested but have not been settled in Class A Shares. These RSUs do not participate in dividends until settled in Class A Shares. |
| (2) | As of December 31, 2021, the Oak Street Triggering Events with respect to the Oak Street Earnout Units had not been met, and therefore such units have not been included in the calculation of diluted earnings (loss) per share. |
| (3) | As of December 31, 2021, the Class E Triggering Events with respect to the Earnout Securities had been met and no Earnout Securities remained outstanding. |
| (4) | The treasury stock method for warrants carried at fair value includes adjusting the numerator for changes in fair value impacting net income (loss) for the period. |
| (5) | The if-converted method includes adding back to the numerator any related income or loss allocations to noncontrolling interest, as well as any incremental tax expense had the instruments converted into Class A Shares as of the beginning of the period. In the case of Earnout Securities carried at fair value, the numerator is also adjusted for changes in fair value impacting net income (loss) for the period. |
For the Period from May 19, 2021 to December 31, 2021 | Net Loss Attributable to Class A Shareholders | Weighted- Average Class A Shares Outstanding | Loss Per Class A Share | Weighted- Average Number of Antidilutive Instruments | ||||||||||||
| (dollars in thousands, except per share amounts) | ||||||||||||||||
Basic | $ | (450,430 | ) | 354,949,067 | $ | (1.27 | ) | |||||||||
Effect of dilutive instruments: | ||||||||||||||||
Unvested RSUs | — | — | 1,702,275 | |||||||||||||
Warrants | — | — | 14,159,364 | |||||||||||||
Vested Common and Incentive Units | (1,306,873 | ) | 960,237,349 | 0 | ||||||||||||
Unvested Incentive Units | — | — | 6,743,015 | |||||||||||||
Oak Street Earnout Units | — | — | 344,594 | |||||||||||||
Earnout Securities | — | — | 50,881,018 | |||||||||||||
Diluted | $ | (1,757,303 | ) | 1,315,186,416 | $ | (1.34 | ) | |||||||||
F-46
Blue Owl Capital Inc.
(Prior to May 19, 2021, Owl Rock)
Notes to Consolidated and Combined Financial Statements
For periods prior to the Business Combination, earnings per share results in values that would not be meaningful to the users of the consolidated and combined financial statements, as the Company’s capital structure completely changed as a result of the Business Combination. Therefore, earnings (loss) per share information has not been presented for periods prior to the Business Combination.
14. | SUBSEQUENT EVENTS |
Dividend
On February 17, 2022, the Company announced a cash dividend of $0.10 per Class A Share. The dividend is payable on March 7, 2022, to holders of record as of the close of business on February 28, 2022.
2032 Notes
On February 15, 2022, the Company, through its indirect subsidiary, Blue Owl Finance LLC, issued $400.0 million aggregate principal amount of 4.375% Senior Notes due 2032 (the “2032 Notes”). The 2032 Notes bear interest at a rate of 4.375% per annum and mature on February 15, 2032. Interest on the 2032 Notes will be payable semi-annually in arrears on February 15 and August 15 of each year, commencing August 15, 2022.
The 2032 Notes are fully and unconditionally guaranteed, jointly and severally, by the Blue Owl Operating Partnerships and certain of their subsidiaries. The guarantees are unsecured and unsubordinated obligations of the guarantors. All or a portion of the 2032 Notes may be redeemed at the Company’s option in whole, at any time, or in part, from time to time, prior to their stated maturity, subject to a make-whole redemption price; provided, however, that if the Company redeems any amounts on or after November 15, 2031, the redemption price for the 2032 Notes will be equal to 100% of the principal amount of the amounts redeemed, in each case, plus any accrued and unpaid interest. If a change of control repurchase event occurs, the 2032 Notes are subject to repurchase by the Company at a repurchase price in cash equal to 101% of the aggregate principal amount repurchased plus any accrued and unpaid interest. The 2032 Notes also provide for customary events of default and acceleration.
Wellfleet Acquisition
On February 16, 2022, the Company announced its entry into an agreement to acquire Wellfleet Credit Partners LLC (“Wellfleet”) from affiliates of Littlejohn & Co., LLC. The closing is subject to customary conditions. The purchase price consists of $108.0 million cash consideration on closing and earnout payments of up to an additional $15.0 million of cash and 940,668 Class A Shares payable in equal installments on each of the first three anniversaries from the closing date.
F-47
1,320,591,340 Class A Shares
PROSPECTUS
, 2022
You should rely only on the information contained or incorporated by reference in this prospectus. We have not authorized anyone to provide you with different information. You should not assume that the information contained or incorporated by reference in this prospectus is accurate as of any date other than the date of this prospectus. We are not making an offer of these securities in any state where the offer is not permitted.
PART II
INFORMATION NOT REQUIRED IN PROSPECTUS
Item 13. Other Expenses of Issuance and Distribution.
The following table sets forth the estimated expenses to be borne by the registrant in connection with the issuance and distribution of the shares of common stock being registered hereby.
Securities and Exchange Commission registration fee | $ | 1,981,052.08 | ||
Accounting fees and expenses | $ | 60,000 | ||
Legal fees and expenses | $ | 100,000 | ||
Financial printing and miscellaneous expenses | $ | 150,000 | ||
Total | $ | 2,291,052.08 | ||
Item 14. Indemnification of Directors and Officers.
Blue Owl is governed by the Delaware General Corporation Law, as the same exists or may hereafter be amended (the “
DGCL
”). Section 145 of the DGCL (“Section
145
”) provides that a Delaware corporation may indemnify any person who was or is a party or is threatened to be made a party to any threatened, pending or completed action, suit or proceeding, whether civil, criminal, administrative or investigative (other than an action by or in the right of such corporation) by reason of the fact that such person is or was a director, officer, employee or agent of such corporation, or is or was serving at the request of such corporation as a director, officer, employee or agent of another corporation or enterprise. The indemnification may include expenses (including attorneys’ fees), judgments, fines and amounts paid in settlement actually and reasonably incurred by such person in connection with such action, suit or proceeding, provided such person acted in good faith and in a manner he or she reasonably believed to be in or not opposed to the corporation’s best interests and, with respect to any criminal action or proceeding, had no reasonable cause to believe that his conduct was unlawful. Section 145 also provides that a Delaware corporation may indemnify any person who was or is a party or is threatened to be made a party to any threatened, pending or completed action or suit by or in the right of such corporation, under the same conditions, except that such indemnification is limited to expenses (including attorneys’ fees) actually and reasonably incurred by such person, and except that no indemnification is permitted without judicial approval if such person is adjudged to be liable to such corporation. Where an officer or director of a corporation is successful, on the merits or otherwise, in the defense of any action, suit or proceeding referred to above, or any claim, issue or matter therein, the corporation must indemnify that person against the expenses (including attorneys’ fees) which such officer or director actually and reasonably incurred in connection therewith.Section 145 further authorizes a corporation to purchase and maintain insurance on behalf of any person who is or was a director, officer, employee or agent of the corporation, or is or was serving at the request of the corporation as a director, officer, employee or agent of another corporation or enterprise, against any liability asserted against such person and incurred by such person in any such capacity, or arising out of such person’s status as such, whether or not the corporation would otherwise have the power to indemnify such person against such liability under Section 145.
Our certificate of incorporation and bylaws provide that Blue Owl will indemnify to the fullest extent permitted by law any person made or threatened to be made a party to an action or proceeding, whether criminal, civil, administrative or investigative, by reason of the fact that he, his testator or intestate is or was a director, officer or employee of Blue Owl or any predecessor of Blue Owl, or serves or served at any other corporation, partnership, joint venture, trust or other enterprise as a director, officer, employee or agent at the request of Blue Owl or any predecessor of Blue Owl.
II-1
Our bylaws provide for mandatory indemnification to the fullest extent permitted by DGCL against all expenses (including attorney’s fees), judgments, fines, ERISA excise taxes or penalties and amounts paid in settlements.
Our certificate of incorporation eliminates the liability of a director of Blue Owl to the fullest extent under applicable law. Pursuant to Section 102(b)(7) of the DGCL, a corporation may eliminate the personal liability of a director to the corporation or its stockholders for monetary damages for breach of fiduciary duty as a director, except for liabilities arising (i) from any breach of the director’s duty of loyalty to the corporation or its stockholders, (ii) from acts or omissions not in good faith or which involve intentional misconduct or a knowing violation of law, (iii) under Section 174 of the DGCL, or (iv) from any transaction from which the director derived an improper personal benefit.
These provisions may be held not to be enforceable for certain violations of the federal securities laws of the United States.
The Registrant’s directors and executive officers are covered by insurance maintained by Blue Owl against specified liabilities for actions taken in their capacities as such, including liabilities under the Securities Act. In addition, Blue Owl has entered into contracts with its directors and executive officers providing indemnification of such directors and executive officers by Blue Owl to the fullest extent permitted by law, subject to certain limited exceptions.
Item 15. Recent Sales of Unregistered Securities.
None.
Item 16. Exhibits and Financial Statements.
(a). The following exhibits are being followed herewith:
Exhibits
II-2
II-3
II-4
II-5
| † | Certain of the exhibits and schedules to this Exhibit have been omitted in accordance with Regulation S-K Item 601(a)(5). The Registrant agrees to furnish a copy of all omitted exhibits and schedules to the SEC upon its request. |
| + | Indicates a management or compensatory plan. |
| * | Filed herewith |
(b). The financial statements filed as part of this registration statement are listed in the index to the financial statements immediately preceding such financial statements, which index to the financial statements is incorporated herein by reference.
Financial Statements
Item 17. Undertakings.
The undersigned registrant hereby undertakes:
| (1) | To file, during any period in which offers or sales are being made, a post-effective amendment to this registration statement: (i) to include any prospectus required by Section 10(a)(3) of the Securities Act of 1933; (ii) to reflect in the prospectus any facts or events arising after the effective date of the registration statement (or the most recent post-effective amendment thereof) which, individually or in the aggregate, represent a fundamental change in the information set forth in the registration statement (notwithstanding the foregoing, any increase or decrease in the volume of securities offered (if the total dollar value of securities offered would not exceed that which was registered) and any deviation from the low or high end of the estimated maximum offering range may be reflected in the form of prospectus filed with the SEC pursuant to Rule 424(b) if, in the aggregate, the changes in volume and price represent no more than a 20% change in the maximum aggregate offering price set forth in the “Calculation of Registration Fee” table in the effective registration statement); and (iii) to include any material information with respect to the plan of distribution not previously disclosed in the registration statement or any material change to such information in the registration statement. |
| (2) | That, for the purpose of determining any liability under the Securities Act of 1933, each such post-effective amendment shall be deemed to be a new registration statement relating to the securities offered therein, and the offering of such securities at that time shall be deemed to be the initial bona fide |
| (3) | To remove from registration by means of a post-effective amendment any of the securities being registered which remain unsold at the termination of the offering. |
| (4) | That, for the purpose of determining liability of the registrant under the Securities Act to any purchaser in the initial distribution of securities, in a primary offering of securities of the undersigned registrant pursuant to this registration statement, regardless of the underwriting method used to sell the securities to the purchaser, if the securities are offered or sold to such purchaser by means of any of the following communications, the undersigned registrant will be a seller to the purchaser and will be considered to offer or sell such securities to such purchaser: (i) any preliminary prospectus or prospectus of the undersigned registrant relating to the offering required to be filed pursuant to Rule 424; (ii) any free writing prospectus relating to the offering prepared by or on behalf of the undersigned registrant or used or referred to by the undersigned registrant; (iii) the portion of any other free writing prospectus relating to the offering containing material information about the undersigned registrant or its securities |
II-6
| provided by or on behalf of the undersigned registrant; and (iv) any other communication that is an offer in the offering made by the undersigned registrant to the purchaser. |
| (5) | That, for the purpose of determining liability under the Securities Act of 1933 to any purchaser, each prospectus filed pursuant to Rule 424(b) as part of a registration statement relating to an offering, other than registration statements relying on Rule 430B or other than prospectuses filed in reliance on Rule 430A, shall be deemed to be part of and included in the registration statement as of the date it is first used after effectiveness. Provided, however, that no statement made in a registration statement or prospectus that is part of the registration statement or made in a document incorporated or deemed incorporated by reference into the registration statement or prospectus that is part of the registration statement will, as to a purchaser with a time of contract of sale prior to such first use, supersede or modify any statement that was made in the registration statement or prospectus that was part of the registration statement or made in any such document immediately prior to such date of first use. |
| (6) | That, prior to any public reoffering of the securities registered hereunder through use of a prospectus which is a part of this registration statement, by any person or party who is deemed to be an underwriter within the meaning of Rule 145(c), the registrant undertakes that such reoffering prospectus will contain the information called for by the applicable registration form with respect to reofferings by persons who may be deemed underwriters, in addition to the information called for by the other items of the applicable form. |
| (7) | That every prospectus (i) that is filed pursuant to the immediately preceding paragraph, or (ii) that purports to meet the requirements of Section 10(a)(3) of the Securities Act and is used in connection with an offering of securities subject to Rule 415, will be filed as a part of an amendment to the registration statement and will not be used until such amendment has become effective, and that for the purpose of determining any liability under the Securities Act of 1933, each such post-effective amendment shall be deemed to be a new registration statement relating to the securities offered therein, and the offering of such securities at that time shall be deemed to be the initial bona fide |
| (8) | To respond to requests for information that is incorporated by reference into the prospectus pursuant to Items 4, 10(b), 11 or 13 of this Form, within one business day of receipt of such request, and to send the incorporated documents by first-class mail or other equally prompt means. This includes information contained in documents filed subsequent to the effective date of the registration statement through the date of responding to the request. |
| (9) | To supply by means of a post-effective amendment all information concerning a transaction, and the company being acquired involved therein, that was not the subject of, and included in, this registration statement when it became effective. |
| (10) | Insofar as indemnification for liabilities arising under the Securities Act of 1933 may be permitted to directors, officers, and controlling persons of the registrant pursuant to the foregoing provisions, or otherwise, the registrant has been advised that in the opinion of the Securities and Exchange Commission, such indemnification is against public policy as expressed in the Securities Act of 1933 and is, therefore, unenforceable. In the event that a claim for indemnification against such liabilities (other than the payment by the registrant of expenses incurred or paid by a director, officer, or controlling person of the registrant in the successful defense of any action, suit, or proceeding) is asserted by such director, officer, or controlling person in connection with the securities being registered, the registrant will, unless in the opinion of its counsel the matter has been settled by controlling precedent, submit to a court of appropriate jurisdiction the question whether such indemnification by it is against public policy as expressed in the Securities Act of 1933 and will be governed by the final adjudication of such issue. |
II-7
SIGNATURES
Pursuant to the requirements of the Securities Act, the registrant has duly caused this Post-Effective Amendment No. 1 to the registration statement to be signed on its behalf by the undersigned, thereunto duly authorized, in the City of New York, New York, on April 21, 2022.
| BLUE OWL CAPITAL INC. | ||
| By: | /s/ Neena A. Reddy | |
| Name: Neena A. Reddy | ||
| Title: General Counsel and Secretary | ||
Pursuant to the requirements of the Securities Act, this registration statement has been signed by the following persons in the capacities and on the dates indicated.
Name | Position | Date | ||
* Douglas I. Ostrover | Chief Executive Officer and Chairman of the Board | April 21, 2022 | ||
* Marc S. Lipschultz | Co-President and Director | April 21, 2022 | ||
* Michael Rees | Co-President and Director | April 21, 2022 | ||
* Alan J. Kirshenbaum | Chief Financial Officer | April 21, 2022 | ||
* Sean Ward | Director | April 21, 2022 | ||
/s/ Marc Zahr Marc Zahr | Director | April 21, 2022 | ||
* Craig W. Packer | Director | April 21, 2022 | ||
* Dana Weeks | Director | April 21, 2022 | ||
* Claudia Holz | Director | April 21, 2022 | ||
* Andrew S. Komaroff | Director | April 21, 2022 | ||
* Stacy Polley | Director | April 21, 2022 | ||
| *By: | /s/ Neena A. Reddy | |
| Name: | Neena A. Reddy | |
| Title: | Attorney-in-Fact | |
II-8