Exhibit (c)(2)
These materials may not be used or relied upon for any purpose other than as specifically contemplated by a written agreement with Credit Suisse Group AG and/or its Affiliates (hereafter “Credit Suisse”). PRELIMINARY | SUBJECT TO FURTHER REVIEW AND EVALUATION I Draft Project Flash Board of Directors Presentation March 23, 2023
I Draft I N:\IBD_Regional_Documents_Repository_AM_Clients\Berkshire Grey(BQWF)\Spider\S03939\01. PPT\SoftBank\Project Flash_BoD_v14.pptx Table of contents 1 Sumo Offer Terms 1 Bravo Financials 2 Valuation Analysis 3 Appendix
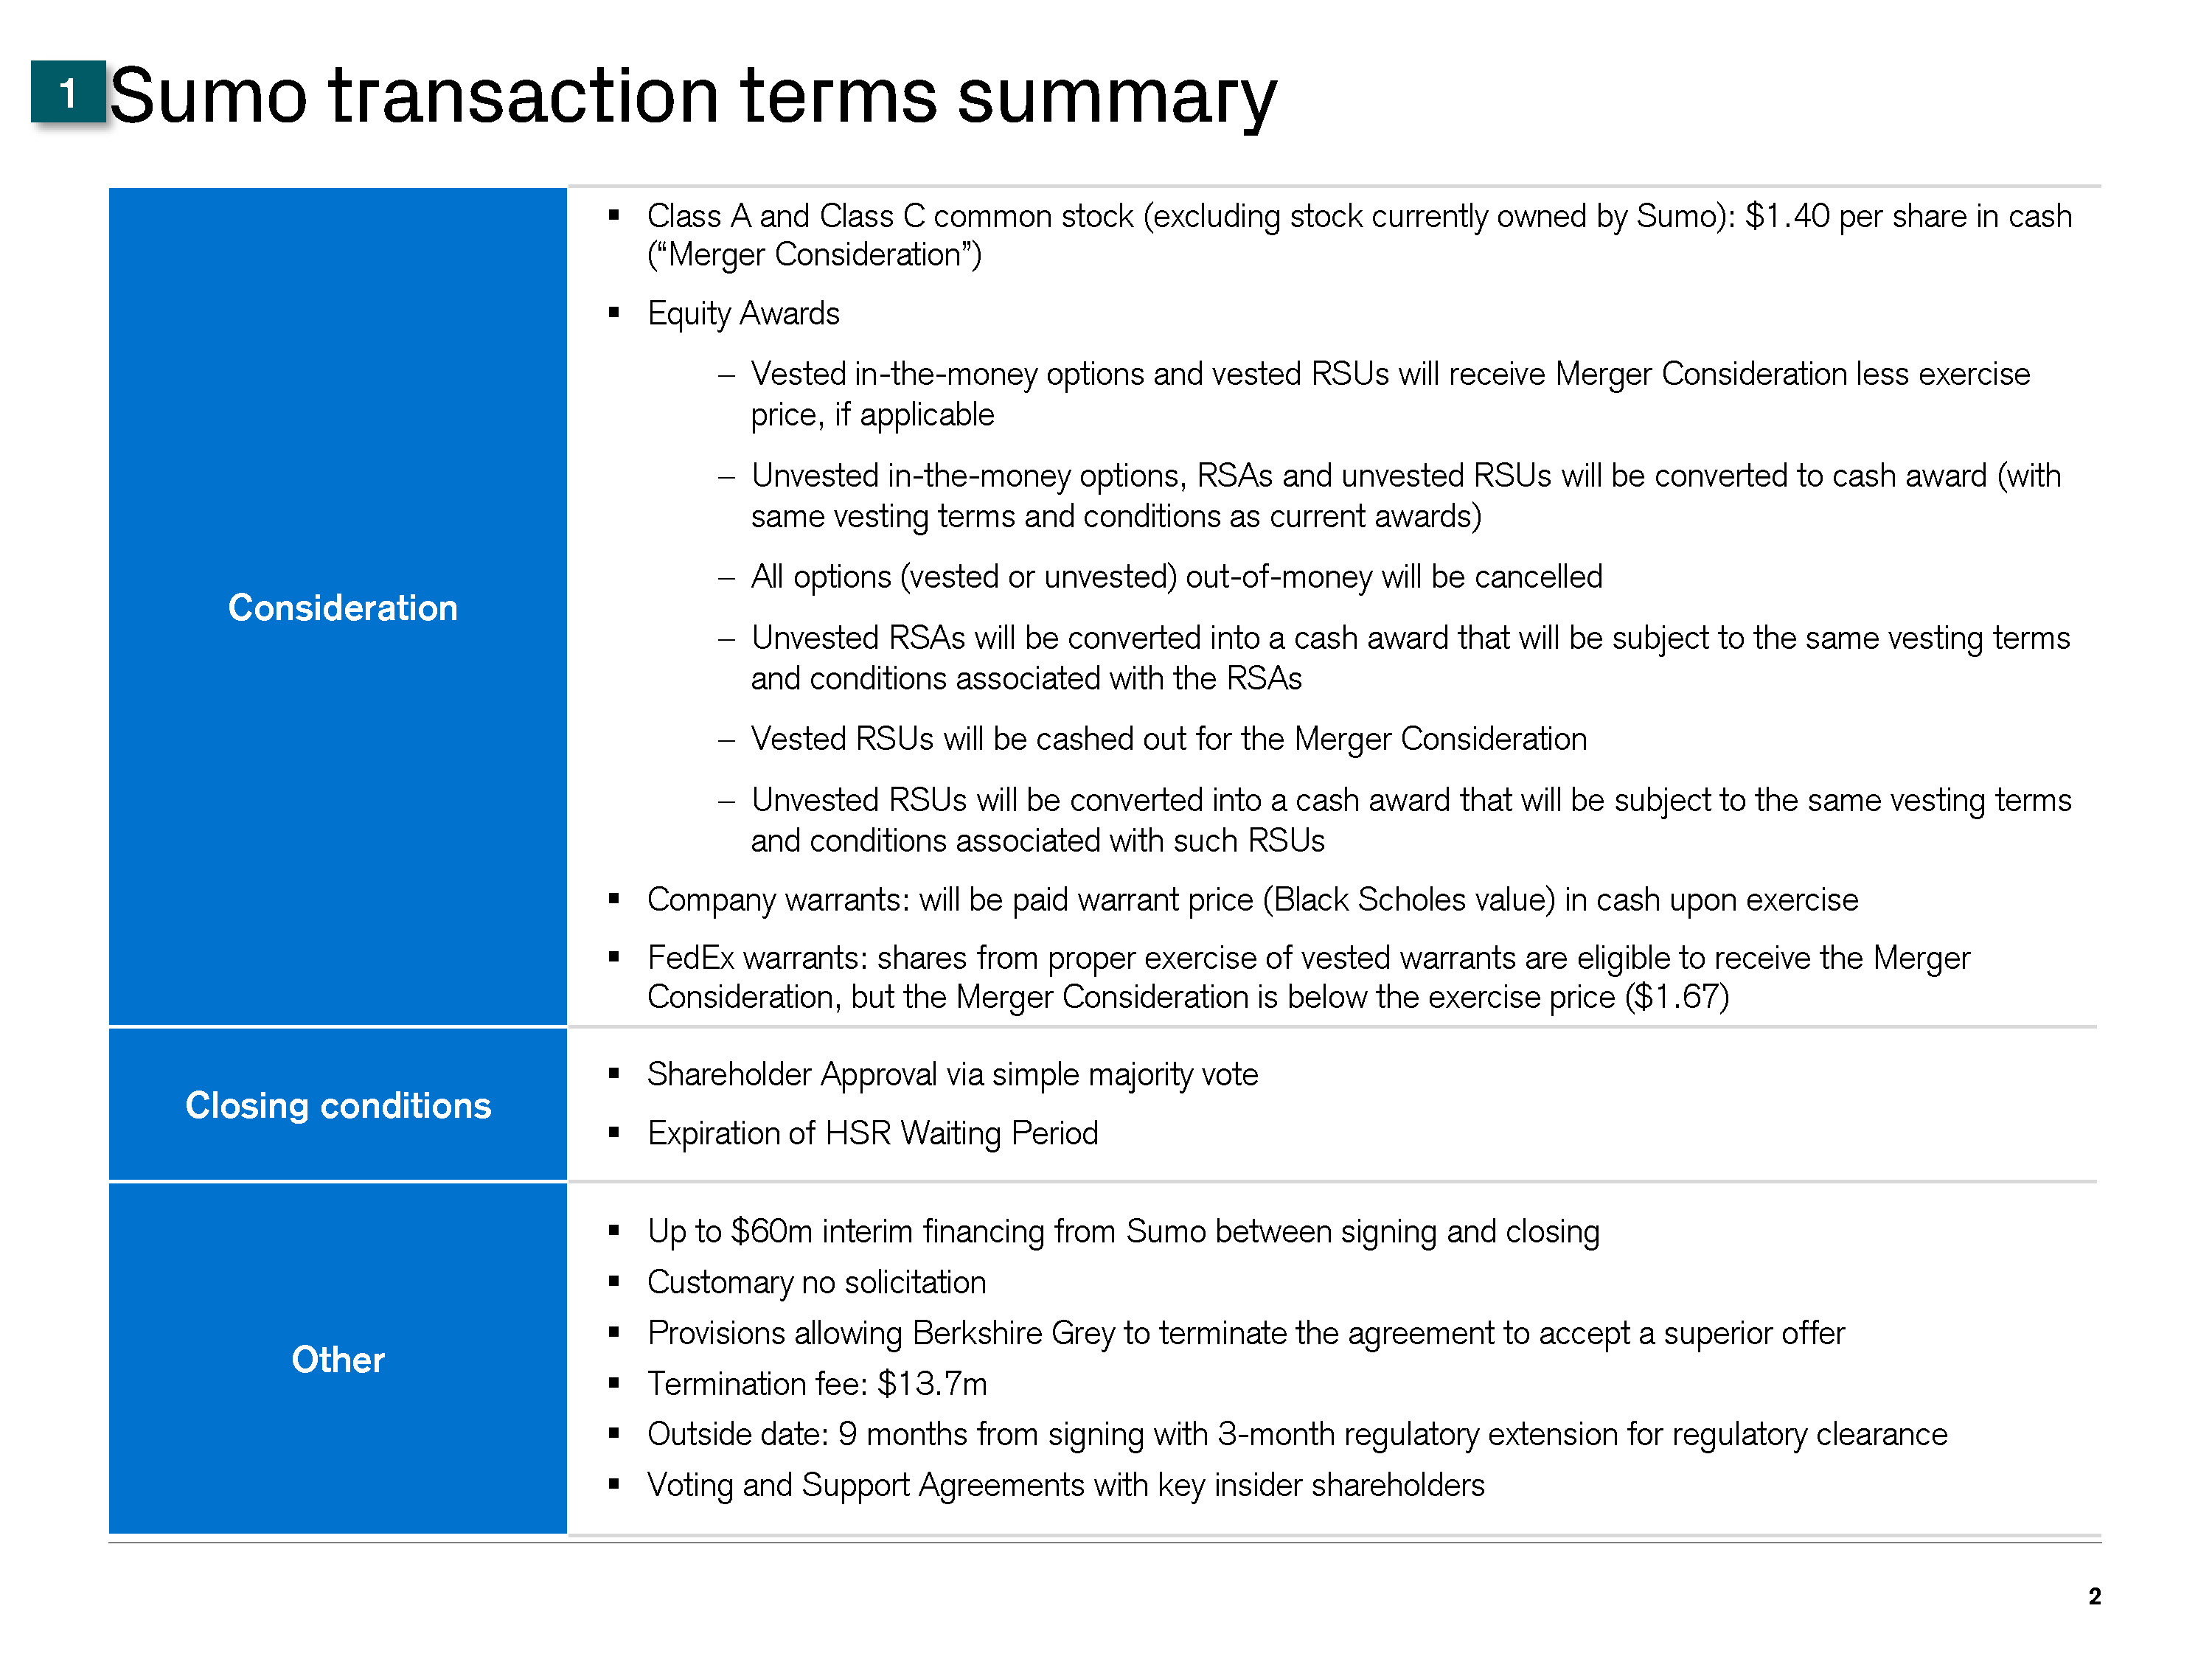
I Draft I N:\IBD_Regional_Documents_Repository_AM_Clients\Berkshire Grey(BQWF)\Spider\S03939\01. PPT\SoftBank\Project Flash_BoD_v14.pptx 2 Consideration Class A and Class C common stock (excluding stock currently owned by Sumo): $1.40 per share in cash (“Merger Consideration”) Equity Awards − Vested in-the-money options and vested RSUs will receive Merger Consideration less exercise price, if applicable − Unvested in-the-money options, RSAs and unvested RSUs will be converted to cash award (with same vesting terms and conditions as current awards) − All options (vested or unvested) out-of-money will be cancelled − Unvested RSAs will be converted into a cash award that will be subject to the same vesting terms and conditions associated with the RSAs − Vested RSUs will be cashed out for the Merger Consideration − Unvested RSUs will be converted into a cash award that will be subject to the same vesting terms and conditions associated with such RSUs Company warrants: will be paid warrant price (Black Scholes value) in cash upon exercise FedEx warrants: shares from proper exercise of vested warrants are eligible to receive the Merger Consideration, but the Merger Consideration is below the exercise price ($1.67) Closing conditions Shareholder Approval via simple majority vote Expiration of HSR Waiting Period Other Up to $60m interim financing from Sumo between signing and closing Customary no solicitation Provisions allowing Berkshire Grey to terminate the agreement to accept a superior offer Termination fee: $13.7m Outside date: 9 months from signing with 3-month regulatory extension for regulatory clearance Voting and Support Agreements with key insider shareholders 1 Sumo transaction terms summary
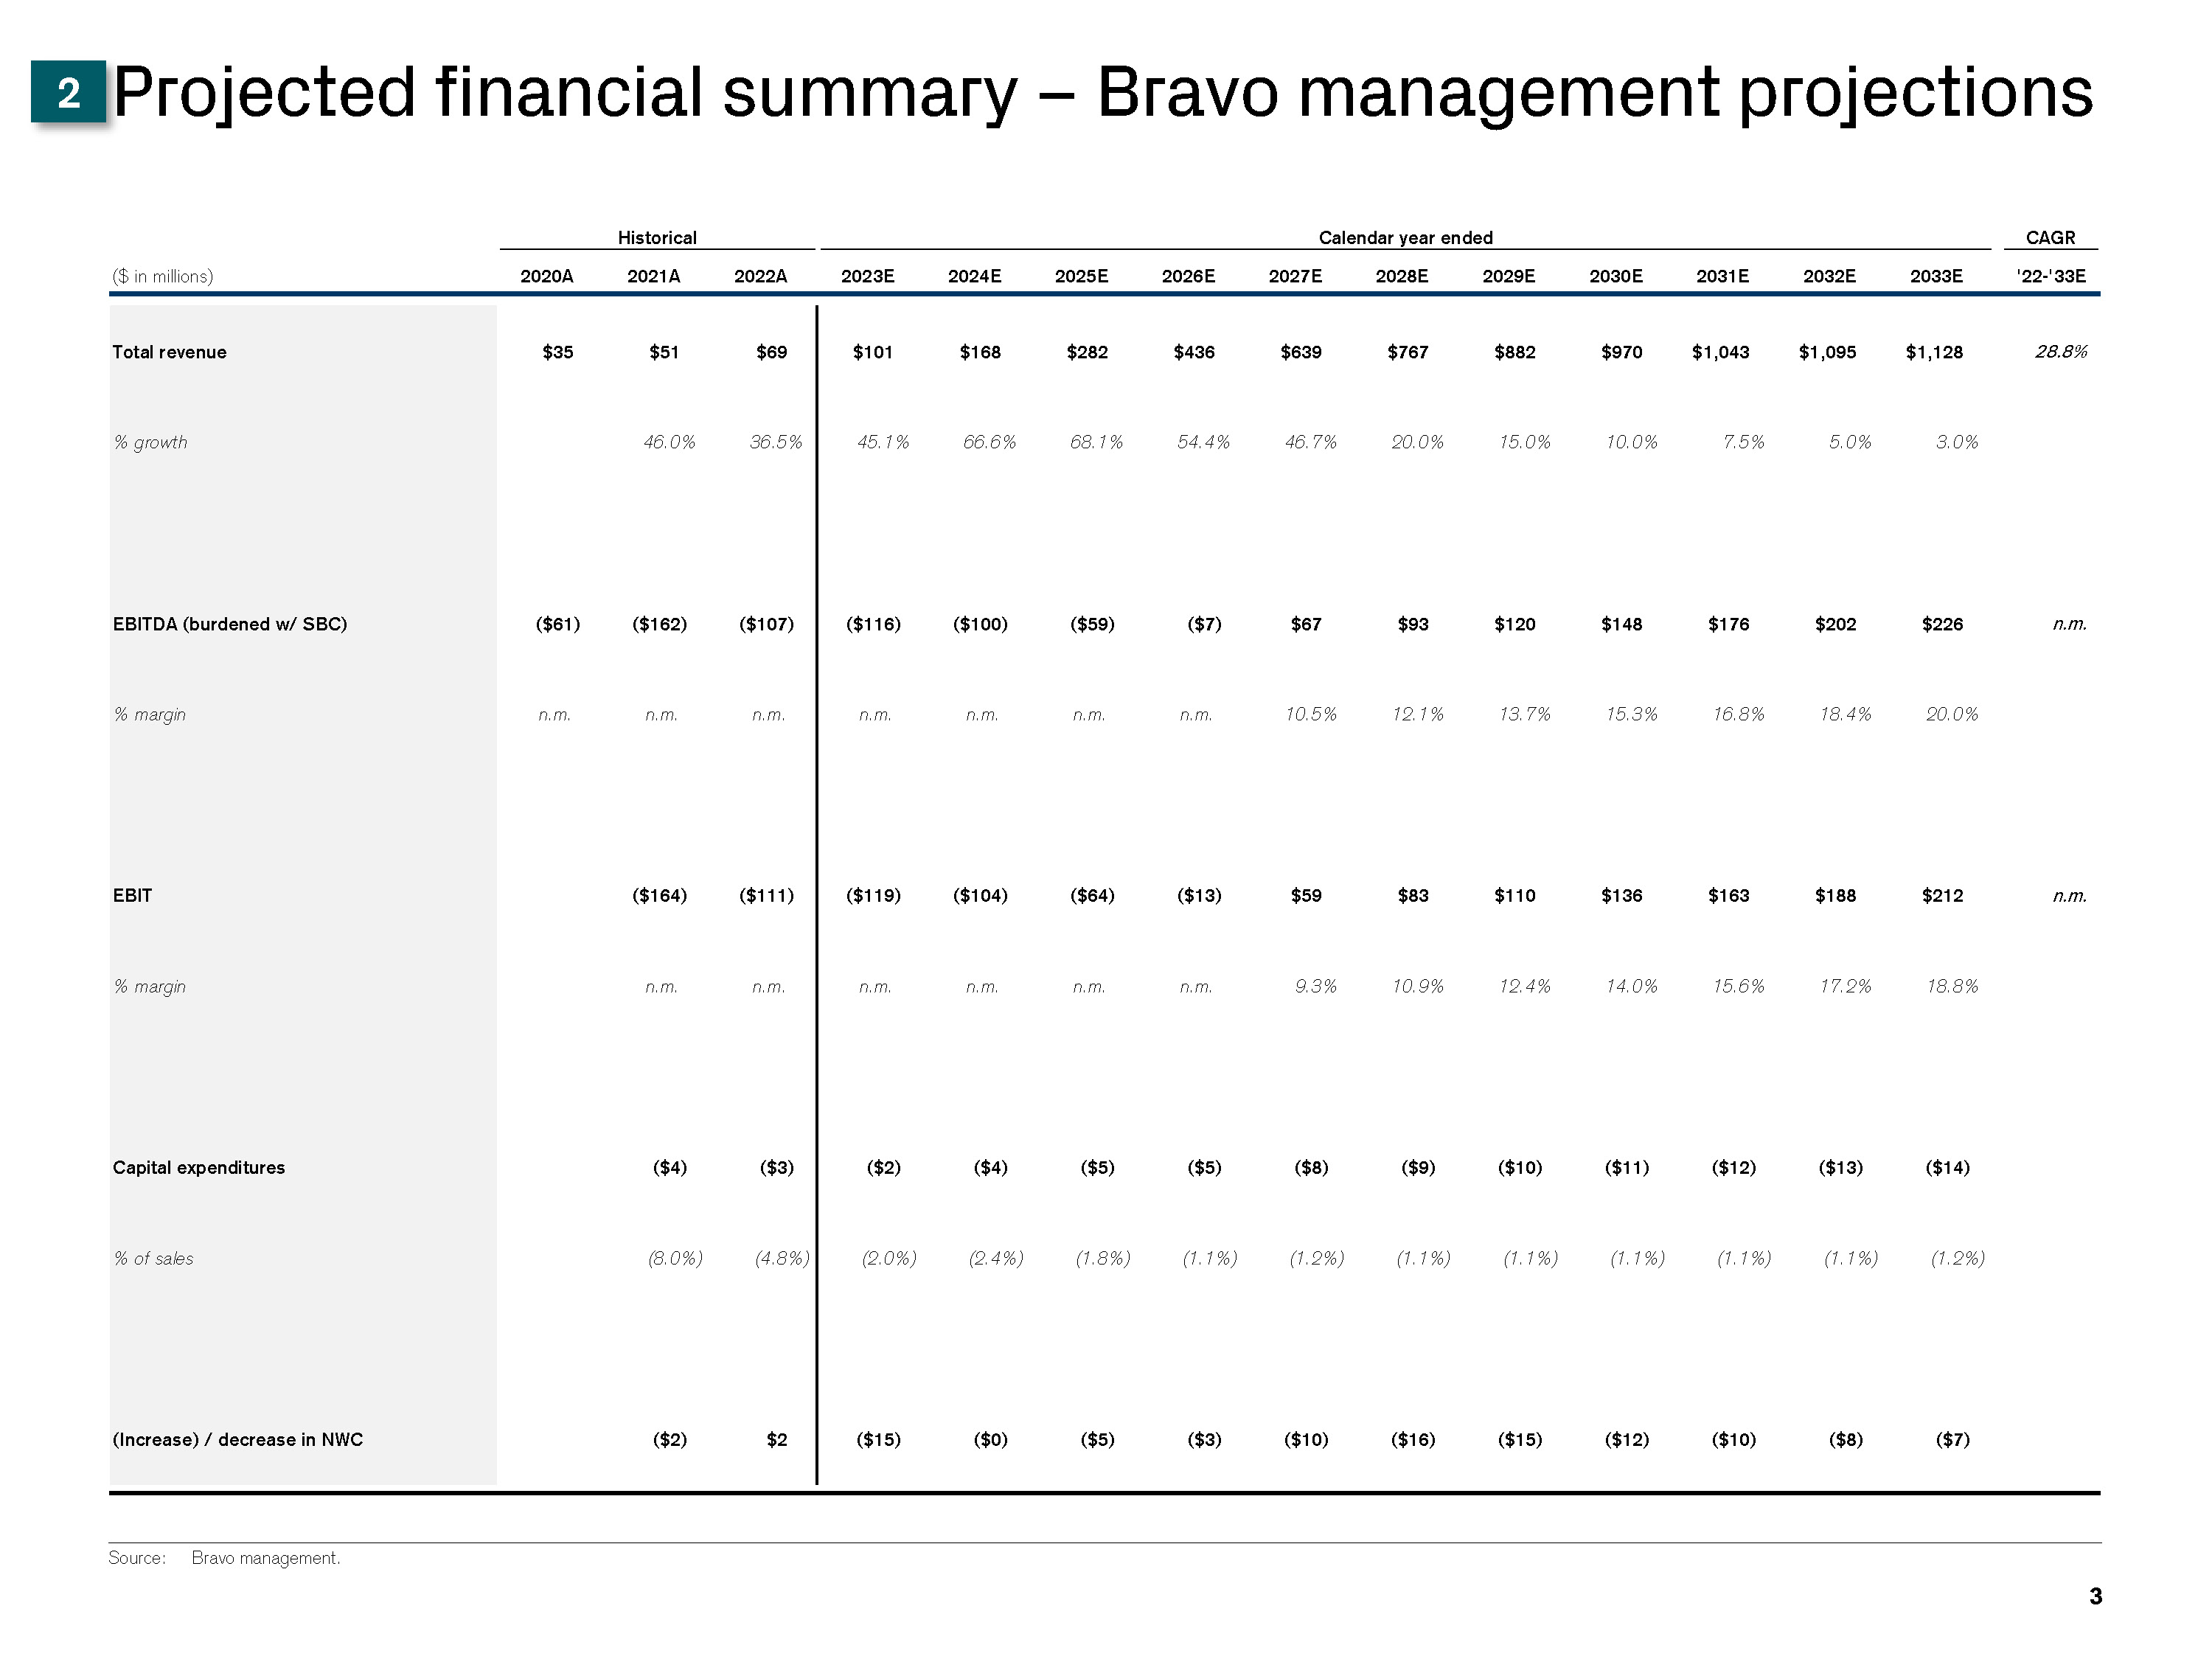
I Draft I N:\IBD_Regional_Documents_Repository_AM_Clients\Berkshire Grey(BQWF)\Spider\S03939\01. PPT\SoftBank\Project Flash_BoD_v14.pptx 3 Projected financial summary – Bravo management projections Source: Bravo management. 2 Historical Calendar year ended CAGR ($ in millions) 2020A 2021A 2022A 2023E 2024E 2025E 2026E 2027E 2028E 2029E 2030E 2031E 2032E 2033E '22-'33E Total revenue $35 $51 $69 $101 $168 $282 $436 $639 $767 $882 $970 $1,043 $1,095 $1,128 28.8% % growth 46.0% 36.5% 45.1% 66.6% 68.1% 54.4% 46.7% 20.0% 15.0% 10.0% 7.5% 5.0% 3.0% EBITDA (burdened w/ SBC) % margin EBIT % margin Capital expenditures % of sales (Increase) / decrease in NWC ($61) ($162) ($107) n.m. n.m. n.m. ($164) ($111) n.m. n.m. ($4) ($3) (8.0%) (4.8%) ($2) $2 ($116) ($100) ($59) ($7) $67 $93 $120 $148 $176 $202 $226 n.m. n.m. n.m. n.m. n.m. 10.5% 12.1% 13.7% 15.3% 16.8% 18.4% 20.0% ($119) ($104) ($64) ($13) $59 $83 $110 $136 $163 $188 $212 n.m. n.m. n.m. n.m. n.m. 9.3% 10.9% 12.4% 14.0% 15.6% 17.2% 18.8% ($2) ($4) ($5) ($5) ($8) ($9) ($10) ($11) ($12) ($13) ($14) (2.0%) (2.4%) (1.8%) (1.1%) (1.2%) (1.1%) (1.1%) (1.1%) (1.1%) (1.1%) (1.2%) ($15) ($0) ($5) ($3) ($10) ($16) ($15) ($12) ($10) ($8) ($7)
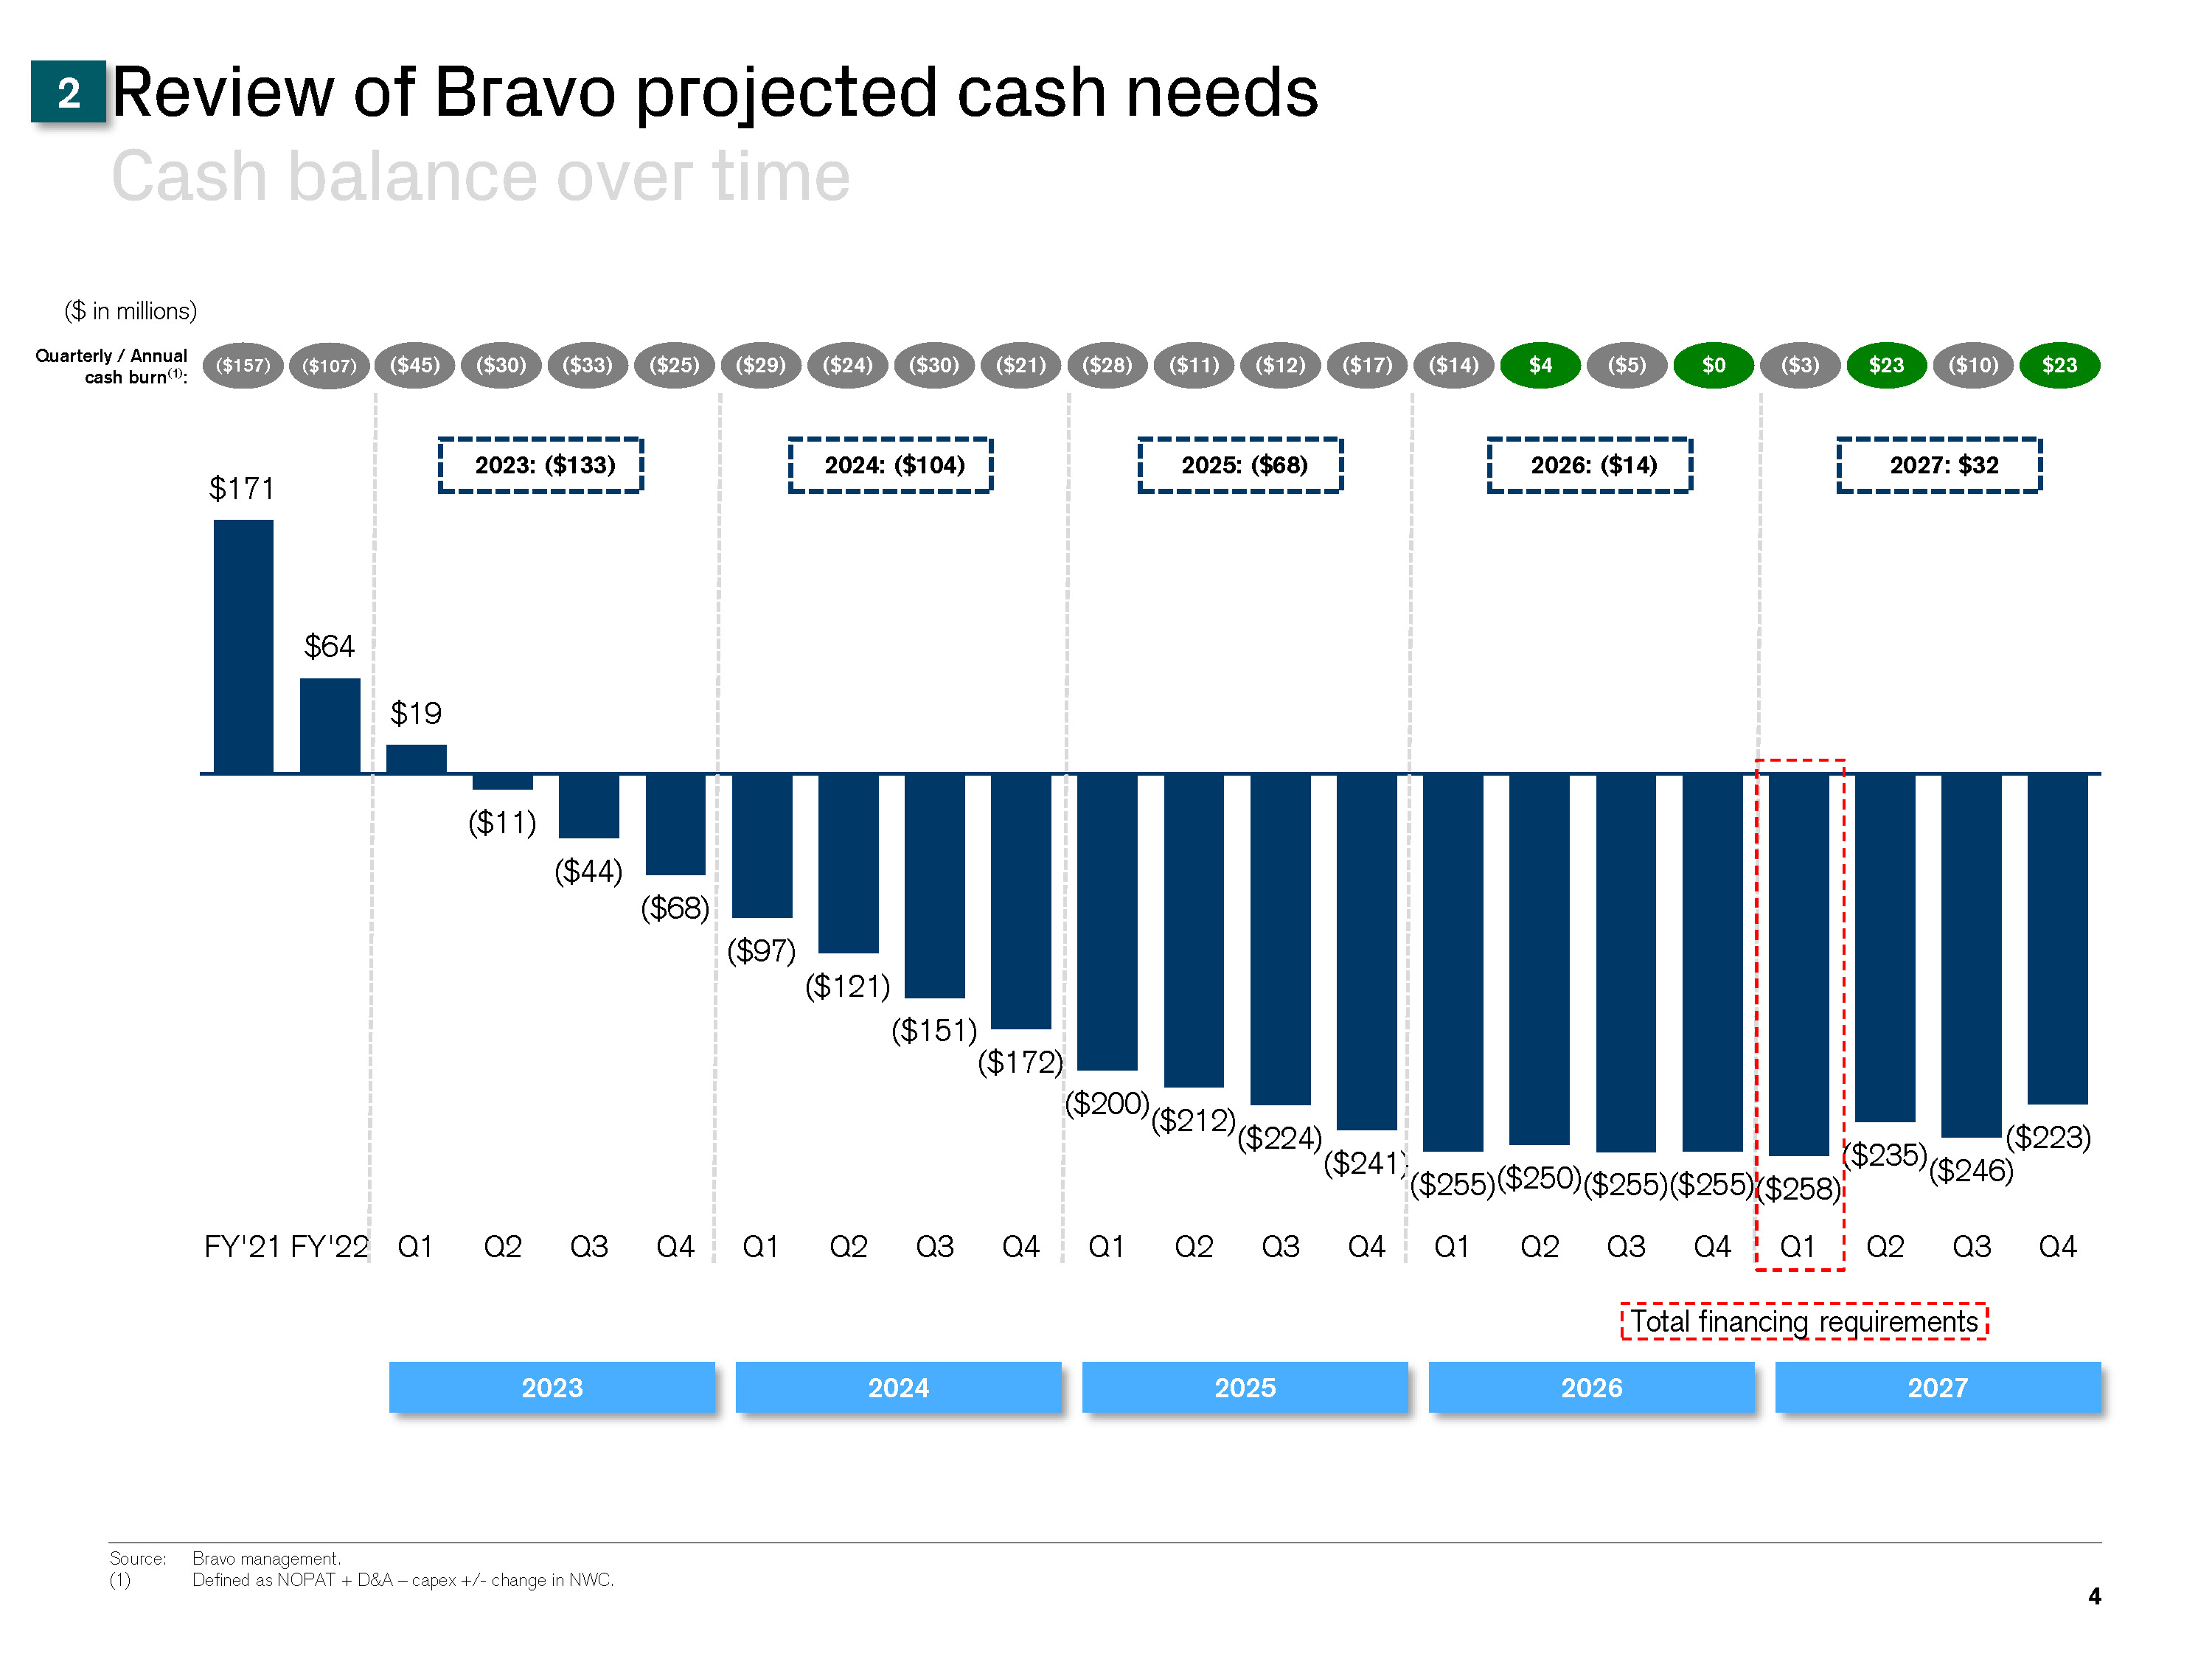
I Draft I N:\IBD_Regional_Documents_Repository_AM_Clients\Berkshire Grey(BQWF)\Spider\S03939\01. PPT\SoftBank\Project Flash_BoD_v14.pptx 4 Review of Bravo projected cash needs Cash balance over time $171 $64 $19 ($11) ($44) ($68) ($97) ($121) ($151) ($172) ($200)($212)($224) ($235)($246) ($223) FY'21 FY'22 ($241)($255)($250)($255)($255) Q1 Q2 Q3 Q4 Q1 Q2 Q3 Q4 Q1 Q2 Q3 Q4 Q1 Q2 Q3 Q4 ($258) Q1 Q2 Q3 Q4 ($25) ($33) ($30) ($45) ($21) ($30) ($24) ($29) ($17) ($12) ($11) ($28) ($3) ($5) ($14) 2023 2024 2025 2026 ($ in millions) $23 ($10) $23 $0 $4 2027 Source: Bravo management. (1) Defined as NOPAT + D&A – capex +/- change in NWC. ($157) ($107) Total financing requirements 2023: ($133) 2024: ($104) 2025: ($68) 2026: ($14) 2027: $32 Quarterly / Annual cash burn(1): 2
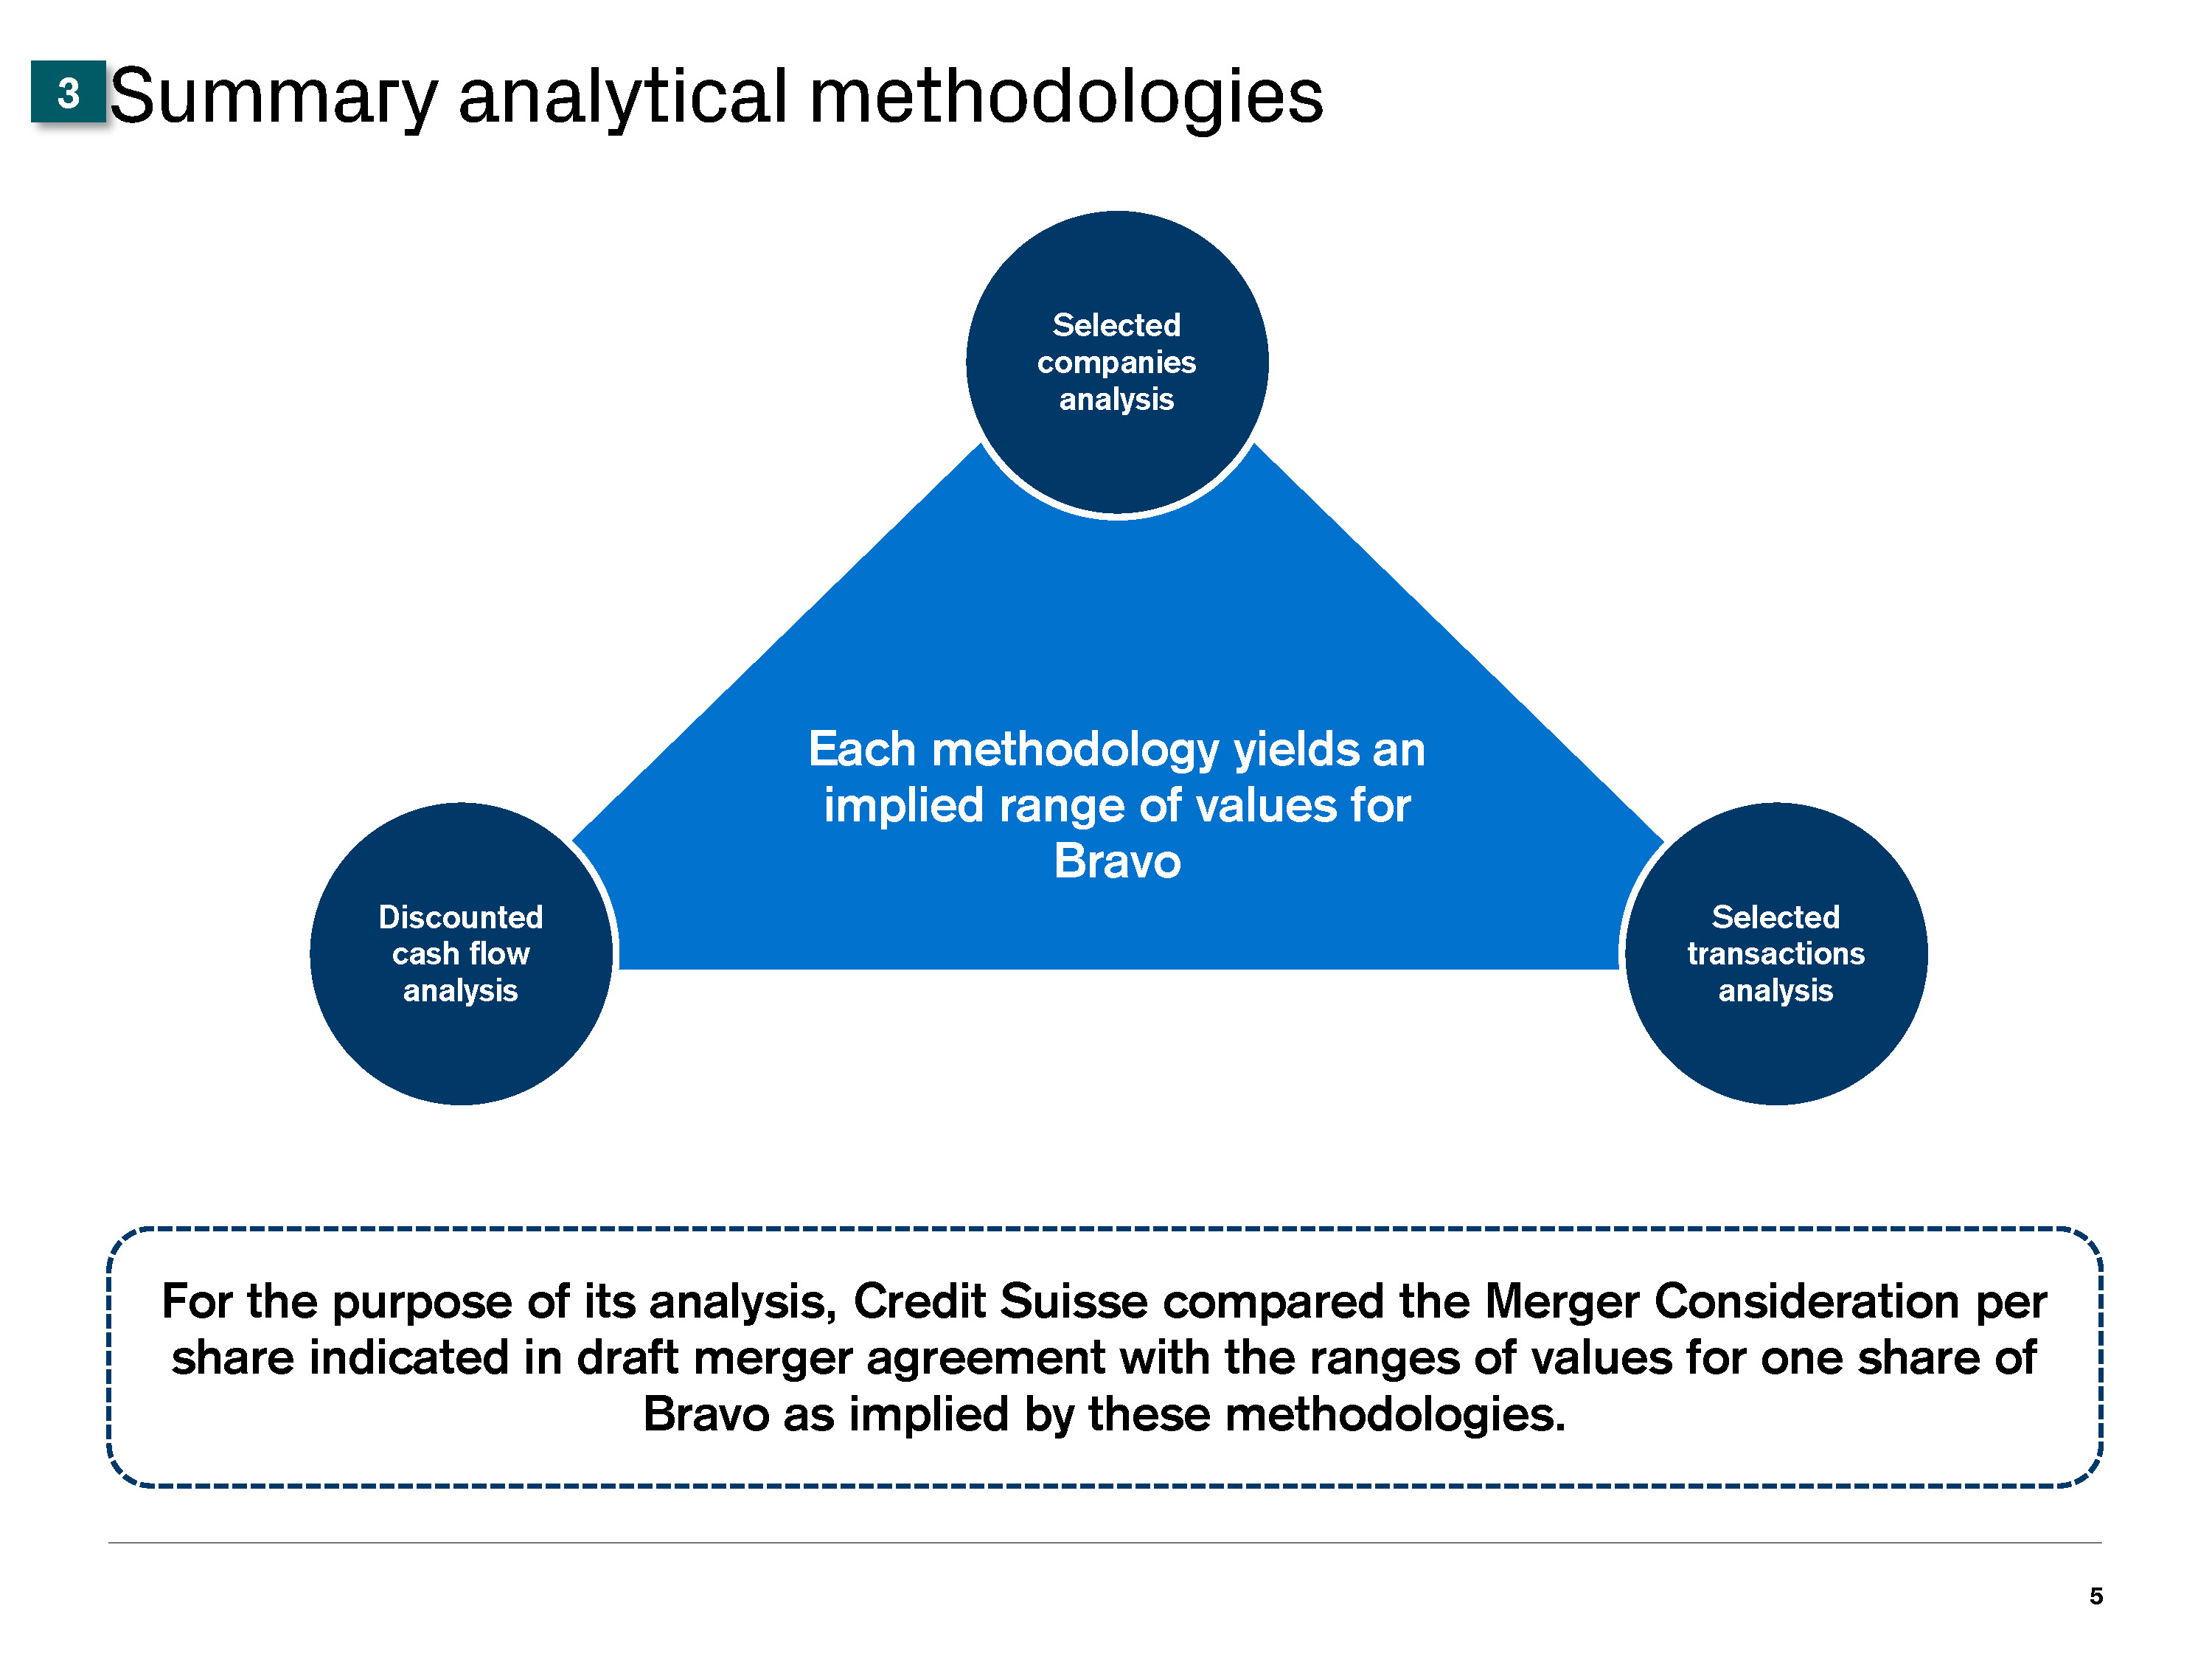
I Draft I N:\IBD_Regional_Documents_Repository_AM_Clients\Berkshire Grey(BQWF)\Spider\S03939\01. PPT\SoftBank\Project Flash_BoD_v14.pptx Each methodology yields an implied range of values for Bravo Selected companies analysis 5 Summary analytical methodologies For the purpose of its analysis, Credit Suisse compared the Merger Consideration per share indicated in draft merger agreement with the ranges of values for one share of Bravo as implied by these methodologies. Discounted cash flow analysis Selected transactions analysis 3
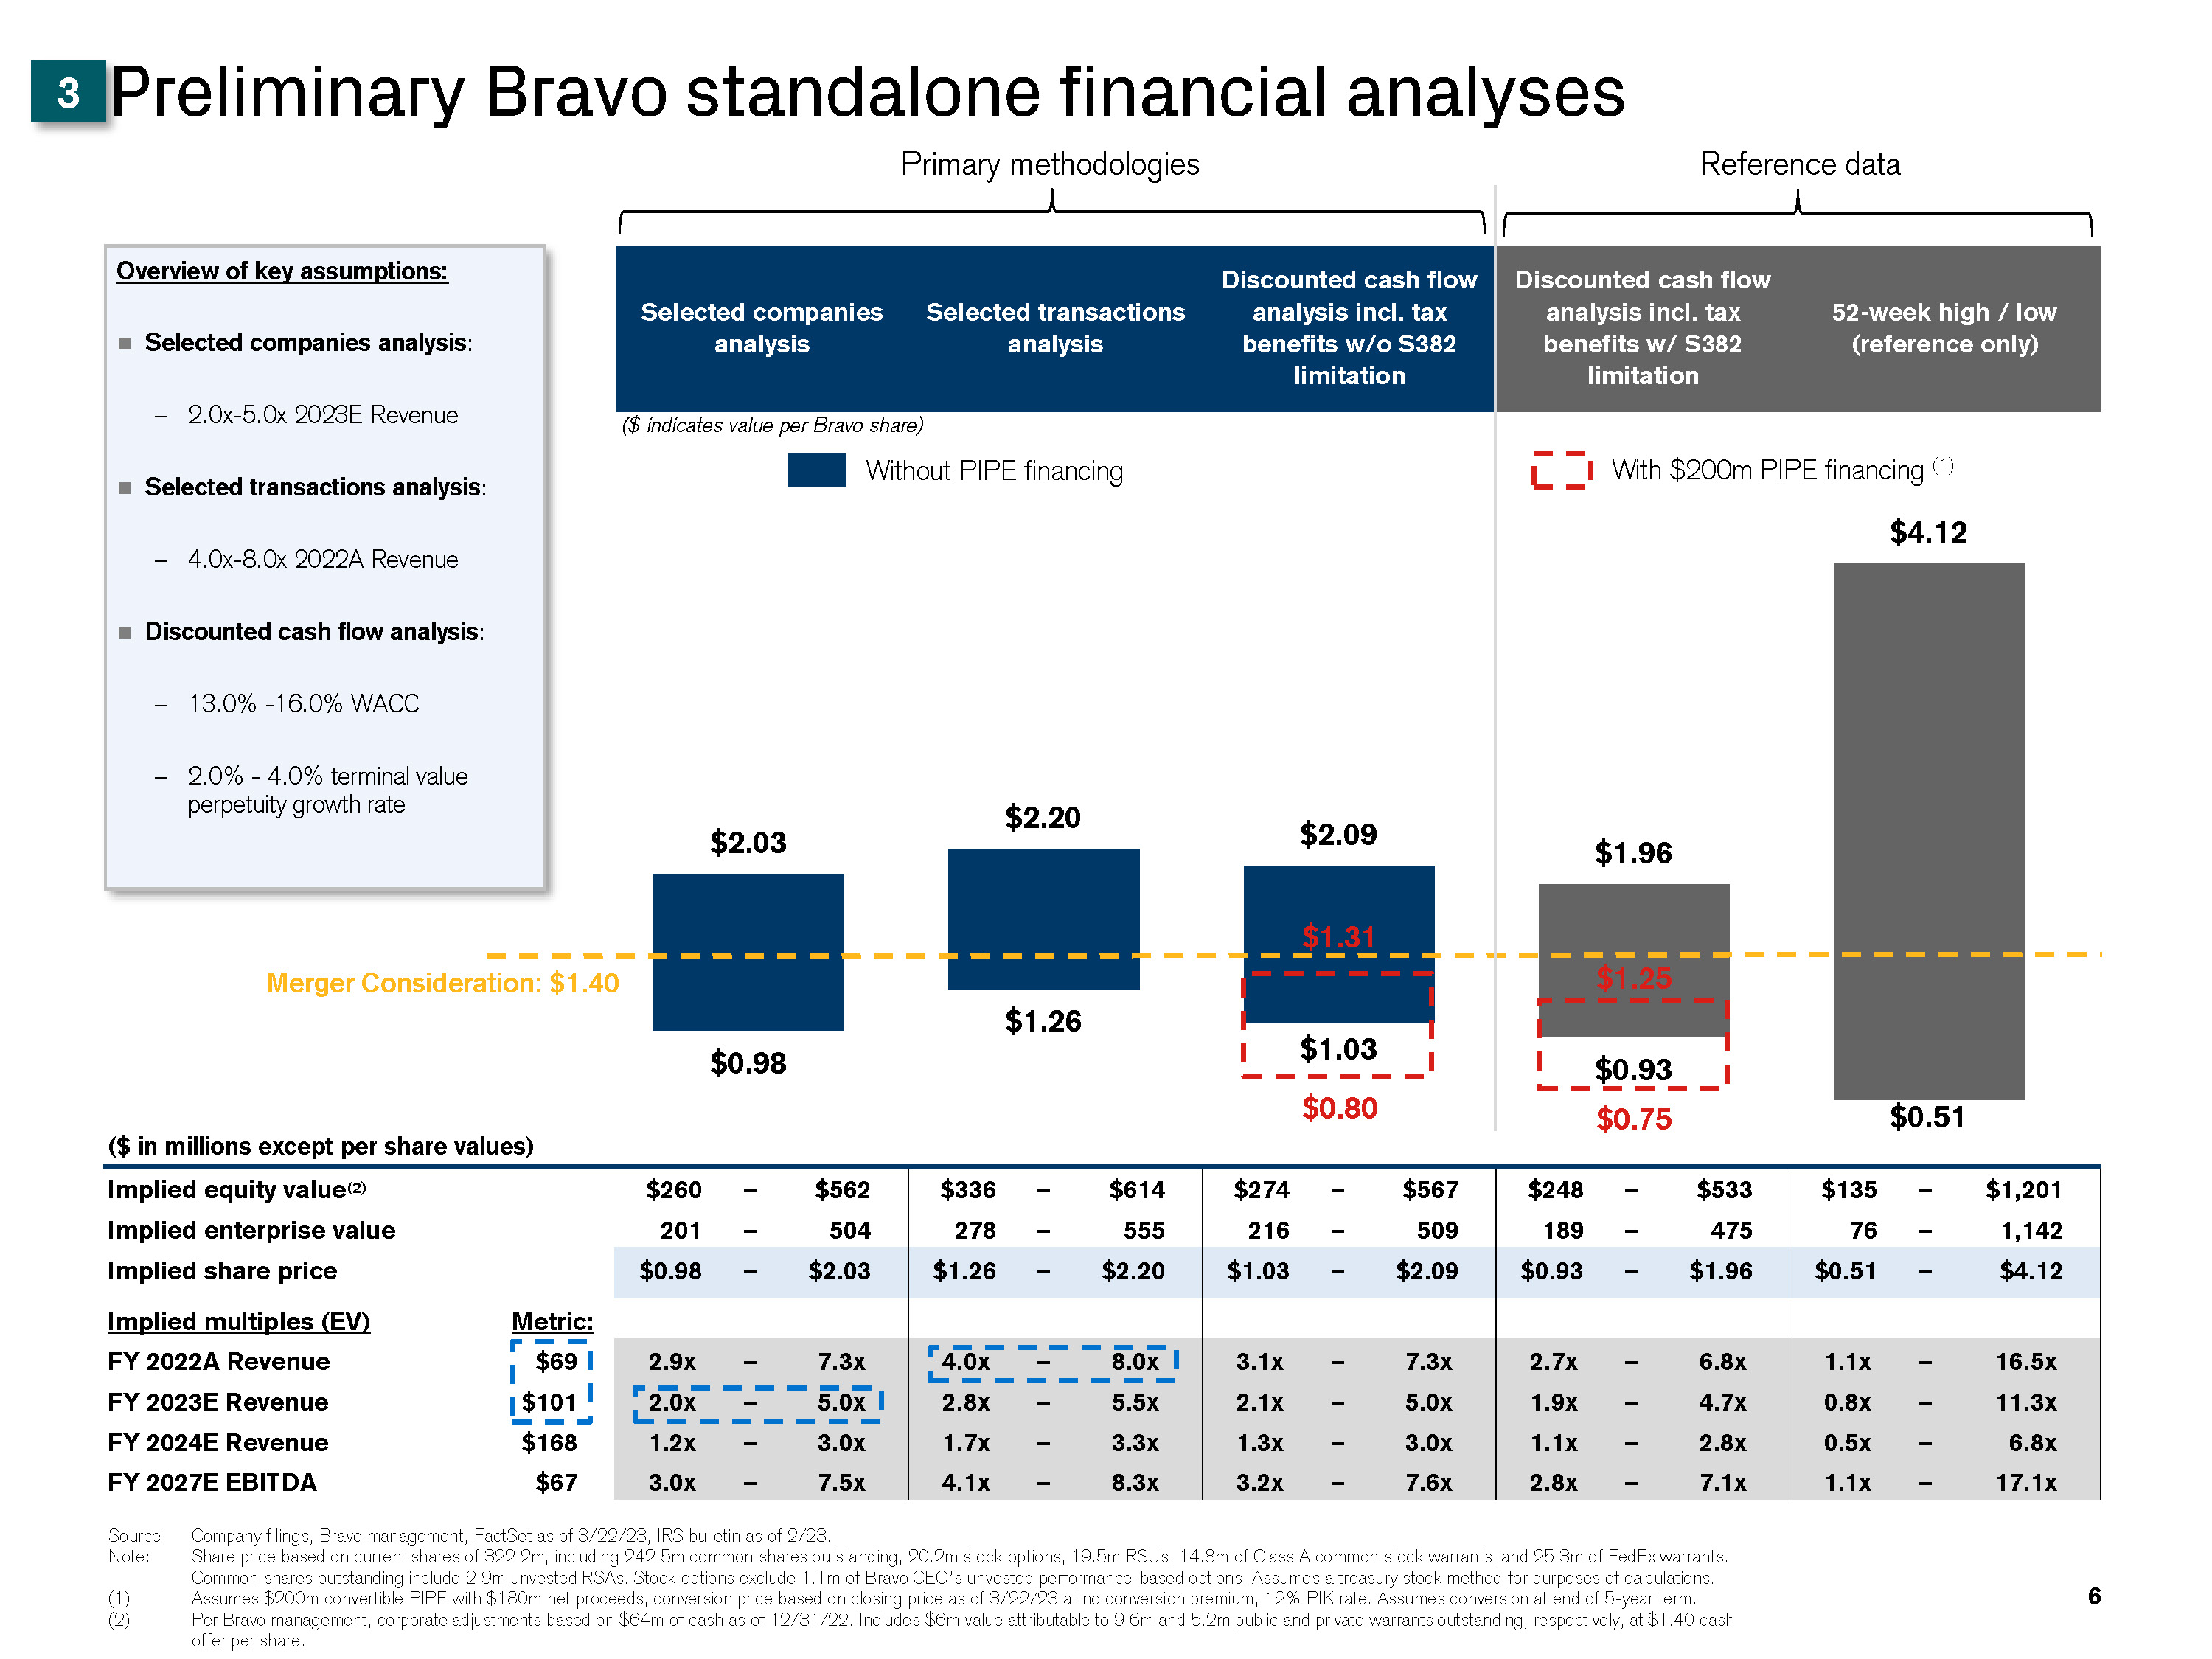
I Draft I N:\IBD_Regional_Documents_Repository_AM_Clients\Berkshire Grey(BQWF)\Spider\S03939\01. PPT\SoftBank\Project Flash_BoD_v14.pptx ($ in millions except per share values) Implied equity value(2) $260 – $562 $336 – $614 $274 – $567 $248 – $533 $135 – $1,201 Implied enterprise value 201 – 504 278 – 555 216 – 509 189 – 475 76 – 1,142 Implied share price $0.98 – $2.03 $1.26 – $2.20 $1.03 – $2.09 $0.93 – $1.96 $0.51 – $4.12 Implied multiples (EV) Metric: FY 2022A Revenue $69 2.9x – 7.3x 4.0x – 8.0x 3.1x – 7.3x 2.7x – 6.8x 1.1x – 16.5x FY 2023E Revenue $101 2.0x – 5.0x 2.8x – 5.5x 2.1x – 5.0x 1.9x – 4.7x 0.8x – 11.3x FY 2024E Revenue $168 1.2x – 3.0x 1.7x – 3.3x 1.3x – 3.0x 1.1x – 2.8x 0.5x – 6.8x FY 2027E EBITDA $67 3.0x – 7.5x 4.1x – 8.3x 3.2x – 7.6x 2.8x – 7.1x 1.1x – 17.1x $0.98 $1.26 $1.03 $0.93 $0.51 $2.03 $2.20 $2.09 $1.96 $4.12 Discounted cash flow analysis incl. tax 52-week high / low benefits w/ S382 (reference only) limitation Discounted cash flow Selected companies Selected transactions analysis incl. tax analysis analysis benefits w/o S382 limitation 6 Preliminary Bravo standalone financial analyses Primary methodologies Source: Company filings, Bravo management, FactSet as of 3/22/23, IRS bulletin as of 2/23. Note: Share price based on current shares of 322.2m, including 242.5m common shares outstanding, 20.2m stock options, 19.5m RSUs, 14.8m of Class A common stock warrants, and 25.3m of FedEx warrants. Common shares outstanding include 2.9m unvested RSAs. Stock options exclude 1.1m of Bravo CEO’s unvested performance-based options. Assumes a treasury stock method for purposes of calculations. Assumes $200m convertible PIPE with $180m net proceeds, conversion price based on closing price as of 3/22/23 at no conversion premium, 12% PIK rate. Assumes conversion at end of 5-year term. Per Bravo management, corporate adjustments based on $64m of cash as of 12/31/22. Includes $6m value attributable to 9.6m and 5.2m public and private warrants outstanding, respectively, at $1.40 cash offer per share. Overview of key assumptions: Selected companies analysis: − 2.0x-5.0x 2023E Revenue Selected transactions analysis: − 4.0x-8.0x 2022A Revenue Discounted cash flow analysis: − 13.0% -16.0% WACC − 2.0% - 4.0% terminal value perpetuity growth rate $0.75 $1.25 $0.80 $1.31 With $200m PIPE financing (1) Reference data Merger Consideration: $1.40 ($ indicates value per Bravo share) Without PIPE financing 3
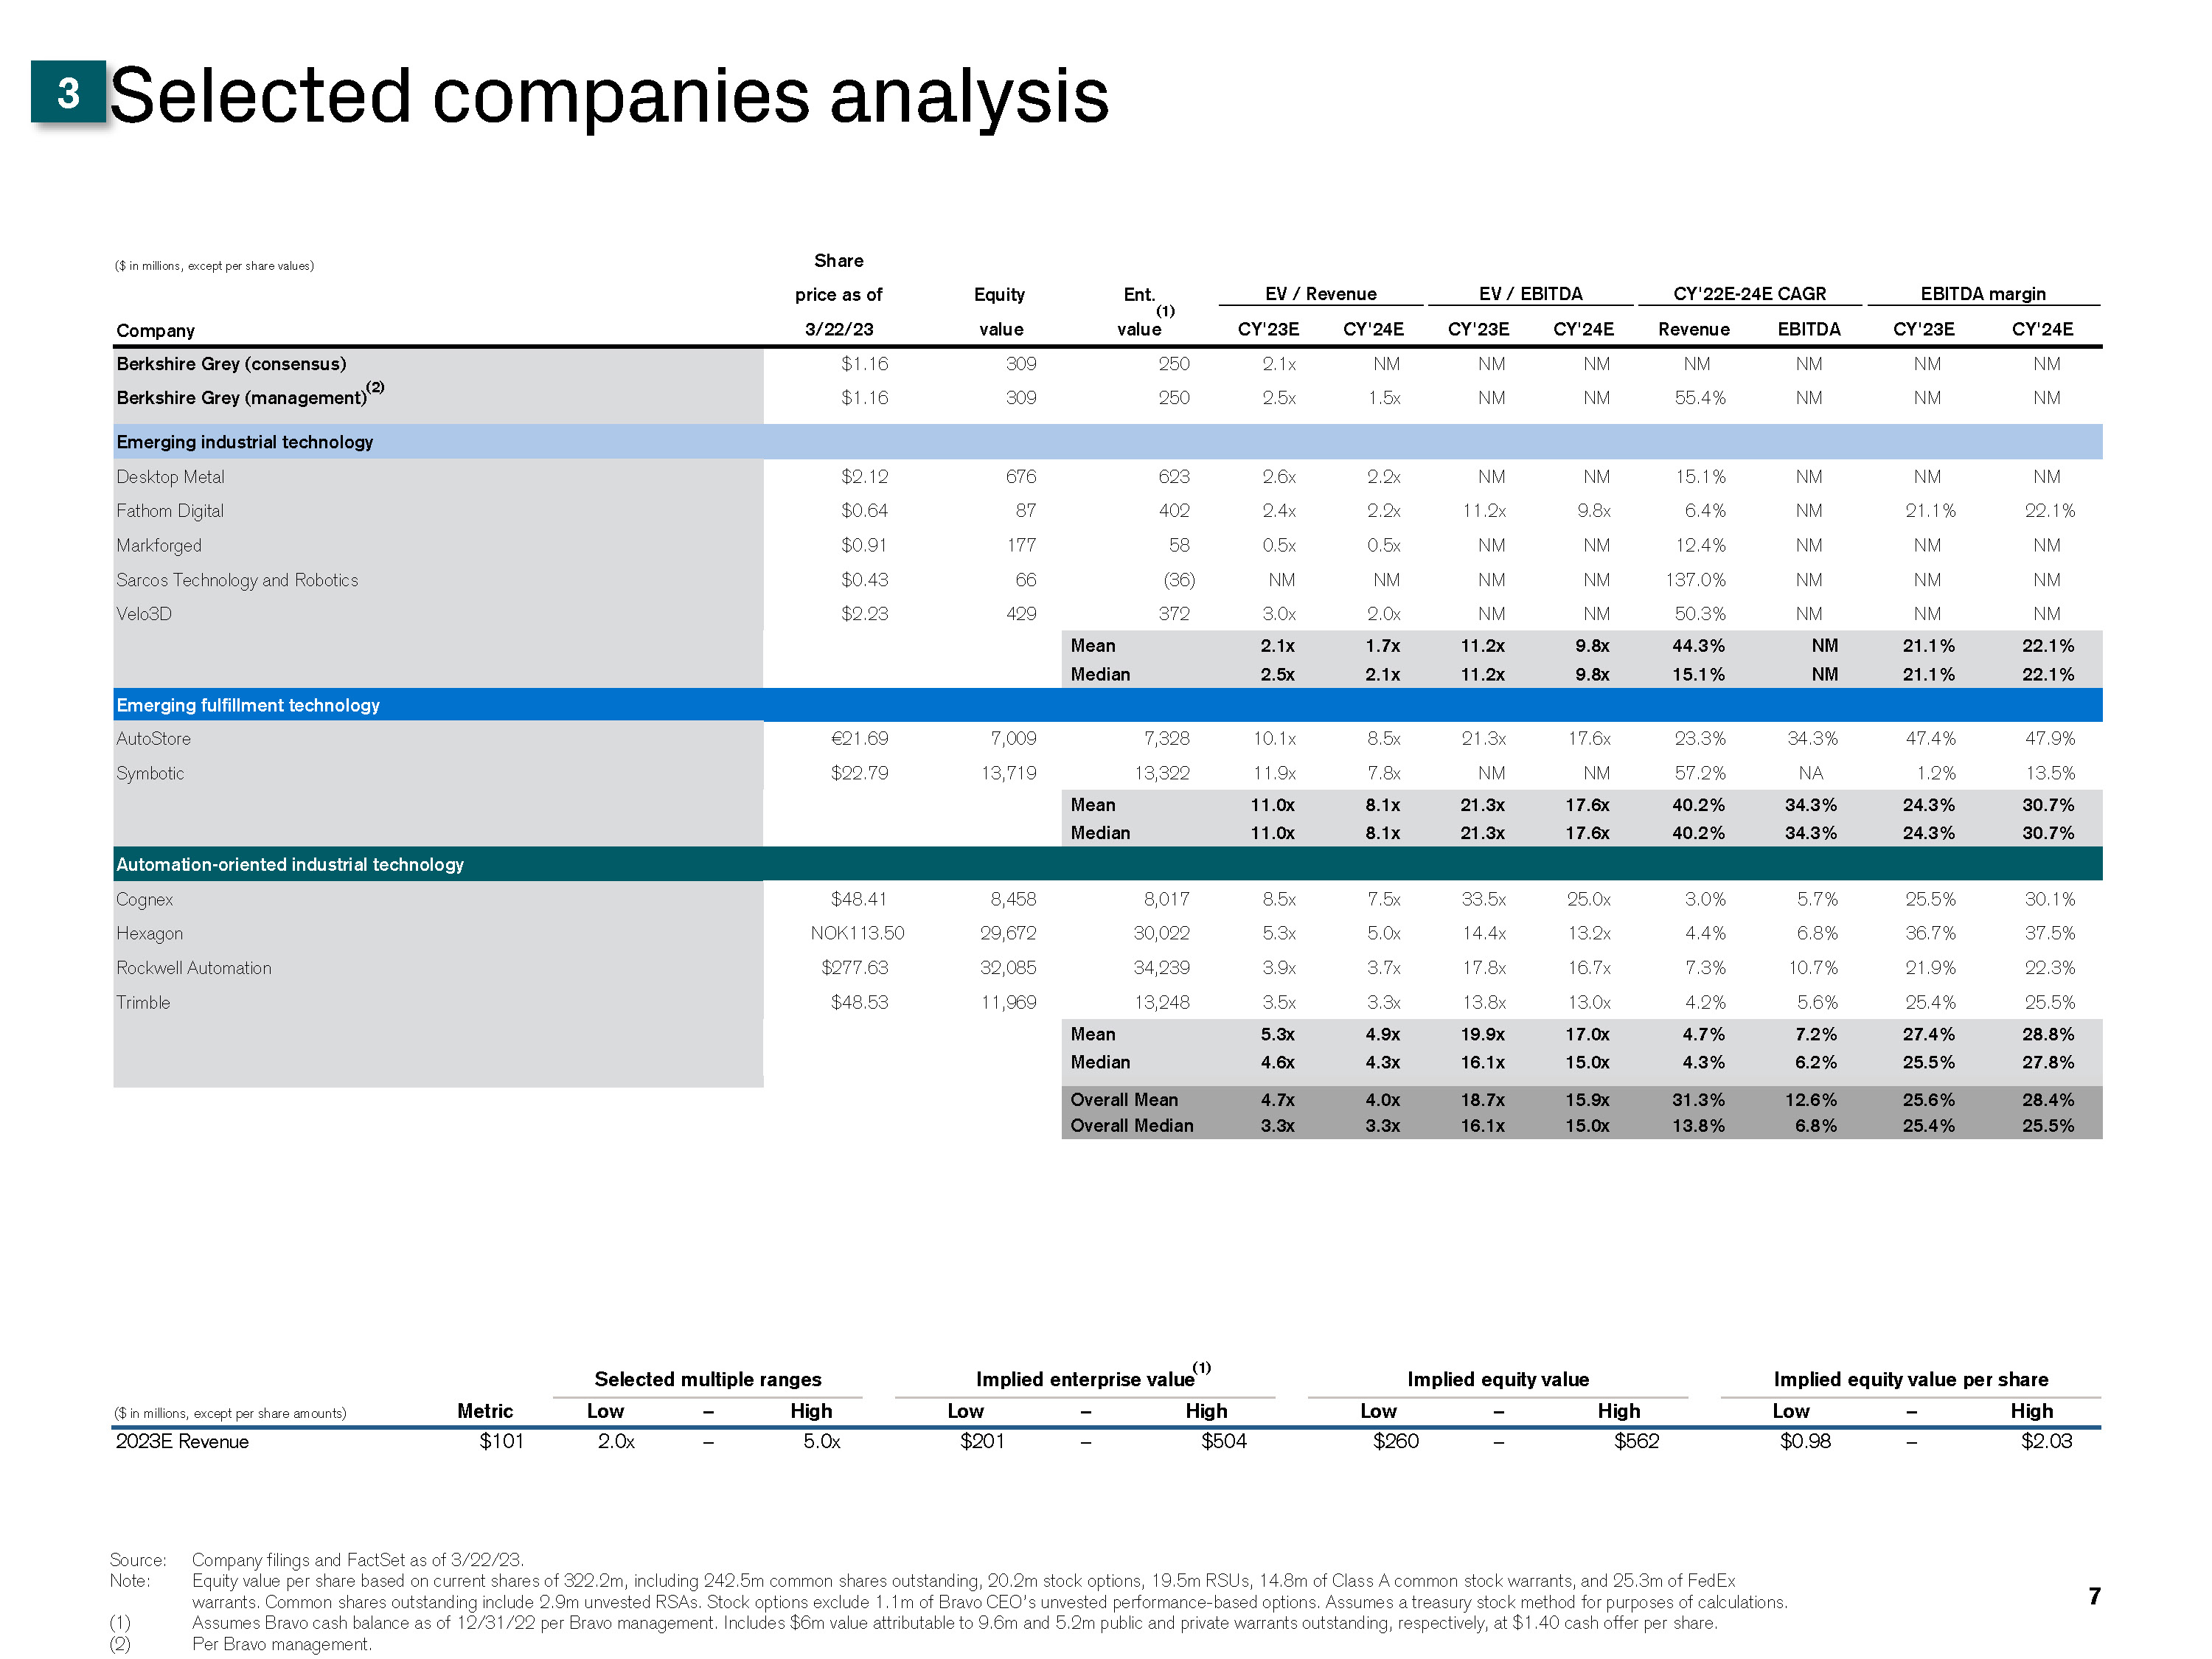
I Draft I N:\IBD_Regional_Documents_Repository_AM_Clients\Berkshire Grey(BQWF)\Spider\S03939\01. PPT\SoftBank\Project Flash_BoD_v14.pptx ($ in millions, except per share values) Company Share price as of 3/22/23 Equity value EV / Revenue EV / EBITDA CY'22E-24E CAGR EBITDA margin CY'23E CY'24E CY'23E CY'24E Revenue EBITDA CY'23E CY'24E Overall Mean 4.7x 4.0x 18.7x 15.9x 31.3% 12.6% 25.6% 28.4% Overall Median 3.3x 3.3x 16.1x 15.0x 13.8% 6.8% 25.4% 25.5% 7 Selected companies analysis Source: Company filings and FactSet as of 3/22/23. Note: Equity value per share based on current shares of 322.2m, including 242.5m common shares outstanding, 20.2m stock options, 19.5m RSUs, 14.8m of Class A common stock warrants, and 25.3m of FedEx warrants. Common shares outstanding include 2.9m unvested RSAs. Stock options exclude 1.1m of Bravo CEO’s unvested performance-based options. Assumes a treasury stock method for purposes of calculations. Assumes Bravo cash balance as of 12/31/22 per Bravo management. Includes $6m value attributable to 9.6m and 5.2m public and private warrants outstanding, respectively, at $1.40 cash offer per share. Per Bravo management. Ent. (1) value Berkshire Grey (consensus) Berkshire Grey (managemen (2) t) $1.16 $1.16 309 309 250 250 2.1x 2.5x NM 1.5x NM NM NM NM NM 55.4% NM NM NM NM NM NM Emerging industrial technology Desktop Metal $2.12 676 623 2.6x 2.2x NM NM 15.1% NM NM NM Fathom Digital $0.64 87 402 2.4x 2.2x 11.2x 9.8x 6.4% NM 21.1% 22.1% Markforged $0.91 177 58 0.5x 0.5x NM NM 12.4% NM NM NM Sarcos Technology and Robotics $0.43 66 (36) NM NM NM NM 137.0% NM NM NM Velo3D $2.23 429 372 3.0x 2.0x NM NM 50.3% NM NM NM Mean Median 2.1x 2.5x 1.7x 2.1x 11.2x 11.2x 9.8x 9.8x 44.3% 15.1% NM NM 21.1% 21.1% 22.1% 22.1% Emerging fulfillment technology AutoStore €21.69 7,009 7,328 10.1x 8.5x 21.3x 17.6x 23.3% 34.3% 47.4% 47.9% Symbotic $22.79 13,719 13,322 11.9x 7.8x NM NM 57.2% NA 1.2% 13.5% Mean 11.0x 8.1x 21.3x 17.6x 40.2% 34.3% 24.3% 30.7% Median 11.0x 8.1x 21.3x 17.6x 40.2% 34.3% 24.3% 30.7% Automation-oriented industrial technology Cognex $48.41 8,458 8,017 8.5x 7.5x 33.5x 25.0x 3.0% 5.7% 25.5% 30.1% Hexagon NOK113.50 29,672 30,022 5.3x 5.0x 14.4x 13.2x 4.4% 6.8% 36.7% 37.5% Rockwell Automation $277.63 32,085 34,239 3.9x 3.7x 17.8x 16.7x 7.3% 10.7% 21.9% 22.3% Trimble $48.53 11,969 13,248 3.5x 3.3x 13.8x 13.0x 4.2% 5.6% 25.4% 25.5% Mean 5.3x 4.9x 19.9x 17.0x 4.7% 7.2% 27.4% 28.8% Median 4.6x 4.3x 16.1x 15.0x 4.3% 6.2% 25.5% 27.8% Selected multiple ranges Implied enterprise value(1) Implied equity value Implied equity value per share ($ in millions, except per share amounts) Metric Low – High Low – High Low – High Low – High 2023E Revenue $101 2.0x – 5.0x $201 – $504 $260 – $562 $0.98 – $2.03 3
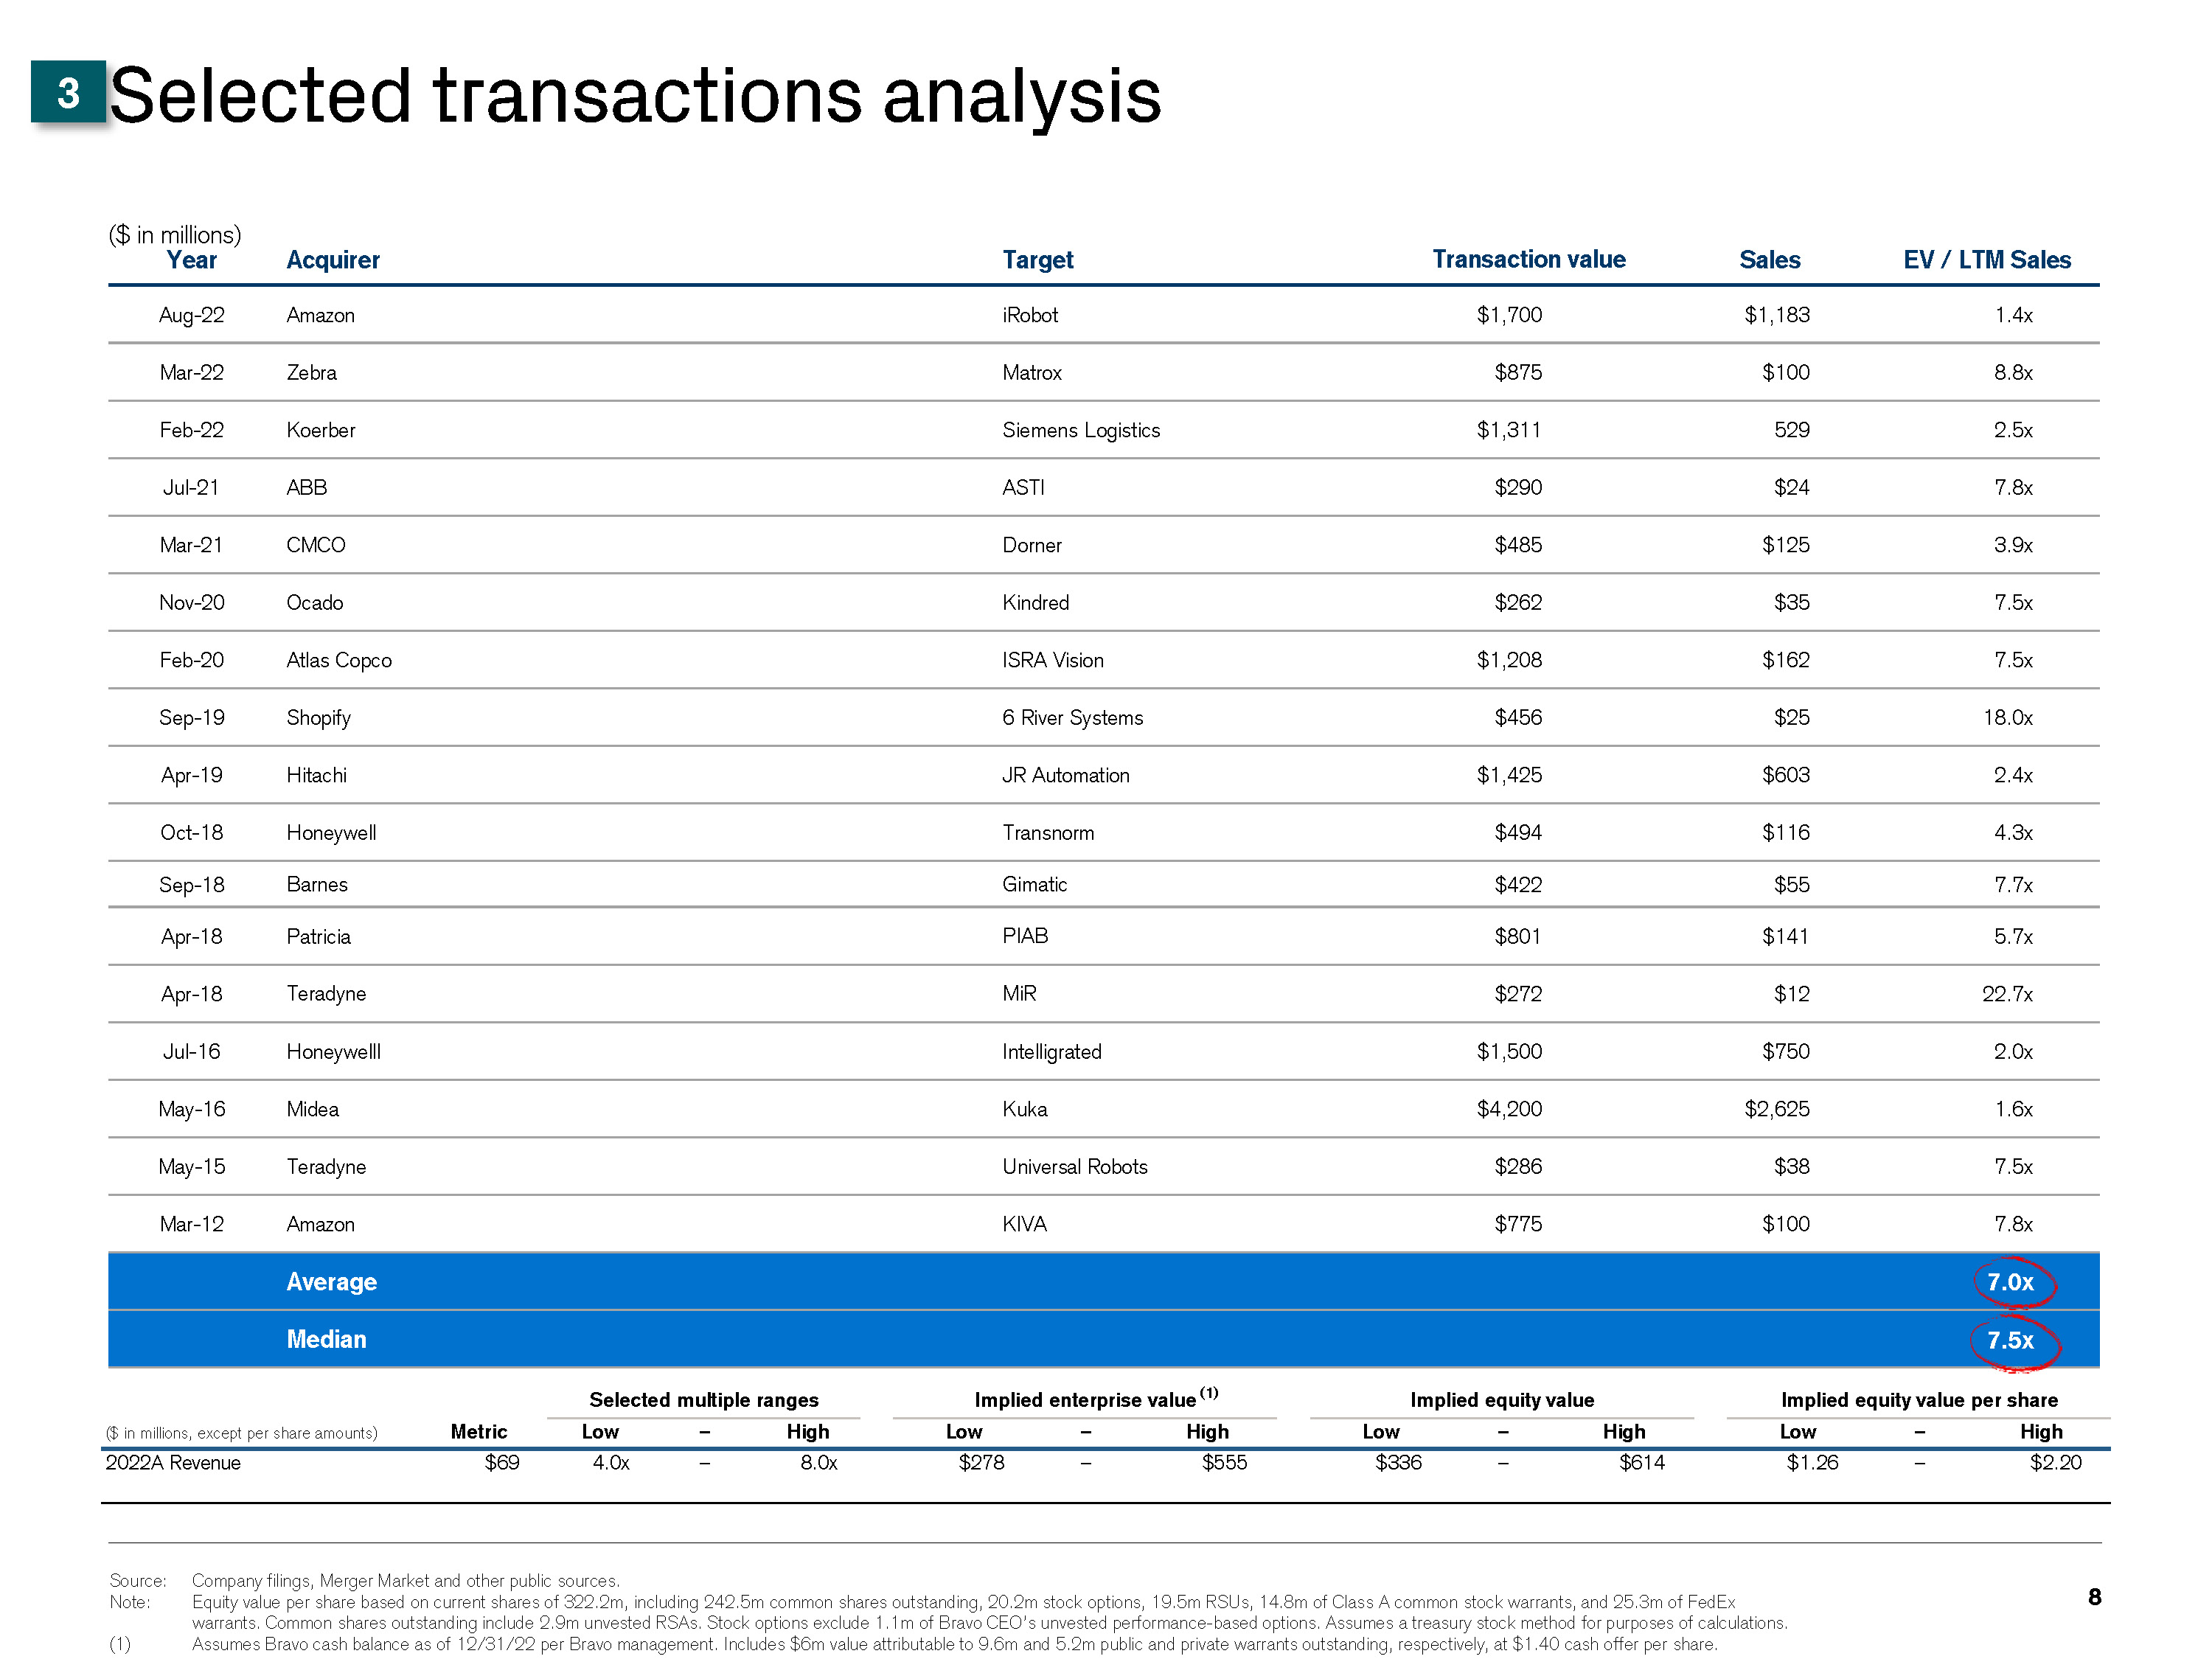
I Draft I N:\IBD_Regional_Documents_Repository_AM_Clients\Berkshire Grey(BQWF)\Spider\S03939\01. PPT\SoftBank\Project Flash_BoD_v14.pptx Year Acquirer Target Transaction value Sales EV / LTM Sales Aug-22 Amazon iRobot $1,700 $1,183 1.4x Mar-22 Zebra Matrox $875 $100 8.8x Feb-22 Koerber Siemens Logistics $1,311 529 2.5x Jul-21 ABB ASTI $290 $24 7.8x Mar-21 CMCO Dorner $485 $125 3.9x Nov-20 Ocado Kindred $262 $35 7.5x Feb-20 Atlas Copco ISRA Vision $1,208 $162 7.5x Sep-19 Shopify 6 River Systems $456 $25 18.0x Apr-19 Hitachi JR Automation $1,425 $603 2.4x Oct-18 Honeywell Transnorm $494 $116 4.3x Sep-18 Barnes Gimatic $422 $55 7.7x Apr-18 Patricia PIAB $801 $141 5.7x Apr-18 Teradyne MiR $272 $12 22.7x Jul-16 Honeywelll Intelligrated $1,500 $750 2.0x May-16 Midea Kuka $4,200 $2,625 1.6x May-15 Teradyne Universal Robots $286 $38 7.5x Mar-12 Amazon KIVA $775 $100 7.8x Average 7.0x Median 7.5x 8 Selected transactions analysis Selected multiple ranges Implied enterprise value (1) Implied equity value Implied equity value per share ($ in millions, except per share amounts) Metric Low – High Low – High Low – High Low – High 2022A Revenue $69 4.0x – 8.0x $278 – $555 $336 – $614 $1.26 – $2.20 Source: Company filings, Merger Market and other public sources. Note: Equity value per share based on current shares of 322.2m, including 242.5m common shares outstanding, 20.2m stock options, 19.5m RSUs, 14.8m of Class A common stock warrants, and 25.3m of FedEx warrants. Common shares outstanding include 2.9m unvested RSAs. Stock options exclude 1.1m of Bravo CEO’s unvested performance-based options. Assumes a treasury stock method for purposes of calculations. (1) Assumes Bravo cash balance as of 12/31/22 per Bravo management. Includes $6m value attributable to 9.6m and 5.2m public and private warrants outstanding, respectively, at $1.40 cash offer per share. ($ in millions) 3

I Draft I N:\IBD_Regional_Documents_Repository_AM_Clients\Berkshire Grey(BQWF)\Spider\S03939\01. PPT\SoftBank\Project Flash_BoD_v14.pptx 10-year DCF discounted to 12/31/2022 − Mid-year discounting convention Assumes unlevered free cash flow projections discounted using assumed 13.0%-16.0% WACC Assumes 2.0%-4.0% terminal value perpetuity growth rate per Bravo management Assumes tax rate of 29.0% per Bravo management 9 Sensitivities Discount Perpetuity growth rate rate (%) 2.0% 3.0% 4.0% Assumptions Source: Company filings, Bravo management. Note: Fully diluted shares based on current shares of 322.2m, including 242.5m common shares outstanding, 20.2m stock options, 19.5m RSUs, 14.8m of Class A common stock warrants, and 25.3m of FedEx warrants. Common shares outstanding include 2.9m unvested RSAs. Stock options exclude 1.1m of Bravo CEO’s unvested performance-based options. Assumes a treasury stock method for purposes of calculations. Burdened by SBC. Assumes Bravo cash balance as of 12/31/22 per Bravo management. Includes $6m value attributable to 9.6m and 5.2m public and private warrants outstanding, respectively, at $1.40 cash offer per share. 13.0% ($88) 414 ($88) 455 ($88) 506 Present value of cash flows Present value of terminal value $326 127.0% 59 $367 124.0% 59 $418 121.1% 59 Enterprise value PV of terminal value as % of enterprise value Corporate Adjustments(2) $384 268.550 $1.43 $426 269.648 $1.58 $476 271.880 $1.75 Equity value Fully diluted shares Equity value per share 14.5% ($100) 321 ($100) 349 ($100) 382 PV of cash flows PV of terminal value $221 145.5% 59 $249 140.4% 59 $282 135.6% 59 Enterprise value PV of terminal value as % of enterprise value Corporate Adjustments(2) $279 265.758 $1.05 $307 266.093 $1.15 $341 267.275 $1.27 Equity value Fully diluted shares Equity value per share 16.0% ($111) 253 ($111) 273 ($111) 296 PV of cash flows PV of terminal value $142 178.2% 59 $162 168.8% 59 $184 160.3% 59 Enterprise value PV of terminal value as % of enterprise value Corporate Adjustments(2) $201 265.295 $0.76 $220 265.358 $0.83 $243 265.440 $0.92 Equity value Fully diluted shares Equity value per share Discounted cash flow analysis – excluding tax benefits ($ in millions, except per share amounts) 2022A Terminal 2033E '23E – '32E CAGR Calendar year ended 2023E 2024E 2025E 2026E 2027E 2028E 2029E 2030E 2031E 2032E Revenue $69 $101 $168 $282 $436 $639 $767 $882 $970 $1,043 $1,095 $1,128 % growth 45% 67% 68% 54% 47% 20% 15% 10% 8% 5% 3% EBITDA (1) ($107) ($116) ($100) ($59) ($7) $67 $93 $120 $148 $176 $202 $226 % margin (154%) (115%) (59%) (21%) (2%) 10% 12% 14% 15% 17% 18% 20% (–) Depreciation (4) (5) (5) (6) (8) (9) (11) (12) (13) (13) (14) EBIT ($119) ($104) ($64) ($13) $59 $83 $110 $136 $163 $188 $212 (–) Taxes – – – – (17) (24) (31) (39) (46) (54) (60) % tax rate 29% 29% 29% 29% 29% 29% 29% 29% 29% 29% 29% NOPAT ($119) ($104) ($64) ($13) $42 $60 $78 $97 $116 $135 $152 (+) Depreciation & amortization 4 5 5 6 8 9 11 12 13 13 14 (–) Capital expenditures (2) (4) (5) (5) (8) (9) (10) (11) (12) (13) (14) (–) Change in working capital (15) (0) (5) (3) (10) (16) (15) (12) (10) (8) (7) Unlevered free cash flow ($133) ($104) ($68) ($14) $32 $45 $65 $87 $107 $127 $145 30% NA 3
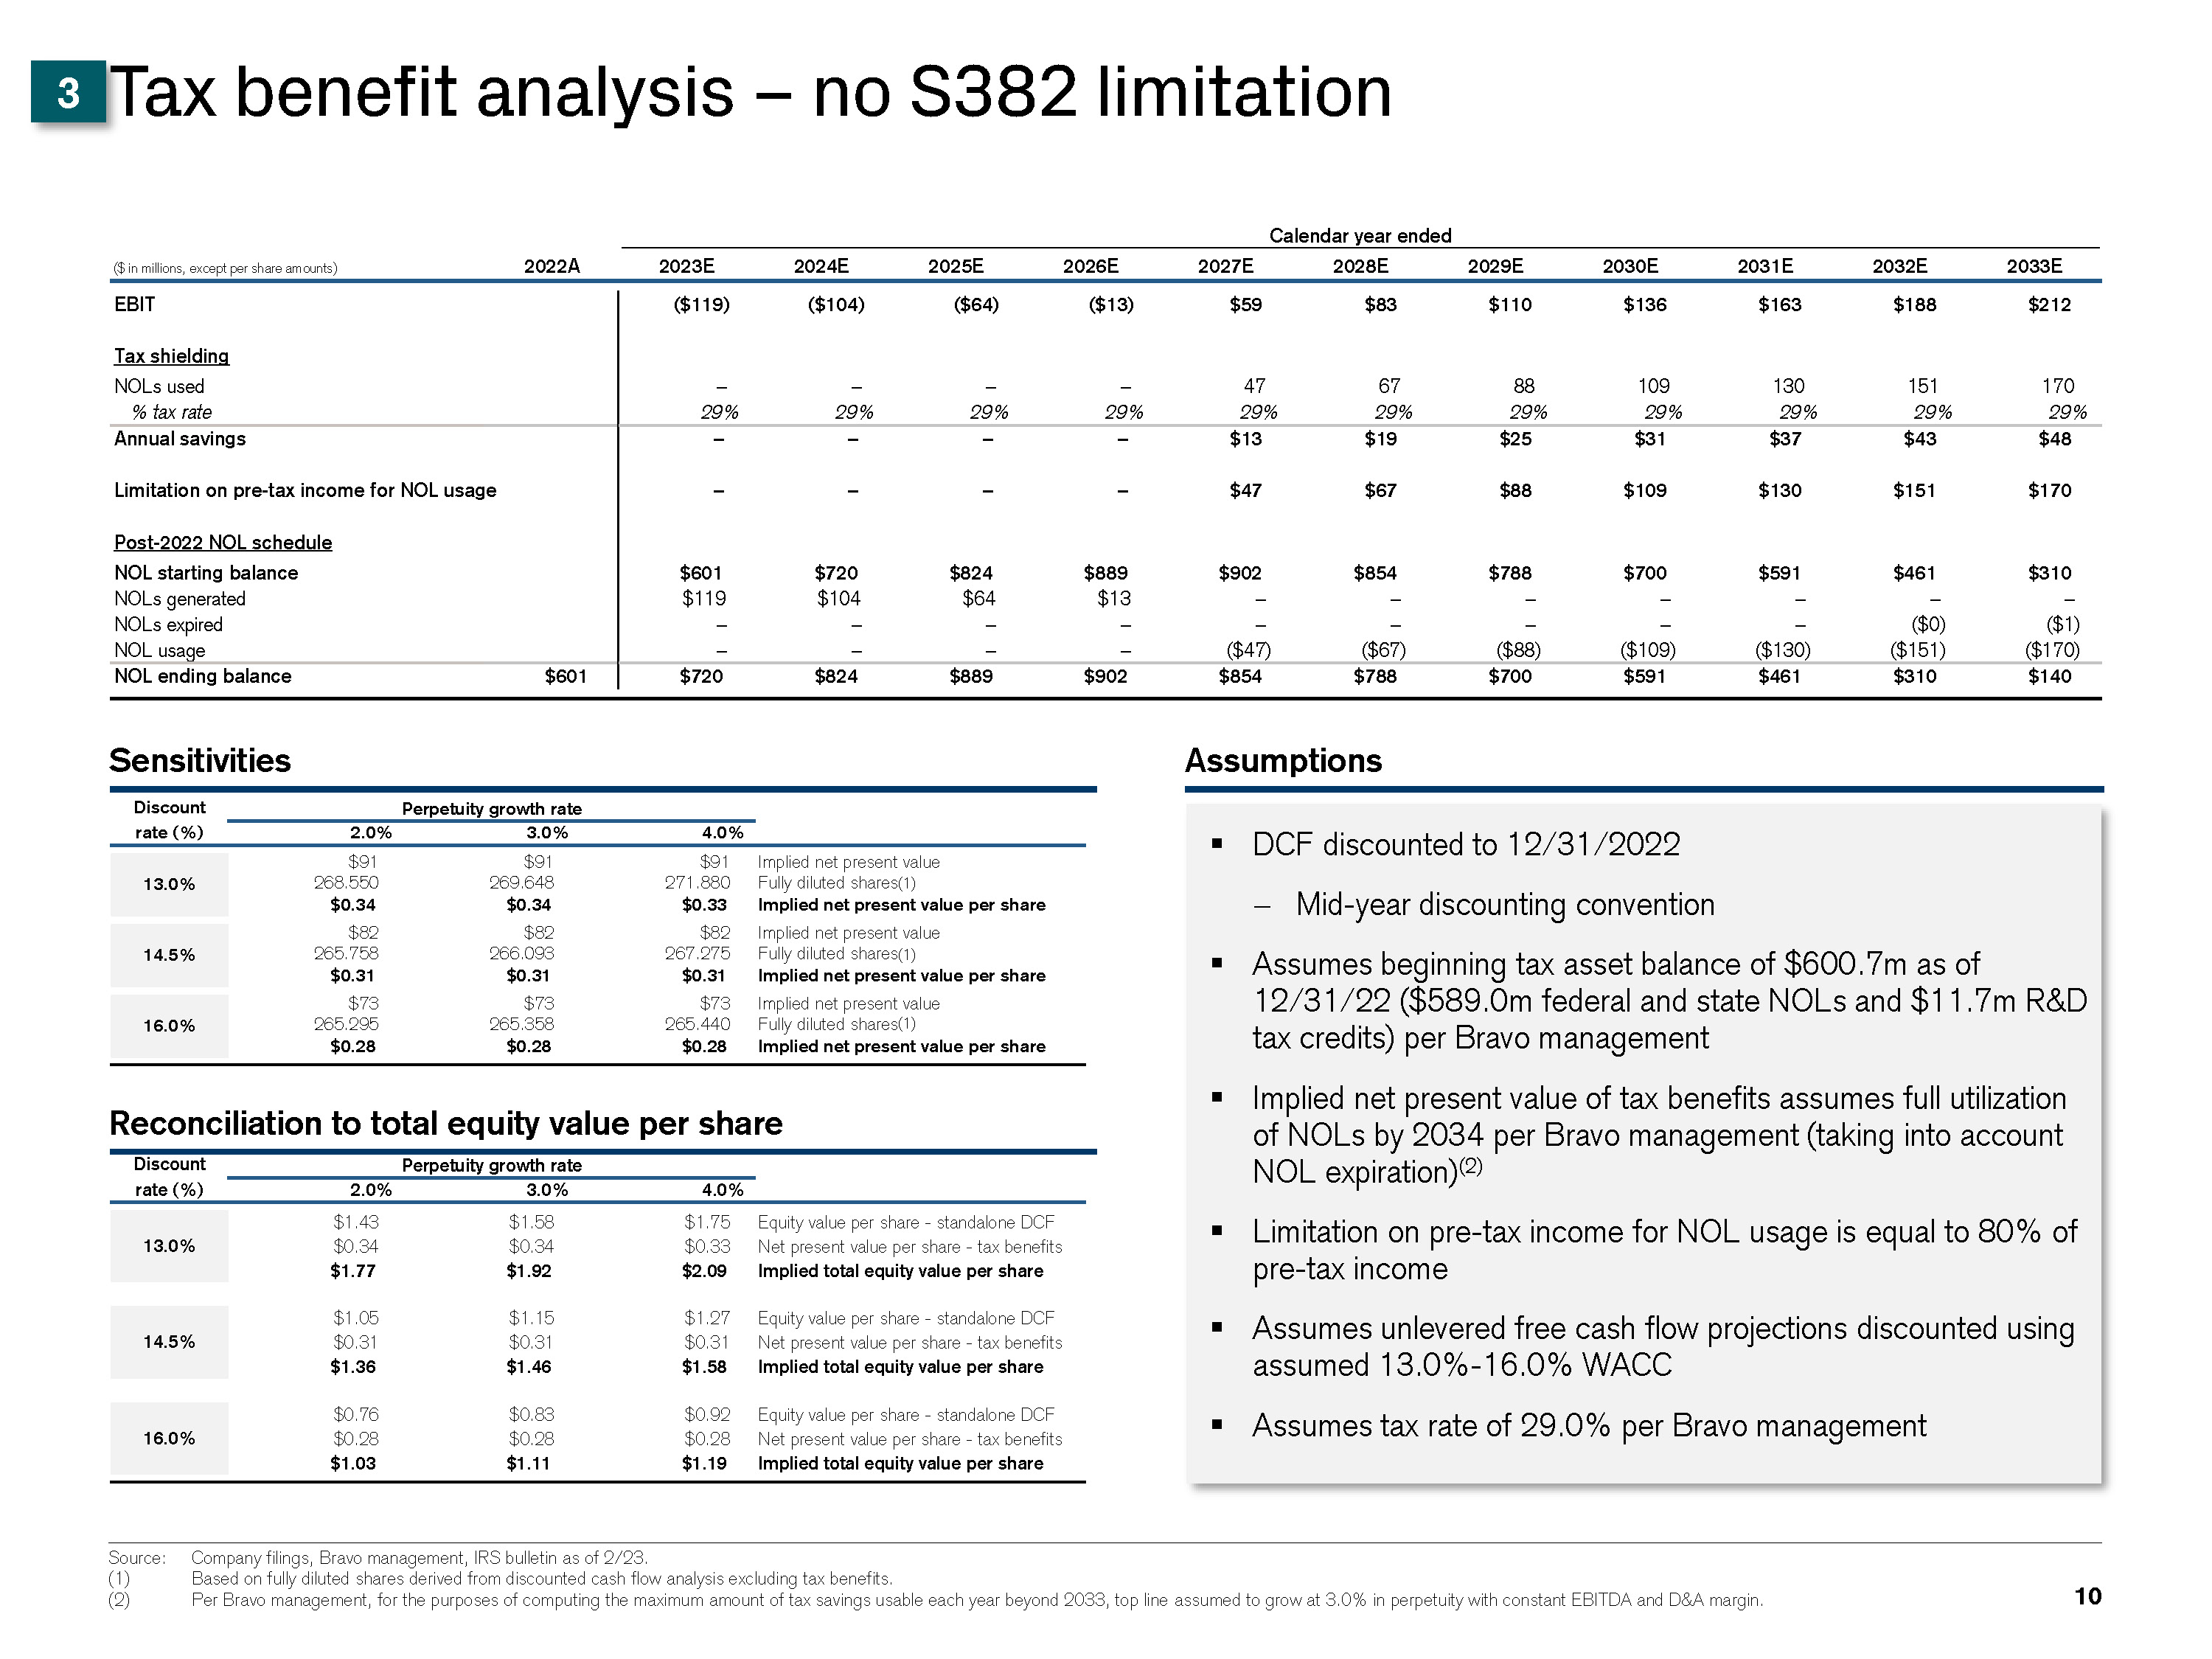
I Draft I N:\IBD_Regional_Documents_Repository_AM_Clients\Berkshire Grey(BQWF)\Spider\S03939\01. PPT\SoftBank\Project Flash_BoD_v14.pptx Tax benefit analysis – no S382 limitation DCF discounted to 12/31/2022 − Mid-year discounting convention Assumes beginning tax asset balance of $600.7m as of 12/31/22 ($589.0m federal and state NOLs and $11.7m R&D tax credits) per Bravo management Implied net present value of tax benefits assumes full utilization of NOLs by 2034 per Bravo management (taking into account NOL expiration)(2) Limitation on pre-tax income for NOL usage is equal to 80% of pre-tax income Assumes unlevered free cash flow projections discounted using assumed 13.0%-16.0% WACC Assumes tax rate of 29.0% per Bravo management 10 Sensitivities Discount Perpetuity growth rate rate (%) 2.0% 3.0% 4.0% Assumptions Source: Company filings, Bravo management, IRS bulletin as of 2/23. Based on fully diluted shares derived from discounted cash flow analysis excluding tax benefits. Per Bravo management, for the purposes of computing the maximum amount of tax savings usable each year beyond 2033, top line assumed to grow at 3.0% in perpetuity with constant EBITDA and D&A margin. (1) Reconciliation to total equity value per share (1) (1) ($ in millions, except per share amounts) 2022A Calendar year ended 2023E 2024E 2025E 2026E 2027E 2028E 2029E 2030E 2031E 2032E 2033E EBIT ($119) ($104) ($64) ($13) $59 $83 $110 $136 $163 $188 $212 Tax shielding NOLs used – – – – 47 67 88 109 130 151 170 % tax rate 29% 29% 29% 29% 29% 29% 29% 29% 29% 29% 29% Annual savings – – – – $13 $19 $25 $31 $37 $43 $48 Limitation on pre-tax income for NOL usage – – – – $47 $67 $88 $109 $130 $151 $170 Post-2022 NOL schedule NOL starting balance NOLs generated NOLs expired NOL usage $601 $119 – – $720 $104 – – $824 $64 – – $889 $13 – – $902 – – ($47) $854 – – ($67) $788 – – ($88) $700 – – ($109) $591 – – ($130) $461 – ($0) ($151) $310 – ($1) ($170) NOL ending balance $601 $720 $824 $889 $902 $854 $788 $700 $591 $461 $310 $140 3 $91 268.550 $0.34 $82 265.758 $0.31 $91 269.648 $0.34 $82 26 $91 Implied net 271.880 F $ 13.0% 14.5% 16.0% Discount Perpetuity growth rate rate (%) 2.0% 3.0% 4.0% $1.43 $1.58 $1.75 Equity value per share - standalone DCF 13.0% $0.34 $0.34 $0.33 Net present value per share - tax benefits $1.77 $1.92 $2.09 Implied total equity value per share $1.05 $1.15 $1.27 Equity value per share - standalone DCF 14.5% $0.31 $0.31 $0.31 Net present value per share - tax benefits $1.36 $1.46 $1.58 Implied total equity value per share $0.76 $0.83 $0.92 Equity value per share - standalone DCF 16.0% $0.28 $0.28 $0.28 Net present value per share - tax benefits $1.03 $1.11 $1.19 Implied total equity value per share
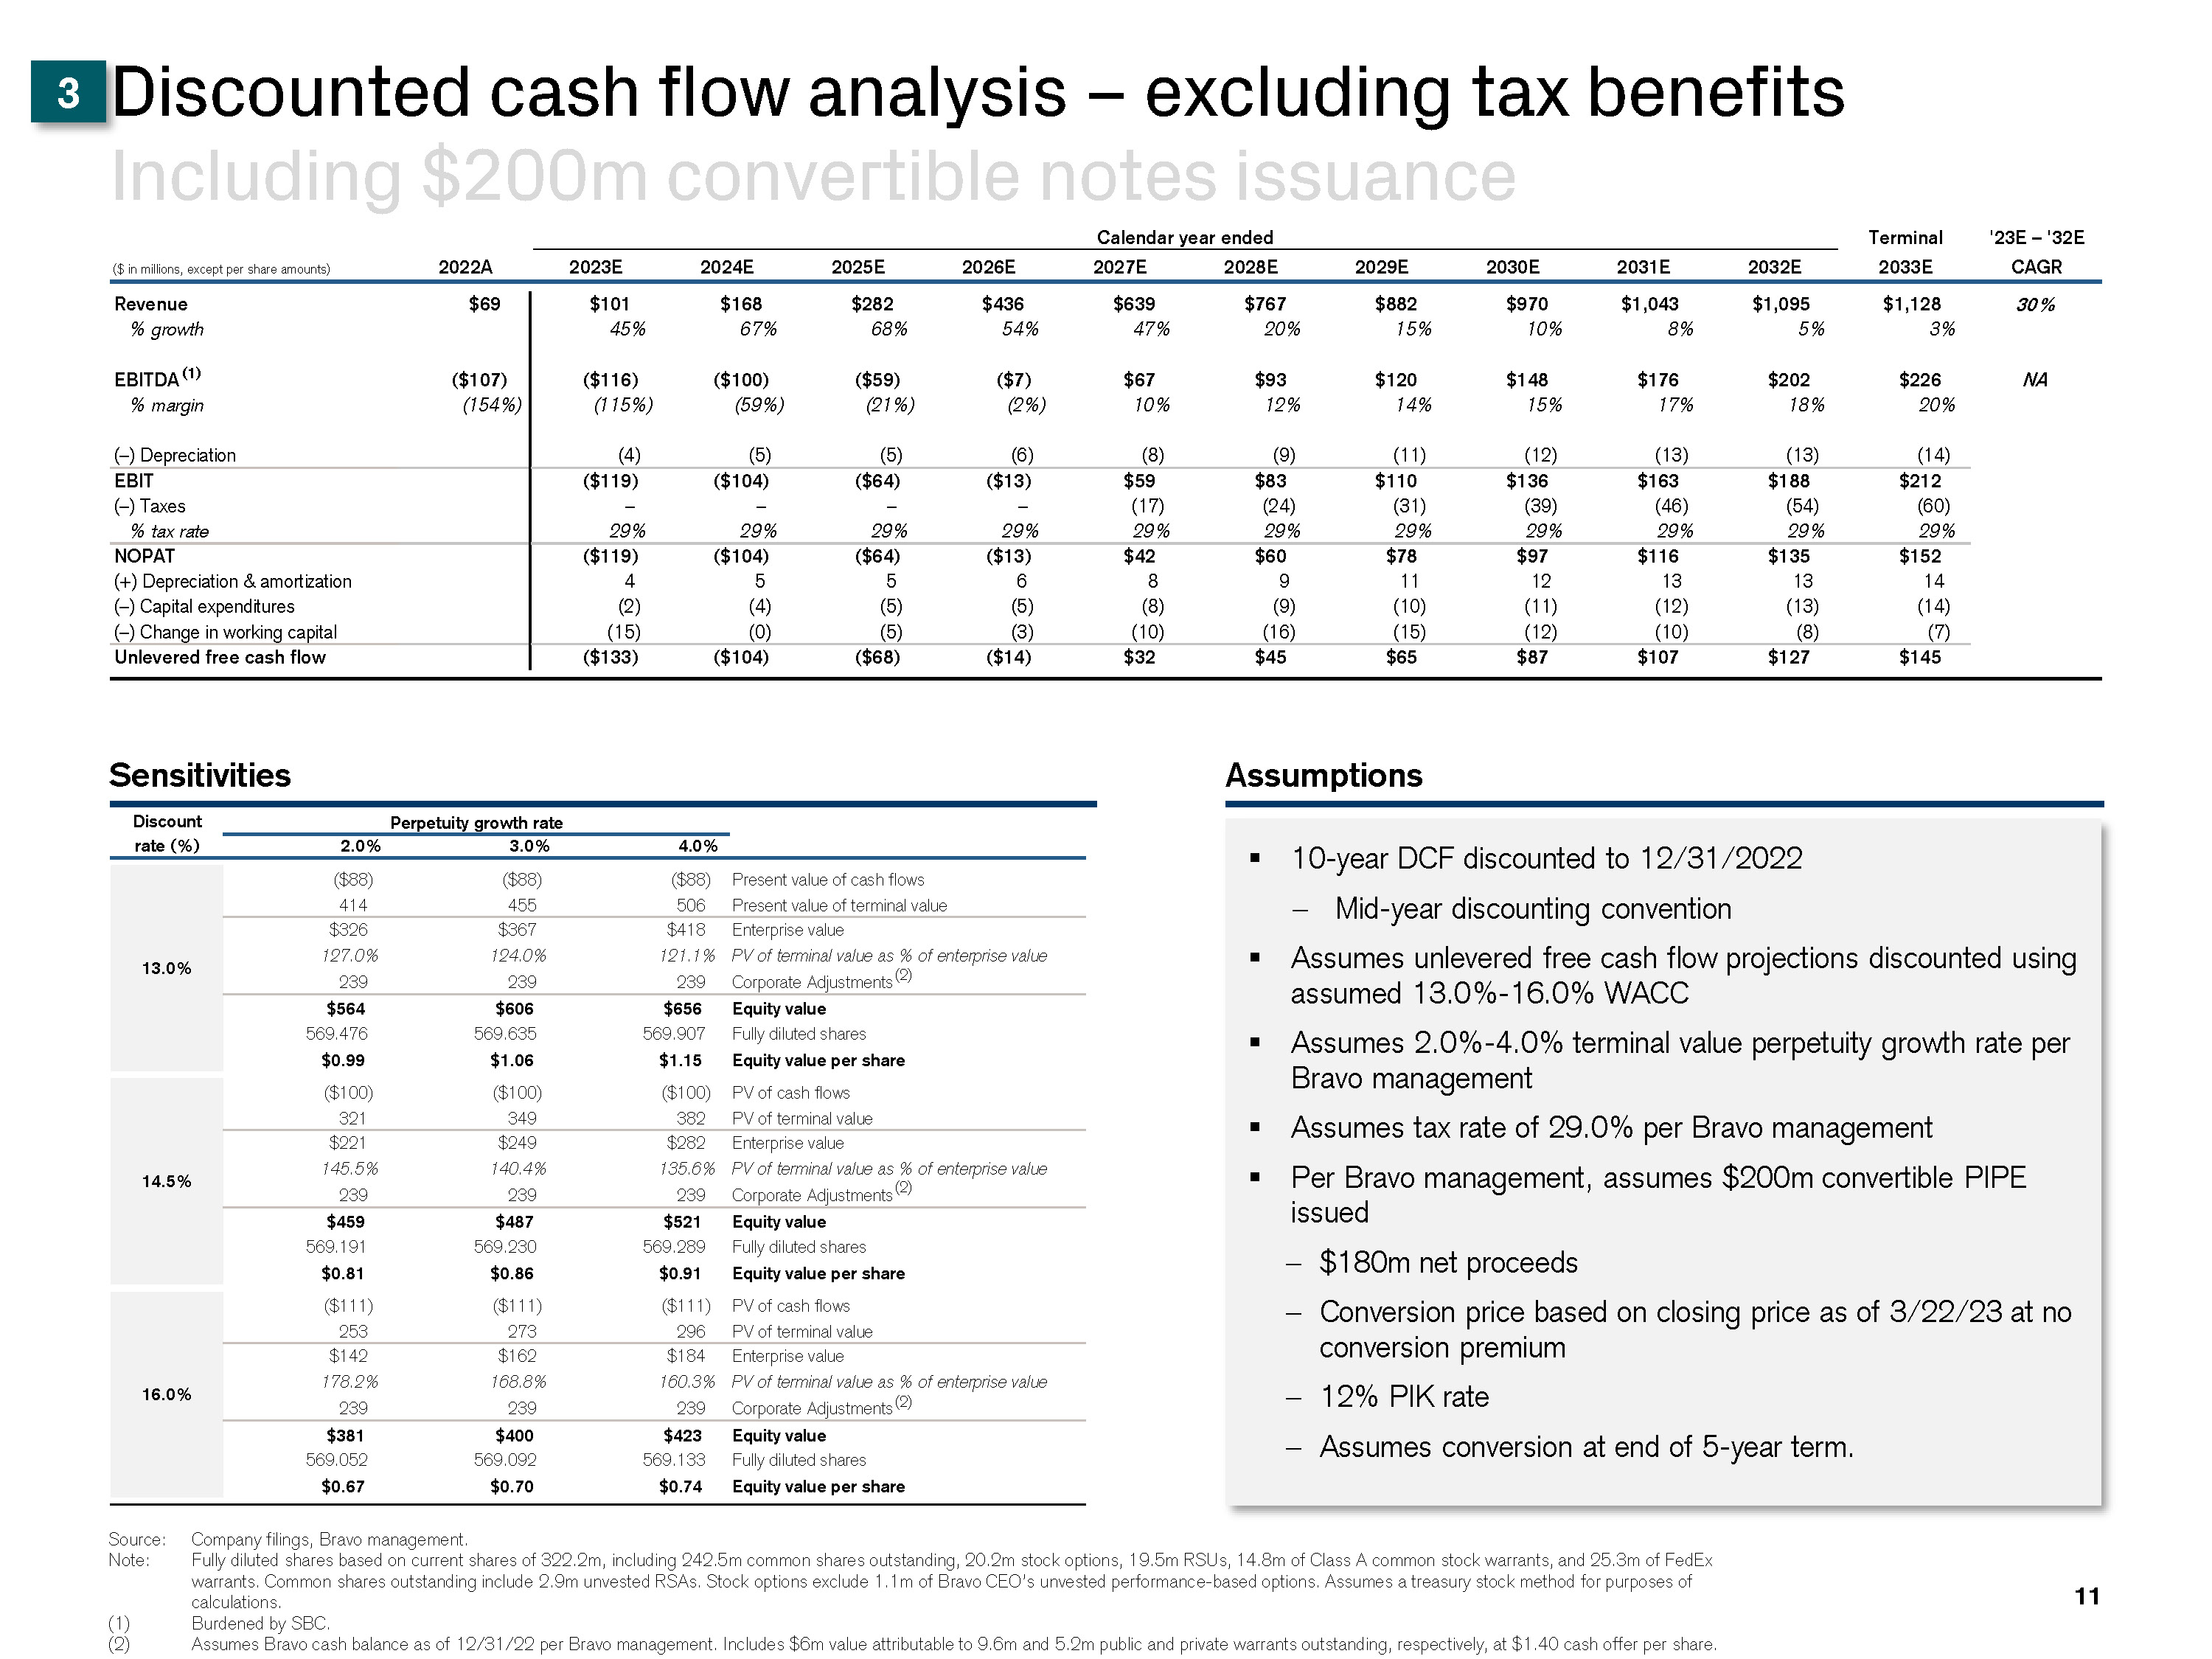
I Draft I N:\IBD_Regional_Documents_Repository_AM_Clients\Berkshire Grey(BQWF)\Spider\S03939\01. PPT\SoftBank\Project Flash_BoD_v14.pptx 10-year DCF discounted to 12/31/2022 − Mid-year discounting convention Assumes unlevered free cash flow projections discounted using assumed 13.0%-16.0% WACC Assumes 2.0%-4.0% terminal value perpetuity growth rate per Bravo management Assumes tax rate of 29.0% per Bravo management Per Bravo management, assumes $200m convertible PIPE issued − $180m net proceeds − Conversion price based on closing price as of 3/22/23 at no conversion premium − 12% PIK rate − Assumes conversion at end of 5-year term. 11 Sensitivities Discount Perpetuity growth rate rate (%) 2.0% 3.0% 4.0% Assumptions Source: Company filings, Bravo management. Note: Fully diluted shares based on current shares of 322.2m, including 242.5m common shares outstanding, 20.2m stock options, 19.5m RSUs, 14.8m of Class A common stock warrants, and 25.3m of FedEx warrants. Common shares outstanding include 2.9m unvested RSAs. Stock options exclude 1.1m of Bravo CEO’s unvested performance-based options. Assumes a treasury stock method for purposes of calculations. Burdened by SBC. Assumes Bravo cash balance as of 12/31/22 per Bravo management. Includes $6m value attributable to 9.6m and 5.2m public and private warrants outstanding, respectively, at $1.40 cash offer per share. Discounted cash flow analysis – excluding tax benefits Including $200m convertible notes issuance ($88) ($88) ($88) Present value of cash flows 414 455 506 Present value of terminal value 13.0% $326 127.0% 239 $367 124.0% 239 $418 121.1% 239 Enterprise value PV of terminal value as % of enterprise value Corporate Adjustments(2) $564 $606 $656 Equity value 569.476 569.635 569.907 Fully diluted shares $0.99 $1.06 $1.15 Equity value per share ($100) ($100) ($100) PV of cash flows 321 349 382 PV of terminal value 14.5% $221 145.5% 239 $249 140.4% 239 $282 135.6% 239 Enterprise value PV of terminal value as % of enterprise value Corporate Adjustments(2) $459 $487 $521 Equity value 569.191 569.230 569.289 Fully diluted shares $0.81 $0.86 $0.91 Equity value per share ($111) ($111) ($111) PV of cash flows 253 273 296 PV of terminal value 16.0% $142 178.2% 239 $162 168.8% 239 $184 160.3% 239 Enterprise value PV of terminal value as % of enterprise value Corporate Adjustments(2) $381 569.052 $0.67 $400 569.092 $0.70 $423 569.133 $0.74 Equity value Fully diluted shares Equity value per share 3 ($ in millions, except per share amounts) 2022A 2023E 2024E 2025E 2026E 2027E 2028E 2029E 2030E 2031E 2032E Terminal 2033E '23E – '32E CAGR Revenue $69 $101 $168 $282 $436 $639 $767 $882 $970 $1,043 $1,095 $1,128 % growth 45% 67% 68% 54% 47% 20% 15% 10% 8% 5% 3% EBITDA (1) ($107) ($116) ($100) ($59) ($7) $67 $93 $120 $148 $176 $202 $226 % margin (154%) (115%) (59%) (21%) (2%) 10% 12% 14% 15% 17% 18% 20% (–) Depreciation (4) (5) (5) (6) (8) (9) (11) (12) (13) (13) (14) EBIT ($119) ($104) ($64) ($13) $59 $83 $110 $136 $163 $188 $212 (–) Taxes – – – – (17) (24) (31) (39) (46) (54) (60) % tax rate 29% 29% 29% 29% 29% 29% 29% 29% 29% 29% 29% NOPAT ($119) ($104) ($64) ($13) $42 $60 $78 $97 $116 $135 $152 (+) Depreciation & amortization 4 5 5 6 8 9 11 12 13 13 14 (–) Capital expenditures (2) (4) (5) (5) (8) (9) (10) (11) (12) (13) (14) (–) Change in working capital (15) (0) (5) (3) (10) (16) (15) (12) (10) (8) (7) Unlevered free cash flow ($133) ($104) ($68) ($14) $32 $45 $65 $87 $107 $127 $145 30% NA Calendar year ended
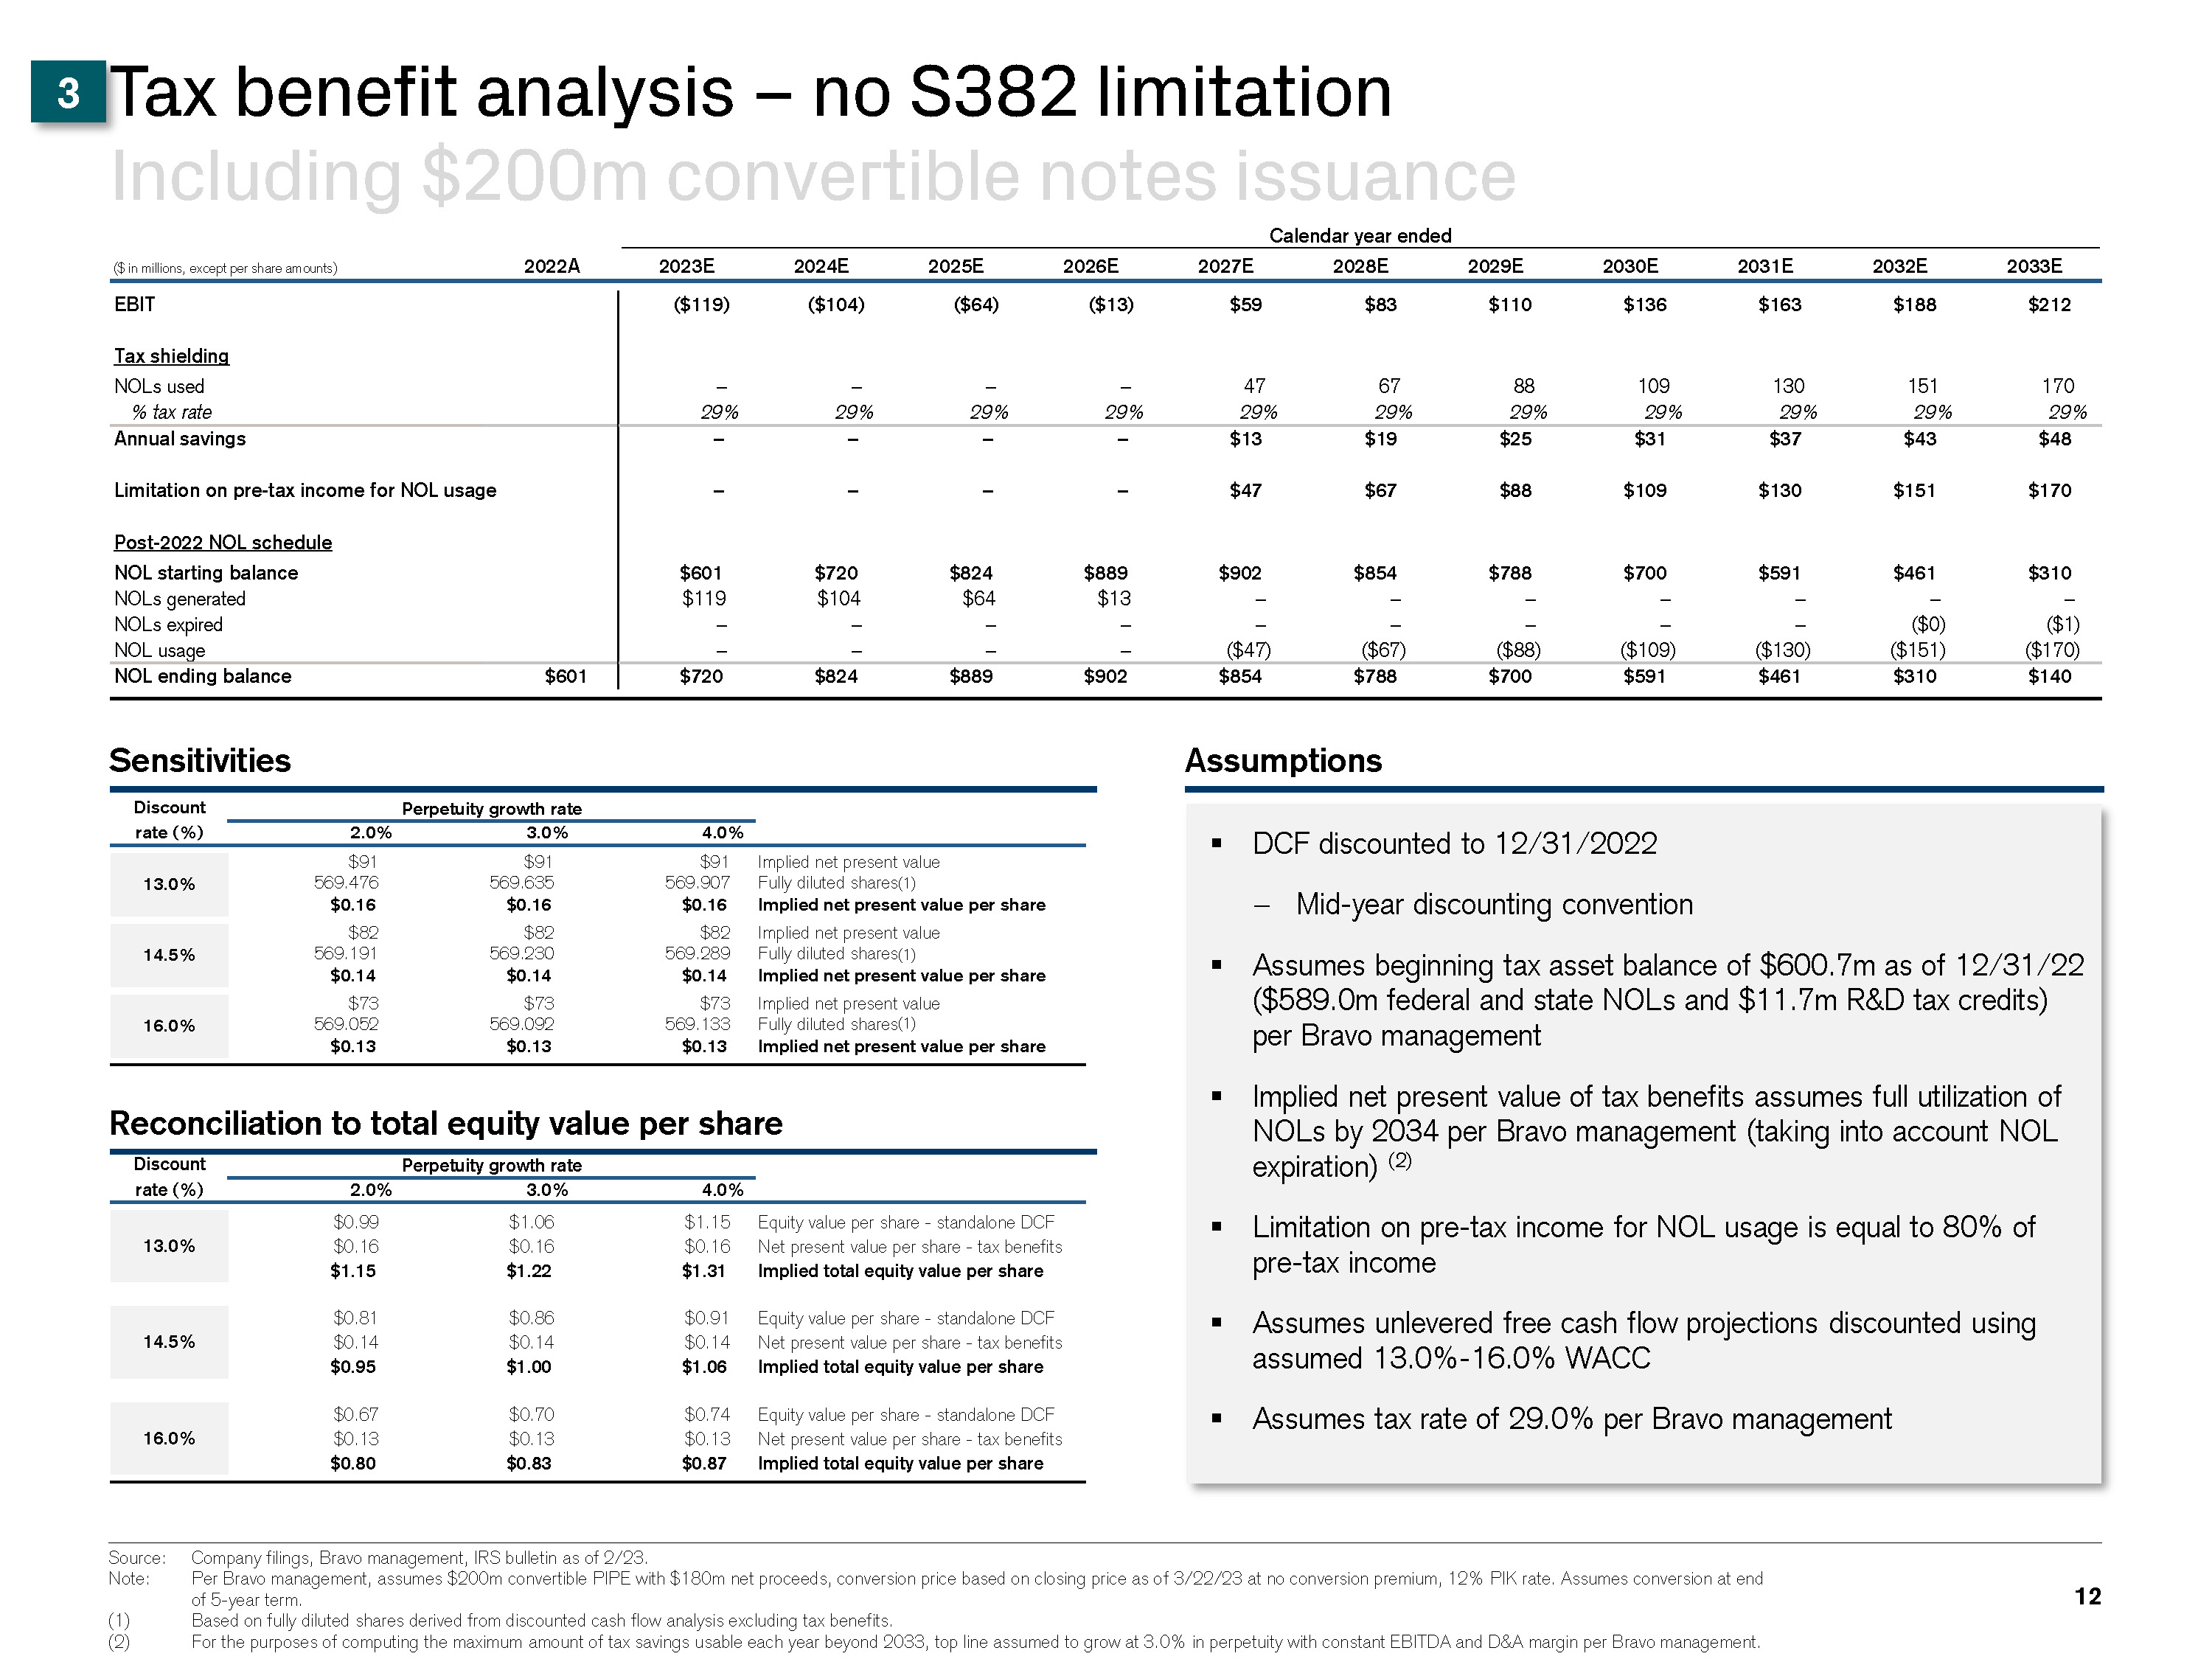
I Draft I N:\IBD_Regional_Documents_Repository_AM_Clients\Berkshire Grey(BQWF)\Spider\S03939\01. PPT\SoftBank\Project Flash_BoD_v14.pptx Tax benefit analysis – no S382 limitation Including $200m convertible notes issuance DCF discounted to 12/31/2022 − Mid-year discounting convention Assumes beginning tax asset balance of $600.7m as of 12/31/22 ($589.0m federal and state NOLs and $11.7m R&D tax credits) per Bravo management Implied net present value of tax benefits assumes full utilization of NOLs by 2034 per Bravo management (taking into account NOL expiration) (2) Limitation on pre-tax income for NOL usage is equal to 80% of pre-tax income Assumes unlevered free cash flow projections discounted using assumed 13.0%-16.0% WACC Assumes tax rate of 29.0% per Bravo management 12 Sensitivities Discount Perpetuity growth rate rate (%) 2.0% 3.0% 4.0% Assumptions Source: Company filings, Bravo management, IRS bulletin as of 2/23. Note: Per Bravo management, assumes $200m convertible PIPE with $180m net proceeds, conversion price based on closing price as of 3/22/23 at no conversion premium, 12% PIK rate. Assumes conversion at end of 5-year term. Based on fully diluted shares derived from discounted cash flow analysis excluding tax benefits. For the purposes of computing the maximum amount of tax savings usable each year beyond 2033, top line assumed to grow at 3.0% in perpetuity with constant EBITDA and D&A margin per Bravo management. Reconciliation to total equity value per share ($ in millions, except per share amounts) 2022A 2023E 2024E 2025E 2026E 2027E 2028E 2029E 2030E 2031E 2032E 2033E EBIT ($119) ($104) ($64) ($13) $59 $83 $110 $136 $163 $188 $212 Tax shielding NOLs used – – – – 47 67 88 109 130 151 170 % tax rate 29% 29% 29% 29% 29% 29% 29% 29% 29% 29% 29% Annual savings – – – – $13 $19 $25 $31 $37 $43 $48 Limitation on pre-tax income for NOL usage – – – – $47 $67 $88 $109 $130 $151 $170 Post-2022 NOL schedule NOL starting balance NOLs generated NOLs expired NOL usage $601 $119 – – $720 $104 – – $824 $64 – – $889 $13 – – $902 – – ($47) $854 – – ($67) $788 – – ($88) $700 – – ($109) $591 – – ($130) $461 – ($0) ($151) $310 – ($1) ($170) NOL ending balance $601 $720 $824 $889 $902 $854 $788 $700 $591 $461 $310 $140 Calendar year ended 3 (1) (1) (1) $91 569.476 $0.16 $82 569.191 $0.14 $91 569.635 $0.16 $82 56 $91 Implied net 569.907 F $ 13.0% 14.5% 16.0% Discount Perpetuity growth rate rate (%) 2.0% 3.0% 4.0% $0.99 $1.06 $1.15 Equity value per share - standalone DCF 13.0% $0.16 $0.16 $0.16 Net present value per share - tax benefits $1.15 $1.22 $1.31 Implied total equity value per share $0.81 $0.86 $0.91 Equity value per share - standalone DCF 14.5% $0.14 $0.14 $0.14 Net present value per share - tax benefits $0.95 $1.00 $1.06 Implied total equity value per share $0.67 $0.70 $0.74 Equity value per share - standalone DCF 16.0% $0.13 $0.13 $0.13 Net present value per share - tax benefits $0.80 $0.83 $0.87 Implied total equity value per share
I Draft I N:\IBD_Regional_Documents_Repository_AM_Clients\Berkshire Grey(BQWF)\Spider\S03939\01. PPT\SoftBank\Project Flash_BoD_v14.pptx 13 Appendix
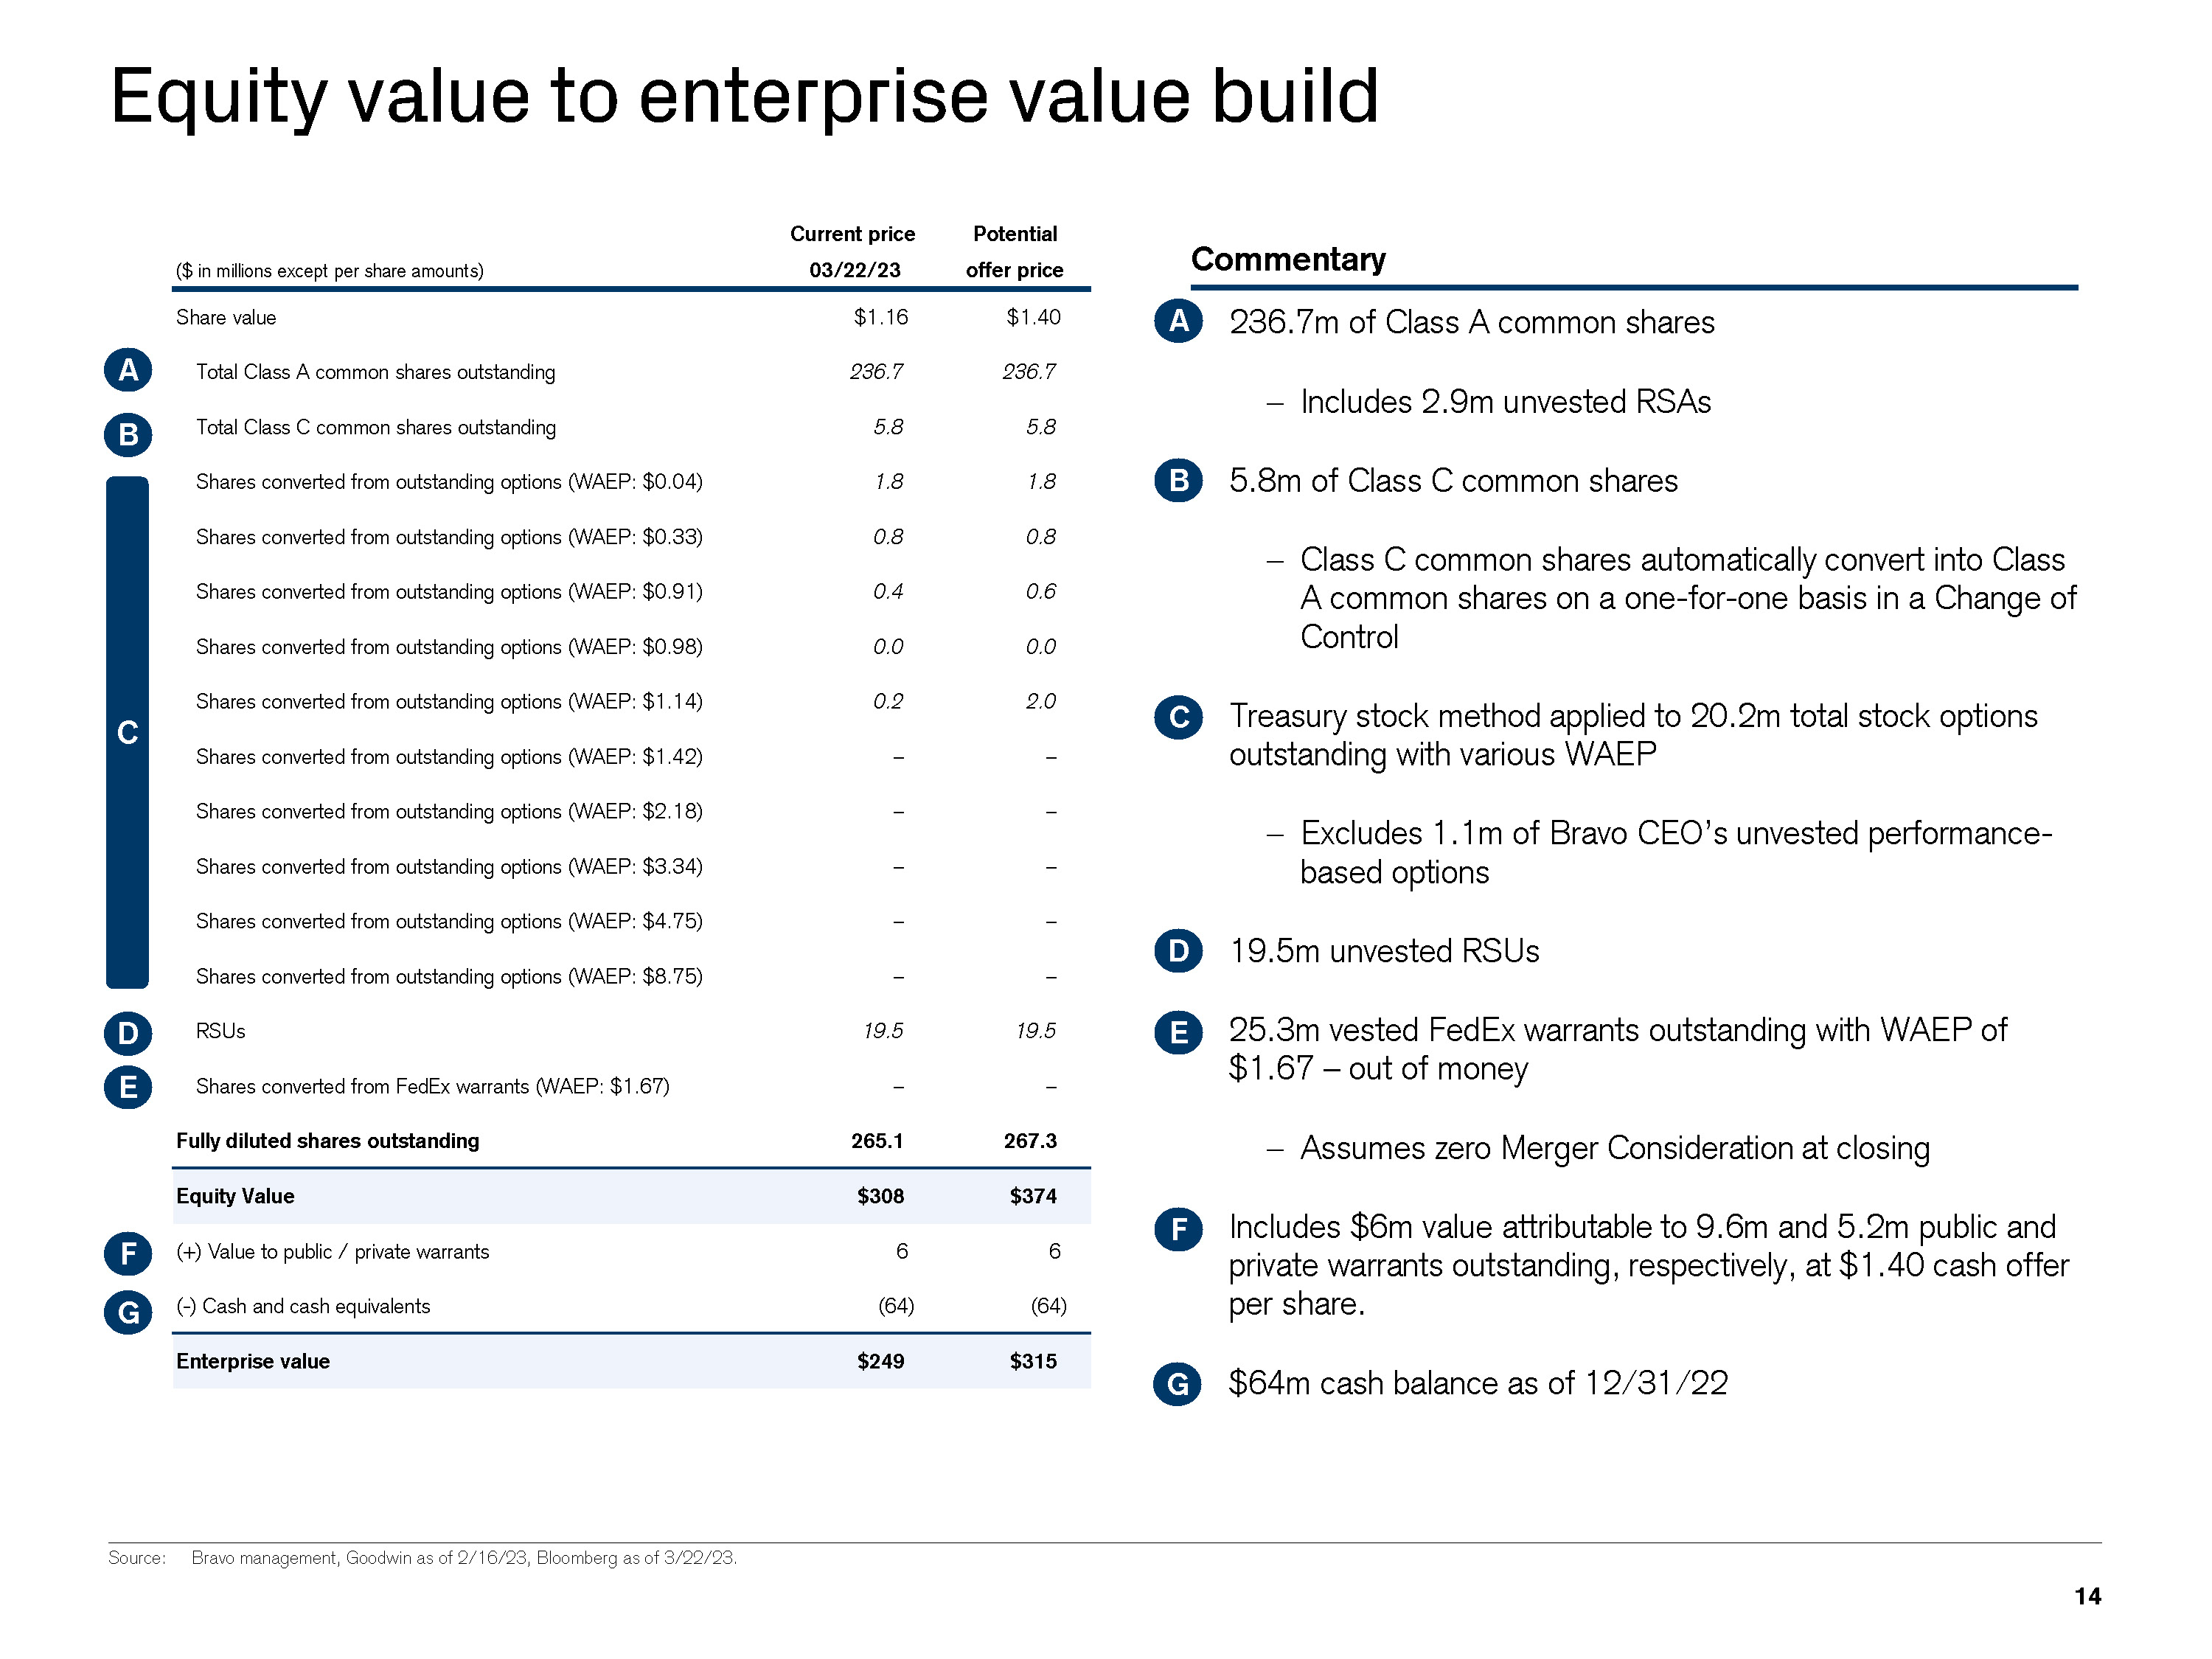
I Draft I N:\IBD_Regional_Documents_Repository_AM_Clients\Berkshire Grey(BQWF)\Spider\S03939\01. PPT\SoftBank\Project Flash_BoD_v14.pptx 14 Equity value to enterprise value build Commentary A 236.7m of Class A common shares − Includes 2.9m unvested RSAs 5.8m of Class C common shares − Class C common shares automatically convert into Class A common shares on a one-for-one basis in a Change of Control C Treasury stock method applied to 20.2m total stock options outstanding with various WAEP − Excludes 1.1m of Bravo CEO’s unvested performance- based options 19.5m unvested RSUs 25.3m vested FedEx warrants outstanding with WAEP of $1.67 – out of money − Assumes zero Merger Consideration at closing Includes $6m value attributable to 9.6m and 5.2m public and private warrants outstanding, respectively, at $1.40 cash offer per share. $64m cash balance as of 12/31/22 D E G F B D E F G A B C Source: Bravo management, Goodwin as of 2/16/23, Bloomberg as of 3/22/23. Current price Potential ($ in millions except per share amounts) 03/22/23 offer price Share value $1.16 $1.40 Total Class A common shares outstanding 236.7 236.7 Total Class C common shares outstanding 5.8 5.8 Shares converted from outstanding options (WAEP: $0.04) 1.8 1.8 Shares converted from outstanding options (WAEP: $0.33) 0.8 0.8 Shares converted from outstanding options (WAEP: $0.91) 0.4 0.6 Shares converted from outstanding options (WAEP: $0.98) 0.0 0.0 Shares converted from outstanding options (WAEP: $1.14) 0.2 2.0 Shares converted from outstanding options (WAEP: $1.42) – – Shares converted from outstanding options (WAEP: $2.18) – – Shares converted from outstanding options (WAEP: $3.34) – – Shares converted from outstanding options (WAEP: $4.75) – – Shares converted from outstanding options (WAEP: $8.75) – – RSUs 19.5 19.5 Shares converted from FedEx warrants (WAEP: $1.67) – – Fully diluted shares outstanding 265.1 267.3 Equity Value $308 $374 (+) Value to public / private warrants 6 6 (-) Cash and cash equivalents (64) (64) Enterprise value $249 $315
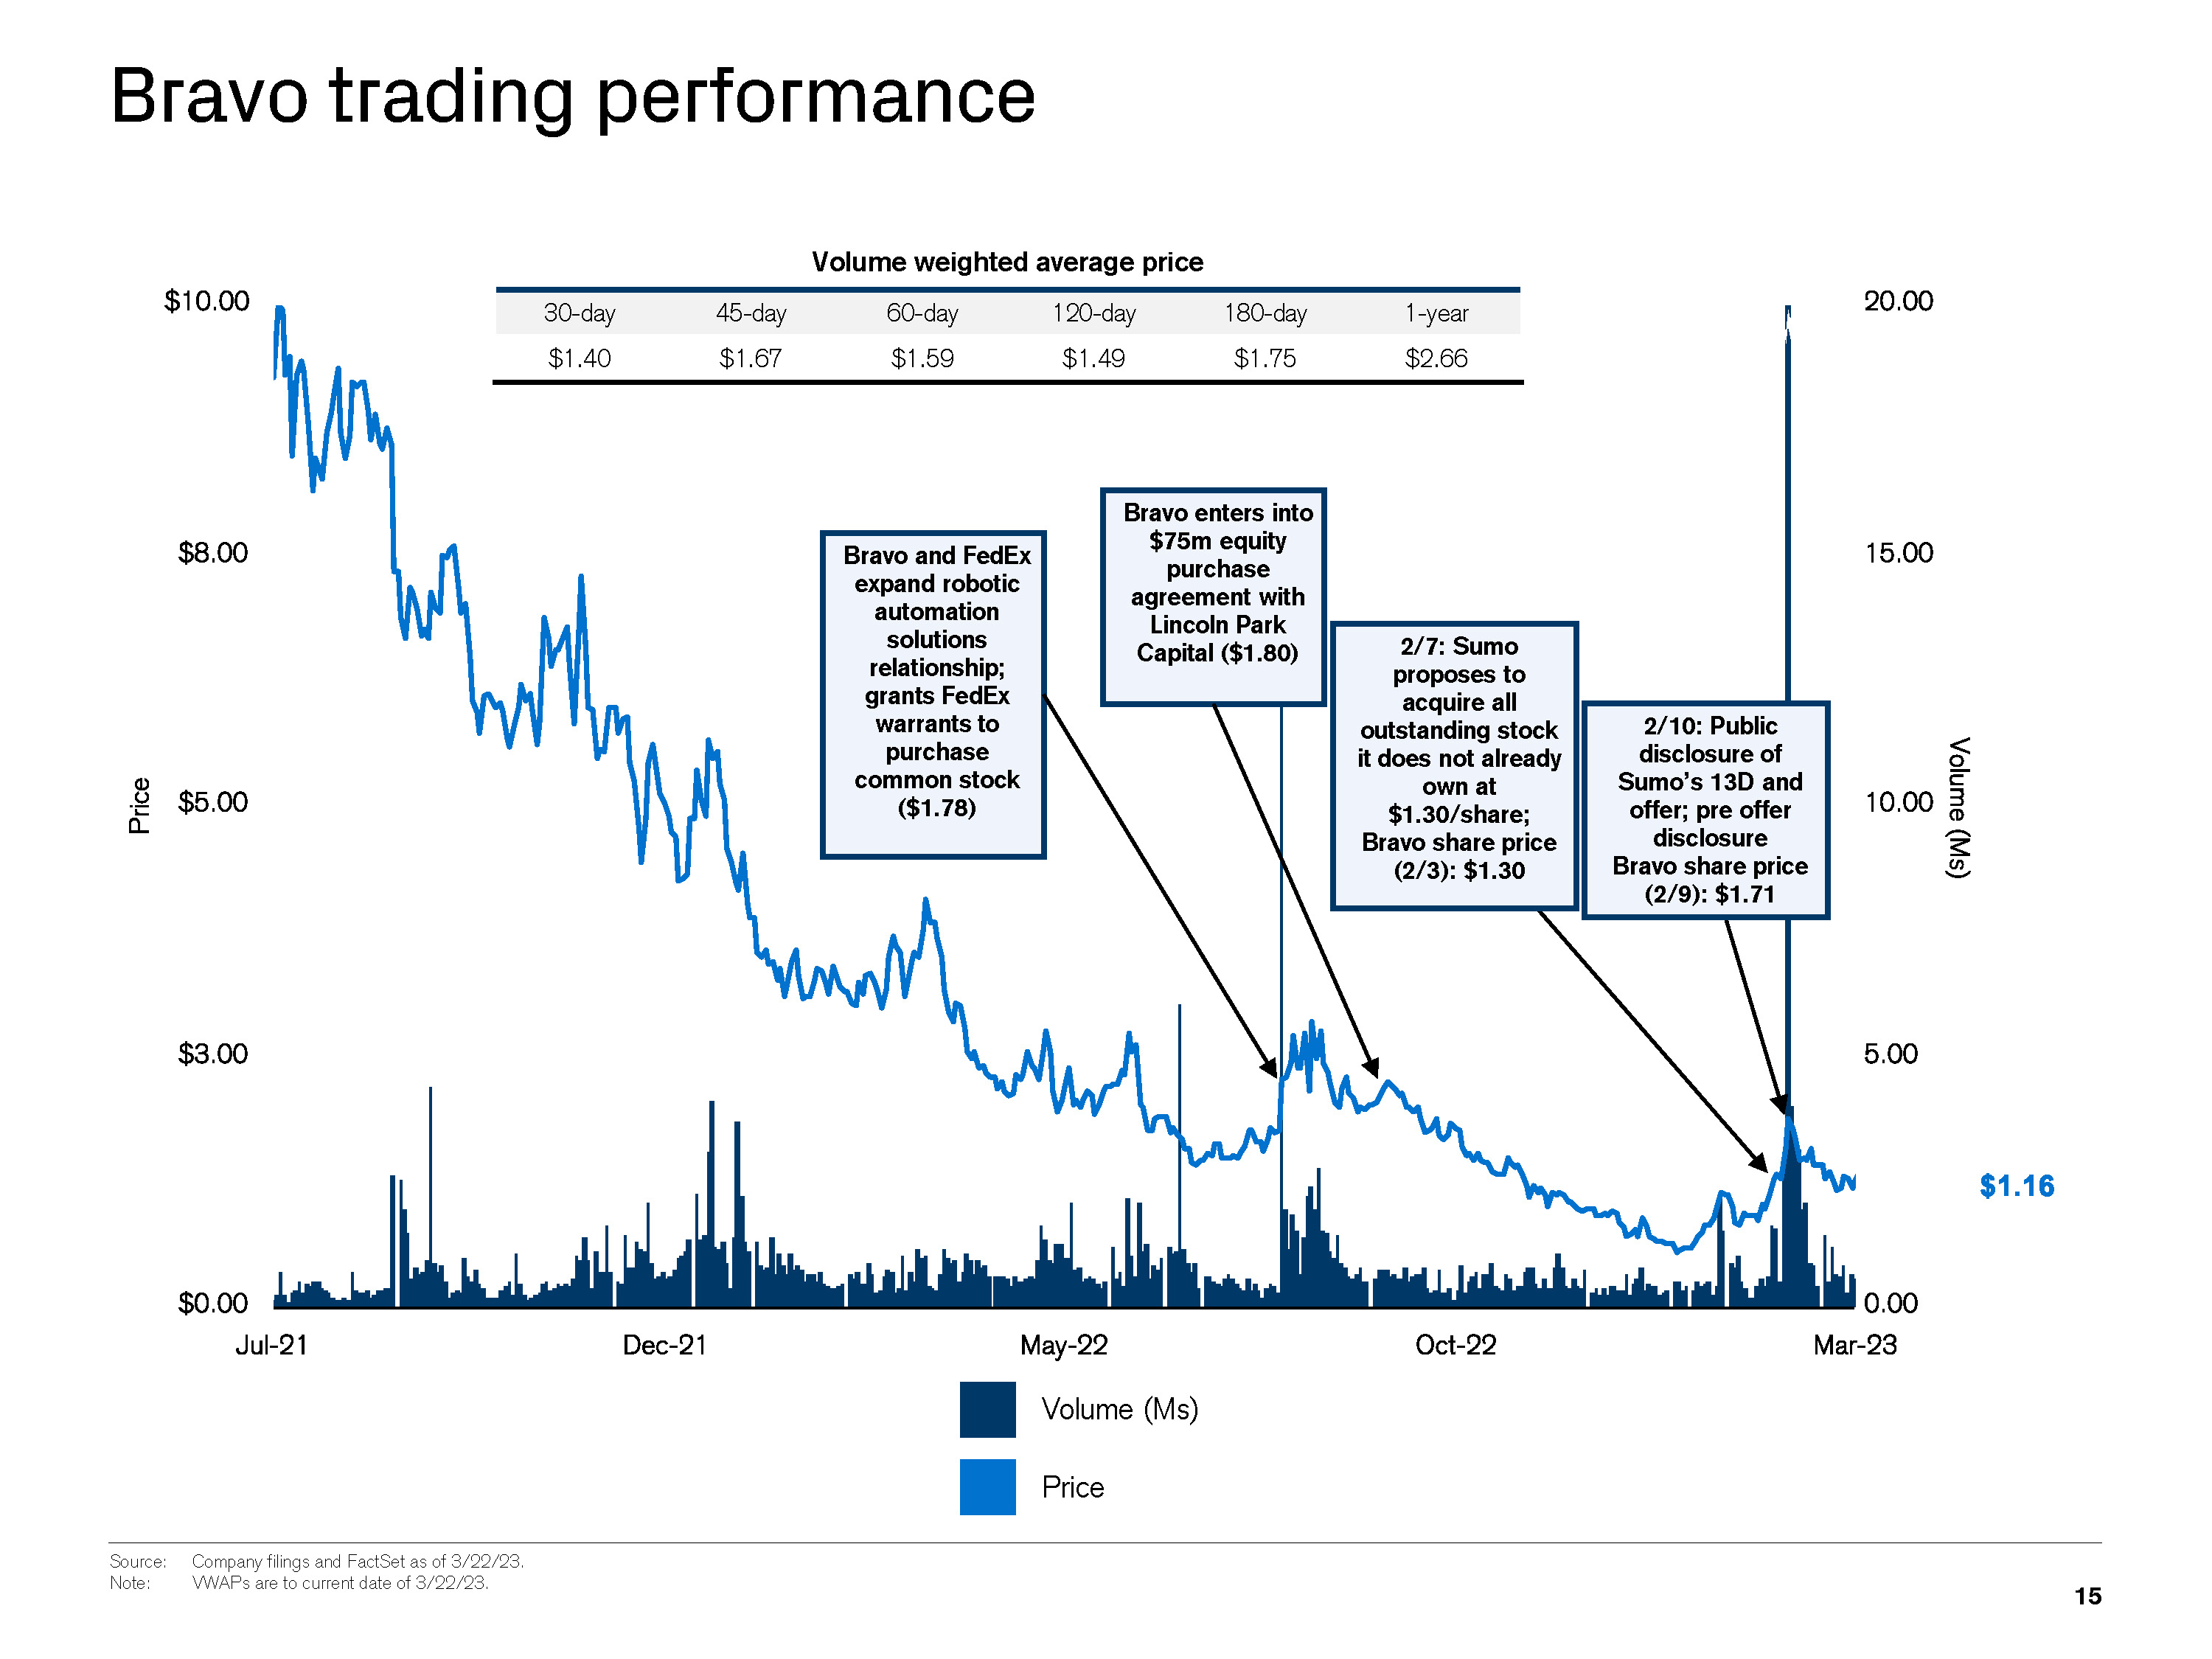
I Draft I N:\IBD_Regional_Documents_Repository_AM_Clients\Berkshire Grey(BQWF)\Spider\S03939\01. PPT\SoftBank\Project Flash_BoD_v14.pptx 15 Bravo trading performance Volume (Ms) Price Source: Company filings and FactSet as of 3/22/23. Note: VWAPs are to current date of 3/22/23. Volume weighted average price 30-day 45-day 60-day 120-day 180-day 1-year $1.40 $1.67 $1.59 $1.49 $1.75 $2.66 Bravo and FedEx expand robotic automation solutions relationship; grants FedEx warrants to purchase common stock ($1.78) Bravo enters into $75m equity purchase agreement with Lincoln Park Capital ($1.80) 2/7: Sumo proposes to acquire all outstanding stock it does not already own at $1.30/share; Bravo share price (2/3): $1.30 2/10: Public disclosure of Sumo’s 13D and offer; pre offer disclosure Bravo share price (2/9): $1.71
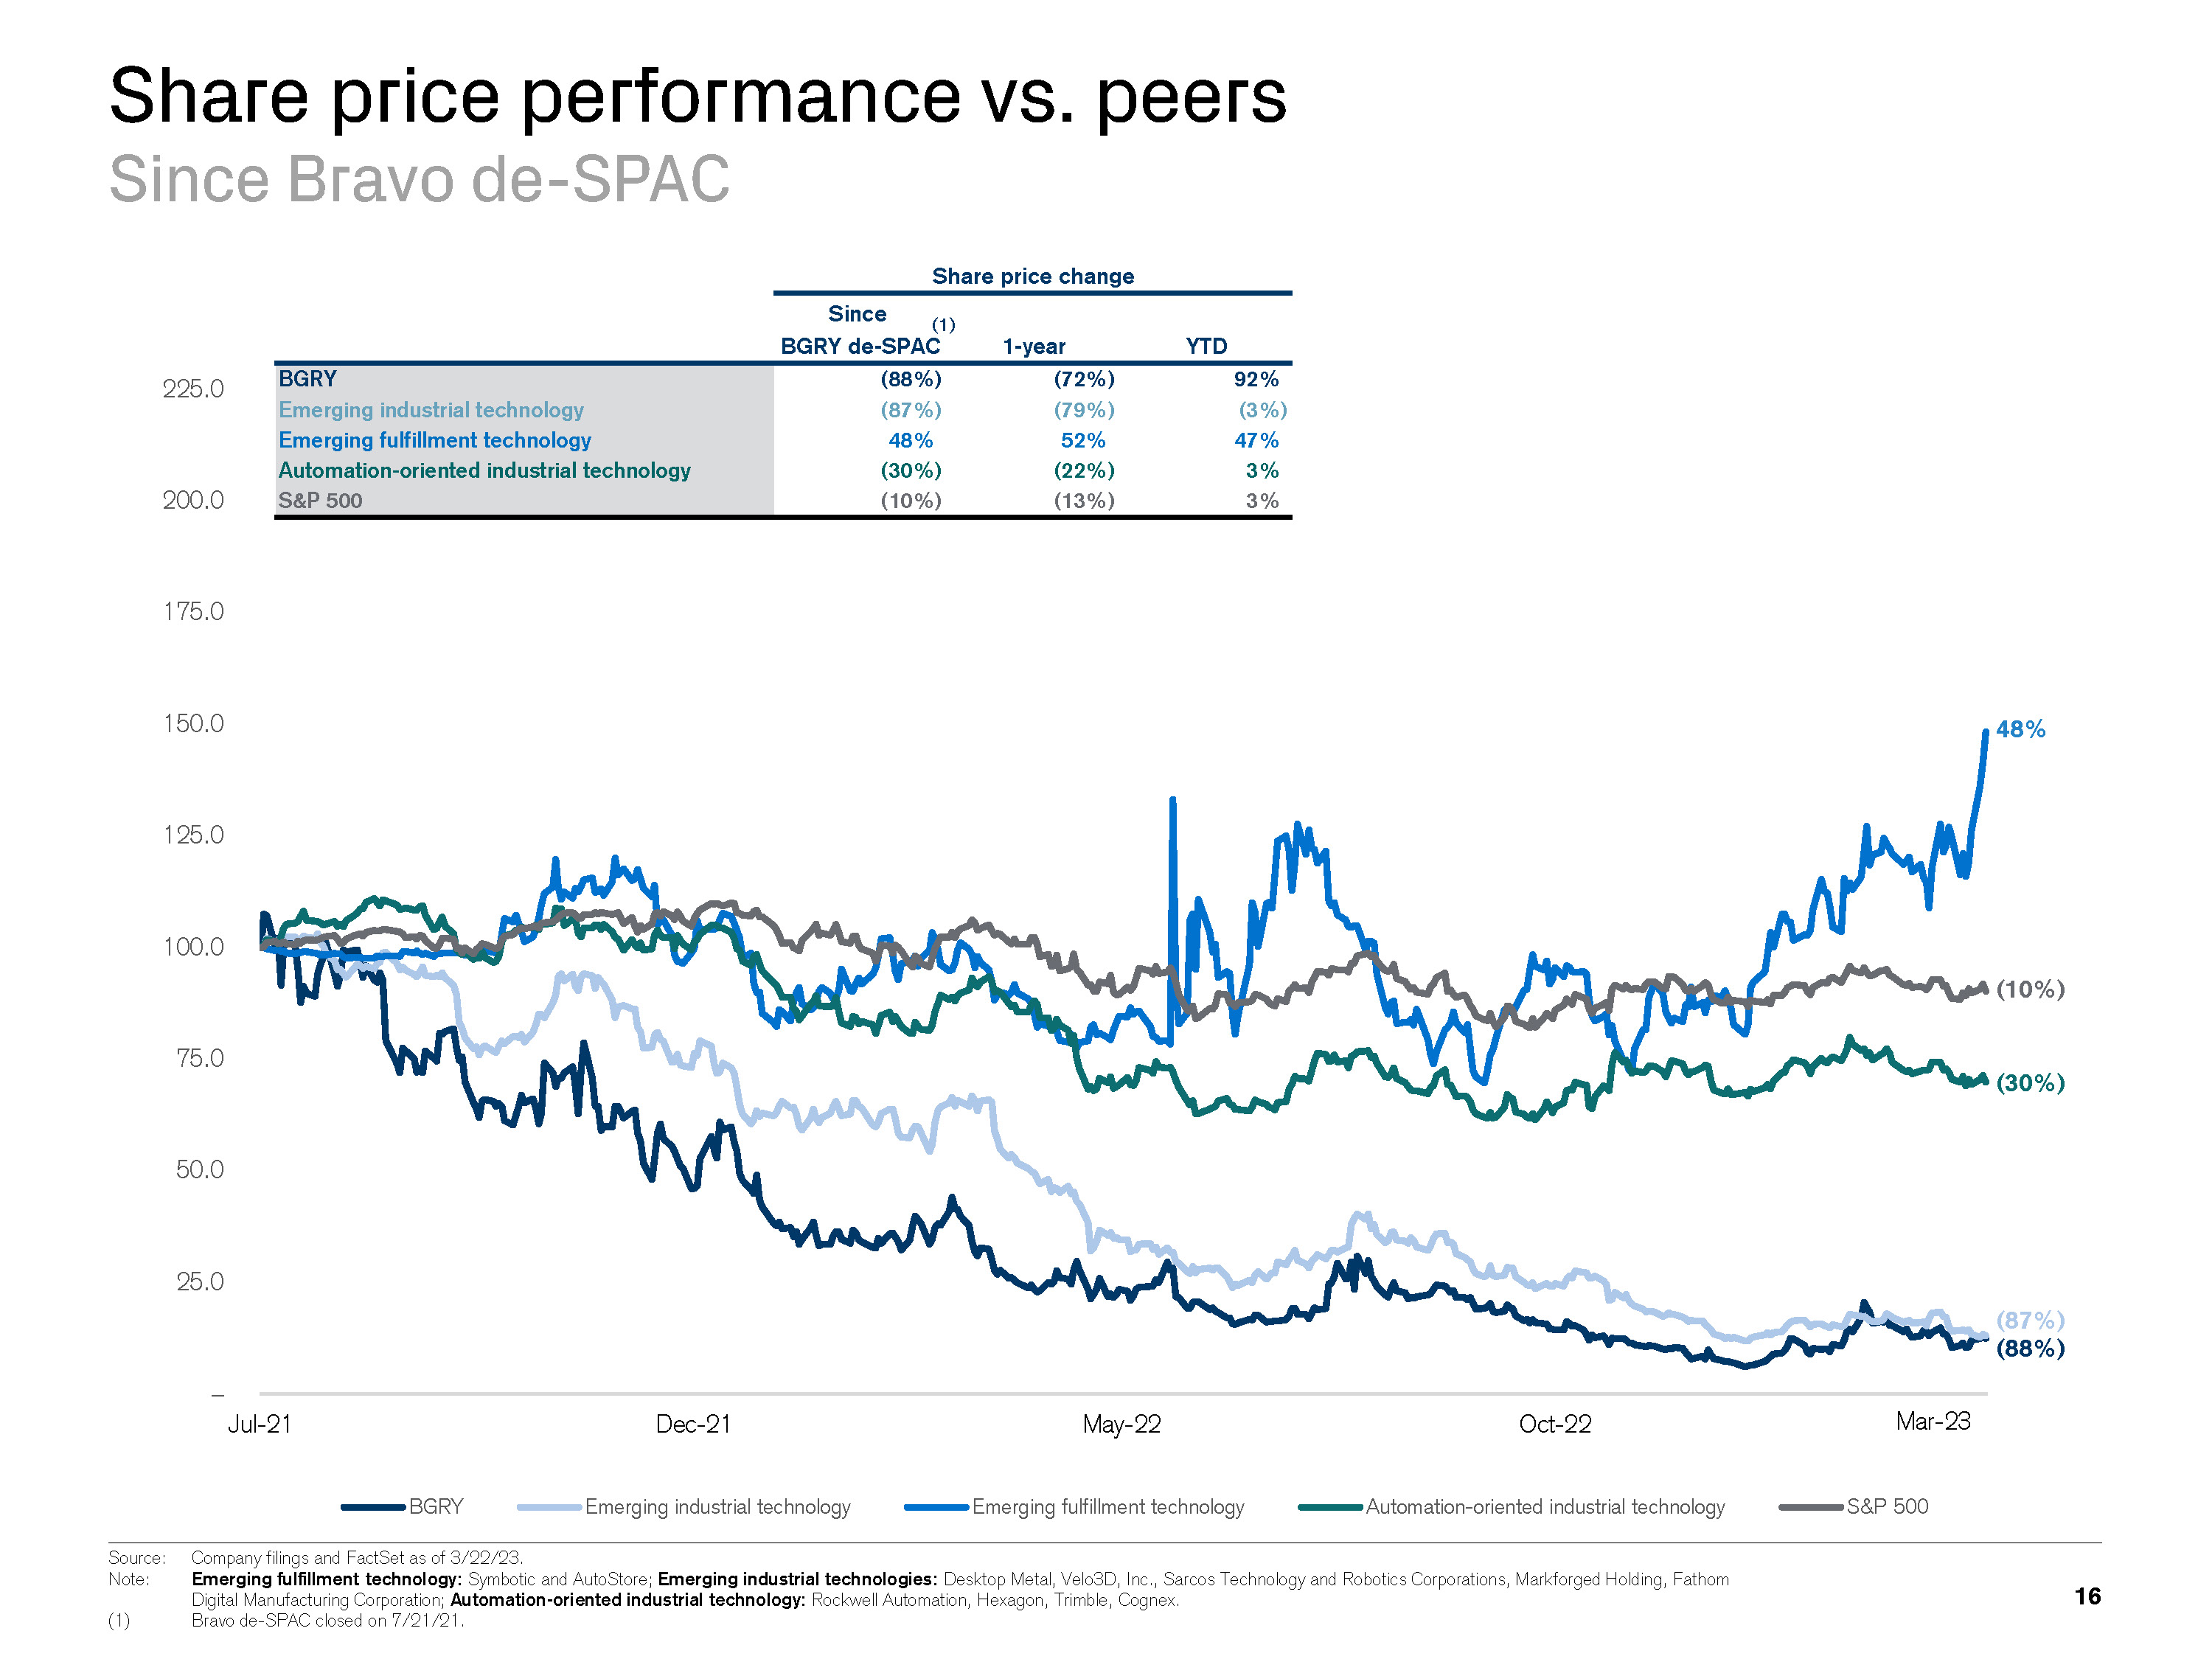
I Draft I N:\IBD_Regional_Documents_Repository_AM_Clients\Berkshire Grey(BQWF)\Spider\S03939\01. PPT\SoftBank\Project Flash_BoD_v14.pptx – 25.0 50.0 75.0 100.0 125.0 150.0 175.0 200.0 225.0 Jul-21 Dec-21 May-22 Oct-22 Mar-23 BGRY Emerging industrial technology Emerging fulfillment technology Automation-oriented industrial technology Source: Company filings and FactSet as of 3/22/23. Note: Emerging fulfillment technology: Symbotic and AutoStore; Emerging industrial technologies: Desktop Metal, Velo3D, Inc., Sarcos Technology and Robotics Corporations, Markforged Holding, Fathom Digital Manufacturing Corporation; Automation-oriented industrial technology: Rockwell Automation, Hexagon, Trimble, Cognex. (1) Bravo de-SPAC closed on 7/21/21. S&P 500 16 Share price performance vs. peers Mar-23 48% (10%) (30%) (87%) (88%) (1) Since Bravo de-SPAC Share price change Since BGRY de-SPAC BGRY Emerging industrial technology Emerging fulfillment technology Automation-oriented industr S&P 500
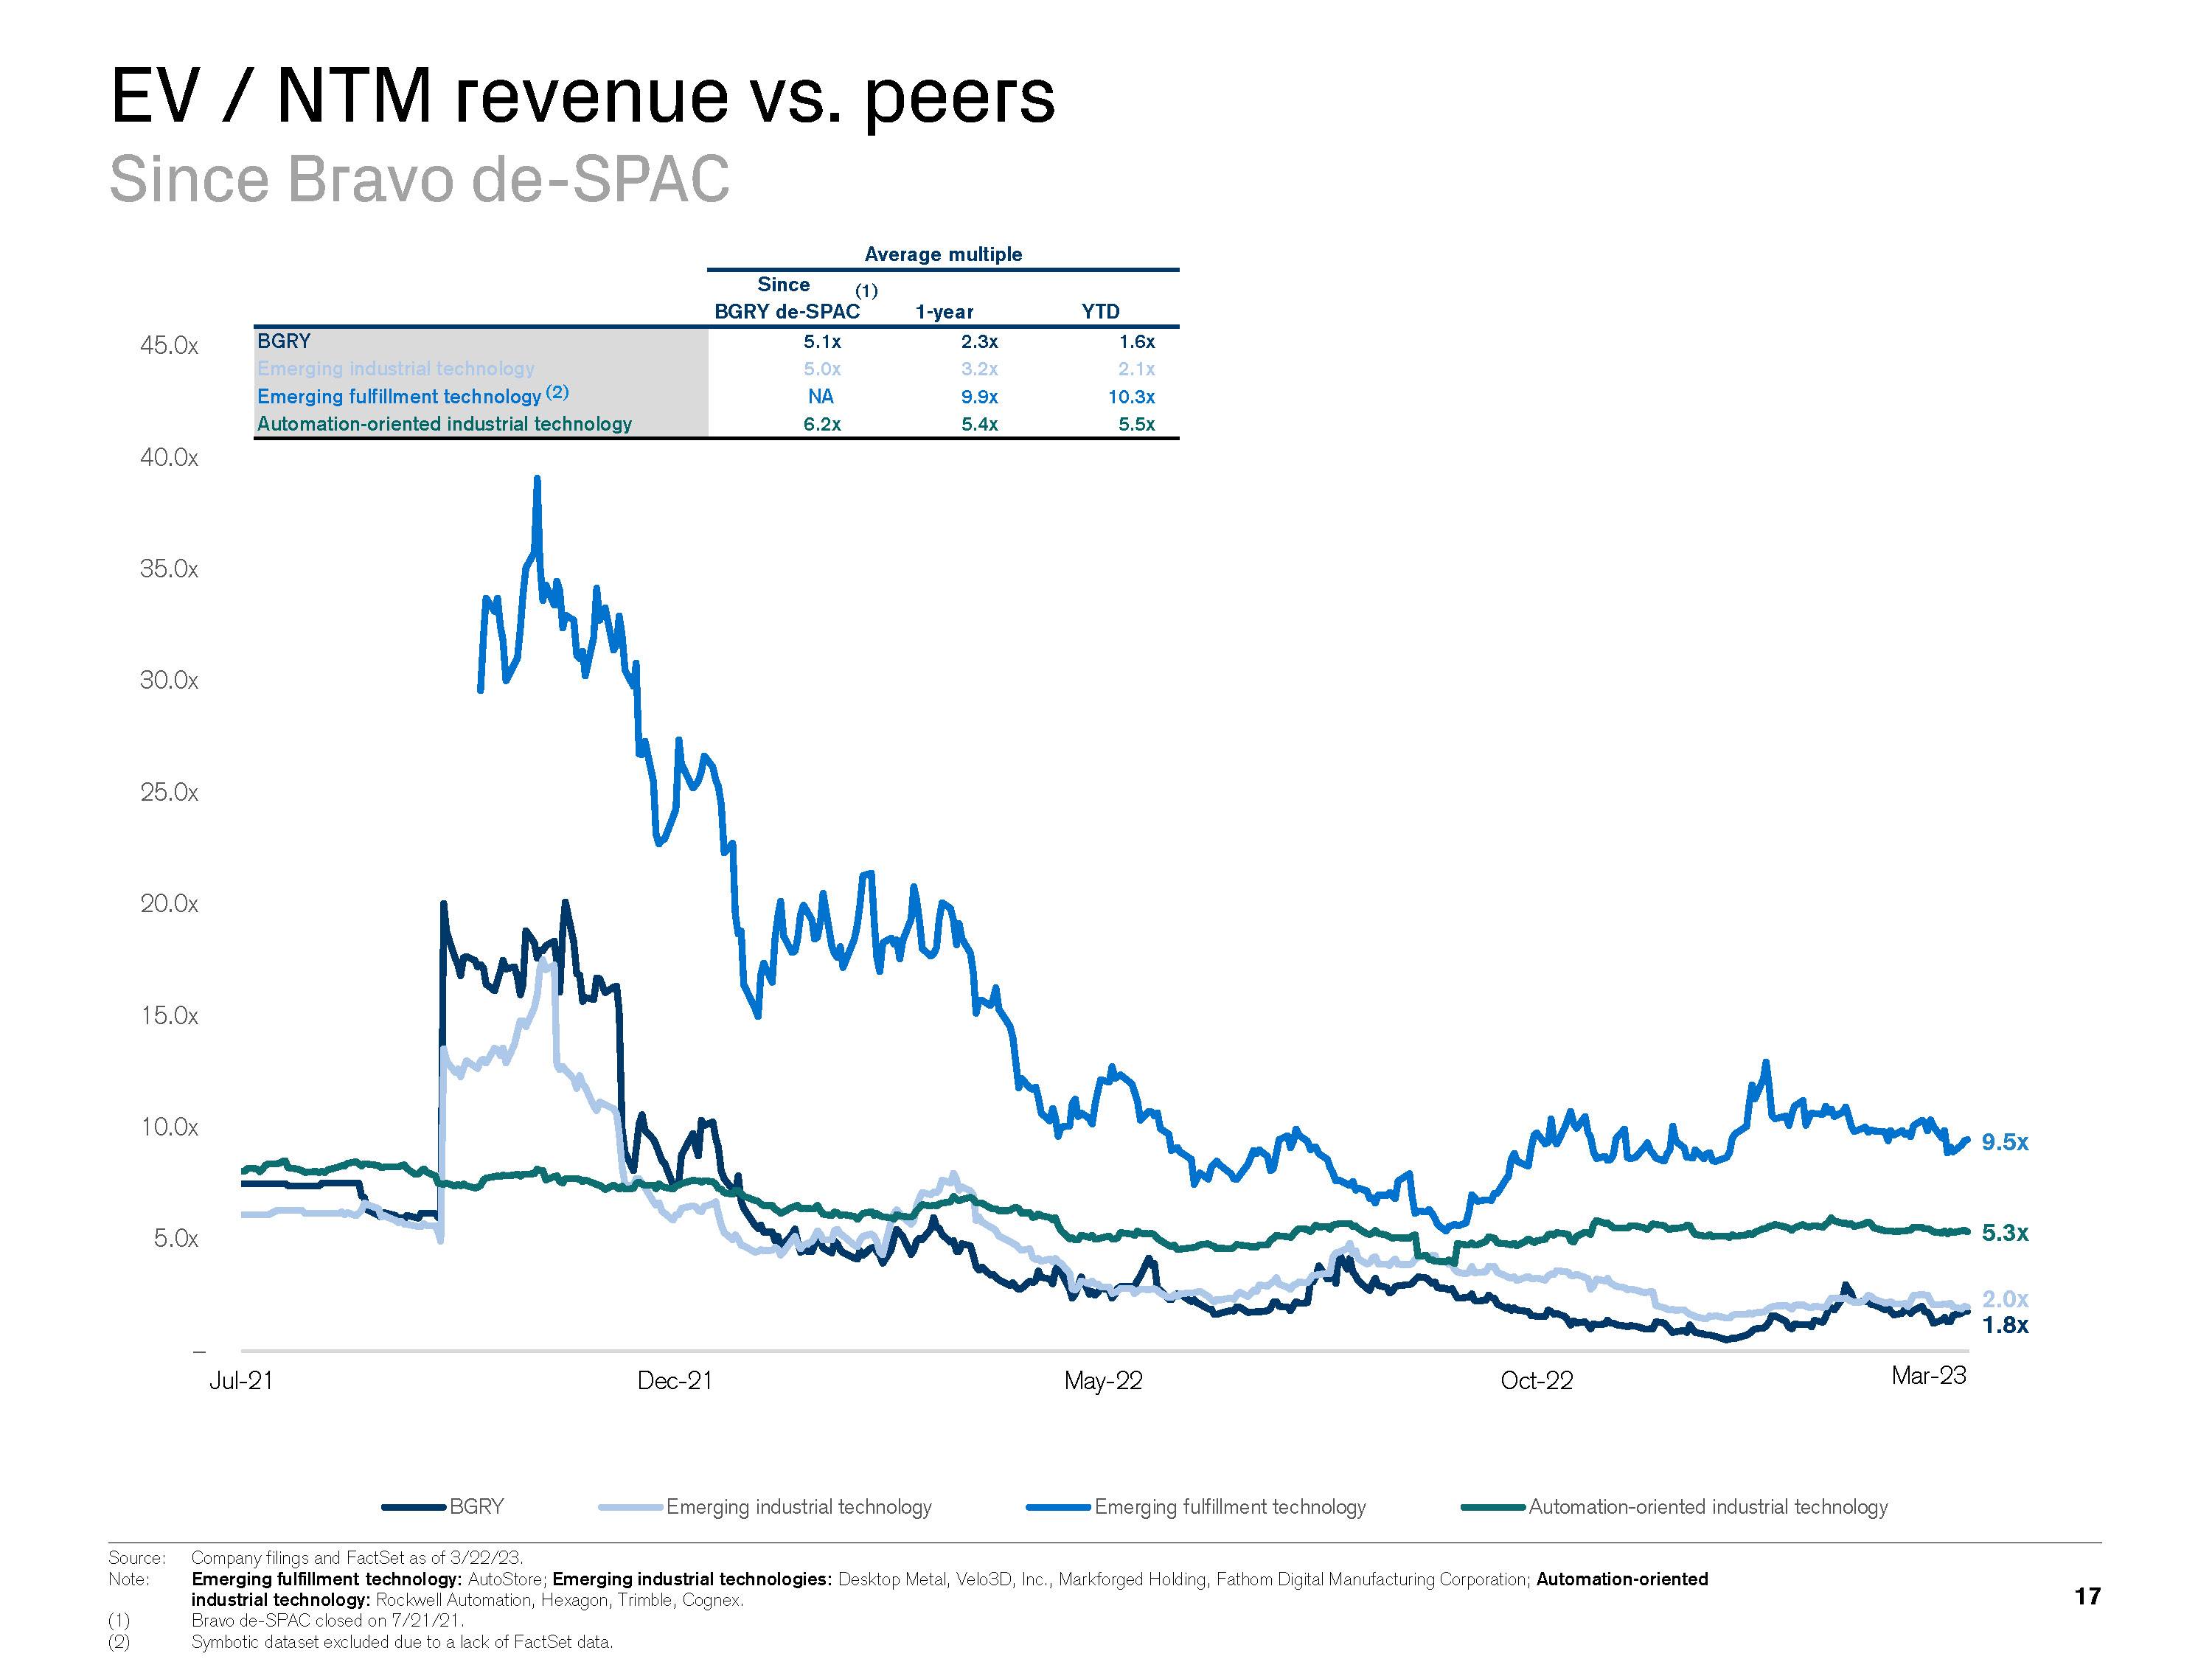
I Draft I N:\IBD_Regional_Documents_Repository_AM_Clients\Berkshire Grey(BQWF)\Spider\S03939\01. PPT\SoftBank\Project Flash_BoD_v14.pptx 17 EV / NTM revenue vs. peers Since Bravo de-SPAC Average multiple – 5.0x 10.0x 15.0x 20.0x 25.0x 30.0x 35.0x 40.0x 45.0x Jul-21 Dec-21 May-22 Oct-22 Mar-23 BGRY Emerging industrial technology Emerging fulfillment technology Automation-oriented industrial technology Source: Company filings and FactSet as of 3/22/23. Note: Emerging fulfillment technology: AutoStore; Emerging industrial technologies: Desktop Metal, Velo3D, Inc., Markforged Holding, Fathom Digital Manufacturing Corporation; Automation-oriented industrial technology: Rockwell Automation, Hexagon, Trimble, Cognex. Bravo de-SPAC closed on 7/21/21. Symbotic dataset excluded due to a lack of FactSet data. Since BGRY de-SPAC 1-year YTD Mar-23 9.5x 5.3x 2.0x 1.8x (1) BGRY 5.1x 2.3x 1.6x Emerging industrial technology Emerging fulfillment technology (2) 5.0x NA 3.2x 9.9x 2.1x 10.3x Automation-oriented industrial technology 6.2x 5.4x 5.5x
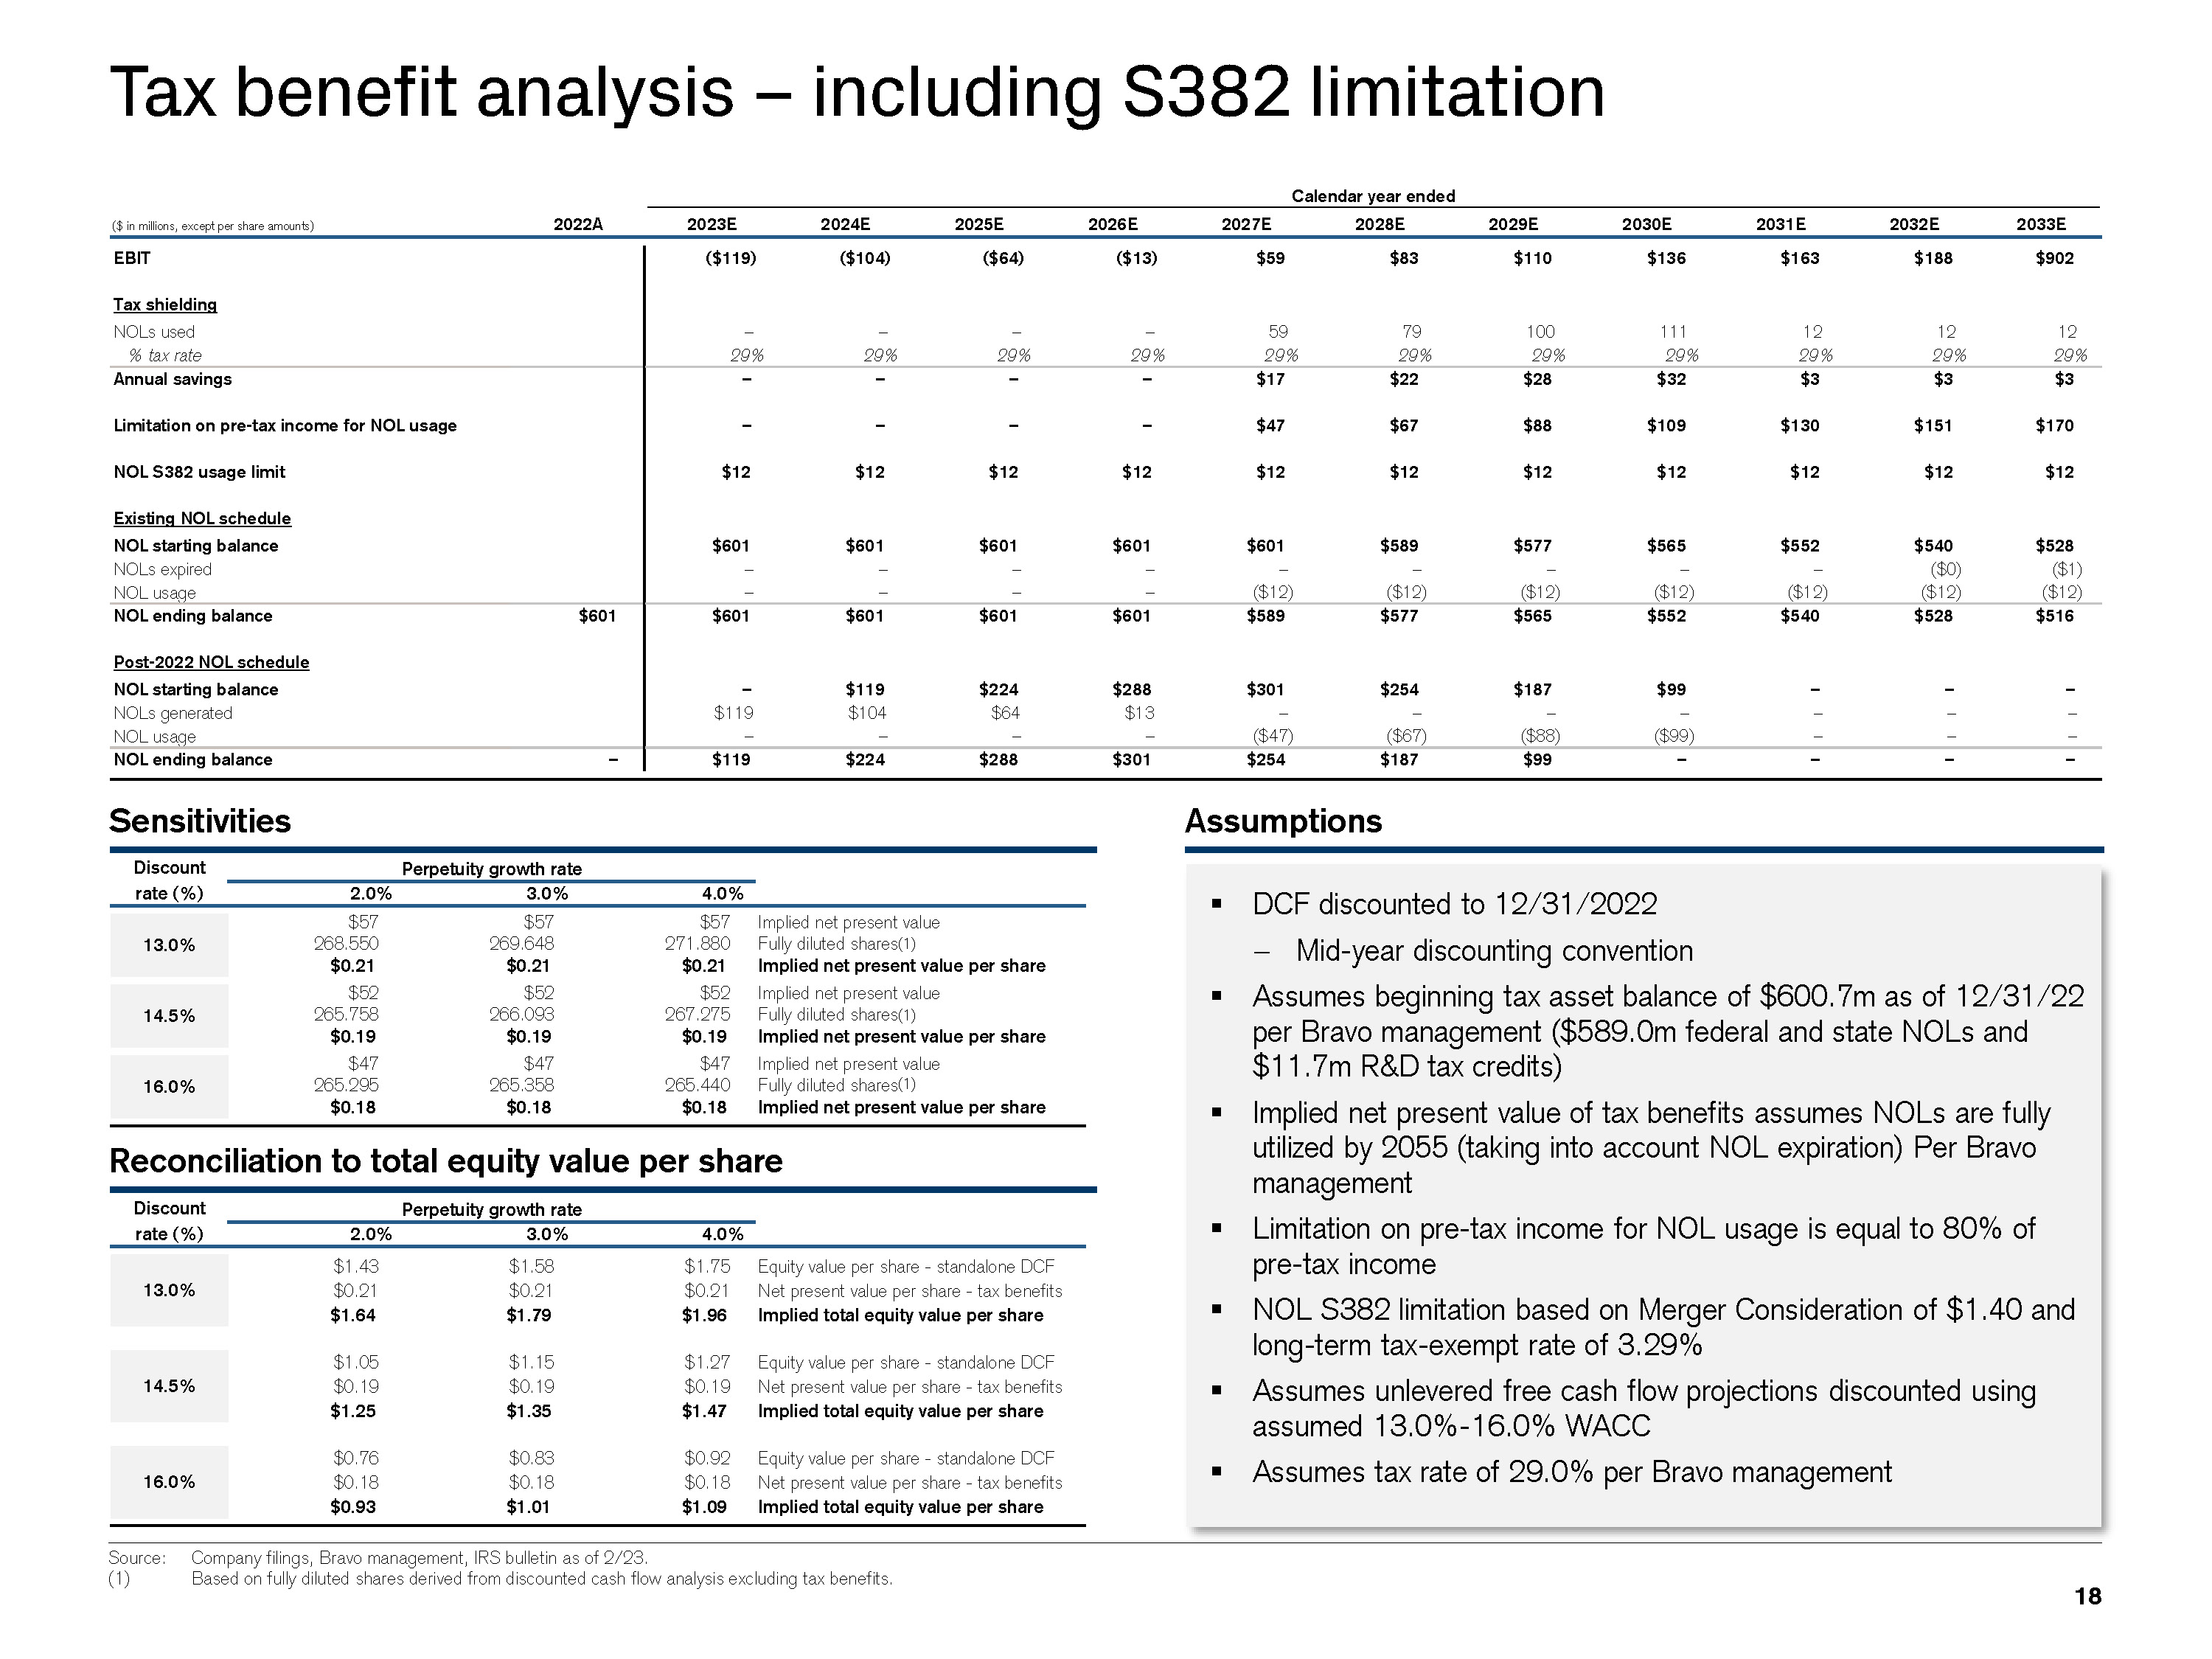
I Draft I N:\IBD_Regional_Documents_Repository_AM_Clients\Berkshire Grey(BQWF)\Spider\S03939\01. PPT\SoftBank\Project Flash_BoD_v14.pptx $57 $57 $57 Implied net present value 13.0% 268.550 269.648 271.880 Fully diluted shares(1) $0.21 $0.21 $0.21 Implied net present value per share $52 $52 $52 Implied net present value 14.5% 265.758 266.093 267.275 Fully diluted shares(1) $0.19 $0.19 $0.19 Implied net present value per share $47 $47 $47 Implied net present value 16.0% 265.295 265.358 265.440 Fully diluted shares(1) $0.18 $0.18 $0.18 Implied net present value per share Perpetuity growth rate Discount rate (%) 2.0% 3.0% 4.0% Tax benefit analysis – including S382 limitation DCF discounted to 12/31/2022 − Mid-year discounting convention Assumes beginning tax asset balance of $600.7m as of 12/31/22 per Bravo management ($589.0m federal and state NOLs and $11.7m R&D tax credits) Implied net present value of tax benefits assumes NOLs are fully utilized by 2055 (taking into account NOL expiration) Per Bravo management Limitation on pre-tax income for NOL usage is equal to 80% of 18 Sensitivities Assumptions Source: Company filings, Bravo management, IRS bulletin as of 2/23. (1) Based on fully diluted shares derived from discounted cash flow analysis excluding tax benefits. Reconciliation to total equity value per share ($ in millions, except per share amounts) 2022A 2023E 2024E 2025E 2026E 2027E 2028E 2029E 2030E 2031E 2032E 2033E EBIT ($119) ($104) ($64) ($13) $59 $83 $110 $136 $163 $188 $902 Tax shielding NOLs used – – – – 59 79 100 111 12 12 12 % tax rate 29% 29% 29% 29% 29% 29% 29% 29% 29% 29% 29% Annual savings – – – – $17 $22 $28 $32 $3 $3 $3 Limitation on pre-tax income for NOL usage – – – – $47 $67 $88 $109 $130 $151 $170 NOL S382 usage limit $12 $12 $12 $12 $12 $12 $12 $12 $12 $12 $12 Existing NOL schedule NOL starting balance $601 $601 $601 $601 $601 $589 $577 $565 $552 $540 $528 NOLs expired – – – – – – – – – ($0) ($1) NOL usage – – – – ($12) ($12) ($12) ($12) ($12) ($12) ($12) NOL ending balance $601 $601 $601 $601 $601 $589 $577 $565 $552 $540 $528 $516 Post-2022 NOL schedule NOL starting balance – $119 $224 $288 $301 $254 $187 $99 – – – NOLs generated $119 $104 $64 $13 – – – – – – – NOL usage – – – – ($47) ($67) ($88) ($99) – – – NOL ending balance – $119 $224 $288 $301 $254 $187 $99 – – – – Calendar year ended Discount Perpetuity growth rate rate (%) 2.0% 3.0% 4.0% Implied tota equity value per share Equity value per share - standalone DCF $1.43 $1.58 $1.75 Equity value per share - standalone DCF pre-tax income 13.0% $0.21 $0.21 $0.21 Net present value per share - tax benefits $1.64 $1.79 $1.96 Implied total equity value per share NOL S382 limitation based on Merger Consideration of $1.40 and long-term tax-exempt rate of 3.29% $1.05 $1.15 $1.27 Equity value per share - standalone DCF 14.5% $0.19 $0.19 $0.19 Net present value per share - tax benefits Assumes unlevered free cash flow projections discounted using $1.25 $1.35 $1.47 l assumed 13.0%-16.0% WACC $0.76 $0.83 $0.92 16.0% $0.18 $0.18 $0.18 Net present value per share - tax benefits Assumes tax rate of 29.0% per Bravo management $0.93 $1.01 $1.09 Implied total equity value per share
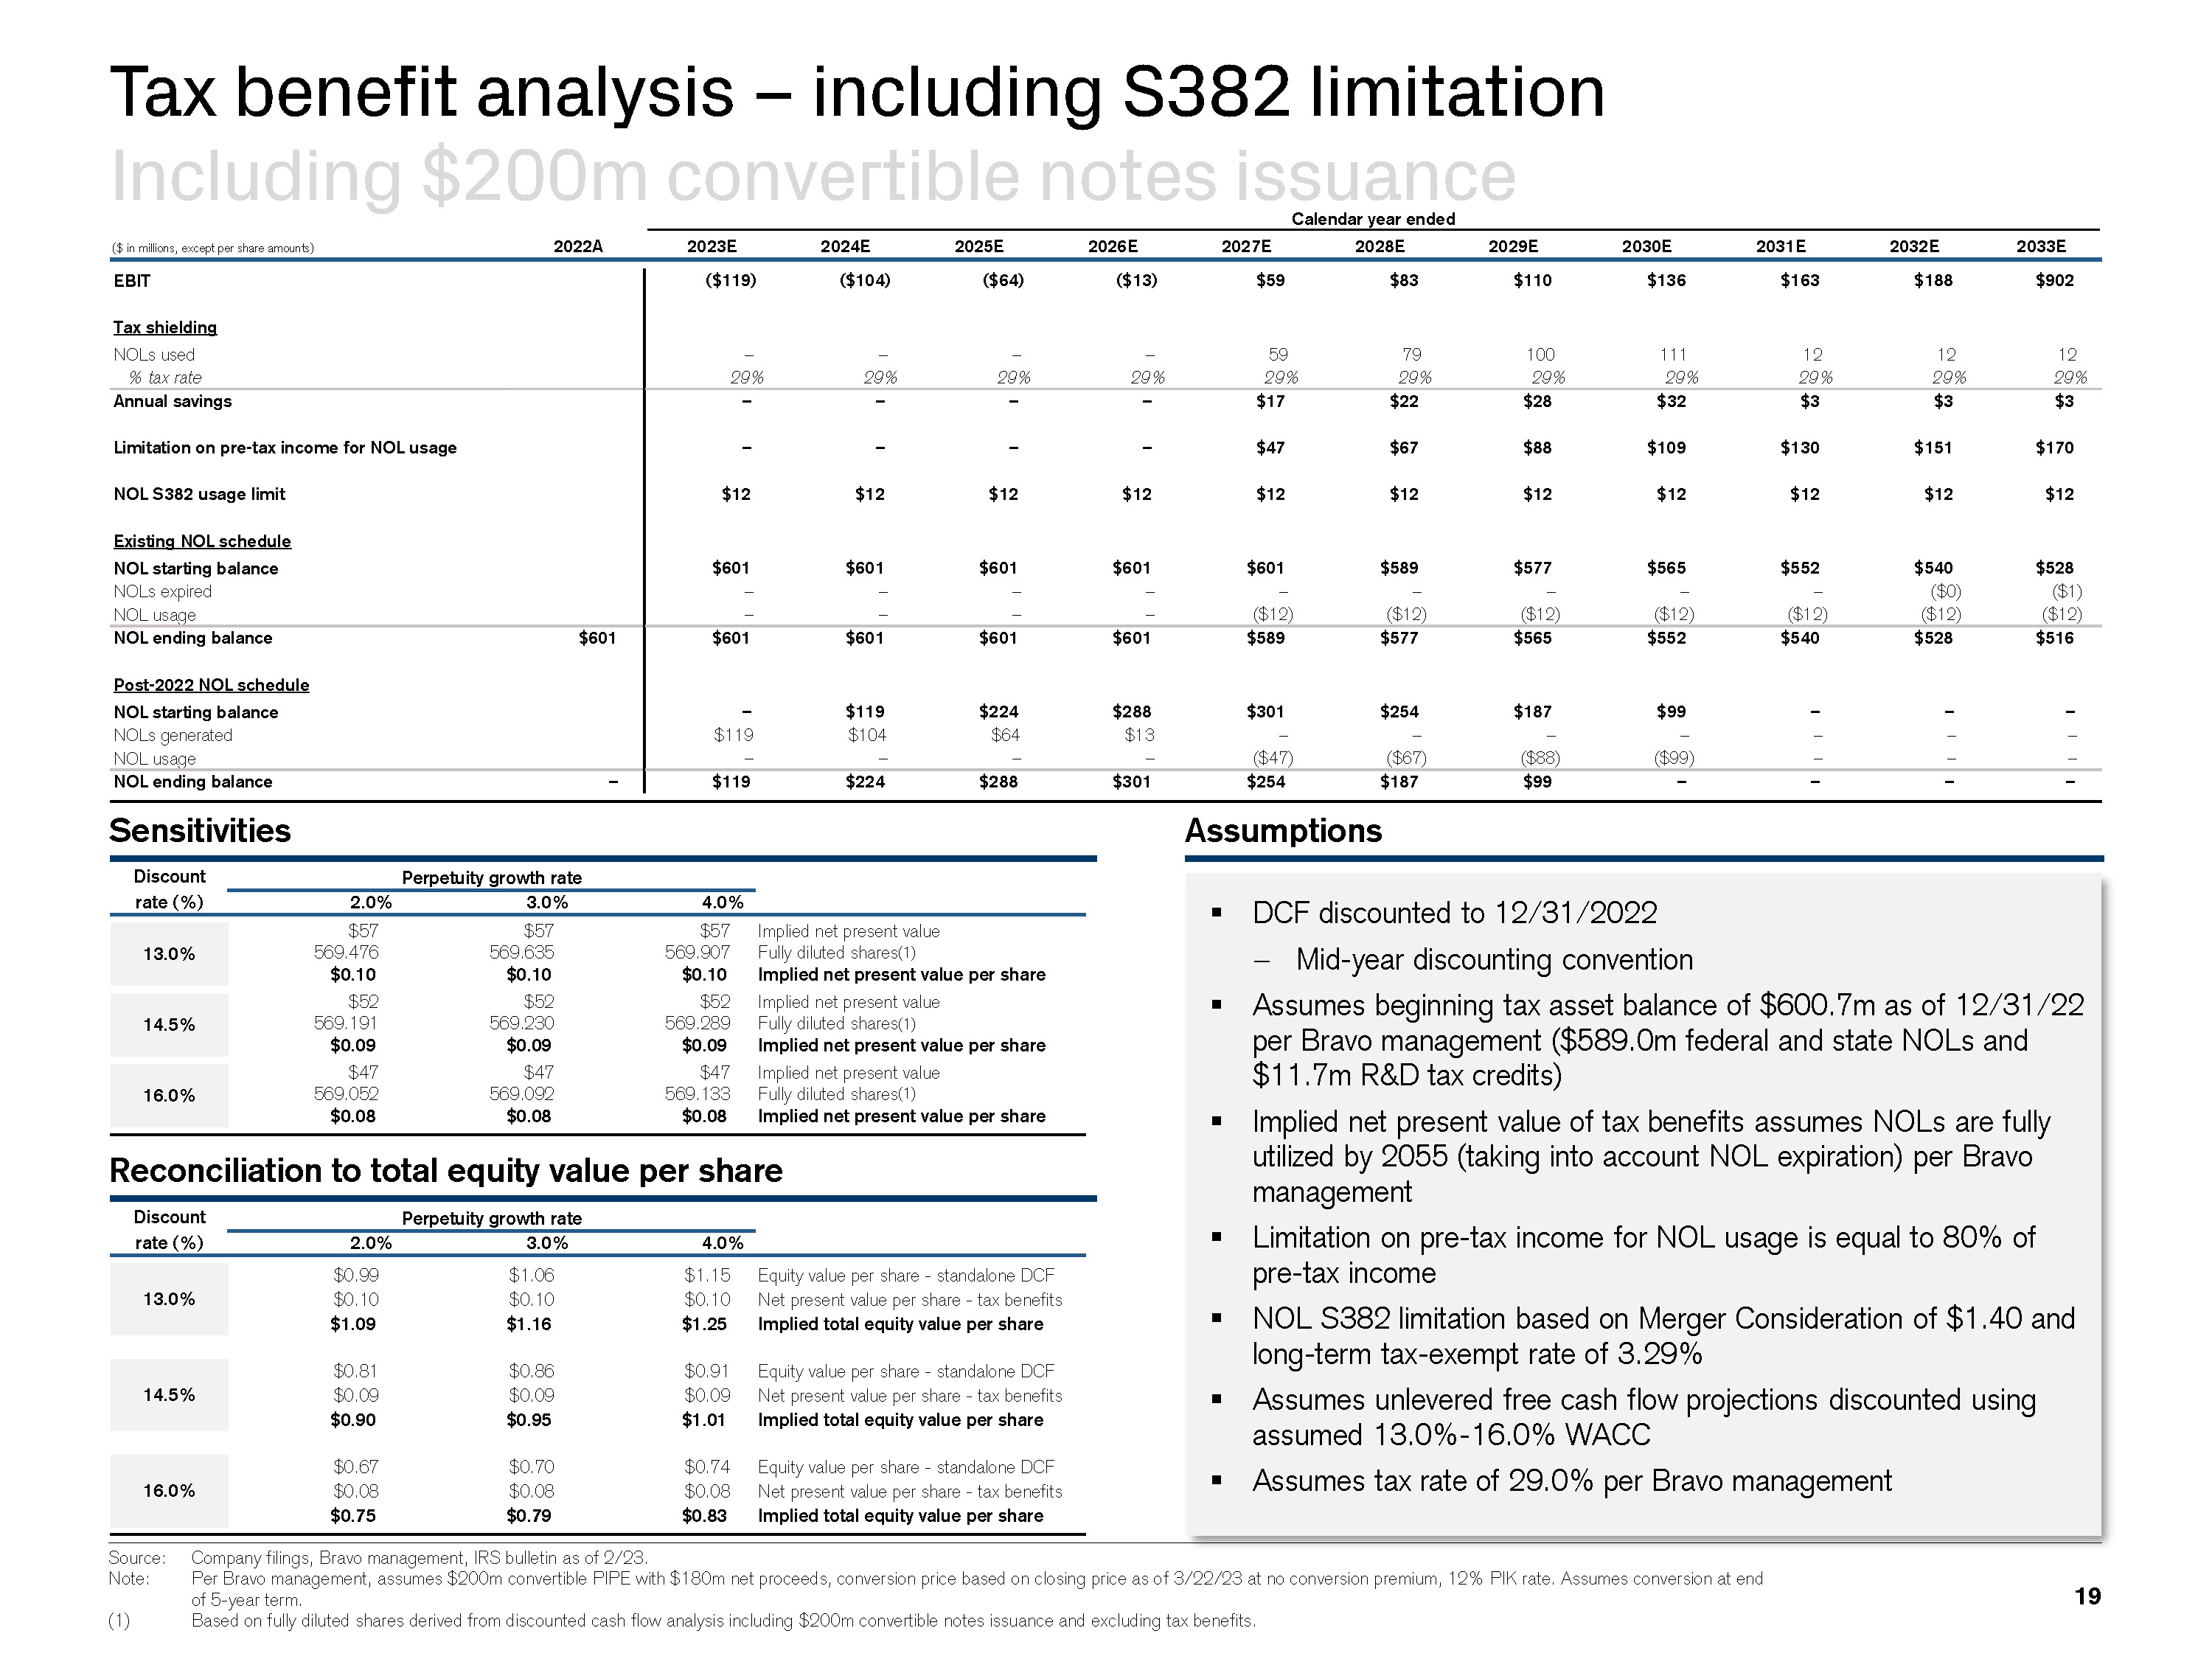
I Draft I N:\IBD_Regional_Documents_Repository_AM_Clients\Berkshire Grey(BQWF)\Spider\S03939\01. PPT\SoftBank\Project Flash_BoD_v14.pptx Tax benefit analysis – including S382 limitation Including $200m convertible notes issuance DCF discounted to 12/31/2022 − Mid-year discounting convention Assumes beginning tax asset balance of $600.7m as of 12/31/22 per Bravo management ($589.0m federal and state NOLs and $11.7m R&D tax credits) Implied net present value of tax benefits assumes NOLs are fully utilized by 2055 (taking into account NOL expiration) per Bravo management Limitation on pre-tax income for NOL usage is equal to 80% of 19 ($ in millions, except per share amounts) 2022A 2023E 2024E 2025E 2026E 2027E 2028E 2029E 2030E 2031E 2032E 2033E EBIT ($119) ($104) ($64) ($13) $59 $83 $110 $136 $163 $188 $902 Tax shielding NOLs used – – – – 59 79 100 111 12 12 12 % tax rate 29% 29% 29% 29% 29% 29% 29% 29% 29% 29% 29% Annual savings – – – – $17 $22 $28 $32 $3 $3 $3 Limitation on pre-tax income for NOL usage – – – – $47 $67 $88 $109 $130 $151 $170 NOL S382 usage limit $12 $12 $12 $12 $12 $12 $12 $12 $12 $12 $12 Existing NOL schedule NOL starting balance $601 $601 $601 $601 $601 $589 $577 $565 $552 $540 $528 NOLs expired – – – – – – – – – ($0) ($1) NOL usage – – – – ($12) ($12) ($12) ($12) ($12) ($12) ($12) NOL ending balance $601 $601 $601 $601 $601 $589 $577 $565 $552 $540 $528 $516 Post-2022 NOL schedule NOL starting balance – $119 $224 $288 $301 $254 $187 $99 – – – NOLs generated $119 $104 $64 $13 – – – – – – – NOL usage – – – – ($47) ($67) ($88) ($99) – – – NOL ending balance – $119 $224 $288 $301 $254 $187 $99 – – – – Sensitivities Assumptions Source: Company filings, Bravo management, IRS bulletin as of 2/23. Note: Per Bravo management, assumes $200m convertible PIPE with $180m net proceeds, conversion price based on closing price as of 3/22/23 at no conversion premium, 12% PIK rate. Assumes conversion at end of 5-year term. (1) Based on fully diluted shares derived from discounted cash flow analysis including $200m convertible notes issuance and excluding tax benefits. $57 $57 $57 Implied net present value 13.0% 569.476 569.635 569.907 Fully diluted shares(1) $0.10 $0.10 $0.10 Implied net present value per share $52 $52 $52 Implied net present value 14.5% 569.191 569.230 569.289 Fully diluted shares(1) $0.09 $0.09 $0.09 Implied net present value per share $47 $47 $47 Implied net present value 16.0% 569.052 569.092 569.133 Fully diluted shares(1) $0.08 $0.08 $0.08 Implied net present value per share Reconciliation to total equity value per share Calendar year ended Perpetuity growth rate Discount rate (%) 2.0% 3.0% 4.0% Discount Perpetuity growth rate rate (%) 2.0% 3.0% 4.0% Implied tota equity value per share Equity value per share - standalone DCF $0.99 $1.06 $1.15 Equity value per share - standalone DCF pre-tax income 13.0% $0.10 $0.10 $0.10 Net present value per share - tax benefits $1.09 $1.16 $1.25 Implied total equity value per share NOL S382 limitation based on Merger Consideration of $1.40 and long-term tax-exempt rate of 3.29% $0.81 $0.86 $0.91 Equity value per share - standalone DCF 14.5% $0.09 $0.09 $0.09 Net present value per share - tax benefits Assumes unlevered free cash flow projections discounted using $0.90 $0.95 $1.01 l assumed 13.0%-16.0% WACC $0.67 $0.70 $0.74 16.0% $0.08 $0.08 $0.08 Net present value per share - tax benefits Assumes tax rate of 29.0% per Bravo management $0.75 $0.79 $0.83 Implied total equity value per share
I Draft I Copyright © 2021 Credit Suisse Group AG and/or its affiliates. All rights reserved. N:\IBD_Regional_Documents_Repository_AM_Clients\Berkshire Grey(BQWF)\Spider\S03939\01. PPT\SoftBank\Project Flash_BoD_v14.pptx Credit Suisse does not provide any tax advice. Any tax statement herein regarding any U.S. federal tax is not intended or written to be used, and cannot be used, by any taxpayer for the purpose of avoiding any penalties. Any such statement herein was written to support the marketing or promotion of the transaction(s) or matter(s) to which the statement relates. Each taxpayer should seek advice based on the taxpayer's particular circumstances from an independent tax advisor. These materials have been provided to you by Credit Suisse in connection with an actual or potential mandate or engagement and may not be used or relied upon for any purpose other than as specifically contemplated by a written agreement with Credit Suisse. In addition, these materials may not be disclosed, in whole or in part, or summarized or otherwise referred to except as agreed in writing by Credit Suisse. The information used in preparing these materials was obtained from or through you or your representatives or from public sources. Credit Suisse assumes no responsibility for independent verification of such information and has relied on such information being complete and accurate in all material respects. To the extent such information includes estimates and forecasts of future financial performance (including estimates of potential cost savings and synergies) prepared by or reviewed or discussed with the managements of your company and/or other potential transaction participants or obtained from public sources, we have assumed that such estimates and forecasts have been reasonably prepared on bases reflecting the best currently available estimates and judgments of such managements (or, with respect to estimates and forecasts obtained from public sources, represent reasonable estimates). These materials were designed for use by specific persons familiar with the business and the affairs of your company and Credit Suisse assumes no obligation to update or otherwise revise these materials. Nothing contained herein should be construed as tax, accounting or legal advice. You (and each of your employees, representatives or other agents) may disclose to any and all persons, without limitation of any kind, the tax treatment and tax structure of the transactions contemplated by these materials and all materials of any kind (including opinions or other tax analyses) that are provided to you relating to such tax treatment and structure. For this purpose, the tax treatment of a transaction is the purported or claimed U.S. federal income tax treatment of the transaction and the tax structure of a transaction is any fact that may be relevant to understanding the purported or claimed U.S. federal income tax treatment of the transaction. These materials have been prepared by Credit Suisse ("CS") and its affiliates for use by CS. Accordingly, any information reflected or incorporated herein, or in related materials or in ensuing transactions, may be shared in good faith by CS and its affiliates with employees of CS, its affiliates and agents in any location. Credit Suisse has adopted policies and guidelines designed to preserve the independence of its research analysts. Credit Suisse’s policies prohibit employees from directly or indirectly offering a favorable research rating or specific price target, or offering to change a research rating or price target, as consideration for or an inducement to obtain business or other compensation. Credit Suisse’s policies prohibit research analysts from being compensated for their involvement in investment banking transactions. Credit Suisse Securities (USA) LLC (“CSSU”) does not hold an Australian Financial Services License (“AFSL”) and is exempt from the requirement to hold an AFSL. CSSU is licensed and regulated by the Securities and Exchange Commission under U.S. laws, which differ from Australian laws. A copy of the terms of relevant exemptions referenced is available upon request. CSSU can only provide services to Australian clients who are “wholesale clients” within the meaning of section 761G of the Corporations Act (Cth.). CREDIT SUISSE SECURITIES (USA) LLC Eleven Madison Avenue New York, NY 10010-3629 +1 212 325 2000 www.credit-suisse.com 20