As filed with the Securities and Exchange Commission on August 20, 2021
Registration No. 333-
UNITED STATES
SECURITIES AND EXCHANGE COMMISSION
Washington, D.C. 20549
FORM
S-1
REGISTRATION STATEMENT
UNDER
THE SECURITIES ACT OF 1933
Berkshire Grey, Inc
.
(Exact Name of Registrant as Specified in Its Charter)
Delaware | 6770 | 85-2994421 | ||
(State or other jurisdiction of incorporation or organization) | (Primary Standard Industrial Classification Code Number) | (I.R.S. Employer Identification Number) |
140 South Road
Bedford, Massachusetts 01730
(833) 848-9900
(Address, including zip code, and telephone number, including area code, of Registrant’s principal executive offices)
Thomas Wagner
Chief Executive Officer
Berkshire Grey, Inc.
140 South Road
Bedford, Massachusetts 01730
Telephone:
(833) 848-9900
(Name, address, including zip code, and telephone number, including area code, of agent for service)
Copies to:
Jocelyn Arel
Mark S. Opper
Goodwin Procter LLP
100 Northern Ave
Boston, MA 02210
Tel: (617)
570-1000
If any of the securities being registered on this Form are to be offered on a delayed or continuous basis pursuant to Rule 415 under the Securities Act of 1933 check the following box: ☒
If this Form is filed to register additional securities for an offering pursuant to Rule 462(b) under the Securities Act, check the following box and list the Securities Act registration statement number of the earlier effective registration statement for the same offering: ☐
If this Form is a post-effective amendment filed pursuant to Rule 462(c) under the Securities Act, check the following box and list the Securities Act registration statement number of the earlier effective registration statement for the same offering: ☐
If this Form is a post-effective amendment filed pursuant to Rule 462(d) under the Securities Act, check the following box and list the Securities Act registration statement number of the earlier effective registration statement for the same offering: ☐
Indicate by check mark whether the registrant is a large accelerated filer, an accelerated filer, a
non-accelerated
filer, smaller reporting company, or an emerging growth company. See the definitions of “large accelerated filer”, “accelerated filer”, “smaller reporting company”, and “emerging growth company” inRule 12b-2
of the Exchange Act.| Large accelerated filer | ☐ | Accelerated filer | ☐ | |||
Non-accelerated filer | ☒ | Smaller reporting company | ☒ | |||
| Emerging growth company | ☒ |
If an emerging growth company, indicate by check mark if the registrant has elected not to use the extended transition period for complying with any new or revised financial accounting standards provided pursuant to Section 7(a)(2)(B) of the Securities Act. ☐
CALCULATION OF REGISTRATION FEE
Title of each class of securities to be registered | Amount to be registered | Proposed maximum offering price per security | Proposed maximum aggregate offering price | Amount of registration fee | ||||||||||||
Class A common stock, par value $0.0001 per share | 205,457,460 | (1)(2) | $ | 8.48 | (3) | $ | 1,742,279,260.80 | $ | 190,082.67 | |||||||
Class A common stock par value $0.0001 per share | 14,750,000 | (4) | $ | 11.50 | (5) | $ | 169,625,000.00 | $ | 18,506.09 | |||||||
Warrants to purchase Class A common stock | 5,166,667 | (6) | — | — | — | (7) | ||||||||||
Total | $ | 208,588.75 | ||||||||||||||
| (1) | Consists of (a) 183,207,460 shares of Class A common stock issued to certain selling securityholders in connection with the closing of the Business Combination (as defined herein), (b) 16,500,000 shares of Class A common stock issued to certain selling securityholders in private placements consummated in connection with the PIPE Investment (as defined herein) and (c) 5,750,000 shares of Class A common stock underlying the Class C common stock issued to certain selling securityholders in connection with the Initial Public Offering (as defined herein). |
| (2) | Pursuant to Rule 416 under the Securities Act of 1933, as amended (the “Securities Act”), this registration statement also covers any additional number of shares of Class A common stock issuable upon stock splits, stock dividends or other distribution, recapitalization or similar events with respect to the shares of Class A common stock being registered pursuant to this registration statement. |
| (3) | Estimated solely for purposes of calculating the registration fee pursuant to Rule 457(c) under the Securities Act of 1933, as amended, and based on the average of the high and low sales price per share of the registrant’s Class A common stock on The Nasdaq Stock Market LLC on August 17, 2021. |
| (4) | Consists of (a) 5,166,667 shares of Class A common stock that may be issued upon the exercise of the Private Placement Warrants (as defined herein) and (b) 9,583,333 shares of Class A common stock that may be issued upon the exercise of the Public Warrants (as defined herein). |
| (5) | Based upon the $11.50 exercise price per share of Class A common stock issuable upon exercise of the Private Placement Warrants and the Public Warrants. |
| (6) | Represents the resale of the 5,166,667 Private Placement Warrants, which were issued on December 10, 2020 and will become exercisable upon effectiveness of this registration statement. |
| (7) | In accordance with Rule 457(i) under the Securities Act, the entire registration fee for the Private Placement Warrants is allocated to the shares of Class A common stock issuable upon exercise of the Private Placement Warrants, and no separate fee is payable for the Private Placement Warrants. |
The registrant hereby amends this registration statement on such date or dates as may be necessary to delay its effective date until the registrant shall file a further amendment which specifically states that this registration statement shall thereafter become effective in accordance with Section 8(a) of the Securities Act or until the registration statement shall become effective on such date as the SEC, acting pursuant to said Section 8(a), may determine.
The information in this preliminary prospectus is not complete and may be changed. We may not sell these securities until the registration statement filed with the Securities and Exchange Commission is effective. This prospectus is not an offer to sell these securities and it is not soliciting an offer to buy these securities in any state where the offer or sale is not permitted.
SUBJECT TO COMPLETION PRELIMINARY PROSPECTUS DATED AUGUST 20, 2021

Berkshire Grey, Inc.
220,207,460 Shares of Class A Common Stock
5,166,667 Warrants to Purchase Class A Common Stock
This prospectus relates to the resale, from time to time, by the selling securityholders (including their pledgees, donees, transferees or otheridentified in this prospectus, or the Selling Securityholders of (i) up to 205,457,460 shares of our Class A common stock and (ii) up to 5,166,667 Private Placement Warrants (as defined herein). This prospectus also relates to the issuance by us of up to 14,750,000 shares of Class A common stock upon the exercise of outstanding warrants.
successors-in-interest)
We will not receive any proceeds from the sale of the shares or the Private Placement Warrants by the Selling Securityholders. We will receive the proceeds from any exercise of the warrants for cash.
We will bear all costs, expenses and fees in connection with the registration of the shares of Class A common stock. The Selling Securityholders will bear all commissions and discounts, if any, attributable to their sales of the shares of Class A common stock.
Our Class A common stock is listed on The Nasdaq Stock Market LLC (“Nasdaq”) under the symbol “BGRY” and our warrants are listed on the Nasdaq under the symbol “BGRYW.” On August 19, 2021, the closing sale price of our Class A common stock as reported on the Nasdaq was $9.26, and the closing sale price of our warrants as reported on the Nasdaq was $1.05.
We are an “emerging growth company” under applicable Securities and Exchange Commission rules and, as such, have elected to comply with certain reduced public company disclosure requirements for this prospectus and future filings. See “Prospectus Summary — Implications of Being an Emerging Growth Company.”
Our business and investment in our Class A common stock and warrants involve significant risks. These risks are described in the section titled “Risk Factors” beginning on page 6 of this prospectus.
Neither the Securities and Exchange Commission nor any state securities commission has approved or disapproved of these securities or passed upon the accuracy or adequacy of this prospectus. Any representation to the contrary is a criminal offense.
The date of this prospectus is , 2021
TABLE OF CONTENTS
Page | ||||
| ii | ||||
| iii | ||||
| iii | ||||
| v | ||||
| 1 | ||||
| 6 | ||||
| 29 | ||||
| 30 | ||||
| 30 | ||||
| 31 | ||||
| 44 | ||||
| 58 | ||||
| 77 | ||||
| 82 | ||||
| 93 | ||||
| 96 | ||||
| 98 | ||||
| 104 | ||||
| 116 | ||||
| 117 | ||||
| 120 | ||||
| 121 | ||||
| 122 | ||||
| F-1 | ||||
i
ABOUT THIS PROSPECTUS
This prospectus is part of a registration statement that we filed with the U.S. Securities and Exchange Commission, or the SEC, using a “shelf” registration process. By using a shelf registration statement, the Selling Securityholders may sell up to 205,457,460 shares of Class A common stock and 5,166,667 Private Placement Warrants from time to time in one or more offerings as described in this prospectus. This prospectus also relates to the issuance by us of up to 14,750,000 shares of Class A common stock upon the exercise of outstanding warrants. We will not receive any proceeds from the sale of Class A common stock or Private Placement Warrants by the Selling Securityholders. We will receive the proceeds from any exercise of the warrants for cash.
We may also file a prospectus supplement or post-effective amendment to the registration statement of which this prospectus forms a part that may contain material information relating to these offerings. The prospectus supplement or post-effective amendment may also add, update or change information contained in this prospectus with respect to that offering. If there is any inconsistency between the information in this prospectus and the applicable prospectus supplement or post-effective amendment, you should rely on the prospectus supplement or post-effective amendment, as applicable. Before purchasing any securities, you should carefully read this prospectus, any post-effective amendment, and any applicable prospectus supplement, together with the additional information described under the heading “Where You Can Find More Information.”
Neither we, nor the Selling Securityholders, have authorized anyone to provide you with any information or to make any representations other than those contained in this prospectus, any post-effective amendment, or any applicable prospectus supplement prepared by or on behalf of us or to which we have referred you. We and the Selling Securityholders take no responsibility for, and can provide no assurance as to the reliability of, any other information that others may give you. We and the Selling Securityholders will not make an offer to sell these securities in any jurisdiction where the offer or sale is not permitted. You should assume that the information appearing in this prospectus, any post-effective amendment and any applicable prospectus supplement to this prospectus is accurate only as of the date on its respective cover. Our business, financial condition, results of operations and prospects may have changed since those dates. This prospectus contains, and any post-effective amendment or any prospectus supplement may contain, market data and industry statistics and forecasts that are based on independent industry publications and other publicly available information. Although we believe these sources are reliable, we do not guarantee the accuracy or completeness of this information and we have not independently verified this information. In addition, the market and industry data and forecasts that may be included in this prospectus, any post-effective amendment or any prospectus supplement may involve estimates, assumptions and other risks and uncertainties and are subject to change based on various factors, including those discussed under the heading “Risk Factors” contained in this prospectus, any post-effective amendment and the applicable prospectus supplement. Accordingly, investors should not place undue reliance on this information.
As used in this prospectus, unless otherwise indicated or the context otherwise requires, references to “we,” “us,” “our,” “Berkshire Grey” and the “Company” refer Berkshire Grey, Inc. (f/k/a Revolution Acceleration Acquisition Corp), a Delaware corporation, and its consolidated subsidiaries following the effective time of the Merger Agreement (as defined below). Unless the context otherwise requires, references to “RAAC” refer to Revolution Acceleration Acquisition Corp, a Delaware corporation, prior to the Closing, and references to “Legacy Berkshire Grey” refer to Berkshire Grey, Inc. (currently known as Berkshire Grey Operating Company, Inc.), a Delaware corporation, prior to the effective time of the Merger Agreement.
On July 20, 2021, RAAC held a special meeting in lieu of the annual meeting of its stockholders (the “Special Meeting”), at which the RAAC stockholders considered and adopted, among other matters, a proposal to approve the previously announced business combination (the “Business Combination”) pursuant to the terms of the Agreement and Plan of Merger (the “Merger Agreement”), by and among RAAC, Pickup Merger Corp, a Delaware corporation and a direct wholly owned subsidiary of RAAC (“Merger Sub”), and Legacy Berkshire Grey. Pursuant to the terms and subject to the conditions set forth in the Merger Agreement, following the Special Meeting, on July 21, 2021, the Business Combination was consummated (the “Closing”). Upon the
ii
completion of the Business Combination and the other transactions contemplated by the Merger Agreement, Legacy Berkshire Grey became a direct wholly-owned subsidiary of RAAC, Revolution Acceleration Acquisition Corp changed its name to Berkshire Grey, Inc. and Legacy Berkshire Grey changed its name to Berkshire Grey Operating Company, Inc.
TRADEMARKS
This document contains references to trademarks and service marks belonging to other entities. Solely for convenience, trademarks and trade names referred to in this prospectus may appear without the
®
or TM
symbols, but such references are not intended to indicate, in any way, that the applicable licensor will not assert, to the fullest extent under applicable law, its rights to these trademarks and trade names. Berkshire Grey does not intend its use or display of other companies’ trade names, trademarks or service marks to imply a relationship with, or endorsement or sponsorship of it by, any other companies.SELECTED DEFINITIONS
Unless otherwise stated in this prospectus or the context otherwise requires, references to:
| • | “A&R Registration Rights Agreement” are to the Amended & Restated Registration Rights Agreement, dated as of July 21, 2021, by and among the Company, RAAC Management LLC, Steven A. Museles, Phyllis R. Caldwell, Jason M. Fish, Andrew Wallace and certain former stockholders of Legacy Berkshire Grey. |
| • | “Berkshire Grey” are to Berkshire Grey, Inc., (f/k/a Revolution Acceleration Acquisition Corp), a Delaware corporation, and its consolidated subsidiaries after the effective time of the Merger Agreement. |
| • | “Business Combination” are to the business combination between RAAC and Berkshire Grey pursuant to the terms of the Merger Agreement. |
| • | “Bylaws” are to the amended and restated bylaws of Berkshire Grey. |
| • | “Charter” are to the third amended and restated certificate of incorporation of Berkshire Grey. |
| • | “Closing” are to the consummation of the Business Combination. |
| • | “COVID-19” are toSARS-CoV-2 COVID-19, and any evolutions, mutations or variants thereof or related to associated epidemics, pandemics or disease outbreaks. |
| • | “Exchange Act” are to the Securities Exchange Act of 1934, as amended. |
| • | “GAAP” are to generally accepted accounting principles in the United States as in effect from time to time. |
| • | “Initial Public Offering” means the initial public offering of RAAC, that was completed on December 10, 2020, of 28,750,000 RAAC Units. |
| • | “Internal Revenue Code” are the Internal Revenue Code of 1986, as amended. |
| • | “Merger Agreement” are to the Agreement and Plan of Merger, dated as of February 23, 2021, by and among RAAC, Merger Sub and Berkshire Grey. |
| • | “Merger Sub” are to Pickup Merger Corp, a Delaware corporation. |
| • | “Nasdaq” are to The Nasdaq Stock Market LLC. |
| • | “PIPE Investment” are to the purchase of 16,500,000 shares of Class A common stock pursuant to the Subscription Agreements. |
iii
| • | “RAAC” are to Revolution Acceleration Acquisition Corp, a Delaware corporation, prior to the effective time of the Merger Agreement. |
| • | “Private Placement Warrants” are to the 5,166,667 redeemable warrants of the Company that were sold in a private placement to the Sponsor concurrently with RAAC’s initial public offering at a purchase price of $1.50 per warrant. The Private Placement Warrants are identical to the Public Warrants except that, as long as the Sponsor or its permitted transferees beneficially own the Private Placement Warrants, the Private Placement Warrants (including the shares of Class A common stock issuable upon exercise of such Private Placement Warrants) are subject to certain transfer restrictions and the holders thereof are entitled to certain registration rights, and: (1) will not be redeemable by the Company (except as described under “ Description of Securities—Warrants |
| • | “Public Warrants” are to the 9,583,333 redeemable warrants of the Company sold as part of the RAAC Units in RAAC’s initial public offering. Each whole Public Warrant entitles the holder thereof to purchase one share of Class A common stock for $11.50 per share, subject to adjustment and in accordance with the terms of the Public Warrants. |
| • | “RAAC Units” are to the units of RAAC sold in connection with RAAC’s initial public offering, each such unit consisting of one share of Class A common stock and one-third of one Public Warrant. |
| • | “SEC” are to the United States Securities and Exchange Commission. |
| • | “Securities Act” are to the Securities Act of 1933, as amended. |
| • | “Sponsor” are to RAAC Management LLC, a Delaware limited liability company and the sponsor of RAAC. |
| • | “Subscription Agreements” are to the subscription agreements, entered into as of February 23, 2021, by and between RAAC and the PIPE Investors, pursuant to which the PIPE Investment will be consummated. |
Unless specified otherwise, amounts in this prospectus are presented in United States (“U.S.”) dollars.
Defined terms in the financial statements contained in this prospectus have the meanings ascribed to them in the financial statements.
iv
CAUTIONARY NOTE REGARDING FORWARD-LOOKING STATEMENTS
This prospectus contains forward-looking statements as defined in Section 27A of the Securities Act of 1933, as amended, or the Securities Act, and Section 21E of the Securities Exchange Act of 1934, as amended, or the Exchange Act. All statements other than statements of historical facts contained in this prospectus, including statements regarding our future results of operations and financial position, our business strategy, plans and prospects, existing and prospective products, research and development costs, timing and likelihood of success, and plans, market growth, trends, events and our objectives of management for future operations and results, are forward-looking statements. These statements involve known and unknown risks, uncertainties and other important factors that may cause our actual results, performance or achievements to be materially different from any future results, performance or achievements expressed or implied by the forward-looking statements.
In some cases, you can identify forward-looking statements by terms such as “may,” “will,” “should,” “expect,” “plan,” “anticipate,” “could,” “intend,” “target,” “project,” “contemplate,” “believe,” “estimate,” “predict,” “potential” or “continue” or the negative of these terms or other similar expressions. The forward-looking statements in this prospectus are only predictions. We have based these forward-looking statements largely on our current expectations and projections about future events and financial trends that we believe may affect our business, financial condition and results of operations. These forward-looking statements speak only as of the date of this prospectus and are subject to a number of important factors that could cause actual results to differ materially from those in the forward-looking statements, including the risks, uncertainties and assumptions described under the section in this prospectus titled “Risk Factors.” These forward-looking statements are subject to numerous risks, including, without limitation, the following:
| • | the expected benefits from the Business Combination; |
| • | Berkshire Grey’s plans to develop and commercialize its product candidates; |
| • | Berkshire Grey’s ability to continue to develop new innovations to meet constantly evolving customer demands; |
| • | Berkshire Grey’s expectations regarding the impact of the ongoing COVID-19 pandemic on its business, industry and the economy; |
| • | Berkshire Grey’s estimates regarding future expenses, revenue, earnings, margin, capital requirements and needs for additional financing after the Business Combination; |
| • | Berkshire Grey’s expectations regarding the growth of its business, including the potential size of the total addressable market; |
| • | Berkshire Grey’s ability to maintain and establish collaborations or obtain additional funding; |
| • | Berkshire Grey’s ability, subsequent to the consummation of the PIPE Investment and the Business Combination, to obtain funding for its future operations and working capital requirements and expectations regarding the sufficiency of its capital resources; |
| • | the implementation of Berkshire Grey’s business model and strategic plans for its business following the Business Combination; |
| • | Berkshire Grey’s intellectual property position and the duration of its patent rights; |
| • | developments or disputes concerning Berkshire Grey’s intellectual property or other proprietary rights; |
| • | Berkshire Grey’s ability to compete in the markets it serves; |
| • | Berkshire Grey’s expectations regarding its entry into new markets; |
| • | competition in Berkshire Grey’s industry, the advantages of Berkshire Grey’s solutions and technology over competing products and technology existing in the market and competitive factors including with respect to technological capabilities, cost and scalability; |
v
| • | the impact of government laws and regulations and liabilities thereunder; |
| • | Berkshire Grey’s need to hire additional personnel and our ability to attract and retain such personnel; |
| • | Berkshire Grey’s ability to raise financing in the future; and |
| • | the anticipated use of Berkshire Grey’s cash and cash equivalents. |
Because forward-looking statements are inherently subject to risks and uncertainties, some of which cannot be predicted or quantified and some of which are beyond our control, you should not rely on these forward-looking statements as predictions of future events. The events and circumstances reflected in our forward-looking statements may not be achieved or occur, and actual results could differ materially from those projected in the forward-looking statements. Moreover, we operate in an evolving environment. New risk factors and uncertainties may emerge from time to time, and it is not possible for management to predict all risk factors and uncertainties. As a result of these factors, we cannot assure you that the forward-looking statements in this prospectus will prove to be accurate. Except as required by applicable law, we do not plan to publicly update or revise any forward-looking statements contained herein, whether as a result of any new information, future events, changed circumstances, or otherwise.
You should read this prospectus completely and with the understanding that our actual future results may be materially different from what we expect. We qualify all of our forward-looking statements by these cautionary statements.
vi
PROSPECTUS SUMMARY
This summary highlights, and is qualified in its entirety by, the more detailed information and financial statements included elsewhere in this prospectus. This summary does not contain all of the information that may be important to you in making your investment decision. You should read this entire prospectus carefully, especially the “Risk Factors” section beginning on page 6 and our consolidated financial statements and the related notes appearing at the end of this prospectus, before deciding to invest in our Class A common stock or warrants.
Overview
Berkshire Grey is an Intelligent Enterprise Robotics (“IER”) company pioneering and delivering transformative
AI-enabled
robotic solutions that automate filling ecommerce orders for consumers or businesses, filling orders to resupply retail stores and groceries, and handling packages shipped to fill those orders. Our solutions transform supply chain operations and enable our customers to meet and exceed the demands of today’s connected consumers and businesses.Our IER capabilities are grounded in patented and proprietary technologies for(each picking or unit handling),(movement and storage of orders and goods), andwhich enables various intelligent subsystems to work together so that the right work is being done at the right time to meet our customer’s needs. We are a technology leader in robotics and AI automation with an intellectual property position buttressed by trade secrets supporting our technologies and over 300 patent filings with 75 U.S. and international patents issued to date in technologies including robotic picking, mobility, gripping, sensing and perception, general robot control, and differentiated supporting mechanisms. Our proprietary technologies enable us to offer holistic solutions that automate supply chain operations. Our solutions include moving goods to robots that then pick and pack ecommerce or retail orders, robotically moving and organizing inventory and orders within a warehouse or logistics facility, and robotically sorting packages and shipments.
robotic picking
robotic movement and mobility
system orchestration
Berkshire Grey is an IER company, a technology creator, and a deliverer of solutions. We are not a component technology company nor are we a conventional systems integrator. Instead, we create products from the technologies we pioneer and develop, and then incorporate the products (product modules) into solutions — solutions that incorporate said modules and are designed by us to meet customer performance metrics like throughput and accuracy rates. This technology plus performant, whole-enterprise solution view, enables customers to focus on the core of their business and creates attractive returns for them. Following the whole-enterprise solution view, we not only make, install, test, and commission the solutions, but we also offer customers continued support in the form of software updates as well as professional services including maintenance, system operation, and cloud-based monitoring and analytics. Because of our modular approach to solutions and the role of our software, we offer customers the ability to incrementally add to or change solutions, and we can incorporate outside technologies with our product modules if desired. The same modular attributes mean we can offer small and large solutions and can design for brownfield and greenfield installations. We offer customers a range of purchase options including a(“RaaS”) program that minimizes the
robotics-as-a-service
up-front
capital required when compared to conventional equipment purchase models. We also expect to realize recurring revenues from software maintenance and other services offered to our customers post-installation.For more information about Berkshire Grey, see the sections entitled “” and “”.
Business
Management’s Discussion and Analysis of Financial Condition and Results of Operation
Emerging Growth Company
We are an “emerging growth company”, as defined in Section 2(a) of the Securities Act, as modified by the JOBS Act, and it may take advantage of certain exemptions from various reporting requirements that are
1
applicable to other public companies that are not emerging growth companies, including, but not limited to, not being required to comply with the auditor attestation requirements of Section 404 of the Sarbanes-Oxley Act, reduced disclosure obligations regarding executive compensation in Berkshire Grey’s periodic reports and proxy statements, and exemptions from the requirements of holding a nonbinding advisory vote on executive compensation and stockholder approval of any golden parachute payments not previously approved.
Further, section 102(b)(1) of the JOBS Act exempts emerging growth companies from being required to comply with new or revised financial accounting standards until private companies (that is, those that have not had a Securities Act registration statement declared effective or do not have a class of securities registered under the Exchange Act) are required to comply with the new or revised financial accounting standards. The JOBS Act provides that a company can elect to opt out of the extended transition period and comply with the requirements that apply to
non-emerging
growth companies but any such election to opt out is irrevocable. Berkshire Grey has elected not to opt out of such extended transition period, which means that when a standard is issued or revised and it has different application dates for public or private companies, Berkshire Grey, as an emerging growth company, can adopt the new or revised standard at the time private companies adopt the new or revised standard. This may make comparison of Berkshire Grey’s financial statements with certain other public companies difficult or impossible because of the potential differences in accounting standards used.We will remain an emerging growth company until the earlier of (1) the last day of the fiscal year (a) following the fifth anniversary of the completion of RAAC’s IPO, (b) in which Berkshire Grey has a total annual gross revenue of at least $1.07 billion or (c) in which Berkshire Grey is deemed to be a large accelerated filer, which means the market value of Berkshire Grey’s common stock that is held by
non-affiliates equals
or exceeds $700 million as of the end of that year’s second fiscal quarter, and (2) the date on which we have issued more than $1.00 billion innon-convertible debt
securities during the prior three-year period. References herein to “emerging growth company” will have the meaning associated with it in the JOBS Act.Risk Factor Summary
You should consider all the information contained in this prospectus in deciding how to vote for the proposals presented in the prospectus. In particular, you should consider the factors described under “” beginning on page 6 of this prospectus, which include, among others, the following:
Risk Factors
| • | We have incurred net losses in every year since our inception, we anticipate expenses will increase in the future and we may not be able to achieve or maintain profitability in the future. |
| • | We have generated substantially all of our revenue to date, and expect to generate a significant portion of our future revenue, from a limited number of customers. |
| • | We have generated substantially all of our revenue to date from three product solutions. |
| • | Our mobile solutions use lithium-ion battery cells, which have been observed to catch fire or vent smoke and flame in limited circumstances, and such events have raised concerns, and future events may lead to additional concerns, about the batteries we use, which could have a negative impact on our sales or our reputation. |
| • | Our sales channels are currently limited, and our business may not grow as rapidly as we expect if we do not successfully develop other sales channels such as business partnerships and strategic alliances. |
| • | If our suppliers or other third-party vendors become unavailable or produce inadequate supplies or services, we may be unable to obtain necessary hardware, software and operational support, and our customer relationships, results of operations and financial condition may be adversely affected. |
| • | The facilities of our third-party contract manufacturers, our suppliers and our customers are vulnerable to disruption due to natural or other disasters, strikes, pandemics (including COVID-19) and other events beyond our control. |
2
| • | Our existing and planned global operations subject us to a variety of risks and uncertainties that could adversely affect our business and operating results. Our business is subject to risks associated with selling our solutions in locations outside the United States. |
| • | We may face liability if our solutions are used by our customers to handle dangerous materials. |
| • | Global economic, political and social conditions and uncertainties in the markets that we serve, including risks and uncertainties caused by the COVID-19 pandemic, may adversely impact our business. |
| • | Third parties may claim that our solutions or services infringe or otherwise violate their proprietary rights, which claims and any related litigation may adversely affect our business, financial condition and results of operations. |
| • | If we cannot cost-effectively develop proprietary technology, content, branding or business methods, or license them on favorable terms, we may be unable to compete effectively or to operate our business in certain jurisdictions. |
| • | Litigation or investigations involving us could result in material settlements, fines or penalties and may adversely affect our business, financial condition and results of operations. |
| • | We may require additional capital to support business growth, and this capital may not be available on acceptable terms, if at all. |
| • | As part of our growth strategy, we expect to acquire or make investments in other businesses, patents, technologies, products or services. Our failure to do so successfully could disrupt our business and have an adverse impact on our financial condition. |
| • | Our decision to expand existing solutions offerings into new markets or to launch new solutions may consume significant financial and other resources and may not achieve the desired results. |
| • | We have a broad range of competitors, including automation and robotics suppliers, more diversified technology providers and providers of alternative products, which could adversely impact the price of our solutions and our ability to increase our market share. |
| • | Our failure to meet our customers’ price expectations or declines in the prices of our solutions and services or in our sales volume would adversely affect our business and results of operations. |
| • | We may redeem your unexpired warrants prior to their exercise at a time that is disadvantageous to you, thereby making your warrants worthless. |
| • | Berkshire Grey’s operations may be materially adversely affected by the COVID-19 pandemic. |
| • | Our warrants are accounted for as liabilities and the changes in value of our warrants could have a material effect on our financial results. |
| • | In connection with the Business Combination, we have identified a material weaknesses in our internal control over financial reporting as of December 31, 2020 and March 31, 2021. If we are unable to develop and maintain an effective system of internal control over financial reporting, we may not be able to accurately report our financial results in a timely manner, which may adversely affect investor confidence in us and materially and adversely affect our business and operating results. |
| • | We may face litigation and other risks and uncertainties as a result of the material weaknesses in our internal control over financial reporting and the restatement of our financial statements. |
| • | We do not intend to pay dividends on our common stock for the foreseeable future. |
| • | If securities analysts do not publish research or reports about us, or if they issue unfavorable commentary about us or our industry or downgrade our common stock, the price of our common stock and warrants could decline. |
3
| • | Our issuance of additional shares of common stock or convertible securities could make it difficult for another company to acquire us, may dilute your ownership of us and could adversely affect the price of our stock and warrants. |
| • | Future sales, or the perception of future sales, of our common stock or securities convertible into our common stock by us or our existing stockholders in the public market could cause the market price for our common stock and warrants to decline. |
| • | Certain provisions, including anti-takeover provisions, in Berkshire Grey’s governing documents and under Delaware law could make an acquisition of us more difficult, limit attempts by our stockholders to replace or remove our current management and limit the market price of our common stock and warrants. |
| • | Berkshire Grey’s Bylaws designate the Court of Chancery of the State of Delaware as the sole and exclusive forum for substantially all disputes between us and our stockholders, which could limit our stockholders’ ability to obtain a favorable judicial forum for disputes with us or our directors, officers, or other employees. |
Corporate Information
We were incorporated under the laws of the state of Delaware on September 10, 2020 under the name Revolution Acceleration Acquisition Corp. Upon the closing of the Business Combination, we changed our name to Berkshire Grey, Inc. Our principal executive offices are located at 140 South Road, Bedford, Massachusetts 01730, and its telephone number is (833)
848-9900.
Our website address is www.berkshiregrey.com. The information contained in, or accessible through, our website does not constitute a part of this prospectus. We have included our website address in this prospectus solely as an inactive textual reference.4
The Offering
Class A common stock offered by the Selling Securityholders | 205,457,460 shares |
Class A common stock offered by us | 14,750,000 shares issuable upon the exercise of the warrants |
Warrants offered by the Selling Securityholders | 5,166,667 Private Placement Warrants |
Exercise Price of warrants | $11.50 per share, subject to adjustment as described herein |
Use of proceeds | We will not receive any proceeds from the sale of shares or warrants by the selling securityholders. We will receive the proceeds from any exercise of the warrants for cash, which we intend to use for general corporate and working capital purposes. |
Risk factors | You should carefully read the “Risk Factors” beginning on page 6 and the other information included in this prospectus for a discussion of factors you should consider carefully before deciding to invest in our Class A common stock and warrants. |
Nasdaq symbol for our Class A common stock | “BGRY” |
Nasdaq symbol for our warrants | “BGRYW” |
5
RISK FACTORS
You should carefully consider the risks and uncertainties described below and the other information in this prospectus before making an investment in our Class A common stock or warrants. Our business, financial condition, results of operations, or prospects could be materially and adversely affected if any of these risks occurs, and as a result, the market price of our Class A common stock and warrants could decline and you could lose all or part of your investment. This prospectus also contains forward-looking statements that involve risks and uncertainties. See “Cautionary Note Regarding Forward-Looking Statements.” Our actual results could differ materially and adversely from those anticipated in these forward-looking statements as a result of certain factors, including those set forth below.
Risks Relating to Berkshire Grey’s Business and Industry
Unless the context otherwise requires, all references in this “Risk Factors — Risks Related to Berkshire Grey’s Business and Industry” section to “ we,” “ us” and “ our” refer to Berkshire Grey as it currently exists following the consummation of the Business Combination and to Legacy Berkshire Grey as it existed prior to the consummation of the Business Combination
We have incurred net losses in every year since our inception, we anticipate expenses will increase in the future and we may not be able to achieve or maintain profitability in the future.
We have incurred net losses in each year since our incorporation in 2013, including net losses of $57.6 million for 2020 and $49.5 million for 2019. We believe we will continue to incur operating losses and negative cash flow in the near-term as we continue to invest significantly in our business, in particular across our research and development efforts and sales and marketing programs, and such losses may fluctuate significantly in any given quarter. We expect to incur significant expenditures for the foreseeable future in connection with such investments, and we expect these expenditures to increase as we continue to expand our operations into new geographic areas.
These investments may not result in increased revenue or growth in our business, and our operating results may fluctuate significantly or may fall below the expectations of investors. In addition, as a newly-public company, we expect to incur significant additional legal, accounting, directors and officers insurance and other expenses that we did not incur as a private company. These increased expenditures may make it harder for us to achieve and maintain future profitability. Revenue growth and growth in our customer base may not be achievable or sustainable, and we may not achieve sufficient revenue to achieve or maintain profitability. We may incur significant losses in the future for a number of reasons, including due to the other risks described in this prospectus, and we may encounter unforeseen expenses, difficulties, complications and delays and other unknown events. As a result, the amount of our future losses is uncertain, our losses may be larger than anticipated and we may incur significant losses for the foreseeable future. If we do not successfully address these risks, we may not achieve profitability when expected, or at all, and even if we do achieve profitability, we may not be able to maintain or increase profitability. Furthermore, if our future growth and operating performance fail to meet investor or analyst expectations, or if we have future negative cash flow or losses resulting from our investments in acquiring customers, further developing our technology or expanding our operations, this could have a material adverse effect on our business, financial condition and results of operations.
We have generated substantially all of our revenue to date, and expect to generate a significant portion of our future revenue, from a limited number of customers.
A significant portion of our revenue is derived from a limited number of customers. For the six months ended June 30, 2021, SoftBank, FedEx, and Meijer comprised approximately 38%, 30%, and 19% of our revenue respectively. In the year ended December 31, 2020, Target Corporation and SoftBank Robotics Corp., an affiliate of SB SVF II, a related party of Berkshire Grey, comprised approximately 70% and 30% of our revenue, respectively. We have master system purchase agreements with these customers that permit them to order
6
systems from time to time, and orders placed may be cancelled for convenience subject to payment of costs incurred by us. Historically, our revenue has been dependent upon a limited number of customers and we expect that we will continue to derive a majority of our revenue from a limited number of significant customers in future years. No assurance can be given that our significant customers will continue to do business with us or that they will maintain their historical levels of business. If our relationship with any significant customer were to cease, then our revenues would decline and negatively impact our results of operations. Any such decline could increase our accumulated deficit and result in a need to raise additional capital to fund our operations. If our expectations regarding future revenues are inaccurate, we may be unable to reduce costs in a timely manner to adjust for revenue shortfalls.
The majority of our contracts permit our customers to terminate their orders or such customer relationship for convenience, and such terminations, if effected, would adversely affect our future revenues and could have a significant negative impact on our financial condition and results of operations.
A significant portion of our revenue is derived from customers with whom we have entered into contracts that can be terminated by the customer for any reason, which may result in our failure to realize a significant portion of the value of the contract with such customer. If our relationship with any significant customer were to deteriorate or cease, we would be exposed to the risk that such customer contract may be terminated early. To the extent that we do not maintain our existing level of business with our significant or other customers, or such customers cancel existing contracts, we will need to attract new customers or win new business with existing customers, or our results of operations and financial condition will be adversely affected.
We have generated substantially all of our revenue to date from three product solutions. We may experience significant delays in the design, development, production and launch of new solutions, and we may be unable to successfully commercialize additional solutions on our planned timelines.
We are reliant on the marketing and sale of our current solutions for the majority of our revenue earned to date. If we are unable to sell these solutions to new customers or sell a higher volume of these solutions to our existing customers in the future, it will be difficult for us to achieve and maintain consistent profitability. In addition, if we are unable to develop new solutions and services, or if we experience significant delays or incur significant expenses in the design, development, production and launch of new solutions and services, then we may be unable to successfully commercialize additional solutions on our planned timelines, which may in turn have a material adverse effect on our business, financial condition and results of operations.
Our mobile solutions use
lithium-ion
battery cells, which have been observed to catch fire or vent smoke and flame in limited circumstances, and such events have raised concerns, and future events may lead to additional concerns, about the batteries we use, which could have a negative impact on our sales or our reputation.
The battery packs in certain of our solutions make use of
lithium-ion
cells. We also currently intend to make use oflithium-ion
cells in battery packs on future solutions we may produce. On rare occasions,lithium-ion
cells can rapidly release the energy they contain by venting smoke and flames in a manner that can ignite nearby materials as well as otherlithium-ion
cells. Extremely rare incidents of laptop computers, cell phones andlithium-ion
battery packs catching fire have raised questions and concerns about the safety of these cells. Negative public perceptions regarding the suitability oflithium-ion
cells, or any future incident involvinglithium-ion
cells, such as a vehicle or other device or product catching fire, could seriously harm our business, even if such incident does not involve us or our solutions. Although there have not been any observations or experiences of fire or smoke incidents associated with thelithium-ion
cells incorporated within our solutions, such incidents could result in a number of increased costs and expenses being imposed on our business, including costs resulting from regulatory compliance obligations in connection with regulatory scrutiny of the industry resulting from any such future incidents.7
Our sales channels are currently limited, and our business may not grow as rapidly as we expect if we do not successfully develop other sales channels such as business partnerships and strategic alliances.
To maintain and grow our business, we must maintain and expand our sales channels. As of June 30, 2021, our sole sales channel was through direct sales to customers. If we are unable to maintain and expand our sales channels, our growth prospects would be limited and our business or ability to realize future revenues may be harmed. We must also continuously monitor and evaluate emerging sales channels. If we fail to establish a presence in an important developing sales channel, our business and growth prospects could be harmed.
We currently depend on a limited number of third-party contract manufacturers for substantially all of our solution manufacturing. If these third-party manufacturers experience any delay, disruption or quality control problems in their operations, we could lose market share and our brand may be damaged.
While there are several potential manufacturers for most of our solutions, substantially all of our manufacturing needs are currently supplied by two third-party manufacturers, including Columbia Tech, a wholly owned subsidiary of Coghlin Companies, Inc., and Plexus Corp. We do not have ongoing manufacturing agreements with these manufacturers and we can change manufacturers at any time. In most cases, we rely on these two manufacturers to procure components and, in some cases, subcontract engineering work. Our reliance on limited number of contract manufacturers involves a number of risks, including, but not limited to:
| • | unpredictable and unexpected increases in manufacturing and repair costs; |
| • | inability to control the quality and reliability of finished solutions; |
| • | inability to control delivery schedules; |
| • | potential liability for expenses incurred by third-party contract manufacturers in reliance on our forecasts that later prove to be inaccurate; |
| • | potential lack of adequate capacity to manufacture all or a part of the solutions we require; |
| • | potential high switching costs in the event our relationship with a manufacturer ceases; |
| • | potential liability to customers for delays in delivery caused by dependence on third-party manufacturers to provide components; and |
| • | potential labor unrest affecting the ability of the third-party manufacturers to produce our solutions. |
If any of our third-party contract manufacturers experience a delay, disruption or quality control problems in their operations, including due to the
COVID-19
pandemic, or if a primary third-party contract manufacturer does not renew its agreement with us, our operations could be significantly disrupted and our solution shipments to customers could be delayed. Qualifying a new manufacturer and commencing volume production is expensive and time consuming. Ensuring that a contract manufacturer is qualified to manufacture our solutions to our standards is time consuming. In addition, there is no assurance that a contract manufacturer can scale its production of our solutions at the volumes and in the quality that we require. If a contract manufacturer is unable to do these things, we may have to move production for the solutions to a new or existing third-party manufacturer, which would take significant effort and our business, results of operations and financial condition could be materially adversely affected.As we contemplate moving manufacturing into different jurisdictions, we may be subject to additional significant challenges in ensuring that quality, processes, and costs, among other issues, are consistent with our expectations. For example, while we expect our third-party contract manufacturers to be responsible for costs assessed on us because of failures of the solutions, there is no assurance that we will be able to collect such reimbursements from these manufacturers, which would require us to take on additional risk for potential failures of our solutions. There may also be a number of other hindrances in securing third-party contract manufacturers in new jurisdictions, including hurdles that are regulatory in nature, financial or otherwise, that could significantly increase our costs of retaining such manufacturers and affect our results of operations.
8
In addition, because we use a limited number of third-party contract manufacturers, increases in the prices charged may have an adverse effect on our results of operations, as we may be unable to find a contract manufacturer who can supply to us at a lower price or a similar quality for components. As a result, the loss of a limited source supplier could adversely affect our relationships with our customers and our results of operations and financial condition.
All of our solutions must satisfy safety and regulatory standards, and some of our solutions may also need to receive regulatory certifications. Working with third-party consultants, we conduct tests, internally and through contract agencies, that support our applications for most regulatory approvals for our solutions. In the future we may outsource some of these testing responsibilities to our third-party contract manufacturers. If we or our contract manufacturers fail to timely and accurately conduct these tests, we may be unable to obtain the necessary regulatory approvals or certifications to sell our solutions in certain jurisdictions. As a result, we would be unable to sell our solutions and our sales and profitability could be reduced, our relationships with our sales channels could be harmed and our reputation and brand would suffer.
If our suppliers or other third-party vendors become unavailable or produce inadequate supplies or services, we may be unable to obtain necessary hardware, software and operational support, and our customer relationships, results of operations and financial condition may be adversely affected.
We acquire certain of our supplies and services, which are critical to the ongoing operation and future growth of our business, from several third parties. Generally, our third-party contract manufacturers contract directly with component suppliers to manage their supply chains. If one of our contract manufacturers has supply chain disruption, or our relationship with our contract manufacturer terminates, we could experience delays. We also source some materials directly from suppliers. While most manufacturing equipment and materials for our solutions are available from multiple suppliers, certain of those items are only available from limited sources. Should any of these suppliers become unavailable or inadequate, or impose terms unacceptable to us, such as increased pricing terms, we could be required to spend a significant amount of time and expense to develop alternate sources of supply, and we may not be successful in doing so on terms acceptable to us, or at all. As a result, the loss of a limited source supplier could adversely affect our relationship with our customers as well as our results of operations and financial condition.
The facilities of our third-party contract manufacturers, our suppliers and our customers are vulnerable to disruption due to natural or other disasters, strikes, pandemics (including
COVID-19)
and other events beyond our control.A major earthquake, fire, tsunami, hurricane, cyclone or other disaster, such as a major flood, seasonal storms, nuclear event or terrorist attack affecting the facilities of our third-party manufacturers, our suppliers or our customers, or the areas in which they are located, could significantly disrupt our or their operations and delay or prevent product shipment or installation during the time required to repair, rebuild or replace such damaged facilities. These delays could be lengthy and costly. Any delay in the production, shipment and installation of our solutions could impact the period in which we recognize the revenue related to that sale. Additionally, customers may delay purchases of our solutions until operations return to normal. Even if we are able to respond quickly to a disaster, the continued effects of the disaster could create uncertainty in our business operations. In addition, concerns about terrorism, the effects of a terrorist attack, political turmoil, labor strikes, war or the outbreak of epidemic or pandemic diseases (including the outbreak or persistence of
COVID-19)
could have a material and negative effect on our operations and sales.Our existing and planned global operations subject us to a variety of risks and uncertainties that could adversely affect our business and operating results. Our business is subject to risks associated with selling our solutions in locations outside the United States.
In 2020, we derived approximately 30% of our revenues from one customer in one country outside the United States. Revenues derived outside the United State increased to 38% during the six months ended June 30,
9
2021, and we plan to increase our international operations in the future. Accordingly, we expect to increasingly face significant operational risks and expenses from doing business internationally.
Our international operating results may be affected by volatility in currency exchange rates and our ability to effectively manage our currency transaction risks. We would incur currency transaction risks if we were to enter into either a purchase or a sale transaction using a different currency from the currency in which we report revenue. In such cases, we may suffer an exchange loss because we do not currently engage in currency swaps or other currency hedging strategies to address this risk. As we realize our strategy to expand internationally, our exposure to currency risks may increase. Given the volatility of exchange rates, we can give no assurance that we will be able to effectively manage our currency transaction risks or that any volatility in currency exchange rates will not have a material adverse effect on our results of operations.
Other risks and uncertainties we face from our global operations include, but are not limited to:
| • | difficulties in staffing and managing foreign operations; |
| • | limited protection for the enforcement of contract and intellectual property rights in certain countries where we may sell our solutions or work with suppliers or other third parties; |
| • | potentially longer sales and payment cycles and potentially greater difficulties in collecting accounts receivable; |
| • | costs and difficulties of customizing solutions for foreign countries; |
| • | challenges in providing solutions across a significant distance, in different languages and among different cultures; |
| • | laws and business practices favoring local competition; |
| • | being subject to a wide variety of complex foreign laws, treaties and regulations and adjusting to any unexpected changes in such laws, treaties and regulations; |
| • | specific and significant regulations, including, but not limited to, the European Union’s General Data Protection Regulation (“GDPR”), which imposes compliance obligations on companies who possess and use data of EU residents; |
| • | differences in analysis of regulatory, legal and tax issues across various countries, such as different interpretations of antitrust and competition laws; |
| • | uncertainty and resultant political, financial and market instability arising from the United Kingdom’s exit from the European Union; |
| • | compliance with U.S. laws affecting activities of U.S. companies abroad, including the U.S. Foreign Corrupt Practices Act; |
| • | uncertainties related to geopolitical risks, including the relationship between the U.S. government and the government of other nations; |
| • | tariffs, trade barriers and other regulatory or contractual limitations on our ability to sell or develop our solutions in certain foreign markets; |
| • | operating in countries with a higher incidence of corruption and fraudulent business practices; |
| • | changes in regulatory requirements, including export controls, tariffs and embargoes, other trade restrictions, competition, corporate practices and data privacy concerns; |
| • | potential adverse tax consequences arising from global operations; |
| • | seasonal reductions in business activity in certain parts of the world, particularly during the summer months in Europe and at year-end globally; |
10
| • | rapid changes in government, economic and political policies and conditions; and |
| • | political or civil unrest or instability, terrorism or epidemics or pandemics (including any risks related to or resulting from COVID-19) and other similar outbreaks or events. |
Our failure to effectively manage the risks and uncertainties associated with our existing and planned global operations could limit the future growth of our business and adversely affect our business and operating results.
In the future, some of our solutions may contain customer-specific provisions that may impact the period in which we recognize the related revenue under GAAP.
Some customers that purchase
AI-enabled
robotics and automation solutions from us may require specific, customized factors relating to their intended use or the installation of the solutions in their facilities. These specific, customized factors are occasionally required by the customers to be included in our commercial agreements relating to the purchases. As a result, our responsiveness to our customers’ specific requirements has the potential to impact the period in which we recognize the revenue relating to that sale.Similarly, some of our customers must build or prepare facilities to install a subset of our
AI-enabled
robotics and automation solutions, and the completion of such projects can be unpredictable, which can impact the period in which we recognize the revenue relating to that sale.We may face liability if our solutions are used by our customers to handle dangerous materials.
Customers may use our
AI-enabled
robotics and automation solutions to handle materials in a harmful way or in a manner that could otherwise be dangerous. While ourAI-enabled
robotics and automation solutions are safe when used properly and we endeavor to limit our liability for misuse and use of our solutions with hazardous materials, there can be no assurance that we will not be held liable if someone were injured or killed while using one of our solutions.Any unauthorized control or manipulation of our solutions or robots, or theft or vandalism of our robots, could negatively impact our ability to conduct business and compromise the integrity of our solutions, resulting in significant data losses to our Company and our customers or the theft of intellectual property, damage to our reputation and significant liability to third parties.
Our solutions contain complex information technology systems. While we have implemented security measures intended to prevent unauthorized access to our information technology networks, our solutions and their systems, our security measures may not be sufficient to prevent malicious entities from attempting to gain unauthorized access to modify, alter and use such networks, solutions and systems to gain control of, or to change, our solutions’ functionality, user interface and performance characteristics or from gaining access to data stored in or generated by our solutions or in our customer’s systems. Any unauthorized access to or control of our solutions or their systems or any loss of data could result in costly legal claims or government investigations. In addition, regardless of their accuracy, reports of unauthorized access to our solutions, their systems or data, as well as other factors that may result in the perception that our solutions, their systems or data are capable of being hacked, may harm our brand, prospects and operating results.
Laws and regulations governing the robotics and AI automation industries are still developing and may restrict our business or increase the costs of our solutions, making our solutions less competitive or adversely affecting our revenue growth.
We are generally subject to laws and regulations relating to the robotics and AI automation industries in the jurisdictions in which we conduct our business or in some circumstances, of those jurisdictions in which we offer our solutions, as well as the general laws and regulations that apply to all businesses, such as those related to
11
privacy and personal information, tax and consumer protection. These laws and regulations are developing and vary from one jurisdiction to another and future legislative and regulatory action, court decisions or other governmental action, which may be affected by, among other things, political pressures, attitudes and climates, as well as personal biases, may have a material and adverse impact on our operations and financial results.
Global economic, political and social conditions and uncertainties in the markets that we serve, including risks and uncertainties caused by the
COVID-19
pandemic, may adversely impact our business.Our performance depends on the financial health and strength of our customers, which in turn is dependent on the economic conditions of the markets in which we and our customers operate. The recent declines in the global economy, continuing geopolitical uncertainties and other macroeconomic factors all affect the spending behavior of potential customers. The economic uncertainty in the United States, Europe, Japan and other countries may cause
end-users
to further delay or reduce technology purchases and could possibly cause a national or global recession.We also face risks from financial difficulties or other uncertainties experienced by our suppliers, distributors or other third parties on which we rely resulting from geopolitical tensions. If third parties are unable to supply us with required materials or components or otherwise assist us in operating our business, our business could be harmed.
For example, the possibility of an ongoing trade war between the United States and China may impact the cost of raw materials, finished products or components used in our solutions and our ability to sell our solutions in, or source materials from, China. Other changes in U.S. social, political, regulatory and economic conditions or in laws and policies governing foreign trade, manufacturing, development and investment could also adversely affect our business. In addition, the United Kingdom’s formal exit from the European Union, or the potential for other countries to decide to leave the European Union, may have an effect on global economic conditions and the stability of global financial markets, which in turn could have a material adverse effect on our business, financial condition and results of operations. In extreme cases, we could experience interruptions in production due to the processing of customs formalities or reduced customer spending in the wake of weaker economic performance.
Our business is currently concentrated in the United States. Future exposure to local economies, regional downturns or severe weather or catastrophic occurrences or other disruptions or events may materially adversely affect our financial condition and results of operations.
For the year ended December 31, 2020, 30% of our revenue was derived from a customer in Japan. We expect to see revenue from other markets in future periods. Local and regional conditions in additional these markets may differ significantly from prevailing conditions in the United States or in other parts of the world. Our inability to effectively adapt to any shift, including failing to increase revenue from other markets, could adversely affect our business prospects and financial performance.
We may incur substantial costs and challenges enforcing and defending our intellectual property rights.
We may incur substantial costs in protecting, enforcing and defending our intellectual property rights against third parties. Intellectual property disputes may be costly and can be disruptive to our business operations by diverting attention and energies of management and key technical personnel and by increasing our costs of doing business. Third-party intellectual property claims asserted against us could subject us to significant liabilities, require us to enter into royalty and licensing arrangements on unfavorable terms, prevent us from assembling or licensing certain products, subject us to injunctions restricting our sale of solutions, cause severe disruptions to our operations or the marketplaces in which we compete or require us to satisfy indemnification commitments with our customers, including contractual provisions under various license arrangements. Any of these could have an adverse effect on our business and financial condition.
12
If we are unable to adequately protect or enforce our intellectual property rights, including patents pending, registered intellectual property and trade secrets, such information may be used by others to compete against us.
We have devoted substantial resources to the development of our technology and related intellectual property rights. Our success and future revenue growth will depend, in part, on our ability to protect our intellectual property. We rely on a combination of registered and unregistered intellectual property and protect our rights using patents, licenses, trademarks, trade secrets, confidentiality and assignment of invention agreements and other methods.
Despite our efforts to protect our proprietary rights, it is possible that competitors or other unauthorized third parties may obtain, copy, use or disclose our technologies, inventions, processes or improvements. We cannot provide assurance that any of our existing or future patents or other intellectual property rights will not be challenged, invalidated or circumvented, or will otherwise provide us with meaningful of sufficient protection. The infringement of our patents and misappropriation of confidential or trade secret technologies may occur in facilities where we cannot monitor or know that violations or theft is occurring. Our pending patent applications may not be granted, and we may not be able to obtain foreign patents or pending applications corresponding to our U.S. patents. Even if foreign patents are granted, effective enforcement in foreign countries may not be available. Moreover, we have registered our trademarks and domain names that we currently use in certain countries, but we may not be able to register them in other territories in which we may operate now or in the future. Further, we may be unable to prevent competitors from acquiring trademarks or domain names that are similar to or diminish the value of our intellectual property.
Our trade secrets,
know-how
and other unregistered proprietary rights are a key aspect of our intellectual property portfolio. While we take reasonable steps to protect our trade secrets and confidential information and enter into confidentiality and invention assignment agreements intended to protect such rights, such agreements can be difficult and costly to enforce or may not provide adequate remedies if violated, and we may not have entered into such agreements with all relevant parties. Such agreements may be breached and trade secrets or confidential information may be willfully or unintentionally disclosed, including by employees who may leave our company and join our competitors, or our competitors or other parties may learn of the information in some other way. The disclosure to, or independent development by, a competitor of any of our trade secrets,know-how
or other technology not protected by a patent or other intellectual property system could materially reduce or eliminate any competitive advantage that we may have over such competitor.If our patents and other intellectual property do not adequately protect our technology, our competitors may be able to offer products similar to ours. Our competitors may also be able to develop similar technology independently or design around our patents and other intellectual property, by copying or reverse-engineering our applications or other technology offerings, or through other means. Any of the foregoing events would lead to increased competition and reduce our revenue or gross margin, which would adversely affect our operating results.
Third parties may claim that our solutions or services infringe or otherwise violate their proprietary rights, which claims and any related litigation may adversely affect our business, financial condition and results of operations.
Intellectual property disputes and litigation, regardless of merit, can be costly and disruptive to our business operations by diverting attention and energies of management and key technical personnel and by increasing our costs of doing business. Any of the foregoing could adversely affect our business and financial condition and we may be unsuccessful in defending such disputes or litigation, which may require us to pay substantial damages or be subject to an injunction. Moreover, as part of any settlement or other compromise to avoid complex, protracted litigation, we may agree not to pursue future claims against a third party, including for claims related to alleged infringement of the third party’s or our intellectual property rights. Part of any settlement or other
13
compromise with another party may resolve a potentially costly dispute but may also have future repercussions on our ability to defend and protect our intellectual property rights, which in turn could adversely affect our business.
Disruption or failure of our networks, systems or technology as a result of computer viruses or malicious code, cyber-attacks, misappropriation of data or other malfeasance or cybersecurity incidents, as well as outages, natural disasters, terrorist attacks, accidental releases of information or similar events could disrupt our business or result in the loss of critical and confidential information.
We, our suppliers and our customers utilize information technology, or IT, systems and networks to process, transmit and store electronic information in connection with our business activities. As use of digital technologies has increased, cyber incidents, including third parties gaining access to employee accounts using stolen or inferred credentials, computer malware, viruses, spamming, phishing attacks or other means, and deliberate attacks and attempts to gain unauthorized access to computer systems and networks, have increased in frequency and sophistication. These threats pose a risk to the security of our systems and networks and the confidentiality, availability and integrity of our data. There can be no assurance that we will be successful in preventing cyber-attacks or successfully mitigating their effects. Like other companies, we have on occasion experienced, and will continue to experience, threats to our data and systems, including malicious codes and viruses, phishing, business email compromise attacks or other cyber-attacks. Any cyber-attack, data breach or destruction or loss of data could result in a violation of applicable U.S. and international privacy, data protection and other laws and subject us to litigation and governmental investigations and proceedings by federal, state and local regulatory entities in the United States and by international regulatory entities, resulting in exposure to material civil and/or criminal liability. Further, our general liability insurance and corporate risk management program may not cover all potential claims to which we are exposed and may not be adequate to indemnify us for all liability that may be imposed, which could have a material adverse effect on our business and prospects. In addition, we may suffer reputational harm or face litigation or adverse regulatory action as a result of cyber-attacks or other data security breaches and may incur significant additional expense to implement further data protection measures.
If we cannot cost-effectively develop proprietary technology, content, branding or business methods, or license them on favorable terms, we may be unable to compete effectively or to operate our business in certain jurisdictions.
Our revenue is derived from the sale of
AI-enabled
robotics and automation solutions and services. We have encountered and will continue to encounter challenges experienced by growing companies in a market subject to rapid innovation and technological change. While we intend to invest substantial resources to remain on the forefront of technological development, continuing advances in intelligent automation technology, changes in customer requirements and preferences and the emergence of new standards, regulations and certifications could adversely affect adoption of our solutions either generally or for particular applications. Our ability to compete in the intelligent automation market depends, in large part, on our success in developing and introducing new systems and technology, in improving our existing solutions and technology and qualifying new materials which our systems can support. We believe that we must continuously enhance and expand the functionality and features of our solutions and technologies in order to remain competitive. However, we may not be able to:| • | develop cost-effective new solutions and technologies that address the increasingly complex needs of prospective customers in a cost-effective manner or at all; |
| • | enhance our existing solutions and technologies; |
| • | respond to technological advances and emerging industry standards and certifications on a cost-effective and timely basis; |
| • | adequately protect our intellectual property as we develop new solutions and technologies; |
| • | identify the appropriate technology or product to which to devote our resources; or |
| • | ensure the availability of cash resources to fund research and development. |
14
Even if we successfully introduce new
AI-enabled
robotics and automation solutions and enhance our existing solutions and technologies, it is possible that these will eventually supplant our existing solutions or that our competitors will develop new solutions and technologies that will replace our own. As a result, any of our solutions may be rendered obsolete or uneconomical by our or our competitors’ technological advances, leading to a loss in market share, decline in revenue and adverse effects to our business and prospects.Our AI software platform contains third-party open-source software components, and failure to comply with the terms of the underlying open-source software licenses could restrict our ability to sell our solutions or give rise to disclosure obligations of proprietary software.
Our AI software platform contains components that are licensed under
so-called
“open source,” “free” or other similar licenses. Open source software is made available to the general public on an“as-is”
basis under the terms of anon-negotiable
license. Certain open source licenses may give rise to obligations to disclose or license our source code or other intellectual property rights if such open source software is integrated with our proprietary software in certain ways. We currently combine our proprietary software with open source software, but not in a manner that we believe requires the release of the source code of our proprietary software to the public. If we combine our proprietary software with open source software in a certain manner in the future, we could, under certain open source licenses, be required to release to the public or remove the source code of our proprietary software. Open source licensors also generally do not provide warranties or other contractual protections regarding infringement claims or the quality of the code. We may also face claims alleging noncompliance with open source license terms or infringement or misappropriation of proprietary software. These claims could result in litigation, require us to purchase a costly license or require us to remove the software. In addition, if the license terms for open source software that we use change, we may be forced tore-engineer
our solutions, incur additional costs or discontinue the sale of certain offerings ifre-engineering
could not be accomplished in a timely manner. Although we monitor our use of open source software to avoid subjecting our offerings to unintended conditions, there is a risk that these licenses could be construed in a way that could impose unanticipated conditions or restrictions on our ability to commercialize our offerings. We cannot guarantee that we have incorporated open source software in our software in a manner that will not subject us to liability or in a manner that is consistent with our current policies and procedures.We employ third-party licensed software for use in or with our software and to develop and maintain our software, and the inability to maintain these licenses, failure to comply with the terms of these licenses or errors in the software we license could result in increased costs, or reduced service levels, which would adversely affect our business.
Our software incorporates, and the development and maintenance of our software uses, certain third-party software obtained under licenses from other companies. We anticipate that we will continue to rely on such third-party software in the future. Although we believe that there are commercially reasonable alternatives to the third-party software we currently license, this may not always be the case, or it may be difficult or costly to migrate to other third-party software. Our use of additional or alternative third-party software would require us to enter into license agreements with third parties. In addition, integration of our software, including the third-party software used in our software with new third-party software may require significant work and require substantial investment of our time and resources. Also, any undetected errors or defects in third-party software could prevent the deployment or impair the functionality of our software, delay new updates or enhancements to our platform, result in a failure of our platform, present security risks and injure our reputation.
Litigation or investigations involving us could result in material settlements, fines or penalties and may adversely affect our business, financial condition and results of operations.
We could be subject to investigations and litigation in the future. While we intend to mount vigorous defenses to any future lawsuits that may be brought against us by any third party, we can provide no assurance as to the outcome of any such disputes, and any such actions may result in judgments against us for significant
15
damages. Resolution of any such matters can be prolonged and costly, and the ultimate results or judgments are uncertain due to the inherent uncertainty in litigation and other proceedings. In addition, the robotics and AI automation industry has been, and may continue to be, litigious, particularly with respect to intellectual property claims. Moreover, our potential liabilities are subject to change over time due to new developments, changes in settlement strategy or the impact of evidentiary requirements. Regardless of the outcome, future litigation may result in significant legal expenses and require significant attention and resources of management. As a result, any litigation that may be brought against us by any third party could result in losses, damages and expenses that have a significant adverse effect on our financial condition.
Our limited operating history and rapid recent growth make it difficult to evaluate our prospects and may increase the risk of any investment in our company.
We were founded in 2013, and much of our growth has occurred in recent periods. Our limited operating history may make it difficult for you to evaluate our current business and our prospects, as we continue to grow our business. Our ability to forecast our future operating results is subject to a number of uncertainties, including our ability to plan for and model future growth and expansion into new jurisdictions. We have encountered, and will continue to encounter, risks and uncertainties frequently experienced by growing companies in rapidly evolving industries, as we continue to grow our business. If our assumptions regarding these uncertainties, which we use to plan our business, are incorrect or change in reaction to changes in our markets, or if we do not address these risks successfully, our operating and financial results could differ materially from our expectations, our business could suffer and the trading price of our stock may decline.
It is difficult to predict our future revenues and appropriately budget for our expenses, and we have limited insight into trends that may emerge and affect our business. If actual results differ from our estimates or we adjust our estimates in future periods, our operating results and financial position could be materially affected.
If demand for our solutions does not grow as we expect, or if market adoption of
AI-enabled
robotics and automation solutions does not continue to develop, or develops more slowly than we expect, our future revenues may stagnate or decline, and our business may be adversely affected.The
AI-enabled
robotics and automation market is rapidly growing and developing. We may not be able to develop effective strategies to raise awareness among potential customers of the benefits ofAI-enabled
robotics and automation or our solutions may not address the specific needs or provide the level of functionality required by potential customers to encourage the continuation of this shift towardsAI-enabled
robotics and automation. IfAI-enabled
robotics and automation technology does not continue to gain broader market acceptance as an alternative to conventional manual operations, or if the marketplace adoptsAI-enabled
robotics and automation technologies that differ from our technologies, we may not be able to increase or sustain the level of sales of our solutions or retain existing customers or attract new customers, and our operating results would be adversely affected as a result.Our solutions have a limited operating history, and any defects in our solutions may give rise to warranty or other claims that could result in material expenses, diversion of management time and attention and damage to our reputation.
Our
AI-enabled
robotics and automation solutions (and underlying product modules and related components) are complex and may contain undetected defects or errors when first introduced, during operation, or as enhancements are released that, despite testing, are not discovered until after a system has been used for a certain period of time or under certain conditions. This could result in delayed market acceptance of our solutions or claims from resellers, customers or others, which may result in litigation, increasedend-user
warranty, support and repair or replacement costs, damage to our reputation and business, or significant costs and diversion of support and engineering personnel to correct the defect or error. We may from time to time become subject to warranty or product liability claims related to product quality issues that could lead us to incur significant expenses.16
We attempt to include provisions in our agreements with customers that are designed to limit our exposure to potential liability for damages arising from defects or errors in our solutions. However, it is possible that these limitations may not be effective as a result of unfavorable judicial decisions or laws or regulations enacted in the future.
The sale and support of our solutions entails the risk of product liability claims. Any product liability claim brought against us, regardless of its merit, could result in material expense, diversion of management time and attention, damage to our business and reputation and brand, and cause us to fail to retain existing customers or to fail to attract new customers.
If we fail to grow our business as we expect, our revenue, gross margin and operating margin will be adversely affected. If we grow our business as we expect but fail to effectively manage our growth, our business may be harmed, and our results of operation may be adversely impacted.
Over the past several years, we have experienced rapid growth, and we are attempting to continue to grow our business substantially. To this end, we have made, and expect to continue to make, significant investments in our business, including investments in our technology development, operations infrastructure and marketing and sales efforts. These investments include dedicated facilities expansion and increased staffing. If our business does not generate the level of revenue required to support our investment, our future revenues and profitability, if any, will be adversely affected.
Our ability to effectively manage our anticipated growth and expansion of our operations will also require us to enhance our operational, financial and management controls and infrastructure, human resources policies and reporting systems. These enhancements and improvements will require significant capital expenditures, investments in additional headcount and other operating expenditures and allocation of valuable management and employee resources. Our future financial performance and our ability to execute on our business plan will depend, in part, on our ability to effectively manage any future growth and expansion. There are no guarantees we will be able to do so in an efficient or timely manner, or at all.
We may require additional capital to support business growth, and this capital may not be available on acceptable terms, if at all.
We intend to continue to make investments to support our business growth and may require additional funds to respond to business challenges and opportunities, including the need to develop new features or enhance our solutions, improve our operating infrastructure or acquire complementary businesses and technologies. Accordingly, we may need to engage in equity or debt financings to secure additional funds if our existing sources of cash and any funds generated from operations do not provide us with sufficient capital. If we raise additional funds through future issuances of equity or convertible debt securities, our existing stockholders could suffer significant dilution, and any new equity securities we issue could have rights, preferences and privileges superior to those of holders of our common stock. Any debt financing that we may secure in the future could involve restrictive covenants relating to our capital raising activities and other financial and operational matters, which may make it more difficult for us to obtain additional capital and to pursue business opportunities, including potential acquisitions. We may not be able to obtain additional financing on terms favorable to us, if at all. If we are unable to obtain adequate financing or financing on terms satisfactory to us when we require it, our ability to continue to support our business growth and to respond to business challenges and opportunities could be significantly impaired, and our business may be adversely affected.
As part of our growth strategy, we expect to acquire or make investments in other businesses, patents, technologies, products or services. Our failure to do so successfully could disrupt our business and have an adverse impact on our financial condition.
We have no experience acquiring businesses and third-party technologies or products but expect to do so in the future. To the extent we seek to grow our business through acquisitions, we may not be able to successfully
17
identify attractive acquisition opportunities or consummate any such acquisitions if we cannot reach an agreement on commercially favorable terms, if we lack sufficient resources to finance the transaction on our own and cannot obtain financing at a reasonable cost or if regulatory authorities prevent such transaction from being consummated. In addition, competition for acquisitions in the markets in which we operate during recent years has increased, and may continue to increase, which may result in an increase in the costs of acquisitions or cause us to refrain from making certain acquisitions. We may not be able to complete future acquisitions on favorable terms, if at all.
If we do complete future acquisitions, we cannot assure you that they will ultimately strengthen our competitive position or that they will be viewed positively by customers, financial markets or investors. Furthermore, future acquisitions could pose numerous additional risks to our operations, including:
| • | diversion of management’s attention from their day-to-day |
| • | unanticipated or significant costs or liabilities associated with the acquisition; |
| • | incurrence of acquisition-related costs, which would be recognized as a current period expense; |
| • | problems integrating the purchased business, products or technologies; |
| • | challenges in achieving strategic objectives, cost savings and other anticipated benefits; |
| • | inability to maintain relationships with key customers, suppliers, vendors and other third parties on which the purchased business relies; |
| • | the difficulty of incorporating acquired technology and rights into our platform and of maintaining quality and security standards consistent with our brand; |
| • | difficulty in maintaining controls (financial or otherwise), procedures and policies during the transition and integration; |
| • | material changes to our business or product offerings resulting from regulatory compliance; |
| • | challenges in integrating the new workforce and the potential loss of key employees, particularly those of the acquired business; and |
| • | use of substantial portions of our available cash or the incurrence of debt to consummate the acquisition. |
If we proceed with a particular acquisition, we may have to use cash, issue new equity securities with dilutive effects on existing shareholders, incur indebtedness, assume contingent liabilities or amortize assets or expenses in a manner that might have a material adverse effect on our financial condition and results of operations. Aversion to any such acquisition from existing shareholders could adversely affect our stock price. Acquisitions will also require us to record certain acquisition-related costs and other items as current period expenses, which would have the effect of reducing our reported earnings in the period in which an acquisition is consummated. In addition, we could also face unknown liabilities or write-offs due to our acquisitions, which could result in a significant charge to our earnings in the period in which they occur. We will also be required to record goodwill or other long-lived asset impairment charges (if any) in the periods in which they occur, which could result in a significant charge to our earnings in any such period.
Achieving the expected returns and synergies from future acquisitions will depend, in part, upon our ability to integrate the products and services, technology, administrative functions and personnel of these businesses into our product lines in an efficient and effective manner. We cannot assure you that we will be able to do so, that our acquired businesses will perform at levels and on the timelines anticipated by our management or that we will be able to obtain these synergies in the future. In addition, acquired technologies and intellectual property may be rendered obsolete or uneconomical by our own or our competitors’ technological advances. Management resources may also be diverted from operating our existing businesses to certain acquisition integration
18
challenges. If we are unable to successfully integrate acquired businesses, our anticipated revenues and profits may be lower. Our profit margins may also be lower, or diluted, following the acquisition of companies whose profit margins are less than those of our existing businesses.
The competition for qualified personnel is particularly intense in our industry. In addition, we have added or made changes to executive personnel during the past 18 months and may continue to do so as our needs evolve. If we are unable to retain or hire executive and other key personnel, we may not be able to sustain or grow our business.
Our ability to operate successfully and manage our potential future growth depends significantly upon our ability to attract, retain and motivate highly skilled and qualified technical, sales, marketing, managerial, legal and financial personnel. We have hired, and expect to continue to hire, a substantial number of employees in these areas and others in order to support commercialization and the expected growth in our global business. However, we face intense competition for qualified personnel, and we may not be able to attract, retain and motivate these individuals. We compete for talent with numerous companies, as well as research organizations. Our future success also depends on the personal efforts and abilities of the principal members of our senior management and technical staff to provide strategic direction, management of our operations and maintenance of a cohesive and stable working environment. Although we have employment and incentive compensation agreements with our executive officers and incentive and compensation plans for our other personnel providing them with various economic incentives to remain employed with us, these incentives may not be sufficient to retain them. The loss of key personnel for any reason or our inability to hire, retain and motivate additional qualified personnel in the future could prevent us from sustaining or growing our business.
Our decision to expand existing solutions offerings into new markets or to launch new solutions may consume significant financial and other resources and may not achieve the desired results.
We expect to expand existing solutions offerings into new markets and to launch new solutions in the future. We may not be able to do so at prices that are attractive to our customers, and our costs to develop new solutions may be significant. It may take longer than we might expect for a solution, even if ultimately successful, to achieve attractive sales results. Failure to successfully develop or market new or expanded solutions or delays in the development of new or expanded solutions could have a material adverse effect on our financial condition, results of operations and business.
Our management team will have broad discretion in making strategic decisions to execute their growth plans, and there can be no assurance that our management’s decisions will result in successful achievement of our business objectives or will not have unintended consequences that negatively impact our growth prospects.
Our management will have broad discretion in making strategic decisions to execute their growth plans and may devote time and company resources to new or expanded solution offerings, potential acquisitions, prospective customers or other initiatives that do not necessarily improve our operating results or contribute to our growth. Management’s failure to make strategic decisions that are ultimately accretive to our growth may result in unfavorable returns and uncertainty about our prospects, each of which could cause the price of our common stock to decline.
We have a broad range of competitors, including automation and robotics suppliers, more diversified technology providers and providers of alternative products, which could adversely impact the price of our solutions and our ability to increase our market share.
The robotics and AI automation industry in which we operate is fragmented and competitive. We compete for customers with a wide variety of producers of robotics and automation systems, as well as with providers of components, materials and services for this equipment. Some of our existing and potential competitors are researching, designing, developing and marketing other types of products and services that may render our
19
existing or future solutions obsolete, uneconomical or less competitive. Existing and potential competitors may also have substantially greater financial, technical, marketing and sales, manufacturing, distribution and other resources than us, including name recognition, as well as experience and expertise in intellectual property rights and operating within certain international markets, any of which may enable them to compete effectively against us.
We intend to continue to follow a strategy of continuing product development and distribution network expansion to enhance our competitive position to the extent practicable. But we cannot assure you that we will be able to maintain our current position or continue to compete successfully against current and future sources of competition. If we do not keep pace with technological change and introduce new solutions and technologies, demand for our solutions may decline, and our operating results may suffer.
Our failure to meet our customers’ price expectations or declines in the prices of our solutions and services or in our sales volume would adversely affect our business and results of operations.
Demand for our
AI-enabled
robotics and automation solutions is sensitive to price. We believe our competitive pricing has been an important factor in our results to date. Therefore, changes in our pricing strategies can have a significant impact on our business and ability to generate revenue. Many factors, including our production and personnel costs and our competitors’ pricing and marketing strategies, can significantly impact our pricing strategies. If we fail to meet our customers’ price expectations in any given period, demand for our solutions could be negatively impacted and our business and results of operations could suffer.We use, and plan to continue using, different pricing models for different solutions. For example, we offer our customers a(“RaaS”) pricing model whereby we own and maintain systems physically located at our customer’s facility and our customer pays a subscription fee for the use of the system. Such pricing models are still relatively new to some of our customers and may not be attractive to them, especially in regions where they are less common. The RaaS pricing model requires us to fund the capital needed to manufacture systems and, therefore, substantial capital may be needed if our customers increase the use of the RaaS pricing model. Such capital may not be available under favorable terms, or at all, which could in turn harm our ability to grow our revenue. If customers resist such pricing models, our revenue may be adversely affected and we may need to restructure the way in which we charge customers for our solutions.
robotics-as-a-service
We may undergo an ownership change for U.S. federal income tax purposes, which would limit our ability to utilize net operating losses from prior tax years.
For U.S. federal income tax purposes, we have incurred net losses since our inception. If we undergo an ownership change for U.S. federal income tax purposes, our ability to utilize net operating loss carry-forwards from prior years to reduce taxable income in future tax years might be limited by operation of the Internal Revenue Code, either by limiting the amount of net operating losses that can be utilized to offset taxable income in a given year, or in total over the entire carry-forward period. Certain changes in the ownership of our common stock may result in an ownership change sufficient to limit the availability of our net operating losses.
The unaudited pro forma condensed combined financial information included in this prospectus is preliminary, and our actual financial condition and results of operations may differ materially.
The unaudited pro forma financial information included in this prospectus is presented for illustrative purposes only and is not necessarily indicative of what Berkshire Grey’s actual financial position or results of operations would have been had the Business Combination been completed on the date(s) indicated. The preparation of the pro forma financial information is based upon available information and certain assumptions and estimates that we currently believe are reasonable.
20
We may redeem your unexpired warrants prior to their exercise at a time that is disadvantageous to you, thereby making your warrants worthless.
We have the ability to redeem the outstanding warrants at any time after they become exercisable and prior to their expiration, at a price of $0.01 per warrant if, among other things, the Reference Value equals or exceeds $18.00 per share (as adjusted for adjustments to the number of shares issuable upon exercise or the exercise price of a warrant). If and when the warrants become redeemable by us, we may exercise our redemption right even if we are unable to register or qualify the underlying securities for sale under all applicable state securities laws. As a result, we may redeem the warrants as set forth above even if the holders are otherwise unable to exercise the warrants. Redemption of the outstanding warrants as described above could force you to: (1) exercise your warrants and pay the exercise price therefor at a time when it may be disadvantageous for you to do so; (2) sell your warrants at the then-current market price when you might otherwise wish to hold your warrants; or (3) accept the nominal redemption price which, at the time the outstanding warrants are called for redemption, we expect would be substantially less than the market value of your warrants. None of the private placement warrants will be redeemable by us so long as they are held by RAAC Management LLC or its permitted transferees.
In addition, we have the ability to redeem the outstanding warrants at any time after they become exercisable and prior to their expiration, at a price of $0.10 per warrant if, among other things, the Reference Value equals or exceeds $10.00 per share (as adjusted for adjustments to the number of shares issuable upon exercise or the exercise price of a warrant). In such a case, the holders will be able to exercise their warrants prior to redemption for a number of shares of Berkshire Grey Common Stock determined based on the redemption date and the fair market value of our Berkshire Grey Common Stock. Any such redemption may have similar consequences to a cash redemption described above. In addition, such redemption may occur at a time when the warrants arein which case you would lose any potential embedded value from a subsequent increase in the value of the Berkshire Grey Common Stock had your warrants remained outstanding. The value received upon exercise of the warrants (1) may be less than the value the holders would have received if they had exercised their warrants at a later time where the underlying share price is higher and (2) may not compensate the holders for the value of the warrants, including because the number of shares of Berkshire Grey Class A Common Stock received is capped at 0.361 shares of Berkshire Grey Common Stock per warrant (subject to adjustment) irrespective of the remaining life of the warrants.
“out-of-the-money,”
Berkshire Grey’s operations may be materially adversely affected by the
COVID-19
pandemic.The
COVID-19
pandemic has resulted, and other infectious diseases could result, in a widespread health crisis that has affected and could continue to adversely affect the economies and financial markets worldwide, which may delay or prevent the business of Berkshire Grey and could be materially and adversely affected. The extent of such impact will depend on future developments, which are highly uncertain and cannot be predicted, including new information which may emerge concerning the severity ofCOVID-19
and the actions to containCOVID-19
or treat its impact, among others.The disruptions posed by
COVID-19
have continued, and other matters of global concern may continue, for an extensive period of time, and if Berkshire Grey is unable to recover from business disruptions due toCOVID-19
or other matters of global concern on a timely basis, Berkshire Grey’s financial condition and results of operations may be materially adversely affected.Our warrants are accounted for as liabilities and the changes in value of our warrants could have a material effect on our financial results.
On April 12, 2021, the Acting Director of the Division of Corporation Finance and Acting Chief Accountant of the SEC together issued a statement regarding the accounting and reporting considerations for warrants issued by special purpose acquisition companies entitled “Staff Statement on Accounting and Reporting Considerations
21
for Warrants Issued by Special Purpose Acquisition Companies (‘SPACs’)” (the “SEC Statement”). Specifically, the SEC Statement focused on certain settlement terms and provisions related to certain tender offers following a business combination, which terms are similar to those contained in the warrant agreement governing our warrants. As a result of the SEC Statement, we reevaluated the accounting treatment of RAAC’s 9,583,333 public warrants and 5,166,667 private placement warrants prior to the Business Combination, and determined to classify the warrants as derivative liabilities measured at fair value, with changes in fair value each period reported in earnings.
As a result, included on our consolidated balance sheet as of December 31, 2020 contained elsewhere in this prospectus are derivative liabilities related to embedded features contained within our warrants. Accounting Standards Codification (“ASC”) 815,, and ASC 820,, provide for the remeasurement of the fair value of such derivatives at each balance sheet date, with a resulting
Derivatives and Hedging
Fair Value Measurement
non-cash
gain or loss related to the change in the fair value being recognized in earnings in the statement of operations. As a result of the recurring fair value measurement, our consolidated financial statements and results of operations may fluctuate quarterly, based on factors, which are outside of our control. Due to the recurring fair value measurement, we expect that we will recognizenon-cash
gains or losses on our warrants each reporting period and that the amount of such gains or losses could be material.In connection with the Business Combination, we identified a material weaknesses in our internal control over financial reporting as of December 31, 2020 and March 31, 2021. If we are unable to develop and maintain an effective system of internal control over financial reporting, we may not be able to accurately report our financial results in a timely manner, which may adversely affect investor confidence in us and materially and adversely affect our business and operating results.
Following the issuance of the SEC Statement, on April 29, 2021, after consultation with our independent registered public accounting firm, management and the Audit Committee of the RAAC Board concluded that, in light of the SEC Statement, it was appropriate to restate (i) certain items on RAAC’s previously issued audited balance sheet dated as of December 10, 2020, which was related to RAAC’s IPO, and (ii) RAAC’s previously issued audited financial statements as of December 31, 2020 and for the period from September 10, 2020 (inception) to December 31, 2020. See “—” On June 9, 2021, after consultation with our independent registered public accounting firm, management and the Audit Committee of the RAAC Board revised our position related to the classification of our shares of Class A common stock between temporary equity and permanent equity in connection with the guidance within ASC 480,as it specifically relates to the impact of the PIPE Investment and concluded that it was appropriate to restate RAAC’s previously issued interim condensed financial statements as of and for the three months ended March 31, 2021. As part of such processes, we identified material weaknesses in our internal controls over financial reporting.
Our warrants are accounted for as liabilities and the changes in value of our warrants could have a material effect on our financial results.
Distinguishing Liabilities from Equity
A material weakness is a deficiency, or a combination of deficiencies, in internal control over financial reporting such that there is a reasonable possibility that a material misstatement of our annual or interim financial statements will not be prevented, or detected and corrected on a timely basis.
Effective internal controls are necessary for us to provide reliable financial reports and prevent fraud. We continue to evaluate steps to remediate the material weakness. These remediation measures may be time consuming and costly, and there is no assurance that these initiatives will ultimately have the intended effects.
If we identify any new material weaknesses in the future, any such newly identified material weakness could limit our ability to prevent or detect a misstatement of our accounts or disclosures that could result in a material misstatement of our annual or interim financial statements. In such case, we may be unable to maintain compliance with securities law requirements regarding timely filing of periodic reports in addition to applicable stock exchange listing requirements, investors may lose confidence in our financial reporting and our stock price
22
may decline as a result. We cannot assure you that the measures we have taken to date, or any measures we may take in the future, will be sufficient to avoid potential future material weaknesses in our internal controls over financial reporting.
As of June 30, 2021, the material weakness had not been remediated.
We may face litigation and other risks and uncertainties as a result of the material weaknesses in our internal control over financial reporting and the restatement of our financial statements.
Following this issuance of the SEC Statement, on April 29, 2021, after consultation with our independent registered public accounting firm, management and the Audit Committee of the RAAC Board concluded that it was appropriate to restate (i) certain items on RAAC’s previously issued audited balance sheet dated as of December 10, 2020, which was related to RAAC’s IPO, and (ii) RAAC’s previously issued audited financial statements as of December 31, 2020 and for the period from September 10, 2020 (inception) to December 31, 2020. See “—” On June 9, 2021, after consultation with our independent registered public accounting firm, management and the Audit Committee of the RAAC Board revised our position related to the classification of our shares of Class A common stock between temporary equity and permanent equity in connection with the guidance within ASC 480,as it specifically relates to the impact of the PIPE Investment and concluded that it was appropriate to restate RAAC’s previously issued interim condensed financial statements as of and for the three months ended March 31, 2021. As part of such processes, we identified material weaknesses in our internal controls over financial reporting.
Our warrants are accounted for as liabilities and the changes in value of our warrants could have a material effect on our financial results.
Distinguishing Liabilities from Equity
As a result of such material weakness, the restatement of previously issued financials of RAAC, the change in accounting for the warrants and other matters raised or that may in the future be raised by the SEC, we face potential for litigation, inquiries from the SEC and other regulatory bodies, other disputes or proceedings which may include, among other things, monetary judgments, penalties or other sanctions, claims invoking the federal and state securities laws and contractual claims. As of the date of this prospectus, we have no knowledge of any such litigation, inquires, disputes or proceedings. However, we can provide no assurance that such litigation, inquiries, disputes or proceedings will not arise in the future. Any such litigation, inquiries, disputes or proceedings, whether successful or not, could have a material adverse effect on our business, results of operations and financial condition or our ability to complete our initial business combination.
Risks Relating to Ownership of Berkshire Grey’s Securities
Berkshire Grey’s common stock and warrant price may be volatile or may decline regardless of our operating performance and you may lose some or all of your investment.
The trading price of our common stock and warrants is likely to be volatile and the stock market recently has experienced extreme volatility and may experience similar volatility moving forward. This volatility often has been unrelated or disproportionate to the operating performance of particular companies. You may not be able to resell your shares or warrants at an attractive price due to a number of factors such as those listed in “” and the following:
— Risks Relating to Berkshire Grey’s Business and Industry
| • | the previous and continued impact of the COVID-19 pandemic on our financial condition and the results of operations; |
| • | our operating and financial performance and prospects; |
| • | our quarterly or annual earnings or those of other companies in our industry compared to market expectations; |
| • | conditions that impact demand for our solutions; |
| • | future announcements concerning our business, our clients’ businesses or our competitors’ businesses; |
23
| • | the public’s reaction to our press releases, other public announcements and filings with the SEC; |
| • | the market’s reaction to our reduced disclosure and other requirements as a result of being an “emerging growth company” under the Jumpstart Our Business Startups Act (the “JOBS Act”); |
| • | the size of our public float; |
| • | coverage by or changes in financial estimates by securities analysts or failure to meet their expectations; |
| • | market and industry perception of our success, or lack thereof, in pursuing our growth strategy and the effects of such perception on our brand and reputation; |
| • | strategic actions by us or our competitors, such as acquisitions or restructurings; |
| • | changes in laws or regulations which adversely affect our industry or us; |
| • | changes in accounting standards, policies, guidance, interpretations or principles; |
| • | changes in senior management or key personnel; |
| • | issuances, exchanges or sales, or expected issuances, exchanges or sales of our capital stock; |
| • | adverse resolution of new or pending litigation against us; and |
| • | changes in general market, economic and political conditions in the United States and global economies or financial markets, including those resulting from natural disasters, terrorist attacks, acts of war and responses to such events. |
These broad market and industry factors may materially reduce the market price of our common stock and warrants, regardless of our operating performance. In addition, price volatility may be greater if the public float and trading volume of our common stock is low. As a result, you may suffer a loss on your investment.
In the past, following periods of market volatility, stockholders have instituted securities class action litigation. If we were involved in securities litigation, it could have a substantial cost and divert resources and the attention of executive management from our business, regardless of the outcome of such litigation.
We do not intend to pay dividends on our common stock for the foreseeable future.
We currently intend to retain all available funds and any future earnings to fund the development and growth of our business. As a result, we do not anticipate declaring or paying any cash dividends on our common stock in the foreseeable future. Any decision to declare and pay dividends in the future will be made at the discretion of our board of directors and will depend on, among other things, our business prospects, results of operations, financial condition, cash requirements and availability, certain restrictions related to any future indebtedness, industry trends and other factors that our board of directors may deem relevant. Any such decision will also be subject to compliance with contractual restrictions and covenants in the agreements governing our future indebtedness. In addition, we may incur indebtedness, the terms of which may further restrict or prevent us from paying dividends on our common stock. As a result, you may have to sell some or all of your common stock after price appreciation in order to generate cash flow from your investment, which you may not be able to do. Our inability or decision not to pay dividends, particularly when others in our industry have elected to do so, could also adversely affect the market price of our common stock.
If securities analysts do not publish research or reports about us, or if they issue unfavorable commentary about us or our industry or downgrade our common stock, the price of our common stock and warrants could decline.
The trading market for our common stock and warrants will depend in part on the research and reports that third-party securities analysts publish about us and the industries in which we operate. We may be unable or slow
24
to attract research coverage and if one or more analysts cease coverage of us, the price and trading volume of our securities would likely be negatively impacted. If any of the analysts that may cover us change their recommendation regarding our securities adversely, or provide more favorable relative recommendations about our competitors, the price of our securities would likely decline. If any analyst that may cover us ceases covering us or fails to regularly publish reports on us, we could lose visibility in the financial markets, which could cause the price or trading volume of our securities to decline. Moreover, if one or more of the analysts who cover us downgrades our common stock, or if our reporting results do not meet their expectations, the market price of our common stock and warrants could decline.
Our issuance of additional shares of common stock or convertible securities could make it difficult for another company to acquire us, may dilute your ownership of us and could adversely affect the price of our common stock and warrants.
We intend to file a registration statement with the SEC on
Form S-8
providing for the registration of shares of our common stock issued or reserved for issuance under the Incentive Equity Plan. Subject to the satisfaction of vesting conditions and the expiration of lockup agreements, shares registered under the registration statement onForm S-8
will be available for resale immediately in the public market without restriction. From time to time in the future, we may also issue additional shares of our common stock or securities convertible into common stock pursuant to a variety of transactions, including acquisitions. The issuance by us of additional shares of our common stock or securities convertible into our common stock would dilute your ownership of us and the sale of a significant amount of such shares in the public market could adversely affect prevailing market prices of our common stock and warrants.In the future, we may obtain financing or to further increase our capital resources by issuing additional shares of our capital stock or offering debt or other equity securities, including senior or subordinated notes, debt securities convertible into equity, or shares of preferred stock. Issuing additional shares of our capital stock, other equity securities, or securities convertible into equity may dilute the economic and voting rights of our existing stockholders, reduce the market price of our common stock and warrants, or both. Debt securities convertible into equity could be subject to adjustments in the conversion ratio pursuant to which certain events may increase the number of equity securities issuable upon conversion. Preferred stock, if issued, could have a preference with respect to liquidating distributions or a preference with respect to dividend payments that could limit our ability to pay dividends to the holders of our common stock. Additionally, debt securities convertible into equity or preferred stock, if issued, may be given preferential rights or powers that could affect the rights and powers of our current stockholders. Our decision to issue securities in any future offering will depend on market conditions and other factors beyond our control, which may adversely affect the amount, timing or nature of our future offerings. As a result, holders of our common stock and warrants bear the risk that our future offerings may reduce the market price of our common stock and warrants and dilute a common stockholder’s percentage ownership. See “Description of Capital Stock.”
Future sales, or the perception of future sales, of our common stock or securities convertible into shares of our common stock by us or our existing stockholders in the public market could cause the market price for our common stock and warrants to decline.
The sale of shares of our Class A common stock or securities convertible into shares of our Class A common stock in the public market, or the perception that such sales could occur, could harm the prevailing market price of shares of our Class A common stock and warrants. These sales, or the possibility that these sales may occur, also might make it more difficult for us to sell equity securities in the future at a time and at a price that we deem appropriate.
Following this effectiveness of this registration statement, the Selling Securityholders’ shares of Class A common stock will be available for resale without restriction, subject to, in the case of stockholders who are our affiliates, volume, manner of sale and other limitations under Rule 144 promulgated under the Securities Act.
25
In addition, shares of our Class A common stock issuable upon exercise or vesting of incentive awards under our incentive plans may be eligible for sale in the public market, subject to any
lock-up
agreements and, in some cases, limitations on volume and manner of sale applicable to affiliates under Rule 144. Furthermore, shares of our Class A common stock reserved for future issuance under our 2021 Stock Option and Incentive Plan, or the 2021 Plan, including pursuant to the evergreen provision that allows our board of directors to reserve additional shares of Class A common stock for future issuance under the 2021 Plan each calendar year, may become available for sale in future.The market price of shares of our Class A common stock and warrants could drop significantly if the holders of these shares sell them or are perceived by the market as intending to sell them. These factors could also make it more difficult for us to raise additional funds through future offerings of shares of our Class A common stock or other securities.
We are an emerging growth company and a smaller reporting company within the meaning of the Securities Act, and if we take advantage of certain exemptions from disclosure requirements available to emerging growth companies or smaller reporting companies, this could make our securities less attractive to investors and may make it more difficult to compare our performance with other public companies.
We are an “emerging growth company” within the meaning of the Securities Act, as modified by the JOBS Act, and we may take advantage of certain exemptions from various reporting requirements that are applicable to other public companies that are not emerging growth companies including, but not limited to, not being required to comply with the auditor attestation requirements of Section 404 of the Sarbanes-Oxley Act, reduced disclosure obligations regarding executive compensation in our periodic reports and proxy statements, and exemptions from the requirements of holding a nonbinding advisory vote on executive compensation and shareholder approval of any golden parachute payments not previously approved. As a result, our shareholders may not have access to certain information they may deem important. We could be an emerging growth company for up to five years, although circumstances could cause us to lose that status earlier, including if the market value of our ordinary shares held by
non-affiliates
exceeds $700 million as of the end of any second quarter of a fiscal year, in which case we would no longer be an emerging growth company as of the end of such fiscal year. We cannot predict whether investors will find our securities less attractive because we will rely on these exemptions. If some investors find our securities less attractive as a result of our reliance on these exemptions, the trading prices of our securities may be lower than they otherwise would be, there may be a less active trading market for our securities and the trading prices of our securities may be more volatile.Further, Section 102(b)(1) of the JOBS Act exempts emerging growth companies from being required to comply with new or revised financial accounting standards until private companies (that is, those that have not had a Securities Act registration statement declared effective or do not have a class of securities registered under the Exchange Act) are required to comply with the new or revised financial accounting standards. The JOBS Act provides that a company can elect to opt out of the extended transition period and comply with the requirements that apply to
non-emerging
growth companies but any such election to opt out is irrevocable. We have elected not to opt out of such extended transition period which means that when a standard is issued or revised and it has different application dates for public or private companies, we, as an emerging growth company, can adopt the new or revised standard at the time private companies adopt the new or revised standard. This may make comparison of our financial statements with another public company which is neither an emerging growth company nor an emerging growth company which has opted out of using the extended transition period difficult or impossible because of the potential differences in accounting standards used.Additionally, we are a “smaller reporting company” as defined in Item 10(f)(1) of Regulation
S-K.
Smaller reporting companies may take advantage of certain reduced disclosure obligations, including, among other things, providing only two years of audited financial statements. We will remain a smaller reporting company until the last day of the fiscal year in which (1) the market value of our ordinary shares held bynon-affiliates
equals or exceeds $250 million as of the end of that year’s second fiscal quarter, or (2) our annual revenue26
equaled or exceeded $100 million during such completed fiscal year or the market value of our ordinary shares held by
non-affiliates
equals or exceeds $700 million as of the end of that year’s second fiscal quarter. To the extent we take advantage of such reduced disclosure obligations, it may also make comparison of our financial statements with other public companies difficult or impossible.Certain provisions, including anti-takeover provisions, in Berkshire Grey’s governing documents and under Delaware law could make an acquisition of us more difficult, limit attempts by our stockholders to replace or remove our current management and limit the market price of our common stock and warrants.
The Berkshire Grey Charter and Bylaws, and the DGCL, contain provisions that could have the effect of rendering more difficult, delaying, or preventing an acquisition deemed undesirable by Berkshire Grey’s board of directors and therefore depress the market price of Berkshire Grey’s common stock and warrants. Among other things, the Berkshire Grey Charter and Bylaws include the following provisions:
| • | a staggered board, which means that our board of directors is classified into three classes of directors with staggered three-year terms and directors may be removed from office (i) only for cause and (ii) only by the affirmative vote of the holders of not less than two thirds of the outstanding shares of capital stock then entitled to vote at an election of directors; |
| • | limitations regarding special stockholder meetings, including the requirement that a special meeting of stockholders may be called only by a majority of the entire Berkshire Grey board of directors, which could delay the ability of stockholders to force consideration of a proposal or to action, including the removal of directors and the adoption of desired governance changes; |
| • | a prohibition on stockholder action by written consent, which forces stockholder action to be taken at an annual or special meeting of stockholders and, therefore, could delay the ability of stockholders to force consideration of a stockholder proposal or to take action; |
| • | the authorization of undesignated preferred stock, the terms of which may be established and shares of which may be issued without further action by our stockholders; |
| • | the ability of the Berkshire Grey board of directors to amend its Bylaws, which may allow the Berkshire Grey board of directors to take additional actions to prevent an unsolicited takeover and inhibit the ability of an acquirer to amend the Bylaws to facilitate an unsolicited takeover attempt; |
| • | limitation of liability of, and the indemnification of, Berkshire Grey’s directors and officers; and |
| • | advance notice procedures, which apply for stockholders to nominate candidates for election as directors or to bring matters before an annual meeting of stockholders. |
These provisions, alone or together, could delay or prevent hostile takeovers and changes in control or changes in the Berkshire Grey board of directors or management.
Any provision of the Berkshire Grey’s Charter and Bylaws or Delaware law that has the effect of delaying, preventing or deterring a change in control could limit the opportunity for our stockholders to receive a premium for their shares of our common stock and warrants and could also affect the price that some investors are willing to pay for our common stock and warrants.
Berkshire Grey’s Bylaws designate the Court of Chancery of the State of Delaware as the sole and exclusive forum for substantially all disputes between us and our stockholders, which could limit our stockholders’ ability to obtain a favorable judicial forum for disputes with us or our directors, officers, or other employees.
The Berkshire Grey Bylaws, provide that, unless we consent in writing to the selection of an alternative forum, the Court of Chancery (the “Chancery Court”) of the State of Delaware shall be the sole and exclusive forum for state law claims for (i) any derivative action or proceeding brought on our behalf, (ii) any action
27
asserting a claim of breach of a fiduciary duty owed by any of our directors, officers or other employee of Berkshire Grey or Berkshire Grey’s stockholders, (iii) any action asserting a claim arising pursuant to any provision of the DGCL or the Berkshire Grey Charter or Bylaws, (iv) any action to interpret, apply, enforce or determine the validity of the Berkshire Grey Charter or Bylaws, or (v) any action asserting a claim against Berkshire Grey governed by the internal affairs doctrine. The foregoing provisions will not apply to any claims arising under the Exchange Act or the Securities Act and, unless we consent in writing to the selection of an alternative forum, the United States District Court for the District of Massachusetts will be the sole and exclusive forum for resolving any action asserting a claim arising under the Securities Act.
The choice of forum provision in the Bylaws may limit a stockholder’s ability to bring a claim in a judicial forum that it finds favorable for disputes with Berkshire Grey or any of Berkshire Grey’s directors, officers, or other employees, which may discourage such lawsuits with respect to such claims. There is uncertainty as to whether a court would enforce such provisions, and the enforceability of similar choice of forum provisions in other companies’ organizational documents has been challenged in legal proceedings. It is possible that a court could find these types of provisions to be inapplicable or unenforceable, and if a court were to find the choice of forum provision contained in the Berkshire Grey’s Bylaws to be inapplicable or unenforceable in an action, we may incur additional costs associated with resolving such action in other jurisdictions, which could harm the Berkshire Grey’s business, results of operations, and financial condition.
Additionally, Section 22 of the Securities Act creates concurrent jurisdiction for federal and state courts over all suits brought to enforce any duty or liability created by the Securities Act or the rules and regulations thereunder. As noted above, the Bylaws will designate the United States District Court for the District of Massachusetts as the sole and exclusive forum for resolving any action asserting a claim arising under the Securities Act. Accordingly, there is uncertainty as to whether a court would enforce such provision, and we may incur additional costs associated with resolving such action in other jurisdictions, which could harm Berkshire Grey’s business, results of operations, and financial condition. Our stockholders will not be deemed to have waived our compliance with the federal securities laws and the rules and regulations thereunder.
28
USE OF PROCEEDS
We are filing the registration statement of which this prospectus is a part to permit holders of the Private Placement Warrants and shares of our Class A common stock described in the section entitled “Selling Securityholders” to resell such warrants and shares. We will not receive any proceeds from the sale of warrants or shares by the Selling Securityholders.
The Selling Securityholders will pay all incremental selling expenses relating to the sale of their warrants and shares, including underwriters’ or agents’ commissions and discounts, brokerage fees, underwriter marketing costs and all reasonable fees and expenses of any legal counsel representing the Selling Securityholders, except that we will pay the reasonable fees and expenses of one legal counsel for the Selling Securityholders, in the event of an underwritten offering of their warrants and shares. We will bear all other costs, fees and expenses incurred in effecting the registration of the warrants and shares covered by this prospectus, including, without limitation, all registration and filing fees, printing and delivery fees, Nasdaq listing fees and fees and expenses of our counsel and our accountants.
We are also registering shares of our Class A common stock that may be issued upon exercise of warrants. We will receive the proceeds from any exercise of warrants for cash. We intend to use the proceeds the exercise of warrants for cash for general corporate and working capital purposes.
29
DIVIDEND POLICY
We have never declared or paid cash dividends on our capital stock. We do not expect to pay dividends on our capital stock for the foreseeable future, instead anticipating that all of our earnings for the foreseeable future will be used for the operation and growth of our business. The payment of any future dividends will be at the discretion of our board of directors and will depend on various factors, including our operating results, financial condition, capital requirements, growth plans, any contractual and legal restrictions on our payment of dividends, and any other factors deemed relevant by our board of directors.
MARKET INFORMATION
Our Class A common stock and warrants are listed on the Nasdaq under the symbol “BGRY” and “BGRYW,” respectively. As of July 21, 2021, there were approximately 160 registered holders of our Class A common stock. This number does not include beneficial owners holding our securities through nominee names.
30
UNAUDITED PRO FORMA CONDENSED COMBINED FINANCIAL INFORMATION
Introduction
The following unaudited pro forma condensed combined financial statements of Revolution Acceleration Acquisition Corp, “RAAC”, present the combination of the financial information of RAAC and Berkshire Grey, Inc., (“Berkshire Grey”), adjusted to give effect to the Business Combination (the “Combined Company”) and consummation of the transactions contemplated by the Subscription Agreements (collectively, the “Transactions”). The following unaudited pro forma condensed combined financial information has been prepared in accordance with Article 11 of
Regulation S-X.
The following unaudited pro forma condensed combined balance sheet as of June 30, 2021 assumes that the Transactions occurred on June 30, 2021. The unaudited pro forma condensed combined statements of operations for the six months ended June 30, 2021 and year ended December 31, 2020 present pro forma effect to the Transactions as if they had been completed on January 1, 2020.
The unaudited pro forma condensed combined financial statements do not necessarily reflect what the Combined Company’s financial condition or results of operations would have been had the Transactions occurred on the dates indicated. The unaudited pro forma condensed combined financial information also may not be useful in predicting the future financial condition and results of operations of the Combined Company. The actual financial position and results of operations may differ significantly from the pro forma amounts reflected herein due to a variety of factors.
This information should be read together with RAAC’s and Berkshire Grey’s respective audited financial statements and related notes, the sections titled “” and other financial information included elsewhere in this prospectus.
Management
’
s Discussion and Analysis of Financial Condition and Results of Operations
The Business Combination is accounted for as a reverse recapitalization, with no goodwill or other intangible assets recorded, in accordance with GAAP. Berkshire Grey has been determined to be the accounting acquirer based on evaluation of the following facts and circumstances:
| • | Berkshire Grey’s stockholders will have a majority of the voting power; |
| • | The majority of the members of the existing board of directors of Berkshire Grey will comprise the majority of the members of the Combined Company Board; |
| • | Berkshire Grey’s existing management will comprise the management of the Combined Company; |
| • | Berkshire Grey will comprise the ongoing operations of the Combined Company; |
| • | Berkshire Grey is the larger entity based on historical revenues and business operations; and |
| • | Combined Company will assume Berkshire Grey’s name. |
Under this method of accounting, RAAC is the “acquired” company for financial reporting purposes. Accordingly, for accounting purposes, the Business Combination is treated as the equivalent of Berkshire Grey issuing stock for the net assets of RAAC, accompanied by a recapitalization. The net assets of RAAC are stated at historical cost, with no goodwill or other intangible assets recorded.
The unaudited pro forma condensed combined financial information includes the redemption of 23,251,823 of RAAC Public Shares at a redemption price of $10.00 per share, transaction costs of approximately $27.4 million which include deferred underwriting commissions from RAAC’s IPO, 16,500,000 shares of RAAC Class A Common Stock issued pursuant to the PIPE Investment, and 196,765,903 shares of RAAC Class A Common Stock are issued as Merger Consideration.
31
Description of the Transactions
On February 23, 2021, RAAC entered into the Merger Agreement. Pursuant to the terms of the Merger Agreement, a business combination between RAAC and Berkshire Grey was affected through the merger of Merger Sub with and into Berkshire Grey, with Berkshire Grey surviving the merger as a wholly owned subsidiary of RAAC. At the effective time of the Business Combination, each share of Berkshire Grey preferred stock, par value $0.001 per share (“Berkshire Grey preferred stock”), and each share of Berkshire Grey common stock, par value $0.001 per share (“Berkshire Grey common stock”), was converted into the right to receive 5.87585 shares of RAAC’s Class A common stock, par value $0.0001 per share. The purchase price for the Berkshire Grey common stock and preferred stock had a cap of $2.25 billion. The consideration payable to Berkshire Grey stockholders consists of 225.0 million shares of RAAC Class A common stock at $10.00 per share (or $2.25 billion).
In connection with the execution of the Merger Agreement, RAAC entered into the Subscription Agreements. Pursuant to the Subscription Agreements, the Subscribers have agreed to purchase, and RAAC agreed to sell to the Subscribers, an aggregate of 16.5 million shares of Class A common stock for a purchase price of $10.00 per share and at an aggregate purchase price of $165.0 million (collectively, the “PIPE”). The obligations to consummate the transactions contemplated by the Subscription Agreements were conditioned upon, among other things, customary closing conditions and the consummation of the transactions contemplated by the Merger Agreement. The following pro forma condensed combined financial statements presented herein reflect the actual redemptions of 23,251,823 shares of Class A common stock by RAAC’s shareholders in conjunction with the stockholder vote on the Business Combination contemplated by the Merger Agreement at a meeting held on July 20, 2021.
(in thousands) | Purchase price | Shares Issued | ||||||
Share Consideration to Berkshire Grey (a)(b) | $ | 2,250,000 | 225,000 | |||||
| (a) | The value of Class A common stock issued to Berkshire Grey included in the consideration is reflected at $10.00 per share as defined in the Merger Agreement. |
| (b) | The total 225.0 million consideration shares include approximately 196.8 million shares to be issued for all issued and outstanding Berkshire Grey common and preferred stock plus approximately 28.2 million shares underlying unvested and/or unexercised restricted stock and options. |
The following summarizes the unaudited pro forma common stock shares outstanding after redemptions:
Ownership
Shares | % | |||||||
RAAC Public Stockholders | 5,498 | 2.4 | % | |||||
RAAC Sponsor and Directors | 9,583 | 4.2 | % | |||||
Total RAAC | 15,081 | 6.6 | % | |||||
Berkshire Grey (a) | 196,766 | 86.2 | % | |||||
PIPE Shares | 16,500 | 7.2 | % | |||||
Total Shares at Closing (excluding certain Berkshire Grey shares) | 228,347 | 100 | % | |||||
Berkshire Grey-Remaining Consideration Shares (a) | 28,234 | |||||||
Total Shares at Closing (including certain Berkshire Grey shares) | 256,581 | |||||||
| (a) | Total consideration to be issued to Berkshire Grey is $2.25 billion or 225.0 million shares ($10.00 per share price). The total shares to be issued includes Berkshire Grey common and preferred stock plus shares |
32
| underlying unvested and/or unexercised restricted stock and stock options. Accordingly, the consideration shares outstanding at the closing of the Business Combination has been adjusted to exclude the portion of consideration shares that will be attributed to unvested, and/or unexercised share awards at the closing of the Business Combination. |
The following unaudited pro forma condensed combined balance sheet as of June 30, 2021 and the unaudited pro forma condensed combined statements of operations for the six months ended June 30, 2021 and year ended December 31, 2020 are based on the historical financial statements of RAAC and Berkshire Grey. The unaudited pro forma adjustments are based on information currently available, assumptions, and estimates underlying the pro forma adjustments and are described in the accompanying notes. Actual results may differ materially from the assumptions used to present the accompanying unaudited pro forma condensed combined financial information.
33
UNAUDITED PRO FORMA CONDENSED RAAC BALANCE SHEET
AS OF JUNE 30, 2021
(in thousands)
RAAC Historical | RAAC Pro Forma Adjustments | Note 3 | RAAC As Adjusted | |||||||||||||
ASSETS | ||||||||||||||||
CURRENT ASSETS | ||||||||||||||||
Cash and cash equivalents | $ | 124 | $ | 41,193 | (A) | $ | 41,317 | |||||||||
Accounts receivable | — | — | — | |||||||||||||
Inventories | — | — | — | |||||||||||||
Deferred fulfillment costs | — | — | — | |||||||||||||
Prepaid expenses | 365 | — | 365 | |||||||||||||
Deferred transaction costs | ||||||||||||||||
Other current assets | — | — | — | |||||||||||||
Total current assets | 489 | 41,193 | 41,682 | |||||||||||||
Property and equipment - net | — | — | — | |||||||||||||
Restricted cash | — | — | — | |||||||||||||
Cash held in trust account | 287,539 | (287,539 | ) | (B) | — | |||||||||||
Other non-current assets | — | — | — | |||||||||||||
Total Assets | $ | 288,028 | $ | (246,346 | ) | $ | 41,682 | |||||||||
LIABILITIES, MEZZANINE EQUITY AND STOCKHOLDERS’ | ||||||||||||||||
CURRENT LIABILITIES | ||||||||||||||||
Accounts payable | $ | — | $ | — | $ | — | ||||||||||
Accrued expenses | 3,053 | — | 3,053 | |||||||||||||
Contract liabilities | — | — | — | |||||||||||||
Promisory Note - related party | 500 | — | 500 | |||||||||||||
Other current liabilities | — | — | — | |||||||||||||
Total current liabilities | 3,553 | — | 3,553 | |||||||||||||
Deferred underwriting fee payable | 10,063 | (10,063 | ) | (C) | — | |||||||||||
Warrant liability | 29,603 | — | 29,603 | |||||||||||||
Share-based compensation liability | — | — | — | |||||||||||||
Other non-current liabilities | — | — | — | |||||||||||||
Total Liabilities | 43,219 | (10,063 | ) | 33,156 | ||||||||||||
MEZZANINE EQUITY | ||||||||||||||||
Redeemable convertible preferred stock | — | — | — | |||||||||||||
Class A common stock subject to redemption | 287,500 | (287,500 | ) | (D) | — | |||||||||||
STOCKHOLDERS’ EQUITY (DEFICIT) | ||||||||||||||||
Class A common stock | — | — | — | |||||||||||||
Class B common stock | — | — | — | |||||||||||||
Class C common stock | 1 | — | 1 | |||||||||||||
Common stock | — | 1 | (D) | 1 | ||||||||||||
Additional paid-in capital | 24 | 51,216 | (D) | 51,240 | ||||||||||||
Accumulated deficit | (42,716 | ) | — | (42,716 | ) | |||||||||||
Accumulated other comprehensive income | — | — | — | |||||||||||||
Total stockholders’ equity (deficit) | (42,691 | ) | 51,217 | 8,526 | ||||||||||||
Total liabilities and stockholders’ equity (deficit) | $ | 288,028 | $ | (246,346 | ) | $ | 41,682 | |||||||||
34
UNAUDITED PRO FORMA CONDENSED BERKSHIRE GREY BALANCE SHEET
AS OF JUNE 30, 2021
(in thousands)
Berkshire Grey Historical | Berkshire Grey Pro Forma Adjustments | Note 3 | Berkshire Grey As Adjusted | |||||||||||
ASSETS | ||||||||||||||
CURRENT ASSETS | ||||||||||||||
Cash and cash equivalents | $ | 52,830 | $ | (2,200 | ) | (E) | $ | 50,630 | ||||||
Accounts receivable | 2,669 | — | 2,669 | |||||||||||
Inventories | 2,719 | — | 2,719 | |||||||||||
Deferred fulfillment costs | 13,373 | — | 13,373 | |||||||||||
Prepaid expenses | 2,537 | — | 2,537 | |||||||||||
Other current assets | 2,091 | — | 2,091 | |||||||||||
Total current assets | 76,219 | (2,200 | ) | 74,019 | ||||||||||
Property and equipment - net | 10,466 | — | 10,466 | |||||||||||
Restricted cash | 1,121 | — | 1,121 | |||||||||||
Cash held in trust account | — | — | — | |||||||||||
Deferred transaction costs | 1,770 | (1,770 | ) | — | ||||||||||
Other non-current assets | 24 | — | 24 | |||||||||||
Total Assets | $ | 89,600 | $ | (3,970 | ) | $ | 85,630 | |||||||
LIABILITIES, MEZZANINE EQUITY AND STOCKHOLDERS’ DEFICIT | ||||||||||||||
CURRENT LIABILITIES | ||||||||||||||
Accounts payable | $ | 5,412 | $ | — | $ | 5,412 | ||||||||
Accrued expenses | 12,339 | (1,770 | ) | 10,569 | ||||||||||
Contract liabilities | 23,765 | — | 23,765 | |||||||||||
Other current liabilities | 181 | — | 181 | |||||||||||
Total current liabilities | 41,697 | (1,770 | ) | 39,927 | ||||||||||
Deferred underwriting fee payable | — | — | — | |||||||||||
Warrant liability | — | — | ||||||||||||
Share-based compensation liability | 21,371 | (3,158 | ) | (F) | 18,213 | |||||||||
Other non-current liabilities | 1,996 | 1,996 | ||||||||||||
Total Liabilities | 65,064 | (4,928 | ) | 60,136 | ||||||||||
MEZZANINE EQUITY | ||||||||||||||
Redeemable convertible preferred stock | 223,442 | (223,442 | ) | (G) | — | |||||||||
Class A common stock subject to redemption | — | — | — | |||||||||||
STOCKHOLDERS’ EQUITY (DEFICIT) | ||||||||||||||
Class A common stock | — | — | — | |||||||||||
Class B common stock | — | — | — | |||||||||||
Class C common stock | — | — | — | |||||||||||
Common stock | 3 | 17 | (G) | 20 | ||||||||||
Additional paid-in capital | 29,237 | 224,383 | (E), (F), (G) | 253,620 | ||||||||||
Accumulated deficit | (228,141 | ) | — | (228,141 | ) | |||||||||
Accumulated other comprehensive income | (5 | ) | — | (5 | ) | |||||||||
Total stockholders’ equity (deficit) | (198,906 | ) | 224,400 | 25,494 | ||||||||||
Total liabilities and stockholders’ equity (deficit) | $ | 89,600 | $ | (3,970 | ) | $ | 85,630 | |||||||
35
UNAUDITED PRO FORMA CONDENSED COMBINED BALANCE SHEET
AS OF JUNE 30, 2021
(in thousands)
RAAC as Adjusted | Berkshire Grey As Adjusted | Transaction Accounting Adjustments | Note 3 | Pro Forma Combined | ||||||||||||||
ASSETS | ||||||||||||||||||
CURRENT ASSETS | ||||||||||||||||||
Cash and cash equivalents | $ | 41,317 | $ | 50,630 | $ | 153,561 | (A) | $ | 245,508 | |||||||||
Accounts receivable | — | 2,669 | — | 2,669 | ||||||||||||||
Inventories | — | 2,719 | — | 2,719 | ||||||||||||||
Deferred fulfillment costs | — | 13,373 | — | 13,373 | ||||||||||||||
Prepaid expenses | 365 | 2,537 | — | 2,902 | ||||||||||||||
Deferred transaction costs | — | — | — | — | ||||||||||||||
Other current assets | — | 2,091 | — | 2,091 | ||||||||||||||
Total current assets | 41,682 | 74,019 | 153,561 | 269,262 | ||||||||||||||
Property and equipment - net | — | 10,466 | — | 10,466 | ||||||||||||||
Restricted cash | — | 1,121 | — | 1,121 | ||||||||||||||
Cash held in trust account | — | — | — | — | ||||||||||||||
Other non-current assets | — | 24 | — | 24 | ||||||||||||||
Total Assets | $ | 41,682 | $ | 85,630 | $ | 153,561 | $ | 280,873 | ||||||||||
LIABILITIES, MEZZANINE EQUITY AND STOCKHOLDERS’ DEFICIT | ||||||||||||||||||
CURRENT LIABILITIES | ||||||||||||||||||
Accounts payable | $ | — | $ | 5,412 | $ | — | $ | 5,412 | ||||||||||
Accrued expenses | 3,053 | 10,569 | — | 13,622 | ||||||||||||||
Contract liabilities | — | 23,765 | — | 23,765 | ||||||||||||||
Promisory Note - related party | 500 | 500 | ||||||||||||||||
Other current liabilities | — | 181 | — | 181 | ||||||||||||||
Total current liabilities | 3,553 | 39,927 | — | 43,480 | ||||||||||||||
Deferred underwriting fee payable | — | — | — | — | ||||||||||||||
Warrant liability | 29,603 | — | — | 29,603 | ||||||||||||||
Share-based compensation liability | — | 18,213 | — | 18,213 | ||||||||||||||
Other non-current liabilities | — | 1,996 | — | 1,996 | ||||||||||||||
Total Liabilities | 33,156 | 60,136 | — | 93,292 | ||||||||||||||
MEZZANINE EQUITY | ||||||||||||||||||
Redeemable convertible preferred stock | — | — | — | — | ||||||||||||||
Class A common stock subject to redemption | — | — | — | — | ||||||||||||||
STOCKHOLDERS’ EQUITY (DEFICIT) | ||||||||||||||||||
Class A common stock | — | — | — | — | ||||||||||||||
Class B common stock | — | — | — | — | ||||||||||||||
Class C common stock | 1 | — | — | 1 | ||||||||||||||
Common stock | 1 | 20 | 2 | (E) | 23 | |||||||||||||
Additional paid-in capital | 51,240 | 253,620 | 110,843 | (D),(E) | 415,703 | |||||||||||||
Accumulated deficit | (42,716 | ) | (228,141 | ) | 42,716 | (E) | (228,141 | ) | ||||||||||
Accumulated other comprehensive income | — | (5 | ) | — | (5 | ) | ||||||||||||
Total stockholders’ equity (deficit) | 8,526 | 25,494 | 153,561 | 187,581 | ||||||||||||||
Total liabilities and stockholders’ equity (deficit) | $ | 41,682 | $ | 85,630 | $ | 153,561 | $ | 280,873 | ||||||||||
36
UNAUDITED PRO FORMA CONDENSED COMBINED STATEMENT OF OPERATIONS
FOR THE SIX MONTHS ENDED JUNE 30, 2021
(in thousands, except per share data)
RAAC Historical | Berkshire Grey Historical | Pro Forma Adjustments | Note 3 | Pro Forma | ||||||||||||||||
Revenue | $ | — | $ | 8,468 | $ | — | $ | 8,468 | ||||||||||||
Cost of revenue | — | 9,938 | — | 9,938 | ||||||||||||||||
Gross profit | — | (1,470 | ) | — | (1,470 | ) | ||||||||||||||
Operating expenses: | ||||||||||||||||||||
General and administrative | — | 8,853 | 1,328 | (H) (I) | 10,181 | |||||||||||||||
Sales and marketing | — | 38,023 | — | 38,023 | ||||||||||||||||
Research and development | — | 28,051 | — | 28,051 | ||||||||||||||||
Change in fair value of warrant liability | 6,741 | — | — | 6,741 | ||||||||||||||||
Transaction costs | — | — | — | — | ||||||||||||||||
Compensation expense | — | — | — | — | ||||||||||||||||
Formation and operational costs | 4,486 | — | (4,486 | ) | (I) | — | ||||||||||||||
Total operating expenses | 11,227 | 74,927 | (3,158 | ) | 82,996 | |||||||||||||||
Loss from operations | (11,227 | ) | (76,397 | ) | 3,158 | (84,466 | ) | |||||||||||||
Other income (expense): | ||||||||||||||||||||
Interest income | — | 14 | — | 14 | ||||||||||||||||
Other income | — | (42 | ) | — | (42 | ) | ||||||||||||||
Interest income (expense) on marketable securities held in trust account | 47 | — | (47 | ) | (J) | — | ||||||||||||||
Unrealized gain (loss) on marketable securities held in trust account | — | — | — | (K) | — | |||||||||||||||
Net loss before income tax | (11,180 | ) | (76,425 | ) | 3,111 | (84,494 | ) | |||||||||||||
Income tax | — | 12 | — | 12 | ||||||||||||||||
Net loss | (11,180 | ) | (76,437 | ) | 3,111 | (84,506 | ) | |||||||||||||
Weighted average common shares outstanding | 10,658 | 3,782 | 228,347 | |||||||||||||||||
Net loss per common share - basic and diluted | $ | (1.05 | ) | $ | (20.21 | ) | $ | (0.37 | ) | |||||||||||
37
UNAUDITED PRO FORMA CONDENSED COMBINED STATEMENT OF OPERATIONS
FOR THE YEAR ENDED DECEMBER 31, 2020
(in thousands, except per share data)
RAAC Historical | Berkshire Grey Historical | Pro Forma Adjustments | Note 3 | Pro Forma | ||||||||||||||
Revenue | $ | — | $ | 34,835 | $ | — | $ | 34,835 | ||||||||||
Cost of revenue | — | 32,009 | — | 32,009 | ||||||||||||||
Gross profit | — | 2,826 | — | 2,826 | ||||||||||||||
Operating expenses: | ||||||||||||||||||
General and administrative | — | 15,935 | 718 | (H) (I) | 16,653 | |||||||||||||
Sales and marketing | — | 12,910 | 12,910 | |||||||||||||||
Research and development | — | 35,806 | 35,806 | |||||||||||||||
Change in fair value of warrant liability | 590 | — | — | 590 | ||||||||||||||
Transaction costs | 828 | — | (828 | ) | (I) | — | ||||||||||||
Compensation expense | 52 | — | (52 | ) | (I) | — | ||||||||||||
Formation and operational costs | 173 | — | (173 | ) | (I) | — | ||||||||||||
Total operating expenses | 1,643 | 64,651 | (335 | ) | 65,959 | |||||||||||||
Loss from operations | (1,643 | ) | (61,825 | ) | 335 | (63,133 | ) | |||||||||||
Other income (expense): | ||||||||||||||||||
Interest income | — | 280 | — | 280 | ||||||||||||||
Other income | — | 3,907 | — | 3,907 | ||||||||||||||
Interest income (expense) on marketable securities held in trust account | 8 | — | (8 | ) | (J) | — | ||||||||||||
Unrealized gain (loss) on marketable securities held in trust account | (17 | ) | — | 17 | (K) | — | ||||||||||||
Net loss before income tax | (1,652 | ) | (57,638 | ) | 344 | (58,946 | ) | |||||||||||
Income tax | — | 5 | — | 5 | ||||||||||||||
Net loss | (1,652 | ) | (57,643 | ) | 344 | (58,951 | ) | |||||||||||
Weighted average common shares outstanding | 9,280 | 3,554 | 228,347 | |||||||||||||||
Net loss per common share - basic and diluted | $ | (0.18 | ) | $ | (16.22 | ) | $ | (0.26 | ) | |||||||||
38
NOTES TO UNAUDITED PRO FORMA CONDENSED COMBINED FINANCIAL INFORMATION
1. Basis of Presentation
The Business Combination is accounted for as a reverse recapitalization, with no goodwill or other intangible assets recorded, in accordance with GAAP. Under this method of accounting, RAAC is treated as the “acquired” company for financial reporting purposes. Accordingly, for accounting purposes, the Business Combination is treated as the equivalent of Berkshire Grey issuing stock for the net assets of RAAC, accompanied by a recapitalization. The net assets of RAAC are stated at historical cost, with no goodwill or other intangible assets recorded.
The unaudited pro forma condensed combined balance sheet as of June 30, 2021 assumes that the Transactions occurred on June 30, 2021. The unaudited pro forma condensed combined statement of operations for the six months ended June 30, 2021 and year ended December 31, 2020 presents the pro forma effect of the Transactions as if they had been completed on January 1, 2020.
The unaudited pro forma condensed combined statement of operations for the six months ended June 30, 2021 has been prepared using, and should be read in conjunction with, the following:
| • | RAAC’s unaudited statement of operations for the six months ended June 30, 2021 and the related notes included thereto which are included elsewhere in this prospectus; and |
| • | Berkshire Grey’s unaudited consolidated statements of operations for the six months ended June 30, 2021 and the related notes, included elsewhere in this prospectus. |
The unaudited pro forma condensed combined statement of operations for the year ended December 31, 2020 has been prepared using, and should be read in conjunction with, the following historical financial statements and notes thereto, which are included elsewhere in this prospectus:
| • | RAAC’s audited statement of operations for the year ended December 31, 2020; and |
| • | Berkshire Grey’s audited consolidated statement of operations for the year ended December 31, 2020. |
The unaudited pro forma condensed combined financial information is not necessarily indicative of what the actual results of operations and financial position would have been had the Transactions taken place on the dates indicated, nor are they indicative of the future consolidated results of operations or financial position of the Combined Company. They should be read in conjunction with the historical financial statements and notes thereto of RAAC and Berkshire Grey.
2. Accounting Policies
As part of the preparation of these unaudited pro forma condensed combined financial statements, certain reclassifications were made to align RAAC’s and Berkshire Grey’s financial statement presentation. Management performed a comprehensive review of RAAC’s and Berkshire Grey’s accounting policies. Based on its initial analysis, management has identified the presentation differences that would have an impact on the unaudited pro forma condensed combined financial information and recorded the necessary adjustments.
3. Adjustments to Unaudited Pro Forma Condensed Combined Financial Information
The unaudited pro forma condensed combined financial information has been prepared to illustrate the effect of the Transactions and has been prepared for informational purposes only.
The following unaudited pro forma condensed combined financial information has been prepared in accordance with Article 11 of
Regulation S-X,
which requires the depiction of the accounting for the transaction39
(“Transaction Accounting Adjustments”) and presentation of the reasonably estimable synergies and other transaction effects that have occurred or are reasonably expected to occur (“Management’s Adjustments”). RAAC has elected not to present Management’s Adjustments and will only be presenting Transaction Accounting Adjustments in the following unaudited pro forma condensed combined financial information.
The unaudited pro forma condensed combined provision for income taxes does not necessarily reflect the amounts that would have resulted had the Combined Company filed consolidated income tax returns during the periods presented.
The unaudited pro forma basic and diluted earnings per share amounts presented in the unaudited pro forma condensed combined statements of operations are based upon the number of RAAC’s shares outstanding, assuming the Transactions occurred on January 1, 2020.
Adjustments to Unaudited Pro Forma Condensed Combined Balance Sheet
The adjustments included in the unaudited pro forma condensed combined balance sheet as of June 30, 2021 are as follows:
| (A) | Reflects the release of cash held in trust account less payment of deferred underwriting fees and RAAC transaction expenses. |
The table below represents the sources and uses of funds as it relates to the Business Combination:
(in thousands) | Note | |||||||
RAAC cash held in trust account | (1 | ) | $ | 287,539 | ||||
PIPE - RAAC Investors | (2 | ) | 64,000 | |||||
PIPE - New Investors | (2 | ) | 101,000 | |||||
Payment to redeeming RAAC Stockholders | (3 | ) | (232,551 | ) | ||||
Payment of RAAC deferred underwriting commissions | (4 | ) | (10,063 | ) | ||||
Payment of RAAC accounting, legal and insurance fees | (5 | ) | (3,732 | ) | ||||
Payment of RAAC financial advisory fees | (6 | ) | (4,574 | ) | ||||
Payment of RAAC insurance premiums | (7 | ) | (790 | ) | ||||
Payment of Berkshire Grey accounting and legal fees | (8 | ) | (2,200 | ) | ||||
Payment of Berkshire Grey financial advisory fees | (9 | ) | (6,077 | ) | ||||
Excess cash to balance sheet from Business Combination | $ | 192,552 | ||||||
| (1) | Represents the amount of the restricted investments and cash held in the trust account upon consummation of the Business Combination. |
| (2) | Represents the aggregate gross proceeds of the PIPE Investment. |
| (3) | Represents the payment to RAAC stockholders who are exercised redemption rights. |
| (4) | Represents the payment of deferred RAAC IPO underwriting commissions by RAAC upon consummation of the Business Combination. |
| (5) | Represents the aggregate of the estimated payments of accounting, legal, financial advisory and placement agent fees by RAAC upon consummation of the Business Combination. |
| (6) | Represents payment of financial advisory fees by RAAC calculated as $4,500,000 plus approximately $74,000 in reimbursements. |
| (7) | Represents payment of six year “tail” director and officer insurance premiums by RAAC. |
| (8) | Represents payment of legal and accounting fees by Berkshire Grey. |
| (9) | Represents payment of financial advisory fees by Berkshire Grey calculated as $5,000,000 plus and creditable against 2.75% of the sum of the cash held in the Trust Account net of redemptions and the PIPE Investment Amount. |
40
| (B) | Reflects the release of cash held in trust account upon consummation of the Business Combination at closing (See Note 3(A)(1)). |
| (C) | Reflects the payment of deferred RAAC IPO underwriting commissions by RAAC in the amount of approximately $10.1 million (see Note 3(A)(4)). The unaudited pro forma condensed combined balance sheet reflects payment of these costs as a reduction of cash, with a corresponding decrease in deferred underwriting commission liability. |
| (D) | Post-Business Combination Class C common stock and warrant liabilities are classified as equity and liabilities, respectively. The following table represents the impact of the Business Combination and PIPE Investment on the number of shares of RAAC Class A common stock and represents the equity section: |
Common Stock | ||||||||||||||||||||||||||||||||||||||||
Number of Shares | Par Value | |||||||||||||||||||||||||||||||||||||||
(in thousands) | Class A Stock | Class B Stock | Class C Stock | Class A Stock | Class B Stock | Class C Stock | Berkshire Grey Stock | Additional paid-in capital | Accumulated deficit | Accumulated Other Comprehensive Income | ||||||||||||||||||||||||||||||
Pre-Business Combination - RAAC stockholders | — | 3,833 | 5,750 | $ | — | $ | — | $ | 1 | $ | — | $ | 24 | $ | (42,716 | ) | $ | — | ||||||||||||||||||||||
Pre-Business Combination - Berkshire Grey | — | — | — | 3 | — | — | 223,442 | 29,237 | (228,141 | ) | (5 | ) | ||||||||||||||||||||||||||||
Conversion of Class B common stock to Class A common stock | 3,833 | (3,833 | ) | — | — | — | — | — | — | — | — | |||||||||||||||||||||||||||||
Reclassification of redeemable stock to Class A common stock | 28,750 | — | — | 3 | — | — | — | 287,497 | — | — | ||||||||||||||||||||||||||||||
Less: Redemption of redeemable shares | (23,252 | ) | — | — | (2 | ) | — | — | — | (232,549 | ) | — | — | |||||||||||||||||||||||||||
Reclassification of Berkshire Grey liability classified Stock awards to Equity | — | — | — | — | — | — | — | 3,158 | — | — | ||||||||||||||||||||||||||||||
Berkshire Grey Stockholders | 196,766 | — | — | 20 | — | — | — | (20 | ) | — | — | |||||||||||||||||||||||||||||
PIPE - RAAC Shareholders | 6,400 | — | — | 1 | — | — | — | 64,000 | — | — | ||||||||||||||||||||||||||||||
PIPE - New Investors | 10,100 | — | — | 1 | — | — | — | 101,000 | — | — | ||||||||||||||||||||||||||||||
Balances after share transactions of Combined Entity | 222,597 | — | 5,750 | 26 | — | 1 | 223,442 | $ | 252,347 | (270,857 | ) | (5 | ) | |||||||||||||||||||||||||||
Estimated transaction costs | — | — | — | — | — | — | — | (17,373 | ) | — | — | |||||||||||||||||||||||||||||
Elimination of historical accumulated deficit of RAAC | — | — | — | — | — | — | — | (42,716 | ) | 42,716 | — | |||||||||||||||||||||||||||||
Elimination of historical par amounts for Class A, Class B | — | — | — | — | — | — | — | — | — | — | ||||||||||||||||||||||||||||||
Elimination of historical stock of Berkshire Grey | — | — | — | (3 | ) | — | — | (223,442 | ) | 223,445 | — | — | ||||||||||||||||||||||||||||
Post-Business Combination | 222,597 | — | 5,750 | $ | 23 | $ | — | $ | 1 | $ | — | $ | 415,703 | $ | (228,141 | ) | $ | (5 | ) | |||||||||||||||||||||
| (E) | Reflects payment of Berkshire Grey related transaction expenses, including a reduction of deferred transaction costs and accrued liabilities. |
| (F) | Share-based compensation liability reflects restricted stock awards issued to an executive officer, who purchased the awards using the proceeds received from the partial recourse secured promissory note issued by the Company. In conjunction with the Transactions, the promissory note was settled through the repurchase of 174,243 shares of vested common stock. The pro forma adjustments recorded reduces the share-based liability to account for the repurchase of shares described above. |
41
| (G) | Reflects conversion of preferred stock, payment of transaction expenses (see note 3(E) and settlement of promissory note (see note 3(F)). |
Adjustments to Unaudited Pro Forma Condensed Combined Statements of Operations
The pro forma adjustments included in the unaudited pro forma condensed combined statements of operations for the six months ended June 30, 2021 and year ended December 31, 2020 are as follows:
| (H) | In conjunction with the Transactions, a partial recourse promissory note issued to an executive officer, the proceeds of which were used to purchase restricted stock awards, was settled through the repurchase of 174,243 shares of vested common stock. This adjustment reflects a corresponding reduction in stock-based compensation expense as a result of fewer outstanding shares associated with the stock award of approximately $3.3 million and $0.4 million for the six months ended June 30, 2021 and year ended December 31, 2020, respectively. The adjustment assumes the promissory note is settled via repurchase of at the time pro forma adjustment occurred. |
| (I) | Reflects the reclassification of transaction costs, compensation expense and formation and operational costs incurred by RAAC of approximately $3.3 million and $1.0 million for the six months ended June 30, 2021 and year ended December 31, 2020, respectively, to General and Administrative expenses on the condensed combined statements of operations. |
| (J) | Reflects the elimination of interest income earned on marketable securities held in the RAAC trust account. |
| (K) | Reflects the elimination of unrealized loss on marketable securities held in the RAAC trust account. |
4. Loss Per Share
Net loss per share calculated using the historical weighted average shares outstanding, and the issuance of additional shares in connection with the Transactions, assuming the shares were outstanding since January 1, 2020. As the Transactions are being reflected as if they had occurred at the beginning of the periods presented, the calculation of weighted average shares outstanding for basic and diluted net loss per share assumes that the shares issuable relating to the Transactions have been outstanding for the entire periods presented. This calculation is retroactively adjusted to eliminate redeemed shares for the entire periods.
The unaudited pro forma condensed combined financial information has been prepared for the six months ended June 30, 2021 and year ended December 31, 2020:
(in thousands, except per share amounts) | Six Months Ended June 30, 2021 | Year Ended December 31, 2020 | ||||||
Pro forma net loss | $ | (84,506 | ) | $ | (58,951 | ) | ||
Pro forma weighted average shares outstanding-basic and diluted | 228,347 | 226,526 | ||||||
Pro forma net loss per share-basic and diluted | $ | (0.37 | ) | $ | (0.26 | ) | ||
Pro forma weighted average shares outstanding-basic and diluted | ||||||||
RAAC public stockholders | 5,498 | 5,498 | ||||||
RAAC Sponsor | 9,583 | 9,583 | ||||||
Total RAAC | 15,081 | 15,081 | ||||||
Berkshire Grey(a) | 196,766 | 194,945 | ||||||
PIPE Shares | 16,500 | 16,500 | ||||||
Pro forma weighted average shares outstanding-basic and diluted (b) | 228,347 | 226,526 | ||||||
42
| (a) | Excludes approximately 28.2 million and 33.6 million Berkshire consideration shares for the six months ended June 30, 2021 and for year ended December 31 2020, respectively, that will be issued upon the occurrence of future events (i.e., exercise of stock options). Total consideration to be issued to Berkshire Grey is $2.25 billion or 225 million shares ($10 per share price). The total shares to be issued includes all issued and outstanding Berkshire Grey common and preferred stock plus shares underlying unvested stock options. Accordingly, the weighted average pro forma shares outstanding at close has been adjusted to exclude the portion of consideration shares that will be unvested, unissued, and/or unexercised at the closing of the Business Combination. |
| (b) | For the purposes of applying the if converted method for calculating diluted earnings per share, it was assumed that all Berkshire Grey stock options are exchanged for Class A common stock. However, since this results in anti-dilution, the effect of such exchange was not included in calculation of diluted loss per share. Shares underlying these instruments include approximately 30.9 million Berkshire consideration shares for unvested, unissued, and/or unexercised stock options. |
43
MANAGEMENT’S DISCUSSION AND ANALYSIS OF FINANCIAL CONDITION AND RESULTS OF OPERATIONS
The following discussion and analysis provide information which we believe is relevant to an assessment and understanding of our unaudited consolidated results of operations and financial condition. You should read the following discussion and analysis of our financial condition and results of operations together with our unaudited consolidated financial statements and notes thereto included elsewhere in this prospectus. This discussion and analysis should also be read together with our pro forma financial information as of and for the six months ended June 30, 2021 included elsewhere in this prospectus. In addition to historical financial information, this discussion contains forward-looking statements based upon our current expectations that involve risks and uncertainties. Our actual results could differ materially from those anticipated in these forward-looking statements as a result of various factors, including those set forth under “Risk Factors.” Unless otherwise indicated or the context otherwise requires, references in this report to “Berkshire Grey,” “we,” “us,” “our,” ”the Company” and other similar terms refer to Berkshire Grey, Inc. and its consolidated subsidiaries.
Business Overview
We are an Intelligent Enterprise Robotics (“IER”) company pioneering and delivering transformative
AI-enabled
robotic solutions that automate filling ecommerce orders for consumers or businesses, filling orders to resupply retail stores and groceries, and handling packages shipped to fill those orders. Our solutions transform supply chain operations and enable our customers to meet and exceed the demands of today’s connected consumers and businesses.Our IER capabilities are grounded in patented and proprietary technologies for(each picking or unit handling),(movement and storage of orders and goods), andwhich enables various intelligent subsystems to work together so that the right work is being done at the right time to meet our customer’s needs. We are a technology leader in robotics and AI automation with an intellectual property position buttressed by trade secrets supporting our technologies and over 300 patent filings with 71 U.S. and international patents issued to date in technologies including robotic picking, mobility, gripping, sensing and perception, general robot control, and differentiated supporting mechanisms. Our proprietary technologies enable us to offer holistic solutions that automate supply chain operations. Our solutions include moving goods to robots that then pick and pack ecommerce or retail orders, robotically moving and organizing inventory and orders within a warehouse or logistics facility, and robotically sorting packages and shipments.
robotic picking
robotic movement and mobility
system orchestration
We are not a component technology company nor are we a conventional systems integrator. Instead, we create products from the technologies we pioneer and develop, and then incorporate the products (product modules) into solutions — solutions that incorporate said modules and are designed by us to meet customer performance metrics like throughput and accuracy rates. This technology plus performant, whole-enterprise solution view, enables customers to focus on the core of their business and creates attractive returns for them. Following the whole-enterprise solution view, we not only make, install, test, and commission the solutions, but we also offer customers continued support in the form of software updates as well as professional services including maintenance, system operation, and cloud-based monitoring and analytics. Because of our modular approach to solutions and the role of our software, we offer customers the ability to incrementally add to or change solutions, and we can incorporate outside technologies with our product modules if desired. The same modular attributes mean we can offer small and large solutions and can design for brownfield and greenfield installations. We offer customers a range of purchase options including a(“RaaS”) program that minimizes the
robotics-as-a-service
up-front
capital required when compared to conventional equipment purchase models.To date, most of our deployments have been with large, Fortune 50 companies, where our technology and solutions in production have achieved targeted metrics including throughput, accuracy, equipment effectiveness, and others. Our customers include
Wal-Mart
Stores, Inc.(“Wal-Mart”),
Target Corporation (“Target”), FedEx Corporation (“FedEx”), Meijer Distribution, Inc. (“Meijer”) and SoftBank Robotics Corp. (“Softbank”).44
For the three months ended June 30, 2021 Meijer, SoftBank, and
Wal-Mart
comprised approximately 36%, 36%, and 15% of our revenue, respectively. For the three months ended June 30, 2020 SoftBank comprised 97% of our revenue.For the six months ended June 30, 2021 SoftBank, FedEx, and Meijer comprised approximately 38%, 30%, and 19% of our revenue respectively. For the six months ended June 30, 2020 Target and SoftBank comprised approximately 78% and 22% of our revenue, respectively.
Recent Developments
Merger Agreement
Subsequent to June 30, 2021, on July 21, 2021, the Company consummated the transactions contemplated by the Agreement and Plan of Merger (the “Merger Agreement”), dated February 23, 2021, by and among the Company, Revolution Acceleration Acquisition Corp. (“RAAC”), and Pickup Merger Corp, a Delaware corporation and a direct, wholly owned subsidiary of RAAC (“Merger Sub”). Pursuant to the Merger Agreement, RAAC amended and restated its second amended and restated certificate of incorporation and its bylaws such that RAAC changed its name to “Berkshire Grey, Inc.”. Refer to Note 1 “Merger Agreement” and Note 14 “Subsequent Events” of Notes to Consolidated Financial Statements for further details.
COVID-19
In March 2020, the World Health Organization declared the outbreak of
COVID-19
a pandemic. It is not possible to accurately predict the full impact of theCOVID-19
pandemic on our business, financial condition and results of operations due to the evolving nature of theCOVID-19
pandemic and the extent of its impact across industries and geographies and numerous other uncertainties. For example, we face uncertainties about the duration and spread of the outbreak, additional actions that may be taken by governmental entities, and the impact it may have on the ability of us, our customers, our suppliers, our manufacturers, and our other business partners to conduct business. Governments in affected regions have implemented, and may continue to implement, safety precautions which include quarantines, travel restrictions, business closures, cancellations of public gatherings, and other measures as they deem necessary. Many organizations and individuals, including our company and employees, are taking additional steps to avoid or reduce infections, including limiting travel and working from home. These measures are disrupting normal business operations and have had significant negative impacts on businesses and financial markets worldwide. We continue to monitor our operations and government recommendations and have made modifications to our normal operations because of theCOVID-19
pandemic, including requiring mostnon-engineering
or operations-related team members to work remotely, utilizing heightened cleaning and sanitization procedures, implementing new health and safety protocols and reducingnon-essential
travel.To date, travel restrictions and capacity limits at customer locations imposed in response to the
COVID-19
pandemic have caused delays in the deployment of two customer contracts; however, the pandemic has not significantly impacted our financial condition and operations. We cannot predict the future extent or duration of the impact that theCOVID-19
pandemic will have on our financial condition and operations. The impact of theCOVID-19
pandemic on our financial performance will depend on future developments, including the duration and spread of the outbreak and related governmental advisories and restrictions. These developments and the impact of theCOVID-19
pandemic on the financial markets and the overall economy are highly uncertain and cannot be predicted. If the financial markets and/or the overall economy are impacted for an extended period, our results may be materially adversely affected.Critical Accounting Policies and Significant Estimates
The preparation of financial statements in conformity with generally accepted accounting principles in the United States requires management to make estimates and assumptions that affect the reported amounts of assets
45
and liabilities, revenues and expenses. These estimates and judgments include, but are not limited to, revenue recognition including performance obligations, variable consideration and other obligations such as product returns and incentives; allowance for credit losses; warranty costs; evaluating loss contingencies; accounting for stock-based compensation including performance-based assessments; and accounting for income taxes and related valuation allowances. We base these estimates and judgments on historical experience, market participant fair value considerations, projected future cash flows and various other factors that we believe are reasonable under the circumstances. Actual results may differ from our estimates. Additional information about these critical accounting policies may be found in the “Management’s Discussion and Analysis of Financial Condition and Results of Operations” section included in our Registration Statement filed by RAAC on Form
S-4
for the fiscal years ended December 31, 2020 and 2019. There have been no significant changes to our critical accounting policies or in the underlying accounting assumptions and estimates used in such policies from those disclosed on FormS-4.
Summary of Recent Financial Performance
Revenue was approximately $4.5 million for the three months ended June 30, 2021 compared to approximately $2.8 million for the three months ended June 30, 2020. The change is primarily due to an increase in customer deployment activity.
Revenue was approximately $8.5 million for the six months ended June 30, 2021 compared to approximately $29.0 million for the six months ended June 30, 2020. The change is primarily due to the completion, and recognition of revenue at a point in time, of a $22.3 million customer contract in the first quarter of 2020.
Gross loss was $0.7 million for the three months ended June 30, 2021 compared to a profit of $0.1 million for the three months ended June 30, 2020. The gross loss for the three months ended June 30, 2021 was due primarily to increased overhead resulting from the growth in deployment operations.
Gross loss was $1.5 million for the six months ended June 30, 2021 compared to a profit of $1.6 million for the three and six months ended June 30, 2020. The gross loss for the six months ended June 30, 2021 was due primarily to lower absorption of overhead costs as a result of overall lower revenues.
Combined general and administrative, selling and marketing, and research and development expenses for the three months ended June 30, 2021 increased to $31.0 million, compared to $13.7 million for the three months ended June 30, 2020. The net increase in total operating expenses of $17.3 million included a $5.0 million increase in stock-based compensation further described below, $6.0 million increase in salaries and related employee costs related to personnel growth, and $5.1 million increase in materials and services.
Combined general and administrative, selling and marketing, and research and development expenses for the six months ended June 30, 2021 increased to $74.9 million, compared to $27.3 million for the six months ended June 30, 2020. The net increase in total operating expenses of $47.6 million included a $28.2 million increase in stock-based compensation further described below, $10.1 million increase in salaries and related employee costs related to personnel growth, and $7.4 million increase in materials and services.
The increase in stock-based compensation from three and six months ended June 30, 2020 to the three and six months ended June 30, 2021 is primarily due to the revaluation of restricted stock awards that are treated as a liability as discussed in Notes 7 and 9 of Berkshire Grey’s Consolidated Financial Statements. For other stock-based awards, stock-based compensation included in operating expenses increased by $0.9 million and $1.6 million for the three and six months ended June 30, 2021 as compared to the three and six months ended June 30, 2020.
Net losses were $31.8 million for the three months ended June 30, 2021 compared to $9.7 million for the three months ended June 30, 2020. The increase in net losses was primarily due to the increase in stock-based compensation expense and increases in operating expenses.
46
Net losses were $76.4 million for the six months ended June 30, 2021 compared to $21.4 million for the six months ended June 30, 2020. The increase in net losses was primarily due to the completion, and recognition of revenue, of a $22.3 million customer contract in the first quarter of 2020, the increase in stock-based compensation expense, and increases in operating expenses. six months ended June 30, 2021
Results of Operations
The following is a description of significant components of our operations, including significant trends and uncertainties that we believe are important to an understanding of our business and results of operations.
Comparison of the three and six months ended June 30, 2021 and 2020
Revenue
Berkshire Grey generates revenue through the sale, delivery, installation of customer contracts in the United States and Japan. The following table presents revenue as well as the change from the prior period.
For the Three Months Ended June 30, | For the Six Months Ended June 30, | |||||||||||||||||||||||||||||||
(Dollars in thousands) | 2021 | 2020 | Change | 2021 | 2020 | Change | ||||||||||||||||||||||||||
Revenue | $ | 4,503 | $ | 2,752 | $ | 1,751 | 64 | % | $ | 8,468 | $ | 29,028 | $ | (20,560 | ) | (71 | )% | |||||||||||||||
Total revenue for the three months ended June 30, 2021 and 2020 was $4.5 million and $2.8 million, respectively, an increase of $1.7 million or 64%. The increase is related to additional customer deployment activities.
Total revenue for the six months ended June 30, 2021 and 2020 was $8.5 million and $29.0 million, respectively, a decrease of $20.5 million or 71%. The decrease is primarily due to the completion of a $22.3 million customer contract for which revenue was recognized at a point in time in the first quarter of 2020, whereas revenue during the first half of 2021 was generated from incremental development and deployment of customer contracts in which revenue is recognized on a percentage of completion basis, and the sale, delivery, installation and/or completion of contracts with existing customers. Our revenue can fluctuate significantly from quarter to quarter depending on the number of projects in process and the method of accounting used to recognize revenues.
In three months ended June 30, 2021, SoftBank and Meijer each comprised approximately 36% of our revenue, or 72% in total between the two customers .In three months ended June 30, 2020 SoftBank comprised approximately 89% of our revenue. Since 2019, our revenue has been dependent upon a few customers and we expect that we will continue to derive a majority of our revenue from a limited number of significant customers in future years. No assurance can be given that our significant customers will expand their business relationship with us, will continue to do business with us, or that they will maintain their historical levels of business. If our relationship with any significant customer were to cease, then our revenues would decline and negatively impact our results of operations.
Cost of Revenue
The following table presents cost of revenue as well as the change from the prior period.
For the Three Months Ended June 30, | For the Six Months Ended June 30, | |||||||||||||||||||||||||||||||
(Dollars in thousands) | 2021 | 2020 | Change | 2021 | 2020 | Change | ||||||||||||||||||||||||||
Cost of Revenue | $ | 5,240 | $ | 2,658 | $ | 2,582 | 97 | % | $ | 9,938 | $ | 27,392 | $ | (17,454 | ) | (64 | )% | |||||||||||||||
47
Total cost of revenue for the three months ended June 30, 2021 and 2020 was $5.2 million and $2.7 million, respectively, an increase of $2.6 million or 97%. The increase in total cost of revenue was primarily due to increased revenue volume and increased overhead resulting from the growth in deployment operations.
Total cost of revenue for the six months ended June 30, 2021 and 2020 was $9.9 million and $27.4 million, respectively, a decrease of $17.5 million or 64%. The decrease in total cost of revenue was primarily due to costs related to the completion of a $22.3 million customer contract for which revenue and cost of revenue was recognized at a point in time in the first quarter of 2020.
Gross (Loss) Profit and Gross Margin
The following table presents gross profit and margin as well as the change from the prior period.
For the Three Months Ended June 30, | For the Six Months Ended June 30, | |||||||||||||||||||||||||||||||
(Dollars in thousands) | 2021 | 2020 | Change | 2021 | 2020 | Change | ||||||||||||||||||||||||||
Gross (Loss) Profit | $ | (737 | ) | $ | 94 | $ | (831 | ) | (884 | )% | $ | (1,470 | ) | $ | 1,636 | $ | (3,106 | ) | (190 | )% | ||||||||||||
Gross Margin | (16 | )% | 3 | % | (20 | )% | (17 | )% | 6 | % | (23 | )% | ||||||||||||||||||||
Total gross (loss) profit during the three months ended June 30, 2021 and 2020 was a loss of $0.7 million and a profit of $0.1 million, respectively. Total gross margin was approximately (16)% for three months ended June 30, 2021 compared with 3% for three months ended June 30, 2020, a decrease of 19% points. The change in gross profit of $(0.8) million and the decrease in gross margin percentage was driven by increased overhead resulting from the growth in deployment operations.
Total gross (loss) profit during the six months ended June 30, 2021 and 2020 was a loss of $1.5 million and a profit of $1.6 million, respectively. Total gross margin was approximately (17)% for three months ended June 30, 2021 compared with 6% for three months ended June 30, 2020, a decrease of 23% points. The change in gross profit of $3.1 million and the decrease in gross margin percentage was driven by lower revenue and overhead absorption in the six months ended June 30, 2021.
General and Administrative
The following table presents general and administrative expenses as well as the change from the prior period.
For the Three Months Ended June 30, | For the Six Months Ended June 30, | |||||||||||||||||||||||||||||||
(Dollars in thousands) | 2021 | 2020 | Change | 2021 | 2020 | Change | ||||||||||||||||||||||||||
General and Administrative | $ | 4,710 | $ | 2,877 | $ | 1,833 | 64 | % | $ | 8,853 | $ | 6,722 | $ | 2,131 | 32 | % | ||||||||||||||||
% of Operating Expenses | 15 | % | 21 | % | 12 | % | 25 | % | ||||||||||||||||||||||||
General and administrative expenses during the three months ended June 30, 2021 and 2020 were $4.7 million and $2.9 million, respectively, an increase of $1.8 million or 64%. The increase in general and administrative expenses included a $0.4 million increase in salaries and related employee costs and a $0.8 million increase in information technology and infrastructure related costs.
General and administrative expenses during the six months ended June 30, 2021 and 2020 were $8.8 million and $6.7 million, respectively, an increase of $2.1 million or 32%. The increase in general and administrative expenses included a $0.5 million increase in salaries and related employee costs and a $1.2 million increase in information technology and infrastructure related costs.
48
Sales and Marketing
The following table presents sales and marketing expenses as well as the change from the prior period.
For the Three Months Ended June 30, | For the Six Months Ended June 30, | |||||||||||||||||||||||||||||||
(Dollars in thousands) | 2021 | 2020 | Change | 2021 | 2020 | Change | ||||||||||||||||||||||||||
Sales and Marketing | $ | 10,540 | $ | 1,667 | $ | 8,873 | 532 | % | $ | 38,023 | $ | 3,338 | $ | 34,685 | 1039 | % | ||||||||||||||||
% of Operating Expenses | 34 | % | 12 | % | 51 | % | 12 | % | ||||||||||||||||||||||||
Sales and marketing expenses during the three months ended June 30, 2021 and 2020 were $10.5 million and $1.7 million, respectively, an increase of approximately $8.8 million or 531%. The increase in sales and marketing expenses included a $4.5 million increase in stock-based compensation, $3.2 million increase in salaries and related employee costs related primarily to sales team personnel growth and expansion into Europe, and $1.0 million increase in marketing services and materials to expand our customer reach, branding programs, and implementing systems to support planned future growth. Approximately $4.2 million of the increase in stock-based compensation is due to the revaluation of restricted stock awards that are treated as a liability as previously described.
Sales and marketing expenses during the six months ended June 30, 2021 and 2020 were $38.0 million and $3.3 million, respectively, an increase of approximately $34.7 million or 1038%. The increase in sales and marketing expenses included a $27.7 million increase in stock-based compensation, $5.5 million increase in salaries and related employee costs related primarily to sales team personnel growth and expansion into Europe, and $1.3 million increase in marketing services and materials to expand our customer reach, branding programs, and implementing systems to support planned future growth. Approximately $22.7 million of the increase in stock-based compensation is due to the revaluation of restricted stock awards that are treated as a liability as previously described.
Research and Development
The following table presents research and development expenses as well as the change from the prior period.
For the Three Months Ended June 30, | For the Six Months Ended June 30, | |||||||||||||||||||||||||||||||
(Dollars in thousands) | 2021 | 2020 | Change | 2021 | 2020 | Change | ||||||||||||||||||||||||||
Research and Development | $ | 15,741 | $ | 9,163 | $ | 6,578 | 72 | % | $ | 28,051 | $ | 17,200 | $ | 10,851 | 63 | % | ||||||||||||||||
% of Operating Expenses | 51 | % | 67 | % | 37 | % | 63 | % | ||||||||||||||||||||||||
Research and development expenses during the three months ended June 30, 2021 and 2020 were $15.7 million and $9.2 million, respectively, an increase of $6.5 million or 72%. The increase in research and development expenses included a $2.4 million increase in salaries and related employee costs related to personnel growth and expanded development programs and $3.4 million increase in research and development materials and services.
Research and development expenses during the three months ended June 30, 2021 and 2020 were $28.1 million and $17.2 million, respectively, an increase of $10.9 million or 63%. The increase in research and development expenses included a $4.2 million increase in salaries and related employee costs related to personnel growth and expanded development programs and $5.3 million increase in research and development materials and services.
49
Interest Income
The following table presents interest income as well as the change from the prior period.
For the Three Months Ended June 30, | For the Six Months Ended June 30, | |||||||||||||||||||||||||||||||
(Dollars in thousands) | 2021 | 2020 | Change | 2021 | 2020 | Change | ||||||||||||||||||||||||||
Interest Income, Net | $ | 3 | $ | 8 | $ | (5 | ) | -63 | % | $ | 14 | $ | 273 | $ | (259 | ) | -95 | % | ||||||||||||||
Interest income, net during the three months ended June 30, 2021 and 2020 was less than $0.1 million for both periods. Interest income, net during the six months ended June 30, 2021 and 2020 was less than $0.1 million and $0.3 million, respectively, a decrease of approximately $0.3 million or 95%. The decrease in interest income is attributed to a decline in cash balances and interest rates on money market funds
Income Taxes
During the three months ended June 30, 2021 and 2020, Berkshire Grey recorded no income tax benefits due to the uncertainty of future taxable income as Berkshire Grey has incurred net losses since inception.
We have provided a valuation allowance for all our net deferred tax assets as a result of our historical net losses in the jurisdictions in which we operate. We continue to assess our future taxable income by jurisdiction based on our recent historical operating results, the expected timing of reversal of temporary differences, various tax planning strategies that we may be able to enact in future periods, the impact of potential operating changes on our business and our forecast results from operations in future periods based on available information at the end of each reporting period. To the extent that we are able to reach the conclusion that deferred tax assets are realizable based on any combination of the above factors in a single, or multiple, taxing jurisdictions, a reversal of the related portion of our existing valuation allowances may occur.
Comparison of the Years Ended December 31, 2020 and 2019
Revenue
In 2020 and 2019, Berkshire Grey generated revenue through the sale, delivery, installation of customer contracts in the United States and Japan. The following table presents revenue as well as the change from the prior period.
For the Years Ended December 31, | Change in Revenue | |||||||||||||||
(Dollars in thousands) | 2020 | 2019 | $ | % | ||||||||||||
Revenue | $ | 34,835 | $ | 7,972 | $ | 26,863 | 337 | % | ||||||||
Total revenue for the years ended December 31, 2020 and 2019 was $34.8 million and $8.0 million, respectively, an increase of $26.9 million or 337%. The increase is primarily due to the completion and recognition of revenue of a $22.3 million customer contract, with the remainder of the increase related to incremental development and deployment of a customer contract in which revenue is recognized on a percentage of completion basis, and the sale, delivery, installation and/or completion of contracts with existing customers. In 2020, Target Corporation and SoftBank Robotics Corp. comprised approximately 70% and 30% of our revenue, respectively, and in 2019, SoftBank Robotics Corp. and Walmart, Inc. comprised approximately 60% and 30% of our revenue, respectively. Since 2019, our revenue has been dependent upon these few customers and we expect that we will continue to derive a majority of our revenue from a limited number of significant customers in future years. No assurance can be given that our significant customers will expand their business relationship with us, will continue to do business with us, or that they will maintain their historical levels of business. If our relationship with any significant customer were to cease, then our revenues would decline and negatively impact our results of operations.
50
Cost of Revenue
The following table presents cost of revenue as well as the change from the prior period.
For the Years Ended December 31, | Change in Cost of Revenue | |||||||||||||||
(Dollars in thousands) | 2020 | 2019 | $ | % | ||||||||||||
Cost of Revenue | $ | 32,009 | $ | 9,974 | $ | 22,035 | 221 | % | ||||||||
Total cost of revenue during the years ended December 31, 2020 and 2019 was $32.0 million and $10.0 million, respectively, an increase of $22.0 million or 221%. The increase in total cost of revenue was driven primarily by costs related to the completion of a $22.3 million customer contract.
Gross Profit and Gross Margin
The following table presents gross profit as well as the change from the prior period.
For the Years Ended December 31, | Change in Gross Profit | |||||||||||||||
(Dollars in thousands) | 2020 | 2019 | $ | % | ||||||||||||
Gross Profit | $ | 2,826 | $ | (2,002 | ) | $ | 4,828 | (241 | )% | |||||||
Total gross profit during the years ended December 31, 2020 and 2019 was $2.8 million and a loss of $2.0 million, respectively. The increase in gross profit of $4.8 million resulted from completing more product and service contracts compared to the prior year, and beginning to achieve economies of scale with fixed overhead costs.
The following table presents gross margin as well as the change from the prior period.
For the Years Ended December 31, | Change in Gross Margin | |||||||||||
2020 | 2019 | |||||||||||
Gross Margin | 8 | % | (25 | )% | 33 | % | ||||||
Total gross margin was approximately 8% for 2020 compared with total gross margin of (25)% for 2019, an increase of 33% points. The increase in 2020 gross margin percentage was driven by higher revenues and achieving economies of scale with fixed overhead costs, including certain fixed personnel related costs directly associated with manufacturing. We expect that gross margins will continue to improve as we grow our revenue. However, gross margins may fluctuate significantly based on actual volumes realized in any given reporting period. By scaling our revenues, we expect to be able to lower our solution costs through increased volumes with our contract manufacturers. Additionally, scaling our revenues allows us to leverage other overhead costs, contributing towards improving overall gross margins.
General and Administrative
The following table presents general and administrative expenses as well as the change from the prior period.
For the Years Ended December 31, | Change in Expenses | |||||||||||||||
(Dollars in thousands) | 2020 | 2019 | $ | % | ||||||||||||
General and Administrative | $ | 15,935 | $ | 15,152 | $ | 783 | 5 | % | ||||||||
% of Operating Expenses | 25 | % | 31 | % | ||||||||||||
51
General and administrative expenses during the years ended December 31, 2020 and 2019 were $15.9 million and $15.1 million, respectively, an increase of $0.8 million or 5%. The increase in general and administrative expenses included a $1.8 million increase in salaries and related employee costs, $1.3 million increase in business services (e.g., legal, recruiting, insurance, consulting), partially offset by a $2.3 million decrease in stock-based compensation. In 2019, we recorded $5.0 million in stock-based compensation expense associated with a tender offer of shares of our common stock which is more fully described in Notes 8 and 9 to our Consolidated Financial Statements and a similar expense was not incurred in 2020.
Sales and Marketing
The following table presents sales and marketing expenses as well as the change from the prior period.
For the Years Ended December 31, | Change in Expenses | |||||||||||||||
(Dollars in thousands) | 2020 | 2019 | $ | % | ||||||||||||
Sales and Marketing | $ | 12,910 | $ | 5,272 | $ | 7,638 | 145 | % | ||||||||
% of Operating Expenses | 20 | % | 11 | % | ||||||||||||
Sales and marketing expenses during the years ended December 31, 2020 and 2019 were $12.9 million and $5.3 million, respectively, an increase of $7.6 million or 145%. The increase in sales and marketing expenses included a $5.9 million increase in salaries and related employee costs related primarily to sales team personnel growth and expansion into Europe, $1.0 million increase in marketing services and materials to expand our customer reach, branding programs, and implementing systems to support planned future growth, and $0.7 million increase in stock-based compensation. In 2019, we recorded $0.8 million in stock-based compensation expense associated with a tender offer of shares of our common stock which is more fully described in Notes 8 and 9 to our Consolidated Financial Statements and a similar expense was not incurred in 2020.
Research and Development
The following table presents research and development expenses as well as the change from the prior period.
For the Years Ended December 31, | Change in Expenses | |||||||||||||||
(Dollars in thousands) | 2020 | 2019 | $ | % | ||||||||||||
Research and Development | $ | 35,806 | $ | 27,805 | $ | 8,001 | 29 | % | ||||||||
% of Operating Expenses | 55 | % | 58 | % | ||||||||||||
Research and development expenses during the years ended December 31, 2020 and 2019 were $35.8 million and $27.8 million, respectively, an increase of $8.0 million or 29%. The increase in research and development expenses included an $9.6 million increase in salaries and related employee costs related to personnel growth and expanded development programs, $1.4 million increase in costs associated with equipment related to engineering projects, $1.1 million increase in research and development materials and services, offset by a $4.1 million decrease in stock-based compensation. In 2019, we recorded $4.5 million in stock-based compensation expense associated with a tender offer of shares of our common stock which is more fully described in the Notes to our Consolidated Financial Statements.
52
Interest Income
The following table presents interest income as well as the change from the prior period.
For the Years Ended December 31, | Change in Interest Income | |||||||||||||||
(Dollars in thousands) | 2020 | 2019 | $ | % | ||||||||||||
Interest Income | $ | 280 | $ | 579 | $ | (299 | ) | (52 | )% | |||||||
Interest income during the years ended December 31, 2020 and 2019 was $0.3 million and $0.6 million, respectively, a decrease of $0.3 million or 52%. The decrease in interest income is attributed to a decline in cash balances and interest rates on money market funds.
Other Income
The following table presents other income as well as the change from the prior period.
For the Years Ended December 31, | Change in Other Income | |||||||||||||||
(Dollars in thousands) | 2020 | 2019 | $ | % | ||||||||||||
Other Income | $ | 3,907 | $ | 142 | $ | 3,765 | 2,651 | % | ||||||||
Other income during the years ended December 31, 2020 and 2019 was $3.9 million and $0.1 million, respectively, an increase of $3.8 million or 2,651%. The increase in other income is related to the revaluation of warrants issued to purchase shares of Berkshire Grey Series
B-3 Preferred
Stock which we determined, upon evaluation of achievement of certain performance milestones, that the vesting of the warrants was not probable. See Note 8 in our consolidated financial statements for more information regarding the warrants.Income Taxes
During the years ended December 31, 2020 and 2019, Berkshire Grey recorded no income tax benefits due to the uncertainty of future taxable income as Berkshire Grey has incurred net losses since inception.
We have provided a valuation allowance for all our net deferred tax assets as a result of our historical net losses in the jurisdictions in which we operate. We continue to assess our future taxable income by jurisdiction based on our recent historical operating results, the expected timing of reversal of temporary differences, various tax planning strategies that we may be able to enact in future periods, the impact of potential operating changes on our business and our forecast results from operations in future periods based on available information at the end of each reporting period. To the extent that we are able to reach the conclusion that deferred tax assets are realizable based on any combination of the above factors in a single, or multiple, taxing jurisdictions, a reversal of the related portion of our existing valuation allowances may occur.
Non-GAAP
Financial InformationIn addition to our results determined in accordance with GAAP, we believe that EBITDA and Adjusted EBITDA, each
non-GAAP
financial measures, are useful in evaluating our operational performance. We use thisnon-GAAP
financial information to evaluate our ongoing operations and for internal planning and forecasting purposes. We believe that thisnon-GAAP
financial information, when taken collectively, may be helpful to investors in assessing our operating performance.We define “EBITDA” as net loss plus interest income, income tax expense, depreciation and amortization expense.
53
We define “Adjusted EBITDA” as EBITDA adjusted for stock-based compensation.
We believe that the use of EBITDA and Adjusted EBITDA provides an additional tool for investors to use in evaluating ongoing operating results and trends because it eliminates the effect of financing, capital expenditures, and
non-cash
expenses such as stock-based compensation and provides investors with a means to compare our financial measures with those of comparable companies, which may present similarnon-GAAP
financial measures to investors. However, you should be aware that when evaluating EBITDA and Adjusted EBITDA we may incur future expenses similar to those excluded when calculating these measures. In addition, our presentation of these measures should not be construed as an inference that our future results will be unaffected by unusual or non-recurring items. Our computation of these measures may not be comparable to other similarly titled measures computed by other companies because not all companies calculate these measures in the same fashion.Because of these limitations, EBITDA and Adjusted EBITDA should not be considered in isolation or as a substitute for performance measures calculated in accordance with GAAP. We compensate for these limitations by relying primarily on our GAAP results and using EBITDA and Adjusted EBITDA on a supplemental basis. You should review the reconciliation of net loss to EBITDA and Adjusted EBITDA below and not rely on any single financial measure to evaluate our business.
The following table reconciles net loss to EBITDA and Adjusted EBITDA during the years presented.
For the Years Ended December 31, | For the Three Months Ended June 30, | For the Six Months Ended June 30, | ||||||||||||||||||||||
(Dollars in thousands) | 2020 | 2019 | 2021 | 2020 | 2021 | 2020 | ||||||||||||||||||
Net loss | $ | (57,643 | ) | $ | (49,511 | ) | $ | (31,754 | ) | $ | (9,683 | ) | $ | (76,437 | ) | $ | (21,425 | ) | ||||||
Interest income, net | $ | (280 | ) | $ | (579 | ) | $ | (3 | ) | $ | (8 | ) | $ | (14 | ) | $ | (273 | ) | ||||||
Income tax expense | $ | 5 | $ | 1 | $ | 7 | $ | — | $ | 12 | $ | — | ||||||||||||
Depreciation and amortization | $ | 1,006 | $ | 312 | $ | 671 | $ | 800 | $ | 1,217 | $ | 1,000 | ||||||||||||
EBITDA | $ | (56,912 | ) | $ | (49,777 | ) | $ | (31,079 | ) | $ | (8,891 | ) | $ | (75,222 | ) | $ | (20,698 | ) | ||||||
Stock-based compensation | $ | 6,021 | $ | 12,034 | $ | 5,309 | $ | 316 | $ | 29,488 | $ | 1,259 | ||||||||||||
Adjusted EBITDA | $ | (50,891 | ) | $ | (37,743 | ) | $ | (25,770 | ) | $ | (8,575 | ) | $ | (45,734 | ) | $ | (19,439 | ) | ||||||
Liquidity and Capital Resources
Sources of Liquidity and Capital
We have incurred a net loss in each of our annual periods since our inception. We incurred net losses of $31.7 million and $76.4 million during the three and six months ended June 30, 2021, respectively. We incurred net losses of $9.7 million and $21.4 million during the three and six months ended June 30, 2020, respectively. As of June 30, 2021, we have an accumulated deficit of $228.1 million. As an early-stage company, we have primarily obtained cash to fund our operations through preferred stock offerings. From inception through June 30, 2021, we have received cumulative gross proceeds from the sale of our preferred stock and warrants of $227.3 million to fund our operations.
As of the date of this prospectus, we believe that our existing capital resources will be sufficient to support our operating plan and cash commitments for the next 12 months. We completed the Merger with RAAC on July 21, 2021 and received proceeds, net of transaction costs, of $192.6 million. Our future capital requirements will depend on many factors including the growth of the business, continued research and development in our customer solutions, and support for our operations.
54
Cash Flows
The following table summarizes our cash flows during the years presented.
For the Six Months Ended June 30, | ||||||||
(Dollars in thousands) | 2021 | 2020 | ||||||
Net cash used in operating activities | $ | (39,340 | ) | $ | (35,516 | ) | ||
Net cash used in investing activities | $ | (2,139 | ) | $ | (2,114 | ) | ||
Net cash provided by financing activities | $ | 495 | $ | 32 | ||||
Effect of exchange rate on cash | $ | (43 | ) | $ | — | |||
Net decrease in cash, cash equivalents and restricted cash | $ | (41,027 | ) | $ | (37,598 | ) | ||
Cash Flows for the three months ended June 30, 2021 and 2020
Operating Activities
Net cash used in operating activities during the six months ended June 30, 2021 and 2020 was $39.3 million and $35.5 million, respectively. The increase of $3.8 million in cash used for operating activities is the result of approximately $55.0 million increase in net losses offset by $33.3 million in adjustments from
non-cash
operating activities and $17.9 million in changes from net operating assets and liabilities.The increase in net losses of approximately $55.0 million is more fully described in the management’s discussion and analysis of operating results.
Changes in
non-cash
operating activity of $33.3 million include a $28.2 million increase in stock-based compensation, $3.9 million decrease in gain on change in fair value of warrants, and an increase in depreciation of $1.1 million. $22.7 million of the increase in stock-based compensation is primarily due to the revaluation of restricted stock awards that are treated as a liability as previously described.Cash used from changes in net operating assets and liabilities totaling $17.9 million is composed of a $26.6 million increase in cash from changes in contract liabilities, a $17.0 million increase in cash from changes in accounts receivable, $7.3 million increase in cash from changes in accounts payable and accrued expenses, partially offset by a $27.6 million decrease in cash from changes in deferred fulfillment costs, and a $5.4 million decrease in cash in inventories, prepaid expenses and other assets.
Investing Activities
Net cash used in investing activities for the six months ended June 30, 2021 and 2020 was $2.1 million and $2.1 million, respectively, and primarily relates to the purchases of fixed assets.
Financing Activities
Net cash provided by financing activities during the three months ended June 30, 2021 and 2020 was $0.5 million and less than $0.1 million, respectively. The increase in cash provided by financing activities of approximately $0.5 million was due to an increase in the proceeds received from stock option exercises.
55
Cash Flows for the Years ended December 31, 2020 and 2019
Operating Activities
Net cash used in operating activities during the years ended December 31, 2020 and 2019 was $56.0 million and $28.8 million, respectively. The increase of $27.2 million in cash used for operating activities is the result of $8.1 million increase in net losses, $9.1 million in adjustments from non-cash operating activities, and $10.0 million in changes from net operating assets and liabilities.
The increase in net losses of $8.1 million is more fully described in the management’s discussion and analysis of operating results.
Changes in non-cash operating activity of $9.1 million include a $6.0 million reduction in stock-based compensation and a $3.9 million gain on the revaluation of warrants associated with Berkshire Grey Series B-3 Preferred shares, partially offset by an increase in depreciation of $0.7 million.
In 2019, we recorded $10.6 million in stock-based compensation expense associated with a tender offer of shares of our common stock which is more fully described in the Notes to our Consolidated Financial Statements. Other income from warrant revaluation occurred in mid-2020 when we determined, upon evaluation of performance milestones, that the vesting of the warrants was not probable. Increases in depreciation are primarily attributable to an increase in investing activities, specifically related to leasehold improvements and capitalized development systems.
Cash used from changes in net operating assets and liabilities totaling $10.0 million is composed of a $18.3 million decrease in cash from changes in contract liabilities, a $15.9 million decrease in cash from changes in accounts receivable, partially offset by a $20.5 million increase in cash from changes in deferred fulfillment costs and a $2.2 million increase in cash from changes in accounts payable.
Investing Activities
Net cash used in investing activities for the years ended December 31, 2020 and 2019 was $8.7 million and $1.8 million, respectively. The increase of $6.9 million is attributed to an increase in capital expenditures for development systems, leasehold improvements for lab and office space in Bedford, Massachusetts and Sharpsburg, Pennsylvania, and information technology infrastructure for research and development teams.
Financing Activities
Net cash provided by financing activities during the years ended December 31, 2020 and 2019 was $0.2 million and $167.6 million, respectively. The decrease in cash provided by financing activities of $167.4 million was primarily due to the issuance of our Berkshire Grey Series B-2 Preferred Stock financing and B-3 Warrants in June 2019.
Commitments and Contingencies
See Note 13 in the Consolidated Financial Statements for discussion on contractual commitments and contingencies.
Off-Balance
Sheet ArrangementsIn October 2019, Berkshire Grey issued a Partial Recourse Secured Promissory Note (the “Secured Promissory Note”) to an executive officer for approximately $9.9 million with an interest rate of 1.86% per annum compounded annually. Under the terms of the Secured Promissory Note, the officer will be personally liable for 51% of the unpaid balance of the principal and any accrued interest. The entire principal amount was
56
used to purchase 1,191,872 shares of restricted stock. The Secured Promissory Note is collateralized by the restricted common stock. Berkshire Grey determined that the entire Secured Promissory Note must be treated as
non-recourse;
as such, the balance of the note and related accrued interest are not presented on the consolidated balance sheets.Recent Accounting Pronouncements
See Note 2 in the Consolidated Financial Statements regarding recent accounting pronouncements.
Quantitative and Qualitative Disclosures About Market Risk
Foreign Currency Exchange Rate Sensitivity
We are exposed to foreign currency risks that arise from normal business operations. These risks include the translation of local currency balances of foreign subsidiaries, transaction gains and losses associated with intercompany accounts receivable and payable with foreign subsidiaries, and transactions denominated in currencies other than a location’s functional currency. As such, we have exposure to adverse changes in exchange rates associated with operating expenses of our foreign operations. Any fluctuations in other currencies will have minimal direct impact on our international revenue.
We regularly monitor the forecast of
non-U.S.
dollar expenses and the level ofnon-U.S.
dollar monetary asset and liability balances to determine if any actions, including possibly entering into foreign currency contracts, should be taken to minimize the impact of fluctuating exchange rates on our results of operations. We have not entered into any foreign currency contracts as of June 30, 2021.Interest Rate Sensitivity
At June 30, 2021, we had unrestricted cash and cash equivalents of $52.8 million. The unrestricted cash and cash equivalents are held for working capital purposes. We do not enter into investments for trading or speculative purposes. As of June 30, 2021, all our cash equivalents were held in money market funds. Due to the short-term nature of these investments, we believe we do not have any material exposure to changes in the fair value of our investment portfolio as a result of changes in interest rates.
57
BUSINESS
Company Overview
Berkshire Grey is an Intelligent Enterprise Robotics (“IER”) company pioneering and delivering transformative
AI-enabled
robotic solutions that automate filling ecommerce orders for consumers or businesses, filling orders to resupply retail stores and groceries, and handling packages shipped to fill those orders. Our solutions transform supply chain operations and enable our customers to meet and exceed the demands of today’s connected consumers and businesses.Our IER capabilities are grounded in patented and proprietary technologies for(each picking or unit handling),(movement and storage of orders and goods), andwhich enables various intelligent subsystems to work together so that the right work is being done at the right time to meet our customer’s needs. We are a technology leader in robotics and AI automation with an intellectual property position buttressed by trade secrets supporting our technologies and over 300 patent filings with 71 U.S. and international patents issued to date in technologies including robotic picking, mobility, gripping, sensing and perception, general robot control, and differentiated supporting mechanisms. Our proprietary technologies enable us to offer holistic solutions that automate supply chain operations. Our solutions include moving goods to robots that then pick and pack ecommerce or retail orders, robotically moving and organizing inventory and orders within a warehouse or logistics facility, and robotically sorting packages and shipments.
robotic picking
robotic movement and mobility
system orchestration
Berkshire Grey is an IER company, a technology creator, and a deliverer of solutions. We are not a component technology company nor are we a conventional systems integrator. Instead, we create products from the technologies we pioneer and develop, and then incorporate the products (product modules) into solutions — solutions that incorporate said modules and are designed by us to meet customer performance metrics like throughput and accuracy rates. This technology plus performant, whole-enterprise solution view, enables customers to focus on the core of their business and creates attractive returns for them. Following the whole-enterprise solution view, we not only make, install, test, and commission the solutions, but we also offer customers continued support in the form of software updates as well as professional services including maintenance, system operation, and cloud-based monitoring and analytics. Because of our modular approach to solutions and the role of our software, we offer customers the ability to incrementally add to or change solutions, and we can incorporate outside technologies with our product modules if desired. The same modular attributes mean we can offer small and large solutions and can design for brownfield and greenfield installations. We offer customers a range of purchase options including a(“RaaS”) program that minimizes the
robotics-as-a-service
up-front
capital required when compared to conventional equipment purchase models. We also expect to realize recurring revenues from software maintenance and other services offered to our customers post-installation.We created these technologies, product modules, and solutions to support our customers at a time that supply chain operations are under increasing competitive pressures driven by changes in consumer expectations related to the growth of ecommerce. According to LogistisIQ,
global ecommerce sales have grown at a CAGR of 20% over the last decade, reaching approximately $3.5 trillion worldwide in 2019 and are expected to grow to approximately $7.5 trillion by 2026. Today’s consumers expect large numbers of items to choose from, fast fulfillment, “free” shipping, limited or zero substitutes, and rapid delivery of goods. These consumer expectations put significant pressures on conventional supply chain operations, and it is these pressures that Berkshire Grey technologies help customers address.
Just as consumer expectations have changed, so too must the underlying supply chain technologies. Retailers, ecommerce companies, and logistics companies are being asked for increased performance at the same time that competitive pressures and labor availability issues are pronounced. The top three industry challenges, per a recent MHI study, are labor availability, increasing consumer demands, and increasing competitive intensity. With our
AI-enabled
technology, product modules, and solutions, customers can better meet increasing consumer demands and maximize the abilities of human workers, and can do so competitively.58
We believe that the addressable opportunity for Berkshire Grey technology, product modules, and solutions is large. Based on labor consuming approximately 65% of warehousing spend (F. Curtis Barry & Company) and total annual global warehouse spend of $350 billion (McKinsey), global annual spending on warehouse labor is approximately $230 billion, which represents manual labor associated with processes that can be automated with our technology. Further, according to Mordor Intelligence, $56 billion is spent annually on automated material handling equipment globally, representing additional market opportunity for our technology. These two factors together yield an addressable market for our technology, product modules, and solutions of approximately $280 billion annually.
To date, most of our deployments have been with large, Fortune 50 companies, where our technology and solutions in production have achieved targeted metrics including throughput, accuracy, equipment effectiveness, and others. Our customers include Walmart, Target, FedEx, SoftBank Robotics Corp. and TJX. Since 2019, our customers have ordered approximately $148 million of systems from us, and as of June 30, 2021 we had orders of approximately $95 million in backlog that we expect to deliver and install during 2021 and early 2022. In 2020 Target Corporation and SoftBank Robotics Corp., an affiliate of SB SVF II, a related party of Berkshire Grey, comprised approximately 70% and 30% of our revenue, respectively, and in 2019 SoftBank Robotics Corp. and Walmart, Inc. comprised approximately 60% and 30% of our revenue, respectively. We enter into master system purchase agreements with our customers that permit them to order systems from time to time and orders placed may be cancelled for convenience subject to payment of costs incurred by us.
While we have more than a dozen product module offerings incorporating AI and other advanced technologies, we continue to develop new technologies and product modules. The strength of our team enables this continuous development — of our approximately 350 employees as of June 30, 2021, approximately 75% have technical degrees, approximately 60% have advanced degrees and 28 employees have PhD’s. Our engineering team has more than 1,000 years of combined robotics experience.
We use our investor relations website to post important information for investors, including news releases, analyst presentations, and supplemental financial information, and as a means of disclosing material
non-public
information and for complying with disclosure obligations under Regulation FD. Accordingly, investors should monitor our investor relations website, in addition to our press releases, SEC filings and public conference calls and webcasts. We also make available, free of charge, on our investor relations website under “Financial Information” our Annual Reports onForm 10-K,
Quarterly Reports onForm 10-Q,
Current Reports onForm 8-K
and amendments to these reports as soon as reasonably practicable after electronically filing or furnishing those reports to the SEC.59
Industry Background
According to the Statistica, there are almost 19,000 warehouse facilities in the United States, and it is these facilities that represent a critical link in the commerce supply chain. The flow of goods throughout a warehouse or logistics facility typically starts with receiving products in bulk and ends with items exiting the facility by shipping items either in different bulk bundles or as single units depending on the use case. When items arrive at the warehouse they are generally unpacked, counted, and stored. When an ecommerce or store order arrives, goods are picked to meet that order, which is typically in batches of several orders at a time. The batches of picked goods are then sorted into their respective orders, packed into boxes, and shipped to stores or individual consumers. The process is generally similar for ecommerce and retail replenishment purposes and there are many similarities and parallels in package sortation facilities used by logistics companies. Today, most facilities utilize human labor to perform these functions, which creates challenges for businesses when labor is scarce or when labor requirements fluctuate during peak seasons. The figure below illustrates the prototypical flow of goods within a warehouse.

These are all processes that can be made more efficient and automated, whole or in part, with our IER capabilities and specific solutions. Movement and mobility provide a common underlying substrate that enable goods to flow through the various processes while picking provides the ability to automate the item or smaller unit handling steps. Other providers’ systems or components that address only a portion of the value chain, e.g., a unique robotic gripper or even an individual mobile robot that, for example, only carries picked totes, by definition, support only that specific operation and have less potential to support the customer and have a smaller total addressable market.
Over the last several years, there has been a significant evolution of the retail industry, driven by changing demographics and a shift from shopping in conventionalstores to online to omnichannel commerce fulfillment. Fundamental changes in consumer buying behavior have substantially increased the complexities of supply chains, order fulfillment processes and logistics. Consumers are demanding greater product choice and availability, shorter delivery times, free delivery, and simpler return processes. Just as consumer behaviors have changed, the underlying supply chain operations and supporting technologies must change too. Ecommerce is a driving factor in these changes — even impactingoperations and their evolution such as ordering online for
brick-and-mortar
brick-and-mortar
pick-up
at store and related services.Ecommerce is expected to continue to grow rapidly. The
COVID-19
pandemic has provided added energy to that growth and transition. Such growth requires businesses to innovate their supply chains. Large companies such as Amazon have accelerated this phenomenon. Amazon has grown into the largest ecommerce business in the United States and according to Bank of America, Amazon captured more than 44% of the ecommerce market in the United States in 2019. Amazon’s investment in automation has enabled this growth. By investing in automation, Amazon has been able to offer its customers a large selection of items with fast fulfillment at competitive cost levels. Disruption due to Amazon pertains not just to the consumer behaviors and expectations but to the underlying supply chain operations as well. Other retailers, ecommerce companies, grocers, and logistics companies that participate in the same markets must compete. At Berkshire Grey we offer these companies our technology, product modules, and solutions to support these needs.60
Intelligent Enterprise Robotics (IER)
Berkshire Grey has the full portfolio of the capabilities that we believe are necessary to automate supply-chain and logistics enterprises today and enables a fully automated potential future. We call this set of capabilities Intelligent Enterprise Robotics, or IER, and we have these capabilities in house and offer solutions that combine these capabilities to our customers:
| • | Intelligence Software AI-enabled capabilities for individual modules, such as picking and mobility, but also that provide system-level intelligences and orchestration of such robots to achieve overall system-wide performance. |
| • | Automated Picking Platform |
| • | Intelligent Mobile Robotic Platform |
| • | Amplification Robotics & Automation — |
| • | Cloud Analytics Platform |
| • | Cloud AI |
| • | Holistic Sensing and Perception |
| • | Enterprise APIs |
| • | Wrapping & Incorporation of Third-Party and Other Legacy Systems |
| • | Brownfield and Greenfield Installation |
| • | Modularity, Flexibility, and Scalability |
| • | Dynamically Adjustable Performance |
| • | Mobile Data Access for Customers |
In addition, we believe to best utilize IER capabilities, a company must offer customers a full spectrum of services. Our portfolio of services includes:
| • | Full Analysis & Design we start with an analysis of the customer’s processes, product flows, goods handled, and even the physical layout of their existing systems, and use proprietary analysis |
61
methodologies and simulation to create solutions using our product modules and technological capabilities for our customers. |
| • | Installation & Commissioning |
| • | Professional Services |
Technology
While robots are physical and do physical work, algorithms and software produce much of the differentiated performance of these systems for the tasks that we automate, e.g., picking in fulfillment operations. These tasks are inherently different from conventional robotic tasks like those found in manufacturing settings where a robot may paint a car. In manufacturing tasks, the robots are generally executing plans by rote – plans that are often simply programmed in advance by a human engineer. The car shape is known, the position of the car is known, and where the paint needs to be applied is known. In these cases, the capabilities are not about the robot being intelligent but are instead about the robot being a well-designed device which repeats these predefined steps on a predefined shape by rote and does so with high precision. In contrast, in fulfillment, picking robots must self-determine movements and operations online, as they operate, because they process many different types of items with one system and the items are presented chaotically in bins, totes, on conveyor belts, etc. In addition, the items themselves are not perfectly and consistently modeled or known, e.g., a small change in a label will make an item look slightly different. Where items must be placed in an outgoing box, for instance, is also situationally dependent e.g., considering what other items were ordered and what is already in the box are questions the robot must determine on its own as it works.
62
To produce the returns that our systems generate for our customers, Berkshire Grey employs a wide variety of proprietary AI techniques to enable the robots to scan a bin or tote, identify the contents, decide where and how to pick an item up, plan motions to pick up the item, plan motions to the outgoing receptacle, determine where in the outgoing receptacle to place the item, and then deposit the item in the determined location. To do this, our systems employ multiple AI subsystems for several key tasks, including perception and sensor interpretation, motion planning to move the robot, planning for where and how to
pick-up
an item, for tracking the system’s execution, and other critical aspects of the system’s operation. Our AI technologies also employ machine learning to improve performance over time. However, it is important to note that our systems are designed to meet the customers’ performance goals out of the box, and improvements achieved though machine learning benefit the customer over the long-term. We do not require months, years, or even minutes of teleoperation (also known as remote control of the robot by manual means) in advance to be effective.
To create product modules and solutions that perform useful work in an intelligent fashion, our AI algorithms and software are combined withto form product modules as shown in the figure below. Differentiated hardware is important to enable the AI and to enable high-performance execution of the physical task. Patented grippers equipped with sensing and compliance in key areas, for instance, inform the AI and unlock its ability to perform the task well. Patented sensors enable the systems to see and process certain items, e.g., polybags which are notoriously difficult to handle and process. Our differentiated hardware is patent protected with more than 300 filings, and 75 issued U.S. and international patents to date. The AI algorithms and software are trade secrets. These AI algorithms and software are combined with the differentiated hardware, along with selectedcomponents, e.g., motors, in specific ways to create product modules. These product modules are generally manufactured by contract manufacturers, to our standards, which enables Berkshire Grey to scale more quickly by utilizing multiple contract manufacturers as appropriate. Solutions for our customers are then generated by analyzing customer goods, their processes and infrastructure, available physical space, etc., to determine which product modules to utilize and the corresponding appropriate layout and product flow.
differentiated hardware
off-the-shelf
63

We believe that this integrated approach of AI algorithms and software, differentiated hardware, productized modules, and solution generation is critical to making revolutionary gains in supply chain operations. If one simply considers one small component of the problem or even one component of technology, e.g., a new gripper or a body of software, one will miss many opportunities for transformative change. Consider an analogy: the invention of the automobile. Put yourself in Henry Ford’s place — trying to automate the
horse-and
carriage. If you are focused on components, you might swap a robot for the horse. But if you are focused on the true overall goal, you would look at the whole system. You would ask, how do I redesign the surrounding components to solve the real problem? That is the holistic approach which leads to transformative change. That is how Berkshire Grey approaches supply chain transformation and IER.
Product Modules
Our defined IER product module portfolio includes more than a dozen offerings which are combined to create solutions for our customers. Examples include:
| • | Robotic Pick & Pack |
| • | Robotic Induction Systems |
| • | Robotic Pick & Sortation |
64
| • | Intelligent Mobility |
For the picking family of product modules, some of the core elements include our AUTOPICK
®
subsystems and our HYPERSCANNER®
technology. The AUTOPICK subsystems are parts of our product modules and ultimately solutions that help businesses grow by automating unit item handling tasks, e.g., picking a USB power supply in response to a customer order, for ecommerce fulfillment, retail resupply, and package handling operations. AUTOPICK can pick many different items with one system, e.g., handling sporting goods, toiletries, clothing, and even groceries. These picking systems are also able to handle items not previously seen or processed. The capabilities come from our AI technology combined withAI-enabling
differentiated hardware elements like our Spectrum gripper and scanning technologies like our HYPERSCANNER.AUTOPICKs feature robotic arms optimized for speed and efficiency. Our robots make fluid and dynamic movements in contrast to the rote motions generally used in industrial robot applications and deliver high-speed performance. To achieve this level of natural motion complexity our robots are paired with AI, proprietary control software, vision systems, sensors, and engineered electromechanical hardware. Our various AI subsystems for planning, robotic manipulation, vision technology, differentiated gripping, and sensing allow us to pick swiftly and accurately from clutter. This enables them to handle real-world situations such as picking from mixed totes, picking many items with one system, batch picking, and downstream sortation. Our systems are designed to meet customer performance goals out of the box and improve by learning over time as they work.
Our computer vision systems incorporate a variety of camera and vision technologies to create three-dimensional perception. This enables picking from both cluttered and structured containers and environments. Sophisticated vision systems are a key aspect of our systems’ ability to adjust to dynamic conditions in real-time. The systems not only see, but they also plan and process. They see, interpret theand can react in real-time to changing conditions such as shifting items in a container and new orientations for items on a belt after previous items are picked. Our systems react with no material time lag in the picking process since the vision systems are constantly updating and the AI software is constantly analyzing and adjusting the systems’ motion with every pick.
field-of-view,
Our AUTOPICK system is used in three product module families, includingand. Each of these product module families is designed to automate different steps within the supply chain, and each can be configured into systems to meet each customer’s needs. In addition, each can be combined with our mobile technologies and each can be enhanced with our proprietary HYPERSCANNER technology, providing item identification functionality that significantly broadens the capability of our systems.
Robotic Pick
& Pack, Robotic Induction,
Robotic Pick
& Sortation
Robotic Pick & Pack
Berkshire Grey’s Robotic Pick & Pack family consists of product modules that automate picking of individual items and either placing items into outgoing locations like bins or totes, or packing items for shipment. When incorporated into our holistic solutions, these product modules provide agility, labor reduction, and high-performance SKU handling capabilities to order fulfillment, retail resupply, and package handling logistics. Product modules in this family consist of inbound/outbound container transport with intelligently managed buffering, highly engineered pick and system structures with integrated safety features, a highrobot outfitted with our patented SPECTRUMGRIPPER
degree-of-freedom
®
system, advanced computer vision, andAI-enabled
software. Value-added packages for these product modules include careful handling, packing density, autoswap technology, divided tote features, andweb-enabled
management dashboards. These product modules can be combined with other Berkshire Grey technologies including mobile robotic modules, manual customer operations, and third-party robotic or automated storage and retrieval systems (AS/RS).65
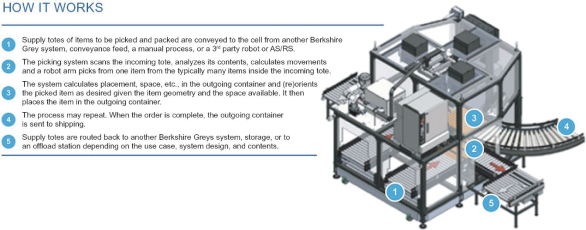
Robotic Induction Systems
Berkshire Grey’s Robotic Induction Systems family consists of product modules that automate unit sorter induction processes so that our solutions can interface with unit sortation systems, reducing labor, modernizing and improving sorter utilization. This ability to interface with and utilize other hardware is essential for providing an IER offering to customers. Robotic Induction Systems pick and place individual items, packages, and other units into a sorting system. Robotic Induction Systems are comprised of a highly engineered structure with integrated safety features, a highrobot outfitted with our patented SPECTRUMGRIPPER system, advanced computer vision, and
degree-of-freedom
AI-enabled
software. Value-added packages for these product modules include careful handling, autoswap technology, divided tote features, andweb-enabled
management dashboards. These product modules can be combined with other Berkshire Grey technologies including mobile robotic modules, as well as totes provided by manual processes and third-party robotics or AS/RS systems.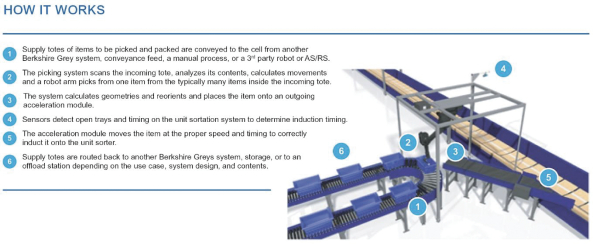
Robotic Pick & Sortation
Berkshire Grey’s Robotic Pick & Sortation family consists of product modules that automate picking of individual items and combines this ability with movement, via amplification robot, of the item to specified locations to sort or collate items. These systems enable operations such as sorting of batch picked ecommerce orders to order specific locations or outgoing boxes, store replenishment operations like breakpack processing, and package handling. These systems include features like those of Robotic Pick & Pack, plus amplification robotic movement, plus features supporting the boxing and sortation of items like box fullness detection, box
66
closeout, automatic box ejection, automatic box
in-feed,
and so forth. Many of these capabilities are protected by patents and patent filings. Value-added packages for these product modules include advanced sensing, careful handling, autoswap technology, divided tote features, and web enabled management dashboards. These product modules can be combined with other Berkshire Grey technologies including mobile robotic modules as well as manual customer operations,conveyance-fed
goods, and third-party robotic or AS/RS systems.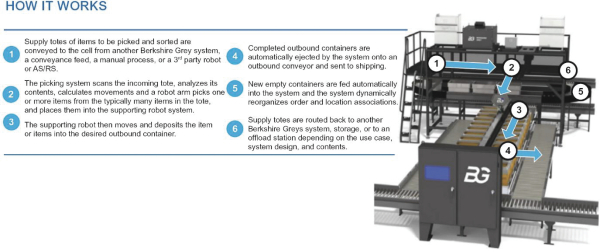
HYPERSCANNER
TM
TechnologyIn some applications, robots need to see and understand goods and items very clearly in order to process them. Berkshire Grey produces a range of perception and scanning systems for our various product modules and solutions, which enables them to see and process a wide range of items in a wide range of settings. One of our unique scanning systems is our patented HYPERSCANNER. The HYPERSCANNER is engineered with an auto-identification chamber that reads barcodes and labels from many angles, on standard and irregular surfaces, in milliseconds — without the need for additional manual manipulation for the system to identify each item. With its innovative design and advanced machine vision, the HYPERSCANNER handles a wide range of item types, irregular shapes, and challenging colors and patterns, without disrupting processing flows. This includes polybags which are particularly difficult for conventional scanning technologies. The HYPERSCANNER integrates with Berkshire Grey’s other product modules or can be used in a stand-alone fashion.

Intelligent Mobility
Our Intelligent Mobility module family consists of Berkshire Grey’s proprietary mobile robots and supporting infrastructure that provide a modular, distributed, transport and storage system that is flexible, fast,
67
and accurate, and which is orchestrated by our AI software platform. Attributes and accessory technologies for these systems include FlexFeed subsystems, which automatically feed large individual items like cases of water bottles into the system along with bins, boxes, totes, and trays. Our Intelligent Mobility offerings can be partnered with our other technologies and product modules, e.g., the aforementioned picking-centric families, and include product module lines like Mobile Robotic Sortation and Mobile Robotic Fulfillment.

Mobile Robotic Sortation
Mobile Robotic Sortation is a highly flexible, industrial-grade mobile robotic sortation module that enables dynamicinduct to discharge sortation with higher payloads and faster performance than is typically found in other mobile sortation approaches. To remain competitive in the fast-paced omnichannel order fulfillment landscape, retail, ecommerce, grocery, package handling, and third-party logistics (“3PL”) companies must manage increasing throughput demands and new ways of supporting customer buying choices. Traditional unit sorters and conveyor-based sortation are neither flexible nor agile enough to handle the assortment of product types and the item- and case-level sortation required by modern cross-docking, buy online pick up in store (“BOPIS”), and direct delivery processes.
any-to-any
Berkshire Grey’s Mobile Robotic Sortation module consists of AI cloud-based orchestration software, dynamically controlled fleets of mobile robots, and automated induct and discharge stations that dynamically automate sortation within existing footprints and legacy brownfield environments as well as greenfield installations. Offering maximum flexibility and performance, this module turns any floor into a world-class sortation system capable of handling the widest assortment of product sizes, types, and packaging for agile sortation strategies. The Mobile Robotic Sortation module automates the management and coordination of the mobile robot work plans, task allocation, trajectories, and planned paths to deliver resilient and highly accurate sortation. Our offering includes a real-time simulation package for determining optimal configurations for both brownfield and greenfield installations.
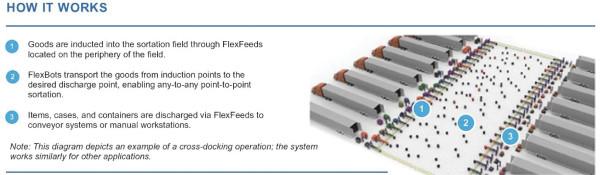
68
Mobile Robotic Fulfillment
Mobile Robotic Fulfillment is an innovative inventory management and order fulfillment module that combines our intelligent mobile robotics technologies with our automated picking technologies to produce a holistic system that stores, moves, organizes, and picks goods. These systems can incorporate both our automatic picking technology along with our manual stations which enable Q&A functions as well as manual picking when desired.
Mobile Robotic Fulfillment modules are flexible. They offer a unique and dynamic blend of functionality that cannot easily be achieved with more conventional material handling equipment, AS/RS solutions, or stand-alone automated picking systems. The combined set of Berkshire Grey technologies can handle the wide assortment of case and unit level product types required to fulfill modern cross-docking, buy online pick up in store (BOPIS), and direct delivery applications.
The highly modular Mobile Robotic Fulfillment technologies can be used in traditional store replenishment distribution centers as well as micro and nano fulfillment center implementations with constrained physical environments and they can be deployed in brownfield as well as greenfield implementations. They easily scale to meet increased customer needs over time. Value-added modules for these systems include manual and Q&A stations, GUI interfaces with configurable execution and exception logic, additional storage via density modules or leveling, and modular, distributed safety systems that allow access and maintenance with very limited operational impact.
Solutions based on Berkshire Grey’s Mobile Robotic Fulfillment modules combine our AI and patented AUTOPICK technology with our cloud-based AI orchestration software to enable unit-level singulation and dynamic case-based sortation within an integrated omni-channel fulfillment solution.

Benefits Of Our Solutions
We believe Berkshire Grey’s technology, product modules, and solutions provide material benefits including:
| • | Versatility odd-shaped boxes, containers, apparel, electronics, housewares, packaged food, childcare products, pet care items, health and beauty items, and other general merchandise. Our vision systems, AI and machine learning algorithms combined with haptics and gripping technology enable our solutions to handle wide ranges of products without the need forpre-programming or other manual processes to “teach” our robots. Further, our technology and product modules industry agnostic — they can be applied broadly to businesses that fill orders or perform logistics. |
69
| • | Speed and Accuracy |
| • | Reliability |
| • | Flexibility and Scalability |
| • | Efficiency and Economic Benefits |
These benefits enable tangible competitive advantages for our customers, which we see as creating a flywheel of economic transformation for our customers. Generally, investment in our
AI-enabled
robotics and automation solutions provides customers with increased operational capabilities which allows them to offer more (choices, performance, etc.) to their customers, while doing so at a lower overall cost. Growing the topline through better customer satisfaction at a lower cost profile creates economic competitive advantage, and the cycle continues.
Our Market Opportunity
Historically, conventional automation was implemented primarily to reduce operating costs. In the last several years, the rapid growth of ecommerce has accelerated the need for distribution centers, logistics facilities and warehouses to adopt robotics and AI automation technologies to not only reduce operating costs, but to keep
70
up with changes in consumer buying behavior and to remain competitive. We believe our technology, product modules, and solutions can be used in many businesses with order fulfillment, distribution and logistics facilities in a variety of industries, and our technology plays a key role in improving operational efficiencies, reducing labor dependencies, improving flexibility and increasing speed. We sell into a variety of market verticals, including ecommerce, retail, grocery, package handling, and third-party logistics. We market globally, and our deployments to date have been in the United States and Japan, and beginning in 2021 we will be deploying solutions in Canada, We recently expanded our sales and marketing efforts in Europe.
We believe we are well positioned to capitalize on the large and expected rapid growth of the robotics and AI automation market and that only a limited amount of automation penetration has occurred to date. Based on labor consuming approximately 65% of warehousing spend (F. Curtis Barry & Company) and total annual global warehouse spend of $350 billion (McKinsey), global annual spending on warehouse labor is approximately $230 billion, which represents manual labor associated with processes that can be automated with our technology. Further, according to Mordor Intelligence, $56 billion is spent annually on automated material handling equipment globally, representing additional market opportunity for our technology. Therefore, our technology could provide solutions for an addressable market of over $280 billion annually.
Our Growth Strategy
The key elements of our strategy for growth include the following:
Expand existing relationships with large anchor customers
To date, most of our deployments have been with large, Fortune 50 companies, where our technology and solutions in production have achieved targeted metrics including throughput, accuracy, equipment effectiveness, and others. Our customers include Walmart, Target, FedEx, SoftBank Robotics Corp. and TJX with solutions in operation or being installed. These customers have thousands of stores and hundreds of fulfillment and logistics centers in which our solutions can be implemented. Our goal is to continue our collaborative relationship with our large customers and to continue to help them add new levels of technology and automation throughout their network of operations. The underlying modular and flexible product modules that we combine to create solutions, which can be deployed in both brownfield and greenfield situations, help to support this model.
Invest in sales and marketing to build a diverse, global customer base and expand geographically
We intend to continue to invest in our sales and marketing efforts to rapidly expand our customer base. We currently focus on five market verticals with our technology: retail, ecommerce, grocery, parcels and 3PL. We believe that these market verticals provide the largest immediate opportunity for us due to the growth and challenges businesses face with the fundamental changes in consumer buying behavior, and we have developed our solutions to address these challenges. We believe nearly every ecommerce company, retailer, grocer, and logistics business is a potential customer.
Our deployments to date have been in the United States and Japan, and beginning in 2021 we will be deploying solutions in Canada. We expect to expand our installations with customers in other regions internationally. We also intend to expand our sales and marketing efforts into Europe and Asia, and we established offices in the UK and Japan during 2020 to scale our efforts in those regions.
Continue to invest in technology
We intend to expand our engineering efforts to create increasingly more powerful artificial intelligence software platforms and differentiated hardware. This will continually increase product module and solution productivity and expand our market opportunity and enable our customers to enjoy the benefits of
AI-enabled
robotics and automation solutions at scale. We also intend to expand our product module and solution offerings to other applications throughout the customer value chain. By providing robust, holistic solutions for a variety of market verticals and applications, we believe we will be able to penetrate our target markets further.71
Expandand other recurring and
Robotics-as-a-Service
re-occurring
revenue streamsTo date, our revenues are primarily generated from the sale of our solutions. Customers have the option to buy our solutions outright or under a subscription-based model, RaaS. We believe the RaaS model will be financially attractive to many customers and will contribute to our growth. Additionally, we offer certain post-installation services which can renewed annually for a fee. We believe there is growth potential for recurring and
re-occurring
revenue streams, and we intend to accelerate offering additionalvalue-add
services, aftermarket component replacement programs, and expanding our software capabilities and services to maximize revenue from our installed base.Pursue strategic partnerships
We intend to pursue strategic partnerships with systems integrators, companies with complimentary technologies, software application providers, distributors, and consulting firms to expand the channels in which our solutions are marketed. We believe working with these partners will allow us to accelerate our brand awareness within a variety of industries, provide complementary capabilities, and differentiation that will attract new customers, while helping us to expand our customer base.
Our Competitive Strengths
Our IER capabilities are grounded in patented and proprietary technologies for(each picking or unit handling),(movement and storage of orders and goods), andwhich enables various intelligent subsystems to work together so that the right work is being done at the right time to meet our customer’s needs. These are combined with the full suite of IER capabilities, defined above, which include cloud attributes, the ability to install in brownfield and greenfield settings, and a full spectrum of services from manufacturing of our product modules through to installation through to system operation. We are a leader in the robotics and AI automation industry with technologies we pioneer and develop and have over 300 patent filings and 71 U.S. and international patents issued to date. We incorporate our differentiated technologies into products (product modules) which are then incorporated into customer solutions — solutions that are designed by us to meet customer performance metrics like throughput and accuracy rates. This performant, whole-enterprise solution view, which includes differentiated technologies and a full IER suite of capabilities, enables customers to focus on the core of their business and creates attractive returns for them. We believe that these strengths provide us with competitive advantages now and into the future.
robotic picking
robotic movement and mobility
system orchestration
Proven technology — our solutions are in use today by large customers
To date, most of our deployments have been with large, Fortune 50 companies, where our technology and solutions in production have achieved targeted metrics including throughput, accuracy, equipment effectiveness, and others. Our customers include Walmart, Target, FedEx, SoftBank Robotics Corp. and TJX. Operations being performed include picking and mobility to fill orders.
Asset-light operations
Our core hardware product modules are manufactured via third-party contract manufacturers. This is a deliberate strategy and we believe our investment in our processes will enable us to scale production rapidly. We therefore do not have plans to build factories to produce our product modules. We intend to continue to utilize a network of contract manufacturers to leverage their expertise in scaling production systems, sourcing key raw materials and implementing world-class quality control processes. This approach reduces scaling risk and allows us to focus our resources on designing solutions, continuously improving our artificial intelligence platforms and ensuring customer satisfaction.
Creative pricing models
We offer the option for our customers to purchase our solutions outright or under a subscription-based RaaS pricing model. RaaS pricing models enable some customers easier access to our technology and to automate
72
today and support their plans for tomorrow. RaaS makes it possible to address labor availability challenges, avoid costly new warehouse buildouts, and secure the fiscal benefits of complete
AI-enabled
robotics and automation solutions without requiring significant upfront capital requirements.Experienced management team and deep technological engineering capabilities
Our management team has operational experience bringing emerging technologies to market across the hardware and software sectors. Members of our management and engineering teams have significant experience at various companies and institutions focusing on robotics, artificial intelligence, and other automation technologies. Our ability to innovate and develop
AI-enabled
robotics and automation solutions is essential to our success. Of our approximately 350 employees as of June 30, 2021, approximately 75% have technical degrees, 60% have advanced degrees and 28 employees have PhD’s. Our engineering team has more than 1,000 years of combined robotics experience and have developed artificial intelligence-based technology, product modules, and solutions to enable our customers to keep pace with the rapid rate of change in consumer buying behavior.Competition
Today, we primarily compete against conventional, manual systems supported by human labor despite fundamental issues impacting businesses including labor availability, increasing consumer expectations, and increasing competitive pressures. This is partly due to the current low penetration of automation technology and partly due to the familiarity with existing manual systems and processes. When it comes to conventional equipment providers in this space, some provide equipment to support these manual processes such as conveyor belts and static manual shelving units that we, at Berkshire Grey, do not manufacture or sell as a primary solution. Some traditional material handling companies also offer AS/RS solutions which store and move goods in support of manual processes. In addition to traditional equipment providers, there are also development stage companies endeavoring to produce new technology for some of our targeted verticals and segments where many are focusing on component technologies, e.g., novel grippers, or even a mobile robot that, for example, performs only the specific task of carrying a batchfor a discussion of material risks to us relating to our competitive position.
picked-bin.
There are also mature companies that provide component technologies such as vision or camera systems. Component technologies can be useful though from a whole solution perspective, these are elements of a solution, not a whole solution. At Berkshire Grey, we both pioneer newAI-enabled
technologies and approach the customers from an enterprise perspective with our IER portfolio of capabilities, where solutions can include our technologies for picking, movement and mobility, and whole system orchestration — and where our services include full analysis and design, installation, and even system operation at the customers’ option. In addition to the discussion above, seeRisk Factors
Customers
Our customers include some of the largest retailers and logistics companies in the world and include Walmart, Target, SBG, TJX and FedEx, and we also have additional small and medium sized customers within our five market verticals: retail, ecommerce, grocery, parcel and 3PL. Solutions deployed to date include picking and mobility. Since 2019, our customers have ordered approximately $148 million of solutions from us, and as of June 30, 2021, we had orders of approximately $95 million in backlog that we expect to deliver and install during 2021 and early 2022.
Research and Development
We believe our research and development capability provides us with a key competitive advantage. Our team of engineers has more than 1,000 years of combined advanced robotics experience and have backgrounds at many of the world-leading robotics, artificial intelligence and research organizations. We conduct research and development in our Innovation and R&D centers in in Bedford and Lexington Massachusetts, as well as at our R&D center located in Pittsburgh, Pennsylvania.
73
Our research and development activities currently include programs in the following areas:
| • | Expanding the capabilities and making improvements to our technology |
| • | Expand the capabilities of our artificial intelligence software platforms value-add capability, improve system performance and expand solutions offerings. |
| • | Expand our product module and solution offerings |
Sales and Marketing
We sell our
AI-enabled
robotics and automation solutions primarily through direct sales. We have general managers leading each market vertical who have teams in place to build our pipelines and expand our customer base. We also have dedicated resources for certain key anchor customers due to their size and potential opportunity. We intend to continue to invest in our sales and marketing efforts to build our customer base and expand geographically, and we expect to focus on many of the largest businesses within each market vertical.We intend to pursue strategic partnerships with systems integrators, companies with complimentary technologies, software application providers, distributors, and consulting firms to expand the channels in which our solutions are marketed. We believe working with these partners will allow us to accelerate our brand awareness within a variety of industries, provide complementary capabilities, and differentiation that will attract new customers, while helping us to expand our customer base.
Manufacturing and Suppliers
Our hardware product modules are manufactured via third-party contract manufacturers with international quality certifications. We develop and design product modules and processes and often build engineering prototypes in our R&D facilities or Innovation Centers. Our engineers and supply chain teams work collaboratively with our third-party contract manufacturers to develop processes to enable commercialization at scale. Our third-party contract manufacturers provide a variety of services including sourcingcomponents, manufacturing custom components, final assembly and integration, end of line testing and quality assurance per our specifications.
off-the-shelf
We initially manage the supply chain for key components, and then set up supply agreements to ensure stable supply and redundancy where applicable. Depending on the criticality of the component, our internal supply chain group may continue to manage the supplier relationship throughout the life of the solution. Commodity consumables are qualified and purchased directly from known industry leaders and provided to the customer to properly support equipment operation. In some circumstances, key consumables used in our solutions are developed and produced with partners to ensure protection of intellectual property and production that meets our specifications and quality requirements.
Intellectual Property
Our ability to drive innovation in the robotics and AI automation market depends in part upon our ability to protect our core technology and intellectual property. We seek to protect our intellectual property rights, both in
74
the United States and abroad, through a combination of patent, trademark, copyright and trade secret laws, as well as nondisclosure and invention assignment agreements with our contractors and employees and through
non-disclosure
agreements with our customers, vendors and business partners. Unpatented research, development,know-how
and engineering skills make an important contribution to our business, but we pursue patent protection when we believe it is possible and consistent with our overall strategy for safeguarding intellectual property.As of June 30, 2021, we had over 300 patent filings and 75 issued U.S. and international patents. Our patents and patent applications are directed to, among other things, intelligent robotics for the enterprise and span areas of focus including overall systems and processes, sensing and perception, gripping, and other mechanisms. In addition, we own more than 30 U.S. trademarks registrations and applications in the U.S. and foreign jurisdictions.
Employees and Human Capital Resources
Our employees are critical to our success. As of June 30, 2021, we had approximately 350 full-time employees based primarily in the greater Boston, Massachusetts area, as well as in offices in Pittsburgh, PA and Reading, UK. We also engage consultants and contractors to supplement our permanent workforce on an as needed basis. A majority of our employees are engaged in engineering, research and development, and related functions. To date, we have not experienced any work stoppages and consider our relationship with our employees to be in good standing. None of our employees are subject to a collective bargaining agreement or represented by a labor union.
Our human capital resources objectives include, as applicable, identifying, recruiting, retaining, incentivizing and integrating our existing and additional employees. The principal purposes of our incentive plans are to attract, retain and motivate selected employees and consultants through the granting of stock-based compensation awards and cash-based performance awards.
Facilities
Our corporate headquarters is located in an approximately 70,000 square foot facility that we lease in Bedford, Massachusetts. The lease expires in 2031 and we have the option to extend for two additional five-year periods. Our facilities we lease in Massachusetts, Pennsylvania, Reading UK, are summarized below. We believe that our leased office space is adequate for our current needs and, should we need additional space, we believe we will be able to obtain additional space on commercially reasonable terms.
Location | ~Size (sq ft) | Lease Expiration | Purpose | |||
Bedford, MA (Main) | 70,000 | 2031 | Innovation Center & Headquarters | |||
Lexington, MA | 31,000 | April 2022 | R&D and Admin | |||
Pittsburgh, PA | 20,500 | September 2025 | R&D | |||
Reading, UK | 1,000 | December 2021 | EMEA S&M |
Government Regulations
Compliance with various governmental regulations has an impact on our business, including our capital expenditures, earnings and competitive position, which can be material. We incur costs to monitor and take actions to comply with governmental regulations that are applicable to our business, which include, among others, laws, regulations and permitting requirements of federal, state and local authorities, including related to environmental, health and safety, anti-corruption and export controls. In addition to the discussion below, see, for a discussion of material risks to us, including, to the extent material, to our competitive position, relating to governmental regulations, and see, together with our consolidated financial statements, including
Risk Factors
Berkshire Grey’s Management’s Discussion and Analysis of Financial Condition and Results of Operation
75
the related notes included therein, for a discussion of material information relevant to an assessment of our financial condition and results of operations, including, to the extent material, the effects that compliance with governmental regulations may have upon our capital expenditures and earnings.
Environmental Matters
We are subject to domestic and foreign environmental laws and regulations governing our operations, including, but not limited to, emissions into the air and water and the use, handling, disposal and remediation of hazardous substances. A certain risk of environmental liability is inherent in our production activities, operation of our solutions and the disposal of our solutions. These laws and regulations govern, among other things, the generation, use, storage, registration, handling and disposal of chemicals and waste materials, the presence of specified substances in electrical products, the emission and discharge of hazardous materials into the ground, air or water, the cleanup of contaminated sites, including any contamination that results from spills due to our failure to properly dispose of chemicals and other waste materials and the health and safety of our employees.
The export of our solutions internationally from our facilities subjects us to environmental laws and regulations concerning the import and export of electronics and other equipment. These laws and regulations require the testing and registration of some materials that form a part of our solutions.
Export and Trade Matters
We are subject to anti-corruption laws and regulations imposed by governments around the world with jurisdiction over our operations, including the U.S. Foreign Corrupt Practices Act and the UK Bribery Act 2010, as well as the laws of the countries where we do business. We are also subject to various trade restrictions, including trade and economic sanctions and export controls, imposed by governments around the world with jurisdiction over our operations. For example, in accordance with trade sanctions administered by the U.S. Department of Treasury’s Office of Foreign Assets Control and export controls administered by the U.S. Department of Commerce, we are prohibited from engaging in transactions involving certain persons and certain designated countries or territories, including Cuba, Iran, Syria, North Korea and the Crimea Region of Ukraine. In addition, our solutions may be subject to export regulations that can involve significant compliance time and may add additional overhead cost to our solutions. In recent years the United States government has a renewed focus on export matters. For example, the Export Control Reform Act of 2018 and regulatory guidance thereunder have imposed additional controls and may result in the imposition of further additional controls, on the export of certain “emerging and foundational technologies.” Our current and future solutions may be subject to these heightened regulations, which could increase our compliance costs.
See “” beginning on page 10 of this prospectus for additional information about the environmental, health and safety laws and regulations that apply to our business.
Risk Factors — Our existing and planned global operations subject us to a variety of risks and uncertainties that could adversely affect our business and operating results. Our business is subject to risks associated with selling our solutions in locations outside the United States
Legal Proceedings
We may be subject from time to time subject to various claims, lawsuits and other legal and administrative proceedings arising in the ordinary course of business. Some of these claims, lawsuits and other proceedings may involve highly complex issues that are subject to substantial uncertainties, and could result in damages, fines, penalties,
non-monetary
sanctions or relief. We intend to recognize provisions for claims or pending litigation when we determine that an unfavorable outcome is probable and the amount of loss can be reasonably estimated. Due to the inherent uncertain nature of litigation, the ultimate outcome or actual cost of settlement may materially vary from estimates.76
MANAGEMENT
The following sets forth, as of the date of this prospectus, certain information regarding our directors and executive officers who are responsible for overseeing the management of our business.
Name | Age | Position | ||
Thomas Wagner | 54 | Chief Executive Officer and Class III Director | ||
Steven Johnson | 57 | President & Chief Operating Officer | ||
Mark Fidler | 50 | Chief Financial Officer | ||
John K. Delaney | 58 | Class III Director | ||
Peter Barris | 70 | Class II Director | ||
Sven Strohband | 48 | Class II Director | ||
Fiona P. Dias | 55 | Class I Director | ||
Serena Wolfe | 42 | Class I Director |
Thomas Wagner
Steven Johnson
.
Mark Fidler
.
77
John K. Delaney
co-founded
CapitalSource Inc. (NYSE: CSE), a leading middle market lending business, and from 2000-2011 he served as its Chief Executive Officer and Chairman. From 1993 until its sale to Heller Financial in 1999, Mr. Delaney was theco-founder,
Chairman and Chief Executive Officer of HealthCare Financial Partners, Inc. (NYSE: HCF), a provider of commercial financing to small andmedium-sized
healthcare service companies. Mr. Delaney currently serves as the Executive Chairman of Congressional Bancshares, Inc., a banking and lending company, and as the Chief Executive Officer and a director of Revolution Acceleration Acquisition Corp II, a special purpose acquisition company. Mr. Delaney received his undergraduate degree from Columbia University and his juris doctor degree from the Georgetown University Law Center.Peter Barris
In-Q-Tel
Sven Strohband
Fiona P. Dias
e-commerce
shopping network. She has also held senior marketing and strategy positions at GSI Commerce, Inc., PepsiCo, Inc. and The Procter & Gamble Company. Ms. Dias has a bachelor’s degree in biochemistry from Harvard University and a master’s degree in business administration from the Stanford Graduate School of Business.78
Serena Wolfe
go-to-market
Corporate Governance
Our corporate governance is structured in a way that we believe will closely align our interests with those of our stockholders. Notable features of our corporate governance include:
| • | we have independent director representation on our audit, compensation and nominating and corporate governance committees, and our independent directors meet regularly in executive sessions without the presence of our corporate officers or non-independent directors; |
| • | at least one of our directors qualifies as an “audit committee financial expert” as defined by the SEC; and |
| • | we have implemented a range of other corporate governance best practices, including implementing a robust director education program. |
Role of Board in Risk Oversight
Our board of directors is responsible for overseeing our risk management process. Our board of directors focuses on our general risk management strategy, the most significant risks facing us, and oversees the implementation of risk mitigation strategies by management. Our audit committee is also responsible for discussing our policies with respect to risk assessment and risk management. We do not believe that our board’s administration of its risk oversight function will negatively affect its leadership structure.
Classification of our Board of Directors
In accordance with our certificate of incorporation, our board of directors is divided into three classes with staggered, three-year terms. At each annual meeting of stockholders, the successors to directors whose terms then expire are elected to serve from the time of election and qualification until the third annual meeting following election. Our directors are divided among the three classes as follows:
| • | the Class I directors are Fiona P. Dias and Serena Wolfe, and their terms will expire at our 2022 annual meeting of stockholders; |
| • | the Class II directors are Peter Barris and Sven Strohband, and their terms will expire at our 2023 annual meeting of stockholders; and |
| • | the Class III directors are Mr. Delaney and Dr. Wagner and their terms will expire at the 2024 annual meeting of stockholders. |
Our certificate of incorporation provides that the authorized number of directors may be changed only by resolution of the board of directors. The division of our board of directors into three classes with staggered three-
79
year terms may delay or prevent a change of our management or a change in control of our company. Subject to the rights of the holders of any series of preferred stock, any director or the entire board may be removed from office at any time, but only (i) for cause and (ii) by the affirmative vote of holders of at least
two-thirds
(2/3) of the voting power of all then outstanding shares of our capital stock entitled to vote generally in the election of directors, voting together as a single class.Board Committees
Our board of directors has three standing committees: an audit committee, a compensation committee and a nominating and corporate governance committee. In addition, from time to time, special committees may be established under the direction of our board of directors when necessary to address specific issues.
Audit Committee
Our audit committee is responsible for, among other things:
| • | appointing, compensating, retaining, evaluating, terminating and overseeing our independent registered public accounting firm; |
| • | discussing with our independent registered public accounting firm their independence from management; |
| • | reviewing, with our independent registered public accounting firm, the scope and results of their audit; |
| • | approving all audit and permissible non-audit services to be performed by our independent registered public accounting firm; |
| • | overseeing the financial reporting process and discussing with management and our independent registered public accounting firm the quarterly and annual financial statements that we file with the SEC; |
| • | overseeing our financial and accounting controls and compliance with legal and regulatory requirements; |
| • | reviewing our policies on risk assessment and risk management; |
| • | reviewing related person transactions; and |
| • | establishing procedures for the confidential anonymous submission of concerns regarding questionable accounting, internal controls or auditing matters. |
Our audit committee consists of Mr. Barris, Ms. Wolfe and Ms. Dias. Ms. Wolfe serves as the chairperson of the audit committee. Under the Nasdaq listing rules and applicable SEC rules, we are required to have at least three members of the audit committee. The rules of the Nasdaq and. The information on our website is not deemed to be incorporated in this prospectus or to be part of this prospectus.
Rule 10A-3
of the Exchange Act require that the audit committee of a listed company be composed solely of independent directors for audit committee purposes, and each of Mr. Barris, Ms. Wolfe and Ms. Dias qualify as independent directors for audit committee purposes under applicable rules. Each of Mr. Barris, Ms. Wolfe and Ms. Dias, is financially literate and Ms. Wolfe qualifies as an “audit committee financial expert” as defined in applicable SEC rules. Our board of directors has adopted a written charter for the audit committee, which is available on our corporate website atwww.berkshiregrey.com/investors
Compensation Committee
Our compensation committee is responsible for, among other things:
| • | reviewing and approving the corporate goals and objectives, evaluating the performance of and reviewing and approving, (either alone or, if directed by our board of directors, in conjunction with a |
80
majority of the independent members of our board of directors) the compensation of our Chief Executive Officer; |
| • | overseeing an evaluation of the performance of and reviewing and setting or making recommendations to our board of directors regarding the compensation of our other executive officers; |
| • | reviewing and approving or making recommendations to our board of directors regarding our incentive compensation and equity-based plans, policies and programs; |
| • | reviewing and approving all employment agreement and severance arrangements for our executive officers; |
| • | making recommendations to our board of directors regarding the compensation of our directors; and |
| • | retaining and overseeing any compensation consultants. |
Our compensation committee consists of Mr. Barris and Ms. Wolfe, who are both independent directors. Mr. Barris serves as the chairperson of the compensation committee. Our board of directors has adopted a written charter for the compensation committee, which is available on our corporate website at. The information on our website is not deemed to be incorporated in this prospectus or to be part of this prospectus.
www.berkshiregrey.com/investors
Nominating and Corporate Governance Committee
Our nominating and corporate governance committee is responsible for, among other things:
| • | identifying individuals qualified to become members of our board of directors, consistent with criteria approved by our board of directors; |
| • | overseeing succession planning for our Chief Executive Officer and other executive officers; |
| • | periodically reviewing our board’s leadership structure and recommending any proposed changes to our board of directors; |
| • | overseeing an annual evaluation of the effectiveness of our board of directors and its committees; and |
| • | developing and recommending to our board of directors a set of corporate governance guidelines. |
Our nominating and corporate governance committee consist of Ms. Dias and Mr. Strohband, who are both independent directors. Ms. Dias serves as the chairperson of the nominating and corporate governance committee. Our board of directors has adopted a written charter for the nominating and corporate governance committee, which is available on our corporate website at. The information on our website is not deemed to be incorporated in this prospectus or to be part of this prospectus.
www.berkshiregrey.com/investors
Code of Business Conduct and Ethics
We have adopted a written code of business conduct and ethics that applies to our directors, officers and employees, including our principal executive officer, principal financial officer, principal accounting officer or controller, or persons performing similar functions. A copy of the code of business conduct and ethics is posted on our corporate website at. In addition, post on our website all disclosures that are required by law or the Nasdaq listing standards concerning any amendments to, or waivers from, any provision of the code of business conduct and ethics. The information on any of our websites is not deemed to be incorporated in this prospectus or to be part of this prospectus.
www.berkshiregrey.com/investors
Compensation Committee Interlocks and Insider Participation
None of our executive officers will serve as a member of the board of directors or compensation committee (or other committee performing equivalent functions) of any entity that has one or more executive officers serving on the our board of directors or compensation committee.
81
EXECUTIVE AND DIRECTOR COMPENSATION
As an emerging growth company, we have opted to comply with the executive compensation disclosure rules applicable to “smaller reporting companies” as such term is defined in the rules promulgated under the Securities Act, which require compensation disclosure for its principal executive officer and its two other most highly compensated executive officers. References in this section to “we”, “our”, “us”, the “Company” and “Berkshire Grey” as of dates prior to the closing of the Business Combination, generally refer to Legacy Berkshire Grey.
Executive Compensation
The compensation provided to Berkshire Grey’s named executive officers for the fiscal year ended December 31, 2020 is detailed in the 2020 Summary Compensation Table and accompanying footnotes and narrative that follow. Berkshire Grey’s named executive officers, are:
| • | Thomas Wagner, Berkshire Grey’s Chief Executive Officer; |
| • | Steven Johnson, Berkshire Grey’s President and Chief Operating Officer; and |
| • | Mark Fidler, Berkshire Grey’s Chief Financial Officer. |
2020 Summary Compensation Table
The following table sets forth information regarding compensation awarded to, earned by, or paid to Berkshire Grey’s named executive officers for services rendered to Berkshire Grey’s in all capacities during the fiscal year ended December 31, 2020.
Name and principal position | Year | Salary | Bonus (1) | Stock Awards | Option Awards (2) | Non-Equity Incentive Plan Compensation (3) | Nonqualified deferred compensation earnings | All Other Compensation (4) | Total | |||||||||||||||||||||||||||
Thomas Wagner Chief Executive Officer | 2020 | $ | 341,154 | $ | — | $ | — | $ | 1,307,300 | (5) | $ | 187,500 | $ | — | $ | 11,400 | $ | 1,847,354 | ||||||||||||||||||
Steven Johnson President and Chief Operating Officer | 2020 | 300,000 | — | — | — | 150,000 | — | 6,959 | 456,959 | |||||||||||||||||||||||||||
Mark Fidler Chief Financial Officer (6) | 2020 | 113,077 | 58,333 | — | 1,441,578 | — | — | 942 | 1,613,930 | |||||||||||||||||||||||||||
| (1) | Mr. Fidler’s 2020 bonus was guaranteed as described in his offer letter. |
| (2) | Represents the aggregate grant date fair value of stock option awards computed in accordance with FASB ASC Topic 718, rather than an amount paid to or realized by the named executive officer. The value of the grants was determined by application of the Black-Sholes option-pricing model with no discount for estimated forfeitures. Key assumptions include the underlying value of the common stock, risk free rate of return, expected life of the option, expected stock price volatility and expected dividend yield. |
| (3) | Amounts shown reflect discretionary bonuses to each of Dr. Wagner and Mr. Johnson earned in 2020 with respect to the achievement of predetermined corporate and individual performance goals, as determined by Berkshire Grey’s board of directors. |
| (4) | The amounts reported represent 401(k) matching contributions made by us. |
| (5) | The fair value of option awards as set forth above includes $0, which is the aggregate grant date fair value of 500,044 stock options that will vest upon the achievement of performance criteria to be determined by Berkshire Grey’s board of directors, based on probable achievement of such criteria. Assuming maximum achievement, the grant date fair value of the performance-based stock options granted to Dr. Wagner is $0. In accordance with FASB ASC Topic 718, the fair value of these stock options will not be determinable |
82
| until such criteria are determined. The fair value of these awards is $23.4 million and was determined in July 2021 when the performance criteria for the awards was determined by Berkshire Grey’s board of directors. |
| (6) | Mr. Fidler joined Berkshire Grey on September 1, 2020. |
Narrative Disclosure to Summary Compensation Table
The amounts provided above were paid pursuant to the terms of each named executive officer’s employment agreement or offer letter, in each case, as described below.
Thomas Wagner.
at-will
employment. Dr. Wagner’s current annual base salary is $375,000, which is subject to annual review and increase, and he is eligible for cash bonuses from time to time as determined by Berkshire Grey’s board of directors. Dr. Wagner is eligible to participate in the employee benefit plans available to Berkshire Grey’s employees, subject to the terms of those plans. As a condition to the Wagner Employment Agreement, Dr. Wagner is subject to Berkshire Grey’s Employee Restrictions and Proprietary Information Agreement.Pursuant to the Wagner Employment Agreement, as amended, in the event that Dr. Wagner’s employment is terminated by Berkshire Grey without “cause” (and other than due to Dr. Wagner’s death or “disability”) (as such terms are defined in the Wagner Employment Agreement), subject to the execution and effectiveness of a general release of claims, he will be entitled to receive six months of base salary and benefits continuation. In addition, Dr. Wagner’s options are subject to full accelerated vesting if Dr. Wagner’s employment is terminated by Berkshire Grey without “cause” (and other than due to Dr. Wagner’s death or “disability”) (as such terms are defined in the Wagner Employment Agreement) within three months preceding and 12 months following certain liquidity events of Berkshire Grey.
Steven Johnson.
at-will
employment. Mr. Johnson’s current annual base salary is $300,000, which is subject to annual review and increase, and he is eligible for an annual bonus with a target amount equal to 50% of his base salary. In addition, pursuant to the Johnson Employment Agreement, Mr. Johnson purchased 1,191,871 restricted Berkshire Grey common shares, or the “Johnson Shares,” with a promissory note and pledge agreement, which note and pledge agreement were satisfied in exchange for vested shares of Berkshire Grey Common Stock prior to the closing of the Business Combination. The Johnson Shares are subject time- and performance-based vesting, such that 50% of the Johnson Shares shall vest over four years, subject to Mr. Johnson’s continued service with Berkshire Grey and the remaining 50% shall vest upon the achievement of certain Berkshire Grey performance conditions. Mr. Johnson was also eligible for reimbursement by Berkshire Grey of up to $10,000 in attorney’s fees incurred in connection with the negotiation of the Johnson Employment Agreement and is also eligible to participate in the employee benefit plans available to Berkshire Grey employees, subject to the terms of those plans. As a condition to the Johnson Employment Agreement, Mr. Johnson is subject to Berkshire Grey’sNon-Competition,
Non-Solicitation,
Non-Disclosure
and Intellectual Property Agreement.Pursuant to the Johnson Employment Agreement, in the event that Mr. Johnson’s employment is terminated by Berkshire Grey without “cause” (and other than due to Mr. Johnson’s death or “disability”) or Mr. Johnson resigns for “good reason” (as each terms are defined in the Johnson Employment Agreement) (such termination a “qualifying termination”), subject to the execution and effectiveness of a general release of claims, he will be entitled to receive (i) twelve months of base salary continuation, (ii) a prorated amount of his annual bonus earned during the year of termination, if Berkshire Grey’s board of directors so determines to pay bonuses for such year, (iii) an amount of annual bonus with respect to the year prior to the year of termination, if Berkshire Grey’s board of directors so determines to pay bonuses for such year, he has not yet received payment of the
83
bonus for such prior year and Mr. Johnson’s employment is terminated after December 31 of such year, (iv) subject to the Mr. Johnson’s timely election to continue COBRA health coverage, continued medical coverage, fully paid by Berkshire Grey under Berkshire Grey’s medical plan until the earlier of (A) twelve months following termination or (B) Mr. Johnson’s eligibility for group medical plan benefits under any other employer’s group medical plan, and (v) the Johnson Shares that (i) would have vested over the
six-month
period following termination and (ii) are subject to time-based vesting conditions only, shall automatically vest.Pursuant to the Johnson Employment Agreement, if Mr. Johnson undergoes a qualifying termination during the period beginning three months prior to and ending 6 months following a “change of control” (as defined in the Johnson Employment Agreement), he will be eligible to receive (i) a lump sum payment equal to 12 months of his base salary, (ii) a severance bonus in an amount equal to 100% of his target annual bonus for such year, (iii) an amount of annual bonus with respect to the year prior to the year of termination, if Berkshire Grey’s board of directors so determines to pay bonuses for such year and Mr. Johnson is terminated after December 31 of such year, (iv) subject to Mr. Johnson’s timely election to continue COBRA health coverage, continued medical coverage, fully paid by Berkshire Grey under Berkshire Grey medical plan until the earlier of (A) twelve months following termination or (B) Mr. Johnson’s eligibility for group medical plan benefits under any other employer’s group medical plan, and (v) the automatic vesting acceleration of all equity awards held by him.
In the event of a change of control of Berkshire Grey, which results in Mr. Johnson receiving “parachute payments” within the meaning of Section 280G of the Internal Revenue Code subject to the applicable excise tax, the Johnson Employment Agreement requires that such payments be reduced to avoid the imposition of such excise tax, but only to the extent such reduction results in a better
after-tax
position to Mr. Johnson.Mark Fidler.
at-will
employment. Mr. Fidler’s current annual base salary is $350,000, which is subject to annual review and increase, and he is eligible for an annual bonus with a target amount equal to 50% of his base salary (but, for 2020 only, Mr. Fidler was guaranteed a bonus of $58,333.33). In addition, the Fidler Offer Letter provides for a grant of options to acquire Berkshire Grey Common Stock equal to 1.0% of the shares of common stock as of the date of grant, or the “Fidler Options.” The Fidler Options are subject to time-based vesting conditions such that 25% of the Fidler Options shall vest upon the first anniversary of the date of commencement of employment followed by equal monthly vesting for three years thereafter. Mr. Fidler is eligible to participate in the employee benefit plans available to Berkshire Grey’s employees, subject to the terms of those plans. As a condition to the Fidler Offer Letter, Mr. Fidler is subject to Berkshire Grey’s Confidential/Proprietary Information Agreement.Pursuant to the Fidler Offer Letter, in the event that Mr. Fidler’s employment is terminated by Berkshire Grey without “cause” or Mr. Fidler resigns for “good reason” (as each term is defined in the Fidler Employment Agreement), subject to the execution and effectiveness of a general release of claims, he will be entitled to receive six months of base salary and benefits continuation. In addition, the Fidler Options are subject to full accelerated vesting if Mr. Fidler’s employment is terminated by Berkshire Grey without cause or he resigns for good reason within three months preceding and 12 months following certain liquidity events of Berkshire Grey.
84
Outstanding Equity Awards at December 31, 2020
The following table sets forth certain information with respect to outstanding equity awards of Legacy Berkshire Grey held by Berkshire Grey’s named executive officers as of December 31, 2020. The market value of the shares in the following table is the fair value of such shares at December 31, 2020.
Option Awards | Stock Awards | |||||||||||||||||||||||||||||||||||||||
Name | Date of Grant | Number of Securities Underlying Unexercised Options (#) Exercisable | Number of Securities Underlying Unexercised Options (#) Unexercisable | Equity Incentive Plan Awards: Number of Securities Underlying Unexercised Unearned Options (#) | Option Exercise Price ($) | Option Expiration Date | Number of Shares or Units of Stock That Have Not Vested (#) | Market Value of Shares or Units of Stock That Have Not Vested ($) (1) | Equity Incentive Plan Awards: Number of Unearned Shares, Units or Other Rights That Have Not Vested (#) | Equity Incentive Plan Awards: Market or Payout Value of Unearned Shares or Other Rights That Have Not Vested ($) (1) | ||||||||||||||||||||||||||||||
Thomas Wagner | 11/4/2020 | (2) | — | 346,540 | — | 6.70 | 11/4/2030 | — | — | — | — | |||||||||||||||||||||||||||||
Chief Executive Officer | 11/4/2020 | (3) | — | — | 105,653 | 6.70 | 11/4/2030 | — | — | — | — | |||||||||||||||||||||||||||||
| 12/9/2020 | (4) | — | 36,671 | — | 6.70 | 12/9/2030 | — | — | — | — | ||||||||||||||||||||||||||||||
| 12/9/2020 | (5) | — | — | 394,391 | 6.70 | 12/9/2030 | — | — | — | — | ||||||||||||||||||||||||||||||
Steven Johnson | 10/28/2019 | (6) | — | — | — | — | — | 421,909 | 5,489,036 | 595,936 | 7,753,127 | |||||||||||||||||||||||||||||
President and Chief Operating Officer | ||||||||||||||||||||||||||||||||||||||||
| Mark Fidler | 11/4/2020 | (7) | — | 422,610 | — | 6.70 | 11/4/2030 | — | — | — | — | |||||||||||||||||||||||||||||
Chief Financial Officer | ||||||||||||||||||||||||||||||||||||||||
| (1) | Market value of unvested shares is based on management’s retrospective determination of the fair market value of such shares as of December 31, 2020: $13.01. |
| (2) | The stock option is subject to time-based vesting, such that the stock options vests over four years, commencing on November 4, 2020, with 25% of the award vesting on the first anniversary of such date, followed by equal monthly vesting thereafter. In addition, the stock option is subject to automatic 100% acceleration upon a “change in control” (as defined in the stock option agreement). |
| (3) | The stock options vest at the discretion of the board of directors for achievement of performance milestones determined by the board of directors. The maximum number of options to acquire shares of stock Dr. Wagner may earn in connection with this award is 105,653. In addition, the stock option is subject to automatic 100% acceleration upon a “change in control” (as defined in the stock option agreement). |
| (4) | The stock option is subject to time-based vesting, such that the stock options vests over four years, commencing on December 9, 2020, such that 25% of the award vests upon the first anniversary of such date, followed by equal monthly vesting thereafter. In addition, the stock option is subject to automatic 100% acceleration upon a “change in control” (as defined in the stock option agreement). |
| (5) | The stock options vest at the discretion of the Board for achievement of performance milestones determined by the board of directors. The maximum number of options to acquire shares of stock Dr. Wagner may earn in connection with this award is 394,391. In addition, the stock option is subject to automatic 100% acceleration upon a change in control (as defined in the stock option agreement). |
| (6) | The restricted stock awards are subject to time- and performance-based vesting in equal parts. The time-based vesting portion the restricted stock awards vest over four years, commencing on October 28, 2019, such that 25% of the award vests upon the first anniversary of such date, followed by equal monthly vesting thereafter. The performance-based vesting portion of the awards vests upon the achievement of corporate financial performance criteria. |
| (7) | The stock option is subject to time-based vesting, such that the stock options vest over four years, commencing on September 1, 2020, such that 25% of the award vests upon the first anniversary of such date, followed by equal monthly vesting thereafter. |
85
Employee Benefits and Equity Compensation Plans
2013 Stock Option and Purchase Plan
Berkshire Grey 2013 Stock Option and Purchase Plan (the “2013 Plan”) was adopted by Berkshire Grey’s board of directors in October 2013, Berkshire Grey’s stockholders in October 2013 and amended and restated in November 2020. The 2013 Plan allows the administrator of the plan to make equity-based incentive awards to Berkshire Grey’s employees, directors, consultants and advisors.
Authorized Shares.
Administration.
Eligibility.
Options.
Other Awards.
Corporate Transactions.
Amendment.
86
Upon the effectiveness of the 2021 Plan (as defined below), no additional awards will be made under the 2013 Plan.
2021 Stock Option and Incentive Plan
The 2021 Stock Option and Incentive Plan for Berkshire Grey, Inc. (the “2021 Plan”) was approved at a special meeting of RAAC’s stockholders on July 20, 2021. The 2021 Plan is intended to (i) attract and retain the best available personnel to ensure our success and accomplish our goals; (ii) incentivize employees, directors and independent contractors with long-term equity-based compensation to align their interests with our stockholders, and (iii) promote the success of our business.
Types of Stock Awards
Share Reserve
Lapsed Awards
Eligibility
Administration
Subject to the terms of the 2021 Plan, the Plan Administrator has the authority, in its discretion, to (i) determine the time or times to grant stock awards under the 2021 Plan; (ii) select the service providers to whom stock awards may be granted under the 2021 Plan; (iii) determine the number of shares to be covered by
87
each stock award granted under the 2021 Plan; (iv) approve forms of stock award agreements for use under the 2021 Plan; (v) determine and modify, from time to time, the terms and conditions, not inconsistent with the terms of the 2021 Plan, of any stock award granted thereunder; (vi) institute and determine the terms and conditions of an exchange program under the terms of the 2021 Plan (subject to stockholder approval); (vii) construe and interpret the terms of the 2021 Plan and stock awards granted pursuant to the 2021 Plan; (viii) decide all disputes arising in connection with the 2021 Plan; (ix) prescribe, amend and rescind rules and regulations relating to the 2021 Plan; (x) modify or amend each stock award (subject to the terms of the 2021 Plan); (xi) supervise the administration of the 2021 Plan; (xii) allow participants to satisfy tax withholding obligations in such manner as prescribed in the 2021 Plan; (xiii) extend at any time the period in which stock options may be exercised (subject to the terms of the 2021 Plan); (xiv) accelerate at any time the exercisability or vesting of all or any portion of any stock award; and (xv) make all other determinations deemed necessary or advisable for administering the 2021 Plan.
Stock Options
The term of each stock option will be stated in the stock award agreement. In the case of an incentive stock option, the term will be 10 years from the date of grant or such shorter term as may be provided in the stock award agreement. Moreover, in the case of an incentive stock option granted to a participant who owns stock representing more than 10% of the total combined voting power of all classes of our stock or the stock of any of our affiliates, the term of the incentive stock option will be 5 years from the date of grant or such shorter term as may be provided in the stock award agreement.
The per share exercise price for the shares to be issued pursuant to exercise of a stock option will be determined by the Plan Administrator, subject to the following: in the case of an incentive stock option (i) granted to an employee who, at the time the incentive stock option is granted, owns stock representing more than 10% of the voting power of all classes of our stock or the stock of any of our affiliates, the per share exercise price will be no less than 110% of the fair market value per share on the date of grant; and (ii) granted to any other employee, the per share exercise price will be no less than 100% of the fair market value per share on the date of grant. In the case of a nonstatutory stock option, the per share exercise price will be no less than 100% of the fair market value per share on the date of grant. Notwithstanding the foregoing, stock options may be granted with a per share exercise price of less than 100% of the fair market value per share on the date of grant (i) if such stock option is otherwise compliant with Section 409A of the Internal Revenue Code, (ii) if the option recipient is not subject to U.S. income tax on the date of grant or (iii) pursuant to a corporate reorganization, liquidation, etc., described in, and in a manner consistent with, Section 424(a) of the Internal Revenue Code.
At the time a stock option is granted, the Plan Administrator will fix the period within which the stock option may be exercised and will determine any conditions that must be satisfied before the stock option may be exercised. The Plan Administrator will also determine the acceptable form of consideration for exercising a stock option, including the method of payment. In the case of an incentive stock option, the Plan Administrator will determine the acceptable form of consideration at the time of grant.
If a participant ceases to be a service provider other than for “Cause” (as defined in the stock award agreement), the participant may exercise his or her stock option within such period of time as is specified in the stock award agreement to the extent that the stock option is vested on the date of termination (but in no event later than the expiration of the term of such stock option). In the absence of a specified time in the stock award agreement, to the extent vested as of a participant’s termination, the stock option will remain exercisable for 12 months following a termination for death or disability (as determined by the Plan Administrator), and three
88
months following a termination for any other reason. Any outstanding stock option (including any vested portion thereof) held by a participant will immediately terminate in its entirety upon the participant being first notified of his or her termination for Cause and the participant will be prohibited from exercising his or her stock option from and after the date of such termination.
Stock Appreciation Rights (SARs)
Restricted Stock and RSUs
Unrestricted Stock Awards
Outside Director Limitations
non-employee
director (calculating the value of any such stock awards based on the grant date fair value of such stock awards for financial reporting purposes), provided, however that such limit shall be $1,000,000 in anynon-employee
director’s first year of service as anon-employee
director.Leaves of Absence/Transfer Between Locations
Nontransferability of Stock Awards
89
Clawback/Recovery
Adjustment
non-cash
assets are distributed with respect to such shares of stock or other securities, or, if, as a result of any merger or consolidation, sale of all or substantially all of the assets of Berkshire Grey, the outstanding shares of stock are converted into or exchanged for securities of Berkshire Grey or any successor entity (or a parent or subsidiary thereof), the Plan Administrator, in order to prevent dilution, diminution or enlargement of the benefits or potential benefits intended to be made available under the 2021 Plan, will, in such manner as it may deem equitable, adjust the number, kind and class of securities that may be delivered under the 2021 Plan, the number, class, kind and price of securities covered by each outstanding stock award and/or the repurchase or exercise prices (as applicable) of such stock awards; provided that all such adjustments will be made in a manner that does not result in taxation under Section 409A of the Internal Revenue Code.Corporate Transaction
Amendment, Termination and Duration of the 2021 Plan
90
Employee Benefit Plans
Berkshire Grey’s named executive officers are eligible to participate in Berkshire Grey’s employee benefit plans, including Berkshire Grey’s medical, dental, vision, group life and accidental death and dismemberment insurance plans, in each case, on the same basis as all of Berkshire Grey’s other employees. Berkshire Grey also maintains a 401(k) plan for the benefit of its eligible employees, including the named executive officers, as discussed in the section “.”
401(k) plan
401(k) Plan
Berkshire Grey maintains a 401(k) retirement savings plan, or the 401(k) Plan, that provides eligible U.S. employees with an opportunity to save for retirement on a
tax-advantaged
basis. Under the 401(k) Plan, eligible employees may defer eligible compensation subject to applicable annual contribution limits imposed by the Internal Revenue Service. Berkshire Grey’s employees’pre-tax
contributions are allocated to each participant’s individual account and participants are immediately and fully vested in their contributions. The 401(k) Plan is intended to be qualified under Section 401(a) of the Internal Revenue Code with the 401(k) Plan’s related trust intended to be tax exempt under Section 501(a) of the Internal Revenue Code. Berkshire Grey makes matching contributions to eligible participants equal to the first 4% of the participants’ contributions.Director Compensation
The following table presents the total compensation for each person who served as a
non-employee
member of Berkshire Grey’s board of directors during the year ended December 31, 2020. Other than as set forth in the table and described more fully below, we did not pay any compensation, make any equity awards ornon-equity
awards to, or pay any other compensation to any of thenon-employee
members of Berkshire Grey’s board of directors in 2020 for their services as members of the board of directors.Name | Fees Earned or Paid in Cash ($) | Stock Awards ($) | Option Awards ($) | Non-Equity Incentive Plan Compensation ($) | Nonqualified Deferred Compensation Earnings ($) | All Other Compensation ($) | Total ($) | |||||||||||||||||||||
Peter Barris | — | — | — | — | — | — | — | |||||||||||||||||||||
Sven Strohband | — | — | — | — | — | — | — | |||||||||||||||||||||
Kenichi Yoshida | — | — | — | — | — | — | — | |||||||||||||||||||||
We expect our board of directors to adopt a director compensation program that entitles our
non-employee
directors to a cash retainer for service on the board of directors and for service on each committee on which the director is a member. We expect the chairman of each committee to be entitled to higher retainers for such service. We expect these fees will be payable in arrears in four equal quarterly installments on the last day of each quarter, provided that the amount of such payment will be prorated for any portion of such quarter that the director is not serving on our board of directors. We expect the fees payable tonon-employee
directors for service on the board of directors and for service on each committee of the board of directors on which the director is a member to be as follows:Member Annual Fee | Committee Chair Annual Fee | |||||||
Board of Directors | $ | 40,000 | $ | — | ||||
Audit Committee | $ | 10,000 | $ | 20,000 | ||||
Compensation Committee | $ | 7,500 | $ | 15,000 | ||||
Nominating and Corporate Governance Committee | $ | 5,000 | $ | 10,000 | ||||
In addition, we expect that our director compensation program will entitle each director to an annual grant of restricted stock units. We expect that the annual grant will have a grant date fair value equal to $140,000 and will vest one year from the grant date, although we expect that the initial grant upon adoption of the director
91
compensation program will have a grant date fair value equal to $280,000 and will vest quarterly over a three-year period following the grant date.
We also plan to continue to reimburse our
non-employee
directors for reasonable travel and other expenses incurred in connection with attending meetings of our board of directors and any committee of our board of directors on which he or she serves.92
CERTAIN RELATIONSHIPS AND RELATED PARTY TRANSACTIONS
Customer Contracts with Affiliates of SoftBank
In June 2019, Legacy Berkshire Grey entered into two customer contracts with SoftBank Robotics Corp., a subsidiary of Softbank Robotics Group Corp., which in turn is a subsidiary of SoftBank Group Corp. (“SBG”) and an affiliate of SVF II BG (DE), LLC (“SB SVF II”). SBG held the warrant to purchase the Series
B-3
preferred stock, par value $0.001 per share, of Legacy Berkshire Grey (the“B-3
Warrant”), and SB SVF II holds more than 5% of Legacy Berkshire Grey’s outstanding stock. For the years ended December 31, 2020 and 2019, Legacy Berkshire Grey recognized approximately $9.8 million and $4.8 million in revenue related to these customer contracts, respectively.Series
B-2
Preferred Stock Financing and Warrants to Purchase SeriesB-3
Preferred StockIn June and October of 2019, Legacy Berkshire Grey sold an aggregate of 9,788,160 shares of Legacy Berkshire Grey Series
B-2
Preferred Stock and theB-3
Warrant to SBG at a purchase price of $17.8328 per share, for an aggregate purchase price of $174.6 million. Of the $174.6 million in proceeds raised, approximately $4.1 million was allocated to theB-3 Warrant,
which provided, subject to certain vesting conditions, a right to purchase up to 1,903,647 shares of Legacy Berkshire Grey SeriesB-3
Preferred Stock at an exercise price of $11.5913 per share, which was issued to SBG in connection with the Legacy Berkshire Grey SeriesB-2
Preferred Stock financing. In October of 2019, SBG also purchased 1,370,620 shares of Legacy Berkshire Grey Common Stock at a purchase price of $16.0495 per share pursuant to a tender offer. On March 31, 2021, SBG transferred its 1,370,620 shares of Berkshire Grey Common Stock and 9,788,160 shares of Berkshire Grey SeriesB-2
Preferred Stock to SB SVF II.Sponsor Support Agreement
On February 23, 2021, in connection with and concurrently with the execution of the Merger Agreement, RAAC and Legacy Berkshire Grey entered into an amended and restated letter agreement (the “Sponsor Support Agreement”) with each of the Sponsor, RAAC’s officers and directors and holders of RAAC’s Class B common stock and Class C common stock, which amended and restated the prior letter agreement between such parties (other than Legacy Berkshire Grey), dated December 7, 2020. Pursuant to the Sponsor Support Agreement, among other things, the parties thereto agreed to (i) vote all of the shares of RAAC common stock beneficially owned or held by such parties in favor of the Business Combination and certain related matters, (ii) vote all of the shares of RAAC common stock beneficially owned or held by such parties against certain other actions, including (A) any action reasonably expected to impede or result in the breach of any provision of the Merger Agreement and (B) any business combination or change in capitalization other than with respect to the Business Combination, (iii) waive anti-dilution rights provided in the RAAC charter with respect to their founder shares and alignment shares and waive their right to convert working capital loans to RAAC into warrants and (iv) not redeem or tender any of their shares of RAAC common stock in connection with any such vote as described in clauses (i) or (ii) or in connection with any vote to amend the RAAC charter.
Amended and Restated Registration Rights Agreement
In connection with the Closing, on July 21, 2021, we entered into an Amended and Restated Registration Rights Agreement (the “A&R Registration Rights Agreement”) with RAAC Management LLC, a Delaware limited liability company (the “Sponsor”) and certain other investors party thereto (collectively, with each other person who has executed and delivered a joinder thereto, the “RRA Parties”), including certain former holders of Legacy Berkshire Grey securities (the “BG RRA Parties”), pursuant to which the RRA Parties are entitled to registration rights in respect of certain shares of our Class A common stock, par value $0.0001 per share (the “Class A Common Stock”) and certain other of our equity securities that are held by the RRA Parties from time to time. This includes the shares of Class A Common Stock underlying the shares of Class C common stock, par
93
value $0.0001 per share (the “Class C Common Stock”). Such shares of Class C Common Stock are convertible to shares of Class A Common Stock upon the earlier of (i) meeting certain stock price performance thresholds, and (ii) the date on which we complete a merger, stock exchange, reorganization or other similar transaction that results in both a change of control and all of the public stockholders having the right to exchange their shares of Class A Common Stock for cash, securities or other property, in each case, on a one-for-one basis, subject to adjustment. Please see “” for more information. The A&R Registration Rights Agreement provides that we will, (i) within 30 calendar days after the consummation of the Business Combination, submit to or file with the SEC (at our sole cost and expense) a registration statement registering the resale of certain shares of the Class A Common Stock and certain other of our equity securities held by the RRA Parties (the “Resale Registration Statement”), and (ii) use our reasonable best efforts to have the Resale Registration Statement declared effective by the SEC as soon as practicable after the filing thereof, but no later than the earlier of (x) the 90th calendar day following the filing date if the SEC notifies us that it will “review” the Resale Registration Statement and (y) the 10th business day after the date we are notified by the SEC that the Resale Registration Statement will not be “reviewed” or will not be subject to further review.
Description of Our Securities—Common Stock—Conversion Rights
The A&R Registration Rights Agreement grants each of the RRA Parties and their respective permitted transferees certain demand registration rights in connection with an underwritten shelf takedown offering, in each case subject to certain offering thresholds, issuer suspension periods and certain other conditions. In addition, the A&R Registration Rights Agreement grants the RRA Parties “piggyback” registration rights, subject to customary underwriter cutbacks, issuer suspension periods and certain other conditions.
These registration rights are subject to certain customary limitations, including the right of the underwriters to limit the number of securities to be included in an underwritten offering and our right to delay or withdraw a registration statement under certain circumstances. The A&R Registration Rights Agreement includes customary indemnification provisions. The Company will bear the expenses incurred in connection with the filing of any registration statements filed pursuant to the terms of the A&R Registration Rights Agreement, including the fees of legal counsel selected by theof RRA Parties initiating a demand registration right (not to exceed $75,000 without our consent). The A&R Registration Rights Agreement also provides for a
majority-in-interest
lock-up
on registrable securities held by the BG RRA Parties so that such BG RRA Parties may not transfer such shares, except to certain permitted transferees, for 180 days following the Closing.The A&R Registration Rights Agreement will terminate on the earlier of (i) July 21, 2031 or (ii) with respect to any party thereto, on the date that such party no longer holds any registrable securities.
Indemnification Agreement
On July 21, 2021, we entered into indemnification agreements with each of our directors and executive officers. Each indemnification agreement provides for indemnification and advancements by Berkshire Grey of certain expenses and costs relating to claims, suits or proceedings arising from his or her service to Berkshire Grey or, at our request, service to other entities, as officers or directors to the maximum extent permitted by applicable law.
Procedures with Respect to Review and Approval of Related Person Transactions
Our board of directors recognizes the fact that transactions with related persons present a heightened risk of conflicts of interests (or the perception thereof). Our board of directors has adopted a written policy on transactions with related persons that is in conformity with the requirements for issuers having publicly held common stock that is listed on the Nasdaq. Under the policy, our legal department will be primarily responsible for developing and implementing processes and procedures to obtain information regarding related persons with respect to potential related person transactions and then determining, based on the facts and circumstances, whether such potential related person transactions do, in fact, constitute related person transactions requiring
94
compliance with the policy. If the legal department determines that a transaction or relationship is a related person transaction requiring compliance with the policy, our general counsel will be required to present to the audit committee of our board of directors all relevant facts and circumstances relating to the related person transaction. Our audit committee will be required to review the relevant facts and circumstances of each related person transaction, including if the transaction is on terms comparable to those that could be obtained in arm’s length dealings with an unrelated third party and the extent of the related person’s interest in the transaction, take into account the conflicts of interest and corporate opportunity provisions of our code of business conduct and ethics, and either approve or disapprove the related person transaction. If advance audit committee approval of a related person transaction requiring the audit committee’s approval is not feasible, then the transaction may be preliminarily entered into by management upon prior approval of the transaction by the chair of the audit committee, subject to ratification of the transaction by the audit committee at the audit committee’s next regularly scheduled meeting; provided, that if ratification is not forthcoming, management will make all reasonable efforts to cancel or annul the transaction. If a transaction was not initially recognized as a related person transaction, then, upon such recognition, the transaction will be presented to the audit committee for ratification at the audit committee’s next regularly scheduled meeting; provided, that if ratification is not forthcoming, management will make all reasonable efforts to cancel or annul the transaction. Our management will update the audit committee as to any material changes to any approved or ratified related person transaction and will provide a status report at least annually of all then current related person transactions. No director will be permitted to participate in approval of a related person transaction for which he or she is a related person.
95
BENEFICIAL OWNERSHIP OF SECURITIES
The following table sets forth information regarding the beneficial ownership of our common stock as of August 13, 2021 by:
| • | each person known to us to be the beneficial owner of more than 5% of our Company common stock; |
| • | each of our named executive officers and directors; and |
| • | all of our executive officers and directors as a group. |
Beneficial ownership is determined according to the rules of the SEC, which generally provide that a person has beneficial ownership of a security if he, she or it possesses sole or shared voting or investment power over that security, including options and warrants that are currently exercisable or exercisable within 60 days. Berkshire Grey stock issuable upon exercise of options and warrants currently exercisable within 60 days are deemed outstanding solely for purposes of calculating the percentage of total voting power of the beneficial owner thereof.
The beneficial ownership of our common stock is based on 222,597,413 shares of our Class A Common Stock and 5,750,000 shares of our class C common stock outstanding as of August 13, 2021.
Unless otherwise indicated, we believe that each person named in the table below has sole voting and investment power with respect to all shares of our common stock beneficially owned by them.
Class A Common Stock | Class C Common Stock (2) | |||||||||||||||
Name and Address of Beneficial Owner (1) | Number of Shares | Percentage of Class Outstanding | Number of Shares | Percentage of Class | ||||||||||||
5% Holders (Other than Directors and Named Executive Officer) | ||||||||||||||||
RAAC Management (the Sponsor) (3) | 3,735,333 | 1.68 | % | 5,628,000 | 97.88 | % | ||||||||||
Entities Affiliated with Khosla Ventures (4) | 56,567,914 | 25.41 | % | — | — | |||||||||||
Entities Affiliated with New Enterprise Associates (5) | 38,226,621 | 17.17 | % | — | — | |||||||||||
Canaan X, L.P. (6) | 14,302,523 | 6.437 | % | — | — | |||||||||||
SVF II BG (DE) LLC (7) | 65,567,317 | 29.46 | % | — | — | |||||||||||
Directors and Named Executive Officers | ||||||||||||||||
Thomas Wagner (8) | 6,198,141 | 2.78 | % | — | — | |||||||||||
Steve Johnson (9) | 5,979,436 | 2.69 | % | — | — | |||||||||||
Mark Fidler 10) | 620,818 | * | — | — | ||||||||||||
Peter Barris (11) | — | — | — | — | ||||||||||||
Sven Strohband (4) | 56,567,920 | 25.41 | % | — | — | |||||||||||
Fiona P. Dias | — | — | — | — | ||||||||||||
Serena Wolfe | — | — | — | — | ||||||||||||
John K. Delaney (3) | 3,735,333 | 1.68 | % | 5,628,000 | 97.88 | % | ||||||||||
All current directors and executive officers as a group (8 individuals) | 73,101,648 | 32.84 | % | 5,628,000 | 97.88 | % | ||||||||||
| * | Less than 1%. |
| (1) | Unless otherwise noted, the business address of each of the following entities or individuals is c/o Berkshire Grey, Inc., 140 South Road, Bedford, Massachusetts 01730. |
| (2) | The shares of Class C common stock will automatically convert into shares of Class A Common Stock upon the earlier of (i) meeting certain stock price performance thresholds, and (ii) the date on which we complete |
96
| a merger, stock exchange, reorganization or other similar transaction that results in both a change of control and all of the public stockholders having the right to exchange their shares of Class A Common Stock for cash, securities or other property, in each case, on a one-for-one |
| (3) | RAAC Management LLC, the Sponsor, is the record holder of the 3,735,333 shares of Class A Common Stock and the 5,628,000 shares of Class C common stock reported herein. The members of the Sponsor are Acceleration Capital Management LLC (“ACM”) and Revolution Special Opportunities LLC (“RSO”). John K. Delaney is the managing member of ACM. The members of the Sponsor elect and remove its managers. By virtue of control over our sponsor, Mr. Delaney may be deemed to beneficially own shares held by our sponsor. |
| (4) | Consists of (a) 33,981,955 shares held by Khosla Ventures Seed B, LP, (b) 1,928,958 shares held by Khosla Ventures Seed B (CF), LP, and (c) 20,657,001 shares held by Khosla Ventures V, LP. Dr. Strohband is a Partner and Managing Director at Khosla Ventures and may be deemed to have beneficial ownership with respect to these shares. The address for these entities is 2128 Sand Hill Road, Menlo Park, CA 94025. |
| (5) | Consists of (a) 38,183,023 shares held by New Enterprise Associates 15, L.P. (NEA 15) and (b) 43,598 shares held by NEA Ventures 2016, L.P. (Ven 2016). The shares directly held by NEA 15 are indirectly held by NEA Partners 15, L.P. (NEA Partners 15) the sole general partner of NEA 15, NEA 15 GP, LLC (NEA 15 LLC) the sole general partner of NEA Partners 15 and each of the individual managers of NEA 15 LLC. The individual managers (the Managers) of NEA 15 LLC are Forest Baskett, Anthony A. Florence, Jr., Mohamad Makhzoumi, Joshua Makower, Scott D. Sandell and Peter Sonsini. The shares directly held by Ven 2016 are indirectly held by Karen P. Welsh, the general partner of Ven 2016. NEA Partners 15, NEA 15 LLC and the Managers share voting and dispositive power with regard to the shares held by NEA 15. Karen P. Welsh shares voting and dispositive power with regard to the shares held by Ven 2016. All indirect holders of the above referenced shares disclaim beneficial ownership of all applicable shares, except to the extent of their actual pecuniary interest therein. The address for these entities is 1954 Greenspring Drive, Suite 600, Timonium, MD 21093. |
| (6) | Consists of 14,302,523 shares of Class A Common Stock held by Canaan X, L.P. The address for this entity is 285 Riverside Avenue, Suite 250, Westport, CT 06880. |
| (7) | Consists of 65,567,317shares held by SVF II BG (DE) LLC. Entities affiliated with SVF II BG (DE) LLC, whose shares are aggregated for the purposes of reporting ownership information, include SVF II Holdings (DE) L.P., SVF II Aggregator (Jersey) L.P. and SoftBank Vision Fund II-2 L.P (“SoftBank Vision Fund II”). SB Investment Advisers (UK) Limited, or SBIA UK, has been appointed as alternative investment fund manager (“AIFM”) and is exclusively responsible for managing SoftBank Vision Fund II in accordance with the Alternative Investment Fund Managers Directive and is authorized and regulated by the UK Financial Conduct Authority accordingly. As AIFM of SoftBank Vision Fund II, SBIA UK is exclusively responsible for making all final decisions related to the acquisition, structuring, financing, voting and disposal of SoftBank Vision Fund II’s investments, including as held by SVF II BG (DE) LLC. The address for this entity is c/o SB Investment Advisers (US) Inc., 1 Circle Star Way, 2F, San Carlos, CA 94070. |
| (8) | Consists of 4,709,752 shares and 1,488,389 stock options that will vest within 60 days of August 13, 2021 held directly by Dr. Wagner. |
| (9) | Includes 2,477,805 shares of restricted stock subject to time-based vesting and 3,498,631 shares of restricted stock subject to performance-based vesting. |
| (10) | Consists of 620,798 stock options that will vest within 60 days of August 13, 2021 held directly by Mr. Fidler. |
| (11) | Excludes the shares referenced in footnote (5) above because, while Mr. Barris is the Chairman at New Enterprise Associates, Mr. Barris does not have voting or dispositive power over any of the shares directly held by NEA 15 or Ven 2016 referenced in footnote (5) above. |
97
SELLING SECURITYHOLDERS
The Selling Securityholders listed in the table below may from time to time offer and sell any or all of the shares of Class A common stock and Private Placement Warrants set forth below pursuant to this prospectus. When we refer to the “Selling Securityholders” in this prospectus, we refer to the persons listed in the table below, and the pledgees, donees, transferees, assignees, successors and other permitted transferees that hold any of the Selling Securityholders’ interest in the shares of Class A common stock and Private Placement Warrants after the date of this prospectus.
The following table sets forth information concerning the shares of Class A common stock and warrants that may be offered from time to time by each Selling Securityholder. The number of shares and warrants beneficially owned by each Selling Securityholder is determined under rules issued by the SEC. Under these rules, beneficial ownership includes any shares as to which the individual or entity has sole or shared voting power or investment power. Percentage ownership of the Class A common stock is based on 222,597,413 shares of Class A common stock outstanding as of August 13, 2021, and percentage ownership of the warrants is based on 14,750,000 warrants outstanding as of August 13, 2012. In computing the number of shares beneficially owned by an individual or entity and the percentage ownership of that person, shares of Class A common stock subject to options, warrants or other rights held by such person that are currently exercisable or will become exercisable within 60 days of August 13, 2021 are considered outstanding, although these shares are not considered outstanding for purposes of computing the percentage ownership of any other person. Each of the Selling Securityholders listed has sole voting and investment power with respect to the shares or warrants beneficially owned by the Selling Securityholder unless noted otherwise, subject to community property laws where applicable.
The following table sets forth certain information provided by or on behalf of the Selling Securityholders concerning the Class A common stock and warrants that may be offered from time to time by each Selling Securityholder pursuant to this prospectus. The Selling Securityholders identified below may have sold, transferred or otherwise disposed of all or a portion of their securities after the date on which they provided us with information regarding their securities. Any changed or new information given to us by the Selling Securityholders, including regarding the identity of, and the securities held by, each Selling Securityholder, will be set forth in a prospectus supplement or amendments to the registration statement of which this prospectus is a part, if and when necessary. A Selling Securityholder may sell all, some or none of such securities in this offering. See “Plan of Distribution.”
Certain of the selling securityholders in the following table are our employees.
Shares Beneficially Owned Prior to the Offering | Number of Shares Being Offered | Shares Beneficially Owned After the Offering | Warrants Beneficially Owned Prior to the Offering | Number of Warrants Being Offered | Warrants Beneficially Owned After the Offering | |||||||||||||||||||||||||||||||||||
Name of Selling Stockholder | Number | Percentage | Number | Percentage | Number | Percentage | Number | Percentage | ||||||||||||||||||||||||||||||||
RAAC Management LLC (1) | 14,530,000 | 6.5 | % | 14,530,000 | — | — | 5,166,667 | 35.0 | % | 5,166,667 | — | — | ||||||||||||||||||||||||||||
Entities Affiliated with Khosla Ventures (2) | 56,567,914 | 25.4 | % | 56,567,914 | — | — | — | — | — | — | — | |||||||||||||||||||||||||||||
Entities Affiliated with New Enterprise Associates (3) | 38,226,621 | 17.2 | % | 38,226,621 | — | — | — | — | — | — | — | |||||||||||||||||||||||||||||
Canaan X, L.P. (4) | 14,302,523 | 6.4 | % | 14,302,523 | — | — | — | — | — | — | — | |||||||||||||||||||||||||||||
SVF II BG (DE) LLC (5) | 65,567,317 | 29.5 | % | 65,567,317 | — | — | — | — | — | — | — | |||||||||||||||||||||||||||||
Thomas Wagner | 6,198,199 | 2.8 | % | 4,709,752 | 1,488,447 | * | — | — | — | — | — | |||||||||||||||||||||||||||||
Ghisallo Master Fund LP (6) | 800,000 | * | 800,000 | — | — | — | — | — | — | — | ||||||||||||||||||||||||||||||
Suvretta Long Master Fund, LTD. (7) | 1,000 | * | 1,000 | — | — | — | — | — | — | — | ||||||||||||||||||||||||||||||
Suvretta Master Fund, LTD. (8) | 199,000 | * | 199,000 | — | — | — | — | — | — | — | ||||||||||||||||||||||||||||||
98
Shares Beneficially Owned Prior to the Offering | Number of Shares Being Offered | Shares Beneficially Owned After the Offering | Warrants Beneficially Owned Prior to the Offering | Number of Warrants Being Offered | Warrants Beneficially Owned After the Offering | |||||||||||||||||||||||||||||||||||
Name of Selling Stockholder | Number | Percentage | Number | Percentage | Number | Percentage | Number | Percentage | ||||||||||||||||||||||||||||||||
Alberta Investment Management Corporation (9) | 200,000 | * | 200,000 | — | — | — | — | — | — | — | ||||||||||||||||||||||||||||||
Alyeska Master Fund, L.P. (10) | 600,000 | * | 600,000 | — | — | — | — | — | — | — | ||||||||||||||||||||||||||||||
Athanor International Master Fund, LP (11) | 188,900 | * | 188,900 | — | — | — | — | — | — | �� | ||||||||||||||||||||||||||||||
Athanor Master Fund, LP (12) | 811,100 | * | 811,100 | — | — | — | — | — | — | — | ||||||||||||||||||||||||||||||
BlackRock, Inc. (13) | 1,700,000 | * | 1,700,000 | — | — | — | — | — | — | — | ||||||||||||||||||||||||||||||
Brookdale Global Opportunity Fund (14) | 296,000 | * | 296,000 | — | — | — | — | — | — | — | ||||||||||||||||||||||||||||||
Brookdale International Partners, L.P. (15) | 504,000 | * | 504,000 | — | — | — | — | — | — | — | ||||||||||||||||||||||||||||||
Chachacha 2019 Trust DTD 9/20/2019 (16) | 3,935,000 | 1.8 | % | 3,935,000 | — | — | — | — | — | — | — | |||||||||||||||||||||||||||||
GoldenTree Asset Management LP, as investment advisor to Crown Managed Accounts SPC – Crown/Goldentree Segregated Portfolio (17) | 22,850 | * | 22,850 | — | — | — | — | — | — | — | ||||||||||||||||||||||||||||||
Entities affiliated with Diameter Capital Partners LP (18) | 300,000 | * | 300,000 | — | — | 297,289 | 2.0 | % | — | 297,289 | 2.0 | % | ||||||||||||||||||||||||||||
GoldenTree Asset Management LP, as investment advisor to Goldentree Master Fund, LTD. (19) | 853,905 | * | 853,905 | — | — | — | — | — | — | — | ||||||||||||||||||||||||||||||
GoldenTree Asset Management LP, as investment advisor to GoldenTree Multi Sector-C, LP(20) | 7,120 | * | 7,120 | — | — | — | — | — | — | — | ||||||||||||||||||||||||||||||
GoldenTree Asset Management LP, as investment advisor to GoldenTree V1 Master Fund, LP (21) | 35,700 | * | 35,700 | — | — | — | — | — | — | — | ||||||||||||||||||||||||||||||
Hedosophia Public Investments Limited (22) | 2,000,000 | * | 2,000,000 | — | — | — | — | — | — | — | ||||||||||||||||||||||||||||||
GoldenTree Asset Management LP, as investment advisor to Gingko Tree, LLC (23) | 52,065 | * | 52,065 | — | — | — | — | — | — | — | ||||||||||||||||||||||||||||||
GoldenTree Asset Management LP, as investment advisor to Guadalupe Fund, LP (24) | 9,560 | * | 9,560 | — | — | — | — | — | — | — | ||||||||||||||||||||||||||||||
Integrated Core Strategies (US) LLC (25) | 400,000 | * | 400,000 | — | — | — | — | — | — | — | ||||||||||||||||||||||||||||||
GoldenTree Asset Management LP, as investment advisor to Louisiana State Employees’ Retirement System (26) | 11,485 | * | 11,485 | — | — | — | — | — | — | — | ||||||||||||||||||||||||||||||
MA Multi-Sector Opportunistic Fund, LP (27) | 7,315 | * | 7,315 | — | — | — | — | — | — | — | ||||||||||||||||||||||||||||||
MWIS – Market Neutral Tops Fund (28) | 25,370 | * | 25,370 | — | — | — | — | — | — | — | ||||||||||||||||||||||||||||||
MMF LT, LLC (29) | 500,000 | * | 500,000 | — | — | 100,000 | * | — | 100,000 | * | ||||||||||||||||||||||||||||||
MWIS – Eureka Fund (30) | 251,865 | * | 251,865 | — | — | — | — | — | — | — | ||||||||||||||||||||||||||||||
MWIS – Systematic Alpha Plus Fund (31) | 7,250 | * | 7,250 | — | — | — | — | — | — | — | ||||||||||||||||||||||||||||||
MWIS – Tops Fund (32) | 15,515 | * | 15,515 | — | — | — | — | — | — | — | ||||||||||||||||||||||||||||||
Connor Nowinski | 5,000 | * | 5,000 | — | — | — | — | — | — | — | ||||||||||||||||||||||||||||||
PBCAY One Limited (33) | 93,590 | * | 93,590 | — | — | — | — | — | — | — | ||||||||||||||||||||||||||||||
Riverview Group LLC (34) | 100,000 | * | 100,000 | — | — | — | — | — | — | — | ||||||||||||||||||||||||||||||
Justin Saslaw | 5,000 | * | 5,000 | — | — | — | — | — | — | — | ||||||||||||||||||||||||||||||
99
Shares Beneficially Owned Prior to the Offering | Number of Shares Being Offered | Shares Beneficially Owned After the Offering | Warrants Beneficially Owned Prior to the Offering | Number of Warrants Being Offered | Warrants Beneficially Owned After the Offering | |||||||||||||||||||||||||||||||||||
Name of Selling Stockholder | Number | Percentage | Number | Percentage | Number | Percentage | Number | Percentage | ||||||||||||||||||||||||||||||||
Schonfeld Strategic 460 Fund LLC (35) | 200,000 | * | 200,000 | — | — | — | — | — | — | — | ||||||||||||||||||||||||||||||
Steven Trieu Living Trust DTD 4.3.12 (36) | 50,000 | * | 50,000 | — | — | — | — | — | — | — | ||||||||||||||||||||||||||||||
Ravikant Tanuku (37) | 5,000 | * | 5,000 | — | — | — | — | — | — | — | ||||||||||||||||||||||||||||||
TCIM Opportunities I LTD. (33) | 200,093 | * | 200,093 | — | — | — | — | — | — | — | ||||||||||||||||||||||||||||||
Toms Capital Investments LLC (33) | 206,317 | * | 206,317 | — | — | — | — | — | — | — | ||||||||||||||||||||||||||||||
Washington Harbour Capital Master Fund, LP (38) | 960,000 | * | 960,000 | — | — | — | — | — | — | — | ||||||||||||||||||||||||||||||
Washington Harbour Capital Long Only Master Fund, LP (38) | 40,000 | * | 40,000 | — | — | — | — | — | — | — | ||||||||||||||||||||||||||||||
XN Exponent Master Fund LP (39) | 900,000 | * | 900,000 | — | — | — | — | — | — | — | ||||||||||||||||||||||||||||||
Steven A. Musele (40) | 40,000 | * | 40,000 | — | — | — | — | — | — | — | ||||||||||||||||||||||||||||||
Phyllis R. Caldwell (40) | 40,000 | * | 40,000 | — | — | — | — | — | — | — | ||||||||||||||||||||||||||||||
Jason M. Fish (40) | 40,000 | * | 40,000 | — | — | — | — | — | — | — | ||||||||||||||||||||||||||||||
Andrew Wallace (41) | 100,000 | * | 100,000 | — | — | — | — | — | — | — | ||||||||||||||||||||||||||||||
| * | less than 1%. |
| (1) | Includes 3,735,333 shares of Class A Common Stock, 5,628,000 shares of Class A Common Stock underlying shares of Class C Common Stock, 5,166,667 Private Placement Warrants, each of which entitles the holder to purchase one share of Class A Common Stock, and the 5,166,667 shares of Class A Common Stock issuable upon exercise of such Private Placement Warrants. The members of the Sponsor are Acceleration Capital Management LLC (“ACM”) and Revolution Special Opportunities LLC (“RSO”). John K. Delaney is the managing member of ACM and Stephen M. Case is the managing member of RSO. The members of the Sponsor elect and remove its managers. By virtue of control over our sponsor, each of Mr. Delaney, Mr. Case, RSO and ACM may be deemed to beneficially own shares held by our sponsor. The address of these entities is 1717 Rhode Island Avenue, NW 10th floor, Washington, D.C. 20036. |
| (2) | Consists of (a) 33,981,955 shares held by Khosla Ventures Seed B, LP, (b) 1,928,958 shares held by Khosla Ventures Seed B (CF), LP, and (c) 20,657,001 shares held by Khosla Ventures V, LP. Dr. Strohband is a Partner and Managing Director at Khosla Ventures and may be deemed to have beneficial ownership with respect to these shares. The address for these entities is 2128 Sand Hill Road, Menlo Park, CA 94025. |
| (3) | Consists of (a) 38,183,023 shares held by New Enterprise Associates 15, L.P. (NEA 15) and (b) 43,598 shares held by NEA Ventures 2016, L.P. (Ven 2016). The shares directly held by NEA 15 are indirectly held by NEA Partners 15, L.P. (NEA Partners 15) the sole general partner of NEA 15, NEA 15 GP, LLC (NEA 15 LLC) the sole general partner of NEA Partners 15 and each of the individual managers of NEA 15 LLC. The individual managers (the Managers) of NEA 15 LLC are Forest Baskett, Anthony A. Florence, Jr., Mohamad Makhzoumi, Joshua Makower, Scott D. Sandell and Peter Sonsini. The shares directly held by Ven 2016 are indirectly held by Karen P. Welsh, the general partner of Ven 2016. NEA Partners 15, NEA 15 LLC and the Managers share voting and dispositive power with regard to the shares held by NEA 15. Karen P. Welsh shares voting and dispositive power with regard to the shares held by Ven 2016. All indirect holders of the above referenced shares disclaim beneficial ownership of all applicable shares, except to the extent of their actual pecuniary interest therein. The address for these entities is 1954 Greenspring Drive, Suite 600, Timonium, MD 21093. |
| (4) | Consists of 14,302,523 shares of Class A Common Stock held by Canaan X, L.P. The address for this entity is 285 Riverside Avenue, Suite 250, Westport, CT 06880. |
| (5) | Consists of 65,567,317 shares held by SVF II BG (DE) LLC. Entities affiliated with SVF II BG (DE) LLC, whose shares are aggregated for the purposes of reporting ownership information, include SVF II Holdings (DE) L.P., SVF II Aggregator (Jersey) L.P. and SoftBank Vision Fund II-2 L.P (“SoftBank Vision Fund II”). SB Investment Advisers (UK) Limited, or SBIA UK, has been appointed as alternative investment fund manager (“AIFM”) and is exclusively responsible for managing SoftBank Vision Fund II in accordance with the Alternative Investment Fund Managers Directive and is authorized and regulated by the UK |
100
| Financial Conduct Authority accordingly. As AIFM of SoftBank Vision Fund II, SBIA UK is exclusively responsible for making all final decisions related to the acquisition, structuring, financing, voting and disposal of SoftBank Vision Fund II’s investments, including as held by SVF II BG (DE) LLC. The address for this entity is c/o SB Investment Advisers (US) Inc., 1 Circle Star Way, 2F, San Carlos, CA 94070. |
| (6) | The principal business address of the entity is 27 HOSPITAL ROAD, GRAND CAYMAN KY1-9008, CAYMAN ISLANDS. |
| (7) | Aaron Cowen is the control person of Suvretta Capital Management, LLC, the investment manager of Suvretta Long Master Fund, Ltd, and the principal business address of the entity is 540 Madison Ave., Floor 7, New York, NY 10022-3213. |
| (8) | Aaron Cowen is the control person of Suvretta Capital Management, LLC, the investment manager of Suvretta Master Fund, Ltd., and the principal business address of the entity is 540 Madison Ave., Floor 7, New York, NY 10022-3213. |
| (9) | The principal business address of the entity is 1600-10250 101 ST NW, EDMONTON AB T5J 3P4, CANADA. |
| (10) | Alyeska Investment Group, L.P., the investment manager of Alyeska Master Fund, L.P. (the “Selling Securityholder”), has voting and investment control of the shares held by the Selling Securityholder. Anand Parekh is the Chief Executive Officer of Alyeska Investment Group, L.P. and may be deemed to be the beneficial owner of such shares. Mr. Parekh, however, disclaims any beneficial ownership of the shares held by the Selling Securityholder. The registered address of Alyeska Master Fund, L.P. is at c/o Maples Corporate Services Limited, P.O. Box 309, Ugland House, South Church Street George Town, Grand Cayman, KY1-1104, Cayman Islands. Alyeska Investment Group, L.P. is located at 77 W. Wacker, Suite 700, Chicago IL 60601. |
| (11) | The principal business address of the entity is C/O ANTHANOR CAPITAL, LP, 888 SEVENTH AVENUE, 21ST FLOOR, NEW YORK NY 10019. |
| (12) | The principal business address of the entity is C/O ANTHANOR CAPITAL, LP, 888 SEVENTH AVENUE, 21ST FLOOR, NEW YORK NY 10019. |
| (13) | The registered holders of the referenced shares to be registered are the following funds and accounts under management by subsidiaries of BlackRock, Inc.: BlackRock Science and Technology Trust; BlackRock Science and Technology Trust II; BlackRock Strategic Income Opportunities Portfolio of BlackRock Funds V; BlackRock Global Allocation Fund, Inc.; BlackRock Global Funds – Global Allocation Fund; BlackRock Global Allocation V.I. Fund of BlackRock Variable Series Funds, Inc.; BlackRock Global Allocation Portfolio of BlackRock Series Fund, Inc.; BlackRock Global Allocation Collective Fund; BlackRock Global Funds – Global Dynamic Equity Fund; BlackRock Capital Allocation Trust; and BlackRock Global Long/Short Credit Fund of BlackRock Funds IV. BlackRock, Inc. is the ultimate parent holding company of such subsidiaries. On behalf of such subsidiaries, the applicable portfolio managers, as managing directors (or in other capacities) of such entities, and/or the applicable investment committee members of such funds and accounts, have voting and investment power over the shares held by the funds and accounts which are the registered holders of the referenced shares. Such portfolio managers and/or investment committee members expressly disclaim beneficial ownership of all shares held by such funds and accounts. The addresses of such funds and accounts, such subsidiaries and such portfolio managers and/or investment committee members are 55 East 52nd Street, New York, NY 10055 and 400 Howard Street, San Francisco CA 94105. Shares shown include only the securities being registered for resale and may not incorporate all shares deemed to be beneficially held by the registered holders or BlackRock, Inc. |
| (14) | Andrew Weiss is Manager of WAM GP LLC, which is the general partner of Weiss Asset Management LP, the investment manager of Brookdale Global Opportunity Fund (“BGO”). Andrew Weiss, WAM GP LLC, BGO and Weiss Asset Management LP each disclaim beneficial ownership over the Shares except to the extent of their pecuniary interests therein. The principal business address of this entity is c/o Weiss Asset Management LP, 222 Berkeley St., 16th Floor, Boston, MA 02116. |
| (15) | Andrew Weiss is Manager of WAM GP LLC, which is the general partner of Weiss Asset Management LP, the investment manager of Brookdale International Partners, L.P (“BIP”). WAM GP LLC is also the Manager of BIP GP LLC, the general partner of BIP. Andrew Weiss, WAM GP LLC, Weiss Asset Management LP, BIP and BIP GP LLC each disclaim beneficial ownership over the Shares except to the |
101
| extent of their pecuniary interests therein. The principal business address of this entity is c/o Weiss Asset Management LP, 222 Berkeley St., 16th Floor, Boston, MA 02116. |
| (16) | The principle business address of the entity is C/O ICONIQ CAPITAL, 394 PACIFIC AVE FL 2, SAN FRANCISCO CA 94111-1715. |
| (17) | Steven A. Tananbaum is the Chief Investment Officer of GoldenTree Asset Management LP, the investment advisor to Crown Managed Accounts SPC - Crown/GoldenTree Segregated Portfolio. As a result, Mr. Tananbaum may be deemed to be the beneficial owner of these shares. Notwithstanding the foregoing, Mr. Tananbaum disclaims any such beneficial ownership except to the extent of any pecuniary interest. The principal business address of GoldenTree Asset Management LP is 300 Park Avenue, 21st Floor, New York, New York 10022. |
| (18) | Includes 300,000 shares of Class A common stock held by Diameter Master Fund LP (“DMF”). Diameter Capital Partners LP is the investment manager (“Investment Manager”) of DMF and, therefore, has investment and voting power over these shares. Scott Goodwin and Jonathan Lewinsohn, as the sole managing members of the general partner of the Investment Manager, make voting and investment decisions on behalf of the Investment Manager. As a result, the Investment Manager, Mr. Goodwin and Mr. Lewinsohn may be deemed to be the beneficial owners of these shares. Notwithstanding the foregoing, each of Mr. Goodwin and Mr. Lewinsohn disclaim any such beneficial ownership. The business address of Diameter Master Fund LP is 55 Hudson Yards, 29th Floor, New York, NY 10001. |
| (19) | Steven A. Tananbaum is the Chief Investment Officer of GoldenTree Asset Management LP, the investment advisor to GoldenTree Asset Management LP, the investment advisor to GoldenTree Master Fund, Ltd. As a result, Mr. Tananbaum may be deemed to be the beneficial owner of these shares. Notwithstanding the foregoing, Mr. Tananbaum disclaims any such beneficial ownership except to the extent of any pecuniary interest. The principal business address of GoldenTree Asset Management LP is 300 Park Avenue, 21st Floor, New York, New York 10022. |
| (20) | Steven A. Tananbaum is the Chief Investment Officer of GoldenTree Asset Management LP, the investment advisor to GoldenTree Multi Sector-C LP. As a result, Mr. Tananbaum may be deemed to be the beneficial owner of these shares. Notwithstanding the foregoing, Mr. Tananbaum disclaims any such beneficial ownership except to the extent of any pecuniary interest. The principal business address of GoldenTree Asset Management LP is 300 Park Avenue, 21st Floor, New York, New York 10022. |
| (21) | Steven A. Tananbaum is the Chief Investment Officer of GoldenTree Asset Management LP, the investment advisor to GoldenTree V1 Master Fund, LP. As a result, Mr. Tananbaum may be deemed to be the beneficial owner of these shares. Notwithstanding the foregoing, Mr. Tananbaum disclaims any such beneficial ownership except to the extent of any pecuniary interest. The principal business address of GoldenTree Asset Management LP is 300 Park Avenue, 21st Floor, New York, New York 10022. |
| (22) | The board of directors of Hedosophia Public Investments Limited comprises Ian Osborne, Iain Stokes, Rob King and Trina Le Noury and each director has shared voting and dispositive power with respect to the securities held by Hedosophia Public Investments Limited. Each of them disclaims beneficial ownership of the securities held by Hedosophia Public Investments Limited. The address of Hedosophia Public Investments Limited is Trafalgar Court, Les Banques, St Peter Port, Guernsey GY1 3QL. |
| (23) | Steven A. Tananbaum is the Chief Investment Officer of GoldenTree Asset Management LP, the investment advisor to Ginko Tree, LLC. As a result, Mr. Tananbaum may be deemed to be the beneficial owner of these shares. Notwithstanding the foregoing, Mr. Tananbaum disclaims any such beneficial ownership except to the extent of any pecuniary interest. The principal business address of GoldenTree Asset Management LP is 300 Park Avenue, 21st Floor, New York, New York 10022. |
| (24) | Steven A. Tananbaum is the Chief Investment Officer of GoldenTree Asset Management LP, the investment advisor to Guadalupe Fund, LP. As a result, Mr. Tananbaum may be deemed to be the beneficial owner of these shares. Notwithstanding the foregoing, Mr. Tananbaum disclaims any such beneficial ownership except to the extent of any pecuniary interest. The principal business address of GoldenTree Asset Management LP is 300 Park Avenue, 21st Floor, New York, New York 10022. |
| (25) | The principal business address of the entity is 399 PARK AVE, NEW YORK NY 10022-4614. |
| (26) | Steven A. Tananbaum is the Chief Investment Officer of GoldenTree Asset Management LP, the investment advisor to Louisiana State Employees’ Retirement System. As a result, Mr. Tananbaum may be deemed to |
102
| be the beneficial owner of these shares. Notwithstanding the foregoing, Mr. Tananbaum disclaims any such beneficial ownership except to the extent of any pecuniary interest. The principal business address of GoldenTree Asset Management LP is 300 Park Avenue, 21st Floor, New York, New York 10022. |
| (27) | Steven A. Tananbaum is the Chief Investment Officer of GoldenTree Asset Management LP, the investment advisor to MA Multi-Sector Opportunistic Fund, LP. As a result, Mr. Tananbaum may be deemed to be the beneficial owner of these shares. Notwithstanding the foregoing, Mr. Tananbaum disclaims any such beneficial ownership except to the extent of any pecuniary interest. The principal business address of GoldenTree Asset Management LP is 300 Park Avenue, 21st Floor, New York, New York 10022. |
| (28) | The principal business address of the entity is C/O MARSHALL WACE LLP, GEORGE HOUSE 131 SLOANE STREET, LONDON SW1X 9AT, UNITED KINGDOM. |
| (29) | Moore Capital Management, LP, the investment manager of MMF LT, LLC, has voting and investment control of the shares held by MMF LT, LLC. Mr. Louis M. Bacon controls the general partner of Moore Capital Management, LP and may be deemed the beneficial owner of the shares of the Company held by MMF LT, LLC. Mr. Bacon also is the indirect majority owner of MMF LT, LLC. The address of MMF LT, LLC, Moore Capital Management, LP and Mr. Bacon is 11 Times Square, New York, New York 10036. |
| (30) | The principal business address of the entity is C/O MARSHALL WACE LLP, GEORGE HOUSE 131 SLOANE STREET, LONDON SW1X 9AT, UNITED KINGDOM. |
| (31) | The principal business address of the entity is C/O MARSHALL WACE LLP, GEORGE HOUSE 131 SLOANE STREET, LONDON SW1X 9AT, UNITED KINGDOM. |
| (32) | The principal business address of the entity is C/O MARSHALL WACE LLP, GEORGE HOUSE 131 SLOANE STREET, LONDON SW1X 9AT, UNITED KINGDOM. |
| (33) | Benjamin Pass is the Chief Investment Officer of TOMS Capital Investment Management LP, the investment manager of this entity, which has an address of 450 West 14th Street, 13th Floor, New York, NY 10014. |
| (34) | The principal business address of the entity is 399 PARK AVE, NEW YORK NY 10022-4614. |
| (35) | The principal business address of the entity is 460 PARK AVE FL 19, NEW YORK NY 10022-1827. |
| (36) | Steven Trieu is the trustee of the trust. |
| (37) | The principal business address of the entity is 657 29TH ST MANHATTAN BEACH CA 90266-2232 |
| (38) | Washington Harbour Partners, LP, is the investment advisor of this entity, which has a business address of 1201 Wilson Blvd, Suite 2210, Arlington, VA 22209. |
| (39) | XN Exponent Advisors LLC serves as investment manager to XN Exponent Master Fund LP (the “Fund”) and has discretionary authority to make investment decisions and determine how to vote any securities held by the Fund. XN Exponent Advisors LLC is wholly owned by XN LP, a registered investment advisor. The general partner of XN LP is XN Management GP LLC, which is indirectly controlled by Gaurav Kapadia. Mr. Kapadia disclaims beneficial ownership of these securities except to the extent of any pecuniary interest therein. The principal business address of the entities referenced herein is 412 West 15th Street, 13th Floor, New York, New York 10011. |
| (40) | Includes 16,000 shares of Class A Common Stock and 24,000 shares of Class A Common Stock underlying shares of Class C Common Stock. |
| (41) | Includes 50,000 shares of Class A Common Stock and 50,000 shares of Class A Common Stock underlying shares of Class C Common Stock. |
103
DESCRIPTION OF OUR SECURITIES
The following description summarizes some of the terms of our certificate of incorporation and bylaws and of the General Corporation Law of the State of Delaware. This description is summarized from, and qualified in its entirety by reference to, our certificate of incorporation and bylaws, each of which has been publicly filed with the SEC, as well as the relevant provisions of the DGCL.
Authorized Capitalization
General
The total amount of our authorized share capital consists of (a) 400,000,000 shares of capital stock including (i) 385,000,000 shares of Class A common stock (the “Class A Common Stock”) and (ii) 15,000,000 shares of Class C common stock (the “Class C Common Stock” and, together with the Class A Common Stock, the “Common Stock”), and (b) 10,000,000 shares of undesignated preferred stock (the “Preferred Stock”). We had 222,597,413 shares of the Class A Common Stock issued and outstanding and 5,750,000 shares of Class C Common Stock issued and outstanding immediately after the consummation of the Business Combination.
Common Stock
Voting rights
Dividend rights
Rights upon liquidation
Conversion rights
.
(x) $15.25 if occurring before July 21, 2024;
(y) $23.00 if occurring before July 21, 2027; or
(z) $35.00 if occurring before July 21, 2030;
and (ii) the date on which Berkshire Grey completes a merger, stock exchange, reorganization or other similar transaction that results in both a change of control and all of its public stockholders having the right to exchange
104
their shares of Class A Common Stock for cash, securities or other property, in each case, on abasis, subject to adjustment as is further set forth in the Charter.
one-for-one
Other rights
Trading Symbol and Market
Preferred Stock
Our board of directors has the authority to issue shares of preferred stock from time to time on terms it may determine, to divide shares of preferred stock into one or more series and to fix the designations, preferences, privileges, and restrictions of preferred stock, including dividend rights, conversion rights, voting rights, terms of redemption, liquidation preference, sinking fund terms, and the number of shares constituting any series or the designation of any series to the fullest extent permitted by the DGCL. The issuance of Preferred Stock could have the effect of decreasing the trading price of Common Stock, restricting dividends on our capital stock, diluting the voting power of the Common Stock, impairing the liquidation rights of our capital stock, or delaying or preventing a change in control of Berkshire Grey.
Election of Directors and Vacancies
Subject to the rights of the holders of any series of Preferred Stock to elect additional directors under specified circumstances, the holders of Common Stock have the exclusive right to vote for the election of directors to our board of directors, and the number of directors on our board shall be fixed solely and exclusively by resolution duly adopted from time to time by the board, but shall initially consist of six (6) directors, which shall be divided into three (3) classes, designated Class I, II and III, with Class I consisting of two (2) directors, Class II consisting of two (2) directors and Class III consisting of two (2) directors.
Under the Bylaws, at all meetings of stockholders called for the election of directors, a plurality of the votes properly cast is sufficient to elect such directors to our board.
Except as the DGCL may otherwise require and subject to the rights, if any, of the holders of any series of Preferred Stock, in the interim between annual meetings of stockholders or special meetings of stockholders called for the election of directors and/or the removal of one or more directors and the filling of any vacancy in that connection, newly created directorships and any vacancies on our board, including unfilled vacancies resulting from the removal of directors, may be filled only by the affirmative vote of a majority of the remaining directors then in office, although less than a quorum, or by the sole remaining director. All directors will hold office until the expiration of their respective terms of office and until their successors will have been elected and qualified. A director elected or appointed to fill a vacancy resulting from the death, resignation or removal of a director or a newly created directorship will serve for the remainder of the full term of the class of directors in which the new directorship was created or the vacancy occurred and until his or her successor will have been elected and qualified.
Subject to the rights, if any, of any series of Preferred Stock, any director may be removed from office only with cause and only by the affirmative vote of the holders of not less than
two-thirds
of the outstanding voting stock of Berkshire Grey then entitled to vote at an election of directors. Any such director proposed to be removed from office is entitled to advance written notice as described in the Charter. In case any one or more directors should be so removed, new directors may be elected at the same time for the unexpired portion of the full term of the director or directors so removed.105
Our directors are empowered to exercise all such powers and do all such acts and things as may be exercised or done by Berkshire Grey, subject, nevertheless, to the provisions of the DGCL, the Charter and to the Bylaws, as in effect from time to time; provided, however, that no adopted bylaw will invalidate any prior act of the directors which would have been valid if such bylaw had not been adopted.
Notwithstanding the foregoing provisions, any director elected pursuant to the right, if any, of the holders of Preferred Stock to elect additional directors under specified circumstances will serve for such term or terms and pursuant to such other provisions as specified in the relevant certificate of designations related to the Preferred Stock.
Quorum
The holders of a majority of the voting power of the capital stock issued and outstanding and entitled to vote thereat, present in person or represented by proxy, will constitute a quorum at all meetings of the stockholders for the transaction of business except as otherwise required by law or provided by the Charter. If, however, such quorum is not present or represented at any meeting of the stockholders, the holders of a majority of the voting power present in person or represented by proxy, will have power to adjourn the meeting from time to time, without notice other than announcement at the meeting, until a quorum will be present or represented. At such adjourned meeting at which a quorum is present or represented, any business may be transacted which might have been transacted at the meeting as originally noticed. If the adjournment is for more than thirty (30) days, or if after the adjournment a new record date is fixed for the adjourned meeting, a notice of the adjourned meeting will be given to each stockholder entitled to vote at such adjourned meeting as of the record date fixed for notice of such adjourned meeting.
Anti-takeover Effects of the Charter and the Bylaws
The Charter and the Bylaws contain provisions that may delay, defer or discourage another party from acquiring control of Berkshire Grey. We expect that these provisions, which are summarized below, will discourage coercive takeover practices or inadequate takeover bids. These provisions are also designed to encourage persons seeking to acquire control of us to first negotiate with our board of directors, which we believe may result in an improvement of the terms of any such acquisition in favor of our stockholders. However, they also give our board of directors the power to discourage acquisitions that some stockholders may favor.
Authorized but Unissued Capital Stock
Delaware law does not require stockholder approval for any issuance of authorized shares. However, the listing requirements of Nasdaq, which apply if and so long as the Common Stock (or warrants) remains listed on Nasdaq, require stockholder approval of certain issuances equal to or exceeding 20% of the then outstanding voting power or then outstanding number of shares of Common Stock. Additional shares that may be issued in the future may be used for a variety of corporate purposes, including future public offerings, to raise additional capital or to facilitate acquisitions.
One of the effects of the existence of unissued and unreserved common stock may be to enable our board of directors to issue shares to persons friendly to current management, which issuance could render more difficult or discourage an attempt to obtain control of Berkshire Grey by means of a merger, tender offer, proxy contest or otherwise and thereby protect the continuity of management and possibly deprive stockholders of opportunities to sell their shares of Common Stock at prices higher than prevailing market prices.
Special Meeting, Action by Written Consent and Advance Notice Requirements for Stockholder Proposals
Unless otherwise required by law, and subject to the rights, if any, of the holders of any series of Preferred Stock, special meetings of the stockholders of Berkshire Grey, for any purpose or purposes, may be called only
106
(i) by a majority of our board of directors or (ii) at any time when no annual meeting has been held for a period of thirteen (13) months after Berkshire Grey’s last annual meeting, a special meeting in lieu thereof may be held, and such special meeting shall have, for the purposes of the Bylaws or otherwise, all the force and effect of an annual meeting. Unless otherwise required by law, written notice of a special meeting of stockholders, stating the time, place and purpose or purposes thereof, shall be given to each stockholder entitled to vote at such meeting, not less than ten (10) or more than sixty (60) days before the date fixed for the meeting. Business transacted at any special meeting of stockholders will be limited to the purposes stated in the notice.
The Bylaws also provide that unless otherwise restricted by the Charter or the Bylaws, any action required or permitted to be taken at any meeting of our board of directors or of any committee thereof may be taken without a meeting, if all members of our board of directors or of such committee, as the case may be, consent thereto in writing or by electronic transmission, and the writing or writings or electronic transmission or transmissions are filed with the minutes of proceedings of the board or committee.
In addition, the Bylaws require advance notice procedures for stockholder proposals to be brought before an annual meeting of the stockholders, including the nomination of directors. Stockholders at an annual meeting may only consider the proposals specified in the notice of meeting or brought before the meeting by or at the direction of our board of directors, or by a stockholder of record on the record date for the meeting, who is entitled to vote at the meeting and who has delivered a timely written notice in proper form to Berkshire Grey’s Secretary, of the stockholder’s intention to bring such business before the meeting.
These provisions could have the effect of delaying until the next stockholder meeting any stockholder actions, even if they are favored by the holders of a majority of our outstanding voting securities.
Amendment of the Charter and the Bylaws
The DGCL provides generally that the affirmative vote of a majority of the outstanding stock entitled to vote on amendments to a corporation’s certificate of incorporation or bylaws is required to approve such amendment, unless a corporation’s certificate of incorporation or bylaws, as the case may be, requires a greater percentage.
The Charter provides that the following provisions therein may be amended, altered, repealed or rescinded only by the affirmative vote of the holders of at least
66-
2
⁄3
% in voting power of all the then outstanding shares of Berkshire Grey’s capital stock entitled to vote thereon and the affirmative vote of at least66-
2
⁄3
% of the outstanding shares of each class entitled to vote thereon as a class:| • | the provisions regarding the size of our board of directors and the election of directors; |
| • | the provisions prohibiting stockholder actions without a meeting; |
| • | the provisions regarding calling special meetings of stockholders; |
| • | the provisions regarding removal of directors; |
| • | the provisions regarding the limited liability of directors of Berkshire Grey; and |
| • | the provisions regarding the size and classification of our board of directors and the election of directors not to be governed by Section 203 of the DGCL. |
The Bylaws may be amended or repealed (A) by the affirmative vote of a majority of our entire board of directors then in office (subject to any bylaw requiring the affirmative vote of a larger percentage of the members of the board) or (B) without the approval of our board of directors, by the affirmative vote of the holders of
66-
2
⁄3
% of the outstanding voting stock of Berkshire Grey entitled to vote on such amendment or repeal, voting as a single class; provided that if our board of directors recommends that stockholders approve such amendment or repeal at such meeting of stockholders, then such amendment or repeal shall only require the affirmative vote of the majority of the outstanding shares of capital stock entitled to vote on such amendment or repeal, voting together as a single class.107
Delaware Anti-Takeover Statute
Section 203 of the DGCL provides that if a person acquires 15% or more of the voting stock of a Delaware corporation, such person becomes an “interested stockholder” and may not engage in certain “business combinations” with such corporation for a period of three years from the time such person acquired 15% or more of such corporation’s voting stock, unless: (a) the board of directors of such corporation approves the acquisition of stock or the merger transaction before the time that the person becomes an interested stockholder, (b) the interested stockholder owns at least 85% of the outstanding voting stock of such corporation at the time the merger transaction commences (excluding voting stock owned by directors who are also officers and certain employee stock plans), or (c) the merger transaction is approved by the board of directors and at a meeting of stockholders, not by written consent, by the affirmative vote of at least
two-thirds
of the outstanding voting stock which is not owned by the interested stockholder. A Delaware corporation may elect in its certificate of incorporation or bylaws not to be governed by this particular Delaware law.Under the Charter, Berkshire Grey opted out of Section 203 of the DGCL.
Limitations on Liability and Indemnification of Officers and Directors
The Charter limits the liability of our directors to the fullest extent permitted by the DGCL, and the Bylaws provide that we will indemnify them to the fullest extent permitted by such law. We have entered and expect to continue to enter into agreements to indemnify our directors, executive officers and other employees as determined by our board of directors. Under the terms of such indemnification agreements, we are required to indemnify each of our directors and officers, to the fullest extent permitted by the laws of the state of Delaware, if the basis of the indemnitee’s involvement was by reason of the fact that the indemnitee is or was a director or officer of Berkshire Grey or any of its subsidiaries or was serving at Berkshire Grey’s request in an official capacity for another entity. We must indemnify our officers and directors against all reasonable fees, expenses, charges and other costs of any type or nature whatsoever, including any and all expenses and obligations paid or incurred in connection with investigating, defending, being a witness in, participating in (including on appeal), or preparing to defend, be a witness or participate in any completed, actual, pending or threatened action, suit, claim or proceeding, whether civil, criminal, administrative or investigative, or establishing or enforcing a right to indemnification under the indemnification agreement. The indemnification agreements also require us, if so requested, to advance within 10 days of such request all reasonable fees, expenses, charges and other costs that such director or officer incurred, provided that such person will return any such advance if it is ultimately determined that such person is not entitled to indemnification by us. Any claims for indemnification by our directors and officers may reduce our available funds to satisfy successful third-party claims against us and may reduce the amount of money available to us.
Exclusive Jurisdiction of Certain Actions
The Bylaws require, to the fullest extent permitted by law, unless Berkshire Grey consents in writing to the selection of an alternative forum, that derivative actions brought in the name of Berkshire Grey, actions against directors, officers and employees for breach of fiduciary duty, actions asserting a claim arising pursuant to any provision of the DGCL or the Charter or the Bylaws, actions to interpret, apply, enforce or determine the validity of the Charter or the Bylaws and actions asserting a claim against Berkshire Grey governed by the internal affairs doctrine may be brought only in the Court of Chancery in the State of Delaware and, if brought outside of Delaware, the stockholder bringing the suit will be deemed to have consented to service of process on such stockholder’s counsel. Although we believe this provision benefits Berkshire Grey by providing increased consistency in the application of Delaware law in the types of lawsuits to which it applies, the provision may have the effect of discouraging lawsuits against our directors and officers.
In addition, the Bylaws require that, unless Berkshire Grey consents in writing to the selection of an alternative forum, the United States District Court for the District of Massachusetts shall be the sole and
108
exclusive forum for resolving any action asserting a claim arising under the Securities Act. Berkshire Grey has chosen the United States District Court for the District of Massachusetts as the exclusive forum for such Securities Act causes of action because Berkshire Grey’s principal executive offices are located in Bedford, Massachusetts.
Warrants
Public Warrants
Each whole warrant entitles the registered holder to purchase one share of Class A Common Stock at a price of $11.50 per share, subject to adjustment as discussed below, at any time commencing on August 20, 2021, provided that Berkshire Grey has an effective registration statement under the Securities Act covering the Berkshire Grey Class A Common Stock issuable upon exercise of the warrants and a current prospectus relating to them is available (or we permit holders to exercise their warrants on a cashless basis under the circumstances specified in the warrant agreement) and such shares are registered, qualified or exempt from registration under the securities, or blue sky, laws of the state of residence of the holder. Pursuant to the warrant agreement, a warrant holder may exercise its warrants only for a whole number of shares of Class A Common Stock. This means only a whole warrant may be exercised at a given time by a warrant holder. The warrants will expire five years after the completion of the Business Combination, at 5:00 p.m., New York City time, or earlier upon redemption or liquidation.
We will not be obligated to deliver any shares of Class A Common Stock pursuant to the exercise of a warrant and will have no obligation to settle such warrant exercise unless a registration statement under the Securities Act covering the issuance of the shares of Class A Common Stock underlying the warrants is then effective and a prospectus relating thereto is current, subject to our satisfying our obligations described below with respect to registration, or a valid exemption from registration is available, including in connection with a cashless exercise permitted as a result of a notice of redemption described below under “.” No warrant will be exercisable for cash or on a cashless basis, and we will not be obligated to issue a share of Class A Common Stock upon exercise of a warrant unless the share of Class A Common Stock issuable upon such warrant exercise has been registered, qualified or deemed to be exempt under the securities laws of the state of residence of the registered holder of the warrants. In the event that the conditions in the two immediately preceding sentences are not satisfied with respect to a warrant, the holder of such warrant will not be entitled to exercise such warrant and such warrant may have no value and expire worthless. In no event will we be required to net cash settle any warrant.
Redemption of warrants when the price per share of Class
A Common Stock equals or exceeds $10.00
We agreed that as soon as practicable, but in no event later than fifteen (15) business days after the closing of the Business Combination, we would use our commercially reasonable efforts to file with the SEC a registration statement covering the shares of Class A Common Stock issuable upon exercise of the warrants, and we will use our commercially reasonable efforts to cause the same to become effective within sixty (60) business days after the closing of the Business Combination, and to maintain the effectiveness of such registration statement and a current prospectus relating to those shares of Class A Common Stock until the warrants expire or are redeemed, as specified in the warrant agreement; provided that if our shares of Class A Common Stock are at the time of any exercise of a warrant not listed on a national securities exchange such that they satisfy the definition of a “covered security” under Section 18(b)(1) of the Securities Act, we may, at our option, require holders of public warrants who exercise their warrants to do so on a “cashless basis” in accordance with Section 3(a)(9) of the Securities Act and, in the event we so elect, we will not be required to file or maintain in effect a registration statement. If any such registration statement has not been declared effective by the sixtieth (60
th
) business day following the closing of the Business Combination, holders of the warrants will have the right, during the period beginning on the sixty first (61st
) business day after the closing of the Business Combination and ending upon such registration statement being declared effective by the SEC, and during any other period when the company fails to have maintained an effective registration statement covering the issuance109
of the shares of Class A Common Stock issuable upon exercise of the warrants, to exercise such warrants on a “cashless basis” in accordance with Section 3(a)(9) of the Securities Act or another exemption, but we will use commercially reasonable efforts to register or qualify the shares under applicable blue sky laws to the extent an exemption is not available.
Redemption of warrants when the price per share of Class
A Common Stock equals or exceeds $18.00
| • | in whole and not in part; |
| • | at a price of $0.01 per warrant; |
| • | upon not less than 30 days’ prior written notice of redemption to each warrant holder; and |
| • | if, and only if, the last reported sale price of Class A Common Stock for any 20-trading days within a30-trading day period ending on the third trading day prior to the date on which we send the notice of redemption to the warrant holders (which we refer to as the “Reference Value”) equals or exceeds $18.00 per share (as adjusted for adjustments to the number of shares issuable upon exercise or the exercise price of a warrant as described below under “— Anti-Dilution Adjustments |
We will not redeem the warrants as described above unless a registration statement under the Securities Act covering the issuance of the shares of Class A Common Stock issuable upon exercise of the warrants is then effective and a current prospectus relating to those shares of Class A Common Stock is available throughout the
30-day
redemption period. If and when the warrants become redeemable by us, we may exercise our redemption right even if we are unable to register or qualify the underlying securities for sale under all applicable state securities laws.We have established the last of the redemption criterion discussed above to prevent a redemption call unless there is at the time of the call a significant premium to the warrant exercise price. If the foregoing conditions are satisfied and we issue a notice of redemption of the warrants, each warrant holder will be entitled to exercise his, her or its warrant prior to the scheduled redemption date. However, the price of the shares of Class A Common Stock may fall below the $18.00 redemption trigger price (as adjusted for adjustments to the number of shares issuable upon exercise or the exercise price of a warrant) as well as the $11.50 (for whole shares) warrant exercise price after the redemption notice is issued.
Redemption of warrants when the price per share of Class
A Common Stock equals or exceeds $10.00
| • | in whole and not in part; |
| • | at $0.10 per warrant upon a minimum of 30 days’ prior written notice of redemption, provided that holders will be able to exercise their warrants on a cashless basis prior to redemption and receive that number of shares determined by reference to the table below, based on the redemption date and the “fair market value” of the Class A Common Stock, except as otherwise described below; |
| • | if, and only if, the Reference Value (as defined above under “ Redemption of warrants when the price per share of Class A Common Stock equals or exceeds $18.00 |
| • | if the Reference Value is less than $18.00 per share (as adjusted for adjustments to the number of shares issuable upon exercise or the exercise price of a warrant as described below under “ —Anti-Dilution Adjustments |
110
During the period beginning on the date the notice of redemption is given, holders may elect to exercise their warrants on a cashless basis. The numbers in the table below represent the number of shares of Class A Common Stock that a warrant holder will receive upon such cashless exercise in connection with a redemption by us pursuant to this redemption feature, based on the “fair market value” of the Class A Common Stock on the corresponding redemption date (assuming holders elect to exercise their warrants and such warrants are not redeemed for $0.10 per warrant), determined for these purposes based on volume weighted average price of the shares of the Class A Common Stock during the ten trading days immediately following the date on which the notice of redemption is sent to the holders of warrants, and the number of months that the corresponding redemption date precedes the expiration date of the warrants, each as set forth in the table below. We will provide our warrant holders with the final fair market value no later than one business day after the
ten-trading
day period described above ends.The share prices set forth in the column headings of the table below will be adjusted as of any date on which the number of shares issuable upon exercise of a warrant or the exercise price of a warrant is adjusted as set forth in the registration statement under the heading “” below. If the number of shares issuable upon exercise of a warrant is adjusted, the adjusted share prices in the column headings will equal the share prices immediately prior to such adjustment, multiplied by a fraction, the numerator of which is the number of shares deliverable upon exercise of a warrant immediately prior to such adjustment and the denominator of which is the number of shares deliverable upon exercise of a warrant as so adjusted. The number of shares in the table below shall be adjusted in the same manner and at the same time as the number of shares issuable upon exercise of a warrant. If the exercise price of a warrant is adjusted, (a) in the case of an adjustment pursuant to the fifth paragraph in the registration statement under the heading “” below, the adjusted share prices in the column headings will equal the unadjusted share price multiplied by a fraction, the numerator of which is the higher of the Market Value and the Newly Issued Price as set forth in the registration statement under the heading “and the denominator of which is $10.00 and (b) in the case of an adjustment pursuant to the second paragraph in the registration statement under the heading “” below, the adjusted share prices in the column headings will equal the unadjusted share price less the decrease in the exercise price of a warrant pursuant to such exercise price adjustment.
— Anti-dilution Adjustments
— Anti-dilution Adjustments
— Anti-dilution Adjustments”
— Anti-dilution Adjustments
Redemption Date (period to expiration of warrants) | Redemption Fair Market Value of shares of Common Stock | |||||||||||||||||||||||||||||||||||
£ 10.00 | 11.00 | 12.00 | 13.00 | 14.00 | 15.00 | 16.00 | 17.00 | ³ 18.00 | ||||||||||||||||||||||||||||
60 months | 0.261 | 0.281 | 0.297 | 0.311 | 0.324 | 0.337 | 0.348 | 0.358 | 0.361 | |||||||||||||||||||||||||||
57 months | 0.257 | 0.277 | 0.294 | 0.310 | 0.324 | 0.337 | 0.348 | 0.358 | 0.361 | |||||||||||||||||||||||||||
54 months | 0.252 | 0.272 | 0.291 | 0.307 | 0.322 | 0.335 | 0.347 | 0.357 | 0.361 | |||||||||||||||||||||||||||
51 months | 0.246 | 0.268 | 0.287 | 0.304 | 0.320 | 0.333 | 0.346 | 0.357 | 0.361 | |||||||||||||||||||||||||||
48 months | 0.241 | 0.263 | 0.283 | 0.301 | 0.317 | 0.332 | 0.344 | 0.356 | 0.361 | |||||||||||||||||||||||||||
45 months | 0.235 | 0.258 | 0.279 | 0.298 | 0.315 | 0.330 | 0.343 | 0.356 | 0.361 | |||||||||||||||||||||||||||
42 months | 0.228 | 0.252 | 0.274 | 0.294 | 0.312 | 0.328 | 0.342 | 0.355 | 0.361 | |||||||||||||||||||||||||||
39 months | 0.221 | 0.246 | 0.269 | 0.290 | 0.309 | 0.325 | 0.340 | 0.354 | 0.361 | |||||||||||||||||||||||||||
36 months | 0.213 | 0.239 | 0.263 | 0.285 | 0.305 | 0.323 | 0.339 | 0.353 | 0.361 | |||||||||||||||||||||||||||
33 months | 0.205 | 0.232 | 0.257 | 0.280 | 0.301 | 0.320 | 0.337 | 0.352 | 0.361 | |||||||||||||||||||||||||||
30 months | 0.196 | 0.224 | 0.250 | 0.274 | 0.297 | 0.316 | 0.335 | 0.351 | 0.361 | |||||||||||||||||||||||||||
27 months | 0.185 | 0.214 | 0.242 | 0.268 | 0.291 | 0.313 | 0.332 | 0.350 | 0.361 | |||||||||||||||||||||||||||
24 months | 0.173 | 0.204 | 0.233 | 0.260 | 0.285 | 0.308 | 0.329 | 0.348 | 0.361 | |||||||||||||||||||||||||||
21 months | 0.161 | 0.193 | 0.223 | 0.252 | 0.279 | 0.304 | 0.326 | 0.347 | 0.361 | |||||||||||||||||||||||||||
18 months | 0.146 | 0.179 | 0.211 | 0.242 | 0.271 | 0.298 | 0.322 | 0.345 | 0.361 | |||||||||||||||||||||||||||
15 months | 0.130 | 0.164 | 0.197 | 0.230 | 0.262 | 0.291 | 0.317 | 0.342 | 0.361 | |||||||||||||||||||||||||||
12 months | 0.111 | 0.146 | 0.181 | 0.216 | 0.250 | 0.282 | 0.312 | 0.339 | 0.361 | |||||||||||||||||||||||||||
9 months | 0.090 | 0.125 | 0.162 | 0.199 | 0.237 | 0.272 | 0.305 | 0.336 | 0.361 | |||||||||||||||||||||||||||
6 months | 0.065 | 0.099 | 0.137 | 0.178 | 0.219 | 0.259 | 0.296 | 0.331 | 0.361 | |||||||||||||||||||||||||||
3 months | 0.034 | 0.065 | 0.104 | 0.150 | 0.197 | 0.243 | 0.286 | 0.326 | 0.361 | |||||||||||||||||||||||||||
0 months | — | — | 0.042 | 0.115 | 0.179 | 0.233 | 0.281 | 0.323 | 0.361 | |||||||||||||||||||||||||||
111
The exact fair market value and redemption date may not be set forth in the table above, in which case, if the fair market value is between two values in the table or the redemption date is between two redemption dates in the table, the number of shares of Class A Common Stock to be issued for each warrant exercised will be determined by a straight-line interpolation between the number of shares set forth for the higher and lower fair market values and the earlier and later redemption dates, as applicable, based on a 365 or
366-day
year, as applicable. For example, if the volume weighted average price of the shares of Class A Common Stock as reported during the 10 trading days immediately following the date on which the notice of redemption is sent to the holders of the warrants is $11.00 per share, and at such time there are fifty seven (57) months until the expiration of the warrants, holders may choose to, in connection with this redemption feature, exercise their warrants for 0.277 shares of Class A Common Stock for each whole warrant. For an example where the exact fair market value and redemption date are not as set forth in the table above, if the volume weighted average price of the shares of Class A Common Stock as reported during the ten (10) trading days immediately following the date on which the notice of redemption is sent to the holders of the warrants is $13.50 per share, and at such time there are thirty eight (38) months until the expiration of the warrants, holders may choose to, in connection with this redemption feature, exercise their warrants for 0.298 shares of Class A Common Stock for each whole warrant. In no event will the warrants be exercisable in connection with this redemption feature for more than 0.361 shares of Class A Common Stock per warrant (subject to adjustment). Finally, as reflected in the table above, if the warrants are out of the money and about to expire, they cannot be exercised on a cashless basis in connection with a redemption by us pursuant to this redemption feature, since they will not be exercisable for any shares of Class A Common Stock.This redemption feature differs from the typical warrant redemption features used in some other blank check offerings, which typically only provide for a redemption of warrants for cash (other than the private placement warrants) when the trading price for the shares of Class A Common Stock exceeds $18.00 per share for a specified period of time. This redemption feature is structured to allow for all of the outstanding warrants to be redeemed when the shares of Class A Common Stock are trading at or above $10.00 per share, which may be at a time when the trading price of our shares of Class A Common Stock is below the exercise price of the warrants. We have established this redemption feature to provide us with the flexibility to redeem the warrants without the warrants having to reach the $18.00 per share threshold set forth above. Holders choosing to exercise their warrants in connection with a redemption pursuant to this feature will, in effect, receive a number of shares of Class A Common Stock for their warrants based on an option pricing model with a fixed volatility input. This redemption right provides us with an additional mechanism by which to redeem all of the outstanding warrants, and therefore have certainty as to our capital structure as the warrants would no longer be outstanding and would have been exercised or redeemed. We will be required to pay the applicable redemption price to warrant holders if we choose to exercise this redemption right and it will allow us to quickly proceed with a redemption of the warrants if we determine it is in our best interest to do so. As such, we would redeem the warrants in this manner when we believe it is in our best interest to update our capital structure to remove the warrants and pay the redemption price to the warrant holders.
As stated above, we can redeem the warrants when the shares of Class A Common Stock are trading at a price starting at $10.00, which is below the exercise price of $11.50, because it will provide certainty with respect to our capital structure and cash position while providing warrant holders with the opportunity to exercise their warrants on a cashless basis for the applicable number of shares. If we choose to redeem the warrants when the shares of Class A Common Stock are trading at a price below the exercise price of the warrants, this could result in the warrant holders receiving fewer shares of Class A Common Stock than they would have received if they had chosen to exercise their warrants for shares of Class A Common Stock if and when such shares were trading at a price higher than the exercise price of $11.50.
No fractional shares of Class A Common Stock will be issued upon exercise. If, upon exercise, a holder would be entitled to receive a fractional interest in a share, we will round down to the nearest whole number of the number of shares of Class A Common Stock to be issued to the holder. If, at the time of redemption, the warrants are exercisable for a security other than the shares of Class A Common Stock pursuant to the warrant
112
agreement, the warrants may be exercised for such security. At such time as the warrants become exercisable for a security other than the shares of Class A Common Stock, Berkshire Grey (or a surviving company) will use its commercially reasonable efforts to register under the Securities Act the security issuable upon the exercise of the warrants.
Redemption Procedures
Anti-dilution Adjustments
split-up
of common stock or other similar event, then, on the effective date of such stock dividend,split-up
or similar event, the number of shares of Class A Common Stock issuable on exercise of each warrant will be increased in proportion to such increase in the issued and outstanding shares of common stock. A rights offering made to all or substantially all holders of common stock entitling holders to purchase shares of Class A Common Stock at a price less than the “historical fair market value” (as defined below) will be deemed a share dividend of a number of shares of Class A Common Stock equal to the product of (i) the number of shares of Class A Common Stock actually sold in such rights offering (or issuable under any other equity securities sold in such rights offering that are convertible into or exercisable for shares of Class A Common Stock) and (ii) one minus the quotient of (x) the price per shares of Class A Common Stock paid in such rights offering and (y) the historical fair market value. For these purposes, (i) if the rights offering is for securities convertible into or exercisable for shares of Class A Common Stock, in determining the price payable for shares of Class A Common Stock, there will be taken into account any consideration received for such rights, as well as any additional amount payable upon exercise or conversion and (ii) “historical fair market value” means the volume weighted average price of shares of Class A Common Stock as reported during the 10 trading day period ending on the trading day prior to the first date on which the shares of Class A Common Stock trade on the applicable exchange or in the applicable market, regular way, without the right to receive such rights.In addition, if we, at any time while the warrants are outstanding and unexpired, pay to all or substantially all of the holders of the Class A Common Stock a dividend or make a distribution in cash, securities or other assets to the holders of shares of Class A Common Stock on account of such shares (or other securities into which the warrants are convertible), other than (a) as described above, or (b) any cash dividends or cash distributions which, when combined on a per share basis with all other cash dividends and cash distributions paid on the shares of Class A Common Stock during the
365-day
period ending on the date of declaration of such dividend or distribution does not exceed $0.50 (as adjusted for stock splits, stock dividends, reorganizations, recapitalizations and the like) but only with respect to the amount of the aggregate cash dividends or cash distributions equal to or less than $0.50 per share, then the warrant exercise price will be decreased, effective immediately after the effective date of such event, by the amount of cash and/or the fair market value of any securities or other assets paid on each share of Class A Common Stock in respect of such event.If the number of issued and outstanding shares of Class A Common Stock is decreased by a consolidation, combination, reverse stock split or reclassification of share of Class A Common Stock or other similar event, then, on the effective date of such consolidation, combination, reverse stock split, reclassification or similar event, the number of shares of Class A Common Stock issuable on exercise of each warrant will be decreased in proportion to such decrease in issued and outstanding shares of Class A Common Stock.
Whenever the number of shares of Class A Common Stock purchasable upon the exercise of the warrants is adjusted, as described above, the warrant exercise price will be adjusted by multiplying the warrant exercise price immediately prior to such adjustment by a fraction (x) the numerator of which will be the number of shares of Class A Common Stock purchasable upon the exercise of the warrants immediately prior to such adjustment and
113
(y) the denominator of which will be the number of shares of Class A Common Stock so purchasable immediately thereafter.
In case of any reclassification or reorganization of the issued and outstanding shares of Class A Common Stock (other than those described above or that solely affects the par value of such shares of Class A Common Stock), or in the case of any merger or consolidation of us with or into another corporation (other than a consolidation or merger in which we are the continuing corporation and that does not result in any reclassification or reorganization of our issued and outstanding shares of Class A Common Stock), or in the case of any sale or conveyance to another corporation or entity of the assets or other property of us as an entirety or substantially as an entirety in connection with which we are dissolved, the holders of the warrants will thereafter have the right to purchase and receive, upon the basis and upon the terms and conditions specified in the warrants and in lieu of the shares of Class A Common Stock immediately theretofore purchasable and receivable upon the exercise of the rights represented thereby, the kind and amount of shares, stock or other equity securities or property (including cash) receivable upon such reclassification, reorganization, merger or consolidation, or upon a dissolution following any such sale or transfer, that the holder of the warrants would have received if such holder had exercised their warrants immediately prior to such event. However, if such holders were entitled to exercise a right of election as to the kind or amount of securities, cash or other assets receivable upon such merger or consolidation, then the kind and amount of securities, cash or other assets for which each warrant will become exercisable will be deemed to be the weighted average of the kind and amount received per share by such holders in such merger or consolidation that affirmatively make such election, and if a tender, exchange or redemption offer has been made to and accepted by such holders under circumstances in which, upon completion of such tender or exchange offer, the maker thereof, together with members of any group (within the meaning ofmarket, or is to be so listed for trading or quoted immediately following such event, and if the registered holder of the warrant properly exercises the warrant within thirty days following public disclosure of such transaction, the warrant exercise price will be reduced as specified in the warrant agreement based on the Black-Scholes value (as defined in the warrant agreement) of the warrant.
Rule 13d-5(b)(1)
under the Exchange Act) of which such maker is a part, and together with any affiliate or associate of such maker (within the meaning ofRule 12b-2
under the Exchange Act) and any members of any such group of which any such affiliate or associate is a part, own beneficially (within the meaning ofRule 13d-3
under the Exchange Act) more than 50% of the issued and outstanding shares of Class A Common Stock, the holder of a warrant will be entitled to receive the highest amount of cash, securities or other property to which such holder would actually have been entitled as a stockholder if such warrant holder had exercised the warrant prior to the expiration of such tender or exchange offer, accepted such offer and all of the shares of Class A Common Stock held by such holder had been purchased pursuant to such tender or exchange offer, subject to adjustment (from and after the consummation of such tender or exchange offer) as nearly equivalent as possible to the adjustments provided for in the warrant agreement. Additionally, if less than 70% of the consideration receivable by the holders of shares of Class A Common Stock in such a transaction is payable in the form of shares of Class A Common Stock in the successor entity that is listed for trading on a national securities exchange or is quoted in an establishedover-the-counter
The warrants are issued in registered form under a warrant agreement between Continental Stock Transfer & Trust Company, as warrant agent, and us. The warrant agreement provides that the terms of the warrants may be amended without the consent of any holder to cure any ambiguity or correct any defective provision or correct any mistake, including to conform the provisions of the warrant agreement to the description of the terms of the warrants and the warrant agreement set forth in RAAC’s initial public offering prospectus, or defective provision or (ii) adding or changing any provisions with respect to matters or questions arising under the warrant agreement as the parties to the warrant agreement may deem necessary or desirable and that the parties deem to not adversely affect the rights of the registered holders of the warrants and (b) all other modifications or amendments require the vote or written consent of at least 65% of the then outstanding public warrants and, solely with respect to any amendment to the terms of the private placement warrants or any provision of the warrant agreement with respect to the private placement warrants, at least 65% of the then outstanding private placement warrants. You should review a copy of the warrant agreement, which is filed as an exhibit to the
114
registration statement of which this prospectus is a part, for a complete description of the terms and conditions applicable to the warrants.
The warrant holders do not have the rights or privileges of holders of shares of Class A Common Stock and any voting rights until they exercise their warrants and receive shares of Class A Common Stock.
We have agreed that, subject to applicable law, any action, proceeding or claim against us arising out of or relating in any way to the warrant agreement will be brought and enforced in the courts of the State of New York or the United States District Court for the Southern District of New York, and we irrevocably submit to such jurisdiction, which jurisdiction will be the exclusive forum for any such action, proceeding or claim. This provision applies to claims under the Securities Act but does not apply to claims under the Exchange Act or any claim for which the federal district courts of the United States of America are the sole and exclusive forum.
Private Placement Warrants
The Private Placement Warrants (including the shares of Class A Common Stock issuable upon exercise of the private placement warrants) will not be transferable, assignable or salable until at least 30 days after the completion the Business Combination, except pursuant to limited exceptions to our directors and officers and other persons or entities affiliated with RAAC Management LLC, and they will not be redeemable by us (except as described under “”) so long as they are held by RAAC Management LLC or its permitted transferees. RAAC Management LLC, or its permitted transferees, has the option to exercise the private placement warrants on a cashless basis and have certain registration rights described herein. Otherwise, the private placement warrants have terms and provisions that are identical to those of the warrants being sold as part of the units in this offering. If the private placement warrants are held by holders other than RAAC Management LLC or its permitted transferees, the private placement warrants will be redeemable by us in all redemption scenarios and exercisable by the holders on the same basis as the warrants included in the units being sold in this offering.
—
Redemption of warrants when the price per share of Class
A Common Stock equals or exceeds
$10.00
Except as described in the registration statement under “if holders of the private placement warrants elect to exercise them on a cashless basis, they would pay the exercise price by surrendering his, her or its warrants for that number of shares of Class A Common Stock equal to the quotient obtained by dividing (x) the product of the number of shares of Class A Common Stock underlying the warrants, multiplied by the excess of the “historical fair market value” (defined below) less the exercise price of the warrants by (y) the historical fair market value. For these purposes, the “historical fair market value” shall mean the average last reported sale price of the Class A Common Stock for the ten trading days ending on the third trading day prior to the date on which the notice of warrant exercise is sent to the warrant agent.
— Redemption of warrants when the price per share of Class
A Common Stock equals or exceeds $10.00,”
Trading Symbol and Market
Transfer Agent and Warrant Agent
The transfer agent for our common stock and warrant agent for our warrants is Continental Stock Transfer & Trust Company. We have agreed to indemnify Continental in its roles as transfer agent and warrant agent, its agents and each of its stockholders, directors, officers and employees against all liabilities, including judgments, costs and reasonable counsel fees that may arise out of acts performed or omitted for its activities in that capacity, except for any liability due to any gross negligence, willful misconduct or bad faith of the indemnified person or entity.
115
SECURITIES ACT RESTRICTIONS ON RESALE OF SECURITIES
Pursuant to Rule 144 under the Securities Act (“Rule 144”), a person who has beneficially owned restricted Berkshire Grey’s Class A Common Stock or Berkshire Grey’s warrants for at least six months would be entitled to sell their securities provided that (i) such person is not deemed to have been an affiliate of Berkshire Grey at the time of, or at any time during the three months preceding, a sale and (ii) Berkshire Grey is subject to periodic reporting requirements under the Exchange Act for at least three months before the sale and have filed all required reports under Section 13 or 15(d) of the Exchange Act during the 12 months (or such shorter period as Berkshire Grey was required to file reports) preceding the sale.
Persons who have beneficially owned restricted shares of Berkshire Grey’s Class A Common Stock or Berkshire Grey’s warrants for at least six months but who are affiliates of Berkshire Grey at the time of, or at any time during the three months preceding, a sale, would be subject to additional restrictions, by which such person would be entitled to sell within any three-month period only a number of securities that does not exceed the greater of:
| • | 1% of the total number of shares of Class A Common Stock then outstanding; or |
| • | the average weekly reported trading volume of Class A Common Stock during the four calendar weeks preceding the filing of a notice on Form 144 with respect to the sale. |
Sales by affiliates of Berkshire Grey under Rule 144 are also limited by manner of sale provisions and notice requirements and to the availability of current public information about Berkshire Grey.
Restrictions on the Use of Rule 144 by Shell Companies or Former Shell Companies
Rule 144 is not available for the resale of securities initially issued by shell companies (other than business combination related shell companies) or issuers that have been at any time previously a shell company. However, Rule 144 also includes an important exception to this prohibition if the following conditions are met:
| • | the issuer of the securities that was formerly a shell company has ceased to be a shell company; |
| • | the issuer of the securities is subject to the reporting requirements of Section 13 or 15(d) of the Exchange Act; |
| • | the issuer of the securities has filed all Exchange Act reports and material required to be filed, as applicable, during the preceding 12 months (or such shorter period that the issuer was required to file such reports and materials), other than Current Reports on Form 8-K; and |
| • | at least one year has elapsed from the time that the issuer filed current Form 10 type information with the SEC reflecting its status as an entity that is not a shell company. |
As a result, RAAC Management LLC will be able to sell its founder shares and private placement warrants, as applicable, pursuant to Rule 144 without registration one year after the consummation of the Business Combination.
116
PLAN OF DISTRIBUTION
We are registering 205,457,460 shares of Class A common stock and 5,166,667 Private Placement Warrants for possible sale by the Selling Securityholders from time to time and up to 14,750,000 shares of Class A common stock upon the exercise of outstanding warrants. We are required to pay all fees and expenses incident to the registration of the shares of our Class A common stock and the Private Placement Warrants to be offered and sold pursuant to this prospectus.
The shares of Class A common stock and Private Placement Warrants beneficially owned by the Selling Securityholders covered by this prospectus may be offered and sold from time to time by the Selling Securityholders. The term “Selling Securityholders” includes donees, pledgees, transferees or other successors in interest selling securities received after the date of this prospectus from a Selling Securityholder as a gift, pledge, partnership distribution or other transfer. The Selling Securityholders will act independently of us in making decisions with respect to the timing, manner and size of each sale. Such sales may be made on one or more exchanges or in thecounter market or otherwise, at prices and under terms then prevailing or at prices related to the then-current market price or in negotiated transactions. The Selling Securityholders may dispose of their securities by one or more of, or a combination of, the following methods:
over-the-
| • | distributions to members, partners, stockholders or other equityholders of the Selling Securityholders; |
| • | purchases by a broker-dealer as principal and resale by such broker-dealer for its own account pursuant to this prospectus; |
| • | ordinary brokerage transactions and transactions in which the broker solicits purchasers; |
| • | block trades in which the broker-dealer so engaged will attempt to sell the securities as agent but may position and resell a portion of the block as principal to facilitate the transaction; |
| • | an over-the-counter |
| • | through trading plans entered into by a Selling Securityholder pursuant to Rule 10b5-1 under the Exchange Act, that are in place at the time of an offering pursuant to this prospectus and any applicable prospectus supplement hereto that provide for periodic sales of their securities on the basis of parameters described in such trading plans; |
| • | to or through underwriters or broker-dealers; |
| • | in “at the market” offerings, as defined in Rule 415 under the Securities Act, at negotiated prices, at prices prevailing at the time of sale or at prices related to such prevailing market prices, including sales made directly on a national securities exchange or sales made through a market maker other than on an exchange or other similar offerings through sales agents; |
| • | in privately negotiated transactions; |
| • | in options transactions; |
| • | through a combination of any of the above methods of sale; or |
| • | any other method permitted pursuant to applicable law. |
In addition, any securities that qualify for sale pursuant to Rule 144 may be sold under Rule 144 rather than pursuant to this prospectus. A Selling Securityholder that is an entity may elect to make an
in-kind
distribution of securities to its members, partners, stockholders or other equityholders pursuant to the registration statement of which this prospectus forms a part by delivering a prospectus. To the extent that such members, partners, stockholders or other equityholders are not affiliates of ours, such members, partners, stockholders or other equityholders would thereby receive freely tradable securities pursuant to a distribution pursuant to the registration statement of which this prospectus forms a part.To the extent required, this prospectus may be amended or supplemented from time to time to describe a specific plan of distribution. In connection with distributions of the securities or otherwise, the Selling
117
Securityholders may enter into hedging transactions with broker-dealers or other financial institutions. In connection with such transactions, broker-dealers or other financial institutions may engage in short sales of securities in the course of hedging the positions they assume with Selling Securityholders. The Selling Securityholders may also sell securities short and redeliver the securities to close out such short positions. The Selling Securityholders may also enter into option or other transactions with broker-dealers or other financial institutions that require the delivery to such broker-dealer or other financial institution of securities offered by this prospectus, which securities such broker-dealer or other financial institution may resell pursuant to this prospectus (as supplemented or amended to reflect such transaction). The Selling Securityholders may also pledge securities to a broker-dealer or other financial institution, and, upon a default, such broker-dealer or other financial institution, may effect sales of the pledged securities pursuant to this prospectus (as supplemented or amended to reflect such transaction).
A Selling Securityholder may enter into derivative transactions with third parties, or sell securities not covered by this prospectus to third parties in privately negotiated transactions. If the applicable prospectus supplement indicates, in connection with those derivatives, the third parties may sell securities covered by this prospectus and the applicable prospectus supplement, including in short sale transactions. If so, the third party may use securities pledged by any Selling Securityholder or borrowed from any Selling Securityholder or others to settle those sales or to close out any related open borrowings of stock, and may use securities received from any Selling Securityholder in settlement of those derivatives to close out any related open borrowings of stock. The third party in such sale transactions will be an underwriter and will be identified in the applicable prospectus supplement (or a post-effective amendment). In addition, any Selling Securityholder may otherwise loan or pledge securities to a financial institution or other third party that in turn may sell the securities short using this prospectus. Such financial institution or other third party may transfer its economic short position to investors in our securities or in connection with a concurrent offering of other securities.
In effecting sales, broker-dealers or agents engaged by the Selling Securityholders may arrange for other broker-dealers to participate. Broker-dealers or agents may receive commissions, discounts or concessions from the Selling Securityholders in amounts to be negotiated immediately prior to the sale.
In offering the securities covered by this prospectus, the Selling Securityholders and any broker-dealers who execute sales for the Selling Securityholders may be deemed to be “underwriters” within the meaning of the Securities Act in connection with such sales. Any profits realized by the Selling Securityholders and the compensation of any broker-dealer may be deemed to be underwriting discounts and commissions.
In order to comply with the securities laws of certain states, if applicable, the securities must be sold in such jurisdictions only through registered or licensed brokers or dealers. In addition, in certain states the securities may not be sold unless they have been registered or qualified for sale in the applicable state or an exemption from the registration or qualification requirement is available and is complied with.
We have advised the Selling Securityholders that the anti-manipulation rules of Regulation M under the Exchange Act may apply to sales of securities in the market and to the activities of the Selling Securityholders and their affiliates. In addition, we will make copies of this prospectus available to the Selling Securityholders for the purpose of satisfying the prospectus delivery requirements of the Securities Act. The Selling Securityholders may indemnify any broker-dealer that participates in transactions involving the sale of the securities against certain liabilities, including liabilities arising under the Securities Act.
At the time a particular offer of securities is made, if required, a prospectus supplement will be distributed that will set forth the number of securities being offered and the terms of the offering, including the name of any underwriter, dealer or agent, the purchase price paid by any underwriter, any discount, commission and other item constituting compensation, any discount, commission or concession allowed or reallowed or paid to any dealer, and the proposed selling price to the public.
118
A holder of warrants may exercise its warrants in accordance with the warrant agreement on or before the expiration date by surrendering, at the office of the warrant agent, Continental Stock Transfer & Trust Company, the certificate evidencing such warrant, an election to purchase, properly completed and duly executed, accompanied by full payment of the exercise price and any and all applicable taxes due in connection with the exercise of the warrant, subject to any applicable provisions relating to cashless exercises in accordance with the warrant agreement.
119
LEGAL MATTERS
Goodwin Procter LLP, Boston, Massachusetts has passed upon the validity of the securities of Berkshire Grey, Inc. offered by this prospectus and certain other legal matters related to this prospectus.
120
EXPERTS
The audited financial statements of Berkshire Grey, Inc. and its subsidiaries (referred to as Legacy Berkshire Grey in the registration statement) as of and for the years ended December 31, 2020 and 2019 included in this prospectus and elsewhere in the registration statement have been so included in reliance upon the report of Grant Thornton LLP, independent registered public accountants, upon authority of said firm as experts in accounting and auditing.
The financial statements of Revolution Acceleration Acquisition Corp as of December 31, 2020, and for the period from September 10, 2020 (inception) through December 31, 2020 appearing in this prospectus, have been audited by Marcum LLP, independent registered public accounting firm, as set forth in their report (which contain an explanatory paragraph relating to the substantial doubt about the ability of Revolution Acceleration Acquisition Corp to continue as a going concern as described in Note 1 to the financial statements) appearing elsewhere herein, and are included in reliance upon such report given on the authority of such firm as experts in accounting and auditing.
121
WHERE YOU CAN FIND MORE INFORMATION
We file annual, quarterly and current reports, proxy statements and other information with the SEC. We have also filed with the SEC a registration statement on Form
S-1
under the Securities Act with respect to the securities offered by this prospectus. This prospectus, which constitutes a part of the registration statement, does not contain all of the information set forth in the registration statement or the exhibits and schedules filed therewith. For further information about us and the Class A common stock offered hereby, we refer you to the registration statement and the exhibits and schedules filed thereto.Statements contained in this prospectus regarding the contents of any contract or any other document that is filed as an exhibit to the registration statement are not necessarily complete, and each such statement is qualified in all respects by reference to the full text of such contract or other document filed as an exhibit to the registration statement. Our filings with the SEC are available to the public at a website maintained by the SEC located at http://www.sec.gov. Those filings are also available to the public on, or accessible through, our website under the heading “Investor Relations” at www.berkshiregrey.com. The information contained on, or otherwise accessible through, our website, however, is not, and should not be deemed to be, a part of this prospectus. You may request copies of this prospectus and any of the documents incorporated by reference into this prospectus or other publicly available information concerning Berkshire Grey, without charge, by written request to Chief Executive Officer at Berkshire Grey, Inc. 140 South Road Bedford, Massachusetts 01730, by telephone request at (833)
848-9900;
or by email request to BG@gatewayir.com.122
INDEX TO FINANCIAL STATEMENTS
BERKSHIRE GREY, INC. (referred to as Legacy Berkshire Grey in this registration statement)
Audited Consolidated Financial Statements as of and for the Years Ended December 31, 2020 and 2019
| F-2 | ||
Consolidated Financial Statements | ||
| F-3 | ||
| F-4 | ||
| F-5 | ||
| F-6 | ||
| F-7 – F-30 |
Unaudited Consolidated Financial Statements as of and for the Six Months Ended June 30, 2021 and 2020
Consolidated Financial Statements | ||
| F-31 | ||
| F-32 | ||
| F-33 | ||
| F-34 | ||
| F- 35 – F-51 |
REVOLUTION ACCELERATION ACQUISITION CORP FINANCIAL STATEMENTS
Audited Financial Statements as of December 31, 2020 and for the Period from September 10, 2020 (Inception) Through December 30, 2020
| F-52 | ||
Financial Statements: | ||
| F-53 | ||
| F-54 | ||
| F-55 | ||
| F-56 | ||
| F-57 – F-75 |
Unaudited Condensed Consolidated Financial Statements as of and for the Six Months Ended June 30, 2021
| F-76 | ||
| F-77 | ||
| F-78 | ||
| F-79 | ||
| F-80 – F-98 |
F-1
REPORT OF INDEPENDENT REGISTERED PUBLIC ACCOUNTING FIRM
Board of Directors and Stockholders
Berkshire Grey, Inc.
Opinion on the financial statements
We have audited the accompanying consolidated balance sheets of Berkshire Grey, Inc. and subsidiaries (the “Company”) as of December 31, 2020 and 2019, the related consolidated statements of operations and comprehensive loss, mezzanine equity and stockholders’ deficit, and cash flows for the years ended December 31, 2020 and 2019, and the related notes (collectively referred to as the “financial statements”). In our opinion, the consolidated financial statements present fairly, in all material respects, the financial position of the Company as of December 31, 2020 and 2019, and the results of its operations and its cash flows for the years ended December 31, 2020 and 2019, in conformity with accounting principles generally accepted in the United States of America.
Basis for opinion
These financial statements are the responsibility of the Company’s management. Our responsibility is to express an opinion on the Company’s financial statements based on our audits. We are a public accounting firm registered with the Public Company Accounting Oversight Board (United States) (“PCAOB”) and are required to be independent with respect to the Company in accordance with U.S. federal securities laws and the applicable rules and regulations of the Securities and Exchange Commission and the PCAOB.
We conducted our audits in accordance with the standards of the PCAOB and in accordance with auditing standards generally accepted in the United States of America. Those standards require that we plan and perform the audit to obtain reasonable assurance about whether the financial statements are free of material misstatement, whether due to error or fraud. The Company is not required to have, nor were we engaged to perform, an audit of its internal control over financial reporting. As part of our audits we are required to obtain an understanding of internal control over financial reporting but not for the purpose of expressing an opinion on the effectiveness of the Company’s internal control over financial reporting. Accordingly, we express no such opinion.
Our audits included performing procedures to assess the risks of material misstatement of the financial statements, whether due to error or fraud, and performing procedures that respond to those risks. Such procedures include examining, on a test basis, evidence regarding the amounts and disclosures in the financial statements. Our audits also included evaluating the accounting principles used and significant estimates made by management, as well as evaluating the overall presentation of the financial statements. We believe that our audits provide a reasonable basis for our opinion.
/s/ GRANT THORNTON LLP
We have served as the Company’s auditor since 2019.
Boston, Massachusetts
March 19, 2021
F-2
BERKSHIRE GREY, INC.
Consolidated Balance Sheets
(in thousands, except share data and per share data)
December 31, | ||||||||
2020 | 2019 | |||||||
ASSETS | ||||||||
Current assets: | ||||||||
Cash and cash equivalents | $ | 93,857 | $ | 159,298 | ||||
Accounts receivable | 16,752 | 565 | ||||||
Inventories | 758 | 403 | ||||||
Deferred fulfillment costs (see Note 7 for related party transactions) | 3,461 | 20,966 | ||||||
Prepaid expenses | 804 | 752 | ||||||
Other current assets | 132 | 229 | ||||||
Total current assets | 115,764 | 182,213 | ||||||
Property and equipment – net | 9,403 | 1,691 | ||||||
Restricted cash | 1,121 | 150 | ||||||
Other non-current assets | 101 | 64 | ||||||
Total assets | $ | 126,389 | $ | 184,118 | ||||
LIABILITIES, MEZZANINE EQUITY, AND STOCKHOLDERS’ DEFICIT | ||||||||
Current liabilities: | ||||||||
Accounts payable | $ | 1,681 | $ | 1,239 | ||||
Accrued expenses | 7,771 | 4,346 | ||||||
Contract liabilities (see Note 7 for related party transactions) | 22,331 | 30,637 | ||||||
Other current liabilities | 182 | 72 | ||||||
Total current liabilities | 31,965 | 36,294 | ||||||
Warrant liability | — | 3,922 | ||||||
Share-based compensation liability | 3,047 | 350 | ||||||
Other non-current liabilities | 2,057 | 140 | ||||||
Total liabilities | 37,069 | 40,706 | ||||||
Commitments and contingencies (Note 13) | ||||||||
Mezzanine equity: | 0 | 0 | ||||||
Redeemable convertible preferred stock – $0.001 par value; 32,055,463 shares authorized; 28,207,674 shares issued and outstanding at December 31, 2020 and 2019; aggregate liquidation preference of $239,447 as of December 31, 2020 and 2019 (Note 8) | 223,442 | 223,442 | ||||||
Stockholders’ deficit: | ||||||||
Common stock – $0.001 par value; 44,531,024 and 42,000,000 shares authorized, 4,814,981 and 4,713,349 shares issued, and 3,623,109 and 3,521,477 outstanding at December 31, 2020 and 2019, respectively | 3 | 3 | ||||||
Additional paid-in capital | 17,578 | 14,028 | ||||||
Accumulated deficit | (151,704 | ) | (94,061 | ) | ||||
Accumulated other comprehensive income | 1 | — | ||||||
Total stockholders’ deficit | (134,122 | ) | (80,030 | ) | ||||
Total liabilities, mezzanine equity, and stockholders’ deficit | $ | 126,389 | $ | 184,118 | ||||
The accompanying notes are an integral part of these consolidated financial statements.
F-3
BERKSHIRE GREY, INC.
Consolidated Statements of Operations and Comprehensive Loss
(in thousands, except share and per share data)
Years Ended December 31, | ||||||||
2020 | 2019 | |||||||
Revenue (see Note 7 for related party transactions) | $ | 34,835 | $ | 7,972 | ||||
Cost of revenue (see Note 7 for related party transactions) | 32,009 | 9,974 | ||||||
Gross profit (loss) | 2,826 | (2,002 | ) | |||||
Operating expenses: | ||||||||
General and administrative expense | 15,935 | 15,152 | ||||||
Sales and marketing expense | 12,910 | 5,272 | ||||||
Research and development expense | 35,806 | 27,805 | ||||||
Total operating expenses | 64,651 | 48,229 | ||||||
Loss from operations | (61,825 | ) | (50,231 | ) | ||||
Interest income | 280 | 579 | ||||||
Other income | 3,907 | 142 | ||||||
Net loss before income taxes | (57,638 | ) | (49,510 | ) | ||||
Income tax | 5 | 1 | ||||||
Net loss | $ | (57,643 | ) | $ | (49,511 | ) | ||
Other comprehensive income (loss): | ||||||||
Net foreign currency translation adjustments | 1 | — | ||||||
Total comprehensive loss | $ | (57,642 | ) | $ | (49,511 | ) | ||
Net loss per common share – basic and diluted | $ | (16.22 | ) | $ | (17.77 | ) | ||
Weighted average shares outstanding – basic and diluted | 3,554,478 | 2,786,510 | ||||||
The accompanying notes are an integral part of these consolidated financial statements.
F-4
BERKSHIRE GREY, INC.
Consolidated Statements of Mezzanine Equity and Stockholders’ Deficit
(in thousands, except share data)
Mezzanine equity Series A and B | Common stock | Additional paid-in capital | Accumulated deficit | Accumulated other comprehensive income | Total stockholders’ deficit | |||||||||||||||||||||||||||
Shares | Amount | Shares | Amount | |||||||||||||||||||||||||||||
Balance – December 31, 2018 | 18,419,514 | $ | 60,631 | 2,579,180 | $ | — | $ | 1,632 | $ | (44,550 | ) | $ | — | $ | (42,918 | ) | ||||||||||||||||
Issuance of redeemable convertible preferred stock, net of issuance costs of $7,675 | 9,788,160 | 162,811 | — | — | — | — | — | — | ||||||||||||||||||||||||
Proceeds from exercise of stock options | — | — | 942,297 | 3 | 712 | — | — | 715 | ||||||||||||||||||||||||
Stock-based compensation | — | — | — | — | 11,684 | — | — | 11,684 | ||||||||||||||||||||||||
Net loss | — | — | — | — | — | (49,511 | ) | — | (49,511 | ) | ||||||||||||||||||||||
Balance – December 31, 2019 | 28,207,674 | $ | 223,442 | 3,521,477 | $ | 3 | $ | 14,028 | $ | (94,061 | ) | $ | — | $ | (80,030 | ) | ||||||||||||||||
Proceeds from exercise of stock options | — | — | 101,632 | — | 226 | — | — | 226 | ||||||||||||||||||||||||
Stock-based compensation | — | — | — | — | 3,324 | — | — | 3,324 | ||||||||||||||||||||||||
Other comprehensive income | — | — | — | — | — | — | 1 | 1 | ||||||||||||||||||||||||
Net loss | — | — | — | — | — | (57,643 | ) | — | (57,643 | ) | ||||||||||||||||||||||
Balance – December 31, 2020 | 28,207,674 | $ | 223,442 | 3,623,109 | $ | 3 | $ | 17,578 | $ | (151,704 | ) | $ | 1 | $ | (134,122 | ) | ||||||||||||||||
The accompanying notes are an integral part of these consolidated financial statements.
F-5
BERKSHIRE GREY, INC.
CONSOLIDATED STATEMENTS OF CASH FLOW
(IN THOUSANDS)
Years Ended December 31, | ||||||||
2020 | 2019 | |||||||
CASH FLOWS FROM OPERATING ACTIVITIES | ||||||||
Net loss | $ | (57,643 | ) | $ | (49,511 | ) | ||
Adjustments to reconcile net loss to net cash used in operating activities | ||||||||
Depreciation and amortization | 1,006 | 312 | ||||||
Gain on change in fair value of warrants | (3,922 | ) | (141 | ) | ||||
Gain on foreign currency transactions | 5 | — | ||||||
Stock-based compensation | 6,021 | 12,034 | ||||||
Change in operating assets and liabilities | ||||||||
Accounts receivable | (16,187 | ) | (264 | ) | ||||
Inventories | (355 | ) | (245 | ) | ||||
Deferred fulfillment costs | 17,505 | (2,992 | ) | |||||
Prepaid expenses and other assets | 8 | (335 | ) | |||||
Accounts payable | 442 | (1,713 | ) | |||||
Accrued expenses | 3,425 | 4,002 | ||||||
Contract liabilities | (8,306 | ) | 9,921 | |||||
Other liabilities | 2,027 | 111 | ||||||
Net cash used in operating activities | (55,974 | ) | (28,821 | ) | ||||
CASH FLOWS FROM INVESTING ACTIVITIES | ||||||||
Capital expenditures | (8,718 | ) | (1,818 | ) | ||||
Net cash used in investing activities | (8,718 | ) | (1,818 | ) | ||||
CASH FLOWS FROM FINANCING ACTIVITIES | ||||||||
Proceeds from exercise of stock options | 226 | 715 | ||||||
Proceeds from the issuance of Series B-2 Preferred Stock, net of issuance costs | — | 162,811 | ||||||
Proceeds from the issuance of Series B-3 Warrants, net of issuance costs | — | 4,063 | ||||||
Net cash provided by financing activities | 226 | 167,589 | ||||||
Effect of exchange rate on cash | (4 | ) | — | |||||
Net (decrease) increase in cash, cash equivalents, and restricted cash | (64,470 | ) | 136,950 | |||||
Cash, cash equivalents, and restricted cash at beginning of period | 159,448 | 22,498 | ||||||
Cash, cash equivalents, and restricted cash at end of period | $ | 94,978 | $ | 159,448 | ||||
The accompanying notes are an integral part of these consolidated financial statements.
F-6
BERKSHIRE GREY, INC.
NOTES TO THE CONSOLIDATED FINANCIAL STATEMENTS
DECEMBER 31, 2020 AND 2019
1. NATURE OF THE BUSINESS AND BASIS OF PRESENTATION
Nature of Business
Berkshire Grey is a development stage robotics company incorporated in Delaware in 2013. The Company is based in Bedford, MA and has approximately 275 employees.
Berkshire Grey is a robotics and artificial intelligence company delivering automation solutions to global retail,
e-commerce,
and logistics companies. The Company helps customers change the way they do business by combining artificial intelligence and robotics to automate commerce fulfillment. The Company’s solutions automate key fulfillment processes including pick, pack, and sort operations in customer warehouses and fulfillment centers.Basis of Presentation
The consolidated financial statements reflect the financial position, results of operations, and cash flows of Berkshire Grey, Inc. (“Berkshire Grey” or the “Company”). The accompanying consolidated financial statements include those of Berkshire Grey and its subsidiaries, after elimination of all intercompany balances and transactions. The Company prepared the accompanying consolidated financial statements in conformity with accounting principles generally accepted in the United States of America (“GAAP”).
For the Company’s subsidiaries that transact in a functional currency other than the U.S. dollar, assets and liabilities are translated into U.S. dollars at
period-end
foreign exchange rates. Revenues and expenses are translated into U.S. dollars at the average foreign exchange rates for the period. Translation adjustments are excluded from the determination of net income and are recorded in accumulated other comprehensive income (loss), a separate component of stockholders’ deficit.The Company incurred net losses and negative cash flows from operations for the years ended December 31, 2020 and 2019 and historically relied upon financing activities to fund operations. As described in Note 8, as of December 31, 2020 the Company raised approximately $227.3 million, net of issuance costs, from the issuance of preferred stock and warrants, which management believes will be sufficient to fund its current operations, projected working capital requirements, and capital spending for a period beyond the next 12 months.
2. SIGNIFICANT ACCOUNTING POLICIES
Use of Estimates
The preparation of consolidated financial statements in conformity with GAAP requires management to make estimates and assumptions which affect the reported amounts of assets and liabilities and disclosure of contingent assets and liabilities at the date of the financial statements and the reported amounts of revenue and expenses during the reporting period. These estimates and judgments include, but are not limited to, revenue recognition (including performance obligations, variable consideration and other obligations such as product returns); realizability of deferred fulfillment costs, inventory, and warranty; accounting for stock-based compensation including performance-based assessments; and accounting for income taxes and related valuation allowances. Actual results may differ from estimates.
Cash Equivalents and Restricted Cash
The Company considers all highly liquid investments with an original maturity of 90 days or less to be cash equivalents. The Company’s cash equivalents consist of money market funds. Restricted cash represents cash on deposit with a financial institution as collateral for the Company’s corporate credit cards and an irrevocable
F-7
BERKSHIRE GREY, INC.
NOTES TO THE CONSOLIDATED FINANCIAL STATEMENTS
DECEMBER 31, 2020 AND 2019
2. SIGNIFICANT ACCOUNTING POLICIES
standby letter of credit as security for the Company’s obligations under the lease for its headquarters in Massachusetts. The Company has included restricted cash as a noncurrent asset as of December 31, 2020 and 2019. A reconciliation of the amounts of cash, cash equivalents, and restricted cash from the consolidated cash flow statements to the consolidated balance sheets is as follows:
December 31, | ||||||||
2020 | 2019 | |||||||
(in thousands) | ||||||||
Cash | $ | 999 | $ | 157 | ||||
Money Market funds in Cash and Cash Equivalents | 92,858 | 159,141 | ||||||
Restricted cash | 1,121 | 150 | ||||||
Cash, cash equivalents, and restricted cash | $ | 94,978 | $ | 159,448 | ||||
Revenue Recognition
In accordance with ASC Topic 606, the Company recognizes revenue when the following criteria are met:
| • | Contract with the customer is identified; |
| • | Performance obligations in the contract is identified; |
| • | Transaction price is determined; |
| • | Transaction price is allocated to the performance obligations; and |
| • | When performance obligations are satisfied (see Note 6 for additional information). |
Fair Value Measurements
The Company’s fair value measurements are estimated pursuant to a fair value hierarchy that requires us to maximize the use of observable inputs and minimize the use of unobservable inputs. The valuation hierarchy is based upon the transparency of inputs to the valuation of an asset or liability as of the measurement date, giving highest priority to quoted prices in active markets (Level 1) and the lowest priority to unobservable data (Level 3). In some cases, the inputs used to measure fair value might fall in different levels of the fair value hierarchy. The lowest level input that is significant to a fair value measurement in its entirety determines the applicable level in the fair value hierarchy. Assessing the significance of a particular input to the fair value measurement in its entirety requires judgment, considering factors specific to the asset or liability, and may affect the valuation of the assets and liabilities and their placement within the hierarchy level. The three levels of inputs that may be used to measure fair value are defined as:
| Level 1 — | Quoted prices for identical assets and liabilities traded in active exchange markets. | |||
| Level 2 — | Observable inputs other than Level 1 that are directly or indirectly observable for the asset or liability, including quoted prices for similar assets or liabilities in active markets, quoted prices for identical or similar assets or liabilities inactive markets, or other observable inputs that can be corroborated by observable market data. | |||
| Level 3 — | Unobservable inputs supported by little or no market activity for financial instruments whose value is determined using pricing models, discounted cash flow methodologies, or similar techniques, as well as instruments for which the determination of fair value requires significant management judgment or estimation. | |||
F-8
BERKSHIRE GREY, INC.
NOTES TO THE CONSOLIDATED FINANCIAL STATEMENTS
DECEMBER 31, 2020 AND 2019
2. SIGNIFICANT ACCOUNTING POLICIES
The Company uses the assistance of third-party valuation specialists in determining the fair value of its common stock, warrants, and restricted stock. Valuation reports are evaluated through a management review process.
While the Company believes its valuation methods are appropriate and consistent with other market participants, the use of different methodologies or assumptions to determine the fair value of certain financial instruments could result in a different estimate of fair value at the reporting date. Refer to Note 10 for different methodologies used.
Concentration of Credit Risk and Significant Customers
Financial instruments which potentially expose the Company to concentrations of credit risk consist of accounts receivable and cash and cash equivalents.
At December 31, 2020 and 2019, 3 customers and 1 customer accounted for 100% of the Company’s accounts receivable balance, respectively. For the year ended December 31, 2020, the Company generated approximately 70% and 28% of revenues from 2 significant customers. For the year ended December 31, 2019, the Company generated approximately 39% and 60% of revenues from 2 significant customers. The Company believes that credit risks associated with these contracts are not significant due to the customers’ financial strength.
The Company places cash and cash equivalents with high-quality financial institutions. The Company is exposed to credit risk in the event of default by these institutions to the extent the amount recorded on the consolidated balance sheets exceeds federally insured limits.
Accounts Receivable
The Company evaluates the collectability of outstanding receivables and provides an allowance for receivables when collection becomes doubtful. Provisions are made based upon a specific review of all significant outstanding invoices and the overall quality and age of those invoices not specifically reviewed. The Company’s receivables amounted to approximately $16.8 million and $0.6 million as of December 31, 2020 and 2019, respectively. The Company believes that credit risks associated with these contracts are not significant. To date, the Company has not experienced any losses associated with accounts receivable and does not maintain an allowance for doubtful accounts.
Inventories
Inventories are stated at the lower of cost or net realizable value, with cost determined by use of the average cost method. The Company maintains an inventory reserve for the estimated amount of excess or obsolete inventory.
Contract Assets and Contract Liabilities
Contract assets represent the sale of goods or services to a customer before the Company has the right to obtain consideration from the customer. Contract assets consist of unbilled amounts at the reporting date and are transferred to accounts receivable when the rights become unconditional.
F-9
BERKSHIRE GREY, INC.
NOTES TO THE CONSOLIDATED FINANCIAL STATEMENTS
DECEMBER 31, 2020 AND 2019
2. SIGNIFICANT ACCOUNTING POLICIES
Contract liabilities represent an obligation to transfer goods or services to a customer for which the Company received advanced consideration. Contract liabilities will be recognized as revenue when the contracted deliverables are provided to our customers. See Note 6 for additional information.
Deferred Fulfillment Costs
The Company incurs costs to fulfill obligations under a contract once it is obtained, but before transferring goods or services to the customer. The Company capitalizes deferred fulfillment costs if they are directly related to a specific customer contract, generate or enhance assets used to satisfy the customer contract performance obligations in the future, and are recoverable. The Company’s deferred fulfillment costs include direct labor related to manufacturing, installation, software services, and direct materials.
Property and Equipment
Property and equipment, including significant betterments to existing facilities, are recorded at cost, less accumulated depreciation. Upon retirement or disposal, the cost and accumulated depreciation are removed from the accounts and any gain or loss is included in income. The Company reviews property and equipment for impairment upon a triggering event. If a review indicates that an impairment occurred, the Company writes down the carrying value of the assets to their fair value. Fair value is determined based on comparable market values, when available, or discounted cash flows. The Company concluded there were no triggering events for the years ended December 31, 2020 and 2019.
Depreciation and Amortization
Depreciation is recorded using the straight-line method over the shorter of the useful life or lease term, when applicable. The Company generally uses estimated useful lives of three years for machinery, furniture, equipment, and software. For leasehold improvements the Company records depreciation over the remaining lease term.
Deferred Rent and Rental Expense
Minimum rent expense is recorded using the straight-line method over the related lease term. The differences between payments required and rental expense are reflected as current and
non-current
liabilities rent in the consolidated balance sheets.Stock-Based Compensation Expense
The Company issues stock-based awards to employees and nonemployees, generally in the form of stock options. Stock-based awards are accounted for in accordance with ASC Topic 718,, (“ASC 718”). ASC 718 requires all stock-based payments, including grants of employee stock options and modifications to existing stock options, to be recognized in the statements of operations and comprehensive loss based on their fair values. Compensation expense of those awards is recognized over the requisite service period. The Company recognizes forfeitures at the time forfeitures occur.
Compensation
— Stock Compensation
The Company issued restricted stock to an executive officer which was purchased with proceeds from a partial recourse promissory note. As the underlying restricted stock was not allocated to the recourse and
non-recourse
portions of the note, the entire note is treated asnon-recourse
and the shares are treated as stock options for accounting purposes. See Notes 7 and 9 for additional information.F-10
BERKSHIRE GREY, INC.
NOTES TO THE CONSOLIDATED FINANCIAL STATEMENTS
DECEMBER 31, 2020 AND 2019
2. SIGNIFICANT ACCOUNTING POLICIES
The Company classifies stock-based compensation expense in its consolidated statements of operations in the same way the payroll costs or service payments are classified for the related stock-based award recipient.
Our stock-based awards are subject to service or performance-based vesting conditions. Compensation expense related to awards with service-based vesting conditions is recognized on a straight-line basis based on the grant date fair value over the associated service period of the award, which is generally the vesting term. Compensation expense related to awards with
pre-established
performance-based vesting conditions is recognized based on the grant date fair value over the requisite service period using the accelerated attribution method to the extent achievement of the performance condition is probable.The fair value of stock-based awards are estimated using the Black-Scholes option pricing model or a lattice model, which requires the input of highly subjective assumptions, including (i) the expected volatility of our stock, (ii) the expected term of the award, (iii) the risk-free interest rate, and (iv) expected dividends. Due to the lack of a public market for the trading of our common stock and a lack of company-specific historical and implied volatility data, estimates of expected volatility are based on the historical volatility of a group of similar companies that are publicly traded. Expected life of our stock options are estimated using the “simplified” method, whereby, the expected life equals the average of the vesting term and the original contractual term of the option. The risk-free interest rates for periods within the expected life of the option were based on the U.S. Treasury yield curve in effect during the period the options were granted.
Research and Development
Costs incurred in the research and development of the Company’s products are expensed as incurred.
Warranty
The Company accrues an estimate warranty expense based on expected warranty claims and costs to be incurred. Product warranty reserves are recorded in accrued expenses.
Income Taxes
Income taxes are recorded in accordance with ASC Topic 740,(“ASC 740”), which provides for deferred taxes using an asset and liability approach. Under this method, deferred tax assets and liabilities are determined based on the difference between the financial reporting and tax reporting basis of assets and liabilities and are measured using enacted tax rates and laws that are expected to be in effect when the differences are expected to reverse. Valuation allowances are provided if based upon the weight of available evidence, it is more likely than not that some or all of the deferred tax assets will not be realized. The Company evaluated available evidence and concluded that the Company may not realize the benefit of its deferred tax assets; therefore, a valuation allowance has been established for the full amount of the net deferred tax assets.
Income Taxes
The Company accounts for uncertain tax positions in accordance with the provisions of ASC 740. When uncertain tax positions exist, the Company recognizes the tax benefit of tax positions to the extent that the benefit will more likely than not be realized. The determination as to whether the tax benefit will more likely than not be realized is based upon the technical merits of the tax position as well as consideration of the available facts and circumstances. As of December 31, 2020 and 2019, the Company did not have any significant uncertain tax positions. The Company’s practice is to recognize interest and/or penalties related to income tax matters in income tax expense. See Note 11 for additional information.
F-11
BERKSHIRE GREY, INC.
NOTES TO THE CONSOLIDATED FINANCIAL STATEMENTS
DECEMBER 31, 2020 AND 2019
2. SIGNIFICANT ACCOUNTING POLICIES
Net Loss Per Common Share
The Company computes net loss per share in accordance with ASC 260, “Earnings per Share” which requires presentation of both basic and diluted earnings per share (“EPS”) on the face of the consolidated statement of operations. Basic EPS is computed by dividing the loss available to common shareholders (numerator) by the weighted average number of shares outstanding (denominator) during the period.
The Company has two classes of stock: (1) Common Stock and (2) Convertible Preferred Stock (“Preferred Stock”). For purposes of calculating loss per share, a company that has participating security holders (for example, the Company’s preferred stockholders) is required to utilize the
two-class
method for calculating EPS unless the treasury stock method results in lower EPS. Thetwo-class
method is an allocation of loss between the holders of common stock and a company’s participating security holders. Under thetwo-class
method, loss for the reporting period is calculated by taking the net loss for the period, less both the dividends declared in the period on participating securities (whether or not paid) and the dividends accumulated for the period on cumulative Preferred Stock (whether or not earned) for the period.The Preferred Stock has been determined to be noncumulative and as such, net loss available to common shareholders is reduced by the amount of Preferred Stock dividends declared during the period. During the years ended December 31, 2020 and 2019, 0 dividends have been declared by the Company.
Preferred Stock outstanding as of December 31, 2020 and 2019 has been excluded from the calculation of basic net loss per common share since such shares only participate in their pro rata share of earnings. Diluted EPS gives effect to all dilutive potential common shares outstanding during the period using the treasury stock method and convertible Preferred Stock using the
if-converted
method. Diluted EPS excludes all dilutive potential shares if their effect is antidilutive.For the years ended December 31, 2020 and 2019, restricted stock awards and stock options representing approximately 6.0 million and 4.1 million shares of common stock, respectively, and convertible preferred shares representing approximately 28.2 million and 21.3 million shares of common stock, respectively, were excluded from the computation of diluted earnings per share as their effect would have been antidilutive. Accordingly, basic and diluted net loss per share are the same for both years.
Recent Accounting Pronouncements
In February 2016, the FASB issued ASUThis guidance requires a dual approach for lessee accounting under which a lessee will account for leases as finance leases or operating leases. Both finance leases and operating leases will result in the lessee recognizing aasset and a corresponding lease liability on its balance sheet, with differing methodology for income statement recognition. In March 2019, the FASB issued. This update clarified that entities are exempt from disclosing the effect of the change on income from continuing operations, net income, and, which defers the effective date of ASU
2016-02,
Leases (Topic 842).
right-of-use
ASU 2019-01,
Leases (Topic 842): Codification Improvements
related per-share amounts,
if applicable, for the interim periods after adoption of ASC 842. In June 2020, the FASB issued ASU2020-05,
Revenue from Contracts with Customers (Topic 606) and Leases (Topic 842)
— Effective Dates for Certain Entities
2016-02
for private entities. This guidance is effective for the Company for fiscal years beginning after December 15, 2021 and interim periods beginning after December 15, 2022, and early adoption is permitted. A modified retrospective approach is required for all leases existing or entered into after the beginning of the earliest comparative period in the financial statements. The Company is currently assessing the impact that adoption of this ASU will have on its consolidated financial statements.F-12
BERKSHIRE GREY, INC.
NOTES TO THE CONSOLIDATED FINANCIAL STATEMENTS
DECEMBER 31, 2020 AND 2019
2. SIGNIFICANT ACCOUNTING POLICIES
In June 2016, the FASB issued ASU. This ASU amends the impairment model by requiring entities to use a forward-looking approach based on expected losses rather than incurred losses to estimate credit losses on certain types of financial instruments. This may result in the earlier recognition of allowances for losses. The guidance is effective for the Company for fiscal years beginning after December 15, 2022, including interim periods within those fiscal years, with early adoption permitted. The Company does not expect the adoption of this ASU to have a significant impact on its consolidated financial statements.
2016-13,
Measurement of Credit Losses on Financial Instruments
In December 2019, the FASB issued ASU. The ASU simplifies the accounting for income taxes by removing certain exceptions to the general principles as well as clarifying and amending existing guidance to improve consistent application. The amendments to this ASU are effective for fiscal years, and interim periods within those fiscal years, beginning after December 15, 2021, with early adoption permitted. Depending on the amendment, adoption may be applied on the retrospective, modified retrospective or prospective basis. The Company is currently assessing the impact that adoption of this ASU will have on its consolidated financial statements.
2019-12,
Income Taxes
— Simplifying the Accounting for Income Taxes
Initial Adoption of New Accounting Policies
In June 2018, the FASB issued ASU, as part of an initiative to reduce the cost and complexity in financial reporting and improve the usefulness of the information provided related to share-based payment transaction for acquiring goods and services from nonemployees. Under ASUthe fair value of awards granted to nonemployees at each reporting date until the awards vest (the date the vesting condition is achieved). Instead, grants to nonemployees will be valued and accounted for much in the same way as awards to employees, including the ability to use the simplified method/practical expedient when determining the expected term assumption. The Company adopted this ASU as of January 1, 2019 using the modified retrospective basis. The adoption of the ASU did not have a material impact on the consolidated financial statements.
2018-07,
Compensation-Stock Compensation (Topic 718): Improvements to Nonemployee Share-Based Payment Accounting
2018-07,
the guidance under ASC505-50
is superseded as ASC 718 is expanded to include awards to nonemployees. In general, companies will no longer be required to remeasure (i.e.,mark-to-market)
In August 2018, the FASB issued ASU. This ASU eliminates, modifies, and adds disclosure requirements for fair value measurements. The amendments in this ASU are effective for the Company for fiscal years, and for interim periods within those fiscal years, beginning after December 15, 2019, with early adoption permitted. The Company adopted this ASU as of January 1, 2020. The adoption of the ASU did not have a material impact on the consolidated financial statements and related disclosures.
No. 2018-13,
Fair Value Measurement (Topic 820): Disclosure Framework
— Changes to the Disclosure Requirements for Fair Value Measurement
3. INVENTORIES
Inventories consists of work in process and finished goods of approximately $0.8 million and $0.4 million as of December 31, 2020 and 2019, respectively.
F-13
BERKSHIRE GREY, INC.
NOTES TO THE CONSOLIDATED FINANCIAL STATEMENTS
DECEMBER 31, 2020 AND 2019
4. PROPERTY AND EQUIPMENT
Property and equipment consist of the following:
December 31, | ||||||||
2020 | 2019 | |||||||
(in thousands) | ||||||||
Leasehold improvements | $ | 5,907 | $ | 333 | ||||
Machinery and equipment | 15 | 10 | ||||||
Furniture and fixtures | 714 | 158 | ||||||
Research and development equipment | 2,794 | 1,030 | ||||||
Computer hardware and software | 1,219 | 365 | ||||||
Construction in progress | 437 | 472 | ||||||
Subtotal | 11,086 | 2,368 | ||||||
Less: Accumulated depreciation | 1,683 | 677 | ||||||
Property and equipment, net | $ | 9,403 | $ | 1,691 | ||||
Depreciation expense for the years ended December 31, 2020 and 2019 was approximately $1.0 million and $0.3 million, respectively.
5. ACCRUED EXPENSES
Accrued expenses consist of the following:
December 31, | ||||||||
2020 | 2019 | |||||||
(in thousands) | ||||||||
Accrued compensation | $ | 5,424 | $ | 3,056 | ||||
Accrued sales taxes payable | 879 | 142 | ||||||
Accrued professional services | 754 | 0 | ||||||
Accrued materials | 401 | 290 | ||||||
Accrued other | 272 | 541 | ||||||
Accrued warranty | 41 | 317 | ||||||
| $ | 7,771 | $ | 4,346 | |||||
Accrued Compensation
Accrued compensation included estimated
year-end
employee bonuses and related employee costs of approximately $3.9 million and $2.8 million at December 31, 2020 and 2019, respectively.Accrued Warranty
The Company provides a limited warranty ranging from one to three years. Estimated warranty obligations are recorded as an expense upon customer acceptance of related products. Factors that affect the estimated warranty liability include number of products accepted, historical and anticipated rates of warranty claims, cost per claim, and vendor-supported warranty programs. The Company periodically assesses the adequacy of our recorded warranty liabilities and adjusts the amounts as necessary. The amount of liability recorded is equal to the estimated costs to repair or otherwise satisfy claims made by customers.
F-14
BERKSHIRE GREY, INC.
NOTES TO THE CONSOLIDATED FINANCIAL STATEMENTS
DECEMBER 31, 2020 AND 2019
5. ACCRUED EXPENSES
Changes in our product warranty consist of the following:
December 31, | ||||||||
2020 | 2019 | |||||||
(in thousands) | ||||||||
Beginning balance | $ | 317 | $ | 0 | ||||
Accrual (reversal) for warranty expense | (136 | ) | 449 | |||||
Warranty costs incurred during period | (140 | ) | (132 | ) | ||||
Ending balance | $ | 41 | $ | 317 | ||||
6. REVENUE
The Company primarily derives its revenue from selling robotic fulfillment and material handling systems, which consist of a network of automated machinery installed at the customer location and configured to meet specified performance requirements such as accuracy, throughput and
up-time.
Revenue is recognized when control of the promised products is transferred to the customer, or when services are satisfied under the contract, in an amount that reflects the consideration the Company expects to be entitled to in exchange for those products or services (the transaction price). Revenue is recognized only to the extent that it is probable that a significant reversal of revenue will not occur. Taxes collected from customers, which are subsequently remitted to governmental authorities, are excluded from revenue.The Company’s contracts typically have multiple performance obligations that may include system delivery, installation, testing, and training. Judgment is required to determine whether performance obligations specified in these contracts are distinct and should be accounted for as separate revenue transactions for recognition purposes. The Company also provides assurance-based warranties that are not considered a distinct performance obligation. The Company allocates the total transaction price to each performance obligation in an amount based on the estimated relative standalone selling prices of the promised goods or services underlying each performance obligation. The Company uses a cost-plus margin approach to determine the stand-alone selling price for separate performance obligations.
Each customer contract is evaluated individually to determine the appropriate pattern of revenue recognition. Contracts that are recognized over time meet the criteria that the Company is creating or enhancing an asset that the customer controls. The system is delivered to the customer and control is transferred, after which point the Company performs installation and implementation services to fully integrate the system at the customer’s location. As such, revenue recognition begins upon delivery, continues throughout the installation and implementation period, and concludes upon customer acceptance. Revenue from customer contracts is generally expected to be recognized over a period of three to six months. There historically have been, and potentially will be in the future, customer contracts that contain obligations and timelines that result in revenue being recognized over extended periods, which may include periods greater than 12 months. The Company typically uses total estimated labor hours as the input to measure progress as labor hours represent work performed, which corresponds with, and thereby best depicts, the transfer of control to the customer. Installation and training services are evaluated together with the delivery of robotic fulfillment or material handling systems as a singular performance obligation.
The Company determined that the revenue of one of its robotic fulfillment system contracts should be recognized at a point in time as the contract did not meet any of the three criteria to recognize revenue over time
F-15
BERKSHIRE GREY, INC.
NOTES TO THE CONSOLIDATED FINANCIAL STATEMENTS
DECEMBER 31, 2020 AND 2019
6. REVENUE
as defined in ASC27 due to the terms within the contract. As such, the Company capitalized the related fulfillment costs, which is presented as deferred fulfillment costs on the consolidated balance sheet as of December 31, 2019. Obligations under this contract were fulfilled in March 2020 and the Company determined no similar contracts exist as of December 31, 2020.
606-10-25
Other performance obligations recognized at a point in time include the sale and delivery of spare parts and pilot agreements. Pilot agreements are typically short-term contracts designed to demonstrate the Company’s technology and ability to serve the customer. Due to the exploratory nature of pilot agreements, revenue is recognized at a point in time once the evaluation activities are complete.
Other performance obligations recognized over time include, but are not limited to, maintenance, extended support, and research services, which are recognized ratably on a straight-line-basis as the Company assumes an even distribution of performance over the service period.
Shipping and handling activities that occur after control of a product has transferred to the customer are accounted for as fulfillment activities rather than performance obligations, as allowed under a practical expedient provided by ASC 606. Shipping and handling fees charged to customers are recognized as revenue and the related costs are included in cost of revenue at the point in time when ownership of the product is transferred to the customer.
The following table disaggregates revenue by timing of transfer of goods or services:
Years Ended December 31, | ||||||||
2020 | 2019 | |||||||
(in thousands) | ||||||||
Transferred over time | $ | 10,045 | $ | 7,872 | ||||
Transferred at a point in time | 24,790 | 100 | ||||||
Total Revenue | $ | 34,835 | $ | 7,972 | ||||
Payment terms offered to customers are defined in contracts and do not include a significant financing component. Payment milestones typically exist throughout the course of a contract and generally occur upon signing of an agreement, delivery of a system, start and completion of installation and testing, and upon acceptance of the system. The nature of the Company’s contracts may give rise to variable consideration, typically related to fees charged for shipping and handling. The Company generally estimates such variable consideration at the most likely amount. In addition, the Company includes the estimated variable consideration in the transaction price to the extent that it is probable that a significant reversal in the amount of cumulative revenue recognized will not occur when the related uncertainty is resolved. These estimates are based on historical experience and the Company’s best judgment at the time. Because of the certainty in estimating these amounts, they are included in the transaction price of the Company’s contracts and the associated remaining performance obligations. The Company does not disclose the value of unsatisfied performance obligations for contracts with an original expected duration of one year or less.
Contracts may be modified to account for changes in contract specifications and requirements. Contract modifications exist when the modification either creates new or changes the existing enforceable rights and obligations. Most of the Company’s contract modifications are for goods or services that are not distinct from the existing contract due to the significant integration service provided in the context of the contract and are
F-16
BERKSHIRE GREY, INC.
NOTES TO THE CONSOLIDATED FINANCIAL STATEMENTS
DECEMBER 31, 2020 AND 2019
6. REVENUE
accounted for as if they were part of that existing contract. The effects of a contract modification on the transaction price, and the measure of progress for the performance obligation to which it relates, are recognized as an adjustment to revenue on a cumulative
catch-up
basis.Deferred Fulfillment Costs and Contract Balances
As of December 31, 2020 and 2019, the Company incurred $3.5 million and $21.0 million of net deferred fulfillment costs, respectively.
Contract liabilities in aggregate were $22.3 million and $30.6 million as of December 31, 2020 and 2019, respectively. Changes in the contract liability balance during the years ended December 31, 2020 and 2019 were due to the Company receiving additional advanced cash payments from customer contracts and the Company recognizing revenue as performance obligations were met.
The following table summarizes changes in contract liabilities during the years ended December 31, 2020 and 2019:
Contract Liabilities | ||||
(in thousands) | ||||
Contract liabilities at December 31, 2018 | $ | 20,716 | ||
Additions to contract liabilities during the period | 17,790 | |||
Revenue recognized in the period from: | ||||
Amounts included in contract liabilities at the beginning of the period | (2,111 | ) | ||
Amounts added to contract liabilities during the period | (5,758 | ) | ||
Contract liabilities at December 31, 2019 | 30,637 | |||
Additions to contract liabilities during the period | 26,398 | |||
Revenue recognized in the period from: | ||||
Amounts included in contract liabilities at the beginning of the period | (29,743 | ) | ||
Amounts added to contract liabilities during the period | (4,961 | ) | ||
Contract liabilities at December 31, 2020 | $ | 22,331 | ||
There were no significant contract asset balances for all periods presented.
7. RELATED PARTY TRANSACTIONS
In June 2019, the Company entered into two customer contracts with an affiliate of one of its primary investors. Related to these contracts, as of December 31, 2020 and 2019, the Company recorded $1.4 million and $(0.6 million) in net deferred fulfillment costs, respectively, and $4.6 million and $7.4 million in contract liabilities, respectively. For the years ended December 31, 2020 and 2019, the Company recognized approximately $9.8 million and $4.8 million in revenue and approximately $4.3 million and $2.1 million in cost of revenue related to these customer contracts, respectively.
In October 2019, the Company issued a Partial Recourse Secured Promissory Note (the “Promissory Note”) to an executive officer for approximately $9.9 million with an interest rate of 1.86% per annum compounded
F-17
BERKSHIRE GREY, INC.
NOTES TO THE CONSOLIDATED FINANCIAL STATEMENTS
DECEMBER 31, 2020 AND 2019
7. RELATED PARTY TRANSACTIONS
annually. Under the terms of the Promissory Note, the
officer
will be personally liable for 51% of the unpaid balance of the principal and any accrued interest. The entire principal amount was used to purchase 1,191,872 shares of restricted stock. The Promissory Note is collateralized by the restricted common stock. The Company determined that the entire Promissory Note must be treated asnon-recourse;
as such, the balance of the note and related accrued interest are not presented on the consolidated balance sheet. Refer to Note 9 for further information on the treatment of stock-based compensation related to these purchased shares and Note 14 for information related to anticipated repayment of the Promissory Note.8. CONVERTIBLE PREFERRED STOCK AND STOCKHOLDERS’ EQUITY
Preferred Stock
Series
B-2
Preferred Stock FinancingIn 2019 the Company issued and sold a total of 9,788,160 shares of Series
B-2
Preferred Stock for a purchase price of $17.8328 per share across three transactions, resulting in aggregate gross proceeds of approximately $174.6 million. In connection with these transactions the Company incurred costs of approximately $7.7 million, resulting in net proceeds of approximately $166.9 million.On June 28, 2019, the Company issued and sold 2,312,489 shares of the Company’s Series
B-2
Preferred Stock, par value of $0.001 per share (the “SeriesB-2
Preferred”), at an aggregate purchase price of $41.2 million (“Initial Closing”). On October 9, 2019, the Company issued and sold 5,818,595 SeriesB-2
Preferred shares at an aggregate purchase price of $103.8 million. On October 16, 2019, the Company issued an additional 1,657,076 SeriesB-2
Preferred shares at an aggregate purchase price of $29.6 million.Of the $174.6 million in proceeds raised, approximately $4.1 million was allocated to warrants that were issued in connection with the Series
B-2
Preferred Stock Financing. See discussion below and Note 10 for additional information regarding the valuation of the warrants.The Company has cumulatively raised $227.3 million,
net
of issuance costs, inventure
financing through the sale and issuance of Preferred Stock and warrants as of December 31, 2020 and 2019. The following table summarizes details of Convertible Preferred Stock authorized, issued and outstanding, and liquidation preference:December 31, 2020 and 2019 | ||||||||||||
Convertible preferred stock | ||||||||||||
Authorized shares | Shares issued and outstanding | Liquidation preference | ||||||||||
(in thousands) | ||||||||||||
Series A | 2,212,389 | 2,212,389 | $ | 500 | ||||||||
Series A-1 | 2,403,846 | 2,403,846 | 2,500 | |||||||||
Series A-2 | 4,118,126 | 4,118,126 | 11,098 | |||||||||
Series A-3 | 785,056 | 785,056 | 1,058 | |||||||||
Series A-4 | 710,321 | 710,321 | 1,531 | |||||||||
Series B | 5,385,474 | 5,385,474 | 24,100 | |||||||||
Series B-1 | 2,804,302 | 2,804,302 | 24,110 | |||||||||
Series B-2 | 11,732,302 | 9,788,160 | 174,550 | |||||||||
Series B-3 | 1,903,647 | — | — | |||||||||
| 32,055,463 | 28,207,674 | $ | 239,447 | |||||||||
F-18
BERKSHIRE GREY, INC.
NOTES TO THE CONSOLIDATED FINANCIAL STATEMENTS
DECEMBER 31, 2020 AND 2019
8. CONVERTIBLE PREFERRED STOCK AND STOCKHOLDERS’ EQUITY
Conversion Rights
Each share of Preferred Stock is convertible at the option of the holder into fully paid shares of common stock as is determined by dividing the original issue price by the applicable conversion price in effect at the time of conversion. The initial conversion price shall be equal to the original issue price. As of December 31, 2020 and 2019, each share of Preferred Stock is effectively convertible into 1 share of common stock.
Voting Rights
Each holder of outstanding shares of Preferred Stock is entitled to cast the number of votes equal to the number of whole shares of common stock into which the shares of Preferred Stock are convertible as of the record date of the voting matter.
Dividend Rights
The Company shall not declare, pay, or set aside any dividends on shares of any other class of capital stock unless the holders of the Preferred Stock then outstanding first receive for such year a dividend in the amount equal to 8% of the applicable Original Issue Price of each outstanding share of Preferred Stock. Such dividends are not cumulative. After payment of the preferred dividends, any remaining dividends shall be distributed on a pro rata basis with the common stock determined on an
as-converted
basis assuming all shares had been converted as of immediately prior to the record date of the applicable dividend or distribution. No dividends have been declared as of December 31, 2020 or 2019.Liquidation Preference
Upon a Liquidation Event (as defined in the Company’s Amended and Restated Certificate of Incorporation), no other class or series of capital stock can receive any payment unless the holders of Preferred Stock have first received a payment in an amount equal to the greater of i) the applicable original issue price, plus any dividends declared but unpaid thereon, or ii) such amount per share as would have been payable had all shares of Preferred Stock been converted into common stock (“Preferred Liquidation Amount”).
Redemption Feature
Upon a Liquidation Event (as defined in the Company’s Amended and Restated Certificate of Incorporation), if the Company does not effect a dissolution within 90 days, then the holder shall, in addition to any other right it may have, have the right, at its option, to require the Company to either redeem the outstanding shares of Preferred Stock at a price equal to their respective Preferred Liquidation Amount in cash or in certain circumstance in shares of common stock at the redemption prices set forth in the Certificate of Designation. As the Preferred Stock is contingently redeemable, the Preferred Stock is presented as “Mezzanine Equity” in the Company’s consolidated balance sheets and consolidated statements of mezzanine equity and stockholders’ deficit.
Warrants
In connection with the Series
B-2
Initial Closing, the Company issued a Warrant to purchase up to 1,903,647 shares of SeriesB-3
Preferred Stock (the “Warrants”) at an exercise price of $11.5913 per share. As discussed above, the Company allocated approximately $4.1 million of the SeriesB-2
gross proceeds to theF-19
BERKSHIRE GREY, INC.
NOTES TO THE CONSOLIDATED FINANCIAL STATEMENTS
DECEMBER 31, 2020 AND 2019
8. CONVERTIBLE PREFERRED STOCK AND STOCKHOLDERS’ EQUITY
Warrants, which are presented as a noncurrent liability on the consolidated balance sheets. The Company incurred approximately $0.2 million of issuance costs in connection with the Warrants. See Note 10 for additional information regarding the valuation of the Warrants and Note 14 for information regarding anticipated termination of the Warrants.
Duration
The Warrants expire on the earlier of the occurrence of a Liquidation Event (as defined in the Company’s Amended and Restated Certificate of Incorporation) or July 5, 2029.
Vesting
The Warrants vest in tranches, which are dependent on the Company achieving certain performance conditions.
Exercisability
The Warrants, upon vesting, are exercisable at any point until the expiration date. The Warrants are exercised by delivery of an executed form of subscription for the portion of the Warrants to be exercised, along with payment of the exercise price, either in immediately available funds or by means of a cashless exercise.
Adjustment
The stock purchase price and the number of shares purchasable upon the exercise of the Warrants shall be subject to adjustment from time to time upon the occurrence of certain events, such as stock splits or combinations, or reclassifications of Series
B-3
Preferred Stock. Upon each adjustment of the stock purchase price, the holder of the Warrants shall thereafter be entitled to purchase, at the stock purchase price resulting from such adjustment, the number of shares obtained by multiplying the stock purchase price in effect immediately prior to such adjustment by the number of shares purchasable pursuant hereto immediately prior to such adjustment, and dividing the product thereof by the stock purchase price resulting from such adjustment.Reservation of Shares
The terms of the Warrants require that all shares of Series
B-3
Preferred Stock which may be issued upon the exercise of the rights represented by this Warrant (together with all shares of common stock issuable upon conversion of such SeriesB-3
Preferred Stock) will, upon issuance, be duly authorized, validly issued, fully paid and nonassessable.Fractional Shares
No fractional shares arising out of the above formula for determining the number of shares to be issued to the holder shall be issued, and the Company shall in lieu thereof make payment to the holder of cash in the amount of such fraction multiplied by the fair market value of one share of the Warrants shares on the date of exercise.
Voting or Dividend Rights
The holders of the Warrants are not entitled to vote, receive dividends, or to exercise any of the rights of stockholders of the Company until such Warrants have been exercised.
F-20
BERKSHIRE GREY, INC.
NOTES TO THE CONSOLIDATED FINANCIAL STATEMENTS
DECEMBER 31, 2020 AND 2019
8. CONVERTIBLE PREFERRED STOCK AND STOCKHOLDERS’ EQUITY
Common Stock
Common stockholders are entitled to one vote for each share held at all meetings of stockholders. The voting, dividend, and liquidation rights of the holders of the common stock are subject to and qualified by the rights, powers, and preferences of the holders of Preferred Stock.
9. STOCK-BASED COMPENSATION
In 2013, the Company adopted the Berkshire Grey, Inc. 2013 Stock Option and Stock Purchase Plan (the “Plan”) under which the Company may grant incentive stock options, nonqualified stock options, restricted stock, unrestricted stock, restricted stock units, performance awards, or other awards that are convertible into or based on company stock. The maximum number of shares that may be issued under the Plan was 10,017,823 and 7,486,799 shares as of December 31, 2020 and 2019, respectively. Shares underlying any award that are forfeited, expired, or repurchased will again be available for grant and issuance in connection with future awards under this Plan.
Stock-based compensation expense recognized for all stock-based awards is reported in the Company’s consolidated statements of operations as follows:
Years Ended December 31, | ||||||||
2020 | 2019 | |||||||
(in thousands) | ||||||||
Cost of sales | $ | 137 | $ | 475 | ||||
General and administrative | 3,245 | 5,518 | ||||||
Sales and marketing | 1,583 | 897 | ||||||
Research and development | 1,056 | 5,144 | ||||||
Total | $ | 6,021 | $ | 12,034 | ||||
Stock Options
The Company’s Board of Directors determines the exercise price for all stock options and the vesting schedule for all equity awards. The exercise price for a stock option awarded under the Plan shall not be less than 100% of the fair market value of the Company’s common stock on the date of grant. Options granted under the Plan are exercisable in full at any time subsequent to vesting, generally vest over four years, and expire ten years from the date of grant. Options with performance-based vesting criteria vest in one or more tranches contingent upon the achievement of
pre-determined
milestones related to the development of our products, the achievement of certain organizational objectives, the achievement of specific financial performance measures, or similar metrics. The fair value of the stock options granted was evaluated on the date of grant. Per ASC 718, stock-based compensation expense is recognized for these awards over the vesting period based on the projected probability of achievement of the respective target(s). In each period, the stock-based compensation expense may be adjusted, as necessary, in response to any changes in the Company’s forecast with respect to the recipient achieving his target(s).F-21
BERKSHIRE GREY, INC.
NOTES TO THE CONSOLIDATED FINANCIAL STATEMENTS
DECEMBER 31, 2020 AND 2019
9. STOCK-BASED COMPENSATION
The Company estimates the fair value of each employee stock award on the grant date using the Black-Scholes option-pricing model based on the following assumptions regarding the fair value of the underlying common stock on each measurement date:
Years Ended December 31, | ||||||||
2020 | 2019 | |||||||
Weighted average expected volatility | 55.0 | % | 55.0 | % | ||||
Weighted average expected term (in years) | 6.1 | 6.1 | ||||||
Weighted average risk-free interest rate | 0.57 | % | 2.00 | % | ||||
Expected dividend yield | 0 | % | 0 | % | ||||
The following table summarizes stock option activity under the 2013 Plan since December 31, 2018:
Options | Weighted-Average Exercise Price | Weighted-Average Remaining Contractual Term (years) | ||||||||||
Outstanding at December 31, 2018 | 3,513,759 | $ | 1.25 | 7.9 | ||||||||
Granted | 1,077,900 | 7.04 | ||||||||||
Exercised | 942,297 | 0.76 | ||||||||||
Forfeited | 140,148 | 3.07 | ||||||||||
Outstanding at December 31, 2019 | 3,509,214 | $ | 3.09 | 7.8 | ||||||||
Granted | 2,957,409 | 6.70 | ||||||||||
Exercised | 101,632 | 2.22 | ||||||||||
Forfeited | 412,654 | 5.99 | ||||||||||
Outstanding at December 31, 2020 | 5,952,337 | $ | 4.70 | 8.0 | ||||||||
Exercisable at December 31, 2020 | 2,086,639 | $ | 1.91 | 5.6 | ||||||||
Vested or expected to vest at December 31, 2020 | 5,952,337 | $ | 4.70 | 8.0 | ||||||||
At December 31, 2020, 633,656 of the Options outstanding are subject to performance-based vesting criteria described above.
During the year ended December 31, 2020, the Company granted stock options to purchase an aggregate of 2,957,409 shares of its common stock with a weighted-average grant date fair value of $6.10. The weighted-average grant date fair value per share excludes 500,044 shares related to grants that currently have no grant date as the performance objectives have not yet been defined.
During the year ended December 31, 2019, the Company granted stock options to purchase an aggregate of 1,077,900 shares of its common stock with a weighted-average grant date fair value of $3.75.
The total intrinsic value of options exercised in the years ended December 31, 2020 and 2019 was approximately $1.1 million and $7.1 million, respectively.
F-22
BERKSHIRE GREY, INC.
NOTES TO THE CONSOLIDATED FINANCIAL STATEMENTS
DECEMBER 31, 2020 AND 2019
9. STOCK-BASED COMPENSATION
The Company recognized approximately $3.3 million and $1.1 million in stock-based compensation expense related to stock options during the years ended December 31, 2020 and 2019, respectively. As of December 31, 2020 and 2019, there was approximately $15.1 million and $4.8 million, respectively, of total unrecognized compensation cost related to
non-vested
stock options. The total unrecognized compensation cost will be adjusted for future forfeitures as they occur. As of December 31, 2020, the Company expects to recognize its remaining stock-based compensation expense over a weighted-average period of 3.4 years.Restricted Stock Sold Through Issuance of Promissory Note
In conjunction with a Partial RecoursePromissory Note issued in October 2019 (See Note 7), the Company also entered into a Restricted Stock Award Agreement with an executive officer (the “RSA Agreement”). Pursuant to the RSA Agreement, the Company granted 1,191,872 shares of common stock (the “Restricted Stock”) at a purchase price of $8.32 per share. The Restricted Stock was purchased by the executive officer with the proceeds from the Promissory Note. As the underlying Restricted Shares are not allocated to the recourse and
non-recourse
portions of the Promissory Note, the entire note is treated asnon-recourse
and the shares are treated as options for accounting purposes.The RSA Agreement contains a Repurchase Option, which causes the shares to be classified as a liability. The Repurchase Option expires six months after the shares’ respective vesting date, at which point the shares will be reclassified as equity at the fair value on such date and no further compensation cost is recognized. A portion of the awards are subject to performance-based vesting conditions based primarily on financial performance of the Company and a portion are only subject to time and service-based vesting conditions over a four-year period. The Company will remeasure the fair value of the award at each reporting period until settlement. The Company measured compensation cost for the shares
(in-substance
stock options) based on the fair value on the grant date using a lattice-based option pricing model. The Company recognizes compensation cost over the requisite service period with an offsetting credit to a share-based liability.The underlying shares of Restricted Stock are not considered outstanding until the vesting conditions have been achieved and the Promissory Note has been paid. As of December 31, 2020, 173,815 shares of Restricted Stock have vested, and NaN were forfeited.
The Company recognized approximately $2.7 million and $0.4 million in stock-based compensation expense related to the Restricted Stock during the years ended December 31, 2020 and 2019, respectively. The expense is presented in the Company’s consolidated statements of operations as general and administrative expense. As of December 31, 2020, there was approximately $5.7 million of total unrecognized compensation cost related to the Restricted Stock.
Tender Offer
In connection with the Series
B-2
Initial Closing discussed in Note 8, an investor commenced a tender offer on September 3, 2019 through October 9, 2019 to purchase up to 3,616,930 shares (the “Tender Offer”) of the then-outstanding shares of common stock and Preferred Stock at an offer price of $16.05 per share. Existing investors, employees, and advisors of the Company were eligible to participate and tender up to 30% of their outstanding shares of capital stock upon commencement of the Tender Offer. Shareholders sold a total of 1,370,620 shares of common stock and common stock issuable upon exercise of vested options in the Tender Offer.F-23
BERKSHIRE GREY, INC.
NOTES TO THE CONSOLIDATED FINANCIAL STATEMENTS
DECEMBER 31, 2020 AND 2019
9. STOCK-BASED COMPENSATION
Management determined there was a compensatory element to the Tender Offer, resulting in the excess of the purchase price over the fair value of the common shares being considered compensation for employee services. The Company recorded $10.6 million in stock-based compensation expense during the year ended December 31, 2019 related to the Tender Offer.
10. FAIR VALUE OF FINANCIAL INSTRUMENTS
Recurring Fair Value Measurements
The following table summarizes information about the Company’s financial assets and liabilities measured at fair value on a recurring basis and indicates the level of the fair value hierarchy used to determine such fair values:
December 31, 2020 | ||||||||||||||||
Level 1 | Level 2 | Level 3 | Total | |||||||||||||
(in thousands) | ||||||||||||||||
Assets | ||||||||||||||||
Money Market funds in Cash and Cash Equivalents | $ | 92,858 | $ | — | $ | — | $ | 92,858 | ||||||||
Total Assets | $ | 92,858 | $ | — | $ | — | $ | 92,858 | ||||||||
Liabilities: | ||||||||||||||||
Restricted Stock | $ | — | $ | — | $ | 3,047 | $ | 3,047 | ||||||||
Warrants | — | — | — | — | ||||||||||||
Total Liabilities | $ | — | $ | — | $ | 3,047 | $ | 3,047 | ||||||||
December 31, 2019 | ||||||||||||||||
Level 1 | Level 2 | Level 3 | Total | |||||||||||||
(in thousands) | ||||||||||||||||
Assets | ||||||||||||||||
Money Market funds in Cash and Cash Equivalents | $ | 159,141 | $ | — | $ | — | $ | 159,141 | ||||||||
Total Assets | $ | 159,141 | $ | — | $ | — | $ | 159,141 | ||||||||
Liabilities: | ||||||||||||||||
Restricted Stock | $ | — �� | $ | — | $ | 350 | $ | 350 | ||||||||
Warrants | — | — | 3,922 | 3,922 | ||||||||||||
Total Liabilities | $ | — | $ | — | $ | 4,272 | $ | 4,272 | ||||||||
Money market funds were valued by the Company using quoted prices in active markets for similar securities, which represent a Level 1 measurement within the fair value hierarchy.
The values for the warrant and restricted stock liabilities are based on significant inputs not observable in the market, which represent Level 3 measurements within the fair value hierarchy.
F-24
BERKSHIRE GREY, INC.
NOTES TO THE CONSOLIDATED FINANCIAL STATEMENTS
DECEMBER 31, 2020 AND 2019
10. FAIR VALUE OF FINANCIAL INSTRUMENTS
During the years ended December 31, 2020 and 2019, there were no transfers between Level 1, Level 2, and Level 3.
Warrants to Purchase Series
B-3
Preferred StockOn July 5, 2019, in connection with the Initial Closing of the Series
B-2
Preferred Stock financing, the Company issued a Warrant to purchase up to 1,903,647 shares of SeriesB-3
Preferred Stock at an exercise price of $11.5913 per share. The Warrants expire 10 years from the date of issuance and are exercisable for Vested Shares at any time up until the earlier of either the Expiration Date or the occurrence of a Deemed Liquidation Event.The Warrants are accounted for as liabilities under ASC 480 because the underlying shares are contingently redeemable outside of the issuer’s control. The Warrants are considered freestanding financial instruments as they are separately exercisable and could be separately transferred from the Series
B-2
Preferred Stock in the related financing. Such warrant instruments are initially recorded and valued as a Level 3 liability and are accounted for at fair value with changes in fair value reported as a component of other income. There were no changes in the methodology to value the Warrants during 2020.The following table summarizes the change in fair value, as determined by Level 3 inputs, of the Warrants for the years ended December 31, 2020 and 2019:
Warrants | ||||
(in thousands) | ||||
Balance at December 31, 2018 | $ | 0 | ||
Issuance of Series B-3 Preferred Stock Warrants | 4,063 | |||
Change in fair value | (141 | ) | ||
Balance at December 31, 2019 | 3,922 | |||
Change in fair value | (3,922 | ) | ||
Balance at December 31, 2020 | $ | 0 | ||
The fair value of the Warrants to purchase shares of the Company’s Series
B-3
Preferred Stock at an exercise price of $11.59 per share, including subsequent remeasurements, was estimated using the Black-Scholes Option Pricing Model using the following assumptions:2019 | ||||
Fair Value of the underlying Instrument | $ | 4.19 – $4.43 | ||
Time to liquidity event (in years) | 3.0 | |||
Average volatility rate | 55.0 | % | ||
Risk-free interest rate | 1.62 | % | ||
As of June 30, 2020, Management determined, upon evaluation of performance milestones that the vesting of the Warrants was not probable. As such, the Warrants were revalued at $0 for the year ended December 31, 2020.
The risk-free interest rate used is the rate for a U.S. Treasury zero coupon issue with a term consistent with the remaining contractual term of the warrant on the date of measurement. The Company has not paid, and does not expect to pay, any cash dividends in the foreseeable future. The Company based the expected term
F-25
BERKSHIRE GREY, INC.
NOTES TO THE CONSOLIDATED FINANCIAL STATEMENTS
DECEMBER 31, 2020 AND 2019
10. FAIR VALUE OF FINANCIAL INSTRUMENTS
assumption on the actual remaining contractual term of the respective Warrants as of the date of measurement. The expected volatility is based on historical volatilities from guideline companies, since there is no active market for the Company’s common stock. The fair value on the date of measurement of the Series
B-3
Preferred Stock, the underlying instrument, was estimated by management with the assistance of a third-party valuation specialist.Restricted Stock Awards
In October 2019, the Company granted 1,191,872 shares of common stock (the “Restricted Stock”) at a purchase price of $8.32 per share that was purchased using the proceeds of a Promissory Note. Such shares are treated as stock options for accounting purposes and classified as a liability. Changes in fair value will be recorded as compensation cost with a corresponding increase or decrease in the share-based liability. No restricted stock awards were exercised during the years ended December 31, 2020 and 2019.
The following table summarizes the change in fair value, as determined by Level 3 inputs, of restricted stock for the years ended December 31, 2020 and 2019:
Restricted Stock | ||||
(in thousands) | ||||
Balance at December 31, 2018 | $ | 0 | ||
Issuance of Restricted Stock | 350 | |||
Change in fair value | 0 | |||
Balance at December 31, 2019 | 350 | |||
Change relating to vesting at original issuance price | 2,098 | |||
Change in fair value | 599 | |||
Balance at December 31, 2020 | $ | 3,047 | ||
The fair value of the Company’s Restricted Stock, including subsequent remeasurements, was estimated using an option pricing model using the following assumptions:
Years Ended December 31, | ||||||||
2020 | 2019 | |||||||
Fair Value of the underlying Instrument | $ | 6.70 – $13.01 | $ | 8.32 | ||||
Exercise Price | $ | 9.23 – $9.48 | $ | 9.23 – $9.34 | ||||
Time to liquidity event (in years) | 5.6 – 7.1 | 5.6 – 6.3 | ||||||
Average volatility rate | 55.0 | % | 55.0 | % | ||||
Risk-free interest rate | 0.28 – 0.93 | % | 1.69 – 1.72 | % | ||||
The risk-free interest rate used is the rate for a U.S. Treasury zero coupon issue with a term consistent with the remaining contractual term of the restricted stock on the date of measurement. The Company based the expected term assumption on the actual remaining contractual term of the respective restricted stock as of the date of measurement. The expected volatility is based on historical volatilities from guideline companies, since there is no active market for the Company’s common stock. The exercise price is calculated based on a function of the purchase price of $8.32 per share multiplied by a compounding interest rate over the expected term consistent with the repayment term of the Promissory Note. The fair value on the date of measurement of the common stock, the underlying instrument, was estimated by management with the assistance of a third-party valuation specialist.
F-26
BERKSHIRE GREY, INC.
NOTES TO THE CONSOLIDATED FINANCIAL STATEMENTS
DECEMBER 31, 2020 AND 2019
11. INCOME TAXES
During the years ended December 31, 2020 and 2019, the Company recorded 0 income tax benefits due to the losses incurred and the uncertainty of future taxable income. For financial reporting purposes, net loss before income taxes, includes the following components:
Years Ended December 31, | ||||||||
2020 | 2019 | |||||||
(in thousands) | ||||||||
Domestic | $ | (57,683 | ) | $ | (49,510 | ) | ||
Foreign | 45 | — | ||||||
Total | $ | (57,638 | ) | $ | (49,510 | ) | ||
A reconciliation of the expected income tax (benefit) computed using the federal statutory income tax rate to the Company’s effective income tax rate is as follows:
Years Ended December 31, | ||||||||
2020 | 2019 | |||||||
Federal statutory rate | 21.0 | % | 21.0 | % | ||||
State rate, net of federal benefit | 4.1 | % | 4.7 | % | ||||
Change in valuation allowance | (30.0 | )% | (33.6 | )% | ||||
Tax credits generated | 5.9 | % | 6.5 | % | ||||
Stock-based compensation | (2.1 | )% | 1.6 | % | ||||
Warrant revaluation | 1.4 | % | 0.1 | % | ||||
Permanent differences | (0.2 | )% | (0.3 | )% | ||||
Effective tax rate | 0.0 | % | 0.0 | % | ||||
Deferred tax assets and liabilities consist of the following:
Years Ended December 31, | ||||||||
2020 | 2019 | |||||||
(in thousands) | ||||||||
Federal and state net operating carryforwards | $ | 36,988 | $ | 23,277 | ||||
Research and development and other credits | 8,000 | 4,658 | ||||||
Stock-based compensation | 240 | 233 | ||||||
Deferred revenue | 228 | 95 | ||||||
Other | 1,262 | 1,166 | ||||||
Gross deferred tax assets | 46,718 | 29,429 | ||||||
Valuation allowance | (46,722 | ) | (29,429 | ) | ||||
Net deferred tax assets | $ | (4 | ) | $ | 0— | |||
Realization of deferred tax assets is dependent upon the generation of future taxable income. As required by ASC 740, the Company evaluated the positive and negative evidence bearing upon its ability to realize the deferred tax assets as of December 31, 2020 and 2019. As the Company has incurred tax losses from inception, the Company determined that it was more likely than not that the Company would not realize the benefits of federal and state net deferred tax assets. Accordingly, a full valuation allowance was established against the net deferred tax assets as of December 31, 2020 and 2019.
Income Taxes
F-27
BERKSHIRE GREY, INC.
NOTES TO THE CONSOLIDATED FINANCIAL STATEMENTS
DECEMBER 31, 2020 AND 2019
11. INCOME TAXES
As of December 31, 2020 and 2019, the Company had federal net operating loss carryforwards of $143.2 million and $89.1 million, respectively, which may be available to reduce future taxable income. The carryforwards generated in 2018 and prior expire at various dates through 2038. The $126.3 million in carryforwards generated from 2019 onwards do not expire. As of December 31, 2020 and 2019, the Company had state net operating loss carryforwards of $105.8 million and $69.6 million, respectively, which may be available to reduce future taxable income. These carryforwards expire at various dates through 2040. In addition, the Company had federal and state research and development tax credit carryforwards of $8.6 million available to reduce future tax liabilities, which will expire at various dates through 2035.
Utilization of the Company’s net operating loss (“NOL”) carryforwards and research and development (“R&D”) tax credit carryforwards may be subject to a substantial annual limitation due to ownership change limitations that have occurred previously or that could occur in the future in accordance with Section 382 of the Internal Revenue Code of 1986 (“Section 382”) as well as similar state provisions. These ownership changes may limit the amount of NOL and R&D tax credit carryforwards that can be utilized annually to offset future taxable income and taxes, respectively. In general, an ownership changes as defined by Section 382 results from transactions increasing the ownership of certain shareholders or public groups in the stock of a corporation by more than 50% over a three-year period. The Company has not conducted a study to assess whether a change of control has occurred or whether there have been multiple changes of control since inception due to significant complexity with such a study. If the Company has experienced a change of control, as defined by Section 382, at any time since inception, utilization of the NOL carryforwards or R&D tax credit carryforwards would be subject to an annual limitation under Section 382, which is determined by first multiplying the value of the Company’s stock at the time of the ownership change by the applicable long-term
tax-exempt
rate, and then could be subject to additional adjustments, as required. Any limitation may result in expiration of a portion of the NOL carryforwards or R&D tax credit carryforwards before utilization.The Company operates within multiple taxing jurisdictions and is required to file tax returns in those jurisdictions. Since the Company is in a loss carryforward position, the Company is generally subject to examination by the U.S. federal, state, and local income tax authorities for all tax years in which a loss carryforward is available. The Company is currently not under examination by the Internal Revenue Service or any other jurisdiction for any tax years. The Company has not recorded any interest or penalties on any unrecognized tax benefits since inception. The Company does not believe material uncertain tax positions have arisen to date.
12. SEGMENT INFORMATION
In its operation of the business, management, including our chief operating decision maker, who is also our Chief Executive Officer, reviews the business as one segment. The Company currently ships its products to markets in the United States and Japan. Product sales attributed to a country are based on the location of the customer to whom the products are being sold. Long-lived assets are primarily held in the United States.
Product sales by country are as follows:
Years Ended December 31, | ||||||||
2020 | 2019 | |||||||
(in thousands) | ||||||||
United States | $ | 25,020 | $ | 3,193 | ||||
Japan | 9,815 | 4,779 | ||||||
Total Revenue | $ | 34,835 | $ | 7,972 | ||||
F-28
BERKSHIRE GREY, INC.
NOTES TO THE CONSOLIDATED FINANCIAL STATEMENTS
DECEMBER 31, 2020 AND 2019
13. COMMITMENTS AND CONTINGENCIES
The Company has various
non-cancellable
operating leases for facilities that expire at various dates through 2031.In September 2016, the Company executed a lease agreement for office space in Lexington, Massachusetts. The lease has an initial term of approximately five years with the option to extend the term for one additional five-year term. In December 2018, the Company executed the First Amendment to expand the premises. In addition to rent, the lease requires the Company to pay additional amounts for taxes, insurance, maintenance and other operating expenses.
In February 2018, the Company executed a sublease agreement for additional office space in Lexington, Massachusetts. The sublease has a term of approximately three years.
In August 2019, the Company executed a lease
agreement
for office and warehouse space in Sharpsburg, Pennsylvania. The lease has an initial term of approximatelyfive years and three months
with an option to extend the term for one additional five-year term. In addition to rent, the lease requires the Company to pay additional amounts for taxes, insurance, maintenance, and other operating expenses.In February 2020, the Company executed a lease for its headquarters in Bedford, Massachusetts. The original
11-year
lease for approximately 70,748 square feet of combined office and laboratory space is set to expire in 2031, with two options to extend the term for additional periods of five years each. The landlord agreed to provide the Company a construction allowance of up to $1.4 million to be applied toward the aggregate work completed on the total space. The Company provided an approximate $1.0 million cash-collateralized irrevocable standby letter of credit as security for the Company’s obligations under the lease. The Company will also be required to pay its proportionate share of certain operating costs and property taxes applicable to the leased premises.Rental expense was approximately $2.0 million and $1.3 million for the years ended December 31, 2020 and 2019, respectively.
As of December 31, 2020, future minimum rental commitments for operating leases with
non-cancellable
terms in excess of one year were as follows:Operating Leases | ||||
Years Ending December 31, | (in thousands) | |||
2021 | $ | 2,020 | ||
2022 | 1,601 | |||
2023 | 1,462 | |||
2024 | 1,504 | |||
2025 | 1,473 | |||
Thereafter | 7,079 | |||
| $ | 15,139 | |||
F-29
BERKSHIRE GREY, INC.
NOTES TO THE CONSOLIDATED FINANCIAL STATEMENTS
DECEMBER 31, 2020 AND 2019
14. SUBSEQUENT EVENTS
On February 23, 2021 the Company entered into an Agreement and Plan of Merger (the, “Merger Agreement”) with Revolution Acceleration Acquisition Corp (“RAAC”) to affect a business combination between RAAC and the Company with the Company surviving the merger as a wholly owned subsidiary of RAAC. At the effective time of the Merger, each share of Berkshire Grey Convertible Preferred Stock and each share of Berkshire Grey Common Stock will be converted into the right to receive such number of shares of RAAC’s Class A Common Stock as defined in the Merger Agreement. The aggregate consideration for the transaction payable to Berkshire Grey existing shareholders is capped at $2.25 billion. The consummation of the proposed transaction is subject to the receipt of the requisite approval of the stockholders of RAAC and Berkshire Grey and fulfillment of certain other closing conditions.
On February 23, 2021 in conjunction with the Merger Agreement, the Company entered into a Warrant Termination Agreement (the “Warrant Termination”) with the Warrant holder (see Note 8). Pursuant to the terms of the Merger Agreement, the Warrant is to be surrendered, terminated and cancelled immediately prior to, and contingent upon, the completion of the business combination.
On February 23, 2021 the Company entered into a Stock Repurchase Agreement with an executive officer. In the Stock Repurchase Agreement, the Company’s Board of Directors authorized the repurchase of a sufficient number of vested shares of common stock from the executive officer, at a per share price equal to the per share price in the Merger Agreement. The sale and repurchase will repay in full all of the outstanding principal and accrued interest under the Promissory Note (see Note 7) and is contingent upon the completion of the business combination.
The Company evaluated its December 31, 2020 and 2019 consolidated financial statements for subsequent events through March 19, 2021 which represents the date the consolidated financial statements were available to be issued.
F-30
BERKSHIRE GREY, INC.
Consolidated Balance Sheets
(Unaudited)
(in thousands, except for share data)
June 30, | December 31, | |||||||
2021 | 2020 | |||||||
ASSETS | ||||||||
Current assets: | ||||||||
Cash and cash equivalents | $ | 52,830 | $ | 93,857 | ||||
Accounts receivable | 2,669 | 16,752 | ||||||
Inventories, net | 2,719 | 758 | ||||||
Deferred fulfillment costs (see Note 7 for related party transactions) | 13,373 | 3,461 | ||||||
Prepaid expenses | 2,537 | 804 | ||||||
Other current assets | 2,091 | 132 | ||||||
Total current assets | 76,219 | 115,764 | ||||||
Property and equipment – net | 10,466 | 9,403 | ||||||
Restricted cash | 1,121 | 1,121 | ||||||
Deferred transaction costs | 1,770 | — | ||||||
Other non-current assets | 24 | 101 | ||||||
Total assets | $ | 89,600 | $ | 126,389 | ||||
LIABILITIES, MEZZANINE EQUITY, AND STOCKHOLDERS’ DEFICIT | ||||||||
Current liabilities: | ||||||||
Accounts payable | $ | 5,412 | $ | 1,681 | ||||
Accrued expenses | 12,339 | 7,771 | ||||||
Contract liabilities (see Note 7 for related party transactions) | 23,765 | 22,331 | ||||||
Other current liabilities | 181 | 182 | ||||||
Total current liabilities | 41,697 | 31,965 | ||||||
Share-based compensation liability | 21,371 | 3,047 | ||||||
Other non-current liabilities | 1,996 | 2,057 | ||||||
Total liabilities | 65,064 | 37,069 | ||||||
Commitments and contingencies (Note 13) | 0 | 0 | ||||||
Mezzanine equity: | ||||||||
Redeemable convertible preferred stock – $0.001 par value; 32,055,463 shares authorized; 28,207,674 shares issued and outstanding at June 30, 2021 and December 31, 2020; aggregate liquidation preference of $239,447 as of June 30, 2021 and December 31, 2020 (Note 8) | 223,442 | 223,442 | ||||||
Stockholders’ deficit: | ||||||||
Common stock – $0.001 par value; 44,531,024 shares authorized, 4,814,981 shares issued, and 3,895,473 and 3,623,109 shares outstanding as of June 30, 2021 and December 31, 2020, respectively | 3 | 3 | ||||||
Additional paid-in capital | 29,237 | 17,578 | ||||||
Accumulated deficit | (228,141 | ) | (151,704 | ) | ||||
Accumulated other comprehensive income (loss) | (5 | ) | 1 | |||||
Total stockholders’ deficit | (198,906 | ) | (134,122 | ) | ||||
Total liabilities, mezzanine equity, and stockholders’ deficit | $ | 89,600 | $ | 126,389 | ||||
The accompanying notes are an integral part of these unaudited consolidated financial statements.
F-31
BERKSHIRE GREY, INC.
Consolidated Statements of Operations and Comprehensive Loss
(Unaudited)
(in thousands, except for share data)
For the Three Months Ended June 30, | For the Six Months Ended June 30, | |||||||||||||||
2021 | 2020 | 2021 | 2020 | |||||||||||||
Revenue (see Note 7 for related party transactions) | $ | 4,503 | $ | 2,752 | $ | 8,468 | $ | 29,028 | ||||||||
Cost of revenue (see Note 7 for related party transactions) | 5,240 | 2,658 | 9,938 | 27,392 | ||||||||||||
Gross (loss) profit | (737 | ) | 94 | (1,470 | ) | 1,636 | ||||||||||
Operating expenses: | ||||||||||||||||
General and administrative expense | 4,710 | 2,877 | 8,853 | 6,722 | ||||||||||||
Sales and marketing expense | 10,540 | 1,667 | 38,023 | 3,338 | ||||||||||||
Research and development expense | 15,741 | 9,163 | 28,051 | 17,200 | ||||||||||||
Total operating expenses | 30,991 | 13,707 | 74,927 | 27,260 | ||||||||||||
Loss from operations | (31,728 | ) | (13,613 | ) | (76,397 | ) | (25,624 | ) | ||||||||
Interest income, net | 3 | 8 | 14 | 273 | ||||||||||||
Other (expense) income, net | (22 | ) | 3,922 | (42 | ) | 3,926 | ||||||||||
Net loss before income taxes | (31,747 | ) | (9,683 | ) | (76,425 | ) | (21,425 | ) | ||||||||
Income tax | 7 | — | 12 | — | ||||||||||||
Net loss | $ | (31,754 | ) | $ | (9,683 | ) | $ | (76,437 | ) | $ | (21,425 | ) | ||||
Other comprehensive loss: | ||||||||||||||||
Net foreign currency translation adjustments | — | — | (6 | ) | — | |||||||||||
Total comprehensive loss | $ | (31,754 | ) | $ | (9,683 | ) | $ | (76,443 | ) | $ | (21,425 | ) | ||||
Net loss per common share – basic and diluted | $ | (8.21 | ) | $ | (2.74 | ) | $ | (20.21 | ) | $ | (6.07 | ) | ||||
Weighted average shares outstanding – basic and diluted | 3,868,554 | 3,532,100 | 3,781,658 | 3,528,301 | ||||||||||||
The accompanying notes are an integral part of these unaudited consolidated financial statements.
F-32
BERKSHIRE GREY, INC.
Consolidated Statements of Mezzanine Equity and Stockholders’ Deficit
(Unaudited)
(in thousands, except share data)
Mezzanine equity Series A and B | Common stock | Additional paid-in | Accumulated | Accumulated other comprehensive | Total stockholders’ | |||||||||||||||||||||||||||
Shares | Amount | Shares | Amount | capital | deficit | income (loss) | deficit | |||||||||||||||||||||||||
Balance – December 31, 2020 | 28,207,674 | $ | 223,442 | 3,623,109 | $ | 3 | $ | 17,578 | $ | (151,704 | ) | $ | 1 | $ | (134,122 | ) | ||||||||||||||||
Proceeds from exercise of stock options | — | — | 229,281 | — | 278 | — | — | 278 | ||||||||||||||||||||||||
Stock-based compensation | — | — | — | — | 1,165 | — | — | 1,165 | ||||||||||||||||||||||||
Other comprehensive loss | — | — | — | — | — | — | (6 | ) | (6 | ) | ||||||||||||||||||||||
Net loss | — | — | — | — | — | (44,683 | ) | — | (44,683 | ) | ||||||||||||||||||||||
Balance – March 31, 2021 | 28,207,674 | $ | 223,442 | 3,852,390 | $ | 3 | $ | 19,021 | $ | (196,387 | ) | $ | (5 | ) | $ | (177,368 | ) | |||||||||||||||
�� | ||||||||||||||||||||||||||||||||
Proceeds from exercise of stock options | — | — | 43,083 | — | 217 | — | — | 217 | ||||||||||||||||||||||||
Reclassification of restricted stock to equity | 8,836 | 8,836 | ||||||||||||||||||||||||||||||
Stock-based compensation | — | — | — | — | 1,163 | — | — | 1,163 | ||||||||||||||||||||||||
Net loss | — | — | — | — | — | (31,754 | ) | — | (31,754 | ) | ||||||||||||||||||||||
Balance – June 30, 2021 | 28,207,674 | $ | 223,442 | 3,895,473 | $ | 3 | $ | 29,237 | $ | (228,141 | ) | $ | (5 | ) | $ | (198,906 | ) | |||||||||||||||
Balance – December 31, 2019 | 28,207,674 | $ | 223,442 | 3,521,477 | $ | 3 | $ | 14,028 | $ | (94,061 | ) | $ | — | $ | (80,030 | ) | ||||||||||||||||
Proceeds from exercise of stock options | — | — | — | — | 32 | — | — | 32 | ||||||||||||||||||||||||
Stock-based compensation | — | — | — | — | 461 | — | — | 461 | ||||||||||||||||||||||||
Net loss | — | — | — | — | — | (11,742 | ) | — | (11,742 | ) | ||||||||||||||||||||||
Balance – March 31, 2020 | 28,207,674 | $ | 223,442 | 3,521,477 | $ | 3 | $ | 14,521 | $ | (105,803 | ) | $ | — | $ | (91,279 | ) | ||||||||||||||||
Proceeds from exercise of stock options | — | — | — | — | — | — | — | — | ||||||||||||||||||||||||
Stock-based compensation | — | — | — | — | 361 | — | — | 361 | ||||||||||||||||||||||||
Net loss | — | — | — | — | — | (9,683 | ) | — | (9,683 | ) | ||||||||||||||||||||||
Balance – June 30, 2020 | 28,207,674 | $ | 223,442 | 3,521,477 | $ | 3 | $ | 14,882 | $ | (115,486 | ) | $ | — | $ | (100,601 | ) | ||||||||||||||||
The accompanying notes are an integral part of these unaudited consolidated financial statements.
F-33
BERKSHIRE GREY, INC.
Consolidated Statements of Cash Flows
(Unaudited)
(in thousands)
Six Months Ended June 30, | ||||||||
2021 | 2020 | |||||||
CASH FLOWS FROM OPERATING ACTIVITIES | ||||||||
Net loss | $ | (76,437 | ) | $ | (21,425 | ) | ||
Adjustments to reconcile net loss to net cash used in operating activities | ||||||||
Depreciation and amortization | 1,217 | 158 | ||||||
Loss on disposal of fixed assets | 15 | — | ||||||
Gain on change in fair value of warrants | — | (3,921 | ) | |||||
Gain on foreign currency transactions | 37 | — | ||||||
Stock-based compensation | 29,488 | 1,259 | ||||||
Change in operating assets and liabilities | ||||||||
Accounts receivable | 14,083 | (2,914 | ) | |||||
Inventories | (1,961 | ) | (444 | ) | ||||
Deferred fulfillment costs | (9,912 | ) | 17,693 | |||||
Prepaid expenses and other assets | (3,729 | ) | (215 | ) | ||||
Accounts payable | 3,621 | (235 | ) | |||||
Accrued expenses | 2,866 | (538 | ) | |||||
Contract liabilities | 1,434 | (25,195 | ) | |||||
Other liabilities | (62 | ) | 261 | |||||
Net cash used in operating activities | (39,340 | ) | (35,516 | ) | ||||
CASH FLOWS FROM INVESTING ACTIVITIES | ||||||||
Capital expenditures | (2,139 | ) | (2,114 | ) | ||||
Net cash used in investing activities | (2,139 | ) | (2,114 | ) | ||||
CASH FLOWS FROM FINANCING ACTIVITIES | ||||||||
Proceeds from exercise of stock options | 495 | 32 | ||||||
Net cash provided by financing activities | 495 | 32 | ||||||
Effect of exchange rate on cash | (43 | ) | — | |||||
Net decrease in cash, cash equivalents, and restricted cash | (41,027 | ) | (37,598 | ) | ||||
Cash, cash equivalents, and restricted cash at beginning of period | 94,978 | 159,448 | ||||||
Cash, cash equivalents, and restricted cash at end of period | $ | 53,951 | $ | 121,850 | ||||
NON-CASH INVESTING AND FINANCING ACTIVITIES | ||||||||
Purchase of property and equipment included in accounts payable and accrued expenses | $ | 156 | $ | 1,127 | ||||
Deferred transaction costs not yet paid included in accrued expenses | $ | 1,656 | $ | — | ||||
The accompanying notes are an integral part of these unaudited consolidated financial statements.
F-34
BERKSHIRE GREY, INC.
NOTES TO THE CONDENSED CONSOLIDATED FINANCIAL STATEMENTS
(Unaudited)
1. NATURE OF THE BUSINESS AND BASIS OF PRESENTATION
Nature of Business
Berkshire Grey, Inc. (“Berkshire Grey,” “we,” “us,” “our,” or the “Company”) is a development stage Intelligent Enterprise Robotics (“IER”) company incorporated in 2013. The Company is based in Bedford, MA and has approximately 350 employees.
Berkshire Grey is a robotics and artificial intelligence company delivering automation solutions to global retail,
e-commerce,
and logistics companies. The Company helps customers change the way they do business by combining artificial intelligence and robotics to automate commerce fulfillment. The Company’s solutions automate key fulfilment processes including pick, pack, and sort operations in customer warehouses and fulfillment centers.On July, 21, 2021 the Company consummated the transactions contemplated by the Agreement and Plan of Merger (the “Merger Agreement”), dated February 23, 2021, by and among the Company, Revolution Acceleration Acquisition Corp. (“RAAC”), and Pickup Merger Corp, a Delaware corporation and a direct, wholly owned subsidiary of RAAC (“Merger Sub”). Pursuant to the Merger Agreement, RAAC amended and restated its second amended and restated certificate of incorporation and its bylaws such that RAAC changed its name to “Berkshire Grey, Inc.”. Refer to Note 1 “and Note 14 “for further details.
Merger Agreement”
Subsequent Events”
Basis of Presentation
The unaudited condensed
consolidated financial statements reflect the financial position, results of operations, and cash flows of Berkshire Grey, Inc. The accompanying unaudited condensed consolidated financial statements include those of Berkshire Grey and its subsidiaries, after elimination of all intercompany balances and transactions. The Company prepared the accompanying unaudited condensed consolidated financial statements in conformity with accounting principles generally accepted in the United States of America (“GAAP”). The information included in these unaudited condensed consolidated financial statements should be read in conjunction with the Company’s audited consolidated financial statements and notes thereto included in the Registration Statement filed by Revolution Acceleration Acquisition Corp. (“RAAC”) on Form
S-4
for the fiscal years ended December 31, 2020 and 2019. The unaudited condensed consolidated financial statements were prepared on the same basis as the audited consolidated financial statements and, in the opinion of management, reflect all adjustments (consisting of normal recurring accruals) considered necessary to present fairly the Company’s financial position, results of operations and cash flows for the periods and dates presented. Interim results are not necessarily indicative of results for the full fiscal year or any future periods.For the Company’s subsidiaries that transact in a functional currency other than the U.S. dollar, assets and liabilities are translated into U.S. dollars at
period-end
foreign exchange rates. Revenues and expenses are translated into U.S. dollars at the average foreign exchange rates for the period. Translation adjustments are excluded from the determination of net income and are recorded in accumulated other comprehensive income (loss), a separate component of stockholders’ deficit.Merger Agreement
On February 23, 2021, the Company entered into the Merger Agreement, by and among the Company, RAAC, and Merger Sub, which provides for, among other things, the merger of Merger Sub with and into the Company, with the Company being the surviving corporation of the merger and a direct, wholly owned
F-35
1.
NATURE OF THE BUSINESS AND BASIS OF PRESENTATION
subsidiary of RAAC as a consequence of the merger (the “Merger” and, together with the other transactions contemplated by the Merger Agreement, the “RAAC Business Combination”). The Merger Agreement and the transactions contemplated thereby were unanimously approved by the board of directors of the Company on February 23, 2021 and by the board of directors of RAAC.
Subject to the terms and conditions of the Merger Agreement, the consideration to be paid in respect of each share of common stock, par value $0.001 per share, of the Company (“Berkshire Grey Common Stock”) issued and outstanding (other than (i) any such shares held in the treasury of the Company and (ii) any shares held by stockholders of the Company who have perfected and not withdrawn a demand for appraisal rights) immediately prior to the effective time of the Merger will be a number of shares of newly issued Class A common stock of RAAC (with each share valued at $10.00), par value $0.0001 per share (“Class A Stock”), equal to (x) $2,250,000,000 divided by (y) the number of shares of Aggregate Fully Diluted Company Stock (as defined in the Merger Agreement). Immediately prior to the closing of the RAAC Business Combination (the “Closing”), all of the outstanding shares of each series of preferred stock, par value $0.001 per share, of the Company (“Berkshire Grey Preferred Stock”) will be converted into shares of Berkshire Grey Common Stock.
At the Closing, each outstanding option to acquire Berkshire Grey Common Stock and each award of restricted Berkshire Grey Common Stock will be converted into the right to receive an option relating to shares of RAAC Class A Stock and an award of restricted shares of RAAC Class A Stock, as applicable, upon substantially the same terms and conditions, including with respect to vesting and termination-related provisions, as existed prior to the Closing, except that the number of shares underlying such option and the exercise price and the number of shares subject to restricted stock awards, in each case, shall be determined as set forth in the Merger Agreement.
Each Company, RAAC and Merger Sub, have made representations, warranties and covenants that are customary for a transaction of this nature. The representations and warranties contained in the Merger Agreement terminate and are of no further force or effect as of the Closing.
The Merger Agreement contains additional covenants of the parties, including, among others, covenants providing for (a) the parties to conduct their respective businesses in the ordinary course through the Closing, subject to certain exceptions, (b) the Company and RAAC to cease discussions regarding alternative transactions, (c) RAAC to prepare with the Company’s cooperation and to file with the SEC a registration statement on Form
S-4
in connection with the registration under the Securities Act of 1933, as amended (the “Securities Act”), of the shares of RAAC Class A Stock issued in the Merger (the “Registration Statement”), (d) RAAC to prepare with the Company’s cooperation and to file with the SEC a proxy statement as part of the Registration Statement soliciting proxies from the Company’s stockholders to vote in favor of approval of the Merger Agreement, the transactions contemplated thereby and certain other matters in connection with the RAAC Business Combination at a RAAC stockholders’ meeting called therefor and (e) the parties providing required notice under the Hart-Scott-Rodino Antitrust Improvements Act of 1976, as amended (the “HSR Act”).In connection with the Closing, RAAC will amend and restate its second amended and restated certificate of incorporation and its bylaws such that RAAC will (i) change its name to “Berkshire Grey, Inc.” and (ii) have a board of directors initially consisting of up to thirteen (13) directors, with one director nominee designated by RAAC and up to twelve (12) director nominees to be mutually agreed by RAAC and the Company.
The consummation of the transactions contemplated by the Merger Agreement is subject to customary closing conditions for special purpose acquisition companies, including, among others: (a) approval of the Berkshire Grey Business Combination by the company’s stockholders and RAAC’s stockholders, (b) the Registration Statement being deemed effective (c) RAAC having at least $5,000,001 of net tangible assets, (d) the expiration or termination of the waiting period under the HSR Act, (e) the approval for listing on The
F-36
1.
NATURE OF THE BUSINESS AND BASIS OF PRESENTATION
Nasdaq Stock Market LLC of the shares of RAAC Class A Stock to be issued in connection with the Merger, and (f) as a condition to the Company’s obligations to consummate the Berkshire Grey Business Combination, the RAAC having at least $200,000,000 in available cash, after taking into account payments required to satisfy RAAC’s stockholder redemptions and the net proceeds from the PIPE Investment (as defined below).
The Merger Agreement may be terminated under certain customary and limited circumstances prior to the Closing, including (a) by mutual written consent of the parties, (b) by either the Company or RAAC if a final and
non-appealable
order has been issued or governmental action that permanently makes consummation of the transactions illegal or otherwise prevents or prohibits the Berkshire Grey Business Combination, (c) by the Company (i) if RAAC’s stockholders do not vote to approve the Berkshire Grey Business Combination at RAAC’s stockholders’ meeting convened for such purpose, (ii) upon a breach by RAAC or Merger Sub that gives rise to a failure of a closing condition that cannot be cured or has not been cured within 30 days’ notice and RAAC continues to use its reasonable best efforts to cure, or (iii) if the Berkshire Grey Business Combination is not consummated by August 23, 2021 (the “Outside Date”), unless the Company is in material breach of the Merger Agreement, and (d) by the RAAC (i) if approval by the Company’s stockholders is not obtained within two business days of the Registration Statement being declared effective by the SEC and delivered or otherwise made available to stockholders, (ii) upon a breach by the Company that gives rise to a failure of a closing condition that cannot be cured or has not been cured within 30 days’ notice and the Company continues its reasonable best efforts to cure, or (iii) if the Berkshire Grey Business Combination is not consummated by the Outside Date, unless RAAC is in material breach of the Merger Agreement.Subscription Agreements
Concurrently with the execution of the Merger Agreement, RAAC entered into subscription agreements (the “Subscription Agreements”) with certain investors (the “PIPE Investors”), pursuant to which the PIPE Investors have committed to purchase an aggregate amount of $165,000,000 in shares of Class A Stock at a purchase price of $10.00 per share, substantially concurrent with, and contingent upon, the Closing (the “PIPE Investment”).
The Subscription Agreements for the PIPE Investors provide for certain registration rights. In particular, RAAC is required to, within 30 calendar days following the Closing, file with the SEC a registration statement registering the resale of the securities issued pursuant to the Subscription Agreements. Additionally, RAAC is required to use its commercially reasonable efforts to have such registration statement declared effective as soon as practicable after the filing thereof, but no later than the earlier of (i) the 90th calendar day following the filing date thereof and (ii) the 10th business day after the date RAAC is notified (orally or in writing, whichever is earlier) by the SEC that the registration statement will not be “reviewed” or will not be subject to further review.
Each Subscription Agreement will terminate with no further force and effect upon the earliest to occur of: (a) such date and time as the Merger Agreement is terminated in accordance with its terms; (b) the mutual written agreement of the parties to such Subscription Agreement; (c) if any of the conditions to closing set forth in the Subscription Agreements are not satisfied on or prior to the closing of the PIPE Investment and, as a result thereof, the transactions contemplated by such Subscription Agreement fail to occur; and (d) if the consummation of the Berkshire Grey Business Combination has not occurred by the Outside Date.
Liquidity
The Company incurred net losses and negative cash flows from operations for the six months ended June 30, 2021, and historically relied upon financing activities to fund operations. As described in Note 8, as of June 30, 2021 the Company raised approximately $227.3 million, net of issuance costs, from the issuance of preferred stock and warrants. Management believes the capital raised, in combination with the transaction proceeds discussed in Note 14, will be sufficient to fund its current operations, projected working capital requirements, and capital spending for a period beyond the next 12 months.
F-37
2. SIGNIFICANT ACCOUNTING POLICIES
Use of Estimates
The preparation of consolidated financial statements in conformity with GAAP requires management to make estimates and assumptions which affect the reported amounts of assets and liabilities and disclosure of contingent assets and liabilities at the date of the financial statements and the reported amounts of revenue and expenses during the reporting period. These estimates and judgments include, but are not limited to, revenue recognition (including performance obligations, variable consideration and other obligations such as product returns); realizability of deferred fulfillment costs, inventory, and warranty; accounting for stock-based compensation including performance-based assessments; and accounting for income taxes and related valuation allowances. Actual results may differ from estimates.
Cash Equivalents and Restricted Cash
The Company considers all highly liquid investments with an original maturity of three months or less to be cash equivalents. The Company’s cash equivalents consist of money market funds. Restricted cash represents cash on deposit with a financial institution as collateral for the Company’s corporate credit cards and an irrevocable standby letter of credit as security for the Company’s obligations under the lease for its headquarters in Massachusetts.
The Company has included restricted cash as a
non-current
asset as of the six months then ended June 30, 2021 and 2020. A reconciliation of the amounts of cash, cash equivalents, and restricted cash from the consolidated cash flow statements to the consolidated balance sheets is as follows:June 30, | June 30, | |||||||
2021 | 2020 | |||||||
(in thousands) | ||||||||
Cash | $ | 1,334 | $ | 2,578 | ||||
Money Market funds in Cash and Cash Equivalents | 51,496 | 118,151 | ||||||
Restricted cash | 1,121 | 1,121 | ||||||
Cash, cash equivalents, and restricted cash | $ | 53,951 | $ | 121,850 | ||||
Concentration of Credit Risk and Significant Customers
Financial instruments which potentially expose the Company to concentrations of credit risk consist of accounts receivable and cash and cash equivalents.
Sales of the Company’s products are concentrated among specific customers. At June 30, 2021 and December 31, 2020, 5 and 3 customers accounted for 100% of the Company’s accounts receivable balance, respectively. For the three and six months ended June 30, 2021, the Company generated 100% of revenues from 5 significant customers. For the three and six months ended June 30, 2020, the Company generated approximately 100% of revenues from 2 and 3 significant customers, respectively. The Company believes that credit risks associated with these contracts are not significant due to the customers’ financial strength.
The Company places cash and cash equivalents with high-quality financial institutions. The Company is exposed to credit risk in the event of default by these institutions to the extent the amount recorded on the consolidated balance sheets exceeds federally insured limits.
Deferred Transaction Costs and Transaction Costs Payable
As part of the transaction with RAAC, the Company has accrued direct and incremental transaction costs related to the merger which will be deducted from the combined entity’s additional
paid-in
capital at the closing of the transaction when the proceeds are received.F-38
2. SIGNIFICANT ACCOUNTING POLICIES
(cont.)
As of June 30, 2021, the Company had recorded $1.8 million of transaction costs payable to advisers, which is reported as a
non-current
asset on the consolidated balance sheet.Net Loss Per Common Share
Basic EPS is computed by dividing the loss available to common shareholders (numerator) by the weighted average number of shares outstanding (denominator) during the period. Diluted income per share is calculated using the Company’s weighted-average outstanding common shares including the dilutive effect of stock awards as determined under the treasury stock method and convertible Preferred Stock using the
if-converted
method. Diluted EPS excludes all dilutive potential shares if their effect is antidilutive.For the six months ended June 30, 2021 and 2020, restricted stock awards and stock options representing approximately 5.7 million and 4.1 million shares of common stock, respectively, and convertible preferred shares representing approximately 28.2 million shares of common stock were excluded from the computation of diluted earnings per share as their effect would have been antidilutive. Accordingly, basic and diluted net loss per share are the same for both periods.
Recent Accounting Pronouncements
In February 2016, the FASB issued ASUThis guidance requires a dual approach for lessee accounting under which a lessee will account for leases as finance leases or operating leases. This guidance is effective for the Company for fiscal years beginning after December 15, 2021 and interim periods beginning after December 15, 2022, and early adoption is permitted. This standard can be applied at the beginning of the earliest period presented using the modified retrospective approach, which includes certain practical expedients that an entity may elect to apply, including an election to use certain transition relief. In July 2018, the FASB issued ASU and ASU, which make improvements to ASC 842 and allow entities to not restate comparative periods in transition to ASC 842 and instead report the comparative periods under ASC 840. The Company is currently assessing the impact that adoption of this ASU will have on its consolidated financial statements.
2016-02,
Leases (Topic 842).
2018-10,
Codification Improvements to Topic
842, Leases
2018-11,
Leases (Topic
842): Targeted Improvements
In June 2016, the FASB issued ASU. This ASU amends the impairment model by requiring entities to use a forward-looking approach based on expected losses rather than incurred losses to estimate credit losses on certain types of financial instruments. This may result in the earlier recognition of allowances for losses. The guidance is effective for the Company for fiscal years beginning after December 15, 2022, including interim periods within those fiscal years, with early adoption permitted. The Company does not expect the adoption of this ASU to have a significant impact on its consolidated financial statements.
2016-13,
Measurement of Credit Losses on Financial Instruments
In December 2019, the FASB issued ASU. The ASU simplifies the accounting for income taxes by removing certain exceptions to the general principles as well as clarifying and amending existing guidance to improve consistent application. The amendments to this ASU are effective for fiscal years, and interim periods within those fiscal years, beginning after December 15, 2021, with early adoption permitted. Depending on the amendment, adoption may be applied on the retrospective, modified retrospective or prospective basis. The Company is currently assessing the impact that adoption of this ASU will have on its consolidated financial statements.
2019-12,
Income Taxes
— Simplifying the Accounting for Income Taxes
F-39
2. SIGNIFICANT ACCOUNTING POLICIES
(cont.)
Initial Adoption of New Accounting Policies
In August 2018, the FASB issued ASU. This ASU eliminates, modifies, and adds disclosure requirements for fair value measurements. The amendments in this ASU are effective for the Company for fiscal years, and for interim periods within those fiscal years, beginning after December 15, 2019, with early adoption permitted. The Company adopted this ASU as of January 1, 2020. The adoption of the ASU did not have a material impact on the consolidated financial statements and related disclosures.
No. 2018-13,
Fair Value Measurement (Topic 820): Disclosure Framework
— Changes to the Disclosure Requirements for Fair Value Measurement
3. INVENTORIES, net
Inventories consist of the following:
June 30, | December 31, | |||||||
2021 | 2020 | |||||||
(in thousands) | ||||||||
Work in progress | $ | 13 | $ | 3 | ||||
Finished goods | 2,706 | 755 | ||||||
Inventory, net | $ | 2,719 | $ | 758 | ||||
4. PROPERTY AND EQUIPMENT
Property and equipment consist of the following:
June 30, | December 31, | |||||||
2021 | 2020 | |||||||
(in thousands) | ||||||||
Leasehold improvements | $ | 6,224 | $ | 5,907 | ||||
Machinery and equipment | 10 | 15 | ||||||
Furniture and fixtures | 784 | 714 | ||||||
Research and development equipment | 4,679 | 2,794 | ||||||
Computer hardware and software | 1,513 | 1,219 | ||||||
Construction in progress | 93 | 437 | ||||||
Subtotal | 13,303 | 11,086 | ||||||
Less: Accumulated depreciation | 2,837 | 1,683 | ||||||
Property and equipment, net | $ | 10,466 | $ | 9,403 | ||||
Depreciation expense for the three and six months ended June 30, 2021 was approximately $0.7 million and $1.2 million, respectively. Depreciation expense for the three and six months ended June 30, 2020 was approximately $0.8 million and $1.0 million, respectively.
F-40
5. ACCRUED EXPENSES
Accrued expenses consist of the following:
June 30, | December 31, | |||||||
2021 | 2020 | |||||||
(in thousands) | ||||||||
Accrued compensation | $ | 3,871 | $ | 5,424 | ||||
Accrued sales taxes payable | 185 | 879 | ||||||
Accrued professional services | 2,045 | 754 | ||||||
Accrued materials | 4,077 | 401 | ||||||
Accrued other | 2,049 | 272 | ||||||
Accrued warranty | 112 | 41 | ||||||
Accrued expenses | $ | 12,339 | $ | 7,771 | ||||
Accrued Warranty
The Company provides a limited warranty ranging from one to three years. Estimated warranty obligations are recorded as an expense upon customer acceptance of related products. Factors that affect the estimated warranty liability include number of products accepted, historical and anticipated rates of warranty claims, cost per claim, and vendor-supported warranty programs. The Company periodically assesses the adequacy of our recorded warranty liabilities and adjusts the amounts as necessary. The amount of liability recorded is equal to the estimated costs to repair or otherwise satisfy claims made by customers.
Changes in our product warranty consist of the following:
June 30, | December 31, | |||||||
2021 | 2020 | |||||||
(in thousands) | ||||||||
Beginning balance | $ | 41 | $ | 317 | ||||
Accrual (reversal) for warranty expense | 107 | (136 | ) | |||||
Warranty costs incurred during period | (36 | ) | (140 | ) | ||||
Ending balance | $ | 112 | $ | 41 | ||||
6. REVENUE
The Company primarily derives its revenue from selling robotic fulfillment and material handling systems, which consist of a network of automated machinery installed at the customer location and configured to meet specified performance requirements, such as accuracy, throughput and
up-time.
Revenue is recognized when control of the promised products is transferred to the customer, or when services are satisfied under the contract, in an amount that reflects the consideration the Company expects to be entitled to in exchange for those products or services (the transaction price). Revenue is recognized only to the extent that it is probable that a significant reversal of revenue will not occur. Taxes collected from customers, which are subsequently remitted to governmental authorities, are excluded from revenue.The Company’s contracts typically have multiple performance obligations that may include system delivery, installation, testing, and training. Judgment is required to determine whether performance obligations specified in these contracts are distinct and should be accounted for as separate revenue transactions for recognition purposes. The Company also provides assurance-based warranties that are not considered a distinct performance obligation. The Company allocates the total transaction price to each performance obligation in an amount based on the estimated relative standalone selling prices of the promised goods or services underlying each performance obligation. The Company uses a cost-plus margin approach to determine the stand-alone selling price for separate performance obligations.
F-41
6. REVENUE
(cont.)
Each customer contract is evaluated individually to determine the appropriate pattern of revenue recognition. Contracts that are recognized over time meet the criteria that the Company is creating or enhancing an asset that the customer controls. The system is delivered to the customer and control is transferred, after which point the Company performs installation and implementation services to fully integrate the system at the customer’s location. As such, revenue recognition begins upon delivery, continues throughout the installation and implementation period, and concludes upon customer acceptance. Revenue from customer contracts is generally expected to be recognized over a period of three to six months. There historically have been, and potentially will be in the future, customer contracts that contain obligations and timelines that result in revenue being recognized over extended periods, which may include periods greater than 12 months. The Company typically uses total estimated labor hours as the input to measure progress as labor hours represent work performed, which corresponds with, and thereby best depicts, the transfer of control to the customer. Installation and training services are evaluated together with the delivery of robotic fulfillment or material handling systems as a singular performance obligation.
The Company determined that the revenue of one of its robotic fulfillment system contracts should be recognized at a point in time as the contract did not meet any of the three criteria to recognize revenue over time as defined in ASCdue to the terms within the contract. Obligations under this contract were fulfilled in March 2020 and the Company determined no similar contracts exist as of June 30, 2021 or December 31, 2020.
606-10-25-27
Other performance obligations recognized at a point in time include the sale and delivery of spare parts and pilot agreements. Pilot agreements are typically short-term contracts designed to demonstrate the Company’s technology and ability to serve the customer. Due to the exploratory nature of pilot agreements, revenue is recognized at a point in time once the evaluation activities are complete.
Other performance obligations recognized over time include, but are not limited to, maintenance, extended support, and research services, which are recognized ratably on a straight-line-basis as the Company assumes an even distribution of performance over the service period.
Shipping and handling activities that occur after control of a product has transferred to the customer are accounted for as fulfillment activities rather than performance obligations, as allowed under a practical expedient provided by ASC 606. Shipping and handling fees charged to customers are recognized as revenue and the related costs are included in cost of revenue at the point in time when ownership of the product is transferred to the customer.
The following table disaggregates revenue by timing of transfer of goods or services:
Three Months Ended June 30, | Six Months Ended June 30, | |||||||||||||||
2021 | 2020 | 2021 | 2020 | |||||||||||||
(in thousands) | (in thousands) | |||||||||||||||
Transferred over time | $ | 4,275 | $ | 2,535 | $ | 8,211 | $ | 6,465 | ||||||||
Transferred at a point in time | 228 | 217 | 257 | 22,563 | ||||||||||||
Total revenue | $ | 4,503 | $ | 2,752 | $ | 8,468 | $ | 29,028 | ||||||||
Payment terms offered to customers are defined in contracts and do not include a significant financing component. Payment milestones typically exist throughout the course of a contract and generally occur upon signing of an agreement, delivery of a system, start and completion of installation and testing, and upon acceptance of the system. The nature of the Company’s contracts may give rise to variable consideration, typically related to fees charged for shipping and handling. The Company generally estimates such variable consideration at the most likely amount. In addition, the Company includes the estimated variable consideration
F-42
6. REVENUE
(cont.)
in the transaction price to the extent that it is probable that a significant reversal in the amount of cumulative revenue recognized will not occur when the related uncertainty is resolved. These estimates are based on historical experience and the Company’s best judgment at the time. Because of the certainty in estimating these amounts, they are included in the transaction price of the Company’s contracts and the associated remaining performance obligations. The Company does not disclose the value of unsatisfied performance obligations for contracts with an original expected duration of one year or less.
Contracts may be modified to account for changes in contract specifications and requirements. Contract modifications exist when the modification either creates new or changes the existing enforceable rights and obligations. Most of the Company’s contract modifications are for goods or services that are not distinct from the existing contract due to the significant integration service provided in the context of the contract and are accounted for as if they were part of that existing contract. The effects of a contract modification on the transaction price, and the measure of progress for the performance obligation to which it relates, are recognized as an adjustment to revenue on a cumulative
catch-up
basis.Deferred Fulfillment Costs and Contract Balances
As of June 30, 2021 and December 31, 2020, the Company incurred $13.4 million and $3.5 million of net deferred fulfillment costs, respectively.
Changes in the contract liability balance during the six months ended June 30, 2021 were due to the Company receiving additional advanced cash payments from customer contracts and the Company recognizing revenue as performance obligations were met. The following table summarizes changes in contract liabilities during the six months ended June 30, 2021:
Contract Liabilities | ||||
(in thousands) | ||||
Contract liabilities at December 31, 2020 | $ | 22,331 | ||
Additions to contract liabilities during the period | 9,728 | |||
Revenue recognized in the period from: | ||||
Amounts included in contract liabilities at the beginning of the period | (7,084 | ) | ||
Amounts added to contract liabilities during the period | (1,210 | ) | ||
Contract liabilities at June 30, 2021 | $ | 23,765 | ||
There were no significant contract asset balances for all periods presented.
7. RELATED PARTY TRANSACTIONS
In June 2019, the Company entered into two customer contracts with an affiliate of one of its primary investors. Related to these contracts, as of June 30, 2021 and December 31, 2020, the Company recorded $0.5 million and $1.4 million in net deferred fulfillment costs, respectively, and $1.4 million and $4.6 million in contract liabilities, respectively. For the three and six months ended June 30, 2021, the Company recognized approximately $1.5 million and $3.1 million in revenue and approximately $0.4 million and $1.2 million in cost of revenue related to these customer contracts, respectively. For the three and six months ended June 30, 2020, the Company recognized approximately $2.4 million and $6.2 million in revenue and approximately $1.1 million and $2.7 million in cost of revenue related to these customer contracts, respectively.
In October 2019, the Company issued a Partial Recourse Secured Promissory Note (the “Promissory Note”) to an executive officer for approximately $9.9 million with an interest rate of 1.86% per annum compounded
F-43
a
nnually. Under the terms of the Promissory Note, the officer will be personally liable for 51% of the unpaid balance of the principal and any accrued interest. The entire principal amount was used to purchase 1,191,872 shares of restricted stock. The Promissory Note is collateralized by the restricted common stock. The Company determined that the entire Promissory Note must be treated asnon-recourse;
as such, the balance of the note and related accrued interest are not presented on the consolidated balance sheet. Refer to Note 9 for further information on the treatment of stock-based compensation related to these purchased shares.On February 23, 2021 the Company entered into a Stock Repurchase Agreement with the executive officer. In the Stock Repurchase Agreement, the Company’s Board of Directors authorized the repurchase of a sufficient number of vested shares of common stock from the executive officer, at a per share price equal to the per share price as defined in the Merger Agreement. The sale and repurchase will repay in full all of the outstanding principal and accrued interest under the Promissory Note and is contingent upon the completion of the business combination. Refer to Note 14 “Subsequent Events” for further details.
8. CONVERTIBLE PREFERRED STOCK
Preferred Stock
The Company has cumulatively raised $227.3 million, net of issuance costs, in venture financing through the sale and issuance of Preferred Stock and warrants as of June 30, 2021 and December 31, 2020. The following table summarizes details of Convertible Preferred Stock authorized, issued and outstanding, and liquidation preference:
June 30, 2021 and December 31, 2020 | ||||||||||||
Convertible preferred stock | ||||||||||||
Authorized shares | Shares issued and outstanding | Liquidation preference | ||||||||||
Series A | 2,212,389 | 2,212,389 | $ | 500 | ||||||||
Series A-1 | 2,403,846 | 2,403,846 | 2,500 | |||||||||
Series A-2 | 4,118,126 | 4,118,126 | 11,098 | |||||||||
Series A-3 | 785,056 | 785,056 | 1,058 | |||||||||
Series A-4 | 710,321 | 710,321 | 1,531 | |||||||||
Series B | 5,385,474 | 5,385,474 | 24,100 | |||||||||
Series B-1 | 2,804,302 | 2,804,302 | 24,110 | |||||||||
Series B-2 | 11,732,302 | 9,788,160 | 174,550 | |||||||||
Series B-3 | 1,903,647 | — | — | |||||||||
| 32,055,463 | 28,207,674 | $ | 239,447 | |||||||||
Warrants
In connection with the Series
B-2
Preferred Stock financing in 2019, the Company issued a Warrant to purchase up to 1,903,647 shares of SeriesB-3
Preferred Stock (the “Warrants”) at an exercise price of $11.5913 per share. See Note 10 for additional information regarding the valuation of the Warrants.On February 23, 2021 in conjunction with the Merger Agreement, the Company entered into a Warrant Termination Agreement with the Warrant holder. Pursuant to the terms of the Merger Agreement, the Warrant is to be surrendered, terminated and cancelled immediately prior to, and contingent upon, the completion of the business combination. Refer to Note 14 “Subsequent Events” for further details.
9
. STOCK-BASED COMPENSATIONIn 2013, the Company adopted the Berkshire Grey, Inc. 2013 Stock Option and Stock Purchase Plan (the “Plan”) under which the Company may grant incentive stock options, nonqualified stock options, restricted stock,
F-44
8. CONVERTIBLE PREFERRED STOCK
(cont.)
unrestricted stock, restricted stock units, performance awards, or other awards that are convertible into or based on company stock. The maximum number of shares that may be issued under the Plan was 10,017,823 shares as of June 30, 2021 and December 31, 2020. Shares underlying any award that are forfeited, expired, or repurchased will again be available for grant and issuance in connection with future awards under this Plan.
Stock-based compensation expense recognized for all stock-based awards is reported in the Company’s consolidated statements of operations as follows:
Three Months Ended June 30, | Six Months Ended June 30, | |||||||||||||||
2021 | 2020 | 2021 | 2020 | |||||||||||||
(in thousands) | (in thousands) | |||||||||||||||
Cost of sales | $ | 35 | $ | 28 | $ | 70 | $ | 56 | ||||||||
General and administrative | 430 | (17 | ) | 856 | 494 | |||||||||||
Sales and marketing | 4,549 | 65 | 27,961 | 233 | ||||||||||||
Research and development | 295 | 240 | 601 | 476 | ||||||||||||
Total | $ | 5,309 | $ | 316 | $ | 29,488 | $ | 1,259 | ||||||||
Stock Options
The Company did 0t issue any grants during the six months ended June 30, 2021 and 2020.
The following table summarizes stock option activity under the 2013 Plan for the six months ended June 30, 2021:
Options | Weighted- Average Exercise Price | Weighted- Average Remaining Contractual Term (years) | ||||||||||
Outstanding at December 31, 2020 | 5,956,837 | $ | 4.70 | 8.0 | ||||||||
Exercised | 272,364 | 1.82 | 2.9 | |||||||||
Cancelled | 4,596 | 3.65 | — | |||||||||
Forfeited | 59,055 | 3.59 | — | |||||||||
Outstanding at June 30, 2021 | 5,620,822 | $ | 4.85 | 7.8 | ||||||||
Exercisable at June 30, 2021 | 2,342,488 | $ | 2.71 | 6.1 | ||||||||
Vested or expected to vest at June 30, 2021 | 5,620,822 | $ | 4.85 | 7.8 | ||||||||
As of June 30, 2021, 633,656 of the Options outstanding are subject to performance-based vesting criteria described above.
The total intrinsic value of options exercised in the six months ended June 30, 2021 was approximately $15.5 million.
The Company recognized approximately $1.2 million and $2.4 million in stock-based compensation expense related to stock options during the three and six months ended June 30, 2021, respectively. The Company recognized approximately $0.3 million and $0.8 million in stock-based compensation expense related to stock options during the three and six months ended June 30, 2020, respectively. As of June 30, 2021, there was approximately $12.7 million of total unrecognized compensation cost related to
non-vested
stock options. The total unrecognized compensation cost will be adjusted for future forfeitures as they occur. As of June 30, 2021, the Company expects to recognize its remaining stock-based compensation expense over a weighted-average period of 2.9 years.F-45
9. STOCK-BASED COMPENSATION
(cont.)
Restricted Stock Sold Through Issuance of Promissory Note
In conjunction with a Partial RecoursePromissory Note issued in October 2019 (See Note 7), the Company also entered into a Restricted Stock Award Agreement with an executive officer (the “RSA Agreement”). Pursuant to the RSA Agreement, the Company granted 1,191,872 shares of common stock (the “Restricted Stock”) at a purchase price of $8.32 per share. The Restricted Stock was purchased by the executive officer with the proceeds from the Promissory Note. As the underlying Restricted Shares are not allocated to the recourse and
non-recourse
portions of the Promissory Note, the entire note is treated asnon-recourse
and the shares are treated as options for accounting purposes.The RSA Agreement contains a Repurchase Option, which causes the shares to be classified as a liability. The Repurchase Option expires six months after the shares’ respective vesting date, at which point the shares will be reclassified as equity at the fair value on such date and no further compensation cost is recognized. A portion of the awards are subject to performance-based vesting conditions based primarily on financial performance of the Company and a portion are only subject to time and service-based vesting conditions over a four-year period. The Company will remeasure the fair value of the award at each reporting period until settlement. The Company measured compensation cost for the shares
(in-substance
stock options) based on the fair value on the grant date using a lattice-based option pricing model. The Company recognizes compensation cost over the requisite service period with an offsetting credit to a share-based liability.The underlying shares of Restricted Stock are not considered outstanding until the vesting conditions have been achieved and the Promissory Note has been paid. As of June 30, 2021, 248,307 shares of Restricted Stock have vested, and NaN were forfeited.
The Company recognized approximately $4.2 million and $27.2 million in stock-based compensation expense related to the Restricted Stock during the three and six months ended June 30, 2021, respectively. The Company recognized approximately $(0.1) million and $0.4 million in stock-based compensation expense related to the Restricted Stock during the three and six months ended June 30, 2020, respectively. The expense is presented in the Company’s consolidated statements of operations as sales and marketing expense and general and administrative expense, respectively. As of June 30, 2021, there was approximately $30.5 million of total unrecognized compensation cost related to the Restricted Stock.
F-46
10. FAIR VALUE OF FINANCIAL INSTRUMENTS
Recurring Fair Value Measurements
The following table summarizes information about the Company’s financial assets and liabilities measured at fair value on a recurring basis and indicates the level of the fair value hierarchy used to determine such fair values:
June 30, 2021 | ||||||||||||||||
Level 1 | Level 2 | Level 3 | Total | |||||||||||||
(in thousands) | ||||||||||||||||
Assets | ||||||||||||||||
Money Market funds in Cash and Cash Equivalents | $ | 51,496 | $ | — | $ | — | $ | 51,496 | ||||||||
Total Assets | $ | 51,496 | $ | — | $ | — | $ | 51,496 | ||||||||
Liabilities | ||||||||||||||||
Restricted Stock | $ | — | $ | — | $ | 21,371 | $ | 21,371 | ||||||||
Total Liabilities | $ | — | $ | — | $ | 21,371 | $ | 21,371 | ||||||||
December 31, 2020 | ||||||||||||||||
Level 1 | Level 2 | Level 3 | Total | |||||||||||||
(in thousands) | ||||||||||||||||
Assets | ||||||||||||||||
Money Market funds in Cash and Cash Equivalents | $ | 92,858 | $ | — | $ | — | $ | 92,858 | ||||||||
Total Assets | $ | 92,858 | $ | — | $ | — | $ | 92,858 | ||||||||
Liabilities | ||||||||||||||||
Restricted Stock | $ | — | $ | — | $ | 3,047 | $ | 3,047 | ||||||||
Total Liabilities | $ | — | $ | — | $ | 3,047 | $ | 3,047 | ||||||||
Money market funds were valued by the Company using quoted prices in active markets for similar securities, which represent a Level 1 measurement within the fair value hierarchy.
The values for the restricted stock liability are based on significant inputs not observable in the market, which represent Level 3 measurements within the fair value hierarchy.
During the six months ended June 30, 2021, there were no transfers between Level 1, Level 2, and Level 3.
Warrants to Purchase Series
B-3
Preferred StockOn July 5, 2019, in connection with the Series
B-2
Preferred Stock financing, the Company issued a Warrant to purchase up to 1,903,647 shares of SeriesB-3
Preferred Stock at an exercise price of $11.5913 per share. The Warrants expire 10 years from the date of issuance and are exercisable for Vested Shares at any time up until the earlier of either the Expiration Date or the occurrence of a Deemed Liquidation Event.The Warrants were accounted for as liabilities under ASC 480 because the underlying shares are contingently redeemable outside of the issuer’s control. The Warrants are considered freestanding financial instruments as they are separately exercisable and could be separately transferred from the Series
B-2
Preferred Stock in the related financing. Such warrant instruments were initially recorded and valued as a Level 3 liability and are accounted for at fair value with changes in fair value reported as a component of other income.F-47
10. FAIR VALUE OF FINANCIAL INSTRUMENTS
(cont.)
As of June 30, 2020, Management determined, upon evaluation of performance milestones that the vesting of the Warrants was not probable. As such, the Warrants were revalued at $0 as of June 30, 2021 and December 31, 2020. In addition, pursuant to the terms of the Merger Agreement, the Warrants are to be surrendered, terminated and cancelled immediately prior to, and contingent upon, the completion of the business combination.
Restricted Stock Awards
Changes in fair value will be recorded as compensation cost with a corresponding increase or decrease in the share-based liability. No restricted stock awards were exercised during the six months ended June 30, 2021.
The following table summarizes the change in fair value, as determined by Level 3 inputs, of restricted stock for the six months ended June 30, 2021.
Restricted Stock | ||||
(in thousands) | ||||
Balance at December 31, 2020 | $ | 3,047 | ||
Change relating to vesting at original issuance price | 775 | |||
Change in fair value | 26,385 | |||
Reclassification of restricted stock to equity (see Note 9) | (8,836 | ) | ||
Balance at June 30, 2021 | 21,371 | |||
The fair value of the Company’s Restricted Stock, including subsequent remeasurements, was estimated using an option pricing model using the following assumptions as of June 30, 2021 and December 31, 2020:
June 30, | December 31, | |||
2021 | 2020 | |||
Fair Value of the underlying Instrument | $58.60 | $6.70 - 13.01 | ||
Exercise Price | $9.31 - $9.48 | $9.23 - $9.48 | ||
Time to liquidity event (in years) | 6.1 - 7.1 | 5.6 - 7.1 | ||
Average volatility rate | 55.0% | 55.0% | ||
Risk-free interest rate | 0.93% - 1.27% | 0.28% - 0.93% |
The risk-free interest rate used is the rate for a U.S. Treasury zero coupon issue with a term consistent with the remaining contractual term of the restricted stock on the date of measurement. The Company based the expected term assumption on the actual remaining contractual term of the respective restricted stock as of the date of measurement. The expected volatility is based on historical volatilities from guideline companies, since there is no active market for the Company’s common stock. The exercise price is calculated based on a function of the purchase price of $8.32 per share multiplied by a compounding interest rate over the expected term consistent with the repayment term of the Promissory Note. As of December 31, 2020, the fair value on the date of measurement of the common stock, the underlying instrument, was estimated by management with the assistance of a third-party valuation specialist.
As a result of the pending merger with RAAC, management determined that the fair value of the common stock, the underlying instrument, should approximate the fair value of RAAC’s common stock as of the date of measurement and resulted in compensation expense of approximately $4.2 million and $27.2 million for the three and six months ended June 30, 2021. As a result of the pending merger with RAAC, management determined that the fair value of the common stock, the underlying instrument, should approximate the fair value of RAAC’s
F-48
10. FAIR VALUE OF FINANCIAL INSTRUMENTS
(cont.)
common stock as of the date of measurement on June 30, 2021. Each unit of Restricted Stock can be exchanged for a single share of Berkshire Grey common stock. Upon the effective date of the merger, any shares held by stockholders of Berkshire Grey will be cancelled and converted into the right to receive a number of newly issued shares of RAAC Class A common stock based on a conversion formula as defined in the Merger Agreement. The Company calculated the conversion ratio based on this formula with inputs known as of June 30, 2021 and applied this ratio to the closing price of RAAC’s current common stock on June 30, 2021 in order to determine the fair value price of a share of the underlying instrument.
11. INCOME TAXES
During the six months ended June 30, 2021 and 2020, the Company recorded 0 income tax benefits due to the losses incurred and the uncertainty of future taxable income.
Realization of deferred tax assets is dependent upon the generation of future taxable income. As required by ASC 740, the Company evaluated the positive and negative evidence bearing upon its ability to realize the deferred tax assets as of June 30, 2021 and December 31, 2020. As the Company has incurred tax losses from inception, the Company determined that it was more likely than not that the Company would not realize the benefits of federal and state net deferred tax assets. Accordingly, a full valuation allowance was established against the net deferred tax assets as of June 30, 2021 and December 31, 2020.
Income Taxes
The Company does not believe material uncertain tax positions have arisen to date.
The Company’s effective income tax rate for the three and six months ended June 30, 2021 and 2020 was 0.0%.
On March 27, 2020, the Coronavirus Aid, Relief, and Economic Security Act (“CARES Act”) was enacted in response to the
COVID-19
pandemic. The Company continues to evaluate the impact of the CARES Act, but at present does not expect the CARES Act to result in any material income tax benefit.12. SEGMENT INFORMATION
In its operation of the business, management, including our chief operating decision maker, who is also our Chief Executive Officer, reviews the business as one segment. The Company currently ships its products to markets in the United States and Japan. Product sales attributed to a country are based on the location of the customer to whom the products are being sold. Long-lived assets are primarily held in the United States.
Product sales by country are as follows:
Three Months Ended June 30, | Six Months Ended June 30, | |||||||||||||||
2021 | 2020 | 2021 | 2020 | |||||||||||||
(in thousands) | (in thousands) | |||||||||||||||
United States | $ | 2,929 | $ | 292 | $ | 5,334 | $ | 22,792 | ||||||||
Japan | 1,574 | 2,460 | 3,134 | 6,236 | ||||||||||||
Total revenue | $ | 4,503 | $ | 2,752 | $ | 8,468 | $ | 29,028 | ||||||||
13. COMMITMENTS AND CONTINGENCIES
The Company has various
non-cancellable
operating leases for facilities that expire at various dates through 2031.Rental expense was approximately $0.5 million and $1.0 million for the three and six months ended June 30, 2021 and 2020, respectively. Rental expense was approximately $0.4 million and $1.0 million for the three and six months ended June 30, 2020, respectively.
F-49
As of June 30, 2021, future minimum rental commitments for operating leases with
non-cancellable
terms in excess of one year were as follows:Operating Leases | ||||
(in thousands) | ||||
Remainder of 2021 | $ | 1,052 | ||
2022 | 1,601 | |||
2023 | 1,462 | |||
2024 | 1,504 | |||
2025 | 1,473 | |||
Thereafter | 7,079 | |||
| $ | 14,171 | |||
14. SUBSEQUENT EVENTS
The Company evaluated subsequent events and transactions that occurred after the balance sheet date up to
August 16, 2021.
Based upon this review, other than as described below, the Company did not identify any subsequent events that would have required adjustment or disclosure in the financial statements.RAAC Business Combination
Merger
On July 21, 2021, the Company completed a business combination transaction (the “Merger”) with RAAC pursuant to the business combination agreement (the “Merger Agreement”) dated February 23, 2021. Upon closing of the business combination transaction, the combined company was renamed Berkshire Grey, Inc.
Closing occurred on July 21, 2021 (the “Closing Date”). The transaction was accounted for as a reverse recapitalization. The Company received gross proceeds of $220.0 million and incurred closing costs of $27.4 million. As of June 30, 2021, $1.8 million of deferred transaction costs were recorded, which consisted of legal, accounting, and other professional services directly related to the Merger. These costs were included in
non-current
assets on the Company’s consolidated balance sheet. These costs will be offset against proceeds upon accounting for the Closing.PIPE Investment
Concurrently with the execution of the Merger Agreement, RAAC entered into subscription agreements with certain investors (the “PIPE Investors”) to which the PIPE Investors have committed to purchase an aggregate amount of $165 million in shares of Class A Stock at a purchase price of $10.00 per share. The PIPE Investment was consummated substantially concurrently with the closing of the Merger.
Warrant
On February 23, 2021 in conjunction with the Merger Agreement, the Company entered into a Warrant Termination Agreement with the Warrant holder. On July 21, 20201, pursuant to the terms of the Merger Agreement, the Warrant was terminated immediately prior to the Closing.
Promissory Note
In October 2019, the Company issued a Partial Recourse Secured Promissory Note (the “Promissory Note”) to an executive officer for approximately $9.9 million with an interest rate of 1.86% per annum compounded annually. The entire principal amount was used to purchase 1,191,872 shares of restricted stock. On February 23,
F-50
14. SUBSEQUENT EVENTS
(cont.)
2021 the Company entered into a Stock Repurchase Agreement with the executive officer. In the Stock Repurchase Agreement, the Company’s Board of Directors authorized the repurchase of 174,243 vested shares of common stock from the executive officer which will repay, in full, all the outstanding principal and accrued interest under the Promissory Note. At Closing Date, all outstanding principal and accrued interest under the Promissory Note was repaid and the note was retired.
Performance Options
On July 15, 2021 the Board of Directors determined and approved the performance milestones for 500,044 previously granted performance-based stock options, which included a performance milestone for the successful completion of a material financing event. Upon completion of the Merger approximately 33% of the options vested. The remaining milestones relate to financial metrics based on orders and revenue.
F-51
REPORT OF INDEPENDENT REGISTERED PUBLIC ACCOUNTING FIRM
To the Shareholders and the Board of Directors of
Revolution Acceleration Acquisition Corp
Opinion on the Financial Statements
We have audited the accompanying balance sheet of Revolution Acceleration Acquisition Corp (formerly known as Acceleration Acquisition Corporation) (the “Company”) as of December 31, 2020, the related statements of operations, changes in stockholders’ equity and cash flows for the period from September 10, 2020 (inception) through December 31, 2020, and the related notes (collectively referred to as the “financial statements”). In our opinion, the financial statements present fairly, in all material respects, the financial position of the Company as of December 31, 2020, and the results of its operations and its cash flows for the period from September 10, 2020 (inception) through December 31, 2020, in conformity with accounting principles generally accepted in the United States of America.
Restatement of the 2020 Financial Statements
As discussed in Note 2 to the financial statements, the accompanying financial statements as of December 31, 2020 and for the period from September 10, 2020 (inception) through December 31, 2020, have been restated.
Explanatory Paragraph — Going Concern
The accompanying financial statements have been prepared assuming that the Company will continue as a going concern. As more fully described in Note 1 to the financial statements, the Company’s business plan is dependent on the completion of a business combination and the Company’s cash and working capital as of December 31, 2020 are not sufficient to complete its planned activities for a reasonable period of time, which is considered to be one year from the issuance date of the financial statements. These conditions raise substantial doubt about the Company’s ability to continue as a going concern. Management’s plans in regard to these matters are also described in Note 1. The financial statements do not include any adjustments that might result from the outcome of this uncertainty.
Basis for Opinion
These financial statements are the responsibility of the Company’s management. Our responsibility is to express an opinion on the Company’s financial statements based on our audit. We are a public accounting firm registered with the Public Company Accounting Oversight Board (United States) (the “PCAOB”) and are required to be independent with respect to the Company in accordance with the U.S. federal securities laws and the applicable rules and regulations of the Securities and Exchange Commission and the PCAOB.
We conducted our audit in accordance with the standards of the PCAOB. Those standards require that we plan and perform the audit to obtain reasonable assurance about whether the financial statements are free of material misstatement, whether due to error or fraud. The Company is not required to have, nor were we engaged to perform, an audit of its internal control over financial reporting. As part of our audit, we are required to obtain an understanding of internal control over financial reporting but not for the purpose of expressing an opinion on the effectiveness of the Company’s internal control over financial reporting. Accordingly, we express no such opinion.
Our audit included performing procedures to assess the risks of material misstatement of the financial statements, whether due to error or fraud, and performing procedures that respond to those risks. Such procedures included examining, on a test basis, evidence regarding the amounts and disclosures in the financial statements. Our audit also included evaluating the accounting principles used and significant estimates made by management, as well as evaluating the overall presentation of the financial statements. We believe that our audit provides a reasonable basis for our opinion.
/
S
/ Marcum LLPMarcum LLP
We have served as the Company’s auditor from 2020 to 2021.
New York, NY
March 17, 2021, except for the effects of the restatement discussed in Note 2 and the subsequent events discussed in Note 12B as to which the date is May 12, 2021.
F-52
REVOLUTION ACCELERATION ACQUISITION CORP
BALANCE SHEET
DECEMBER 31, 2020 (As Restated)
ASSETS | ||||
Current Assets | ||||
Cash and cash equivalents | $ | 780,292 | ||
Prepaid expenses | 747,842 | |||
Total Current Assets | 1,528,134 | |||
Cash and marketable securities held in Trust Account | 287,491,254 | |||
TOTAL ASSETS | $ | 289,019,388 | ||
LIABILITIES AND STOCKHOLDERS’ EQUITY | ||||
Current liabilities – accrued expenses | $ | 106,477 | ||
Warrant liability | 22,862,501 | |||
Deferred underwriting payable | 10,062,500 | |||
Total Liabilities | 33,031,478 | |||
Commitments | ||||
Class A common stock subject to possible redemption 25,098,791 shares at redemption value | 250,987,908 | |||
Stockholders’ Equity | ||||
Preferred stock, $0.0001 par value; 1,000,000 shares authorized; no shares issued and outstanding | — | |||
Class A common stock, $0.0001 par value; 75,000,000 shares authorized; 3,651,209 issued and outstanding (excluding 25,098,791 shares subject to possible redemption) | 365 | |||
Class B common stock, $0.0001 par value; 10,000,000 shares authorized; 3,833,333 shares issued and outstanding | 383 | |||
Class C common stock, $0.0001 par value; 15,000,000 shares authorized; 5,750,000 shares issued and outstanding | 575 | |||
Additional paid-in capital | 6,650,386 | |||
Accumulated deficit | (1,651,707 | ) | ||
Total Stockholders’ Equity | 5,000,002 | |||
TOTAL LIABILITIES AND STOCKHOLDERS’ EQUITY | $ | 289,019,388 | ||
The accompanying notes are an integral part of the financial statements.
F-53
REVOLUTION ACCELERATION ACQUISITION CORP
STATEMENT OF OPERATIONS
FOR THE PERIOD FROM SEPTEMBER 10, 2020 (INCEPTION) THROUGH DECEMBER 31, 2020
(As Restated)
Formation and operating costs | $ | 172,935 | ||
Loss from operations | (172,935 | ) | ||
Other income (expense): | ||||
Interest income – bank | 6 | |||
Interest earned on marketable securities held in Trust Account | 7,721 | |||
Change in fair value of warrant liability | (590,001 | ) | ||
Transaction costs | (828,364 | ) | ||
Compensation expense | (51,667 | ) | ||
Unrealized loss on marketable securities held in Trust Account | (16,467 | ) | ||
Other expense, net | (1,478,772 | ) | ||
Net loss | $ | (1,651,707 | ) | |
Basic and diluted weighted average shares outstanding, Common stock subject to possible redemption | 25,175,858 | |||
Basic and diluted net loss per share, Common stock subject to possible redemption | $ | 0.00 | ||
Basic and diluted weighted average shares outstanding, Non-redeemable common stock | 9,280,127 | |||
Basic and diluted net loss per share, Non-redeemable common stock | $ | (0.18 | ) | |
The accompanying notes are an integral part of the financial statements.
F-54
REVOLUTION ACCELERATION ACQUISITION CORP
STATEMENT OF CHANGES IN STOCKHOLDERS’ EQUITY
FOR THE PERIOD FROM SEPTEMBER 10, 2020 (INCEPTION) THROUGH DECEMBER 31, 2020
(As Restated)
Class A Common Stock | Class B Common Stock | Class C Common Stock | Additional Paid-in Capital | Accumulated Deficit | Total Stockholders’ Equity | |||||||||||||||||||||||||||||||
Shares | Amount | Shares | Amount | Shares | Amount | |||||||||||||||||||||||||||||||
Balance – September 10, 2020 (Inception) | — | $ | — | — | $ | — | — | $ | — | $ | — | $ | — | $ | — | |||||||||||||||||||||
Issuance of Class B common stock to Sponsor | — | — | 8,625,000 | 862 | — | — | 24,138 | — | 25,000 | |||||||||||||||||||||||||||
Cancellation of Class B common stock | — | — | (4,791,667 | ) | (479 | ) | — | — | 479 | — | — | |||||||||||||||||||||||||
Issuance of Class C common stock to Sponsor | — | — | — | — | 5,750,000 | 575 | (575 | ) | — | — | ||||||||||||||||||||||||||
Sale of 28,750,000 Units, net of underwriting discounts | 28,750,000 | 2,875 | — | — | — | — | 257,611,742 | — | 257,614,617 | |||||||||||||||||||||||||||
Class A common stock subject to possible redemption | (25,098,791 | ) | (2,510 | ) | — | — | — | — | (250,985,398 | ) | — | (250,987,908 | ) | |||||||||||||||||||||||
Net loss | — | — | — | — | — | — | — | (1,651,707 | ) | (1,651,707 | ) | |||||||||||||||||||||||||
Balance – December 31, 2020 | 3,651,209 | $ | 365 | 3,833,333 | $ | 383 | 5,750,000 | $ | 575 | $ | 6,650,386 | $ | (1,651,707 | ) | $ | 5,000,002 | ||||||||||||||||||||
The accompanying notes are an integral part of the financial statements.
F-55
REVOLUTION ACCELERATION ACQUISITION CORP
STATEMENT OF CASH FLOWS
FOR THE PERIOD FROM SEPTEMBER 10, 2020 (INCEPTION) THROUGH DECEMBER 31, 2020
(As Restated)
Cash Flows from Operating Activities: | ||||
Net loss | $ | (1,651,707 | ) | |
Adjustments to reconcile net loss to net cash used in operating activities: | ||||
Interest earned on marketable securities held in Trust Account | (7,721 | ) | ||
Change in fair value of warrant liability | 590,001 | |||
Transaction costs | 828,364 | |||
Compensation expense | 51,667 | |||
Unrealized loss on marketable securities held in Trust Account | 16,467 | |||
Changes in operating assets and liabilities: | ||||
Prepaid expenses | (747,842 | ) | ||
Accrued expenses | 106,477 | |||
Net cash used in operating activities | (814,294 | ) | ||
Cash Flows from Investing Activities: | ||||
Investment of cash in Trust Account | (287,500,000 | ) | ||
Net cash used in investing activities | (287,500,000 | ) | ||
Cash Flows from Financing Activities: | ||||
Proceeds from sale of Units, net of underwriting discounts paid | 281,750,000 | |||
Proceeds from sale of Private Placement Warrants | 7,750,000 | |||
Proceeds from promissory note – related party | 88,686 | |||
Repayment of promissory note – related party | (88,686 | ) | ||
Payment of offering costs | (405,414 | ) | ||
Net cash provided by financing activities | 289,094,586 | |||
Net Change in Cash and Cash Equivalents | 780,292 | |||
Cash and Cash Equivalents – Beginning of period | — | |||
Cash and Cash Equivalents – End of period | $ | 780,292 | ||
Non-Cash investing and financing activities: | ||||
Initial classification of Class A common stock subject to possible redemption | $ | 251,758,580 | ||
Change in value of Class A common stock subject to possible redemption | $ | (770,672 | ) | |
Deferred underwriting fee payable | $ | 10,062,500 | ||
Initial classification of warrant liability | $ | 22,272,500 | ||
Offering costs by the Sponsor in exchange for the issuance of Class B common stock | $ | 25,000 | ||
Issuance of Class C common stock to Sponsor | $ | 575 | ||
The accompanying notes are an integral part of the financial statements.
F-56
REVOLUTION ACCELERATION ACQUISITION CORP
NOTES TO FINANCIAL STATEMENTS
NOTE 1. DESCRIPTION OF ORGANIZATION AND BUSINESS OPERATIONS
Revolution Acceleration Acquisition Corp (formerly known as Acceleration Acquisition Corporation) (the “Company”) is a blank check company incorporated in Delaware on September 10, 2020. The Company was formed for the purpose of effectuating a merger, capital stock exchange, asset acquisition, stock purchase, reorganization or other similar business combination with one or more businesses (the “Business Combination”).
The Company has one subsidiary, Pickup Merger Corp, a direct, wholly-owned subsidiary of the Company incorporated in Delaware on February 19, 2021 (“Merger Sub”) (see Note 12).
As of December 31, 2020, the Company had not yet commenced any operations. All activity for the period from September 10, 2020 (inception) through December 31, 2020 relates to the Company’s formation and the initial public offering (the “Initial Public Offering”), which is described below, identifying a target company for a Business Combination and activities in connection with the proposed acquisition of Berkshire Grey, Inc., a Delaware corporation (“BG”) (see Note 12).
The registration statement for the Company’s Initial Public Offering was declared effective on December 7, 2020. On December 10, 2020, the Company consummated the Initial Public Offering of 28,750,000 units (the “Units” and, with respect to the shares of Class A common stock included in the Units sold, the “Public Shares”), which includes the full exercise by the underwriter of its over-allotment option in the amount of 3,750,000 Units, at $10.00 per Unit, generating gross proceeds of $287,500,000, which is described in Note 4.
Simultaneously with the closing of the Initial Public Offering, the Company consummated the sale of 5,166,667 warrants (each, a “Private Placement Warrant” and, collectively, the “Private Placement Warrants”) at a price of $1.50 per Private Placement Warrant in a private placement to RAAC Management LLC (the “Sponsor”), generating gross proceeds of $7,750,000, which is described in Note 5.
Transaction costs amounted to $16,242,914, consisting of $5,750,000 of underwriting fees, $10,062,500 of deferred underwriting fees and $430,414 of other offering costs.
Following the closing of the Initial Public Offering on December 10, 2020, an amount of $287,500,000 ($10.00 per Unit) from the net proceeds of the sale of the Units in the Initial Public Offering and the sale of the Private Placement Warrants was placed in a trust account (the “Trust Account”), and invested in U.S. government securities, within the meaning set forth in Section 2(a)(16) of the Investment Company Act, with a maturity of 185 days or less, or in any open-ended investment company that holds itself out as a money market fund meeting the conditions of
Rule 2a-7
of the Investment Company Act of 1940, as amended (the “Investment Company Act”), as determined by the Company, until the earlier of: (i) the consummation of a Business Combination or (ii) the distribution of the funds in the Trust Account to the Company’s stockholders, as described below.The Company’s management has broad discretion with respect to the specific application of the net proceeds of the Initial Public Offering and the sale of the Private Placement Warrants, although substantially all of the net proceeds are intended to be applied generally toward consummating a Business Combination. NASDAQ rules provide that the Business Combination must be with one or more target businesses that together have a fair market value equal to at least 80% of the balance in the Trust Account (less any deferred underwriting commissions and taxes payable on interest earned on the Trust Account) at the time of the signing of a definitive agreement to enter a Business Combination. The Company will only complete a Business Combination if the post-Business Combination company owns or acquires 50% or more of the outstanding voting securities of the target or otherwise acquires a controlling interest in the target sufficient for it not to be required to register as an investment company under the Investment Company Act. There is no assurance that the Company will be able to successfully effect a Business Combination.
F-57
The Company will provide its holders of the outstanding Public Shares (the “public stockholders”) with the opportunity to redeem all or a portion of their Public Shares upon the completion of a Business Combination either (i) in connection with a stockholder meeting called to approve the Business Combination or (ii) by means of a tender offer. In connection with a proposed Business Combination, the Company may seek stockholder approval of a Business Combination at a meeting called for such purpose at which stockholders may seek to redeem their shares, regardless of whether they vote for or against a Business Combination. The Company will proceed with a Business Combination only if the Company has net tangible assets of at least $5,000,001 either immediately prior to or upon such consummation of a Business Combination and, if the Company seeks stockholder approval, a majority of the outstanding shares voted are voted in favor of the Business Combination.
If the Company seeks stockholder approval of a Business Combination and it does not conduct redemptions pursuant to the tender offer rules, the Company’s Amended and Restated Certificate of Incorporation provides that, a public stockholder, together with any affiliate of such stockholder or any other person with whom such stockholder is acting in concert or as a “group” (as defined under Section 13 of the Securities Exchange Act of 1934, as amended (the “Exchange Act”)), will be restricted from seeking redemption rights with respect to 15% or more of the Public Shares without the Company’s prior written consent.
The public stockholders will be entitled to redeem their shares for a pro rata portion of the amount then in the Trust Account (initially $10.00 per share, plus any pro rata interest earned on the funds held in the Trust Account and not previously released to the Company to pay its tax obligations). The
per-share
amount to be distributed to stockholders who redeem their shares will not be reduced by the deferred underwriting commissions the Company will pay to the underwriter (as discussed in Note 7). There will be no redemption rights upon the completion of a Business Combination with respect to the Company’s warrants.If a stockholder vote is not required and the Company does not decide to hold a stockholder vote for business or other legal reasons, the Company will, pursuant to its Amended and Restated Certificate of Incorporation, offer such redemption pursuant to the tender offer rules of the Securities and Exchange Commission (the “SEC”), and file tender offer documents containing substantially the same information as would be included in a proxy statement with the SEC prior to completing a Business Combination.
The Company’s Sponsor has agreed (a) to vote its Founder Shares (as defined in Note 6), alignment shares (as defined in Note 6) and any Public Shares purchased during or after the Initial Public Offering in favor of a Business Combination, (b) not to propose an amendment to the Company’s Amended and Restated Certificate of Incorporation with respect to the Company’s
pre-Business
Combination activities prior to the consummation of a Business Combination unless the Company provides dissenting public stockholders with the opportunity to redeem their Public Shares in conjunction with any such amendment; (c) not to redeem any shares (including the Founder Shares and alignment shares) and Private Placement Warrants (including underlying securities) into the right to receive cash from the Trust Account in connection with a stockholder vote to approve a Business Combination (or to sell any shares in a tender offer in connection with a Business Combination if the Company does not seek stockholder approval in connection therewith) or a vote to amend the provisions of the Amended and Restated Certificate of Incorporation relating to stockholders’ rights ofpre-Business
Combination activity and (d) that the Founder Shares, alignment shares and Private Placement Warrants (including underlying securities) shall not participate in any liquidating distributions upon winding up if a Business Combination is not consummated. However, the Sponsor will be entitled to liquidating distributions from the Trust Account with respect to any Public Shares purchased during or after the Initial Public Offering if the Company fails to complete its Business Combination.If the Company is unable to complete a Business Combination by December 10, 2022 (the “Combination Period”), the Company will (i) cease all operations except for the purpose of winding up, (ii) as promptly as reasonably possible but no more than ten business days thereafter, redeem the public shares, at a
per-share
price, payable in cash, equal to the aggregate amount then on deposit in the Trust Account, including interest earned on the funds held in the Trust Account and not previously released to us to pay taxes (less up to $100,000 of interestF-58
to pay dissolution expenses), divided by the number of then outstanding public shares, which redemption will completely extinguish public stockholders’ rights as stockholders (including the right to receive further liquidation distributions, if any), subject to applicable law, and (iii) as promptly as reasonably possible following such redemption, subject to the approval of the remaining stockholders and the Company’s board of directors, proceed to commence a voluntary liquidation and thereby a formal dissolution of the Company, subject in each case to its obligations under Delaware law to provide for claims of creditors and the requirements of applicable law. The underwriter has agreed to waive its rights to the deferred underwriting commission held in the Trust Account in the event the Company does not complete a Business Combination within the Combination Period and, in such event, such amounts will be included with the funds held in the Trust Account that will be available to fund the redemption of the Public Shares. In the event of such distribution, it is possible that the per share value of the assets remaining available for distribution will be less than the Initial Public Offering price per Unit ($10.00).
The Sponsor has agreed that it will be liable to the Company if and to the extent any claims by a third party for services rendered or products sold to the Company, or a prospective target business with which the Company has entered into a written letter of intent, confidentiality or similar agreement or Business Combination agreement, reduce the amount of funds in the Trust Account to below the lesser of (i) $10.00 per Public Share and (ii) the actual amount per Public Share held in the Trust Account as of the day of liquidation of the Trust Account, if less than $10.00 per share due to reductions in the value of the trust assets, less taxes payable, provided that such liability will not apply to any claims by a third party or prospective target business who executed a waiver of any and all rights to monies held in the Trust Account (whether or not such waiver is enforceable) nor will it apply to any claims under the Company’s indemnity of the underwriter of the Initial Public Offering against certain liabilities, including liabilities under the Securities Act of 1933, as amended (the “Securities Act”). However, the Company has not asked the Sponsor to reserve for such indemnification obligations, nor has the Company independently verified whether the Sponsor has sufficient funds to satisfy its indemnity obligations and believe that the Sponsor’s only assets are securities of the Company. Therefore, the Company cannot assure its stockholders that the Sponsor would be able to satisfy those obligations. None of the Company’s officers or directors will indemnify the Company for claims by third parties including, without limitation, claims by vendors and prospective target businesses. The Company will seek to reduce the possibility that the Sponsor will have to indemnify the Trust Account due to claims of creditors by endeavoring to have all vendors, service providers (other than the Company’s independent auditors), prospective target businesses or other entities with which the Company does business, execute agreements with the Company waiving any right, title, interest or claim of any kind in or to monies held in the Trust Account.
Going Concern
As of December 31, 2020, the Company had $780,292 in its operating bank accounts, $287,491,254 in securities held in the Trust Account to be used for a Business Combination or to repurchase or redeem its common stock in connection therewith and working capital of $1,445,281, which excludes $23,624 of franchise taxes. As of December 31, 2020, no amount on deposit in the Trust Account represented interest income, which would be available to pay the Company’s tax obligations.
Until the consummation of a Business Combination, the Company will be using the funds not held in the Trust Account for identifying and evaluating prospective acquisition candidates, performing due diligence on prospective target businesses, paying for travel expenditures, selecting the target business to acquire, and structuring, negotiating and consummating the Business Combination.
The Company will need to raise additional capital through loans or additional investments from its Sponsor, stockholders, officers, directors, or third parties. The Company’s officers, directors and Sponsor may, but are not obligated to, loan the Company funds, from time to time or at any time, in whatever amount they deem reasonable in their sole discretion, to meet the Company’s working capital needs. Accordingly, the Company may not be able to obtain additional financing. If the Company is unable to raise additional capital, it may be
F-59
required to take additional measures to conserve liquidity, which could include, but not necessarily be limited to, curtailing operations, suspending the pursuit of a potential transaction, and reducing overhead expenses. The Company cannot provide any assurance that new financing will be available to it on commercially acceptable terms, if at all. These conditions raise substantial doubt about the Company’s ability to continue as a going concern through March 17, 2022. These financial statements do not include any adjustments relating to the recovery of the recorded assets or the classification of the liabilities that might be necessary should the Company be unable to continue as a going concern.
Risks and Uncertainties
Management continues to evaluate the impact of the
COVID-19
pandemic and has concluded that while it is reasonably possible that the virus could have a negative effect on the Company’s financial position, results of its operations and/or search for a target company, the specific impact is not readily determinable as of the date of these financial statements. The financial statements do not include any adjustments that might result from the outcome of this uncertainty.NOTE 2. RESTATEMENT OF PREVIOUSLY ISSUED FINANCIAL STATEMENTS
The Company previously accounted for its outstanding Public Warrants (as defined in Note 4) and Private Placement Warrants issued in connection with its Initial Public Offering as components of equity instead of as derivative liabilities. The warrant agreement governing the warrants includes a provision that provides for potential changes to the settlement amounts dependent upon the characteristics of the holder of the warrant. In addition, the warrant agreement includes a provision that in the event of a tender or exchange offer made to and accepted by holders of more than 50% of the outstanding shares of a single class of common shares, all holders of the warrants would be entitled to receive cash for their warrants (the “tender offer provision”).
Upon review of the “Staff Statement on Accounting and Reporting Considerations for Warrants Issued by Special Purpose Acquisition Companies (‘SPACs’)” released by the SEC staff on April 12, 2021, the Company’s management evaluated the warrants under Accounting Standards Codification (“ASC”) Subtopicaddresses equity versus liability treatment and classification of equity-linked financial instruments, including warrants, and states that a warrant may be classified as a component of equity only if, among other things, the warrant is indexed to the issuer’s common stock. Under ASCa warrant is not indexed to the issuer’s common stock if the terms of the warrant require an adjustment to the exercise price upon a specified event and that event is not an input to the fair value of the warrant. Based on management’s evaluation, the Company’s audit committee, in consultation with management and after discussion with the Company’s independent registered public accounting firm, concluded that the Company’s Private Placement Warrants are not indexed to the Company’s common shares in the manner contemplated by ASCbecause the holder of the instrument is not an input into the pricing of aoption on equity shares. In addition, based on management’s evaluation, the Company’s audit committee, in consultation with management and after discussion with the Company’s independent registered public accounting firm, concluded the tender offer provision included in the warrant agreement fails the “classified in shareholders’ equity” criteria as contemplated by ASC
815-40,
Contracts in Entity’s Own Equity. ASCSection 815-40-15
Section 815-40-15,
Section 815-40-15
fixed-for-fixed
Section 815-40-25.
As a result of the above, the Company should have classified the warrants as derivative liabilities in its previously issued financial statements. Under this accounting treatment, the Company is required to measure the fair value of the warrants at the end of each reporting period and recognize changes in the fair value from the prior period in the Company’s operating results for the current period.
F-60
The Company’s accounting for the warrants as components of equity instead of as derivative liabilities did not have any effect on the Company’s previously reported operating expenses, cash flows or cash.
As Previously Reported | Adjustments | As Restated | ||||||||||
Balance sheet as of December 10, 2020 (audited) | ||||||||||||
Total Liabilities | $ | 10,374,560 | $ | 22,272,500 | $ | 32,647,060 | ||||||
Warrant Liability | — | 22,272,500 | 22,272,500 | |||||||||
Class A Common Stock Subject to Possible Redemption | 274,031,080 | (22,272,500 | ) | 251,758,580 | ||||||||
Class A Common Stock | 135 | 222 | 357 | |||||||||
Additional Paid-in Capital | 4,999,913 | 879,809 | 5,879,722 | |||||||||
Accumulated Deficit | (999 | ) | (880,031 | ) | (881,030 | ) | ||||||
Total Stockholders’ Equity | 5,000,007 | — | 5,000,007 | |||||||||
Number of Class A common shares subject to redemption | 27,403,108 | (2,227,250 | ) | 25,175,858 | ||||||||
Balance sheet as of December 31, 2020 (audited) | ||||||||||||
Total Liabilities | $ | 10,168,977 | $ | 22,862,501 | $ | 33,031,478 | ||||||
Warrant Liability | — | 22,862,501 | 22,862,501 | |||||||||
Class A Common Stock Subject to Possible Redemption | 273,850,409 | (22,862,501 | ) | 250,987,908 | ||||||||
Class A Common Stock | 136 | 229 | 365 | |||||||||
Additional Paid-in Capital | 5,180,583 | 1,469,803 | 6,650,386 | |||||||||
Accumulated Deficit | (181,675 | ) | (1,470,032 | ) | (1,651,707 | ) | ||||||
Total Stockholders’ Equity | 5,000,002 | — | 5,000,002 | |||||||||
Number of Class A common shares subject to redemption | 27,385,874 | (2,287,083 | ) | 25,098,791 | ||||||||
Period from September 10, 2020 (inception) to December 31, 2020 (audited) | ||||||||||||
Net loss | $ | (181,675 | ) | $ | (1,470,032 | ) | $ | (1,651,707 | ) | |||
Weighted average shares outstanding, common stock subject to possible redemption | 27,403,108 | (2,227,250 | ) | 25,175,858 | ||||||||
Basic and diluted net earnings per share, common stock subject to possible redemption | 0.00 | — | 0.00 | |||||||||
Weighted average shares outstanding, non-redeemable common stock | 8,843,003 | 437,124 | 9,280,127 | |||||||||
Basic and diluted net loss per share, non-redeemable common stock | (0.02 | ) | (0.16 | ) | (0.18 | ) | ||||||
F-61
As Previously Reported | Adjustments | As Restated | ||||||||||
Cash Flow Statement for the Period from September 10, 2020 (inception) to December 31, 2020 (audited) | ||||||||||||
Net loss | $ | (181,675 | ) | $ | (1,470,032 | ) | $ | (1,651,707 | ) | |||
Allocation of initial public offering costs | — | 828,064 | 828,064 | |||||||||
Change in fair value of warrant liability | — | 590,001 | 590,001 | |||||||||
Compensation expense | — | 51,667 | 51,667 | |||||||||
Initial classification of warrant liability | — | 22,272,500 | 22,272,500 | |||||||||
Initial classification of common stock subject to possible redemption | 274,031,080 | (22,272,500 | ) | 251,758,580 | ||||||||
Change in value of common stock subject to possible redemption | (180,671 | ) | (590,001 | ) | (770,672 | ) | ||||||
NOTE 3. SUMMARY OF SIGNIFICANT ACCOUNTING POLICIES
Basis of Presentation
The accompanying financial statements are presented in conformity with accounting principles generally accepted in the United States of America (“GAAP”) and pursuant to the rules and regulations of the SEC.
Emerging Growth Company
The Company is an “emerging growth company,” as defined in Section 2(a) of the Securities Act, as modified by the Jumpstart Our Business Startups Act of 2012 (the “JOBS Act”), and it may take advantage of certain exemptions from various reporting requirements that are applicable to other public companies that are not emerging growth companies including, but not limited to, not being required to comply with the independent registered public accounting firm attestation requirements of Section 404 of the Sarbanes-Oxley Act of 2002 (“Sarbanes-Oxley Act”), reduced disclosure obligations regarding executive compensation in its periodic reports and proxy statements, and exemptions from the requirements of holding a nonbinding advisory vote on executive compensation and stockholder approval of any golden parachute payments not previously approved.
Further, Section 102(b)(1) of the JOBS Act exempts emerging growth companies from being required to comply with new or revised financial accounting standards until private companies (that is, those that have not had a Securities Act registration statement declared effective or do not have a class of securities registered under the Exchange Act) are required to comply with the new or revised financial accounting standards. The JOBS Act provides that a company can elect to opt out of the extended transition period and comply with the requirements that apply to
non-emerging
growth companies but any such election to opt out is irrevocable. The Company has elected not to opt out of such extended transition period which means that when a standard is issued or revised and it has different application dates for public or private companies, the Company, as an emerging growth company, can adopt the new or revised standard at the time private companies adopt the new or revised standard. This may make comparison of the Company’s financial statement with another public company which is neither an emerging growth company nor an emerging growth company which has opted out of using the extended transition period difficult or impossible because of the potential differences in accounting standards used.Use of Estimates
The preparation of financial statements in conformity with GAAP requires the Company’s management to make estimates and assumptions that affect the reported amounts of assets and liabilities and disclosure of
F-62
contingent assets and liabilities at the date of the financial statements and the reported amounts of revenues and expenses during the reporting period.
Making estimates requires management to exercise significant judgment. It is at least reasonably possible that the estimate of the effect of a condition, situation or set of circumstances that existed at the date of the financial statements, which management considered in formulating its estimate, could change in the near term due to one or more future confirming events. Accordingly, the actual results could differ significantly from those estimates.
Cash and Cash Equivalents
The Company considers all short-term investments with an original maturity of three months or less when purchased to be cash equivalents. The Company did not have any cash equivalents as of December 31, 2020.
Cash and Marketable Securities Held in Trust Account
At December 31, 2020, substantially all of the assets held in the Trust Account were held in U.S. Treasury Bills.
Warrant Liability
The Company accounts for warrants as either equity-classified or liability-classified instruments based on an assessment of the warrant’s specific terms and applicable authoritative guidance in Financial Accounting Standards Board (“FASB”) Accounting Standards Codification (“ASC”) 480, Distinguishing Liabilities from Equity (“ASC 480”) and ASC 815, Derivatives and Hedging (“ASC 815”). The assessment considers whether the warrants are freestanding financial instruments pursuant to ASC 480, meet the definition of a liability pursuant to ASC 480, and whether the warrants meet all of the requirements for equity classification under ASC 815, including whether the warrants are indexed to the Company’s own common shares and whether the warrant holders could potentially require “net cash settlement” in a circumstance outside of the Company’s control, among other conditions for equity classification. This assessment, which requires the use of professional judgment, is conducted at the time of warrant issuance and as of each subsequent quarterly period end date while the warrants are outstanding.
For issued or modified warrants that meet all of the criteria for equity classification, the warrants are required to be recorded as a component of additional
paid-in
capital at the time of issuance. For issued or modified warrants that do not meet all the criteria for equity classification, the warrants are required to be recorded at their initial fair value on the date of issuance, and each balance sheet date thereafter. Changes in the estimated fair value of the warrants are recognized as anon-cash
gain or loss on the statements of operations.Class A Common Stock Subject to Possible Redemption
The Company accounts for its Class A common stock subject to possible redemption in accordance with the guidance in Accounting Standards Codification (“ASC”) Topic 480 “Distinguishing Liabilities from Equity.” Class A common stock subject to mandatory redemption is classified as a liability instrument and is measured at fair value. Conditionally redeemable common stock (including common stock that features redemption rights that is either within the control of the holder or subject to redemption upon the occurrence of uncertain events not solely within the Company’s control) is classified as temporary equity. At all other times, common stock is classified as stockholders’ equity. The Company’s Class A common stock features certain redemption rights that are considered to be outside of the Company’s control and subject to occurrence of uncertain future events. Accordingly, Class A common stock subject to possible redemption is presented at redemption value as temporary equity, outside of the stockholders’ equity section of the Company’s balance sheet.
F-63
Income Taxes
The Company complies with the accounting and reporting requirements of ASC Topic 740, “Income Taxes,” which requires an asset and liability approach to financial accounting and reporting for income taxes. Deferred income tax assets and liabilities are computed for differences between the financial statement and tax bases of assets and liabilities that will result in future taxable or deductible amounts, based on enacted tax laws and rates applicable to the periods in which the differences are expected to affect taxable income. Valuation allowances are established, when necessary, to reduce deferred tax assets to the amount expected to be realized.
ASC Topic 740 prescribes a recognition threshold and a measurement attribute for the financial statement recognition and measurement of tax positions taken or expected to be taken in a tax return. For those benefits to be recognized, a tax position must be
more-likely-than-not
to be sustained upon examination by taxing authorities. The Company recognizes accrued interest and penalties related to unrecognized tax benefits, if any, as income tax expense. There were no unrecognized tax benefits and no amounts accrued for interest and penalties as of September 30, 2020. The Company is currently not aware of any issues under review that could result in significant payments, accruals or material deviation from its position. The Company is subject to income tax examinations by major taxing authorities since inception.The Company may be subject to potential examination by federal, state and city taxing authorities in the areas of income taxes. These potential examinations may include questioning the timing and amount of deductions, the nexus of income among various tax jurisdictions and compliance with federal, state and city tax laws. The Company’s management does not expect that the total amount of unrecognized tax benefits will materially change over the next twelve months.
On March 27, 2020, President Trump signed the Coronavirus Aid, Relief, and Economic Security “CARES” Act into law. The CARES Act includes several significant business tax provisions that, among other things, would eliminate the taxable income limit for certain net operating losses (“NOL”) and allow businesses to carry back NOLs arising in 2018, 2019 and 2020 to the five prior years, suspend the excess business loss rules, accelerate refunds of previously generated corporate alternative minimum tax credits, generally loosen the business interest limitation under IRC section 163(j) from 30 percent to 50 percent among other technical corrections included in the Tax Cuts and Jobs Act tax provisions. The Company does not believe that the CARES Act will have a significant impact on Company’s financial position or statement of operations.
Net Loss Per Share
Net loss per share is computed by dividing net loss by the weighted-average number of shares of common stock outstanding during the period. The Company has not considered the effect of the warrants sold in the Public Offering and Private Placement to purchase an aggregate of 14,750,000 shares in the calculation of diluted loss per share, since the exercise of the warrants are contingent upon the occurrence of future events and the inclusion of such warrants would be anti-dilutive.
The Company’s statement of operations includes a presentation of loss per share for common stock subject to possible redemption in a manner similar to the
two-class
method of loss per share. Net loss per share, basic and diluted, for stock subject to possible redemption is calculated by dividing the proportionate share of loss on marketable securities held by the Trust Account by the weighted average number of stock subject to possible redemption outstanding since original issuance.Net loss per share, basic and diluted, for
non-redeemable
common stock is calculated by dividing the net loss, adjusted for loss on marketable securities attributable to Class A common stock subject to possible redemption, by the weighted average number ofnon-redeemable
common stock outstanding for the period.Non-redeemable
common stock includes Founder Shares, alignment shares andnon-redeemable
Class A common stock as these shares do not have any redemption features.Non-redeemable
common stock participates in the loss on marketable securities based onnon-redeemable
Class A common stock’s proportionate interest.F-64
The following table reflects the calculation of basic and diluted net loss per share (in dollars, except per share amounts):
For the Period from September 10, 2020 (Inception) through December 31, 2020 | ||||
Common stock subject to possible redemption | ||||
Numerator: Earnings allocable to Common stock subject to possible redemption | ||||
Interest earned on marketable securities held in Trust Account | $ | 7,355 | ||
Unrealized loss on marketable securities held in Trust Account | (15,686 | ) | ||
Less: Company’s portion available to pay taxes | — | |||
Net Loss allocable to shares subject to redemption | $ | (8,331 | ) | |
Denominator: Weighted Average Class A common stock subject to possible redemption | ||||
Basic and diluted weighted average shares outstanding | 25,175,858 | |||
Basic and diluted net loss per share | $ | 0.00 | ||
Non-Redeemable Common Stock | ||||
Numerator: Net Loss minus Net Earnings | ||||
Net loss | $ | (1,651,707 | ) | |
Add: Net loss allocable to Class A common stock subject to possible redemption | 8,331 | |||
Non-Redeemable Net Loss | $ | (1,643,376 | ) | |
Denominator: Weighted Average Non-Redeemable Common Stock | ||||
Basic and diluted weighted average shares outstanding | 9,280,127 | |||
Basic and diluted net loss per share | $ | (0.18 | ) | |
Concentration of Credit Risk
Financial instruments that potentially subject the Company to concentrations of credit risk consist of a cash account in a financial institution, which, at times, may exceed the Federal Depository Insurance Corporation coverage of $250,000. The Company has not experienced losses on this account.
Fair value of Financial Instruments
The fair value of the Company’s assets and liabilities, which qualify as financial instruments under ASC Topic 820, “Fair Value Measurement,” approximates the carrying amounts represented in the accompanying balance sheet, primarily due to their short-term nature.
F-65
Fair Value Measurements
Fair value is defined as the price that would be received for sale of an asset or paid for transfer of a liability, in an orderly transaction between market participants at the measurement date. GAAP establishes a three-tier fair value hierarchy, which prioritizes the inputs used in measuring fair value. The hierarchy gives the highest priority to unadjusted quoted prices in active markets for identical assets or liabilities (Level 1 measurements) and the lowest priority to unobservable inputs (Level 3 measurements). These tiers include:
| • | Level 1, defined as observable inputs such as quoted prices (unadjusted) for identical instruments in active markets; |
| • | Level 2, defined as inputs other than quoted prices in active markets that are either directly or indirectly observable such as quoted prices for similar instruments in active markets or quoted prices for identical or similar instruments in markets that are not active; and |
| • | Level 3, defined as unobservable inputs in which little or no market data exists, therefore requiring an entity to develop its own assumptions, such as valuations derived from valuation techniques in which one or more significant inputs or significant value drivers are unobservable. |
In some circumstances, the inputs used to measure fair value might be categorized within different levels of the fair value hierarchy. In those instances, the fair value measurement is categorized in its entirety in the fair value hierarchy based on the lowest level input that is significant to the fair value measurement.
Derivative Financial Instruments
The Company evaluates its financial instruments to determine if such instruments are derivatives or contain features that qualify as embedded derivatives in accordance with ASC Topic 815, “Derivatives and Hedging”. For derivative financial instruments that are accounted for as liabilities, the derivative instrument is initially recorded at its fair value on the grant date and is then
re-valued
at each reporting date, with changes in the fair value reported in the statements of operations. The classification of derivative instruments, including whether such instruments should be recorded as liabilities or as equity, is evaluated at the end of each reporting period. Derivative liabilities are classified in the balance sheet as current ornon-current
based on whether or notnet-cash
settlement or conversion of the instrument could be required within 12 months of the balance sheet date.Recent Accounting Standards
Management does not believe that any recently issued, but not yet effective, accounting standards, if currently adopted, would have a material effect on the Company’s financial statements.
NOTE 4. PUBLIC OFFERING
Pursuant to the Initial Public Offering, the Company sold 28,750,000 Units, which includes a full exercise by the underwriter of the over-allotment option in the amount of 3,750,000 Units, at a purchase price of $10.00 per Unit. Each Unit consists of one share of Class A common stock and
one-third
of one redeemable warrant (“Public Warrant”). Each Public Warrant entitles the holder to purchase one share of Class A common stock at an exercise price of $11.50 per whole share, subject to adjustment (see Note 9).NOTE 5. PRIVATE PLACEMENT
Simultaneously with the closing of the Initial Public Offering, the Sponsor purchased an aggregate of 5,166,667 Private Placement Warrants at a price of $1.50 per warrant ($7,750,000 in the aggregate), each exercisable to purchase one share of Class A common stock at a price of $11.50 per share, in a private placement. The proceeds from the sale of the Private Placement Warrants were added to the net proceeds from the Initial Public Offering held in the Trust Account. If the Company does not complete a Business Combination within the
F-66
Combination Period, the proceeds from the sale of the Private Placement Warrants will be used to fund the redemption of the Public Shares (subject to the requirements of applicable law) and the Private Placement Warrants will expire worthless.
NOTE 6. RELATED PARTY TRANSACTIONS
Founder Shares
On September 15, 2020, the Sponsor paid $25,000 to cover certain offering costs of the Company in consideration for 8,625,000 shares of Class B common stock (the “Founder Shares”). On November 20, 2020, the Sponsor exchanged 4,791,667 Founder Shares, which were cancelled by the Company, for 5,750,000 alignment shares. On November 20, 2020, the Sponsor transferred 16,000 Founder Shares and 24,000 alignment shares to each of Mr. Museles, Ms. Caldwell and Mr. Fish, the Company’s independent directors, and 50,000 Founder Shares and 50,000 alignment shares to Andrew Wallace, who will serve as an advisor to the Sponsor and provide it with services in connection with the sourcing and completion of a Business Combination. Up to 500,000 Founder Shares and 750,000 alignment shares are subject to forfeiture by the Sponsor to the extent that the underwriter’s over-allotment is not exercised in full or in part so that the Founder Shares and alignment shares will represent 10% and 15%, respectively, of the Company’s issued and outstanding shares of common stock after the Initial Public Offering. The alignment shares are reflected as Class C common stock, have the same rights and conditions are Class B common stock and are more fully described in Note 8. As a result of the underwriter’s election to fully exercise the over-allotment option on December 10, 2020, no Founder Shares or alignment shares are currently subject to forfeiture.
The Sponsor and other holders of Founder Shares and alignment shares have agreed, subject to certain limited exceptions, not to transfer, assign or sell any of the Founder Shares until the earlier to occur of: (A) one year after the completion of a Business Combination or (B) subsequent to a Business Combination, (x) if the last reported sale price of the Class A common stock equals or exceeds $12.00 per share (as adjusted for stock splits, stock dividends, reorganizations, recapitalizations and the like) for any 20 trading days within any
30-trading
day period commencing at least 150 days after a Business Combination, or (y) the date on which the Company completes a liquidation, merger, capital stock exchange or other similar transaction that results in all of the Company’s stockholders having the right to exchange their shares of common stock for cash, securities or other property.The Sponsor and other holders of Founder Shares and alignment shares have agreed, subject to certain limited exceptions, not to transfer, assign or sell any of the alignment shares until the earlier of: (A) their conversion into shares of Class A common stock; and (B) subsequent to the initial Business Combination, the date on which the Company completes a merger, stock exchange, reorganization or other similar transaction that results in both a change of control and all of the Company’s public stockholders having the right to exchange their shares of Class A common stock for cash, securities or other property.
Administrative Support Agreement
The Company entered into an agreement, commencing on December 7, 2020, pursuant to which it will agree to pay the Sponsor a total of $10,000 per month for office space, administrative and support services. Upon completion of the Business Combination or the Company’s liquidation, the Company will cease paying these monthly fees. For the period from September 10, 2020 (inception) through December 31, 2020, the Company incurred $7,742 in fees for these services, of which such amount is included in accrued expenses in the accompanying balance sheet.
Promissory Note — Related Party
On September 11, 2020, the Sponsor agreed to loan the Company an aggregate of up to $300,000 to cover expenses related to the Initial Public Offering pursuant to a promissory note (the “Promissory Note”). The
F-67
Promissory Note is
non-interest
bearing and payable on the earlier of (i) June 30, 2021 or (ii) the consummation of the Initial Public Offering. As of December 10, 2020, there was $83,686 outstanding under the Promissory Note, which was due on demand. The outstanding balance under the Promissory Note of $83,686 was repaid on December 15, 2020.Related Party Loans
In addition, in order to finance transaction costs in connection with a Business Combination, the Sponsor, an affiliate of the Sponsor or certain of the Company’s officers and directors may, but are not obligated to, loan the Company funds on a
non-interest
basis as may be required (“Working Capital Loans”). If the Company completes a Business Combination, the Company would repay the Working Capital Loans out of the proceeds of the Trust Account released to the Company. Otherwise, the Working Capital Loans would be repaid only out of funds held outside the Trust Account. In the event that a Business Combination does not close, the Company may use a portion of proceeds held outside the Trust Account to repay the Working Capital Loans, but no proceeds held in the Trust Account would be used to repay the Working Capital Loans. Except for the foregoing, the terms of such Working Capital Loans, if any, have not been determined and no written agreements exist with respect to such loans. The Working Capital Loans would be repaid upon consummation of a Business Combination, without interest, or, at the lender’s discretion, up to $1,500,000 of such Working Capital Loans may be convertible into warrants at a price of $1.50 per warrant. The warrants would be identical to the Private Placement Warrants.NOTE 7. COMMITMENTS
Registration Rights
Pursuant to a registration rights agreement entered into on December 7, 2020, the holders of the Founder Shares, alignment shares, Private Placement Warrants and any warrants that may be issued upon conversion of the Working Capital Loans (and any shares of Class A common stock issuable upon the exercise of the Private Placement Warrants and warrants that may be issued upon conversion of Working Capital Loans and upon conversion of the Founder Shares and alignment shares) will be entitled to registration rights requiring the Company to register such securities for resale (in the case of the Founder Shares and alignment shares, only after conversion to shares of our Class A common stock). The holders of these securities will be entitled to make up to three demands, excluding short form registration demands, that the Company register such securities. In addition, the holders have certain “piggy-back” registration rights with respect to registration statements filed subsequent to the completion of a Business Combination and rights to require the Company to register for resale such securities pursuant to Rule 415 under the Securities Act. However, the registration rights agreement provides that the Company will not be required to effect or permit any registration or cause any registration statement to become effective until termination of the applicable
lock-up
period. The registration rights agreement does not contain liquidating damages or other cash settlement provisions resulting from delays in registering the Company’s securities. The Company will bear the expenses incurred in connection with the filing of any such registration statements.Underwriting Agreement
The underwriter is entitled to a deferred fee of $0.35 per Unit, or $10,062,500 in the aggregate. Of such amount, at the Company’s sole and absolute discretion, up to $0.175 per Unit, or up to $5,031,250, may be paid to third parties not participating in the Initial Public Offering that assist the Company in consummating its initial Business Combination. The deferred fee will become payable to the underwriter from the amounts held in the Trust Account solely in the event that the Company completes a Business Combination, subject to the terms of the underwriting agreement.
F-68
NOTE 8. STOCKHOLDERS’ EQUITY
Preferred Stock
Class
A Common Stock
Class
B Common Stock
Class
C Common Stock
The Class C common stock will automatically convert into shares of Class A common stock at the earlier of (i) a time after the completion of a Business Combination in which the sale price of shares of the Class A common stock equals or exceeds $15.25 if occurring before the third anniversary of a Business Combination, $23.00 if occurring before the sixth anniversary of a Business Combination or $35.00 if occurring before the ninth anniversary of a Business Combination, and (ii) subsequent to the completion of the Business Combination, the date on which the Company completes a merger, stock exchange, reorganization or other similar transaction that results in both a change of control and all of its public stockholders having the right to exchange their shares of Class A common stock for cash, securities or other property, in each case, on abasis, subject to adjustment. The Class C common stock shares will be returned to the Company for cancellation in the event that they have not converted into shares of Class A common stock nine years after a Business Combination.
one-for-one
Holders of Class A common stock, Class B common stock and Class C common stock will vote together as a single class on all other matters submitted to a vote of stockholders, except as required by law.
The shares of Class B common stock will automatically convert into shares of Class A common stock at the time of a Business Combination on abasis, subject to adjustment. The shares of Class C common stock will automatically convert into shares of Class A common stock if the Company meets certain stock price performance thresholds following the completion of a Business Combination, on abasis, subject to adjustment. In the case that additional shares of Class A common stock, or equity-linked securities, are issued or deemed issued in excess of the amounts issued in this offering and related to the closing of a Business Combination, the ratio at which the shares of Class B common stock and Class C common stock will convert into shares of Class A common stock will be adjusted (unless the holders of a majority of the issued and outstanding shares of Class B common stock and Class C common stock agree to waive such anti-dilution adjustment with respect to any such issuance or deemed issuance) so that the number of shares of Class A common stock issuable upon conversion of all shares of Class B common stock and Class C common stock will equal, in the aggregate, on an
one-for-one
one-for-one
as-converted
basis, 25% of the sum of all common stock issued and outstanding upon the completion of the Initial Public Offering plus all shares of Class A common stock and equity-linked securities issued or deemed issued in connection with a Business Combination, excluding any shares or equity-linked securities issued, or to be issued, to any seller in a Business Combination.F-69
NOTE 9. WARRANT LIABILITY
Warrants
The Company will not be obligated to deliver any Class A common stock pursuant to the exercise of a Public Warrant and will have no obligation to settle such Public Warrant exercise unless a registration statement under the Securities Act covering the issuance of the Class A common stock issuable upon exercise of the Public Warrants is then effective and a prospectus relating thereto is current, subject to the Company satisfying its obligations with respect to registration. No warrant will be exercisable and the Company will not be obligated to issue shares of Class A common stock upon exercise of a warrant unless Class A common stock issuable upon such warrant exercise has been registered, qualified or deemed to be exempt under the securities laws of the state of residence of the registered holder of the warrants.
The Company has agreed that as soon as practicable, but in no event later than 15 business days after the closing of a Business Combination, it will use its commercially reasonable efforts to file with the SEC a registration statement covering the issuance, under the Securities Act, of the Class A common stock issuable upon exercise of the warrants, and the Company will use its commercially reasonable efforts to cause the same to become effective within 60 business days after the closing of a Business Combination and to maintain the effectiveness of such registration statement, and a current prospectus relating thereto, until the expiration of the warrants in accordance with the provisions of the warrant agreement. Notwithstanding the above, if the shares of Class A common stock are, at the time of any exercise of a warrant, not listed on a national securities exchange such that they satisfy the definition of a “covered security” under Section 18(b)(1) of the Securities Act, the Company may, at its option, require holders of public warrants who exercise their warrants to do so on a “cashless basis” in accordance with Section 3(a)(9) of the Securities Act and, in the event the Company so elects, the Company will not be required to file or maintain in effect a registration statement, but will use its commercially reasonable efforts to register or qualify the shares under applicable blue sky laws to the extent an exemption is not available.
Redemption of Warrants When the Price per share of Class
A common stock Equals or Exceeds $18.00
| • | in whole and not in part; |
| • | at a price of $0.01 per Public Warrant; |
| • | upon not less than 30 days’ prior written notice of redemption to each warrant holder; and |
| • | if, and only if, the last reported sale price of the Class A common stock for any 20-trading days within a30-trading day period ending on the third trading day prior to the date on which the Company send the notice of redemption to the warrant holders (the “Reference Value”) equals or exceeds $18.00 per share (as adjusted). |
If and when the warrants become redeemable by the Company, the Company may exercise its redemption right even if it is unable to register or qualify the underlying securities for sale under all applicable state securities laws.
Redemption of Warrants When the Price per share of Class
A common stock Equals or Exceeds $10.00
| • | in whole and not in part; |
F-70
| • | at $0.10 per warrant upon a minimum of 30 days’ prior written notice of redemption provided that holders will be able to exercise their warrants on a cashless basis prior to redemption and receive that number of shares based on the redemption date and the “fair market value” of our Class A common stock; |
| • | if, and only if, the Reference Value equals or exceeds $10.00 per share (as adjusted); and |
| • | if the Reference Value is less than $18.00 per share (as adjusted), the Private Placement Warrants must also be concurrently called for redemption on the same terms as the outstanding Public Warrants, as described above. |
The exercise price and number of Class A common stock issuable upon exercise of the Public Warrants may be adjusted in certain circumstances including in the event of a share dividend, extraordinary dividend or recapitalization, reorganization, merger or consolidation. However, except as described below, the Public Warrants will not be adjusted for issuances of Class A common stock at a price below its exercise price. Additionally, in no event will the Company be required to net cash settle the Public Warrants. If the Company is unable to complete a Business Combination within the Combination Period and the Company liquidates the funds held in the Trust Account, holders of Public Warrants will not receive any of such funds with respect to their Public Warrants, nor will they receive any distribution from the Company’s assets held outside of the Trust Account with respect to such Public Warrants. Accordingly, the Public Warrants may expire worthless.
In addition, if (x) the Company issues additional shares of Class A common stock or equity-linked securities for capital raising purposes in connection with the closing of its initial Business Combination at an issue price or effective issue price of less than $9.20 per share of Class A common stock (with such issue price or effective issue price to be determined in good faith by the Company’s board of directors and, in the case of any such issuance to the Sponsor or its affiliates, without taking into account any Founder Shares and alignment shares held by the Sponsor or such affiliates, as applicable, prior to such issuance) (the “Newly Issued Price”), (y) the aggregate gross proceeds from such issuances represent more than 60% of the total equity proceeds, and interest thereon, available for the funding of the Company’s initial Business Combination on the date of the consummation of such initial Business Combination (net of redemptions), and (z) the volume weighted average trading price of the Company’s Class A common stock during the 20 trading day period starting on the trading day prior to the day on which the Company consummates its initial Business Combination (such price, the “Market Value”) is below $9.20 per share, the exercise price of the warrants will be adjusted (to the nearest cent) to be equal to 115% of the higher of the Market Value and the Newly Issued Price and the $18.00 and $10.00 per share redemption trigger prices described above will be adjusted (to the nearest cent) to be equal to 180% and 100%, respectively, of the higher of the Market Value and the Newly Issued Price.
The Private Placement Warrants are identical to the Public Warrants underlying the Units sold in the Initial Public Offering, except that the Private Placement Warrants will and the common shares issuable upon the exercise of the Private Placement Warrants will not be transferable, assignable or salable until 30 days after the completion of a Business Combination, subject to certain limited exceptions. Additionally, the Private Placement Warrants will be exercisable on a cashless basis and will be
non-redeemable
so long as they are held by the initial purchasers or their permitted transferees. If the Private Placement Warrants are held by someone other than the initial purchasers or their permitted transferees, the Private Placement Warrants will be redeemable by the Company and exercisable by such holders on the same basis as the Public Warrants.F-71
NOTE 10. INCOME TAX
The Company’s net deferred tax assets is as follows:
December 31, 2020 | ||||
Deferred tax assets | ||||
Net operating loss carryforward | $ | 36,315 | ||
Unrealized loss on marketable securities held in Trust Account | 1,837 | |||
Total deferred tax assets | 38,152 | |||
Valuation Allowance | (38,152 | ) | ||
Deferred tax assets, net of allowance | $ | — | ||
The income tax provision consists of the following:
As of December 31, 2020 | ||||
Federal | ||||
Current | $ | — | ||
Deferred | (38,152 | ) | ||
State and Local | ||||
Current | — | |||
Deferred | — | |||
Change in valuation allowance | 38,152 | |||
Income tax provision | $ | — | ||
As of December 31, 2020, the Company had 172,929 of U.S. federal net operating loss carryovers available to offset future taxable income.
In assessing the realization of the deferred tax assets, management considers whether it is more likely than not that some portion of all of the deferred tax assets will not be realized. The ultimate realization of deferred tax assets is dependent upon the generation of future taxable income during the periods in which temporary differences representing net future deductible amounts become deductible. Management considers the scheduled reversal of deferred tax liabilities, projected future taxable income and tax planning strategies in making this assessment. After consideration of all of the information available, management believes that significant uncertainty exists with respect to future realization of the deferred tax assets and has therefore established a full valuation allowance. For the period from September 10, 2020 (inception) through December 31, 2020, the change in the valuation allowance was $38,152.
A reconciliation of the federal income tax rate to the Company’s effective tax rate is as follows:
December 31, 2020 | ||||
Statutory federal income tax rate | 21.0 | % | ||
State taxes, net of federal tax benefit | 0.0 | % | ||
Change in fair value of warrant liability | (18.7 | )% | ||
Valuation allowance | (2.3 | )% | ||
Income tax provision | 0.0 | % | ||
F-72
The Company files income tax returns in the U.S. federal jurisdiction and is subject to examination by the various taxing authorities. The Company’s tax returns for the year ended December 31, 2020 remain open and subject to examination. The Company considers Delaware to be a significant state tax jurisdiction.
NOTE 11. FAIR VALUE MEASUREMENTS
The Company follows the guidance in ASC Topic 820 for its financial assets and liabilities that are
re-measured
and reported at fair value at each reporting period, andnon-financial
assets and liabilities that arere-measured
and reported at fair value at least annually.The fair value of the Company’s financial assets and liabilities reflects management’s estimate of amounts that the Company would have received in connection with the sale of the assets or paid in connection with the transfer of the liabilities in an orderly transaction between market participants at the measurement date. In connection with measuring the fair value of its assets and liabilities, the Company seeks to maximize the use of observable inputs (market data obtained from independent sources) and to minimize the use of unobservable inputs (internal assumptions about how market participants would price assets and liabilities). The following fair value hierarchy is used to classify assets and liabilities based on the observable inputs and unobservable inputs used in order to value the assets and liabilities:
Level 1: Quoted prices in active markets for identical assets or liabilities. An active market for an asset or liability is a market in which transactions for the asset or liability occur with sufficient frequency and volume to provide pricing information on an ongoing basis.
Level 2: Observable inputs other than Level 1 inputs. Examples of Level 2 inputs include quoted prices in active markets for similar assets or liabilities and quoted prices for identical assets or liabilities in markets that are not active.
Level 3: Unobservable inputs based on our assessment of the assumptions that market participants would use in pricing the asset or liability.
The following table presents information about the Company’s assets and liabilities that are measured at fair value on a recurring basis at December 31, 2020, and indicates the fair value hierarchy of the valuation inputs the Company utilized to determine such fair value:
Description | Level | December 31, 2020 | ||||||
Assets: | ||||||||
Marketable securities held in Trust Account | 1 | $ | 287,491,254 | |||||
Liabilities: | ||||||||
Warrant Liability – Public Warrants | 3 | $ | 14,854,167 | |||||
Warrant Liability – Private Placement Warrants | 3 | $ | 8,008,334 | |||||
The Warrants were accounted for as liabilities in accordance with ASC
815-40
and are presented within warrant liabilities on our balance sheet. The warrant liabilities are measured at fair value at inception and on a recurring basis, with changes in fair value presented within change in fair value of warrant liabilities in the statement of operations.The Public Warrants and Private Warrants were initially valued using a binomial Monte Carlo simulation model, which is considered to be a Level 3 fair value measurement. The Monte Carlo model’s primary unobservable input utilized in determining the fair value of the warrants is the expected volatility of the common stock. The expected volatility as of the IPO date was derived from observable public warrant pricing on comparable “blank-check” companies without an identified target. The expected volatility as of subsequent
F-73
valuation dates will be implied from the Company’s own public warrant pricing. For periods subsequent to the detachment of the Public Warrants from the Units, the close price of the public warrant price will be used as the fair value as of each relevant date.
The key inputs into the Monte Carlo simulation model for the Private Placement Warrants and Public Warrants were as follows at initial measurement and December 31, 2020:
Input | December 10, 2020 | December 31, 2020 | ||||||
Risk-free interest rate | 0.39 | % | 0.36 | % | ||||
Trading days per year | 252 | 252 | ||||||
Expected volatility | 29.0 | % | 29.0 | % | ||||
Exercise price | $ | 11.50 | $ | 11.50 | ||||
Stock Price | $ | 10.30 | $ | 10.41 | ||||
The following table presents the changes in the fair value of warrant liabilities:
Private Placement | Public | Warrant Liabilities | ||||||||||
Fair value as of September 10, 2020 (inception) | $ | — | $ | — | $ | — | ||||||
Initial measurement on December 10, 2020 | 7,801,667 | 14,470,833 | 22,272,500 | |||||||||
Change in valuation inputs or other assumptions | 206,667 | 383,334 | 590,001 | |||||||||
Fair value as of December 31, 2020 | $ | 8,008,334 | $ | 14,854,167 | $ | 22,862,501 | ||||||
NOTE 12. SUBSEQUENT EVENTS
The Company evaluated subsequent events and transactions that occurred after the balance sheet date up to the date that the financial statements were issued. Based upon this review, the Company did not identify any subsequent events that would have required adjustment or disclosure in the financial statements other than as noted below and in Note 2 and Note 11.
12A — Merger and Subscription Agreements
On February 23, 2021, the Company entered into an Agreement and Plan of Merger (the “Merger Agreement”), by and among the Company, Pickup Merger Corp, a Delaware corporation and a direct, wholly owned subsidiary of the Company (“Merger Sub”), and Berkshire Grey, Inc., a Delaware corporation (“Berkshire Grey”), relating to a proposed business combination with Berkshire Grey (the “Berkshire Grey Business Combination”). Pursuant to the Merger Agreement, Merger Sub will merge with and into Berkshire Grey, with Berkshire Grey being the surviving corporation of the merger and a direct, wholly owned subsidiary of the Company.
Subject to the terms and conditions of the Merger Agreement, the consideration to be paid in respect of each share of common stock, par value $0.001 per share, of Berkshire Grey (“Berkshire Grey Common Stock”) issued and outstanding immediately prior to the effective time of the Merger will be a number of shares of newly-issued Class A common stock of the Company (with each share valued at $10.00), par value $0.0001 per share (“RAAC Class A Common Stock”), equal to (x) $2,250,000,000.00 divided by (y) the number of shares of Aggregate Fully Diluted Company Stock (as defined in the Merger Agreement). Immediately prior to the closing of the Business Combination (the “Closing”), all of the outstanding shares of each series of preferred stock of Berkshire Grey will be converted into shares of Berkshire Grey Common Stock.
F-74
At the Closing, each outstanding option to acquire Berkshire Grey Common Stock and each award of restricted Berkshire Grey Common Stock will be converted into the right to receive an option relating to shares of Class A Stock and an award of restricted shares of Class A Stock, as applicable, upon substantially the same terms and conditions, including with respect to vesting and termination-related provisions, as existed prior to the Closing, except that the number of shares underlying such option and the exercise price and the number of shares subject to restricted stock awards, in each case, shall be determined as set forth in the Merger Agreement.
The Merger Agreement contains customary representations, warranties and covenants by the parties thereto and the closing is subject to certain conditions as further described in the Merger Agreement.
Concurrently with the execution of the Merger Agreement, the Company entered into subscription agreements (the “Subscription Agreements”) with certain investors (the “PIPE Investors”), pursuant to which the PIPE Investors have committed to purchase an aggregate amount of $165,000,000 in shares of Class A Stock at a purchase price of $10.00 per share, substantially concurrent with, and contingent upon, the Closing (the “PIPE Investment”).
The Subscription Agreements for the PIPE Investors provide for certain registration rights. In particular, the Company is required to, within 30 calendar days following the Closing, file with the SEC a registration statement registering the resale of the securities issued pursuant to the Subscription Agreements. Additionally, the Company is required to use its commercially reasonable efforts to have such registration statement declared effective as soon as practicable after the filing thereof, but no later than the earlier of (i) the 90
th
calendar day following the filing date thereof and (ii) the 10th
business day after the date the Company is notified (orally or in writing, whichever is earlier) by the SEC that the registration statement will not be “reviewed” or will not be subject to further review.Each Subscription Agreement will terminate with no further force and effect upon the earliest to occur of: (a) such date and time as the Merger Agreement is terminated in accordance with its terms; (b) the mutual written agreement of the parties to such Subscription Agreement; (c) if any of the conditions to closing set forth in the Subscription Agreements are not satisfied on or prior to the closing of the PIPE Investment and, as a result thereof, the transactions contemplated by such Subscription Agreement fail to occur; and (d) if the consummation of the Berkshire Grey Business Combination has not occurred by the Outside Date.
12B — Demand Letters
On March 30, 2021, April 10, 2021, May 4, 2021 and May 6, 2021, four purported stockholders of RAAC sent demand letters requesting that RAAC provide additional disclosures in an amendment to the registration statement filed in connection with the Berkshire Grey Business Combination. The Company believes that the allegations in the demand letters are meritless and no additional disclosure is required in such registration statement.
F-75
BERKSHIRE GREY, INC.
(successor to REVOLUTION ACCELERATION ACQUISITION CORP)
CONDENSED CONSOLIDATED BALANCE SHEETS
June 30, 2021 | December 31, 2020 | |||||||
(Unaudited) | ||||||||
ASSETS | ||||||||
Current Assets | ||||||||
Cash and cash equivalents | $ | 123,871 | $ | 780,292 | ||||
Prepaid expenses | 365,366 | 747,842 | ||||||
Total Current Assets | 489,237 | 1,528,134 | ||||||
Cash and marketable securities held in Trust Account | 287,538,614 | 287,491,254 | ||||||
TOTAL ASSETS | $ | 288,027,851 | $ | 289,019,388 | ||||
LIABILITIES AND STOCKHOLDERS’ EQUITY (DEFICIT) | ||||||||
Accounts payable and accrued expenses | $ | 3,053,408 | $ | 106,477 | ||||
Promissory note - related party | 500,000 | — | ||||||
Total Current Liabilities | 3,553,408 | 106,477 | ||||||
Warrant liability | 29,603,334 | 22,862,501 | ||||||
Deferred underwriting fee payable | 10,062,500 | 10,062,500 | ||||||
Total Liabilities | 43,219,242 | 33,031,478 | ||||||
Commitments | ||||||||
Class A common stock subject to possible redemption 28,750,000 and 25,098,791 shares at redemption value at June 30, 2021 and December 31, 2020, respectively | 287,500,000 | 250,987,908 | ||||||
Stockholders’ Equity (Deficit) | ||||||||
Preferred stock, $0.0001 par value; 1,000,000 shares authorized; no shares issued and outstanding | — | — | ||||||
Class A common stock, $0.0001 par value; 75,000,000 shares authorized; 0 and 3,651,209 issued and outstanding (excluding 28,750,000 and 25,098,791 shares subject to possible redemption) at June 30, 2021 and December 31, 2020, respectively | — | 365 | ||||||
Class B common stock, $0.0001 par value; 10,000,000 shares authorized; 3,833,333 shares issued and outstanding | 383 | 383 | ||||||
Class C common stock, $0.0001 par value; 15,000,000 shares authorized; 5,750,000 shares issued and outstanding | 575 | 575 | ||||||
Additional paid-in capital | 24,138 | 6,650,386 | ||||||
Accumulated deficit | (42,716,487 | ) | (1,651,707 | ) | ||||
Total Stockholders’ Equity (Deficit) | (42,691,391 | ) | 5,000,002 | |||||
TOTAL LIABILITIES AND STOCKHOLDERS’ EQUITY (DEFICIT) | $ | 288,027,851 | $ | 289,019,388 | ||||
The accompanying notes are an integral part of the condensed consolidated financial statements.
F-76
BERKSHIRE GREY, INC.
(successor to REVOLUTION ACCELERATION ACQUISITION CORP)
CONDENSED CONSOLIDATED STATEMENTS OF OPERATIONS
(Unaudited)
Three Months Ended June 30, 2021 | Six Months Ended June 30, 2021 | |||||||
Formation and operating costs | $ | 1,157,655 | $ | 4,485,844 | ||||
Loss from operations | (1,157,655 | ) | (4,485,844 | ) | ||||
Other expense: | ||||||||
Change in fair value of derivative liabilities | (398,333 | ) | (6,740,833 | ) | ||||
Interest income - bank | 2 | 16 | ||||||
Interest earned on marketable securities held in Trust Account | 4,614 | 47,360 | ||||||
Unrealized loss on marketable securities held in Trust Account | (744 | ) | — | |||||
Other expense, net | (394,461 | ) | (6,693,457 | ) | ||||
Loss before income taxes | (1,552,116 | ) | (11,179,301 | ) | ||||
Provision for income taxes | — | — | ||||||
Net loss | $ | (1,552,116 | ) | $ | (11,179,301 | ) | ||
Basic and diluted weighted average shares outstanding, Class A common stock subject to redemption | 28,750,000 | 27,674,922 | ||||||
Basic and diluted net income per share, Class A common stock subject to redemption | $ | 0.00 | $ | 0.00 | ||||
Basic and diluted weighted average shares outstanding, Non-redeemable common stock | 9,583,333 | 10,658,411 | ||||||
Basic and diluted net loss per share, Non-redeemable common stock | $ | (0.16 | ) | $ | (1.05 | ) | ||
The accompanying notes are an integral part of the condensed consolidated financial statements.
F-77
BERKSHIRE GREY, INC.
(successor to REVOLUTION ACCELERATION ACQUISITION CORP)
CONDENSED CONSOLIDATED STATEMENT OF CHANGES IN STOCKHOLDERS’ EQUITY (DEFICIT)
THREE AND SIX MONTHS ENDED JUNE 30, 2021
(Unaudited)
Class A Common Stock | Class B Common Stock | Class C Common Stock | Additional Paid-in | Accumulated | Total Stockholders’ | |||||||||||||||||||||||||||||||
Shares | Amount | Shares | Amount | Shares | Amount | Capital | Deficit | Equity (Deficit) | ||||||||||||||||||||||||||||
Balance – December 31, 2020 | 3,651,209 | $ | 365 | 3,833,333 | $ | 383 | 5,750,000 | $ | 575 | $ | 6,650,386 | $ | (1,651,707 | ) | $ | 5,000,002 | ||||||||||||||||||||
Change in fair value of common stock subject to possible redemption | (3,651,209 | ) | (365 | ) | — | — | — | — | (6,626,248 | ) | (29,885,479 | ) | (36,512,092 | ) | ||||||||||||||||||||||
Net loss | — | — | — | — | — | — | — | (9,627,185 | ) | (9,627,185 | ) | |||||||||||||||||||||||||
Balance – March 31, 2021 | — | $ | — | 3,833,333 | $ | 383 | 5,750,000 | $ | 575 | $ | 24,138 | $ | (41,164,371 | ) | $ | (41,139,275 | ) | |||||||||||||||||||
Net loss | — | — | — | — | — | — | — | (1,552,116 | ) | (1,552,116 | ) | |||||||||||||||||||||||||
Balance – June 30, 2021 | — | $ | — | 3,833,333 | $ | 383 | 5,750,000 | $ | 575 | $ | 24,138 | $ | (42,716,487 | ) | $ | (42,691,391 | ) | |||||||||||||||||||
The accompanying notes are an integral part of the condensed consolidated financial statements.
F-78
BERKSHIRE GREY, INC.
(successor to REVOLUTION ACCELERATION ACQUISITION CORP)
CONDENSED CONSOLIDATED STATEMENT OF CASH FLOWS
SIX MONTHS ENDED JUNE 30, 2021
(Unaudited)
Cash Flows from Operating Activities: | ||||
Net loss | $ | (11,179,301 | ) | |
Adjustments to reconcile net income to net cash used in operating activities: | ||||
Interest earned on marketable securities held in Trust Account | (47,360 | ) | ||
Change in fair value of derivative liabilities | 6,740,833 | |||
Changes in operating assets and liabilities: | ||||
Prepaid expenses | 382,476 | |||
Accounts payable and accrued expenses | 2,946,931 | |||
Net cash used in operating activities | (1,156,421 | ) | ||
Cash Flows from Financing Activities: | ||||
Proceeds from promissory note – related party | 500,000 | |||
Net cash provided by financing activities | 500,000 | |||
Net Change in Cash and Cash Equivalents | (656,421 | ) | ||
Cash and Cash Equivalents – Beginning of period | 780,292 | |||
Cash and Cash Equivalents – End of period | $ | 123,871 | ||
Non-Cash investing and financing activities: | ||||
Change in value of Class A common stock subject to possible redemption | $ | 36,512,092 | ||
The accompanying notes are an integral part of the condensed consolidated financial statements.
F-79
BERKSHIRE GREY, INC.
(successor to REVOLUTION ACCELERATION ACQUISITION CORP)
NOTES TO CONDENSED CONSOLIDATED FINANCIAL STATEMENTS
JUNE 30, 2021
(Unaudited)
NOTE 1. DESCRIPTION OF ORGANIZATION AND BUSINESS OPERATIONS
Berkshire Grey, Inc., formally known as Revolution Acceleration Acquisition Corp (formerly known as Acceleration Acquisition Corporation) (the “Company”) is a blank check company incorporated in Delaware on September 10, 2020. The Company was formed for the purpose of effectuating a merger, capital stock exchange, asset acquisition, stock purchase, reorganization or other similar business combination with one or more businesses.
Business Combination
On July 21, 2021, the Company closed the previously announced business combination pursuant to that certain Agreement and Plan of Merger, dated as of February 23, 2021 (the “Merger Agreement”), by and among RAAC, Pickup Merger Corp, a Delaware corporation and a direct, wholly owned subsidiary of RAAC (“Merger Sub”), and Legacy Berkshire Grey, which provided for, among other things, the merger of Merger Sub with and into Legacy Berkshire Grey (the “Merger”), with Legacy Berkshire Grey being the surviving corporation of the Merger and having become a direct, wholly owned subsidiary of the Company as a consequence of the Merger (together with the other transactions contemplated by the Merger Agreement, the “Business Combination”). In connection with the consummation of the Business Combination, RAAC changed its name to Berkshire Grey, Inc. and Legacy Berkshire Grey changed its name to Berkshire Grey Operating Company, Inc.
Holders of 23,251,823 shares of RAAC’s Class A common stock (the “public shares”) properly exercised their right to have such shares redeemed for a full pro rata portion of the trust account holding the proceeds from RAAC’s initial public offering, calculated as of two business days prior to the consummation of the business combination, which was approximately $10.00 per share, or $232,551,292 in the aggregate.
As a result of the Business Combination, each share of Legacy Berkshire Grey preferred stock was converted into Legacy Berkshire Grey common stock, and each share of Legacy Berkshire Grey common stock was converted into the right to receive approximately 5.87585 shares of the Company’s Class A Common Stock.
Pursuant to subscription agreements entered into in connection with the Merger Agreement (collectively, the “Subscription Agreements”), certain investors (the “PIPE Investors”) agreed to subscribe for an aggregate of 16,500,000 newly-issued shares of Class A Common Stock at a purchase price of $10.00 per share for an aggregate purchase price of $165,000,000 (the “PIPE Investment”). At the Closing, the Company consummated the PIPE Investment.
After giving effect to the Transactions and the consummation of the PIPE Investment there are currently 222,597,413 shares of the Company’s Class A Common Stock issued and outstanding.
The Company’s Class A Common Stock and warrants commenced trading on The Nasdaq Stock Market LLC (“Nasdaq”) under the symbols “BGRY” and “BGRYW,” respectively, on July 22, 2021, subject to ongoing review of the Company’s satisfaction of all listing criteria following the Business Combination.
As noted above, an aggregate of $232,551,292 was paid from the Company’s trust account to holders that properly exercised their right to have public shares redeemed, and the remaining balance of approximately $54,989,588 was used to fund the Business Combination.
F-80
BERKSHIRE GREY, INC.
(successor to REVOLUTION ACCELERATION ACQUISITION CORP)
NOTES TO CONDENSED CONSOLIDATED FINANCIAL STATEMENTS
JUNE 30, 2021
(Unaudited)
Business Prior to the Business Combination
Prior to the Business Combination, the Company had one subsidiary, Pickup Merger Corp, a direct, wholly-owned subsidiary of the Company incorporated in Delaware on February 19, 2021 (“Merger Sub”) (see Note 10).
All activity through June 30, 2021 related to the Company’s formation, the initial public offering (the “Initial Public Offering”), which is described below, and identifying a target company for an initial business combination and consummating the acquisition of Berkshire Grey, Inc.
The registration statement for the Company’s Initial Public Offering was declared effective on December 7, 2020. On December 10, 2020, the Company consummated the Initial Public Offering of 28,750,000 units (the “Units” and, with respect to the shares of Class A common stock included in the Units sold, the “Public Shares”), which includes the full exercise by the underwriter of its over-allotment option in the amount of 3,750,000 Units, at $10.00 per Unit, generating gross proceeds of $287,500,000, which is described in Note 3.
Simultaneously with the closing of the Initial Public Offering, the Company consummated the sale of 5,166,667 warrants (each, a “Private Placement Warrant” and, collectively, the “Private Placement Warrants”) at a price of $1.50 per Private Placement Warrant in a private placement to RAAC Management LLC (the “Sponsor”), generating gross proceeds of $7,750,000, which is described in Note 4.
Transaction costs amounted to $16,242,914, consisting of $5,750,000 of underwriting fees, $10,062,500 of deferred underwriting fees and $430,414 of other offering costs.
Following the closing of the Initial Public Offering on December 10, 2020, an amount of $287,500,000 ($10.00 per Unit) from the net proceeds of the sale of the Units in the Initial Public Offering and the sale of the Private Placement Warrants was placed in a trust account (the “Trust Account”), and invested in U.S. government securities, within the meaning set forth in Section 2(a)(16) of the Investment Company Act, with a maturity of 185 days or less, or in any open-ended investment company that holds itself out as a money market fund meeting the conditions of
Rule 2a-7
of the Investment Company Act of 1940, as amended (the “Investment Company Act”), as determined by the Company.Liquidity
As of June 30, 2021, the Company had approximately $123,871 in its operating bank account and $287,538,614 in securities held in the Trust Account to be used for a Business Combination or to repurchase or redeem its common stock in connection therewith.
Until the consummation of the Business Combination, the Company used the funds not held in the Trust Account for identifying and evaluating prospective acquisition candidates, performing due diligence on prospective target businesses, paying for travel expenditures, selecting the target business to acquire, and structuring, negotiating and consummating the Business Combination. In addition, the Sponsor, an affiliate of the Sponsor or certain of the Company’s officers and directors may, but are not obligated to, provide the Company Working Capital Loans of up to $1,500,000 (See Notefor more information).
Related Party Loans
On July 21, 2021, the Company completed the Business Combination with RAAC pursuant to the Merger Agreement. Upon closing of the business combination transaction, the combined company was renamed
F-81
BERKSHIRE GREY, INC.
(successor to REVOLUTION ACCELERATION ACQUISITION CORP)
NOTES TO CONDENSED CONSOLIDATED FINANCIAL STATEMENTS
JUNE 30, 2021
(Unaudited)
Berkshire Grey, Inc. Closing occurred on July 21, 2021 (the “Closing Date”). The transaction was accounted for as a reverse recapitalization. The Company received gross proceeds of $220.0 million and incurred closing costs of $27.4 million. As of June 30, 2021, $1.8 million of deferred transaction costs were recorded, which consisted of legal, accounting, and other professional services directly related to the Merger. These costs were offset against proceeds upon accounting for the Closing.
Based on the foregoing, the Company had sufficient working capital and borrowing capacity from the Sponsor to meet its needs through the consummation of the Business Combination. Over this time period, the Company used these funds for paying existing accounts payable, identifying and evaluating prospective initial business combination candidates, performing due diligence on prospective target businesses, paying for travel expenditures, selecting the target business to merge with or acquire, and structuring, negotiating and consummating the Business Combination.
NOTE 2. SUMMARY OF SIGNIFICANT ACCOUNTING POLICIES
Basis of Presentation
The accompanying unaudited condensed consolidated financial statements have been prepared in accordance with accounting principles generally accepted in the United States of America (“GAAP”) for interim financial information and in accordance with the instructions to Form
10-Q
and Article 8 of RegulationS-X
of the SEC. Certain information or footnote disclosures normally included in financial statements prepared in accordance with GAAP have been condensed or omitted, pursuant to the rules and regulations of the SEC for interim financial reporting. Accordingly, they do not include all the information and footnotes necessary for a complete presentation of financial position, results of operations, or cash flows. In the opinion of management, the accompanying unaudited condensed consolidated financial statements include all adjustments, consisting of a normal recurring nature, which are necessary for a fair presentation of the financial position, operating results and cash flows for the periods presented.The accompanying unaudited condensed consolidated financial statements should be read in conjunction with Amendment No. 1 to the Company’s Annual Report on Form
10-K/A
for the period ended December 31, 2020, as filed with the SEC on May 13, 2021. The interim results for the three and six months ended June 30, 2021 are not necessarily indicative of the results to be expected for the year ending December 31, 2021 or for any future periods.Principles of Consolidation
The accompanying condensed consolidated financial statements include the accounts of the Company and its wholly-owned subsidiary. All significant intercompany balances and transactions have been eliminated in consolidation.
Emerging Growth Company
The Company is an “emerging growth company,” as defined in Section 2(a) of the Securities Act, as modified by the Jumpstart Our Business Startups Act of 2012 (the “JOBS Act”), and it may take advantage of certain exemptions from various reporting requirements that are applicable to other public companies that are not emerging growth companies including, but not limited to, not being required to comply with the independent registered public accounting firm attestation requirements of Section 404 of the Sarbanes-Oxley Act of 2002 (“Sarbanes-Oxley Act”), reduced disclosure obligations regarding executive compensation in its periodic reports
F-82
BERKSHIRE GREY, INC.
(successor to REVOLUTION ACCELERATION ACQUISITION CORP)
NOTES TO CONDENSED CONSOLIDATED FINANCIAL STATEMENTS
JUNE 30, 2021
(Unaudited)
and proxy statements, and exemptions from the requirements of holding a nonbinding advisory vote on executive compensation and stockholder approval of any golden parachute payments not previously approved.
Further, Section 102(b)(1) of the JOBS Act exempts emerging growth companies from being required to comply with new or revised financial accounting standards until private companies (that is, those that have not had a Securities Act registration statement declared effective or do not have a class of securities registered under the Exchange Act) are required to comply with the new or revised financial accounting standards. The JOBS Act provides that a company can elect to opt out of the extended transition period and comply with the requirements that apply to
non-emerging
growth companies but any such election to opt out is irrevocable. The Company has elected not to opt out of such extended transition period which means that when a standard is issued or revised and it has different application dates for public or private companies, the Company, as an emerging growth company, can adopt the new or revised standard at the time private companies adopt the new or revised standard. This may make comparison of the Company’s financial statement with another public company which is neither an emerging growth company nor an emerging growth company which has opted out of using the extended transition period difficult or impossible because of the potential differences in accounting standards used.Use of Estimates
The preparation of the condensed consolidated financial statements in conformity with GAAP requires the Company’s management to make estimates and assumptions that affect the reported amounts of assets and liabilities and disclosure of contingent assets and liabilities at the date of the condensed consolidated financial statements and the reported amounts of revenues and expenses during the reporting period.
Making estimates requires management to exercise significant judgment. It is at least reasonably possible that the estimate of the effect of a condition, situation or set of circumstances that existed at the date of the financial statements, which management considered in formulating its estimate, could change in the near term due to one or more future confirming events. Accordingly, the actual results could differ significantly from those estimates.
Cash and Cash Equivalents
The Company considers all short-term investments with an original maturity of three months or less when purchased to be cash equivalents. The Company did not have any cash equivalents as of June 30, 2021 and December 31, 2020.
Cash and Marketable Securities Held in Trust Account
At June 30, 2021 and December 31, 2020, substantially all of the assets held in the Trust Account were held in money market funds that invest in U.S. Treasury Bills.
Warrant Liability
The Company accounts for warrants as either equity-classified or liability-classified instruments based on an assessment of the warrant’s specific terms and applicable authoritative guidance in Financial Accounting Standards Board (“FASB”) Accounting Standards Codification (“ASC”) 480, Distinguishing Liabilities from Equity (“ASC 480”) and ASC 815, Derivatives and Hedging (“ASC 815”). The assessment considers whether the warrants are freestanding financial instruments pursuant to ASC 480, meet the definition of a liability pursuant to ASC 480, and whether the warrants meet all of the requirements for equity classification under ASC 815,
F-83
BERKSHIRE GREY, INC.
(successor to REVOLUTION ACCELERATION ACQUISITION CORP)
NOTES TO CONDENSED CONSOLIDATED FINANCIAL STATEMENTS
JUNE 30, 2021
(Unaudited)
including whether the warrants are indexed to the Company’s own common shares and whether the warrant holders could potentially require “net cash settlement” in a circumstance outside of the Company’s control, among other conditions for equity classification. This assessment, which requires the use of professional judgment, is conducted at the time of warrant issuance and as of each subsequent quarterly period end date while the warrants are outstanding.
For issued or modified warrants that meet all of the criteria for equity classification, the warrants are required to be recorded as a component of additional
paid-in
capital at the time of issuance. For issued or modified warrants that do not meet all the criteria for equity classification, the warrants are required to be recorded at their initial fair value on the date of issuance, and each balance sheet date thereafter. Changes in the estimated fair value of the warrants are recognized as anon-cash
gain or loss on the statements of operations.Class A Common Stock Subject to Possible Redemption
The Company accounts for its Class A common stock subject to possible redemption in accordance with the guidance in Accounting Standards Codification (“ASC”) Topic 480 “Distinguishing Liabilities from Equity.” Class A common stock subject to mandatory redemption is classified as a liability instrument and is measured at fair value. Conditionally redeemable common stock (including common stock that features redemption rights that is either within the control of the holder or subject to redemption upon the occurrence of uncertain events not solely within the Company’s control) is classified as temporary equity. At all other times, common stock is classified as stockholders’ equity. The Company’s Class A common stock features certain redemption rights that are considered to be outside of the Company’s control and subject to occurrence of uncertain future events. Accordingly, Class A common stock subject to possible redemption is presented at redemption value as temporary equity, outside of the stockholders’ equity section of the Company’s condensed consolidated balance sheets.
Income Taxes
The Company complies with the accounting and reporting requirements of ASC Topic 740, “Income Taxes,” which requires an asset and liability approach to financial accounting and reporting for income taxes. Deferred income tax assets and liabilities are computed for differences between the financial statement and tax bases of assets and liabilities that will result in future taxable or deductible amounts, based on enacted tax laws and rates applicable to the periods in which the differences are expected to affect taxable income. Valuation allowances are established, when necessary, to reduce deferred tax assets to the amount expected to be realized.
ASC Topic 740 prescribes a recognition threshold and a measurement attribute for the financial statement recognition and measurement of tax positions taken or expected to be taken in a tax return. For those benefits to be recognized, a tax position must be
more-likely-than-not
to be sustained upon examination by taxing authorities. The Company recognizes accrued interest and penalties related to unrecognized tax benefits, if any, as income tax expense. There were no unrecognized tax benefits and no amounts accrued for interest and penalties as of June 30, 2021 and December 31, 2020. The Company is currently not aware of any issues under review that could result in significant payments, accruals or material deviation from its position. The Company is subject to income tax examinations by major taxing authorities since inception.The Company may be subject to potential examination by federal, state and city taxing authorities in the areas of income taxes. These potential examinations may include questioning the timing and amount of deductions, the nexus of income among various tax jurisdictions and compliance with federal, state and city tax laws. The
F-84
BERKSHIRE GREY, INC.
(successor to REVOLUTION ACCELERATION ACQUISITION CORP)
NOTES TO CONDENSED CONSOLIDATED FINANCIAL STATEMENTS
JUNE 30, 2021
(Unaudited)
Company’s management does not expect that the total amount of unrecognized tax benefits will materially change over the next twelve months.
On March 27, 2020, President Trump signed the Coronavirus Aid, Relief, and Economic Security “CARES” Act into law. The CARES Act includes several significant business tax provisions that, among other things, would eliminate the taxable income limit for certain net operating losses (“NOL”) and allow businesses to carry back NOLs arising in 2018, 2019 and 2020 to the five prior years, suspend the excess business loss rules, accelerate refunds of previously generated corporate alternative minimum tax credits, generally loosen the business interest limitation under IRC section 163(j) from 30 percent to 50 percent among other technical corrections included in the Tax Cuts and Jobs Act tax provisions. The Company does not believe that the CARES Act will have a significant impact on Company’s financial position or statements of operations.
Net Income (Loss) Per Share
Net income (loss) per share is computed by dividing net income (loss) by the weighted-average number of shares of common stock outstanding during the period. The Company has not considered the effect of the warrants sold in the Public Offering and Private Placement to purchase an aggregate of 14,750,000 shares in the calculation of diluted income (loss) per share, since the exercise of the warrants are contingent upon the occurrence of future events and the inclusion of such warrants would be anti-dilutive.
The Company’s statements of operations includes a presentation of income (loss) per share for common stock subject to possible redemption in a manner similar to the
two-class
method of income (loss) per share. Net income (loss) per share, basic and diluted, for stock subject to possible redemption is calculated by dividing the proportionate share of income (loss) on marketable securities held by the Trust Account by the weighted average number of stock subject to possible redemption outstanding since original issuance.Net loss per share, basic and diluted, for
non-redeemable
common stock is calculated by dividing the net loss, adjusted for loss on marketable securities attributable to Class A common stock subject to possible redemption, by the weighted average number ofnon-redeemable
common stock outstanding for the period.Non-redeemable
common stock includes Founder Shares, alignment shares andnon-redeemable
Class A common stock as these shares do not have any redemption features.Non-redeemable
common stock participates in the loss on marketable securities based onnon-redeemable
Class A common stock’s proportionate interest.F-85
BERKSHIRE GREY, INC.
(successor to REVOLUTION ACCELERATION ACQUISITION CORP)
NOTES TO CONDENSED CONSOLIDATED FINANCIAL STATEMENTS
JUNE 30, 2021
(Unaudited)
The following table reflects the calculation of basic and diluted net income (loss) per share (in dollars, except per share amounts):
Three Months Ended June 30, 2021 | Six Months Ended June 30, 2021 | |||||||
Class A common stock subject to possible redemption | ||||||||
Numerator: Earnings allocable to Common stock subject to possible redemption | ||||||||
Interest earned on marketable securities held in Trust Account | $ | 4,614 | $ | (47,360 | ) | |||
Unrealized loss on marketable securities held in Trust Account | (744 | ) | — | |||||
Less: Company’s portion available to pay taxes | (3,870 | ) | (47,360 | ) | ||||
Net Income allocable to shares subject to redemption | $ | — | $ | — | ||||
Denominator: Weighted Average Class A common stock subject to possible redemption | ||||||||
Basic and diluted weighted average shares outstanding | 28,750,000 | 27,674,922 | ||||||
Basic and diluted net income per share | $ | 0.00 | $ | 0.00 | ||||
Non-Redeemable Common Stock | ||||||||
Numerator: Net Loss minus Net Earnings | ||||||||
Net loss | $ | (1,552,116 | ) | $ | (11,179,301 | ) | ||
Non-Redeemable Net Loss | $ | (1,552,116 | ) | $ | (11,179,301 | ) | ||
Denominator: Weighted Average Non-redeemable Common stock | ||||||||
Basic and diluted weighted average shares outstanding | 9,583,333 | 10,658,411 | ||||||
Basic and diluted net loss per share | $ | (0.16 | ) | $ | (1.05 | ) | ||
Concentration of Credit Risk
Financial instruments that potentially subject the Company to concentrations of credit risk consist of a cash account in a financial institution, which, at times, may exceed the Federal Depository Insurance Corporation coverage of $250,000. The Company has not experienced losses on this account.
F-86
BERKSHIRE GREY, INC.
(successor to REVOLUTION ACCELERATION ACQUISITION CORP)
NOTES TO CONDENSED CONSOLIDATED FINANCIAL STATEMENTS
JUNE 30, 2021
(Unaudited)
Fair value of Financial Instruments
The fair value of the Company’s assets and liabilities, which qualify as financial instruments under ASC Topic 820, “Fair Value Measurement,” approximates the carrying amounts represented in the accompanying condensed consolidated balance sheet, primarily due to their short-term nature.
Fair Value Measurements
Fair value is defined as the price that would be received for sale of an asset or paid for transfer of a liability, in an orderly transaction between market participants at the measurement date. GAAP establishes a three-tier fair value hierarchy, which prioritizes the inputs used in measuring fair value. The hierarchy gives the highest priority to unadjusted quoted prices in active markets for identical assets or liabilities (Level 1 measurements) and the lowest priority to unobservable inputs (Level 3 measurements). These tiers include:
| • | Level 1, defined as observable inputs such as quoted prices (unadjusted) for identical instruments in active markets; |
| • | Level 2, defined as inputs other than quoted prices in active markets that are either directly or indirectly observable such as quoted prices for similar instruments in active markets or quoted prices for identical or similar instruments in markets that are not active; and |
| • | Level 3, defined as unobservable inputs in which little or no market data exists, therefore requiring an entity to develop its own assumptions, such as valuations derived from valuation techniques in which one or more significant inputs or significant value drivers are unobservable. |
In some circumstances, the inputs used to measure fair value might be categorized within different levels of the fair value hierarchy. In those instances, the fair value measurement is categorized in its entirety in the fair value hierarchy based on the lowest level input that is significant to the fair value measurement.
Derivative Financial Instruments
The Company evaluates its financial instruments to determine if such instruments are derivatives or contain features that qualify as embedded derivatives in accordance with ASC Topic 815, “Derivatives and Hedging”. For derivative financial instruments that are accounted for as liabilities, the derivative instrument is initially recorded at its fair value on the grant date and is then
re-valued
at each reporting date, with changes in the fair value reported in the statements of operations. The classification of derivative instruments, including whether such instruments should be recorded as liabilities or as equity, is evaluated at the end of each reporting period. Derivative liabilities are classified in the balance sheet as current ornon-current
based on whether or notnet-cash
settlement or conversion of the instrument could be required within 12 months of the balance sheet date.Recent Accounting Standards
In August 2020, the Financial Accounting Standards Board (“FASB”) issued Accounting Standards Update (“ASU”)
2020-06,
Debt — Debt with Conversion and Other Options (Subtopic470-20)
and Derivatives and Hedging — Contracts in Entity’s Own Equity (Subtopic815-40)
(“ASU2020-06”)
to simplify accounting for certain financial instruments. ASU2020-06
eliminates the current models that require separation of beneficial conversion and cash conversion features from convertible instruments and simplifies the derivative scope exception guidance pertaining to equity classification of contracts in an entity’s own equity. The new standardF-87
BERKSHIRE GREY, INC.
(successor to REVOLUTION ACCELERATION ACQUISITION CORP)
NOTES TO CONDENSED CONSOLIDATED FINANCIAL STATEMENTS
JUNE 30, 2021
(Unaudited)
also introduces additional disclosures for convertible debt and freestanding instruments that are indexed to and settled in an entity’s own equity. ASU
2020-06
amends the diluted earnings per share guidance, including the requirement to use theif-converted
method for all convertible instruments. ASU2020-06
is effective January 1, 2022 and should be applied on a full or modified retrospective basis, with early adoption permitted beginning on January 1, 2021. The Company adopted ASU2020-06
as of January 1, 2021 and the adoption did not have an impact on its financial position, results of operations or cash flows.Management does not believe that any other recently issued, but not yet effective, accounting standards, if currently adopted, would have a material effect on the Company’s condensed consolidated financial statements.
NOTE 3. INITIAL PUBLIC OFFERING
Pursuant to the Initial Public Offering on December 10, 2020, the Company sold 28,750,000 Units, which includes a full exercise by the underwriter of the over-allotment option in the amount of 3,750,000 Units, at a purchase price of $10.00 per Unit. Each Unit consists of one share of Class A common stock and
one-third
of one redeemable warrant (“Public Warrant”). Each Public Warrant entitles the holder to purchase one share of Class A common stock at an exercise price of $11.50 per whole share, subject to adjustment (see Note 8).NOTE 4. PRIVATE PLACEMENT
Simultaneously with the closing of the Initial Public Offering, the Sponsor purchased an aggregate of 5,166,667 Private Placement Warrants at a price of $1.50 per warrant ($7,750,000 in the aggregate), each exercisable to purchase one share of Class A common stock at a price of $11.50 per share, in a private placement. The proceeds from the sale of the Private Placement Warrants were added to the net proceeds from the Initial Public Offering held in the Trust Account. If the Company does not complete a Business Combination within the Combination Period, the proceeds from the sale of the Private Placement Warrants will be used to fund the redemption of the Public Shares (subject to the requirements of applicable law) and the Private Placement Warrants will expire worthless.
NOTE 5. RELATED PARTY TRANSACTIONS
Founder Shares
On September 15, 2020, the Sponsor paid $25,000 to cover certain offering costs of the Company in consideration for 8,625,000 shares of Class B common stock (the “Founder Shares”). On November 20, 2020, the Sponsor exchanged 4,791,667 Founder Shares, which were cancelled by the Company, for 5,750,000 alignment shares. On November 20, 2020, the Sponsor transferred 16,000 Founder Shares and 24,000 alignment shares to each of Mr. Museles, Ms. Caldwell and Mr. Fish, the Company’s independent directors, and 50,000 Founder Shares and 50,000 alignment shares to Andrew Wallace, who will serve as an advisor to the Sponsor and provide it with services in connection with the sourcing and completion of a Business Combination. Up to 500,000 Founder Shares and 750,000 alignment shares are subject to forfeiture by the Sponsor to the extent that the underwriter’s over-allotment is not exercised in full or in part so that the Founder Shares and alignment shares will represent 10% and 15%, respectively, of the Company’s issued and outstanding shares of common stock after the Initial Public Offering. The alignment shares are reflected as Class C common stock, have the same rights and conditions are Class B common stock and are more fully described in Note 7. As a result of the underwriter’s election to fully exercise the over-allotment option on December 10, 2020, no Founder Shares or alignment shares are currently subject to forfeiture.
F-88
BERKSHIRE GREY, INC.
(successor to REVOLUTION ACCELERATION ACQUISITION CORP)
NOTES TO CONDENSED CONSOLIDATED FINANCIAL STATEMENTS
JUNE 30, 2021
(Unaudited)
The Sponsor and other holders of Founder Shares and alignment shares have agreed, subject to certain limited exceptions, not to transfer, assign or sell any of the Founder Shares until the earlier to occur of: (A) one year after the completion of a Business Combination or (B) subsequent to a Business Combination, (x) if the last reported sale price of the Class A common stock equals or exceeds $12.00 per share (as adjusted for stock splits, stock dividends, reorganizations, recapitalizations and the like) for any 20 trading days within any
30-trading
day period commencing at least 150 days after a Business Combination, or (y) the date on which the Company completes a liquidation, merger, capital stock exchange or other similar transaction that results in all of the Company’s stockholders having the right to exchange their shares of common stock for cash, securities or other property.The Sponsor and other holders of Founder Shares and alignment shares have agreed, subject to certain limited exceptions, not to transfer, assign or sell any of the alignment shares until the earlier of: (A) their conversion into shares of Class A common stock; and (B) subsequent to the initial Business Combination, the date on which the Company completes a merger, stock exchange, reorganization or other similar transaction that results in both a change of control and all of the Company’s public stockholders having the right to exchange their shares of Class A common stock for cash, securities or other property.
Administrative Support Agreement
The Company entered into an agreement, commencing on December 7, 2020, pursuant to which it will agree to pay the Sponsor a total of $10,000 per month for office space, administrative and support services. Upon completion of the Business Combination or the Company’s liquidation, the Company will cease paying these monthly fees. For the three and six months ended June 30, 2021, the Company incurred and paid $30,000 and $60,000 in fees for these services, respectively.
Related Party Loans
In addition, in order to finance transaction costs in connection with a Business Combination, the Sponsor, an affiliate of the Sponsor or certain of the Company’s officers and directors may, but are not obligated to, loan the Company funds on a
non-interest
basis as may be required (“Working Capital Loans”). If the Company completes a Business Combination, the Company would repay the Working Capital Loans out of the proceeds of the Trust Account released to the Company. Otherwise, the Working Capital Loans would be repaid only out of funds held outside the Trust Account. In the event that a Business Combination does not close, the Company may use a portion of proceeds held outside the Trust Account to repay the Working Capital Loans, but no proceeds held in the Trust Account would be used to repay the Working Capital Loans. The Working Capital Loans will be repaid upon consummation of a Business Combination, without interest, or, at the lender’s discretion, up to $1,500,000 of such Working Capital Loans may be convertible into warrants at a price of $1.50 per warrant. The warrants would be identical to the Private Placement Warrants. The Company did not have an outstanding balance related to Working Capital Loans on June 30, 2021.On April 12, 2021 the Company and RAAC Management LLC executed a Promissory Note (“Promissory Note”) which provided the Company with the option to withdraw up to $500,000 at an interest rate of 1.60% per annum. All unpaid principle was due in full upon completion of a Business Combination. On June 30, 2021 the Company had an outstanding Promissory Note balance of $500,000, which was paid in full plus accrued interest in connections with the consummation of the Business Combination on Closing Date.
F-89
BERKSHIRE GREY, INC.
(successor to REVOLUTION ACCELERATION ACQUISITION CORP)
NOTES TO CONDENSED CONSOLIDATED FINANCIAL STATEMENTS
JUNE 30, 2021
(Unaudited)
NOTE 6. COMMITMENTS AND CONTINGENCIES
Registration Rights
Pursuant to a registration rights agreement entered into on December 7, 2020, the holders of the Founder Shares, alignment shares, Private Placement Warrants and any warrants that may be issued upon conversion of the Working Capital Loans (and any shares of Class A common stock issuable upon the exercise of the Private Placement Warrants and warrants that may be issued upon conversion of Working Capital Loans and upon conversion of the Founder Shares and alignment shares) will be entitled to registration rights requiring the Company to register such securities for resale (in the case of the Founder Shares and alignment shares, only after conversion to shares of our Class A common stock). The holders of these securities will be entitled to make up to three demands, excluding short form registration demands, that the Company register such securities. In addition, the holders have certain “piggy-back” registration rights with respect to registration statements filed subsequent to the completion of a Business Combination and rights to require the Company to register for resale such securities pursuant to Rule 415 under the Securities Act. However, the registration rights agreement provides that the Company will not be required to effect or permit any registration or cause any registration statement to become effective until termination of the applicable
lock-up
period. The registration rights agreement does not contain liquidating damages or other cash settlement provisions resulting from delays in registering the Company’s securities. The Company will bear the expenses incurred in connection with the filing of any such registration statements.In connection with the Closing, on July 21, 2021, the Company entered into an Amended and Restated Registration Rights Agreement (the “A&R Registration Rights Agreement”) with RAAC Management LLC, a Delaware limited liability company (the “Sponsor”) and certain other investors party thereto (collectively, with each other person who has executed and delivered a joinder thereto, the “RRA Parties”), including certain former holders of Legacy Berkshire Grey securities (the “BG RRA Parties”), pursuant to which the RRA Parties will be entitled to registration rights in respect of certain shares of our Class A common stock, par value $0.0001 per share (the “Class A Common Stock”) and certain other of our equity securities that are held by the RRA Parties from time to time. The A&R Registration Rights Agreement provides that we will, (i) within 30 calendar days after the consummation of the Business Combination, submit to or file with the SEC (at our sole cost and expense) a registration statement registering the resale of certain shares of the Class A Common Stock and certain other of our equity securities held by the RRA Parties (the “Resale Registration Statement”), and (ii) use our reasonable best efforts to have the Resale Registration Statement declared effective by the SEC as soon as practicable after the filing thereof, but no later than the earlier of (x) the 90th calendar day following the filing date if the SEC notifies us that it will “review” the Resale Registration Statement and (y) the 10th business day after the date we are notified by the SEC that the Resale Registration Statement will not be “reviewed” or will not be subject to further review.
The A&R Registration Rights Agreement grants each of the RRA Parties and their respective permitted transferees certain demand registration rights in connection with an underwritten shelf takedown offering, in each case subject to certain offering thresholds, issuer suspension periods and certain other conditions. In addition, the A&R Registration Rights Agreement grants the RRA Parties “piggyback” registration rights, subject to customary underwriter cutbacks, issuer suspension periods and certain other conditions.
These registration rights are subject to certain customary limitations, including the right of the underwriters to limit the number of securities to be included in an underwritten offering and our right to delay or withdraw a registration statement under certain circumstances. The A&R Registration Rights Agreement includes customary
F-90
BERKSHIRE GREY, INC.
(successor to REVOLUTION ACCELERATION ACQUISITION CORP)
NOTES TO CONDENSED CONSOLIDATED FINANCIAL STATEMENTS
JUNE 30, 2021
(Unaudited)
indemnification provisions. The Company will bear the expenses incurred in connection with the filing of any registration statements filed pursuant to the terms of the A&R Registration Rights Agreement, including the fees of legal counsel selected by theof RRA Parties initiating a demand registration right (not to exceed $75,000 without our consent). The A&R Registration Rights Agreement also provides for a
majority-in-interest
lock-up
on registrable securities held by the BG RRA Parties so that such BG RRA Parties may not transfer such shares, except to certain permitted transferees, for 180 days following the Closing.Underwriting Agreement
The underwriter is entitled to a deferred fee of $0.35 per Unit, or $10,062,500 in the aggregate. Of such amount, at the Company’s sole and absolute discretion, up to $0.175 per Unit, or up to $5,031,250, may be paid to third parties not participating in the Initial Public Offering that assist the Company in consummating its initial Business Combination. The deferred fee was paid to the underwriter from the amounts held in the Trust Account at the Closing Date, subject to the terms of the underwriting agreement.
Sponsor Support Agreement
On February 23, 2021, in connection with and concurrently with the execution of the Merger Agreement, RAAC and Legacy Berkshire Grey entered into an amended and restated letter agreement (the “Sponsor Support Agreement”) with each of the Sponsor, RAAC’s officers and directors and holders of RAAC’s Class B common stock and Class C common stock, which amended and restated the prior letter agreement between such parties (other than Legacy Berkshire Grey), dated December 7, 2020. Pursuant to the Sponsor Support Agreement, among other things, the parties thereto agreed to (i) vote all of the shares of RAAC common stock beneficially owned or held by such parties in favor of the Business Combination and certain related matters, (ii) vote all of the shares of RAAC common stock beneficially owned or held by such parties against certain other actions, including (A) any action reasonably expected to impede or result in the breach of any provision of the Merger Agreement and (B) any business combination or change in capitalization other than with respect to the Business Combination, (iii) waive anti-dilution rights provided in the RAAC charter with respect to their founder shares and alignment shares and waive their right to convert working capital loans to RAAC into warrants and (iv) not redeem or tender any of their shares of RAAC common stock in connection with any such vote as described in clauses (i) or (ii) or in connection with any vote to amend the RAAC charter.
Berkshire Grey Stockholders Support Agreement
In connection with and concurrently with the execution of the Merger Agreement, RAAC entered into a support agreement with Legacy Berkshire Grey and certain stockholders of Legacy Berkshire Grey (the “Legacy Berkshire Grey Stockholders”), representing, in aggregate, 91.9% of the voting power of the outstanding Berkshire Grey capital stock, voting as a single class and on an
as-converted
basis, as of February 23, 2021 (the “Legacy Berkshire Grey Stockholders Support Agreement”). Pursuant to the Legacy Berkshire Grey Stockholders Support Agreement, Legacy Berkshire Grey Stockholders agreed to, among other things and subject to certain conditions, vote to approve and adopt the Merger Agreement and all other ancillary agreements and transactions contemplated thereby.Pursuant to the Legacy Berkshire Grey Stockholders Support Agreement, the requisite Legacy Berkshire Grey Stockholders also agreed to, among other things, terminate all affiliate agreements other than those set forth on the Legacy Berkshire Grey’s disclosure letter accompanying the Merger Agreement and to deliver a duly executed copy of the A&R Registration Rights Agreement at the Closing.
F-91
BERKSHIRE GREY, INC.
(successor to REVOLUTION ACCELERATION ACQUISITION CORP)
NOTES TO CONDENSED CONSOLIDATED FINANCIAL STATEMENTS
JUNE 30, 2021
(Unaudited)
Indemnification Agreement
On July 21, 2021, we entered into indemnification agreements with each of our directors and executive officers. Each indemnification agreement provides for indemnification and advancements by the Company of certain expenses and costs relating to claims, suits or proceedings arising from his or her service to the Company or, at our request, service to other entities, as officers or directors to the maximum extent permitted by applicable law.
Merger Agreement
On February 23, 2021, the Company entered into an Agreement and Plan of Merger (the “Merger Agreement”), by and among the Company, Pickup Merger Corp, a Delaware corporation and a direct, wholly owned subsidiary of the Company (“Merger Sub”), and Berkshire Grey, Inc., a Delaware corporation (“Berkshire Grey”), relating to a proposed business combination with Berkshire Grey (the “Berkshire Grey Business Combination”). Pursuant to the Merger Agreement, Merger Sub will merge with and into Berkshire Grey, with Berkshire Grey being the surviving corporation of the merger and a direct, wholly owned subsidiary of the Company.
Subject to the terms and conditions of the Merger Agreement, the consideration to be paid in respect of each share of common stock, par value $0.001 per share, of Berkshire Grey (“Berkshire Grey Common Stock”) issued and outstanding immediately prior to the effective time of the Merger was a number of shares of newly-issued Class A common stock of the Company (with each share valued at $10.00), par value $0.0001 per share (“RAAC Class A Common Stock”), equal to (x) $2,250,000,000.00 divided by (y) the number of shares of Aggregate Fully Diluted Company Stock (as defined in the Merger Agreement). Immediately prior to the closing of the Business Combination (the “Closing”), all of the outstanding shares of each series of preferred stock of Berkshire Grey was converted into shares of Berkshire Grey Common Stock.
At the Closing, each outstanding option to acquire Berkshire Grey Common Stock and each award of restricted Berkshire Grey Common Stock was converted into the right to receive an option relating to shares of Class A Stock and an award of restricted shares of Class A Stock, as applicable, upon substantially the same terms and conditions, including with respect to vesting and termination-related provisions, as existed prior to the Closing, except that the number of shares underlying such option and the exercise price and the number of shares subject to restricted stock awards, in each case, shall be determined as set forth in the Merger Agreement.
The Merger Agreement contained customary representations, warranties and covenants by the parties thereto and the closing was subject to certain conditions as further described in the Merger Agreement.
Concurrently with the execution of the Merger Agreement, the Company entered into subscription agreements (the “Subscription Agreements”) with certain investors (the “PIPE Investors”), pursuant to which the PIPE Investors have committed to purchase an aggregate amount of $165,000,000 in shares of Class A Stock at a purchase price of $10.00 per share, substantially concurrent with, and contingent upon, the Closing (the “PIPE Investment”).
The Subscription Agreements for the PIPE Investors provide for certain registration rights. In particular, the Company is required to, within 30 calendar days following the Closing, file with the SEC a registration statement registering the resale of the securities issued pursuant to the Subscription Agreements. Additionally, the Company is required to use its commercially reasonable efforts to have such registration statement declared effective as soon as practicable after the filing thereof, but no later than the earlier of (i) the 90th calendar day
F-92
BERKSHIRE GREY, INC.
(successor to REVOLUTION ACCELERATION ACQUISITION CORP)
NOTES TO CONDENSED CONSOLIDATED FINANCIAL STATEMENTS
JUNE 30, 2021
(Unaudited)
following the filing date thereof and (ii) the 10th business day after the date the Company is notified (orally or in writing, whichever is earlier) by the SEC that the registration statement will not be “reviewed” or will not be subject to further review.
Each Subscription Agreement will terminate with no further force and effect upon the earliest to occur of: (a) such date and time as the Merger Agreement is terminated in accordance with its terms; (b) the mutual written agreement of the parties to such Subscription Agreement; (c) if any of the conditions to closing set forth in the Subscription Agreements are not satisfied on or prior to the closing of the PIPE Investment and, as a result thereof, the transactions contemplated by such Subscription Agreement fail to occur; and (d) if the consummation of the Berkshire Grey Business Combination has not occurred by the Outside Date.
In connection with the Berkshire Grey Business Combination, the Company engaged J.P. Morgan Securities LLC as its financial advisor and Credit Suisse Securities (USA) LLC as its placement agent for the PIPE Investment, each of which will be entitled to customary fees in such capacity, with payment due at, and conditioned upon, the closing of the Business Combination and the PIPE Investment, respectively.
NOTE 7. STOCKHOLDERS’ EQUITY
Preferred Stock
Class
A Common Stock
The Company determined the common stock subject to redemption to be equal to the redemption value of approximately $10.00 per share of common stock while also taking into consideration a redemption cannot result in net tangible assets being less than $5,000,001. Upon considering the impact of the PIPE Investment and associated PIPE Subscription Agreements, it was concluded that the redemption value should include all the Public Shares resulting in the common stock subject to possible redemption being equal to $287,500,000. This resulted in a measurement adjustment to the initial carrying value of the common stock subject to redemption with the offset recorded to additional
paid-in
capital and accumulated deficit.Class
B Common Stock
Class
C Common Stock
F-93
BERKSHIRE GREY, INC.
(successor to REVOLUTION ACCELERATION ACQUISITION CORP)
NOTES TO CONDENSED CONSOLIDATED FINANCIAL STATEMENTS
JUNE 30, 2021
(Unaudited)
The Class C common stock will automatically convert into shares of Class A common stock at the earlier of (i) a time after the completion of a Business Combination in which the sale price of shares of the Class A common stock equals or exceeds $15.25 if occurring before the third anniversary of a Business Combination, $23.00 if occurring before the sixth anniversary of a Business Combination or $35.00 if occurring before the ninth anniversary of a Business Combination, and (ii) subsequent to the completion of the Business Combination, the date on which the Company completes a merger, stock exchange, reorganization or other similar transaction that results in both a change of control and all of its public stockholders having the right to exchange their shares of Class A common stock for cash, securities or other property, in each case, on abasis, subject to adjustment. The Class C common stock shares will be returned to the Company for cancellation in the event that they have not converted into shares of Class A common stock nine years after a Business Combination.
one-for-one
Holders of Class A common stock, Class B common stock and Class C common stock will vote together as a single class on all other matters submitted to a vote of stockholders, except as required by law.
The shares of Class B common stock will automatically convert into shares of Class A common stock at the time of a Business Combination on abasis, subject to adjustment. The shares of Class C common stock will automatically convert into shares of Class A common stock if the Company meets certain stock price performance thresholds following the completion of a Business Combination, on abasis, subject to adjustment. In the case that additional shares of Class A common stock, or equity-linked securities, are issued or deemed issued in excess of the amounts issued in this offering and related to the closing of a Business Combination, the ratio at which the shares of Class B common stock and Class C common stock will convert into shares of Class A common stock will be adjusted (unless the holders of a majority of the issued and outstanding shares of Class B common stock and Class C common stock agree to waive such anti-dilution adjustment with respect to any such issuance or deemed issuance) so that the number of shares of Class A common stock issuable upon conversion of all shares of Class B common stock and Class C common stock will equal, in the aggregate, on an
one-for-one
one-for-one
as-converted
basis, 25% of the sum of all common stock issued and outstanding upon the completion of the Initial Public Offering plus all shares of Class A common stock and equity-linked securities issued or deemed issued in connection with a Business Combination, excluding any shares or equity-linked securities issued, or to be issued, to any seller in a Business Combination.NOTE 8. WARRANT LIABILITY
Public Warrants may only be exercised for a whole number of shares. No fractional shares will be issued upon exercise of the Public Warrants. The Public Warrants will become exercisable on the later of (a) 30 days after the consummation of a Business Combination or (b) 12 months from the closing of the Initial Public Offering. The Public Warrants will expire five years from the consummation of a Business Combination or earlier upon redemption or liquidation.
The Company will not be obligated to deliver any Class A common stock pursuant to the exercise of a Public Warrant and will have no obligation to settle such Public Warrant exercise unless a registration statement under the Securities Act covering the issuance of the Class A common stock issuable upon exercise of the Public Warrants is then effective and a prospectus relating thereto is current, subject to the Company satisfying its obligations with respect to registration. No warrant will be exercisable and the Company will not be obligated to issue shares of Class A common stock upon exercise of a warrant unless Class A common stock issuable upon such warrant exercise has been registered, qualified or deemed to be exempt under the securities laws of the state of residence of the registered holder of the warrants.
F-94
BERKSHIRE GREY, INC.
(successor to REVOLUTION ACCELERATION ACQUISITION CORP)
NOTES TO CONDENSED CONSOLIDATED FINANCIAL STATEMENTS
JUNE 30, 2021
(Unaudited)
The Company has agreed that as soon as practicable, but in no event later than 15 business days after the closing of a Business Combination, it will use its commercially reasonable efforts to file with the SEC a registration statement covering the issuance, under the Securities Act, of the Class A common stock issuable upon exercise of the warrants, and the Company will use its commercially reasonable efforts to cause the same to become effective within 60 business days after the closing of a Business Combination and to maintain the effectiveness of such registration statement, and a current prospectus relating thereto, until the expiration of the warrants in accordance with the provisions of the warrant agreement. Notwithstanding the above, if the shares of Class A common stock are, at the time of any exercise of a warrant, not listed on a national securities exchange such that they satisfy the definition of a “covered security” under Section 18(b)(1) of the Securities Act, the Company may, at its option, require holders of public warrants who exercise their warrants to do so on a “cashless basis” in accordance with Section 3(a)(9) of the Securities Act and, in the event the Company so elects, the Company will not be required to file or maintain in effect a registration statement, but will use its commercially reasonable efforts to register or qualify the shares under applicable blue sky laws to the extent an exemption is not available.
Redemption of Warrants When the Price per share of Class
A common stock Equals or Exceeds $18.00
| • | in whole and not in part; |
| • | at a price of $0.01 per Public Warrant; |
| • | upon not less than 30 days’ prior written notice of redemption to each warrant holder; and |
| • | if, and only if, the last reported sale price of the Class A common stock for any 20-trading days within a30-trading day period ending on the third trading day prior to the date on which the Company send the notice of redemption to the warrant holders (the “Reference Value”) equals or exceeds $18.00 per share (as adjusted). |
If and when the warrants become redeemable by the Company, the Company may exercise its redemption right even if it is unable to register or qualify the underlying securities for sale under all applicable state securities laws.
Redemption of Warrants When the Price per share of Class
A common stock Equals or Exceeds $10.00
| • | in whole and not in part; |
| • | at $0.10 per warrant upon a minimum of 30 days’ prior written notice of redemption provided that holders will be able to exercise their warrants on a cashless basis prior to redemption and receive that number of shares based on the redemption date and the “fair market value” of our Class A common stock; |
| • | if, and only if, the Reference Value equals or exceeds $10.00 per share (as adjusted); and |
| • | if the Reference Value is less than $18.00 per share (as adjusted), the Private Placement Warrants must also be concurrently called for redemption on the same terms as the outstanding Public Warrants, as described above. |
The exercise price and number of Class A common stock issuable upon exercise of the Public Warrants may be adjusted in certain circumstances including in the event of a share dividend, extraordinary dividend or
F-95
BERKSHIRE GREY, INC.
(successor to REVOLUTION ACCELERATION ACQUISITION CORP)
NOTES TO CONDENSED CONSOLIDATED FINANCIAL STATEMENTS
JUNE 30, 2021
(Unaudited)
recapitalization, reorganization, merger or consolidation. However, except as described below, the Public Warrants will not be adjusted for issuances of Class A common stock at a price below its exercise price. Additionally, in no event will the Company be required to net cash settle the Public Warrants. If the Company is unable to complete a Business Combination within the Combination Period and the Company liquidates the funds held in the Trust Account, holders of Public Warrants will not receive any of such funds with respect to their Public Warrants, nor will they receive any distribution from the Company’s assets held outside of the Trust Account with respect to such Public Warrants. Accordingly, the Public Warrants may expire worthless.
In addition, if (x) the Company issues additional shares of Class A common stock or equity-linked securities for capital raising purposes in connection with the closing of its initial Business Combination at an issue price or effective issue price of less than $9.20 per share of Class A common stock (with such issue price or effective issue price to be determined in good faith by the Company’s board of directors and, in the case of any such issuance to the Sponsor or its affiliates, without taking into account any Founder Shares and alignment shares held by the Sponsor or such affiliates, as applicable, prior to such issuance) (the “Newly Issued Price”), (y) the aggregate gross proceeds from such issuances represent more than 60% of the total equity proceeds, and interest thereon, available for the funding of the Company’s initial Business Combination on the date of the consummation of such initial Business Combination (net of redemptions), and (z) the volume weighted average trading price of the Company’s Class A common stock during the 20 trading day period starting on the trading day prior to the day on which the Company consummates its initial Business Combination (such price, the “Market Value”) is below $9.20 per share, the exercise price of the warrants will be adjusted (to the nearest cent) to be equal to 115% of the higher of the Market Value and the Newly Issued Price and the $18.00 and $10.00 per share redemption trigger prices described above will be adjusted (to the nearest cent) to be equal to 180% and 100%, respectively, of the higher of the Market Value and the Newly Issued Price.
The Private Placement Warrants are identical to the Public Warrants underlying the Units sold in the Initial Public Offering, except that the Private Placement Warrants will and the common shares issuable upon the exercise of the Private Placement Warrants will not be transferable, assignable or salable until 30 days after the completion of a Business Combination, subject to certain limited exceptions. Additionally, the Private Placement Warrants will be exercisable on a cashless basis and will be
non-redeemable
so long as they are held by the initial purchasers or their permitted transferees. If the Private Placement Warrants are held by someone other than the initial purchasers or their permitted transferees, the Private Placement Warrants will be redeemable by the Company and exercisable by such holders on the same basis as the Public Warrants.NOTE 9. FAIR VALUE MEASUREMENTS
The Company follows the guidance in ASC Topic 820 for its financial assets and liabilities that are
re-measured
and reported at fair value at each reporting period, andnon-financial
assets and liabilities that arere-measured
and reported at fair value at least annually.The fair value of the Company’s financial assets and liabilities reflects management’s estimate of amounts that the Company would have received in connection with the sale of the assets or paid in connection with the transfer of the liabilities in an orderly transaction between market participants at the measurement date. In connection with measuring the fair value of its assets and liabilities, the Company seeks to maximize the use of observable inputs (market data obtained from independent sources) and to minimize the use of unobservable inputs (internal assumptions about how market participants would price assets and liabilities). The following fair value hierarchy
F-96
BERKSHIRE GREY, INC.
(successor to REVOLUTION ACCELERATION ACQUISITION CORP)
NOTES TO CONDENSED CONSOLIDATED FINANCIAL STATEMENTS
JUNE 30, 2021
(Unaudited)
is used to classify assets and liabilities based on the observable inputs and unobservable inputs used in order to value the assets and liabilities:
| Level 1: | Quoted prices in active markets for identical assets or liabilities. An active market for an asset or liability is a market in which transactions for the asset or liability occur with sufficient frequency and volume to provide pricing information on an ongoing basis. | |
| Level 2: | Observable inputs other than Level 1 inputs. Examples of Level 2 inputs include quoted prices in active markets for similar assets or liabilities and quoted prices for identical assets or liabilities in markets that are not active. | |
| Level 3: | Unobservable inputs based on our assessment of the assumptions that market participants would use in pricing the asset or liability. |
The following table presents information about the Company’s assets and liabilities that are measured at fair value on a recurring basis at June 30, 2021 and December 31, 2020, and indicates the fair value hierarchy of the valuation inputs the Company utilized to determine such fair value:
Description | Level | June 30, 2021 | December 31, 2020 | |||||||||
Assets: | ||||||||||||
Marketable securities held in Trust Account | 1 | $ | 287,538,614 | $ | 287,491,254 | |||||||
Liabilities: | ||||||||||||
Warrant Liability – Public Warrants | 1 | $ | 19,166,666 | $ | 14,854,167 | |||||||
Warrant Liability – Private Placement Warrants | 2 | $ | 10,436,667 | $ | 8,008,334 | |||||||
The Warrants were accounted for as liabilities in accordance with ASC
815-40
and are presented within warrant liabilities on our balance sheets. The warrant liabilities are measured at fair value at inception and on a recurring basis, with changes in fair value presented within change in fair value of warrant liabilities in the statements of operations.The Public Warrants and Private Placement Warrants were initially valued using a binomial Monte Carlo simulation model, which is considered to be a Level 3 fair value measurement. The Monte Carlo model’s primary unobservable input utilized in determining the fair value of the Private Warrants is the expected volatility of the common stock. The expected volatility as of the Initial Public Offering date was derived from observable public warrant pricing on comparable ‘blank-check’ companies without an identified target. The expected volatility as of subsequent valuation dates was implied from the Company’s own public warrant pricing.
A Monte Carlo simulation methodology was used in estimating the fair value of the public warrants for periods where no observable traded price was available, using the same expected volatility as was used in measuring the fair value of the Private Warrants. For periods subsequent to the detachment of the warrants from the Units, the close price of the Public Warrant price was used as the fair value of the Public Warrants and Private Placement Warrants as of each relevant date.
F-97
BERKSHIRE GREY, INC.
(successor to REVOLUTION ACCELERATION ACQUISITION CORP)
NOTES TO CONDENSED CONSOLIDATED FINANCIAL STATEMENTS
JUNE 30, 2021
(Unaudited)
The key inputs into the Monte Carlo simulation model for the Private Placement Warrants and Public Warrants were as follows at December 31, 2020:
Input | June 30, 2021 | December 31, 2020 | ||||||
Risk-free interest rate | 0.87 | % | 0.36 | % | ||||
Trading days per year | 252 | |||||||
Expected volatility | 27.50 | % | 29.0 | % | ||||
Expected Term (in years) | 5 | 5 | ||||||
Exercise price | $ | 11.50 | $ | 11.50 | ||||
Stock Price | $ | 9.97 | $ | 10.41 | ||||
The following table presents the changes in the fair value of warrant liabilities:
Private Placement | Public | Warrant Liabilities | ||||||||||
Fair value as of December 31, 2020 | $ | 8,008,334 | $ | 14,854,166 | $ | 22,862,500 | ||||||
Change in valuation inputs or other assumptions | 2,428,333 | 4,312,500 | 6,740,833 | |||||||||
Fair value as of June 30, 2021 | $ | 10,436,667 | $ | 19,166,666 | $ | 29,603,333 | ||||||
NOTE 10. SUBSEQUENT EVENTS
The Company evaluated subsequent events and transactions that occurred after the balance sheet date up to the date that the condensed consolidated financial statements were issued. Based upon this review, other than as described below, the Company did not identify any subsequent events that would have required adjustment or disclosure in the condensed consolidated financial statements.
On July 21, 2021, the Company and Berkshire Grey, Inc. consummated the closing of the transactions contemplated by Merger Agreements. (see Note 6).
F-98
Berkshire Grey, Inc.
220,207,460 Shares of Class A Common Stock
5,166,667 Warrants to Purchase Class A Common Stock
PROSPECTUS
August , 2021
PART II
INFORMATION NOT REQUIRED IN PROSPECTUS
Item 13. | Other Expenses of Issuance and Distribution. |
The expenses expected to be incurred by us in connection with the registration and distribution of the securities being registered under this registration statement are as follows (all amounts are estimates other than the SEC and the Financial Industry Regulatory Authority, or FINRA, filing fees):
SEC Filing Fee | $208,588.75 | |||
FINRA Filing Fee | * | |||
Printing Expenses | * | |||
Legal Fees and Expenses | * | |||
Accounting Fees and Expenses | * | |||
Transfer Agent and Registrar Fees | * | |||
Miscellaneous | * | |||
Total | $ | * | ||
| * | To be filed by amendment. |
Item 14. | Indemnification of Directors and Officers. |
Subsection (a) of Section 145 of the General Corporation Law of the State of Delaware (the “DGCL”) empowers a corporation to indemnify any person who was or is a party or who is threatened to be made a party to any threatened, pending or completed action, suit or proceeding, whether civil, criminal, administrative or investigative (other than an action by or in the right of the corporation) by reason of the fact that the person is or was a director, officer, employee or agent of the corporation, or is or was serving at the request of the corporation as a director, officer, employee or agent of another corporation, partnership, joint venture, trust or other enterprise, against expenses (including attorneys’ fees), judgments, fines and amounts paid in settlement actually and reasonably incurred by the person in connection with such action, suit or proceeding if the person acted in good faith and in a manner the person reasonably believed to be in or not opposed to the best interests of the corporation, and, with respect to any criminal action or proceeding, had no reasonable cause to believe the person’s conduct was unlawful.
Subsection (b) of Section 145 empowers a corporation to indemnify any person who was or is a party or is threatened to be made a party to any threatened, pending or completed action or suit by or in the right of the corporation to procure a judgment in its favor by reason of the fact that the person acted in any of the capacities set forth above, against expenses (including attorneys’ fees) actually and reasonably incurred by the person in connection with the defense or settlement of such action or suit if the person acted in good faith and in a manner the person reasonably believed to be in or not opposed to the best interests of the corporation, except that no indemnification shall be made in respect of any claim, issue or matter as to which such person shall have been adjudged to be liable to the corporation unless and only to the extent that the Court of Chancery or the court in which such action or suit was brought shall determine upon application that, despite the adjudication of liability but in view of all the circumstances of the case, such person is fairly and reasonably entitled to indemnity for such expenses which the Court of Chancery or such other court shall deem proper.
Section 145 further provides that to the extent a director or officer of a corporation has been successful on the merits or otherwise in the defense of any action, suit or proceeding referred to in subsections (a) and (b) of Section 145, or in defense of any claim, issue or matter therein, such person shall be indemnified against expenses (including attorneys’ fees) actually and reasonably incurred by such person in connection therewith;
II-1
that indemnification provided for by Section 145 shall not be deemed exclusive of any other rights to which the indemnified party may be entitled; and the indemnification provided for by Section 145 shall, unless otherwise provided when authorized or ratified, continue as to a person who has ceased to be a director, officer, employee or agent and shall inure to the benefit of such person’s heirs, executors and administrators. Section 145 also empowers the corporation to purchase and maintain insurance on behalf of any person who is or was a director, officer, employee or agent of the corporation, or is or was serving at the request of the corporation as a director, officer, employee or agent of another corporation, partnership, joint venture, trust or other enterprise against any liability asserted against such person and incurred by such person in any such capacity, or arising out of his status as such, whether or not the corporation would have the power to indemnify such person against such liabilities under Section 145.
Section 102(b)(7) of the DGCL provides that a corporation’s certificate of incorporation may contain a provision eliminating or limiting the personal liability of a director to the corporation or its stockholders for monetary damages for breach of fiduciary duty as a director, provided that such provision shall not eliminate or limit the liability of a director (i) for any breach of the director’s duty of loyalty to the corporation or its stockholders, (ii) for acts or omissions not in good faith or which involve intentional misconduct or a knowing violation of law, (iii) under Section 174 of the DGCL, or (iv) for any transaction from which the director derived an improper personal benefit.
Additionally, our Charter limits the liability of our directors to the fullest extent permitted by the DGCL, and our Bylaws provide that we will indemnify them to the fullest extent permitted by such law. We have entered into and expect to continue to enter into agreements to indemnify our directors, executive officers and other employees as determined by our board of directors. Under the terms of such indemnification agreements, we are required to indemnify each of our directors and officers, to the fullest extent permitted by applicable law, if the basis of the indemnitee’s involvement was by reason of the fact that the indemnitee is or was our director or officer or was serving at our request in an official capacity for another entity. We must indemnify our officers and directors against all reasonable fees, expenses, charges and other costs of any type or nature whatsoever, including any and all expenses and obligations paid or incurred in connection with investigating, defending, being a witness in, participating in (including on appeal), or preparing to defend, be a witness or participate in any completed, actual, pending or threatened action, suit, claim or proceeding, whether civil, criminal, administrative or investigative, or establishing or enforcing a right to indemnification under the indemnification agreement. The indemnification agreements also require us, if so requested, to advance all fees, expenses and other costs that such director or officer incurred, provided that such person will return any such advance if it is ultimately determined that such person is not entitled to indemnification by us. Any claims for indemnification by our directors and officers may reduce our available funds to satisfy successful third-party claims against us and may reduce the amount of money available to us.
Item 15. | Recent Sales of Unregistered Securities. |
We have sold the securities described below within the past three years which were not registered under the Securities Act:
| • | On December 10, 2020, RAAC issued 5,166,667 Private Placement Warrants to RAAC’s sponsor, RAAC Management LLC, concurrently with the closing of RAAC’s initial public offering; and |
| • | On July 21, 2021, we issued 16,500,000 shares of our Class A common stock to certain qualified institutional buyers and accredited investors that agreed to purchase such shares in connection with the Business Combination for aggregate consideration of $165,000,000. |
We issued the foregoing securities in transactions not involving an underwriter and not requiring registration under Section 5 of the Securities Act of 1933, as amended, in reliance on the exemption afforded by Section 4(a)(2) thereof.
II-2
Item 16. | Exhibits and Financial Statements Schedules. |
II-3
II-4
Exhibit Number | Description | |
| 21.1 | List of Subsidiaries (incorporated by reference to Exhibit 21.1 to the Registrant’s Current Report on Form 8-K (File No. 001-39768) filed on July 27, 2021). | |
| 23.1 | Consent of Marcum LLP, independent registered public accounting firm of RAAC. | |
| 23.2 | Consent of Grant Thornton LLP, independent registered public accounting firm of Berkshire Grey, Inc. | |
| 23.3* | Consent of Goodwin Procter LLP (included in Exhibit 5.1 hereto). | |
| 24.1 | Power of Attorney (included on signature page hereto). | |
| 101.INS | Inline XBRL Instance Document | |
| 101.SCH | Inline XBRL Taxonomy Extension Schema Document | |
| 101.CAL | Inline XBRL Taxonomy Extension Calculation Linkbase Document | |
| 101.DEF | Inline XBRL Taxonomy Extension Definition Linkbase Document | |
| 101.LAB | Inline XBRL Taxonomy Extension Label Linkbase Document | |
| 101.PRE | Inline XBRL Taxonomy Extension Presentation Linkbase Document | |
| 104 | Cover Page Interactive Data File (embedded within the Inline XBRL document) | |
| + | Schedules omitted pursuant to Item 601(a)(5) of Regulation S-K. The registrant agrees to furnish supplementally a copy of any omitted schedule or exhibit to the SEC upon request. |
| * | To be filed by amendment. |
Item 17. | Undertakings. |
The undersigned registrant hereby undertakes:
| (1) | to file, during any period in which offers or sales are being made, a post-effective amendment to this registration statement: |
(i) to include any prospectus required by Section 10(a)(3) of the Securities Act of 1933, as amended (the “Securities Act”);
(ii) to reflect in the prospectus any facts or events arising after the effective date of the registration statement (or the most recent post-effective amendment thereof) which, individually or in the aggregate, represent a fundamental change in the information set forth in the registration statement. Notwithstanding the foregoing, any increase or decrease in volume of securities offered (if the total dollar value of securities offered would not exceed that which was registered) and any deviation from the low or high end of the estimated maximum offering range may be reflected in the form of prospectus filed with the Commission pursuant to Rule 424(b) if, in the aggregate, the changes in volume and price represent no more than a 20% change in the maximum aggregate offering price set forth in the “Calculation of Registration Fee” table in the effective registration statement; and
(iii) to include any material information with respect to the plan of distribution not previously disclosed in the registration statement or any material change to such information in the registration statement;
provided
however
S-1
and the information required to be included in a post-effective amendment by those paragraphs is contained in reports filed with or furnished to the Commission by the registrant pursuant to Section 13 or Section 15(d) of the Securities Exchange Act of 1934 that are incorporated by reference in the registration statement, or is contained in a form of prospectus filed pursuant to Rule 424(b) that is part of the registration statement;II-5
| (2) | that, for the purpose of determining any liability under the Securities Act, each such post-effective amendment shall be deemed to be a new registration statement relating to the securities offered therein, and the offering of such securities at that time shall be deemed to be the initial bona fide offering thereof; |
| (3) | to remove from registration by means of a post-effective amendment any of the securities being registered which remain unsold at the termination of the offering; |
| (4) | that, for the purpose of determining liability under the Securities Act to any purchaser: |
Each prospectus filed pursuant to Rule 424(b) as part of a registration statement relating to an offering, other than registration statements relying on Rule 430B or other than prospectuses filed in reliance on Rule 430A, shall be deemed to be part of and included in the registration statement as of the date it is first used after effectiveness.
Provided
however
| (5) | that, for the purpose of determining liability of the registrant under the Securities Act to any purchaser in the initial distribution of the securities, the undersigned registrant undertakes that in a primary offering of securities of the undersigned registrant pursuant to this registration statement, regardless of the underwriting method used to sell the securities to the purchaser, if the securities are offered or sold to such purchaser by means of any of the following communications, the undersigned registrant will be a seller to the purchaser and will be considered to offer or sell such securities to such purchaser: |
(a) any preliminary prospectus or prospectus of the undersigned registrant relating to the offering required to be filed pursuant to Rule 424;
(b) any free writing prospectus relating to the offering prepared by or on behalf of the undersigned registrant or used or referred to by the undersigned registrant;
(c) the portion of any other free writing prospectus relating to the offering containing material information about the undersigned registrant or its securities provided by or on behalf of an undersigned registrant; and
(d) any other communication that is an offer in the offering made by the undersigned registrant to the purchaser.
Insofar as indemnification for liabilities arising under the Securities Act of 1933 may be permitted to directors, officers, and controlling persons of the registrant pursuant to the foregoing provisions, or otherwise, the registrant has been advised that in the opinion of the Securities and Exchange Commission, such indemnification is against public policy as expressed in the Securities Act of 1933 and is, therefore, unenforceable. In the event that a claim for indemnification against such liabilities (other than the payment by the registrant of expenses incurred or paid by a director, officer, or controlling person of the registrant in the successful defense of any action, suit, or proceeding) is asserted by such director, officer, or controlling person in connection with the securities being registered, the registrant will, unless in the opinion of its counsel the matter has been settled by controlling precedent, submit to a court of appropriate jurisdiction the question whether such indemnification by it is against public policy as expressed in the Securities Act of 1933 and will be governed by the final adjudication of such issue.
II-6
SIGNATURE
Pursuant to the requirements of the Securities Act of 1933, the registrant has duly caused this Registration Statement to be signed on its behalf by the undersigned, thereunto duly authorized, in the City of Bedford, Commonwealth of Massachusetts, on the 20
th
day of August, 2021.BERKSHIRE GREY, INC. | ||
| By: | /s/ Thomas Wagner | |
| Name: | Thomas Wagner | |
Title: | Chief Executive Officer | |
II-7
SIGNATURES AND POWER OF ATTORNEY
Each person whose signature appears below constitutes and appoints each of Thomas Wagner and Mark Fidler, acting alone or together with anotheras his or her true and lawfuland agent, with full power of substitution and resubstitution, for such person and in his or her name, place and stead, in any and all capacities, to sign any or all further amendments (including post-effective amendments) to this registration statement (and any additional registration statement related hereto permitted by Rule 462(b) promulgated under the Securities Act (and all further amendments, including post-effective amendments, thereto)), and to file the same, with all exhibits thereto, and other documents in connection therewith, with the SEC, granting unto saidand agents, and each of them, full power and authority to do and perform each and every act and thing requisite and necessary to be done in and about the premises, as fully to all intents and purposes as he might or could do in person, hereby ratifying and confirming all that saidand agent, or his or her substitute or substitutes, may lawfully do or cause to be done by virtue hereof.
attorney-in-fact,
attorney-in-fact
attorneys-in-fact
attorney-in-fact
Pursuant to the requirements of the Securities Act of 1933, this Registration Statement has been signed by the following persons in the capacities and on the dates indicated:
Signature | Title | Date | ||
/s/ Thomas Wagner Thomas Wagner | Chief Executive Officer and Director (principal executive officer) | August 20, 2021 | ||
/s/ Mark Fidler Mark Fidler | Chief Financial Officer (principal financial officer and principal accounting officer) | August 20, 2021 | ||
/s/ Peter Barris Peter Barris | Director | August 20, 2021 | ||
/s/ John K. Delaney John K. Delaney | Director | August 20, 2021 | ||
/s/ Fiona P. Dias Fiona P. Dias | Director | August 20, 2021 | ||
/s/ Sven Strohband Sven Strohband | Director | August 20, 2021 | ||
/s/ Serena Wolfe Serena Wolfe | Director | August 20, 2021 | ||
II-8