Exhibit 99.2
ROVER MANAGEMENT’S DISCUSSION AND ANALYSIS OF FINANCIAL CONDITION AND
RESULTS OF OPERATIONS
Capitalized terms used but not defined in this Exhibit 99.2 shall have the meanings ascribed to them in the Current Report on Form 8-K (the “Form 8-K”) filed with the Securities and Exchange Commission (the “SEC”) on August 5, 2021 and, if not defined in the Form 8-K, the proxy statement/prospectus filed by Nebula Caravel Acquisition Corp., (“Caravel”) on July 9, 2021 prior to the consummation of the Merger (the “Proxy Statement”).
The following discussion and analysis provides information that Legacy Rover’s management believes is relevant to an assessment and understanding of Rover’s condensed consolidated results of operations and financial condition. The discussion should be read together with Legacy Rover’s unaudited condensed consolidated financial statements as of June 30, 2021 and for the three and six months ended June 30, 2021, and the respective notes thereto, included as Exhibit 99.1 to the Amendment No. 1 to Current Report on Form 8-K/A filed by Rover Group, Inc. with the SEC on August 16, 2021 (the “Form 8-K/A”).
On July 30, 2021, Legacy Rover and Caravel consummated the previously announced Merger pursuant to that certain Business Combination Agreement. This discussion and analysis should also be read together with Legacy Rover’s unaudited pro forma financial information as of and for the six months ended June 30, 2021 included as Exhibit 99.3 to the Form 8-K/A.
This discussion may contain forward-looking statements within the meaning of the Private Securities Litigation Reform Act of 1995 including, but not limited to, the Company’s expectations or predictions of future financial or business performance or conditions. Forward-looking statements are inherently subject to risks, uncertainties, and assumptions. Generally, statements that are not historical facts, including statements concerning possible or assumed future actions, business strategies, events, or results of operations, including guidance and projections, are forward-looking statements. These statements may be preceded by, followed by, or include the words “believes,” “estimates,” “expects,” “projects,” “forecasts,” “may,” “will,” “could,” “can,” “would,” “predict,” “potential,” “poised,” “continue,” “ongoing,” “should,” “seeks,” “plans,” “scheduled,” “anticipates” or “intends” or the negative of these words or similar terms or expressions. Forward-looking statements are based on current expectations and assumptions that are subject to risks and uncertainties that may cause actual results to differ materially. Our actual results may differ materially from those anticipated in these forward-looking statements as a result of various factors, including those set forth in the section of the Proxy Statement titled “Risk Factors”, which has been incorporated by reference into the Form 8-K/A. We undertake no obligation to update or revise publicly any forward-looking statements, whether because of new information, future events, or otherwise.
Unless the context otherwise requires, references in this Exhibit 99.2 to “we”, “our” and “the Company” refer to the business and operations of Legacy Rover and its consolidated subsidiaries prior to the Merger.
Overview
Rover was founded to give pet parents an alternative to relying on friends and family, neighbors, and kennels for pet care. Our online marketplace matches pet parents with pet lovers dedicated to providing excellent pet care while earning extra income. Our simple and easy-to-use platform enables pet parents to easily discover and book the right pet care providers for them and their pets, communicate with providers and write and read reviews. Our platform enables pet care providers to list on our marketplace with low startup costs, schedule bookings, communicate with pet parents, and receive payment.
We are the world’s largest, online marketplace for pet care. We connect pet parents with caring pet care providers who offer overnight services, including boarding and in-home pet sitting, as well as daytime services, including doggy daycare, dog walking, drop-in visits, and grooming. Through June 30, 2021, more than two million unique pet parents and more than 580,000 pet care providers across North America and Europe have booked a service on Rover, enabling millions of moments of joy and play for people and pets.
Impact of COVID-19
In December 2019, a novel strain of coronavirus, SARS-CoV-2, was identified in Wuhan, China. Since then, SARS-CoV-2, and the resulting disease, COVID-19, has spread to almost every country in the world and all 50 states within the United States. Global health concerns relating to the outbreak of COVID-19 have been weighing on the macroeconomic environment, and the outbreak has significantly increased economic uncertainty. The outbreak has resulted in authorities implementing numerous measures to try to contain the virus, such as travel bans and restrictions, quarantines, shelter-in-place orders, and business shutdowns. Restrictive measures have not only negatively impacted consumer and business spending habits, but they have also adversely impacted and may further impact our workforce and operations. Although certain of these measures are beginning to ease in some geographic regions, overall measures to contain the COVID-19 outbreak may remain in place for a significant period of time as many geographic regions are experiencing a resurgence of COVID-19 infections, including the new variants of the virus, such as the Delta variant. The duration and severity of this pandemic, including new variants, are unknown, and the extent of the business disruption and financial impact depend on factors beyond our knowledge and control.
Second Quarter 2021 Financial Highlights
| • | Revenue of $24.5 million, an increase of 355% from the second quarter 2020. |
| • | GAAP net loss of $2.8 million, compared to net loss of $18.1 million from the second quarter 2020. |
| • | Adjusted EBITDA of $2.5 million, marking the Company’s first quarter of positive Adjusted EBITDA, compared to $(8.4) million from the second quarter 2020. See “—Key Business Metrics-Adjusted EBITDA” below for information on this non-GAAP measure and a reconciliation to net income (loss), its most directly comparable GAAP measure. |
| • | Cash and cash equivalents was $103.4 million as of June 30, 2021. |
The second quarter 2021 financial highlights below are relative to Q2 2019, due to the irregularity in our 2020 business metrics caused by COVID.
| • | Revenue of $24.5 million, compared to $23.8 million, an increase of 3%. |
| • | GAAP net loss of $2.8 million, compared to net loss of $12.0 million. |
Components of Results of Operations
Revenue
We derive revenue principally from fees paid by pet care providers and pet parents for use of our platform, net of discounts and sales tax paid on behalf of pet parents. We also derive revenue from fees paid by pet care providers for background checks in order to be listed on our platform. We recognize revenue related to the facilitation of the connection between pet care providers and pet parents at the start of a booking.
Costs and Expenses
Cost of Revenue (Exclusive of Depreciation and Amortization Shown Separately)
Cost of revenue (exclusive of depreciation and amortization shown separately) includes fees paid to payment processors for credit card and other funding transactions, server hosting costs, internal-use software amortization, third-party costs for background checks for pet care providers, claim costs paid out under the Rover Guarantee (“Rover Guarantee”) and other direct and indirect costs arising as a result of bookings that take place on our platform. We expect our cost of revenue (exclusive of depreciation and amortization shown separately) will vary from period-to-period on an absolute dollar basis and as a percentage of revenue depending on the timing and pace of recovery of the travel and pet care services market.
Operations and Support
Operations and support expenses include payroll, employee benefits, stock-based compensation and other personnel-related costs associated with our operations and support team, and third-party costs related to outsourced support providers. This team assists with onboarding new pet service providers, quality reviews of pet care provider profiles, fraud monitoring and prevention across our marketplace, and community support provided via phone, email, and chat to our pet parents and pet service providers. This support includes assistance and responding to pet parents’ inquiries regarding the general use of our platform or how to make or modify a booking through our platform. The Company allocates a portion of overhead costs which includes lease expense, utilities and information technology expense to operations and support expense based on headcount. Notwithstanding the decrease in operations and support expenses as a result of the restructuring discussed below, we expect that operations and support expense will increase on an absolute dollar basis for the foreseeable future to the extent that we continue to see growth on our platform. We expect these expenses to decrease as a percentage of revenue over the longer term due to better leverage in our operations.
Marketing
Marketing expenses include payroll, employee benefits, stock-based compensation expense and other personnel-related costs associated with our marketing team. These expenses also include digital marketing, brand marketing, public relations, broadcast television, marketing partnerships and other promotions. Digital marketing primarily consists of targeted promotional campaigns through electronic channels, such as social media, search engine marketing and optimization, affiliate programs and display advertising which are focused on pet parent acquisition and brand marketing. In 2020, we significantly curtailed our discretionary marketing spending in response to the COVID-19 pandemic in addition to reducing headcount to our marketing team as part of our restructuring plan. As our business recovers and we return to growth, we expect that marketing expenses will increase in absolute dollars in future periods and vary from period-to-period as a percentage of revenue in the near-term. Over the longer term, we expect marketing expense to decrease as a percentage of revenue.
Product Development
Product development expenses include payroll, employee benefits, stock-based compensation expense and other headcount related costs for employees in engineering, design and product management, as well as the maintenance and support costs for technology infrastructure, primarily related to non-revenue generating systems. In 2020, we reduced the headcount in our product development team as part of our restructuring plan. As our growth in operations recovers, we expect that our product development expense will increase on an absolute dollar basis and will vary from period-to-period as a percentage of revenue for the foreseeable future as we continue to invest in product development activities relating to ongoing improvements and maintenance of our technology platform. We expect these expenses to decrease as a percentage of revenue over the longer term due to better leverage in our operations.
The costs incurred in the preliminary stages of website and software development related to the platform are expensed as incurred. Once an application has reached the development stage, internal and external costs, if direct and incremental and deemed by management to be significant, are capitalized as internal-use software and amortized on a straight-line basis over their estimated useful lives. Maintenance and enhancement costs, including those costs in the post-implementation stages, are typically expensed as incurred, unless such costs relate to substantial upgrades and enhancements to the website or software that result in added functionality, in which case the costs are capitalized and amortized on a straight-line basis over the estimated useful lives. Amortization expense related to capitalized internal-use software is included in cost of revenue (exclusive of depreciation and amortization shown separately).
General and Administrative
General and administrative expenses include payroll, employee benefits, stock-based compensation expense and other personnel-related costs for employees in corporate functions, as well as management, accounting, legal, corporate insurance and other expenses used to run the business. In 2020, we reduced the headcount in our general and administrative functions as part of our restructuring plan. We expect to incur additional general and administrative expense to support operating as a public company and the overall expected growth in our business. While these expenses may vary from period-to-period as a percentage of revenue, we expect them to decrease as a percentage of revenue over the longer term.
Depreciation and Amortization
Depreciation and amortization expenses include depreciation of our property and equipment, leasehold improvements and amortization of our intangible assets. Amortization related to our internal-use software is included in cost of revenue (exclusive of depreciation and amortization shown separately).
Restructuring
In response to the impact of COVID-19, we implemented a number of measures to minimize cash outlays, implementing a restructuring plan in April 2020 whereby approximately 50% of employees were terminated or put on standby. In connection with this restructuring, we incurred severance-related and legal costs, and modified the terms of stock options previously awarded to impacted employees.
Other Income (Expense), Net
Interest Income
Interest income consists primarily of interest earned on our cash, cash equivalents, and short-term investments.
Interest Expense
Interest expense consists of interest on our borrowing arrangements and the amortization of debt discounts and deferred financing costs.
Other Expense, Net
Other expense, net consists primarily of realized and unrealized gains and losses on foreign currency transactions and realized gains and losses on sales of our securities.
Results of Operations
The results of operations presented below should be reviewed in conjunction with the condensed consolidated financial statements and notes included elsewhere in Exhibit 99.1 to this Amendment No. 1 to Current Report on Form 8-K/A. The following tables set forth our results of operations for the periods presented:
| | Three Months Ended June 30, | | | Six Months Ended June 30, | |
| | 2020 | | | 2021 | | | 2020 | | | 2021 | |
| | (in thousands) | |
Revenue | | $ | 5,381 | | | $ | 24,482 | | | $ | 22,372 | | | $ | 36,678 | |
Costs and expenses(1): | | | | | | | | | | | | | | | | |
Cost of revenue (exclusive of depreciation and amortization shown separately below) | | | 6,209 | | | | 6,283 | | | | 11,627 | | | | 10,459 | |
Operations and support | | | 2,482 | | | | 3,482 | | | | 7,537 | | | | 5,715 | |
Marketing | | | 2,146 | | | | 4,462 | | | | 11,496 | | | | 7,128 | |
Product development | | | 4,927 | | | | 5,086 | | | | 13,738 | | | | 9,554 | |
General and administrative | | | 4,601 | | | | 5,732 | | | | 10,803 | | | | 12,368 | |
Depreciation and amortization | | | 2,100 | | | | 1,849 | | | | 4,862 | | | | 3,699 | |
Total costs and expenses | | | 22,465 | | | | 26,894 | | | | 60,063 | | | | 48,923 | |
Loss from operations | | | (17,084 | ) | | | (2,412 | ) | | | (37,691 | ) | | | (12,245 | ) |
Other income (expense), net: | | | | | | | | | | | | | | | | |
Interest income | | | 129 | | | | 4 | | | | 461 | | | | 8 | |
Interest expense | | | (1,009 | ) | | | (703 | ) | | | (1,258 | ) | | | (1,400 | ) |
Other expense, net | | | (144 | ) | | | (26 | ) | | | (188 | ) | | | (77 | ) |
Total other income (expense), net | | | (1,024 | ) | | | (725 | ) | | | (985 | ) | | | (1,469 | ) |
Loss before benefit from income taxes | | | (18,108 | ) | | | (3,137 | ) | | | (38,676 | ) | | | (13,714 | ) |
Benefit from income taxes | | | 29 | | | | 331 | | | | 52 | | | | 317 | |
Net loss | | $ | (18,079 | ) | | $ | (2,806 | ) | | $ | (38,624 | ) | | $ | (13,397 | ) |
(1) | Costs and expenses include stock-based compensation expense as follows: |
| | Three Months Ended June 30, | | | Six Months Ended June 30, | |
| | 2020 | | | 2021 | | | 2020 | | | 2021 | |
| | (in thousands) | |
Operations and support | | $ | 41 | | | $ | 48 | | | $ | 161 | | | $ | 101 | |
Marketing | | | 51 | | | | 99 | | | | 225 | | | | 167 | |
Product development | | | 273 | | | | 399 | | | | 949 | | | | 694 | |
General and administrative | | | 529 | | | | 601 | | | | 1,144 | | | | 1,186 | |
Total stock-based compensation expense | | $ | 894 | | | $ | 1,147 | | | $ | 2,479 | | | $ | 2,148 | |
The following table sets forth the components of our condensed consolidated statements of operations for each of the periods presented as a percentage of revenue:
| | Three Months Ended June 30, | | | Six Months Ended June 30, | |
| | 2020 | | | 2021 | | | 2020 | | | 2021 | |
Revenue | | | 100 | % | | | 100 | % | | | 100 | % | | | 100 | % |
Costs and expenses: | | | | | | | | | | | | | | | | |
Cost of revenue (exclusive of depreciation and amortization shown separately below) | | | 115 | | | | 26 | | | | 52 | | | | 29 | |
Operations and support | | | 46 | | | | 14 | | | | 34 | | | | 16 | |
Marketing | | | 40 | | | | 18 | | | | 51 | | | | 19 | |
Product development | | | 92 | | | | 21 | | | | 61 | | | | 26 | |
General and administrative | | | 86 | | | | 23 | | | | 48 | | | | 34 | |
Depreciation and amortization | | | 39 | | | | 8 | | | | 22 | | | | 10 | |
Total costs and expenses | | | 418 | | | | 110 | | | | 268 | | | | 134 | |
Loss from operations | | | (318 | ) | | | (10 | ) | | | (168 | ) | | | (34 | ) |
Other income (expense), net: | | | | | | | | | | | | | | | | |
Interest income | | | 2 | | | | — | | | | 2 | | | | — | |
Interest expense | | | (19 | ) | | | (3 | ) | | | (6 | ) | | | (4 | ) |
Other expense, net | | | (3 | ) | | | — | | | | (1 | ) | | | — | |
Total other income (expense), net | | | (20 | ) | | | (3 | ) | | | (5 | ) | | | (4 | ) |
Loss before benefit from income taxes | | | (338 | ) | | | (13 | ) | | | (173 | ) | | | (38 | ) |
Benefit from income taxes | | | 1 | | | | 1 | | | | — | | | | 1 | |
Net loss | | | (337 | )% | | | (12 | )% | | | (173 | )% | | | (37 | )% |
Comparisons for the Three and Six Months Ended June 30, 2020 and 2021
Revenue
| | Three Months Ended June 30, | | | | | | | | Six Months Ended June 30, | | | | | |
| | 2020 | | | 2021 | | | % Change | | | | 2020 | | | 2021 | | | % Change | |
| | (in thousands, except for percentages) | |
Revenue | | $ | 5,381 | | | $ | 24,482 | | | | 355 | % | | | $ | 22,372 | | | $ | 36,678 | | | | 64 | % |
Revenue increased $19.1 million, or 355%, in the three months ended June 30, 2021 as compared to the three months ended June 30, 2020. The increase in revenue was primarily due to a 220% increase in the number of bookings on our platform as well as a 28% increase in the average gross booking value per booking. Demand for overnight and daytime pet care is primarily linked to pet parents traveling or working outside of the home which had declined as a result of various state and local COVID-related restrictions during the three months ended June 30, 2020. We saw an increase in demand as pet parents began to travel again and return to the office, as some COVID-related restrictions lifted during the three months ended June 30, 2021, along with our service mix shifting back to higher average order value overnight services.
Revenue increased $14.3 million, or 64%, in the six months ended June 30, 2021 as compared to the six months ended June 30, 2020. The increase in revenue was primarily due to a 36% increase in the number of bookings on our platform as well as a 22% increase in the average gross booking value per booking. Demand for overnight and daytime pet care is primarily linked to pet parents traveling or working outside of the home which had declined as a result of various state and local COVID-related restrictions during the six months ended June 30, 2020. As those restrictions began to lift in the six months ended June 30, 2021, our mix is shifting back to higher average order value overnight services as pet parents begin to travel again and return to the office.
Costs and Expenses
| | Three Months Ended June 30, | | | | | | | | Six Months Ended June 30, | | | | | |
| | 2020 | | | 2021 | | | % Change | | | | 2020 | | | 2021 | | | % Change | |
| | (in thousands, except for percentages) | |
Costs and expenses: | | | | | | | | | | | | | | | | | | | | | | | | | |
Cost of revenue (exclusive of depreciation and amortization shown separately below) | | $ | 6,209 | | | $ | 6,283 | | | | 1 | % | | | $ | 11,627 | | | $ | 10,459 | | | | (10 | )% |
Operations and support | | | 2,482 | | | | 3,482 | | | | 40 | | | | | 7,537 | | | | 5,715 | | | | (24 | ) |
Marketing | | | 2,146 | | | | 4,462 | | | | 108 | | | | | 11,496 | | | | 7,128 | | | | (38 | ) |
Product development | | | 4,927 | | | | 5,086 | | | | 3 | | | | | 13,738 | | | | 9,554 | | | | (30 | ) |
General and administrative | | | 4,601 | | | | 5,732 | | | | 25 | | | | | 10,803 | | | | 12,368 | | | | 14 | |
Depreciation and amortization | | | 2,100 | | | | 1,849 | | | | (12 | ) | | | | 4,862 | | | | 3,699 | | | | (24 | ) |
Total costs and expenses | | $ | 22,465 | | | $ | 26,894 | | | | 20 | % | | | $ | 60,063 | | | $ | 48,923 | | | | (19 | )% |
Cost of Revenue (Exclusive of Depreciation and Amortization Shown Separately). Cost of revenue (exclusive of depreciation and amortization shown separately) increased $0.1 million, or 1%, in the three months ended June 30, 2021 as compared to the three months ended June 30, 2020. The increase was primarily due to a 355% increase in revenue as the business continues to recover from the COVID-19 pandemic. The increase includes a $2.2 million increase in merchant fees, a $0.2 million increase in pet care provider background check costs, and a $0.2 million increase in customer claim costs related to the Rover Guarantee. Additionally, these increases were partially offset by a $2.8 million decline in internal-use software amortization as the three months ended June 30, 2020 included $2.6 million in accelerated amortization of internal-use software due to the discontinuation of our on-demand service.
Cost of revenue (exclusive of depreciation and amortization shown separately) decreased $1.2 million, or 10%, in the six months ended June 30, 2021 as compared to the six months ended June 30, 2020. The decrease includes a $2.9 million decrease in amortization of internal-use software primarily due to the acceleration of amortization related to the discontinuation of our on-demand service, partially offset by a $1.8 million increase in merchant fees.
Operations and Support. Operations and support expenses increased $1.0 million, or 40%, in the three months ended June 30, 2021 as compared to the three months ended June 30, 2020. The increase was primarily due to a $0.4 million increase in personnel-related costs for the operations and support team as well as a $0.6 million increase in third-party costs related to outsourced support providers in response to changes in demand for our platform as illustrated by the 220% increase in the number of bookings on our platform due to the business recovering from the COVID-19 pandemic and the increased need for pet sitter provider onboarding and general platform user support activities.
Operations and support expenses decreased $1.8 million, or 24%, in the six months ended June 30, 2021 as compared to the six months ended June 30, 2020. The decrease was primarily due to a decrease in personnel-related costs for the operations and support team, inclusive of $0.5 million of severance costs related to the reduction in our workforce in response to the impact of the COVID-19 pandemic in March 2020.
Marketing. Marketing expenses increased $2.3 million, or 108%, in the three months ended June 30, 2021 as compared to the three months ended June 30, 2020. The increase in marketing expenses was primarily the result of an increase in general marketing spend in response to increasing demand for Rover platform services and the business recovering from the COVID-19 pandemic.
Marketing expenses decreased $4.4 million, or 38%, in the six months ended June 30, 2021 as compared to the six months ended June 30, 2020. The decrease in marketing expenses was the result of a $3.2 million reduction in discretionary marketing spend and professional services costs. These reductions were made to reduce cash outlays due to a 43% reduction in the number of bookings on our platform as a result of the COVID-19 pandemic. Additionally,
personnel costs decreased by $0.9 million driven by the reduction in our workforce in March 2020, inclusive of $0.3 million of severance costs.
Product Development. Product development expenses increased $0.2 million, or 3%, in the three months ended June 30, 2021 as compared to the three months ended June 30, 2020. The increase was primarily the result of an increase in personnel expenses due to increased headcount as we reinvest in technology as our business recovers from the COVID-19 pandemic.
Product development expenses decreased $4.2 million, or 30%, in the six months ended June 30, 2021 as compared to the six months ended June 30, 2020. The decrease was primarily the result of a $3.7 million decrease in personnel expenses as a result of the reduction in our workforce in March 2020, inclusive of $1.3 million of severance costs and a $0.5 million decline in the capitalization of internal use software, and a $0.3 million decrease in professional service costs.
General and Administrative. General and administrative expenses increased $1.1 million, or 25%, in the three months ended June 30, 2021 as compared to the three months ended June 30, 2020. The increase in general and administrative expenses was primarily the result of an increase in personnel expenses due to the return to a normalized compensation structure with annual compensation increases as compared to the three months ended June 30, 2020, which included COVID-19 related compensation reductions.
General and administrative expenses increased $1.6 million, or 14%, in the six months ended June 30, 2021 as compared to the six months ended June 30, 2020. The increase in general and administrative expenses was the result of $0.9 million of professional services related to our public company readiness efforts, as well as a $1.0 million increase in personnel expenses due to the return to a normalized compensation structure with annual compensation increases as compared to the six months ended June 30, 2020, which included COVID-19 related compensation reductions. These increases were partially offset by a $0.3 million decrease in severance costs.
Depreciation and Amortization. Depreciation and amortization decreased $0.3 million, or 12%, in the three months ended June 30, 2021 as compared to the three months ended June 30, 2020. The decrease in depreciation and amortization expenses was due to a decrease in intangible asset amortization expense as a result of certain intangible assets related to the DogVacay and Barking Dog Ventures acquisitions reaching the end of their useful lives.
Depreciation and amortization decreased $1.2 million, or 24%, in the six months ended June 30, 2021 as compared to the six months ended June 30, 2020. The decrease in depreciation and amortization expenses was due to a decrease in intangible asset amortization expense as a result of certain intangible assets related to the DogVacay and Barking Dog Ventures acquisitions reaching the end of their useful lives.
Other Income (Expense), Net
Interest Income. The $0.1 million decrease in interest income for the three months ended June 30, 2021 compared to the three months ended June 30, 2020 was primarily due to decrease in interest earning balances.
The $0.4 million decrease in interest income for the six months ended June 30, 2021 compared to the six months ended June 30, 2020 was primarily related to a decline in interest rates year over year, partially offset by an increase in cash balances as we had fully drawn on our credit facility and received a PPP loan in March and April 2020, respectively.
Interest Expense. The $0.3 million decrease in interest expense for three months ended June 30, 2021 compared to the three months ended June 30, 2020 was driven by the repayment of the variable rate revolving line of credit and variable rate growth capital advance components of the credit facility in August 2020 that was initially drawn in March of 2020. As of June 30, 2021, we had both the Subordinated credit facility and Paycheck Protection loan outstanding as well as $11.4 million available under the revolving borrowings. In connection with the closing of the Merger on July 30, 2021, we repaid the principal and accrued interest on the Subordinated credit facility and PPP Loan.
The $0.1 million decrease in interest expense for six months ended June 30, 2021 compared to the six months ended June 30, 2020 was driven by the repayment of the variable rate revolving line of credit and variable rate growth capital advance components of the credit facility in August 2020 that was initially drawn in March of 2020. As of June 30, 2021, we had both the Subordinated credit facility and Paycheck Protection loan outstanding as well as $11.4 million available under the revolving borrowings. In connection with the closing of the Merger on July 30, 2021, we repaid the principal and accrued interest on the Subordinated credit facility and PPP Loan.
Key Business Metrics and Non-GAAP Measures
In addition to the measures presented in our consolidated financial statements, we use the following metrics to measure our performance, identify trends, formulate financial projections, and make strategic decisions.
Bookings
We define a booking as a single arrangement, prior to cancellation, between a pet parent and pet care provider, which can be for a single night or multiple nights for our overnight services, or for a single walk/day/drop-in/groom or multiple walks/days/drop-ins for our daytime services. We believe that the number of bookings is a useful indicator of the scale of our marketplace. We define new bookings as the total number of first-time bookings that new users, which Rover refers to as pet parents, book on our platform in a period. We define repeat bookings as the total number of bookings from pet parents who have had a previous booking on Rover.
Our bookings are impacted by seasonal trends. We typically experience stronger bookings during the months of June, July, and August, and November and December, which in a typical year, coincide with high travel demand related to summer vacation and holiday travel. This seasonality impacts bookings, Gross Booking Value, revenue, marketing and operations and support expenses. Bookings can also be impacted by the timing of holidays and other events.
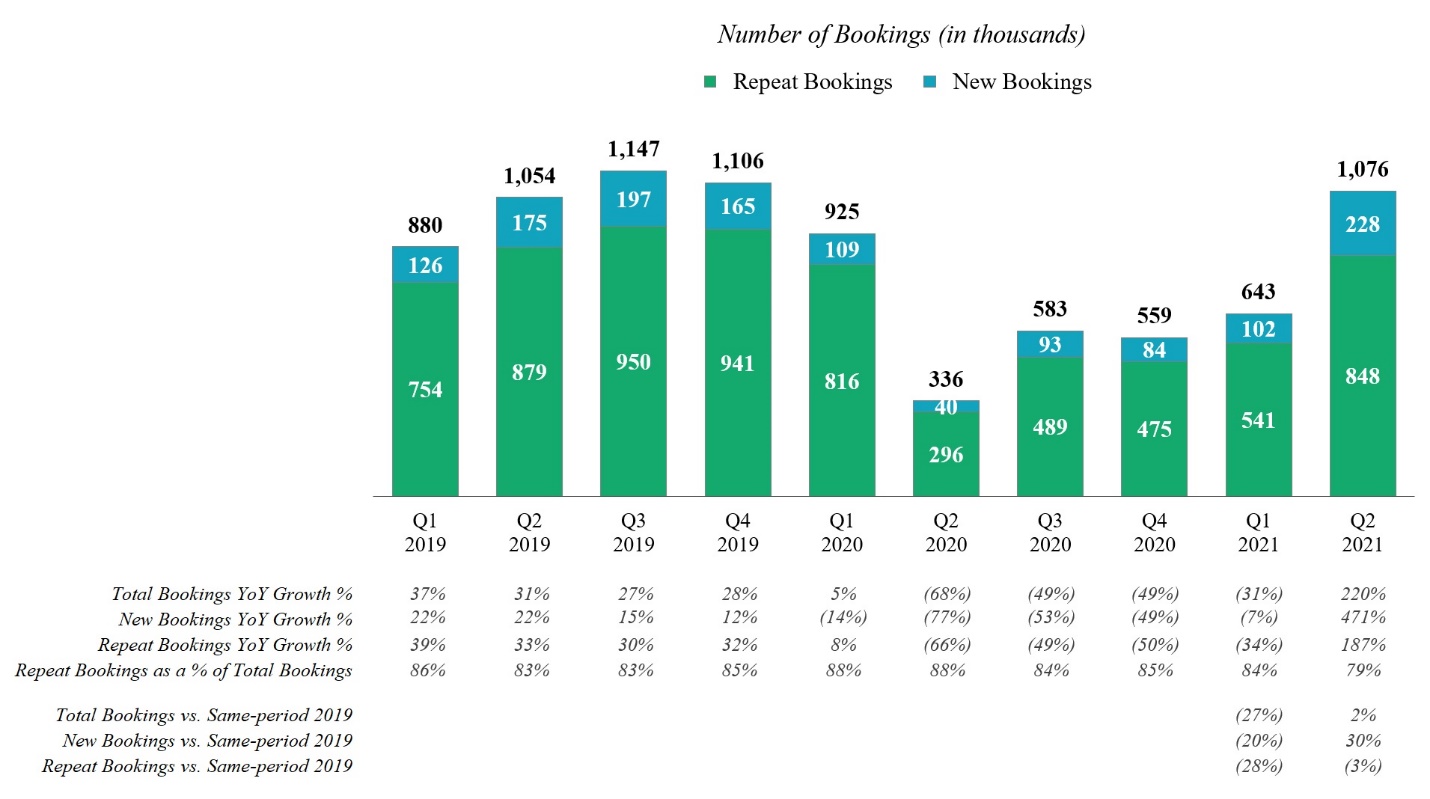
In the second quarter of 2021, we had 1.1 million bookings, a 220% increase from the same period in 2020. This was our largest new customer quarter ever, surpassing the previous high achieved in the third quarter of 2019 by 16%, driven disproportionately by organic customer acquisition channels. The improvement in bookings was driven by the ongoing recovery in travel demand from the impacts of COVID-19 during the second quarter. See “—Impact of COVID-19.”
Gross Booking Value (“GBV”)
Gross Booking Value, or GBV, represents the dollar value of bookings on our platform in a period and is inclusive of pet care provider earnings, service fees, add-ons, taxes and alterations that occurred during that period. We believe that GBV is a useful indicator of the level of spending on and growth of our platform. Growth in GBV represents increasing activity on our platform from repeat and new pet parents and may differ slightly from bookings growth depending on the mix of daytime and overnight services for each period.
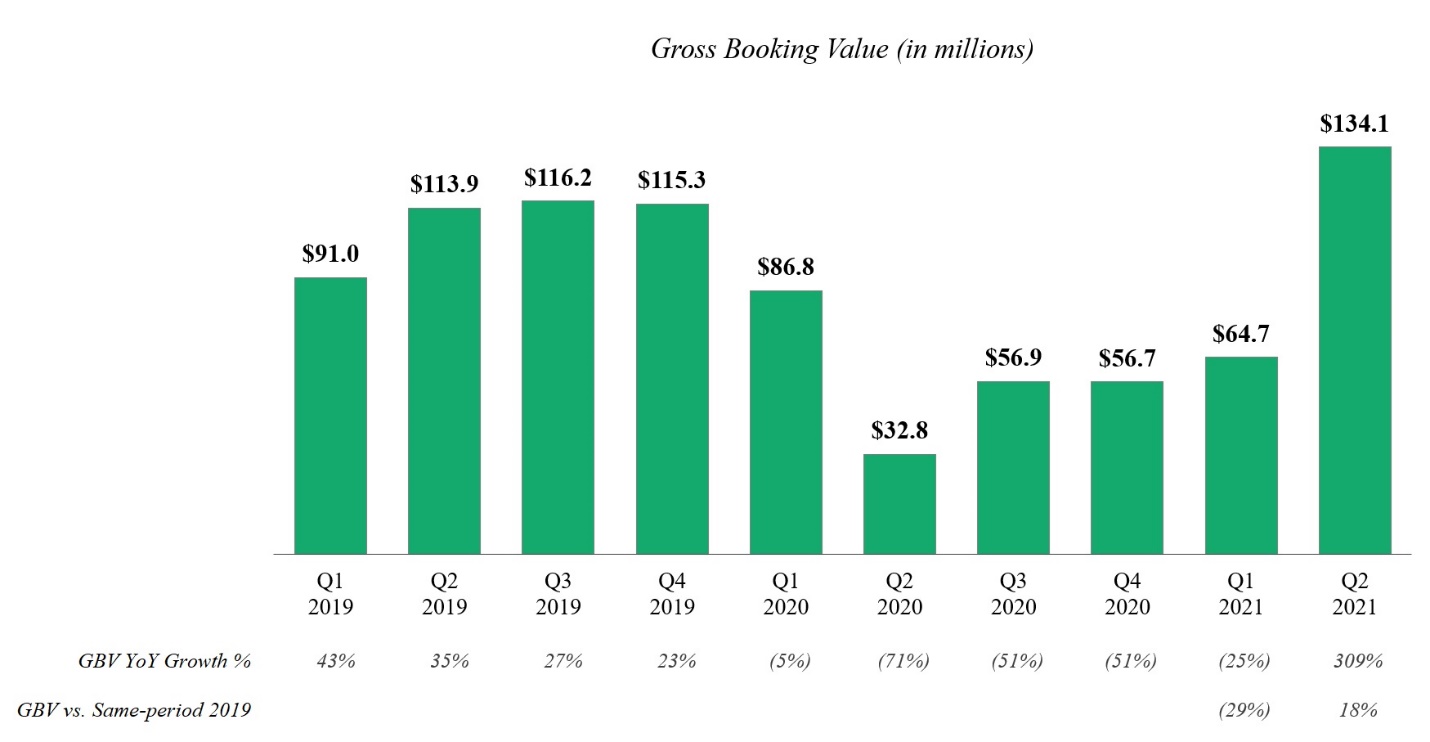
In the second quarter of 2021, our GBV was $134.1 million, a 309% increase from $32.8 million in the same prior year period. Demand for services grew throughout the three months ending June 30, 2021, with GBV for the period growing 18% over the same period in 2019. The increase in our GBV was primarily due to continued increase in U.S. domestic travel demand. Similar to Bookings, this improvement was largely driven by stronger results in the U.S., as our international markets remained slower to recover. For additional information regarding the impact of the COVID-19 pandemic on our business, see “—Impact of COVID-19”.
Adjusted EBITDA
We collect and analyze operating and financial data to evaluate the health of our business and assess our performance. In addition to revenue, net income (loss), loss from operations, and other results under GAAP, we use Adjusted EBITDA, which is described below, to evaluate our business.
We use this non-GAAP financial measure for financial and operational decision-making and as a means to evaluate period-to-period comparisons. We consider Adjusted EBITDA to be an important measure because it helps illustrate underlying trends in our business and our historical operating performance on a more consistent basis. We believe that this non-GAAP financial measure, when taken together with its most directly comparable GAAP measure, net income (loss), provides meaningful supplemental information regarding our performance by excluding certain items that may not be indicative of our recurring core business operating results.
We believe that both management and investors benefit from referring to this non-GAAP financial measure in assessing our performance and when planning, forecasting, and analyzing future periods. This non-GAAP financial measure also facilitates management’s internal comparisons to our historical performance. We believe this non-GAAP financial measure is useful to investors both because (1) it allows for greater transparency with respect to key
metrics used by management in its financial and operational decision-making and (2) it is used by our institutional investors and the analyst community to help them analyze the health of our business. Accordingly, we believe that this non-GAAP financial measure provides useful information to investors and others in understanding and evaluating our operating results in the same manner as our management team and board of directors.
Non-GAAP financial measures have limitations as an analytical tool, and you should not consider them in isolation, or as a substitute for, financial information prepared in accordance with GAAP. For example, our calculation of Adjusted EBITDA may differ from similarly titled non-GAAP measures, if any, reported by our peer companies, or our peer companies may use other measures to calculate their financial performance, and therefore our use of Adjusted EBITDA may not be directly comparable to similarly titled measures of other companies. The principal limitation of Adjusted EBITDA is that it excludes significant expenses and income that are required by GAAP to be recorded in our financial statements. In addition, it is subject to inherent limitations as it reflects the exercise of judgments by management about which expense and income are excluded or included in determining this non-GAAP financial measure. In order to compensate for these limitations, management presents non-GAAP financial measures in connection with GAAP results. In addition, such financial information is unaudited and does not conform to SEC Regulation S-X and as a result such information may be presented differently in our future filings with the SEC.
We define Adjusted EBITDA as net loss excluding depreciation and amortization, stock-based compensation expense, income tax expense or benefit, interest expense, interest income, other income (expense), net, and non-routine items such as restructuring, impairment, and certain acquisition and merger-related costs.
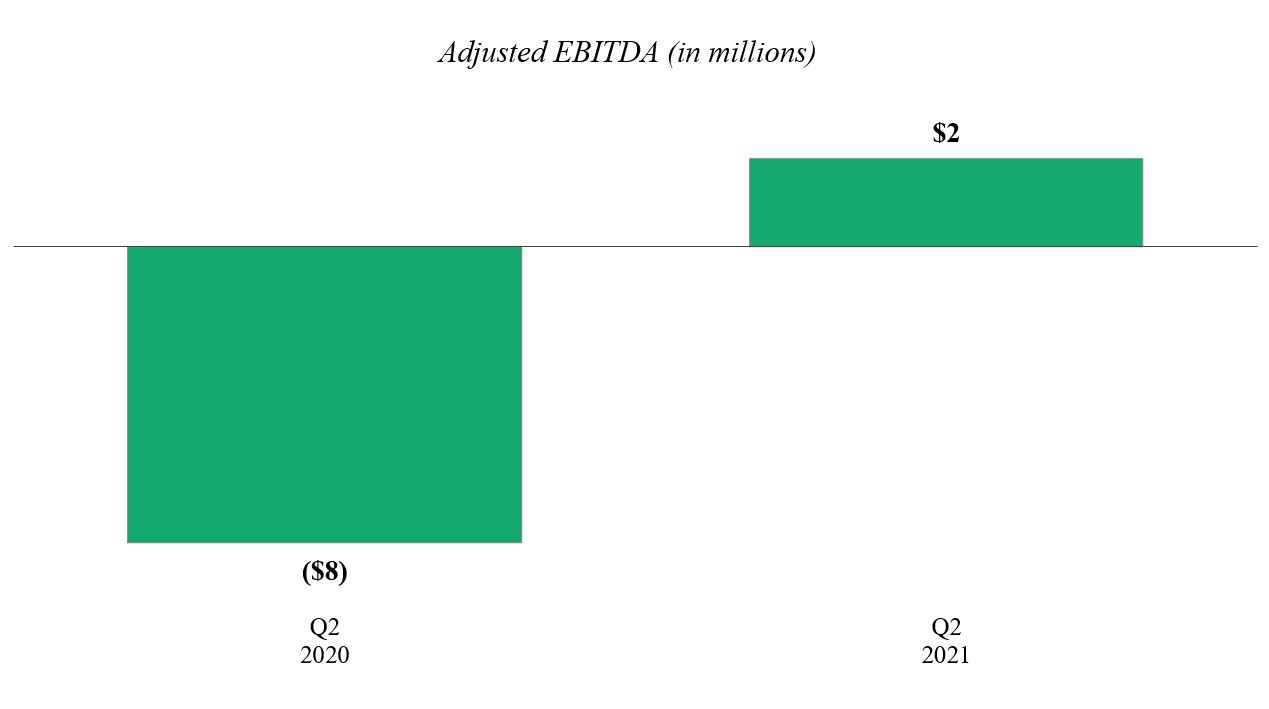 For the three months ended June 30, 2021, Adjusted EBITDA was $2.5 million, marking our first quarterly Adjusted EBITDA profit. The second quarter result was an improvement of $10.9 million compared to the second quarter of 2020. This was the result of strong revenue performance and high volume of organic new customer acquisition in addition to a lower cost structure because of the restructuring in 2020. Over the long term, we expect Adjusted EBITDA to continue to be positive and increase as a result of growth in bookings on our platform and operational efficiency gains; however, in the near term there remains some level of uncertainty as our marketplace continues to recover from the impact of COVID-19. For additional information regarding the impact of the COVID-19 pandemic on our business, see “—Impact of COVID-19”.
The following table presents a reconciliation of Adjusted EBITDA from net loss for the three and six months ended June 30, 2020 and 2021:
| | Three Months Ended June 30, | | | Six Months Ended June 30, | |
| | 2020 | | | 2021 | | | 2020 | | | 2021 | |
| | (in thousands) | |
Adjusted EBITDA reconciliation: | | | | | | | | | | | | | | | | |
Net loss | | $ | (18,079 | ) | | $ | (2,806 | ) | | $ | (38,624 | ) | | $ | (13,397 | ) |
Add (deduct): | | | | | | | | | | | | | | | | |
Depreciation and amortization(1) | | | 6,599 | | | | 3,608 | | | | 11,243 | | | | 7,177 | |
Stock-based compensation(2) | | | 894 | | | | 1,147 | | | | 2,479 | | | | 2,148 | |
Interest income | | | (129 | ) | | | (4 | ) | | | (461 | ) | | | (8 | ) |
Interest expense | | | 1,009 | | | | 703 | | | | 1,258 | | | | 1,400 | |
Other expense, net | | | 144 | | | | 26 | | | | 188 | | | | 77 | |
Benefit from income taxes | | | (29 | ) | | | (331 | ) | | | (52 | ) | | | (317 | ) |
Restructuring expense(3) | | | 1,159 | | | | — | | | | 3,239 | | | | — | |
Acquisition-related costs(4) | | | 3 | | | | 151 | | | | 31 | | | | 1,056 | |
Adjusted EBITDA | | $ | (8,429 | ) | | $ | 2,494 | | | $ | (20,699 | ) | | $ | (1,864 | ) |
______________
______________
(1) | Depreciation and amortization include amortization expense related to capitalized internal use software, which is recognized as cost of revenue (exclusive of depreciation and amortization shown separately) in the consolidated statements of operations. |
(2) | Stock-based compensation expense includes equity granted to employees as well as for professional services to non-employees. |
(3) | Restructuring costs include expenses for severance-related and legal costs incurred during the implementation of our restructuring plan. |
(4) | Acquisition and merger-related costs include accounting, legal, consulting and travel related expenses incurred in connection with business combinations. |
Liquidity and Capital Resources
As of June 30, 2021, we had $103.4 million of cash and cash equivalents, which were primarily invested in money market funds.
From inception to December 31, 2020, we incurred operating losses and negative operating cash flows, and financed our operations through the sale of equity securities and the incurrence of debt. For the six months ended June 30, 2021, we incurred operating losses of $12.2 million but generated positive operating cash flows of $25.8 million. We expect that operating losses could continue into the foreseeable future as we continue to invest in growing our business. Based upon our current operating plans, we believe that cash and equivalents will be sufficient to fund our operations for at least the next 12 months from the date of this Form 8-K/A. However, these forecasts involve risks and uncertainties, and actual results could vary materially. We have based this estimate on assumptions that may prove to be wrong, and we could deplete our capital resources sooner than we expect.
Our future capital requirements and the adequacy of available funds will depend on many factors, including, but not limited to our ability to grow our revenues, the impact of the COVID-19 pandemic, and our response to business challenges, including the need to develop new platform features and services or enhance our existing platform, improve our operating infrastructure, or acquire complementary businesses and technologies. We may seek additional equity or debt financing. If additional financing is required from outside sources, we may not be able to raise it on terms acceptable to us, or at all. If we are unable to raise additional capital when desired, our business, financial condition and results of operations could be adversely affected.
Credit Facility
In May 2018, Rover entered into a credit facility with Silicon Valley Bank (“SVB”) consisting of a revolver and term loan borrowings. Our obligations under the credit facility are secured by substantially all of our assets. The credit facility contains customary conditions to borrowing, events of default and covenants restricting our activities,
including limitations on our ability to sell assets, engage in mergers and acquisitions, enter into transactions involving related parties, incur indebtedness or grant liens or negative pledges on our assets, make loans or make other investments. The credit facility also contains minimum liquidity and minimum net revenue financial covenants that are applicable if our overall liquidity does not exceed $75.0 million at the end of a reporting period. We were in compliance with all of our covenants under the credit facility as of June 30, 2021. In March 2021, the credit facility was amended to provide that the minimum liquidity and minimum net revenue financial covenants would be applicable if overall liquidity does not exceed $65.0 million at the end of the reporting period.
The revolving line of credit provides for up to $15.0 million principal amount of borrowings and matures in May 2022. Interest is payable monthly and accrues at the greater of (1) 4.5% and (2) prime rate plus a margin of 0.50% per year, or if certain milestones are achieved, greater of (1) 4.0% and (2) the prime rate. As of June 30, 2021, these milestones have not been met. We are required to pay a quarterly fee in an amount equal to 0.30% per year times the average unused portion of the revolving line credit. During the year ended December 31, 2020, we had incurred $11.4 million in revolver borrowings, issued a $3.5 million letter of credit primarily for the security deposit on our Seattle headquarters, which reduced available revolver borrowings, and repaid the $11.4 million revolver borrowings. We had $11.4 million in available revolver borrowings as of June 30, 2021.
The credit facility also provides for up to $15.0 million principal amount of term borrowings, available until June 30, 2021 which may be incurred in three tranches of up to $5.0 million based upon achievement of revenue milestones. Term borrowings mature in June 2024. Interest is payable monthly and accrues at the greater of (1) 5.0% and (2) prime rate plus a margin of 1.0% per year, or if certain milestones are achieved, greater of (1) 4.5% and (2) the prime rate plus a margin of 0.5% per year. As of June 30, 2021, these milestones have not been met. Term borrowings are interest only through June 2021. Beginning in July 2021 and continuing through the maturity date, principal and interest are payable in equal monthly installments. Principal that has been repaid cannot be reborrowed. During the year ended December 31, 2020, we had incurred $15.0 million in borrowings and repaid the $15.0 million term borrowings. As of June 30, 2021, no amounts were outstanding, and the Company can no longer borrow under the term borrowings component of the credit facility.
Subordinated Credit Facility
In August 2019, we entered into a subordinated credit facility with SVB and another lender which provides for up to $30.0 million principal amount of term borrowings until June 30, 2020 in tranches of at least $5.0 million. The subordinated credit facility matures in August 2022. Interest is payable monthly and accrues at a rate equal to the prime rate plus a margin of 4.25% per year. Borrowings are interest only through the maturity date when the outstanding principal amount and accrued interest must be repaid. The principal amount may be repaid at any time with a premium. Principal that has been repaid cannot be reborrowed. Our obligations under the subordinated credit facility are secured by substantially all of our assets. The subordinated credit facility contains customary conditions to borrowing, events of default and restrictive covenants that are substantially similar to our credit facility. As of June 30, 2021, we were in compliance with all of our covenants under the subordinated credit facility and had drawn the full $30.0 million of available borrowings. In connection with the closing of the Merger on July 30, 2021, we repaid the principal and accrued interest on the subordinated credit facility.
Paycheck Protection Program Loan
In April 2020, we entered into a Paycheck Protection Program Promissory Note and Agreement with SVB, pursuant to which we incurred $8.1 million aggregate principal amount of term borrowings (the “PPP Loan”). The PPP Loan was made under, and was subject to the terms and conditions of, the PPP which was established under the CARES Act and is administered by the U.S. Small Business Administration. The term of the PPP Loan was two years with a maturity date of April 2022 and accrues interest at a rate of 1.00% per year. Interest is payable monthly. Payments of principal and interest on the PPP Loan were deferred for the first 16 months of the term of the PPP Loan until August 2021.
In connection with the closing of the Merger on July 30, 2021, we repaid the principal and accrued interest on the PPP Loan.
Cash Flows
The following table summarizes our cash flows for the periods indicated:
| | Six Months Ended June 30, | |
| | 2020 | | | 2021 | |
| | (in thousands) | |
Net cash (used in) provided by: | | | | | | | | |
Operating activities | | $ | (46,901 | ) | | $ | 25,766 | |
Investing activities | | | 2,487 | | | | (3,362 | ) |
Financing activities | | | 64,652 | | | | 130 | |
Effect of foreign exchange on cash, cash equivalents, and restricted cash | | | 22 | | | | 4 | |
Net increase in cash, cash equivalents, and restricted cash | | $ | 20,260 | | | $ | 22,538 | |
Operating Activities
Net cash provided by operating activities was $25.8 million for the six months ended June 30, 2021. The most significant component of our cash provided by operations was a net loss of $13.4 million which included non-cash expense related to depreciation and amortization totaling $7.2 million, stock-based compensation of $2.1 million and $1.0 million of non-cash operating lease costs. This was offset by an increase in operating assets and liabilities, primarily as a result of an increase of $35.9 million in deferred revenue, pet parent deposits, and pet service provider liabilities due to increased payments received from customers in advance of revenue recognition as the business recovers from the COVID-19 pandemic.
Net cash used in operating activities was $46.9 million for the six months ended June 30, 2020. The most significant component of our cash used in operations was a net loss of $38.6 million. This included non-cash expense related to depreciation and amortization of $11.2 million and stock-based compensation of $2.5 million. In addition, cash outflow totaling $22.4 million was attributable to changes in operating assets and liabilities, primarily as a result of a $15.3 million decrease in deferred revenue, pet parent deposits and pet service provider liabilities due to the impact of the COVID-19 pandemic.
Investing Activities
Net cash used in investing activities for the six months ended June 30, 2021 was $3.4 million, which was primarily driven by our investment in internal-use software of $3.0 million and purchase of property and equipment of $0.4 million.
Net cash provided by investing activities for the six months ended June 30, 2020 was $2.5 million, which was primarily due to net short-term investment cash inflows of $6.9 million, offset by investment in internal-use software of $4.0 million and purchases of property and equipment of $0.5 million.
Financing Activities
Net cash provided by financing activities for the six months ended June 30, 2021 was $0.1 million which consisted of $1.5 million of proceeds from exercises of common stock options offset by $1.4 million of payment of deferred transaction costs.
Net cash provided by financing activities for the six months ended June 30, 2020 was $64.7 million, which was primarily due to net proceeds from borrowings under our credit facilities.
Quantitative and Qualitative Disclosures About Market Risk
We are exposed to a variety of markets and other risks including the effects of change in interest rates, inflation and foreign currency translation and transaction risks as well as risks to the availability of funding sources, hazard events and specific asset risks.
Interest Rate Risk
Our investment portfolio consists of short-term fixed income securities, including government and investment-grade debt securities and money market funds. These securities are classified as available-for-sale and, consequently, are recorded in the condensed consolidated balance sheets at fair value with unrealized gains or losses, net of tax reported as a separate component of stockholders’ deficit within accumulated other comprehensive income (loss). Our investment policy and strategy are focused on the preservation of capital and supporting our liquidity requirements. We do not enter into investments for trading or speculative purposes.
Based on our investment portfolio balance as of December 31, 2020 and June 30, 2021, a hypothetical 100 basis point increase in interest rates would not have materially affected our condensed consolidated financial statements. We currently do not hedge these interest rate exposures.
Foreign Currency Risk
Our functional currency is the U.S. dollar, while certain of our current and future subsidiaries will be expected to have other functional currencies, including the British Pound, the Euro and the Canadian dollar. To date, we have not had material exposure to foreign currency fluctuations and have not hedged such exposure, although it may do so in the future.
Inflation Risk
We do not believe that inflation has had a material effect on our business, results of operations, or financial condition.
Critical Accounting Policies and Estimates
Our condensed consolidated financial statements have been prepared in accordance with GAAP. The preparation of these financial statements requires us to make estimates and assumptions that affect the reported amounts of assets and liabilities and the disclosure of contingent assets and liabilities as of the date of the financial statements, as well as the reported expenses incurred during the reporting periods. Our estimates are based on historical experience and on various other factors that we believe are reasonable under the circumstances, the results of which form the basis for making judgments about the carrying value of assets and liabilities that are not readily apparent from other sources.
Actual results may differ from these estimates under different assumptions or conditions. We believe that the accounting policies discussed below are critical to understanding our historical and future performance, as these policies relate to the more significant areas involving management’s judgments and estimates.
While our significant accounting policies are described in the notes to our condensed consolidated financial statements, we believe that the accounting policies below are most critical to understanding our financial condition and historical and future results of operations.
Revenue Recognition
We recognize revenue in accordance with ASC Topic 606, which we adopted as of January 1, 2019 on a modified retrospective basis. We generate substantially all of our revenue from facilitating the connection between pet care providers and pet parents. We consider both pet parents and pet care providers to be our customers. We charge a fixed
percentage service fee for each arrangement of pet-related services between the pet parent and the pet service provider on our platform, or a booking. The fixed percentage service fees are established at the time a pet parent or pet provider joined the platform and do not vary based on the volume of transactions. A booking defines the explicit fee from which we earn our fixed service fee. Our single performance obligation is identified as the facilitation of the connection between pet care provider and pet parent through our platform, which occurs upon the completion of a booking. Revenue is recognized at a point in time when the performance obligation is satisfied upon completion of a booking and the related underlying pet-related services have begun.
We evaluate the presentation of revenue on a gross or net basis based on whether or not we are the principal in the transaction (gross) or whether we arrange for other parties to provide the service to the pet parent and are an agent (net) in the transaction. We determined that we do not control the right to use the pet-related services provided by the pet service provider to the pet parent. Accordingly, we concluded that we are acting in an agent capacity and revenue is presented net reflecting the service fees received from our customers to facilitate a booking.
We offer discounts to pet parents to encourage use of the Company’s platform. Discounts are primarily in the form of coupon codes for prospective pet parents and are accounted for as reductions to revenue.
Stock-Based Compensation
We estimate the fair value of stock options granted to employees, non-employees and directors using the Black-Scholes option pricing model. The fair value of stock options that is expected to vest is recognized as compensation expense on a straight-line basis over the requisite service period.
The Black-Scholes option pricing model utilizes inputs which are highly subjective assumptions and generally require significant judgment. These assumptions include:
• | Fair Value of Common Stock. See “—Common Stock Valuations” below. |
• | Risk-Free Interest Rate. The risk-free interest rate is based on the U.S. Treasury zero coupon issues in effect at the time of grant for periods corresponding with the expected term of the option. |
• | Expected Volatility. As our stock was not publicly traded through June 30, 2021, the expected volatility was estimated based on the average volatility for comparable publicly traded peer companies over a period equal to the expected term of the stock option grants. |
• | Expected Term. The expected term represents the period that the stock-based awards are expected to be outstanding and is determined using the simplified method (based on the mid-point between the vesting date and the end of the contractual term), as we do not have sufficient historical data to use any other method to estimate expected term. |
• | Expected Dividend Yield. We have never paid dividends on our common stock and have no plans to pay dividends on our common stock. Therefore, we used an expected dividend yield of zero. |
See Note 14 to our annual audited financial statements beginning on page F-34 of the Proxy Statement for more information concerning certain of the specific assumptions we used in applying the Black-Scholes option pricing model to determine the estimated fair value of our stock options. Certain of such assumptions involve inherent uncertainties and the application of significant judgment. As a result, if factors or expected outcomes change and we use significantly different assumptions or estimates, stock-based compensation could be materially different.
Common Stock Valuations
Historically, for all periods prior to Merger, since there has been no public market of our common stock, the fair value of the shares of common stock underlying our share-based awards was estimated on each grant date by our Board. To determine the fair value of our common stock underlying option grants, our Board considered, among other things, input from management, valuations of our common stock prepared by unrelated third-party valuation firms in
accordance with the guidance provided by the American Institute of Certified Public Accountants 2013 Practice Aid, Valuation of Privately-Held-Company Equity Securities Issued as Compensation, and the Board’ assessment of additional objective and subjective factors that it believed were relevant, and factors that may have changed from the date of the most recent valuation through the date of the grant. These factors include, but are not limited to:
• | our results of operations and financial position, including the present value of expected future cash flows and the value of tangible and intangible assets; |
• | risks and opportunities relevant to our business; |
• | the status of platform development activities; |
• | our business conditions and projections; |
• | the market value of companies engaged in a substantially similar business; |
• | the lack of marketability of our common stock as a private company; |
• | the prices at which we sold shares of our convertible preferred stock to outside investors in arms-length transactions; |
• | the rights, preferences, and privileges of our convertible preferred stock relative to those of our common stock; |
• | the likelihood of achieving a liquidity event for our securityholders, such as an initial public offering or a sale of the company, given prevailing market conditions; |
• | the hiring of key personnel and the experience of management; and |
• | trends and developments in our industry, including the impact of COVID-19. |
For valuations performed prior to October 31, 2020, we used the option pricing method (“OPM”) back-solve method. In an OPM framework, the back-solve method for inferring the equity value implied by a recent financing transaction involves making assumptions for the expected time to liquidity, volatility and risk-free rate and then solving for the value of equity such that value for the most recent financing equals the amount paid. This method was selected due to our stage and uncertainty regarding the timing and probability of possible future exit scenarios.
For valuations performed on and subsequent to October 31, 2020, we used a hybrid method of the OPM and the Probability-Weighted Expected Return Method (“PWERM”). PWERM considers various potential liquidity outcomes. Our approach included the use of an initial public offering scenario, a strategic merger or sale scenario, and a scenario assuming continued operation as a private entity. Under the hybrid OPM and PWERM method, the per share value calculated under the OPM and PWERM are weighted based on expected exit outcomes and the quality of the information specific to each allocation methodology to arrive at a final estimated fair value per share of the common stock before a discount for lack of marketability is applied.
Recent Accounting Pronouncements
See Note 2 to our condensed consolidated financial statements included as Exhibit 99.1 to this Form 8-K/A for more information about recent accounting pronouncements, the timing of their adoption, and our assessment, to the extent it has made one, of their potential impact on our financial condition and its results of operations.
Internal Control Over Financial Reporting
Internal control over financial reporting is a process to provide reasonable assurance regarding the reliability of financial reporting and the preparation of financial statements in accordance with generally accepted accounting principles. Because of its inherent limitations, internal control over financial reporting may not prevent or detect misstatements. Also, projections of any evaluation of effectiveness to future periods are subject to the risk that controls may become inadequate because of changes in conditions, or that the degree of compliance with policies or procedures may deteriorate.
In connection with the preparation of our consolidated financial statements as of and for the years ended December 31, 2018, 2019 and 2020, we identified material weaknesses in our internal control over financial reporting. A material weakness is a deficiency, or a combination of deficiencies, in internal control over financial reporting such that there is a reasonable possibility that a material misstatement of our annual or interim financial statements will not be prevented or detected on a timely basis. We did not design or maintain an effective control environment due to an insufficient complement of personnel with the appropriate level of knowledge, experience, and training commensurate with our accounting and reporting requirements. This material weakness contributed to the following additional material weaknesses:
| • | We did not design and maintain sufficient formal procedures and controls to achieve complete and accurate financial reporting and disclosures, including controls over the preparation and review of journal entries and account reconciliations. Additionally, we did not design and maintain controls to ensure appropriate segregation of duties. |
Neither of these material weaknesses resulted in a material misstatement to the consolidated financial statements, however they did result in adjustments to several accounts and disclosures. Additionally, these material weaknesses could result in a misstatement of substantially all of the financial statement accounts and disclosures that would result in a material misstatement to the annual or interim consolidated financial statements that would not be prevented or detected.
| • | We identified an additional material weakness as a result of the material weakness in our control environment in that we did not design and maintain effective controls over information technology (“IT”) general controls for information systems that are relevant to the preparation of our financial statements. Specifically, we did not design and maintain: (1) program change management controls for financial systems to ensure that information technology program and data changes affecting financial IT applications and underlying accounting records are identified, tested, authorized and implemented appropriately; (2) user access controls to ensure appropriate segregation of duties that adequately restrict user and privileged access to financial applications, programs, and data to appropriate Company personnel; (3) computer operations controls to ensure that critical batch jobs are monitored and data backups are authorized and monitored; and (4) testing and approval controls for program development to ensure that new software development is aligned with business and IT requirements. |
These IT deficiencies did not result in a material misstatement to the financial statements, however, the deficiencies, when aggregated, could impact our ability to maintain effective segregation of duties, as well as the effectiveness of IT-dependent controls (such as automated controls that address the risk of material misstatement to one or more assertions, along with the IT controls and underlying data that support the effectiveness of system-generated data and reports) that could result in misstatements potentially impacting all financial statement accounts and disclosures that would result in a material misstatement to the annual or interim financial statements that would not be prevented or detected. Accordingly, we have determined these deficiencies in the aggregate constitute a material weakness.
Rover has begun implementation of a plan to remediate these material weaknesses. These remediation measures are ongoing and include hiring additional personnel and implementing additional procedures and controls. While these actions and planned actions are subject to ongoing management evaluation and will require validation and testing of the design and operating effectiveness of internal controls over a sustained period, we are committed to continuous improvement and will continue to diligently review our internal control over financial reporting.