Exhibit 99.1

Second Quarter 2022 Earnings Presentation August 11, 2022

Disclaimer This presentation contains forward - looking statements that can be identified by the use of words such as “anticipate,” “believe, ” “could,” “expect,” “should,” “plan,” “intend,” “estimate” and “potential,” among others. By their nature, forward - looking statements are necessarily subject to a high degree o f uncertainty and involve known and unknown risks, uncertainties, assumptions and other factors because they relate to events and depend on circumstances that will occur in the fu ture whether or not outside of our control. Such factors may cause actual results, performance or developments to differ materially from those expressed or implied by such forward - looki ng statements and there can be no assurance that such forward - looking statements will prove to be correct. Accordingly, you should not place undue reliance on forward - looking st atements. The forward - looking statements included herein speak only as at the date of this presentation and we do not undertake any obligation to update these forward - looking sta tements. Past performance does not guarantee or predict future performance. Moreover, neither we nor our affiliates, officers, employees and agents undertake any obligation to review, update or confirm expectations or estimates or to release any revisions to any forward - looking statements to reflect events that occur or circumstances that arise in relation to the content of the presentation. Further information on these and other factors that could affect our financial results is included in filings we have made and will make with the U. S. Securities and Exchange Commission (the “SEC”) from time to time, including in the section titled “Risk Factors” in our latest fillings with the SEC. These documents are availa ble on the SEC Filings section of the investor relations section of our website at: https://ir.vincipartners.com/financials/sec - filings. We have prepared this presentation solely for informational purposes. The information in this presentation does not constitut e o r form part of, and should not be construed as, an offer or invitation to subscribe for, underwrite or otherwise acquire, any of our securities or securities of our subsidiaries or a ffi liates, not should it or any part of it form the basis of, or be relied on, in connection with any contract to purchase or subscribe for any of our securities or securities of any of our sub sid iaries or affiliates, nor shall it or any part of it form the basis of, or be relied on, in connection with any contract or commitment whatsoever. This presentation also includes certain non - GAAP financial information. We believe that such information is meaningful and usefu l in understanding the activities and business metrics of our operations. We also believe that these non - GAAP financial measures reflect an additional way of viewing aspects o f our business that, when viewed with our International Financial Reporting Standards (“IFRS”) results, as issued by the International Accounting Standards Board, prov ide a more complete understanding of factors and trends affecting our business. Further, investors regularly rely on non - GAAP financial measures to assess operating performance and suc h measures may highlight trends in our business that may not otherwise be apparent when relying on financial measures calculated in accordance with IFRS. We also believe that cer tai n non - GAAP financial measures are frequently used by securities analysts, investors and other interested parties in the evaluation of public companies in our industry, many of wh ich present these measures when reporting their results. The non - GAAP financial information is presented for informational purposes and to enhance understanding of the IFRS financial st atements. The non - GAAP measures should be considered in addition to results prepared in accordance with IFRS, but not as a substitute for, or superior to, IFRS results . A s other companies may determine or calculate this non - GAAP financial information differently, the usefulness of these measures for comparative purposes is limited. A reconciliatio n o f such non - GAAP financial measures to the nearest GAAP measure is included in this presentation. 2

3 Presenters Alessandro Horta Chief Executive Officer Sergio Passos Chief Operating Officer & Chief Financial Officer Bruno Zaremba Private Equity Chairman & Head of Investor Relations

Opening Remarks
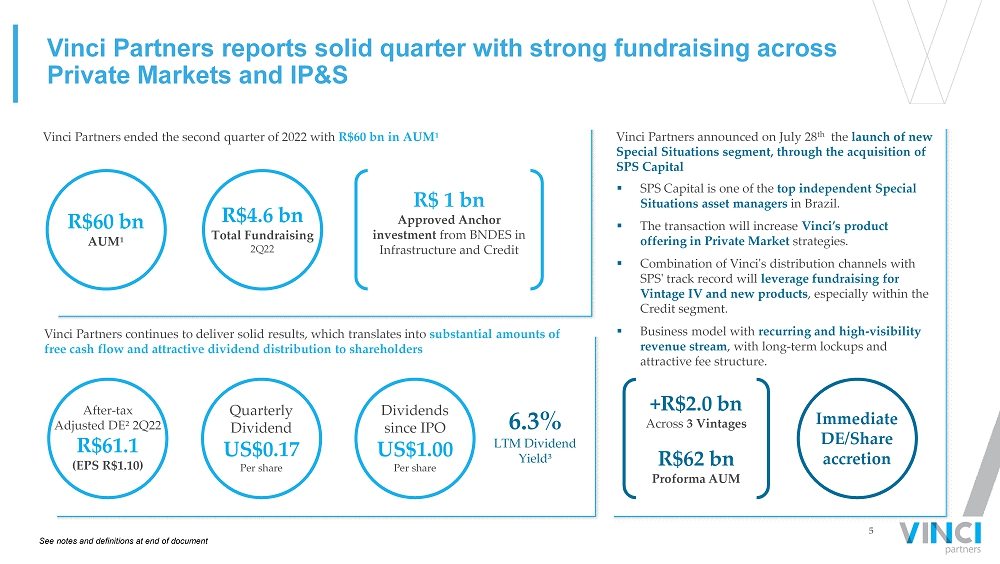
5 Vinci Partners reports solid quarter with strong fundraising across Private Markets and IP&S After - tax Adjusted DE² 2Q22 R$61.1 (EPS R$1.10) R$ 60 bn AUM¹ See notes and definitions at end of document R$4.6 bn Total Fundraising 2Q22 Vinci Partners ended the second quarter of 2022 with R$60 bn in AUM¹ Vinci Partners continues to deliver solid results, which translates into substantial amounts of free cash flow and attractive dividend distribution to shareholders Quarterly Dividend US$0.17 Per share Dividends since IPO US$1.00 Per share Vinci Partners announced on July 28 th the launch of new Special Situations segment, through the acquisition of SPS Capital Immediate DE/Share accretion ▪ SPS Capital is one of the top independent Special Situations asset managers in Brazil. ▪ The transaction will increase Vinci’s product offering in Private Market strategies. ▪ Combination of Vinci's distribution channels with SPS' track record will leverage fundraising for Vintage IV and new products , especially within the Credit segment. ▪ Business model with recurring and high - visibility revenue stream , with long - term lockups and attractive fee structure. R$ 1 bn Approved Anchor investment from BNDES in Infrastructure and Credit +R$2.0 bn Across 3 Vintages R$62 bn Proforma AUM 6.3 % LTM Dividend Yield³

Financial Highlights

7 Second Quarter 2022 Segment Earnings (Unaudited) See notes and definitions at end of document (R$ thousands, unless mentioned) 2Q'21 1Q'22 2Q'22 ∆ YoY(%) 2Q'21 YTD 2Q'22 YTD ∆ YoY(%) Net revenue from management fees 94,778 87,229 89,271 - 6% 176,621 176,500 0% Net revenue from advisory fees 6,378 3,674 6,659 4% 21,444 10,333 - 52% Total Fee Related Revenues 101,156 90,903 95,930 - 5% 198,065 186,833 - 6% Segment personnel expenses (5,528) (6,549) (6,233) 13% (10,625) (12,782) 20% Other G&A expenses (4,058) (4,503) (4,178) 3% (7,632) (8,681) 14% Corporate center expenses (19,296) (18,761) (21,350) 11% (38,808) (40,111) 3% Bonus compensation related to management and advisory¹ (17,082) (17,272) (17,267) 1% (35,608) (34,539) - 3% Total Fee Related Expenses (45,964) (47,085) (49,028) 7% (92,674) (96,113) 4% FEE RELATED EARNINGS (FRE) 55,192 43,818 46,902 - 15% 105,391 90,720 - 14% FRE Margin (%) 54.6% 48.2% 48.9% 53.2% 48.6% FRE per share² (R$/share) 0.97 0.78 0.84 1.85 1.63 Net revenue from performance fees 18,624 3,172 3,839 - 79% 28,575 7,011 - 75% Performance based compensation³ (7,817) (1,032) (1,427) - 82% (11,109) (2,459) - 78% PERFORMANCE RELATED EARNINGS (PRE) 10,807 2,140 2,412 - 78% 17,466 4,552 - 74% PRE Margin (%) 58.0% 67.5% 62.8% 61.1% 64.9% ( - ) Unrealized performance fees (9,065) (636) – N/A (9,487) (636) - 93% (+) Unrealized performance compensation 2,980 225 – N/A 3,130 225 - 93% (+) Realized GP investment income 345 2,045 4,926 1,328% 457 6,971 1,425% SEGMENT DISTRIBUTABLE EARNINGS 60,259 47,593 54,240 - 10% 116,958 101,833 - 13% Segment DE Margin (%) 54.3% 49.8% 51.8% 53.7% 50.9% (+) Depreciation and amortization 926 984 976 5% 1,865 1,960 5% (+) Realized financial income 14,239 24,996 20,001 40% 18,883 44,997 138% ( - ) Leasing expenses (3,106) (2,472) (2,400) - 23% (6,263) (4,872) - 22% ( - ) Other items (2,120) (1,136) 644 N/A (1,234) (492) - 60% ( - ) Extraordinary expenses – (5,109) (962) – (6,071) ( - ) Income taxes (excluding related to unrealized fees and income) (15,417) (11,601) (12,064) - 22% (28,232) (23,665) - 16% DISTRIBUTABLE EARNINGS (DE) 54,781 53,255 60,435 10% 101,976 113,690 11% DE Margin (%) 43.7% 44.2% 48.5% 43.1% 46.4% DE per share (R$/share) 4 0.97 0.95 1.09 1.79 2.04 (+) Nonrecurring expenses (including Income Tax effect) 5 – 4,437 635 N/A – 5,072 N/A ADJUSTED DISTRIBUTABLE EARNINGS 54,781 57,692 61,070 11% 101,976 118,762 16% Adjusted DE Margin (%) 43.7% 47.9% 49.0% 43.1% 48.4% Adjusted DE per share (R$/share) 0.97 1.03 1.10 1.79 2.13
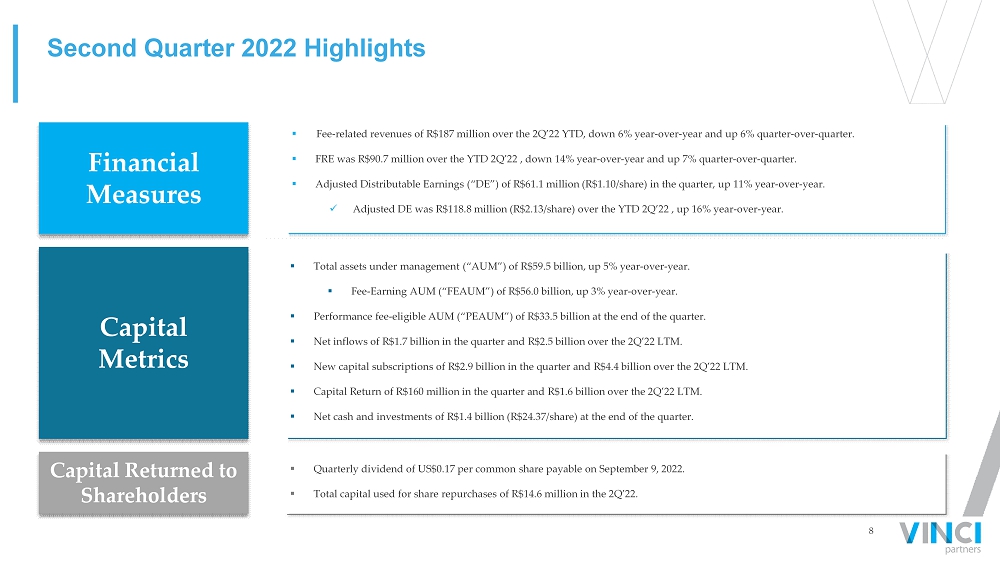
8 ▪ Total assets under management (“AUM”) of R$59.5 billion, up 5% year - over - year. ▪ Fee - Earning AUM (“FEAUM”) of R$56.0 billion, up 3% year - over - year. ▪ Performance fee - eligible AUM (“PEAUM”) of R$33.5 billion at the end of the quarter. ▪ Net inflows of R$ 1.7 billion in the quarter and R$2.5 billion over the 2Q’22 LTM. ▪ New capital subscriptions of R$2.9 billion in the quarter and R$4.4 billion over the 2 Q’22 LTM . ▪ Capital Return of R$160 million in the quarter and R$1.6 billion over the 2Q’22 LTM. ▪ Net cash and investments of R$1.4 billion (R$24.37/share) at the end of the quarter. Second Quarter 2022 Highlights ▪ Fee - related revenues of R$187 million over the 2Q’22 YTD , down 6% year - over - year and up 6% quarter - over - quarter. ▪ FRE was R$90.7 million over the YTD 2Q’22 , down 14% year - over - year and up 7% quarter - over - quarter. ▪ Adjusted Distributable Earnings (“DE”) of R$61.1 million (R$1.10/share) in the quarter, up 11% year - over - year. x Adjusted DE was R$ 118.8 million (R$ 2.13 /share) over the YTD 2Q’22 , up 16 % year - over - year. Financial Measures Capital Metrics Capital Returned to Shareholders ▪ Quarterly dividend of US$0.17 per common share payable on September 9, 2022. ▪ Total capital used for share repurchases of R$14.6 million in the 2Q’22.

9 Vinci raised R$4.6 billion in 2Q’22, a resilient and robust organic growth in AUM despite a volatile and challenging macro scenario ▪ Net Inflows accounted for R$1.7 billion in 2Q’22. ▪ R$2.4 billion raised in IP&S, coming primarily from our pension plan products. ▪ Our Liquid Strategies' AUM remains extremely resilient in comparison to local market's overall behavior. We did not experience significant outflows in open - ended funds, whilst the Brazilian asset manager industry has continued to suffer from outflows adding up to R$95 billion in the year - to - date. ▪ AUM was impacted by R$1.7 billion in depreciation following a significant mark - to - market effect in liquid strategies. The Ibovespa index dropped by 18% in the quarter, impacting the overall mark of Vinci's liquid funds. Net Capital Subscriptions Net Inflows AUM Appreciation/ Depreciation ▪ Private Markets strategies raised R$2.9 billion in additional long - term capital for the platform in 2Q’22. ▪ We started to fundraise for VCP IV, the fourth vintage in our flagship Private Equity strategy. VCP IV was activated as of June 23 rd and all fees charged for subsequent following closings will retroact to this date. ▪ Credit raised R$900 million through its new vintage, Vinci Credit Infra, anchored by a local institutional investor. ▪ This quarter the Private Equity strategy had an impact from a non - fee earning AUM mandate, following the structuring of Evino's operation (VCP III's portfolio company). AUM Rollforward – QTD (R$ bn) 56.7 59.5 2.9 (1.7)

10 19 18 2 3 7 7 27 28 2Q'21 2Q'22 Perpetual or quasi-perpetual 10+ Years 5-10 Years 19 21 14 10 22 26 55 56 2Q'21 2Q'22 Private Markets Liquid Strategies IP&S We continue to see AUM expansion through organic growth across the platform... ▪ Total assets under management (AUM) of R$59.5 billion, up 5% year - over - year, driven primarily by strong fundraising coming from Private Markets funds and our pension plan products within IP&S. ▪ During the second quarter of 2022, Vinci raised R$2.9 billion in Private Markets, with highlights to the start of fundraising fo r VCP IV, and the capital raise for a new vintage in our Credit strategy, Vinci Credit Infra. ▪ Total Fee - Earning AUM (FEAUM) of R$56.0 billion, up 3% year - over - year. AUM 2Q ’ 22 vs 2Q ’ 21 ( R$bn ) Fee - Earning AUM 2Q ’ 22 vs 2Q ’ 21 ( R$bn ) Long - Term AUM¹ 2Q ’ 22 vs 2Q ’ 21 ( R$bn ) + 5% + 3% +2% See notes and definitions at end of document 21 24 14 10 22 26 57 60 2Q'21 2Q'22 Private Markets Liquid Strategies IP&S
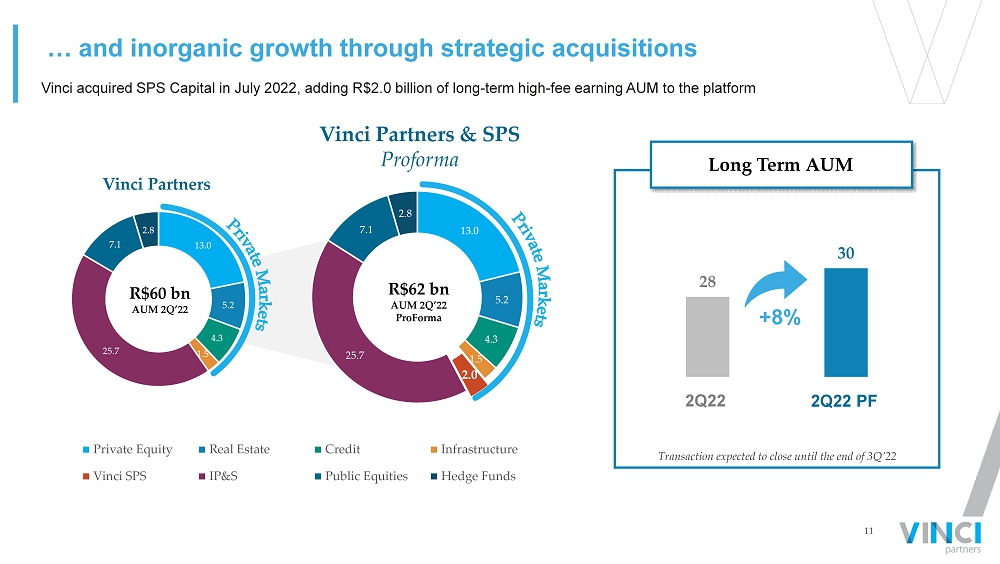
11 Vinci acquired SPS Capital in July 2022, adding R$2.0 billion of long - term high - fee earning AUM to the platform 13.0 5.2 4.3 1.5 2.0 25.7 7.1 2.8 Private Equity Real Estate Credit Infrastructure Vinci SPS IP&S Public Equities Hedge Funds R$60 bn AUM 2Q’22 R$62 bn AUM 2Q’22 ProForma Vinci Partners Vinci Partners & SPS Proforma 28 30 … and inorganic growth through strategic acquisitions Long Term AUM 2Q22 2Q22 PF +8% 13.0 5.2 4.3 1.5 25.7 7.1 2.8 Transaction expected to close until the end of 3Q’22
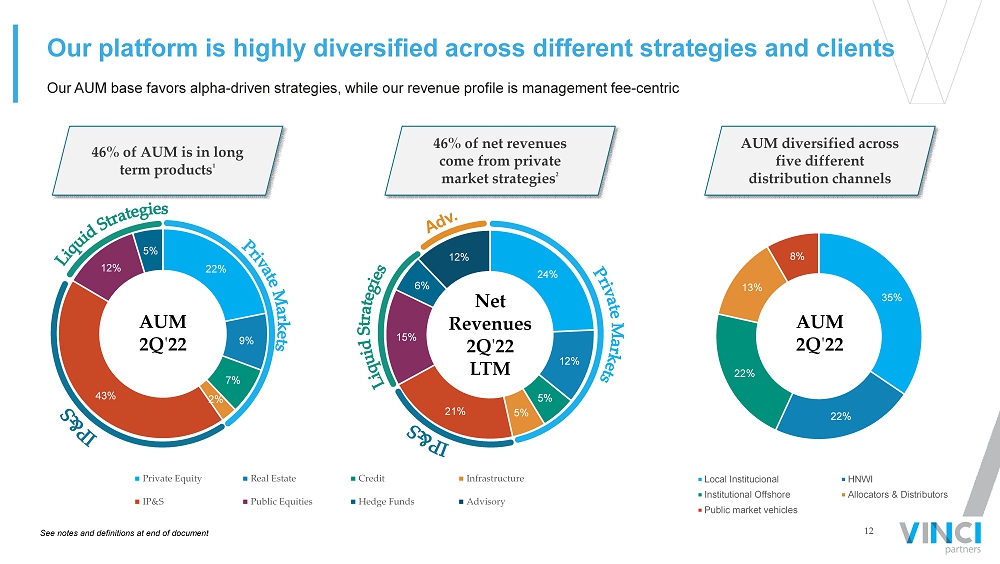
12 22% 9% 7% 2% 43% 12% 5% 35% 22% 22% 13% 8% Local Institucional HNWI Institutional Offshore Allocators & Distributors Public market vehicles 24% 12% 5% 5% 21% 15% 6% 12% Private Equity Real Estate Credit Infrastructure IP&S Public Equities Hedge Funds Advisory Our AUM base favors alpha - driven strategies, while our revenue profile is management fee - centric Our platform is highly diversified across different strategies and clients 46 % of net revenues come from private market strategies ² 46 % of AUM is in long term products ¹ AUM diversified across five different distribution channels AUM 2Q ' 22 Net Revenues 2Q ' 22 LTM See notes and definitions at end of document AUM 2Q ' 22
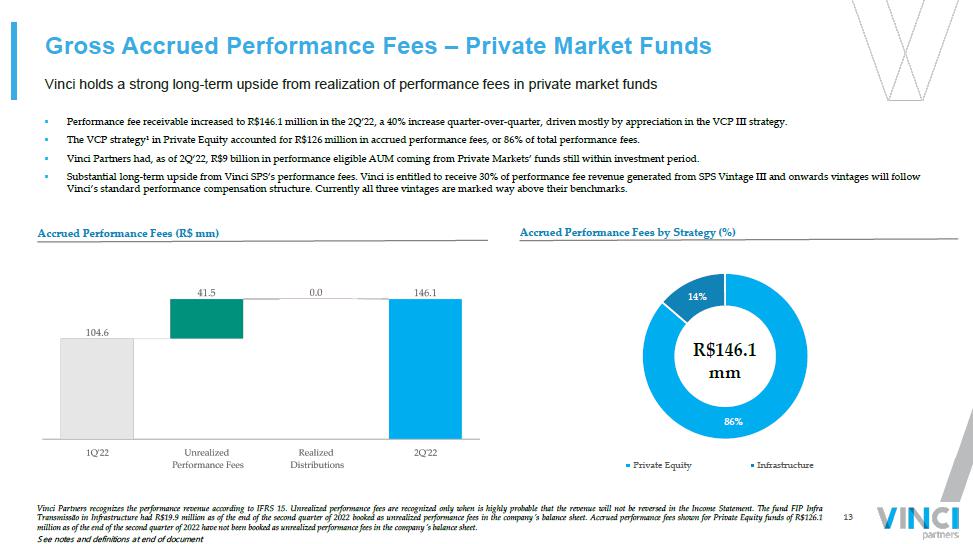
13 Vinci holds a strong long - term upside from realization of performance fees in private market funds Gross Accrued Performance Fees – Private Market Funds ▪ Performance fee receivable increased to R$146.1 million in the 2Q’22, a 40% increase quarter - over - quarter, driven mostly by appr eciation in the VCP III strategy. ▪ The VCP strategy¹ in Private Equity accounted for R$126 million in accrued performance fees, or 86% of total performance fees . ▪ Vinci Partners had, as of 2Q’22, R$9 billion in performance eligible AUM coming from Private Markets’ funds still within inve stm ent period. ▪ Substantial long - term upside from Vinci SPS’s performance fees. Vinci is entitled to receive 30% of performance fee revenue gene rated from SPS Vintage III and onwards vintages will follow Vinci’s standard performance compensation structure. Currently all three vintages are marked way above their benchmarks. R$146.1 mm Accrued Performance Fees (R$ mm) Accrued Performance Fees by Strategy (%) Vinci Partners recognizes the performance revenue according to IFRS 15 . Unrealized performance fees are recognized only when is highly probable that the revenue will not be reversed in the Income Statement . The fund FIP Infra Transmissão in Infrastructure had R $ 19 . 9 million as of the end of the second quarter of 2022 booked as unrealized performance fees in the company ´ s balance sheet . Accrued performance fees shown for Private Equity funds of R $ 126 . 1 million as of the end of the second quarter of 2022 have not been booked as unrealized performance fees in the company ´ s balance sheet . See notes and definitions at end of document 86% 14% Private Equity Infrastructure

14 30% 25% 16% 9% 10% 8% 2% Private Equity IP&S Public Equities Real Estate Credit Hedge Funds Infrastructure Significant exposure to performance fee - eligible AUM ▪ Total Performance fee eligible AUM (PEAUM) of R$33.5 billion. ▪ Hurdle rate funds charge performance based on the fund’s return over its benchmark, generally with a high - watermark clause, except for the SWF mandate in Public Equities. ▪ Within our Private Market strategies, R$9 billion in AUM comes from “preferred return” funds with carried interest, that are still in investment period. PEAUM R$33 bn PERFORMANCE FEE ELIGIBLE AUM (PEAUM) Strategy/Fund AUM R$mm Index type Index Rate Status Offshore Vehicles 3,147 Preferred Return w/ Catch - Up² USD + 8% Within investment period Onshore Vehicles 2,909 Preferred Return w/ Catch - Up² IPCA 5 + 8% Within investment period Nordeste III 233 Preferred Return w/ Catch - Up² IPCA 5 + 8.5% Currently generating performance Teman Pier 96 Preferred Return w/ Catch - Up² IPCA 5 + 5% Within investment period Others 3,708 Not expected to pay performance Total Private Equity 10,092 Vinci Valorem 2,539 Hurdle³ IMAB 5 6 Currently generating performance Separate Mandates 1,711 Hurdle³ IBOV 7 + alpha Currently generating performance International¹ 1,626 Currently generating performance Commingled Funds 705 Hurdle³ IBOV 7 + alpha Currently generating performance VSP 205 Preferred Return w/ Catch - Up² IPCA 5 + 8% Currently generating performance Others 1,427 Currently generating performance Total IP&S 8,214 SWF 3,674 Hurdle³ FTSE 8 Currently generating performance Mosaico Strategy 1,001 Hurdle³ IBOV 7 Currently generating performance Vinci Gas Dividendos 470 Hurdle³ IBOV 7 Currently generating performance Others 307 Currently generating performance Total Public Equities 5,452 Listed REITs 2,357 Hurdle³ IPCA 5 + 6% Currently generating performance VFDL 435 Preferred Return 4 IPCA 5 + 6% Within investment period FOF Strategy 227 Hurdle³ IFIX 9 Currently generating performance Others 16 Currently generating performance Total Real Estate 3,035 VCI II 739 Preferred Return 4 IPCA 5 + 6% Within investment period VES 614 Preferred Return 4 IPCA 5 + 6% Within investment period VCM FIM 360 Preferred Return 4 IPCA 5 + 5% Within investment period Energia FIM 272 Hurdle³ CDI 10 Currently generating performance VCS 175 Hurdle³ IPCA 5 + 5% Within investment period VCI I 257 Not expected to pay performance Others 919 Currently generating performance Total Credit 3,336 Atlas Strategy 490 Hurdle³ CDI 10 Currently generating performance Vinci Multiestratégia 490 Hurdle³ CDI 10 Currently generating performance Vinci Total Return 343 Hurdle³ IPCA 5 + Yield IMAB 11 Currently generating performance Others 1,224 Currently generating performance Total Hedge Funds 2,548 VIAS 371 Preferred Return 4 IPCA 5 + 6% Within investment period Transportation and Logistics 151 Preferred Return 4 IPCA 5 + 6% Within investment period FIP Infra Transmissão 72 Preferred Return 4 IPCA 5 + 8% Currently generating performance Others 199 Not expected to pay performance Total Infrastructure 793 PEAUM TOTAL 33,469

15 95 89 6 7 101 96 2Q'21 2Q'22 Management fees Advisory fees Fee Related Revenues 2Q ’ 22 vs. 2Q ’ 21 (R$mm) - 5% YoY 177 177 21 10 198 187 2Q'21 YTD 2Q'22 YTD Management fees Advisory fees Fee Related Revenues Management fees remain the main contributor to revenues, accounting for 91% of total revenues over the 2Q’22 YTD ▪ Fee related revenues totaled R$95.9 million in the quarter, up 6% quarter - over - quarter, a result of higher advisory fees and the fundraising across Private Market and pension plan products within IP&S. ▪ Fee related revenues, down 5% year - over - year primarily due to our successful capital return in FIP Energia PCH, which occurred in the first quarter of 2022, and the mark - to - market impact in liquid funds following strong corrections in the local markets during the quarter. ▪ Fee related revenues accounted for R$186.8 million over the 2Q’22 YTD, down 6% when compared to the 2Q’21 YTD, due to a great er contribution from advisory fees in 1Q’21, driven by the pre - IPO advisory for B3 listed company Espaço Laser. - 6% YoY Fee Related Revenues 2Q ’ 22 vs. 1Q ’ 22 ( R$mm ) Fee Related Revenues 2Q’22 YTD vs. 2Q’21 YTD (R$mm) 87 89 4 7 91 96 1Q'22 2Q'22 Management fees Advisory fees + 6% QoQ

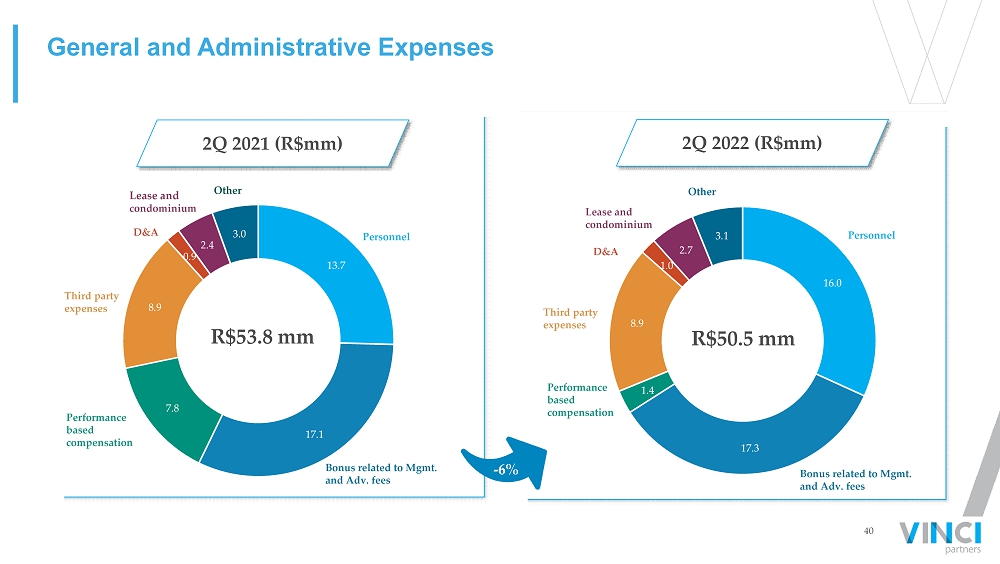
16 Operating Expenses ▪ Total operating expenses of R$50.5 million in the quarter, down 6% year - over - year. ▪ Disregarding bonus compensation, Personnel, Corporate center and G&A expenses were up 10% year - over - year due to higher inflation in the period and return of travel expenses to the same levels experienced before COVID - 19 pandemic. ▪ Total operating expenses of R$98.6 during the 2Q’22 YTD , a decrease of 5% when compared to the 2Q’21 YTD. Total Expenses 2Q ’ 22 vs. 2Q ’ 21 ( R$mm ) Total Expenses 2Q’22 YTD vs. 2Q ’ 21 YTD ( R$mm ) See notes and definitions at end of document 25 19 19 21 6 6 4 4 54 50 2Q'21 2Q'22 Bonus compensation Corporate center Segment Personnel expenses Other G&A 47 37 39 40 11 13 8 9 104 99 2Q'21 YTD 2Q'22 YTD Bonus compensation Corporate center Segment Personnel expenses Other G&A - 5% - 6%
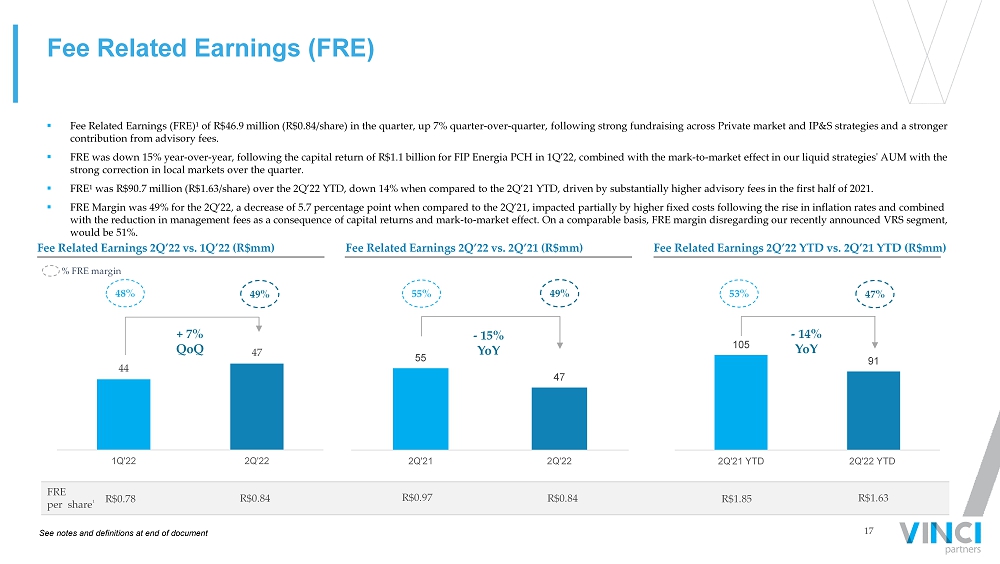
17 105 91 2Q'21 YTD 2Q'22 YTD 55 47 2Q'21 2Q'22 Fee Related Earnings (FRE) ▪ Fee Related Earnings (FRE)¹ of R$46.9 million (R$0.84/share) in the quarter, up 7% quarter - over - quarter, following strong fundra ising across Private market and IP&S strategies and a stronger contribution from advisory fees. ▪ FRE was down 15% year - over - year, following the capital return of R$1.1 billion for FIP Energia PCH in 1Q’22, combined with the mark - to - market effect in our liquid strategies' AUM with the strong correction in local markets over the quarter. ▪ FRE¹ was R$90.7 million (R$1.63/share) over the 2Q’22 YTD, down 14% when compared to the 2Q’21 YTD, driven by substantially h igh er advisory fees in the first half of 2021. ▪ FRE Margin was 49% for the 2Q’22, a decrease of 5.7 percentage point when compared to the 2Q’21, impacted partially by higher fi xed costs following the rise in inflation rates and combined with the reduction in management fees as a consequence of capital returns and mark - to - market effect. On a comparable basis, FRE margin disregarding our recently announced VRS segment, would be 51%. FRE per share ¹ R$0.78 R$0.84 R$1.85 R$1.63 4 9 % 55 % 47% 53% Fee Related Earnings 2Q’22 vs. 2Q’21 ( R$mm ) Fee Related Earnings 2Q’22 YTD vs. 2Q’21 YTD ( R$mm ) - 15% YoY - 14% YoY R$0.84 R$0.97 See notes and definitions at end of document Fee Related Earnings 2Q’22 vs. 1Q’22 ( R$mm ) 44 47 1Q'22 2Q'22 4 9 % 48 % + 7% QoQ % FRE margin

18 Performance Related Earnings (PRE) ▪ Performance related earnings (PRE)¹ of R$2.4 million (R$0.04/share) in the quarter, down 78% year - over - year. ▪ PRE¹ was R$4.6 million (R$0.08/share) over the 2Q’22 YTD , down 74% when compared to the 2Q’21 YTD. ▪ In the 2Q'21 the platform was positively impacted by an extraordinary performance coming from international exclusive mandate s i n IP&S, that although unrealized, impacted PRE results. Liquid strategies' funds haven't been able to charge significant levels of performance fees during 2022, mostly due to their hig h - watermark clause and the strong correction in local markets during the period. Performance Related Earnings 2Q ’ 22 vs. 2Q ’ 21 ( R$mm ) Performance Related Earnings 2Q’22 YTD vs. 2Q’21 YTD ( R$mm ) % PRE margin 63 % 58 % - 74% 65 % 61 % PRE per share¹ R$0.12 R$0.04 R$0.31 R$0.08 5 2 6 11 2 2Q'21 2Q'22 Realized Unrealized - 78% 11 4 6 0.4 17 5 2Q'21 YTD 2Q'22 YTD Realized Unrealized See notes and definitions at end of document

19 14 20 0.3 5 15 25 2Q'21 2Q'22 Realized Financial Income Realized GP Investment Income Realized GP Investment and Financial income ▪ Realized GP Investment¹ and Financial income² of R$25.0 million in the 2Q ’ 22, up 71% year - over - year, driven by realized gains in our liquid funds' portfolio. ▪ Realized GP Investment income of R$4.9 million in the quarter, coming primarily from dividend distributions of the company’s pro prietary stake in listed REITs. ▪ Realized GP Investment¹ and Financial income² accounted for R$52.0 million over the 2Q’22 YTD , up 169% when compared to the 2Q’ 21 YTD. See notes and definitions at end of document Realized GP Investment¹ and Financial income² 2Q ’ 22 vs 2Q ’ 21 ( R$mm ) Realized GP Investment¹ and Financial income² 2Q’22 YTD vs 2Q’21 YTD ( R$mm ) 19 45 7 19 52 2Q'21 YTD 2Q'22 YTD Realized Financial Income Realized GP Investment Income + 71% + 169%
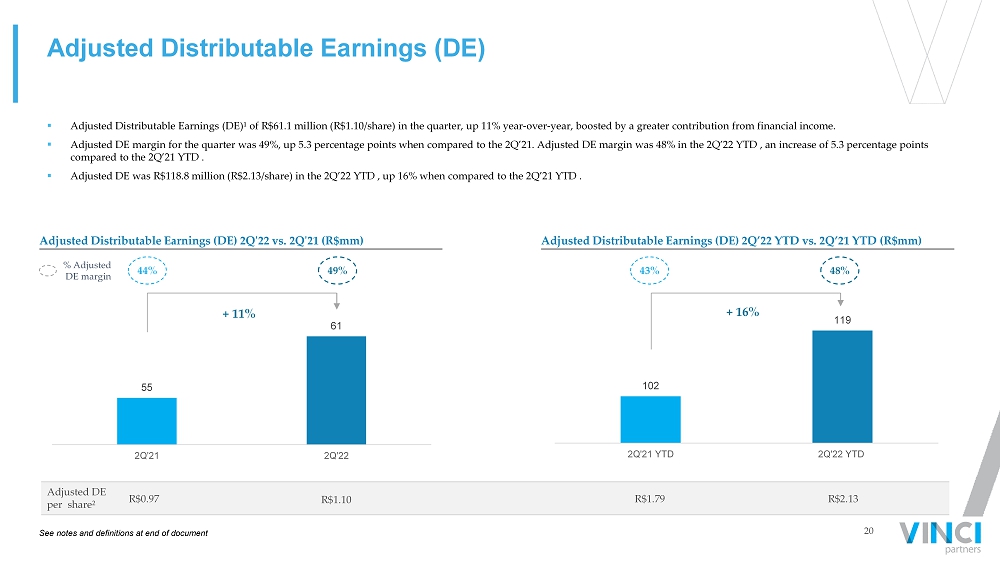
20 102 119 2Q'21 YTD 2Q'22 YTD 55 61 2Q'21 2Q'22 Adjusted Distributable Earnings (DE) ▪ Adjusted Distributable Earnings (DE)¹ of R$61.1 million (R$1.10/share) in the quarter, up 11% year - over - year, boosted by a great er contribution from financial income. ▪ Adjusted DE margin for the quarter was 49%, up 5.3 percentage points when compared to the 2Q’21. Adjusted DE margin was 48% i n t he 2Q’22 YTD , an increase of 5.3 percentage points compared to the 2Q’21 YTD . ▪ Adjusted DE was R$118.8 million (R$2.13/share) in the 2Q’22 YTD , up 16% when compared to the 2Q’21 YTD . Adjusted Distributable Earnings (DE) 2Q ' 22 vs. 2Q ' 21 ( R$mm ) Adjusted Distributable Earnings (DE) 2Q’22 YTD vs. 2Q’21 YTD ( R$mm ) Adjusted DE per share² + 11% % Adjusted DE margin 49% 44% R$0.97 R$1.10 + 16% 48 % 43% R$1.79 R$2.13 See notes and definitions at end of document

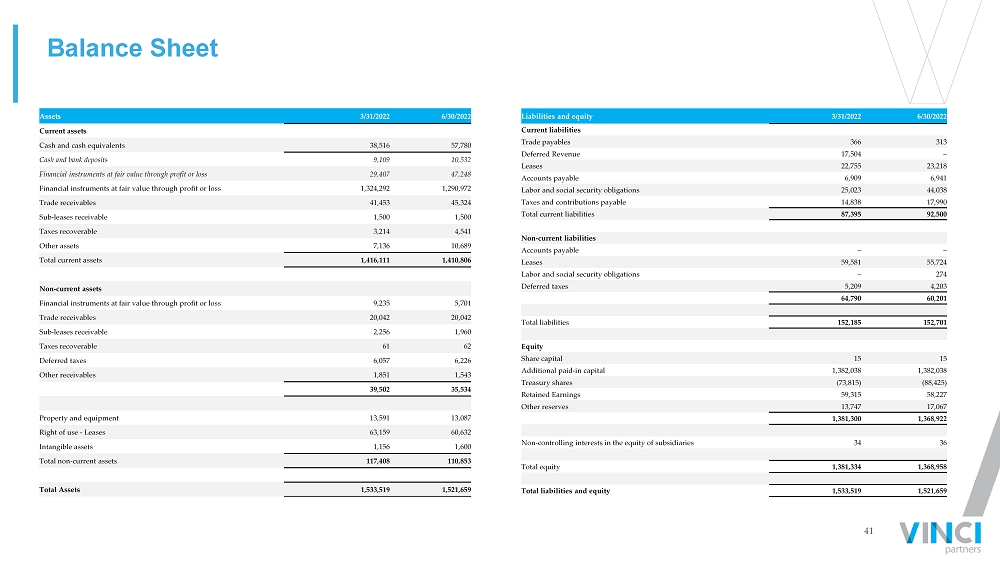
21 24.58 24.37 1Q'22 2Q'22 Cash and Net Investments per share 4 (R$/share) Share Repurchase Activity (in R$ million, unless mentioned) 1Q'22 2Q'22 Total Shares Repurchased (number of shares) 326,261 250,360 Total Capital Used for Share Repurchases 21.2 14.6 Remaining Share Repurchase Plan Authorization 5 11.2 56.4 Average Price Paid Per Share (US$) 12.3 11.7 (in R$ millions, unless mentioned) 1Q'22 2Q'22 Cash and cash equivalents¹ 38.5 57.8 Net Investments 1,333.5 1,296.7 Liquid funds² 1,074.9 1,245.0 GP Fund Investments³ 258.7 51.7 Cash and Net Investments 1,372.0 1,354.5 Cash and Net Investments per share 4 (R$/share) 24.58 24.37 Balance Sheet Highlights ▪ As of June 30, 2022, Vinci Partners had R$1.4 billion (R$24.37/share) in total cash and net investments, that comprise cash, cas h equivalents and net investments (liquid funds and GP fund investments at fair value). ▪ Vinci Partners repurchased 250,360 shares in the quarter with an average share price of US$11.7. As of June 30, 2022, the com pan y had R$56.4 million remaining in its current authorized share repurchase plan. See notes and definitions at end of document

Segment Highlights
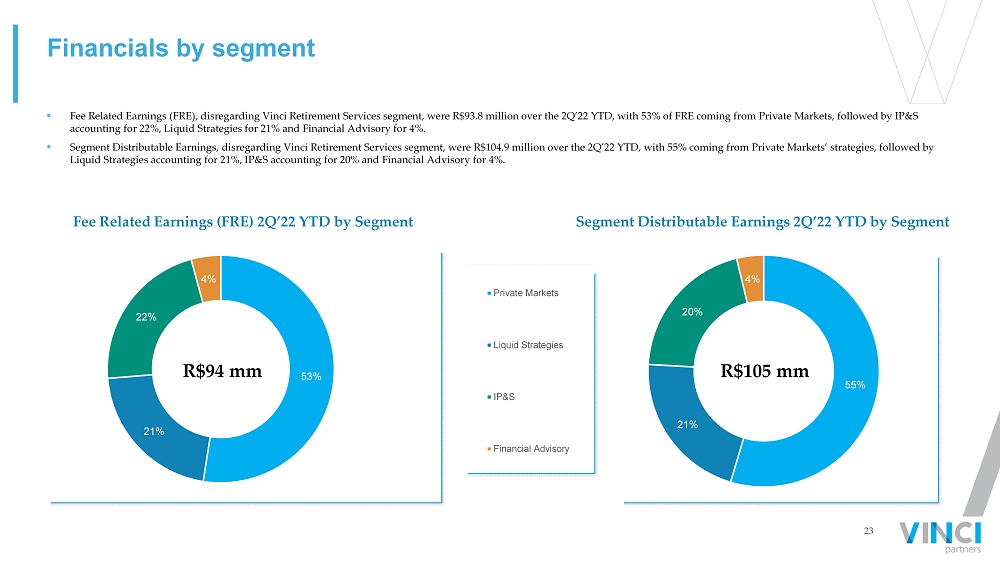
23 53% 21% 22% 4% Financials by segment ▪ Fee Related Earnings (FRE), disregarding Vinci Retirement Services segment, were R$93.8 million over the 2Q’22 YTD, with 53% of FRE coming from Private Markets, followed by IP&S accounting for 22%, Liquid Strategies for 21% and Financial Advisory for 4%. ▪ Segment Distributable Earnings, disregarding Vinci Retirement Services segment, were R$104.9 million over the 2Q’22 YTD, with 55 % coming from Private Markets’ strategies, followed by Liquid Strategies accounting for 21%, IP&S accounting for 20% and Financial Advisory for 4%. Segment Distributable Earnings 2Q’22 YTD by Segment Fee Related Earnings (FRE) 2Q’22 YTD by Segment R$94 mm R$105 mm 55% 21% 20% 4% Private Markets Liquid Strategies IP&S Financial Advisory

24 (R$ thousands, unless mentioned) 2Q'21 1Q'22 2Q'22 ∆ YoY (%) 2Q'21 YTD 2Q'22 YTD ∆ YTD (%) Net revenue from management fees 49,407 46,759 47,654 - 4% 95,988 94,413 - 2% Net revenue from advisory fees 2,641 467 275 - 90% 3,146 741 - 76% Total Fee Related Revenues 52,048 47,226 47,929 - 8% 99,134 95,154 - 4% Segment personnel expenses (2,722) (2,736) (2,923) 7% (5,160) (5,659) 10% Other G&A expenses (2,907) (2,755) (2,411) - 17% (5,232) (5,166) - 1% Corporate center expenses (9,792) (9,554) (10,827) 11% (20,376) (20,381) 0% Bonus compensation related to management and advisory (7,568) (7,307) (7,426) - 2% (15,299) (14,733) - 4% Total Fee Related Expenses (22,989) (22,352) (23,587) 3% (46,067) (45,939) 0% FEE RELATED EARNINGS (FRE) 29,059 24,874 24,342 - 16% 53,067 49,215 - 7% FRE Margin (%) 55.8% 52.7% 50.8% 53.5% 51.7% Net revenue from performance fees 1,792 640 1,719 - 4% 2,254 2,359 5% Realized performance fees 715 4 1,719 140% 755 1,723 128% Unrealized performance fees 1,077 636 – N/A 1,499 636 - 58% Performance based compensation (570) (226) (609) 7% (731) (835) 14% PERFORMANCE RELATED EARNINGS (PRE) 1,222 414 1,110 - 9% 1,523 1,524 0% PRE Margin (%) 68.2% 64.7% 64.6% 67.6% 64.6% ( - ) Unrealized performance fees (1,077) (636) – N/A (1,499) (636) - 58% (+) Unrealized performance compensation 382 225 – N/A 532 225 - 58% (+) Realized GP investment income 345 2,045 4,926 1328% 457 6,971 1425% SEGMENT DISTRIBUTABLE EARNINGS 29,931 26,922 30,377 1% 54,079 57,299 6% Segment DE Margin (%) 56.4% 54.6% 55.7% 53.9% 55.2% 2Q'21 ∆ (%) 2Q'22 2Q'21 YTD 2Q'22 YTD ASSETS UNDER MANAGEMENT (AUM R$millions) 20,762 21,041 23,998 16% 20,762 23,998 16% FEE EARNING ASSETS UNDER MANAGEMENT (FEAUM R$ millions) 18,873 19,192 20,722 10% 18,873 20,722 10% AVERAGE MANAGEMENT FEE RATE (%) 0.99% 0.92% 0.90% 0.98% 0.91% FULL TIME EMPLOYEES 50 50 46 - 8% 50 46 - 8% Private Equity 54% Real Estate 22% Credit 18% Infrastructure 6% Private Markets' AUM Private Markets R$24 bn AUM ▪ Fee related earnings (FRE) of R$24.3 million in the quarter, down 16% year - over - year, driven by a combination of FIP Energia PCH's capital return in the first quarter of 2022 and a one - off advisory fee contribution in Real Estate during the 2Q'21. FRE was R$49.2 million over the 2Q’22 YTD, a decrease of 7% when c omp ared to the 2Q’21 YTD. ▪ Segment Distributable Earnings of R$30.4 million in the quarter, up 1% year - over - year. Segment DE was R$57.3 million over the 2Q ’22 YTD, an increase of 6% when compared to the 2Q’21 YTD boosted by a higher contribution from GP investment income due to listed REITs dividends payout. ▪ Total AUM of R$24.0 billion at the end of the quarter, an increase of 16% year - over - year, driven by strong fundraising across Pr ivate Equity and Credit strategies. These fundraisings occurred in the latter part of the quarter and will start to impact management fee revenues from the third quarter onwards.

25 (R$ thousands, unless mentioned) 2Q'21 1Q'22 2Q'22 ∆ YoY (%) 2Q'21 YTD 2Q'22 YTD ∆ YTD (%) Net revenue from management fees 23,020 20,573 20,210 - 12% 43,003 40,783 - 5% Net revenue from advisory fees – – – N/A – – N/A Total Fee Related Revenues 23,020 20,573 20,210 - 12% 43,003 40,783 - 5% Segment personnel expenses (1,387) (1,384) (1,394) 1% (2,680) (2,778) 4% Other G&A expenses (681) (676) (780) 15% (1,305) (1,456) 12% Corporate center expenses (4,196) (4,203) (4,592) 9% (8,689) (8,795) 1% Bonus compensation related to management and advisory (3,893) (3,948) (3,922) 1% (7,312) (7,871) 8% Total Fee Related Expenses (10,157) (10,212) (10,688) 5% (19,986) (20,900) 5% FEE RELATED EARNINGS (FRE) 12,863 10,361 9,522 - 26% 23,017 19,883 - 14% FRE Margin (%) 55.9% 50.4% 47.1% 53.5% 48.8% Net revenue from performance fees 6,451 2,325 1,300 - 80% 8,460 3,625 - 57% Realized performance fees 6,451 2,325 1,300 - 80% 8,460 3,625 - 57% Unrealized performance fees – – – N/A – – N/A Performance based compensation (4,015) (722) (459) - 89% (4,718) (1,181) - 75% PERFORMANCE RELATED EARNINGS (PRE) 2,436 1,603 841 - 65% 3,742 2,444 - 35% PRE Margin (%) 37.8% 68.9% 64.7% 44.2% 67.4% ( - ) Unrealized performance fees – – – N/A – – N/A (+) Unrealized performance compensation – – – N/A – – N/A SEGMENT DISTRIBUTABLE EARNINGS 15,299 11,963 10,363 - 32% 26,759 22,327 - 17% Segment DE Margin (%) 51.9% 52.2% 48.2% 52.0% 50.3% ASSETS UNDER MANAGEMENT (AUM R$millions) 14,124 12,243 9,845 - 30% 14,124 9,845 - 30% FEE EARNING ASSETS UNDER MANAGEMENT (FEAUM R$millions) 13,965 12,104 9,708 - 30% 13,965 9,708 - 30% AVERAGE MANAGEMENT FEE RATE (%) 0.73% 0.74% 0.78% 0.70% 0.76% FULL TIME EMPLOYEES 24 21 22 - 8% 24 22 - 8% Public Equities 72% Hedge Funds 28% Liquid Strategies' AUM R$10 bn AUM Liquid Strategies ▪ Fee related earnings (FRE) of R$9.5 million in the quarter, down 26% year - over - year. FRE was R$19.9 million over the 2Q’22 YTD, a decrease of 14% compared to the 2Q’21 YTD, driven by the mark - to - market effect in liquid strategies' AUM during the second quarter, impacting management fee revenues. ▪ Performance related earnings (PRE) of R$0.8 million in the quarter, down 65% year - over - year. PRE was R$2.4 million over the 2Q’2 2 YTD, a decrease of 35% when compared to the 2Q’21 YTD. Liquid strategies' funds haven't been able to charge performance fees, mostly due to their high - watermark clause and the st rong correction in local markets during the period. ▪ Segment Distributable Earnings of R$10.4 million in the quarter, down 32% year - over - year. Segment Distributable Earnings was R$2 2.3 million over the 2Q’22 YTD, a decrease of 17% when compared to 2Q’21. ▪ AUM was R$9.8 billion at the end of the 2Q22. Liquid strategies' AUM has not suffered from significant outflows in the quarte r w hen compared to the outflows seen in the Brazilian asset manager industry during the quarter. Most of the decrease seen in liquid funds' AUM year - over - year comes from the mark - to - market effect following the depreciation in local markets.
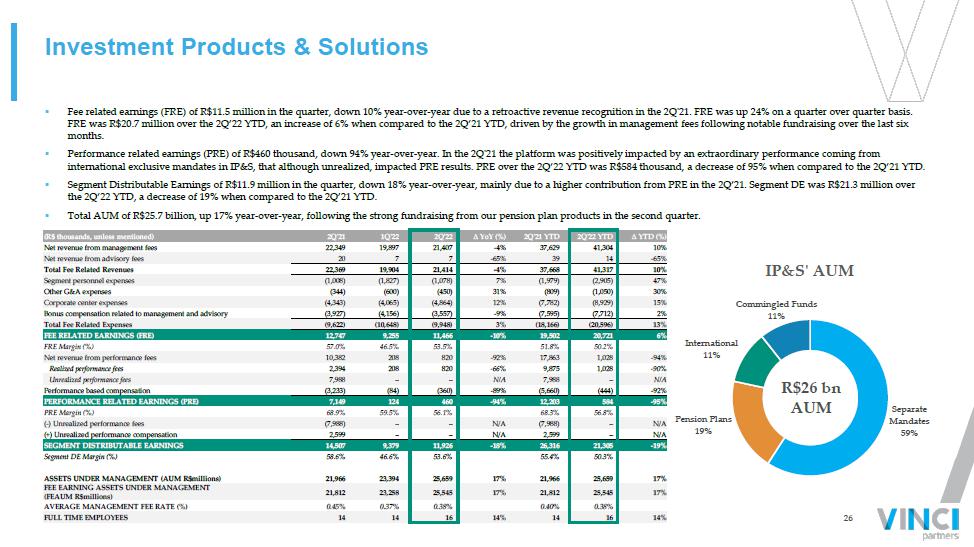
26 (R$ thousands, unless mentioned) 2Q'21 1Q'22 2Q'22 ∆ YoY (%) 2Q'21 YTD 2Q'22 YTD ∆ YTD (%) Net revenue from management fees 22,349 19,897 21,407 - 4% 37,629 41,304 10% Net revenue from advisory fees 20 7 7 - 65% 39 14 - 65% Total Fee Related Revenues 22,369 19,904 21,414 - 4% 37,668 41,317 10% Segment personnel expenses (1,008) (1,827) (1,078) 7% (1,979) (2,905) 47% Other G&A expenses (344) (600) (450) 31% (809) (1,050) 30% Corporate center expenses (4,343) (4,065) (4,864) 12% (7,782) (8,929) 15% Bonus compensation related to management and advisory (3,927) (4,156) (3,557) - 9% (7,595) (7,712) 2% Total Fee Related Expenses (9,622) (10,648) (9,948) 3% (18,166) (20,596) 13% FEE RELATED EARNINGS (FRE) 12,747 9,255 11,466 - 10% 19,502 20,721 6% FRE Margin (%) 57.0% 46.5% 53.5% 51.8% 50.2% Net revenue from performance fees 10,382 208 820 - 92% 17,863 1,028 - 94% Realized performance fees 2,394 208 820 - 66% 9,875 1,028 - 90% Unrealized performance fees 7,988 – – N/A 7,988 – N/A Performance based compensation (3,233) (84) (360) - 89% (5,660) (444) - 92% PERFORMANCE RELATED EARNINGS (PRE) 7,149 124 460 - 94% 12,203 584 - 95% PRE Margin (%) 68.9% 59.5% 56.1% 68.3% 56.8% ( - ) Unrealized performance fees (7,988) – – N/A (7,988) – N/A (+) Unrealized performance compensation 2,599 – – N/A 2,599 – N/A SEGMENT DISTRIBUTABLE EARNINGS 14,507 9,379 11,926 - 18% 26,316 21,305 - 19% Segment DE Margin (%) 58.6% 46.6% 53.6% 55.4% 50.3% ASSETS UNDER MANAGEMENT (AUM R$millions) 21,966 23,394 25,659 17% 21,966 25,659 17% FEE EARNING ASSETS UNDER MANAGEMENT (FEAUM R$millions) 21,812 23,258 25,545 17% 21,812 25,545 17% AVERAGE MANAGEMENT FEE RATE (%) 0.45% 0.37% 0.38% 0.40% 0.38% FULL TIME EMPLOYEES 14 14 16 14% 14 16 14% Investment Products & Solutions ▪ Fee related earnings (FRE) of R$11.5 million in the quarter, down 10% year - over - year due to a retroactive revenue recognition in the 2Q'21. FRE was up 24% on a quarter over quarter basis. FRE was R$20.7 million over the 2Q’22 YTD, an increase of 6% when compared to the 2Q’21 YTD, driven by the growth in manageme nt fees following notable fundraising over the last six months. ▪ Performance related earnings (PRE) of R$460 thousand, down 94% year - over - year. In the 2Q'21 the platform was positively impacted by an extraordinary performance coming from international exclusive mandates in IP&S, that although unrealized, impacted PRE results. PRE over the 2Q’22 YTD was R$584 th ous and, a decrease of 95% when compared to the 2Q’21 YTD. ▪ Segment Distributable Earnings of R$11.9 million in the quarter, down 18% year - over - year, mainly due to a higher contribution fr om PRE in the 2Q’21. Segment DE was R$21.3 million over the 2Q’22 YTD, a decrease of 19% when compared to the 2Q’21 YTD. ▪ Total AUM of R$25.7 billion, up 17% year - over - year, following the strong fundraising from our pension plan products in the secon d quarter. R$26 bn AUM Separate Mandates 59% Pension Plans 19% International 11% Commingled Funds 11% IP&S ' AUM
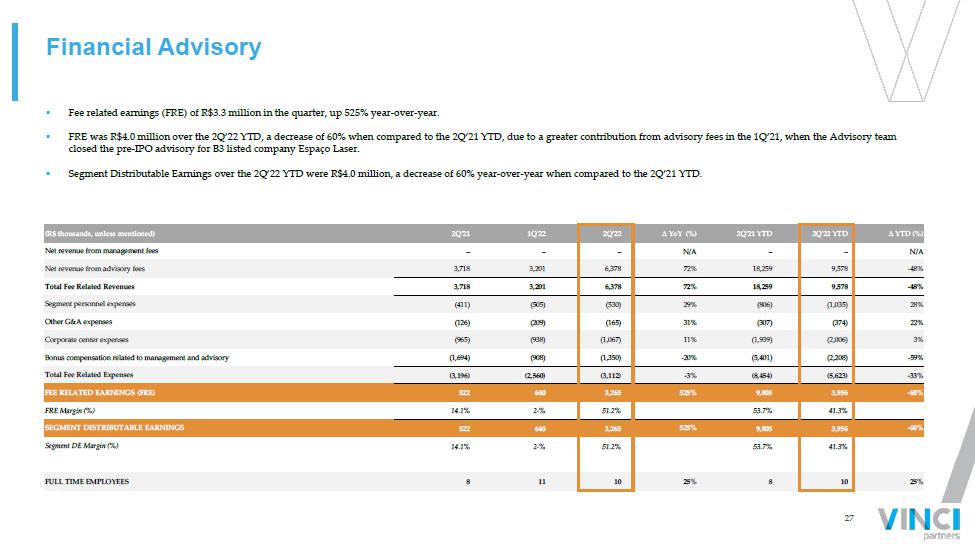
27 Financial Advisory ▪ Fee related earnings (FRE) of R$3.3 million in the quarter, up 525% year - over - year. ▪ FRE was R$4.0 million over the 2Q’22 YTD, a decrease of 60% when compared to the 2Q’21 YTD, due to a greater contribution fro m a dvisory fees in the 1Q’21, when the Advisory team closed the pre - IPO advisory for B3 listed company Espaço Laser. ▪ Segment Distributable Earnings over the 2Q’22 YTD were R$4.0 million, a decrease of 60% year - over - year when compared to the 2Q’2 1 YTD. (R$ thousands, unless mentioned) 2Q'21 1Q'22 2Q'22 ∆ YoY (%) 2Q'21 YTD 2Q'22 YTD ∆ YTD (%) Net revenue from management fees – – – N/A – – N/A Net revenue from advisory fees 3,718 3,201 6,378 72% 18,259 9,578 - 48% Total Fee Related Revenues 3,718 3,201 6,378 72% 18,259 9,578 - 48% Segment personnel expenses (411) (505) (530) 29% (806) (1,035) 28% Other G&A expenses (126) (209) (165) 31% (307) (374) 22% Corporate center expenses (965) (938) (1,067) 11% (1,939) (2,006) 3% Bonus compensation related to management and advisory (1,694) (908) (1,350) - 20% (5,401) (2,208) - 59% Total Fee Related Expenses (3,196) (2,560) (3,112) - 3% (8,454) (5,623) - 33% FEE RELATED EARNINGS (FRE) 522 640 3,265 525% 9,805 3,956 - 60% FRE Margin (%) 14.1% 2 - % 51.2% 53.7% 41.3% SEGMENT DISTRIBUTABLE EARNINGS 522 640 3,265 525% 9,805 3,956 - 60% Segment DE Margin (%) 14.1% 2 - % 51.2% 53.7% 41.3% FULL TIME EMPLOYEES 8 11 10 25% 8 10 25%

28 (R$ thousands, unless mentioned) 2Q'21 1Q'22 2Q'22 ∆ YoY (%) 2Q'21 YTD 2Q'22 YTD ∆ YTD (%) Net revenue from management fees – – – – – – – Net revenue from advisory fees – – – – – – – Total Fee Related Revenues – – – – – – – Segment personnel expenses – (97) (308) N/A – (405) – Other G&A expenses – (263) (372) N/A – (635) – Corporate center expenses – – – N/A – – – Bonus compensation related to management and advisory – (1,002) (1,012) N/A – (2,014) – Total Fee Related Expenses – (1,362) (1,692) N/A – (3,054) – FEE RELATED EARNINGS (FRE) – (1,362) (1,692) N/A – (3,054) – FRE Margin (%) – – – – – – – Net revenue from performance fees – – – – – – – Realized performance fees – – – – – – – Unrealized performance fees – – – – – – – Performance based compensation – – – – – – – PERFORMANCE RELATED EARNINGS (PRE) – – – – – – – PRE Margin (%) – – – – – – – ( - ) Unrealized performance fees – – – – – – – (+) Unrealized performance compensation – – – – – – – SEGMENT DISTRIBUTABLE EARNINGS – (1,362) (1,692) N/A – (3,054) – Segment DE Margin (%) – – – – – – – 1Q'22 2Q'22 – 2Q'21 YTD 2Q'22 YTD – ASSETS UNDER MANAGEMENT (AUM R$millions) – – – – – – – FULL TIME EMPLOYEES – 3 5 – – 5 – Retirement Services ▪ Fee Related Earnings (FRE) of negative R$1.7 million in the quarter. FRE was negative R$3.1 million in the 2Q’22 YTD. ▪ VRS is within investment period and products are expected to be launched in 2023. We are separating this segment from others bec ause we believe it could be a relevant tech enabled vertical in the future.

Supplement Details

30 AUM and Fee - Earning AUM Rollforward Assets Under Management (AUM) – R$ millions Fee - Earning Assets Under Management (FEAUM) – R$ millions For the Three Months Ended June 30, 2022 For the Three Months Ended June 30, 2022 For the Twelve Months Ended June 30, 2022 For the Twelve Months Ended June 30, 2022 Private Public IP&S Infrastructure Real Estate Credit Hedge Total Equity Equities Funds Beginning balance 11,025 9,333 23,394 1,493 5,317 3,206 2,910 56,677 (+/ - ) Capital Subscription / (capital return) 1,888 – – 11 (113) 958 – 2,744 (+) Capital Subscription 1,898 – – 11 – 994 – 2,904 ( - ) Capital Return (11) – – – (113) (36) – (160) (+/ - ) Net Inflow / (outflow) – (646) 2,448 – 16 29 (116) 1,731 (+/ - ) Appreciation / (depreciation) 100 (1,622) (182) (45) (12) 124 (14) (1,651) Ending Balance 13,013 7,064 25,659 1,460 5,208 4,318 2,781 59,502 Private Public IP&S Infrastructure Real Estate Credit Hedge Total Equity Equities Funds Beginning balance 10,851 10,861 21,966 2,363 5,087 2,461 3,263 56,852 (+/ - ) Capital Subscription / (capital return) 2,103 – 203 (900) 296 1,053 – 2,755 (+) Capital Subscription 2,116 – 203 288 619 1,160 – 4,386 ( - ) Capital Return (13) – – (1,188) (323) (107) – (1,631) (+/ - ) Net Inflow / (outflow) – (1,289) 3,658 – 123 499 (498) 2,492 (+/ - ) Appreciation / (depreciation) 58 (2,508) (168) (3) (298) 305 16 (2,597) Ending Balance 13,013 7,064 25,659 1,460 5,208 4,318 2,781 59,502 Private Public IP&S Infrastructure Real Estate Credit Hedge Total Equity Equities Funds Beginning balance 9,236 9,267 23,258 1,433 5,317 3,206 2,838 54,553 (+/ - ) Capital Subscription / (capital return) 593 – – 11 (113) 958 – 1,449 (+) Capital Subscription 603 – – 11 – 994 – 1,609 ( - ) Capital Return (11) – – – (113) (36) – (160) (+/ - ) Net Inflow / (outflow) – (643) 2,468 – 16 29 (116) 1,755 (+/ - ) Appreciation / (depreciation) (31) (1,622) (181) (45) (12) 124 (16) (1,783) Ending Balance 9,797 7,002 25,545 1,399 5,208 4,318 2,706 55,975 Private Public IP&S Infrastructure Real Estate Credit Hedge Total Equity Equities Funds Beginning balance 9,066 10,765 21,812 2,259 5,087 2,461 3,200 54,650 (+/ - ) Capital Subscription / (capital return) 808 – 203 (850) 296 1,053 – 1,510 (+) Capital Subscription 821 – 203 288 619 1,160 – 3,091 ( - ) Capital Return (13) – – (1,138) (323) (107) – (1,581) (+/ - ) Net Inflow / (outflow) – (1,285) 3,686 – 123 499 (502) 2,520 (+/ - ) Appreciation / (depreciation) (77) (2,479) (155) (10) (298) 305 8 (2,706) Ending Balance 9,797 7,002 25,545 1,399 5,208 4,318 2,706 55,975

31 Investment records – IP&S, Liquid Strategies, Credit and Listed Funds Fund Segment NAV¹ (R$ millions) 2Q22 YTD 12 M 24 M Market Comparison Index Rate Vinci Multiestratégia FIM Hedge Funds 490.5 2.2% 5.4% 7.7% 9.2% CDI 4 CDI 4 Atlas Strategy² Hedge Funds 490.2 0.5% 4.8% 0.4% 0.9% CDI 4 CDI 4 Vinci Total Return Hedge Funds 241.0 - 12.5% - 4.5% - 10.5% 33.2% IPCA 5 + Yield IMA - B 7 IPCA 5 + Yield IMA - B 7 Mosaico Strategy Public Equities 951.1 - 18.5% - 8.9% - 24.6% - 3.0% IBOV 5 IBOV 5 Vinci Gas Dividendos FIA Public Equities 469.9 - 15.1% - 1.9% - 15.5% 7.5% IBOV 5 IBOV 5 Vinci Valorem FIM IP&S 3,066.5 2.9% 7.3% 9.7% 15.4% IMA - B 5 7 IMA - B 5 7 Equilibrio Strategy³ IP&S 2,070.7 2.7% 7.4% 8.9% 15.9% IPCA 6 - Vinci Selection Equities FIA IP&S 634.3 - 13.7% - 5.6% - 21.6% 0.3% IBOV 5 IBOV 5 Vinci Crédito Imobiliário I Credit 257.1 3,16% 7.79% 7,79% 16,39% IPCA 6 IPCA 6 +7.785% Vinci Crédito Imobiliário II Credit 636.9 1,55% 4.71% 4,52% 11,52% IPCA 6 IPCA 6 + 6% Vinci Crédito Estruturado Multiestrategia Plus FIC FIM Credit 125.0 3,36% 6.16% 11,00% 16,43% CDI 4 CDI 4 Vinci Energia Sustentável Credit 614.0 2,33% 1.30% 3,58% 13,55% IPCA 6 IPCA 6 + 6% Vinci Crédito Multiestratégia Credit 308.2 3,35% 6.80% 12,91% - CDI 4 IPCA 6 + 5% VISC11 Real Estate (listed REIT) 1,774.9 3.2% 1.8% 1.9% 9.3% IFIX 8 IPCA 6 + 6% VILG11 Real Estate (listed REIT) 1,421.8 - 2.1% - 5.7% - 5.3% - 9.4% IFIX 8 IPCA 6 + 6% VINO11 Real Estate (listed REIT) 725.4 - 9.9% - 18.7% - 17.5% - 8.8% IFIX 8 IPCA 6 + 6% VIFI11 Real Estate (listed REIT) 55.6 - 1.9% - 4.6% - 9.3% - 17.1% IFIX 8 IFIX 8 VIUR11 Real Estate (listed REIT) 191.3 0.5% - 2.7% - 12.6% - IFIX 8 IPCA 6 + 6% VIGT11 Infrastructure (listed) 595.5 - 4.7% - 6.4% - 4.0% - 22.7% - - VINCI FOF IMOBILIARIO FIM CP Real Estate (REIT) 11.0 2.0% 3.8% - - IFIX 8 IFIX 8 Benchmark 2Q22 YTD 12 M 24 M IBOV 5 - 18.1% - 6.0% - 22.3% 3.7% CDI 4 3.0% 5.4% 8.7% 11.1% IMA - B 5 7 2.7% 6.6% 10.1% 16.7% IPCA 6 + Yield IMA - B 7 4.2% 7.4% 16.0% 28.6% IPCA 6 2.3% 5.5% 11.9% 21.2% IFIX 8 0.6% - 0.3% 1.5% - 0.4%

32 Pro Forma Historical Portfolio Performance - Excluding PIPE Investments¹ Investment records – Closed End Private Markets funds Fund Segment Vintage year Committed Capital Invested Capital Realized or Unrealized Total Value Gross MOIC Gross MOIC Gross IRR Gross IRR Partially Realized (R$mm) (R$mm) (R$mm) (R$mm) (R$mm) (BRL) (USD) (BRL) (USD) Fund 1 Private Equity 2004 1,415 1,206 5,058 229 5,287 4.4x 4.0x 71.5% 77.2% VCP II Private Equity 2011 2,200 1,805 1,844 2,390 4,234 2.3x 1.2x 12.6% 2.8% VCP III Private Equity 2018 4,000 1,825 34 2,910 2,944 1.6x 1.6x 48.6% 42.0% VCP Strategy² Private Equity 7,615 4,835 6,936 5,529 12,465 2.6x 2.3x 64.8% 70.3% NE Empreendedor Private Equity 2003 36 13 26 – 26 2.1x 2.6x 22.0% 30.5% Nordeste III Private Equity 2017 240 134 75 139 214 1.6x 1.4x 20.7% 13.5% VIR IV Private Equity 2020 1,000 189 4 202 205 1.1x 1.2x 14.1% 37.5% VIR Strategy³ Private Equity 1,276 336 105 340 446 1.3x 1.2x 22.1% 27.8% FIP Transmissão 4 Infrastructure 2017 211 104 241 161 401 3.9x 3.0x 69.4% 53.5% VIAS 5 Infrastructure 2021 386 350 – 350 350 1.0x 1.1x NM NM VFDL 6 Real Estate 2021 422 83 – 103 103 1.2x 1.8x 44.5% 46.5%

33 Shareholder Dividends ($ in thousands) 1H21 3Q ' 21 4Q'21 1Q'22 2Q'22 Distributable Earnings (R$) 101,976 61,743 68,515 53,255 60,435 Distributable Earnings (US$)¹ 19,397 11,377 13,637 10,615 11,795 DE per Common Share (US$)² 0.34 0.20 0.24 0.19 0.21 Actual Dividend per Common Share³ 0.30 0.16 0.20 0.17 0.17 Record Date September 01,2021 December 01,2021 March 10, 2022 May 24, 2022 August 25, 2022 Payable Date September 16, 2021 December 16,2021 March 24, 2022 June 08, 2022 September 09,2022 ▪ Vinci Partners generated R$1.09 or US$0.21¹ of Distributable Earnings per common share for the second quarter of 2022. ▪ The company declared a quarterly dividend of US$0.17² per common share to record holders as of August 25, 2022; payable on Se pte mber 09 , 2022.
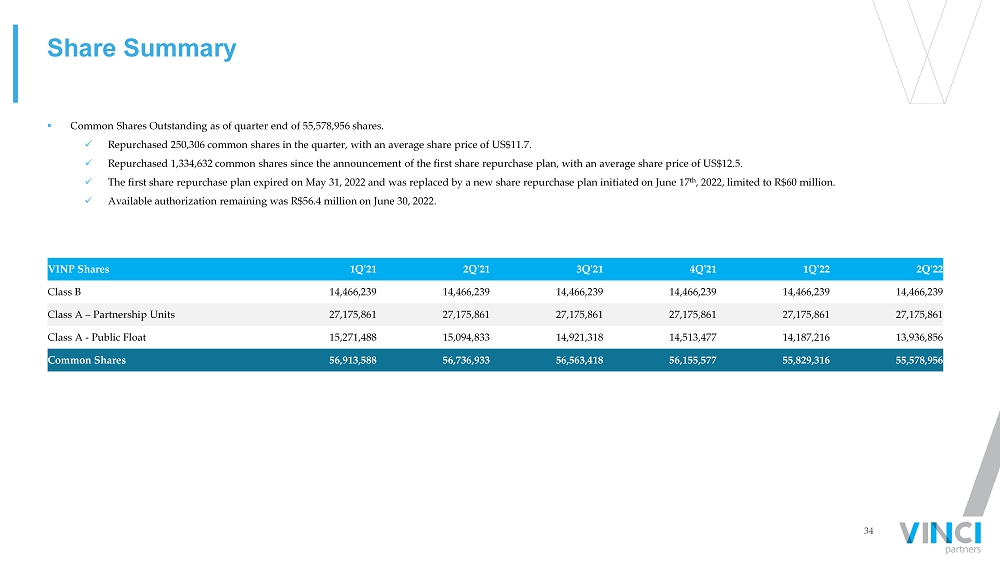
34 Share Summary ▪ Common Shares Outstanding as of quarter end of 55,578,956 shares. x Repurchased 250,306 common shares in the quarter, with an average share price of US$11.7. x Repurchased 1,334,632 common shares since the announcement of the first share repurchase plan, with an average share price of US $12.5. x The first share repurchase plan expired on May 31, 2022 and was replaced by a new share repurchase plan initiated on June 17 th , 2022, limited to R$60 million. x Available authorization remaining was R$56.4 million on June 30, 2022. VINP Shares 1Q ' 21 2Q ' 21 3Q ' 21 4Q'21 1Q'22 2Q'22 Class B 14,466,239 14,466,239 14,466,239 14,466,239 14,466,239 14,466,239 Class A – Partnership Units 27,175,861 27,175,861 27,175,861 27,175,861 27,175,861 27,175,861 Class A - Public Float 15,271,488 15,094,833 14,921,318 14,513,477 14,187,216 13,936,856 Common Shares 56,913,588 56,736,933 56,563,418 56,155,577 55,829,316 55,578,956

35 GP Commitment in Private Market funds ▪ As of June 30, 2022, the company had R$928.9 million in capital commitments signed to proprietary Private Markets funds. ▪ During the second quarter of 2022, the company signed R$ 537.4 million in capital commitments to proprietary Private Markets fun ds. ▪ Total GP Investments marked at fair value of R$278.9 million as of June 30, 2022. (R$ millions, unless mentioned) Segment 2Q’22 Commitments Total Capital Committed 2Q’22 Capital Called Total Capital Called Capital Returned/ Dividends Payed (2Q'22) Accumulated Capital Returned/Dividends Payed Fair value of investments Nordeste III Private Equity - 5.0 - 3.1 - 1.3 2.8 VCP III Private Equity - 3.1 0.4 2.1 - - 2.9 VIR IV Private Equity - 11.1 0.2 3.1 - 0.1 2.8 VCP IV Private Equity 350.0 350.0 - - - - - FIP Infra Transmissão (co - investment)¹ Infrastructure - 29.5 - 8.9 - 19.7 12.6 FIP Infra Transmissão¹ Infrastructure - 10.5 - 3.4 - 6.2 3.6 VIAS Infrastructure - 50.0 - 27.8 - - 27.0 Vinci Transporte e Logística II Infrastructure 15.0 15.0 - - - - - Vinci Transporte e Logística I Infrastructure 11.4 11.4 6.3 6.3 - - 6.3 VFDL Real Estate - 70.0 3.5 17.5 - - 20.3 VIUR Real Estate - 67.3 - 67.3 1.5 6.1 48.3 VINO Real Estate - 50.0 - 50.0 0.9 1.6 40.0 Vinci FOF Imobiliário Real Estate - 10.0 - 10.0 - - 7.0 VCRI (VCS) Credit - 80.0 - 80.0 2.5 2.5 79.1 Vinci Crédito Agro Imobiliário Credit 16.0 16.0 16.0 16.0 - - 16.3 Vinci Credit Infra Credit 100.0 100.0 - - - - - VSP FIM IP&S 45.0 50.0 2.2 2.2 - - 10.0 Total 537.4 928.9 28.6 297.6 4.9 37.5 278.9

Reconciliations and Disclosures
37 (R$ thousands, unless mentioned) 2Q'21 1Q'22 2Q'22 ∆ YoY(%) 2Q'21 YTD 2Q'22 YTD ∆ YTD (%) REVENUES Net revenue from management fees 94,778 87,229 89,271 - 6% 176,621 176,500 0% Net revenue from performance fees 18,624 3,172 3,839 - 79% 28,575 7,011 - 75% Realized performance fees 9,559 2,536 3,839 - 60% 19,088 6,375 - 67% Unrealized performance fees 9,065 636 - N/A 9,487 636 - 93% Net revenue from advisory 6,378 3,674 6,659 4% 21,444 10,333 - 52% Total net revenues from services rendered 119,780 94,075 99,769 - 17% 226,640 193,844 - 14% EXPENSES Bonus related to management and advisory¹ (17,082) (17,272) (17,267) 1% (35,608) (34,539) - 3% Performance based compensation² (7,817) (1,032) (1,427) - 82% (11,109) (2,459) - 78% Realized (4,837) (807) (1,427) - 71% (7,979) (2,234) - 72% Unrealized (2,980) (225) - N/A (3,130) (225) - 93% Total compensation and benefits (24,899) (18,303) (18,694) - 25% (46,717) (36,998) - 21% Segment personnel expenses (5,528) (6,549) (6,233) 13% (10,625) (12,782) 20% Other general and administrative expenses (4,058) (4,503) (4,178) 3% (7,632) (8,681) 14% Corporate center expenses (19,296) (18,761) (21,350) 11% (38,808) (40,111) 3% Total expenses (53,781) (48,116) (50,455) - 6% (103,783) (98,571) - 5% Operating profit 65,999 45,959 49,314 - 25% 122,857 95,273 - 22% OTHER ITEMS GP Investment income (5,206) (4,169) (7,211) 39% (4,045) (11,380) 181% Realized gain from GP investment income 345 2,045 4,926 1,328% 457 6,971 1,425% Unrealized gain from GP investment income (5,551) (6,214) (12,137) 119% (4,502) (18,351) 308% Financial income 14,152 24,708 21,193 50% 18,649 45,901 146% Realized gain from financial income 14,239 24,996 20,001 40% 18,883 44,997 138% Unrealized gain from financial income (87) (288) 1,192 N/A (234) 904 N/A Leasing expenses (3,106) (2,472) (2,400) - 23% (6,263) (4,872) - 22% Other items (2,120) (1,136) 644 N/A (1,234) (492) - 60% Share Based Plan (1,642) (736) (2,468) 50% (1,642) (3,204) 95% Non - recurring expenses³ – (5,109) (962) N/A - (6,071) N/A Total Other Items 2,078 11,086 8,796 323% 5,465 19,882 264% Profit before income taxes 4 68,077 57,045 58,109 - 15% 128,322 115,154 - 10% ( - ) Income taxes 5 (14,671) (11,739) (11,711) - 20% (27,903) (23,450) - 16% NET INCOME 53,406 45,306 46,398 - 13% 100,419 91,704 - 9% (+) Non - recurring expenses including income tax related to realized expense - 4,437 635 N/A - 5,072 N/A ADJUSTED NET INCOME 53,406 49,742 47,034 - 12% 100,419 96,776 - 4% Financials - Income Statement (Unaudited) See notes and definitions at end of document

38 (R$ thousands, unless mentioned) 2Q'21 1Q'22 2Q'22 2Q'21 YTD 2Q'22 YTD OPERATING PROFIT 65,999 45,959 49,314 122,857 95,273 ( - ) Net revenue from realized performance fees (9,559) (2,536) (3,839) (19,088) (6,375) ( - ) Net revenue from unrealized performance fees (9,065) (636) – (9,487) (636) (+) Compensation allocated in relation to performance fees¹ 7,817 1,032 1,427 11,109 2,459 FEE RELATED EARNINGS (FRE) 55,192 43,818 46,902 105,391 90,720 OPERATING PROFIT 65,999 45,959 49,314 122,857 95,273 ( - ) Net revenue from management fees (94,778) (87,229) (89,271) (176,621) (176,500) ( - ) Net revenue from advisory (6,378) (3,674) (6,659) (21,444) (10,333) (+) Bonus related to management and advisory² 17,082 17,272 17,267 35,608 34,539 (+) Personnel expenses 5,528 6,549 6,233 10,625 12,782 (+) Other general and administrative expenses 4,058 4,503 4,178 7,632 8,681 (+) Corporate center expenses 19,296 18,761 21,350 38,808 40,111 PERFORMANCE RELATED EARNINGS (PRE) 10,807 2,140 2,412 17,466 4,552 OPERATING PROFIT 65,999 45,959 49,314 122,857 95,273 ( - ) Net revenue from unrealized performance fees (9,065) (636) – (9,487) (636) (+) Compensation allocated in relation to unrealized performance fees 2,980 225 – 3,130 225 (+) Realized gain from GP investment income 345 2,045 4,926 457 6,971 SEGMENT DISTRIBUTABLE EARNINGS 60,259 47,593 54,240 116,958 101,833 NET INCOME 53,406 45,306 46,398 100,419 91,704 ( - ) Net revenue from unrealized performance fees (9,065) (636) – (9,487) (636) (+) Income tax from unrealized performance fees 124 73 – 173 73 (+) Compensation allocated in relation to unrealized performance fees 2,980 225 – 3,130 225 ( - ) Unrealized gain from GP investment income 5,551 6,214 12,137 4,502 18,351 (+) Income tax on unrealized gain from GP investment income (838) – (55) (422) (55) ( - ) Unrealized gain from financial income 87 288 (1,192) 234 (904) (+) Income tax on unrealized gain from financial income (32) 65 (65) (80) – (+) Depreciation and amortization 926 984 976 1,865 1,960 (+) Share Based Plan 1,642 736 2,468 1,642 3,204 ( - ) Income Taxes on Share Based Plan – – (233) – (233) (+) Non - recurring expenses including income tax related to realized expense – 4,437 635 – 5,072 ADJUSTED DISTRIBUTABLE EARNINGS 54,781 57,692 61,070 101,976 118,762 TOTAL NET REVENUE FROM SERVICES RENDERED 119,780 94,075 99,769 226,640 193,844 ( - ) Net revenue from realized performance fees (9,559) (2,536) (3,839) (19,088) (6,375) ( - ) Net revenue from unrealized performance fees (9,065) (636) – (9,487) (636) NET REVENUE FROM MANAGEMENT FEES AND ADVISORY 101,156 90,903 95,930 198,065 186,833 Financials - Non - GAAP Reconciliation See notes and definitions at end of document
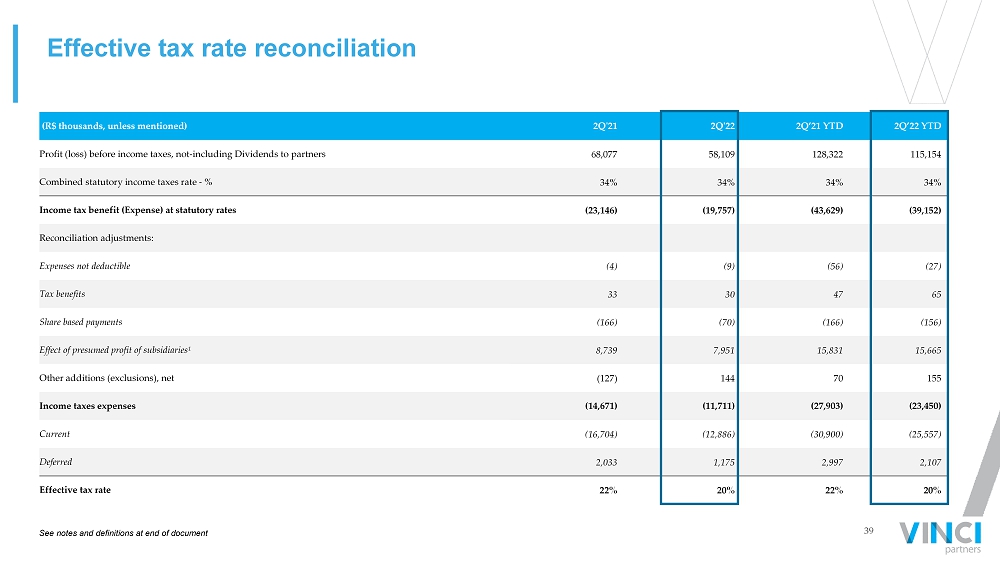
39 Effective tax rate reconciliation See notes and definitions at end of document (R$ thousands, unless mentioned) 2Q'21 2Q'22 2Q’21 YTD 2Q’22 YTD Profit (loss) before income taxes, not - including Dividends to partners 68,077 58,109 128,322 115,154 Combined statutory income taxes rate - % 34% 34% 34% 34% Income tax benefit (Expense) at statutory rates (23,146) (19,757) (43,629) (39,152) Reconciliation adjustments: Expenses not deductible (4) (9) (56) (27) Tax benefits 33 30 47 65 Share based payments (166) (70) (166) (156) Effect of presumed profit of subsidiaries¹ 8,739 7,951 15,831 15,665 Other additions (exclusions), net (127) 144 70 155 Income taxes expenses (14,671) (11,711) (27,903) (23,450) Current (16,704) (12,886) (30,900) (25,557) Deferred 2,033 1,175 2,997 2,107 Effective tax rate 22% 20% 22% 20%
40 13.7 17.1 7.8 8.9 0.9 2.4 3.0 General and Administrative Expenses 2Q 2021 (R$mm) 2Q 2022 (R$mm) Lease and condominium Other Personnel Bonus related to Mgmt. and Adv. fees Performance based compensation Third party expenses D&A R$53.8 mm Personnel Bonus related to Mgmt. and Adv. fees Performance based compensation Third party expenses D&A Lease and condominium Other R$50.5 mm - 6% 16.0 17.3 1.4 8.9 1.0 2.7 3.1
41 Balance Sheet Assets 3/31/2022 6/30/2022 Current assets Cash and cash equivalents 38,516 57,780 Cash and bank deposits 9,109 10,532 Financial instruments at fair value through profit or loss 29,407 47,248 Financial instruments at fair value through profit or loss 1,324,292 1,290,972 Trade receivables 41,453 45,324 Sub - leases receivable 1,500 1,500 Taxes recoverable 3,214 4,541 Other assets 7,136 10,689 Total current assets 1,416,111 1,410,806 Non - current assets Financial instruments at fair value through profit or loss 9,235 5,701 Trade receivables 20,042 20,042 Sub - leases receivable 2,256 1,960 Taxes recoverable 61 62 Deferred taxes 6,057 6,226 Other receivables 1,851 1,543 39,502 35,534 Property and equipment 13,591 13,087 Right of use - Leases 63,159 60,632 Intangible assets 1,156 1,600 Total non - current assets 117,408 110,853 Total Assets 1,533,519 1,521,659 Liabilities and equity 3/31/2022 6/30/2022 Current liabilities Trade payables 366 313 Deferred Revenue 17,504 – Leases 22,755 23,218 Accounts payable 6,909 6,941 Labor and social security obligations 25,023 44,038 Taxes and contributions payable 14,838 17,990 Total current liabilities 87,395 92,500 Non - current liabilities Accounts payable – – Leases 59,581 55,724 Labor and social security obligations – 274 Deferred taxes 5,209 4,203 64,790 60,201 Total liabilities 152,185 152,701 Equity Share capital 15 15 Additional paid - in capital 1,382,038 1,382,038 Treasury shares (73,815) (88,425) Retained Earnings 59,315 58,227 Other reserves 13,747 17,067 1,381,300 1,368,922 Non - controlling interests in the equity of subsidiaries 34 36 Total equity 1,381,334 1,368,958 Total liabilities and equity 1,533,519 1,521,659
42 Notes and Definitions ▪ Notes to page 5 (1) AUM is calculated as consolidated with double counting, due to funds from one segment investing in other segments and it ´ s eliminated on consolidation and excluding double counting from co - managed funds between our segments. (2) Adjusted Distributable Earnings is calculated as Distributable Earnings excluding non - recurring expenses. (3) LTM Dividend Yield is calculated considering 0.70 dividend/share for LTM and US$11.07/share as of August 10 th ,2022. ▪ Notes to page 7 (1) Bonus compensation related to management and advisory includes Dividends to Partners related to management and advisory, dis tributed by the company to its original partners before the company turned public in 2021. (2) FRE per share is calculated considering the number of outstanding shares at the end of the current quarter. Year - to - date val ues are calculated as the sum of the last two quarters. (3) Performance based compensation includes Dividends to Partners related to performance fees, distributed by the company to its original partners before the company turned public in 2021. (4) DE per share is calculated considering the number of outstanding shares at the end of the current quarter. Year - to - date valu es are calculated as the sum of the last two quarters. (5) Non - recurring expenses for the second quarter of 2022 are composed by expenses related to professional services to matters r elated to M&A. For the six months ended June 30, 2022, non - recurring expenses include expenses related to professional services to matters related to our international corporate organi zat ion. ▪ Notes to page 10 (1) Long - term AUM includes funds with lockups for at least five years to quasi - perpetual capital commitments. ▪ Notes to page 12 (1) Long term products include funds with former lockups superior to five years. (2) Private markets strategies include Private Equity, Real Estate, Credit and Infrastructure. ▪ Notes to page 13 (1) Accrued performance fees for the VCP offshore are as of 1Q’22. This occurs due to the 60 days timeline of the quarterly m ark up to be disclosed by the fund’s administrator. ▪ Notes to page 14 (1) International mandates have several different benchmarks across its vehicles. (2) The preferred return w/ catch - up rule applies to funds for which the vehicle must pay back its limited partners 100% of the invested capital corrected by the preferred return rate so it can charge performance fees. Once the preferred return rate is achieved, due to the catch - up clause, performance fees are charged over the absolute return of the fund instead of the excess return over the preferred rate.

43 Notes and Definitions (cont’d.) (3) Hurdle Rate is the minimum return the fund must achieve before it can charge performance fees. In most cases, funds with hur dle rate also are under a high - water mark clause . (4) Funds with preferred return must return 100% of invested capital corrected by the preferred return rate to its limited pa rtn ers in order to charge performance fees. (5) IPCA is a broad consumer price index measured by the IBGE. (6) IMAB 5 is composed by government bonds indexed to IPCA with up to 5 years in duration. (7) IBOV is the Brazilian stock market's most relevant index; (8) FTSE is London's stock market most relevant index. (9) IFIX is an index composed by listed REITs in the Brazilian stock exchange. (10) The CDI rate is a result of the average interbank overnight rates in Brazil (daily average for the period). (11) IMAB is composed by government bonds indexed to IPCA(inflation rate) plus a fixed interest rate. ▪ Notes to page 17 (1) FRE per share is calculated considering the number of outstanding shares at the end of the current quarter. Year - to - date val ues are calculated as the sum of the last two quarters. ▪ Notes to page 18 (1) PRE per share is calculated considering the number of outstanding shares at the end of the current quarter. Year - to - date val ues are calculated as the sum of the last two quarters. ▪ Notes to page 19 (1) GP investment income comes from proprietary investments made by Vinci Partners in its own Private Markets’ funds. (2) Financial income is income generated through investments made with our cash and cash equivalents in cash and bank deposit s, certificate of deposits and proprietary investments in Vinci Partners’ Liquid Funds, including funds from Public Equities, Hedge Funds, Real Estate and Credit. ▪ Notes to page 20 (1) Adjusted Distributable Earnings is calculated as Distributable Earnings excluding extraordinary expenses. (2) DE per share is calculated considering the number of outstanding shares at the end of the current quarter. Year - to - date valu es are calculated as the sum of the last two quarters.
44 Notes and Definitions (cont’d.) ▪ Notes to page 21 (1) Cash and cash equivalents include certificate of deposits and federal bonds. Certificate of deposits are issued by Banco Bra desco (credit rating AAA evaluated by Fitch Ratings) with interest rates variable from 99.5% to 101% of CDI (interbank deposit rate). The certificates are readily convertible to known amounts of cas h a nd which are subject to an insignificant risk of changes in value. (2) Liquid funds’ value are calculated as investment at fair value as of June 30, 2022, in liquid funds from Vinci Partners’ pub lic equities, hedge funds, credit segments and listed REITs. It also comprises the cash and certificate of deposits and federal bonds from Vinci Monalisa FIM. For more detail, see 2Q’22 Financia l S tatements filed within the SEC on August 11, 2022. (3) GP Fund Investments include Vinci Partners’ GP investments in private market funds, calculated at fair value as of June 3 0, 2022. For more detail, please see slide 35 and the Financial Statements filed within the SEC on August 11, 2022. (4) Cash and Net Investments per share were calculated considering the number of outstanding shares at the end of each quarte r. ▪ Notes to page 31 (1) NAV is the net asset value of each fund. For listed vehicles, the NAV represents the Market valuation of the fund. (2) Atlas strategy includes the funds Atlas FIC FIM and Atlas Institucional FIC FIM. (3) Equilibrio Strategy incudes the IP&S Family of pension plans. (4) CDI is an average of interbank overnight rates in Brazil(daily average for the period). (5) Brazil stock market most relevant index. (6) IPCA is a broad consumer price index measured by the IBGE. (7) IMAB is composed by government bonds indexed to IPCA. IMAB 5 also includes government bonds indexed to IPCA with up to 5 Yea rs in duration. (8) IFIX is an index composed by listed REITs in the brazilian stock Market. ▪ Notes to page 32 (1) Track record information is presented throughout this presentation on a pro forma basis and in local currency, excluding PIP E investments, a strategy that will be discontinued in VCP III. (2) Total commitments for VCP III include R$1.3 billion in co - investments. Track record presented for the VCP strategy as of 1Q’ 22, due to fund’s administrator timeline to disclose the quarterly markup of the fund. (3) Track record for VIR strategy is presented as of 1Q’22, due to fund’s administrator timeline to disclose the quarterly ma rku p of the fund. (4) Track record for FIP Infra is presented as of 2Q’22. (5) Track record for VIAS is presented as of 2Q’22. (6) Track record for VFDL is presented as of 2Q’22.

45 Notes and Definitions (cont’d.) ▪ Notes to page 33 (1) US$ Distributable Earnings was calculated considering the exchange rate from USD to BRL of 5.1239, as of August 9, 2022, whe n dividends were approved by our Board of Directors. (2) Per Share calculations are based on end of period Participating Common Shares. (3) Actual dividends per common share are calculated considering the share count as of the applicable record date. ▪ Notes to page 35 (1) The remaining capital committed in FIP Infra Transmissão and FIP Infra Transmissão co - investment will not be called by the fund, which is already in divestment period. ▪ Notes to page 37 (1) Bonus compensation related to management and advisory includes Dividends to Partners related to management and advisory, dis tributed by the company to its original partners before the company turned public in 2021. (2) Performance based compensation includes Dividends to Partners related to performance fees, distributed by the company to its original partners before the company turned public in 2021. (3) Non - recurring expenses for the second quarter of 2022 are composed by expenses related to professional services to matters r elated to M&A. For the six months ended June 30, 2022, non - recurring expenses include expenses related to professional services to matters related to our international corporate organi zat ion. (4) Profit before income taxes includes Dividends to partners related to management, advisory and performance fees, distribut ed by the company to its original partners before the company turned public in 2021. (5) Income taxes are comprised of taxes calculated over our corporate income tax and social contribution taxes. We are taxed on an actual taxable profit regime, while our subsidiaries are taxed based on deemed profit. Dividends to partners distributed by the company to its original partners before turned public in 202 1 a re not included in actual taxable regime. ▪ Notes to page 38 (1) Performance based compensation includes Dividends to Partners related to performance fees, distributed by the company to its original partners before the company turned public in 2021. (2) Bonus compensation related to management and advisory includes Dividends to Partners related to management and advisory, dis tributed by the company to its original partners before the company turned public in 2021. ▪ Notes to page 39 (1) Brazilian tax law establishes that companies that generate gross revenues of up to R$ 78,000 in the prior fiscal year may ca lculate income taxes as a percentage of gross revenue, using the presumed profit income tax regime. The Entity's subsidiaries adopted this tax regime and the effect of the presumed profit of su bsidiaries represents the difference between the taxation based on this method and the amount that would be due based on the statutory rate applied to the taxable profit of the subsidiaries.
46 Notes and Definitions (cont’d.) ▪ “Fee related earnings”, or “FRE”, is a metric to monitor the baseline performance of, and trends in, our business, in a manne r t hat does not include performance fees or investment income. We calculate FRE as operating profit less (a) net revenue from realized performance fees, less (b) net revenue from unrealized p erf ormance fees, plus (c) compensation allocated in relation to performance fees. ▪ “FRE Margin” is calculated as FRE over total net management and advisory fees. ▪ “Distributable Earnings”, or “DE”, is used as a reference point by our board of directors for determining the amount of earni ngs available to distribute to shareholders as dividends. Distributable Earnings is calculated as profit for the year, less (a) net revenue from unrealized performance fees, plus (b) inc ome taxes from unrealized performance fees, plus (c) compensation allocated in relation to unrealized performance fees, less (d) unrealized gain from GP investment income, less (e) unrealized ga in from financial income, plus (f) income taxes on unrealized gain from GP investment income, plus (g) income taxes on unrealized gain from financial income. ▪ “DE Margin” is calculated as DE over the sum of management and advisory fee related revenues, realized performance revenue, r eal ized GP investment income and realized financial income, net of revenue tax. ▪ “Performance Related Earnings”, or “PRE”, is a performance measure that we use to assess our ability to generate profits from re venue that relies on outcome from funds above their respective benchmarks. We calculate PRE as operating profit, less (a) net revenue from fund management and advisory, less (b) operating exp enses, such as segment personnel, G&A, corporate center and bonus related to management and advisory. ▪ “Segment Distributable Earnings” is Vinci Partners’ segment profitability measure used to make operating decisions and assess pe rformance across the company’s four segments (Private Markets, Liquid Strategies, Investment Products and Solutions and Financial Advisory). Segment Distributable Earnings is calc ula ted as operating profit less (a) net revenue from unrealized performance fees, plus (b) compensation allocated in relation to unrealized performance fees, plus (c) realized gain from GP inv estment income. ▪ “AUM” refers to assets under management. Our assets under management equal the sum of: (1) the fair market value of the inves tme nts held by funds plus the capital that we are entitled to call from investors in those funds pursuant to the terms of their capital commitments to those funds (plus the fair market va lue of co - investments arranged by us that were made or could be made by limited partners of our corporate private equity funds and portfolio companies of such funds); (2) the net asset valu e o f our public equity funds, hedge funds and closed - end mutual funds; and (3) the amount of capital raised for our credit funds. AUM includes double counting related to funds from one segm ent that invest in funds from another segment. Those cases occur mainly due to (a) fund of funds of investment products and solutions segment, and (b) investment funds in general that inv est part of their cash in credit segment and hedge fund segment funds in order to maintain liquidity and provide for returns on cash. Such amounts are eliminated on consolidation. T he bylaws of the relevant funds prohibit double - charging fees on AUM across segments. Therefore, while our AUM by segment may double - count funds from one segment that invest in funds from anoth er segment, the revenues for any given segment do not include revenue in respect of assets managed by another segment, which means there are no intercompany eliminations on re ven ues in our results of operations. ▪ Net Cash and Investments include cash and cash equivalents and the fair value of investments in liquid funds and GP Fund Inve stm ents. Cash and cash equivalents include cash, certificate of deposits, which are issued by Banco Bradesco (credit rating AAA evaluated by Fitch Ratings) with interest rates from 99.5% to 10 1% of CDI.

47 Notes and Definitions (cont’d.) ▪ “Net revenue from Fund Management and Advisory” is a performance measure that we use to assess our ability to generate profit s f rom our fund management and advisory business without measuring for the outcomes from funds above their respective benchmarks. We calculate Net Revenue from Fund Management and Ad vis ory as net revenue from services rendered less (a) net revenue from realized performance fees and less (b) net revenue from unrealized performance fees. ▪ “Total compensation and benefits” is the result of the profit sharing paid to our employees as (a) bonus compensation related to management advisory and (b) performance - based compensation. Total compensation and benefits include Dividends to Partners, distributed by the company to its original partn ers before the public turned public in 2021. In accordance with the by - laws of Vinci Brazil, dividends have historically been distributed based on the resolution of the partners. Therefore, di vidends could be distributed on a non - proportional basis among quota holders, which are comprised by the partners of Vinci Brazil. After the company’s IPO, Vinci Partners changed its compe nsa tion structure, from a dividend distribution policy to a profit - sharing scheme our partners. ▪ “Segment personnel expenses” are composed of the salary - part compensation paid to employees and partners of our funds’ managemen t teams. ▪ “Corporate center expenses” are composed by the salary - compensation paid to employees and other general and administrative expen ses related to our support teams, such as research, risk, legal & compliance, investor relations, operations and ESG. ▪ “Other general and administrative expenses” is made up of third - party expenses, depreciation and amortization, travel and repres entation, marketing expenses, administrative fees, non - operating taxes, third - party consultants’ fees, such as legal and accounting, and office consumables. ▪ “GP investment income” is income from proprietary investments made by us in our own Private Markets’ funds, used as GP Commit men ts. ▪ “Financial income” is income generated through the investments made with our cash and cash equivalents in cash and bank depos its , certificate of deposits and proprietary investments in our Liquid Funds from our public equities and hedge funds’ segments and listed REITs from our real estate segment. ▪ “Leasing expenses” include costs from the company’s sub - leasing activities. ▪ “Income taxes” is comprised of taxes on our corporate income tax and social contribution taxes. We are taxed on an actual tax abl e profit regime, while our subsidiaries are taxed based on deemed profit. Dividends to partners distributed by the company to its original partners before turned public in 2021 are not in cluded in actual taxable regime. ▪ “Capital Subscription / (capital return)” represents the net capital commitments and capital returns from our Private Markets ’ c losed end and listed funds. ▪ “Net Inflows / (outflows)” represent the net inflows and outflows from our liquid funds from our liquid strategies, IP&S and cre dit segments. ▪ “Appreciation / (depreciation)” represents the net capital appreciation/depreciation from our funds, which refers to the incr eas e or decrease of the funds’ investment’s value. ▪ “MOIC” means multiple on invested capital, a ratio intended to represent how much value an investment has returned, and is ca lcu lated as realized value plus unrealized value, divided by the total amount invested, gross of expenses and fees. ▪ “IRR” means the internal rate of return, which is a discount rate that makes the net present value of all cash flows equal to ze ro in a discounted cash flow analysis.

48 Funds/strategies’ descriptions ▪ Vinci Multiestratégia : The fund seeks to achieve long - term returns by investing in fixed income assets, through strategies that imply interest rates and currency risks. ▪ Vinci Atlas: The fund seeks to achieve long - term returns by investing across all strategies within fixed income, equities, curre ncy, derivatives, commodities and other investment funds with no obligation of any class concentration. ▪ Vinci Mosaico FIA: Public Equities’ long only flagship strategy. The strategy seeks to achieve long - term returns above Brazilian equities mar ket ( Ibovespa ) based on a fundamental analysis. ▪ Vinci Gas Dividendos : Public Equities’ dividends flagship strategy. The strategy seeks to achieve long - term returns by investing in companies with a consistent history of paying dividends in the Brazilian stock market. ▪ Vinci Total Return: The fund seeks to achieve medium and long - term returns by investing most of its capital in the Brazilian sto ck market, through bottom up and top - down strategies. ▪ Vinci Valorem: IP&S flagship commingled fund with exposure to fixed income assets, foreign exchange currency and derivatives. ▪ Equilibrio Strategy: IP&S family of pension plan funds. The strategy seeks to achieve long - term returns by investing across all strategies within fixed income, equities, currency, derivatives, commodities and other investment funds, respecting limitations in regulation. ▪ Vinci Selection Equities: The fund seeks to beat the Brazilian stock market index by investing in other funds that invest in Bra zilian public equities. ▪ Vinci Crédito Imobiliário I: The fund seeks to achieve long - term returns by investing in real estate mortgage - backed credit security bonds. ▪ Vinci Crédito Estruturado Multiestratégia PLUS FIC FIM: The fund seeks to achieve consistent returns by investing in private structured credit bonds. ▪ VISC11: Shopping malls listed REIT, focused on acquiring income - generating shopping malls in Brazil. ▪ VILG11: Industrial listed REIT focused on acquiring mature income - generating industrial properties in Brazil. ▪ VINO11: Listed REIT focused on acquiring mature income - generating boutique office real estate assets in Brazil. ▪ VIF11: Listed REIT that invests in other listed REITs and real estate mortgage - backed credit security bonds. ▪ VIUR11: perpetual capital listed REIT, focused on income generation to its quota holders through the acquisition of urban com mer cial properties in Brazil, such as street retail, grocery, healthcare, and educational focused real estate properties. ▪ VCRI: Listed REIT that aims to invest in MBS, while also being able to invest in listed REITs with similar investment strateg ies .

Rio de Janeiro 55 21 2159 6000 Av. Bartolomeu Mitre, 336 Leblon - 22431 - 002 São Paulo 55 11 3572 3700 Av. Brigadeiro Faria Lima, 2.277 14 o andar Jardim Paulistano - 01452 - 000 Recife 55 81 3204 6811 Av. República do Líbano, 251 - Sala 301 Torre A - Pina - 51110 - 160 Nova York 1 646 559 8000 780 Third Avenue, 25 th Floor - 10017