Exhibit 99.1

www.near.com

This presentation contains “forward - looking statements” for purposes of the federal securities laws. Forward - looking statements are any statements that look to future events and include, but are not limited to, statements regarding our business strategy; anticipated future operating results and operating expenses, cash flows, capital resources, and liquidity; trends, opportunities and risks affecting our business, industry and financial results; the expected benefits of use of our solutions; future expansion or growth plans and potential for future growth; our ability to attract new clients to purchase our solutions; market acceptance of our solutions; the sufficiency of our existing cash and cash equivalents to meet our working capital and capital expenditure needs over the next 12 months; acquisitions; and our expectations or beliefs concerning future events. In addition, the words “anticipates,” “appear,” “approximate,” “believe,” “continue,” “could,” “estimate,” “expect,” “foresee,” “intends,” “may,” “might,” “plan,” “possible,” “potential,” “predict,” “project,” “seek,” “should,” “would” and similar expressions may identify forward - looking statements, but the absence of these words does not mean that a statement is not forward - looking. Forward - looking statements are neither historical facts nor assurances of future performance, and are based only on our current beliefs, expectations and assumptions regarding the future of our business, future plans and strategies, projections, anticipated events and trends, the economy and other future conditions. Because forward - looking statements relate to the future, they are subject to inherent uncertainties, risks and changes in circumstances that are difficult to predict and many of which are outside of our control. Therefore, you should not place undue reliance on these forward - looking statements. Important factors that could cause our actual results and financial condition to differ materially from those indicated in the forward - looking statements include, among others, the following: (i) our ability to generate sufficient revenue to achieve and sustain profitability; (ii) the financing agreement with Blue Torch Finance LLC contains restrictions and limitations that could significantly affect our ability to operate our business, as well as significantly affect our liquidity; (iii) we may be unable to attract new customers or retain existing customers, and given that a significant portion of our revenue is derived from a limited number of customers, the loss or decline in revenue from any of these customers would harm our business, results of operations and financial condition; (v) we may be unable to accurately predict our future capital needs, and we may not be able to obtain additional financing to fund our operations on favorable terms or at all; (vi) substantial regulation and the potential for unfavorable changes to, or our failure to comply with, these regulations, which could substantially harm our business and operating results; (vii) the level of demand for and market utilization of our solutions and products; (viii) developments and projections relating to our competitors and industry; (ix) our management team’s limited experience managing a public company; (x) the possibility that we need to defend ourselves against fines, penalties and injunctions if we are determined to be promoting products for unapproved uses; (xi) our dependency upon third - party service providers for certain technologies; (xii) our ability to maintain the listing of our common stock or public warrants on Nasdaq; (xiii) the risk that our significant increased expenses and administrative burdens as a public company could have an adverse effect on our business, financial condition and results of operations; and (xiv) the other risks and uncertainties identified in our SEC filings. These forward - looking statements are based on information available as of the date hereof and current expectations, forecasts and assumptions, and involve a number of judgments, risks and uncertainties. Accordingly, forward - looking statements should not be relied upon as representing our views as of any subsequent date, and we do not undertake any obligation to update forward - looking statements to reflect events or circumstances after the date they were made, whether as a result of new information, future events or otherwise, except as may be required under applicable securities laws. www.near.com 2 Forward - Looking Statements
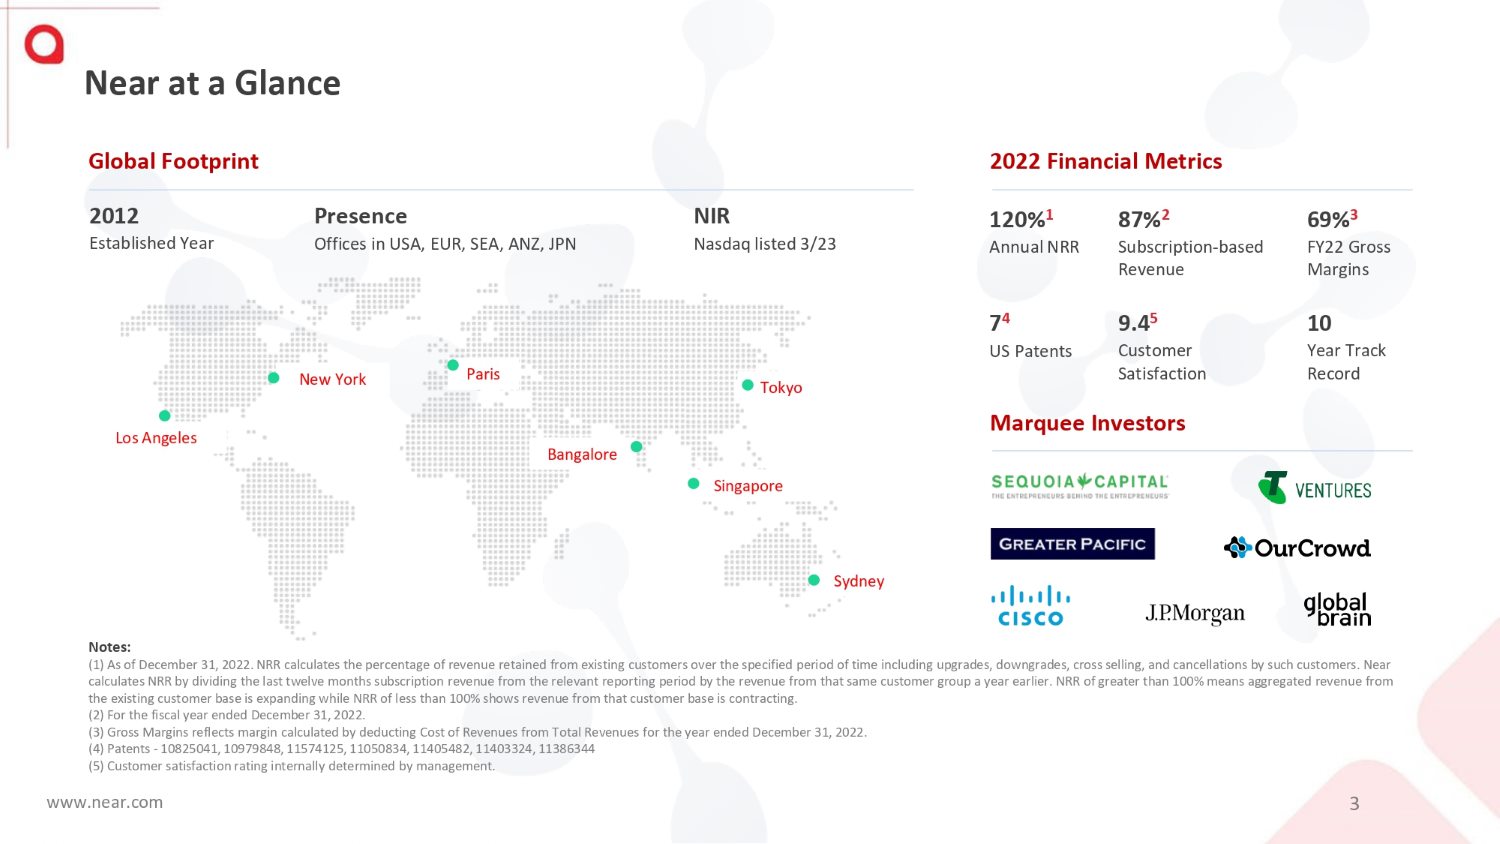
Near at a Glance 2012 Established Year Presence Offices in USA, EUR, SEA, ANZ, JPN 120% 1 Annual NRR Global Footprint 2022 Financial Metrics New York Bangalore Tokyo Singapore Sydney Paris Los Angeles Marquee Investors www.near.com 3 Notes: (1) As of December 31 , 2022 . NRR calculates the percentage of revenue retained from existing customers over the specified period of time including upgrades, downgrades, cross selling, and cancellations by such customers . Near calculates NRR by dividing the last twelve months subscription revenue from the relevant reporting period by the revenue from that same customer group a year earlier . NRR of greater than 100 % means aggregated revenue from the existing customer base is expanding while NRR of less than 100 % shows revenue from that customer base is contracting . (2) For the fiscal year ended December 31 , 2022 . (3) Gross Margins reflects margin calculated by deducting Cost of Revenues from Total Revenues for the year ended December 31 , 2022 . (4) Patents - 10825041 , 10979848 , 11574125 , 11050834 , 11405482 , 11403324 , 11386344 (5) Customer satisfaction rating internally determined by management . 69% 3 FY22 Gross Margins 87% 2 Subscription - based Revenue 7 4 US Patents 10 Year Track Record 9.4 5 Customer Satisfaction NIR Nasdaq listed 3/23
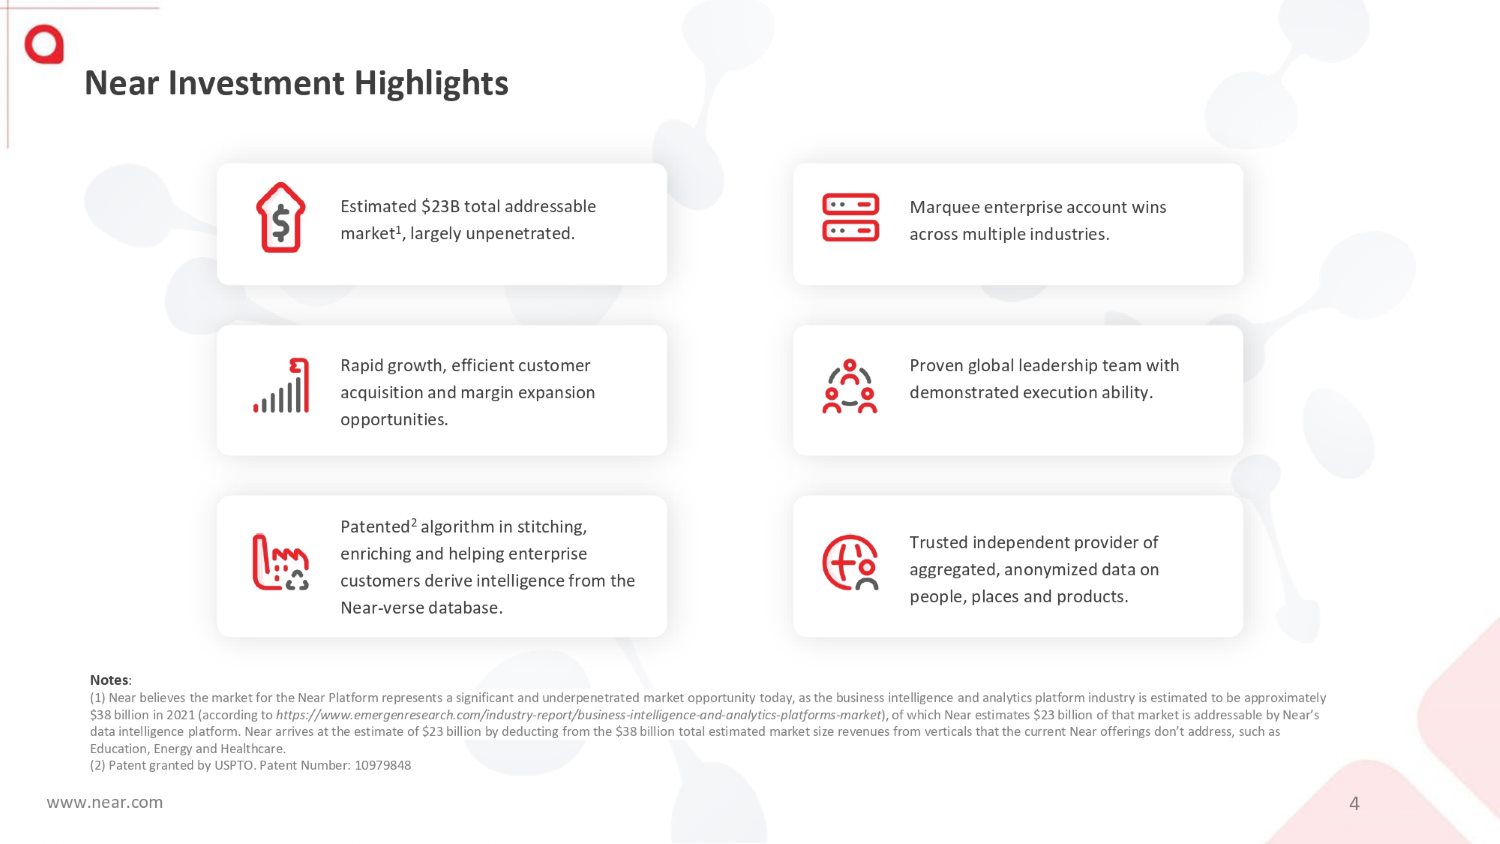
Near Investment Highlights Estimated $23B total addressable market 1 , largely unpenetrated. Marquee enterprise account wins across multiple industries. Proven global leadership team with demonstrated execution ability. Rapid growth, efficient customer acquisition and margin expansion opportunities . Trusted independent provider of aggregated, anonymized data on people, places and products . Patented 2 algorithm in stitching, enriching and helping enterprise customers derive intelligence from the Near - verse database. Notes : www.near.com 4 (1) N ear believes the market for the Near Platform represents a significant and underpenetrated market opportunity today, as the b usiness intelligence and analytics platform industry is estimated to be approximately https:// www.emergenresearch.com/industry - report/business - intelligence $38 billion in 2021 (according to - and - analytics - platforms - market ), of which Near estimates $23 billion of that market is addressable by Near’s data intelligence platform. Near arrives at the estimate of $23 billion by deducting from the $38 billion total estimated mar ket size revenues from verticals that the current Near offerings don’t address, such as Education, Energy and Healthcare. (2) Patent granted by USPTO. Patent Number: 10979848
Corporate Overview www.near.com 5

Near is a global, full - stack data intelligence SaaS platform. What Is Near? www.near.com 6
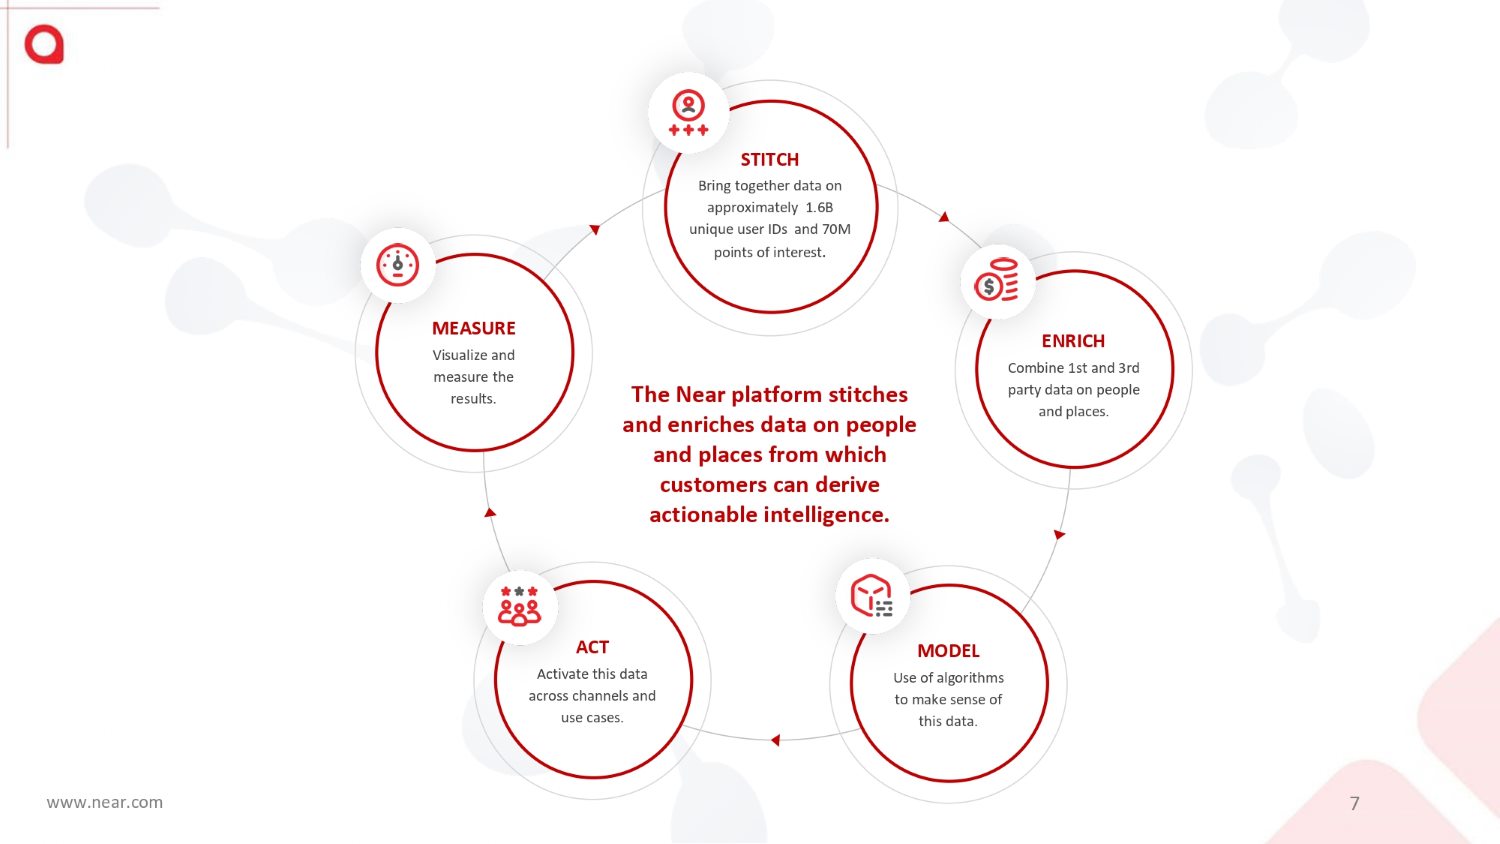
STITCH Bring together data on approximately 1.6B unique user IDs and 70M points of interest . The Near platform stitches and enriches data on people and places from which customers can derive actionable intelligence. MODEL Use of algorithms to make sense of this data. ACT Activate this data across channels and use cases. MEASURE Visualize and measure the results. ENRICH Combine 1st and 3rd party data on people and places. www.near.com 7

Case Studies www.near.com 8
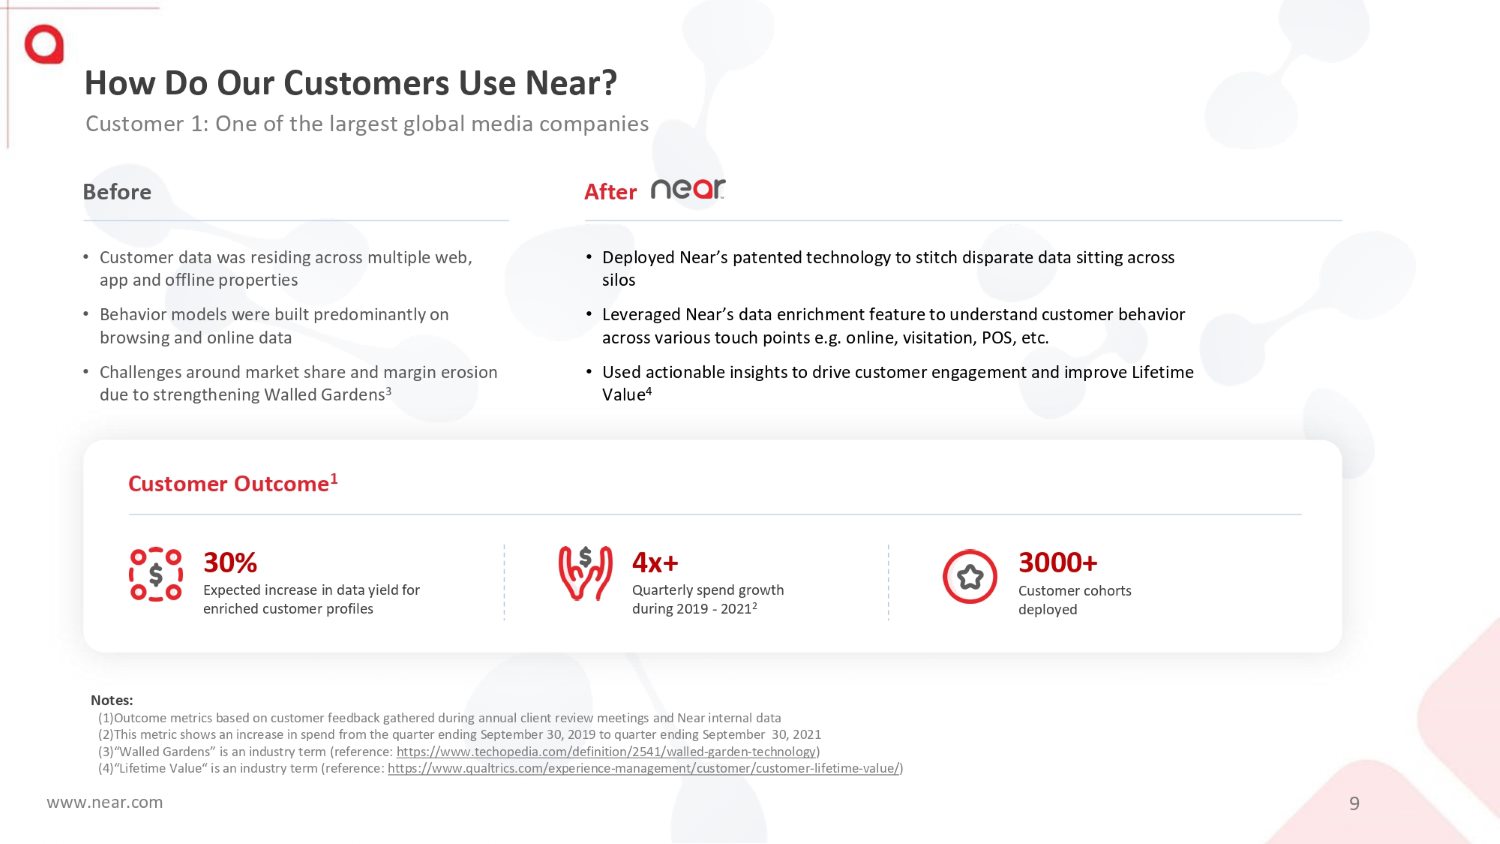
Customer Outcome 1 • Customer data was residing across multiple web, app and offline properties • Behavior models were built predominantly on browsing and online data • Challenges around market share and margin erosion due to strengthening Walled Gardens 3 www.near.com 9 • Deployed Near’s patented technology to stitch disparate data sitting across silos • Leveraged Near’s data enrichment feature to understand customer behavior across various touch points e.g. online, visitation, POS, etc. • Used actionable insights to drive customer engagement and improve Lifetime Value 4 Before After 30% Expected increase in data yield for enriched customer profiles 4x+ Quarterly spend growth during 2019 - 2021 2 How Do Our Customers Use Near? Customer 1: One of the largest global media companies 3000+ Customer cohorts deployed Notes: (1) Outcome metrics based on customer feedback gathered during annual client review meetings and Near internal data (2) This metric shows an increase in spend from the quarter ending September 30, 2019 to quarter ending September 30, 2021 (3) “Walled Gardens” is an industry term (reference: https://www.techopedia.com/definition/2541/walled - garden - technology ) (4) “Lifetime Value“ is an industry term (reference: https://www.qualtrics.com/experience - management/customer/customer - lifetime - value/ )
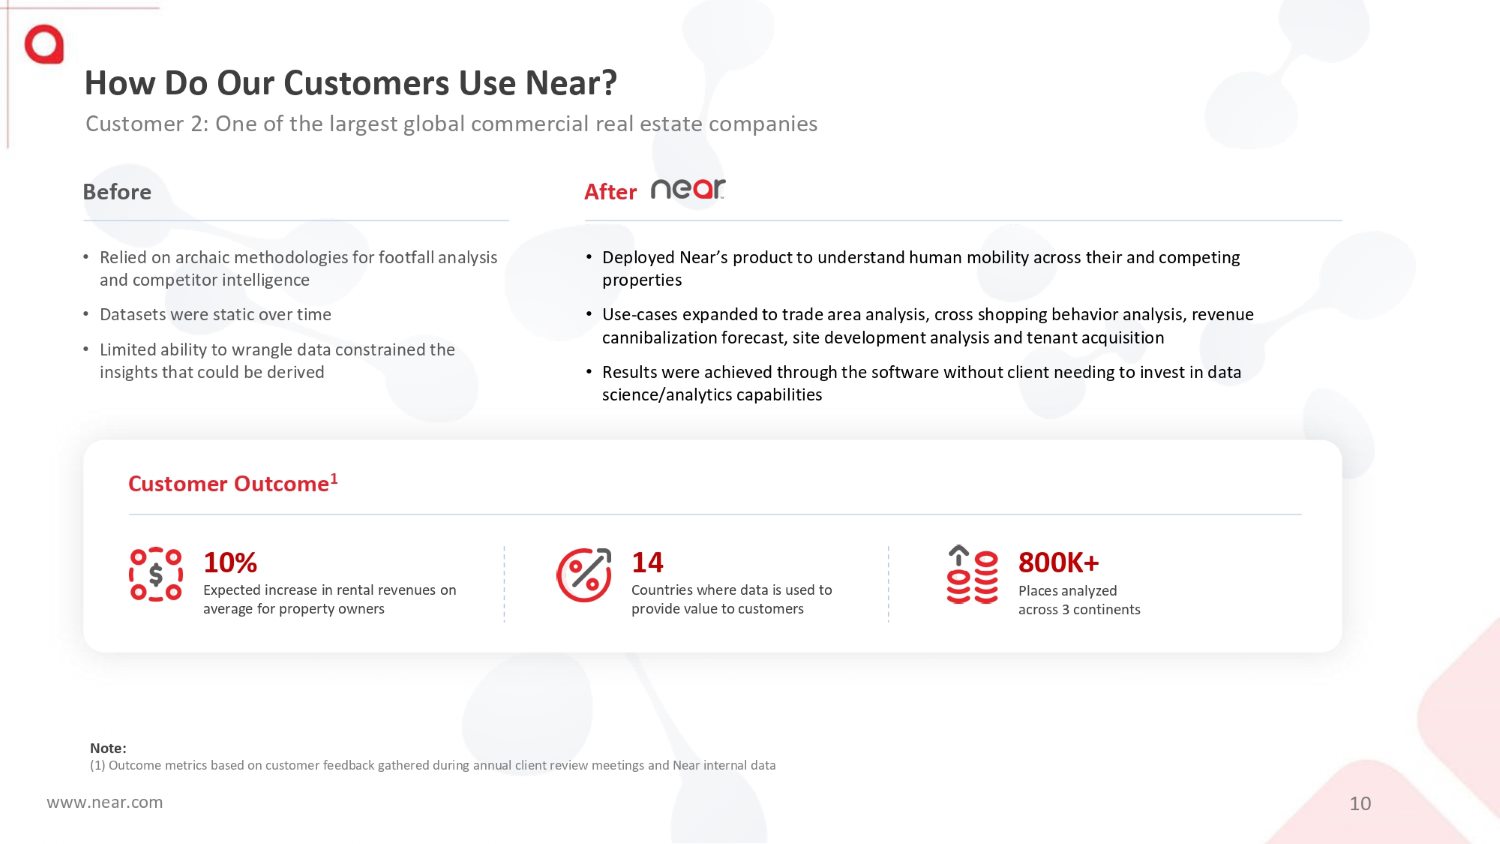
How Do Our Customers Use Near? Customer 2: One of the largest global commercial real estate companies • Relied on archaic methodologies for footfall analysis and competitor intelligence • Datasets were static over time • Limited ability to wrangle data constrained the insights that could be derived • Deployed Near’s product to understand human mobility across their and competing properties • Use - cases expanded to trade area analysis, cross shopping behavior analysis, revenue cannibalization forecast, site development analysis and tenant acquisition • Results were achieved through the software without client needing to invest in data science/analytics capabilities 10% Expected increase in rental revenues on average for property owners www.near.com 10 800K+ Places analyzed across 3 continents 14 Countries where data is used to provide value to customers Note: (1) Outcome metrics based on customer feedback gathered during annual client review meetings and Near internal data Customer Outcome 1 Before After
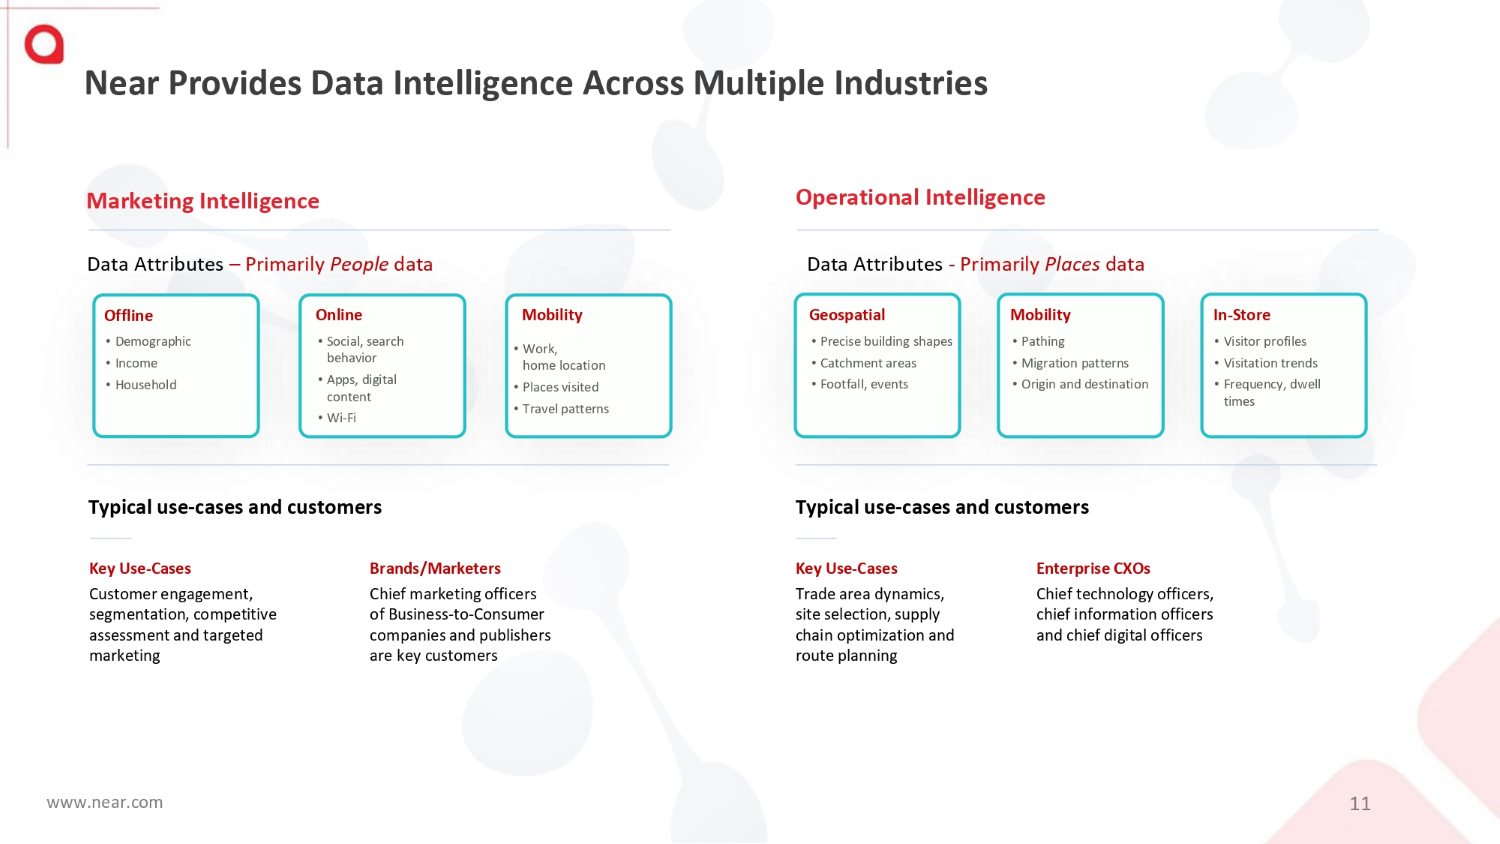
Data Attributes – Primarily People data Data Attributes - Primarily Places data Offline • Demographic • Income • Household Online • Social, search behavior • Apps, digital content • Wi - Fi • Work, home location • Places visited • Travel patterns Mobility Geospatial • Precise building shapes • Catchment areas • Footfall, events Mobility • Pathing • Migration patterns • Origin and destination In - Store • Visitor profiles • Visitation trends • Frequency, dwell times Marketing Intelligence Operational Intelligence www.near.com 11 Key Use - Cases Customer engagement, segmentation, competitive assessment and targeted marketing Typical use - cases and customers Brands/Marketers Chief marketing officers of Business - to - Consumer companies and publishers are key customers Key Use - Cases Trade area dynamics, site selection, supply chain optimization and route planning Enterprise CXOs Chief technology officers, chief information officers and chief digital officers Near Provides Data Intelligence Across Multiple Industries Typical use - cases and customers

The Winning Flywheel www.near.com 12

Near’s Data Network Effect - Our Winning Flywheel (1/3) HIGH QUALITY DATA AT SCALE • Approximately 1.6B unique user IDs, 70M point of interest, across more than 44 countries • Strategic/exclusive data pipes and partnerships with customers (including relationships with top publishers providing access to their 1P data) has enabled Near to aggregate multiple data sources across data types • Near’s patented identity solution gathers deterministic signals from disparate data sources to build a robust ID graph DATA ACCESS www.near.com 13 BUSINESS OUTCOMES ACQUISITION AND RETENTION
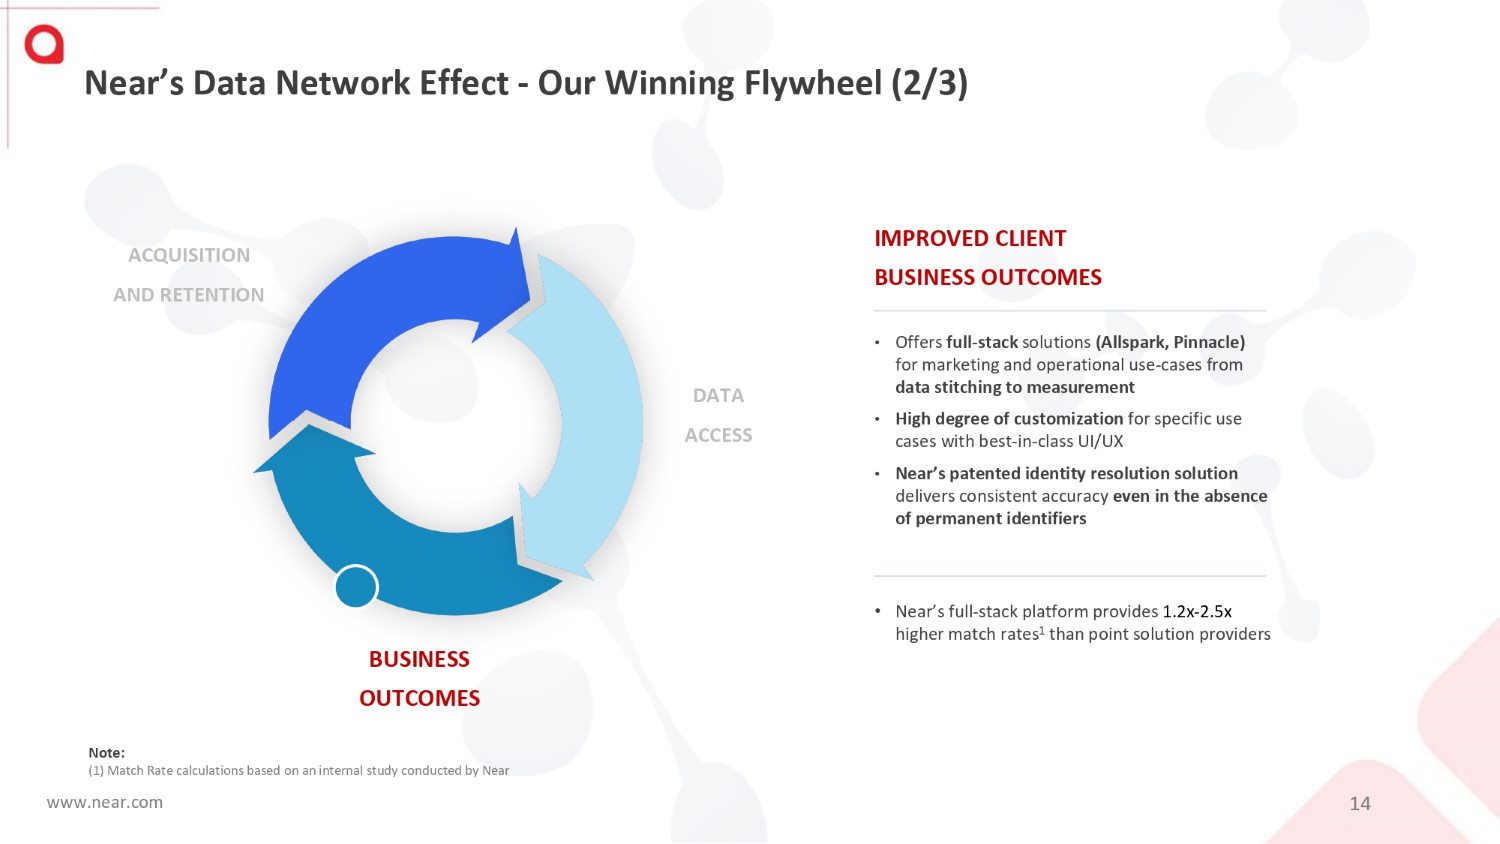
Near’s Data Network Effect - Our Winning Flywheel (2/3) IMPROVED CLIENT BUSINESS OUTCOMES • Offers full - stack solutions (Allspark, Pinnacle) for marketing and operational use - cases from data stitching to measurement • High degree of customization for specific use cases with best - in - class UI/UX • Near’s patented identity resolution solution delivers consistent accuracy even in the absence of permanent identifiers ACQUISITION AND RETENTION www.near.com 14 BUSINESS OUTCOMES • Near’s full - stack platform provides 1.2x - 2.5x higher match rates 1 than point solution providers Note: (1) Match Rate calculations based on an internal study conducted by Near DATA ACCESS
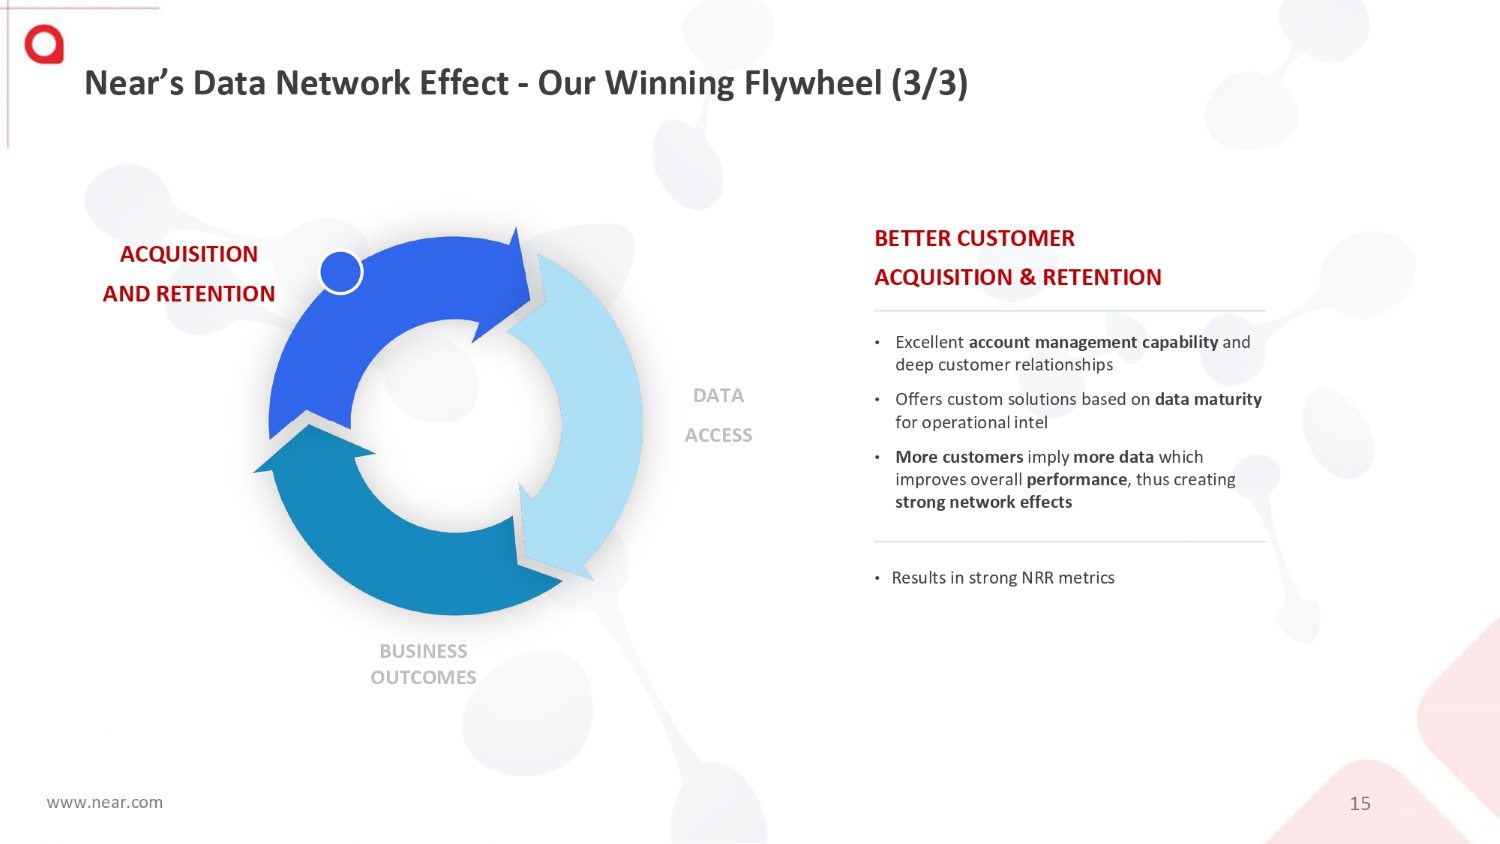
Near’s Data Network Effect - Our Winning Flywheel (3/3) BETTER CUSTOMER ACQUISITION & RETENTION • Excellent account management capability and deep customer relationships • Offers custom solutions based on data maturity for operational intel • More customers imply more data which improves overall performance , thus creating strong network effects BUSINESS OUTCOMES www.near.com 15 ACQUISITION AND RETENTION • Results in strong NRR metrics DATA ACCESS
Customer Testimonial Yahoo! Australia with Dan Richardson, Director , Data APAC ● Customer since 2020. ● Near’s solution for Yahoo! is twofold – we help Yahoo! identify and retarget exposed audiences or we create footfall attribution reporting. ● Yahoo! and Near to add the Taiwan market to current deal, increase use of Near advertiser segments and open up the Yahoo! attribution longtail with attribution counts within Yahoo! DSP. ● " With Tourism Tasmania, we were able to track with Near over fifty percent uplift in traffic to Tasmania in the off - season following exposure to ads. So, it's that type of thing which is really a success story for us, because it's bringing in new verticals into our advertisers to the remit and investment. " – Dan Richardson , Director, Data APAC www.near.com 16
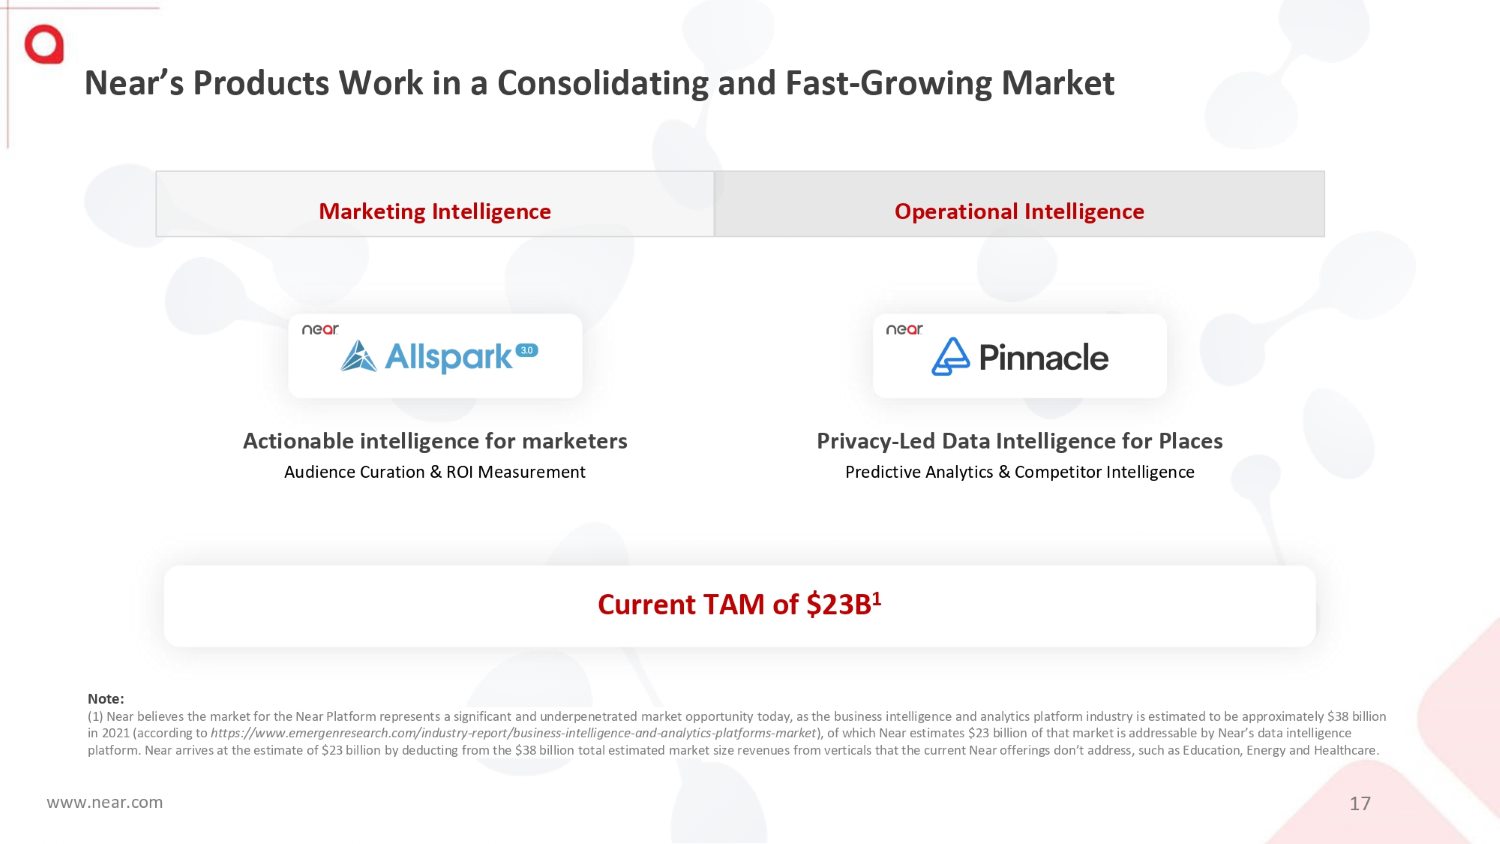
Near’s Products Work in a Consolidating and Fast - Growing Market Current TAM of $23B 1 Marketing Intelligence Operational Intelligence Privacy - Led Data Intelligence for Places Predictive Analytics & Competitor Intelligence Actionable intelligence for marketers Audience Curation & ROI Measurement Note: (1) Near believes the market for the Near Platform represents a significant and underpenetrated market opportunity today, as the business intelligence and analytics platform industry is estimated to be approximately $38 billion in 2021 (according to https:// www.emergenresearch.com/industry - report/business - intelligence - and - analytics - platforms - market ), of which Near estimates $23 billion of that market is addressable by Near’s data intelligence platform. Near arrives at the estimate of $23 billion by deducting from the $38 billion total estimated market size revenues from verticals that the current Near offerings don’t address, such as Education, Energy and Healthcare. www.near.com 17
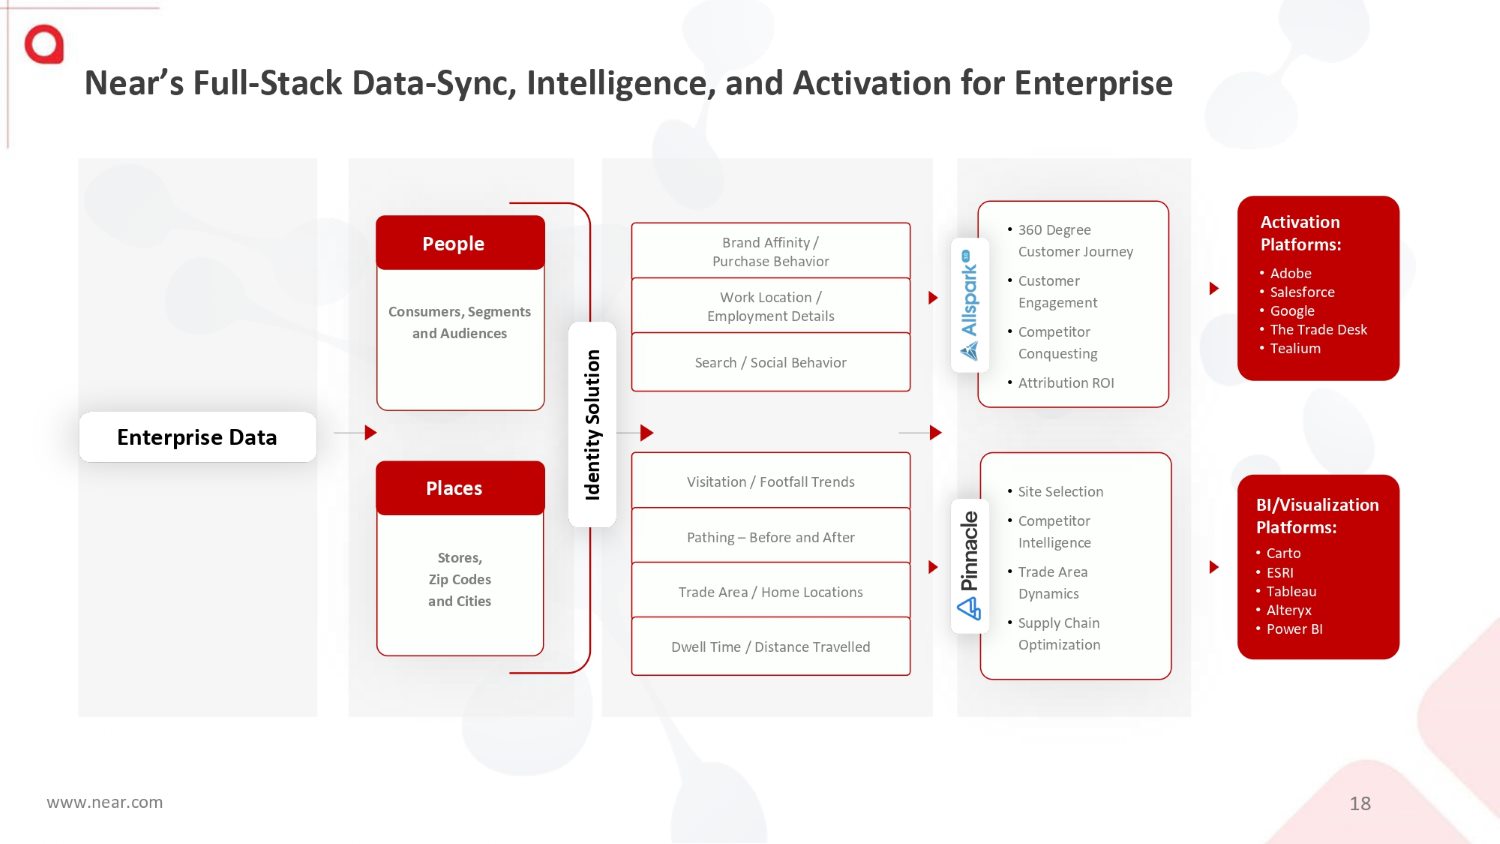
Near’s Full - Stack Data - Sync, Intelligence, and Activation for Enterprise • 360 Degree Customer Journey • Customer Engagement • Competitor Conquesting • Attribution ROI Enterprise Data Brand Affinity / Purchase Behavior Work Location / Employment Details Search / Social Behavior Stores, Zip Codes and Cities Places Visitation / Footfall Trends Pathing – Before and After Trade Area / Home Locations Dwell Time / Distance Travelled Consumers, Segments and Audiences People BI/Visualization Platforms: • Carto • ESRI • Tableau • Alteryx • Power BI Activation Platforms: • Adobe • Salesforce • Google • The Trade Desk • Tealium Identity Solution • Site Selection • Competitor Intelligence • Trade Area Dynamics • Supply Chain Optimization www.near.com 18
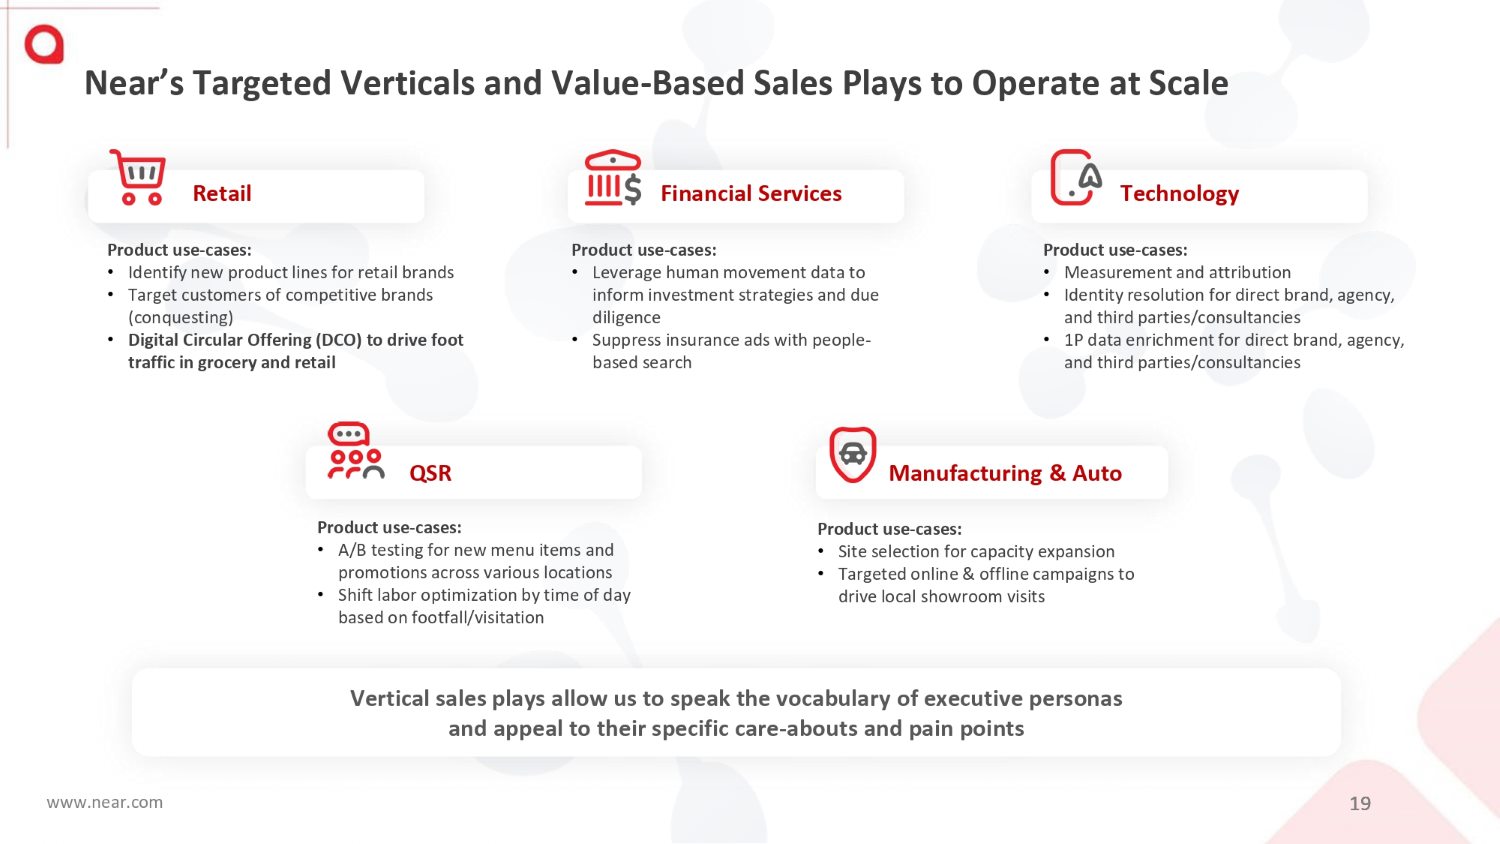
Vertical sales plays allow us to speak the vocabulary of executive personas and appeal to their specific care - abouts and pain points Retail Financial Services www.near.com 19 Technology Product use - cases: • Identify new product lines for retail brands • Target customers of competitive brands (conquesting) • Digital Circular Offering (DCO) to drive foot traffic in grocery and retail Product use - cases: • Leverage human movement data to inform investment strategies and due diligence • Suppress insurance ads with people - based search Product use - cases: • Measurement and attribution • Identity resolution for direct brand, agency, and third parties/consultancies • 1P data enrichment for direct brand, agency, and third parties/consultancies QSR Manufacturing & Auto Product use - cases: • A/B testing for new menu items and promotions across various locations • Shift labor optimization by time of day based on footfall/visitation Product use - cases: • Site selection for capacity expansion • Targeted online & offline campaigns to drive local showroom visits Near’s Targeted Verticals and Value - Based Sales Plays to Operate at Scale

EUR Thousands ~9,500 ~3,500 ~900 ~200 USD Thousands ~1,100 ~975 ~450 ~300 Key Growth Drivers: • Ongoing, high - touch discovery sessions – highly responsive to current and anticipated client needs • Rapid and responsive innovation through collaboration between Near Platform and client teams • Expansion of Near solution scope to include measurement and identity solutions over time www.near.com 20 Key Growth Drivers: • Targeted solution solving clearly - defined problems, delivering business outcomes, with clear business case and ROI • Dedicated account team with defined roles and responsibilities, and senior executive relationship mapping • High - touch account/CS model – weekly checkpoints, QBRs, ongoing readouts, account plan + expansion strategy Top 3 National Grocery Chain in France Multinational Mass Media & Publisher Land & Expand: Selected Client Examples / Drivers of >120% NRR

Restaurants Over 20 global and national chains, including top 50 QSR brands in the US Automotive Auto manufacturers, global oil companies, and top US automotive service company Tourism and Travel Over 50 major travel destinations globally Media and Technology Global media companies Government and Public Services State and local governments, public transportation and universities Financial Services International financial services and investment companies Real Estate International brokerage and commercial real estate services and investment firms Retail Top retailers and global brands Near’s Customer Base Demonstrates that Its Products Deliver Our Annual Net Retention Rate holds strong at 120% 1 Note: (1) NRR calculates the percentage of revenue retained from existing customers over the specified period of time including upgrades, downgrades, cross selling, and cancellations by such customers. Near calculates NRR by dividing the last twelve months subscription revenue from the relevant reporting period by the revenue from that same customer group a year earlier. NRR of greater than 100% means aggregated revenue from the existing customer base is expanding while NRR of less than 100% shows revenue from that customer base is contracting www.near.com 21

Coldwell Banker Commercial with John McClelland, Vice President, Research ● “ With the power of Pinnacle, you can really see geographic context, and Coldwell is able to tell that story in their proposals, and in their marketing packages. ” ● Customer since June 2021. Coldwell Banker Commercial Premier is comprised of over 300 independently owned and operated franchise offices in over 40 countries with a team of 3,000+ professionals worldwide. ● Initial sell was a Vista Data Explorer License. Coldwell Banker upgraded to Pinnacle Places, Pinnacle Data Export and Vista Insights in June 2022. ● “ Say it's a retail site, and you'll look at traffic numbers, so what the Near products did for us is to really paint the picture of what else is going on over there. So instead of just drawing a contrived radius around something, we're able to actually see, for example, what is a true sub - market for that shopping center or that triple net retail building. ” – John McClelland , VP, Research Customer Testimonial www.near.com 22

Key Financial Metrics www.near.com 23

Notes: (1) YoY growth is measured for revenue based on 2022 revenue compared to the same time frame in 2021 (2) As of December 31, 2022. NRR calculates the percentage of revenue retained from existing customers over the specified period of time including upgrades, downgrades, cross selling, and cancellations by such customers. Near calculates NRR by dividing the last twelve months subscription revenue from the relevant reporting period by the revenue from that same customer group a year earlier. NRR of greater than 100% means aggregated revenue from the existing customer base is expanding while NRR of less than 100% shows revenue from that customer base is contracting (3) Gross Margins reflects margin calculated by deducting Cost of Revenues from Total Revenues for the year ended December 31, 2022. (4) Customer satisfaction rating internally determined by management. Near’s 2022 Financial Highlights ~32% YoY Growth 1 120% Annual NRR 2 69%+ Gross Margin 3 www.near.com 24 9.4 Customer Satisfaction Rating 4
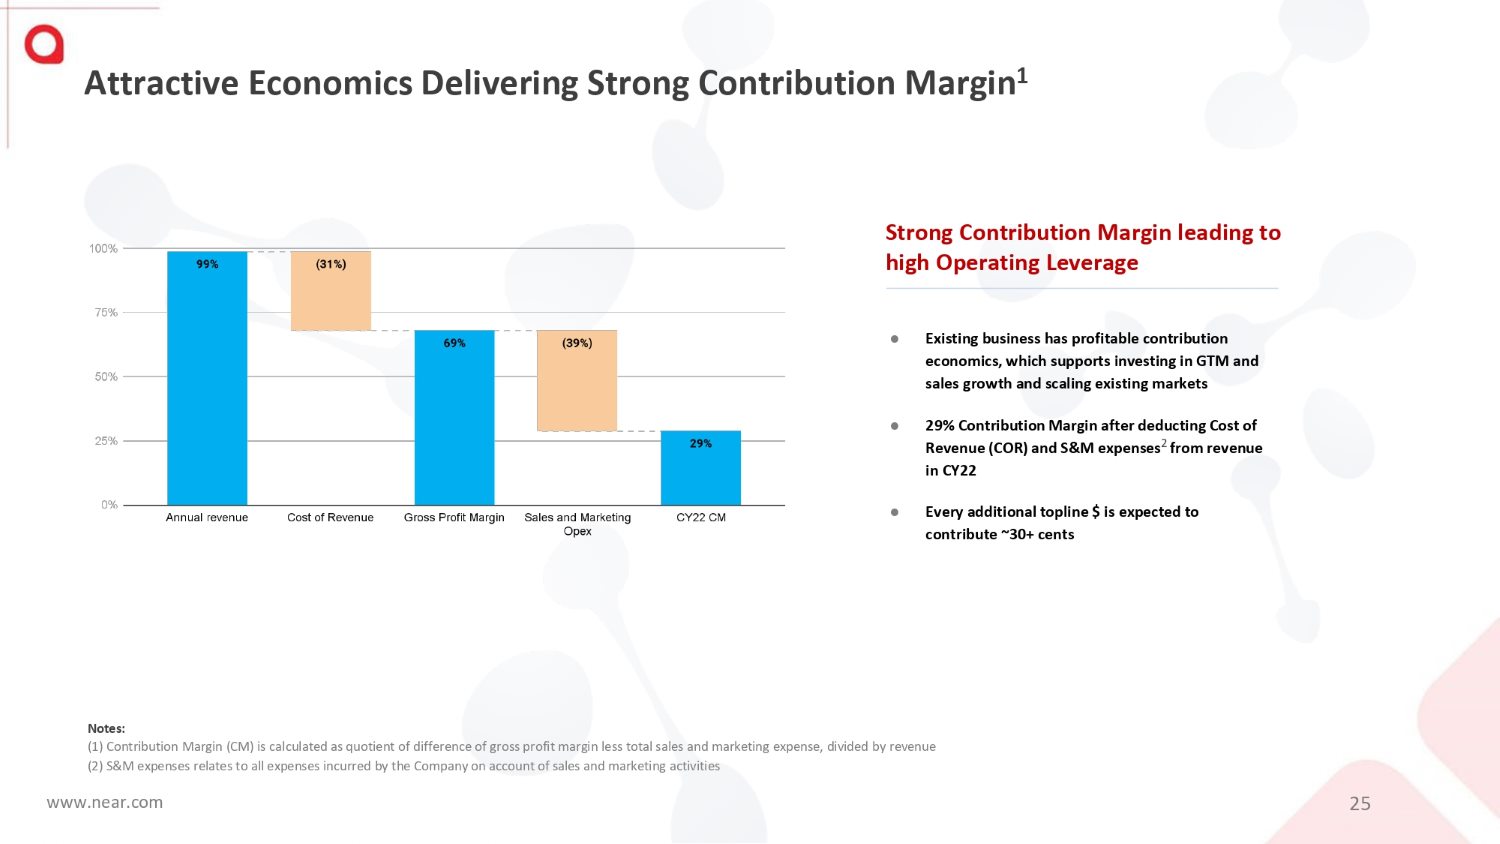
Attractive Economics Delivering Strong Contribution Margin 1 Strong Contribution Margin leading to high Operating Leverage ● Existing business has profitable contribution economics, which supports investing in GTM and sales growth and scaling existing markets ● 29% Contribution Margin after deducting Cost of Revenue (COR) and S&M expenses 2 from revenue in CY22 ● Every additional topline $ is expected to contribute ~30+ cents Notes: (1) Contribution Margin (CM) is calculated as quotient of difference of gross profit margin less total sales and marketing expense, divided by revenue (2) S&M expenses relates to all expenses incurred by the Company on account of sales and marketing activities www.near.com 25

Revenue First Quarter 2023 Results Gross Margin Adjusted EBITDA* Gross Profit Operating Loss www.near.com 26 First Quarter 2023 Unaudited Financial Highlights $15.5 million $10.4 million 67% $22.3 million $(7.0) million *Adjusted EBITDA is a non - GAAP financial measure. See slide 34 for a reconciliation of GAAP to non - GAAP operating results.

Near’s Key Use of Funds SaaS Flywheel Accelerate the SaaS flywheel and data - network effects to maximize the organic growth trajectory Product Expansion Drive customer expansion with new features and products adjacent to the core offerings Generative AI Data acquisition, computing resources, and expertise to help “find the missing data” on the consumer journey Inorganic Growth Continue to acquire value accretive assets with differentiated products/data to unlock long - term synergies New Use - Cases Penetrate large opportunity sectors such as retail, real estate and restaurant www.near.com 27

• Estimated $23B TAM 1 Near’s Investment Summary Large total addressable market, mostly unpenetrated. • Estimated 1.6B Unique User IDs • More than 44 Countries Covered One of the largest database providers of aggregated, anonymized data on people and places . • 7 Patents • Multi - year head start on gathering unique datapoints Patented algorithm in stitching, enriching and helping enterprise customers derive intelligence from the Near - verse database. • 32% CY21 - CY22 revenue growth • Maintain 68% - 72% Gross Margin Rapid growth, efficient customer acquisition and margin expansion opportunities. • Seasoned team made up of IIM and Caltech alumni. Proven global leadership team with demonstrated ability in execution. (1) N ear believes the market for the Near Platform represents a significant and underpenetrated market opportunity today, as the b usiness intelligence and analytics platform industry is estimated to be approximately $38 https:// www.emergenresearch.com/industry - report/business - intelligence billion in 2021 (according to - and - analytics - platforms - market ), of which Near estimates $23 billion of that market is addressable by Near’s data intelligence platform. Near arrives at the estimate of $23 billion by deducting from the $38 billion total estimated market s ize revenues from verticals that the current Near offerings don’t address, such as Education, Energy and Healthcare. (2) NRR calculates the percentage of revenue retained from existing customers over the specified period of time including upgrades, downgrades, cross selling, and cancellations by such customers. Near calculates NRR by dividing the last twelve months subscription revenue from the relevant reporting period by the revenue from that same customer group a year earlier. NRR of greater than 100% means aggregated revenue from the existing customer base is expanding while NRR of less than 100% shows revenue from that customer base is contracting. • Expected NRR 120% CY21P - CY24E2 www.near.com 28 Marquee enterprise account wins across multiple industries .

www.near.com Thank You Connect with us at www.near.com

Appendix www.near.com 30
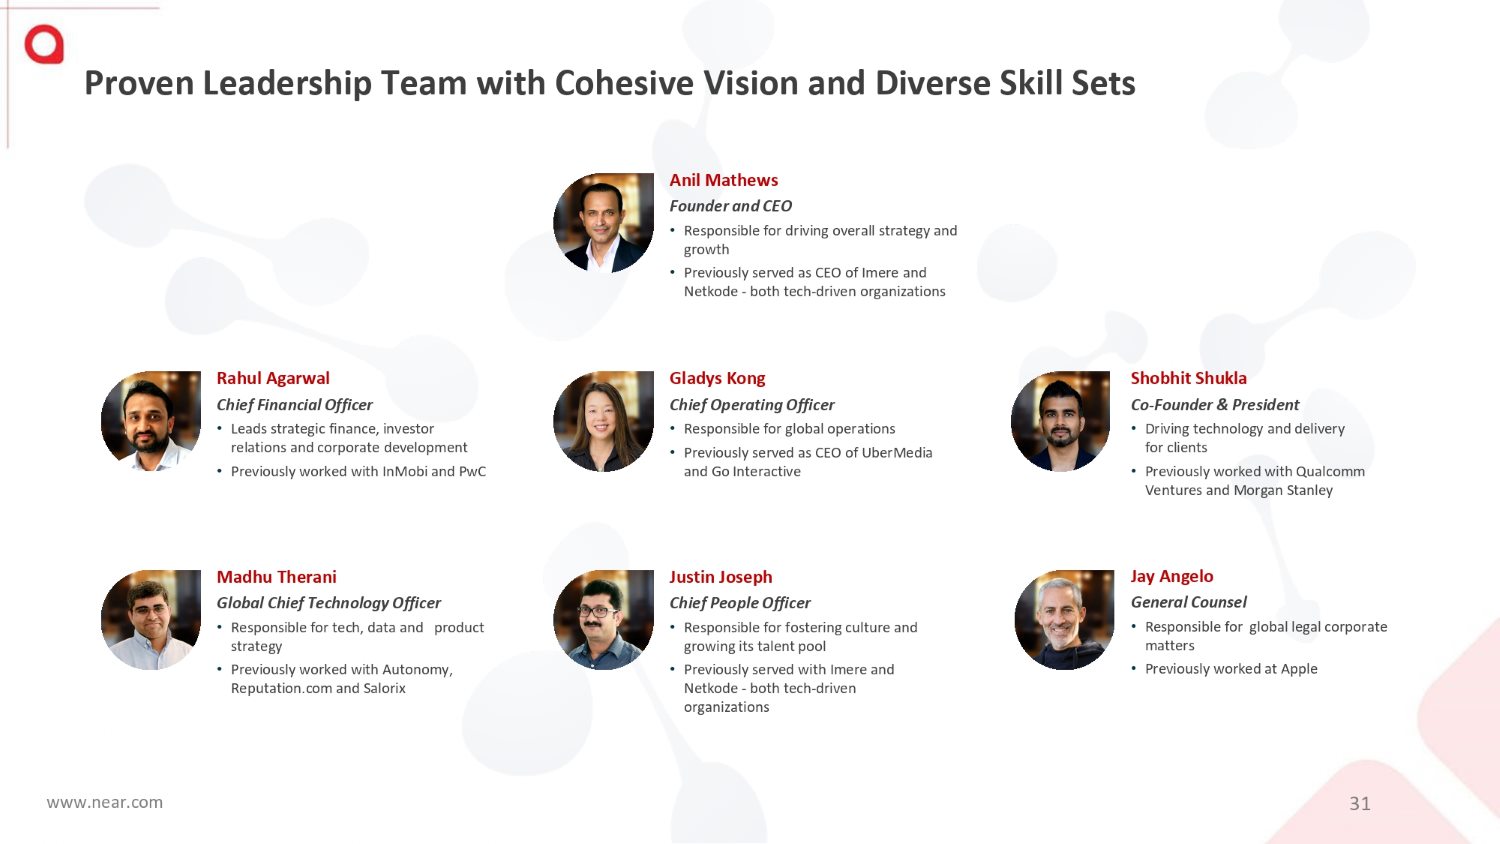
Anil Mathews Founder and CEO • Responsible for driving overall strategy and growth • Previously served as CEO of Imere and Netkode - both tech - driven organizations Shobhit Shukla Co - Founder & President • Driving technology and delivery for clients • Previously worked with Qualcomm Ventures and Morgan Stanley www.near.com 31 Gladys Kong Chief Operating Officer • Responsible for global operations • Previously served as CEO of UberMedia and Go Interactive Rahul Agarwal Chief Financial Officer • Leads strategic finance, investor relations and corporate development • Previously worked with InMobi and PwC Justin Joseph Chief People Officer • Responsible for fostering culture and growing its talent pool • Previously served with Imere and Netkode - both tech - driven organizations Madhu Therani Global Chief Technology Officer • Responsible for tech, data and product strategy • Previously worked with Autonomy, Reputation.com and Salorix Jay Angelo General Counsel • Responsible for global legal corporate matters • Previously worked at Apple Proven Leadership Team with Cohesive Vision and Diverse Skill Sets

Note: During Q2 2022, Near Pte. Ltd. and the Company, Near Intelligence Holdings Inc. USA entered into an Exchange and Recapitalization Agreement dated June 13, 2022 wherein Near Pte. Ltd. exchanged all of the current common stock for a combination of common stock and preferred stock of the Company such that (a) the number of shares in common stock of the Company held by Near Pte. Ltd. is equivalent, on a 1000:1 basis, to the number of outstanding common stock of Near Pte. Ltd.; and (b) the number of each series of preferred stock of the Company is equivalent, on a 1000:1 basis, to the number of outstanding shares of the similarly named series of preferred stock of Near Pte. Ltd. Rights, preferences and privileges of each class of stock of the Company mimic the rights, preferences and privileges of the corresponding stock of Near Pte Ltd. Thereby, the Company's capital structure would consist of 71,963.894 shares of common stock and 307,298.151 shares of various series of preferred stock. This has been given effect for weighted average outstanding shares and EPS for Q1 2022 for purpose of comparisons. Historical Financials - GAAP Near Intelligence Inc. Condensed Consolidated Statements of Operations - GAAP (in USD thousands, except shares and per share data) Three Months Ended Full Year 2022 December 31, 2022 September 30, 2022 June 30, 2022 March 31, 2022 59,746 15,281 15,567 14,839 14,059 Revenue 18,668 4,578 4,696 5,116 4,278 Cost of revenue (excl. depreciation and amortization) 41,078 10,703 10,871 9,723 9,781 Gross profit Operating expenses: 27,254 5,630 6,788 9,936 4,900 Product and technology 23,508 5,105 5,278 8,433 4,692 Sales and marketing 74,361 7,694 5,288 58,374 3,005 General and administrative 9,819 2,700 2,378 2,362 2,379 Depreciation and amortization 134,942 21,129 19,732 79,105 14,976 Total operating expenses - 93,864 - 10,426 - 8,861 - 69,382 - 5,195 Operating loss Other income (expense): 6,159 3,090 1,348 972 749 Interest expense, net - 791 1,146 - 252 15 - 1,700 Changes in fair value of warrant liabilities 5,157 5,847 - 690 0 0 Gain on extinguishment of debts, net - 668 - 29 - 122 - 18 - 499 Other income, net 9,857 10,054 284 969 - 1,450 Total other income (loss) - 103,721 - 20,480 - 9,145 - 70,351 - 3,745 Loss before income tax expense 499 289 72 76 62 Income tax expense - 104,220 - 20,769 - 9,217 - 70,427 - 3,807 Net loss attributable to Near Pte. Ltd. Net loss per share: - 1,076.28 - 183.72 - 83.7 - 771.28 - 52.92 Basic and diluted Weighted - average shares outstanding: 96,835 113,044 110,121 91,312 71,964 Basic and diluted www.near.com 32

Reconciliation of GAAP Net Loss to Adjusted EBITDA Near Intelligence Inc. unaudited reconciliation of GAAP to Non - GAAP Operating Results (in USD thousands) Three Months Ended Three Months Ended March 31, 2023 Full Year 2022 December 31, 2022 September 30, 2022 June 30, 2022 March 31, 2022 Net loss to Adjusted EBITDA (19,158) (104,220) (20,769) (9,217) (70,427) (3,807) Net loss 5,839 66,475 1,702 1,683 63,043 47 Stock - based compensation related to RSUs 6,802 1,937 1,245 559 19 114 One - time expenses 2,722 9,819 2,700 2,378 2,362 2,379 Depreciation and amortization 3,999 6,159 3,090 1,348 972 749 Interest expense (7,304) (791) 1,146 (252) 15 (1,700) Changes in fair value of warrant liabilities 5 (668) (29) (122) (18) (499) Other expenses (income) 121 499 289 72 76 62 Provision for income taxes - 5,157 5,847 (690) 0 0 (Gain) / Loss on extinguishment of debts, net (6,975) (15,633) (4,779) (4,241) (3,958) (2,655) Adjusted EBITDA www.near.com 33 Note: During Q2 2022, Near Pte. Ltd. and the Company, Near Intelligence Holdings Inc. USA entered into an Exchange and Recapitalization Agreement dated June 13, 2022 wherein Near Pte. Ltd. exchanged all of the current common stock for a combination of common stock and preferred stock of the Company such that (a) the number of shares in common stock of the Company held by Near Pte. Ltd. is equivalent, on a 1000:1 basis, to the number of outstanding common stock of Near Pte. Ltd.; and (b) the number of each series of preferred stock of the Company is equivalent, on a 1000:1 basis, to the number of outstanding shares of the similarly named series of preferred stock of Near Pte. Ltd. Rights, preferences and privileges of each class of stock of the Company mimic the rights, preferences and privileges of the corresponding stock of Near Pte Ltd. Thereby, the Company's capital structure would consist of 71,963.894 shares of common stock and 307,298.151 shares of various series of preferred stock. This has been given effect for weighted average outstanding shares and EPS for Q1 2022 for purpose of comparisons.

www.near.com Thank You Connect with us at www.near.com