0001828105 stpr:AZ rtpz:HippoEnterprisesIncAndSubsidiariesMember 2020-04-01 2020-06-30
As filed with the Securities and Exchange Commission on August 24, 2021
Registration No. 333-
UNITED STATES
SECURITIES AND EXCHANGE COMMISSION
Washington, D.C. 20549
FORM
S-1
REGISTRATION STATEMENT
UNDER
THE SECURITIES ACT OF 1933
Hippo Holdings Inc.
(Exact Name of Registrant as Specified in Its Charter)
Delaware | 6770 | 32- 0662604 | ||
(State or other jurisdiction of incorporation or organization) | (Primary Standard Industrial Classification Code Number) | (I.R.S. Employer Identification Number) |
150 Forest Avenue
Palo Alto, California 94301
(650)
294-8463
(Address, including zip code, and telephone number, including area code, of Registrant’s principal executive offices)
Tracy Bowden
General Counsel
Hippo Holdings Inc.
150 Forest Avenue
Palo Alto, California 94301
(650)
294-9463
(Name, address, including zip code, and telephone number, including area code, of agent for service)
Copies to:
Tad J. Freese
Latham & Watkins LLP
140 Scott Drive
Menlo Park, California 94025
(650)
328-4600
Approximate date of commencement of proposed sale of the securities to the public
If any of the securities being registered on this Form are to be offered on a delayed or continuous basis pursuant to Rule 415 under the Securities Act of 1933 (the “Securities Act”) check the following box: ☒
If this Form is filed to register additional securities for an offering pursuant to Rule 462(b) under the Securities Act, please check the following box and list the Securities Act registration statement number of the earlier effective registration statement for the same offering. ☐
If this Form is a post-effective amendment filed pursuant to Rule 462(c) under the Securities Act, check the following box and list the Securities Act registration statement number of the earlier effective registration statement for the same offering. ☐
If this Form is a post-effective amendment filed pursuant to Rule 462(d) under the Securities Act, check the following box and list the Securities Act registration statement number of the earlier effective registration statement for the same offering. ☐
Indicate by check mark whether the registrant is a large accelerated filer, an accelerated filer, a
non-accelerated
filer, smaller reporting company, or an emerging growth company. See the definitions of “large accelerated filer,” “accelerated filer,” “smaller reporting company,” and “emerging growth company” inRule 12b-2
of the Exchange Act.| Large accelerated filer | ☐ | Accelerated filer | ☐ | |||
| Non-accelerated filer | ☒ | Smaller reporting company | ☒ | |||
| Emerging growth company | ☒ | |||||
If an emerging growth company, indicate by check mark if the registrant has elected not to use the extended transition period for complying with any new or revised financial accounting standards provided pursuant to Section 7(a)(2)(B) of the Securities Act. ☐
CALCULATION OF REGISTRATION FEE
Title of each class of securities to be registered | Amount to be registered | Proposed maximum offering price per security | Proposed maximum aggregate offering price | Amount of registration fee | ||||
Common stock (1)(2) | 386,233,06 5 | $4.20 (3) | $1,624,110,038 (3) | $177,190.40 | ||||
Warrants (1) | 4,400,000 | $— (4) | $— (4) | $— | ||||
Common stock (1)(5) | 5,037,463 | $11.50 (6) | $57,930,824.50 (6) | $6,320.25 | ||||
Total | $ | $183,510.65 | ||||||
| (1) | Pursuant to Rule 416(a) of the Securities Act, there are also being registered an indeterminable number of additional securities as may be issued to prevent dilution resulting from stock splits, stock dividends or similar transactions. |
| (2) | The number of shares of common stock being registered represents the sum of (a) 316,640,538 shares of common stock issued in connection with the Merger (as defined below), (b) 55,000,000 shares of common stock issued to certain qualified institutional buyers and accredited investors in private placements consummated in connection with the Business Combination (as defined below) and (c) 14,592,527 shares of common stock reserved for issuance upon the exercise of options to purchase common stock. |
| (3) | Estimated solely for the purpose of calculating the registration fee, based on the average of the high and low prices of the common stock of Hippo Holdings on the New York Stock Exchange (the “NYSE”) on August 20, 2021 (such date being within five business days of the date that this registration statement was first filed with the SEC). This calculation is in accordance with Rule 457(c) of the Securities Act. |
| (4) | In accordance with Rule 457(g), the entire registration fee for the warrants is allocated to the shares of common stock underlying the warrants, and no separate fee is payable for the warrants. |
| (5) | Reflects the shares of common stock that may be issued upon exercise of outstanding warrants, with each warrant exercisable for one share of common stock, subject to adjustment, for an exercise price of $11.50 per share. |
| (6) | Calculated pursuant to Rule 457(g) under the Securities Act, based on the exercise price of the warrants. |
The registrant hereby amends this registration statement on such date or dates as may be necessary to delay its effective date until the registrant shall file a further amendment which specifically states that this registration statement shall thereafter become effective in accordance with Section 8(a) of the Securities Act or until this registration statement shall become effective on such date as the SEC, acting pursuant to said Section 8(a), may determine.
The information in this preliminary prospectus is not complete and may be changed. We may not sell these securities until the registration statement filed with the Securities and Exchange Commission is effective. This preliminary prospectus is not an offer to sell these securities and it is not soliciting an offer to buy these securities in any jurisdiction where the offer or sale is not permitted.
SUBJECT TO COMPLETION, DATED AUGUST 24, 2021

PROSPECTUS FOR
UP TO 386,233,065 SHARES OF COMMON STOCK AND
UP TO 5,037,463 WARRANTS TO PURCHASE SHARES OF COMMON STOCK
OF
HIPPO HOLDINGS INC.
This prospectus relates to (i) the resale by certain of the selling securityholders named in this prospectus (each a “Selling Securityholder” and, collectively, the “Selling Securityholders”) of up to 316,640,538 shares of common stock, par value $0.0001 per share (the “common stock”) issued in connection with the Merger (as defined below), (ii) the resale by certain of the Selling Securityholders of up to 55,000,000 shares of common stock issued in the PIPE Investment (as defined below), (iii) the issuance by us and resale of 14,592,527 shares of common stock reserved for issuance upon the exercise of options to purchase common stock and (iv) the issuance by us and resale of up to 5,037,463 shares of common stock upon the exercise of outstanding warrants. This prospectus also relates to the resale of up to 4,400,000 of our outstanding warrants originally purchased in a private placement by certain of the Selling Securityholders.
On August 2, 2021, we consummated the transactions contemplated by that certain Agreement and Plan of Merger, dated as of March 3, 2021 (the “Merger Agreement”), by and among Reinvent Technology Partners Z, a Cayman Islands exempted company (“RTPZ”), RTPZ Merger Sub Inc., a Delaware corporation and a direct wholly owned subsidiary of RTPZ (“Merger Sub”), and Hippo Enterprises Inc., a Delaware corporation (“Old Hippo”). As contemplated by the Merger Agreement, RTPZ was domesticated as a Delaware corporation and changed its name to “Hippo Holdings Inc.” (the “Domestication”). Following the Domestication, Merger Sub merged with and into Old Hippo, the separate corporate existence of Merger Sub ceased and Old Hippo survived as a wholly owned subsidiary of Hippo Holdings (the “First Merger”). Immediately following the First Merger, Old Hippo (as the surviving corporation of the First Merger) merged with and into Hippo Holdings, the separate corporate existence of Old Hippo ceased, and Hippo Holdings became the surviving corporation (together with the First Merger and the Domestication, the “Business Combination”).
We are registering the resale of shares of common stock and warrants as required by (i) an amended and restated registration rights agreement, dated as of August 2, 2021 (the “Registration Rights Agreement”), entered into by and among Hippo Holdings Inc., Reinvent Sponsor Z LLC, former directors and officers of RTPZ and certain former stockholders of Old Hippo and (ii) the subscription agreements entered into by and between RTPZ and certain qualified institutional buyers and accredited investors relating to the purchase of shares of common stock in private placements consummated in connection with the Business Combination.
We are also registering the (i) resale of other shares of common stock held by certain of our shareholders and affiliates and (ii) the issuance and resale of shares of common stock reserved for issuance upon the exercise of options to purchase shares of common stock held by certain of our current and former employees.
We will receive the proceeds from any exercise of the warrants or options for cash, but not from the resale of the shares of common stock or warrants by the Selling Securityholders.
We will bear all costs, expenses and fees in connection with the registration of the shares of common stock and warrants. The Selling Securityholders will bear all commissions and discounts, if any, attributable to their respective sales of the shares of common stock and warrants.
Our common stock trades on the New York Stock Exchange (the “NYSE”) under the ticker symbol “HIPO” and our warrants trade on the NYSE under the ticker symbol “HIPO.WS”. On August 23, 2021, the closing sale price of our common stock as reported by the NYSE was $3.99 per share and the closing price of our warrants was $11.50 per warrant.
We are an “emerging growth company” under applicable Securities and Exchange Commission rules and, as such, have elected to comply with certain reduced public company disclosure requirements for this prospectus and future filings. See “.”
Prospectus Summary — Implications of Being an Emerging Growth Company
Investing in shares of our common stock or warrants involves risks that are described in the “Risk Factors” section beginning on page 6 of this prospectus.
Neither the Securities and Exchange Commission nor any state securities commission has approved or disapproved of the securities to be issued under this prospectus or determined if this prospectus is truthful or complete. Any representation to the contrary is a criminal offense.
The date of this prospectus is .
TABLE OF CONTENTS
Page | ||||
| ii | ||||
| v | ||||
| 1 | ||||
| 6 | ||||
| 49 | ||||
| 50 | ||||
| 51 | ||||
| 65 | ||||
| 85 | ||||
| 121 | ||||
| 127 | ||||
| 131 | ||||
| 139 | ||||
| 141 | ||||
| 154 | ||||
| 164 | ||||
| 175 | ||||
| 176 | ||||
| 179 | ||||
| 179 | ||||
| 179 | ||||
| F-1 | ||||
You should rely only on the information contained in this prospectus. No one has been authorized to provide you with information that is different from that contained in this prospectus. This prospectus is dated as of the date set forth on the cover hereof. You should not assume that the information contained in this prospectus is accurate as of any date other than that date.
i
SELECTED DEFINITIONS
Unless otherwise stated in this prospectus or the context otherwise requires, references to:
| • | “Business Combination” are to the Domestication together with the Merger; |
| • | “Bylaws” are to our bylaws dated as of July 30, 2021; |
| • | “Cayman Constitutional Documents” are to RTPZ’s Amended and Restated Memorandum of Association under Cayman Islands Companies Law and RTPZ’s Articles of Association, each as amended from time to time; |
| • | “Cayman Islands Companies Law” are to the Cayman Islands Companies Act (As Revised); |
| • | “Certificate of Incorporation” are our certificate of incorporation dated as of July 30, 2021; |
| • | “Closing” are to the closing of the Business Combination; |
| • | “Continental” are to Continental Stock Transfer & Trust Company; |
| • | “DGCL” are to the General Corporation Law of the State of Delaware; |
| • | “Domestication” are to the domestication of RTPZ as a corporation incorporated in the State of Delaware; |
| • | “Effective Time” are to the effective time of the Merger; |
| • | “ESPP” are to the Hippo Holdings Inc. 2021 Employee Stock Purchase Plan; |
| • | “Exchange Act” are to the Securities Exchange Act of 1934, as amended; |
| • | “Exchange Ratio” are to the quotient obtained by dividing (i) the Aggregate Merger Consideration by (ii) the aggregate fully-diluted number of shares of Hippo common stock issued and outstanding immediately prior to the First Merger; |
| • | “GAAP” are to accounting principles generally accepted in the United States of America; |
| • | “Hippo” are to Hippo Holdings Inc. and its consolidated subsidiaries and businesses, including Spinnaker Insurance Company, after the Business Combination; |
| • | “Hippo Holdings common stock” are to shares of Hippo Holdings common stock, par value $0.0001 per share; |
| • | “Hippo Holdings Inc.” or “Hippo Holdings” are to RTPZ after the Domestication and its name change from Reinvent Technology Partners Z to Hippo Holdings Inc.; |
| • | “Hippo Holdings options” are to options to purchase shares of Hippo Holdings common stock; |
| • | “Hippo notes” are to the convertible promissory notes issued by Hippo and convertible into shares of Hippo common stock; |
| • | “Incentive Award Plan” are to the Hippo Holdings Inc. 2021 Incentive Award Plan; |
| • | “initial public offering” are to RTPZ’s initial public offering that was consummated on November 23, 2020; |
| • | “IPO registration statement” are to the Registration Statement on Form S-1 (333-249799) filed by RTPZ in connection with its initial public offering, which became effective on November 18, 2020; |
| • | “IRS” are to the U.S. Internal Revenue Service; |
| • | “JOBS Act” are to the Jumpstart Our Business Startups Act of 2012; |
| • | “Merger” are to the merger of Merger Sub with and into Old Hippo, with Old Hippo surviving the merger as a wholly owned subsidiary of Hippo Holdings; |
ii
| • | “Merger Sub” means RTPZ Merger Sub Inc., a Delaware corporation and a direct wholly owned subsidiary of RTPZ prior to the Business Combination, which, as a result of the Merger, merged into Old Hippo; |
| • | “NYSE” are to the New York Stock Exchange; |
| • | “Old Hippo” are to Hippo Enterprises Inc. prior to the Business Combination, which became a wholly owned subsidiary of Hippo Holdings and later merged into Hippo Holdings as a result of the Business Combination; |
| • | “Old Hippo capital stock” are to shares of Old Hippo common stock and Old Hippo preferred stock. |
| • | “Old Hippo common stock” are to shares of Old Hippo common stock, par value $0.00001 per share; |
| • | “Old Hippo options” are to options to purchase shares of Old Hippo common stock; |
| • | “Old Hippo warrants” are to the warrants to purchase shares of Hippo capital stock outstanding prior to the Effective Time; |
| • | “Old Hippo preferred stock” are to the Series A-1 preferred stock, Series A-2 preferred stock, Series B preferred stock, Series C-1 preferred stock, Series C preferred stock, Series D preferred stock and Series E preferred stock of Old Hippo; |
| • | “Organizational Documents” are to the Certificate of Incorporation and the Bylaws; |
| • | “PIPE Investment” are to the purchase of shares of Hippo Holdings common stock pursuant to the Subscription Agreements; |
| • | “PIPE Investors” are to those certain investors participating in the PIPE Investment pursuant to the Subscription Agreements; |
| • | “private placement warrants” are to the RTPZ private placement warrants outstanding as of the date of this prospectus and the warrants of Hippo Holdings issued as a matter of law upon the conversion thereof at the time of the Domestication; |
| • | “pro forma” are to giving pro forma effect to the Business Combination; |
| • | “public shareholders” are to holders of public shares, whether acquired in RTPZ’s initial public offering or acquired in the secondary market; |
| • | “public shares” are to the RTPZ Class A ordinary shares (including those that underlie the units of RTPZ) that were offered and sold by RTPZ in its initial public offering and registered pursuant to the IPO registration statement and the shares of Hippo Holdings common stock issued as a matter of law upon the conversion thereof on the effective date of the Domestication. |
| • | “public warrants” are to the redeemable warrants (including those that underlie the units of RTPZ) that were offered and sold by RTPZ in its initial public offering and registered pursuant to the IPO registration statement or the redeemable warrants of Hippo Holdings issued as a matter of law upon the conversion thereof at the time of the Domestication; |
| • | “redemption” are to each redemption of public shares for cash pursuant to the Cayman Constitutional Documents and the Organizational Documents; |
| • | “Registration Rights Agreement” are to the Registration Rights Agreement entered into by and among Hippo Holdings, the Sponsor and the other holders of RTPZ Class B ordinary shares, certain former stockholders of Hippo, and Reinvent Capital Fund LP, as amended and modified from time to time; |
| • | “RTPZ” are to Reinvent Technology Partners Z prior to its domestication as a corporation in the State of Delaware; |
iii
| • | “RTPZ Class A ordinary shares” are to RTPZ’s Class A ordinary shares, par value $0.0001 per share; |
| • | “RTPZ Class B ordinary shares” are to RTPZ’s Class B ordinary shares, par value $0.0001 per share; |
| • | “RTPZ founder shares” are to the 5,750,000 RTPZ Class B ordinary shares purchased by the Sponsor in a private placement prior to the initial public offering for an aggregate purchase price of $25,000 (or approximately $0.004 per share), and the RTPZ Class A ordinary shares that will be issued upon the conversion thereof; |
| • | “Sarbanes-Oxley Act” are to the Sarbanes-Oxley Act of 2002; |
| • | “SEC” are to the United States Securities and Exchange Commission; |
| • | “Securities Act” are to the Securities Act of 1933, as amended; |
| • | “Selling Securityholder” are to the selling securityholders named in this prospectus; |
| • | “Sponsor” are to Reinvent Sponsor Z LLC, a Cayman Islands limited liability company; |
| • | “Sponsor Agreement” are to that certain Sponsor Agreement, dated March 3, 2021, by and between RTPZ and Hippo, as amended and modified from time to time; |
| • | “Subscription Agreement” are to that certain Sponsor Agreement, dated March 3, 2021, by and between RTPZ and Hippo, as amended and modified from time to time; |
| • | “Sponsor Shares” are to the RTPZ founder shares that were beneficially owned by the Sponsor as of the Domestication. |
| • | “Third Party PIPE Investor” are to any PIPE Investor who is not (i) Reinvent Capital Fund LP, (ii) the Sponsor, or (iii) a Hippo PIPE Investor; |
| • | “Transaction” are to Old Hippo becoming a wholly owned subsidiary of Hippo Holdings as a result of Merger Sub, a direct wholly owned subsidiary of RTPZ, merging with and into Old Hippo, with Old Hippo surviving as a wholly owned subsidiary of Hippo Holdings; |
| • | “trust account” are to the trust account established at the consummation of RTPZ’s initial public offering at JPMorgan Chase Bank, N.A. and maintained by Continental, acting as trustee; |
| • | “Warrant Agreement” is to the Warrant Agreement, dated as of November 18, 2020, by and between RTPZ and Continental, as warrant agent, as amended; and |
| • | “warrants” are to the public warrants and the private placement warrants. |
Additionally, unless the context otherwise requires, references in this prospectus to the “Company,” “we,” “us” or “our” refer to Hippo Holdings Inc. and its subsidiaries following the Closing.
iv
CAUTIONARY STATEMENT REGARDING FORWARD-LOOKING STATEMENTS
This prospectus contains statements that are forward-looking and as such are not historical facts. This includes, without limitation, statements regarding the financial position, business strategy and the plans and objectives of management for our future operations. These statements constitute projections, forecasts and
forward-looking
statements, and are not guarantees of performance. Such statements can be identified by the fact that they do not relate strictly to historical or current facts. When used in this prospectus, words such as “anticipate,” “believe,” “continue,” “could,” “estimate,” “expect,” “intend,” “may,” “might,” “plan,” “possible,” “potential,” “predict,” “project,” “should,” “strive,” “would” and similar expressions may identify forward-looking statements, but the absence of these words does not mean that a statement is not forward-looking.Forward-looking statements in this prospectus and in any document incorporated by reference in this prospectus may include, for example, statements about:
| • | our public securities’ liquidity and trading; |
| • | our future capital needs following the Business Combination; |
| • | our success in retaining or recruiting, or changes required in, our officers, key employees or directors following the completion of the Business Combination; |
| • | our future results of operations and financial positions; |
| • | our ability to attract, retain, and expand our customer base; |
| • | our ability to maintain and enhance our brand and reputation; |
| • | our lack of operating history and ability to attain profitability; |
| • | our ability to effectively manage the growth of our business; |
| • | the effects of seasonal trends on our results of operation; |
| • | our ability to attain greater value from each customer; |
| • | our ability to compete effectively in our industry; |
| • | our ability to maintain reinsurance contracts; |
| • | our ability to utilize our proprietary technology; |
| • | our ability to underwrite risks accurately and charge profitable rates; |
| • | our ability to protect our intellectual property; |
| • | our ability to expand our product offerings or improve existing ones; |
| • | our ability to attract and retain personnel; |
| • | potential harm caused by misappropriation of our data and compromises in cybersecurity; |
| • | potential harm caused by changes in internet search engines’ methodologies; |
| • | our ability to raise additional capital; |
| • | fluctuations in our results of operation and operating metrics; |
| • | our ability to receive, process, store, use and share data, and compliance with laws and regulations related to data privacy and data security; |
| • | our ability to stay in compliance with laws and regulation that currently apply, or become applicable, to our business both in the United States and internationally; |
| • | our inability to predict the lasting impacts of COVID-19 to our business in particular, and the global economy generally; |
v
| • | our expected uses of the cash on our balance sheet following the Business Combination; and |
| • | other factors detailed under the section entitled “ Risk Factors. |
These forward-looking statements are based on information available as of the date of this prospectus and current expectations, forecasts and assumptions, and involve a number of judgments, risks and uncertainties. Accordingly, forward-looking statements should not be relied upon as representing our views as of any subsequent date, and we do not undertake any obligation to update forward-looking statements to reflect events or circumstances after the date they were made, whether as a result of new information, future events or otherwise, except as may be required under applicable securities laws.
As a result of a number of known and unknown risks and uncertainties, our actual results or performance may be materially different from those expressed or implied by these forward-looking statements. You should not place undue reliance on these forward-looking statements.
vi
PROSPECTUS SUMMARY
This summary highlights selected information from this prospectus and may not contain all of the information that is important to you in making an investment decision. Before investing in our securities, you should carefully read this entire prospectus, including our financial statements and the related notes included in this prospectus and the information set forth under the headings “Risk Factors” and “Management’s Discussion and Analysis of Financial Condition and Results of Operations.” See also the section entitled “Where You Can Find Additional Information.”
Our Company
We are a different kind of home protection company, built from the ground up to provide a new standard of care and protection for homeowners. Our goal is to make homes safer and better protected so customers spend less time worrying about the burdens of homeownership and more time enjoying their homes and the life within. Harnessing real-time data, smart home technology, and a growing suite of home services, we have created an integrated home protection platform.
The home insurance industry has long been defined by incumbents that Hippo Holdings believes deliver a passive, high-friction experience to policyholders. Hippo Holdings views these incumbents as constrained by outdated captive-agent distribution models, legacy technology, and strong incentives not to disrupt their businesses. Accordingly, in our view, the industry has not seen meaningful innovation in decades. We believe this results in a flawed customer experience that creates a transactional, adversarial relationship — one that pits insurance companies and their “policyholders” against each other in
a zero-sum game. The
outcome of this misalignment is an experience that is out of touch with the needs of modern homeowners.Modern technology provides an opportunity to transform the $110 billion U.S. home insurance industry, enabling advancements and efficiencies across the customer lifecycle. We believe there is significant opportunity in this market, expected to reach nearly $140 billion by 2025, for a digital-first, customer-centric company like Hippo Holdings.
Hippo Holdings harnesses technology and data to fundamentally rebuild the home insurance experience around the customer’s needs at every stage of the relationship. Hippo Holdings facilitates an active partnership with its customers to help prevent losses, which in turn creates better results for Hippo Holdings and the customer.
• | Hippo Holdings makes policies fast and easy to buy. |
• | Hippo Holdings’ policies are designed for the modern homeowner. |
• | Hippo Holdings has designed a proactive, human approach to claims, enabled by technology. |
Beyond a core insurance experience that is simple, intuitive, and human, Hippo Holdings focuses its resources on its true promise: better outcomes for homeowners. Hippo Holdings has created an integrated home protection platform, which offers a growing suite of proactive features designed to prevent loss and provide greater peace of mind.
| • | Hippo Holdings has pioneered what it believes is the most widely adopted Smart Home program in the U.S. industry. |
| • | Hippo Holdings proactively helps its customers maintain and protect their homes |
Our intuitive and proactive protection is designed to reduce the likelihood of a loss, while also deepening our customer relationships, and improving loyalty and retention. Hippo Holdings’ customers rate us 4.9 out of 5
1
stars (based on reviews collected by us on our web page) and reward us with a
90-day
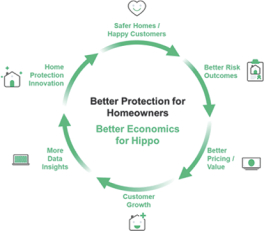
average overall Net Promoter Score of 75, according to our survey (vs. the insurance industry average of 35 in 2020, according to data from Statista, Inc.).This partnership is designed to create a virtuous cycle. By helping to make homes safer, Hippo Holdings helps deliver better risk outcomes and increase customer loyalty, which improves Hippo Holdings’ customer lifetime value (“LTV”). This enables Hippo Holdings to invest in expanding its product offering, customer value proposition, and marketing programs, which should attract more customers. Growth in customers generates more data and insights to fuel further innovation in Hippo Holdings’ product experience and improved underwriting precision. This is designed to result in even safer homes and more loyal customers. We believe this virtuous cycle, combined with our significant existing scale, deep partnerships and compelling unit economics, will propel us to our goal of becoming a trusted household name synonymous with home protection.
Aligned Interest: When our Customers Win, We Win
The success of our strategy is demonstrated in its financial and operating metrics. Over its history, Hippo Holdings has grown consistently while also reducing loss frequency and improving premium retention.
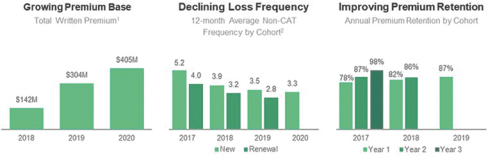
| (1) | Spinnaker and North American Advantage Insurance Services LLC (“NAAIS”) are presented on a pro forma basis as of January 1, 2018. For more information please see “ Recent Acquisition: Spinnaker Insurance Company |
| (2) | Frequency defined as number of claims divided by the total number of units of exposure, where a unit of exposure is defined as one policy year earned. For example, one policy in force written 24 months ago, represents 2x units of exposure. The cohorts are 12-month cohorts starting on 8/1 of each calendar year. |
2
Since its inception, Hippo Holdings has incurred operating losses, including net losses attributable to Hippo Holdings of $141.5 million for the year ended December 31, 2020. Hippo Holdings had an accumulated deficit of $256.6 million as of December 31, 2020. We expect to continue to incur operating losses for the foreseeable future due to continued investments thatto make inbusiness and, as a result,may require additional capital resources to grow its business. For a discussion of risks applicable to Hippo Holdings’ business, including with respect to its history of net losses and its ability to grow its business, please see the section entitled “.”
we intend
our
we
Risk Factors — Risks Related to Our Business
Background
On August 2, 2021, we consummated the transactions contemplated by the Merger Agreement. As contemplated by the Merger Agreement, RTPZ, a blank check company incorporated on October 2, 2020 as a Cayman Islands exempted company, was domesticated as a Delaware corporation and changed its name to “Hippo Holdings Inc.” on July 30, 2021. Following the Domestication, Merger Sub merged with and into Old Hippo, the separate corporate existence of Merger Sub ceased, and Old Hippo survived as a wholly owned subsidiary of Hippo Holdings. Immediately following the First Merger, Old Hippo (as the surviving corporation of the Merger) merged with and into Hippo Holdings, the separate corporate existence of Old Hippo ceased, and Hippo Holdings became the surviving corporation.
The rights of holders of our common stock and warrants are governed by our Certificate of Incorporation, our Bylaws and the DGCL, and, in the case of the warrants, the Warrant Agreement, as amended. See the section entitled “Description of Securities.”
Risk Factors
Our business is subject to a number of risks of which you should be aware before making an investment decision. These risks are discussed more fully in the “Risk Factors” section of this prospectus immediately following this prospectus summary. These risks include the following:
| • | We have a history of net losses and we may not achieve or maintain profitability in the future. |
| • | Our success and ability to grow our business depend on retaining and expanding our customer base. If we fail to add new customers or retain current customers, our business, revenue, operating results and financial condition could be harmed. |
| • | The “Hippo” brand may not become as widely known as incumbents’ or other competitors’ brands or the brand may become tarnished. |
| • | Denial of claims or our failure to accurately and timely pay claims could materially and adversely affect our business, financial condition, results of operations and prospects. |
| • | Our limited operating history makes it difficult to evaluate our current business performance, implementation of our business model and our future prospects. |
| • | We may not be able to manage our growth effectively. |
| • | Intense competition in the segments of the insurance industry in which we operate could negatively affect our ability to attain or increase profitability. |
| • | Reinsurance may be unavailable at current coverage, limits or pricing, which may limit our ability to write new or renew existing business. Furthermore, reinsurance subjects our insurance company subsidiaries to counterparty credit and performance risk and may not be adequate to protect us against losses, which could have a material effect on our results of operations and financial condition. |
3
| • | Failure to maintain our risk-based capital at the required levels could adversely affect the ability of our insurance subsidiaries to maintain regulatory authority to conduct our business. |
| • | Failure to maintain our financial strength ratings could adversely affect the ability of our insurance company subsidiaries to conduct our business as currently conducted. |
| • | If we are unable to expand our product offerings, our prospects for future growth may be adversely affected. |
| • | Our proprietary technology, which relies on third party data, may not operate properly or as we expect it to. |
| • | Our technology platform may not operate properly or as we expect it to operate. |
| • | Our future success depends on our ability to continue to develop and implement our technology, and to maintain the confidentiality of this technology. |
Accounting Treatment
The Transaction is accounted for as a reverse recapitalization under GAAP. Under the guidance in ASC 805, RTPZ is treated as the “acquired” company for financial reporting purposes. This determination is primarily based on Hippo Holdings stockholders comprising a relative majority of the voting power of Hippo Holdings and having the ability to nominate the members of the board of directors of Hippo Holdings, Old Hippo’s operations prior to the Transaction comprising the only ongoing operations of Hippo Holdings, and Old Hippo’s senior management comprising a majority of the senior management of Hippo Holdings. Accordingly, for accounting purposes, the financial statements of Hippo Holdings represent a continuation of the financial statements of Old Hippo with the Transaction being treated as the equivalent of Old Hippo issuing stock for the net assets of RTPZ, accompanied by a recapitalization whereby no goodwill or other intangible assets are recorded. Operations prior to the Transaction are presented as those of Old Hippo in future reports of Hippo Holdings.
Emerging Growth Company Status
Section 102(b)(1) of the JOBS Act exempts emerging growth companies from being required to comply with new or revised financial accounting standards until private companies are required to comply with the new or revised financial accounting standards. The JOBS Act provides that a company can choose not to take advantage of the extended transition period and comply with the requirements that apply to
non-emerging
growth companies, and any such election to not take advantage of the extended transition period is irrevocable.We are an “emerging growth company” as defined in Section 2(a) of the Securities Act, and we have elected to take advantage of the benefits of the extended transition period for new or revised financial accounting standards. We will remain an emerging growth company until the earliest of (i) the last day of the fiscal year in which the market value of Hippo Holdings common stock that is held by
non-affiliates exceeds
$700 million as of the end of that year’s second fiscal quarter, (ii) the last day of the fiscal year in which we have total annual gross revenue of $1.07 billion or more during such fiscal year (as indexed for inflation), (iii) the date on which we have issued more than $1 billion innon-convertible debt
in the prior three-year period or (iv) December 31, 2025, and we expect to continue to take advantage of the benefits of the extended transition period, although we may decide to early adopt such new or revised accounting standards to the extent permitted by such standards. This may make it difficult or impossible to compare our financial results with the financial results of another public company that is either not an emerging growth company or is an emerging growth company that has chosen not to take advantage of the extended transition period exemptions because of the potential differences in accounting standards used.4
Corporate Information
Our principal executive office is located at 150 Forest Avenue, Palo Alto, California 94301. Our telephone number is (650)
294-8463.
Our website address is www.hippo.com. Information contained on our website is not a part of this prospectus, and the inclusion of our website address in this prospectus is an inactive textual reference only.5
RISK FACTORS
An investment in our securities involves a high degree of risk. You should carefully consider the risks described below before making an investment decision. Our business, prospects, financial condition or operating results could be harmed by any of these risks, as well as other risks not currently known to us or that we currently consider immaterial. The trading price of our securities could decline due to any of these risks, and, as a result, you may lose all or part of your investment. Certain statements in “Risk Factors” are forward-looking statements. See “Cautionary Statement Regarding Forward-Looking Statements.”
Risks Related to Our Business
We have a history of net losses and we may not achieve or maintain profitability in the future.
Old Hippo incurred net losses on an annual basis since its incorporation in 2015 and had an accumulated deficit of $115.1 million, $256.6 million and $536.4 million as of December 31, 2019, December 31, 2020 and June 30, 2021, respectively. Old Hippo incurred net losses of $83.1 million and $141.5 million in the years ended December 31, 2019 and December 31, 2020, respectively. Old Hippo also incurred net losses of $279.8 million for the six months ended June 30, 2021. We expect to make significant investments to further develop and expand our business. In particular, we expect to continue to expend substantial financial and other resources on marketing and advertising as part of our strategy to increase our customer base. The marketing and advertising expenses that we incur are typically expensed immediately while most revenues that they generate are recognized ratably over the
12-month
term of each insurance policy that we write. This timing difference can therefore result in expenses that exceed the related revenue generated in any given year and create a net loss. In addition, we expect to continue to increase our headcount significantly in the coming years. As a public company, we will also incur significant legal, accounting and other expenses that Old Hippo did not incur as a private company. We expect that our net loss will increase in the near term as we continue to make such investments to grow our business. Despite these investments, we may not succeed in increasing our revenue on the timeline that we expect or in an amount sufficient to lower our net loss and ultimately become profitable. Moreover, if our revenue declines, we may not be able to reduce costs in a timely manner because many of our costs are fixed, at least in the short term. In addition, if we reduce variable costs to respond to losses, this may limit our ability to sign up new customers and grow our revenues. Accordingly, we may not achieve or maintain profitability and we may continue to incur significant losses in the future.Our success and ability to grow our business depend on retaining and expanding our customer base. If we fail to add new customers or retain current customers, our business, revenue, operating results and financial condition could be harmed.
We believe that growth of our business and revenue depends upon our ability to continue to grow our business in the geographic markets that we currently serve by retaining our existing customers and adding new customers in our current as well as new geographic markets and new insurance and
non-insurance
home-related products. Expanding into new geographic markets and introducing new products takes time, requires us to navigate and comply with extensive regulations, and may occur more slowly than we expect or than it has occurred in the past. If we lose customers, our value will diminish. In particular, while loss performance has improved over time as more customers renew their policies and remain customers for longer, a future loss of customers could lead to higher loss ratios or loss ratios that cease to decline or declining revenue, any of which would adversely impact our profitability. If we fail to remain competitive on customer experience, pricing, or insurance coverage options, our ability to grow and retain our business may also be adversely affected. In addition, we may fail to accurately predict risk segmentation of new and renewal customers or potential customers, which could also reduce our profitability.While a key part of our business strategy is to retain and add customers in our existing markets, we also intend to expand our operations into new markets and new products. In doing so, we may incur losses or
6
otherwise fail to enter new markets or introduce new products successfully. Our expansion into new markets and new products may place us in unfamiliar competitive environments and involve various risks, including competition, government regulation, the need to invest significant resources, and the possibility that returns on such investments will not be achieved for several years or at all.
There are many factors that could negatively affect our ability to grow our customer base, including if:
| • | we fail to effectively use search engines, social media platforms, content-based online advertising, and other online sources for generating traffic to our website; |
| • | potential customers in a particular marketplace or more generally do not meet our underwriting guidelines; |
| • | our products are not competitive in terms of customer experience, pricing, or insurance coverage options; |
| • | our competitors mimic our digital platform or develop other innovative services, causing current and potential customers to purchase their insurance products instead of our products; |
| • | we lose customers to new market entrants and/or existing competitors; |
| • | we do not obtain regulatory approvals necessary for expansion into new markets or in relation to our products (such as line, form, underwriting and rating approvals) or such approvals contain conditions that impose restrictions on our operations (such as limitations on growth); |
| • | our digital platform experiences disruptions; |
| • | we suffer reputational harm to our brand resulting from negative publicity, whether accurate or inaccurate; |
| • | we fail to expand geographically; |
| • | we fail to offer new and competitive products, to provide effective updates to our existing products or to keep pace with technological improvements in our industry; |
| • | we are unable to maintain traditional retail agent relationships; |
| • | customers have difficulty installing, updating or otherwise accessing our website on mobile devices or web browsers as a result of actions by us or third parties; |
| • | customers are unable or unwilling to adopt or embrace new technology; |
| • | technical or other problems frustrate the customer experience, particularly if those problems prevent us from generating quotes or paying claims in a fast and reliable manner; or |
| • | we are unable to address customer concerns regarding the content, data privacy, and security generally or for our digital platform specifically. |
Our inability to overcome these challenges could impair our ability to attract new customers and retain existing customers, and could have a material adverse effect on our business, revenue, operating results and financial condition.
The “Hippo” brand may not become as widely known as incumbents’ or other competitors’ brands or the brand may become tarnished.
Many of our competitors have brands that are well recognized. We spend considerable money and other resources to create brand awareness and build our reputation. We may not be able to build brand awareness, and our efforts at building, maintaining and enhancing our reputation could fail. Complaints or negative publicity about our business practices, our marketing and advertising campaigns, our compliance with applicable laws and regulations, the integrity of the data that we provide to consumers or business partners, data privacy and security
7
issues, and other aspects of our business, whether valid or not, could diminish confidence in our brand, which could adversely affect our reputation and business. As we expand our product offerings and enter new markets, we need to establish our reputation with new customers, and to the extent we are not successful in creating positive impressions, our business in these newer markets could be adversely affected. There can be no assurance that we will be able to maintain or enhance our reputation, and failure to do so could materially adversely affect our business, results of operations and financial condition. If we are unable to maintain or enhance consumer awareness of our brand cost-effectively, our business, results of operations and financial condition could be materially adversely affected.
Denial of claims or our failure to accurately and timely pay claims could materially and adversely affect our business, financial condition, results of operations and prospects.
We must accurately and timely evaluate and pay claims that are made under our policies. Many factors affect our ability to pay claims accurately and timely, including the efficiency of our claims processing, the training and experience of our claims adjusters, including our third-party claims administrators and adjusters, and our ability to develop or select and implement appropriate procedures and systems to support our claims functions.
The speed by which our technology allows us to process and pay claims is a differentiating factor for our business and an increase in the average time to process claims could undermine our reputation and position in the insurance marketplace. Any failure to pay claims accurately or timely could also lead to regulatory and administrative actions or material litigation, loss or reduction in reinsurance recoverable, or result in damage to our reputation, any one of which could materially and adversely affect our business, financial condition, results of operations, and prospects.
If our claims adjusters or third-party claims administrators are unable to effectively process our volume of claims, our ability to grow our business while maintaining high levels of customer satisfaction could be compromised, which in turn, could adversely affect our reputation and operating margins.
Our limited operating history makes it difficult to evaluate our current business performance, implementation of our business model and our future prospects.
Old Hippo launched its business to sell homeowners insurance in 2015, began selling policies as an insurance producer in 2017 and began underwriting and retaining risks under insurance policies as an insurance company in 2020. Due to this limited operating history and the rapid growth Old Hippo experienced since it began operations, our operating results are hard to predict, and Old Hippo’s historical results may not be indicative of, or comparable to, our future results. We also cannot provide any assurance that the data that we collect will provide useful measures for evaluating our business model. Our inability to adequately assess our performance and growth could have a material adverse effect on our brand, business, financial condition and results of operations.
We may not be able to manage our growth effectively.
Old Hippo’s revenue grew from $34.7 million for the year ended December 31, 2019 to $51.6 million for the year ended December 31, 2020. Old Hippo’s total employees grew from 215 as of December 31, 2019, to 399 as of December 31, 2020 and to 593 as of June 30, 2021. In addition, from December 31, 2019 to June 30, 2021, Old Hippo expanded from offering Hippo’s current insurance policies in 20 states to 37 states. This rapid growth has placed and may continue to place significant demands on our management and our operational and financial resources. Old Hippo has hired and we expect to continue hiring additional personnel to support our rapid growth. Our corporate and organizational structure is becoming more complex as we continue to acquire companies, add additional insurance and
non-insurance
products, expand our operations and add and integrate more employees. We will need to enhance our operational, legal and compliance, financial and management8
controls as well as our reporting systems and procedures to account for our Company’s growth. We will require significant capital expenditures and the allocation of valuable management resources to grow and change in these areas without undermining our corporate culture of rapid innovation, teamwork and attention to the insurance-buying experience for the customer. If we cannot manage our growth effectively to maintain the accuracy, quality and efficiency of our customers’ insurance-buying experience, as well as their experience as ongoing customers, our business could be harmed as a result, and our results of operations and financial condition could be materially and adversely affected.
Intense competition in the segments of the insurance industry in which we operate could negatively affect our ability to attain or increase profitability.
The homeowners insurance market is highly competitive with carriers competing through product coverage, reputation, financial strength, advertising, price, customer service and distribution.
We face significant competition from traditional insurance companies for homeowners. Competitors include companies such as Allstate, Farmers, Liberty Mutual, State Farm and Travelers. These companies are larger than us and have significant competitive advantages over us, including greater name recognition, higher financial strength ratings, greater resources, additional access to capital and more types of insurance coverage to offer, such as auto, umbrella and life, than we currently do (or expect to offer in the future). Our future growth will depend in large part on our ability to grow our homeowners insurance business in which traditional insurance companies retain certain advantages. In particular, unlike us, many of these competitors offer consumers the ability to purchase homeowners insurance and multiple other types of insurance coverage and “bundle” them together into one policy and, in certain circumstances, include an umbrella liability policy for additional coverage at competitive prices. Although we expect to continue to grow vertically and offer additional home-related products (including
non-insurance
products), we do not currently expect to expand into other types of insurance. New insurance andnon-insurance
products could take months or years to be approved by regulatory authorities, or may not be approved at all.Moreover, as we expand into new lines of business and offer additional
non-insurance
home-related products beyond homeowners insurance, we could face intense competition from companies that are already established in such markets. Innon-insurance
products we face competition from large technology companies, such as Alphabet and Amazon, that have significant resources and long standing relationships with customers across a variety of products.Further various large technology companies that have recently started operating in adjacent insurance categories that may in the future offer homeowners insurance products. Technology companies may in the future begin operating and offering products at better and more competitive customer experience, pricing, and insurance coverage options than us, which could cause our results of operations and financial condition to be materially and adversely affected. In addition, traditional insurance companies may seek to adapt their businesses to sell insurance by offering modernized coverage or
non-insurance
products like we do, including offering home care and maintenance products. Given their size, resources, customer penetration and other competitive advantages, they may be able to erode any market advantage we may currently have over them.We also face competition from existing and new “insurtech” insurance companies, such as Lemonade, and “insurtech” agencies whose use of digital platforms including for sales, underwriting and claims is similar to ours. These competitors may be able to introduce new sales, underwriting and claims systems that are viewed more attractively than ours by insurance consumers. These models require significantly less infrastructure and capital expenditures than traditional insurance business and can be operated without the need to be licensed as an insurance company (as we did prior to our acquisition of Spinnaker). Accordingly, the barriers of entry for new insurtech companies may be low and competitors may be able to begin operating and build scale quickly.
9
Reinsurance may be unavailable at current coverage, limits or pricing, which may limit our ability to write new or renew existing business. Furthermore, reinsurance subjects our insurance company subsidiaries to counterparty credit and performance risk and may not be adequate to protect us against losses, which could have a material effect on our results of operations and financial condition.
Reinsurance is a contract by which an insurer, which may be referred to as the ceding insurer, agrees with a second insurer, called a reinsurer, that the reinsurer will cover a portion of the losses incurred by the ceding insurer in the event a claim is made under a policy issued by the ceding insurer, in exchange for a premium. The insurance companies that underwrite our insurance products including, but not limited to, our subsidiary Spinnaker, purchase reinsurance to help manage their exposure to property and casualty insurance risks including attritional and catastrophic risks. Although our reinsurance counterparties are liable to us according to the terms of the reinsurance contracts, we remain primarily liable to our customers as the direct insurer on all risks reinsured. As a result, reinsurance does not eliminate or limit in any way the obligation of insurance companies that underwrite our insurance products, including Spinnaker, to pay claims, and we are subject to the risk that one or more reinsurers will be unable or unwilling to honor its obligations, or that the reinsurers will not pay in a timely fashion. Reinsurers may become financially unsound by the time they are called upon to pay amounts due, which may not occur for many years, in which case we may have no legal ability to recover what is due to us under our agreement with such reinsurers. Any disputes with reinsurers regarding coverage under reinsurance contracts could be time consuming, costly and uncertain of success.
Our primary
non-catastrophe
associated reinsurance contracts generally have a fixed term and caps on liability. Each reinsurer’s share in the interest and liabilities related to the reinsurance contract varies, and the reinsurers are severally, but not jointly, liable under the applicable reinsurance contract. Further, these reinsurance agreements may not be required to cover renewals of policies that the insurance carrier is required by law to renew or write, and we may not be able to lawfully cancel ornon-renew
insurance policies in a manner that assures ongoing reinsurance protection under our reinsurance contracts.We may change the structure of our reinsurance arrangements in the future, which may impact our overall risk profile and financial and capital condition. We may be unable to negotiate new reinsurance contracts to provide continuous coverage or negotiate reinsurance on the same coverage, limits, pricing or other terms as are currently available, as such availability depends in part on factors outside of our control. The existing or new contracts may not provide sufficient reinsurance protection. Market forces and external factors, such as significant losses from hurricanes, wildfires, severe weather, or terrorist attacks or an increase in capital requirements, impact the availability coverage, limits and pricing of the reinsurance we purchase. If we are unable to maintain our current level of reinsurance coverage, extend our expiring reinsurance contracts or purchase new reinsurance protection with the coverage, limits, and pricing and in the amounts that we consider sufficient, we would have to either accept an increase in our retained risk exposure, reduce our insurance writings or develop or seek other alternatives.
The unavailability of acceptable and sufficient reinsurance protection would have an adverse impact on our business model, which depends on reinsurance companies to absorb a portion of the losses incurred by our insurance carriers. If our affiliated and unaffiliated insurance carriers are unable to obtain adequate reinsurance at reasonable rates, we would have to increase our retained risk exposure or reduce the level of our underwriting commitments, each of which could have a material adverse effect upon our business volume and profitability. Alternately, if available, we could elect to pay higher than desired rates for reinsurance coverage, which could have a material adverse effect upon our profitability until policy premium rates could be raised, in most cases subject to prior approval by state insurance regulators, to offset this additional cost.
Failure to maintain our risk-based capital at the required levels could adversely affect the ability of our insurance subsidiaries to maintain regulatory authority to conduct our business.
Our insurance company subsidiaries must maintain sufficient capital to comply with insurance regulatory requirements and maintain authority to conduct our business. The National Association of Insurance
10
Commissioners (“NAIC”) has developed a system to test the adequacy of statutory capital of U.S.-based insurers, known as risk-based capital that all states have adopted. This system establishes the minimum amount of capital necessary for an insurance company to support its overall business operations. It identifies insurance companies including property-casualty insurers, that may not be inadequately capitalized by looking at certain inherent risks of each insurer’s assets and liabilities and its mix of net written premiums. Insurers falling below a calculated threshold may be subject to varying degrees of regulatory action, including supervision, rehabilitation or liquidation. Moreover, as a relatively new entrant to the insurance industry, we currently face restrictions in Florida and New York with regard to minimum capital requirements, and may face additional capital requirements as compared to those of our larger and more established competitors. Failure to maintain adequate risk-based capital at the required levels could adversely affect the ability of our insurance company subsidiaries to maintain regulatory authority to conduct their business.
Failure to maintain our financial strength ratings could adversely affect the ability of our insurance company subsidiaries to conduct our business as currently conducted.
Financial strength ratings are an important factor in evaluating and establishing the competitive position of insurance companies. These ratings represent the independent opinion of an insurer’s financial strength, operating performance and ability to meet policyholder obligations. Rating agencies could downgrade or change the outlook on ratings due to:
| • | changes in the financial profile of one of our insurance companies; |
| • | changes in a rating agency’s determination of the amount of capital required to maintain a particular rating; or |
| • | increases in the perceived risk of our investment portfolio, a reduced confidence in management or our business strategy, or other considerations that may or may not be under our control. |
A downgrade in Spinnaker’s financial strength ratings could have a material effect on our sales, competitiveness, customer retention, the marketability of our product offerings, liquidity, access to and cost of borrowing, results of operations and financial condition.
If we are unable to underwrite risks accurately and charge competitive yet profitable rates to our customers, our business, results of operations and financial condition will be adversely affected.
In general, the premiums for our insurance policies are established at the time a policy is issued and, therefore, before all of our underlying costs are known. The accuracy of our pricing is subject to our ability to adequately assess risks, estimate losses and comply with state insurance regulations. Like other insurance companies, we rely on estimates and assumptions in setting our premium rates. We also utilize the data that we gather through our interactions with our customers, as evaluated and curated by our proprietary technology.
Establishing adequate premium rates is necessary, together with investment income, if any, to generate sufficient revenue to offset losses, loss adjustment expenses (“LAE”), acquisition expenses and other costs. If we do not accurately assess the risks that we underwrite, we may not charge adequate premiums to cover our losses and expenses, which would adversely affect our results of operations and our profitability. Moreover, if we determine that our prices are too low, insurance regulations may preclude us from being able to
non-renew
insurance contracts,non-renew
customers, or raise prices. Alternatively, we could set our premiums too high, which could reduce our competitiveness and lead to lower revenues, which could have a material adverse effect on our business, results of operations and financial condition.Pricing involves the acquisition and analysis of historical loss data and the projection of future trends, loss costs and expenses and inflation trends, among other factors, for each of our products in multiple risk tiers and many different markets. In order to accurately price our policies, we must, among other factors:
| • | collect and properly and accurately analyze a substantial volume of data from our customers; |
11
| • | develop, test and apply appropriate actuarial projections and rating formulas; |
| • | review and evaluate competitive product offerings and pricing dynamics; |
| • | closely monitor and timely recognize changes in trends; and |
| • | project both frequency and severity of our customers’ losses with reasonable accuracy. |
There are no assurances that we will have success in implementing our pricing methodology accurately in accordance with our assumptions. Our ability to accurately price our policies is subject to a number of risks and uncertainties, including, but not limited to:
| • | insufficient, inaccurate or unreliable data; |
| • | incorrect or incomplete analysis of available data; |
| • | uncertainties generally inherent in estimates and assumptions; |
| • | our failure to implement appropriate actuarial projections and rating formulas or other pricing methodologies; |
| • | incorrect or incomplete analysis of the competitive environment; |
| • | regulatory constraints on rate increases or coverage limitations; |
| • | our failure to accurately estimate investment yields and the duration of our liability for loss and loss adjustment expenses; and |
| • | unanticipated litigation, court decisions, and legislative or regulatory actions or changes to the existing regulatory landscape. |
To address the potential errors or desired or required changes in our current premium rates, we may be compelled to increase the amount allocated to cover policy claims, increased expenses, or to address other economic factors resulting in an increase in future premium rates or to additionally or alternatively adopt different underwriting standards. Any of these changes may result in a decline in new business and renewals and, as a result, have a material adverse effect on our business, results of operations and financial condition.
Our proprietary technology, which relies on third party data, may not operate properly or as we expect it to.
We utilize the third party data gathered from the insurance application process to determine whether or not to write a particular policy and, if so, how to price that particular policy. The continuous development, maintenance and operation of our technology is expensive and complex, and may involve unforeseen difficulties including material performance problems, undetected defects or errors, for example, with new capabilities incorporating artificial intelligence. We may encounter technical obstacles, and it is possible that we may discover additional problems that prevent our technology from operating properly. If our data analytics do not function reliably, we may incorrectly price insurance products for our customers or incorrectly pay or deny claims made by our customers. Either of these situations could result in customer dissatisfaction with us, which could cause customers to cancel their insurance policies with us, prevent prospective customers from obtaining new insurance policies, or cause us to underprice policies or overpay claims. Any of these eventualities could result in a material and adverse effect on our business, results of operations and financial condition.
Our technology platform may not operate properly or as we expect it to operate.
We utilize our technology platform and gather customer data in order to determine whether or not to write and how to price our insurance products. Additionally, our claims operation utilizes our technology platform to manage claims and we intend to expand our technology platform to further support the processing of some or all of our claims. Our technology platform is expensive and complex, its continuous development, maintenance and
12
operation may entail unforeseen difficulties including material performance problems or undetected defects or errors. We may encounter technical obstacles, and it is possible that we may discover additional problems that prevent our technology from operating properly. If our platform does not function reliably, we may incorrectly select or renew our customers, price insurance and
non-insurance
products for our customers or incorrectly pay or deny claims made by our customers. These errors could result in selecting an uneconomic mix of customers; in customer dissatisfaction with us, which could cause customers to cancel or fail to renew their insurance policies ornon-insurance
products with us or make it less likely that prospective customers obtain new insurance policies; in causing us to underprice policies or overpay claims; or in causing us to incorrectly deny policyholder claims and become subject to liability. Additionally, technology platform errors could result in failure to comply with applicable laws and regulations including, but not limited to, unintentional noncompliance with our rate and form filings, cancellation andnon-renewal
requirements, unfair trade and claims practices andnon-discrimination,
which could subject us to legal or regulatory liability and harm our brand and reputation. Any of these eventualities could result in a material adverse effect on our business, results of operations and financial condition.While we believe our
by-peril
pricing model to be more fair to consumers than multi-peril pricing models, it may yield results that customers find unfair. For instance, we may quote certain homeowners higher premiums than our competitors, if our pricing model determines that the customer is higher risk even though their higher-risk classification has not resulted in a claim on an individual basis. Such perception of unfairness could negatively impact our brand and reputation.Our future success depends on our ability to continue to develop and implement our technology, and to maintain the confidentiality of this technology.
Changes to existing regulations, their interpretation or implementation, or new regulations could impede our use of this technology, or require that we disclose our proprietary technology to our competitors, which could impair our competitive position and result in a material adverse effect on our business, results of operations and financial condition.
New legislation or legal requirements may affect how we communicate with our customers, which could have a material adverse effect on our business model, financial condition, and results of operations.
State and federal lawmakers, and insurance regulators are focusing upon the use of artificial intelligence broadly, including concerns about transparency, deception, and fairness in particular. Changes in laws or regulations, or changes in the interpretation of laws or regulations by a regulatory authority, specific to the use of artificial intelligence, may decrease our revenues and earnings and may require us to change the manner in which we conduct some aspects of our business. In addition, our business and operations are subject to various U.S. federal, state, and local consumer protection laws, including laws which place restrictions on the use of automated tools and technologies to communicate with wireless telephone subscribers or consumers generally. Although we have taken steps to comply with these laws, no assurance can be given that we will not be exposed to civil litigation or regulatory enforcement. Further, to the extent that any changes in law or regulation further restrict the ways in which we solicit, underwrite, or communicate with prospective or current customers before or during onboarding, customer care, or claims management, these restrictions could result in a material reduction in our customer acquisition and retention, reducing the growth prospects of our business, and adversely affecting our financial condition and future cash flows.
13
We rely on external data and our digital platform to collect and evaluate information that we utilize in producing, pricing and underwriting our insurance policies (in accordance with the rates, rules, and forms filed with our regulators, where required), managing claims and customer support, and improving business processes. Any legal or regulatory requirements that might restrict our ability to collect or utilize this data or our digital platform, or an outage by a data vendor could thus materially and adversely affect our business, financial condition, results of operations and prospects.
We use external data and our digital platform to collect and evaluate data points that we utilize in marketing, producing, pricing and underwriting certain of our insurance policies, managing claims and customer support, and improving business processes. To the extent such data points are utilized in the underwriting or rating of our insurance products these may be subject to prior regulatory filing, review and approval. If federal or state regulators were to determine that the type or source of data we collect, the process we use for collecting this data or how we use it results in failure to comply with applicable laws and regulations including, but not limited to, unfair trade and claims practices or
non-discrimination
laws, or otherwise violates existing laws and regulations these could limit, prohibit or restrict our collection or use of this data.In the U.S., the federal Gramm-Leach-Bliley Act and certain federal and state laws and regulations specifically aimed at insurance companies require providers of insurance products to consumers to implement certain measures, including requirements to disclose their privacy practices to consumers, allow consumers to
opt-in
oropt-out,
depending on the state, of the sharing of certain personal information with unaffiliated third parties, and maintain certain security controls to protect their information. State legislatures and regulators have and continue to issue regulations or pass legislation imposing requirements on insurance activities regarding the use of external data sources based on concerns about the potential for unfair discrimination, data privacy, and lack of consumer transparency associated with the use of external consumer data. If such laws or regulations were enacted federally or in a large number of states in which we operate, it could impact the integrity of our pricing and underwriting processes, as well as our customer service and claims management practices. A determination by federal or state regulators that the data points we utilize or the process we use for collecting this data unfairly discriminates against or violates the data privacy of some groups of people could also subject us to fines and other sanctions, including, but not limited to, disciplinary action, revocation and suspension of licenses, and withdrawal of product forms. Any such event could, in turn, materially and adversely affect our business, financial condition, results of operations and prospects, and make it harder for us to be profitable over time. Although we have implemented policies and procedures into our business operations that we feel are appropriately calibrated to our automation-driven operations, these policies and procedures may prove inadequate, resulting in a greater likelihood of inadvertent legal or compliance failures.Additionally, existing laws, future laws, and evolving attitudes about data privacy protection may impair our ability to collect, use, and maintain data points of sufficient type or quantity to continue to develop our technology in accordance with the current plans. For more information, see the below risk factor — “.”
We are subject to laws and regulations concerning our collection, processing, storage, sharing, disclosure and use of customer information and other sensitive data, and our actual or perceived failure to comply with data privacy and security laws and regulations could damage our reputation and brand and harm our business and operating results
Further, an outage from one of our data vendors could have a material adverse effect on our business, revenue, operating results and financial condition, especially if the outage frustrates the customer experience or prevents us from generating quotes, selling policies or paying claims.
We depend on search engines, content based online advertising and other online sources to attract consumers to our website, which may be affected by third party interference beyond our control. In addition, our producer and partner distribution channels are significant sources of new customers and could be impacted by third party interference or other factors. As we grow our customer acquisition costs may increase.
Our success depends on our ability to attract potential consumers to our website and convert them into customers in a cost-effective manner. We depend, in large part, on search engines, content-based online advertising and other online sources for traffic to our website, including, to a lesser extent, our social media platforms.
14
With respect to search engines, we are included in search results as a result of both paid search listings, where we purchase specific search terms that result in the inclusion of our advertisement, and free search listings, which depend on algorithms used by search engines. For paid search listings, if one or more of the search engines or other online sources on which we rely for purchased listings modifies or terminates its relationship with us, our expenses could rise, we could lose consumers and traffic to our website could decrease, any of which could have a material adverse effect on our business, results of operations and financial condition. For free search listings, if search engines on which we rely for algorithmic listings modify their algorithms, our websites may appear less prominently or not at all in search results, which could result in reduced traffic to our websites.
Our ability to maintain and increase the number of consumers directed to our products from digital platforms is not entirely within our control. Search engines, social media platforms and other online sources often revise their algorithms and introduce new advertising products. If one or more of the search engines or other online sources on which we rely for traffic to our website were to modify its general methodology for how it displays our advertisements or keyword search results, resulting in fewer consumers clicking through to our website, our business and operating results are likely to suffer. In addition, if our online display advertisements are no longer effective or are not able to reach certain consumers due to consumers’ use of
ad-blocking
software, or if our competitors bid more aggressively on online advertisements, our business and operating results could suffer.Additionally, changes in regulations could limit the ability of search engines and social media platforms, including, but not limited to, Google and Facebook, to collect data from customers and engage in targeted advertising, making them less effective in disseminating our advertisements to our target customers. For example, the proposed Designing Accounting Safeguards to Help Broaden Oversight and Regulations on Data (DASHBOARD) Act would mandate annual disclosure to the SEC of the type and “aggregate value” of user data used by harvesting companies, such as, but not limited to, Facebook, Google and Amazon, including how revenue is generated by user data and what measures are taken to protect the data. If the costs of advertising on search engines and social media platforms increase, we may incur additional marketing expenses or be required to allocate a larger portion of our marketing spend to other channels and our business and operating results could be adversely affected. Similarly, insurance brokerage and distribution regulation may limit our ability to rely on third party digital technology platforms to provide a link to our insurance platform through an application programming interface (“API”), if the third party distribution platforms are unable to continue to link to our insurance products pursuant to insurance law and regulations.
Besides onlinechannels, we also leverage other channels to secure customers, which benefits our growth and long-term vision of meeting customers where and when they want to buy. We utilize multiple indirect channels, including agency channels and partner channels, among others, which could be disrupted for a variety of reasons.
direct-to-consumer
The insurance producers we work with also have a direct relationship with their customers and could be incentivized to move them to a competitor. While we have gained significant traction within this channel, due to our innovation, relationships and technology, we could lose market share through our competitors’ innovation or new products. Competitors may also increase their commissions to increase their ability to attract specific risk-groups or geographic areas which could slow our ability to grow and increase profitability.
Our partners may attempt to recreate our capabilities independently or move their business to a new insurance partner or add additional insurance partners. Competitors could also develop innovative approaches or significant incentives that could impact our ability to grow, optimize channel economics or build new relationships.
We may require additional capital to grow our business, which may not be available on terms acceptable to us or at all.
To the extent that our present capital (including the funds generated by the Business Combination) is insufficient to meet future operating requirements (including regulatory capital requirements) or to cover losses,
15
we may need to raise additional funds through financings or curtail our projected growth. Many factors will affect our capital needs as well as their amount and timing, including our growth and profitability, risk retained and the availability of reinsurance, as well as market disruptions and other developments.
Historically, Old Hippo funded its operations, marketing expenditures and capital expenditures primarily through equity issuances, including through convertible note financings. Going forward, we intend to evaluate financing opportunities from time to time, and our ability to obtain financing will depend, among other things, on our development efforts, business plans and operating performance, and the condition of the capital markets at the time we seek financing. In addition, regulatory bodies may be required to approve additional equity, equity-linked, or debt issuances or other forms of financing that we may wish to pursue, and we cannot be certain that these approvals can be obtained. We cannot be certain that additional financing will be available to us on favorable terms, or at all.
If we raise additional funds through the issuance of equity, equity-linked or debt securities, those securities may have rights, preferences or privileges senior to those of our common stock, and our existing stockholders may experience dilution. Any debt financing secured by us in the future could require that a substantial portion of our operating cash flow be devoted to the payment of interest and principal on such indebtedness, which may decrease available funds for other business activities, and could involve restrictive covenants relating to our capital-raising activities and other financial and operational matters, which may make it more difficult for us to obtain additional capital and to pursue business opportunities.
If we are unable to obtain adequate financing or financing on terms satisfactory to us, when we require it, our ability to continue to support our business growth, maintain minimum amounts of risk-based capital and to respond to business challenges could be significantly limited, and our business, results of operations and financial condition could be adversely affected.
Interruptions or delays in the services provided by our providers of third-party technology platforms or our internet service providers could impair the operability of our website and may cause our business to suffer.
We currently rely on multiple providers of cloud infrastructure services, including Google Cloud Platform (“GCP”), Amazon Web Services (“AWS”), Salesforce.com (“SFDC”) and others (collectively, “Cloud Platforms”). We rely on the internet and, accordingly, depend on the continuous, reliable and secure operation of internet servers, related hardware and software, and network infrastructure. Our operations depend on protecting the virtual cloud infrastructure hosted in Cloud Platforms by maintaining its configuration, architecture, and interconnection specifications, as well as the information stored in these virtual data centers and which third-party internet service providers transmit. Furthermore, we have no physical access or control over the services provided by our Cloud Platforms. Although we have disaster recovery plans that utilize multiple Cloud Platforms locations, the data centers that we use are vulnerable to damage or interruption from human error, intentional bad acts, earthquakes, floods, fires, severe storms, war, terrorist attacks, power losses, hardware failures, systems failures, telecommunications failures and similar events, many of which are beyond our control, any of which could disrupt our services, prevent customers from accessing our products, destroy customer data, or prevent us from being able to continuously back up and record data. In the event of significant physical damage to one of these data centers, it may take a significant period of time to achieve full resumption of our services, and our disaster recovery planning may not account for all eventualities. Further, a prolonged Cloud Platform service disruption affecting our website for any of the foregoing reasons could damage our reputation with current and potential customers, expose us to liability, cause us to lose customers, or otherwise harm our business. In addition, any changes to our Cloud Platforms’ service levels may adversely affect our ability to meet the requirements of our customers. As our platform’s continuing and uninterrupted performance is critical to our success, sustained or repeated system failures would reduce the attractiveness of our offerings. We may also incur significant costs for using alternative platforms or taking other actions in preparation for, or in reaction to, events that damage the Cloud Platform services we use. Damage or interruptions to these data centers could harm
16
our business. Moreover, negative publicity arising from these types of disruptions could damage our reputation and may adversely impact use of our website. Insurance coverage may not be sufficient to compensate us for the potentially significant losses, including the potential harm to the future growth of our business that may result from interruptions in our services or products.
Our usage of Cloud Platforms enables us to order and reserve server capacity in varying amounts and sizes distributed across multiple regions. Our Cloud Platform approach provides us with computing and storage capacity pursuant to an agreement that continues until terminated by either party. Our Cloud Platform providers may terminate the agreement for multiple reasons (including, but not limited to, requirement to comply with a government request, security risk to others, breach of payment obligations or breach of contract). Termination of a Cloud Platform agreement may harm our ability to access data centers we need to host our website or to do so on terms as favorable as those we have today.
As we continue to expand the number of customers to whom we provide our products and services, we may not be able to scale our technology to accommodate the increased capacity requirements, which may result in interruptions or delays in service. In addition, the failure of Cloud Platforms’ data centers or third-party internet service providers to meet our capacity requirements could result in interruptions or delays in access to our website or impede our ability to scale our operations. In the event that one or more of our Cloud Platform service agreements are terminated, or there is a lapse of service, interruption of internet service provider connectivity or damage to such facilities, we could experience interruptions in access to our website as well as delays and additional expense in arranging new facilities and services, which could harm our business, results of operations, and financial condition.
Security incidents or real or perceived errors, failures or bugs in our systems or website could impair our operations, result in loss of personal customer information, damage our reputation and brand, and harm our business and operating results.
Our continued success is dependent on our systems, applications, and software continuing to operate and to meet the changing needs of our customers and users. We rely on our technology and engineering staff and vendors to successfully implement changes to and maintain our systems and services in an efficient and secure manner. Like all information systems and technology, our website may contain material errors, failures, vulnerabilities or bugs, particularly when new features or capabilities are released, and may be subject to computer viruses or malicious code,or other attacks, ransomware and similar incidents or disruptions from unauthorized use of our computer systems, as well as unintentional incidents causing data leakage, any of which could lead to interruptions, delays or website shutdowns, or could cause loss of critical data, or the unauthorized disclosure, access, acquisition, alteration or use of personal or other confidential information.
break-ins,
phishing impersonation attacks, attempts to overload our servers withdenial-of-service
In the ordinary course of business, we collect, store, and transmit information, including personal information, in relation to our current, past or potential customers, business partners, staff and contractors. We could be subject to a cyber-incident or other adverse event that threatens the security, confidentiality, integrity or availability of our information resources, including intentional attacks or unintentional events where parties gain unauthorized access to systems to disrupt operations, corrupt data or steal confidential information about subscribers, vendors and employees. For example, unauthorized parties could steal or access our customers’ names, email addresses, physical addresses, phone numbers and other information that we collect when providing insurance quotes. Outside parties may also attempt to fraudulently induce employees or customers to disclose sensitive information in order to gain access to our information or customers’ information. Further, our vendors are also susceptible to data breaches, including our payment processing vendors who handle customer credit card numbers or other payment information. While we use encryption and authentication technology licensed from third parties designed to effect secure transmission of such information, we cannot guarantee the security of the transfer and storage of personal information. Because the techniques used to obtain unauthorized access, disable or degrade service, or sabotage systems change frequently, often they are not recognized until launched against a
17
target, and may originate from less regulated and remote areas around the world, we may be unable to proactively address these techniques or to implement adequate preventative measures. Despite our efforts and processes to prevent breaches, our products and services, as well as our servers, computer systems, and those of third parties that we use in our operations are vulnerable to cybersecurity risks, including cyber-attacks such as viruses and worms, phishing attacks,
denial-of-service
attacks, physical or electronicbreak-ins,
third-party or employee theft or misuse, and similar disruptions from unauthorized tampering with our servers and computer systems or those of third parties that we use in our operations, which could lead to interruptions, delays, loss of critical data, unauthorized access to subscriber data, and loss of consumer confidence. In addition, we may be the target of email scams that attempt to acquire personal information or company assets.Security breaches, including by hackers or insiders, or any other types of data security or privacy related incidents could expose confidential or personal information, which could result in potential regulatory investigations, fines, penalties, compliance orders, liability, litigation and remediation costs, as well as reputational harm, any of which could materially adversely affect our business and financial results. It could also trigger claims by affected third parties. Further, even if we do not ourselves experience a cyber-incident, hacking against our competitors or other companies could create the perception among our customers or potential customers that our digital platform is not safe to use.
If we experience compromises to our security that result in technology performance, integrity, or availability problems, the complete shutdown of our website or the loss or unauthorized disclosure, access, acquisition, alteration or use of confidential information, customers may lose trust and confidence in us, and customers may decrease the use of our website, or stop using our services entirely. Further, outside parties may attempt to fraudulently induce employees or customers to disclose sensitive information in order to gain access to our information or customers’ information. A significant impact on the performance, reliability, security, and availability of our systems, software, or services may harm our reputation, impair our ability to operate, retain existing customers or attract new customers, and expose us to legal claims and government action, each of which could have a material adverse impact on our financial condition, results of operations and growth prospects.
Misconduct or fraudulent acts by employees, agents or third parties may expose us to financial loss, disruption of business, regulatory assessments and reputational harm.
We and the insurance industry are inherently susceptible to past and future misconduct or fraudulent activities by employees, representative agents, vendors, customers or other third parties. These activities could include fraud against the company, its employees and its customers through illegal or prohibited activities, or unauthorized acts or representations, unauthorized use or disclosure of personal or proprietary information.
Our success depends, in part, on our ability to establish and maintain relationships with quality and trustworthy service professionals.
We must continue to attract, retain and grow the number of skilled and reliable service professionals who can provide services across our products. In addition to skill and reliability, our customers want to work with service professionals and claims adjusters whom they trust to work in their homes and with whom they feel safe.
While we maintain screening processes to try to prevent unsuitable service professionals, these processes have limitations and, even with these safety measures, no assurances can be provided regarding the future behavior of any service provider. Inappropriate and/or unlawful behavior of service professionals generally, particularly any such behavior that compromises the trustworthiness of service providers and/or of the safety of our customers, could result in bad publicity and related damage to our reputation, detriment to our brands and brand-building efforts and/or actions by governmental and regulatory authorities, criminal proceedings and/or litigation. The occurrence of any of these events could, in turn, adversely affect our business, financial condition and results of operations.
18
We may be unable to prevent, monitor or detect fraudulent activity, including policy acquisitions or payments of claims that are fraudulent in nature.
If we fail to maintain adequate systems and processes to prevent, monitor and detect fraud, including employee fraud, agent fraud, fraudulent policy acquisitions, vendor fraud or fraudulent claims activity, or if inadvertent errors occur with such prevention, monitoring and detection systems due to human or computer error, our business could be materially adversely impacted. In the ordinary course of business in the insurance industry, we have experienced relatively isolated incidents of fraudulent activity that have not had a material impact on our business. However, we cannot be certain that our systems and processes will always be adequate in the face of increasingly sophisticated and ever-changing fraud schemes. We use a variety of tools to protect against fraud, but these tools may not always be successful at preventing such fraud.
We are periodically subject to examinations by our primary state insurance regulators, which could result in adverse examination findings and necessitate remedial actions.
Our primary insurance regulators are responsible for our supervision and examination. Spinnaker Insurance Company is currently domiciled in Illinois and “commercially domiciled” in Texas. Periodically, other insurance regulators perform examinations of insurance companies under their jurisdiction to assess compliance with applicable laws and regulations, financial condition and the conduct of regulated activities or may conduct targeted investigations. These examinations provide insurance regulators with a significant opportunity to review and scrutinize our business. If, as a result of an examination, an insurance regulator determines that our financial condition, capital resources, or other aspects of any of our operations are less than satisfactory, or that we are in violation of applicable laws or regulations, an insurance regulator could require us to take one or more remedial actions or otherwise subject us to regulatory scrutiny, impose fines and penalties, or take further actions. We cannot predict with precision the likelihood, nature, or extent of any necessary remedial actions, or financial impact if any, resulting from such an examination, or the associated costs of such remedial actions or regulatory scrutiny. Any regulatory or enforcement action or any regulatory order imposing remedial, injunctive, or other corrective action against us resulting from these examinations could have a material adverse effect on our business, reputation, financial condition or results of operations.
We are subject to laws and regulations concerning our collection, processing, storage, sharing, disclosure and use of customer information and other sensitive data, and our actual or perceived failure to comply with data privacy and security laws and regulations could damage our reputation and brand and harm our business and operating results.
In the ordinary course of business, we collect, store, and transmit information, including personal information, in relation to our current, past or potential customers, business partners, staff and contractors. In the U.S., there are numerous federal and state data privacy and protection laws and regulations governing the collection, use, disclosure, protection and other processing of personal information, including federal and state data privacy laws, data breach notification laws and consumer protection laws. For example, the California Consumer Privacy Act of 2018 (the “CCPA”), which became effective in January 2020, created new privacy rights for consumer residing in the state and imposes obligations on companies that process their personal information, including an obligation to provide certain new disclosures to such residents. Specifically, among other things, the CCPA creates new consumer rights, and imposes corresponding obligations on covered businesses, relating to the access to, deletion of, and sharing of personal information collected by covered businesses, including California residents’ right to access and delete their personal information, opt out of certain sharing and sales of their personal information, and receive detailed information about how their personal information is used. The law exempts from certain requirements of the CCPA certain information that is collected, processed, sold, or disclosed pursuant to the California Financial Information Privacy Act, the federal Gramm-Leach-Bliley Act or the federal Driver’s Privacy Protection Act. The definition of “personal information” in the CCPA is broad and may encompass other information that we maintain beyond that excluded under the Gramm-Leach-Bliley Act, the Driver’s Privacy Protection Act or the California Financial Information
19
Privacy Act exemption. Further, the CCPA allows for the California Attorney General to impose civil penalties for violations, as well as providing a private right of action for certain data breaches that result in the loss of personal information. This private right of action is expected to increase the likelihood of, and risks associated with, data breach litigation. In addition, it remains unclear how various provisions of the CCPA will be interpreted and enforced. California voters also recently passed the California Privacy Rights Act (“CPRA”), which will take effect on January 1, 2023. The CPRA significantly modifies the CCPA, including by imposing additional obligations on covered companies and expanding California consumers’ rights with respect to certain sensitive personal information, potentially resulting in further uncertainty and requiring us to incur additional costs and expenses in an effort to comply. Some observers have noted that the CCPA (and the CPRA) could mark the beginning of a trend toward more stringent privacy legislation in the United States, and multiple states have enacted, or are expected to enact, similar or more stringent laws. For example, in 2020, Nevada passed SB 220 which restricts the “selling” of personal information and, in 2021, Virginia passed the Consumer Data Protection Act (“CDPA”) which is set to take effect on January 1, 2023 and grants new privacy rights for Virginia residents. Additionally, we are subject to the federal Telephone Consumer Protection Act which restricts the making of telemarketing calls and the use of automatic telephone dialing systems. There is also discussion in Congress of a new comprehensive federal data protection and privacy law to which we likely would be subject if it is enacted. Such new laws and proposed legislation, if passed, could have conflicting requirements that could make compliance challenging, require us to expend significant resources to come into compliance, and restrict our ability to process certain personal information. The effects of the CCPA, and other similar state laws subsequently enacted, as well as possible future state or federal laws, are potentially significant and may require us to modify our data collection and processing practices and policies and to incur substantial costs and potential liability in an effort to comply with such legislation.
In the event of a data breach, we are also subject to breach notification laws in the jurisdictions in which we operate, including U.S. state laws, and the risk of litigation and regulatory enforcement actions. In addition, a number of federal and state laws and regulations relating to privacy affect and apply to the insurance industry specifically.
We may also face particular privacy, data security, and data protection risks in connection with requirements of the European Union’s (“E.U.”) General Data Protection Regulation 2016/679 (“GDPR”), the United Kingdom (“UK”) GDPR and UK Data Protection Act 2018 (which retains the GDPR in UK national law) and other data protection regulations in the E.U. and UK. Among other stringent requirements, the GDPR restricts transfers of data outside of the E.U. to third countries deemed to lack adequate privacy protections (such as the U.S.), unless an appropriate safeguard specified by the GDPR is implemented. A July 16, 2020 decision of the Court of Justice of the European Union invalidated a key mechanism for lawful data transfer to the U.S. and called into question the viability of its primary alternative. As such, the ability of companies to lawfully transfer personal data from the E.U. to the U.S. is presently uncertain. Other countries have enacted or are considering enacting similar cross-border data transfer rules or data localization requirements. These developments could limit our future ability to deliver our products in the E.U. and other foreign markets. In addition, any failure or perceived failure to comply with these rules may result in regulatory fines or penalties including orders that require us to change the way we process data.
Additionally, we are subject to the terms of our privacy policies and data privacy-related obligations to third parties. Any failure or perceived failure by us to comply with our privacy policies, our data privacy-related obligations to customers or other third parties, or our other data privacy-related legal obligations, may result in governmental or regulatory investigations, enforcement actions, regulatory fines, compliance orders, litigation or public statements against us by consumer advocacy groups or others, and could cause customers to lose trust in us, all of which could be costly and have an adverse effect on our business. In addition, new and changed rules and regulations regarding data privacy, data protection (in particular those that impact the use of artificial intelligence) and cross-border transfers of customer information could cause us to delay planned uses and disclosures of data to comply with applicable data privacy and data protection requirements. Moreover, if third parties that we work with violate applicable laws or our policies, such violations also may put personal
20
information at risk, which may result in increased regulatory scrutiny and have a material adverse effect to our reputation, business and operating results.
We employ third-party licensed data, software, technologies and intellectual property for use in our business, and the inability to maintain these licenses, or errors or defects in the data, software, technologies and intellectual property we license could result in increased costs or reduced service levels, which would adversely affect our business, financial condition and results of operations.
Our business relies on certain third-party data, software, technology and intellectual property that we obtain under licenses from other companies including insurance industry proprietary information that we license from Insurance Services Office, Inc. (“ISO”). We anticipate that we will continue to rely on such third-party data, software, technology and intellectual property and we may license additional third-party data, software, technology and intellectual property in the future. We cannot assure that these third-party licenses, or support for such licensed software and technologies, will continue to be available to us on commercially reasonable terms, if at all. Although we believe that there are commercially reasonable alternatives to the third-party products we currently license, other than proprietary information provided by ISO, this may not always be the case, or it may be difficult or costly to replace. In addition, integration of new third-party products may require significant work and require substantial investment of our time and resources. Also, should ISO refuse to license its proprietary information to us on the same terms that it offers to our competitors and we are unable to find a comparable replacement, we could be placed at a significant competitive disadvantage. In the event that we cannot renew and/or expand existing licenses, we may be required to discontinue or limit our use of the products that include or incorporate the licensed software, technology or other intellectual property. Any of these results could harm our business, results of operations and financial condition.
Any errors or defects in third-party data, software, technology and intellectual property that we license could result in errors that could harm our brand and business. We also cannot be certain that our licensors are not infringing the intellectual property rights of others or that our licensors have sufficient rights to the licensed software and technology in all jurisdictions in which we may operate. If we are unable to obtain or maintain rights to any of this software or technology because of intellectual property infringement claims brought by third parties against our licensors or against us, our ability to develop our services containing such software or technology could be severely limited and our business could be harmed. Many of the risks associated with the use of third-party software, technology and other intellectual property cannot be eliminated, and these risks could negatively affect our business.
Failure to protect or enforce our intellectual property rights could harm our business, results of operations and financial condition.
Our success is dependent in part on protecting our intellectual property rights and technology, including any source code, proprietary information, data, processes and other forms of information, knowhow and technology. We rely on a combination of patents, copyrights, trademarks, service marks, and trade secret laws to establish and protect our intellectual property. We also seek to control access to our proprietary information by entering into a combination of invention assignment agreements and nondisclosure agreements with our employees, consultants and with our third-party providers and strategic partners. While these agreements will give us contractual remedies upon any unauthorized use or disclosure of our proprietary business information or intellectual property, we cannot assure you that these agreements will be effective in controlling access to, and use and distribution of, our platform and proprietary information and we may not always be able to effectively monitor or prevent such unauthorized use of disclosure.
We also seek to protect our proprietary information and intellectual property though contractual restrictions in our commercial agreements with third party licensees, partners and other third parties. However, some license provisions that protect against unauthorized use, copying, transfer and disclosure of our technology may be unenforceable under the laws of certain jurisdictions and foreign countries. Certain arrangements with joint
21
development partners may limit our ability to protect, maintain, enforce or commercialize such intellectual property rights, including requiring agreement with or payment to our joint development partners before protecting, maintaining, licensing or initiating enforcement of such intellectual property rights, and may allow such joint development partners to register, maintain, enforce or license such intellectual property rights in a manner that may affect the value of the jointly-owned intellectual property or our ability to compete in the market.
We have filed, and may continue in the future to file, trademark and patent applications to protect certain of our innovations and intellectual property. However, we cannot guarantee that patents will issue on our pending patent applications or that we will be successful in registering our trademarks. Our existing intellectual property, and any intellectual property granted to us or that we otherwise acquire in the future, may be contested, circumvented or invalidated, and we may not be able to prevent third parties from infringing our rights to our intellectual property. Therefore, the exact effect of the protection of this intellectual property cannot be predicted with certainty. In addition, given the costs, effort, risks and downside of obtaining patent protection, including the requirement to ultimately disclose the invention to the public, we may choose not to seek patent protection for certain innovations. Any failure to adequately obtain such patent protection, or other intellectual property protection, could later prove to adversely impact our business.
While software and other of our proprietary works may be protected under copyright law, we have chosen not to register any copyrights in these works, and instead, primarily rely on protecting our software as a trade secret. In order to bring a copyright infringement lawsuit in the United States, the copyright must be registered. Accordingly, the remedies and damages available to us for unauthorized use of our software may be limited.
We currently hold various domain names relating to our brand, including hippoinsurance.com, among others. Failure to protect our domain names could adversely affect our reputation and brand and make it more difficult for users to find our website. We may be unable, without significant cost or at all, to prevent third parties from acquiring domain names that are similar to, infringe upon or otherwise decrease the value of our trademarks and other proprietary rights.
While we take precautions designed to protect our intellectual property, there are steps that we have not yet taken to protect our intellectual property on a global basis. Additionally, the steps that we have already taken to protect our intellectual property may not be sufficient or effective. Third parties may knowingly or unknowingly infringe our proprietary rights and third parties may challenge proprietary rights held by us and we may not be able to prevent infringement or misappropriation of our proprietary rights without incurring substantial expense. If third parties copy our technology and use our proprietary brand, content and information to create or enhance competing solutions and services, the value of our brand and other intangible assets may be diminished, competitors may be able to more effectively mimic our service and methods of operations, the perception of our business and service to customers and potential customers may become confused, and our ability to attract customers may be adversely affected. We may need to engage in litigation to enforce our rights. Litigation to protect and enforce our intellectual property rights could be costly, time-consuming and distracting to management and could result in the impairment or loss of portions of our intellectual property. Our efforts to enforce our intellectual property rights may be met with defenses, counterclaims and countersuits attacking the validity and enforceability of our intellectual property rights. Our inability to protect our proprietary technology against unauthorized copying or use, as well as any costly litigation or diversion of our management’s attention and resources, could impair the functionality of our platform, delay introductions of enhancements to our platform, result in our substituting inferior or more costly technologies into our platform or harm our reputation or brand.
Our services utilize third-party open source software components, which may pose particular risks to our proprietary software, technologies, products and services in a manner that could negatively affect our business.
The software powering our technology systems incorporates open source software and will continue to use open source software in the future. Use and distribution of open source software may entail greater risks than the
22
use of third-party commercial software as open source licensors generally do not provide support, warranties, indemnification or other contractual protections regarding infringement claims or the quality of the code. To the extent that our services depend upon the successful operation of open source software, any undetected errors or defects in this open source software could prevent the deployment or impair the functionality of our platform, delay new solutions introductions, result in a failure of our platform, and injure our reputation. For example, undetected errors or defects in open source software could render it vulnerable to breaches or security attacks, and, in conjunction, make our systems more vulnerable to data breaches. In addition, the public availability of such software may make it easier for others to compromise our platform.
Furthermore, some open source licenses contain requirements that we make available source code for modifications or derivative works we create based upon the type of open source software we use, or grant other licenses to our intellectual property. If we combine our proprietary software with open source software in a certain manner, we could, under certain open source licenses, be required to release or license the source code of our proprietary software to the public. In the event that portions of our proprietary software are determined to be subject to an open source license, we could be required to publicly release the affected portions of our source code or
re-engineer
all or a portion of our technology systems, each of which could reduce or eliminate the value of our technology systems. Such risk could be difficult or impossible to eliminate and could adversely affect our business, financial condition, and results of operations.We may be unable to prevent or address the misappropriation of our data.
From time to time, third parties may misappropriate our data through website scraping, bots or other means and aggregate this data on their websites with data from other companies. In addition, copycat websites may have attempted to and may in the future attempt to misappropriate data and imitate our brand or the functionality of our website. If we become aware of such websites, we intend to employ technological or legal measures in an attempt to halt their operations. However, we may be unable to detect all such websites in a timely manner and, even if we could, technological and legal measures may be insufficient to halt their operations. In some cases, particularly in the case of websites operating outside of the United States, our available remedies may not be adequate to protect us against the effect of the operation of such websites. Regardless of whether we can successfully enforce our rights against the operators of these websites, any measures that we may take could require us to expend significant financial or other resources, which could harm our business, results of operations or financial condition. In addition, to the extent that such activity creates confusion among consumers or advertisers, our brand and business could be harmed.
We rely on the experience and expertise of our founder, senior management team, highly-specialized insurance experts, key technical employees and other highly skilled personnel.
Our success depends upon the continued service of Assaf Wand, our
co-founder,
Chief Executive Officer and a member of our board of directors, and senior management team, highly-specialized insurance experts and key technical employees, as well as our ability to continue to attract and retain additional highly qualified personnel. Our future success depends on our continuing ability to identify, hire, develop, motivate, retain and integrate highly skilled personnel for all areas of our organization. If we are unable to attract the requisite personnel, our business and prospects may be adversely affected. Each of ourco-founder,
executive officers, specialized insurance experts, key technical personnel and other employees could terminate his or her relationship with us at any time. The loss of ourco-founder
or any other member of our senior management team, specialized insurance experts or key personnel might significantly delay or prevent the achievement of our strategic business objectives and could harm our business. We rely on a small number of highly-specialized insurance experts, the loss of any one of whom could have a disproportionate impact on our business. Competition in our industry for qualified employees is intense. Our compensation arrangements, such as our equity award programs, may not always be successful in attracting new employees and retaining and motivating our existing employees. Moreover, if and when the stock options or other equity awards are substantially vested, employees under such equity arrangements may be more likely to leave, particularly when the underlying shares have seen a value appreciation.23
Furthermore, several members of our management team were hired recently. If we are not able to integrate these new team members or if they do not perform adequately, our business may be harmed.
We face significant competition for personnel, particularly in California, where our headquarters is located and in Texas, where many of our technical employees are located. To attract top talent, we have to offer, and believe we will need to continue to offer, competitive compensation and benefits packages. We may also need to increase our employee compensation levels in response to competitor actions. If we are unable to hire new employees quickly enough to meet our needs, or otherwise fail to effectively manage our hiring needs or successfully integrate new hires, including our recently hired management team members, our efficiency, ability to meet forecasts and our employee morale, productivity and retention could suffer, which in turn could have an adverse effect on our business, results of operations and financial condition.
If our customers were to claim that the policies they purchased failed to provide adequate or appropriate coverage, we could face claims that could harm our business, results of operations and financial condition.
Although we aim to provide adequate and appropriate coverage under each of our policies, customers could purchase policies that prove to be inadequate or inappropriate. If such customers were to bring a claim or claims alleging that we failed in our responsibilities to provide them with the type or amount of coverage that they sought to purchase, we could be found liable, resulting in an adverse effect on our business, results of operations and financial condition. While we maintain errors and omissions insurance coverage to protect us against such liability, such coverage may be insufficient or inadequate.
We may become subject to claims under Israeli law for remuneration or royalties for assigned invention rights by our Israel-based contractors or employees, which could result in litigation and adversely affect our business.
We enter into assignment of invention agreements with employees and contractors, pursuant to which such employees and contractors assign to us all rights to any inventions created during and as a result of their employment or engagement with us. Under the Israeli Patents Law, 5727-1967 (the “Israeli Patents Law”), inventions conceived by an employee during and as a result of such employee’s employment are regarded as “Service Inventions,” which belong to the employer absent an agreement between the employee and employer providing otherwise.
The Israeli Patents Law also provides that if there is no agreement between an employer and an employee determining whether the employee is entitled to receive consideration for service inventions and on what terms, this will be determined by the Israeli Compensation and Royalties Committee (the “Committee”), a body constituted under the Israel Patents Law. Current case law clarifies that the right to receive consideration for Service Inventions can be waived by the employee and that in certain circumstances, such waiver does not necessarily have to be explicit. The Committee will examine, on abasis, the general contractual framework between the parties, using interpretation rules of general Israeli contract laws. Further, the Committee has not yet determined one specific formula for calculating this remuneration, but rather uses the criteria specified in the Israeli Patents Law.
case-by-case
In addition, with respect to contractors, there is no clear arrangement under the Israeli Patents Law with respect to contractors’ ownership in inventions developed by them. Therefore, it is considered best practice to include, in the contractor’s engagement agreement, a provision whereby the parties agree that the company engaging such contractor shall own all intellectual property rights conceived or developed by the contractor during and as a result of such contractor’s engagement with the company, including a clear and explicit assignment provision with respect thereto and a waiver to receive additional consideration.
Although we generally enter into agreements with our contractors and employees pursuant to which they (i) assign to us all rights in and to inventions developed by them during and as a result of their employment or
24
engagement with us; and (ii) waive any right to receive royalties, compensation or additional consideration in connection therewith (including, with respect to employees, waiver under Section 134 of the Israeli Patents Law), we may face claims demanding remuneration in consideration for assigned inventions. As a consequence of such claims, we could be required to pay additional remuneration or royalties to our current or former contractors or employees, or be forced to litigate such monetary claims, which could negatively affect our business.
Our company culture has contributed to our success and if we cannot maintain this culture as we grow, our business could be harmed.
We believe that our company culture has been critical to our success. We not only seek to engender a trusting relationship between our brand and our customers, but also among our employees. Our ability to continue to cultivate and maintain this culture is essential to our growth and continued success. We face a number of challenges that may affect our ability to sustain our corporate culture, including:
| • | failure to identify, attract, reward and retain people in leadership positions in our organization who share and further our culture, values and mission; |
| • | the increasing size and geographic diversity of our workforce, and our ability to promote a uniform and consistent culture across all our offices and employees; |
| • | competitive pressures to move in directions that may divert us from our mission, vision and values; |
| • | the continued challenges of a rapidly evolving industry; and |
| • | the increasing need to develop expertise in new areas of business that affect us. |
Our unique culture is one of our core characteristics that helps us to attract and retain key personnel. If we are not able to maintain our culture, we would have to incur additional costs and find alternative methods to recruit key employees, which in turn could cause our business, results of operations and financial condition to be adversely affected.
Our exposure to loss activity and regulation may be greater in states where we currently have most of our customers or where we are domiciled.
Approximately 70% of our total generated premium for the year ended December 31, 2020 originated from customers in California and Texas. As a result of this concentration, if a significant catastrophe event or series of catastrophe events occur, such as a natural disaster, severe weather (such as the Texas hail storms in 2019 or the recent Texas winter storm), or the recent outbreak of a novel strain of coronavirus
(“COVID-19”),
and cause material losses in California and Texas, our business, financial condition and results of operation could be materially adversely affected. Further, as compared to our competitors who operate on a wider geographic scale, any adverse changes in the regulatory or legal environment affecting property and casualty insurance in California and Texas may expose us to more significant risks. In addition, as we are domiciled in Illinois, any adverse changes in the regulatory environment affecting property and casualty insurance in Illinois may also expose us to more significant risks.Our product development cycles are complex and subject to regulatory approval, and we may incur significant expenses before we generate revenues, if any, from new products.
Because our insurance products require regulatory approvals, development cycles can take time. Moreover, development projects can be technically challenging and expensive, and may be delayed or defeated by the inability to obtain licensing or other regulatory approvals. The nature of these development cycles may cause us to experience delays between the time we incur expenses associated with research and development and the time we generate revenues, if any, from such expenses. If we expend a significant amount of resources on research and development and our efforts do not lead to the successful introduction or improvement of products that are competitive in the marketplace, this could materially and adversely affect our business and results of operations.
25
Additionally, anticipated customer demand for a product we are developing could decrease after the development cycle has commenced. Such decreased customer demand may cause us to fall short of our sales targets, and we may nonetheless be unable to avoid substantial costs associated with the product’s development. If we are unable to complete product development cycles successfully and in a timely fashion and generate revenues from such future products, the growth of our business may be harmed.
Our success depends upon the continued growth in the use of the internet for purchasing of insurance products.
We provide homeowners insurance products through our website that competes with traditional offline counterparts. While we also offer insurance through traditional, offline producers, the continued growth and acceptance of our products and services will depend, to a large extent, on the continued growth in commercial use of the internet and our ability to innovate and distinguish our products and services from traditional markets.
Purchasers of insurance may develop the perception that purchasing insurance products online is not as effective as purchasing such products through a producer or other traditional offline methods, and the homeowners insurance markets may not migrate online as quickly as (or at the levels that) we expect. Moreover, if, for any reason, an unfavorable perception develops that data automation is less efficacious than traditional offline methods of purchasing insurance, underwriting, claims processing, and other functions that use data automation, our business, results of operations and financial condition could be adversely affected.
New lines of business or new products and services may subject us to additional risks.
From time to time, we may implement or acquire new lines of business, including those outside of the insurance industry, or offer new products and services within existing lines of business. There are risks and uncertainties associated with these efforts, particularly in instances where the markets are not fully developed or are evolving. In developing and marketing new lines of business and new products and services, we may invest significant time and resources. In addition, new business ventures may require different strategic management competencies and risk considerations compared to those of a traditional insurance company or compared to those of our existing management team. External factors, such as regulatory compliance obligations, competitive alternatives, and shifting market preferences, may also impact the successful implementation of a new line of business or a new product or service. Failure to successfully manage these risks in the development and implementation of new lines of business or new products or services could have an adverse effect on our business, results of operations and financial condition.
Litigation and legal proceedings filed by or against us and our subsidiaries could have a material adverse effect on our business, results of operations and financial condition.
Litigation and other proceedings may include, but are not limited to, complaints from or litigation by vendors, employees, customers, our insurance companies, or reinsurers, related to alleged breaches of contract or otherwise. As our market share increases, competitors may pursue litigation to require us to change our business practices or offerings and limit our ability to compete effectively. As is typical in the insurance industry, we continually face risks associated with litigation of various types arising in the normal course of our business operations, including disputes relating to insurance claims under our policies as well as other general commercial and corporate litigation. Although we are not currently involved in any material litigation with our customers, members of the insurance industry are the target of class action lawsuits and other types of litigation, some of which involve claims for substantial or indeterminate amounts, and the outcomes of which are unpredictable. This litigation is based on a variety of issues, including the sale of insurance, and unfair trade or claim settlement practices. In addition, because we utilize our own and third party data, it is possible that customers or consumer groups could bring individual or class action claims, and regulators could bring actions alleging that our methods of collecting data and pricing risk are impermissibly discriminatory. We cannot predict with any certainty whether we will be involved in such litigation in the future or what impact such litigation would have on our business. If we were to be involved in litigation and it was determined adversely, it could require us to pay
26
significant damage amounts or to change aspects of our operations, either of which could have a material adverse effect on our financial results. Even claims without merit can be time-consuming and costly to defend and may divert management’s attention and resources away from our business and adversely affect our business, results of operations and financial condition. Additionally, lawsuits over claims that are not individually material could in the future become material if aggregated with a substantial number of similar lawsuits. In addition to increasing costs, a significant volume of customer complaints or litigation could adversely affect our brand and reputation, regardless of whether such allegations are valid or whether we are liable. We cannot predict with certainty the costs of defense, the costs of prosecution, applicability or adequacy of insurance coverage or the ultimate outcome of litigation or other proceedings filed by or against us, including remedies or damage awards, and adverse results in such litigation, and other proceedings may harm our business and financial condition. See “.”
Business — Legal Proceedings
Claims by others that we infringed their proprietary technology or other intellectual property rights could result in litigation which are expensive to support, and if resolved adversely, could harm our business.
Companies in the internet and technology industries are frequently subject to litigation based on allegations of infringement or other violations of trademarks, copyrights, patents and other intellectual property rights. As we gain an increasingly high public profile, the possibility of intellectual property rights claims against us grows and, from time to time, third parties may assert claims of infringement of intellectual property rights against us. There can be no assurance that we will be successful in defending against these allegations or reaching a business resolution that is satisfactory to us. In addition, future litigation may involve patent holding companies or other adverse patent owners who have no relevant product or service revenue and against whom our own patents may therefore provide little or no deterrence or protection. Many potential litigants, including some of our competitors and patent-holding companies, may now and in the future have significantly larger and more mature patent portfolios than us and have the ability to dedicate substantial resources to assert their intellectual property rights. Any claim of infringement by a third party, even those without merit, could cause us to incur substantial costs defending against the claim, could distract our management from our business and could require us to cease use of such intellectual property. Furthermore, because of the substantial amount of discovery required in connection with intellectual property litigation, we risk compromising our confidential information during this type of litigation. We may be required to settle such litigation on terms that are unfavorable to us. Similarly, we may be subject to an unfavorable judgment which may not be reversible or is not reversed upon appeal. The terms of such settlement or judgment may require us to pay substantial damages, royalties or other fees, or subject us to an injunction or other restrictions that prevent us from using or distributing our intellectual property, or from operating under our brand, each of which could adversely affect our business, results of operations and financial condition. Even if third party allegations of infringement do not result in litigation or are resolved in our favor or without significant expenses, the time and resources necessary to resolve them could harm our business, results of operations, financial condition and reputation.
With respect to any intellectual property rights claim, we may have to seek out a license to continue operations found to violate such rights, which may not be available on favorable or commercially reasonable terms and may significantly increase our operating expenses. Some licenses may be
non-exclusive,
and therefore our competitors may have access to the same technology licensed to us. If a third party does not offer us a license to its intellectual property on reasonable terms, or at all, we may be required to develop alternative,non-infringing
technology, which could require significant time (during which we would be unable to continue to offer our affected offerings), effort and expense and may ultimately not be successful. Any of these events could adversely affect our business, results of operations and financial condition.If we are unable to make acquisitions and investments, or unable to successfully integrate them into our business, our business, results of operations and financial condition could be adversely affected.
As part of our business strategy, we will continue to consider a wide array of potential strategic transactions, including acquisitions of and organizations of new businesses, new technologies, services and other assets and strategic investments that complement our business. We may evaluate target companies and make acquisitions in
27
the future. There is no assurance that such acquired or organized businesses will be successfully integrated into our existing business or generate substantial revenue.
Acquisitions involve numerous risks, any of which could harm our business and negatively affect our financial condition and results of operations, including:
| • | intense competition for suitable acquisition targets, which could increase prices and adversely affect our ability to consummate deals on favorable or acceptable terms; |
| • | failure or material delay in closing a transaction, including as a result of regulatory review and approvals; |
| • | inadequacy of reserves for losses and loss expenses; |
| • | quality of their data and underwriting processes; |
| • | conditions imposed by regulatory agencies that make the realization of cost-savings through integration of operations more difficult; |
| • | difficulties in obtaining regulatory approvals on our ability to be an acquirer; |
| • | a need for additional capital that was not anticipated at the time of the acquisition; |
| • | transaction-related lawsuits or claims; |
| • | difficulties in integrating the technologies, operations, existing contracts and personnel of an acquired company; |
| • | difficulties in retaining key employees or business partners of an acquired company; |
| • | diversion of financial and management resources from existing operations or alternative acquisition opportunities; |
| • | failure to realize the anticipated benefits or synergies of a transaction; |
| • | failure to identify the problems, liabilities or other shortcomings or challenges of an acquired company or technology, including issues related to intellectual property, regulatory compliance practices, litigation, accounting practices, or employee or user issues; |
| • | risks that regulatory bodies may enact new laws or promulgate new regulations that are adverse to an acquired company or business; |
| • | theft of our trade secrets or confidential information that we share with potential acquisition candidates; |
| • | risk that an acquired company or investment in new offerings cannibalizes a portion of our existing business; |
| • | adverse market reaction to an acquisition; |
| • | significant attention from management and disruption to our business; and |
| • | potential dilution in value to our stockholders. |
If we fail to address the foregoing risks or other problems encountered in connection with past or future acquisitions of businesses, new technologies, services and other assets and strategic investments, or if we fail to successfully integrate such acquisitions or investments, our business, results of operations and financial condition could be adversely affected.
We may not be able to utilize a portion of our net operating loss carryforwards (“NOLs”) to offset future taxable income, which could adversely affect our net income and cash flows.
We are subject to federal and state income and
non-income
taxes in the United States. Tax laws, regulations, and administrative practices in various jurisdictions may be subject to significant change, with or without notice,28
due to economic, political and other conditions, and significant judgment is required in evaluating and estimating these taxes. Our effective tax rates could be affected by numerous factors, such as entry into new businesses and geographies, changes to our existing business and operations, acquisitions and investments and how they are financed, changes in our stock price, changes in our deferred tax assets and liabilities and their valuation, and changes in the relevant tax, accounting, and other laws, regulations, administrative practices, principles and interpretations. We are required to take positions regarding the interpretation of complex statutory and regulatory tax rules and on valuation matters that are subject to uncertainty, and IRS or other tax authorities may challenge the positions that we take.
As of December 31, 2020, Old Hippo had U.S. federal and state NOL carryforwards of approximately $154.5 million and $41.5 million, respectively, available to offset our future taxable income, if any, prior to consideration of annual limitations that may be imposed under Section 382 of the Code, or otherwise. Of our U.S. federal NOL carryforwards, $9.2 million of losses will begin to expire in 2035 and $145.3 million of losses can be carried forward indefinitely. Under the Tax Cuts and Jobs Act of 2017, as modified by the Coronavirus Aid, Relief, and Economic Security Act, U.S. federal NOL carryforwards generated in taxable periods beginning after December 31, 2017, may be carried forward indefinitely, but the deductibility of such NOL carryforwards in taxable years beginning after December 31, 2020, is limited to 80% of taxable income.
We may be unable to fully use our NOL carryforwards, if at all. Under Section 382 of the Code, if a corporation undergoes an “ownership change” (generally defined as a greater than 50 percentage point change, by value, in the corporation’s equity ownership by certain shareholders or groups of shareholders over a rolling three-year period), the corporation’s ability to use its
pre-ownership
change NOLs to offset its post-ownership change income may be limited. We have experienced two historical ownership changes (in 2016 and 2018) and we may experience ownership changes in the future as a result of subsequent shifts in our stock ownership, including as a result of this transaction, some of which may be outside of our control. If we undergo a future ownership change, we may be prevented from fully utilizing our NOL carryforwards existing at the time of the ownership change prior to their expiration. Future regulatory changes could also limit our ability to utilize our NOL carryforwards. To the extent we are not able to offset future taxable income with our NOL carryforwards, our net income and cash flows may be adversely affected.Our expansion strategy will subject us to additional costs and risks and our plans may not be successful.
Our success depends in significant part on our ability to expand into additional markets. Currently, Spinnaker Insurance Company is licensed to write limited lines of business in 50 states and the District of Columbia, and Hippo Analytics Inc. is licensed as an insurance agency in 50 states and the District of Columbia. We have targeted writing homeowners business across all 50 states, but we cannot guarantee that we will be able to provide nationwide coverage in the near term or at all. As of June 30, 2021, our insurance program was approved to be sold in 37 states. Moreover, one or more states could revoke our license to operate, or implement additional regulatory hurdles that could inhibit or limit our ability to obtain or maintain our license or grow our business in such states.
As we seek to expand, we may incur significant operating expenses, although our expansion may not be successful for a variety of reasons, including because of, among other things:
| • | barriers to obtaining the required government approvals, licenses or other authorizations, including seasoning or other limitations imposed by a state; |
| • | failures in identifying and entering into joint ventures with strategic partners or entering into joint ventures that do not produce the desired results; |
| • | challenges in, and the cost of, complying with various laws and regulatory standards, including with respect to the insurance business and insurance distribution, capital and outsourcing requirements, data privacy, tax and regulatory restrictions; |
29
| • | competition from incumbents that already own market share, better understand the market, may market and operate more effectively and may enjoy greater affinity or awareness; and |
| • | differing demand dynamics, which may make our product offerings less successful. |
Expansion into new markets will require additional investments by us in both securing regulatory approvals and marketing. These incremental costs may include hiring additional personnel, as well as engaging third-party service providers and other research and development costs. If we grow our geographic footprint or product offering at a slower rate than expected, our business, results of operations and financial condition could be materially and adversely affected.
We are subject to payment processing risk.
We currently rely on a limited number of payment processing services, including the processing of payments from credit cards and debit cards, and our business would be disrupted if any of these vendors becomes unwilling or unable to provide these services to us and we are unable to find a suitable replacement on a timely basis. If we or our processing vendors fail to maintain adequate systems for the authorization and processing of credit card transactions, it could cause one or more of the major credit card companies to disallow our continued use of their payment products. In addition, if these systems fail to work properly and, as a result, we do not charge our customers’ credit cards on a timely basis or at all, our business, revenue, results of operations and financial condition could be harmed.
The payment methods that we offer also subject us to potential fraud and theft by criminals, who are becoming increasingly more sophisticated, seeking to obtain unauthorized access to or exploit weaknesses that may exist in the payment systems. If we fail to comply with applicable rules or requirements for the payment methods we accept, or if payment-related data are compromised due to a breach of data, we may be liable for significant costs incurred by payment card issuing banks and other third parties or subject to fines and higher transaction fees, or our ability to accept or facilitate certain types of payments may be impaired. In addition, our customers could lose confidence in certain payment types, which may result in a shift to other payment types or potential changes to our payment systems that may result in higher costs. If we fail to adequately control fraudulent credit card transactions, we may face civil liability, diminished public perception of our security measures, and significantly higher credit card-related costs, each of which could harm our business, results of operations and financial condition.
Risks Related to Our Industry
The insurance business, including the market for homeowners insurance, is historically cyclical in nature, and we may experience periods with excess underwriting capacity and unfavorable premium rates, which could adversely affect our business.
Historically, insurance carriers writing homeowners insurance have experienced significant fluctuations in operating results due to competition, frequency and severity of catastrophic events, levels of capacity, adverse litigation trends, regulatory constraints, general economic conditions, and other factors. The supply of insurance is related to prevailing prices, the level of insured losses and the level of capital available to the industry that, in turn, may fluctuate in response to changes in rates of return on investments being earned in the insurance industry. As a result, the homeowners insurance business historically has been a cyclical industry characterized by periods of intense price competition due to excessive underwriting capacity as well as periods when shortages of capacity increased premium levels. Demand for insurance depends on numerous factors, including the frequency and severity of catastrophic events, levels of capacity, the introduction of new capital providers and general economic conditions. All of these factors fluctuate and may contribute to price declines generally in the insurance industry.
30
We cannot predict with certainty whether market conditions affecting the homeowners insurance market and the insurance market in general will improve, remain constant or deteriorate. Negative market conditions may impair our ability to underwrite insurance at rates we consider appropriate and commensurate relative to the risk assumed. Additionally, negative market conditions could result in a decline in policies sold, an increase in the frequency or severity of claims and premium defaults, and an uptick in the frequency of fraud including the falsification of claims. If we cannot underwrite insurance at appropriate rates, our ability to transact business will be materially and adversely affected. Any of these factors could lead to an adverse effect on our business, results of operations and financial condition.
Our actual incurred losses may be greater than our loss and loss adjustment expense reserves, which could have a material adverse effect on our financial condition and results of operations.
Our financial condition and results of operations depends on our ability to accurately assess potential Loss and Loss Adjustment Expenses under the terms of the policies we underwrite for homeowners. Reserves do not represent an exact calculation of liability. Rather, reserves represent an estimate of what the expected ultimate settlement and administration of claims will cost, and the ultimate liability may be greater or less than the current estimate. In our industry, there is always the risk that reserves may prove inadequate as it is possible for us to underestimate the cost of claims and claims administration.
We base our estimates on our assessment of known facts and circumstances, as well as estimates of future trends in claim severity, claim frequency, judicial theories of liability, and other factors. These variables are affected by both internal and external events that could increase our exposure to losses, including changes in the mix of customers and jurisdictions, changes in actuarial projections, claims handling procedures, inflation, severe weather, climate change, economic and judicial trends and legislative changes. Increases in claims severity can be impacted by increased costs including construction costs, availability of supplies, and other economic factors; and by litigation trends and precedent. We regularly monitor reserves using new information on reported claims and a variety of statistical techniques to update our current estimate. Our estimates could prove to be inadequate, and this underestimation could have a material adverse effect on our financial condition.
Recorded claim reserves, including case reserves and incurred but not reported (“IBNR”) claims reserves, are based on our estimates of losses after considering known facts and interpretations of the circumstances, including settlement agreements. Additionally, models that rely on the assumption that past loss development patterns will persist into the future are used. Internal factors are considered including our experience with similar cases, actual claims paid, historical trends involving claim payment patterns, pending levels of unpaid claims, loss management programs, product mix, contractual terms and changes in claim reporting, and settlement practices. External factors are also considered, such as court decisions, changes in law and litigation imposing unintended coverage. We also consider benefits, such as disallowing the use of benefit payment schedules, requiring coverage designed to cover losses that occur in a single policy period to losses that develop continuously over multiple policy periods or requiring the availability of multiple limits. Regulatory requirements and economic conditions are also considered.
Since reserves are estimates of the unpaid portion of losses that have occurred, including IBNR losses, the establishment of appropriate reserves, including reserves for catastrophes, is an inherently uncertain and complex process that is regularly refined to reflect current estimation processes and practices. The ultimate cost of losses may vary materially from recorded reserves and such variance may adversely affect our results of operations and financial condition as the reserves and reinsurance recoverables are reestimated.
If any of our insurance reserves should prove to be inadequate for the reasons discussed above, or for any other reason, we will be required to increase reserves, resulting in a reduction in our net income and stockholders’ equity in the period in which the deficiency is identified. Future loss experience substantially in excess of established reserves could also have a material adverse effect on future earnings and liquidity and financial strength rating, which would affect our ability to attract new business or to retain existing customers.
31
We are subject to extensive insurance industry regulations.
Currently, Spinnaker Insurance Company is licensed to write limited lines of business in 50 states and the District of Columbia, and Hippo Analytics Inc. is licensed as an insurance agency in 50 states and the District of Columbia. We have targeted writing homeowners business across all 50 states, but we cannot guarantee that we will be able to provide nationwide coverage in the near term or at all. As of June 30, 2021, our insurance program is approved to be sold in 37 states.
Each U.S. state regulator retains the authority to license insurance producers and insurance companies in their states, and a producer or company generally may not operate in a state in which it is not licensed. Accordingly, we are not permitted to sell or underwrite insurance to residents of the remaining states and territories of the United States for lines or products for which we are not authorized, which is likely to put us at a disadvantage among many of our competitors that have been in business much longer than us and are licensed to sell their insurance products in most, if not all, U.S. jurisdictions.
We are subject to extensive regulation and supervision in the states in which we transact business by the individual state insurance departments. This regulation is generally designed to protect the interests of consumers, and not necessarily the interests of insurers or producers, their shareholders or other investors. Numerous aspects of our insurance business are subject to regulation, including, but not limited to, premium rates, mandatory covered risks, limitations on the ability to
non-renew
or to cancel or elect not to renew business, prohibited exclusions, licensing and appointment of agents, restrictions on the size of risks that may be insured under a single policy, reserves and provisions for unearned premiums, losses and other obligations, deposits of securities for the benefit of customers, investments and capital, policy forms and coverages, advertising and other conduct, including restrictions on the use of credit information and other factors in underwriting, as well as other production, underwriting and claims practices. To the extent we decide to expand our current product offerings to include other insurance products, this would subject us to additional regulatory requirements and scrutiny in each state in which we elect to offer such products. States have also adopted legislation defining and prohibiting unfair methods of competition and unfair or deceptive acts and practices in the business of insurance. Prohibited practices include, but are not limited to, misrepresentations, false advertising, coercion, disparaging other insurers, unfair claims settlement procedures, discrimination in the business of insurance, and offering illegal inducements in connection with insurance sales. Noncompliance with any of such state statute may subject us to regulatory action by the relevant state insurance regulator, and, in certain states, private litigation. States also regulate various aspects of the contractual relationships between insurers and licensed agents and brokers.Such laws, rules and regulations are usually overseen and enforced by the various state insurance departments, as well as through private rights of action and by state attorneys general. Such regulations or enforcement actions are often responsive to current consumer and political sensitivities, such as homeowners insurance rates and coverage forms, or which may arise after a major event. Such rules and regulations may result in rate suppression, limit our ability to manage our exposure to unprofitable or volatile risks, or lead to fines, premium refunds or other adverse consequences. The federal government also may regulate aspects of our businesses, such as the protection of consumer confidential information or the use of consumer insurance (credit) scores to underwrite and assess the risk of customers under the Fair Credit Reporting Act (“FCRA”). Among other things, the FCRA requires insurance companies to have a permissible purpose before obtaining and using a consumer report for underwriting purposes, as well as comply with related notice and recordkeeping requirements. Failure to comply with federal requirements under the FCRA or any other applicable federal laws would subject us to regulatory fines and other sanctions. In addition, given our short operating historyorders for an individual state, or all states, until the identified noncompliance is rectified.
to-date
and rapid speed of growth, we are particularly vulnerable to regulators identifying errors in the policy forms we use, the rates we charge, and our customer communications. As a result of any such noncompliance, regulators could impose fines, rebates or other penalties, includingcease-and-desist
Our ability to retain state licenses depends on our ability to meet licensing requirements enacted or promulgated in each state (sometimes based on model laws and regulations developed by the NAIC), subject to
32
significant variations across states. If we are unable to satisfy the applicable licensing requirements of any particular state, we could lose our license to do business in such state, which would result in the temporary or permanent cessation of our operations in that state. Alternatively, if we are unable to satisfy applicable state licensing requirements, we may be subject to additional regulatory oversight, have our license suspended, face monetary penalties, or be subject to seizure of assets. Any such events could adversely affect our business, results of operations or financial condition.
In addition, as a condition to writing business in certain states, insurance companies are often required to participate in various pools or risk sharing mechanisms or to accept certain classes of risk, regardless of whether such risks meet their underwriting requirements for voluntary business. Some states also limit or impose restrictions on the ability of an insurer to withdraw from certain classes of business. Certain states impose significant restrictions on a company’s ability to materially reduce its exposures,
non-renew,
or to withdraw from certain lines of business. State insurance departments can impose significant charges on an insurer in connection with a market withdrawal or refuse to approve withdrawal plans including on the grounds that they could lead to market disruption. Laws and regulations that limit cancellation andnon-renewal
of policies or that subject withdrawal plans to prior approval requirements may significantly restrict our ability terminate unprofitable risks or to exit unprofitable markets. Such actions and related regulatory restrictions may limit our ability to reduce our potential exposure including, but not limited to, catastrophe events such as hurricane-related losses.A regulatory environment that requires rate increases to be approved and that can dictate underwriting practices and mandate participation in loss sharing arrangements may adversely affect our results of operations and financial condition.
From time to time, political events and positions affect the insurance market, including efforts to reduce rates to a level that may prevent us from being profitable or may not allow us to reach targeted levels of profitability. For example, if our loss ratio compares favorably to that of the industry, state or provincial regulatory authorities may impose rate rollbacks, require us to pay premium refunds to policyholders, or challenge or otherwise delay our efforts to raise rates even if the property and casualty industry generally is not experiencing regulatory challenges to rate increases. Such challenges affect our ability to obtain approval for rate changes that may be required to achieve targeted levels of profitability and returns on equity. In particular and by way of example, due to the
COVID-19
pandemic, state regulators and legislators are under increased political pressure to provide financial relief to policyholders through premium rebates or requiring insurers to pay claims arising fromCOVID-19
related losses, regardless of the applicable policy’s exclusions.In addition, certain states have enacted laws that require an insurer conducting business in that state to participate in assigned risk plans, reinsurance facilities and joint underwriting associations. Certain states also require insurers to offer coverage to all consumers, often restricting an insurer’s ability to charge the price it might otherwise charge. In these markets, we may be compelled to underwrite significant amounts of business at lower-than-desired rates, possibly leading to an unacceptable return on equity. Laws and regulations of many states also limit an insurer’s ability to withdraw from one or more lines of insurance there, except pursuant to a plan that is approved by the state insurance department. Additionally, as addressed above, certain states require insurers to participate in guaranty funds for impaired or insolvent insurance companies. These funds periodically assess losses against all insurance companies doing business in the state. Our business, results of operations or financial condition could be adversely affected by any of these factors.
State insurance regulators impose additional reporting requirements regarding enterprise risk on insurance holding company systems, with which we must comply as an insurance holding company.
In the past decade, various state insurance regulators have increased their focus on risks within an insurer’s holding company system that may pose enterprise risk to the insurer. During the last approximately ten years, the NAIC adopted significant changes to the insurance holding company act and regulations (the “NAIC Amendments”). The NAIC Amendments are designed to respond to perceived gaps in the regulation of insurance holding company systems in the United States. One of the major changes is a requirement that an insurance
33
holding company system’s ultimate controlling person submit annually to its lead state insurance regulator an “enterprise risk report” that identifies activities, circumstances or events involving one or more affiliates of an insurer that, if not remedied properly, are likely to have a material adverse effect upon the financial condition or liquidity of the insurer or its insurance holding company system as a whole. Other changes include requiring a controlling person to submit prior notice to its domiciliary insurance regulator of a divestiture of control, having detailed minimum requirements for cost sharing and management agreements between an insurer and its affiliates and expanding of the agreements between an insurer and its affiliates to be filed with its domiciliary insurance regulator.
The increasing adoption by states of cybersecurity regulations could impose additional compliance burdens on us and expose us to additional liability.
In response to the growing threat of cyber-attacks in the insurance industry, certain jurisdictions have adopted and others are considering new cybersecurity measures, including the adoption of cybersecurity regulations. On October 24, 2017, the NAIC adopted its Insurance Data Security Model Law, intended to serve as model legislation for states to enact in order to govern cybersecurity and data protection practices of insurers, insurance agents, and other licensed entities registered under state insurance laws. As of the summer of 2020, Alabama, Connecticut, Delaware, Indiana, Louisiana, Michigan, Mississippi, New Hampshire, Ohio, South Carolina, and Virginia have adopted versions of the NAIC Insurance Data Security Model Law, each with a different effective date, and other states may adopt versions of the NAIC Insurance Data Security Model Law in the future. Although we take steps to comply with financial industry cybersecurity regulations and believe we are materially compliant with their requirements, our failure to comply with new or existing cybersecurity regulations could result in regulatory actions and other penalties. In addition, efforts to comply with new or existing cybersecurity regulations could impose significant costs on our business, which could materially and adversely affect our business, financial condition or results of operations.
The
COVID-19
pandemic has caused disruption to our operations and may negatively impact our business, key metrics or results of operations in numerous ways that remain unpredictable.In December 2019,
COVID-19
was reported to have surfaced in Wuhan, China and in March 2020 was recognized as a pandemic by the World Health Organization. Public and private sector policies and initiatives to reduce the transmission ofCOVID-19,
such as the imposition of travel restrictions and the adoption of remote working, could impact our operations if our employees are unable to work effectively, including because of illness, quarantines, government actions, facility closures or other restrictions. We continue to assess and update our business continuity plans in the context of this pandemic, including taking steps to help keep our employees healthy and safe. The spread ofCOVID-19
has caused us to modify our business practices (including employee travel, employee work locations in certain cases and cancellation of physical participation in meetings, events and conferences and to increase our use of web based solutions for business processes like meetings and working remote solutions).Beginning in early March 2020, the
COVID-19
pandemic and the measures imposed to contain this pandemic have severely impacted businesses worldwide, including many in the insurance sector. Insurers of travel, events or business interruption may be directly and adversely affected by claims with respect toCOVID-19
or the lock-down it engendered. Other insurers, in lines of business that are not directly impacted byCOVID-19,
may nevertheless be dependent on office-based brokers,in-person
inspections, or teams that are poorly equipped to work from home — all of which can translate into value erosion. Finally, the broader financial crisis may hurt insurers in other ways, too. With interest rates atall-time
lows, we, along with many insurers, have seen a decline on the return on capital.The
COVID-19
pandemic is expected to impact our loss ratios as homes are being used more intensively due to the remote working environment. Home infrastructure and equipment breakdown are occurring more frequently due to increased use. COVID 19 has delayed our recoverability of premiums where moratoriums have been imposed and has delayed the launch of some of our Hippo Home Care products. Due to the speed with34
which the
COVID-19
situation is developing, the global breadth of its spread and the range of governmental and community reactions thereto, uncertainty around its duration and ultimate impact persists, and the related financial impact on our business could change and cannot be accurately predicted at this time.Furthermore, the”
COVID-19
pandemic has impacted and may further impact the broader economies of affected countries, including negatively impacting economic growth, the proper functioning of financial and capital markets, foreign currency exchange rates and interest rates. It is possible that the pandemic will cause an economic slowdown of potentially extended duration, and it is possible that it could cause a global recession. This could result in an increase in fraudulent claims or a decrease in home sales, an increase in costs associated with claims under our policies, as well as an increase in the number of customers experiencing difficulty paying premiums, any of which could have a material adverse effect on our business and results of operations. Given that theCOVID-19
situation is continuing to develop (particularly as new strains of the virus emerge and create potential challenges to vaccination efforts), the global breadth of its spread and the range of governmental and community reactions thereto (including the availability and acceptance of vaccines), there is uncertainty around its duration and ultimate impact it will continue to have on our business. For a further discussion of the effects of theCOVID-19
pandemic on our business, see “Management’s Discussion and Analysis of Financial Condition and Results of Operations —
COVID-19
Impact.Severe weather events and other catastrophes, including the effects of climate change, global pandemics and terrorism, are inherently unpredictable and may have a material adverse effect on our financial results and financial condition.
Our homeowners insurance business is exposed to the risk of severe weather conditions and other catastrophes. Severe weather events include, but are not limited to, winter storms, tornadoes, hurricanes, rain, hail and high winds. The incidence and severity of weather conditions are largely unpredictable. Catastrophes can be caused by various events, such as wildfires, tornadoes, tsunamis, hurricanes, tropical storms, earthquakes, windstorms, hailstorms, severe thunderstorms, fires and other
non-natural
events such as explosions, civil unrest, terrorism or war. Additionally, seasonal weather patterns impact the level and amount of claims we receive. These patterns include hurricanes, wildfires and coastal storms in the fall, cold weather patterns and changing home heating needs in the winter, and tornados and hailstorms in the spring and summer. The mix of geographic exposure and products within our customer base impacts our exposure to these weather patterns and as we diversify our base of premium such that our exposure more closely resembles the industry exposure, we should see the impact of these events on our business more closely resemble the impact on the broader industry.The incidence and severity of severe weather conditions and catastrophes are inherently unpredictable and the occurrence of one catastrophe does not render the possibility of another catastrophe greater or lower. The extent of losses from a catastrophe is a function of both the total amount of insured exposure in the area affected by the event and the severity of the event. In particular, severe weather and other catastrophes could significantly increase our costs due to a surge in claims following such events and/or legal and regulatory changes in response to catastrophes that may impair our ability to limit our liability under our policies. Severe weather conditions and catastrophes can cause greater losses for us, which can cause our liquidity and financial condition to deteriorate. Resulting reductions in our capital could materially adversely affect our ability to underwrite new or renew existing insurance policies. In addition, we may not be able to obtain reinsurance coverage at reasonable rates and in amounts or with coverages adequate to mitigate the risks associated with severe weather conditions and other catastrophes. While we only work with reinsurers whom we believe have acceptable credit, if our reinsurers are unable to pay for the claims for which they are responsible, we could be exposed to additional liability, which could have a material adverse effect on our business and results of operations. Catastrophic losses, such as the recent storms in Texas, may result in our insurance companies incurring losses greater than those experienced in prior years, the expected level of losses including modeled losses, and current reinsurance limits.
Climate change may affect the occurrence of certain natural events, such as an increase in the frequency or severity of snow, wind and thunderstorm events, and tornado or hailstorm events due to increased convection in the atmosphere; more frequent wildfires in certain geographies; higher incidence of deluge flooding and the
35
potential for an increase in severity of the hurricane events due to higher sea surface temperatures. Additionally, climate change may cause an impact on the demand, price and availability of homeowners insurance and reinsurance coverages, as well as the value of our investment portfolio. Due to significant variability associated with future changing climate conditions, we are unable to predict the impact climate change will have on our business.
We expect our results of operations to fluctuate on a quarterly and annual basis. In addition, our operating results and operating metrics are subject to seasonality and volatility, which could result in fluctuations in our quarterly revenues and operating results or in perceptions of our business prospects.
Our revenue and results of operations could vary significantly from period to period and may fail to match expectations as a result of a variety of factors, some of which are outside of our control. Our results may vary as a result of fluctuations in the number of customers purchasing our insurance products and fluctuations in the timing and amount of our expenses. In addition, the insurance industry, and particularly homeowners insurance, are subject to their own cyclical trends and uncertainties, including extreme weather which is often seasonal and may result in volatility in claims reporting and payment patterns. Fluctuations and variability across the industry may affect our revenue. As a result of the potential variations in our revenue and results of operations,comparisons may not be meaningful and the results of any one period should not be relied on as an indication of future performance. In addition, our results of operations may not meet the expectations of investors or public market analysts who follow us, which may adversely affect our stock price.
period-to-period
We have experienced in the past, and expect to continue to experience, seasonal fluctuations in our revenues and resulting fluctuations in our rate of growth as a result of insurance spending patterns. Specifically, our revenues may be proportionately higher in our third fiscal quarter due to the seasonality of when homeowners purchase and move into new homes, which historically occurs at higher rates in the months of July, August and September. Accordingly, the amount of growth we experience may also be greater in the third quarter. As our business expands and matures, other seasonality trends may develop and the existing seasonality and customer behavior that we experience may change. Volatility in our key operating metrics or their rates of growth could have a negative impact on our financial results and investor perceptions of our business prospects and a failure to achieve our quarterly forecasts or to meet or exceed the expectations of research analysts or investors will cause our stock price to decline.
An overall decline in economic activity could have a material adverse effect on the financial condition and results of operations of our business.
The demand for property and casualty insurance generally rises as the overall level of household income increases and generally falls as household income decreases, affecting premiums, commissions and fees generated by our business. Some new accounts are sourced by referral sources tied to home closing transactions, and major slowdowns in the various housing markets we serve could impact our ability to generate new business. The economic activity that impacts property and casualty insurance is most closely correlated with employment levels, corporate revenue and asset values.
Our results of operations and financial condition may be adversely affected due to limitations in the analytical models used to assess and predict our exposure to catastrophe losses.
Along with others in the insurance industry, models developed internally and by third party vendors are used along with our own historical data in assessing property insurance exposure to catastrophe losses. These models assume various conditions and probability scenarios; however, they do not necessarily accurately predict future losses or measure losses currently incurred. Further, the accuracy of such models may be negatively impacted by changing climate conditions, including increased weather severity patterns. Catastrophe models use historical information and scientific research about natural events, such as hurricanes and earthquakes, as well as detailed information about our
in-force
business. This information is used in connection with pricing and risk36
management activities. However, since actual catastrophic events vary considerably, there are limitations with respect to its usefulness in predicting losses in any reporting period. Other limitations are evident in significant variations in estimates between models, material increases and decreases in results due to model changes and refinements of the underlying data elements and actual conditions that are not yet well understood or may not be properly incorporated into the models.
Our insurance company subsidiaries are subject to minimum capital and surplus requirements, and failure to meet these requirements could subject us to regulatory action.
Our insurance company subsidiaries are subject to risk based capital standards and other minimum capital and surplus requirements. The risk based capital standards, based upon the Risk Based Capital Model Act developed by the NAIC and adopted in all states, including our insurance subsidiaries’ states of domicile, require our insurance company subsidiaries to report results of risk based capital calculations to their domestic regulator. These risk based capital standards provide for different levels of regulatory attention depending upon the ratio of an insurance company’s total adjusted capital, as calculated in accordance with the NAIC’s RBC formula, to its authorized control level risk based capital. Authorized control level risk based capital is determined using the NAIC’s risk based capital formula, which measures the minimum amount of capital that an insurance company needs to support its overall business operations.
An insurance company with total adjusted capital that is less than 200% of its authorized control level risk based capital is at a company action level, which would require the insurance company to file a risk based capital plan that, among other things, contains proposals of corrective actions the company intends to take that are reasonably expected to result in the elimination of the company action level event. Additional action level events occur when the insurer’s total adjusted capital falls below 150%, 100%, and 70% of its authorized control level risk based capital. The lower the percentage, the more severe the regulatory response, including, in the event of a mandatory control level event (total adjusted capital falls below 70% of the insurer’s authorized control level risk based capital), placing the insurance company into receivership. As of June 30, 2021, Spinnaker Insurance Company’s risk based capital ratio was well in excess of minimum statutory requirements.
In addition, our insurance company subsidiaries are required to maintain certain minimum capital and surplus and generally must keep their net written premiums within specified multiples of its surplus that regulators customarily view as prudent. The insurance company subsidiaries could exceed these ratios if their volume increases faster than anticipated or if their surplus declines due to catastrophe or
non-catastrophe
losses or excessive underwriting and operational expenses.Any failure by our insurance company subsidiaries to meet the applicable risk based capital or minimum statutory capital requirements or the writings ratio limitations regulators customarily use where we currently or may in the future conduct business could subject us to further examination or corrective action imposed by state regulators, including limitations on our writing of additional business, state supervision or liquidation.
Any changes in existing risk based capital requirements, minimum statutory capital requirements, or customary writings ratios may require us to increase our statutory capital levels, which we may be unable to do.
Our insurance company subsidiaries are subject to assessments and other surcharges from state guaranty funds, and mandatory state insurance facilities, which may reduce our profitability.
The insurance laws of many states subject property and casualty insurers doing business in those states to statutory property and casualty guaranty fund assessments. The purpose of a guaranty fund is to protect customers by requiring that solvent property and casualty insurers pay the insurance claims of insolvent insurers. These guaranty associations generally pay these claims by assessing solvent insurers proportionately based on each insurer’s share of voluntary premiums written in the state. While most guaranty associations provide for recovery of assessments through subsequent rate increases, surcharges or premium tax credits, there is no
37
assurance that insurers will ultimately recover these assessments, which could be material, particularly following a large catastrophe or in markets which become disrupted.
Maximum contributions required by law in any one year vary by state. We cannot predict with certainty the amount of future assessments because they depend on factors outside our control, such as insolvencies of other insurance companies. Significant assessments could have a material adverse effect on our financial condition and results of operations.
Performance of our investment portfolio is subject to a variety of investment risks that may adversely affect our financial results.
Our results of operations depend, in part, on the performance of our investment portfolio. We seek to hold a diversified portfolio of investments in accordance with our investment policy and routinely reviewed by our investment committee. However, our investments are subject to general economic and market risks as well as risks inherent to particular securities.
Our primary market risk exposures are to changes in interest rates and overall debt markets given that a majority of our portfolio is invested in debt securities, treasury bills, municipal bonds and mortgage- and asset-backed securities. We have limited exposure to equities, but may in the future increase our portfolio’s allocation to equities. See “.” In recent years, interest rates have been at or near historic lows. A protracted low interest rate environment would continue to place pressure on our net investment income, particularly as it relates to fixed income securities and short-term investments, which, in turn, may adversely affect our operating results. Future increases in interest rates could cause the values of our fixed income securities portfolios to decline, with the magnitude of the decline depending on the duration of securities included in our portfolio and the amount by which interest rates increase. Some fixed income securities have call or prepayment options, which create possible reinvestment risk in declining rate environments. Other fixed income securities, such as mortgage-backed and asset-backed securities, carry prepayment risk or, in a rising interest rate environment, may not prepay as quickly as expected.
Management’s Discussion and Analysis of Financial Condition and Results of Operations — Quantitative and Qualitative Disclosure About Market Risk
The value of our investment portfolio is subject to the risk that certain investments may default or become impaired due to deterioration in the financial condition of one or more issuers of the securities we hold, or due to deterioration in the financial condition of an insurer that guarantees an issuer’s payments on such investments. Downgrades in the credit ratings of fixed maturities also have a significant negative effect on the market valuation of such securities.
Such factors could reduce our net investment income and result in realized investment losses. Our investment portfolio is subject to increased valuation uncertainties when investment markets are illiquid. The valuation of investments is more subjective when markets are illiquid, thereby increasing the risk that the estimated fair value (i.e., the carrying amount) of the securities we hold in our portfolio does not reflect prices at which actual transactions would occur.
We may also invest in marketable equity securities. These securities are carried on the balance sheet at fair market value and are subject to potential losses and declines in market value.
Risks for all types of securities are managed through the application of our investment policy, which establishes investment parameters that include, but are not limited to, maximum percentages of investment in certain types of securities and minimum levels of credit quality, which we believe are within applicable guidelines established by the NAIC.
Although we seek to preserve our capital, we cannot be certain that our investment objectives will be achieved, and results may vary substantially over time. In addition, although we seek to employ investment
38
strategies that are not correlated with our insurance and reinsurance exposures, losses in our investment portfolio may occur at the same time as underwriting losses and, therefore, exacerbate the adverse effect of the losses on us.
Unexpected changes in the interpretation of our coverage or provisions, including loss limitations and exclusions, in our policies could have a material adverse effect on our financial condition and results of operations.
There can be no assurances that specifically negotiated loss limitations or exclusions in our policies will be enforceable in the manner we intend. As industry practices and legal, judicial, social and other conditions change, unexpected and unintended issues related to claims and coverage may emerge. While these limitations and exclusions help us assess and mitigate our loss exposure, it is possible that a court or regulatory authority could nullify or void a limitation or exclusion or legislation could be enacted modifying or barring the use of such limitations or exclusions. These types of governmental actions could result in higher than anticipated Loss and Loss Adjustment Expenses, which could have a material adverse effect on our financial condition or results of operations. In addition, court decisions, such as the 1995 Montrose decision in which the California Supreme Court eliminated long standing coverage limitations by a narrow reading of policy exclusions In these cases, insurers are required to create and write new exclusions to establish the intended coverage. These types of cases and the issues they raise may adversely affect our business by either broadening coverage beyond our underwriting intent or by increasing the frequency or severity of claims. In some instances, these changes may not become apparent until sometime after we have issued insurance contracts that are affected by the changes. As a result, the full extent of liability under our insurance contracts may not be known for many years after a contract is issued.
Risks Related to Ownership of Our Common Stock
There may not be an active trading market for our common stock, which may make it difficult to sell shares of our common stock and there can be no assurance that the Company will be able to comply with the continued listing standards of such exchange.
We have listed Hippo Holdings common stock and Hippo Holdings warrants on the NYSE under the symbols “HIPO” and “HIPO.WS,” respectively. However, it is possible that an active trading market will not develop or, if developed, that any market will not be sustained. This would make it difficult for you to sell shares of our common stock at an attractive price or at all. The market price per share of our common stock may not be indicative of the price at which shares of our common stock will trade in the public market after this transaction.
The market price of our common stock and warrants may be highly volatile, which could cause the value of your investment to decline.
Even if an active trading market develops, the trading price of our common stock could be volatile, and you could lose all or part of your investment. The following factors, in addition to other factors described in this “Risk Factors” section and included elsewhere and incorporated by reference in this prospectus, may have a significant impact on the market price of our common stock:
| • | the occurrence of severe weather conditions and other catastrophes; |
| • | our operating and financial performance, quarterly or annual earnings relative to similar companies; |
| • | publication of research reports or news stories about us, our competitors or our industry, or positive or negative recommendations or withdrawal of research coverage by securities analysts; |
| • | the public’s reaction to our press releases, our other public announcements and our filings with the SEC; |
| • | announcements by us or our competitors of acquisitions, business plans or commercial relationships; |
39
| • | any major change in our board of directors or senior management, including the departure of our founder; |
| • | sales of our common stock by us, our directors, executive officers, principal shareholders, our founder and/or the PIPE Investors, or expectations of such sales given the release of shares from applicable lock-ups over time; |
| • | adverse market reaction to any indebtedness we may incur or securities we may issue in the future; |
| • | short sales, hedging and other derivative transactions in our common stock; |
| • | exposure to capital market risks related to changes in interest rates, realized investment losses, credit spreads, equity prices, foreign exchange rates and performance of insurance-linked investments; |
| • | our creditworthiness, financial condition, performance, and prospects; |
| • | changes in the fair values of our financial instruments (including certain warrants assumed in connection with the Business Combination); |
| • | our dividend policy and whether dividends on our common stock have been, and are likely to be, declared and paid from time to time; |
| • | perceptions of the investment opportunity associated with our common stock relative to other investment alternatives; |
| • | regulatory or legal developments; |
| • | changes in general market, economic and political conditions; |
| • | conditions or trends in our industry, geographies or customers; |
| • | changes in accounting standards, policies, guidance, interpretations or principles; |
| • | the impact of the COVID-19 pandemic on Hippo Holdings’ management, employees, partners, customers and operating results; and |
| • | threatened or actual litigation or government investigations. |
In addition, broad market and industry factors may negatively affect the market price of our common stock, regardless of our actual operating performance, and factors beyond our control may cause our stock price to decline rapidly and unexpectedly. In the past, companies that have experienced volatility in the market price of their stock have been subject to securities class action litigation. We may be the target of this type of litigation in the future. Litigation of this type could result in substantial costs and diversion of management’s attention and resources, which could have a material adverse effect on our business, financial condition, results of operations or prospects. Any adverse determination in litigation could also subject us to significant liabilities.
If securities or industry analysts do not publish or cease publishing research or reports about us, our business or our markets, or if they adversely change their recommendations or publish negative reports regarding our business or our stock, our stock price and trading volume could materially decline.
The trading market for our common stock will be influenced by the research and reports that industry or securities analysts may publish about us, our business, our markets, or our competitors. We do not currently have research coverage by industry or securities analysts and we cannot provide any assurance that analysts will cover us or provide favorable coverage. If any of the analysts who may cover us adversely change their recommendation regarding our stock, or provide more favorable relative recommendations about our competitors, our stock price could materially decline. If any analyst who may cover us were to cease coverage of our company or fail to regularly publish reports on us, we could lose visibility in the financial markets, which in turn could cause our stock price or trading volume to materially decline.
40
Some provisions of our Organizational Documents and Delaware law may have anti-takeover effects that could discourage an acquisition of us by others, even if an acquisition would be beneficial to our stockholders, and may prevent attempts by our stockholders to replace or remove our current management.
Provisions in our Organizational Documents, as well as provisions of the DGCL, could make it more difficult for a third party to acquire us or increase the cost of acquiring us, even if doing so would benefit our stockholders, including transactions in which stockholders might otherwise receive a premium for their shares. These provisions include:
| • | our board of directors is classified into three classes of directors with staggered three-year terms, and directors are only able to be removed from office for cause; |
| • | nothing in our Certificate of Incorporation precludes future issuances without stockholder approval of the authorized but unissued shares of our common stock; |
| • | advance notice procedures apply for stockholders to nominate candidates for election as directors or to bring matters before an annual meeting of stockholders; |
| • | our stockholders are only be able to take action at a meeting of stockholders and not by written consent; |
| • | only our chairman of the board of directors, our chief executive officer, our president, or a majority of the board of directors are authorized to call a special meeting of stockholders; |
| • | no provision in our Organizational Documents provides for cumulative voting, which limits the ability of minority stockholders to elect director candidates; |
| • | certain amendments to our Certificate of Incorporation requires the approval of two-thirds of the then outstanding voting power of our capital stock; |
| • | our Bylaws provide that the affirmative vote of two-thirds of the then-outstanding voting power of our capital stock, voting as a single class, is required for stockholders to amend or adopt any provision of our Bylaws; |
| • | our Certificate of Incorporation authorizes undesignated preferred stock, the terms of which may be established and shares of which may be issued, without the approval of the holders of our capital stock; and |
| • | certain litigation against us can only be brought in Delaware. |
Our Certificate of Incorporation states that we shall not engage in a “business combination” with an “interested stockholder” for a period of three years after the date of the transaction in which the person became an interested stockholder, unless:
| • | the business combination or transaction which resulted in the stockholder becoming an interested stockholder was approved by the board of directors prior to the time that the stockholder became an interested stockholder; |
| • | upon consummation of the transaction which resulted in the stockholder becoming an interested stockholder, the interested stockholder owned at least 85% of the voting stock of the corporation outstanding at the time the transaction commenced, excluding shares owned by directors who are also officers of the corporation and shares owned by employee stock plans in which employee participants do not have the right to determine confidentially whether shares held subject to the plan will be tendered in a tender or exchange offer; or |
| • | at or subsequent to the time the stockholder became an interested stockholder, the business combination was approved by the board of directors and authorized at an annual or special meeting of the stockholders, and not by written consent, by the affirmative vote of at least two-thirds of the outstanding voting stock which is not owned by the interested stockholder. |
41
These anti-takeover defenses could discourage, delay or prevent a transaction involving a change in control of our company. These provisions could also discourage proxy contests and make it more difficult for you and other stockholders to elect directors of your choosing and cause us to take corporate actions other than those you desire. For more information, see “.”
Description of Our Securities
Applicable insurance laws may make it difficult to effect a change of control.
Under applicable state insurance laws and regulations, no person may acquire control of a domestic insurance company until written approval is obtained from the state insurance commissioner on the proposed acquisition. Such approval would be contingent upon the state insurance commissioner’s consideration of a number of factors including, among others, the financial strength of the proposed acquiror, the acquiror’s plans for the future operations of the domestic insurer and any anti-competitive results that may arise from the consummation of the acquisition of control. For example, pursuant to both the Illinois Holding Company Act and the Texas Holding Company Act, a person must either (a) seek regulatory approval from the Director or Commissioner of each state’s insurance regulatory authority prior to acquiring direct or indirect “control” of a domestic insurer by filing a “Form A” application, or (b) obtain an exemption from such requirement from the relevant Director or Commissioner if the transaction does not result in the actual change of “control” as defined in the state’s Holding Company Act. We cannot predict with certainty whether a state will approve applications for exemptions or the timing of such decisions by the states, or whether regulators may impose conditions on or in connection with these applications that might be considered burdensome in nature. If a state insurance regulatory authority were to deny an application for an exemption, we would be required to seek the prior approval of the regulatory authority of the transaction pursuant to a Form A filing. These requirements may discourage potential acquisition proposals and may delay, deter, or prevent a change of control of our insurance company subsidiary, including through transactions that some or all of the stockholders might consider to be desirable.
Our Certificate of Incorporation designates the Court of Chancery of the State of Delaware as the exclusive forum for certain litigation that may be initiated by our stockholders, which could limit our stockholders’ ability to obtain a favorable judicial forum for disputes with us.
Our Certificate of Incorporation provides that, to the fullest extent permitted by law, and unless we consent in writing to the selection of an alternative forum, the Court of Chancery of the State of Delaware will be the sole and exclusive forum for (i) any derivative action or proceeding brought on our behalf, (ii) any action asserting a claim of breach of a fiduciary duty owed to us or our stockholders by any of our directors, officers, employees or agents, (iii) any action asserting a claim against us arising under the DGCL, (iv) any action, suit or proceeding as to which the DGCL confers jurisdiction on the Court of Chancery of the State of Delaware or (v) any action asserting a claim against us that is governed by the internal affairs doctrine. Notwithstanding the foregoing, the Certificate of Incorporation provides that the exclusive forum provision will not apply to suits brought to enforce a duty or liability created by the Securities Act or the Exchange Act or any other claim for which the federal courts have exclusive jurisdiction. Section 22 of the Securities Act creates concurrent jurisdiction for federal and state courts over all suits brought to enforce any duty or liability created by the Securities Act or the rules and regulations thereunder. Similarly, Section 27 of the Exchange Act creates exclusive federal jurisdiction over all suits brought to enforce any duty or liability created by the Exchange Act or the rules and regulations thereunder.
These provisions may have the effect of discouraging lawsuits against our directors and officers. The enforceability of similar choice of forum provisions in other companies’ certificates of incorporation has been challenged in legal proceedings, and it is possible that, in connection with any applicable action brought against us, a court could find the choice of forum provisions contained in the Certificate of Incorporation to be inapplicable or unenforceable in such action.
42
Claims for indemnification by our directors and officers may reduce our available funds to satisfy successful third-party claims against us and may reduce the amount of money available to us.
Our Certificate of Incorporation and Bylaws provide that we will indemnify our directors and officers, in each case, to the fullest extent permitted by Delaware law. Delaware law provides that directors of a corporation will not be personally liable for monetary damages for any breach of fiduciary duties as directors, except liability for:
| • | any breach of the director’s duty of loyalty to the corporation or its stockholders; |
| • | any act or omission not in good faith or that involves intentional misconduct or a knowing violation of law; |
| • | unlawful payments of dividends or unlawful stock repurchases or redemptions; or |
| • | any transaction from which the director derived an improper personal benefit. |
Such limitation of liability does not apply to liabilities arising under federal securities laws and does not affect the availability of equitable remedies such as injunctive relief or rescission.
Our Bylaws provide that we are required to indemnify our directors and officers to the fullest extent permitted by Delaware law and may indemnify our other employees and agents. Our Bylaws also provide that, on satisfaction of certain conditions, we will advance expenses incurred by a director or officer in advance of the final disposition of any action or proceeding, and permit us to secure insurance on behalf of any officer, director, employee or other agent for any liability arising out of his or her actions in that capacity regardless of whether we would otherwise be permitted to indemnify him or her under the provisions of Delaware law. We have entered and expect to continue to enter into agreements to indemnify our directors and executive officers. With certain exceptions, these agreements provide for indemnification for related expenses, including attorneys’ fees, judgments, fines and settlement amounts incurred by any of these individuals in connection with any action, proceeding or investigation. We believe that these certificate of incorporation and bylaws provisions and indemnification agreements are necessary to attract and retain qualified persons as directors and officers.
While we maintain directors’ and officers’ liability insurance, such insurance may not be adequate to cover all liabilities that we may incur, which may reduce our available funds to satisfy third-party claims and may adversely impact our cash position.
Taking advantage of the reduced disclosure requirements applicable to “emerging growth companies” may make our common stock less attractive to investors.
The JOBS Act provides that, so long as a company qualifies as an “emerging growth company,” it will, among other things:
| • | be required to have only two years of audited financial statements and only two years of related selected financial data and Management’s Discussion and Analysis of Financial Condition and Results of Operations disclosure; |
| • | be exempt from the provisions of Section 404(b) of the Sarbanes-Oxley Act requiring that its independent registered public accounting firm provide an attestation report on the effectiveness of its internal control over financial reporting; |
| • | be exempt from the “say on pay” and “say on golden parachute” advisory vote requirements of the Dodd-Frank Wall Street Reform and Consumer Protection Act (the “Dodd-Frank Act”); and |
| • | be exempt from certain disclosure requirements of the Dodd-Frank Act relating to compensation of its executive officers and be permitted to omit the detailed compensation discussion and analysis from proxy statements and reports filed under the Exchange Act; |
43
We currently intend to take advantage of each of the exemptions described above. Further, pursuant to Section 107 of the JOBS Act, as an emerging growth company, we have elected to take advantage of the extended transition period for complying with new or revised accounting standards until those standards would otherwise apply to private companies. As a result, our operating results and financial statements may not be comparable to the operating results and financial statements of other companies who have adopted the new or revised accounting standards. It is possible that some investors will find our common stock less attractive as a result, which may result in a less active trading market for our common stock and higher volatility in our stock price. We could be an emerging growth company for up to five years after this transaction. We cannot predict if investors will find our common stock less attractive if we elect to rely on these exemptions, or if taking advantage of these exemptions would result in less active trading or more volatility in the price of our common stock.
Failure to establish and maintain effective internal controls in accordance with Section 404 of the Sarbanes-Oxley Act could have a material adverse effect on our business and stock price.
We are required to comply with the SEC’s rules implementing Sections 302 and 404 of the Sarbanes-Oxley Act, which requires management to certify financial and other information in our quarterly and annual reports and provide an annual management report on the effectiveness of controls over financial reporting. Although we are required to disclose changes made in our internal controls and procedures on a quarterly basis, we are not required to make our first annual assessment of our internal control over financial reporting pursuant to Section 404 until the year following our first annual report required to be filed with the SEC. As an emerging growth company, our independent registered public accounting firm will not be required to formally attest to the effectiveness of our internal control over financial reporting pursuant to Section 404 until the later of (i) the year following our first annual report required to be filed with the SEC or (ii) the date we are no longer an emerging growth company. At such time, our independent registered public accounting firm may issue a report that is adverse in the event it is not satisfied with the level at which our controls are documented, designed or operating.
As a private company, Old Hippo did not have any internal audit function. To comply with the requirements of being a public company, we have undertaken various actions, and will need to take additional actions, such as implementing numerous internal controls and procedures and hiring additional accounting or internal audit staff or consultants. Testing and maintaining internal control can divert our management’s attention from other matters that are important to the operation of our business. Additionally, when evaluating our internal control over financial reporting, we may identify material weaknesses that we may not be able to remediate in time to meet the applicable deadline imposed upon us for compliance with the requirements of Section 404. If we identify any material weaknesses in our internal control over financial reporting or are unable to comply with the requirements of Section 404 in a timely manner or assert that our internal control over financial reporting is effective, or if our independent registered public accounting firm is unable to express an opinion as to the effectiveness of our internal control over financial reporting once we are no longer an emerging growth company, investors may lose confidence in the accuracy and completeness of our financial reports and the market price of our common stock could be negatively affected. We could also become subject to investigations by the SEC, the stock exchange on which our securities are listed or other regulatory authorities, which could require additional financial and management resources. In addition, if we fail to remedy any material weakness, our financial statements could be inaccurate and we could face restricted access to capital markets.
We depend on the ability of our subsidiaries to transfer funds to us to meet our obligations, and our insurance company subsidiaries ability to pay dividends to us is restricted by law.
We are a holding company that transacts a majority of our business through operating subsidiaries. Our ability to meet our operating and financing cash needs depends on the surplus and earnings of our subsidiaries, and upon the ability of our insurance subsidiaries to pay dividends to us.
Payments of dividends by our insurance company subsidiary are restricted by state insurance laws, including laws establishing minimum solvency and liquidity thresholds. The limitations are based on income and surplus
44
determined in accordance with statutory accounting principles, not GAAP. The jurisdictions in which our current insurance company subsidiary is domiciled impose certain restrictions on the ability of our insurance company subsidiary to pay dividends to its parent. These restrictions are based, in part, on the prior year’s statutory income and surplus. In general, dividends up to specified levels are considered ordinary and may be paid by giving prior notice to regulators. Dividends in larger amounts, or extraordinary dividends, are subject to a
thirty-day
prior notice period unless the insurance commissioner of the relevant state of domicile approves the dividend during that prior notice period. Under the insurance laws of Illinois and Texas, an extraordinary dividend or distribution is defined as a dividend or distribution that, together with other dividends and distributions made within the preceding 12 months, exceeds the greater of (1) 10% of the insurer’s surplus as regards policyholders as of the preceding December 31 and (2) net income for the12-month
period ending the preceding December 31. In addition, dividends may be paid only from earned surplus of the insurance company.In addition, our insurance subsidiary could be subject to contractual restrictions in the future, including those imposed by indebtedness we may incur in the future. Our insurance subsidiary may also face competitive pressures in the future to maintain insurance financial stability or strength ratings. These restrictions and other regulatory requirements would affect the ability of our insurance subsidiary to make dividend payments and we may not receive dividends in the amounts necessary to meet our obligations.
We do not currently expect to pay any cash dividends.
We do not currently expect to pay any cash dividends on our common stock for the foreseeable future. Instead, we intend to retain future earnings, if any, for the future operation and expansion of our business. Any determination to pay dividends in the future will be at the discretion of our board of directors and will depend on our results of operations (including our ability to generate cash flow in excess of expenses and our expected or actual net income), liquidity, cash requirements, financial condition, retained earnings and collateral and capital requirements, general business conditions, contractual restrictions, legal, tax and regulatory limitations, the effect of a dividend or dividends upon our financial strength ratings, and other factors that our board of directors deems relevant. For more information, see “.”
Dividend Policy
Because we are a holding company and all of our business is conducted through our subsidiaries, dividends, distributions and other payments from, and cash generated by, our subsidiaries will be our principal sources of cash to fund operations and pay dividends. Accordingly, our ability to pay dividends to our stockholders is dependent on the earnings and distributions of funds from our subsidiaries. Our ability to pay dividends may also be restricted by the terms of any future credit agreement or any of our future debt or preferred equity securities or our subsidiaries. Accordingly, if you purchase shares of our common stock in this transaction, realization of a gain on your investment will depend on the appreciation of the price of shares of our common stock, which may never occur. Investors seeking cash dividends in the foreseeable future should not purchase our common stock.
The requirements of being a public company, including compliance with the reporting requirements of the Exchange Act, the requirements of the Sarbanes-Oxley Act and the Dodd-Frank Act and the listing standards of NYSE, may strain our resources, increase our costs and divert management’s attention, and we may be unable to comply with these requirements in a timely or cost-effective manner. In addition, key members of our management team have limited experience managing a public company.
As a public company, we are subject to the reporting requirements of the Exchange Act, the requirements of the Sarbanes-Oxley Act, the Dodd-Frank Act and the listing standards of the NYSE. These requirements will place a strain on our management, systems and resources and we will incur significant legal, accounting, insurance and other expenses that we have not incurred as a private company. The Exchange Act will require us to file annual, quarterly and current reports with respect to our business and financial condition within specified time periods and to prepare a proxy statement with respect to our annual meeting of stockholders. The Sarbanes-Oxley Act will require that we maintain effective disclosure controls and procedures, and internal controls over financial reporting. The NYSE will require that we comply with various corporate governance requirements. To
45
maintain and improve the effectiveness of our disclosure controls and procedures and internal controls over financial reporting, and comply with the Exchange Act and NYSE requirements, significant resources and management oversight is required. This may divert management’s attention from other business concerns and lead to significant costs associated with compliance, which could have a material adverse effect on us and the price of our common stock.
We expect these reporting and corporate governance rules and regulations to increase our legal and financial compliance costs and to make some activities more time-consuming and costly, although we are currently unable to estimate these costs with certainty. These laws and regulations could also make it more difficult or costly for us to obtain certain types of insurance, including director and officer liability insurance, and we may be forced to accept reduced policy limits and coverage or incur substantially higher costs to obtain the same or similar coverage. These laws and regulations could also make it more difficult for us to attract and retain qualified persons to serve on our board of directors or its committees or as our executive officers. Advocacy efforts by stockholders and third parties may also prompt even more changes in governance and reporting requirements. We cannot predict or estimate the amount of additional costs we may incur or the timing of these costs. Furthermore, if we are unable to satisfy our obligations as a public company, we could be subject to delisting of our common stock, fines, sanctions and other regulatory action, and potentially civil litigation.
Many members of our management team have limited experience managing a publicly traded company, interacting with public company investors and complying with the increasingly complex laws pertaining to public companies. Our management team may not successfully or efficiently manage our transition to being a public company subject to significant regulatory oversight and reporting obligations under the federal securities laws and the continuous scrutiny of securities analysts and investors. These new obligations and constituents will require significant attention from our senior management and could divert their attention away from themanagement of our business, which could adversely affect our business, results of operations and financial condition.
day-to-day
Sales of a substantial number of shares of our common stock by our existing stockholders in the public market could cause our stock price to fall.
Sales of a substantial number of shares of our common stock in the public market or the perception that these sales might occur could significantly reduce the market price of our common stock and impair our ability to raise adequate capital through the sale of additional equity securities.
As discussed elsewhere in this prospectus, pursuant to the
Lock-Up
Agreements and the Sponsor Agreement, after the consummation of the Business Combination and subject to certain exceptions, the Sponsor, Company Directors and Officers, and the Major Company Equityholders are contractually restricted from selling or transferring any of their shares of Hippo Holdings common stock (other than shares purchased in the public market or in the PIPE Investment) and the shares of Hippo Holdings common stock issuable to the Company Directors and Officers upon settlement or exercise of Hippo Holdings options or other equity awards outstanding as of immediately following the Closing (the“Lock-up
Shares”). Hippo Holdings may permit the Sponsor, the Company Directors and Officers and/or the Major Company Equityholders to sell shares prior to the expiration of thelock-up
agreements at any time in its sole discretion. Sales of these shares, or perceptions that they will be sold, could cause the trading price of our common stock to decline. After thelock-up
agreements expire, theLock-up
Shares will be eligible for sale in the public market. If these additional shares of Hippo Holdings common stock are sold, or if it is perceived that they will be sold, in the public market, the trading price of Hippo Holdings common stock could decline.We will incur significant transaction and transition costs in connection with the Business Combination.
We have both incurred and expect to incur
significant, non-recurring costs
in connection with consummating the Business Combination and operating as a public company following the consummation of the46
Business Combination. We may also incur additional costs to retain key employees. Certain transaction expenses incurred in connection with the Merger Agreement (including the Business Combination), including all legal, accounting, consulting, investment banking and other fees, expenses and costs, have been and will be paid by us following the closing of the Business Combination.
The announcement of the Business Combination could disrupt our relationships with our customers, suppliers, business partners and others, as well as our operating results and business generally.
Risks relating to the impact of the announcement of the Business Combination on our business include the following:
| • | our employees may experience uncertainty about their future roles, which might adversely affect our ability to retain and hire key personnel and other employees; |
| • | customers, suppliers, business partners and other parties with which we maintain business relationships may experience uncertainty about our future and seek alternative relationships with third parties, seek to alter their business relationships with us or fail to extend an existing relationship with us; and |
| • | we have expended and will continue to expend significant costs, fees and expenses for professional services and transaction costs in connection with the Business Combination. |
If any of the aforementioned risks were to materialize, they could lead to significant costs which may impact our results of operations and cash available to fund its business.
Warrants are exercisable for Hippo Holdings common stock, which increases the number of shares eligible for future resale in the public market and result in dilution to our stockholders.
Outstanding warrants to purchase an aggregate of 9,000,000 shares of Hippo Holdings common stock are exercisable in accordance with the terms of the Warrant Agreement governing those securities. Under the terms of the Warrant Agreement, these warrants will become exercisable 12 months from the closing of RTPZ’s initial public offering, or November 23, 2021. The exercise price of these warrants will be $11.50 per share. To the extent such warrants are exercised, additional shares of Hippo Holdings common stock will be issued, which will result in dilution to the holders of Hippo Holdings common stock and increase the number of shares eligible for resale in the public market. Sales of substantial numbers of such shares in the public market or the fact that such warrants may be exercised could adversely affect the market price of Hippo Holdings common stock. However, there is no guarantee that the public warrants will ever be in the money prior to their expiration, and as such, the public warrants may expire worthless.
We may redeem your unexpired warrants prior to their exercise at a time that is disadvantageous to you, thereby making your warrants worthless.
We have the ability to redeem the outstanding public warrants for cash at any time after they become exercisable and prior to their expiration, at a price of $0.01 per warrant if, among other things, the last reported sale price of Hippo Holdings’ common stock for any 20 trading days within
a 30-trading day
period ending on the third trading day prior to the date on which we send the notice of redemption to the warrant holders (the “Reference Value”) equals or exceeds $18.00 per share (as adjusted for share splits, share dividends, rights issuances, subdivisions, reorganizations, recapitalizations and the like). If and when the warrants become redeemable by us, we may exercise our redemption right even if we are unable to register or qualify the underlying securities for sale under all applicable state securities laws. As a result, we may redeem the warrants as set forth above even if the holders are otherwise unable to exercise the warrants. Redemption of the outstanding warrants as described above could force you to: (i) exercise your warrants and pay the exercise price therefor at a time when it may be disadvantageous for you to do so; (ii) sell your warrants at the then-current market price when you might otherwise wish to hold your warrants; or (iii) accept the nominal redemption price which, at the time the outstanding warrants are called for redemption, we expect would be substantially less than47
the market value of your warrants. None of the private placement warrants will be redeemable by us in such a case (subject to limited exceptions) so long as they are held by our Sponsor or its permitted transferees, but the Sponsor has agreed, in addition to the existing exercise provisions in the Warrant Agreement, to exercise the private placement warrants if (a) Hippo Holdings elects to redeem the public warrants, (b) the Reference Value exceeds $25.00 per share, and (c) there is an effective registration statement covering the issuance of shares of Hippo Holdings common stock issuable upon exercise of the private placement warrants, and a current prospectus relating thereto, available at the time of such exercise.
In addition, we have the ability to redeem the outstanding warrants (including the private placement warrants if the Reference Value is less than $18.00 per share) for shares of Hippo Holdings common stock at any time after they become exercisable and prior to their expiration, at a price of $0.10 per warrant if, among other things, the Reference Value equals or exceeds $10.00 per share (as adjusted for share splits, share dividends, rights issuances, subdivisions, reorganizations, recapitalizations and the like). In such a case, the holders will be able to exercise their warrants prior to redemption for a number of shares of Hippo Holdings common stock determined based on the redemption date and the fair market value of our Hippo Holdings common stock. The value received upon exercise of the warrants (1) may be less than the value the holders would have received if they had exercised their warrants at a later time where the underlying share price is higher and (2) may not compensate the holders for the value of the warrants, including because the number of RTPZ Class A ordinary shares received is capped at 0.361 shares of Hippo Holdings common stock per warrant (subject to adjustment) irrespective of the remaining life of the warrants.
Our warrants are accounted for as liabilities and the changes in value of our warrants could have a material effect on our financial results.
On April 12, 2021, the Acting Director of the Division of Corporation Finance and Acting Chief Accountant of the SEC together issued a statement regarding the accounting and reporting considerations for warrants issued by special purpose acquisition companies entitled “Staff Statement on Accounting and Reporting Considerations for Warrants Issued by Special Purpose Acquisition Companies (‘SPACs’)” (the “SEC Statement”). Specifically, the SEC Statement focused on certain settlement terms and provisions related to certain tender offers following a business combination, which terms are similar to those contained in the warrant agreement governing our warrants. As a result of the SEC Statement, we reevaluated the accounting treatment of our 4,600,000 public warrants and 4,400,000 private placement warrants and determined to classify the warrants as derivative liabilities measured at fair value, with changes in fair value each period reported in earnings.
As a result, included on our consolidated balance sheet as of March 31, 2021 are derivative liabilities related to embedded features contained within our warrants. Accounting Standards Codification 815, Derivatives and Hedging (“ASC 815”), provides for the remeasurement of the fair value of such derivatives at each balance sheet date, with a
resulting non-cash gain
or loss related to the change in the fair value being recognized in earnings in the statement of operations. As a result of the recurring fair value measurement, our consolidated financial statements and results of operations may fluctuate quarterly, based on factors, which are outside of our control. Due to the recurring fair value measurement, we expect that we willrecognize non-cash gains
or losses on our warrants each reporting period and that the amount of such gains or losses could be material. The impact of changes in fair value on earnings may have an adverse effect on the market price of our securities.48
USE OF PROCEEDS
All of the shares of Hippo Holdings common stock and Hippo Holdings warrants offered by the Selling Securityholders will be sold by them for their respective accounts. We will not receive any of the proceeds from these sales.
The Selling Securityholders will pay any underwriting fees, discounts, selling commissions, stock transfer taxes and certain legal expenses incurred by such Selling Securityholders in disposing of their shares of common stock and warrants, and we will bear all other costs, fees and expenses incurred in effecting the registration of such securities covered by this prospectus, including, without limitation, all registration and filing fees, NYSE listing fees and fees and expenses of our counsel and our independent registered public accountants.
We will receive any proceeds from the exercise of the Hippo Holdings warrants or Hippo Holdings options for cash, but not from the sale of the shares of Hippo Holdings common stock issuable upon such exercise.
49
DIVIDEND POLICY
We have not paid any cash dividends on our common stock to date, and prior to the Business Combination, RTPZ had not paid any dividends on the RTPZ Class A ordinary shares or the RTPZ Class B ordinary shares. The payment of cash dividends in the future will be dependent upon our revenues and earnings, if any, capital requirements and general financial condition. The payment of any cash dividends will be within the discretion of our board of directors. Our ability to declare dividends may be limited by the terms of financing or other agreements entered into by us or our subsidiaries from time to time.
50
UNAUDITED PRO FORMA CONDENSED COMBINED FINANCIAL INFORMATION
The unaudited pro forma condensed combined financial information has been prepared in accordance with Article 11 of SEC Regulation
S-X
as amended by the final rule, ReleaseNo. 33-10786
“Amendments to Financial Disclosures about Acquired and Disposed Businesses” and is for informational purposes only. The combined financial information presents the pro forma effects of the following transactions, collectively referred to as the “Transactions” for purposes of this section, and other related events as described in Note 1 to the accompanying Notes to the unaudited pro forma condensed combined financial information:| • | The reverse recapitalization of Hippo Enterprises Inc. (“Old Hippo”), referred to herein as the “Business Combination,” and the issuance of Hippo Holdings common stock in the PIPE Investment; |
| • | The acquisition of Spinnaker Insurance Company (“Spinnaker”) by Hippo on August 31, 2020 (“Spinnaker Transaction”) |
On August 2, 2021, as contemplated by the Merger Agreement, following the Domestication (including the change of RTPZ’s name to “Hippo Holdings Inc.”), (i) Merger Sub merged with and into Old Hippo, with Old Hippo surviving the First Merger as a wholly owned subsidiary of Hippo Holdings, and (ii) immediately following the First Merger, Old Hippo (as the surviving corporation of the First Merger) merged with and into Hippo Holdings, the separate corporate existence of Old Hippo ceased, and Hippo Holdings continued as the surviving corporation.
The unaudited pro forma condensed combined balance sheet of Hippo Holdings as of June 30, 2021 combines the historical balance sheet of Old Hippo as of June 30, 2021 and the historical consolidated balance sheet of RTPZ as of June 30, 2021, adjusted to give pro forma effect to the Business Combination, the PIPE Investment and certain other related events related to the Business Combination between Old Hippo and RTPZ, in each case, as if the Business Combination, PIPE Investment and other events had been consummated on June 30, 2021. The Spinnaker Transaction was consummated on August 31, 2020 and, accordingly, is reflected within the consolidated balance sheet of Old Hippo as of June 30, 2021.
The unaudited pro forma condensed combined statement of operations of Hippo Holdings for the six months ended June 30, 2021 combines the historical consolidated statement of operations of Old Hippo for the six months ended June 30, 2021, and the historical consolidated statement of operations of RTPZ for the six months ended June 30, 2021, on a pro forma basis as if the Business Combination, the PIPE Investment and other related events contemplated by the Merger Agreement, as described below and in the accompanying notes to the unaudited pro forma condensed combined financial statements, had been consummated on January 1, 2020.
The unaudited pro forma condensed combined statement of operations for the year ended December 31, 2020 combine the historical statement of operations of Old Hippo for the fiscal year ended December 31, 2020, the historical statement of operations of RTPZ for the period from October 2, 2020 (inception) through December 31, 2020, and the historical statement of operations of Spinnaker for the eight-month period ended August 31, 2020, adjusted to give pro forma effect to the Spinnaker Transaction, the Business Combination, the PIPE Investment and certain other related events, as discussed below, related to the Business Combination between RTPZ and Old Hippo and, in each case, as if such Transactions and other related events had been consummated on January 1, 2020.
The unaudited pro forma condensed combined balance sheet does not purport to represent, and is not necessarily indicative of, what the actual financial condition of the combined company would have been had the Transactions taken place on June 30, 2021, nor is it indicative of the financial condition of Hippo Holdings as of any future date. The unaudited pro forma condensed combined financial information is for illustrative purposes only and is not necessarily indicative of what the actual results of operations and financial position would have been had the Business Combination and the PIPE Transaction taken place on the dates indicated, nor are they indicative of the future consolidated results of operations or financial position of Hippo Holdings. The unaudited
51
pro forma condensed combined financial information is subject to several uncertainties and assumptions as described in the accompanying notes.
The unaudited pro forma condensed combined financial information should be read in conjunction with the following historical financial statements and the accompanying notes, which are included elsewhere in this prospectus:
| • | the accompanying Notes to the unaudited pro forma condensed combined financial statements; |
| • | the historical unaudited financial statements of RTPZ as of and for the six months ended June 30, 2021 included in RTPZ’s Quarterly Report on Form 10-Q filed with the SEC on August 16, 2021 incorporated herein by reference and the historical audited financial statements of RTPZ as of the year ended December 31, 2020 and for the period from October 2, 2020 (inception) through December 31, on Form10-K/A filed with the SEC on May 11, 2021 incorporated herein by reference; |
| • | the historical unaudited condensed consolidated financial statements of Old Hippo as of and for the six months ended June 30, 2021 and the historical audited consolidated financial statements of Old Hippo as of and for the year ended December 31, 2020, which are included as exhibits to this prospectus; |
| • | the historical audited financial statements of Spinnaker, as of, and for the year ended, December 31, 2019, included in this prospectus incorporated herein by reference; |
| • | the historical unaudited financial information of Spinnaker, as of, and for the period ended, June 30, 2020, included in this prospectus incorporated herein by reference; and |
| • | other information relating to RTPZ and Old Hippo included in this prospectus incorporated herein by reference, including the Merger Agreement and the description of certain terms thereof set forth under the section titled “The Business Combination”. |
52
UNAUDITED PRO FORMA CONDENSED COMBINED BALANCE SHEET
AS OF JUNE 30, 2021
(in millions)
As of June 30, 2021 | As of June 30, 2021 | |||||||||||||||||||
Hippo (Historical) | RTPZ (Historical) | Pro Forma Transaction Accounting Adjustments | Pro Forma Combined | |||||||||||||||||
Assets | ||||||||||||||||||||
Investments: | ||||||||||||||||||||
Fixed maturities available-for-sale, | $ | 56.6 | $ | — | $ | — | $ | 56.6 | ||||||||||||
Total Investments | 56.6 | — | — | 56.6 | ||||||||||||||||
Cash and cash equivalents | 364.1 | 0.1 | 230.0 | 6(a) | 819.5 | |||||||||||||||
| (1.4 | ) | 6(b) | ||||||||||||||||||
| (8.1 | ) | 6(d) | ||||||||||||||||||
| 550.0 | 6(e) | |||||||||||||||||||
| (27.6 | ) | 6(f) | ||||||||||||||||||
| (95.0 | ) | 6(j) | ||||||||||||||||||
| (192.6 | ) | 6(k) | ||||||||||||||||||
Restricted cash | 46.1 | — | 46.1 | |||||||||||||||||
Accounts receivable, net | 54.0 | — | 54.0 | |||||||||||||||||
Reinsurance recoverable on paid and unpaid losses and LAE | 242.8 | — | 242.8 | |||||||||||||||||
Deferred policy acquisition costs | — | — | — | |||||||||||||||||
Ceding commissions receivable | 34.2 | — | 34.2 | |||||||||||||||||
Prepaid reinsurance premiums | 195.3 | — | 195.3 | |||||||||||||||||
Prepaid expenses | — | 0.8 | (0.6 | ) | 6(f) | 0.2 | ||||||||||||||
Investments and cash held in Trust Account | — | 230.0 | (230.0 | ) | 6(a) | — | ||||||||||||||
Property and equipment | — | — | — | |||||||||||||||||
Capitalized internal use software, net | 18.7 | — | 18.7 | |||||||||||||||||
Goodwill | 48.2 | — | 48.2 | |||||||||||||||||
Intangible assets, net | 34.6 | — | 34.6 | |||||||||||||||||
Other assets | 27.2 | — | (5.2 | ) | 6(f) | 22.0 | ||||||||||||||
Total Assets | $ | 1,121.8 | $ | 230.9 | $ | 219.5 | $ | 1,572.2 | ||||||||||||
Liabilities, convertible preferred stock, and stockholders’ equity (deficit) | ||||||||||||||||||||
Liabilities | ||||||||||||||||||||
Loss and loss adjustment expense reserve | 195.2 | — | 195.2 | |||||||||||||||||
Unearned premiums | 216.5 | — | 216.5 | |||||||||||||||||
Reinsurance premiums payable | 137.0 | — | 137.0 | |||||||||||||||||
Provision for commission | 13.0 | — | 13.0 | |||||||||||||||||
Fiduciary liabilities | 28.2 | — | 28.2 | |||||||||||||||||
Convertible promissory notes | 299.0 | — | (299.0 | ) | 6(c) | — | ||||||||||||||
Derivative liability on notes | 162.6 | — | (162.6 | ) | 6(c) | — | ||||||||||||||
Contingent consideration liability | 11.6 | — | 11.6 | |||||||||||||||||
Preferred stock warrant liabilities | 137.5 | — | (137.5 | ) | 6(g) | — | ||||||||||||||
Due to related party | — | 0.3 | (0.3 | ) | 6(b) | — | ||||||||||||||
Deferred legal fees | — | 0.2 | (0.2 | ) | 6(b) | — | ||||||||||||||
Deferred underwriting comissions | — | 8.1 | (8.1 | ) | 6(d) | — | ||||||||||||||
Accrued expenses and other current liabilities | 46.0 | 0.9 | (0.9 | ) | 6(b) | 44.0 | ||||||||||||||
| (0.9 | ) | 6(c) | ||||||||||||||||||
| (1.1 | ) | 6(f) | ||||||||||||||||||
Derivative warrant liabilities | — | 16.6 | — | 16.6 | ||||||||||||||||
Total liabilities | 1,246.6 | 26.1 | (610.6 | ) | 662.1 | |||||||||||||||
53
Commitments and Contingencies | ||||||||||||||||||||
Class A ordinary shares, subject to possible redemption | — | 199.8 | (199.8 | ) | 6(h) | — | ||||||||||||||
Preferred stock | 344.8 | — | (344.8 | ) | 6(i) | — | ||||||||||||||
Stockholders’ equity (deficit) | ||||||||||||||||||||
Class A ordinary shares | — | — | — | 6(i) | — | |||||||||||||||
Class B ordinary shares | — | — | — | 6(i) | — | |||||||||||||||
Hippo common stock | — | — | — | 6(i) | — | |||||||||||||||
Hippo Holdings common stock | — | 6(c) | — | |||||||||||||||||
| — | 6(e) | |||||||||||||||||||
| — | 6(g) | |||||||||||||||||||
| — | 6(i) | |||||||||||||||||||
Additional paid-in capital | 65.8 | 11.6 | 199.8 | 6(h) | 1,445.5 | |||||||||||||||
| 344.8 | 6(i) | |||||||||||||||||||
| 462.5 | 6(c) | |||||||||||||||||||
| 137.5 | 6(g) | |||||||||||||||||||
| (14.4 | ) | 6(i) | ||||||||||||||||||
| 550.0 | 6(e) | |||||||||||||||||||
| (24.5 | ) | 6(f) | ||||||||||||||||||
| (95.0 | ) | 6(j) | ||||||||||||||||||
| (192.6 | ) | 6(k) | ||||||||||||||||||
Accumulated other comprehensive income | (0.3 | ) | — | — | 6(c) | (0.3 | ) | |||||||||||||
Accumulated deficit | (536.4 | ) | (6.6 | ) | 14.4 | 6(i) | (536.4 | ) | ||||||||||||
| (7.8 | ) | 6(f) | ||||||||||||||||||
Total stockholders’ equity (deficit) | (470.9 | ) | 5.0 | 1,374.7 | 908.8 | |||||||||||||||
Noncontrolling interest | 1.3 | — | — | 1.3 | ||||||||||||||||
Total stockholders’ equity (deficit) | (469.6 | ) | 5.0 | 1,374.7 | 910.1 | |||||||||||||||
Total liabilities, convertible preferred stock, and stockholders’ equity (deficit) | $ | 1,121.8 | $ | 230.9 | $ | 219.5 | $ | 1,572.2 | ||||||||||||
54
UNAUDITED PRO FORMA CONDENSED COMBINED STATEMENT OF OPERATIONS
FOR THE SIX MONTHS ENDED JUNE 30, 2021
(in millions, except share and per share amounts)
For the Six Months Ended June 30, 2021 | For the Six Months Ended June 30, 2021 | |||||||||||||||||||
Hippo (Historical) | RTPZ (Historical) | Pro Forma Transactions Accounting Adjustment | Pro Forma Combined | |||||||||||||||||
Revenue: | ||||||||||||||||||||
Net earned premium | $ | 19.0 | $ | — | $ | — | $ | 19.0 | ||||||||||||
Commission income, net | 11.6 | — | — | 11.6 | ||||||||||||||||
Service and fee income | 7.1 | — | — | 7.1 | ||||||||||||||||
Net investment income | 0.2 | — | — | 0.2 | ||||||||||||||||
Net realized capital gain on investments | — | — | — | — | ||||||||||||||||
Other income | — | — | — | — | ||||||||||||||||
Total revenue | 37.9 | — | — | 37.9 | ||||||||||||||||
Expenses: | ||||||||||||||||||||
Losses and loss adjustment expenses | 38.7 | — | — | 38.7 | ||||||||||||||||
Insurance related expenses | 16.0 | — | — | 16.0 | ||||||||||||||||
Technology and development | 14.5 | — | — | 14.5 | ||||||||||||||||
Sales and marketing | 46.9 | — | — | 46.9 | ||||||||||||||||
General and administrative | 17.1 | 2.0 | (1.7 | ) | 7(bb) | 17.4 | ||||||||||||||
Interest and other expense | 183.1 | — | (183.0 | ) | 7(aa) | 0.1 | ||||||||||||||
Commission Expense | — | — | — | — | ||||||||||||||||
Total expenses | 316.3 | 2.0 | (184.7 | ) | 133.6 | |||||||||||||||
Income (loss) from operations | (278.4 | ) | (2.0 | ) | 184.7 | (95.7 | ) | |||||||||||||
Other income (expense) | ||||||||||||||||||||
Unrealized gain on investment held in Trust Account | — | — | — | — | ||||||||||||||||
Change in fair value of derivative warrant liabilities | — | (3.1 | ) | — | (3.1 | ) | ||||||||||||||
Total other income (expense) | — | (3.1 | ) | — | (3.1 | ) | ||||||||||||||
Income (loss) before income taxes | (278.4 | ) | (5.1 | ) | 184.7 | (98.8 | ) | |||||||||||||
Income taxes (benefit) expense | 0.3 | — | — | 0.3 | ||||||||||||||||
Net income (loss) | (278.7 | ) | (5.1 | ) | 184.7 | (99.1 | ) | |||||||||||||
Net income (loss) attributable to noncontrolling interests, net of tax | 1.1 | — | — | 1.1 | ||||||||||||||||
Net income (loss) attributable to common stockholders | $ | (279.8) | $ | (5.1) | $ | 184.7 | $ | (100.2) | ||||||||||||
Weighted-average shares used in computing net loss per share attributable to Hippo — basic and diluted | 13,968,160 | |||||||||||||||||||
Net loss per share attributable to Hippo — basic and diluted | $ | (20.03 | ) | |||||||||||||||||
Weighted average shares outstanding — Class A ordinary shares | 23,000,000 | |||||||||||||||||||
Class A ordinary shares — basic and diluted | $ | — | ||||||||||||||||||
Weighted average shares outstanding — Class B ordinary shares | 5,750,000 | |||||||||||||||||||
Class B ordinary shares — basic and diluted | $ | (0.89 | ) | |||||||||||||||||
Weighted average shares outstanding — Hippo Holdings Common stock | 559,731,226 | |||||||||||||||||||
Hippo Holdings common stock — basic and diluted | $ | (0.18 | ) | |||||||||||||||||
55
UNAUDITED PRO FORMA CONDENSED COMBINED STATEMENT OF OPERATIONS
FOR THE YEAR ENDED DECEMBER 31, 2020
(in millions, except share and per share amounts)
For the Year Ended December 31, 2020 | For the period from January 1, 2020 to August 31, 2020 | For the period from inception October 2, 2020 (date of inception) to December 31, 2020 | For the Year ended December 31, 2020 | |||||||||||||||||||||||||||||||||||||
Hippo (Historical) | Spinnaker (Historical) | Spinnaker PPA Transaction Accounting Adjustments | Hippo and Spinnaker Combined (Historical) | RTPZ (Historical) | Pro Forma Transactions Accounting Adjustment | Pro Forma Combined | ||||||||||||||||||||||||||||||||||
Revenue: | ||||||||||||||||||||||||||||||||||||||||
Net earned premium | $ | 17.1 | $ | 5.6 | $ | — | $ | 22.7 | $ | — | $ | — | $ | 22.7 | ||||||||||||||||||||||||||
Commission income, net | 27.1 | — | (7.8 | ) | 7(aa) | 19.3 | — | — | 19.3 | |||||||||||||||||||||||||||||||
Service and fee income | 6.3 | — | — | 6.3 | — | — | 6.3 | |||||||||||||||||||||||||||||||||
Net investment income | 1.1 | 0.7 | — | 1.8 | — | — | 1.8 | |||||||||||||||||||||||||||||||||
Total revenue | 51.6 | 6.3 | (7.8 | ) | 50.1 | — | — | 50.1 | ||||||||||||||||||||||||||||||||
Expenses: | ||||||||||||||||||||||||||||||||||||||||
Losses and loss adjustment expenses | 25.3 | 5.0 | (0.9 | ) | 7(aa) | 29.4 | — | — | 29.4 | |||||||||||||||||||||||||||||||
Insurance related expenses | 19.3 | — | (0.5 | ) | 7(aa) | 18.8 | — | — | 18.8 | |||||||||||||||||||||||||||||||
Technology and development | 18.0 | — | 0.4 | 7(bb) | 18.4 | — | — | 18.4 | ||||||||||||||||||||||||||||||||
Sales and marketing | 69.4 | — | (14.6 | ) | 7(aa) | 54.8 | — | — | 54.8 | |||||||||||||||||||||||||||||||
General and administrative | 36.8 | 7.4 | — | 44.2 | 0.3 | 8.9 | 7(ee) | 53.4 | ||||||||||||||||||||||||||||||||
Interest and other expense | 26.0 | — | — | 26.0 | — | (25.8 | ) | 7(cc) | 0.2 | |||||||||||||||||||||||||||||||
Commission Expense | — | (11.3 | ) | 11.3 | 7(aa) | — | — | — | — | |||||||||||||||||||||||||||||||
Total expenses | 194.8 | 1.1 | (4.3 | ) | 191.6 | 0.3 | (16.9 | ) | 175.0 | |||||||||||||||||||||||||||||||
Income (loss) from operations | (143.2 | ) | 5.2 | (3.5 | ) | (141.5 | ) | (0.3 | ) | 16.9 | (124.9 | ) | ||||||||||||||||||||||||||||
Other income (expense) | ||||||||||||||||||||||||||||||||||||||||
Financing costs — derivative warrant liabilities | — | — | — | — | (0.4 | ) | (0.7 | ) | 7(ff) | (1.1 | ) | |||||||||||||||||||||||||||||
Change in fair value of derivative warrant liabilities | — | — | — | — | (0.8 | ) | — | (0.8 | ) | |||||||||||||||||||||||||||||||
Total other income (expense) | — | — | — | — | (1.2 | ) | (0.7 | ) | (1.9 | ) | ||||||||||||||||||||||||||||||
Income (loss) before income taxes | (143.2 | ) | 5.2 | (3.5 | ) | (141.5 | ) | (1.5 | ) | 16.2 | (126.8 | ) | ||||||||||||||||||||||||||||
Income taxes (benefit) expense | (1.8 | ) | 1.1 | (1.1 | ) | 7(dd) | (1.8 | ) | — | 7(dd) | — | 7(dd) | (1.8 | ) | ||||||||||||||||||||||||||
Net income (loss) | (141.4 | ) | 4.1 | (2.4 | ) | (139.7 | ) | (1.5 | ) | 16.2 | (125.0 | ) | ||||||||||||||||||||||||||||
Net income (loss) attributable to noncontrolling interests, net of tax | 0.1 | — | — | 0.1 | — | — | 0.1 | |||||||||||||||||||||||||||||||||
Net income (loss) attributable to common stockholders | $ | (141.5 | ) | $ | 4.1 | $ | (2.4 | ) | $ | (139.8 | ) | $ | (1.5 | ) | $ | 16.2 | $ | (125.1 | ) | |||||||||||||||||||||
Weighted-average shares used in computing net loss per share attributable to Hippo — basic and diluted | 12,495,509 | |||||||||||||||||||||||||||||||||||||||
Net loss per share attributable to Hippo — basic and diluted | $ | (11.32 | ) | |||||||||||||||||||||||||||||||||||||
Weighted average shares outstanding — Class A ordinary shares | 23,000,000 | |||||||||||||||||||||||||||||||||||||||
Class A ordinary shares — basic and diluted | $ | — | ||||||||||||||||||||||||||||||||||||||
Weighted average shares outstanding — Class B ordinary shares | 5,750,000 | |||||||||||||||||||||||||||||||||||||||
Class B ordinary shares — basic and diluted | $ | (0.26 | ) | |||||||||||||||||||||||||||||||||||||
Weighted average shares outstanding — Hippo | 559,731,226 | |||||||||||||||||||||||||||||||||||||||
Holdings Common stock | ||||||||||||||||||||||||||||||||||||||||
Hippo Holdings common stock — basic and diluted | $ | (0.22 | ) | |||||||||||||||||||||||||||||||||||||
56
Note 1 — Description of the Merger
Merger between RTPZ and Old Hippo — Business Combination
Pursuant to the Merger Agreement, following the Domestication (including the change of RTPZ’s name to “Hippo Holdings Inc.”), (i) Merger Sub merged with and into Old Hippo, with Old Hippo surviving the First Merger as a wholly owned subsidiary of Hippo Holdings, and (ii) immediately following the First Merger, Old Hippo (as the surviving corporation of the First Merger) merged with and into Hippo Holdings, the separate corporate existence of Old Hippo ceased, and Hippo Holdings continued as the surviving corporation.
The aggregate consideration paid to Old Hippo stockholders in connection with the Business Combination, was 552,200,000 shares. The Exchange Ratio was equal to approximately 6.95433.
The Business Combination occurred based on the following transactions contemplated by:
the Merger Agreement
| • | the issued and outstanding shares of Old Hippo preferred stock was canceled and converted into shares of Old Hippo common stock at the then-effective conversion rate as calculated pursuant to Hippo’s Amended and Restated Certificate of Incorporation; |
| • | the Old Hippo warrants were exercised in full on a cash or cashless basis or terminated without exercise, as applicable, in accordance with their respective terms; |
| • | the Old Hippo notes were automatically converted into shares of Old Hippo common stock in accordance with their respective terms; |
| • | the issued and outstanding share of Old Hippo common stock (including the Old Hippo common stock referred to in the above points) as of immediately prior to the Effective Time, was canceled in exchange for the right to receive a number of shares of Hippo Holdings common stock equal to the Exchange Ratio; and |
| • | the outstanding vested and unvested Old Hippo options as of immediately prior to the Effective Time, was converted into Hippo Holdings options with the same terms except for the number of shares exercisable and the exercise price, each of which was adjusted using the Exchange Ratio. |
Other related events that took place in connection with the Business Combination are summarized below:
| • | Pursuant to the terms of the Sponsor Agreement, the Sponsor subjected the 5,630,000 Sponsor Shares to the following (a) price-based vesting terms over a ten-year period following the Closing and(b) lock-ups. |
Each of the four tranches applies to 25% of the total Sponsor Shares (, each tranche applies to 1,407,500 Sponsor Shares):
i.e.
| • | Tranche 1 |
| • | Price-Based Vesting Trigger |
| • | Lockup |
| • | Tranche 2 |
| • | Price-Based Vesting Trigger |
| • | Lockup |
| • | Tranche 3 |
| • | Price-Based Vesting Trigger |
| • | Lockup |
57
| • | Tranche 4 |
| • | Price-Based Vesting Trigger |
| • | Lockup |
| • | After ten years, any Sponsor Shares that have not yet met the applicable price-based vesting trigger shall automatically vest. |
| • | If, after Closing, Hippo Holdings completes a transaction that results in a change of control, the Sponsor Shares are released from the vesting and lock-up restrictions immediately prior to such change of control. As RTPZ legally owns the shares and is subject only to transfer restrictions that lapse upon the earlier of (1) meeting one or more specific conditions described above or (2) a stated date, such Sponsor Shares are considered to be outstanding shares of stock. |
| • | Pursuant to the terms of the Sponsor Agreement, the Sponsor agreed, in addition to the existing exercise provisions in the Warrant Agreement, to the mandatory exercise of the private placement warrants if, during the exercise period, (a) Hippo Holdings elects to redeem the public warrants, (b) the last reported sales price of Hippo Holdings common stock for any 20 trading days within a period of 30 consecutive trading days exceeds $25.00 per share, and (c) there is an effective registration statement covering the issuance of shares of Hippo Holdings common stock issuable upon exercise of the private placement warrants, and a current prospectus relating thereto, available at the time of such exercise. |
| • | Following the Closing, Hippo Holdings used $95,000,000 to acquire 9,500,000 shares of Hippo Holdings common stock from certain stockholders of Old Hippo prior to the Business Combination. |
Spinnaker Transaction
On August 31, 2020, Old Hippo acquired 100% of the issued and outstanding share capital of Spinnaker, a privately held entity that is an Illinois domiciled property and casualty insurance carrier, in exchange for cash consideration. The total consideration of $90.5 million, which is subject to customary closing adjustments, was paid in cash and transferred as part of the closing of the transaction for all of the outstanding equity interests of Spinnaker.
Note 2 — Basis of Presentation
The unaudited pro forma condensed combined financial statements were prepared in accordance with Article 11 of SEC Regulation
S-X
as amended by the final rule, ReleaseNo. 33-10786
“Amendments to Financial Disclosures about Acquired and Disposed Businesses.” ReleaseNo. 33-10786
replaces the existing pro forma adjustment criteria with simplified requirements to depict the accounting for the transaction (“Transaction Accounting Adjustments”) and present the reasonably estimable synergies and other transaction effects that have occurred or are reasonably expected to occur (“Management’s Adjustments”). RTPZ has not elected to present Management’s Adjustments and will only be presenting Transaction Accounting Adjustments in the unaudited pro forma condensed combined financial information. The adjustments presented in the unaudited pro forma condensed combined financial statements have been identified and presented to provide relevant information necessary for an understanding of the combined company upon consummation of the Business Combination.Management has made significant estimates and assumptions in its determination of the pro forma adjustments based on information available as of the date of filing this prospectus and is subject to change as additional information becomes available and analyses are performed. As the unaudited pro forma condensed combined financial information has been prepared based on these preliminary estimates, the final amounts recorded may differ materially from the information presented as additional information becomes available. Management considers this basis of presentation to be reasonable under the circumstances.
58
The unaudited pro forma condensed combined financial information does not give effect to any anticipated synergies, operating efficiencies, tax savings, or cost savings that may be associated with the Transactions. RTPZ has not had any historical relationship with Old Hippo prior to the Business Combination. Accordingly, no Transaction Accounting Adjustments were required to eliminate activities between the companies. However, as Old Hippo had a prior relationship with Spinnaker prior to the Spinnaker Transactions, Transaction Accounting Adjustments have been made to eliminate such activities in the unaudited condensed combined statement of operations.
Total one-time direct
and incremental transaction costs (i.e. “Transaction costs”) incurred prior to, or concurrent with, the Closing were allocated between common stock issued and other equity instruments currently classified as liabilities (i.e. private placement warrants and public warrants) on a relative fair value basis. Transaction costs allocable to common stock issued are reflected in the unaudited pro forma condensed combined balance sheet as a direct reduction to Hippo’sadditional paid-in capital
and are assumed to be cash settled. Transaction costs allocable to issued warrants classified as liabilities are charged to the unaudited pro forma condensed combined statement of operations and are assumed to be cash settled.The following summarizes the pro forma shares of Post-Combination Common Stock issued and outstanding at the Closing:
Shares (4) | % Ownership | |||||||
Hippo stockholders (1) (2) | 547,974,660 | 89.5 | % | |||||
PIPE Investors — Existing Hippo stockholders | 9,900,000 | 1.6 | % | |||||
PIPE Investors (3)(5) | 45,100,000 | 7.4 | % | |||||
Class A ordinary shares | 3,738,620 | 0.6 | % | |||||
Class B ordinary shares (5) | 5,750,000 | 0.9 | % | |||||
Pro Forma common stock at the Closing | 612,463,280 | 100 | % | |||||
| (1) | Includes approximately 52.7 million shares of Old Hippo common stock underlying rollover options that do not represent legally outstanding shares of Old Hippo common stock at the Closing. |
| (2) | Includes redemption by Old Hippo of 9.5 million shares whereby, at the Closing, Hippo Holdings used $95.0 million to repurchase 9.5 million shares of Hippo Holdings common stock from certain stockholders of Old Hippo. |
| (3) | Includes $10.0 million of investment from Reinvent Capital Fund and remaining $441.0 million from Third Party PIPE investors. |
| (4) | Excludes the outstanding RTPZ warrants issued in connection with its initial public offering as such securities are not exercisable until 30 days after the Closing. |
| (5) | Through the Class B ordinary shares, the Sponsor and its related entities owned 1.027% of Hippo Holdings common stock outstanding immediately following the Closing. |
Note 3 — Accounting Policies
Based on its initial analysis of Old Hippo and RTPZ’s policies, Hippo Holdings and RTPZ did not identified any differences in accounting policies that would have an impact on the unaudited pro forma condensed combined financial information. As a result, the unaudited pro forma condensed combined financial information does not assume any differences in accounting policies.
Note 4 — Accounting for the Transactions
The Business Combination between Old Hippo and RTPZ was accounted for as a reverse recapitalization of Old Hippo who has been determined to be the accounting acquirer based on a number of considerations,
59
including but not limited to: i) Old Hippo former management making up the majority of the Management Team of Hippo Holdings, ii) Old Hippo former management nominating or representing the majority of Hippo Holdings’ board of directors and iii) Old Hippo representing the majority of the continuing operations of Hippo Holdings. Management has also preliminarily determined Old Hippo to be the predecessor entity to the Merger Agreement based on the same considerations listed above.
The Business Combination between Old Hippo and RTPZ was accounted for as a reverse recapitalization, with no goodwill or other intangible assets recorded, in accordance with U.S. GAAP. Under this method of accounting, RTPZ was treated as the “acquired” company for financial reporting purposes. Accordingly, for accounting purposes, the reverse recapitalization was treated as the equivalent of Old Hippo issuing stock for the net assets of RTPZ, accompanied by a recapitalization. Operations prior to the reverse recapitalization was those of Old Hippo.
The acquisition of Spinnaker has been treated as a business combination and has been accounted for using the acquisition method. Old Hippo has recorded the fair value of assets and liabilities acquired from Spinnaker.
Note 5 — Shares of RTPZ Common Stock Issued to Old Hippo Stockholders upon Closing
Based on the Exchange Ratio of 6.95433, RTPZ issued 495.2 million shares of RTPZ common stock in the Business Combination using a reference price of $10.00 per share, net of the Redemption of Hippo Holdings common stock, and an additional 52.7 million Hippo Holdings options as follows:
Hippo Common Stock outstanding prior to the Closing | 15,940,879 | |||
Exchange Ratio | 6.95433 | |||
| 110,858,175 | ||||
Less: Redemption of Hippo Holdings common stock immediately after the Closing | (9,500,000 | ) | ||
| 101,358,175 | ||||
Hippo convertible preferred stock outstanding prior to the Closing | 43,985,178 | |||
Exchange Ratio | 6.95433 | |||
| 305,887,553 | ||||
Hippo convertible promissory note (including accrued interest) outstanding prior to the Closing | 6,247,807 | |||
Exchange Ratio | 6.95433 | |||
| 43,449,329 | ||||
Hippo’s common and preferred warrants which converted prior to the Closing | 6,405,726 | |||
Exchange Ratio | 6.95433 | |||
| 44,547,549 | ||||
Shares of RTPZ Common Stock issued to Hippo Stockholders upon the Closing | 495,242,606 | |||
Rollover of Hippo’s options to Hippo Holding’s options | 7,582,619 | |||
Exchange Ratio | 6.95433 | |||
| 52,732,054 | ||||
Total Aggregate Merger Consideration, including rollover options | 547,974,660 | |||
60
Note 6 — Adjustments to Unaudited Pro Forma Condensed Combined Balance Sheet
The unaudited pro forma condensed combined balance sheet as of June 30, 2021 has been prepared to illustrate the effect of the Transactions and has been prepared for informational purposes only.
The pro forma transaction accounting adjustments, based on preliminary estimates that could change materially as additional information is obtained, are as follows:
| (a) | Reflects the release of $230.0 million of investments held in the trust account that become available upon the Closing. |
| (b) | Reflects the settlement of RTPZ’s historical liabilities that were settled upon the Closing. |
| (c) | Reflects the automatic conversion of Hippo notes into shares of Hippo common stock as per the original terms of the Hippo notes, and subsequent conversion into Hippo Holdings common stock. Upon the conversion, the carrying value of the debt of $299.0 million, including unamortized debt discount, accrued interest of $0.9 million recorded in accrued liability, and the related derivative liability of $162.6 million were derecognized. The Hippo Holdings shares issued in exchange for the Hippo notes were recorded at fair value to Hippo Holdings common stock in amount of $0 and additional paid in capital in amount of $462.5 million. |
| (d) | Reflects the payment of approximately $8.1 million of deferred underwriters’ fees incurred during RTPZ’s initial public offering and due upon the Closing. |
| (e) | Reflects the proceeds of $550.0 million from the issuance and sale of 55.0 million shares of Hippo Holdings common stock at $10.00 per share pursuant to the Subscription Agreements entered into with the PIPE Investors in connection with the PIPE Investment. |
| (f) | Reflects recording of Old Hippo’s transaction costs of $25.2 million. These expected transaction costs are in connection with the Closing and related transactions and are deemed to be direct and incremental costs of the Business Combination, $24.5 million of which have been allocable to common stock issued and recorded as a reduction to additional paid-in capital and the remaining $0.7 million allocable to issued warrants classified as liabilities have been charged to the unaudited pro forma condensed combined statement of operations. Necessary adjustments have been made to other assets for deferred offering cost of $5.2 million, accrued liabilities for $1.1 million for unpaid Old Hippo transaction costs, and cash and cash equivalents for $21.1 million for Old Hippo’s transaction costs. In addition, an adjustment of $7.1 million has been made to accumulated deficit with an offset to cash and cash equivalents and prepaid expenses to reflect RTPZ’s transaction costs in the nature of advisory, legal, accounting and auditing fees and other professional fees pertaining to the Business Combination and related transactions. |
| (g) | Reflects the reclassification of Old Hippo’s convertible preferred stock warrant liability to additional paid in capital as a result of Old Hippo warrants being converted into Hippo Holdings common stock. |
| (h) | Reflects the reclassification of Class A ordinary shares of $199.8 million to permanent equity immediately prior to the Closing. |
| (i) | Reflects the recapitalization of Old Hippo through the contribution of all outstanding Old Hippo common stock and Old Hippo preferred stock to RTPZ and the issuance of 494.7 million shares of Hippo Holdings common stock and the elimination of the accumulated deficit of RTPZ, the accounting acquiree. As a result of the recapitalization, the carrying value of Old Hippo’s convertible preferred stock of $344.8 million, common stock of $0, and RTPZ’s accumulated deficit of $14.4 million were derecognized. The shares of Hippo Holdings common stock issued in exchange for Old Hippo’s capital were recorded to Hippo Holdings common stock in the amount of $0 and additional paid in capital in amount of $344.8 million. The Transaction Accounting Adjustment also includes conversion of outstanding RTPZ Class A and Class B ordinary shares into Hippo Holdings common stock concurrent with the Closing. |
61
| (j) | Reflects the redemption of Hippo Holdings common stock amounting to $95.0 million at $10.00 per share, following the Closing. |
| (k) | Reflects the cash disbursed to redeem 19.3 million Class A ordinary shares for $192.6 million allocated to Hippo Holdings common stock and APIC, using a par value of $0.0001 per share at a redemption price of approximately $10.00 per share. |
Note 7 — Adjustments to Unaudited Pro Forma Condensed Combined Statement of Operations
The unaudited pro forma basic and diluted net loss per share amounts presented in the unaudited pro forma condensed combined statements of operations are based upon the number of outstanding shares of Hippo Holdings, assuming the Business Combination occurred on January 1, 2020.
The pro forma adjustments included in the unaudited pro forma condensed combined statement of operations for the six months ended June 30, 2021 are as follows:
| (aa) | Reflects reversal of $68.4 million interest expense and change in fair value of embedded derivative pertaining to convertible promissory notes. The adjustment also reflects reversal of $114.6 million for changes in fair value of Old Hippo warrants to purchase Old Hippo preferred stock. |
| (bb) | Reflects reversal of $1.7 million of RTPZ’s transaction costs that were recorded during the six months ended June 30, 2021 as such costs pertain to the Business Combination. These costs have been shown as a proforma adjustment within the unaudited pro forma condensed combined statement of operations for the year ended December 31,2020. |
The pro forma adjustments included in the unaudited pro forma condensed combined statement of operations for the year ended December 31, 2020 are as follows:
| (aa) | Reflects adjustment to eliminate pre-existing relationship and fair value between Spinnaker and Old Hippo and fair value adjustments as described below: |
Pre-existing
relationshippre-existing
relationship between Spinnaker and Old Hippo and to align the accounting policies of the combined company, which includes $2.8 million reversal of revenue, $0.9 million reversal of loss and loss adjustment expenses, $14.6 million reversal of sales and marketing expenses, $0.5 million reversal of insurance related expenses and $11.3 million increase of commission expenses, which eliminated the negative commission expense on Spinnaker historical financial statements. Thepre-existing
relationship pertains to Old Hippo serving as MGA and MGU of Spinnaker. Prior to the acquisition, Old Hippo earned commission income and incurred commission expenses to other agencies, which was included in sales and marketing expenses on the consolidated Old Hippo financial statements. Upon the acquisition, the combined company would earn ceding commission income in excess of acquisition cost. The commission paid to other agencies by Old Hippo would be included as a reduction of revenue. Prior to the acquisition, RH Solutions Insurance, a subsidiary of Old Hippo, assumed a portion of the insurance risk from Spinnaker and incurred fronting fee based on percentage of earned premium from the assumed policies, which was recorded as insurance related expense. Upon acquisition, the fronting fee would be eliminated with Spinnaker’s ceding commission income.Fair value adjustment —
| (bb) | Reflects incremental expense pertaining to amortization of intangibles (including value of business acquired) amounting to $0.4 million. |
| (cc) | Reflects reversal of $9.6 million interest expense and change in fair value of embedded derivative pertaining to convertible promissory notes. The Transaction Accounting Adjustment also includes reversal of $16.2 million for changes in fair value of Old Hippo warrants to purchase Old Hippo preferred stock. |
62
| (dd) | The unaudited pro forma condensed combined statement of operations of Old Hippo for the year ended December 31, 2020 takes into consideration if recognition of deferred tax assets is appropriate when realization of these assets is more likely than not. Based upon weight of all available evidence, with primary focus on the Old Hippo’s history of recent losses, Old Hippo has concluded that it is not more likely than not that the recorded deferred tax assets will be realized. As a result, the tax effect of the Transactions is recorded at no tax expense or benefit to Old Hippo. The pro forma combined provision for income taxes does not necessarily reflect the amounts that would have resulted had RTPZ and Old Hippo filed consolidated income tax returns during the period presented. |
| (ee) | Reflects RTPZ’s transaction cost of $8.9 million as part of the Business Combination and related transactions. |
| (ff) | Reflects the transaction costs allocable to RTPZ liability classified warrants. Refer to Note 2 for further details. |
Note 8 — Net Loss per Share
Represents the net loss per share calculated using the historical weighted average shares outstanding and the issuance of additional shares in connection with the Business Combination, the PIPE Investment, and other
related events, assuming such additional shares were outstanding since January 1, 2020. As the Business Combination and PIPE Investment are being reflected as if they had occurred as of January 1, 2020, the calculation of weighted average shares outstanding for basic and diluted net loss per share assumes the shares issued in connection with the Business Combination and PIPE Investment have been outstanding for the entire periods presented. This calculation is retroactively adjusted to eliminate the number of shares redeemed in the Business Combination for the entire period presented.
(in millions, except share and per share data) | For the Six Months Ended June 30, 2021 | For the Year Ended December 31, 2020 | ||||||
Pro forma net loss | $ | (100.2 | ) | $ | (125.1 | ) | ||
Weighted average shares outstanding of Hippo Holdings common stock | 559,731,226 | 559,731,226 | ||||||
Net loss per share (Basic and Diluted) attributable to Hippo Holdings common stockholders | $ | (0.18 | ) | $ | (0.22 | ) | ||
Weighted average shares outstanding — basic and diluted | ||||||||
Former Hippo stockholders | 495,242,606 | 495,242,606 | ||||||
RTPZ Class A stockholders | 3,738,620 | 3,738,620 | ||||||
RTPZ Class B stockholders | 5,750,000 | 5,750,000 | ||||||
PIPE Transaction | 55,000,000 | 55,000,000 | ||||||
Total | 559,731,226 | 559,731,226 | ||||||
63
The following potential outstanding securities were excluded from the computation of pro forma net loss per share, basic and diluted, for the six months ended June 30, 2021 and year ended December 31, 2020, because their effect would have been anti-dilutive or issuance of such shares is contingent upon the satisfaction of certain conditions which were not satisfied by the end of the period:
For the Six Months Ended June 30, 2021 | For the Year Ended December 31, 2020 | |||||||
Hippo Holdings Stock Options | 52,732,054 | 52,732,054 | ||||||
Hippo Holdings Common stock subject to repurchase | 12,003,665 | 12,003,665 | ||||||
RTPZ — public and private placement warrants | 9,000,000 | 9,000,000 | ||||||
64
BUSINESS
Letter from our Founder and CEO
Most of us treat insurance as an afterthought, only considering it when we absolutely need it. And yet, no one would drive a car if they had to shoulder the full financial liability of causing an accident, and no bank would provide a mortgage on a home without insurance coverage. The truth is that insurance is woven into the financial fabric of our society, and is a silent partner in all our major financial decisions.
For over a century insurance has been priced, underwritten, and sold in the same fundamental way—through captive and independent agents. But 2021 is a different age, one with an abundance of data; smart, connected devices in our homes and cars; and growing customer expectations. An opportunity to transform insurance is emerging. We started our Company to accelerate and guide this transformation in the homeowners market.
In order to succeed in insurance,. The industry is simply not set up to deliver fast wins. Investments made today will not pay off overnight, but over many years to come. We have aligned our entire company around this mindset. Our culture supports making the right decisions for the long-term. The people we hire are strategic thinkers who share this view, and our product and technology roadmap is focused on maximizing the long term value of the Company.
we need to take a long-term view
Because of the nature of this industry and our long-term approach, we do not make decisions that maximize short-term results at the expense of long-term value. We believe it is important to share the guiding principles that will inform our prioritization and decision making. Our hope is that this will help to better define our journey and provide clarity for those who wish to join us.
| • | Equally weigh Insurance and Technology: Insurance Technology. |
| • | Be thorough, don’t seek silver bullets: |
| • | Grow from success as well as failure: |
| • | Embrace regulation: |
| • | The best claims experience is the one that never happens. |
| • | Add real value and deliver on our promise to customers: |
65
expectations with a white glove approach that leverages humans for empathy and technology for ease, efficiency, and accuracy. In addition, our coverages have been crafted around their value to the customer, not only on their profitability to us. |
Over the long term, we expect to achieve the industry’s safest homes by harnessing the latest data sources, IoT devices, and proactive home services to prevent losses, and through a tenacious focus on our customers’ needs. This approach, facilitated by our proprietary technology platform, will enable us to fine tune our offering quickly and deliver ongoing innovation to our customers.
We are more than just an insurance company. Hippo’s unique relationship with customers allows us to focus on homeownership more broadly. We expect to expand our home service offerings, providing more protection and support so our customers can focus on the joy of homeownership.
Assaf Wand,
Co-founder
and Chief Executive Officer,Hippo Holdings Inc.
Our Vision and Mission
Hippo’s Vision: To protect the joy of homeownership.
Hippo’s Mission: To deliver intuitive and proactive protection for homeowners by combining the power of technology with a human touch.
Our Company
Hippo Holdings Inc. (“Hippo”) is a different kind of home protection company, built from the ground up to provide a new standard of care and protection for homeowners. Our goal is to make homes safer and better protected so customers spend less time worrying about the burdens of homeownership and more time enjoying their homes and the life within. Harnessing real-time data, smart home technology, and a growing suite of home services, we have created an integrated home protection platform.
The home insurance industry has long been defined by century-old incumbents that deliver a passive, high-friction experience to policyholders. Constrained by outdated captive-agent distribution models, large bases of existing customers, legacy technology, and strong incentives not to disrupt their businesses the industry has not seen meaningful innovation in decades. The result is in a flawed customer experience that creates a transactional, adversarial relationship — one that pits insurance companies and their “policyholders” against each other in a
zero-sum
game. The outcome of this misalignment is an experience that is out of touch with the needs of modern homeowners.Modern technology provides an opportunity to transform the $110 billion U.S. home insurance industry, enabling advancements and efficiencies across the customer lifecycle. We believe there is significant opportunity in this market, expected to reach nearly $140 billion by 2025 (according to industry data from William Blair & Company) for a digital-first, customer-centric company like Hippo.
Hippo harnesses technology and data to refocus the home insurance experience around the customer’s needs at every stage of the relationship. We seek to facilitate an active partnership with our customers to help prevent losses, which in turn creates better results for Hippo. The result is a
win-win.
• | We make Hippo policies fast and easy to buy. |
With incumbent carriers, buying home insurance is an arduous task built around the carrier’s needs, not the customer’s. The process burdens customers with long phone calls, requiring
66
customers to answer up to 60 confusing questions without any online buying capability. Using advanced data approaches, our proprietary underwriting engine allows Hippo to provide a quote in just 60 seconds (and a fully bound policy in less than 5 minutes) and delivers them via omni-channel distribution that meets consumers wherever they shop for insurance.
• | Our policies are designed for the modern homeowner. |
Unlike the outdated policies of traditional insurers which force people to pay for coverage they don’t need. Hippo policies are designed for modern lives, covering crucial items like home office equipment and water
back-up. Our
modern coverage means that Hippo customers are less likely to encounter unexpected holes in coverage in the event of a loss, a primary source of frustration with other carriers’ claims experience.• | We have designed a proactive, human approach to claims, enabled by technology. |
Hippo uses live data to anticipate major events, enabling our claims team to reach out in advance of major weather events with comforting advice and information. When a customer does need to file a claim, a Hippo Claims Concierge guides that customer through the process, easing anxiety and improving satisfaction. The combined impact of our modern coverage and human-first approach can be seen in our
90-day
Claims Net Promoter Score (“NPS”), described below, of positive 60, according to our survey (vs. the industry average Claims NPS of negative 49 using the same methodology, according to a 2014 Morgan Stanley Research and Boston Consulting Group report).Beyond a core insurance experience that is simple, intuitive, and human, we focus our resources on Hippo’s true promise: better outcomes for homeowners. We have created an integrated home protection platform, which offers a growing suite of proactive features designed to prevent loss and provide greater peace of mind.
• | We have pioneered what we believe is the most widely adopted Smart Home program in the industry. |
We include smart home devices to detect water, fire, and theft, and offer premium discounts to customers who use them. Real-time alerts help customers quickly identify and resolve issues before they grow into major losses.
• | We proactively help our customers maintain and protect their homes. |
We offer
on-demand
maintenance advice through Hippo Home Care, our virtual home concierge service, and access to annual homecheck-ups
and maintenance. We also use advanced technology and data to constantly assess new risks outside the home and recommend necessary underwriting adjustments.Our intuitive and proactive protection seeks to reduce the likelihood of a loss, while also deepening our customer relationships, improving loyalty and retention. Just ask our customers, who rate Hippo 4.9 out of 5 stars (based on reviews collected by Hippo on its web page) and reward us with an
90-day
average overall NPS of 75, according to our survey (vs. the insurance industry average of 35 in 2020, according to data from Statista, Inc.). NPS (Net Promoter Score) measures a customer’s propensity to recommend Hippo after signing up for Hippo or experiencing a claim. To calculate NPS, our survey asks, “How likely are you to recommend Hippo to friends or family?” (0 = not at all likely to 10 = extremely likely). The NPS Score is the percentage of customers who are promoters (those who scored9-10)
minus the percentage who are detractors (those who scored0-6).
By asking customers the reasons for their ratings, it provides the business a way to directly address customer concerns, understand how to improve retention and develop strategies to grow brand loyalty.This partnership is designed to create a virtuous cycle. By making homes safer, we help deliver better risk outcomes and increase customer loyalty, which improves our unit economics and customer lifetime value (“LTV”). This enables us to invest in expanding our product offering, customer value proposition, and marketing programs, which helps attract more customers to the Hippo family. This growth generates more data and insights to fuel further innovation in our product experience and improved underwriting precision. The result is even safer
67
homes and
more loyal customers. We believe this virtuous cycle, combined with our significant existing scale, deep partnerships, and compelling unit economics, will propel Hippo to become a trusted household name synonymous with proactive home protection.
Aligned Interest: When our Customers Win, We Win
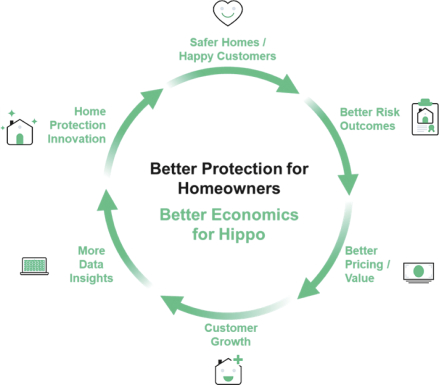
The success of our strategy is demonstrated in our financial and operating metrics. We have grown consistently while also improving loss frequency and premium retention.
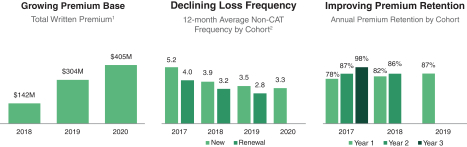
| (1) | Spinnaker and North American Advantage Insurance Services LLC (“NAAIS”) are presented on a pro forma basis as of January 1, 2018. For more information please see “ Recent Acquisition: Spinnaker Insurance Company |
| (2) | Frequency defined as number of claims divided by the total number of units of exposure, where a unit of exposure is defined as one policy year earned. For example, one policy in force written 24 months ago, represents 2x units of exposure. The cohorts are 12-month cohorts starting on 8/1 of each calendar year. |
68
See “”.
Management’s Discussion and Analysis of Financial Condition and Results of Operations — Key Operating and Financial Metrics — Revenue — Total Generated Premium
Our Industry / Opportunity
With $110 billion in annual premiums, the U.S. home insurance industry is a deeply fragmented market with only one carrier accounting for more than 10% of the total market share (according to William Blair & Company). This fragmentation in the market sets the stage for positive traction from new entrants — this is not a
winner-take-all
industry.The U.S. home insurance industry has attractive customer dynamics and growth characteristics. According to the Insurance Information Institute, home insurance customers remain with their selected carrier for an average of
8-10
years — more than double the length of time of renters or auto insurance customers. Additionally, home insurance customers average $1,200 in annual premiums, providing insurers with a compelling recurring revenue opportunity. Multiple factors contribute to a strong growth outlook for the industry, including the high rate of new home construction, population growth, increasingly complex homes, and rising labor and material costs.Despite these industry tailwinds, we believe customers’ needs are not being met. Today’s insurance policies often include coverage for items that modern homeowners do not own, such as fur coats, pewter bowls and paper stock and bond certificates, and exclude coverage for common claim categories such as water-backup, home office equipment and other electronics. Homeowners’ lives and properties have evolved, but too often their coverages have not kept pace. Thismentality in underwriting can mean that while insurers collect premiums, homeowners discover gaps in coverage only after a loss. Even if consumers proactively recalibrate coverage over time, they are still constrained by outdated policy designs. Hippo management believes that 60% of U.S. homeowners are underinsured.
set-it-and-forget-it
We believe the market is poised for rapid transformation with trends emerging in big data, technology, and underwriting that will allow better assessment of home insurance risk resulting in more accurate pricing, proliferation of APIs, and meeting the rising customer expectations for personalized and real-time products. We believe the
COVID-19
pandemic has only accelerated this change, increasing homeowner adoption of digital channels and growing demands on the use of their spaces.Since our inception, we have incurred operating losses, including net losses attributable to Old Hippo of $141.5 million for the year ended December 31, 2020. We had an accumulated deficit of $256.6 million as of December 31, 2020. We expect to continue to incur operating losses for the foreseeable future due to continued investments that we intend to make in our business and, as a result, we may require additional capital resources to grow our business. For a discussion of risks applicable to Hippo’s business, including with respect to its history of net losses and its ability to grow its business, please see the section entitled “.”
Risk Factors — Risks Related to Our Business
Barriers to Entry
New entrants who work to rebuild the customer experience, with technology, new data and nimble changes, will be better positioned to serve today’s homeowners. For the right company, the opportunity is enormous. However, new entrants must overcome high barriers to entry:
• | Significant initial capital requirements to support insurance risk, challenges finding cost-effective reinsurance without an underwriting track record, expensive off-the-shelf |
• | Complicated and fragmented regulatory landscape with a unique set of rules from each state |
• | Significant resource investment in tech and infrastructure to access, collect and validate insurance-related data, in addition to the development of multiple customized APIs |
69
• | Difficulty accessing distribution networks, built upon a legacy, agent-based distribution, or resource-intensive process of creating and scaling new, alternative customer acquisition channels |
We believe incumbents face multiple challenges in responding to the ongoing transformation and meeting customer needs, including channel conflict, data stability and veracity (stemming from unverified customer-supplied data), and too much reliance on aging and siloed technology. And, with the agent population shrinking (according to McKinsey & Company research), incumbents may find it harder to access new customers who increasingly choose digital,channels.
direct-to-consumer
This leads to incumbents potentially facing a dilemma- being forced to choose between maintaining the stability of their current books of business or investing in the innovation that would drive further growth and value to homeowners. We believe they are generally choosing the former. With homeownership generally on the rise, we believe well-positioned new entrants have an opportunity to rise to the challenge and capitalize on growth opportunities more quickly.
We are confident that Hippo’s vision, technology, and innovative approach are positioned to create the change the industry and homeowners need.
The Hippo Business Approach
Hippo set out to solve what it saw as a flawed customer experience in home insurance and deliver intuitive and proactive protection for homeowners by combining the power of technology with a human-touch and empathy.
We started by rebuilding the home insurance experience around the customer’s needs, at every stage of the relationship.
| • | We made insurance easy to buy: |
| • | We designed our policies for the modern homeowner: |
| • | We crafted a proactive, tech-enabled claims experience, focused on a live, white-glove approach: |
| • | Proactive technology-enabled approach : We aspire to be there for our customers as soon as the need arises, if possible before they even reach out to us for support. We use live data to help identify major events like fires or storms. When we suspect that our customers’ home may be impacted, our Claims Concierge team reaches out proactively to help ensure the safety of our customer, their families and their homes. We firmly believe in prioritizing the well-being of our customers and addressing damage to the home quickly, hopefully before things deteriorate or repair costs escalate. If we are effective, customers benefit from superior service in resolving claims, and we gain from better insurance outcomes by mitigating costs and increased customer loyalty. |
Depending on the claim, our Claims Concierge team may use remote (virtual) inspection technology to expedite the claims handling process and, if possible, complete a claim remotely.
70
When a specialist needs to visit the home, we leverage a network of vetted partners whom we work to quickly deploy, seeking to offer our customers full resolution as opposed to just an inspection. This network of trusted partners allows us to save on inspection costs when these partners also perform the work to resolve the issue, benefit from economies of scale in material purchases, and work to ensure quality repair work which reduces the probability of a repeat claim. This approach is designed to align everyone’s incentives and works to drive the best outcome and as fast a resolution as possible.
| • | Human attention from live Claims Concierges : We believe that a customer calling about damage to their home, often a very complicated and stressful situation, needs to speak to a human who can be relied upon for help. Our Claims Concierge team eliminates the often inefficient use of bots or automation, as well as other burdensome processes. Our claims professionals are experienced in both claims handling and customer service. Once a claim is submitted, a Claims Concierge is assigned to the claim and focuses first on ensuring customer safety and alleviating stress. We seek to have the same Claims Concierge remain the key point of contact for the customer throughout the life of the claim. Hippo uniquely measures customer satisfaction, or Claims NPS, specifically for our claims operations. Our claims team is able to achieve a90-day Claims NPS of 60, according to our survey (compared to an average Claims NPS of negative 49 for typical carriers using the same survey methodology, according to a 2014 Morgan Stanley Research and Boston Consulting Group report), in spite of the complicated nature of a home insurance claim. |
Building a home insurance experience that is simple, intuitive, and human was just the beginning. Hippo’s real promise is to ultimately create better outcomes for homeowners. We have created an integrated home protection platform through a growing suite of proactive features and offerings that create meaningful touchpoints throughout the life of a policy.
| • | We employ continuous risk reevaluation and underwriting: |
| • | We deploy what we believe is the most widely adopted Smart Home program in the U.S. home insurance space: |
| • | We help customers maintain their homes: in-home services. Moreover, Hippo Home Care has been building a proactive home maintenance offering: homeowners can sign up for annual checkups by home professionals that inspect key systems around the home and perform routine maintenance tasks. Hippo Home Care has delivered thousands of checkups to date and performed over 11,000 preventive actions in customers’ homes. |
This suite of proactive offerings is designed to allow Hippo to help customers better protect their homes and reduce losses over time. This enables better pricing across all of Hippo’s services, further enhancing the customer value proposition and attracting even more customers to Hippo. That, in turn, generates more data and insights that inform further home protection innovation. This is the principle our business is built upon:.
when our customers win, Hippo wins
71
We have built an omni-channel distribution approach which is designed to allow customers to purchase however they want and provides Hippo differentiated access to a positively selected customer base
We seek to allow customers to buy our policies however they want: online, over the phone, or through an agent. Hippo is not tied to captive agent distribution channels in the way legacy carriers can be, and we seek to leverage this to our advantage in establishing a diverse set of distribution channels:
| • | Direct to consumer: |
| • | Insurance partners (agents / producers): producer portal direct-to-consumer |
| • | Non-insurance partners: |
| • | Home builders — we developed an insurance policy for new home construction, as well as a technology product that integrates with builders’ sales systems. These integrations allow us to provide the builder’s customers a simple, personalized insurance offer precisely when their customers are in the market for a policy. These policies are heavily tailored to the customer’s property and can be easily purchased online or through our partner agency. Through these partnerships we are able to access positively selected customers with a fundamentally better risk profile than those associated with existing homes. The result is a potentially smoother home purchase experience and higher customer satisfaction for our builder partners. |
| • | Smart home providers — we have been developing proprietary integration with the leading providers of smart home and security systems to offer their customers better home insurance coverage with meaningful premium discounts. Moreover, these benefits are also available to our partners’ customers if they purchase insurance from Hippo. |
This channel is also one that allows us to access positively selected customers with a fundamentally better risk profile (for example, smart home technology adopters are more likely to be safe and thoughtful homeowners).
Technological, operational and economic moats
Our Technology + Insurance Approach
“InsurTech” is made of two words: InsuranceTechnology. We are marrying the best of both worlds to create a superior customer experience with superior business results.
and
Our full-stack technology systems have been built from the ground up leveraging the experience of professionals with significant home insurance expertise. We take a similar approach when it comes to the
72
collection and use of available data. In particular, we use machine learning to analyze the large amounts of data we collect, which enables us to draw key insights and learnings about our customers and potential risks to the homes we insure. For example, we considered multiple providers of aerial imagery to support our underwriting processes, and from such data we have been able to determine which sources would be best suited to inform variables like the status of a home’s roof or the presence and size of a swimming pool based on the performance of our book of business over time (including, for example, the type and nature of losses associated with risks in specific areas). Through experience, we have learned that not all data are equally valuable and that each situation requires a unique data approach to achieve the desired outcome. Many data sources provide insight into similar home systems, and our experience and scale have enabled us to utilize our data integrations to achieve accurate views of risk. We believe this provides us a significant advantage over many players in the space.
Beyond the use of data, we believe our use of technology gives us additional advantages over incumbents (who depend on legacy systems) and new entrants with less experience in the space. Examples include:
| • | Offering a fast and accurate online purchase flow that meets modern consumers’ expectations |
| • | Integrating smart home activation status into our policy management system |
| • | Quickly deploying rate changes in any state or region upon regulatory approval |
| • | Creating sophisticated feedback loops between internal teams to ensure cross-pollination (for example, fast underwriting improvements based on claims insights) |
| • | Developing proprietary, channel-specific technology to integrate Hippo’s offerings into partners’ platforms and streamlining their go-to-market |
In short, Hippo seeks to digitize operational aspects of the home insurance buying process. This approach creates lasting advantages that enable advancements across business growth, proactive home project, and user experience.
Our Vertically Integrated Insurance Capabilities
The insurance operation we have built provides us withcapabilities and flexibility to move fast, innovate and seek to offer the best value to our customers. In that sense, it also allows us to control our own destiny in how we grow and operate.
end-to-end
As we grow at the state and national levels, our systems have the ability to adjust our policies and rates in a fast and efficient manner. Our actuaries and underwriters leverage data and our
in-house
technology solutions to continuously optimize our coverage and work to provide customers the best product possible at the right price.We have invested in industry-leading sales and customer service organizations, modeled after the best teams across a variety of business sectors. We have equipped them with dedicated tech tools and training that allow them to focus on what matters most. Our
90-day
average overall NPS of 75, according to a third party survey, compared to the insurance industry average of 35 in 2020, according to data from Statista, Inc., is the best testament to the quality of these teams.Hippo has a distinct approach to claims, managed by our own team and leveraging home-grown technology. Here too, a
90-day
Claims NPS of 60, according to a third party survey, compared to a Claims NPS of negative 49 for typical carriers, according to a 2014 Morgan Stanley Research and Boston Consulting Group report, is an affirmation that our proactive, concierge-based approach is resonating with customers during the times they need us most.In 2020, we continued our vertical integration through the acquisition of our largest insurance carrier partner, Spinnaker Insurance Company. Our structure now allows us to balance risk retention with reinsurance capacity in a more flexible manner, not just for Hippo’s core business but also for third-party programs supported by Spinnaker. This also allows us to maintain a capital-light model while retaining risk in a way that aligns our interests with the reinsurance market and also to retain carrier economics. Most importantly, the acquisition enables faster growth and reduced time to market for new offerings, regulatory filings and rate adjustments.
73
Our Diversified Distribution Strategy
Hippo’s established diverse distribution channels are designed to allow customers to buy however and wherever they want. We have built channel-specific proprietary technology and bespoke business models to support this strategy. Developing unique technological solutions for partners like home builders, loan servicers, other insurance companies, and smart home technology providers allows us to not only integrate into other scaled platforms, but to also support our partners’ businesses and achieve great results alongside them and establish deeper relationships with these partners.
Our Smart Home Program
We have deployed what we believe is the most widely adopted Smart Home program in the U.S. home insurance space, which is currently available in 29 states. Under our program customers may opt in to receive a complimentary smart home self-monitoring system or choose to upgrade to a professionally monitored system when they buy a policy through Hippo. These systems include sensors that can detect smoke, carbon monoxide, water, and motion, and customers who opt in receive discounts of up to 13% on their home insurance. Overall, we have experienced high customer adoption:
| • | Approximately 70% of eligible customers opt into the program |
| • | Approximately 70% of the customers opting into the program activate their kits |
| • | Customers who keep their kits active receive meaningful premium discounts |
In achieving such wide adoption and activation, we have essentially built a platform that enables us to increasingly focus on risk mitigation and loss ratio improvement, especially as we continue to build out this program (for example, as we evaluate new options such adding behavior-based discounts and professional monitoring offers).
Hippo Customer Experience
Hippo’s goal is to make homes safer and better protected so customers can enjoy their homes and lives, knowing that we are committed to preserving their properties. Starting with our dedicated sales staff, who streamline the purchase and onboarding experience down from days to minutes, we aim to make every lead and customer touchpoint efficient, transparent and clear.
Our proactive approach, including real-time alerts to homeowners, is designed to help protect our customers and their families. We have also developed an industry leading Claims Concierge service, assigning one, dedicated Concierge for customers filing a claim. We strive to handle each claim with empathy, forethought, and care that can only be provided by a human touch.
Our approach to customer experience and insurance, brings our values to the forefront, helping customers protect the joy of homeowners. It is no wonder our customers have rated us with 4.9 out of
5-stars
(based on reviews collected by Hippo on its web page) and rank us as one of the top customer service companies in the home insurance industry, with a90-day
average overall NPS that is 3 times the insurance industry average in 2020, according to a third party survey and data from Statista, Inc. By better meeting the needs of our customers, we expect our LTV to benefit from increased customer retention and satisfaction.74
Our Technology and Architecture
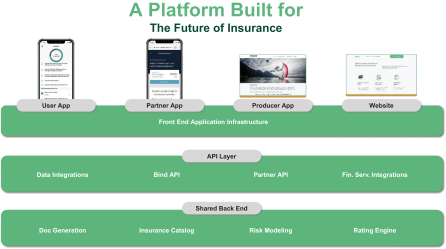
Technology Approach
Hippo built its technology infrastructure, strategy and team to drive better outcomes for homeowners. Our technology is the driving force behind our ability to grow rapidly while managing risk, proactively supporting our customers, pioneering modern insurance and home protection products, and building solutions and services based on our insights quickly and effectively. We believe we offer an advanced technology stack to our customers.
Our purpose-built, full-stack approach starts with modern infrastructure and agile software systems. These systems enable us to capture, clean, and analyze data at scale, derive powerful insights, and create meaningful offerings for our customers and partners with speed and efficiency. In a manner consistent with our regulatory filings, we pair this technology with a set of proprietary insurance expert systems, powered by augmented intelligence, to scale our modern insurance capabilities across actuarial, underwriting, claims, coverages, and fraud. Together, these systems enable us to deploy an intelligent and simple purchase experience that is customized by distribution channel, readily launch new states and partners, and deliver proactive solutions to customers like predicted weather alerts and real-time policy updates. Our technology enables us to iterate quickly and deploy products or features in days that might take an incumbent, relying on legacy systems, months or even years.

75
In short, Hippo largely digitizes the home insurance process. This fact creates lasting advantages that enable advancements across business growth, proactive home protection, and user experience.
• | Rapid growth across diverse channels. |
We have built our systems to scale rapidly and dynamically adapt to growth opportunities across the home insurance landscape. Our proprietary engine employs a constantly-expanding knowledge base alongside dynamic rules and machine learning algorithms to address the ever-changing factors of proactive risk management. This approach enables us to personalize coverage for a specific customer’s needs proactively and automatically. Through adaptable APIs, we can deploy this capability across an ever-increasing number of channels, partners, and geographies quickly. As we accumulate knowledge from additional domains and data sources to fuel our AI engine, insights are seamlessly deployed across Hippo’s integrated system, ensuring a consistent and unified experience across all distribution points. Additionally, we believe our ability to segment risks based on home characteristics allows us to more efficiently market and price than our competitors.
• | Risk prevention and proactive home protection. |
Hippo’s technology is at the heart of our ability to better protect homes. Our process of ongoing underwriting, delivered through advanced algorithms analyzing a vast array of data sources ensures that our customers are properly protected. We also access differentiated and proprietary data sources. We have deployed hundreds of thousands of sensor kits, which in turn monitor temperature, water leaks, door and window opening, and more. Our wide distribution and activation of smart home kits could allow us to collect aggregated and anonymized home health data, which can be synthesized to support our approach and value-added home protection offerings. We also innovate new approaches to home protection. For example, in launching Hippo Home Care in early 2021, we gained the ability to assemble predictive data from
in-home
checkups, including inventory of appliances and drivers of malfunctions of key systems in the home. We have scaled up our Hippo Home Care operation through a Virtual Home Concierge service, in which we leverage mobile device communications to remotely support our customers within-home
services. As new approaches create additional data sets, we can more effectively partner with our customers to understand, predict and prevent potential losses. In turn, the data we collect feeds into our data science pipeline and trains our models.• | Better experiences throughout the customer journey. |
Hippo harnesses technology and data to deliver intuitive and frictionless experiences for customers at every phase of the insurance journey. In the purchase phase, we use advanced, verified data sources so that customers are not burdened with dozens of questions, enabling a simple and fast purchase experience. Through our partnerships, we can automatically provide electronic proof of insurance to mortgage lenders to save customers potential headaches at closing. With our builder partners, the customized Hippo policy can be purchased by a homeowner in a completely integrated process. Our integrated systems approach also benefits the customer in other ways. For example, Hippo Customer Support specialists and our Claims Concierges can access relevant policy and property information, as well as past claims, to efficiently manage the process to provide the best customer experience. Additionally, third-party partners, like inspectors or contractors, can be dispatched to the home, paid and tracked digitally.
Architecture
Our Technology Architecture approach follows the company’s proactive, customer-first strategy by taking a three-horizon view: enabling swift feature development for customer and partner needs; creating a scalable platform that works to anticipate future needs; and setting the capability framework for innovation
| • | Our agile development teams are able to design, deliver and iterate to build product features our customers and partners desire. We have built a flexible and adaptable software architecture and |
76
engineering teams to effectively innovate and implement new ideas. This is combined with an agile iterative approach to experimentation and analytics, working to make sure that we continuously improve our knowledge of what customers want. |
| • | Our underlying software architecture and platform are designed to support future expansion and growth. We are creating data models, algorithms, learning engines, knowledge graphs and cloud platforms that are all intended to support a future set of goals — more ambitious partnerships, wider distribution channels, scaled number of customers. By anticipating future growth with a blueprint of technology capabilities and technical platforms in advance, we are proactively preparing for the next step-change in our company’s growth trajectory. |
| • | We are keeping the pace of innovation high by investing in research and development of underlying technologies and capabilities that seek to change how the market operates in protecting homeowners. We launch tests with partners, look at new and proprietary data sources, offer additional virtual and in-home services, expand the boundaries of expectations on preventative measures, and try out new techniques for customer support and service. All of these are part of our innovation culture and supported by the technology infrastructure to build / experiment / measure / iterate. |
Technology is only just beginning to transform the home insurance industry. Hippo’s unified and integrated systems ensure that, even as homeowners’ needs shift and grow, we will continue to set new standards for customer experience, modern insurance and joyful homeownership.
Our Economic Model
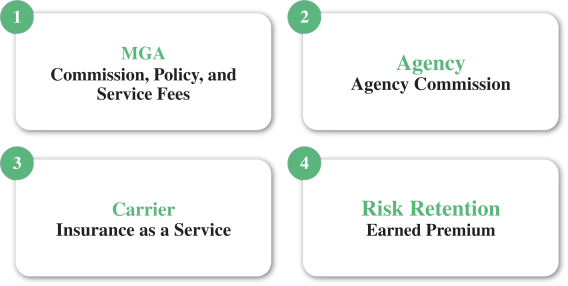
There are four key components in our economic model. First, as a managing general agent (“MGA”), we manage the entire customer-facing experience, including sales and marketing, underwriting, policy issuance and administration, and claims administration. In exchange for these services, we earn recurring commissions and fees associated with the policies we sell. While we have underwriting authority and responsibility for administering policies and claims, we do not take the bulk of the risk associated with the Hippo policies on our own balance sheet. Rather, we work with a diversified panel of highly rated insurance and reinsurance companies who pay us commissions in exchange for the opportunity to take that risk on their own balance sheets.
We also earn commission income as a licensed insurance agency selling
non-Hippo
policies to our customers. Today, we earn agency commission income when we cross sell automobile policies to our77
homeowners customers, when a customer seeking homeowners insurance is an area where Hippo policies are unavailable in which case we place them with another carrier, or when a particular home does not meet our underwriting criteria in which case we also place these customers with another carrier when possible. As we broaden our product offerings, we expect to distribute additional types of insurance offered by other carriers, which will contribute to growth in this element of our economic model. Commission income on these policies recur as the policies renew allowing us to earn margin relative to our customer acquisition cost.
We earn income in a third way, using our platform to offer(“Iaas”) to other MGAs. The economic benefits to Hippo of providing this service extend beyond profit margins on these premiums, and include capital efficiency benefits as the diversity of insurance offered allows Hippo to reduce its regulatory capital requirements through recognition of diversification benefits. Given our diverse portfolio of homeowners insurance, the regulatory capital we are required to set aside for premiums generated by these third parties is lower than these parties would need to set aside if they were to provide their own capital.
insurance-as-a-service
Finally, we earn margin on premiums we receive on policies we issue from our Hippo carrier to our homeowners customers after ceding the majority of the insurance risk to our panel of high quality, reinsurance partners, some of whom have made multi-year commitments. We cede the majority of risk associated with these policies as part of our long-term capital-light strategy. And though the quantum of risk we cede in any year will fluctuate with reinsurance market pricing, we anticipate our long term strategy will include cession of the majority of the insurance risk we generate.
Looking towards the future, we anticipate generating economic benefits through our offering of value-added services such as monitoring and home maintenance.
Our Asset-Light Capital Strategy
We have always pursued an asset-light capital strategy to support the growth of our business. Even though we acquired Spinnaker, a licensed carrier, in 2020, we generally retain only as much risk on our balance sheet as is necessary to secure attractive terms from the reinsurers who bear the risk of the policies we sell. Those reinsurers usually require that companies like Hippo retain some risk to ensure alignment of interests. For policies written in 2021, we expect to retain approximately 10% of the risk associated with Hippo homeowners policies on our own balance sheet and expect to see this increase modestly over time.
This strategy also helps support our growth: third party reinsurance helps decrease the statutory capital required to support new business growth. As a result, we are able to grow at an accelerated pace without material capital investments upfront. We have a successful track record of securing strong reinsurance treaties, providing a solid foundation for a long-term, sustainable model.
78
Growth Strategy
As we grow, our focus will remain on homeowners and on making homes safer and better protected. Beyond growing our core product, we plan to grow vertically into adjacent insurance offerings as well as
non-insurance
areas, towards anall-inclusive
home protection platform: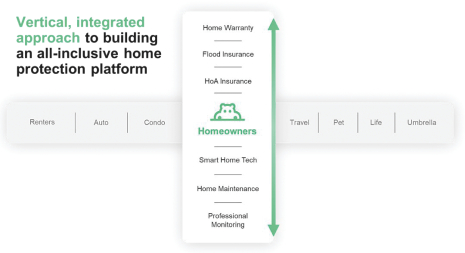
Core Product Growth
We are focused on the U.S. market, where the homeowners insurance industry represents $110 billion in annual premiums, growing at approximately
$4.5-5 billion
annually (according to William Blair & Company). Our product portfolio includes: standalone homes, condos, investment properties, and new home construction, and each of these is its own unique insurance product. Hippo has so far introduced its products in 37 states, covering over 80% of the US population.We believe expanding our core business alone in this market represents a significant opportunity. For perspective, our market share is currently less than 1% of the US home insurance market. We plan to increase our penetration in the states where we already offer our homeowners insurance product. In parallel we plan to continue launching new states in 2021, planning to reach a total of 40 states by the end of 2021. We are at the same time building our brand and raising awareness among homeowners throughout the country. We will continue enhancing ourcapabilities, while expanding our relationships with new and existing partners.
direct-to-consumer
Adjacent Insurance Offerings
We plan to offer additional insurance products to further protect and support homeowners in the US market. Where we feel we can create differentiated offerings leveraging our capabilities and assets, we will build such new products much the same way we did our modern homeowners insurance product. We may also leverage partners to offer best of breed solutions in our capacity as an agent.
We also expect to expand the portfolio of third-party programs that Spinnaker supports as a carrier. With the scalable assets we have built to support Hippo’s growth, we believe we are well-positioned to offer ancillary services across distribution, support and other areas to grow these programs.
Adjacent Non Insurance Offerings
We are deepening our relationships with homeowners by offering broader home protection services to complement our core insurance products. We have built the first, integrated insurance and home protection
79
platform with our Smart Home program and home maintenance offerings, including virtual home services and remote support. We plan to expand these offerings to include additional protection products such as Home Warranty and innovative solutions tied to home inspections that streamline home transactions. Such products and services can introduce additional sources of recurring revenue and
non-risk-based
revenue, accelerating capital efficient growth.Competition
We face competition from established national brand names that offer competing products. These more established competitors have advantages such as brand recognition, greater access to capital, breadth of product offering, and scale of resources. We also face competition from select and new insurtechs that offer digital platforms. However, the market is fragmented, with just one carrier over 10% market share according to William Blair & Company. This allows for multiple large and growing players to coexist with differentiated products and approaches.
Hippo’s distinctive customer experience, vertical focus on complete home protection, and purpose-built, full stack technology infrastructure differentiate our model from our larger and smaller competitors alike. Though incumbents collect vast amounts of data, we believe their legacy systems are not as flexible and dynamic as our integrated technology. Our full stack system allows us to better implement data into our business model and realize the benefits in underwriting, claims, and profitability. This system also enables us to deploy Hippo’s proprietary quoting and underwriting engine (via API) across Hippo’s diversified distribution channels and partners to gain market share.
We believe our strategy to deliver the first
all-in
home protection platform is unique and differentiated and that our competitive advantages across smart home, technology, and distribution will make it difficult for competitors — old or new — to emulate our approach.Our Values and People
As of June 30, 2021, we had a total of 593 employees, including temporary employees, of which 114 were in IT and technology, 95 were in claims, underwriting and operations, 258 in business development, sales, marketing and customer support, 31 in product, design, and analytics, 95 in finance, actuarial, legal and compliance, human resources, and corporate. Of these employees, 576 are located in the United States and 17 are located in Israel. We typically engage temporary workers and independent contractors when necessary in connection with a particular project, to meet increases in demand or to fill vacancy while recruiting a permanent employee. None of our employees is currently represented by a labor union or is covered by a collective bargaining agreement with respect to his or her employment. To date we have not experienced any work stoppages, and we consider our relationship with our employees to be good. Our people team is focused on identifying and retaining top talent and building a world class organization. We use recognition and rewards including compensation and equity to attract and retain our talent.
Seasonality
We have experienced in the past, and expect to continue to experience, seasonal fluctuations in our revenues and resulting fluctuations in our rate of growth as a result of insurance spending patterns. Specifically, our revenues may be proportionately higher in our third fiscal quarter due to the seasonality of when homeowners purchase and move into new homes, which historically occurs at higher rates in the months of July, August and September. As our business expands and matures, other seasonality trends may develop and the existing seasonality and customer behavior that we experience may change.
Additionally, seasonal weather patterns impact the level and amount of claims we receive. These patterns include hurricanes, wildfires, and coastal storms in the fall, cold weather patterns and changing home heating
80
needs in the winter, and tornados and hailstorms in the spring and summer. The mix of geographic exposure and products within our customer base impacts our exposure to these weather patterns and as we diversify our base of premium such that our exposure more closely resembles the industry exposure, we should see the impact of these events on our business more closely resemble the impact on the broader industry.
Data Privacy and Protection Laws
Since we receive, use, transmit, disclose and store personal data, we are subject to numerous state and federal laws and regulations that address privacy, data protection and the collection, storing, sharing, use, transfer, disclosure and protection of certain types of data. In the U.S., insurance companies are subject to the privacy provisions of the federal Gramm-Leach-Bliley Act and the NAIC Insurance Information and Privacy Protection Model Act, to the extent adopted and implemented by various state legislatures and insurance regulators. The regulations implementing these laws require insurance companies to disclose their privacy practices to consumers, allow customers to
opt-in
oropt-out,
depending on the state, of the sharing of certain personal information with unaffiliated third parties, and maintain certain security controls to protect their information. Additionally, we are subject to the Telephone Consumer Protection Act which restricts the making of telemarketing calls and the use of automatic telephone dialing systems. Violators of these laws face regulatory enforcement action, substantial civil penalties, injunctions, and in some states, private lawsuits for damages.Privacy and data security regulation in the U.S. is rapidly evolving. For example, California recently enacted the California Consumer Privacy Act (“CCPA”), which came into force in 2020. The CCPA and related regulations give California residents expanded rights to access and request deletion of their personal information, opt out of certain personal information sharing, and receive detailed information about how their personal information is used and shared. The CCPA allows for the California Attorney General to impose civil penalties for violations, as well as providing a private right of action for certain data breaches. California voters also recently passed the California Privacy Rights Act (“CPRA”), which will take effect on January 1, 2023. The CPRA significantly modifies the CCPA, including by imposing additional obligations on covered companies and expanding California consumers’ rights with respect to certain personal information. In addition to increasing our compliance costs and potential liability, the CCPA’s restrictions on “sales” of personal information may restrict our use of cookies and similar technologies for advertising purposes. The CCPA excludes information covered by Gramm-Leach-Bliley Act, the Driver’s Privacy Protection Act, the Fair Credit Reporting Act, and the California Financial Information Privacy Act from the CCPA’s scope, but the CCPA’s definition of “personal information” is broad and may encompass other information that we maintain. The CCPA likely marked the beginning of a trend toward more stringent privacy legislation in the U.S., and multiple states have enacted or proposed similar laws. For example, in 2020, Nevada enacted SB 220 which restricts the “selling” of personal information and, in 2021, Virginia passed the Consumer Data Protection Act (“CDPA”) which is set to take effect on January 1, 2023 and grant new privacy rights for Virginia residents. In addition, California voters approved the November 2020 ballot measure which will enact the CPRA, substantially expanding the requirements of the CCPA. As of January 1, 2023, the CPRA will give consumers the ability to limit use of precise geolocation information and other categories of information classified as “sensitive”. There is also discussion in Congress of new comprehensive federal data protection and privacy law to which we likely would be subject if it is enacted.
Various regulators are interpreting existing state consumer protection laws to impose evolving standards for the online collection, use, dissemination and security of other personal data. Courts may also adopt the standards for fair information practices which concern consumer notice, choice, security and access. Consumer protection laws require us to publish statements that describe how we handle personal information and choices individuals may have about the way we handle their personal data. If such information that we publish is considered untrue, we may be subject to government claims of unfair or deceptive trade practices, which could lead to significant liabilities and consequences. Furthermore, violating consumers’ privacy rights or failing to take appropriate steps to keep consumers’ personal data secure may constitute unfair acts or practices in or affecting commerce.
81
Insurance Regulation
Hippo is subject to extensive regulation, primarily at the state level. These laws are generally intended to protect the interests of purchasers or users of insurance (which regulators refer to as policyholders), rather than the holders of securities we issue.
The method, extent, and substance of such regulation vary by state but are generally set out in statutes, regulations and orders that establish standards and requirements for conducting the business of insurance and that delegate authority for the regulation of insurance to a state agency. These laws, regulations and orders have a substantial impact on our business and relate to a wide variety of matters including insurer solvency and statutory surplus sufficiency, reserve adequacy, insurance company licensing, examination, investigation, agent and adjuster licensing, agent and broker compensation, policy forms, rates, and rules, the nature and amount of investments, claims practices, trade practices, participation in shared markets and guaranty funds, transaction with affiliates, the payment of dividends, underwriting standards, withdrawal from business, statutory accounting methods, data privacy and data security regulation, corporate governance, internal and external risk management, moratoriums (including of lawful actions), and other matters. In addition, state legislatures and insurance regulators continue to examine the appropriate nature and scope of state insurance regulations, including adopting new laws and regulations, and reinterpreting existing ones.
As part of an effort to strengthen the regulation of the financial services market, the Dodd-Frank Wall Street Reform and Consumer Protection Act (“Dodd-Frank”) was enacted in 2010. Dodd-Frank created the Federal Insurance Office (“FIO”) within the U.S. Department of the Treasury (“Treasury”). The FIO monitors the insurance industry, provides advice to the Financial Stability Oversight Council (“FSOC”), represents the U.S. on international insurance matters, and studies the current regulatory system. Additional regulations or new requirements may emerge from the activities of various regulatory entities, including the Federal Reserve Board, FIO, FSOC, the National Association of Insurance Commissioners (“NAIC”), and the International Association of Insurance Supervisors (“IAIS”), that are evaluating solvency and capital standards for insurance company groups. In addition, the NAIC adopts and will continue to adopt model laws and regulations that will be adopted by various states. We cannot predict whether any specific state or federal measures will be adopted to change the nature or scope of the regulation of insurance or what effect any such measures would have on Hippo.
Spinnaker’s ability to pay dividends without regulatory notice or in the case of certain dividends, regulatory approval, is restricted by Illinois law. Additionally, Spinnaker in the future may become commercially domiciled in additional jurisdictions depending on the amount of premiums written in those states. The laws of these other jurisdictions contain similar limitations on the payment of dividends by insurance companies that are domiciled in that state, and such laws may be more restrictive than Illinois and Texas.
In addition, the NAIC has recently developed a group capital calculation covering all entities of the insurance company group for use in solvency monitoring activities. Any increase in the amount of capital or reserves our insurance subsidiaries are required to hold could reduce the amount of future dividends such subsidiaries are able to distribute to the holding company.
In particular, the NAIC has developed a system to test the adequacy of statutory capital and surplus of U.S.-based insurance companies, known as risk-based capital, which all states have adopted. This system establishes the minimum amount of capital and surplus necessary for an insurance company to support its overall business operations in consideration of its size and risk profile. Any reduction in the risk based capital ratios of our insurance subsidiaries could require us to take remedial actions to increase our insurance subsidiaries capital and could also adversely affect their financial strength ratings as determined by statistical rating agencies.
The National Association of Insurance Commissioners has been examining the use of artificial intelligence in the insurance industry, such as the sources of some of the data Hippo uses in marketing and underwriting its products. In August 2020, the NAIC adopted a statement of “high-level guiding principles”, calling on industry
82
participants to be “fair and ethical, accountable, compliant, transparent, and secure, safe, and robust” in connection with the use of artificial intelligence. These principles do not have the force and effect of law, but could lead to the NAIC or individual states to take action in the future that might restrict our use of artificial intelligence in our business.
Spinnaker is, and any insurance companies that we would form in the future would be, part of an insurance holding company system and as such is subject to regulation in the jurisdictions in which these insurance subsidiaries are domiciled. These holding company laws generally provide that the acquisition or change of “control” of a domestic or commercially domiciled insurer or of any person that controls such an insurer cannot be consummated without the prior approval of the relevant insurance regulator. In general, a presumption of “control” arises from the ownership, control, possession with the power to vote, or possession of proxies with respect to ten percent or more of the voting securities of an insurer or of a person who controls an insurer. In addition, certain state insurance laws require
pre-acquisition
notification and approval of a state where our insurance subsidiaries are merely licensed.Facilities and Office Space
As of June 30, 2021, our principal executive office is located in Palo Alto, California and consists of approximately 15,000 square feet of space under a lease that expires August 15, 2026. In addition to our headquarters, we lease space in Austin, Texas and Bedminster, New Jersey, which consist of approximately 19,000 square feet of space, and 3,000 square feet of space respectively, under a lease(s) that expires July 31, 2022 and expires July 31, 2024, respectively.
We lease all our facilities and do not own any real property. We believe our facilities are adequate and suitable for our current needs and that, should it be needed, suitable additional or alternative space will be available to accommodate our operations.
Intellectual Property
We consider the Hippo brand and those of our subsidiaries to be among our most valuable assets. Our future success depends to a large degree upon our ability to defend the Hippo brand and its associated
sub-brands
from infringement and, to a limited extent, to protect our other intellectual property. We rely on a combination of copyright, trademark, patent and other intellectual property laws and confidentiality procedures and contractual provisions such asnon-disclosure
terms to protect our intellectual property.As of June 30, 2021, our patent portfolio consisted of one utility patent covering autonomous cancellation of insurance policies using a multi-tiered data structure and 11 pending patent applications, including utility, invention, utility model and design patents in the United States. Our patent expires on June 24, 2039. As of April 30, 2021, our trademark portfolio consisted of 50 trademarks. These include the registration of the Hippo name as a trademark in Algeria, Armenia, Australia, Bhutan, Cambodia, Columbia, the European Union, Georgia, Iceland, India, Indonesia, Israel, Japan, Kazakhstan, Laos, Liechtenstein, Monaco, Mongolia, Montenegro, New Zealand, Norway, Philippines, Republic of Korea, Republic of Moldova, Russian Federation, San Marino, Serbia, Singapore, Switzerland, Turkmenistan, Ukraine, United Kingdom, United States of America and Vietnam, and pending applications to register the Hippo name as a trademark in Albania, Antigua and Barbuda, Azerbaijan, Bahrain, Bosnia and Herzegovina, Brunei Darussalam, Kyrgyzstan, Mexico, North Macedonia, Oman and Uzbekistan.
The expansion of our business has required us to protect our trademarks, domain names, copyrights and patents and, to the extent that we expand our business into new geographic areas, we may be required to protect our trademarks, domain names, copyrights, patents and other intellectual property in an increasing number of jurisdictions, a process that is expensive and sometimes requires litigation. If we are unable to protect our trademarks, domain names, copyrights, patents and other intellectual property rights, or prevent third parties from
83
infringing upon them, our business may be adversely affected, perhaps materially. For additional information, see “.” and “—.”
Risk Factors — Risks Related to Our Business — Failure to protect or enforce our intellectual property rights could harm our business, results of operations and financial condition
Claims by others that we infringed their proprietary technology or other intellectual property rights could result in litigation which are expensive to support, and if resolved adversely, could harm our business
Legal Proceedings
From time to time, we may become involved in litigation or other legal proceedings. We are routinely named in litigation involving claims from policyholders. Legal proceedings relating to claims are reserved in the normal course of business. We are not currently a party to any litigation or legal proceedings that, in the opinion of our management, are likely to have a material adverse effect on our business. Regardless of outcome, litigation can have an adverse impact on us because of defense and settlement costs, diversion of management resources and other factors.
On June 4, 2021, Nicholas Kalair filed a putative class action complaint against Hippo in the U.S. District Court for the Northern District of California, alleging violations of the Telephone Consumer Protection Act, individually and on behalf of a putative nationwide class of individuals who received calls or voice messages from Hippo or its agents in the four years prior to the filing of the complaint. Hippo is in the process of investigating the claims alleged in the complaint and has not yet answered. Hippo intends to vigorously defend itself in this matter.
84
MANAGEMENT’S DISCUSSION AND ANALYSIS OF FINANCIAL
CONDITION AND RESULTS OF OPERATIONS
The following discussion and analysis provides information that Hippo’s management believes is relevant to an assessment and understanding of Hippo’s consolidated results of operations and financial condition. The discussion should be read together with the historical audited annual consolidated financial statements as of December 31, 2020 and June 30, 2021 and for the years ended December 31, 2020 and 2019, and the respective notes thereto, included elsewhere in this prospectus. In addition, this discussion should be read together with historical audited financial statements of Spinnaker Insurance Company as of December 31, 2019 and for the year ended December 31, 2019, and the respective notes thereto, and the historical unaudited financial statements of Spinnaker, as of, and for the periods ended, June 30, 2020 and June 30, 2021 included elsewhere in this prospectus.
The discussion and analysis should also be read together with Hippo Holdings’ unaudited pro forma financial information for the year ended December 31, 2020. See “Unaudited Pro Forma Combined Financial Information.” This discussion may contain forward-looking statements based upon current expectations that involve risks and uncertainties. Hippo’s actual results may differ materially from those anticipated in these forward-looking statements as a result of various factors, including those set forth under “Risk Factors” or in other parts of this prospectus. Unless the context otherwise requires, references in this “Management’s Discussion and Analysis of Financial Condition and Results of Operations” to “we”, “our”, “Hippo” and “the Company” refer to the business and operations of Hippo Enterprises Inc. and its consolidated subsidiaries prior to the Business Combination and to Hippo Holdings Inc. and its consolidated subsidiaries, following the consummation of the Business Combination.
Overview
Hippo is a different kind of home protection company, built from the ground up to provide a new standard of care and protection for homeowners. Our goal is to make homes safer and better protected so customers spend less time worrying about the burdens of homeownership and more time enjoying their homes and the life within. Harnessing real-time data, smart home technology, and a growing suite of home services, we have created an integrated home protection platform.
The home insurance industry has long been defined by incumbents that we believe deliver a passive, high-friction experience to policyholders. We view these incumbents as constrained by outdated captive-agent distribution models, legacy technology, and strong incentives not to disrupt their businesses. Accordingly, the industry has not seen meaningful innovation in decades. We believe this results in a flawed customer experience that creates a transactional, adversarial relationship—one that pits insurance companies and their “policyholders” against each other in a
zero-sum
game. The outcome of this misalignment is an experience that is out of touch with the needs of modern homeowners.As a digital-first, customer-centric company, we offer an improved customer value proposition and are well-positioned to succeed in this growing, $110 billion market. By making our policies fast and easy to buy, designing coverages around the needs of modern homeowners, and offering a proactive, white-glove claims experience, we have created an active partnership with our customers to better protect their homes, which saves our customers money and delivers a better economic outcome for Hippo.
Beyond a core insurance experience that is simple, intuitive, and human, we focus our resources on Hippo’s true promise: better outcomes for homeowners. Through our unique Smart Home program, customers may detect and address water, fire, and other issues before they become major losses. And we help our customers maintain their homes with
on-demand
maintenance advice and access to homecheck-ups
designed to reduce the probability of future losses. In short, we have created an integrated home protection platform, which offers a growing suite of proactive features designed to prevent loss and provide greater peace of mind.85
Our partnership with our customers is designed to create a virtuous cycle. By making homes safer, we help deliver better risk outcomes and increase customer loyalty, which improves our unit economics and customer lifetime value (“LTV”). This enables us to invest in expanding our product offering, customer value proposition, and marketing programs, which helps attract more customers to the Hippo family. This growth generates more data and insights to fuel further innovation in our product experience and improved underwriting precision. The result is even safer homes and more loyal customers. We believe this virtuous cycle, combined with our significant existing scale, deep partnerships, and compelling unit economics, will propel Hippo to become a trusted household name synonymous with home protection.
Since our inception, we have incurred operating losses, including net losses attributable to Hippo of $141.5 million for the year ended December 31, 2020 and $279.8 million for the six months ended June 30, 2021. We had an accumulated deficit of $256.6 million as of December 31, 2020 and $536.4 million as of June 30, 2021. We expect to continue to incur operating losses for the foreseeable future due to continued investments that we intend to make in our business and, as a result, we may require additional capital resources to grow our business. For a discussion of risks applicable to Hippo’s business, including with respect to its history of net losses and its ability to grow its business, please see the section entitled “Risk Factors — Risks Relating to Hippo’s Business.”
Our Business Model
There are four key components in our economic model. First, as a managing general agent (“MGA”), we manage the customer-facing experience of insurance, including sales and marketing, underwriting, policy issuance and administration, and claims administration. In exchange for these services, we earn recurring commission and fees associated with the policies we sell. While we have underwriting authority and responsibility for administering policies and claims, we do not take the bulk of the risk associated with these policies on our own balance sheet. Rather, we work with a diversified panel of highly-rated insurance companies who pay us commission in exchange for the opportunity to take the insurance risk on their own balance sheets.
We also earn commission income as a licensed insurance agency selling
non-Hippo
policies to our customers. Today, we earn agency commission income when we cross sell automobile, flood, earthquake, umbrella, and other policies to our homeowners customers, when a customer seeking homeowners insurance is an area where Hippo policies are unavailable in which case we place them with another carrier, or when a particular home does not meet our underwriting criteria in which case we also place these customers with another carrier when possible. As we broaden our agency offerings, we expect to distribute additional types of insurance offered by other carriers, which we expect will contribute to growth of this business. Commission income on these policies recurs as the policies renew allowing us to earn margin relative to our customer acquisition cost.The third way we generate revenue is through our platform offeringto other MGAs who are willing to share economics with a carrier that can provide the capital and regulatory licenses needed for their business, commonly referred to as ‘fronting fees’. The economic benefits to us of providing this service extend beyond profit margins on these premiums and include capital efficiency benefits as the diversity of insurance offered allows us to secure more cost-effective reinsurance coverage. Given our diverse portfolio of homeowners insurance, the regulatory capital we are required to set aside for premium generated by these third parties is lower than these parties would need to set aside if they were to provide their own capital.
insurance-as-a-service
Finally, we earn revenue in the form of earned premium when we retain risk on our own balance sheet rather than ceding it to third-party reinsurers.
In the future, we anticipate generating additional revenue through our offering of value-added services such as home monitoring and maintenance.
86
Our Asset-Light Capital Model and Reinsurance
We have historically pursued an asset-light capital strategy to support the growth of our business. Even though we acquired a licensed carrier in 2020, we generally retain only as much risk on our balance sheet as is necessary to secure attractive terms from the reinsurers who bear the risk of the policies we sell. Those reinsurers usually insist that companies like ours retain some risk to ensure alignment of interests. For policies written in 2021, we expect to retain approximately 10% of the risk associated with Hippo homeowners policies on our own balance sheet and expect to see this increase modestly over time.
This strategy also helps support our growth: third party reinsurance helps decrease the statutory capital required to support new business growth. As a result, we expect to be able to grow at an accelerated pace with lower capital investments upfront than we would otherwise require. We have a successful track record of securing strong reinsurance treaties, providing a solid foundation for a long-term, sustainable model.
Reinsurance
We utilize reinsurance primarily to support the growth of our new and renewal insurance business, to reduce the volatility of our earnings, and to optimize our capital management.
As an MGA, we underwrite homeowners insurance policies on behalf of our affiliated insurer, Spinnaker Insurance Company, and other third-party insurance carriers. These carriers purchase reinsurance from a variety of sources and in a variety of structures. In the basic form of this arrangement, fronting insurance carriers will typically cede a large majority of the total insurance premium they earn from customers, in return for a proportional amount of reinsurance protection. This is known as “ceding” premium and losses through a “quota share” reinsurance treaty.
The fronting carrier and the MGA are paid a percentage of the ceded premium as compensation for sales and marketing, underwriting, insurance, support, claims administration, and other related services (in totality, known as a ceding commission). As additional protection against natural catastrophes or other large loss events, the fronting carrier frequently purchases additional,
non-proportional
reinsurance.Without reinsurance protection, the insurer would shoulder all the insurance risk itself and would need incremental capital to satisfy regulators and rating agencies. Reinsurance allows a carrier to write more business while reducing its balance sheet exposure and volatility of earnings.
As a result, we believe our acquisition of Spinnaker gives us increased control over reinsurance strategy and purchasing.
Proportional Reinsurance Treaties — Hippo MGA
For our primary reinsurance treaty incepting in 2021, we secured proportional, quota share reinsurance from a diverse panel of nine third-party reinsurers with AM Best ratings of.”
“A-”
or better. We retain approximately 11% of the proportional risk through Spinnaker or our captive reinsurance company, RH Solutions Insurance, which aligns our interests with those of our reinsurers. We also seek to further reduce our risk retention through purchases ofnon-proportional
reinsurance described below in the section titled “— Non-Proportional
ReinsuranceNon-Proportional
Reinsurance — Hippo MGAWe also purchase two forms of
non-proportional
reinsurance: excess of loss (“XOL”) andper-risk.
Through our ownership of Spinnaker, we are exposed to the risk of larger losses and natural catastrophe events that could occur on the risks we are assuming from policies underwritten by us or other MGAs. We are also exposed to this risk through our captive reinsurer, which takes on a share of the risk underwritten by our MGA business.87
Our XOL program provides protection to us from catastrophes that could impact a large number of insurance policies. The probability of losses exceeding the XOL protection purchased is approximately 0.4%, or equivalent to a 1:250 year return period. This reinsurance also caps losses at a level which protects us from all but the most severe catastrophic events.
Our
per-risk
program protects us from large, individual claims that are less likely to be associated with catastrophes, such as house fires. We have historically purchased and expect to continue to purchase this coverage for the benefit of our retained shares for losses on single policies in excess of $500,000.Other Spinnaker MGA Programs — Reinsurance
As the fronting carrier for other MGAs, Spinnaker has reinsurance in place for several other MGA programs. Those programs are supported by a diversified panel of high-quality reinsurers similar to those on Hippo’s panel. The treaties are a mix of quota share and excess of loss in which 80% to 100% of the risk is ceded. Spinnaker’s catastrophic risk retention for each program is managed to a 1:250 year loss event across all programs.
With all our reinsurance programs, we are not relieved of our primary obligations to policyholders in the event of a default or the insolvency of our reinsurers. As a result, a credit exposure exists to the extent that any reinsurer fails to meet its obligations assumed in the reinsurance agreements. To mitigate this exposure to reinsurance insolvencies, we evaluate the financial condition of our reinsurers and, in certain circumstances, hold substantial collateral (in the form of funds withheld and letters of credit) as security under the reinsurance agreements.
Significant Milestones Achieved in 2020
Geographic Diversification
Over calendar year 2020, we launched our services in 12 new states, bringing our total to 32 as of December 31, 2020, and significantly increasing the geographic diversity of our new business, which we expect will increase the overall geographic diversity of our premium over time. In the fourth quarter of 2019, 55% of Hippo new policy premium came from sales to customers in Texas. By the fourth quarter of 2020, the percentage of Hippo new policy premium from Texas had declined to 13%. Other states grew as a percentage of Hippo total new and renewal policy premium from 45% in the fourth quarter of 2019 to 87% in the fourth quarter of 2020. The following figure reflects the increase in our geographic diversity during the two years ended December 31, 2020.
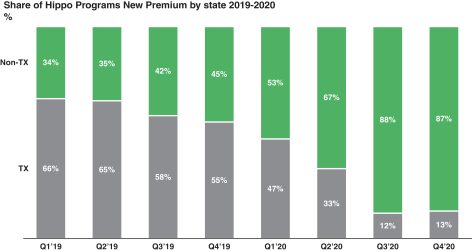
88
We expect to benefit from our ability to provide insurance across an increasing number of states in the United States. State expansion should create a broader base from which to grow while increasing the geographic diversity in our base of customers and premium. We expect that this greater diversity will reduce the impact of catastrophic weather events in any one geographic region on our overall loss ratio, improving the predictability of our financial results over time as we scale. We believe that increased geographic diversity will also improve our ability to secure attractive terms from reinsurers, which would improve our overall cost structure and profitability.
Carrier Acquisition
Despite our rapid state expansion, we grew more slowly in 2020 than we might have to avoid outgrowing the capital bases of our carrier partners. In the spring of 2020, at the height of the pandemic shutdown and during a time of great uncertainty in both private and public capital markets, we acted aggressively to address this barrier to our future growth.
In August 2020, we acquired one of our third-party carrier partners, Spinnaker Insurance Company, giving us full control over a carrier platform and reducing third-party dependency. Partnering with third-party carriers remains an important part of our strategy, but removing this dependency reduces the risk of future disruption to our business.
Reinsurance Stability
In the fall of 2020, we secured a three-year reinsurance commitment starting from January 1, 2021, for 20% of our capacity from an established provider. This marked the beginning of our strategy to transition from quota share reinsurance treaties that renew annually to multi-year reinsurance agreements.
Capital Raising
To fund the acquisition of Spinnaker, we raised $150 million of new equity capital in our Series E Preferred Stock financing in July 2020. To further strengthen our balance sheet and enable us to retain risk if needed, we raised a further $365 million of capital in the form of convertible notes in November 2020.
Partner Channel Launches
We validated our partner channel strategy by launching and growing business across a variety of channels associated with real estate transactions and homeownership life cycle. Deals with home builders, mortgage originators, mortgage servicers, and smart home providers, among others, provide us with access to millions of potential future customers and a path to acquire customers with potentially lower risk profiles than an average home insurance customer.
Business Combination and Public Company Costs
On March 3, 2021, we entered into the Merger Agreement with Merger Sub and RTPZ. The Merger Agreement provides for, among other things, following the Domestication (including the change of RTPZ’s name to “Hippo Holdings Inc.”), (i) the merger of Merger Sub with and into Hippo, with Hippo surviving the merger as a wholly owned subsidiary of RTPZ, immediately followed by (ii) the merger of the surviving corporation of the First Merger with and into RTPZ, with RTPZ surviving the merger, in accordance with the terms and subject to the conditions of the Merger Agreement as more fully described elsewhere in this prospectus. Hippo is deemed the accounting predecessor and Hippo Holdings is the successor SEC registrant, which means that Hippo’s financial statements for previous periods will be disclosed in Hippo Holdings’ future periodic reports filed with the SEC.
The Business Combination is accounted for as a reverse recapitalization. Under this method of accounting, Hippo Holdings is treated as the acquired company for financial statement reporting purposes. The most
89
significant change in Hippo Holdings’ future reported financial position and results was an increase in net cash of approximately $455 million.
As a consequence of the Business Combination, Hippo became the successor to an
SEC-registered
and NYSE-listed company, which requires us to continue to hire additional personnel and implement procedures and processes to satisfy public company regulatory requirements and customary practices. We expect to incur additional annual expenses as a public company for, among other things, directors’ and officers’ liability insurance, director fees and additional internal and external accounting and legal and administrative resources, including increased audit and legal fees.COVID-19
ImpactThe
COVID-19
pandemic and the measures imposed to contain it severely impacted businesses worldwide, including many in the insurance sector. Insurers of travel, events or business interruption have been directly and adversely affected by claims fromCOVID-19
or the lock-down it engendered. Other insurance businesses, including property and casualty lines, have also been indirectly impacted in varying ways, ranging from increased claim rates to dependency onin-person
inspections during a time when suchin-person
interactions have been discouraged. In addition, insurance businesses dependent on office-based brokers and teams that are poorly equipped to work from home have been negatively impacted. The broader economic volatility may hurt insurers in other ways. For instance, with interest rates atall-time
lows, many insurers have and may continue to see their return on capital drop, while those selling premium or discretionary products may see an increase in churn and a decrease in demand.The magnitude and duration of the global pandemic and the impact of actions taken by governmental authorities, businesses and consumers, including the availability and acceptance of vaccines, to mitigate health risks continue to create significant uncertainty, particularly as new strains of the virus emerge and create potential challenges to vaccination efforts. We are closely monitoring the impact of the
COVID-19
pandemic and related economic effects on all aspects of our business, including how it will impact our production, loss ratios, recoverability of premium, our operations, and the fair value of our investment portfolio.Production, loss ratios and recoverability of premium:
COVID-19
has reduced our ability to perform interior home inspections on risks we underwrite, may impact loss ratios as time at home has increased, and has impacted collection of premium where moratoriums have been imposed restricting cancellation of policies fornon-payment.
During 2020, we also witnessed increased cost of labor, and costs associated with materials like timber. These higher costs have a direct impact to the cost of handling claims and result in more than normal loss expenses.Due to the speed with which the
COVID-19
situation has developed over the past year, the global breadth of its spread and the range of governmental and community reactions thereto, uncertainty around its duration and ultimate impact persists, and the related financial impact on our business could change and cannot be accurately predicted at this time.Operations:
The
COVID-19
pandemic has also had and continues to have a significant impact on our business operations, including with respect to employee availability and productivity, temporary increases in regulatory restrictions on operating activities (e.g. moratoria, rate actions or claim practices) that may impact our profitability, the availability and performance of third party vendors, including technology development, home inspections and repairs, and marketing programs. We may also be impacted by cybersecurity risks related to our new dependency on a remote workforce.90
Our investment portfolio:
We seek to hold a high-quality, diversified portfolio of investments. During economic downturns, certain investments may default or become impaired due to deterioration in the financial condition or due to deterioration in the financial condition of an insurer that guarantees an issuer’s payments on such investments. Given the conservative nature of our investment portfolio, we do not expect a material adverse impact on the value of our investment portfolio or a long-term negative impact on our financial condition, results of operations or cash flows as it relates to
COVID-19.
Despite theCOVID-19
pandemic, our business has continued to grow.| • | We write and place home insurance and other insurance products from our agencies that have so far been largely unaffected by COVID-19. |
| • | Our systems are entirely cloud based and accessible to our teams from any browser anywhere in the world. Customers’ phone calls are routed to our team’s laptops and answered and logged from wherever they happen to be. Internal communication has been via email, Slack and Zoom since our founding. Our teams are able to access systems, support customers and collaborate with each other from anywhere, much as they did before the pandemic. |
| • | Our customers’ experience has also been largely unaffected by the turmoil; |
| • | We have initiated virtual inspections for our underwriting requirements and claims processing to keep our employees, agents, policy holders and potential policy holders safe. |
For more information on our operations and risks related to health epidemics, including the”
COVID-19
pandemic, please see the section of this prospectus entitled “Risk Factors.
Key Factors and Trends Affecting our Operating Performance
Our financial condition and results of operations have been, and will likely continue to be, affected by a number of factors, including the following:
Our Ability to Attract New Customers
Our long-term growth will depend, in large part, on our continued ability to attract new customers to our platform. We intend to continue to drive new customer growth by highlighting our consumer-focused approach to homeowners insurance across multiple distribution channels. In particular:
| • | Our growth strategy is centered around accelerating our existing position in markets that we already serve by increasing our direct-to-consumer |
| • | In addition to efforts in states where we are currently selling insurance, we also expect to drive growth by expanding into new markets across the United States and by continuing to develop new strategic partnerships with key players involved in the real estate transaction ecosystem. |
| • | Finally, we plan to deepen our relationships with our customers by offering value-added services, both directly and through partners, that are not specifically insurance products like home maintenance, home monitoring, and home appliance warranties. |
Our ability to attract new customers depends on the pricing of our products, the offerings of our competitors, our ability to expand into new markets, and the effectiveness of our marketing efforts. Our ability to attract customers also depends on maintaining and strengthening our brand by providing superior customer experiences through our proactive, tech-enabled strategy.
We face competition from traditional insurers who have more diverse product offerings and longer established operating histories as well as from new, technology-driven entrants who may pursue more horizontal
91
growth strategies. These competitors may mimic certain aspects of our digital platform and offerings and as they have more types of insurance products, can offer customers the ability to “bundle” multiple coverage types together, which may be attractive to many customers.
Our Ability to Retain Customers
Our ability to derive significant lifetime value from our customer relationships depends, in part, on our ability to retain our customers over time. Strong retention allows us to build a recurring revenue base, generating additional premium term over term without material incremental marketing costs. Our customers typically become more valuable to us over time because retention rates have historically increased with the age of customer cohorts and because
non-catastrophic
loss frequency declines as cohorts mature.
As we expect to broadly retain our customers, we expect our book of business to evolve to be weighted more towards renewals versus new business over time, as is the case with our more mature competitors. We expect that this would enable us to benefit from the higher premium retention rates and inherently lower frequency of losses that characterize renewed premiums.
Our ability to retain customers will depend on a number of factors, including our customers’ satisfaction with our products, offerings of our competitors, and our ability to continue delivering exceptional customer service and support.
Our Ability to Expand Nationally Across the United States
We believe that national expansion will be a key driver of the long-term success of our business. As of June 30, 2021, we were authorized to sell Hippo Homeowners policies in 37 states. We expect to apply our highly scalable model nationally, with a tailored approach to each state that is driven by the regulatory environment and local market dynamics. We hope to expand rapidly and efficiently across different geographies while maintaining a high level of control over the specific strategy within each state.
We expect to benefit from our ability to provide insurance across an increasing number of states in the United States. State expansion should create a broader base from which to grow while increasing the geographic diversity in our base of customers and premium. We expect that this greater diversity will reduce the impact of
92
catastrophic weather events in any one geographic region on our overall loss ratio, improving the predictability of our financial results over time as we scale. We believe that increased geographic diversity will also improve our ability to secure attractive terms from reinsurers, which would improve our overall cost structure and profitability.
Over the past year, we have significantly increased the geographic diversity of our new business, which we expect will increase the overall geographic diversity of our premium over time. In the fourth quarter of 2019, 55% of Hippo new policy premium came from sales to customers in Texas. By the fourth quarter of 2020, the percentage of Hippo new policy premium from Texas had declined to 13%. Other states grew as a percentage of Hippo total new and renewal policy premium from 45% in the fourth quarter of 2019 to 87% in the fourth quarter of 2020.
Our Ability to Expand Fee Income and Premium Through Cross-Sales to Existing Customers
Our strategy to increase the value we are providing to our customers is to offer incremental services to assist our customers in better maintaining and protecting their homes. As we roll out these services, we expect to be able to generate incremental,
non-risk-based
service and fee income from our existing customers. We expect these home protection services not only to generate incremental revenue, but to reduce losses for our customers, and by implication our loss ratios. Our success in expanding revenue and reducing losses by offering these services depends on our ability to market these services, our operational ability to deliver value to our customers, and the ability of these services to reduce the probability of loss for an average homeowner.We are also in the early stages of cross-selling
non-homeowner
insurance products across our customer base. Cross-sales allow us to generate additional premium per customer, and ultimately higher revenue and fee income, without material incremental marketing spend. Our success in expanding revenue through cross-sales depends on our marketing efforts with new products, offerings of our competitors, additional expansion into new states, and the pricing of our bundled products.Our Ability to Manage Risk
We leverage data, technology, and geographic diversity to help manage risk. For instance, we leverage dynamic data sources obtained through various sources and we use advanced statistical methods to model that data into our pricing algorithm. We expect to improve our ability to manage risk and price risk accurately over time as we incorporate new external data sources and utilize the experience gained over time with our own customer base. We expect this to lead to better underwriting, lower loss frequency, and adjusting for weather-related events, lower loss ratios over time. While our current reinsurance framework enhances the stability of our net loss ratio, over time, we need to reduce our overall gross loss ratio. Our success in this area depends on our ability to incorporate new data sources as they become available and to use them to improve our ability to accurately and competitively price risk.
Seasonality of customer acquisition
Seasonal patterns can impact both our rate of customer acquisition and the incurrence of claims losses. Based on historical experience, existing and potential customers move more frequently during the summer months of the year, compared to the rest of the calendar year. As a result, we may see greater demand for new or expanded insurance coverage, and increased engagement resulting in proportionately more growth during the third quarter. We expect that as we grow, expand geographically and launch new products, the impact of seasonal variability on our rate of growth may decrease.
Additionally, seasonal weather patterns impact the level and amount of claims we receive. These patterns include hurricanes, wildfires, and coastal storms in the fall, cold weather patterns and changing home heating needs in the winter, and tornados and hailstorms in the spring and summer. The mix of geographic exposure and
93
products within our customer base impacts our exposure to these weather patterns and as we diversify our base of premium such that our exposure more closely resembles the industry exposure, we should see the impact of these events on our business more closely resemble the impact on the broader industry.
A more diverse and resilient business model
As described in the section entitled “Hippo Management’s Discussion and Analysis of Financial Condition and Results of Operations — Our Business Model” there are four components in our economic model:
| 1. | MGA |
| 2. | Agency |
| 3. | Insurance as a Service |
| 4. | Risk Retention |
During the six months ended June 30, 2020, we were operating primarily as an MGA where most of our economics were driven by our MGA and Agency businesses. Following the acquisition of Spinnaker Insurance Company in August 2020, we now have a more diverse and resilient business model as well as the infrastructure to support our growth trajectory.
This structural evolution of our business model has several implications:
| 1. | Substantive: We are retaining more risk on our balance sheet and accordingly both our net earned premium and our Loss and Loss Adjustment Expenses are expected to be higher. |
| 2. | Financial presentation: The direct acquisition costs associated with the premium written on our carrier will shift from sales and marketing to insurance related expense and will be offset by the corresponding ceding commission and amortized over the lifetime of the policy. Only the excess of ceding commission over our direct acquisition costs will be recognized as revenue. All else being equal, for the exact same amount of premium we expect: |
a. | our ceding commission will be lower |
b. | our sales and marketing expense will be lower |
c. | our bottom line results will be unchanged |
When comparing our financial results year over year, and analyzing the year over year trends, we need to take into consideration these structural changes and their implications. We utilize a
non-GAAP
measure of Adjusted EBITDA to measure our operating profitability. See the section entitled “Hippo Management’s Discussion and Analysis of Financial Condition and Results of Operations — Key Operating and Financial Metrics andNon-GAAP
Measures — Adjusted EBITDA”.Acquisition of Spinnaker Insurance Company
In August 2020, we completed the acquisition of Spinnaker Insurance Company, giving us direct control over this aspect of our business. We believe the Spinnaker acquisition will enable us to maintain a capital-light model while retaining risk in a way that aligns our interests with those of the reinsurance market. We also believe it will benefit our economics; while we expect to continue writing business on third party carriers, we will no longer need to pay a fee to third parties for carrier services on the portion of business we write on Spinnaker. Our financial results in 2021 will reflect the full year of Spinnaker’s operations compared to a partial year in 2020. For more information, see the section titled “—” below.
Results of Operations
Prior to the Spinnaker acquisition, Hippo received MGA commission income for the policies placed by Hippo on Spinnaker paper, and we recognized this commission income at the policy effective dates, net of risk
94
retained by Hippo. The expense incurred for third-party sales commissions (i.e., acquisition costs) was presented on a gross basis in the statement of operations for the period January 1, 2020 to August 31, 2020 and the year ended December 31, 2019 and are included in sales and marketing line item and was not offset against the commission revenue.
After the acquisition, we have consolidated the results of Spinnaker which impact our results of operations as follows:
| • | Premium for the risk retained by us is recognized on a pro-rata basis over the policy period. |
| • | Ceding commission on premium ceded to third party reinsurers is deferred as a liability and recognized on a pro-rata basis over the term of the policy, net of acquisition costs. To the extent ceding commission received exceeds direct acquisition costs, the excess is presented as revenue in the Commission income, Net line on our statements of operations and comprehensive loss. The consolidated company (Hippo and Spinnaker) began to earn ceding commission on premium ceded to third party reinsurers in September 2020 and the ceding commission is recognized net of acquisition costs, on apro-rata basis over the term of the policy. |
Acquisition costs incurred to acquire the Spinnaker policies are deferred and amortized over the term of the policies. Those costs include sales commissions, premium taxes, and board and bureau fees. The amortization of deferred acquisition costs is included in insurance related expenses on the consolidated statements of operations and comprehensive loss.
Loss and LAE incurred, net of losses ceded to reinsurers, will be reflected in the statement of operations for the risk we retain on the Spinnaker policies.
Investment income, net representing interest earned from fixed maturity securities, short-term securities and other investments, and the gains or losses from the sale of investments is presented as part of revenue.
Basis of Presentation
The accompanying consolidated financial statements have been prepared in accordance with GAAP as determined by the Financial Accounting Standards Board (“FASB”) Accounting Standards Codification (“ASC”) and pursuant to the regulations of the U.S. Securities and Exchange Commission (“SEC”).
Key Operating and Financial Metrics and
Non-GAAP
MeasuresWe regularly review the following key operating and financial metrics, to evaluate our business, measure our performance, identify trends in our business, prepare financial projections and make strategic decisions.
The
non-GAAP
financial measure below has not been calculated in accordance with GAAP and should be considered in addition to results prepared in accordance with GAAP and should not be considered as a substitute for, or superior to, GAAP results. In addition, Adjusted EBITDA should not be construed an indicator of our operating performance, liquidity or cash flows generated by operating, investing and financing activities, as there may be significant factors or trends that they fail to address. We caution investors thatnon-GAAP
financial information, by its nature, departs from traditional accounting conventions. Therefore, its use can make it difficult to compare our current results with our results from other reporting periods and with the results of other companies.Our management uses
non-GAAP
financial measures, in conjunction with GAAP financial measures, as an integral part of managing our business and to, among other things: (i) monitor and evaluate the performance of our business operations and financial performance; (ii) facilitate internal comparisons of the historical operating performance of our business operations; (iii) review and assess the operating performance of our management95
team; (iv) analyze and evaluate financial and strategic planning decisions regarding future operating investments; and (v) plan for and prepare future annual operating budgets and determine appropriate levels of operating investments.
The results of Spinnaker Insurance Company since the date of acquisition (August 31, 2020) have been consolidated with ours and are reflected in the following table.
Six Months Ended June 30, | Year Ended December 31 | |||||||||||||||
2021 | 2020 | 2020 (1) | 2019 | |||||||||||||
($ in millions) | ||||||||||||||||
Total Generated Premium | $ | 281.9 | $ | 144.4 | $ | 333.6 | $ | 196.3 | ||||||||
Total Revenue | 37.9 | 22.2 | 51.6 | 34.7 | ||||||||||||
Net Loss attributable to Hippo | (279.8 | ) | (48.7 | ) | (141.5 | ) | (83.1 | ) | ||||||||
Adjusted EBITDA | (78.0 | ) | (40.4 | ) | (89.9 | ) | (56.5 | ) | ||||||||
Gross Loss Ratio | 177 | % | 108 | % | 109 | % | 0 | % | ||||||||
Net Loss Ratio | 204 | % | 130 | % | 148 | % | 0 | % | ||||||||
(1) | Excludes Spinnaker results from the period of January 1, 2020 to August 31, 2020, including $71.8 million of non-Hippo program written premium. |
Total Generated Premium
We define Total Generated Premium (“TGP”) as the aggregate written premium placed across all our business platforms for the period presented. We measure TGP as it reflects the volume of our business irrespective of choices related to how we structure our reinsurance treaties, the amount of risk we retain on our own balance sheet, or the amount of business written in our capacity as an MGA, agency, or as an insurance carrier/reinsurer. We calculate TGP as the sum of:
| i) | Gross written premium (“GWP”) — a GAAP measure defined below; and |
| ii) | Gross placed premium — premium of policies placed with third-party insurance companies, for which we do not retain insurance risk and for which we earn a commission payment, and policy fees charged by us to the policyholders on the effective date of the policy. |
Our Total Generated Premium for the six months ended June 30, 2021 grew 95% year over year to $281.9 million from $144.4 million for the six months ended June 30, 2020. The growth was driven primarily by growth across channels in existing states, expansion into 14 new states, expansion of our independent agent network, launch of new strategic partnerships, maintaining solid premium retention levels, and expansion of our insurance as a service platform. Our results for the six months ended June 30, 2020 exclude $47.8 million of Spinnaker
non-Hippo
programs written premium since the Spinnaker acquisition closed on August 31, 2020.Our Total Generated Premium for the year ended December 31, 2020 grew to $333.6 million from $196.3 million for the year ended December 31, 2019. The growth was driven primarily by expansion into 12 new states during 2020, launch of new strategic partnerships, expansion of our independent agent network, and maintaining solid premium retention levels (in millions).
Six Months Ended June 30, | Year Ended December 31 | |||||||||||||||||||||||
2021 | 2020 | Change | 2020 | 2019 | Change | |||||||||||||||||||
Gross Written Premium | $ | 227.7 | $ | 14.7 | $ | 213.0 | $ | 116.1 | $ | 0.0 | $ | 116.1 | ||||||||||||
Gross Placed Premium | 54.2 | 129.7 | (75.5 | ) | 217.5 | 196.3 | 21.1 | |||||||||||||||||
Total Generated Premium | $ | 281.9 | $ | 144.4 | $ | 137.5 | $ | 333.6 | $ | 196.3 | $ | 137.3 | ||||||||||||
96
Total Revenue
For the six months ended June 30, 2021, total revenue was $37.9 million an increase of $15.7 million compared to $22.2 million for the six months ended June 30, 2020. This increase is driven by increases in net earned premium and service and fee income of $15.0 million and $5.0 million, respectively; offset by a decrease in net commission income of $3.9 million as a result of the Spinnaker acquisition.
For the year ended December 31, 2020, total revenue was $51.6 million, an increase of $16.9 million compared to $34.7 million for the year ended December 31, 2019. This increase is driven by increases in net earned premium and service and fee income of $17.1 million and $2.7 million, respectively; offset primarily by a decrease in net commission income of $1.8 million as a result of the Spinnaker acquisition.
Net Loss attributable to Hippo
Net Loss attributable to Hippo is calculated in accordance with GAAP as total revenue less total expenses and taxes and net of net income attributable to
non-controlling
interest, net of tax.For the six months ended June 30, 2021, net loss attributable to Hippo was $279.8 million, an increase of $231.1 million compared to $48.7 million for the six months ended June 30, 2020. This was primarily driven by an increase in
non-cash
fair value losses recorded on preferred stock warrants and on the derivative liability on our outstanding convertible promissory notes of $161.1 million, an increase in losses and loss adjustment expense of $33.5 million due to more risk retained on policies written and abnormally high weather-related losses, including the Texas winter storm in February 2021 (“Uri”), a higher concentration in areas impacted by the weather-related losses, andnon-cash
interest expense of $21.9 million on the outstanding convertible promissory notes.For the year ended December 31, 2020, net Loss attributable to Hippo was $141.5 million, an increase of $58.4 million compared to $83.1 million for the year ended December 31, 2019. The increase was primarily driven by $25.3 million in Loss and Loss Adjustment Expense in 2020 compared to $0 in 2019 as we did not retain any risk on our balance sheet in 2019. We also had an increase of $20.4 million of expense related to fair value losses recorded on preferred stock warrants due to the increase in the fair market value of the preferred stock and fair value losses recorded on derivative liability on convertible promissory notes due primarily to a decrease in the present value discount due to the passage of time. We also increased our spend in Technology and Development by $10.3 million in 2020 to support our strategy and product roadmap. These increases were partially offset by Net Earned Premium of $17.1 million compared to $0 in 2019 as we did not retain any risk on our balance sheet in 2019.
Adjusted EBITDA
We define adjusted Earnings Before Interest, Taxes, Depreciation, and Amortization (“EBITDA”), a
Non-GAAP
financial measure, as net loss attributable to Hippo excluding interest expense, income tax expense, depreciation, amortization, stock-based compensation, net investment income, othernon-cash
fair market value adjustments for outstanding preferred stock warrants and derivative liabilities on the convertible promissory notes and contingent consideration for one of our acquisition and other transactions that we consider to be unique in nature.For the six months ended June 30, 2021, adjusted EBITDA loss was $78.0 million, an increase of $37.6 million compared to $40.4 million for the six months ended June 30, 2020, due primarily to an increase in our loss and loss adjustment expense due to more risk retained on policies written, abnormally high weather related losses, including Uri, and a higher concentration in areas impacted by the weather-related losses.
For the year ended December 31, 2020, adjusted EBITDA loss was $89.9 million, an increase of $33.4 million compared to $56.5 million for the year ended December 31, 2019. The key driver of the difference between the year over year movements in net adjusted EBITDA is a $25.3 million increase in our loss and loss adjustment expense relating to us retaining a portion of risk on certain of our insurance policies written by our MGA starting from January 1, 2020, as compared to 2019 in which we did not retain risk of losses on insurance policies written.
97
The following table provides a reconciliation from net loss attributable to Hippo to Adjusted EBITDA for the periods presented (in millions):
| Six Months Ended June 30, | Year Ended December 31, | |||||||||||||||
| 2021 | 2020 | 2020 | 2019 | |||||||||||||
Net loss attributable to Hippo | $ | (279.8 | ) | $ | (48.7 | ) | $ | (141.5 | ) | $ | (83.1 | ) | ||||
Adjustments: | ||||||||||||||||
Net investment income | (0.2 | ) | (0.6 | ) | (1.1 | ) | (2.2 | ) | ||||||||
Depreciation and amortization | 5.1 | 3.0 | 6.7 | 2.9 | ||||||||||||
Interest expense | 21.9 | — | 3.5 | — | ||||||||||||
Stock-based compensation | 5.3 | 1.8 | 17.7 | 21.9 | ||||||||||||
Fair value adjustments | 161.1 | 4.1 | 22.4 | 2.0 | ||||||||||||
Contingent consideration charge | 1.3 | — | 3.4 | 1.9 | ||||||||||||
Other one-off transactions | 7.0 | — | 0.8 | — | ||||||||||||
Income taxes (benefit) expense | 0.3 | — | (1.8 | ) | 0.1 | |||||||||||
Adjusted EBITDA (1) | $ | (78.0 | ) | $ | (40.4 | ) | $ | (89.9 | ) | $ | (56.5 | ) | ||||
| (1) | In previous disclosures our Adjusted EBITDA calculation included an adjustment for capitalization of internal use software costs. We no longer include this adjustment as we believe the current presentation is more relevant and in-line with our peers and relevant comparable companies. We have adjusted the historical periods accordingly. |
Gross Loss Ratio
Gross Loss Ratio expressed as a percentage, is the ratio of the Gross Losses and LAE, to the Gross Earned Premium.
Six Months Ended June 30 | Year Ended December 31 | |||||||||||||||
2021 | 2020 | 2020 | 2019 | |||||||||||||
Gross losses and LAE | $ | 286.2 | $ | 5.2 | $ | 106.9 | $ | 0.0 | ||||||||
Gross earned premium | 161.5 | 4.8 | 98.0 | 0.0 | ||||||||||||
Gross loss ratio | 177 | % | 108 | % | 109 | % | 0 | % | ||||||||
Net Loss Ratio
Net Loss Ratio expressed as a percentage, is the ratio of the Net Losses and LAE, to the Net Earned Premium.
Six Months Ended June 30 | Year Ended December 31 | |||||||||||||||
2021 | 2020 | 2020 | 2019 | |||||||||||||
Net Losses and LAE | $ | 38.7 | $ | 5.2 | $ | 25.3 | $ | 0.0 | ||||||||
Net Earned Premium | 19.0 | 4.0 | 17.1 | 0.0 | ||||||||||||
Net Loss Ratio | 204 | % | 130 | % | 148 | % | 0 | % | ||||||||
For the six months ended June 30, 2021, our Gross Loss Ratio was 177% compared with 108% for the six months ended June 30, 2020. The increase is due primarily to the impact of higher weather-related losses. Excluding the impact of the Texas winter storm Uri, our Gross Loss Ratio for the six months ended June 30, 2021 would have been 119%.
For the six months ended June 30, 2021, our Net Loss Ratio was 204% compared with 130% for the six months ended June 30, 2020. The increase is due to the impact of abnormally high weather-related losses, including the Texas winter storm Uri in February 2021.
98
Our Gross Loss Ratio and Net Loss Ratio for the year ended December 31, 2020 was 109% and 148%, respectively, driven primarily by extreme weather conditions. Wildfires in California, tornadoes and hail in Tennessee and Texas, and the unusually high winds of the derecho in the upper Midwest all contributed to higher catastrophic losses than expected. In the prior year we did not retain any risk and so we did not recognize any gross earned premium, any net earned premium or loss and LAE expenses.
Key GAAP Financial Terms
Gross Written Premium
Gross written premium is the amount received or to be received for insurance policies written or assumed by us and our affiliates as a carrier, without reduction for policy acquisition costs, reinsurance costs or other deductions. In addition, gross written premium includes amounts received from our participation in our own reinsurance treaty. The volume of our gross written premium in any given period is generally influenced by:
| • | New business submissions; |
| • | Binding of new business submissions into policies; |
| • | Bound policies going effective; |
| • | Renewals of existing policies; and |
| • | Average size and premium rate of bound policies. |
Ceded Written Premium
Ceded written premium is the amount of gross written premium written or assumed by us and our affiliates as a carrier, that we cede to reinsurers. We enter into reinsurance contracts to limit our exposure to losses as well as to provide additional capacity for growth. Ceded written premium is treated as a reduction from gross written premium written during a specific period of time over the reinsurance contract period in proportion to the period of risk covered. The volume of our ceded written premium is impacted by the level of our gross written premium and decisions we make to increase or decrease retention levels.
Gross Earned Premium
Gross Earned Premium (“GEP”) represents the earned portion of our gross written premium. Our insurance policies generally have a term of one year and premium is earned pro rata over the term of the policy.
Components of Results of Operations
Revenue
Net Earned Premium
Net earned premium represents the earned portion of our gross written premium for insurance policies written or assumed by us and less ceded written premium (any portion of our gross written premium that is ceded to third-party reinsurers under our reinsurance agreements). We earn written premiums on a
pro-rata
basis over the term of the policies.Commission Income, net includes:
| a. | MGA Commission |
99
| sheet. Rather, we work with carrier platforms and a diversified panel of highly rated reinsurance companies who pay us commission in exchange for the opportunity to take that risk on their balance sheets. Our performance obligation associated with these contracts is the placement of the policy, which is met on the effective date. Upon issuance of a new policy, we charge policy fees and inspection fees (see Service and Fee Income |
| b. | Agency Commission non-Hippo policies. For these policies, we earn a recurring agency commission from the carriers whose policies we sell, which is recorded in the commission income, net line on our statements of operations and comprehensive loss. Similar to the MGA businesses, the performance obligation from the agency contracts is placement of the insurance policies. |
For both MGA and insurance agency activities, we recognize commission received from insurers for the sale of insurance contracts as revenue at a point in time on the policy effective dates. Cash received in advance of policy effective dates is recorded on the consolidated balance sheets, representing our portion of commission and premium due to insurers and reinsurers, and hold this cash in trust for the benefit of the insurers and reinsurers as fiduciary liabilities. The MGA commission is subject to adjustments, higher or lower (commonly referred to as “commission slide”), depending on the underwriting performance of the policies placed by us. We are required to return portion of our MGA commission due to commission slide received on the policies placed by MGA if the underwriting performance varies due to higher Hippo programs loss ratio from contractual performance of the Hippo programs loss ratio or if the policies are cancelled before the term of the policy; accordingly, we reserve for commission slide using estimated Hippo programs loss ratio performance, and a cancellation reserve is estimated as a reduction of revenue for each period presented in our statement of operations and comprehensive loss.
| c. | Ceding Commission pro-rata basis over the terms of the policies reinsured. We record the portion of ceding commission income which represents reimbursement of successful direct acquisition costs related to the underlying policies as an offset to the applicable direct acquisition costs. |
| d. | Carrier Fronting Fees insurance-as-a-service pro-rata basis over the terms of the policies. This revenue is included in the Commission income, net line on our statements of operations and comprehensive loss. |
| e. | Claim Processing Fees |
Service and Fee Income:
Service and fee income mainly represents policy fees and other revenue. We directly bill policyholders for policy fees and collect and retain fees per the terms of the contracts between us and our insurers. Similar to the commission revenue, we estimate a cancellation reserve for policy fees using historical information. The performance obligation associated with these fees is satisfied at a point in time upon completion of the
100
underwriting process, which is the policy effective date. Accordingly, we recognize all fees as revenue on the policy effective date.
Net Investment Income
Net investment income represents interest earned from fixed maturity securities, short-term securities and other investments, and the gains or losses from the sale of investments. Our cash and invested assets primarily consist of fixed-maturity securities, and may also include cash and cash equivalents, equity securities, and short-term investments. The principal factors that influence net investment income are the size of our investment portfolio and the yield on that portfolio. As measured by amortized cost (which excludes changes in fair value, such as changes in interest rates), the size of our investment portfolio is mainly a function of our invested equity capital along with premium we receive from our customers less payments on customer claims.
Net investment income also includes an insignificant amount of net realized gains (losses) on investments, which are a function of the difference between the amount received by us on the sale of a security and the security’s amortized cost, as well as any allowances for credit losses recognized in earnings, if any.
Expenses
Loss and Loss Adjustment Expenses
Loss and loss adjustment expense represents the costs incurred for losses net of amounts ceded to reinsurers. We enter into reinsurance contracts to limit our exposure to potential losses as well as to provide additional capacity for growth. These expenses are a function of the size and term of the insurance policies and the loss experience associated with the underlying risks. LAE are based on actuarial assumptions and management judgements, including losses incurred during the period and changes in estimates from prior periods. Loss and LAE also includes employee compensation, including stock-based compensation and benefits, of our claims processing teams as well as allocated occupancy costs and related overhead based on headcount.
Insurance Related Expenses
Insurance related expenses primarily consist of amortization of direct acquisition commission costs and premium taxes incurred on the successful acquisition of business written on a direct basis, and credit card processing fees not charged to our customers. Insurance related expenses also includes employee compensation, including stock-based compensation and benefits, of the Company’s underwriting teams as well as allocated occupancy costs and related overhead based on headcount, and amortization of capitalized internal use software costs. Insurance related expenses are offset by the portion of ceding commission income which represents reimbursement of successful acquisition costs related to the underlying policies. Additionally, insurance related expenses include the costs of providing bound policies and delivering claims services to our customers. These costs include underwriting technology service costs including software, data services used for performing underwriting, and third-party call center costs in addition to personnel-related costs.
In 2019, insurance related expenses were primarily comprised of the costs of providing bound policies and delivering claims services to the Company’s customers. These costs include technology service costs including software, data services, and third-party call center costs in addition to personnel-related costs. We believe these technology service costs represent insurance related costs and might be misleading to a reader on a comparative basis if not recorded in insurance related.
Technology and Development
Technology and development expenses primarily consist of employee compensation, including stock-based compensation and benefits for our technology staff, which includes information technology development,
101
infrastructure support, actuarial, and third-party services. Technology and development also include allocated facility costs and related overhead based on headcount.
We expense development costs as incurred, except for costs related to
internal-use
software development projects which are capitalized and subsequently depreciated over the expected useful life of the developed software. We expect our technology and development costs to increase for the foreseeable future as we continue to invest in research and develop activities to achieve our technology development roadmap.Sales and Marketing
Sales and marketing expenses primarily consist of sales commission expense for policies placed on third-party carriers by us as a managing general agent, advertising costs, and marketing expenditures as well as employee compensation, including stock-based compensation and benefits for employees engaged in sales, marketing, data analytics and customer acquisition. We expense advertising costs as incurred. Sales and marketing also include allocated facility costs and related overhead based on headcount.
We plan to continue to invest in sales and marketing to attract and acquire new customers and to increase our brand awareness. We expect that our sales and marketing expenses will increase over time as we continue to hire additional personnel to scale our business, and invest in developing a nationally recognized brand. We expect that sales and marketing costs will increase in absolute dollars in future periods and vary fromas a percentage of revenue in the near-term. We expect that, in the long-term, our sales and marketing costs will decrease as a percentage of revenue as we continue to drive customer acquisition efficiencies and as the proportion of renewals to our total business increases.
period-to-period
General and Administrative
General and administrative expenses primarily consist of employee compensation, including stock-based compensation and benefits for our finance, human resources, legal, and general management functions, as well as facilities and professional services. We expect our general and administrative expenses to increase for the foreseeable future as we scale headcount with the growth of our business, and as a result of operating as a public company, including compliance with the rules and regulations of the SEC and other regulatory bodies, legal, audit, additional insurance expenses, investor relations activities, and other administrative and professional services.
Interest and Other Expense
Interest and other expense primarily consist of interest expense incurred for the convertible promissory notes, and fair value adjustments on preferred stock warrant liabilities and embedded derivative on convertible promissory notes. The convertible promissory notes will convert into equity immediately prior to the closing of the merger, eliminating the associated interest expense for the future periods after the consummation of the merger.
Income Taxes
We record income taxes using the asset and liability method. Under this method, we record deferred income tax assets and liabilities based on the estimated future tax effects of differences between the financial statement and income tax basis of existing assets and liabilities. We measure these differences using the enacted statutory tax rates that are expected to apply to taxable income for the years in which differences are expected to reverse. We recognize the effect on deferred income taxes of a change in tax rates in income in the period that includes the enactment date.
102
We record a valuation allowance to reduce deferred tax assets and liabilities to the net amount that we believe is more likely than not to be realized. We consider all available evidence, both positive and negative, including historical levels of income, expectations and risks associated with estimates of future taxable income and ongoing tax planning strategies in assessing the need for a valuation allowance.
Results of Operations
The results of operations presented below should be reviewed in conjunction with the consolidated financial statements and notes included elsewhere in this prospectus. The following table sets forth our consolidated results of operations data for the periods presented (dollars in millions):
Six Months Ended June 30 | Year Ended December 31 | |||||||||||||||||||||||||||||||
2021 | 2020 | Change | % Change | 2020 | 2019 | Change | % Change | |||||||||||||||||||||||||
Revenue: | ||||||||||||||||||||||||||||||||
Net earned premium | $ | 19.0 | $ | 4.0 | $ | 15.0 | 375 | % | $ | 17.1 | $ | — | $ | 17.1 | N/A | |||||||||||||||||
Commission income, net. | 11.6 | 15.5 | (3.9 | ) | (25 | )% | 27.1 | 28.9 | (1.8 | ) | (6 | )% | ||||||||||||||||||||
Service and fee income | 7.1 | 2.1 | 5.0 | 238 | % | 6.3 | 3.6 | 2.7 | 75 | % | ||||||||||||||||||||||
Net investment income | 0.2 | 0.6 | (0.4 | ) | (67 | )% | 1.1 | 2.2 | (1.1 | ) | (50 | )% | ||||||||||||||||||||
Total revenue. | 37.9 | 22.2 | 15.7 | 71 | % | 51.6 | 34.7 | 16.9 | 49 | % | ||||||||||||||||||||||
Expenses: | ||||||||||||||||||||||||||||||||
Loss and Loss Adjustment Expenses | 38.7 | 5.2 | 33.5 | 644 | % | 25.3 | — | 25.3 | N/A | |||||||||||||||||||||||
Insurance related expenses | 16.0 | 8.0 | 8.0 | 100 | % | 19.3 | 7.1 | 12.2 | 172 | % | ||||||||||||||||||||||
Technology and development | 14.5 | 7.3 | 7.2 | 99 | % | 18.0 | 7.7 | 10.3 | 134 | % | ||||||||||||||||||||||
Sales and marketing | 46.9 | 35.3 | 11.6 | 33 | % | 69.4 | 66.3 | 3.1 | 5 | % | ||||||||||||||||||||||
General and administrative | 17.1 | 11.1 | 6.0 | 54 | % | 36.8 | 34.6 | 2.2 | 6 | % | ||||||||||||||||||||||
Interest and other expense | 183.1 | 4.0 | 179.1 | 4478 | % | 26.0 | 2.0 | 24.0 | 1200 | % | ||||||||||||||||||||||
Total expenses | 316.3 | 70.9 | 245.4 | 346 | % | 194.8 | 117.7 | 77.1 | 66 | % | ||||||||||||||||||||||
Loss before income taxes | (278.4 | ) | (48.7 | ) | (229.7 | ) | 472 | % | (143.2 | ) | (83.0 | ) | (60.2 | ) | 73 | % | ||||||||||||||||
Income taxes (benefit) expense | 0.3 | — | 0.3 | N/A | (1.8 | ) | 0.1 | (1.9 | ) | (1900 | )% | |||||||||||||||||||||
Net loss | (278.7 | ) | (48.7 | ) | (230.0 | ) | 472 | % | (141.4 | ) | (83.1 | ) | (58.3 | ) | 70 | % | ||||||||||||||||
Net income attributable to noncontrolling interests, net of tax | 1.1 | — | 1.1 | N/A | 0.1 | — | 0.1 | N/A | ||||||||||||||||||||||||
Net loss attributable to Hippo | $ | (279.8 | ) | $ | (48.7 | ) | $ | (231.1 | ) | 475 | % | $ | (141.5 | ) | $ | (83.1 | ) | $ | (58.4 | ) | 70 | % | ||||||||||
Other comprehensive income: | ||||||||||||||||||||||||||||||||
Change in net unrealized gain on available-for-sale | (0.3 | ) | — | (0.3 | ) | N/A | — | 0.1 | (0.1 | ) | (100 | )% | ||||||||||||||||||||
Comprehensive loss attributable to Hippo | $ | (280.1 | ) | $ | (48.7 | ) | $ | (231.4 | ) | 475 | % | $ | (141.5 | ) | $ | (83.0 | ) | $ | (58.5 | ) | 70 | % | ||||||||||
Comparison of the Six Months Ended June 30, 2021 and 2020
For the six months ended June 30, 2021, net earned premium was $19.0 million, an increase of $15.0 million compared to $4.0 million for the six months ended June 30, 2020. The six months increases are due to year over year growth of our total book of business and our acquisition of Spinnaker, which closed on August 31, 2020.
103
The following table presents gross written premium, ceded written premium, net written premium, change in unearned premium, and net earned premium for the six months ended June 30, 2021 and 2020.
Six Months Ended June 30, | ||||||||||||
2021 | 2020 | Change | ||||||||||
Gross written premium | 227.7 | 14.7 | 213.0 | |||||||||
Ceded written premium | 208.4 | 2.0 | 206.4 | |||||||||
Net written premium | 19.3 | 12.7 | 6.6 | |||||||||
Change in unearned premium | (0.3 | ) | (8.7 | ) | 8.4 | |||||||
Net earned premium | $ | 19.0 | $ | 4.0 | $ | 15.0 | ||||||
Commission Income, net
For the six months ended June 30, 2021, commission income was $11.6 million, a decrease of $3.9 million, or 25%, compared to $15.5 million for the six months ended June 30, 2020. This is a direct result of the structural change in our business due to the acquisition of Spinnaker, which led to a decrease in our MGA commission income of $10.6 million. This was partially offset by increase in ceding commission and agency commissions of $5.6 million and $1.1 million respectively.
Service and Fee Income
For the six months ended June 30, 2021, service and fee income was $7.1 million, an increase of $5.0 million, or 238%, compared to $2.1 million for the six months ended June 30, 2020. The increase was due primarily to increased policy fees and other revenue due to an increase in the volume of policies placed by our MGA services.
Net Investment Income
For the six months ended June 30, 2021, net investment income was $0.2 million, a decrease of $0.4 million, compared to $0.6 million for the six months ended June 30, 2020. The decrease was primarily driven by decrease in interest rates compared to the same period in the prior year. We mainly invested in corporate securities, residential mortgage-backed securities and other fixed maturities securities issued by U.S. government and agencies.
Loss and Loss Adjustment Expenses
For the six months ended June 30, 2021, loss and loss adjustment expenses were $38.7 million, an increase of $33.5 million, compared to $5.2 million for the six months ended June 30, 2020. The increase was due to more risk retained on policies written, abnormally high weather-related losses, including the Texas winter storm in February 2021, and a higher concentration in areas impacted by the weather-related losses.
Insurance Related Expenses
For the six months ended June 30, 2021, insurance related expenses were $16.0 million, an increase $8.0 million, or 100%, compared to $8.0 million for the six months ended June 30, 2020. The increase was due primarily to a $1.8 million increase in amortization of deferred acquisition costs, $1.4 million increase in employee-related costs, $1.3 million increase in underwriting costs, and $1.0 million increase in amortization expense attributable to capitalized internal use software. These increases were to support the growth of our business.
104
Technology and Development Expenses
For the six months ended June 30, 2021, technology and development expense were $14.5 million, an increase of $7.2 million, or 99%, compared to $7.3 million for the six months ended June 30, 2020. The increase was due primarily to an increase in employee-related costs of $7.0 million, including an increase in stock-based compensation of $1.0 million, and partially offset by an increase in capitalized costs for the development of
internal-use
software of $1.9 million, driven by an increase in headcount to support our growth.Sales and Marketing Expenses
For the six months ended June 30, 2021, sales and marketing expense was $46.9 million, an increase of $11.6 million, or 33%, compared to $35.3 million for the six months ended June 30, 2020. The increase was due primarily to $7.7 million in advertising costs, $7.0 million in service fees related to the issuance of a convertible promissory note, $6.1 million of employee-related expenses including $1.8 million of stock-based compensation, driven by an increase in headcount to support our growth, $1.3 million in change in fair value of contingent consideration and $1.1 million in licensing fees. These amounts are partially offset by a decrease in direct acquisition costs of $15.0 million, which have now been deferred and the related amortization included in insurance related expenses after the acquisition of Spinnaker in the third quarter of 2020.
General and Administrative Expenses
For the six months ended June 30, 2021, general and administrative expense was $17.1 million, an increase of $6.0 million, or 54%, compared to $11.1 million for the six months ended June 30, 2020. The increase was due primarily to an increase in employee-related expenses of $5.0 million, including stock-based compensation of $1.0 million, driven by an increase in headcount to support our growth.
Interest and Other Expense
For the six months ended June 30, 2021, interest and other expense was $183.1 million, an increase of $179.1 million compared to $4.0 million for the six months ended June 30, 2020. The increase was due primarily to an increase fair value losses recorded on preferred stock warrants of $110.5 million due to the increase in the fair market value of our outstanding preferred stock and an increase in fair value losses recorded on the derivative liability on our outstanding convertible promissory notes of $46.5 million. We also recorded interest expense on the outstanding convertible promissory notes of $21.8 million.
Income Taxes
For the six months ended June 30, 2021, income tax expense was $0.3 million, an increase of $0.3 million, compared to $0 for the six months ended June 30, 2020.
Comparison of the Years Ended December 31, 2020 and 2019
Net Earned Premium
Net earned premium increased by $17.1 million to $17.1 million for the year ended December 31, 2020 compared to the year ended December 31, 2019. Starting January 1, 2020, we retained a portion of risk for the insurance policies written by us as an MGA. Also, on August 31, 2020 we acquired Spinnaker Insurance Company which retains a portion of risk on earned premium less amounts ceded. In the prior year we did not retain any risk and so did not recognize any earned premium.
105
The following table presents gross written premium, ceded written premium, net written premium, change in unearned premium, and net earned premium for the years ended December 31, 2020 and 2019.
Year Ended December 31 | ||||||||||||
2020 | 2019 | Change | ||||||||||
Gross Written Premium | 116.1 | — | 116.1 | |||||||||
Ceded written premium | 78.4 | — | 78.4 | |||||||||
Net Written Premium | 37.7 | — | 37.7 | |||||||||
Change in unearned premium | 20.6 | — | 20.6 | |||||||||
Net Earned Premium | $ | 17.1 | $ | — | $ | 17.1 | ||||||
Commission Income, net
Commission income decreased $1.8 million, or 6%, to $27.1 million for the year ended December 31, 2020 compared to the year ended December 31, 2019. The decrease was due primarily to the following reasons:
| 1. | Lower effective commission rate in FY 2020: Assuming similar blended net commission rate of FY 2019 in FY 2020, our commission income, net would have been higher by $15.1 million. However, in FY 2020, our blended commission rate decreased by 5 percentage points compared to FY 2019, due to a larger commission slide, resulting in offsetting potential increase in our commission income to only $1.2 million. |
| 2. | Impact of acquisition of Spinnaker on revenue recognition for the policies written by Spinnaker: |
Prior to the Spinnaker acquisition, Hippo received MGA commission income for the policies written by Hippo on Spinnaker paper, we recognized this commission income at the policy effective dates, net of intercompany elimination for the risk retained by Hippo. The expense incurred for outside sales commission were included in sales and marketing line item and was not offset against the commission revenue.
After the acquisition, the consolidated company (Hippo and Spinnaker) began to earn ceding commission on premium ceded to third party reinsurers and the ceding commission is recognized net of acquisition costs which represents outside sales commission expense, on a
pro-rata
basis over the term of the policy. This resulted in $3.0 million of commission income which represents reimbursement of successful direct acquisition costs related to the underlying policies as an offset the applicable direct acquisition cost.Service and Fee Income
Service and fee income increased $2.7 million, or 75%, to $6.3 million for the year ended December 31, 2020 compared to the year ended December 31, 2019. The increase was due primarily to increased policy fees and other revenue due to an increase in the volume of policies placed by our MGA services.
Net Investment Income
Net investment income decreased $1.1 million, or 50%, to $1.1 million for the year ended December 31, 2020 compared to the year ended December 31, 2019. The decrease was primarily driven by decrease in interest rates and a lower average balance of investments during the year ended December 31, 2020. We mainly invested in corporate securities, residential mortgage-backed securities and other fixed maturities securities issued by U.S government and agencies.
Loss and Loss Adjustment Expenses
Loss and LAE increased $25.3 million, to $25.3 million for the year ended December 31, 2020, compared to the year ended December 31, 2019. The increase was mainly due to Loss and Loss Adjustment Expenses relating
106
to us retaining a portion of risk on certain of our insurance policies written by our MGA starting from January 1, 2020 and resulting presentation in statement of operation, as compared to 2019 in which we did not retain risk of losses on insurance policies written, and also due to the acquisition of Spinnaker Insurance Company which resulted in additional Loss and LAE of $2.3 million.
The Company faces loss exposure from the February 2021 winter storm in the State of Texas. The Company is assessing the impact of the event; based on a preliminary estimate, we expect the range of expected net retained losses between $5 million to $10 million, reflecting anticipated reinsurance recoveries partially offset by reinstatement premiums. The Company is closely monitoring the loss development and our estimate is subject to change as we get more information. The Company believes this event will have a material impact on the results of operations for the quarter ending March 31, 2021.
Insurance Related Expenses
Insurance related expenses increased $12.2 million, or 172%, to $19.3 million for the year ended December 31, 2020 compared to the year ended December 31, 2019. The increase was due primarily to a $2.7 million increase in amortization of deferred acquisition costs resulting from the acquisition of Spinnaker in 2020, with no comparative amounts in the prior year. Underwriting expenses also increased by $2.4 million due to growth in written premium, and depreciation and amortization attributable to capitalized internal use software increased by $1.7 million. In addition, employee-related costs, including stock-based compensation, increased by $1.7 million, driven by an increase in headcount to support our growth.
Technology and Development Expenses
Technology and development expense increased $10.3 million, or 134%, to $18.0 million for the year ended December 31, 2020 compared to the year ended December 31, 2019. The increase was due primarily to an increase in employee-related costs, including stock-based compensation, net of capitalized costs for the development of
internal-use
software of $5.5 million, driven by an increase in headcount to support our growth, a $1.7 million increase in consulting costs, net of capitalized costs for the development ofinternal-use
software, and a $1.1 million increase in depreciation and amortization attributable to a full year amortization of developed technology acquired in 2019.Sales and Marketing Expenses
Sales and marketing expense increased $3.1 million, or 6%, to $69.4 million for the year ended December 31, 2020. The increase was due primarily to an increase in employee-related expenses, including stock-based compensation of $9.2 million which was driven by an increase in headcount to support our growth. There was also an increase in expenses related to the fair value of contingent consideration of $1.5 million due to changes in market interest rates and performance, an increase of $1.1 million in expenses related to the establishment of the builder channel, and an increase of $0.7 million for the amortization of customer relationships acquired.
General and Administrative Expenses
General and administrative expense increased $2.2 million, or 6%, to $36.8 million for the year ended December 31, 2020 compared to the year ended December 31, 2019. The increase was due primarily to an increase in legal, accounting, and other professional fees of $3.6 million to support our overall growth and to prepare to operate as a public company. There was also an increase in expenses related to consulting and contractors of $0.9 million. These amounts were partially offset by a decrease in employee-related costs of $2.4 million, resulting from a decrease in stock-based compensation of $6.6 million relating to higher stock based compensation expense in the year ending December 31, 2019 which decrease was due to the secondary sale of equity holdings by certain of our employees, partially offset by an increase in $4.2 million for salaries and benefits.
107
Interest and Other Expense
Interest and other expense increased $24.0 million, or 1,180%, to $26.0 million for the year ended December 31, 2020. The increase was due primarily to fair value losses recorded on preferred stock warrants due to the increase in the fair market value of our outstanding preferred stock and fair value losses recorded on the derivative liability on our outstanding convertible promissory notes.
Income Taxes
Income tax benefit increased by $1.9 million, or 1,900%, to a benefit of $1.8 million for the year ended December 31, 2020, compared to a $0.1 million income tax expense the year ended December 31, 2019.
Liquidity and Capital Resources
Sources of Liquidity
Our capital requirements will depend on many factors, including the volume of issuance of insurance policies, the timing and extent of spending to support research and development efforts, investments in information technology systems, and the expansion of sales and marketing activities. Until we can generate sufficient revenue and other income to cover operating expenses, working capital and capital expenditures, we expect the funds raised in our preferred stock and convertible notes financings, the PIPE and the Business Combination, to fund cash needs. In the future, we may raise additional funds through the issuance of debt or equity securities or the borrowing of money. We cannot assure that such funds will be available on favorable terms, or at all.
On July 8, 2020, we issued shares of our Series E Convertible Preferred Stock for aggregate proceeds of $150 million.
In November and December 2020, we raised an additional $365.0 million of cash by issuing convertible promissory notes. The convertible promissory notes converted into shares or our common stock immediately prior to the closing of the Business Combination.
We are a member of the Federal Home Loan Bank (FHLB) of New York, which provides secured borrowing capacity. Our borrowing capacity as of June 30, 2021 is $11.2 million, and there were no outstanding amounts under this agreement.
As of June 30, 2021, we had $410.2 million of cash and restricted cash and $56.6 million offixed income securities. To date, we have funded operations primarily with issuances of convertible preferred stock and convertible promissory notes and from net proceeds from revenue. Our existing sources of liquidity include cash and cash equivalents and marketable securities.
available-for-sale
Subsequently, on August 3, 2021, we completed our business combination with Reinvent Technology Partners Z through a reverse recapitalization. As part of this transaction, we received net proceeds of $455 million.
Since our inception, we have incurred operating losses, including net losses attributable to Hippo of $141.5 million for the year ended December 31, 2020 and $279.8 million as of June 30, 2021. We had an accumulated deficit of $256.6 million as of December 31, 2020 and $536.4 million as of June 30, 2021. We expect to continue to incur operating losses for the foreseeable future due to continued investments that we intend to make in our business and, as a result, we may require additional capital resources to grow our business. We believe that current cash, cash equivalents and net proceeds from the Business Combination will be sufficient to meet our working capital and capital expenditure needs over at least the next 12 months.
108
Cash Flow Summary
The following table summarizes our cash flows for the periods presented (in millions):
Six Months Ended June 30, | Year Ended December 31 | |||||||||||||||
2021 | 2020 | 2020 | 2019 | |||||||||||||
Net cash provided by (used in): | ||||||||||||||||
Operating activities | $ | (69.2 | ) | $ | (22.9 | ) | $ | (65.4 | ) | $ | (29.1 | ) | ||||
Investing activities | $ | (10.2 | ) | $ | 64.8 | $ | (2.3 | ) | $ | (72.3 | ) | |||||
Financing activities | $ | (2.8 | ) | $ | 3.0 | $ | 518.1 | $ | 101.4 | |||||||
Operating Activities
Cash used in operating activities was $69.2 million for the six months ended June 30, 2021, an increase of $46.3 million, from $22.9 million for the six months ended June 30, 2020. This increase was due primarily to the $230.0 million increase in our net loss for the six months ended June 30, 2021, partially offset by
non-cash
charges and net cash provided by changes in our operating assets and liabilities.Non-cash
charges primarily consisted of an increase in the change in fair value of derivative liability on our outstanding preferred stock warrants liabilities of $110.5 million, increase in the change in fair value on the derivative on our convertible promissory notes of $46.5 million, increase amortization of debt discount of $17.1 million, and increase innon-cash
service expense of $7.0 million.Cash used in operating activities was $65.4 million for the year ended December 31, 2020, an increase of $36.3 million, from $29.1 million for the year ended December 31, 2019. This increase was due primarily to the $58.3 million increase in our net loss for the year ended December 31, 2020, partially offset by
non-cash
charges and net cash provided by changes in our operating assets and liabilities.Non-cash
charges primarily consisted of share-based compensation expense, change in fair value of derivative liability on our outstanding preferred stock warrants liabilities, change in fair value on our convertible promissory notes, and depreciation and amortization expense. Net cash provided by changes in operating assets and liabilities primarily consisted of increases in provision for commission, loss and loss adjustment expense reserves and unearned premium.Cash used in operating activities was $29.1 million for the year ended December 31, 2019. This amount resulted from our net loss of $83.1 million, partially offset by
non-cash
charges and net cash provided by changes in our operating assets and liabilities.Non-cash
charges primarily consisted of share-based compensation expense. Net cash provided by changes in operating assets and liabilities primarily consisted of increases in provision for commission, accrued expense and other liabilities and fiduciary liabilities.Investing Activities
Cash used in investing activities was $10.2 million for the six months ended June 30, 2021, primarily due to purchases of intangible assets and investments, partially offset by maturities and sales of investment securities.
Cash provided by investing activities was $64.8 million for the six months ended June 30, 2020 primarily due to maturities and sales of investments.
Cash used in investing activities was $2.3 million for the year ended December 31, 2020 primarily due to purchases of investments and cash paid for acquisition, net of cash acquired, partially offset by maturities and sales of investment securities.
Cash used in investing activities was $72.3 million for the year ended December 31, 2019 primarily due to purchases of investments, partially offset by maturities of investment securities.
109
Financing Activities
Cash used in financing activities was $2.8 million for the six months ended June 30, 2021, which consisted primarily of payments of contingent consideration and transaction related costs, partially offset by proceeds from the exercise of options.
Cash provided by financing activities was $3.0 million for the six months ended June 30, 2020, which consisted primarily of proceeds from the issuance of preferred stock, net of issuance costs, partially offset by payments of contingent consideration.
Cash provided by financing activities was $518.1 million for the year ended December 31, 2020, which consisted of proceeds from the issuance of preferred stock and promissory notes, net of issuance costs.
Cash provided by financing activities was $101.4 million for the years ended December 31, 2019, which consisted almost exclusively of proceeds from the issuance of preferred stock, net of issuance costs.
Commitments and Contractual Obligations
Contractual obligations are cash amounts that we are obligated to pay as part of certain contracts that we have entered into during the normal course of business. Below is a table that shows our contractual obligations as of December 31, 2020 (in millions):
Payments Due by Period | ||||||||||||||||||||||||
Total | Less Than 1 Year | 2 Years | 3 Years | 4 Years | 5 or More Years | |||||||||||||||||||
Purchase commitments | $ | 19.8 | $ | 13.8 | $ | 6.0 | $ | — | $ | — | $ | — | ||||||||||||
Operating lease obligations (1) | 25.1 | 2.9 | 4.0 | 3.5 | 3.5 | 11.2 | ||||||||||||||||||
Unpaid Loss and Loss Adjustment Expense (2) | 105.1 | 105.1 | — | — | — | — | ||||||||||||||||||
Total contractual obligations | $ | 150.0 | $ | 121.8 | $ | 10.0 | $ | 3.5 | $ | 3.5 | $ | 11.2 | ||||||||||||
(1) | Represents minimum rental payments for operating leases having initial or remaining non-cancelable lease terms primarily related to our office space. Included in the lease obligations is a $11.4 million lease agreements that we have entered into but has not yet commenced as of December 31, 2020. |
(2) | The reserve for Loss and Loss Adjustment Expenses represent management’s estimate of the ultimate cost of settling losses. As more fully discussed in “— Critical Accounting Policies — Unpaid Loss and Loss Adjustment Expenses”, the estimation of the unpaid Loss and Loss Adjustment Expenses is based on various complex and subjective judgments. Actual losses paid may differ, perhaps significantly, from the reserve estimates reflected in our consolidated financial statements. Similarly, the timing of payment of our estimated losses is not fixed and there may be significant changes in actual payment activity. The assumptions used in estimating the likely payments due by period are based on our historical claims payment experience and industry payment patterns, but due to the inherent uncertainty in the process of estimating the timing of such payments, there is a risk that the amounts paid can be significantly different from the amounts disclosed. |
There have been no material changes to our contractual obligations subsequent to the year ended December 31, 2020 other than an increase in Unpaid Loss and Loss Adjustment Expense. Unpaid Loss and Loss Adjustment Expense is $195.2 million as of June 30, 2021.
110
Off-Balance
Sheet ArrangementsAs discussed in Note 1 — Description of Business and Summary of Significant Accounting Policies in the Notes to the Audited Consolidated Financial Statements, certain employees early exercised stock options in exchange for promissory notes. We have accounted for the promissory notes as nonrecourse in their entirety since the promissory notes are not aligned with a corresponding percentage of the underlying shares. We have accounted for the transaction as a stock option grant, the exercise price of this stock option is the principal and interest due on the promissory note. The loan and interest receivables are not recorded in the consolidated balance sheets.
Critical Accounting Policies and Estimates
We prepared our consolidated financial statements in accordance with GAAP, which requires the use of estimates and assumptions Our consolidated financial statements include amounts that, either by their nature or due to requirements of GAAP, are determined using best estimates and assumptions. Management has discussed and reviewed the development, selection, and disclosure of critical accounting estimates with our Company’s Audit Committee. While we believe that the amounts included in our consolidated financial statements reflect our best judgment, actual amounts could ultimately materially differ from those currently presented.
For further information, see Note 1 — Description of Business and Summary of Significant Accounting Policies in the Notes to the Audited Consolidated Financial Statements included elsewhere in this prospectus.
Revenue
For a description of policies with respect to revenue recognition, see “” in this section along with Note 1 in the audited consolidated financial statements included elsewhere in this prospectus.
Components of Results of Operations — Revenue
Loss and Loss Adjustment Expense Reserve
Loss and Loss Adjustment Expense Reserves
Recorded Loss and Loss Adjustment Expense Reserve represents management’s best estimate of the amounts yet to be paid for all loss and loss adjustment expenses that will be paid on claims that occurred during the period and prior, whether those claims are currently known or unknown. Our carriers are required to estimate and hold a provision for the carriers’ loss and loss adjustment expense reserve as of a given date.
Loss and Loss Adjustment reserves at December 31, 2020 are the amount of ultimate loss and loss adjustment expense less the paid amounts as of December 31, 2020.
Ultimate loss and loss adjustment expense for an accident period is the sum of the following items:
| 1- | Loss and loss adjustment expense paid for an accident period as of a given evaluation date |
| 2- | Case reserves for loss and loss adjustment expense for losses for an accident period that have been reported but not yet paid as of a given evaluation date |
| 3- | Incurred But Not Reported (“IBNR”) amounts for loss and loss adjustment expense for an accident period are the costs of events or conditions that have not been reported to or specifically identified by the Company as of a given date, but have occurred during the period. |
Case reserves are established within the claims adjustment process based on all known circumstances of a claim at the time. In addition, IBNR reserves are established by management based on reported Loss and Loss Adjustment Expenses and actuarially determined estimates of ultimate Loss and Loss Adjustment Expenses.
111
Our loss and loss adjustment expense reserve amounts are reviewed quarterly, and adjustments, if any, are reflected in earnings in the period in which they become known. The establishment of new loss and loss adjustment expense reserves or the adjustment of previously recorded loss and loss adjustment expense reserves could result in significant positive or negative changes to our financial condition for any particular period. While we believe that we have made a reasonable estimate of loss and loss adjustment expense reserves, the ultimate loss experience may not be as reliably predicted as may be the case with other insurance expenses, and it is possible that actual Loss and Loss Adjustment Expenses will be higher or lower than the loss and loss adjustment reserve amount recorded by us.
Information Used in the Determination of the Loss and Loss Adjustment Expense Reserve
In order to estimate the provision for the recorded loss and loss adjustment expense reserves, we use information developed from both internal and independent external sources. This includes internal and external loss and claim count emergence patterns, pricing change information, internal and external loss and exposure trend information as well as underwriting process changes. In addition, we use commercially available risk analysis models, and overall market share assumptions to estimate our loss and loss adjustment expense reserves related to specific loss events.
Actuarial Methods Used in the Determination of the Loss and Loss Adjustment Expense Reserve
When the applicable information has been obtained, we use several actuarial methods to create estimates of the ultimate incurred in connection with the underwritten business. On a quarterly basis, actuaries perform an analysis of our loss development from the prior analysis and select the initial expected ultimate loss ratio by accident quarter. Our actuarial analysis uses inputs from our underwriting and claims departments, including premium pricing assumptions in addition to historical experience in estimating the initial expected loss ratio. The actuarial methods used to estimate loss and loss adjustment expense reserves are:
| • | Reported and/or Paid Loss and Claim Count Development Methods |
The Reported Loss Development method uses historical loss reporting patterns to estimate future loss reporting patterns. Our actuaries apply the selected loss reporting pattern to reported losses and allocated loss adjustment expenses as of a specific date to calculate expected ultimate losses. Paid and Claim Count Development Methods use similar methods but applied to Paid and Count development, respectively.
| • | Reported Bornhuetter-Ferguson Method; |
Under this method, ultimate losses and allocated loss adjustment expenses are estimated as the sum of cumulative reported losses and allocated loss adjustment expenses as of a specific date and estimated IBNR losses. Loss and Loss Adjustment Expense IBNR losses are estimated based on an initial expected loss ratio applied to earned premium and the historical development patterns of reported losses.
| • | Paid Bornhuetter-Ferguson Method: |
The Paid Bornhuetter-Ferguson method is similar to the Reported Bornhuetter-Ferguson method, except this method divides the projection of ultimate losses and allocated loss adjustment expenses into the portion that has already been paid, and the portion that has yet to be paid as of a specific date. The portion that has yet to be paid is estimated as the product of premium earned for the accident year, the initial expected ultimate loss ratio and an estimate of the percentage of ultimate losses and allocated loss adjustment expenses that are unpaid at the valuation date.
| • | Frequency Severity Method: |
Under this method the estimated ultimate number of claims is determined based on patterns of claims reporting. Ultimate severity is estimated based on historical reported and paid severities. Ultimate losses and allocated loss adjustment expenses are the product of ultimate claims and ultimate severity.
112
As appropriate, unallocated loss adjustment expenses are estimated using a Paid to Paid Method, whereby, historical paid unallocated loss adjustment expense is compared as a ratio to the paid loss and allocated loss adjustment expense amounts for the same calendar period. Based on this information, selected ratios are applied to the case reserve and estimated IBNR for loss and allocated loss adjustment expenses to estimate the provision for the unpaid unallocated loss adjustment expense.
Based on the methods used for each accident period, estimates of ultimate loss and allocated loss adjustment expenses are made. The Chief Executive Officer, President, Chief Insurance Strategy Officer and Chief Financial Officer, meet on a quarterly basis to review the recommendations made by the actuarial department, and use this framework to determine the best estimate to be recorded for the reserve for loss and loss adjustment expense reserves on the balance sheet.
Significant Assumptions Employed in the Recording of the Loss and Loss Adjustment Expense Reserve
The most significant assumptions used in the determination of the recorded reserve for Loss and Loss Adjustment Expenses as of December 31, 2020 are as follows:
| 1. | the information developed from internal and independent external sources such as cost trends, litigation and regulatory trends, legislative activity, climate change, social and economic patterns and claim assumptions are used to develop meaningful estimates of the likely future performance of business bound by the Company; |
| 2. | the estimates of the effective impact of rate changes which includes pricing changes and changes in the underlying amounts of total insured values; |
| 3. | our historical loss development and trend experience that is assumed to be indicative of future loss development and trends. |
The above assumptions most significantly influence our determination of initial expected loss ratios and expected loss reporting patterns that are the key inputs which impact potential variability in the estimate of the reserve for loss and loss adjustment expenses. While there can be no assurance that any of the above assumptions will prove to be correct, we believe that these assumptions represent a realistic and appropriate basis for estimating the reserve for loss and loss adjustment expense reserves.
Factors impacting variability in the Loss and Loss Adjustment Expense Reserve
The amount for Loss and Loss Adjustment Expense Reserve amounts is driven by a number of important assumptions, including litigation and regulatory trends, legislative activity, climate change, social and economic patterns and claims inflation assumptions. Changes in homeowners current year claim severity are generally influenced by inflation in the cost of building materials, the cost of construction and property repair services, the cost of replacing home furnishings and other contents, the types of claims that qualify for coverage, deductibles, other economic and environmental factors and the effectiveness and efficiency of our claim practices. We employ various loss management programs and partnerships to mitigate the effect of these factors.
Our estimates reflect current inflation in legal claims’ settlements and assume we will not be subject to losses from significant new legal liability theories. Our estimates also assume that we will not experience significant losses from mass torts and that we will not incur losses from future mass torts not known to us today. While it is not possible to predict the impact of changes in the litigation environment, if new mass torts or expanded legal theories of liability emerge, our cost of claims may differ substantially from our reserves. Our estimates assume that there will not be significant changes in the regulatory and legislative environment. The impact of potential changes in the regulatory or legislative environment is difficult to quantify in the absence of specific, significant new regulation or legislation. In the event of significant new regulation or legislation, we will attempt to quantify its impact on our business, but no assurance can be given that our attempt to quantify such inputs will be accurate or successful.
113
Although we believe that our provision for the Loss and Loss Adjustment Expense Reserve is reasonable, it is possible that our actual loss experience may not conform to our assumptions. Specifically, our actual ultimate loss ratio could differ from our initial expected loss ratio or our actual reporting and payment patterns could differ from our expected reporting and payment patterns, which are based on our own data and industry data. Accordingly, the ultimate settlement of losses and the related loss adjustment expenses may vary significantly from the estimates included in our financial statements. We regularly review our estimates and adjust them as necessary as experience develops or as new information becomes known to us. Such adjustments are included in current operations.
The following table summarizes gross and reserves net of reinsurance for unpaid loss and LAE as of December 31, 2020 (in millions):
| December 31, 2020 | ||||||||
| Gross | Net | |||||||
Loss and loss adjustment reserves | ||||||||
Total reserves | $ | 105.1 | $ | 13.0 | ||||
Sensitivity Analysis
The table below shows the impact of reasonably likely changes to our held estimates net of reinsurance on the Loss and Loss Adjustment Expense Reserve for the year ended December 31, 2020.
The following table illustrates the impact on the Loss and Loss Adjustment Expense Reserve of a 10% increase and decrease applied to the subject ultimate loss and loss adjustment expenses.
10% increase in ultimate loss and loss adjustment expenses, net | 10% decrease in ultimate loss and loss adjustment expenses, net | |||||||
($ in millions) | ||||||||
Impact on: | ||||||||
Loss and loss adjustment expense reserves, net | $ | 14.9 | $ | 4.7 | ||||
For additional information refer to Note 10, Loss and Loss Adjustment Expense Reserves, to the audited consolidated financial statements included elsewhere in this prospectus.
Reinsurance Recoverable
We also estimated the amount of amount recoverable from reinsurance contracts. Reinsurance assets include reinsurance recoverable on paid and unpaid Loss and Loss Adjustment Expense reserves that are estimated as part of our loss reserving process and, consequently, are subject to similar judgments and uncertainties. This estimate requires significant judgment for which key considerations include:
| • | paid and unpaid amounts recoverable; |
| • | any balances in dispute or subject to legal collection; |
| • | the financial wellbeing of a reinsurer (i.e. insolvent, liquidated, in receivership or otherwise subject to formal or informal regulatory restriction); |
| • | the likelihood of collection of the reinsurance recovery considering factors such as, amounts outstanding, length of collection periods, disputes, any collateral or letters of credit held and other relevant factors. |
114
For additional information refer to Note 11, Reinsurance, to the audited consolidated financial statements included elsewhere in this prospectus.
Recoverability of Our Net Deferred Tax Asset
The evaluation of the recoverability of our deferred tax asset and the need for a valuation allowance requires us to weigh all positive and negative evidence to reach a conclusion, that it is more likely than not, that all or some portion of the deferred tax asset will be realized. The weight given to the evidence is commensurate with the extent to which it can be objectively verified. The more negative evidence that exists, the more positive evidence is necessary and the more difficult it is to support a conclusion that a valuation allowance is not needed.
We consider a number of factors to reliably estimate future taxable income so we can determine the extent of our ability to realize NOLs, foreign tax credits, realized capital loss and other carryforwards. These factors include forecasts of future income for each of our businesses and actual and planned business and operational changes, both of which include assumptions about future macroeconomic and company-specific conditions and events. We subject the forecasts to stresses of key assumptions and evaluate the effect on tax attribute utilization.
As of December 31, 2020, we have U.S. federal and state net operating loss (“NOL”) carryforwards of $154.5 million and $41.5 million, respectively. We have $8.8 million of Dual Consolidating Losses in a 953(d) company, RH Solutions Insurance. The provisions of the Tax Cuts and Jobs Act of 2017 eliminated the
20-year
carryforward period so that federal NOLs generated in tax years after December 31, 2017 do not expire. For such amounts generated prior to 2018, the20-year
carryforward periods continue to apply. For additional information refer to Note 19, Income Taxes, to the audited consolidated financial statements included elsewhere in this prospectus.For additional information refer to Note 19, Income Taxes, to the audited consolidated financial statements included elsewhere in this prospectus.
Business Combinations
We account for business combinations, which requires, among other things, the acquiring entity in a business combination to recognize the fair value of all assets acquired and liabilities assumed; the recognition of acquisition-related costs in the consolidated statement of operations and comprehensive loss for which the acquirer becomes obligated after the acquisition date; and contingent purchase consideration to be recognized at their fair values on the acquisition date with subsequent adjustments recognized in the consolidated statement of operations and comprehensive loss. The excess of the purchase price over the fair value of the identified assets and liabilities is recorded as goodwill. Operating results of the acquired entity are reflected in our consolidated financial statements from date of acquisition.
We perform valuations of assets acquired and liabilities assumed for an acquisition and allocate the purchase price to its respective net tangible and intangible assets. Determining the fair value of assets acquired and liabilities assumed requires management to use significant judgement and estimates including the selection of valuation methodologies, estimates of future revenue, costs, and cash flows, discount rates and selection of comparable companies and comparable transactions. For material acquisitions, we engage the assistance of valuations specialists in concluding on fair value measurements of certain assets acquired or liabilities assumed in a business combination. During the measurement period, which is not to exceed one year from the acquisition date, we may record adjustments to the assets acquired and liabilities assumed, with corresponding offset to goodwill.
For additional information refer to Note 18, Acquisitions, to the audited consolidated financial statements included elsewhere in this prospectus.
115
Goodwill and Intangible Assets
Goodwill on our consolidated balance sheets represents the excess of purchase price over the fair value of net assets acquired from our acquisitions. Intangible assets other than goodwill have also been identified as part of our acquisitions when determining the fair value of assets acquired.
Intangible assets other than goodwill included in our Company’s Consolidated Balance Sheets primarily include assets related to customer relationships, the value of business acquired, developed technology and agency and carrier relationship. The valuation of these assets used valuation methods appropriate for determining the market value of each asset. These valuation methodologies use various assumptions which included discount rates, the cost of capital, and forecasting among others.
Goodwill is not amortized, but instead it is assessed for impairment at the reporting unit level on an annual basis or more frequently if indicators of impairment exist.
The goodwill impairment test is performed at the reporting unit level. We initially perform a qualitative analysis to determine if it is more likely than not that the goodwill balance is impaired. If a qualitative assessment is not performed or if a determination is made that it is not more likely than not that their value of the reporting unit exceeds its carrying amount, then we will perform a
two-step
quantitative analysis. First, the fair value of each reporting unit is compared to its carrying value. If the fair value of the reporting unit is less than its carrying value, we perform a hypothetical purchase price allocation based on the reporting unit’s fair value to determine the fair value of the reporting unit’s goodwill. Any resulting difference will be recorded as a charge to operations in the consolidated statements of operations and comprehensive loss in the period in which the determination is made.Intangible assets with a finite life are amortized over the estimated useful life while intangible assets with an indefinite useful life are not amortized. Finite-lived intangibles are reviewed for impairment when indicators of impairment are present and indefinite-lived intangibles are assessed for impairment on an annual basis or more frequently if indicators of impairment exist.
We evaluate the recoverability of intangible assets at least annually or whenever events or changes in circumstances indicate the carrying value of such asset may not be recoverable. Should there be an indication of impairment, we test for recoverability by comparing the estimated undiscounted future cash flows expected to result from the use of the asset to the carrying amount of the asset or asset group. If the asset or asset group is determined to be impaired, any excess of the carrying value of the asset or asset group over its estimated fair value is recognized as an impairment loss. As of December 31, 2020 neither the Company’s initial valuation nor its subsequent valuations have indicated any impairment of the Company’s goodwill and intangible assets.
For additional information, refer to Note 7, Intangible Assets and Note 8, Goodwill, in the audited consolidated financial statements included elsewhere in this prospectus.
Fair value of Common Stock
We have historically granted stock options at exercise prices equal to the fair value as approved by our Board of Directors on the date of grant. In the absence of a public trading market, management considered numerous objective and subjective factors to determine the fair value of our common stock as of the date of each stock option grant, including:
| • | relevant precedent transactions involving our capital stock; |
| • | the liquidation preferences, rights, preferences, and privileges of our redeemable convertible preferred stock relative to the common stock; |
| • | our actual operating and financial performance; |
116
| • | current business conditions and projections; |
| • | our stage of development; |
| • | the likelihood and timing of achieving a liquidity event for the shares of common stock underlying the stock options, such as an initial public offering, given prevailing market conditions; |
| • | any adjustment necessary to recognize a lack of marketability of the common stock underlying the granted options; |
| • | recent secondary stock sales and tender offers; |
| • | the market performance of comparable publicly traded companies; and |
| • | U.S. and global capital market conditions. |
In addition, our Board of Directors considered the independent valuations completed by a third-party valuation consultant and approved the fair value of common stock presented by the management. The valuations of our common stock were determined in accordance with the guidelines outlined in the American Institute of Certified Public Accountants Practice Aid, Valuation of Privately-Held-Company Equity Securities Issued as Compensation.
In determining the fair value of common stock, we established the enterprise value of our business using the market approach and the income approach. In the cases where a financing took place in close proximity to the Valuation Date, we estimated the enterprise value by reconciling to the most recent round of equity financing. Under the income approach, forecasted cash flows are discounted to the present value at a risk-adjusted discount rate. The valuation analyses determine discrete free cash flows over multiple years based on forecasted financial information provided by our management and a terminal value for the residual period beyond the discrete forecast. Projected cash flows are discounted based on the estimated weighted-average cost of capital in order to estimate the enterprise value. Under the market approach, a group of guideline publicly traded companies with similar financial and operating characteristics to Hippo are selected. Company-specific selected multiples were then ultimately applied to the Company’s historical and projected financial data and incorporated adjustments to reflect differences between the Company and the guideline companies with respect to expected growth, profitability, and business risk.
In allocating the equity value of our business among the various classes of equity securities prior to December 2020, the valuation utilized the option pricing model (“OPM”) method. The OPM analysis assumes that as the value of the Company increases, each equity holder benefits from certain value components. The analysis determined the ranges of equity values at which the various Company stakeholders receive value. The maximum values of these ranges, or “break points”, are based on the full liquidation preference amounts, the points at which option and warrant holders choose to exercise, and the points at which the preferred shareholders would be indifferent between converting their shares into common stock and retaining their preferred shares, Next, the Black-Scholes option pricing model isolated the value allocated to each “range”, calculated as the difference between the option values at each break point. Based on the Company’s capital structure, the analysis calculated the percentage of each range attributable to each share class. For each range, the value allocable to each share class was then calculated by multiplying the value of each range by each security’s respective ownership percentage of the range. For each security, the value derived from each range was summed in order to determine the aggregate value of each share class. The total value of each share class was divided by the security’s respective fully diluted shares outstanding, in order to calculate the per share value for each security on a marketable basis. Lastly, a discount for lack of marketability was applied to the common stock value to conclude on the value on a
non-marketable
basis. The exclusive reliance on the OPM until December 2020 was appropriate when the range of possible future outcomes was difficult to predict and resulted in a highly speculative forecast.117
Since December 2020, we used a hybrid method utilizing a combination of the OPM and the probability weighted expected return method (“PWERM”). The PWERM is a scenario-based methodology that estimates the fair value of common stock based upon an analysis of future values for Hippo, assuming various outcomes. The common stock value is based on the probability-weighted present value of expected future investment returns considering each of the possible outcomes available as well as the rights of each class of shares. The future value of the common stock under each outcome is discounted back to the valuation date at an appropriate risk-adjusted discount rate and probability weighted to arrive at an indication of value for the common stock. We considered two different scenarios: (a) a SPAC Scenario, and (b) a Remain Private Scenario. Under the hybrid/PWERM method, we used the OPM in the Remain Private scenario and the
if-converted method
under the SPAC scenario. Theif-converted method
presumes that all shares of our redeemable convertible preferred stock convert into our Common Stock based upon their conversion terms and differences in the rights and preferences of the share of our redeemable convertible preferred stock are ignored. The liquidation method presumes payment of proceeds in accordance with the liquidation terms of each class of stock, which was taken into consideration in the OPM under the Remain Private scenario.After the allocation to the various classes of equity securities, a discount for lack of marketability (“DLOM”) was applied to arrive at a fair value of common stock under each scenario. A DLOM was meant to account for the lack of marketability of a stock that was not publicly traded. In making the final determination of common stock value, consideration was also given to recent secondary transactions that took place involving the common stock (if applicable).
Application of these approaches and methodologies involves the use of estimates, judgments and assumptions that are highly complex and subjective, such as those regarding our expected future revenue, expenses and future cash flows, discount rates, market multiples, the selection of comparable public companies and the probability of and timing associated with possible future events. Changes in any or all of these estimates and assumptions or the relationships between those assumptions impact our valuations as of each valuation date and may have a material impact on the valuation of our common stock. Following the Business Combination, it is not necessary to determine the fair value of New Hippo Common Stock as the shares are traded in a public market.
For additional information refer to Note 17, Stockholders’ Deficit, in the audited consolidated financial statements included elsewhere in this prospectus.
Valuation of Embedded Derivatives
Our convertible promissory note contains features determined to be embedded derivatives from its host. Embedded derivatives are separated from the host contract and carried at fair value when the embedded derivative possesses economic characteristics that are not clearly and closely related to the economic characteristics of the host contract and a separate, standalone instrument with the same terms would qualify as a derivative instrument. The derivative is measured both initially and in subsequent periods at fair value, with changes in fair value recognized on the statement of operations and comprehensive loss.
Our valuation of embedded derivative liabilities has historically been measured using with or without approach. The key assumptions used for the valuation is estimation of the timing and probability of expected future events i.e. liquidity, financing, or maturity event.
For additional information refer to Note 12, Convertible Promissory Notes and Derivative Liability, in the audited consolidated financial statements included elsewhere in this prospectus.
118
Redeemable Convertible Preferred Stock Warrant Liability
Warrants to purchase shares of redeemable convertible preferred stock are classified as a liability as the underlying redeemable convertible preferred stock is considered redeemable and may require us to transfer assets upon exercise. The warrants are recorded at fair value upon issuance and are subject to remeasurement to fair value at each balance sheet date. Changes in the fair value of our redeemable convertible preferred stock warrant liability are recognized in our consolidated statements of operations and comprehensive loss. We will continue to adjust the liability for changes in fair value until the exercise or expiration of the warrants, conversion of our redeemable convertible preferred stock into our common stock or until the redeemable convertible preferred stock is otherwise no longer redeemable. At that time, the redeemable convertible preferred stock warrant liability will be reclassified to redeemable convertible preferred stock or additional
paid-in capital,
as applicable.For additional information refer to Note 16, Convertible Preferred Stock, in the audited consolidated financial statements included elsewhere in this prospectus.
Recent Accounting Pronouncements
See Note 1 to Hippo’s audited consolidated financial statements included elsewhere in this prospectus for recently adopted accounting pronouncements and recently issued accounting pronouncements not yet adopted as of the date of this prospectus.
Quantitative and Qualitative Disclosures About Market Risk
Market risk is the potential loss arising from adverse changes in market rates and prices, such as interest rates. We are primarily exposed to market risk through our fixed maturities investments. We invest our excess cash primarily in money market accounts, corporate and foreign securities, residential and commercial mortgage-backed securities, and other governmental related securities. Our current investment strategy seeks first to preserve principal, second to provide liquidity for our operating and capital needs and third to maximize yield without putting principal at risk. We do not enter into investments for trading or speculative purposes. Our investments are exposed to market risk due to the fluctuation of prevailing interest rates that may reduce the yield on our investments or their fair value. We assess market risk utilizing a sensitivity analysis that measures the potential change in fair values, interest income and cash flows. As our investment portfolio is primarily short-term in nature, management does not expect our results of operations or cash flows to be materially affected to any degree by a sudden change in market interest rates. In the unlikely event that we would need to sell our investments prior to their maturity, any unrealized gains and losses arising from the difference between the amortized cost and the fair value of the investments at that time would be recognized in the condensed consolidated statements of operations.
Emerging Growth Company Status
Section 102(b)(1) of the JOBS Act exempts emerging growth companies from being required to comply with new or revised financial accounting standards until private companies are required to comply with the new or revised financial accounting standards. The JOBS Act provides that a company can choose not to take advantage of the extended transition period and comply with the requirements that apply to
non-emerging
growth companies, and any such election to not take advantage of the extended transition period is irrevocable.The Company is an “emerging growth company” as defined in Section 2(a) of the Securities Act, and has elected to take advantage of the benefits of the extended transition period for new or revised financial accounting standards. Following the consummation of the Business Combination, Hippo Holdings will remain an emerging growth company until the earliest of (i) the last day of the fiscal year in which the market value of Hippo Holdings common stock that is held by
non-affiliates exceeds
$700 million as of the end of that year’s second fiscal quarter, (ii) the last day of the fiscal year in which Hippo Holdings has total annual gross revenue of119
$1.07 billion or more during such fiscal year (as indexed for inflation), (iii) the date on which Hippo Holdings has issued more than $1 billion in
non-convertible debt
in the prior three-year period or (iv) December 31, 2025, and Hippo Holdings expects to continue to take advantage of the benefits of the extended transition period, although it may decide to early adopt such new or revised accounting standards to the extent permitted by such standards. This may make it difficult or impossible to compare Hippo Holdings’ financial results with the financial results of another public company that is either not an emerging growth company or is an emerging growth company that has chosen not to take advantage of the extended transition period exemptions because of the potential differences in accounting standards used.120
MANAGEMENT OF HIPPO HOLDINGS FOLLOWING THE BUSINESS COMBINATION
The following sets forth certain information, as of June 30, 2021, concerning the persons who serve as directors and executive officers of Hippo Holdings following the consummation of the Business Combination.
Name | Age | Position(s) | ||
Executive Officers | ||||
Assaf Wand | 46 | Chief Executive Officer, Co-Founder and Director | ||
Richard McCathron | 50 | President and Director | ||
Stewart Ellis | 45 | Chief Financial Officer | ||
Ran Harpaz | 47 | Chief Technology Officer | ||
Simon Fleming-Wood | 52 | Chief Marketing Officer | ||
Aviad Pinkovezky | 40 | Chief Product Officer | ||
Non-Employee Directors | ||||
Amy Errett (3) | 63 | Director | ||
Eric Feder (2) | 51 | Director | ||
Lori Dickerson Fouché (3) | 51 | Director | ||
Hugh R. Frater (1) | 65 | Director | ||
Noah Knauf (1)(2) | 41 | Director | ||
Sam Landman (2)(3) | 41 | Director | ||
Sandra Wijnberg (3) | 64 | Director |
| (1) | Member of the audit, risk and compliance committee (the “Audit Committee”). |
| (2) | Member of the compensation committee. |
| (3) | Member of the nominating and corporate governance committee. |
Executive Officers
Assaf Wand
co-founder
of Old Hippo and served as a member of Old Hippo’s board of directors and as Old Hippo’s Chief Executive Officer from October 2015 to August 2021. Prior to Hippo, Mr. Wand was the founder and Chief Executive Officer of Sabi Inc., a consumer goods company, from May 2009 to October 2015. Mr. Wand also served as a consultant with McKinsey & Company from August 2005 to December 2006. Mr. Wand holds an MBA from the University of Chicago Booth School of Business and a dual degree from the Interdisciplinary Center Herzliya in Israel for a B.A. in finance and an LL.B in law.Richard McCathron
Stewart Ellis
121
Ran Harpaz
Tel-Aviv
University.Simon Fleming-Wood
Aviad Pinkovezky
Directors
Amy Errett
Eric Feder
.
Lori Dickerson Fouché
Hugh R. Frater
non-executive
chairman of the board of VEREIT, Inc. He previously led Berkadia Commercial Mortgage LLC, a national commercial real estate company providing comprehensive capital solutions and investment sales advisory and research services for multifamily and commercial properties. He served as chairman of Berkadia from April 2014 to December 2015, and he served as chief executive officer of Berkadia from 2010 to April 2014. Earlier in his career, Mr. Frater was an executive vice president at PNC Financial Services, where he led the real estate division, and was a founding partner and managing director of BlackRock, Inc. Mr. Frater holds an MBA from Columbia Business School and a bachelor’s degree from Dartmouth College.122
Noah Knauf
co-led
Kleiner Perkins’ Digital Growth Fund team, which became BOND in 2019. At Kleiner Perkins, he invested in a range of innovative companiesco-lead
the three Digital Growth Funds totaling $2.8 billion of committed capital. Before joining Kleiner Perkins, Mr. Knauf served as Managing Director at private equity firm Warburg Pincus where he contributed to almost twenty investments in growth companies over nine years from June 2006 to June 2016. Prior to joining Warburg Pincus, Mr. Knauf worked as an investment professional at Parthenon Capital from February 2003 to August 2005 and asSam Landman
Sandra Wijnberg
Classified Board of Directors
The Certificate of Incorporation provides that the board of directors shall be divided into three classes of directors, with the classes to be as nearly equal in number as possible, and with each director serving a three-year term. As a result, approximately
one-third
of the board of directors will be elected each year. The classification of directors has the effect of making it more difficult for stockholders to change the composition of the board of directors. Our directors are divided among the three classes as follows:| • | the Class I directors are Eric Feder, Noah Knauf and Sam Landman, and their terms will expire at our 2022 annual meeting of stockholders; |
| • | the Class II directors are Richard McCathron, Lori Dickerson Fouché and Hugh R. Frater, and their terms will expire at our 2023 annual meeting of stockholders; and |
| • | the Class III directors are Assaf Wand, Sandra Wijnberg and Amy Errett, and their terms will expire at the 2024 annual meeting of stockholders. |
123
Corporate Governance
Composition of the Board of Directors
When considering whether directors and director nominees have the experience, qualifications, attributes and skills, taken as a whole, to enable Hippo Holdings’ board of directors to satisfy its oversight responsibilities effectively in light of its business and structure, the board of directors expects to focus primarily on each person’s background and experience as reflected in the information discussed in each of the directors’ individual biographies set forth above in order to provide an appropriate mix of experience and skills relevant to the size and nature of its business.
Director Independence
Hippo Holdings is required to comply with the rules of the NYSE in determining whether a director is independent. Prior to the completion of this Business Combination, the parties undertook a review of the independence of the individuals named above and determined that each of Amy Errett, Eric Feder, Hugh R. Frater, Noah Knauf, Sam Landman, Sandra Wijnberg and Lori Dickerson Fouché qualifies as “independent” as defined under the applicable NYSE rules.
Committees of the Board of Directors
Hippo Holdings’ board of directors direct the management of its business and affairs, as provided by Delaware law, and conducts its business through meetings of the board of directors and standing committees. Hippo Holdings has a standing Audit Committee, compensation committee and nominating and corporate governance committee, each of which operates under a written charter.
In addition, from time to time, special committees may be established under the direction of the board of directors when the board deems it necessary or advisable to address specific issues. Current copies of Hippo Holdings’ committee charters are posted on its website at investors.hippo.com/governance/governance-documents, as required by applicable SEC and NYSE rules. The information on or available through any of such website is not deemed incorporated in this prospectus and does not form part of this prospectus.
Audit, Risk and Compliance Committee
Hippo Holdings’ Audit Committee consists of Sandra Wijnberg, Hugh Frater and Noah Knauf, with Sandra Wijnberg serving as the chair of the committee. Hippo Holdings’ board of directors has determined that each of these individuals meets the independence requirements of the Sarbanes-Oxley Act of 2002, as amended, or the Sarbanes-Oxley Act, Rule
10A-3
under the Exchange Act and the applicable listing standards of NYSE. Each member of Hippo Holdings’ Audit Committee can read and understand fundamental financial statements in accordance with NYSE audit committee requirements. In arriving at this determination, the board has examined each Audit Committee member’s scope of experience and the nature of their prior and/or current employment.Hippo Holdings’ board of directors has determined that Sandra Wijnberg qualifies as an audit committee financial expert within the meaning of SEC regulations and meets the financial sophistication requirements of the NYSE rules. In making this determination, Hippo Holdings’ board has considered Sandra Wijnberg’s formal education and previous and current experience in financial and accounting roles. Both Hippo Holdings’ independent registered public accounting firm and management periodically will meet privately with Hippo Holdings’ Audit Committee.
The Audit Committee’s responsibilities will include, among other things:
| • | appointing, compensating, retaining, evaluating, terminating and overseeing Hippo Holdings’ independent registered public accounting firm; |
124
| • | discussing with Hippo Holdings’ independent registered public accounting firm their independence from management; |
| • | reviewing with Hippo Holdings’ independent registered public accounting firm the scope and results of their audit; |
| • | pre-approving all audit and permissiblenon-audit services to be performed by Hippo Holdings’ independent registered public accounting firm; |
| • | setting clear hiring policies for employees or former employees of Hippo Holdings’ independent registered public accounting firm; |
| • | overseeing the financial reporting process and discussing with management and Hippo Holdings’ independent registered public accounting firm the interim and annual financial statements that Hippo Holdings files with the SEC; |
| • | overseeing Hippo Holdings’ internal audit process and function; |
| • | overseeing Hippo Holdings’ risk assessment and risk management, including with respect to the underwriting and pricing of insurable risks, the settlement of claims, the appropriate levels of retained risk and other insurance-related matters; |
| • | establishing procedures for the receipt, retention and treatment of complaints received by Hippo Holdings regarding accounting, internal accounting controls or auditing matters; |
| • | reporting regularly to the Hippo Holdings board of directors regarding the activities of the Audit Committee; |
| • | reviewing and monitoring Hippo Holdings’ earnings releases, accounting principles, accounting policies, financial and accounting controls and compliance with legal and regulatory requirements; and |
| • | periodically reviewing and reassessing the Audit Committee Charter. |
Compensation Committee
Hippo Holdings’ compensation committee consists of Noah Knauf, Sam Landman and Eric Feder, with Noah Knauf serving as the chair of the committee. Noah Knauf, Eric Feder and Sam Landman are
non-employee
directors, as defined in Rule16b-3
promulgated under the Exchange Act. Hippo Holdings’ board of directors has determined that each of Mr. Knauf, Mr. Feder and Mr. Landman are “independent” as defined under the applicable NYSE listing standards, including the standards specific to members of a compensation committee. The compensation committee’s responsibilities include, among other things:| • | reviewing and approving corporate goals and objectives relevant to the compensation of Hippo Holdings’ Chief Executive Officer, evaluating the performance of Hippo Holdings’ Chief Executive Officer in light of these goals and objectives and setting or making recommendations to Hippo Holdings’ board of directors regarding the compensation of Hippo Holdings’ Chief Executive Officer; |
| • | reviewing and setting or making recommendations to Hippo Holdings’ board of directors regarding the compensation of Hippo Holdings’ other executive officers; |
| • | making recommendations to Hippo Holdings’ board of directors regarding the compensation of Hippo Holdings’ directors; |
| • | reviewing and approving or making recommendations to Hippo Holdings’ board of directors regarding Hippo Holdings’ incentive compensation and equity-based plans and arrangements; and |
| • | appointing and overseeing any compensation consultants. We believe that the composition and functioning of Hippo Holdings’ compensation committee meets the requirements for independence under the current NYSE listing standards. |
125
Nominating and Corporate Governance Committee
Hippo Holdings’ nominating and corporate governance committee consists of Lori Dickerson Fouché, Amy Errett, Sandra Wijnberg and Sam Landman. Hippo Holdings’ board of directors has determined that each of these individuals is “independent” as defined under the applicable listing standards of NYSE and SEC rules and regulations.
The nominating and corporate governance committee’s responsibilities include, among other things:
| • | identifying individuals qualified to become members of Hippo Holdings’ board of directors, consistent with criteria approved by Hippo Holdings’ board of directors; |
| • | recommending to Hippo Holdings’ board of directors the nominees for election to Hippo Holdings’ board of directors at annual meetings of Hippo Holdings’ stockholders; |
| • | overseeing an evaluation of Hippo Holdings’ board of directors and its committees; and |
| • | developing and recommending to Hippo Holdings’ board of directors a set of corporate governance guidelines. We believe that the composition and functioning of Hippo Holdings’ nominating and corporate governance committee meets the requirements for independence under the current NYSE listing standards. |
Hippo Holdings’ board of directors may from time to time establish other committees.
Risk Oversight
The board of directors is responsible for overseeing our risk management process. The board of directors focuses on our general risk management strategy, the most significant risks facing us, and oversees the implementation of risk mitigation strategies by management. Our Audit Committee is also responsible for reviewing and discussing with management our insurance-related and enterprise risk assessment and risk management, as set forth in the audit committee charter.
Code of Ethics
Hippo Holdings has a code of ethics that applies to all of its executive officers, directors and employees, including its principal executive officer, principal financial officer, principal accounting officer or controller or persons performing similar functions. The code of ethics is available on Hippo Holdings’ website, https://investors.hippo.com/home. Hippo Holdings intends to make any legally required disclosures regarding amendments to, or waivers of, provisions of its code of ethics on its website rather than by filing a Current Report on Form
8-K.
Compensation Committee Interlocks and Insider Participation
None of Hippo Holdings’ executive officers currently serves, or has served during the last year, as a member of the board of directors or compensation committee of any entity, other than Old Hippo, that has one or more executive officers serving as a member of Hippo Holdings’ board of directors.
126
EXECUTIVE COMPENSATION
This section discusses the material components of the executive compensation program for Old Hippo’s 2020 named executive officers (“NEOs”). Old Hippo’s NEOs for fiscal year 2020 are:
| • | Assaf Wand, Hippo’s Chief Executive Officer; |
| • | Richard McCathron, Hippo’s President; and |
| • | Simon Fleming-Wood, Hippo’s Chief Marketing Officer. |
This discussion may contain forward-looking statements that are based on our current plans, considerations, expectations and determinations regarding future compensation programs. Actual compensation programs that Hippo adopts following the Closing may differ materially from the currently planned programs summarized in this discussion. As an “emerging growth company” as defined in the JOBS Act, Hippo Holdings is not required to include a Compensation Discussion and Analysis section and have elected to comply with the scaled disclosure requirements applicable to emerging growth companies.
2020 Summary Compensation Table
The following table sets forth information concerning the compensation of the NEOs for the year ended December 31, 2020.
Name and Principal Position | Year | Salary ($) | Option Awards ($) (1) | All Other Compensation ($) (2) | Total ($) | |||||||||||||||
Assaf Wand | 2020 | 258,333 | — | — | 258,3333 | |||||||||||||||
Chief Executive Officer | ||||||||||||||||||||
Richard McCathron | 2020 | 300,000 | 1,369,065 | 31,222 | 1,700,287 | |||||||||||||||
President | ||||||||||||||||||||
Simon Fleming-Wood | 2020 | 64,962 | 2,319,000 | — | 2,383,692 | |||||||||||||||
Chief Marketing Officer | ||||||||||||||||||||
| (1) | Amounts reported represent the aggregate grant date fair value of stock options granted to the NEOs during 2020 computed in accordance with FASB ASC Topic 718. Assumptions used in the calculation of this amount are included in Note 17 to the audited consolidated financial statements included in this prospectus. |
| (2) | Amounts reported represents travel and lodging expenses in connection with Mr. McCathron’s travel from his home office in Austin, Texas to Hippo’s offices in the Bay Area, California. |
Narrative to the Summary Compensation Table
2020 Annual Base Salary
Old Hippo paid the NEOs a base salary to compensate them for services rendered to Old Hippo. The base salary payable to the NEOs is intended to provide a fixed component of compensation reflecting the executive’s skill set, experience, role and responsibilities. For fiscal year 2020, the NEOs’ annual base salaries were as follows: Mr. Wand: $258,333; Mr. McCathron: $300,000; and Mr. Fleming-Wood $350,000.
Equity Compensation
Old Hippo granted stock options to its employees, including the NEOs, in order to attract and retain them, as well as to align their interests with the interests of Old Hippo’s stockholders. In order to provide a long-term incentive, these stock options generally vest over four years subject to continued service. Old Hippo did not grant any equity awards to Mr. Wand in 2020.
127
In September 2020, Old Hippo granted Mr. McCathron an option to purchase 100,000 shares of Old Hippo common stock for an exercise per share of $7.36, which was the fair market value of Old Hippo’s common stock on the date of grant, as determined by its board of directors. The option vests as to 1/48th of the original number of underlying shares on each monthly anniversary of September 28, 2020, subject to his continued service with Hippo Holdings through the applicable vesting date. In addition, in December 2020, Old Hippo granted Mr. McCathron an option to purchase 150,000 shares of Old Hippo common stock for an exercise per share of $7.36, which was the fair market value of Old Hippo’s common stock on the date of grant, as determined by its board of directors. The option was early exercisable for restricted stock, with a right of repurchase in favor of Old Hippo and Mr. McCathron early exercised the option in full in December 2020. The restricted shares issued upon early exercise of the option vest as to 1/48th of the shares on each monthly anniversary of December 1, 2020, subject to his continued service with Hippo Holdings through the applicable vesting date.
In December 2020, Old Hippo granted Mr. Fleming-Wood an option to purchase 300,000 shares of Old Hippo common stock for an exercise per share of $7.36, which was the fair market value of Old Hippo’s common stock on the date of grant, as determined by its board of directors. 25% of the shares subject to the option vest on the first anniversary of October 26, 2020, and 1/16th of the shares subject to the option vest quarterly thereafter, subject to continued service with Hippo through the applicable vesting date. If Mr. Fleming-Wood’s employment with Hippo Holdings is terminated without cause or he resigns for good reason in connection with a change in control, 100% of the shares subject to the option will vest and become exercisable on the date of termination.
In connection with the Business Combination, Hippo Holdings adopted the Incentive Award Plan in order to facilitate the grant of cash and equity incentives to directors, employees (including the NEOs) and consultants of Hippo Holdings and certain of its affiliates and to enable Hippo Holdings to obtain and retain services of these individuals, which is essential to Hippo Holdings’ long-term success. The Incentive Award Plan became effective on the day immediately prior to the Closing. For additional information about the Incentive Award Plan, please see the section titled “” below.
Equity Incentive Plans
Other Elements of Compensation
Retirement Savings and Health and Welfare Benefits
Hippo Holdings maintains a 401(k) retirement savings plan for Hippo Holdings employees, including the NEOs, who satisfy certain eligibility requirements. The NEOs are eligible to participate in the 401(k) plan on the same terms as other full-time employees. Hippo Holdings believes that providing a vehicle for
tax-deferred
retirement savings though our 401(k) plan adds to the overall desirability of its executive compensation package and further incentivizes its employees, including the NEOs, in accordance with its compensation policies.All of Hippo Holdings’ full-time employees, including the NEOs, are eligible to participate in Hippo Holdings’ health and welfare plans. These health and welfare plans include medical, dental and vision benefits; short-term and long-term disability insurance; and supplemental life and AD&D insurance.
Perquisites and Other Personal Benefits
Hippo Holdings determines perquisites on abasis and will provide a perquisite to a NEO when it believes it is necessary to attract or retain the NEO. In 2020, Old Hippo provided Mr. McCathron travel and lodging expenses related to his travel to Old Hippo’s company offices in Palo Alto, California.
case-by-case
128
Outstanding Equity Awards at Fiscal
Year-End
The following table summarizes the number of shares of Old Hippo common stock underlying outstanding option awards for our named executive officer as of December 31, 2020, which have not been adjusted to reflect any adjustment in contemplation of the transaction.
Option awards | Stock awards | |||||||||||||||||||||||||||
Name | Vesting commencement date | Number of securities underlying unexercised options (#) exercisable | Number of securities underlying unexercised options (#) unexercisable | Option exercise price ($) | Option expiration date | Number of shares that have not vested (#) | Market value of shares that have not vested ($) (7) | |||||||||||||||||||||
Assaf Wand | 10/15/2019 | (1) | 329,273 | 989,172 | 5.60 | 10/14/2029 | — | — | ||||||||||||||||||||
| 01/23/2019 | (2) | 256,819 | 19,266,561 | |||||||||||||||||||||||||
Richard McCathron | 12/01/2020 | (3) | 150,000 | 10,497,000 | ||||||||||||||||||||||||
| 08/27/2020 | (4) | 8,333 | 91,667 | 7.36 | 09/27/2030 | |||||||||||||||||||||||
| 05/13/2019 | (4) | 49,479 | 75,521 | 2.32 | 05/12/2029 | — | — | |||||||||||||||||||||
| 01/23/2019 | (4) | 37,500 | 52,084 | 2.32 | 01/22/2029 | |||||||||||||||||||||||
| 01/23/2018 | (5) | 31,086 | 23,438 | 1.09 | 01/23/2028 | |||||||||||||||||||||||
| 02/06/2017 | (1) | 75,000 | 12,500 | 0.30 | 02/28/2027 | |||||||||||||||||||||||
Simon Fleming-Wood | 10/26/2020 | (6) | 300,000 | — | 7.36 | 12/03/2030 | — | — | ||||||||||||||||||||
| (1) | 25% of the shares subject to the option vest on the first anniversary of the vesting commencement date, and 1/16th of the shares subject to the option vest on each quarterly anniversary thereafter, subject to continued service with Hippo Holdings through the applicable vesting date. If the NEO’s employment with Hippo Holdings is terminated without cause or the NEO’s employment is constructively terminated in connection with a change of control, 50% of the shares subject to the option will vest and become exercisable on the date of termination. |
| (2) | Mr. Wand purchased 493,091 shares upon early exercise of his option prior to vesting. The unvested shares are subject to repurchase by Hippo Holdings at the original exercise price of $2.32 per share upon a termination of Mr. Wand’s service. The shares vest as to 1/48th of the shares on each monthly anniversary of the vesting commencement date, subject to continued service with Hippo Holdings through the applicable vesting date. Notwithstanding the foregoing, 100% of the unvested shares will vest upon a change in control. |
| (3) | Mr. McCathron purchased 150,000 shares upon early exercise of an option prior to vesting. The unvested shares are subject to repurchase by Hippo Holdings at the original exercise price of $7.36 per share upon a termination of Mr. McCathron’s service. The shares vest as to 1/48th of the shares vest on each monthly anniversary of the vesting commencement date, subject to continued service with Hippo Holdings through the applicable vesting date. |
| (4) | 1/48th of the shares subject to the option vest on each monthly anniversary of the vesting commencement date, subject to continued service with Hippo Holdings through the applicable vesting date. |
| (5) | 1/16th of the shares subject to the option vest on each quarterly anniversary of the vesting commencement date, subject to continued service with Hippo Holdings through the applicable vesting date. |
| (6) | 25% of the shares subject to the option vest on the first anniversary of the vesting commencement date, and 1/16th of the shares subject to the option vest quarterly thereafter, subject to continued service with us through the applicable vesting date. If the NEO’s employment with Hippo Holdings is terminated without cause or the NEO’s employment is constructively terminated in connection with a change in control, 100% of the shares subject to the option will vest and become exercisable on the date of termination. |
| (7) | Amount calculated by subtracting the amount paid for the shares from $77.34 per share, which was determined by multiplying the closing trading price of the RTPZ Class A ordinary shares on January 11, 2021, $11.50, times 6.72479, which is the currently assumed exchange ratio for the transaction. RTPZ Class A ordinary shares did not start trading until such date, which is the closest date to December 31, 2020. |
129
Executive Compensation Arrangements
Employment and Offer Letter Agreements
Old Hippo previously entered into an employment offer letter agreement with Hippo Holdings’ NEOs that sets forth the terms and conditions of their respective employment, including initial base salary, employee benefits eligibility and entry into a
non-disclosure,
invention assignment andnon-solicitation
agreement.Mr. Wand’s offer letter does not provide for severance or other payments in connection with a termination of employment or change in control of Hippo Holdings.
Mr. McCathron’s offer letter provides that 50% of the shares subject to the option granted to him in March 2017 will vest if both (i) control of the Hippo Holdings is transferred in a transaction for cash or liquid securities, and (ii) his employment is constructively terminated or terminated without cause within 12 months thereafter.
Mr. Fleming-Wood’s offer letter provides that 100% of the shares subject to option granted to him in December 2020 will vest if both (i) control of the Hippo Holdings is transferred in a transaction for cash or liquid securities, and (ii) his employment is constructively terminated or terminated without cause within 12 months thereafter.
Business Combination-Related Payments
This section sets forth the information required by Item 402(t) of Regulation
S-K
regarding payments made to certain NEOs (some of which will not be treated as compensatory payments to the NEOs), but that are based on or otherwise relate to the Business Combination and that have or may become payable to the NEOs at the completion of the Business Combination. Mr. Fleming-Wood is not entitled to any payment in connection with the Business Combination that would require disclosure by Item 402(t) ofRegulation S-K.
The table below assumes that (i) the Effective Time occurs on March 3, 2021; (ii) the Business Combination did not trigger accelerated vesting of equity grants as the Business Combination will not constitute a “change in control” for purposes of the NEO’s equity grants; (iii) no NEO received any additional equity grants on or prior to the Effective Time that will vest on or prior to the Effective Time; and (iv) no NEO entered into a new agreement or is otherwise legally entitled to, prior to the Effective Time, additional compensation or benefits.
Business Combination Related Payments Table
Name | Cash ($) | Equity ($) (1) | Perquisites/ Benefits ($) (2) | Total ($) | ||||||||||||
Assaf Wand | — | 30,000,000 | 1,192,298 | 31,192,298 | ||||||||||||
Richard McCathron | — | 5,000,000 | — | 5,000,000 | ||||||||||||
Simon Fleming-Wood | — | — | — | — | ||||||||||||
| (1) | The amounts represent the aggregate dollar value payable to the NEOs related to the number of shares of Hippo Holdings common stock Hippo Holdings redeemed upon the consummation of the Business Combination, at a purchase price of $10.00 per share, from each of the following NEOs: 3,000,000 shares from Mr. Wand and 500,000 shares from Mr. McCathron. These payments are not compensatory in nature to the NEOs and will not be treated as compensation to the NEOs. |
| (2) | The amount for Mr. Wand represents the aggregate dollar value of the forgiveness of Mr. Wand’s loan extended pursuant to that certain Secured Partial Recourse Promissory Note and Stock Pledge Agreement by and between Hippo and Mr. Wand and all interest accrued thereon has been forgiven upon the consummation of the Business Combination. |
130
Director Compensation
Old Hippo did not historically maintain a formal
non-employee
director compensation program but made stock and option grants tonon-employee
directors when determined appropriate. In fiscal year 2020, no director received cash for their services on the Old Hippo board. However, in September 2020, Old Hippo granted Ms. Wijnberg an option to purchase 35,000 shares of Hippo common stock. Ms. Wijnberg’s option vests as to 1/12th
of the shares on each quarterly anniversary of September 28, 2020, subject to her continued service through the applicable vesting date.Messrs. Wand and McCathron did not receive additional compensation for their service as directors, and the compensation provided to them as employees is set forth in the Summary Compensation Table above.
2020 Director Compensation Table
The following table sets forth all of the compensation awarded to, earned by or paid to our
non-employee
directors during 2020.Name | Fees Earned or Paid in Cash ($) | Option Awards ($) (1) | All Other Compensation ($) | Total ($) | ||||||||||||
Sandra Wijnberg | — | 73,121 | — | 73,121 | ||||||||||||
All Other Non-Employee Directors(2) | — | — | — | — | ||||||||||||
| (1) | Amounts reported represent the aggregate fair value of options granted to Ms. Wijnberg computed in accordance with FASB ASC Topic 718 in fiscal year 2020. Assumptions used in the calculation of these amounts are included in Note 17 to our audited consolidated financial statements included in this prospectus. As of December 31, 2020, Ms. Wijnberg held an aggregate of options to purchase 35,000 shares Hippo common stock. No options or other equity awards were held by our other non-employee directors as of December 31, 2020. |
| (2) | All Other Non-Employee Directors include Eric Feder, Sam Landman, Hugh Frater, Lori Dickerson Fouche, Amy Errett and Noah Knauf. |
In connection with the Closing, Hippo Holdings adopted a
Non-Employee
Director Compensation Program. Pursuant to theNon-Employee
Director Compensation Program, ournon-employee
directors will receive cash compensation as follows:| • | Each non-employee director will receive an annual cash retainer in the amount of $35,000 per year. Thenon-executive chairperson of the board will receive an additional annual cash compensation in the amount of $22,500 per year for such chairperson’s service on the board. |
| • | The chairperson of the audit committee will receive additional annual cash compensation in the amount of $20,000 per year for such chairperson’s service on the audit committee. Each non-chairperson member of the audit committee will receive additional annual cash compensation in the amount of $10,000 per year for such member’s service on the audit committee. |
| • | The chairperson of the compensation committee will receive additional annual cash compensation in the amount of $12,000 per year for such chairperson’s service on the compensation committee. Each non-chairperson member of the compensation committee will receive additional annual cash compensation in the amount of $6,000 per year for such member’s service on the compensation committee. |
| • | The chairperson of the nominating and corporate governance committee will receive additional annual cash compensation in the amount of $8,000 per year for such chairperson’s service on the nominating and corporate governance committee. Each non-chairperson member of the nominating and corporate governance committee will receive additional annual cash compensation in the amount of $4,000 per year for such member’s service on the nominating and corporate governance committee. |
131
Under the
Non-Employee
Director Compensation Program, eachnon-employee
director will automatically be granted that number of RSUs calculated by dividing (i) $300,000 by (ii) the grant date value upon the director’s initial appointment or election to our board of directors, referred to as the Initial Grant, and that number of RSUs calculated by dividing (i) $150,000 by (ii) the grant date value automatically on the date of each annual stockholder’s meeting thereafter, referred to as the Annual Grant. Eachnon-employee
director who was elected to the board within one year of the date hereof will, subject to the registration of the common stock on a FormS-8,
be granted an Initial Grant automatically on the date following the date on which the registration of the common stock on a FormS-8
becomes effective, subject to the director’s continued service through the date of grant. The Initial Grant will vest as toone-third
of the RSUs on each anniversary of the date of grant (or for Initial Grants made effective upon the FormS-8,
the date when the director commences services on the board), subject to continued service through each applicable vesting date. The Annual Grant will vest in full on the earlier of (i) the first anniversary of the date of grant and (ii) immediately prior to the next annual stockholder’s meeting following the date of grant, subject to continued service through each applicable vesting date. All equity awards held by a director will vest in full upon the consummation of a Change in Control (as defined in the 2021 Plan).2021 Incentive Award Plan
The Incentive Award Plan
The principal purpose of the Incentive Award Plan is to attract, retain and motivate selected employees, consultants and directors through the granting of stock-based compensation awards and cash-based performance bonus awards. Equity awards and equity-linked compensatory opportunities are intended to motivate high levels of performance and align the interests of directors, employees and consultants with those of our stockholders by giving directors, employees and consultants the perspective of an owner with an equity or equity-linked stake in our company and providing a means of recognizing their contributions to our success. The Hippo Holdings board of directors believes that equity awards are necessary for Hippo Holdings to remain competitive in its industry and are essential to recruiting and retaining highly qualified employees.
Summary of the Incentive Award Plan
This section summarizes certain principal features of the Incentive Award Plan. The summary is qualified in its entirety by reference to the complete text of the Incentive Award Plan, which is filed herewith.
Eligibility and Administration
Options, restricted stock units and other stock-based and cash-based awards under the Incentive Award Plan may be granted to individuals who are then our officers, employees or consultants or are the officers, employees or consultants of certain of our subsidiaries. Such awards also may be granted to our directors. Only employees of our company or certain of our subsidiaries may be granted incentive stock options (“ISOs”). Hippo Holdings is expected to have approximately employees, consultants
and non-employee directors
who will be eligible to receive awards under the Incentive Award Plan.The compensation committee of our board of directors is expected to administer the Incentive Award Plan unless our board of directors assumes authority for administration. The compensation committee must consist of at least three members of our board of directors, each of whom is intended to qualify as
a “non-employee director”
for purposes ofRule 16b-3 under
the Exchange Act and an “independent director” within the meaning of the rules of the applicable stock exchange, or other principal securities market on which shares of our common stock are traded. The Incentive Award Plan provides that the board or compensation committee may delegate its authority to grant awards to employees other than executive officers and certain senior executives of the company to a committee consisting of one or more members of our board of directors or one or more of our officers, other than awards made toour non-employee directors,
which must be approved by our full board of directors.132
Subject to the terms and conditions of the Incentive Award Plan, the administrator has the authority to select the persons to whom awards are to be made, to determine the number of shares to be subject to awards and the terms and conditions of awards, and to make all other determinations and to take all other actions necessary or advisable for the administration of the Incentive Award Plan. The administrator is also authorized to adopt, amend or rescind rules relating to administration of the Incentive Award Plan. Our board of directors may at any time remove the compensation committee as the administrator and revest in itself the authority to administer the Incentive Award Plan. The full board of directors will administer the Incentive Award Plan with respect to awards
to non-employee directors.
Shares Available for Awards
Under the Incentive Award Plan, 78,000,000 shares of our common stock will be initially reserved for issuance pursuant to a variety of stock-based compensation awards, including stock options, stock appreciation rights (“SARs”) restricted stock awards, restricted stock unit awards, performance bonus awards, performance stock unit awards, dividend equivalents, or other stock or cash based awards. The number of shares of common stock initially reserved for issuance or transfer pursuant to awards under the Incentive Award Plan will be increased by (i) the number of shares of common stock represented by awards outstanding under the Hippo Enterprises Inc. 2019 Stock Option and Grant Plan (which amended and restated in its entirety the Hippo Analytics Inc. 2016 Stock Option and Grant Plan), that become available for issuance under the counting provisions described below following the effective date and (ii) an annual increase on the first day of each fiscal year beginning in 2022 and ending in 2031, equal to the lesser of (A) 5% of the shares of common stock outstanding (on an as converted basis) on the last day of the immediately preceding fiscal year and (B) such smaller number of shares of common stock as determined by our board of directors; provided, however, that no more than 503,750,000 shares of common stock may be issued upon the exercise of incentive stock options.
The following counting provisions will be in effect for the share reserve under the Incentive Award Plan:
| • | to the extent that an award terminates, expires or lapses for any reason or an award is settled in cash without the delivery of shares, any shares subject to the award at such time will be available for future grants under the Incentive Award Plan; |
| • | to the extent shares are tendered or withheld to satisfy the grant, exercise price or tax withholding obligation with respect to any award under the Incentive Award Plan, such tendered or withheld shares will be available for future grants under the Incentive Award Plan; |
| • | to the extent shares subject to stock appreciation rights are not issued in connection with the stock settlement of stock appreciation rights on exercise thereof, such shares will be available for future grants under the Incentive Award Plan; |
| • | the payment of dividend equivalents in cash in conjunction with any outstanding awards will not be counted against the shares available for issuance under the Incentive Award Plan; and |
| • | to the extent permitted by applicable law or any exchange rule, shares issued in assumption of, or in substitution for, any outstanding awards of any entity acquired in any form of combination by us or any of our subsidiaries will not be counted against the shares available for issuance under the Incentive Award Plan. |
The Incentive Award Plan also provides that the sum of the grant date fair value of all equity-based awards and the maximum that may become payable pursuant to a cash-based award to any individual first year of services as
a non-employee director
during any calendar year may not exceed $1,000,000 and $750,000 for each year thereafter.Types of Awards
The Incentive Award Plan provides that the administrator may grant or issue stock options, SARs, restricted stock, restricted stock units, performance bonus awards, performance stock units, other stock- or cash-based
133
awards and dividend equivalents, or any combination thereof. Each award will be set forth in a separate agreement with the person receiving the award and will indicate the type, terms and conditions of the award.
| • | Nonstatutory Stock Options |
| • | Incentive Stock Options |
| • | Restricted Stock |
| • | Restricted Stock Units |
| • | Stock Appreciation Rights |
| • | Performance Bonus Awards and Performance Stock Units |
| • | Other Stock or Cash Based Awards |
134
awards, which may include vesting conditions based on continued service, performance and/or other conditions. |
| • | Dividend Equivalents |
Any award may be granted as a performance award, meaning that the award will be subject to vesting and/or payment based on the attainment of specified performance goals.
Certain Transactions
In the event of any stock dividend or other distribution, stock split, reverse stock split, reorganization, combination or exchange of shares, merger,repurchase or any other corporate event affecting the number of outstanding shares of our common stock or the share price of our common stock that would require adjustments to the Incentive Award Plan or any awards under the Incentive Award Plan in order to prevent the dilution or enlargement of the potential benefits intended to be made available thereunder, the administrator will make appropriate, proportionate adjustments to: (i) the aggregate number and type of shares subject to the Incentive Award Plan; (ii) the number and kind of shares subject to outstanding awards and terms and conditions of outstanding awards (including, without limitation, any applicable performance targets or criteria with respect to such awards); and (iii) the grant or exercise price per share of any outstanding awards under the Incentive Award Plan. In the event of a change in control (as defined in the Incentive Award Plan), to the extent that the successor entity does not assume or substitute for an outstanding award (other than any portion subject to performance-based vesting), then all such awards will become fully vested and exercisable in connection with the transaction. Additionally, if a participant experiences a termination of service that is effected by us other than for cause or by the participant for good reason (each as defined in the Incentive Award Plan), in either case, during the period beginning three months before and ending 12 months after a change in control, then, as of immediately before such termination of service, each of the participant’s outstanding awards will vest, and any forfeiture restrictions thereon will lapse, as of immediately before the consummation of the change in control.
consolidation, split-up, spin-off, recapitalization,
Amendment and Termination
The administrator may terminate, amend or modify the Incentive Award Plan at any time and from time to time. However, we must generally obtain shareholder approval to the extent required by applicable law, rule or regulation (including any applicable stock exchange rule). Notwithstanding the foregoing, an option may be amended to reduce the per share exercise price below the per share exercise price of such option on the grant date and options may be granted in exchange for, or in connection with, the cancellation or surrender of options having a higher per share exercise price without receiving additional shareholder approval.
No ISOs may be granted pursuant to the Incentive Award Plan after the tenth anniversary of the effective date of the Incentive Award Plan, and no additional annual share increases to the Incentive Award Plan’s aggregate share limit will occur from and after such anniversary. Any award that is outstanding on the termination date of the Incentive Award Plan will remain in force according to the terms of the Incentive Award Plan and the applicable award agreement.
Foreign Participants, Claw-back Provisions, Transferability and Participant Payments
The plan administrator may modify awards granted to participants who are foreign nationals or employed outside the United States or establish subplans or procedures to address differences in laws, rules, regulations or
135
customs of such foreign jurisdictions. All awards will be subject to any company claw-back policy as set forth in such claw-back policy or the applicable award agreement. Except as the plan administrator may determine or provide in an award agreement, awards under the Incentive Award Plan are
generally non-transferrable, except
by will or the laws of descent and distribution, or, subject to the plan administrator’s consent, pursuant to a domestic relations order, and are generally exercisable only by the participant. With regard to tax withholding obligations arising in connection with awards under the Incentive Award Plan, and exercise price obligations arising in connection with the exercise of stock options under the Incentive Award Plan, the plan administrator may, in its discretion, accept cash, wire transfer or check, shares of common stock that meet specified conditions, a promissory note, a “market sell order,” such other consideration as the plan administrator deems suitable or any combination of the foregoing.2021 Employee Stock Purchase Plan
The ESPP
The Hippo Holdings Inc. 2021 Employee Stock Purchase Plan (the “ESPP”) is designed to allow eligible employees of Hippo Holdings to purchase shares of Hippo Holdings common stock with their accumulated payroll deductions. The ESPP is divided into two components: the “Section 423 Component” and the
“Non-Section 423
Component”. The Section 423 Component is intended to qualify under Section 423 of the Code. TheNon-Section 423
Component is not intended to qualify under Section 423 of the Code and will be used to grant stock options tocertain non-U.S. employees
and certain U.S. employees who are employed by certain of our subsidiaries which are not corporations. The material terms of the ESPP are summarized below. The purpose of the ESPP is to assist such employees in acquiring a stock ownership interest in Hippo, to help such employees provide for their future security and to encourage such employees to remain in the employment of Hippo. The Hippo Holdings board of directors believes that equity awards are necessary to remain competitive in its industry and are essential to recruiting and retaining the highly qualified employees who help us meet our goals.Summary of the ESPP
This section summarizes certain principal features of the ESPP. The summary is qualified in its entirety by reference to the complete text of the ESPP, which is filed herewith.
Administration
Subject to the terms and conditions of the ESPP, our compensation committee will administer the ESPP. Our compensation committee can delegate administrative tasks under the ESPP to the services of an agent and/or employees to assist in the administration of the ESPP. The administrator will have the discretionary authority to administer and interpret the ESPP. Interpretations and constructions of the administrator of any provision of the ESPP or of any rights thereunder will be conclusive and binding on all persons. We will bear all expenses and liabilities incurred by the ESPP administration.
Shares Available for Awards
The maximum number of shares of our common stock which will be authorized for sale under the ESPP is equal to the sum of (a) 13,000,000 shares of common stock and (b) an annual increase on the first day of each year beginning in 2022 and ending in 2031, equal to the lesser of (i) 1% of the shares of common stock outstanding (on an as converted basis) on the last day of the immediately preceding fiscal year and (ii) such number of shares of common stock as determined by our board of directors; provided, however, no more than 97,500,000 shares of our common stock may be issued under the ESPP. The shares reserved for issuance under the ESPP may be authorized but unissued shares or reacquired shares.
136
Eligibility
Employees eligible to participate in the ESPP for a given offering period generally include employees who are employed by us or one of our designated subsidiaries on the first day of the offering period, or the enrollment date. Our employees (and, if applicable, any employees of our subsidiaries) who customarily work less than five months in a calendar year or are customarily scheduled to work less than 20 hours per week will not be eligible to participate in the ESPP. Finally, an employee who owns (or is deemed to own through attribution) 5% or more of the combined voting power or value of all our classes of stock or of one of our subsidiaries will not be allowed to participate in the ESPP. Hippo Holdings is expected to have approximately 622 employees who may be eligible to receive awards under the ESPP depending on the offering terms the administrator sets for the ESPP.
Participation
Employees will enroll under the ESPP by completing a payroll deduction form permitting the deduction from their compensation of at least 1% of their compensation but not more than 15% of their compensation. Such payroll deductions may be expressed as either a whole number percentage or a fixed dollar amount, and the accumulated deductions will be applied to the purchase of shares on each purchase date.
Offering
Under the ESPP, participants are offered the option to purchase shares of our common stock at a discount during a series of successive offering periods, the duration and timing of which will be determined by the ESPP administrator. However, in no event may an offering period be longer than 27 months in length.
The option purchase price will be the lower of 85% of the closing trading price per share of our common stock on the first trading date of an offering period in which a participant is enrolled or 85% of the closing trading price per share on the purchase date.
Unless a participant has previously canceled his or her participation in the ESPP before the purchase date, the participant will be deemed to have exercised his or her option in full as of each purchase date. Upon exercise, the participant will purchase the number of whole shares that his or her accumulated payroll deductions will buy at the option purchase price, subject to the participation limitations listed above.
A participant may cancel his or her payroll deduction authorization at any time prior to the end of the offering period. Upon cancellation, the participant will have the option to either (i) receive a refund of the participant’s account balance in cash without interest or (ii) exercise the participant’s option for the current offering period for the maximum number of shares of common stock on the applicable purchase date, with the remaining account balance refunded in cash without interest. Following at least one payroll deduction, a participant may also decrease (but not increase) his or her payroll deduction authorization once during any offering period. If a participant wants to increase or decrease the rate of payroll withholding, he or she may do so effective for the next offering period by submitting a new form before the offering period for which such change is to be effective.
A participant may not assign, transfer, pledge or otherwise dispose of (other than by will or the laws of descent and distribution) payroll deductions credited to a participant’s account or any rights to exercise an option or to receive shares of our common stock under the ESPP, and during a participant’s lifetime, options in the ESPP shall be exercisable only by such participant. Any such attempt at assignment, transfer, pledge or other disposition will not be given effect.
Adjustments
In the event of any increase or decrease in the number of issued shares of our common stock resulting from a stock split, reverse stock split, stock dividend, combination or reclassification of the common stock, or any
137
other increase or decrease in the number of shares of common stock effected without receipt of consideration by us, we will proportionately adjust the aggregate number of shares of our common stock offered under the ESPP, the number and price of shares which any participant has elected to purchase under the ESPP and the maximum number of shares which a participant may elect to purchase in any single offering period. If there is a proposal to dissolve or liquidate us, then the ESPP will terminate immediately prior to the consummation of such proposed dissolution or liquidation, and any offering period then in progress will be shortened by setting a new purchase date to take place before the date of our dissolution or liquidation. We will notify each participant of such change in writing at least ten business days prior to the new exercise date. If we undergo a merger with or into another corporation or sell all or substantially all of our assets, each outstanding option will be assumed or an equivalent option substituted by the successor corporation or the parent or subsidiary of the successor corporation. If the successor corporation refuses to assume the outstanding options or substitute equivalent options, then any offering period then in progress will be shortened by setting a new purchase date to take place before the date of our proposed sale or merger. We will notify each participant of such change in writing at least ten business days prior to the new exercise date.
Amendment and Termination
Our board of directors may amend, suspend or terminate the ESPP at any time. However, the board of directors may not amend the ESPP without obtaining shareholder approval within 12 months before or after such amendment to the extent required by applicable laws.
138
PRINCIPAL STOCKHOLDERS
The following table sets forth the beneficial ownership of Hippo Holdings common stock following the consummation of the Business Combination and the PIPE Investment by:
| • | each person who is known to be the beneficial owner of more than 5% of shares of Hippo Holdings common stock; |
| • | each of Hippo Holdings’ current named executive officers and directors; and |
| • | all current executive officers and directors of Hippo Holdings as a group. |
Beneficial ownership is determined according to the rules of the SEC, which generally provide that a person has beneficial ownership of a security if he, she or it possesses sole or shared voting or investment power over that security, including options and warrants that are currently exercisable or exercisable within 60 days.
Unless otherwise indicated, Hippo Holdings believes that all persons named in the table below have sole voting and investment power with respect to the voting securities beneficially owned by them.
Number of Shares of Hippo Holdings Common Stock | +60 Days Vested | Number of Shares Beneficially Owned | % | |||||||||||||
Name and Address of Beneficial Owner (1)(2) | ||||||||||||||||
Five Percent Holders: | ||||||||||||||||
Fifth Wall Ventures, L.P. and affiliates (3) | 74,168,521 | — | 74,168,521 | 13.2 | % | |||||||||||
LEN FW INVESTOR, LLC and affiliates (4) | 80,786,369 | — | 80,786,369 | 14.4 | % | |||||||||||
Mitsui Sumitomo Insurance Co., Ltd. (5) | 39,555,425 | — | 39,555,425 | 7.0 | % | |||||||||||
Bond Capital Fund, LP and affiliate (6) | 30,003,193 | — | 30,003,193 | 5.3 | % | |||||||||||
RPM Ventures III, L.P. (7) | 30,644,982 | — | 30,644,982 | 5.4 | % | |||||||||||
Directors and Executive Officers of Post-Business Combination: | ||||||||||||||||
Assaf Wand (8) | 32,320,815 | 4,586,013 | 36,906,828 | 6.5 | % | |||||||||||
Richard McCathron (9) | 2,508,501 | 667,633 | 3,176,134 | * | ||||||||||||
Eric Feder | — | — | — | — | ||||||||||||
Sam Landman | — | — | — | — | ||||||||||||
Hugh Frater (10) | 1,076,362 | — | 1,076,362 | * | ||||||||||||
Noah Knauf | — | — | — | — | ||||||||||||
Sandra Wijnberg (11) | — | 81,130 | 81,130 | * | ||||||||||||
Simon Fleming-Wood | — | — | — | — | ||||||||||||
Lori Dickerson Fouché | — | — | — | — | ||||||||||||
Amy Errett | — | — | — | — | ||||||||||||
Aviad Pinkovezky (12) | 1,810,001 | 333,229 | 2,143,230 | * | ||||||||||||
Ran Harpaz (13) | 2,104,125 | 36,224 | 2,140,349 | * | ||||||||||||
Stewart Ellis (14) | 3,366,803 | — | 3,366,803 | * | ||||||||||||
All Directors and Executive Officers of the Combined Company as a Group (13 individuals) | 43,186,607 | 5,704,229 | 57,640,054 | 8.65 | % | |||||||||||
| * | Less than one percent |
| (1) | Unless otherwise noted, the business address of each of those listed in the table above is c/o Hippo Holdings Inc., 150 Forest Avenue, Palo Alto, California 94301. |
| (2) | Prior to the Closing, holders of record of RTPZ Class A ordinary shares and RTPZ Class B ordinary shares were entitled to one vote for each share held on all matters to be voted on by RTPZ shareholders and vote together as a single class, except as required by law; provided, that holders of RTPZ Class B ordinary shares |
139
| had the right to elect all of RTPZ’s directors prior to the Closing, and holders of RTPZ’s Class A ordinary shares were not entitled to vote on the election of directors during such time. As a result of and upon the effective time of the Domestication, (a) each of the then issued and outstanding RTPZ Class A ordinary shares converted automatically, on a one-for-one basis, into a share of Hippo Holdings common stock and (b) each of the then issued and outstanding RTPZ Class B ordinary shares converted automatically, on aone-for-one |
| (3) | Consists of 74,168,521 shares of Hippo Holdings common stock, of which (i) 51,447,246 are common stock directly held by Fifth Wall Ventures SPV IV L.P., (ii) 458,603 are common stock directly held by Fifth Wall Ventures SPV XVII, L.P. and (iii) 22,262,672 are common stock directly held by Fifth Wall Ventures, L.P. Fifth Wall Ventures, L.P. has granted LEN FW Investor, LLC an irrevocable voting proxy in respect of the shares referred to in clause (i) herein, which are held directly by Fifth Wall Ventures SPV IV L.P. The address of the above persons and entities is 11360 Mindanao Way, Suite 100B, Marina Del Rey, California 90292. |
| (4) | Consists of 80,786,369 shares of Hippo Holdings common stock, of which (i) 29,239,123 are common stock held directly by LEN FW Investor, LLC, (ii) 100,000 are PIPE Shares held by LEN FW Investor, LLC and (iii) 51,447,246 are common stock held directly by Fifth Wall Ventures SPV IV L.P. Fifth Wall Ventures, L.P. has granted LEN FW Investor, LLC an irrevocable voting proxy in respect of the shares referred to in clause (iii) herein, which are held directly by Fifth Wall Ventures SPV IV L.P. Eric Feder is currently a member of our board of directors and an officer of the parent of LEN FW Investor, LLC. The address of the above persons and entities is 700 Northwest 107th Avenue, Miami, Florida 33172. |
| (5) | Consists of 39,555,425 shares of Hippo Holdings common stock. Mitsui Sumitomo Insurance Co., Ltd.’s address is 9, Kanda-Surugadai 3-chome, Chiyoda-Ku, Tokyo, Japan. |
| (6) | Consists of 30,003,193 shares of Hippo Holdings common stock held in the name of BOND Capital Fund, LP, as nominee, for the account of BOND Capital Fund, LP and BOND Capital Founders Fund, LP (together, the “BOND Funds”). Daegwon Chae, Juliet de Baubigny, Noah Knauf, Mary Meeker, Mood Rowghani, Jay Simons, and Paul Vronsky are managing members of BOND Capital Associates, LLC, the general partner of the BOND Funds, and share voting and dispositive power over the shares held for the account of the BOND Funds. The address of each of these entities is 100 The Embarcadero, San Francisco, California 94105. |
| (7) | Consists of 30,644,982 shares of Hippo Holdings, of which (i) 26,369,295 are common stock directly held by RPM Ventures III, L.P. and (ii) 4,275,687 are common stock directly held by BGW Ventures II, LP, an affiliate of RPM Ventures III, L.P. The address of the above persons and entities is 320 N. Main Street, Suite 400, Ann Arbor, Michigan 48104. |
| (8) | Consists of (i) 36,906,828 shares of Hippo Holdings common stock, of which approximately 17,087,948 shares are held by Mr. Wand and 15,232,867 shares are held by Mr. Wand as trustee of a trust, and (ii) approximately 4,586,013 shares of Hippo Holdings common stock issuable pursuant to Hippo options of which all are held by Mr. Wand and none are held by Mr. Wand as trustee of a trust. |
| (9) | Consists of (i) 4,324,332 shares of Hippo Holdings common stock, of which approximately 2,508,501 shares are held by Mr. McCathron and (ii) 667,633 shares of Hippo Holdings common stock issuable pursuant to Hippo options. |
| (10) | Consists of (i) 1,076,362 shares of Hippo Holdings common stock, all of which are held by Mr. Frater as trustee of a trust and (ii) no shares of Hippo Holdings common stock issuable pursuant to Hippo options. |
| (11) | Consists of (i) no shares of Hippo Holdings common stock and (ii) 81,130 shares of Hippo Holdings common stock issuable pursuant to Hippo options. |
| (12) | Consists of (i) 2,143,230 shares of Hippo Holdings common stock, of which 1,670,920 shares are held by Mr. Pinkovezky as trustee of a trust and 139,081 shares are held for the benefit of Mr. Pinkovezky by a separate trust and (ii) 333,229 shares of Hippo Holdings common stock issuable pursuant to Hippo options of which all are held by Mr. Pinkovezky and none are held by Mr. Pinkovezky as trustee of a trust. |
| (13) | Consists of (i) 2,277,981 shares of Hippo Holdings common stock, of which approximately 2,104,125 shares are held by Mr. Harpaz and (ii) 36,224 shares of Hippo Holdings common stock issuable pursuant to Hippo options. |
| (14) | Consists of (i) 3,366,803 shares of Hippo Holdings common stock, 3,108,425 of which are held by Mr. Ellis and 258,378 of which are held for the benefit of Mr. Ellis by a trust and (ii) no shares of Hippo Holdings common stock issuable pursuant to Hippo options. |
140
SELLING SECURITYHOLDERS
The selling securityholders may offer and sell, from time to time, any or all of the shares of common stock or warrants being offered for resale by this prospectus, which consists of:
| • | up to 55,000,000 PIPE Shares; |
| • | up to 5,750,000 RTPZ founder shares; |
| • | up to 14,592,527 shares of common stock held by Hippo Holdings holders issuable upon the exercise of equity awards; |
| • | up to 4,400,000 shares of common stock issuable upon the exercise of private placement warrants; |
| • | up to 315,928,001 shares of Hippo Holdings common stock; and |
| • | up to 637,463 shares of common stock issuable upon the exercise of Hippo Holdings warrants. |
The term “selling securityholders” includes the securityholders listed in the tables below and their permitted transferees.
The following tables provide, as of the date of this prospectus, information regarding the beneficial ownership of our common stock and warrants of each selling securityholder, the number of shares of common stock and number of warrants that may be sold by each selling securityholder under this prospectus and that each selling securityholder will beneficially own after this offering.
Because each selling securityholder may dispose of all, none or some portion of their securities, no estimate can be given as to the number of securities that will be beneficially owned by a selling securityholder upon termination of this offering. For purposes of the tables below, however, we have assumed that after termination of this offering none of the securities covered by this prospectus will be beneficially owned by the selling securityholders and further assumed that the Selling Securityholders will not acquire beneficial ownership of any additional securities during the offering. In addition, the selling securityholders may have sold, transferred or otherwise disposed of, or may sell, transfer or otherwise dispose of, at any time and from time to time, our securities in transactions exempt from the registration requirements of the Securities Act after the date on which the information in the tables is presented.
We may amend or supplement this prospectus from time to time in the future to update or change this selling securityholders list and the securities that may be resold.
Please see the section titled “Plan of Distribution” for further information regarding the stockholders’ method of distributing these shares.
Shares of Common Stock | ||||||||||||||||
Name | Number Beneficially Owned Prior to Offering (1) | Number Registered for Sale Hereby | Number Beneficially Owned After Offering | Percent Owned After Offering (2) | ||||||||||||
140 Summer Partners Master Fund LP (3) | 500,000 | 500,000 | — | — | ||||||||||||
40 North Latitude Mater Fund Ltd. (4) | 4,000,000 | 4,000,000 | — | — | ||||||||||||
Ally Financial Inc. (5) | 200,000 | 200,000 | — | — | ||||||||||||
Alyeska Master Fund, L.P. (6) | 1,260,000 | 1,260,000 | 260,000 | * | ||||||||||||
Assaf Wand (7) | 36,906,828 | 36,906,828 | 36,906,828 | 6.5 | % | |||||||||||
Baron Real Estate Fund (8) | 1,500,000 | 1,500,000 | — | — | ||||||||||||
Beagle Limited (9) | 25,000 | 25,000 | — | — | ||||||||||||
BHHP LLC (10) | 500,000 | 500,000 | — | — | ||||||||||||
141
Bond Capital Fund, LP (11) | 30,003,193 | 30,003,193 | 30,003,193 | 5.3 | % | |||||||||||
Byron Auguste (12) | 30,000 | 30,000 | 30,000 | * | ||||||||||||
David Mayer de Rothschild (13) | 140,000 | 140,000 | — | — | ||||||||||||
Diameter Master Fund LP (14) | 881,128 | 881,128 | 181,128 | * | ||||||||||||
Dragoneer Global Fund II, L.P. (15) | 3,329,237 | 3,329,237 | 2,829,237 | * | ||||||||||||
EMJ Master Fund LP (16) | 777,750 | 777,750 | 77,750 | * | ||||||||||||
Entities Affiliated with Brosh Capital (17) | 500,000 | 500,000 | — | — | ||||||||||||
Entities advised by Capital Research and Management Company (18) | 3,011,418 | 3,011,418 | 11,418 | * | ||||||||||||
Entities Affiliated with Clal Insurance (19) | 1,000,000 | 1,000,000 | — | — | ||||||||||||
Entities Affiliated with Comcast (20) | 26,823,284 | 26,823,284 | 26,823,284 | 4.7 | % | |||||||||||
Entities Affiliated with Corbin Capital (21) | 600,000 | 600,000 | — | — | ||||||||||||
Entities Affiliated with Darlington Partners (22) | 3,000,000 | 3,000,000 | — | — | ||||||||||||
Entities Affiliated with Fifth Wall Ventures (23) | 74,168,521 | 74,168,521 | 74,168,521 | 13.2 | % | |||||||||||
Entities Affiliated with Horizon (24) | 26,872,544 | 26,872,544 | 24,872,544 | 4.4 | % | |||||||||||
Entities Affiliated with Luxor Capital (25) | 1,000,000 | 1,000,000 | — | — | ||||||||||||
Entities Affiliated with Millennium (26) | 1,453,733 | 1,453,733 | 253,733 | * | ||||||||||||
Entities Affiliated with Park West (27) | 4,000,000 | 4,000,000 | — | — | ||||||||||||
Entities Affiliated with Saba Capital (28) | 2,000,000 | 2,000,000 | — | — | ||||||||||||
Entities Affiliated with Samlyn Capital (29) | 500,000 | 500,000 | — | — | ||||||||||||
Entities Affiliated with Sentinel Dome (30) | 1,000,000 | 1,000,000 | — | — | ||||||||||||
Entities Affiliated with Serengeti (31) | 700,000 | 700,000 | 50,000 | * | ||||||||||||
Entities Affiliated with Suvretta Capital Management LLC (32) | 600,000 | 600,00 | — | — | ||||||||||||
Entities Managed by UBS (33) | 300,000 | 300,000 | — | — | ||||||||||||
Gan Eden Ventures, Inc. (34) | 1,000,000 | 1,000,000 | — | — | ||||||||||||
Garden Fund, LLC (35) | 100,000 | 100,000 | — | — | ||||||||||||
Ghisallo Master Fund LP (36) | 500,000 | 500,000 | — | — | ||||||||||||
Gores HP, LLC (37) | 500,000 | 500,000 | — | — | ||||||||||||
The HCG Fund LP (38) | 500,000 | 500,000 | — | — | ||||||||||||
Hound Partners, LLC (39) | 529,682 | 529,682 | 29,682 | * | ||||||||||||
Hugh R. Frater Irrevocable Trust Dtd 12/11/2012 (40) | 1,076,362 | 1,076,362 | 1,076,362 | * | ||||||||||||
Invus Public Equities, L.P. (41) | 600,000 | 600,000 | — | — | ||||||||||||
Jane Street Global Trading, LLC (42) | 438,903 | 438,903 | 38,903 | * | ||||||||||||
Julie Hanna (43) | 30,000 | 30,000 | 30,000 | * | ||||||||||||
Lee Linden (44) | 30,000 | 30,000 | 30,0000 | * | ||||||||||||
Len FW Investor, LLC (45) | 80,786,369 | 80,786,369 | 80,686,369 | 14.4 | % | |||||||||||
Linda Rottenberg (46) | 30,000 | 30,000 | 30,000 | * | ||||||||||||
Linden Capital L.P. (47) | 500,000 | 500,000 | — | — | ||||||||||||
Madison Rock Investments LP (48) | 100,000 | 100,000 | — | — | ||||||||||||
Octahedron Master Fund, L.P. (49) | 250,000 | 250,000 | — | — | ||||||||||||
PBCAY One Limited (50) | 2,000,000 | 2,000,000 | — | — | ||||||||||||
Psagot Provident Funds and Pensions Ltd .(51) | 1,000,000 | 1,000,000 | — | — | ||||||||||||
Reinvent Capital Fund LP (52) | 1,000,000 | 1,000,000 | ||||||||||||||
Reinvent Sponsor Z LLC (53) | 5,630,000 | 5,630,000 | — | — | ||||||||||||
Ribbit Capital VI, L.P. (54) | 300,000 | 300,00 | ||||||||||||||
Richard McCathron (55) | 3,176,134 | 3,176,134 | 3,176,134 | * | ||||||||||||
RPM Ventures III, L.P. (56) | 30,644,982 | 30,644,982 | 30,644,982 | 5.4 | % | |||||||||||
Sandra Wijnberg (57) | 81,130 | 81,130 | 81,130 | * | ||||||||||||
Schonfeld Strategic 460 Fund LLC (58) | 1,000,000 | 1,000,000 | — | — | ||||||||||||
Senator Global Opportunity Master Fund L.P. (59) | 2,250,000 | 2,250,000 | — | — | ||||||||||||
142
Shapero 2015 Trust (60) | 75,000 | 75,000 | — | — | ||||||||||||
Slate Path Master Fund LP (61) | 1,000,000 | 1,000,000 | — | — | ||||||||||||
Smith’s Point Family Partners LLC (62) | 700,000 | 700,000 | — | — | ||||||||||||
Stewart Ellis (63) | 3,366,803 | 3,366,803 | 3,366,803 | * | ||||||||||||
Soroban Opportunities Master Fund LP (64) | 2,000,000 | 2,000,000 | — | — | ||||||||||||
The Adam & Carolyn Nash Family Trust U/D/T January 25, 2021 (65) | 10,000 | 10,000 | — | — | ||||||||||||
Entities Affiliated with Third Point Loan LLC (66) | 1,000,000 | 1,000,000 | — | — | ||||||||||||
Transcend Partners LLC (67) | 200,000 | 200,000 | — | — | ||||||||||||
Weiss Ventures I LLC (68) | 1,200,000 | 1,200,000 | — | — | ||||||||||||
West Coast Equity Partners LLC (69) | 600,000 | 600,000 | — | — | ||||||||||||
XN Exponent Master Fund LP (70) | 4,500,000 | 4,500,000 | — | — |
| * | Less than 1% |
| (1) | The first table includes PIPE Shares, Sponsor Shares, Hippo Holdings Holder Shares, shares of common stock issuable upon exercise of certain equity awards (including both shares beneficially owned as determined in accordance with Rule 13d-3 of the Exchange Act and additional shares underlying options to purchase common stock which may be exercisable within one year following the Closing), shares of common stock issuable upon exercise of the Old Hippo Warrants and shares of common stock issuable upon exercise of the private placement warrants, and the second table includes the private placement warrants included in this table (collectively, the “Resale Securities”). We do not know when or in what amounts the selling securityholders will offer the Resale Securities for sale, if at all. |
| (2) | The percentage of shares to be beneficially owned after completion of the offering is calculated on the basis of 559,731,226 shares of common stock outstanding, assuming the exercise of all currently outstanding warrants and the sale of all Resale Securities by the selling securityholders. |
| (3) | Shares offered hereby consist of 500,000 PIPE Shares. The securities to which this filing relates are held directly by 140 Summer Partners Master Fund LP, a Delaware limited partnership (the “Fund”). 140 Summer Partners Fund GP LLC, a Delaware limited liability company, serves as the general partner of 140 Summer Partners Master Fund LP and as such has discretion over the portfolio securities beneficially owned by 140 Summer Partners Master Fund LP. Peter Rosenblum is the managing member of 140 Summer Partners Fund GP LLC and directs 140 Summer Partners Fund GP LLC operations. Each of the reporting persons disclaims beneficial ownership of the securities reported herein for purposes of Section 16 of the Securities and Exchange Act of 1934, as amended, except as to such extent of such reporting person’s pecuniary interest in the securities. |
| (4) | Shares hereby offered consist of 4,000,000 PIPE Shares held by 40 North Latitude Master Fund Ltd. (“Latitude”). David Winter and David Millstone are sole managers of 40 North Management LLC, which holds the sole voting power in Latitude, and 40 North GP III LLC, the General Partner of Latitude. Mr. Winter and Mr. Millstone are sole directors of Latitude. The business address of Latitude is c/o 40 North Management LLC 9 West 57th Street, 46th floor, New York, NY 10019. |
| (5) | Shares hereby offered consist of 200,000 PIPE Shares held by Ally Ventures, a business unit of Ally Financial Inc. The business address of Ally Ventures is 300 Park Avenue, 4 th Floor, New York, NY 10022. (6) Shares hereby offered consist of the 1,000,000 PIPE Shares and 260,000 warrants held by Alyeska Master Fund, L.P. Alyeska Investment Group, L.P., the investment manager of Alyeska Master Fund, L.P., has voting and investment control of the shares held by Alyeska Master Fund, L.P. Anand Parekh is the Chief Executive Officer of Alyeska Investment Group, L.P. and may be deemed to be the beneficial owner of such shares. Mr. Parekh, however, disclaims any beneficial ownership of the shares held by Alyeska Master Fund, L.P. The registered address of Alyeska Master Fund, L.P. is at c/o Maples Corporate Services Limited, P.O. Box 309, Ugland House, South Church Street George Town, Grand Cayman,KY1-1104, Cayman Islands. Alyeska Investment Group, L.P. is located at 77 W. Wacker, Suite 700, Chicago IL 60601. |
| (7) | Consists of (i) 36,906,828 shares of Hippo Holdings common stock, of which approximately 17,087,948 shares are held by Mr. Wand and 15,232,867 shares are held by Mr. Wand as trustee of a trust, |
143
| and (ii) approximately 4,586,013 shares of Hippo Holdings common stock issuable pursuant to Hippo options of which all are held by Mr. Wand and none are held by Mr. Wand as trustee of a trust. |
| (8) | Shares hereby offered consist of 1,500,000 PIPE Shares held directly by Baron Real Estate Fund. Baron Real Estate Fund is an investment company registered under the Investment Company Act of 1940. Ronald Baron, the Chief Executive Officer of Baron Select Funds, of which Baron Real Estate Fund is a series, and has voting and/or investment control over the shares held by Baron Real Estate Fund. Mr. Baron disclaims beneficial ownership of the securities reported herein for purposes of Section 16 of the Securities and Exchange Act of 1934, as amended, except as to such extent of such reporting person’s pecuniary interest in the securities. The business address of Baron Real Estate Fund is 767 Fifth Avenue, 49 th Floor, New York, New York 10153. |
| (9) | Shares hereby offered consist of 25,000 PIPE Shares held directly by Beagle Limited. Beagle Limited is a corporation organized under the laws of Bermuda. Giovanni Pigozzi is the beneficial owner of Beagle Limited and has voting and/or investment control over the shares held by Beagle Limited. Mr. Pigozzi disclaims beneficial ownership of the securities reported herein for purposes of Section 16 of the Securities and Exchange Act of 1934, as amended, except as to such extent of such reporting person’s pecuniary interest in the securities. The business address of Baron Real Estate Fund is 767 Fifth Avenue, 49 th Floor, New York, New York 10153. |
| (10) | Shares hereby offered consist of 500,000 PIPE Shares held directly by BHHP LLC. BHHP LLC is a limited partnership organized under Delaware law. Chaim Tvzi Nash and Shmuel Gniwisch are the managers of Kli Capital LLP, a Delaware limited liability company and general partner of BHHP LLC, and have voting and/or investment control over the shares held by BHHP LLC. Mr. Nash and Mr. Gniwisch disclaim beneficial ownership of the securities reported herein for purposes of Section 16 of the Securities and Exchange Act of 1934, as amended, except as to such extent of such reporting person’s pecuniary interest in the securities. The business address of BHHP LLC is 1083 Main Street, Champlain, New York 12919. |
| (11) | Consists of 30,003,193 shares of Hippo Holdings common stock held in the name of BOND Capital Fund, LP, as nominee, for the account of BOND Capital Fund, LP and BOND Capital Founders Fund, LP (together, the “BOND Funds”). Daegwon Chae, Juliet de Baubigny, Noah Knauf, Mary Meeker, Mood Rowghani, Jay Simons and Paul Vronsky are managing members of BOND Capital Associates, LLC, the general partner of the BOND Funds, and share voting and dispositive power over the shares held for the account of the BOND Funds. The address of each of these entities is 100 The Embarcadero, San Francisco, California 94105. |
| (12) | Consists of 30,000 shares of Hippo Holdings common stock held directly by Byron Auguste. |
| (13) | Shares hereby offered consist of 140,000 PIPE Shares. |
| (14) | Shares hereby offered consist of 700,000 PIPE Shares held directly by Diameter Master Fund LP and 181,128 warrants, of which (i) 140,064 warrants are held by Diameter Master Fund LP, (ii) 16,700 warrants are held by Diameter SPO Master Fund LP and (iii) 24,364 warrants are held by Diameter Dislocation Master Fund LP. Diameter Capital Partners LP is the investment manager of the Diameter Master Fund LP and, therefore, has investment and voting power over these shares. Scott Goodwin and Jonathan Lewinsohn, as the sole managing members of the general partner of the investment manager, make voting and investment decisions on behalf of the investment manager. As a result, the investment manager, Mr. Goodwin and Mr. Lewinsohn may be deemed to be the beneficial owners of these shares. Notwithstanding the foregoing, each of Mr. Goodwin and Mr. Lewinsohn disclaims beneficial ownership of the securities reported herein for purposes of Section 16 of the Securities and Exchange Act of 1934, as amended, except as to such extent of such reporting person’s pecuniary interest in the securities. The business address of Diameter Master Fund LP is 55 Hudson Yards, 29B, New York, New York 10001. |
| (15) | Shares hereby offered consist of 500,000 PIPE Shares held directly by Dragoneer Global Fund II, L.P. and 2,829,237 shares of Hippo Holdings common stock held by Hungry DF Holdings, LP, an affiliate of Dragoneer Global Fund II, L.P. (together, “Dragoneer”). Dragoneer’s registered investment adviser is Dragoneer Investment Group, LLC (“Dragoneer Adviser”). Cardinal DIG CC, LLC (“Cardinal” and together with Dragoneer and Dragoneer Adviser, the “Dragoneer Entities”) is the managing member of Dragoneer Adviser. Marc Stad is the sole member of Cardinal. By virtue of these relationships, Marc Stad and each of the Dragoneer Entities may be deemed to share voting and dispositive power with respect to |
144
| shares held by Dragoneer The business address for Mr. Stad and each of the Dragoneer Entities is 1 Letterman Drive, Building D M-500, San Francisco, CA 94129. |
| (16) | Shares hereby offered consist of 700,000 PIPE Shares and 77,750 warrants held directly by EMJ Master Fund LP. EMJ Master Fund LP is a limited partnership organized pursuant to the Exempted Limited Partnership Law, 2018 of the Cayman Islands. Eric M. Jackson is the president and founder of EMJ Capital Ltd, an Ontario corporation which acts as Investment Manager to EMJ Master Fund LP and has voting and/or investment control over the shares held by EMJ Master Fund LP. Mr. Jackson disclaims beneficial ownership of the securities reported herein for purposes of Section 16 of the Securities and Exchange Act of 1934, as amended, except as to such extent of such reporting person’s pecuniary interest in the securities. The legal address of EMJ Master Fund LP is c/o Waystone Governance Ltd., Suite 5B201, 2nd Floor, One Nexus Way, PO Box 2587, KY1-1103, Cayman Islands and the business address 1370 Don Mills Road, Suite 300, Toronto, Ontario, Canada M3B 3N7. |
| (17) | Shares hereby offered consist of 500,000 PIPE Shares, of which (i) 455,000 are held by Brosh Capital Partners L.P., (ii) 22,500 are held by Halman Aldubi on behalf of Roni Biram and (iii) 22,500 are held by Halman Aldubi on behalf of Ester Deutsch. Brosh Capital Partners L.P. is a limited partnership organized under the laws of the Cayman Islands. Amir Efrati is the CEO and Director of Exodus Management Israel Ltd., which is the general partner of Brosh Capital Partners L.P. and has voting and/or investment control over the shares held by Brosh Capital Partners L.P. Mr. Efrati disclaims beneficial ownership of the securities reported herein for purposes of Section 16 of the Securities and Exchange Act of 1934, as amended, except as to such extent of such reporting person’s pecuniary interest in the securities. The business address for the above-referenced entities is 4 Ariel Sharon Street, Givataim 5320047 Israel. |
| (18) | Shares hereby offer consist of 3,011,418 PIPE Shares, which consists of (i) 2,405,228 common shares held by The Growth Fund of America (“GFA”), (ii) 580,847 common shares held by American Funds Insurance Series – Growth Fund (“VIG” and, together with GFA, the “CRMC Stockholders”), and (iii) 25,343 common shares held by Capital Group Growth Fund of America Trust (US) (“TGFA”). Capital Research and Management Company (“CRMC”) is the investment adviser or subadviser for each CRMC Stockholder. Capital Bank and Trust Company (“CB&T”) is the discretionary trustee and investment adviser for TGFA, and CRMC has been retained by CB&T as investment adviser to CB&T. For purposes of the reporting requirements of the Exchange Act, CRMC and Capital International Investors (“CII”) may be deemed to be the beneficial owner of the common shares held by each CRMC Stockholder; however, each of CRMC and CII expressly disclaims that each is, in fact, the beneficial owner of such securities. For purposes of the reporting requirements of the Exchange Act, CB&T, CRMC and CII may be deemed to be the beneficial owner of the common shares held by TGFA; however, each of CB&T, CRMC and CII expressly disclaims that it is, in fact, the beneficial owner of such securities. Christopher D. Buchbinder, Mark L. Casey, Barry S. Crosthwaite, J. Blair Frank, Joanna F. Jonsson, Carl M. Kawaja, Donald D. O’Neal, Anne-Marie Peterson, Alex Popa, Andraz Razen, Martin Romo, Lawrence R. Solomon, and Alan J. Wilson, as portfolio managers, have voting and investment powers over the shares held by GFA. Christopher D. Buchbinder, Mark L. Casey, Barry S. Crosthwaite, J. Blair Frank, Joanna F. Jonsson, Carl M. Kawaja, Donald D. O’Neal, Anne-Marie Peterson, Alex Popa, Andraz Razen, Martin Romo, Lawrence R. Solomon, and Alan J. Wilson, as portfolio managers, have voting and investment powers over the shares held by VIG. Christopher D. Buchbinder, Mark L. Casey, Barry S. Crosthwaite, J. Blair Frank, Joanna F. Jonsson, Carl M. Kawaja, Donald D. O’Neal, Anne-Marie Peterson, Alex Popa, Andraz Razen, Martin Romo, Lawrence R. Solomon, and Alan J. Wilson, as portfolio managers, have voting and investment powers over the shares held by TGFA. The address for each of the CRMC Stockholders and VIG is c/o Capital Research and Management Company, 333 S. Hope St., 50th Floor, Los Angeles, California 90071. Each of the CRMC Stockholders and VIG acquired the securities being registered hereby in the ordinary course of its business. |
| (19) | Shares hereby offered consist of 1,000,000 PIPE Shares, of which (i) 430,000 are held by Clal Insurance Company Ltd. and (ii) 570,000 are held by Clal Pension and Provident Funds Ltd. (together, the “Clal Insurance Companies”). The Clal Insurance Companies are insurance companies organized under the laws of Israel. Barak Benksi and Dov Caspi are the chief investment officer and deputy chief investment officer of the Clal Insurance Companies, respectively, and have voting and/or investment control over the shares held by the Clal Insurance Companies. Mr. Benski and Mr. Caspi disclaim beneficial ownership of the |
145
| securities reported herein for purposes of Section 16 of the Securities and Exchange Act of 1934, as amended, except as to such extent of such reporting person’s pecuniary interest in the securities. The business address for the above-referenced entities is 4 Ariel Sharon Street, Givataim 5320047 Israel. |
| (20) | Consists of 26,823,284 shares of Hippo Holdings common stock, of which (i) 26,388,639 are held by Comcast Ventures, LP and (ii) 434,645 are held by Comcast Warranty and Home Insurance. The business address for Comcast Ventures, LP and Comcast Warranty and Home Insurance is 1701 John F. Kennedy Boulevard, Philadelphia, Pennsylvania 19103. |
| (21) | Shares hereby offered consist of 600,000 PIPE Shares, of which (i) 246,000 are held by Pinehurst Partners, L.P., (ii) 108,000 are held by Corbin Opportunity Fund, L.P. and (iii) 246,000 are held by Corbin ERISA Opportunity Fund, Ltd. Corbin Capital Partners, L.P. (“CCP”) is the investment manager of Pinehurst Partners, L.P., Corbin Opportunity Fund, L.P. and Corbin ERISA Opportunity Fund, Ltd. Corbin Capital Partners, L.P. and its general partner, Corbin Capital Partners Group, LLC, may be deemed beneficial owners of the Company securities being registered in the Registration Statement on behalf of Corbin ERISA Opportunity Fund, Ltd., Pinehurst Partners, L.P. and Corbin Opportunity Fund, L.P. Craig Bergstrom is the Chief Investment Officer of Corbin Capital Partners, L.P., the investment manager of Pinehurst Partners, L.P., Corbin Opportunity Fund, L.P. and Corbin ERISA Opportunity Fund, Ltd., and accordingly may be deemed to have voting and dispositive power with respect to shares held by Pinehurst Partners, L.P., Corbin Opportunity Fund, L.P. and Corbin ERISA Opportunity Fund, Ltd. Mr. Bergstrom disclaims beneficial ownership of such shares. The business address of each of the above-mentioned funds is 590 Madison Avenue, 31 st Floor, New York, New York 10022. |
| (22) | Shares hereby offered consist of 3,000,000 PIPE Shares, of which (i) 2,655,000 are held by Darlington Partners, LP and (ii) 345,000 are held by Darlington Partners II, LP (together, the “Darlington Funds”). Darlington Partners GP, LLC is the general partner of the Darlington Funds and have voting and/or investment control over the shares held by the Darlington Funds. Darlington Partners GP, LLC disclaims beneficial ownership of the securities reported herein for purposes of Section 16 of the Securities and Exchange Act of 1934, as amended, except as to such extent of such reporting person’s pecuniary interest in the securities. The business address of the Darlington Funds is 300 Drakes Landing Road, Suite 290, Greenbrae, California 94904. |
| (23) | Consists of 74,168,521 shares of Hippo Holdings common stock, of which (i) 51,447,246 are common stock directly held by Fifth Wall Ventures SPV IV L.P., (ii) 458,603 are common stock directly held by Fifth Wall Ventures SPV XVII, L.P. and (iii) 22,262,672 are common stock directly held by Fifth Wall Ventures, L.P. Fifth Wall Ventures, L.P. has granted LEN FW Investor, LLC an irrevocable voting proxy in respect of the shares referred to in clause (i) herein, which are held directly by Fifth Wall Ventures SPV IV L.P. The address of the above persons and entities is 11360 Mindanao Way, Suite 100B, Marina Del Rey, California 90292. |
| (24) | Shares hereby offered consist of 24,872,544 shares of Hippo Holdings common stock held by Digital Fortune Limited and 2,000,000 PIPE Shares, of which (i) 24,750 are held by Celestial Ally Limited, (ii) 982,801 are held by Eliot International Limited, (iii) 982,801 are held by Famous Giant Limited and (iv) 9,828 are held by Moon Stream Investments Limited. Kang Tzu Ping is the ultimate beneficial owner of Celestial Ally Limited and as such, Ms. Kang may be deemed to beneficially own the PIPE Shares directly held by Celestial Ally Limited. Chau Hoi Shuen Solina Holly is the ultimate beneficial owner of Eliot International Limited and as such, Ms. Chau may be deemed to beneficially own the PIPE Shares directly held by Eliot International Limited. Li Ka Shing is the ultimate beneficial owner of Famous Giant Limited and as such, Mr. Li may be deemed to beneficially own the PIPE Shares directly held by Famous Giant Limited. The business address of each of the above-mentioned entities is Vistra Corporate Services Centre, Wickhams Cay II, Road Town, Tortola, VG1110, British Virgin Islands. |
| (25) | Shares hereby offered consist of (i) 313,079 PIPE Shares, held by Lugard Road Capital Master Fund, LP (“Lugard”) beneficially owned by Luxor Capital Group, LP, the investment manager of Lugard; (ii) 3,544 PIPE Shares held by Luxor Capital Partners Long Offshore Master Fund, LP (“Luxor Long Offshore”) beneficially owned by Luxor Capital Group, LP, the investment manager of Luxor Long Offshore (iii) 10,656 PIPE Shares held by Luxor Capital Partners Long, LP (“Luxor Long”) beneficially owned by Luxor Capital Group, LP, the investment manager of Luxor Long; (iv) 198,491 PIPE Shares held by Luxor Capital |
146
| Partners Offshore Master Fund, LP (“Luxor Offshore”) beneficially owned by Luxor Capital Group, LP, the investment manager of Luxor Offshore; (v) 315,949 PIPE Shares held by Luxor Capital Partners, LP (“Luxor Capital”) beneficially owned by Luxor Capital Group, LP, the investment manager of Luxor Capital; and (vi) 158,281 PIPE Shares held by Luxor Wavefront, LP (“Luxor Wavefront”) beneficially owned by Luxor Capital Group, LP, the investment manager of Luxor Wavefront. Christian Leone, in his position as Portfolio Manager at Luxor Capital Group, LP, may be deemed to have voting and investment power with respect to the securities owned by Luxor Long Offshore, Luxor Long, Luxor Offshore, Luxor Capital, and Luxor Wavefront. Jonathan Green, in his position as Portfolio Manager at Luxor Capital Group, LP, may be deemed to have voting and investment power with respect to the securities held by Lugard. Mr. Leone and Mr. Green each disclaims beneficial ownership of any of the PIPE shares over which each exercises voting and investment power. The mailing address of each of the above-mentioned funds is 1114 Avenue of the Americas, 28th Fl New York, NY 10036. |
| (26) | Shares hereby offered consist of 1,200,000 PIPE Shares, of which (i) 1,100,000 are held by Integrated Core Strategies (US) LLC (“Integrated Core Strategies”) and (ii) 100,000 are held by ICS Opportunities, Ltd. (“ICS Opportunities”), 28,494 warrants, of which (i) 100 warrants are held by Integrated Core Strategies and (ii) 28,394 warrants are held by ICS Opportunities and 225,239 shares of Hippo Holdings common stock held directly by ICS Opportunities II LLC. Millennium International Management LP, a Delaware limited partnership (“Millennium International Management”), is the investment manager to ICS Opportunities and may be deemed to have shared voting control and investment discretion over securities owned by ICS Opportunities. Millennium Management LLC, a Delaware limited liability company (“Millennium Management”), is the general partner of the managing member of Integrated Core Strategies and may be deemed to have shared voting control and investment discretion over securities owned by Integrated Core Strategies. Millennium Management is also the general partner of the 100% owner of ICS Opportunities and may also be deemed to have shared voting control and investment discretion over securities owned by ICS Opportunities. Millennium Group Management LLC, a Delaware limited liability company (“Millennium Group Management”), is the managing member of Millennium Management and may also be deemed to have shared voting control and investment discretion over securities owned by Integrated Core Strategies. Millennium Group Management is also the general partner of Millennium International Management and may also be deemed to have shared voting control and investment discretion over securities owned by ICS Opportunities. The managing member of Millennium Group Management is a trust of which Israel A. Englander, a United States citizen (“Mr. Englander”), currently serves as the sole voting trustee. Therefore, Mr. Englander may also be deemed to have shared voting control and investment discretion over securities owned by Integrated Core Strategies and ICS Opportunities. The business address of the above-referenced entities is c/o Millennium Management LLC 399 Park Avenue, New York, New York 10022. |
| (27) | Shares hereby offered consist of 4,000,000 PIPE Shares, of which (i) 3,642,400 are held by Park West Investors Master Fund, Limited and (ii) 357,600 are held by Park West Partners International, Limited (collectively, the “PW Funds”). Park West Asset Management LLC is the investment manager to the PW Funds. Peter S. Park, through one or more affiliated entities, is the controlling manager of Park West Asset Management LLC. The business address for the PW Funds is c/o Park West Asset Management LLC, 900 Larkspur Landing Circle, Suite 165, Larkspur, California 94939. |
| (28) | Shares hereby offered consist of 2,000,000 PIPE Shares, of which (i) 488,200 are held by Saba Capital Master Fund, Ltd., (ii) 1,325,600 are held Saba Capital Master Fund II, Ltd. and (iii) 186,200 are held by Saba Capital Master Fund III, L.P. (the “Saba Funds”). Boaz Weinstein is the managing member of the general partner of the Saba Funds investment manager and accordingly may be deemed to have voting and dispositive power with respect to shares held by the Saba Funds. Mr. Boaz disclaims beneficial ownership of the securities reported herein for purposes of Section 16 of the Securities and Exchange Act of 1934, as amended, except as to such extent of such reporting person’s pecuniary interest in the securities. The business address of the Saba Funds is c/o Saba Capital Management, LP, 405 Lexington Avenue, 58 th Floor, New York, New York 10174. |
| (29) | Shares hereby offered consist of 500,000 PIPE Shares, of which (i) 224,631 are held by Samlyn Offshore Master Fund, Ltd., (ii) 180,352 are held Samlyn Net Neutral Master Fund, Ltd., (iii) 89,538 are held by |
147
| Samlyn Onshore Fund, LP and (iv) 5,479 are held by Samlyn Long Alpha Master Fund, Ltd. (the “Samlyn Funds”). The reported securities are directly owned by the Samlyn Funds, and may be deemed to be indirectly beneficially owned by (i) Samlyn Capital, LLC, as the investment manager of the Samlyn Funds, and (ii) Samlyn Partners, LLC (“Samlyn Partners”), as the general partner of the Samlyn Funds. The reported securities may also be deemed to be indirectly beneficially owned by Robert Pohly as the principal of Samlyn Capital and Managing Member of Samlyn Partners. Samlyn Capital, Samlyn Partners and Robert Pohly disclaim beneficial ownership of the reported securities except to the extent of their respective pecuniary interests therein, and this report shall not be deemed an admission that any of them are the beneficial owners of the securities for purposes of Section 16 of the Exchange Act or for any other purpose. The business address of the Samlyn Funds is c/o Samlyn Capital, LLC, 500 Park Avenue, New York, New York 10022. |
| (30) | Shares hereby offered consist of 1,000,000 PIPE Shares, of which (i) 565,000 are held by SDP Flagship Master Fund, L.P., (ii) 200,000 are held by NPB Manager Fund, SPC., on behalf of and for the account of Segregated Portfolio 103, (iii) 170,000 are held by SDP Opportunities Master Fund, L.P. and (iv) 65,000 are held by NPB Manager Fund, SPC., on behalf of and for the account of Segregated Portfolio 102 (together, the “Sentinel Entities”). Qazi Munirul Alam is the chief investment officer of Sentinel Dome Partners, LLC, the investment adviser to the Sentinel Entities and has voting and/or investment control over the shares held by the Sentinel Entities. The business address of the Sentinel Entities is 3 Embarcadero Center, Suite 1680, San Francisco, California 94111. |
| (31) | Shares hereby offered consist of 650,000 PIPE Shares, of which (i) 250,000 are held by Serengeti Caracal Multi-Series Master LLC — Series AL, (ii) 100,000 are held Serengeti Multi-Series Master LLC — Series C II, (iii) 150,000 are held by Serengeti Multi-Series Master LLC — Series SPC II, (iv) 50,000 are held by Serengetie Multi-Series Master LLC — Series USF and (v) 100,000 are held by Serengeti Opportunities MM LP. Shares hereby offered also consist of 50,000 warrants, of which (i) 30,000 warrants are held by Serengeti Opportunities MM LP and (ii) 20,000 warrants are held by Serengeti Multi-Series Master LLC. Serengeti Asset Management LP is investment adviser for Serengeti Caracal Multi-Series Master LLC — Series AL. J.L. Serengeti Management LLC is the general partner of Serengeti Asset Management LP. Joseph A. LaNasa III is the managing member of J.L. Serengeti Management LLC. In such capacities, each of Serengeti Asset Management LP, J.L. Serengeti Management LLC and Mr. LaNasa may be deemed to have voting and dispositive power over the shares held by Serengeti Caracal Multi-Series Master LLC — Series AL. Mr. LaNasa disclaims beneficial ownership of these shares. The address for Serengeti Caracal Multi-Series Master LLC — Series AL, Serengeti Asset Management LP, J.L. Serengeti Management LLC and Mr. LaNasa is 632 Broadway, Suite 901, New York, NY 10012. Serengeti Asset Management LP is investment adviser for Serengeti Multi-Series Master LLC — Series C II. J.L. Serengeti Management LLC is the general partner of Serengeti Asset Management LP. Joseph A. LaNasa III is the managing member of J.L. Serengeti Management LLC. In such capacities, each of Serengeti Asset Management LP, J.L. Serengeti Management LLC and Mr. LaNasa may be deemed to have voting and dispositive power over the shares held by Serengeti Multi-Series Master LLC — Series C II. Mr. LaNasa disclaims beneficial ownership of these shares. The address for Serengeti Multi-Series Master LLC — Series C II, Serengeti Asset Management LP, J.L. Serengeti Management LLC and Mr. LaNasa is 632 Broadway, Suite 901, New York, NY 10012. Serengeti Asset Management LP is investment adviser for Serengeti Multi-Series Master LLC — Series SPC II. J.L. Serengeti Management LLC is the general partner of Serengeti Asset Management LP. Joseph A. LaNasa III is the managing member of J.L. Serengeti Management LLC. In such capacities, each of Serengeti Asset Management LP, J.L. Serengeti Management LLC and Mr. LaNasa may be deemed to have voting and dispositive power over the shares held by Serengeti Multi- Series Master LLC — Series SPC II. Mr. LaNasa disclaims beneficial ownership of these shares. The address for Serengeti Multi-Series Master LLC — Series SPC II, Serengeti Asset Management LP, J.L. Serengeti Management LLC and Mr. LaNasa is 632 Broadway, Suite 901, New York, NY 10012. Serengeti Asset Management LP is investment adviser for Serengeti Multi-Series Master LLC — Series USF. J.L. Serengeti Management LLC is the general partner of Serengeti Asset Management LP. Joseph A. LaNasa III is the managing member of J.L. Serengeti Management LLC. In such capacities, each of Serengeti Asset Management LP, J.L. Serengeti Management LLC and Mr. LaNasa may be deemed to have voting and |
148
| dispositive power over the shares held by Serengeti Multi-Series Master LLC — Series USF. Mr. LaNasa disclaims beneficial ownership of these shares. The address for Serengeti Multi-Series Master LLC — Series USF, Serengeti Asset Management LP, J.L. Serengeti Management LLC and Mr. LaNasa is 632 Broadway, Suite 901, New York, NY 10012. Serengeti Asset Management LP is investment adviser for Serengeti Opportunities MM LP. J.L. Serengeti Management LLC is the general partner of Serengeti Asset Management LP. Joseph A. LaNasa III is the managing member of J.L. Serengeti Management LLC. In such capacities, each of Serengeti Asset Management LP, J.L. Serengeti Management LLC and Mr. LaNasa may be deemed to have voting and dispositive power over the shares held by Serengeti Opportunities MM LP. Mr. LaNasa disclaims beneficial ownership of these shares. The address for Serengeti Opportunities MM LP, Serengeti Asset Management LP, J.L. Serengeti Management LLC and Mr. LaNasa is 632 Broadway, Suite 901, New York, NY 10012. |
| (32) | Shares hereby offered consist of 600,000 PIPE Shares, of which (i) 595,000 are held by Suvretta Master Fund, Ltd. and (ii) 5,000 are held by Suvretta Long Master Fund, Ltd. (together, the “Suvretta Funds”). The Suvretta Funds are exempt companies organized under the laws of the Cayman Islands. Aaron Cowen is the control person of Suvretta Capital Management, LLC, the investment manager of the Suvretta Funds and has voting and/or investment control over the shares held by the Suvretta Funds. The business address for the Suvretta Funds is 540 Madison Avenue, 7 th Floor, New York, New York 10022. |
| (33) | Shares hereby offered consist of 300,000 PIPE Shares, of which (i) 137,970 are held by Nineteen77 Global Multi-Strategy Alpha Master Limited, (ii) 137,970 are held by Nineteen77 Global Merger Arbitrage Master Limited, (ii) 23,040 are held by Nineteen77 Global Merger Arbitrage Opportunity Fund and (iv) 1,020 are held by IAM Investments ICAV – O’Connor Event Driven UCITS Fund (together, the “UBS Entities”). Kevin Russell, the chief investment officer of UBS O’Connor LLC, the investment manager of the UBS Entities, has voting and/or investment control over the shares held by the UBS Entities. Mr. Russell disclaims beneficial ownership of the securities reported herein for purposes of Section 16 of the Securities and Exchange Act of 1934, as amended, except as to such extent of such reporting person’s pecuniary interest in the securities. The business address for the UBS Entities is c/o UBS O’Connor LLC, One North Wacker Drive, 31 st Floor, Chicago, Illinois 60606. |
| (34) | Shares offered hereby consist of 1,000,000 PIPE Shares held directly by Gan Eden Ventures, Inc. Gan Eden Ventures, Inc. is a corporation organized under Canadian law. Mark Chess and Edward Weisz are the directors of Gan Eden Ventures, Inc. and have voting and/or investment control over the shares held by Gan Eden Ventures, Inc. The business address of Gan Eden Ventures, Inc. is 1 Herons Will Way, Toronto, Ontario, Canada M2J O2G. |
| (35) | Shares offered hereby consist of 100,000 PIPE Shares held directly by Garden Fund, LLC. Garden Fund, LLC is a limited liability company organized under California law. The business address of Garden Fund, LLC is 1 Sansome Street, Suite 3500, San Francisco, California 94104. |
| (36) | Shares hereby offered consist of 500,000 PIPE Shares held directly by Ghisallo Master Fund LP. Michael Germino is a control person for Ghisallo Master Fund LP. The address for Ghisallo Master Fund LP is 190 Elgin Avenue, George Town, Grand Cayman, Cayman Islands KY 1-9008. |
| (37) | Shares hereby offered consist of 500,000 PIPE Shares held directly by Gores HP, LLC. Gores HP, LLC is a partnership organized under the laws of Delaware. The business address of Gores HP, LLC is 6260 Lookout Road, Boulder, Colorado 80301. |
| (38) | Shares hereby offered consist of 500,000 PIPE Shares held in trust by Gundy Co for The HCG Fund LP. The HCG Fund LP is a limited partnership organized under the laws of Canada. Sean Kallir is the chief executive officer and primary manager of HCG Investment Management Inc., the investment manager of The HCG Fund LP and has voting and/or investment control over the shares held by The HCG Fund LP. The business address of The HCG Fund LP is 366 Adelaide St W, Suite 601, Toronto, ON, M5V 1R9. |
| (39) | Shares hereby offered consist of 500,000 PIPE Shares and 29,682 warrants held by clients of Hound Partners, LLC. Hound Partners, LLC is a limited liability company organized under the laws of Delaware. Jonathan Auerbach is the portfolio manager of Hound Partners, LLC and has voting and/or investment control over the shares held by such clients. The business address of Hound Partners, LLC is 101 Park Avenue, 48th Floor, New York, New York 10178. |
149
| (40) | Consists of 1,076,362 shares of Hippo Holdings common stock, all of which are held by Mr. Frater as trustee of a trust. |
| (41) | Shares hereby offered consist of 600,000 PIPE Shares held directly by Invus Public Equities, L.P. Invus Public Equities Advisors, LLC (“Invus PE Advisors”) controls Invus PE, as its general partner and accordingly, may be deemed to beneficially own the shares held by Invus PE. Artal Treasury Limited (“Artal Treasury”) controls Invus PE Advisors, as its managing member and accordingly, may be deemed to beneficially own the shares held by Invus PE. Artal International S.C.A. (“Artal International”) through its Geneva branch, is the sole stockholder of Artal Treasury and may be deemed to beneficially own the 600,000 shares that Artal Treasury may be deemed to beneficially own. Artal International Management S.A. (“Artal International Management”), as the managing partner of Artal International, controls Artal International and accordingly, may be deemed to beneficially own the shares that Artal International may be deemed to beneficially own. Artal Group S.A., as the sole stockholder of Artal International Management, controls Artal International Management and accordingly, may be deemed to beneficially own the shares that Artal International Management may be deemed to beneficially own. Westend S.A. (“Westend”), as the parent company of Artal Group S.A. (“Artal Group”), controls Artal Group and accordingly, may be deemed to beneficially own the shares that Artal Group may be deemed to beneficially own. Stichting Administratiekantoor Westend (the “Stichting”), as majority shareholder of Westend, controls Westend and accordingly, may be deemed to beneficially own the shares that Westend may be deemed to beneficially own. As of August 17,2021 Mr. Amaury Wittouck, as the sole member of the board of the Stichting, controls the Stichting and accordingly, may be deemed to beneficially own the shares that the Stichting may be deemed to beneficially own. The business address of Invus Public Equities, L.P. is 750 Lexington Avenue, 30 th Floor, New York, New York 10022. |
| (42) | Shares hereby offered consist of 400,000 PIPE Shares held directly by Jane Street Global Trading, LLC and 38,903 warrants. Jane Street Global Trading, LLC is a wholly owned subsidiary of Jane Street Group, LLC. Michael A. Jenkins and Robert. A. Granieri are the members of the Operating Committee of Jane Street Group, LLC and have voting and/or investment control over the shares held by Jane Street Global Trading, LLC. The business address of Jane Street Global Trading LLC is 250 Vesey Street, 3 rd Floor, New York, New York 10281. |
| (43) | Consists of 30,000 shares of Hippo Holdings common stock held directly by Julie Hanna. |
| (44) | Consists of 30,000 shares of Hippo Holdings common stock held directly by Lee Linden. |
| (45) | Shares hereby offered consist of 100,000 PIPE Shares owned directly by LEN FW Investor, LLC and 80,686,369 shares of Hippo Holdings common stock, of which (i) 51,447,246 are common stock directly held by Fifth Wall Ventures SPV IV L.P., and (ii) 29,239,123 are common stock directly held by LEN FW Investor, LLC. Fifth Wall Ventures, L.P. has granted LEN FW Investor, LLC an irrevocable voting proxy in respect of the shares referred to in clause (i) herein, which are held directly by Fifth Wall Ventures SPV IV L.P. The address of the above persons and entities is 11360 Mindanao Way, Suite 100B, Marina Del Rey, California 90292. |
| (46) | Consists of 30,000 shares of Hippo Holdings common stock held directly by Linda Rottenberg. |
| (47) | Shares hereby offered consist of 500,000 PIPE Shares held directly by Linden Capital L.P. The securities held by Linden Capital L.P. are indirectly held by Linden Advisors LP (the investment manager of Linden Capital L.P.), Linden GP LLC (the general partner of Linden Capital L.P.), and Mr. Siu Min (Joe) Wong (the principal owner and the controlling person of Linden Advisors LP and Linden GP LLC). Linden Capital L.P., Linden Advisors LP, Linden GP LLC and Mr. Wong share voting and dispositive power with respect to the securities held by Linden Capital L.P. The business address of Linden Capital L.P. is c/o Linden Advisors LP, 590 Madison Avenue, 15 th Floor, New York, New York 10022. |
| (48) | Shares hereby offered consist of 100,000 PIPE Shares held directly by Madison Rock Investments LP. Madison Rock Investments LP is a partnership organized under the laws of Delaware. The business address of Madison Rock Investments LP is 630 Fifth Avenue, New York, New York 10111. |
| (49) | Shares hereby offered consist of 250,000 PIPE Shares held directly by Octahedron Master Fund, L.P. Octahedron Master Fund, L.P. is a limited partnership organized under the laws of the Cayman Islands. Octahedron Fund GP LLC is the general partner of Octahedron Master Fund, L.P. Rajaraman Parameswaram is the managing member of Octahedron Fund GP LLC and has voting and/or investment |
150
| control over the shares held by Octahedron Master Fund L.P. Mr. Parameswaram disclaims beneficial ownership of the securities reported herein for purposes of Section 16 of the Securities and Exchange Act of 1934, as amended, except as to such extent of such reporting person’s pecuniary interest in the securities. The business address for Octahedron Mater Fund, L.P. is 4126 17 th Street, Suite #2, San Francisco, California 94114. |
| (50) | Shares hereby offered consist of 2,000,000 PIPE Shares held directly by PBCAY One Limited. PBCAY One Limited is a company organized under the laws of the Cayman Islands. The business address of PBCAY One Limited is 201 The Exchange Building, DIFC, PO Box 116020, Dubai, U.A.E. |
| (51) | Shares hereby offered consist of 1,000,000 PIPE Shares held directly by Psagot Provident Funds and Pensions Ltd. Psagot Provident Funds and Pensions Ltd is a management company organized under the laws of Israel. The business address for Psagot Provident Funds and Pensions Ltd is 14 Ahad Ha’am Street, Tel Aviv, Israel 6514211. |
| (52) | Shares hereby offered consist of 1,000,000 PIPE Shares held directly by Reinvent Capital Fund LP. Reinvent Capital Fund GP LLC is the general partner of Reinvent Capital Fund LP. Due to its relationship with Reinvent Capital Fund LP, Reinvent Capital Fund GP LLC may be deemed to beneficially own the PIPE Shares directly held by Reinvent Capital Fund LP. Mark Pincus and Michael Thompson are the managing members of Reinvent Capital Fund GP LLC and may therefore be deemed to beneficially own the PIPE Shares held directly by Reinvent Capital Fund LP. Mr. Pincus and Mr. Thompson each disclaim beneficial ownership of the PIPE Shares held directly by Reinvent Capital Fund LP except to the extent of their pecuniary interest therein. The business address of Reinvent Capital Fund LP is 215 Park Avenue S, 11th Floor, New York, New York 10023. |
| (53) | Shares offered hereby consist of (i) 5,630,000 shares of Hippo Holdings common stock held directly by the Sponsor and (ii) 4,400,000 shares of Hippo Holdings common stock issuable upon exercise of the private placement warrants. Each of Reid Hoffman, Mark Pincus, Michael Thompson, David Cohen, and Lee Linden (who are each former directors and/or officers of RTPZ), or entities related thereto, among others, are members of the Sponsor. Messrs. Hoffman and Pincus may be deemed to beneficially own shares held by the Sponsor by virtue of their shared control over the Sponsor. Other than Messrs. Hoffman and Pincus, no member of the Sponsor exercises voting or dispositive control over any of the shares held by the Sponsor. Each of Messrs. Hoffman and Pincus disclaims beneficial ownership of the ordinary shares held by the Sponsor, except to the extent of his pecuniary interest therein. The 4,400,000 private placement warrants offered hereby are held directly by the Sponsor. These securities are subject to a contractual lock-up as described under “Certain Relationships and Related Party Transactions — Old Hippo — Lockup Agreements. Certain Relationships and Related Party Transactions — Old Hippo — Registration Rights Agreement |
| (54) | Shares hereby offered consist of 300,000 PIPE Shares held directly by Ribbit Capital VI, L.P. Ribbit Capital VI, L.P. is an exempt limited partnership organized under the laws of the Cayman Islands. Ribbit Capital GP VI, Ltd. is the general partner of Ribbit Capital VI, L.P. Meyer Malka is the director of Ribbit Capital GP VI, Ltd. and has voting and/or investment control over the shares held by Ribbit Capital VI, L.P. The business address for Ribbit Capital VI, L.P. is 362 University Avenue, Palo Alto, California 94301. |
| (55) | Consists of (i) 4,324,332 shares of Hippo Holdings common stock, of which approximately 2,508,501 shares are held by Mr. McCathron and (ii) 667,633 shares of Hippo Holdings common stock issuable pursuant to Hippo options. |
| (56) | Consists of 30,644,982 shares of Hippo Holdings, of which (i) 26,369,086 are common stock directly held by RPM Ventures III, L.P. and (ii) 4,275,687 are common stock directly held by BGW Ventures II, LP, an affiliate of RPM Ventures III, L.P. The address of the above persons and entities is 320 N. Main Street, Suite 400, Ann Arbor, Michigan 48104. |
| (57) | Consists of (i) no shares of Hippo Holdings common stock and (ii) 81,130 shares of Hippo Holdings common stock issuable pursuant to Hippo options. |
| (58) | Shares hereby offered consist of 1,000,000 PIPE Shares held directly by Schonfeld Strategic 460 Fund LLC. Schonfeld Strategic 460 Fund LLC is a limited liability company organized under the laws of Delaware. The |
151
| business address of Schonfeld Strategic 460 Fund LLC is 460 Park Avenue, 19 th Floor, New York, New York 10022. |
| (59) | Shares hereby offered consist of 2,250,000 PIPE Shares held directly by Senator Global Opportunity Master Fund L.P. Senator Global Opportunity Master Fund L.P. is a limited partnership organized under the laws of the Cayman Islands. Senator Investment Group LP (“Senator”) is investment manager of Senator Global Opportunity Master Fund L.P. and may be deemed to have voting and dispositive power with respect to the shares. The general partner of Senator is Senator Management LLC (the “Senator GP”). Douglas Silverman controls Senator GP, and, accordingly, may be deemed to have voting and dispositive power with respect to the shares held by this selling security holder. Mr. Silverman disclaims beneficial ownership of the securities reported herein for purposes of Section 16 of the Securities and Exchange Act of 1934, as amended, except as to such extent of such reporting person’s pecuniary interest in the securities. The business address for Senator Global Opportunity Master Fund L.P. is 510 Madison Avenue, 28 th Floor, New York, New York 10022. |
| (60) | Shares hereby offered consist of 75,000 PIPE Shares held directly by Shapero 2015 Trust. Daniel Shapero is the trustee for Shapero 2015 Trust and has voting and/or investment control over the shares held by Shapero 2015 Trust. The business address of Shapero 2015 Trust is 920 Hamilton Avenue, Palo Alto, California 94301. |
| (61) | Shares hereby offered consist of 1,000,000 PIPE Shares held directly by Slate Path Master Fund LP. Slate Path Master Fund LP is an exempted limited partnership organized under the laws of the Cayman Islands. Slate Path Capital GP LLC is the general partner of Slate Path Master Fund LP. David Greenspan is the managing member of Slate Path Capital GP LLC and has voting and/or investment control over the shares held by Slate Path Master Fund LP. Mr. Greenspan disclaims beneficial ownership of the securities reported herein for purposes of Section 16 of the Securities and Exchange Act of 1934, as amended, except as to such extent of such reporting person’s pecuniary interest in the securities. The business address for Slate Path Master Fund LP is 717 Fifth Avenue, 16 th Floor, New York, New York 10022. |
| (62) | Shares hereby offered consist of 700,000 PIPE Shares held directly by Smith’s Point Family Partners LLC. Smith’s Point Family Partners LLC is a limited liability company organized under the laws of Pennsylvania. The business address of Smith’s Point Family Partners LLC is PO Box 500, Gladwyne, Pennsylvania 19035. |
| (63) | Consists of (i) 3,366,803 shares of Hippo Holdings common stock, 3,108,425 of which are held by Mr. Ellis and 258,378 of which are held for the benefit of Mr. Ellis by a trust and (ii) no shares of Hippo Holdings common stock issuable pursuant to Hippo options. |
| (64) | Shares hereby offered consist of 2,000,000 PIPE Shares held directly by Soroban Opportunities Master Fund LP. Soroban Opportunities Master Fund LP is an exempted limited partnership organized under the laws of the Cayman Islands. Soroban Capital GP LLC may be deemed to beneficially own the shares by virtue of its role as general partner of Soroban Opportunities Master Fund LP. Soroban Capital Partners LP may be deemed to beneficially own the shares by virtue of its role as investment manager of Soroban Opportunities Master Fund LP. Soroban Capital Partners GP LLC may be deemed to beneficially own the shares by virtue of its role as general partner of Soroban Capital Partners LP. Eric W. Mandelblatt may be deemed to beneficially own the shares by virtue of his role as Managing Partner of Soroban Capital Partners GP LLC. Each of Soroban Capital GP LLC, Soroban Capital Partners LP, Soroban Capital Partners GP LLC and Eric W. Mandelblatt disclaim beneficial ownership of the Shares except to the extent of his or its pecuniary interest therein. The business address of Soroban Opportunities Master Fund LP is c/o Soroban Capital Partners LP, 55 W 46 th Street, 32nd Floor, New York, New York 10036. |
| (65) | Shares hereby offered consist of 10,000 PIPE Shares held directly by Adam Nash and Carolyn Nash as trustees of The Adam & Carolyn Nash Family Trust, U/D/T January 25, 2012. The business address of The Adam & Carolyn Nash Family Trust, U/D/T January 25, 2012 is 300 3rd Street, Suite 7, Los Altos, California 94022. |
| (66) | Shares hereby offered consist of 1,000,000 PIPE Shares held by Third Point Loan LLC. (“TP Loan”). TP Loan holds the securities listed herein as nominee for funds managed and/or advised by Third Point LLC (“Third Point”) and not in its individual capacity. Daniel S. Loeb is the Chief Executive Officer of Third Point. By reason of the provisions of Rule 13d-3 under the Securities Exchange Act of 1934, as amended, Third Point and Mr. Loeb may be deemed to be the beneficial owners of the securities beneficially owned |
152
| by TP Loan. Third Point and Mr. Loeb hereby disclaim beneficial ownership of all such securities, except to the extent of any indirect pecuniary interest therein. The business address for Mr. Loeb and the entities identified in this footnote is c/o Third Point LLC, 55 Hudson Yards, 51st Floor, New York, NY 10001. |
| (67) | Shares hereby offered consist of 200,000 PIPE Shares held directly by Transcend Partners LLC. Transcend Partners LLC is a limited liability company organized under the laws of Delaware. Malcolm Fairbairn and Emily Fairbairn are members of Transcend Partners LLC and have voting and/or investment control over the shares held by Transcend Partners LLC. The business address of Transcend Partners LLC is 10 Orginda View, Orinda, California 94563. |
| (68) | Shares hereby offered consist of 1,200,000 PIPE Shares held directly by Weiss Ventures I LLC. Weiss Ventures I LLC is a Delaware limited liability company wholly-owned by Brookdale Aggregate Holdings LLC (“BAH”), a private investment fund. BAH is a subsidiary owned by Brookdale International Partners, L.P. (“BIP”) and Brookdale Global Opportunity Fund (“BGO”). BIP and BGO are both private investment funds. Weiss Asset Management LP (“WAM”), a U.S.-based, SEC-registered investment adviser, is the investment manager of BIP and BGO. BIP GP LLC (“BIP GP”) is the general partner of BIP. WAM is the manager of Weiss Ventures I LLC and BAH. WAM GP is the general partner of WAM and the manager of BIP GP. Andrew Weiss is the managing member of WAM GP. Each of Andrew Weiss, BIP GP, WAM and WAM GP disclaim beneficial ownership of such securities except to the extent of their respective pecuniary interests therein. The business address of Weiss Ventures I LLC is 222 Berkeley Street, 16th Floor, Boston, Massachusetts 02116. |
| (69) | Shares hereby offered consist of 600,000 PIPE Shares held directly by West Coast Equity Partners LLC. WCEP Management LLC is the managing company of West Coast Equity Partners LLC. Alexander Lazovsky, Anton Baranchuk and Sergey Yushin are the management members of WCEP Management LLC and have voting and/or investment control over the shares held by West Coast Equity Partners LLC. Mr. Lazovsky, Mr. Baranchuck and Mr. Yushin disclaim beneficial ownership of the securities reported herein for purposes of Section 16 of the Securities and Exchange Act of 1934, as amended, except as to such extent of such reporting person’s pecuniary interest in the securities. The business address of West Coast Equity Partners LLC is 703 Crestview Drive, San Carlos, California 94070. |
| (70) | Shares hereby offered consist of 4,500,000 PIPE Shares held directly by XN Exponent Master Fund LP. XN Exponent Master Fund LP is a limited partnership organized under the laws of the Cayman Islands. XN Exponent Advisors LLC serves as investment manager to XN Exponent Master Fund LP (the “Fund”) and has discretionary authority to make investment decisions and determine how to vote any securities held by the Fund. XN Exponent Advisors LLC is wholly owned by XN LP, a registered investment advisor. The general partner of XN LP is XN Management GP LLC, which is indirectly controlled by Gaurav Kapadia. The principal business address of the entities referenced herein is 412 West 15th Street, 13th Floor, New York, New York. |
153
CERTAIN RELATIONSHIPS AND RELATED PERSON TRANSACTIONS
In addition to the compensation arrangements with directors and executive officers described under “Executive Compensation” and “Management” and the registration rights described elsewhere in this prospectus, the following is a description of each transaction since January 1, 2018 and each currently proposed transaction in which:
| • | we have been or are to be a participant; |
| • | the amount involved exceeds or will exceed $120,000; and |
| • | any of our directors, executive officers or beneficial holders of more than 5% of our capital stock, or any immediate family member of, or person sharing the household with, any of these individuals (other than tenants or employees), had or will have a direct or indirect material interest. |
Reinvent Technology Partners Z
RTPZ Founder Shares
Prior to RTPZ’s initial public offering, the Sponsor purchased 5,750,000 RTPZ founder shares, and, in October 2020, the Sponsor transferred 30,000 RTPZ founder shares to each of Byron Auguste, Julie Hanna, Lee Linden and Linda Rottenberg, RTPZ’s independent directors prior to the Domestication.
The RTPZ founder shares were identical to the RTPZ Class A ordinary shares included in the units sold in RTPZ’s initial public offering, except that (i) only the holders of the RTPZ founder shares had the right to vote on the appointment of directors and holders of a majority of the RTPZ founder shares could remove a member of the board of directors for any reason (as set forth in the Cayman Constitutional Documents), (ii) the RTPZ founder shares were subject to certain transfer restrictions, (iii) the holders of the RPTZ founder shares agreed pursuant to a letter agreement to waive (x) their redemption rights with respect to the RTPZ founder shares and public shares held by them in connection with the completion of RTPZ’s initial business combination, (y) their redemption rights with respect to any RTPZ founder shares and public shares held by them in connection with a shareholder vote to amend the Cayman Constitutional Documents (A) to modify the substance or timing of RTPZ’s obligation to allow redemption in connection with RTPZ’s initial business combination or to redeem 100% of the public shares if RTPZ did not complete a business combination within 24 months from the closing of its initial public offering (or 27 months from the closing of the initial public offering if RTPZ had executed a letter of intent, agreement in principle or definitive agreement for an initial business combination within 24 months from the closing of the initial public offering but had not completed the initial business combination within such
24-month
period) or (B) with respect to any other provision relating to shareholders’ rights orpre-initial
business combination activity and (z) their rights to liquidating distributions from the trust account with respect to the RTPZ founder shares if RTPZ failed to complete a business combination within 24 months from the closing of its initial public offering (or 27 months, as applicable) or during any extension of such time period, (iv) the RTPZ founder shares were automatically convertible into RTPZ Class A ordinary shares at the time of the initial business combination or earlier at the option of the holder and (v) the RTPZ founder shares were entitled to registration rights.In connection with the Business Combination, upon the Domestication, the 5,750,000 RTPZ founder shares converted automatically, on abasis, into 5,750,000 shares of Hippo Holdings common stock.
one-for-one
Private Placement Warrants
Simultaneously with the consummation of RTPZ’s initial public offering, the Sponsor purchased 4,400,000 private placement warrants at a price of $1.50 per warrant, or $6.6 million in the aggregate, in a private placement. Each private placement warrant entitled the holder to purchase one RTPZ Class A ordinary share for $11.50 per share. A portion of the proceeds from the sale of the private placement warrants was placed in the trust account of RTPZ.
154
The private placement warrants are identical to the warrants included in the units sold in RTPZ’s initial public offering except that, so long as they are held by the Sponsor or its permitted transferees, the private placement warrants: (i) are not redeemable by RTPZ (except in certain redemption scenarios when the price per Class A ordinary share equals or exceeds $10.00 (as adjusted)), (ii) may be exercised on a cashless basis and (iii) are entitled to registration rights (including the ordinary shares issuable upon exercise of the private placement warrants). Additionally, the Sponsor agreed not to transfer, assign or sell any of the private placement warrants, including the RTPZ Class A ordinary shares issuable upon exercise of the private placement warrants (except to certain permitted transferees), until 30 days after the completion of RTPZ’s initial business combination.
In connection with the Business Combination, upon the Domestication, each of the 4,400,000 private placement warrants converted automatically into a warrant to acquire one share of Hippo Holdings common stock pursuant to the Warrant Agreement.
Registration Rights
The holders of the RTPZ founder shares, private placement warrants, and warrants that may be issued upon conversion of working capital loans, if any (and any RTPZ Class A ordinary shares issuable upon the exercise of the private placement warrants or warrants issued upon conversion of the working capital loans and upon conversion of the Founder Shares) were entitled to registration rights pursuant to a registration rights agreement, signed November 18, 2020 requiring RTPZ to register such securities for resale (in the case of the RTPZ founder shares, only after conversion to RTPZ Class A ordinary shares). The holders of these securities were entitled to make up to three demands, excluding short form demands, that RTPZ register such securities. In addition, the holders had certain “piggy-back” registration rights with respect to registration statements filed subsequent to the completion of RTPZ’s initial business combination and rights to require RTPZ to register for resale such securities pursuant to Rule 415 under the Securities Act. RTPZ was to bear the expenses incurred in connection with the filing of any such registration statements.
In connection with the Business Combination, the registration rights agreement was amended and restated, as described below under.
Old Hippo — Registration Rights Agreement
Subscription Agreements
On March 3, 2021, concurrently with the execution of the Merger Agreement, RTPZ entered into a Subscription Agreement with Reinvent Capital Fund LP, pursuant to which Reinvent Capital Fund subscribed for shares of Hippo Holdings common stock in connection with the PIPE Investment. Reinvent Capital Fund LP, a
fund co-founded by
Reid Hoffman, Mark Pincus and Michael Thompson, funded $10 million of the PIPE Investment, for which it received 1,000,000 shares of Hippo Holdings common stock. In addition, certain former directors and officers of RTPZ, including Mr. Hoffman, Mr. Pincus, Mr. Thompson and Mr. Cohen, have economic interests in Reinvent Capital Fund LP.The PIPE Investment was consummated substantially concurrently with the closing of the Business Combination and Reinvent Capital Fund LP acquired 1,000,000 shares of Hippo Holdings common stock it subscribed for in connection with the PIPE Investment.
Sponsor Agreement
On March 3, 2021, the Sponsor entered into the Sponsor Agreement with RTPZ and Old Hippo. Under the Sponsor Agreement, the parties thereto agreed, among other things, that (i) the 5,630,000 Sponsor Shares are subject to certain vesting and
lock-up
terms, (ii) in addition to the existing exercise provisions in the Warrant Agreement, the Sponsor will exercise all of its private placement warrants for cash or on a “cashless basis” on or prior to the date upon which Hippo Holdings elects to redeem the public warrants in accordance with the Warrant155
Agreement, if, among other conditions, the last reported sales price of the Hippo Holdings common stock for any 20 trading days within the 30
trading-day
period ending on the third trading day prior to the date on which notice of the redemption is given exceeds $25.00 per share (subject to certain adjustments), and (iii) the Sponsor will have certain rights with respect to board representation of Hippo Holdings.Sponsor Support Agreement
On March 3, 2021, in connection with the execution of the Merger Agreement, RTPZ, each of the directors and officers of RTPZ, the Sponsor and Old Hippo entered into the Sponsor Support Agreement. Pursuant to the Sponsor Support Agreement, the Sponsor and each of the directors and officers of RTPZ agreed to, among other things, vote to adopt and approve the Merger Agreement and all other documents and transactions contemplated thereby, in each case, subject to the terms and conditions of the Sponsor Support Agreement.
The Sponsor Support Agreement terminated in its entirety as of the Effective Time. As a result of such termination, all obligations of the parties under the Sponsor Support Agreement have terminated, without any liability or other obligation on the part of any party thereto to any person in respect thereof or the transactions contemplated thereby, and no party thereto will have any claim against another (and no person will have any rights against such party), whether under contract, tort or otherwise, with respect to the subject matter thereof; provided, however, that such termination will not relieve any party thereto from liability arising in respect of any breach of the Sponsor Support Agreement prior to such termination.
Related Party Note and Advances
On October 7, 2020, RTPZ issued an unsecured promissory note to the Sponsor, pursuant to which RTPZ borrowed an aggregate principal amount of approximately $300,000. The note was
non-interest
bearing and payable on the earlier of (i) December 31, 2021 and (ii) the completion of RTPZ’s initial public offering. The borrowings outstanding under the note in the amount of approximately $60,000 were repaid upon the consummation of the initial public offering on November 23, 2020.In addition, the Sponsor, officers and directors, or any of their respective affiliates were reimbursed forincurred in connection with activities on RTPZ’s behalf such as identifying potential target businesses and performing due diligence on suitable business combinations. RTPZ’s audit committee reviewed on a quarterly basis all payments that were made to the Sponsor, officers or directors, or RTPZ’s or their affiliates and determined which expenses and the amount of expenses that would be reimbursed. There was no cap or ceiling on the reimbursement ofincurred by such persons in connection with activities on RTPZ’s behalf. Such payments were made from funds held outside the trust account, including funds released from the trust account to pay for working capital, subject to an annual limit of $165,000.
out-of-pocket expenses
out-of-pocket expenses
Support Services Agreement
RTPZ entered into the Support Services Agreement that provided that, commencing on the date that RTPZ’s securities were first listed on the NYSE through the earlier of consummation of the initial business combination or the liquidation, RTPZ would pay support services fees to Reinvent Capital LLC (“Reinvent Capital”) totaling $625,000 per year for support and administrative services, as well as reimburse Reinvent Capital for anyexpenses it incurs in connection with providing services or for office space under the Support Services Agreement. As of March 31, 2021, RTPZ had paid $156,000 to Reinvent Capital in 2020 and paid $0 to Reinvent Capital in the three-month period ended March 31, 2021, in each case under the Support Services Agreement. As of March 31, 2021, RTPZ recognized approximately $156,000 in the unaudited condensed consolidated statement of operations for the three months ended March 31, 2021 included in Due to Related Party on the balance sheet at March 31, 2021. For the three months ended March 31, 2021, RTPZ incurred approximately $12,000 in reimbursable expenses paid by the Sponsor, which was recognized in the unaudited condensed consolidated statement of operations and included in Due to Related Party on the unaudited condensed consolidated balance sheet at March 31, 2021.
out-of-pocket
156
Old Hippo
Note Purchase Agreement (November 2020)
In November 2020, Hippo entered into a note purchase agreement permitting the issuance of up to an aggregate of $400 million in convertible notes (the “Hippo notes”). The Hippo notes provided for an annualinterest rate of 2.5%, or 5.0% after the
payment-in-kind
15-month
anniversary of the interest commencement date if no conversion event had occurred, and 7.5% after the21-month
anniversary of the interest commencement date if no conversion event had occurred, with a maturity date of November 30, 2023. Under the terms of the Hippo notes, in certain circumstances, the unpaid principal of the Hippo notes, including any accrued but unpaid interest thereon, will convert into shares of Hippo capital stock. In connection with the Business Combination, the Hippo notes converted into shares of Hippo common stock equal to ninety percent of the fair market value of the lowest price offered in the private placement in connection with the PIPE Investment. The table below sets forth the principal amount of the Hippo notes and the number of shares of Hippo common stock issued to Hippo directors, executive officers or beneficial owners of more than 5% of Hippo capital stock, or an affiliate or immediate family member thereof upon conversion of outstanding principal and unpaid, accrued interest under the Hippo notes:Name | Note Principal ($) | Number of Shares of Common Stock | ||||||
Mitsui Sumitomo Insurance Co., Ltd. (1) | 350,000,000 | 39,396,604 | ||||||
| (1) | Mitsui Sumitomo Insurance Co., Ltd. will beneficially own (in the aggregate) more than 5% of outstanding Hippo capital stock upon conversion of the Hippo notes. |
Series E Preferred Stock Financing (July 2020)
In July 2020, Old Hippo issued an aggregate of 7,628,075 shares of Series E preferred stock at $19.6642 per share for aggregate proceeds to Hippo of approximately $150 million.
The table below sets forth the number of shares of Series E preferred stock sold to Hippo directors, executive officers or owners of more than 5% of a class of Old Hippo capital stock, or an affiliate or immediate family member thereof:
Name | Number of Shares of Series E Preferred Stock | Aggregate Purchase Price ($) | ||||||
Bond Capital Fund, LP (1) | 915,369 | 17,999,999.09 | ||||||
Comcast Ventures, LP (2) | 50,853 | 999,983.57 | ||||||
Fifth Wall Ventures, L.P. (3) | 66,109 | 1,299,980.60 | ||||||
LEN FW Investor, LLC (4) | 381,403 | 7,499,984.88 | ||||||
RPM Ventures III, L.P. (5) | 50,853 | 999,983.57 | ||||||
| (1) | Bond Capital Fund, LP and its affiliated funds beneficially owned (in the aggregate) more than 5% of the Hippo capital stock outstanding at the time of the Series E preferred stock financing. Noah Knauf is currently, and was at the time of the Series E preferred stock financing, a member of the Old Hippo board of directors and a Member of the General Partner of Bond Capital Fund, LP. |
| (2) | Comcast Ventures, LP and its affiliates beneficially owned (in the aggregate) more than 5% of the Hippo capital stock outstanding at the time of the Series E preferred stock financing. Sam Landman is currently, and was at the time of the Series E preferred stock financing, a member of the Hippo board of directors and is no longer currently, but was at the time, a Managing Director of Comcast Ventures, LP. |
157
| (3) | Fifth Wall Ventures, L.P. and their affiliated funds beneficially owned (in the aggregate) more than 5% of the Hippo capital stock outstanding at the time of the Series E preferred stock financing. |
| (4) | LEN FW Investor, LLC beneficially owned more than 5% of the Hippo capital stock outstanding at the time of the Series E preferred financing. Eric Feder is an officer of the parent of LEN FW Investor, LLC and is currently, and was at the time of the Series E preferred stock financing, a member of Hippo’s board of directors. |
| (5) | RPM Ventures III, L.P. and its affiliates beneficially owned (in the aggregate) more than 5% of the Hippo capital stock outstanding at the time of the Series E preferred stock financing. |
Series D Preferred Stock Financing (July 2019)
In July and August 2019 and January 2020, Hippo issued an aggregate of 6,594,479 shares of Series D preferred stock at $15.1642 per share for aggregate proceeds to Hippo of approximately $100 million.
The table below sets forth the number of shares of Series D preferred stock sold to Hippo directors, executive officers or owners of more than 5% of a class of Hippo capital stock, or an affiliate or immediate family member thereof:
Name | Number of Shares of Series D Preferred Stock | Aggregate Purchase Price ($) | ||||||
Comcast Ventures, LP (1) | 131,937 | 2,000,719.06 | ||||||
RPM Ventures III, LP (2) | 294,304 | 4,462,884.72 | ||||||
Fifth Wall Ventures (3) | 198,713 | 3,013,323.67 | ||||||
LEN FW Investor, LLC (4) | 65,945 | 1,000,003.17 | ||||||
Fifth Wall Ventures SPV XVII, L.P. (3) | 65,945 | 1,000,003.17 | ||||||
| (1) | Comcast Ventures, LP and its affiliates beneficially owned (in the aggregate) more than 5% of the Hippo capital stock outstanding at the time of the Series D preferred stock financing. Sam Landman is currently, and was at the time of the Series D preferred stock financing, a member of Hippo’s board of directors and is no longer currently, but was at the time, a Managing Director of Comcast Ventures, LP. |
| (2) | RPM Ventures III, L.P. and its affiliates beneficially owned (in the aggregate) more than 5% of the Hippo capital stock outstanding at the time of the Series D preferred stock financing. |
| (3) | Fifth Wall Ventures, L.P., Fifth Wall Ventures SPV XVII, L.P. and their affiliated funds beneficially owned (in the aggregate) more than 5% of the Hippo capital stock outstanding at the time of the Series D preferred stock financing. |
| (4) | LEN FW Investor, LLC beneficially owned more than 5% of the Hippo capital stock outstanding at the time of the Series D preferred financing. Eric Feder is an officer of the parent of LEN FW Investor, LLC and is currently, and was at the time of the Series E preferred stock financing, a member of Hippo’s board of directors. |
Series C Preferred Stock Financing (October 2018)
In October and November 2018, Hippo issued an aggregate of 9,936,528 shares of its Series C preferred stock at $7.0447140192 per share for aggregate proceeds to Hippo of approximately $70 million.
158
The table below sets forth the number of shares of Series C preferred stock sold to Hippo directors, executive officers or owners of more than 5% of a class of Hippo capital stock, or an affiliate or immediate family member thereof:
Name | Number of Shares of Series C Preferred Stock | Aggregate Purchase Price ($) | ||||||
BGW Ventures II, LP (1) | 654,949 | 4,613,928.40 | ||||||
RPM Ventures III, L.P. (1) | 310,314 | 2,186,073.39 | ||||||
Fifth Wall Ventures, L.P. (2) | 851,702 | 5,999,997.02 | ||||||
Fifth Wall Ventures SPV IV, L.P. (2)(3) | 3,548,760 | 24,999,999.32 | ||||||
Comcast Ventures, LP (4) | 1,119,705 | 7,888,001.51 | ||||||
| (1) | RPM Ventures III, L.P., BGW Ventures II, LP and its affiliates beneficially owned (in the aggregate) more than 5% of the Hippo capital stock outstanding at the time of the Series C preferred stock financing. |
| (2) | Fifth Wall Ventures, L.P., Fifth Wall Ventures SPV XVII, L.P. and their affiliated funds beneficially owned (in the aggregate) more than 5% of the Hippo capital stock outstanding at the time of the Series C preferred stock financing. |
| (3) | LEN FW Investor, LLC may be deemed to beneficially own the Series C preferred stock directly owned by Fifth Wall Ventures SPV IV, L.P., and therefore may be deemed to have beneficially owned more than 5% of the Hippo capital stock outstanding at the time of the Series C preferred stock financing. Eric Feder is an officer of the parent of LEN FW Investor, LLC and is currently, and was at the time of the Series C preferred stock financing, a member of Hippo’s board of directors. |
| (4) | Comcast Ventures, LP and its affiliates beneficially owned (in the aggregate) more than 5% of the Hippo capital stock outstanding at the time of the Series C preferred stock financing. Sam Landman is currently, and was at the time of the Series C preferred stock financing, a member of Old Hippo’s board of directors and is no longer currently, but was at the time, a Managing Director of Comcast Ventures, LP. |
Stock Transfer Agreements
Since January 1, 2018, the following directors, executive officers or beneficial owners of more than 5% of a class of Hippo capital stock transferred or received shares of Hippo capital stock pursuant to certain stock transfer agreements:
| • | Stock Transfer Agreement by and between Assaf Wand and ICONIQ Strategic Partners IV, L.P. dated July 17, 2019. |
| • | Stock Transfer Agreement by and between Assaf Wand and FinTLV Ventures dated July 24, 2019. |
| • | Stock Transfer Agreement by and between Assaf Wand and HH SUM-II Holdings Limited, LP dated July 24, 2019. |
| • | Stock Transfer Agreement by and between Assaf Wand and ICONIQ Strategic Partners IV, L.P. dated July 24, 2019. |
| • | Stock Transfer Agreement by and between Assaf Wand and Hut 8 Ventures Hunter I, L.P. dated August 21, 2019. |
| • | Stock Transfer Agreement by and between Assaf Wand and the Wand Family Delaware Trust dated May 13, 2020. |
| • | Stock Transfer Agreement by and between the Wand Family Delaware Trust and Bond Capital Fund, LP dated July 20, 2020. |
| • | Stock Transfer Agreement by and between the Wand Family Delaware Trust and NPC Opportunity Fund dated July 20, 2020. |
159
| • | Stock Transfer Agreement by and between the Wand Family Delaware Trust and Innovius Capital Canopus I, L.P. dated July 21, 2020. |
| • | Stock Transfer Agreement by and between the Wand Family Delaware Trust and Celestial Ally Limited dated July 27, 2020. |
| • | Stock Transfer Agreement by and between Ran Harpaz and Innovius Capital Canopus I, L.P. dated July 21, 2020. |
| • | Stock Transfer Agreement by and between Ran Harpaz and Eric Reiner dated July 23, 2020. |
| • | Stock Transfer Agreement by and between Stewart Ellis and Innovius Capital Canopus I, L.P. dated July 21, 2020. |
| • | Stock Transfer Agreement by and between Aviad Pinkovezky and Innovius Capital Canopus I, L.P. dated July 21, 2020. |
Warrants
In December 2017, Old Hippo issued a warrant to purchase common stock to Fifth Wall Ventures SPV IV, L.P., as amended in October 2018 and March 2021, for up to an aggregate of 4,738,051 shares at a warrant price of $0.01 per share.
In December 2018, Old Hippo issued a warrant to purchase common stock to Comcast Warranty and Home Insurance Agency, LLC, exercisable for up to an aggregate of 4,738,051 shares at a warrant price of $0.01 per share subject to the achievement of certain specified milestones. In December 2020, the warrant was amended to make it exercisable for up to 62,500 shares of Old Hippo common stock without any vesting requirements.
In April 2019, Old Hippo issued an option to purchase 2,465,454 shares of Series
C-1
Preferred Stock at an exercise price of $11.7411898488 to LEN FW Investor, LLC, pursuant to the Rights Agreement dated October 25, 2018 between Old Hippo, Fifth Wall Ventures SPV IV, L.P. and LEN FW Investor, LLC.Director and Executive Officer Compensation
Please see “” for information regarding the compensation of Old Hippo directors and executive officers.
Executive Compensation
Employment Agreements
Old Hippo has entered into employment agreements with its executive officers. For more information regarding these agreements, see “
Executive Compensation
— Employment and Officer Letter Agreements.”
Indemnification Agreements and Directors’ and Officers’ Liability Insurance
Hippo Holdings has entered into or intends to enter into indemnification agreements with each of its directors and executive officers. These agreements will require Hippo Holdings to, among other things, indemnify each director and executive officer to the fullest extent permitted by Delaware law, including indemnification of expenses such as attorneys’ fees, judgments, penalties fines and settlement amounts incurred by the director or executive officer in any action or proceeding, including any action or proceeding by or in right of Hippo Holdings, arising out of the person’s services as a director or executive officer. Hippo Holdings has obtained an insurance policy that insures Hippo Holdings directors and officers against certain liabilities, including liabilities arising under applicable securities laws. For additional information see “.”
Description of Our Securities
—
Limitations on Liability and Indemnification of Officers and Directors
160
Investors’ Rights Agreement
Old Hippo entered into an amended and restated investors’ rights agreement with the purchasers of Old Hippo preferred stock, including entities with which certain of Hippo Holdings’ directors are affiliated. Upon the consummation of the Business Combination, the amended and restated investors’ rights agreement terminated.
Voting Agreement
Old Hippo entered into an amended and restated voting agreement with certain holders of Old Hippo common stock and Old Hippo preferred stock. Upon the consummation of the Business Combination, the amended and restated voting agreement terminated.
Right of First Refusal and
Co-Sale
AgreementOld Hippo entered into an amended and restated right of first refusal and
co-sale
agreement with certain holders of Old Hippo common stock and Old Hippo preferred stock. Upon the consummation of the Business Combination, the amended and restated right of first refusal andco-sale
agreement terminated.Registration Rights Agreement
At the Closing, Hippo Holdings, the Sponsor and the other holders of RTPZ Class B ordinary shares, certain former stockholders of Old Hippo, including certain of Old Hippo’s directors and officers, and Reinvent Capital Fund entered into the Registration Rights Agreement pursuant to which Hippo Holdings agreed to register for resale, pursuant to Rule 415 under the Securities Act, certain shares of Hippo Holdings common stock and other equity securities of Hippo Holdings that are held by the parties thereto from time to time. Pursuant to the Registration Rights Agreement, Hippo Holdings agreed to file a shelf registration statement registering the resale of the Hippo Holdings common stock (including the Hippo Holdings warrants and shares of Hippo Holdings common stock issued or issuable upon the exercise of any other equity security) held by a party immediately following the Closing (including any securities distributable pursuant to the Merger Agreement and any shares of Hippo Holdings common stock purchased in the PIPE Investment) within 30 days of the Closing. Up to twice in any
12-month
period, the Sponsor, Reinvent Capital Fund and the former stockholders of Old Hippo may each request to sell all or any portion of their Registrable Securities (as defined in the Registration Rights Agreement) in an underwritten offering so long as the total offering price is reasonably expected to exceed $100 million. Hippo Holdings also agreed to provide customary “piggyback” registration rights, subject to certain requirements and customary conditions. The Registration Rights Agreement also provides that Hippo Holdings will pay certain expenses relating to such registrations and indemnify the stockholders against certain liabilities.Lockup Agreements
At the Closing, Hippo Holdings entered
into Lock-Up Agreements
with (i) each of the Company Directors and Officers (as defined in the Merger Agreement) (the “CompanyD&O Lock-Up Agreements”),
and (ii) each of the Major Company Equityholders (as defined in the Merger Agreement) (the “Major CompanyEquityholders Lock-Up Agreements”).
The Company
D&O Lock-Up Agreements
contain certain restrictions on transfer with respect to shares of Hippo Holdings common stock held by the Company Directors and Officers immediately following the Closing (other than shares purchased in the public market or in the PIPE Investment) and the shares of Hippo Holdings common stock issuable to the Company Directors and Officers upon settlement or exercise of restricted stock units, stock options or other equity awards outstanding as of immediately following the Closing in respect of equity awards of Old Hippo outstanding immediately prior to the Closing (the“D&O Lock-up Shares”).
Such restrictions began at the Closing and end in tranches of 25% of theD&O Lock-up Shares
on (i) February 2, 2022, (ii) August 2, 2022, (iii) February 2, 2023, and (iv) August 2, 2023. If Hippo Holdings completes a transaction that results in a change of control, theD&O Lock-up Shares
are released from restriction immediately prior to such change of control.161
Pursuant to the Sponsor Agreement, the shares of Hippo Holdings common stock (other than shares purchased in the public market or in the PIPE Investment) held by the Sponsor are subject to the same restrictions and releases as the
D&O Lock-up Shares.
The Major Company
Equityholders Lock-Up Agreements
contain certain restrictions on transfer with respect to shares of Hippo Holdings common stock held by the Major Company Equityholders immediately following the Closing (other than shares purchased in the public market or in the PIPE Investment) (the “Major CompanyEquityholders Lock-up Shares”).
Such restrictions began at the Closing and end in tranches of 50% of the Major CompanyEquityholders Lock-up Shares
at each of (i) February 2, 2022 and (ii) August 2, 2022. If Hippo Holdings completes a transaction that results in a change of control, the Major CompanyEquityholders Lock-up Shares
are released from restriction immediately prior to such change of control.Promissory Notes
In May 2019, Old Hippo extended loans to each of the following of its executive officers in order to facilitate the early exercise of options to purchase shares of Old Hippo common stock pursuant to certain Secured Partial Recourse Promissory Note and Stock Pledge Agreements by and between Old Hippo and such executive officers: Assaf Wand, Old Hippo’s Chief Executive Officer, in the principal amount of $1,143,971.12, Stewart Ellis, Old Hippo’s Chief Financial Officer, in the principal amount of $1,112,284.56 and Ran Harpaz, Old Hippo’s Chief Technology Officer, in the principal amount of $870,000. Each of these loans and all interest accrued thereon was forgiven upon the consummation of the Business Combination, which was subject to the respective executive officer’s continued employment through the consummation of the Business Combination.
Acquisition
In December 2020, Old Hippo acquired First Connect Insurance Services, a wholesale P&C insurance provider for independent agents interested in gaining access to the advanced quoting platforms that are provided by InsurTech companies. One of Old Hippo’s executive officers, Richard McCathron, was the President and Chief Executive Officer of First Connect Insurance services from 2012 to 2017 and owned greater than 10% of First Connect Insurance Services prior to the time of the transaction. The Company paid Mr. McCathron $6.4 million for his equity interests in First Connect Insurance Services prior to the transaction.
Commercial Transactions
Spinnaker Insurance Company entered into a Homeowners Quota Share Reinsurance Contract with Mitsui Sumitomo Insurance Co., Ltd. effective January 1, 2021 relating to the cession of certain premiums and liabilities for business written by or through Hippo Analytics, Inc.
In February 2020, Comcast Neptune, LLC assumed the Master Services Agreement between Loop Labs, Inc. d/b/a Notion and Old Hippo. Comcast Neptune, LLC and its affiliated funds is a beneficial owner of more than 5% of outstanding Hippo capital stock. Old Hippo incurred a total of $3.2 million of expenses during the year ended December 31, 2020 related to this services agreement.
In October 2020, Old Hippo entered into a Master Services Agreement with Forecast Labs, LLC, which operates a startup studio for Comcast Ventures, LP, which provides accelerator and incubator services to select portfolio companies of Comcast Ventures. Comcast Ventures and its affiliated funds were beneficial owners of more than 5% of outstanding Old Hippo capital stock. Old Hippo incurred a total of $2.2 million of expenses during the years ended December 31, 2020 and 2019 related to this agreement.
In April 2019, Old Hippo entered into a Limited Liability Company Agreement with CalAtlantic Title Group, LLC, an affiliate of Lennar Insurance Agency, LLC, in connection with the acquisition of North American Advantage Insurance Services, LLC. Lennar Insurance Agency, LLC and its affiliated funds were beneficial owners of more than 5% of outstanding Old Hippo capital stock. Old Hippo incurred a total of $8.9 million of expenses during the years ended December 31, 2020 and 2019 related to this agreement.
162
In February 2019, Old Hippo entered into an Accelerate Agreement with Comcast Ventures, LLC. Comcast Ventures, LLC and its affiliated funds were beneficial owners of more than 5% of outstanding Old Hippo capital stock. Old Hippo incurred over $120,000 of expenses during the years ended December 31, 2020 and 2019 related to this services agreement.
In February 2018, Old Hippo entered into a
Co-Marketing
Program Agreement with Comcast Warranty and Home Insurance Agency, LLC. Comcast Warranty and Home Insurance, LLC and its affiliated funds were beneficial owners of more than 5% of outstanding Old Hippo capital stock. Old Hippo incurred a total of $500,000 of expenses during the years ended December 31, 2020, 2019 and 2018 related to this program agreement.Policies and Procedures for Related Person Transactions
Effective upon the consummation of the Business Combination, the board of directors of Hippo Holdings adopted a written related person transaction policy that sets forth the following policies and procedures for the review and approval or ratification of related person transactions. A “related person transaction” is a transaction, arrangement or relationship (or any series of similar transactions, arrangements or relationships) in which Hippo Holdings (including any of its subsidiaries and affiliates) was, is or will be a participant and in which any Related Person (as defined below) had, has or will have a direct or indirect material interest. A “related person” means:
| • | any person who is, or at any time since the beginning of Hippo Holdings’ last fiscal year was, a director or executive officer of Hippo Holdings or a nominee to become a director of Hippo Holdings; |
| • | any person who is known to be the beneficial owner of more than 5% of any class of Hippo Holdings voting securities; |
| • | any immediate family member of any of the foregoing persons, which means any child, stepchild, parent, stepparent, spouse, sibling, mother-in-law, father-in-law, son-in-law, daughter-in-law, in-law orsister-in-law |
| • | any firm, corporation or other entity in which any of the foregoing persons is a partner or principal, or in a similar position, or in which such person has a 5% or greater beneficial ownership interest; and |
| • | any firm, corporation or other entity in which any director, executive officer, nominee or more than 5% beneficial owner is employed (whether or not as an executive officer). |
Hippo Holdings has policies and procedures designed to minimize potential conflicts of interest arising from any dealings it may have with its affiliates and to provide appropriate procedures for the disclosure of any real or potential conflicts of interest that may exist from time to time. Specifically, pursuant to its Audit Committee charter, the Audit Committee has the responsibility to review related party transactions.
163
DESCRIPTION OF SECURITIES
The following summary of certain provisions of our securities does not purport to be complete and is subject to the Certificate of Incorporation, the Bylaws, the warrant agreement and the provisions of applicable law. Copies of the Certificate of Incorporation, the Bylaws and the warrant agreement are attached as exhibits to the registration statement of which this prospectus is a part.
Capital Stock
Authorized Capitalization
General
The total amount of Hippo Holdings’ authorized capital stock consists of 2,000,000,000 shares of Hippo Holdings common stock, par value $0.0001 per share, and 10,000,000 shares of Hippo Holdings preferred stock, par value $0.0001 per share. Hippo Holdings had 559,038,333 shares of Hippo Holdings common stock outstanding immediately after the consummation of the Business Combination.
The following summary describes all material provisions of Hippo Holdings’ capital stock. Hippo Holdings urges you to read the Certificate of Incorporation and the Bylaws.
Preferred Stock
Hippo Holdings’ board of directors has authority to issue shares of Hippo Holdings’ preferred stock in one or more series, to fix for each such series such voting powers, designations, preferences, qualifications, limitations or restrictions thereof, including dividend rights, conversion rights, redemption privileges and liquidation preferences for the issue of such series all to the fullest extent permitted by the DGCL. The issuance of Hippo Holdings’ preferred stock could have the effect of decreasing the trading price of Hippo Holdings’ common stock, restricting dividends on Hippo Holdings’ capital stock, diluting the voting power of Hippo Holdings’ common stock, impairing the liquidation rights of Hippo Holdings’ capital stock, or delaying or preventing a change in control of Hippo Holdings.
Redeemable Warrants
Public Shareholders’ Warrants
Each whole warrant entitles the registered holder to purchase one share of Hippo Holdings common stock at a price of $11.50 per share, subject to adjustment as discussed below, at any time commencing on the later of 30 days after the completion of the Business Combination and 12 months from the closing of RTPZ’s initial public offering, except as described below. Pursuant to the Warrant Agreement, a warrant holder may exercise its warrants only for a whole number of shares of Hippo Holdings common stock. This means only a whole warrant may be exercised at a given time by a warrant holder. The warrants will expire five years after the completion of the Business Combination, at 5:00 p.m., New York City time, or earlier upon redemption or liquidation.
Hippo Holdings will not be obligated to deliver any shares of Hippo Holdings common stock pursuant to the exercise of a warrant and will have no obligation to settle such warrant exercise unless a registration statement under the Securities Act covering the issuance of the Hippo Holdings common stock issuable upon exercise of the warrants is then effective and a current prospectus relating thereto is current, subject to Hippo Holdings’ satisfying its obligations described below with respect to registration, or a valid exemption from registration is available, including in connection with a cashless exercise permitted as a result of a notice of redemption described below under “Redemption of warrants when the price per share of Hippo Holdings common stock equals or exceeds $10.00.” No warrant will be exercisable for cash or on a cashless basis, and Hippo Holdings will not be obligated to issue any shares to holders seeking to exercise their warrants, unless the issuance of the
164
shares upon such exercise is registered or qualified under the securities laws of the state of the exercising holder, or an exemption is available. In the event that the conditions in the two immediately preceding sentences are not satisfied with respect to a warrant, the holder of such warrant will not be entitled to exercise such warrant and such warrant may have no value and expire worthless.
Pursuant to the Warrant Agreement, the Hippo Holdings common stock issuable upon exercise of the warrants is being registered on this registration statement on Form
S-1,
and Hippo Holdings will use its commercially reasonable efforts to cause the same to become effective within 60 business days after the closing of the Business Combination and to maintain the effectiveness of such registration statement, and a current prospectus relating thereto, until the expiration of the warrants in accordance with the provisions of the warrant agreement. Notwithstanding the above, if shares of Hippo Holdings common stock are, at the time of any exercise of a warrant, not listed on a national securities exchange such that they satisfy the definition of a “covered security” under Section 18(b)(1) of the Securities Act, Hippo Holdings may, at its option, require holders of public warrants who exercise their warrants to do so on a “cashless basis” in accordance with Section 3(a)(9) of the Securities Act and, in the event Hippo Holdings so elects, Hippo Holdings will not be required to file or maintain in effect a registration statement, but will use its commercially reasonable efforts to register or qualify the shares under applicable blue sky laws to the extent an exemption is not available. In the case of a cashless exercise, each holder would pay the exercise price by surrendering the warrants for that number of shares of Hippo Holdings common stock equal to the lesser of (A) the quotient obtained by dividing (x) the product of the number of shares of Hippo Holdings common stock underlying the warrants, multiplied by the excess of the “fair market value” (defined below) less the exercise price of the warrants by (y) the fair market value and (B) 0.361 shares of Hippo Holdings common stock per warrant. The “fair market value” as used in the preceding sentence shall mean the volume weighted average price of the Hippo Holdings common stock for the 10 trading days ending on the trading day prior to the date on which the notice of exercise is received by the warrant agent.Redemption of warrants when the price per share of Hippo Holdings common stock equals or exceeds $18.00.
| • | in whole and not in part; |
| • | at a price of $0.01 per warrant; |
| • | upon not less than 30 days’ prior written notice of redemption to each warrant holder; and |
| • | if, and only if, the last reported sale price of the Hippo Holdings common stock for any 20 trading days within a 30-trading day period ending on the third trading day prior to the date on which Hippo Holdings send the notice of redemption to the warrant holders (the “Reference Value”) equals or exceeds $18.00 per share (as adjusted for adjustments to the number of shares issuable upon exercise or the exercise price of a warrant as described under the heading “—Anti-dilution Adjustments |
Hippo Holdings will not redeem the warrants as described above unless a registration statement under the Securities Act covering the issuance of the Hippo Holdings common stock issuable upon exercise of the warrants is then effective and a current prospectus relating to that Hippo Holdings common stock is available throughout the
30-day
redemption period. If and when the warrants become redeemable by Hippo Holdings, Hippo Holdings may exercise its redemption right even if it is unable to register or qualify the underlying securities for sale under all applicable state securities laws.The last of the redemption criterion discussed above has been established to prevent a redemption call unless there is at the time of the call a significant premium to the warrant exercise price. If the foregoing conditions are satisfied and Hippo Holdings issues a notice of redemption of the warrants, each warrant holder will be entitled to exercise his, her or its warrant prior to the scheduled redemption date. However, the price of the Hippo Holdings common stock may fall below the $18.00 redemption trigger price (as adjusted for
165
adjustments to the number of shares issuable upon exercise or the exercise price of a warrant as described under the heading “—”) as well as the $11.50 (for whole shares) warrant exercise price after the redemption notice is issued.
Anti-dilution Adjustments
Redemption of warrants when the price per share of Hippo Holdings common stock equals or exceeds $10.00
| • | in whole and not in part; |
| • | at $0.10 per warrant upon a minimum of 30 days’ prior written notice of redemption provided that holders will be able to exercise their warrants on a cashless basis prior to redemption and receive that number of shares determined by reference to the table below, based on the redemption date and the “fair market value” (as defined below) of Hippo Holdings common stock except as otherwise described below; |
| • | if, and only if, the Reference Value (as defined above under “— Redemption of warrants when the price per share of Hippo Holdings common stock equals or exceeds $18.00”) equals or exceeds $10.00 per share (as adjusted for adjustments to the number of shares issuable upon exercise or the exercise price of a warrant as described under the heading “— Anti-dilution Adjustments”); and |
| • | if the Reference Value is less than $18.00 per share (as adjusted for adjustments to the number of shares issuable upon exercise or the exercise price of a warrant as described under the heading “— Anti-dilution Adjustments”), the private placement warrants must also be concurrently called for redemption on the same terms as the outstanding public warrants, as described above. |
During the period beginning on the date the notice of redemption is given, holders may elect to exercise their warrants on a cashless basis. The numbers in the table below represent the number of shares of Hippo Holdings common stock that a warrant holder will receive upon such cashless exercise in connection with a redemption by Hippo Holdings pursuant to this redemption feature, based on the “fair market value” of Hippo Holdings common stock on the corresponding redemption date (assuming holders elect to exercise their warrants and such warrants are not redeemed for $0.10 per warrant), determined for these purposes based on the volume weighted average price of Hippo Holdings common stock during the 10 trading days immediately following the date on which the notice of redemption is sent to the holders of warrants, and the number of months that the corresponding redemption date precedes the expiration date of the warrants, each as set forth in the table below. Hippo Holdings will provide the warrant holders with the final fair market value no later than one business day after the
10-trading
day period described above ends.The share prices set forth in the column headings of the table below will be adjusted as of any date on which the number of shares issuable upon exercise of a warrant or the exercise price of a warrant is adjusted as set forth under the heading “— Anti-dilution Adjustments” below. If the number of shares issuable upon exercise of a warrant is adjusted, the adjusted share prices in the column headings will equal the share prices immediately prior to such adjustment, multiplied by a fraction, the numerator of which is the number of shares deliverable upon exercise of a warrant immediately prior to such adjustment and the denominator of which is the number of shares deliverable upon exercise of a warrant as so adjusted. The number of shares in the table below shall be adjusted in the same manner and at the same time as the number of shares issuable upon exercise of a warrant. If the exercise price of a warrant is adjusted, (a) in the case of an adjustment pursuant to the fifth paragraph under the heading “— Anti-dilution Adjustments” below, the adjusted share prices in the column headings will equal the unadjusted share price multiplied by a fraction, the numerator of which is the higher of the Market Value and the Newly Issued Price as set forth under the heading “— Anti-dilution Adjustments” and the denominator of which is $10.00 and (b) in the case of an adjustment pursuant to the second paragraph under the heading “—
166
Anti-dilution Adjustments” below, the adjusted share prices in the column headings will equal the unadjusted share price less the decrease in the exercise price of a warrant pursuant to such exercise price adjustment.
Redemption Date (period to expiration of warrants) | Fair Market Value of Hippo Holdings Common Stock | |||||||||||||||||||||||||||||||||||
£ 10.00 | 11.00 | 12.00 | 13.00 | 14.00 | 15.00 | 16.00 | 17.00 | ³ 18.00 | ||||||||||||||||||||||||||||
60 months | 0.261 | 0.281 | 0.297 | 0.311 | 0.324 | 0.337 | 0.348 | 0.358 | 0.361 | |||||||||||||||||||||||||||
57 months | 0.257 | 0.277 | 0.294 | 0.310 | 0.324 | 0.337 | 0.348 | 0.358 | 0.361 | |||||||||||||||||||||||||||
54 months | 0.252 | 0.272 | 0.291 | 0.307 | 0.322 | 0.335 | 0.347 | 0.357 | 0.361 | |||||||||||||||||||||||||||
51 months | 0.246 | 0.268 | 0.287 | 0.304 | 0.320 | 0.333 | 0.346 | 0.357 | 0.361 | |||||||||||||||||||||||||||
48 months | 0.241 | 0.263 | 0.283 | 0.301 | 0.317 | 0.332 | 0.344 | 0.356 | 0.361 | |||||||||||||||||||||||||||
45 months | 0.235 | 0.258 | 0.279 | 0.298 | 0.315 | 0.330 | 0.343 | 0.356 | 0.361 | |||||||||||||||||||||||||||
42 months | 0.228 | 0.252 | 0.274 | 0.294 | 0.312 | 0.328 | 0.342 | 0.355 | 0.361 | |||||||||||||||||||||||||||
39 months | 0.221 | 0.246 | 0.269 | 0.290 | 0.309 | 0.325 | 0.340 | 0.354 | 0.361 | |||||||||||||||||||||||||||
36 months | 0.213 | 0.239 | 0.263 | 0.285 | 0.305 | 0.323 | 0.339 | 0.353 | 0.361 | |||||||||||||||||||||||||||
33 months | 0.205 | 0.232 | 0.257 | 0.280 | 0.301 | 0.320 | 0.337 | 0.352 | 0.361 | |||||||||||||||||||||||||||
30 months | 0.196 | 0.224 | 0.250 | 0.274 | 0.297 | 0.316 | 0.335 | 0.351 | 0.361 | |||||||||||||||||||||||||||
27 months | 0.185 | 0.214 | 0.242 | 0.268 | 0.291 | 0.313 | 0.332 | 0.350 | 0.361 | |||||||||||||||||||||||||||
24 months | 0.173 | 0.204 | 0.233 | 0.260 | 0.285 | 0.308 | 0.329 | 0.348 | 0.361 | |||||||||||||||||||||||||||
21 months | 0.161 | 0.193 | 0.223 | 0.252 | 0.279 | 0.304 | 0.326 | 0.347 | 0.361 | |||||||||||||||||||||||||||
18 months | 0.146 | 0.179 | 0.211 | 0.242 | 0.271 | 0.298 | 0.322 | 0.345 | 0.361 | |||||||||||||||||||||||||||
15 months | 0.130 | 0.164 | 0.197 | 0.230 | 0.262 | 0.291 | 0.317 | 0.342 | 0.361 | |||||||||||||||||||||||||||
12 months | 0.111 | 0.146 | 0.181 | 0.216 | 0.250 | 0.282 | 0.312 | 0.339 | 0.361 | |||||||||||||||||||||||||||
9 months | 0.090 | 0.125 | 0.162 | 0.199 | 0.237 | 0.272 | 0.305 | 0.336 | 0.361 | |||||||||||||||||||||||||||
6 months | 0.065 | 0.099 | 0.137 | 0.178 | 0.219 | 0.259 | 0.296 | 0.331 | 0.361 | |||||||||||||||||||||||||||
3 months | 0.034 | 0.065 | 0.104 | 0.150 | 0.197 | 0.243 | 0.286 | 0.326 | 0.361 | |||||||||||||||||||||||||||
0 months | — | — | 0.042 | 0.115 | 0.179 | 0.233 | 0.281 | 0.323 | 0.361 | |||||||||||||||||||||||||||
The exact fair market value and redemption date may not be set forth in the table above, in which case, if the fair market value is between two values in the table or the redemption date is between two redemption dates in the table, the number of shares of Hippo Holdings common stock to be issued for each warrant exercised will be determined by a straight-line interpolation between the number of shares set forth for the higher and lower fair market values and the earlier and later redemption dates, as applicable, based on a 365 or
366-day
year, as applicable. For example, if the volume weighted average price of Hippo Holdings common stock during the 10 trading days immediately following the date on which the notice of redemption is sent to the holders of the warrants is $11.00 per share, and at such time there are 57 months until the expiration of the warrants, holders may choose to, in connection with this redemption feature, exercise their warrants for 0.277 shares of Hippo Holdings common stock for each whole warrant. For an example where the exact fair market value and redemption date are not as set forth in the table above, if the volume weighted average price of Hippo Holdings common stock during the 10 trading days immediately following the date on which the notice of redemption is sent to the holders of the warrants is $13.50 per share, and at such time there are 38 months until the expiration of the warrants, holders may choose to, in connection with this redemption feature, exercise their warrants for 0.298 shares of Hippo Holdings common stock for each whole warrant. In no event will the warrants be exercisable in connection with this redemption feature for more than 0.361 shares of Hippo Holdings common stock per warrant (subject to adjustment). Finally, as reflected in the table above, if the warrants are out of the money and about to expire, they cannot be exercised on a cashless basis in connection with a redemption by Hippo Holdings pursuant to this redemption feature, since they will not be exercisable for any shares of Hippo Holdings common stock.This redemption feature is structured to allow for all of the outstanding warrants to be redeemed when the Hippo Holdings common stock is trading at or above $10.00 per share, which may be at a time when the trading price of the Hippo Holdings common stock is below the exercise price of the warrants. This redemption feature has been established to provide Hippo Holdings with the flexibility to redeem the warrants without the warrants
167
having to reach the $18.00 per share threshold set forth above under “— Redemption of warrants when the price per share of Hippo Holdings common stock equals or exceeds $18.00.” Holders choosing to exercise their warrants in connection with a redemption pursuant to this feature will, in effect, receive a number of shares for their warrants based on an option pricing model with a fixed volatility input as of the date of this prospectus. This redemption right provides Hippo Holdings with an additional mechanism by which to redeem all of the outstanding warrants, and therefore have certainty as to its capital structure as the warrants would no longer be outstanding and would have been exercised or redeemed. Hippo Holdings will be required to pay the applicable redemption price to warrant holders if it chooses to exercise this redemption right and it will allow Hippo Holdings to quickly proceed with a redemption of the warrants if it determine it is in its best interest to do so. As such, Hippo Holdings would redeem the warrants in this manner when it believe it is in its best interest to update its capital structure to remove the warrants and pay the redemption price to the warrant holders.
As stated above, Hippo Holdings can redeem the warrants when the Hippo Holdings common stock is trading at a price starting at $10.00 per share, which is below the exercise price of $11.50 per share, because it will provide certainty with respect to Hippo Holdings’ capital structure and cash position while providing warrant holders with the opportunity to exercise their warrants on a cashless basis for the applicable number of shares. If Hippo Holdings chooses to redeem the warrants when the Hippo Holdings common stock is trading at a price below the exercise price of the warrants, this could result in the warrant holders receiving fewer shares of Hippo Holdings common stock than they would have received if they had chosen to wait to exercise their warrants for Hippo Holdings common stock if and when such Hippo Holdings common stock was trading at a price higher than the exercise price of $11.50.
No fractional shares of Hippo Holdings common stock will be issued upon exercise. If, upon exercise, a holder would be entitled to receive a fractional interest in a share, Hippo Holdings will round down to the nearest whole number of the number of shares of Hippo Holdings common stock to be issued to the holder. If, at the time of redemption, the warrants are exercisable for a security other than Hippo Holdings common stock pursuant to the warrant agreement, the warrants may be exercised for such security. At such time as the warrants become exercisable for a securities other than Hippo Holdings common stock, Hippo Holdings (or the surviving company) will use its commercially reasonable efforts to register under the Securities Act the security issuable upon the exercise of the warrants.
Redemption procedures
Anti-dilution Adjustments
split-up
of Hippo Holdings common stock or other similar event, then, on the effective date of such capitalization or share dividend,split-up
or similar event, the number of shares of Hippo Holdings common stock issuable on exercise of each warrant will be increased in proportion to such increase in the issued and outstanding shares of Hippo Holdings common stock. A rights offering made to all or substantially all holders of Hippo Holdings common stock entitling holders to purchase Hippo Holdings common stock at a price less than the “historical fair market value” (as defined below) will be deemed a share dividend of a number shares of Hippo Holdings common stock equal to the product of (1) the number of shares of Hippo Holdings common stock actually sold in such rights offering (or issuable under any other equity securities sold in such rights offering that are convertible into or exercisable for Hippo Holdings common stock) and (2) one minus the quotient of (x) the price per share of Hippo Holdings common stock paid in such rights offering and (y) the historical fair market value. For these purposes, (1) if the rights offering is for securities convertible into or exercisable for Hippo Holdings common stock, in determining the price payable for Hippo Holdings common stock, there will be taken into account any168
consideration received for such rights, as well as any additional amount payable upon exercise or conversion and (2) “historical fair market value” means the volume weighted average price of Hippo Holdings common stock during the 10 trading day period ending on the trading day prior to the first date on which the Hippo Holdings common stock trade on the applicable exchange or in the applicable market, regular way, without the right to receive such rights.
In addition, if Hippo Holdings, at any time while the warrants are outstanding and unexpired, pay to all or substantially all of the holders of Hippo Holdings common stock a dividend or make a distribution in cash, securities or other assets to the holders of Hippo Holdings common stock on account of such Hippo Holdings common stock (or other securities into which the warrants are convertible), other than (a) as described above or (b) any cash dividends or cash distributions which, when combined on a per share basis with all other cash dividends and cash distributions paid on the Hippo Holdings common stock during the
365-day
period ending on the date of declaration of such dividend or distribution does not exceed $0.50 (as adjusted for sharesub-divisions,
share dividends, rights issuances, consolidations, reorganizations, recapitalizations and other similar transactions) but only with respect to the amount of the aggregate cash dividends or cash distributions equal to or less than $0.50 per share, then the warrant exercise price will be decreased, effective immediately after the effective date of such event, by the amount of cash and/or the fair market value of any securities or other assets paid on each share of Hippo Holdings common stock in respect of such event.If the number of issued and outstanding shares of Hippo Holdings common stock is decreased by a consolidation, combination, reverse share
sub-division
or reclassification of Hippo Holdings common stock or other similar event, then, on the effective date of such consolidation, combination, reverse sharesub-division,
reclassification or similar event, the number of shares of Hippo Holdings common stock issuable on exercise of each warrant will be decreased in proportion to such decrease in issued and outstanding Hippo Holdings common stock.Whenever the number of shares of Hippo Holdings common stock purchasable upon the exercise of the warrants is adjusted, as described above, the warrant exercise price will be adjusted by multiplying the warrant exercise price immediately prior to such adjustment by a fraction (x) the numerator of which will be the number of shares of Hippo Holdings common stock purchasable upon the exercise of the warrants immediately prior to such adjustment and (y) the denominator of which will be the number of shares of Hippo Holdings common stock so purchasable immediately thereafter.
In case of any reclassification or reorganization of the issued and outstanding Hippo Holdings common stock (other than those described above or that solely affects the par value of such Hippo Holdings common stock), or in the case of a merger or consolidation of Hippo Holdings with or into another corporation (other than a merger or consolidation in which Hippo Holdings is the continuing corporation and that does not result in any reclassification or reorganization of the issued and outstanding Hippo Holdings common stock), or in the case of any sale or conveyance to another corporation or entity of the assets or other property of Hippo Holdings as an entirety or substantially as an entirety in connection with which Hippo Holdings is dissolved, the holders of the warrants will thereafter have the right to purchase and receive, upon the basis and upon the terms and conditions specified in the warrants and in lieu of Hippo Holdings common stock immediately theretofore purchasable and receivable upon the exercise of the rights represented thereby, the kind and amount of shares, stock or other equity securities or property (including cash) receivable upon such reclassification, reorganization, merger or consolidation, or upon a dissolution following any such sale or transfer, that the holder of the warrants would have received if such holder had exercised their warrants immediately prior to such event. However, if such holders were entitled to exercise a right of election as to the kind or amount of securities, cash or other assets receivable upon such merger or consolidation, then the kind and amount of securities, cash or other assets for which each warrant will become exercisable will be deemed to be the weighted average of the kind and amount received per share by such holders in such merger or consolidation that affirmatively make such election, and if a tender, exchange or redemption offer has been made to and accepted by such holders under circumstances in which, upon completion of such tender or exchange offer, the maker thereof, together with members of any
169
group (within the meaning ofmarket, or is to be so listed for trading or quoted immediately following such event, and if the registered holder of the warrant properly exercises the warrant within 30 days following public disclosure of such transaction, the warrant exercise price will be reduced as specified in the warrant agreement based on the per share consideration minus Black-Scholes Warrant Value (as defined in the warrant agreement) of the warrant.
Rule 13d-5(b)(1)
under the Exchange Act) of which such maker is a part, and together with any affiliate or associate of such maker (within the meaning ofRule 12b-2
under the Exchange Act) and any members of any such group of which any such affiliate or associate is a part, own beneficially (within the meaning ofRule 13d-3
under the Exchange Act) more than 50% of the issued and outstanding Hippo Holdings common stock, the holder of a warrant will be entitled to receive the highest amount of cash, securities or other property to which such holder would actually have been entitled as a shareholder if such warrant holder had exercised the warrant prior to the expiration of such tender or exchange offer, accepted such offer and all of the shares of Hippo Holdings common stock held by such holder had been purchased pursuant to such tender or exchange offer, subject to adjustment (from and after the consummation of such tender or exchange offer) as nearly equivalent as possible to the adjustments provided for in the warrant agreement. Additionally, if less than 70% of the consideration receivable by the holders of Hippo Holdings common stock in such a transaction is payable in the form of RTPZ Class A ordinary shares in the successor entity that is listed for trading on a national securities exchange or is quoted in an establishedover-the-counter
You should review a copy of the Warrant Agreement, which was filed as an exhibit to the IPO registration statement, for a complete description of the terms and conditions applicable to the warrants. The warrant agreement provides that (a) the terms of the warrants may be amended without the consent of any holder for the purpose of (i) curing any ambiguity or correcting any mistake, including to conform the provisions of the Warrant Agreement to the description of the terms of the warrants and the Warrant Agreement set forth in this prospectus, or defective provision or (ii) adding or changing any provisions with respect to matters or questions arising under the Warrant Agreement as the parties to the Warrant Agreement may deem necessary or desirable and that the parties deem to not adversely affect the rights of the registered holders of the warrants and (b) all other modifications or amendments require the vote or written consent of at least 50% of the then outstanding public warrants and, solely with respect to any amendment to the terms of the private placement warrants or any provision of the Warrant Agreement with respect to the private placement warrants, at least 50% of the then outstanding private placement warrants.
The warrant holders do not have the rights or privileges of holders of Hippo Holdings common stock until they exercise their warrants and receive Hippo Holdings common stock. After the issuance of Hippo Holdings common stock upon exercise of the warrants, each holder will be entitled to one vote for each share held of record on all matters to be voted on by shareholders.
Subject to applicable law, any action, proceeding or claim against Hippo Holdings arising out of or relating in any way to the warrant agreement will be brought and enforced in the courts of the State of New York or the United States District Court for the Southern District of New York, and Hippo Holdings irrevocably submits to such jurisdiction, which jurisdiction will be the exclusive forum for any such action, proceeding or claim. This provision applies to claims under the Securities Act but does not apply to claims under the Exchange Act or any claim for which the federal district courts of the United States of America are the sole and exclusive forum.
Private Placement Warrants
The private placement warrants (including the Hippo Holdings common stock issuable upon exercise of the private placement warrants) are not be transferable, assignable or salable until 30 days after the completion of the Business Combination (with certain limited exceptions) and they will not be redeemable by Hippo Holdings (except as described above) so long as they are held by the Sponsor or its permitted transferees. The Sponsor, or its permitted transferees, has the option to exercise the private placement warrants on a cashless basis and has certain registration rights described herein. Otherwise, the private placement warrants have terms and provisions that are identical to those of the public warrants. If the private placement warrants are held by holders other than
170
the Sponsor or its permitted transferees, the private placement warrants will be redeemable by Hippo Holdings in all redemption scenarios and exercisable by the holders on the same basis as the public warrants.
Except as described under “— Public Shareholders’ Warrants — Redemption of warrants when the price per share of Hippo Holdings common stock equals or exceeds $10.00,” if holders of the private placement warrants elect to exercise them on a cashless basis, they would pay the exercise price by surrendering their warrants for that number of shares of Hippo Holdings common stock equal to the quotient obtained by dividing (x) the product of the number of shares of Hippo Holdings common stock underlying the warrants, multiplied by the excess of the “sponsor fair market value” (defined below) less the exercise price of the warrants by (y) the sponsor fair market value. For these purposes, the “sponsor fair market value” shall mean the average last reported sale price of the Hippo Holdings common stock for the 10 trading days ending on the third trading day prior to the date on which the notice of warrant exercise is sent to the warrant agent.
Common Stock
Hippo Holdings common stock is not entitled to preemptive or other similar subscription rights to purchase any of Hippo Holdings’ securities. Hippo Holdings common stock is neither convertible nor redeemable. Unless Hippo Holdings’ board of directors determines otherwise, Hippo Holdings will issue all of Hippo Holdings’ capital stock in uncertificated form.
Voting Rights
Each holder of Hippo Holdings common stock is entitled to one vote per share on each matter submitted to a vote of stockholders, as provided by the Certificate of Incorporation. The Bylaws provide that the holders of a majority of the capital stock issued and outstanding and entitled to vote thereat, present in person or represented by proxy, will constitute a quorum at all meetings of the stockholders for the transaction of business. When a quorum is present, the affirmative vote of a majority of the votes cast is required to take action, unless otherwise specified by law, the Bylaws or the Certificate of Incorporation, and except for the election of directors, which is determined by a plurality vote. There are no cumulative voting rights. In addition, the affirmative vote of holders of 66 2/3% of the voting power of all of the then outstanding voting stock will be required to take certain actions, including amending certain provisions of our Certificate of Incorporation, such as the provisions relating to amending our Bylaws, the classified board and director liability.
Dividend Rights
Each holder of shares of Hippo Holdings’ capital stock is entitled to the payment of dividends and other distributions as may be declared by Hippo Holdings’ board of directors from time to time out of Hippo Holdings’ assets or funds legally available for dividends or other distributions. These rights are subject to the preferential rights of the holders of Hippo Holdings’ Preferred Stock, if any, and any contractual limitations on Hippo Holdings’ ability to declare and pay dividends.
Other Rights
Each holder of Hippo Holdings common stock is subject to, and may be adversely affected by, the rights of the holders of any series of Hippo Holdings preferred stock that Hippo Holdings may designate and issue in the future.
Liquidation Rights
If Hippo Holdings is involved in voluntary or involuntary liquidation, dissolution or winding up of Hippo Holdings’ affairs, or a similar event, each holder of Hippo Holdings common stock will participate pro rata in all assets remaining after payment of liabilities, subject to prior distribution rights of Hippo Holdings preferred stock, if any, then outstanding.
171
Anti-takeover Effects of the Certificate of Incorporation and the Bylaws
The Certificate of Incorporation and the Bylaws contain provisions that may delay, defer or discourage another party from acquiring control of Hippo Holdings. Hippo Holdings expects that these provisions, which are summarized below, will discourage coercive takeover practices or inadequate takeover bids. These provisions are also designed to encourage persons seeking to acquire control of Hippo Holdings to first negotiate with Hippo Holdings’ board of directors, which Hippo Holdings believes may result in an improvement of the terms of any such acquisition in favor of Hippo Holdings’ stockholders. However, they also give Hippo Holdings’ board of directors the power to discourage mergers that some stockholders may favor.
Undesignated Preferred Stock
The Certificate of Incorporation provides Hippo Holdings’ board of directors with the ability to authorize undesignated preferred stock will make it possible for Hippo Holdings’ board of directors to issue preferred stock with voting or other rights or preferences that could impede the success of any attempt to change control of Hippo Holdings. These and other provisions may have the effect of deterring hostile takeovers or delaying changes in control or management of Hippo Holdings.
Classified Board of Directors
The Certificate of Incorporation provides that Hippo Holdings’ board of directors is divided into three classes of directors, with the classes to be as nearly equal in number as possible, and with each director serving a three-year term. As a result,
approximately one-third of
the board of directors will be elected each year. The classification of directors has the effect of making it more difficult for stockholders to change the composition of Hippo Holdings’ board of directors.Special Meetings of Stockholders
The Certificate of Incorporation provides that a special meeting of stockholders may be called by the (a) the Chairperson of Hippo Holdings’ board of directors, (b) Hippo Holdings’ board of directors, (c) the Chief Executive Officer of Hippo Holdings or (d) the President of Hippo Holdings, provided that such special meeting may be postponed, rescheduled or cancelled by Hippo Holdings’ board of directors or other person calling the meeting.
Requirements for Advance Notification of Stockholder Nominations and Proposals
The Bylaws establish advance notice procedures with respect to stockholder proposals and the nomination of candidates for election as directors, other than nominations made by or at the direction of the board of directors or a committee of the board of directors.
Action by Written Consent
The Certificate of Incorporation provides that any action required or permitted to be taken by the stockholders must be effected at an annual or special meeting of the stockholders, and may not be taken by written consent in lieu of a meeting.
Removal of Directors
Hippo Holdings’ board of directors or any individual director may be removed from office at any time, but only for cause and only by the affirmative vote of the holders of at least a majority of the voting power of all of the then outstanding shares of voting stock of Hippo Holdings entitled to vote at an election of directors.
172
Delaware Anti-Takeover Statute
Section 203 of the DGCL provides that if a person acquires 15% or more of the voting stock of a Delaware corporation, such person becomes an “interested stockholder” and may not engage in certain “business combinations” with such corporation for a period of three years from the time such person acquired 15% or more of such corporation’s voting stock, unless: (1) the board of directors of such corporation approves the acquisition of stock or the merger transaction before the time that the person becomes an interested stockholder, (2) the interested stockholder owns at least 85% of the outstanding voting stock of such corporation at the time the merger transaction commences (excluding voting stock owned by directors who are also officers and certain employee stock plans), or (3) the merger transaction is approved by the board of directors and at a meeting of stockholders, not by written consent, by the affirmative vote of 2/3 of the outstanding voting stock which is not owned by the interested stockholder. A Delaware corporation may elect in its certificate of incorporation or bylaws not to be governed by this particular Delaware law. Under the Certificate of Incorporation, Hippo Holdings opted out of Section 203 of the DGCL, but will provide other similar restrictions regarding takeovers by interested stockholders.
Limitations on Liability and Indemnification of Officers and Directors
The Certificate of Incorporation provides that Hippo Holdings will indemnify Hippo Holdings’ officers and directors to the fullest extent authorized or permitted by applicable law. Hippo Holdings expects to enter into agreements to indemnify Hippo Holdings’ directors, executive officers and other employees as determined by Hippo Holdings’ board of directors. Under the Bylaws, Hippo Holdings is required to indemnify each of Hippo Holdings’ directors and officers if the basis of the indemnitee’s involvement was by reason of the fact that the indemnitee is or was a director or officer of Hippo Holdings or was serving at Hippo Holdings’ request as a director, officer, employee or agent for another entity. Hippo Holdings must indemnify Hippo Holdings’ officers and directors against all expenses (including attorneys’ fees), judgments, fines and amounts paid in settlement actually and reasonably incurred by the indemnitee in connection with such action, suit or proceeding if the indemnitee acted in good faith and in a manner the indemnitee reasonably believed to be in or not opposed to the best interests of Hippo Holdings, and, with respect to any criminal action or proceeding, had no reasonable cause to believe the indemnitee’s conduct was unlawful. The Bylaws also require Hippo Holdings to advance expenses (including attorneys’ fees) incurred by a director or officer in defending any civil, criminal, administrative or investigative action, suit or proceeding, provided that such person will repay any such advance if it is ultimately determined that such person is not entitled to indemnification by Hippo Holdings. Any claims for indemnification by Hippo Holdings’ directors and officers may reduce Hippo Holdings’ available funds to satisfy successful third-party claims against Hippo Holdings and may reduce the amount of money available to Hippo Holdings.
Exclusive Jurisdiction of Certain Actions
Our Certificate of Incorporation and Bylaws provide, that: (i) unless Hippo Holdings consents in writing to the selection of an alternative forum, the Court of Chancery of the State of Delaware (or, if such court does not have subject matter jurisdiction thereof, the federal district court of the State of Delaware) will, to the fullest extent permitted by law, be the sole and exclusive forum for: (A) any derivative action or proceeding brought on behalf of Hippo Holdings, (B) any action asserting a claim for or based on a breach of a fiduciary duty owed by any of Hippo Holdings’ current or former director, officer, other employee, agent or stockholder to the company or Hippo Holdings’ stockholders, including without limitation a claim alleging the aiding and abetting of such a breach of fiduciary duty, (C) any action asserting a claim against the company or any of our current or former director, officer, employee, agent or stockholder arising pursuant to any provision of the Delaware General Corporation Law or the Certificate of Incorporation, Bylaws or as to which the Delaware General Corporation Law confers jurisdiction on the Court of Chancery of the State of Delaware, or (D) any action asserting a claim related to or involving the company that is governed by the internal affairs doctrine; (ii) unless Hippo Holdings consents in writing to the selection of an alternative forum, the federal district courts of the United States will, to
173
the fullest extent permitted by law, be the sole and exclusive forum for the resolution of any complaint asserting a cause of action arising under the Securities Act of 1933, as amended (the “Securities Act”), and the rules and regulations promulgated thereunder; (iii) any person or entity purchasing or otherwise acquiring or holding any interest in shares of capital stock of the company will be deemed to have notice of and consented to these provisions; and (iv) failure to enforce the foregoing provisions would cause Hippo Holdings irreparable harm, and Hippo Holdings will be entitled to equitable relief, including injunctive relief and specific performance, to enforce the foregoing provisions. Nothing in the Certificate of Incorporation or Bylaws precludes stockholders that assert claims under the Securities Exchange Act of 1934, as amended (the “Exchange Act”), from bringing such claims in federal court to the extent that the Exchange Act confers exclusive federal jurisdiction over such claims, subject to applicable law.
Although the Certificate of Incorporation or Bylaws contain the choice of forum provision described above, it is possible that a court could find that such a provision is inapplicable for a particular claim or action or that such provision is unenforceable. For example, Section 22 of the Securities Act creates concurrent jurisdiction for federal and state courts over all suits brought to enforce any duty or liability created by the Securities Act or the rules and regulations thereunder. Accordingly, there is uncertainty as to whether a court would enforce such a forum selection provision as written in connection with claims arising under the Securities Act.
Transfer Agent
The transfer agent for Hippo Holdings common stock is Continental Stock Transfer & Trust Company.
174
SECURITIES ACT RESTRICTIONS ON RESALE OF OUR SECURITIES
Pursuant to Rule 144 under the Securities Act (“Rule 144”), a person who has beneficially owned restricted Hippo Holdings common stock or Hippo Holdings warrants for at least six months would be entitled to sell their securities provided that (i) such person is not deemed to have been an affiliate of Hippo Holdings at the time of, or at any time during the three months preceding, a sale and (ii) Hippo Holdings is subject to the Exchange Act periodic reporting requirements for at least three months before the sale and has filed all required reports under Section 13 or 15(d) of the Exchange Act during the 12 months (or such shorter period as Hippo Holdings was required to file reports) preceding the sale.
Persons who have beneficially owned restricted Hippo Holdings common stock shares or Hippo Holdings warrants for at least six months but who are affiliates of Hippo Holdings at the time of, or at any time during the three months preceding, a sale, would be subject to additional restrictions, by which such person would be entitled to sell within any three-month period only a number of securities that does not exceed the greater of:
| • | 1% of the total number of Hippo Holdings common stock then outstanding; or |
| • | the average weekly reported trading volume of Hippo Holdings’ common stock during the four calendar weeks preceding the filing of a notice on Form 144 with respect to the sale. |
Sales by affiliates of Hippo Holdings under Rule 144 are also limited by manner of sale provisions and notice requirements and to the availability of current public information about Hippo Holdings.
Restrictions on the Use of Rule 144 by Shell Companies or Former Shell Companies
Rule 144 is not available for the resale of securities initially issued by shell companies (other than business combination related shell companies) or issuers that have been at any time previously a shell company. However, Rule 144 also includes an important exception to this prohibition if the following conditions are met:
| • | the issuer of the securities that was formerly a shell company has ceased to be a shell company; |
| • | the issuer of the securities is subject to the reporting requirements of Section 13 or 15(d) of the Exchange Act; |
| • | the issuer of the securities has filed all Exchange Act reports and material required to be filed, as applicable, during the preceding 12 months (or such shorter period that the issuer was required to file such reports and materials), other than Form 8-K reports; and |
| • | at least one year has elapsed from the time that the issuer filed current Form 10 type information with the SEC reflecting its status as an entity that is not a shell company. |
Following the closing of the Business Combination, we are no longer a shell company and so, once the conditions set forth in the exceptions listed above are satisfied, Rule 144 will become available for the resale of the above-noted restricted securities.
175
PLAN OF DISTRIBUTION
The Selling Securityholders, which as used herein, includes donees, pledgees, transferees, distributees or otherselling shares of our common stock or warrants or interests in our common stock or warrants received after the date of this prospectus from the Selling Securityholders as a gift, pledge, partnership distribution or other transfer, may, from time to time, sell, transfer, distribute or otherwise dispose of certain of their shares of common stock or warrants or interests in our common stock or warrants on any stock exchange, market or trading facility on which shares of our common stock or warrants, as applicable, are traded or in private transactions. These dispositions may be at fixed prices, at prevailing market prices at the time of sale, at prices related to the prevailing market price, at varying prices determined at the time of sale, or at negotiated prices.
successors-in-interest
The Selling Securityholders may use any one or more of the following methods when disposing of their shares of common stock or warrants or interests therein:
| • | ordinary brokerage transactions and transactions in which the broker-dealer solicits purchasers; |
| • | one or more underwritten offerings; |
| • | block trades in which the broker-dealer will attempt to sell the shares of common stock or warrants as agent, but may position and resell a portion of the block as principal to facilitate the transaction; |
| • | purchases by a broker-dealer as principal and resale by the broker-dealer for its accounts; |
| • | an exchange distribution in accordance with the rules of the applicable exchange; |
| • | privately negotiated transactions; |
| • | distributions to their members, partners or shareholders; |
| • | short sales effected after the date of the registration statement of which this prospectus is a part is declared effective by the SEC; |
| • | through the writing or settlement of options or other hedging transactions, whether through an options exchange or otherwise; |
| • | in market transactions, including transactions on a national securities exchange or quotations service or over-the-counter |
| • | directly to one or more purchasers; |
| • | through agents; |
| • | broker-dealers may agree with the Selling Securityholders to sell a specified number of such shares of common stock or warrants at a stipulated price per share or warrant; and |
| • | a combination of any such methods of sale. |
The Selling Securityholders may, from time to time, pledge or grant a security interest in some shares of our common stock or warrants owned by them and, if a Selling Securityholder defaults in the performance of its secured obligations, the pledgees or secured parties may offer and sell such shares of common stock or warrants, as applicable, from time to time, under this prospectus, or under an amendment or supplement to this prospectus amending the list of the Selling Securityholders to include the pledgee, transferee or other successors in interest as the Selling Securityholders under this prospectus. The Selling Securityholders also may transfer shares of our common stock or warrants in other circumstances, in which case the transferees, pledgees or other successors in interest will be the selling beneficial owners for purposes of this prospectus.
In connection with the sale of shares of our common stock or warrants or interests therein, the Selling Securityholders may enter into hedging transactions with broker-dealers or other financial institutions, which
176
may in turn engage in short sales of our common stock or warrants in the course of hedging the positions they assume. The Selling Securityholders may also sell shares of our common stock or warrants short and deliver these securities to close out their short positions, or loan or pledge shares of our common stock or warrants to broker-dealers that in turn may sell these securities. The Selling Securityholders may also enter into option or other transactions with broker-dealers or other financial institutions or the creation of one or more derivative securities that require the delivery to such broker-dealer or other financial institution of shares of our common stock or warrants offered by this prospectus, which shares or warrants such broker-dealer or other financial institution may resell pursuant to this prospectus (as supplemented or amended to reflect such transaction).
The aggregate proceeds to the Selling Securityholders from the sale of shares of our common stock or warrants offered by them will be the purchase price of such shares of our common stock or warrants less discounts or commissions, if any. The Selling Securityholders reserve the right to accept and, together with their agents from time to time, to reject, in whole or in part, any proposed purchase of share of our common stock or warrants to be made directly or through agents. We will not receive any of the proceeds from any offering by the Selling Securityholders.
The Selling Securityholders also may in the future resell a portion of our common stock or warrants in open market transactions in reliance upon Rule 144 under the Securities Act, provided that they meet the criteria and conform to the requirements of that rule, or pursuant to other available exemptions from the registration requirements of the Securities Act.
The Selling Securityholders and any underwriters, broker-dealers or agents that participate in the sale of shares of our common stock or warrants or interests therein may be “underwriters” within the meaning of Section 2(11) of the Securities Act. Any discounts, commissions, concessions or profit they earn on any resale of shares of our common stock or warrants may be underwriting discounts and commissions under the Securities Act. If any Selling Securityholder is an “underwriter” within the meaning of Section 2(11) of the Securities Act, then the Selling Securityholder will be subject to the prospectus delivery requirements of the Securities Act. Underwriters and their controlling persons, dealers and agents may be entitled, under agreements entered into with us and the Selling Securityholders, to indemnification against and contribution toward specific civil liabilities, including liabilities under the Securities Act.
To the extent required, our common stock or warrants to be sold, the respective purchase prices and public offering prices, the names of any agent, dealer or underwriter, and any applicable discounts, commissions, concessions or other compensation with respect to a particular offer will be set forth in an accompanying prospectus supplement or, if appropriate, a post-effective amendment to the registration statement that includes this prospectus.
To facilitate the offering of shares of our common stock and warrants offered by the Selling Securityholders, certain persons participating in the offering may engage in transactions that stabilize, maintain or otherwise affect the price of our common stock or warrants. This may include over-allotments or short sales, which involve the sale by persons participating in the offering of more shares of common stock or warrants than were sold to them. In these circumstances, these persons would cover such over-allotments or short positions by making purchases in the open market or by exercising their over-allotment option, if any. In addition, these persons may stabilize or maintain the price of our common stock or warrants by bidding for or purchasing shares of common stock or warrants in the open market or by imposing penalty bids, whereby selling concessions allowed to dealers participating in the offering may be reclaimed if shares of common stock or warrants sold by them are repurchased in connection with stabilization transactions. The effect of these transactions may be to stabilize or maintain the market price of our common stock or warrants at a level above that which might otherwise prevail in the open market. These transactions may be discontinued at any time.
Under the Registration Rights Agreement, we have agreed to indemnify the Selling Securityholders party thereto against certain liabilities that they may incur in connection with the sale of the securities registered
177
hereunder, including liabilities under the Securities Act, and to contribute to payments that the Selling Securityholders may be required to make with respect thereto. In addition, we and the Selling Securityholders have agreed to indemnify any underwriter against certain liabilities related to the selling of the securities, including liabilities arising under the Securities Act.
We have agreed to maintain the effectiveness of this registration statement until all such securities have been sold under this registration statement or Rule 144 under the Securities Act or are no longer outstanding. We have agreed to pay all expenses in connection with this offering, other than underwriting commissions and discounts, brokerage fees, underwriter marketing costs, and certain legal expenses. The Selling Securityholders will pay any underwriting commissions and discounts, brokerage fees, underwriter marketing costs, and certain legal expenses relating to the offering.
Selling Securityholders may use this prospectus in connection with resales of shares of our common stock and warrants. This prospectus and any accompanying prospectus supplement will identify the Selling Securityholders, the terms of our common stock or warrants and any material relationships between us and the Selling Securityholders. Selling Securityholders may be deemed to be underwriters under the Securities Act in connection with shares of our common stock or warrants they resell and any profits on the sales may be deemed to be underwriting discounts and commissions under the Securities Act. Unless otherwise set forth in a prospectus supplement, the Selling Securityholders will receive all the net proceeds from the resale of shares of our common stock or warrants.
A Selling Securityholder that is an entity may elect to make an
in-kind
distribution of common stock or warrants to its members, partners or shareholders pursuant to the registration statement of which this prospectus is a part by delivering a prospectus. To the extent that such members, partners or shareholders are not affiliates of ours, such members, partners or shareholders would thereby receive freely tradable shares of common stock or warrants pursuant to the distribution through a registration statement.We are required to pay all fees and expenses incident to the registration of shares of our common stock and warrants to be offered and sold pursuant to this prospectus, which we expect to be approximately $0.41 million.
178
LEGAL MATTERS
Latham & Watkins LLP has passed upon the validity of the securities of Hippo Holdings offered by this prospectus and certain other legal matters related to this prospectus.
EXPERTS
The financial statements of RTPZ as of and for the period from October 2, 2020 (inception) through December 31, 2020, included in this prospectus have been audited by WithumSmith+Brown, PC, independent registered public accounting firm, as stated in their report thereon, and included in this prospectus, in reliance upon such report and upon the authority of such firm as experts in accounting and auditing.
The consolidated financial statements of Hippo Enterprises Inc. and Subsidiaries at December 31, 2020 and 2019, and for each of the two years in the period ended December 31, 2020 included in this prospectus, have been audited by Ernst & Young LLP, independent registered public accounting firm, as set forth in their report appearing elsewhere herein, and are included in reliance upon such report given on the authority of such firm as experts in accounting and auditing.
The financial statements of Spinnaker Insurance Company at December 31, 2019 and 2018 and for each of the two years in the period ended December 31, 2019 included in this prospectus have been audited by Mazars USA LLP, independent registered public accounting firm, as set forth in their report appearing elsewhere herein, and are included in reliance upon such report given on the authority of such firm as experts in accounting and auditing.
WHERE YOU CAN FIND MORE INFORMATION
We file annual, quarterly and current reports, proxy statements and other information with the SEC pursuant to the Exchange Act. We have also filed a registration statement on Form
S-1,
including exhibits, under the Securities Act with respect to the shares of common stock offered by this prospectus. This prospectus is part of the registration statement, but does not contain all of the information included in the registration statement or the exhibits. Our SEC filings are available to the public on the internet at a website maintained by the SEC located at www.sec.gov. Those filings are also available to the public on, or accessible through, our investor relations website under the heading “Financials” at investors.hippo.com. The information on our web site, however, is not, and should not be deemed to be, a part of this prospectus.179
INDEX TO FINANCIAL STATEMENTS
REINVENT TECHNOLOGY PARTNERS Z
Page | ||||
Financial Statements (Audited) for the period from October 2, 2020 (inception) to December 31, 2020 | ||||
| F-3 | ||||
| F-4 | ||||
| F-5 | ||||
| F-6 | ||||
| F-7 | ||||
| F-8 | ||||
Financial Statements (Unaudited) for the three and six months ended June 30, 2021 | ||||
| F-26 | ||||
| F-27 | ||||
| F-28 | ||||
| F-29 | ||||
| F-30 | ||||
HIPPO ENTERPRISES INC. AND SUBSIDIARIES
Consolidated Financial Statements
Years Ended December 31, 2019 and December 31, 2020
Page | ||||
| F-47 | ||||
| F-48 | ||||
| F-49 | ||||
| F-50 | ||||
| F-51 | ||||
| F-52 | ||||
| F-92 | ||||
| F-96 | ||||
Schedules other than those listed above are omitted for the reason that they are not required, are not applicable or that equivalent information has been included in the financial statements or notes thereto or elsewhere herein.
F-1
Unaudited Consolidated Financial Statements
As of and for the three and six months ended June 30, 2021 and June 30, 2020
Page | ||||
| F-97 | ||||
| F-98 | ||||
| F-99 | ||||
| F-100 | ||||
| F-101 | ||||
SPINNAKER INSURANCE COMPANY
Consolidated Financial Statements
Years Ended December 31, 2019 and December 31, 2018
Page | ||||
| F-120 | ||||
| F-121 | ||||
| F-122 | ||||
| F-123 | ||||
| F-124 | ||||
| F-125 | ||||
Unaudited Consolidated Financial Statements
As of and for the six months ended June 30, 2020 and 2019
Page | ||||
| F-139 | ||||
| F-140 | ||||
| F-141 | ||||
| F-142 | ||||
| F-143 | ||||
F-2
Report of Independent Registered Public Accounting Firm
To the Shareholders and the Board of Directors of
Reinvent Technology Partners Z
Opinion on the Financial Statements
We have audited the accompanying balance sheet of Reinvent Technology Partners Z (the “Company”), as of December 31, 2020, the related statements of operations, changes in shareholders’ equity and cash flows for the period from October 2, 2020 (inception) through December 31, 2020, and the related notes (collectively referred to as the “financial statements”). In our opinion, the financial statements present fairly, in all material respects, the financial position of the Company as of December 31, 2020, and the results of its operations and its cash flows for the period from October 2, 2020 (inception) through December 31, 2020, in conformity with accounting principles generally accepted in the United States of America.
Restatement of Financial Statements
As discussed in Note 2 to the financial statements, the Securities and Exchange Commission issued a public statement entitled(the “Public Statement”) on April 12, 2021, which discusses the accounting for certain warrants as liabilities. The Company previously accounted for its warrants as equity instruments. Management evaluated its warrants against the Public Statement, and determined that the warrants should be accounted for as liabilities. Accordingly, the 2020 financial statements have been restated to correct the accounting and related disclosure for the warrants.
Staff Statement on Accounting and Reporting Considerations for Warrants Issued by Special Purpose Acquisition Companies
(“SPACs”)
Basis for Opinion
These financial statements are the responsibility of the Company’s management. Our responsibility is to express an opinion on the Company’s financial statements based on our audit. We are a public accounting firm registered with the Public Company Accounting Oversight Board (United States) (“PCAOB”) and are required to be independent with respect to the Company in accordance with the U.S. federal securities laws and the applicable rules and regulations of the Securities and Exchange Commission and the PCAOB.
We conducted our audit in accordance with the standards of the PCAOB. Those standards require that we plan and perform the audit to obtain reasonable assurance about whether the financial statements are free of material misstatement, whether due to error or fraud. The Company is not required to have, nor were we engaged to perform, an audit of its internal control over financial reporting. As part of our audit we are required to obtain an understanding of internal control over financial reporting but not for the purpose of expressing an opinion on the effectiveness of the Company’s internal control over financial reporting. Accordingly, we express no such opinion.
Our audit included performing procedures to assess the risks of material misstatement of the financial statements, whether due to error or fraud, and performing procedures that respond to those risks. Such procedures included examining, on a test basis, evidence regarding the amounts and disclosures in the financial statements. Our audit also included evaluating the accounting principles used and significant estimates made by management, as well as evaluating the overall presentation of the financial statements. We believe that our audit provides a reasonable basis for our opinion.
/s/ WithumSmith+Brown, PC
We have served as the Company’s auditor since 2020.
New York, New York
May 10, 2021
F-3
REINVENT TECHNOLOGY PARTNERS Z
BALANCE SHEET
DECEMBER 31, 2020
(As Restated)
Assets: | ||||
Current assets | ||||
Cash | $ | 622,985 | ||
Prepaid expenses | 1,074,689 | |||
Total Current Assets | 1,697,674 | |||
Cash and investments held in Trust Account | 230,018,693 | |||
Total Assets | $ | 231,716,367 | ||
Liabilities and Shareholders’ Equity: | ||||
Current liabilities: | ||||
Accrued expenses | $ | 139,684 | ||
Due to related party | 11,560 | |||
Total current liabilities | 151,244 | |||
Deferred legal fees | 200,000 | |||
Deferred underwriting commissions | 8,050,000 | |||
Derivative warrant liabilities | 13,467,630 | |||
Total Liabilities | 21,868,874 | |||
Commitments and Contingencies | ||||
Class A ordinary shares, $0.0001 par value; 20,484,749 shares subject to possible redemption at $10.00 per share | 204,847,490 | |||
Shareholders’ Equity: | ||||
Preference shares, $0.0001 par value; 5,000,000 shares authorized; NaNissued and outstanding | 0 | |||
Class A ordinary shares, $0.0001 par value; 500,000,000 shares authorized; 2,515,251 shares issued and outstanding (excluding 20,484,749 shares subject to possible redemption) | 252 | |||
Class B ordinary shares, $0.0001 par value; 50,000,000 shares authorized; 5,750,000 shares issued and outstanding | 575 | |||
Additional paid-in capital | 6,471,389 | |||
Accumulated deficit | (1,472,213 | ) | ||
Total shareholders’ equity | 5,000,003 | |||
Total Liabilities and Shareholders’ Equity | $ | 231,716,367 | ||
The accompanying notes are an integral part of these financial statements.
F-4
REINVENT TECHNOLOGY PARTNERS Z
STATEMENT OF OPERATIONS
FOR THE PERIOD FROM OCTOBER 2, 2020 (INCEPTION) THROUGH DECEMBER 31, 2020
(As Restated)
General and administrative expenses | $ | 250,366 | ||
Loss from operations | (250,366 | ) | ||
Other income (expense) | ||||
Unrealized gain on investments held in Trust Account | 18,693 | |||
Financing costs — derivative warrant liabilities | (374,490 | ) | ||
Change in fair value of derivative warrant liabilities | (866,050 | ) | ||
Total other income (expense) | (1,221,847 | ) | ||
Net loss | $ | (1,472,213 | ) | |
Basic and diluted weighted average shares outstanding of Class A ordinary shares | 23,000,000 | |||
Basic and diluted net loss per ordinary share | $ | 0 | ||
Basic and diluted weighted average shares outstanding of Class B ordinary shares | 5,750,000 | |||
Basic and diluted net loss per ordinary share | $ | (0.26 | ) | |
The accompanying notes are an integral part of these financial statements.
F-5
REINVENT TECHNOLOGY PARTNERS Z
STATEMENT OF CHANGES IN SHAREHOLDERS’ EQUITY
FOR THE PERIOD FROM OCTOBER 2, 2020 (INCEPTION) THROUGH DECEMBER 31, 2020
(As Restated)
Ordinary Shares | Additional Paid-in Capital | Accumulated Deficit | Total Shareholders’ Equity | |||||||||||||||||||||||||
Class A | Class B | |||||||||||||||||||||||||||
Shares | Amount | Shares | Amount | |||||||||||||||||||||||||
Balance — October 2, 2020 (inception) | 0 | $ | 0 | 0 | $ | 0 | $ | 0 | $ | 0 | $ | 0 | ||||||||||||||||
Issuance of Class B ordinary shares to Sponsor | — | — | 5,750,000 | 575 | 24,425 | — | 25,000 | |||||||||||||||||||||
Sale of units in initial public offering less fair value of public warrants | 23,000,000 | 2,300 | — | — | 223,608,210 | — | 223,610,510 | |||||||||||||||||||||
Offering costs | — | — | — | — | (12,703,714 | ) | — | (12,703,714 | ) | |||||||||||||||||||
Excess cash received over fair value of private placement warrants | — | — | — | — | 387,910 | — | 387,910 | |||||||||||||||||||||
Shares subject to possible redemption | (20,484,749 | ) | (2,048 | ) | — | — | (204,845,442 | ) | — | (204,847,490 | ) | |||||||||||||||||
Net loss | — | — | — | — | — | (1,472,213 | ) | (1,472,213 | ) | |||||||||||||||||||
Balance — December 31, 2020 | 2,515,251 | $ | 252 | 5,750,000 | $ | 575 | $ | 6,471,389 | $ | (1,472,213 | ) | $ | 5,000,003 | |||||||||||||||
The accompanying notes are an integral part of these financial statements.
F-6
REINVENT TECHNOLOGY PARTNERS Z
STATEMENT OF CASH FLOWS
FOR THE PERIOD FROM OCTOBER 2, 2020 (INCEPTION) THROUGH DECEMBER 31, 2020
(As Restated)
Cash Flows from Operating Activities: | ||||
Net loss | $ | (1,472,213 | ) | |
Adjustments to reconcile net loss to net cash used in operating activities: | ||||
General and administrative expenses paid by Sponsor in exchange for issuance of Class B ordinary shares | 25,000 | |||
Unrealized gain on investments held in Trust Account | (18,693 | ) | ||
Change in fair value of derivative warrant liabilities | 866,050 | |||
Financing costs — derivative warrant liabilities | 374,490 | |||
Changes in operating assets and liabilities: | ||||
Prepaid expenses | (1,074,689 | ) | ||
Accrued expenses | 54,684 | |||
Due to related party | 11,560 | |||
Net cash used in operating activities | (1,233,811 | ) | ||
Cash Flows from Investing Activities | ||||
Cash deposited in Trust Account | (230,000,000 | ) | ||
Net cash used in investing activities | (230,000,000 | ) | ||
Cash Flows from Financing Activities: | ||||
Repayment of note payable to related party | (60,093 | ) | ||
Proceeds received from initial public offering, gross | 230,000,000 | |||
Proceeds received from private placement | 6,600,000 | |||
Offering costs paid | (4,683,111 | ) | ||
Net cash provided by financing activities | 231,856,796 | |||
Net increase in cash | 622,985 | |||
Cash — beginning of the period | 0 | |||
Cash — end of the period | $ | 622,985 | ||
Supplemental disclosure of noncash activities: | ||||
Offering costs included in accrued expenses | $ | 85,000 | ||
Offering costs paid through note payable — related party | $ | 60,093 | ||
Deferred legal fees | $ | 200,000 | ||
Deferred underwriting commissions in connection with the initial public offering | $ | 8,050,000 | ||
Initial value of common stock subject to possible redemption | $ | 205,911,610 | ||
Change in value of common stock subject to possible redemption | $ | (1,064,120 | ) |
The accompanying notes are an integral part of these financial statements.
F-7
REINVENT TECHNOLOGY PARTNERS Z
NOTES TO FINANCIAL STATEMENTS
Note 1 — Description of Organization, Business Operations and Basis of Presentation
Reinvent Technology Partners Z, formerly known as Reinvent Technology Partners B (the “Company”), is a blank check company incorporated as a Cayman Islands exempted company on October 2, 2020. The Company was incorporated for the purpose of effecting a merger, share exchange, asset acquisition, share purchase, reorganization or similar business combination with one or more businesses that the Company has not yet identified (“Business Combination”).
All activity for the period from October 2, 2020 (inception) through December 31, 2020 relates to the Company’s formation and the initial public offering (the “Initial Public Offering”), which is described below, and, subsequent to the Initial Public Offering, the search for a target company for a Business Combination. The Company has selected December 31 as its fiscal year end. The Company will not generate any operating revenues until after the completion of its initial Business Combination, at the earliest. The Company will generate
non-operating
income in the form of interest income on cash and cash equivalents from the net proceeds derived from the Initial Public Offering and Private Placement (defined below).The Company’s sponsor is Reinvent Sponsor Z LLC, a Cayman Islands limited liability company (“Sponsor”). The registration statement for the Company’s Initial Public Offering was declared effective on November 18, 2020. On November 23, 2020, the Company consummated its Initial Public Offering of 23,000,000 units (the “Units” and, with respect to the Class A ordinary shares included in the Units, the “Public Shares”), including 3,000,000 additional Units to cover over-allotments (the “Over-Allotment Units”), at $10.00 per Unit, generating gross proceeds of $230.0 million, and incurring offering costs of approximately $13.1 million, inclusive of approximately $8.1 million in deferred underwriting commissions (Note 7).
Substantially concurrently with the closing of the Initial Public Offering, the Company consummated the private placement (the “Private Placement”) of 4,400,000 warrants (each, a “Private Placement Warrant” and collectively, the “Private Placement Warrants”), at a price of $1.50 per Private Placement Warrant to the Sponsor, generating gross proceeds of $6.6 million (Note 5).
Upon the closing of the Initial Public Offering and the Private Placement, $230.0 million ($10.00 per Unit) of the net proceeds of the Initial Public Offering and certain of the proceeds of the Private Placement were placed in a trust account (“Trust Account”) with Continental Stock Transfer & Trust Company acting as trustee and invested in United States government treasury bills with a maturity of 185 days or less or in money market funds investing solely in U.S. Treasuries and meeting certain conditions under Rule
2a-7
under the Investment Company Act of 1940, as amended, or the Investment Company Act, as determined by the Company, until the earlier of: (i) the completion of a Business Combination and (ii) the distribution of the Trust Account as described below.The Company’s management has broad discretion with respect to the specific application of the net proceeds of its Initial Public Offering and the sale of Private Placement Warrants, although substantially all of the net proceeds are intended to be applied generally toward consummating a Business Combination. The Company’s initial Business Combination must be with one or more operating businesses or assets with a fair market value equal to at least 80% of the net assets held in the Trust Account (net of amounts disbursed to management for working capital purposes, if permitted, and excluding the amount of any deferred underwriting discount held in Trust) at the time the Company signs a definitive agreement in connection with the initial Business Combination. However, the Company will only complete a Business Combination if the post-transaction company owns or acquires 50% or more of the outstanding voting securities of the target or otherwise acquires a controlling interest in the target sufficient for it not to be required to register as an investment company under the Investment Company Act.
F-8
The Company will provide its holders of Public Shares (the “Public Shareholders”) with the opportunity to redeem all or a portion of their Public Shares upon the completion of a Business Combination either (i) in connection with a general meeting called to approve the Business Combination or (ii) by means of a tender offer. The decision as to whether the Company will seek shareholder approval of a Business Combination or conduct a tender offer will be made by the Company. The Public Shareholders will be entitled to redeem their Public Shares for a pro rata portion of the amount then in the Trust Account. The
per-share
amount to be distributed to Public Shareholders who redeem their Public Shares will not be reduced by the deferred underwriting commissions the Company will pay to the underwriters (as discussed in Note 7). These Public Shares will be recorded at a redemption value and classified as temporary equity upon the completion of the Initial Public Offering, in accordance with Accounting Standards Codification (“ASC”) Topic 480 “Distinguishing Liabilities from Equity.” In such case, the Company will proceed with a Business Combination if the Company has net tangible assets of at least $5,000,001 upon such consummation of a Business Combination and a majority of the shares voted are voted in favor of the Business Combination. If a shareholder vote is not required by law and the Company does not decide to hold a shareholder vote for business or other reasons, the Company will, pursuant to the Company’s amended and restated memorandum and articles of association (the “Amended and Restated Memorandum and Articles of Association”), conduct the redemptions pursuant to the tender offer rules of the U.S. Securities and Exchange Commission (the “SEC”), and file tender offer documents with the SEC prior to completing a Business Combination. If, however, a shareholder approval of the transactions is required by law, or the Company decides to obtain shareholder approval for business or other reasons, the Company will offer to redeem shares in conjunction with a proxy solicitation pursuant to the proxy rules and not pursuant to the tender offer rules. Additionally, each Public Shareholder may elect to redeem their Public Shares irrespective of whether they vote for or against the proposed transaction. If the Company seeks shareholder approval in connection with a Business Combination, the holders of the Founder Shares (as defined in Note 6) prior to the Initial Public Offering (the “Initial Shareholders”) agreed to vote their Founder Shares and any Public Shares purchased by them during or after the Initial Public Offering in favor of a Business Combination. In addition, the Initial Shareholders agreed to waive their redemption rights with respect to their Founder Shares and Public Shares in connection with the completion of a Business Combination.Notwithstanding the foregoing, the Company’s Amended and Restated Memorandum and Articles of Association provides that a Public Shareholder, together with any affiliate of such shareholder or any other person with whom such shareholder is acting in concert or as a “group” (as defined under Section 13 of the Securities Exchange Act of 1934, as amended (the “Exchange Act”)), will be restricted from redeeming its shares with respect to more than an aggregate of 15% of the Class A ordinary shares sold in the Initial Public Offering, without the prior consent of the Company.
The Company’s Sponsor, executive officers and directors agreed not to propose an amendment to the Amended and Restated Memorandum and Articles of Association that would affect the substance or timing of the Company’s obligation to provide for the redemption of its Public Shares in connection with a Business Combination or to redeem 100% of its Public Shares if the Company does not complete a Business Combination, unless the Company provides the Public Shareholders with the opportunity to redeem their Class A ordinary shares in conjunction with any such amendment.
If the Company is unable to complete a Business Combination within 24 months from the closing of the Initial Public Offering, or 27 months from the closing of the Initial Public Offering if the Company has executed a letter of intent, agreement in principle or definitive agreement for an initial Business Combination within 24 months from the closing of the Initial Public Offering (as such period may be extended, the “Combination Period”), the Company will (i) cease all operations except for the purpose of winding up; (2) as promptly as reasonably possible but not more than 10 business days thereafter, redeem the Public Shares, at a
per-share
price, payable in cash, equal to the aggregate amount then on deposit in the Trust Account, including interest earned on the funds held in the Trust Account and not previously released to the Company to fund its working capital requirements, subject to an annual limit of $165,000, and/or to pay its taxes (less up to $100,000 of interest to pay dissolution expenses and which interest shall be net of taxes payable), divided by the number of then issuedF-9
and outstanding Public Shares, which redemption will completely extinguish Public Shareholders’ rights as shareholders (including the right to receive further liquidating distributions, if any); and (3) as promptly as reasonably possible following such redemption, subject to the approval of the remaining shareholders and the board of directors, liquidate and dissolve, subject in each case to the Company’s obligations under Cayman Islands law to provide for claims of creditors and the requirements of other applicable law.
The Initial Shareholders agreed to waive their liquidation rights with respect to the Founder Shares if the Company fails to complete a Business Combination within the Combination Period. However, if the Initial Shareholders should acquire Public Shares in or after the Initial Public Offering, they will be entitled to liquidating distributions from the Trust Account with respect to such Public Shares if the Company fails to complete a Business Combination within the Combination Period. The underwriters agreed to waive their rights to their deferred underwriting commission (see Note 7) held in the Trust Account in the event the Company does not complete a Business Combination within the Combination Period and, in such event, such amounts will be included with the funds held in the Trust Account that will be available to fund the redemption of the Company’s Public Shares. In the event of such distribution, it is possible that the per share value of the residual assets remaining available for distribution (including Trust Account assets) will be only $10.00 per share initially held in the Trust Account. In order to protect the amounts held in the Trust Account, the Sponsor has agreed that it will be liable to the Company if and to the extent any claims by a third party for services rendered or products sold to the Company, or a prospective target business with which the Company has entered into a written letter of intent, confidentiality or other similar agreement or business combination agreement, reduce the amount of funds in the Trust Account to below the lesser of (i) $10.00 per Public Share and (ii) the actual amount per Public Share held in the Trust Account as of the date of the liquidation of the Trust Account, if less than $10.00 per share due to reductions in the value of the trust assets, less taxes payable, provided that such liability will not apply to any claims by a third party or prospective target business who executed a waiver of any and all rights to the monies held in the Trust Account (whether or not such waiver is enforceable) nor will it apply to any claims under the Company’s indemnity of the underwriters of the Initial Public Offering against certain liabilities, including liabilities under the Securities Act of 1933, as amended (the “Securities Act”). In the event that an executed waiver is deemed to be unenforceable against a third party, the Sponsor will not be responsible to the extent of any liability for such third-party claims. The Company will seek to reduce the possibility that the Sponsor will have to indemnify the Trust Account due to claims of creditors by endeavoring to have vendors, service providers (except the Company’s independent registered public accounting firm), prospective target businesses or other entities with which the Company does business, execute agreements with the Company waiving any right, title, interest or claim of any kind in or to monies held in the Trust Account.
Note 2 — Restatement of Financial Statements
In April 2021, the Company concluded that, because of a misapplication of the accounting guidance related to its Public and Private Placement warrants the Company issued in November 2020, the Company’s previously issued consolidated financial statements for the Affected Periods should no longer be relied upon. As such, the Company is restating its consolidated financial statements for the Affected Periods.
On April 12, 2021, the staff of the Securities and Exchange Commission (the “SEC Staff”) issued a public statement entitled “Staff Statement on Accounting and Reporting Considerations for Warrants issued by Special Purpose Acquisition Companies (“SPACs”) (the “SEC Staff Statement”). In the SEC Staff Statement, the SEC Staff expressed its view that certain terms and conditions common to SPAC warrants may require the warrants to be classified as liabilities on the SPAC’s balance sheet as opposed to equity. Since issuance on November 23, 2020 the Company’s warrants were accounted for as equity within the Company’s previously reported balance sheets, and after discussion and evaluation, including with the Company’s independent auditors, management concluded that the warrants should be presented as liabilities with subsequent fair value remeasurement.
Historically, the Warrants were reflected as a component of equity as opposed to liabilities on the balance sheets and the statements of operations did not include the subsequent
non-cash
changes in estimated fair valueF-10
of the Warrants, based on our application of FASB ASC Topic(“ASC
815-40,
Derivatives and Hedging, Contracts in Entity
’
s Own Equity
815-40”).
The views expressed in the SEC Staff Statement were not consistent with the Company’s historical interpretation of the specific provisions within its warrant agreement and the Company’s application of ASC815-40
to the warrant agreement. The Company reassessed its accounting for Warrants issued on November 23, 2020, in light of the SEC Staff’s published views. Based on this reassessment, management determined that the Warrants should be classified as liabilities measured at fair value upon issuance, with subsequent changes in fair value reported in the Company Statement of Operations each reporting period.Therefore, the Company, in consultation with its Audit Committee, concluded that its previously issued financial statements for the periods beginning with the period from October 2, 2020 through December 31, 2020 (collectively, the “Affected Periods”) should be restated because of a misapplication in the guidance around accounting for certain of our outstanding warrants to purchase ordinary shares (the “Warrants”) and should no longer be relied upon. The Warrants were issued in connection with the Company’s Initial Public Offering of 23,000,000 Units and the sale of Private Placement warrants completed on November 23, 2020. Each Unit consists of one of the Company’s Class A ordinary shares, $0.0001 par value, and
one-half
of one redeemable warrant. Each whole Warrant entitles the holder to purchase one of Class A ordinary share at a price of $11.50 per share. The Warrants will expire worthless five years from the date of completion of our initial business combination. The material terms of the warrants are more fully described in Note 8 — Derivative Warrant Liabilities. See Note 10 — Fair Value Measurements.Impact of the Restatement
The impact of the restatement on the balance sheets, statements of operations and statements of cash flows for the Affected Periods is presented below. The restatement had no impact on net cash flows from operating, investing or financing activities.
The tables below present the effect of the financial statement adjustments related to the restatement discussed above of the Company’s previously reported financial statements as of and for the year ended December 31, 2020:
As of December 31, 2020 | ||||||||||||
As Previously Reported | Restatement Adjustment | As Restated | ||||||||||
Balance Sheet | ||||||||||||
Total assets | $ | 231,716,367 | $ | — | $ | 231,716,367 | ||||||
Liabilities and shareholders’ equity | ||||||||||||
Total current liabilities | $ | 151,244 | $ | — | $ | 151,244 | ||||||
Deferred legal fees | 200,000 | — | 200,000 | |||||||||
Deferred underwriting commissions | 8,050,000 | 8,050,000 | ||||||||||
Derivative warrant liabilities | 0 | 13,467,630 | 13,467,630 | |||||||||
Total liabilities | 8,401,244 | 13,467,630 | 21,868,874 | |||||||||
Class A common stock, $0.0001 par value; shares subject to possible redemption | 218,315,120 | (13,467,630 | ) | 204,847,490 | ||||||||
Shareholders’ equity | ||||||||||||
Preferred stock — $0.0001 par value | 0 | — | 0 | |||||||||
Class A common stock — $0.0001 par value | 117 | 135 | 252 | |||||||||
Class B common stock — $0.0001 par value | 575 | — | 575 | |||||||||
Additional paid-in-capital | 5,230,984 | 1,240,405 | 6,471,389 | |||||||||
Accumulated deficit | (231,673 | ) | (1,240,540 | ) | (1,472,213 | ) | ||||||
Total shareholders’ equity | 5,000,003 | — | 5,000,003 | |||||||||
Total liabilities and shareholders’ equity | $ | 231,716,367 | $ | — | $ | 231,716,367 | ||||||
F-11
Period From October 2, 2020 (Inception) Through December 31, 2020 | ||||||||||||
As Previously Reported | Restatement Adjustment | As Restated | ||||||||||
Statement of Operations | ||||||||||||
Loss from operations | $ | (250,366 | ) | $ | — | $ | (250,366 | ) | ||||
Other (expense) income: | ||||||||||||
Change in fair value of warrant liabilities | — | (866,050 | ) | (866,050 | ) | |||||||
Financing costs | — | (374,490 | ) | (374,490 | ) | |||||||
Unrealized gain on investments held in Trust Account | 18,693 | — | 18,693 | |||||||||
Total other (expense) income | 18,693 | (1,240,540 | ) | (1,221,847 | ) | |||||||
Net loss | $ | (231,673 | ) | $ | (1,240,540 | ) | $ | (1,472,213 | ) | |||
Basic and Diluted weighted-average Class A common stock outstanding | 23,000,000 | 23,000,000 | ||||||||||
Basic and Diluted net loss per Class A common shares | $ | 0.00 | $ | 0 | ||||||||
Basic and Diluted weighted-average Class B common stock outstanding | 5,750,000 | 5,750,000 | ||||||||||
Basic and Diluted net loss per Class B common shares | $ | (0.06 | ) | $ | (0.26 | ) | ||||||
Period From October 2, 2020 (Inception) Through December 31, 2020 | ||||||||||||
As Previously Reported | Restatement Adjustment | As Restated | ||||||||||
Statement of Cash Flows | ||||||||||||
Net loss | $ | (231,673 | ) | $ | (1,240,540 | ) | $ | (1,472,213 | ) | |||
Adjustments to reconcile net loss to net cash used in operating activities | 6,307 | 1,240,540 | 1,246,847 | |||||||||
Net cash used in operating activities | (1,233,811 | ) | — | (1,233,811 | ) | |||||||
Net cash used in investing activities | (230,000,000 | ) | — | (230,000,000 | ) | |||||||
Net cash provided by financing activities | 231,856,796 | — | 231,856,796 | |||||||||
Net change in cash | $ | 622,985 | $ | — | $ | 622,985 | ||||||
In addition, the impact to the balance sheet dated November 23, 2020, filed on Form
8-K
on November 28, 2020 related to the impact of accounting for the public and private warrants as liabilities at fair value resulted in a $12.6 million increase to the derivative warrant liabilities line item at November 23, 2020 and offsetting decrease to the Class A common stock subject to possible redemption mezzanine equity line item.F-12
The table below presents the effect of the financial statement adjustments related to the restatement discussed above of the Company’s previously reported balance sheet dated November 23, 2020.
As of November 23, 2020 | ||||||||||||
As Previously Reported | Restatement Adjustment | As Restated | ||||||||||
Unaudited Condensed Balance Sheet | ||||||||||||
Total assets | $ | 233,001,707 | $ | — | $ | 233,001,707 | ||||||
Liabilities and shareholders’ equity | ||||||||||||
Total current liabilities | $ | 1,438,508 | $ | — | $ | 1,438,508 | ||||||
Deferred underwriting commissions | 8,050,000 | — | 8,050,000 | |||||||||
Derivative warrant liabilities | — | 12,601,580 | 12,601,580 | |||||||||
Total liabilities | 9,488,508 | 12,601,580 | 22,090,088 | |||||||||
Class A common stock, $0.0001 par value; shares subject to possible redemption | 218,513,190 | (12,601,580 | ) | 205,911,610 | ||||||||
Shareholders’ equity | ||||||||||||
Preferred stock - $0.0001 par value | — | — | — | |||||||||
Class A common stock - $0.0001 par value | 115 | 126 | 241 | |||||||||
Class B common stock - $0.0001 par value | 575 | — | 575 | |||||||||
Additional paid-in-capital | 5,032,916 | 374,364 | 5,407,280 | |||||||||
Accumulated deficit | (33,597 | ) | (374,490 | ) | (408,087 | ) | ||||||
Total shareholders’ equity | 5,000,009 | — | 5,000,009 | |||||||||
Total liabilities and shareholders’ equity | $ | 233,001,707 | $ | — | $ | 233,001,707 | ||||||
Note 3 — Summary of Significant Accounting Policies
Basis of Presentation
The Company’s financial statements have been prepared in conformity with accounting principles generally accepted in the United States of America (“GAAP”) and include all adjustments necessary for the fair presentation of the Company’s financial position for the period presented.
As described in Note 2 — Restatement of Financial Statements, the Company’s consolidated financial statements for the period from October 2, 2020 (inception) through December 31, 2020 (the “Affected Periods”), are restated in this proxy statement/prospectus to correct the misapplication of accounting guidance related to the Company’s warrants in the Company’s previously issued audited and unaudited condensed financial statements for such periods. The restated financial statements are indicated as “Restated” in the audited and unaudited condensed financial statements and accompanying notes, as applicable. See Note 2 — Restatement of Financial Statements for further discussion.
Emerging Growth Company
The Company is an “emerging growth company,” as defined in Section 2(a) of the Securities Act, as modified by the Jumpstart Our Business Startups Act of 2012 (the “JOBS Act”), and it may take advantage of certain exemptions from various reporting requirements that are applicable to other public companies that are not emerging growth companies including, but not limited to, not being required to comply with the auditor attestation requirements of Section 404 of the Sarbanes-Oxley Act of 2002, reduced disclosure obligations regarding executive compensation in its periodic reports and proxy statements, and exemptions from the requirements of holding a nonbinding advisory vote on executive compensation and shareholder approval of any golden parachute payments not previously approved.
F-13
Further, Section 102(b)(1) of the JOBS Act exempts emerging growth companies from being required to comply with new or revised financial accounting standards until private companies (that is, those that have not had a Securities Act registration statement declared effective or do not have a class of securities registered under the Exchange Act) are required to comply with the new or revised financial accounting standards. The JOBS Act provides that an emerging growth company can elect to opt out of the extended transition period and comply with the requirements that apply to
non-emerging
growth companies but any such an election to opt out is irrevocable. The Company has elected not to opt out of such extended transition period, which means that when a standard is issued or revised and it has different application dates for public or private companies, the Company, as an emerging growth company, can adopt the new or revised standard at the time private companies adopt the new or revised standard.This may make comparison of the Company’s financial statements with another public company that is neither an emerging growth company nor an emerging growth company that has opted out of using the extended transition period difficult or impossible because of the potential differences in accounting standards used.
Liquidity and Capital Resources
As of December 31, 2020, the Company had approximately $623,000 in its operating bank accounts, and working capital of approximately $1.5 million.
The Company’s liquidity needs to date have been satisfied through a contribution of $25,000 from the Sponsor to cover certain expenses in exchange for the issuance of the Founder Shares (see Note 6), the loan of approximately $60,000 from the Sponsor pursuant to the Note (see Note 6), and the proceeds from the consummation of the Initial Public Offering and Private Placement not held in the Trust Account. The Company fully repaid the Note as of November 23, 2020. In addition, in order to finance transaction costs in connection with a Business Combination, the Sponsor or an affiliate of the Sponsor, or certain of the Company’s officers and directors may, but are not obligated to, provide the Company Working Capital Loans (see Note 6). As of December 31, 2020, there were no amounts outstanding under any Working Capital Loan.
Based on the foregoing, management believes that the Company will have sufficient working capital and borrowing capacity from the Sponsor or an affiliate of the Sponsor, or certain of the Company’s officers and directors to meet its needs through the earlier of the consummation of a Business Combination and one year from this filing. Over this time period, the Company will be using these funds for paying existing accounts payable, identifying and evaluating prospective initial Business Combination candidates, performing due diligence on prospective target businesses, paying for travel expenditures, selecting the target business to merge with or acquire, and structuring, negotiating and consummating the Business Combination.
Risk and Uncertainties
On January 30, 2020, the World Health Organization (“WHO”) announced a global health emergency because of a new strain of coronavirus (the
“COVID-19
outbreak”). In March 2020, the WHO classified theCOVID-19
outbreak as a pandemic, based on the rapid increase in exposure globally. The full impact of theCOVID-19
outbreak continues to evolve. The impact of theCOVID-19
outbreak on the Company’s results of operations, financial position and cash flows will depend on future developments, including the duration and spread of the outbreak and related advisories and restrictions.These developments and the impact of the
COVID-19
outbreak on the financial markets and the overall economy are highly uncertain and cannot be predicted. If the financial markets and/or the overall economy are impacted for an extended period, the Company’s results of operations, financial position and cash flows may be materially adversely affected. Additionally, the Company’s ability to complete an initial Business Combination may be materially adversely affected due to significant governmental measures that have been, and may in the future be, implemented to contain theCOVID-19
outbreak or treat its impact, including travel restrictions, theF-14
shutdown of businesses and quarantines, among others, which may limit the Company’s ability to have meetings with potential investors or affect the ability of a potential target company’s personnel, vendors and service providers to negotiate and consummate an initial Business Combination in a timely manner. The Company’s ability to consummate an initial Business Combination may also be dependent on the ability to raise additional equity and debt financing, which may be impacted by the
COVID-19
outbreak and the resulting market downturn.Use of Estimates
The preparation of financial statements in conformity with U.S. GAAP requires the Company’s management to make estimates and assumptions that affect the reported amounts of assets and liabilities and disclosure of contingent assets and liabilities at the date of the financial statements and the reported amounts of expenses during the reporting period. Making estimates requires management to exercise significant judgment. It is at least reasonably possible that the estimate of the effect of a condition, situation or set of circumstances that existed at the date of the financial statements, which management considered in formulating its estimate, could change in the near term due to one or more future confirming events. Accordingly, the actual results could differ significantly from those estimates.
Cash and Cash Equivalents
The Company considers all short-term investments with an original maturity of three months or less when purchased to be cash equivalents.
Investments Held in Trust Account
The Company’s portfolio of investments is comprised solely of U.S. government securities, within the meaning set forth in Section 2(a)(16) of the Investment Company Act, with a maturity of 185 days or less, or investments in money market funds that invest in U.S. government securities, or a combination thereof. The Company’s investments held in the Trust Account are classified as trading securities. Trading securities are presented on the balance sheets at fair value at the end of each reporting period. Gains and losses resulting from the change in fair value of these securities is included in unrealized loss on investments held in Trust Account in the accompanying statement of operations. The estimated fair values of investments held in the Trust Account are determined using available market information
.
Concentration of Credit Risk
Financial instruments that potentially subject the Company to concentrations of credit risk consist of cash accounts in a financial institution, which, at times, may exceed the Federal Depository Insurance Coverage of $250,000, and investments held in Trust Account. At December 31, 2020, the Company has not experienced losses on these accounts and management believes the Company is not exposed to significant risks on such accounts.
Fair Value of Financial Instruments
Fair value is defined as the price that would be received for sale of an asset or paid for transfer of a liability, in an orderly transaction between market participants at the measurement date. U.S. GAAP establishes a three-tier fair value hierarchy, which prioritizes the inputs used in measuring fair value.
The hierarchy gives the highest priority to unadjusted quoted prices in active markets for identical assets or liabilities (Level 1 measurements) and the lowest priority to unobservable inputs (Level 3 measurements). These tiers include:
| • | Level 1, defined as observable inputs such as quoted prices for identical instruments in active markets; |
F-15
| • | Level 2, defined as inputs other than quoted prices in active markets that are either directly or indirectly observable such as quoted prices for similar instruments in active markets or quoted prices for identical or similar instruments in markets that are not active; and |
| • | Level 3, defined as unobservable inputs in which little or no market data exists, therefore requiring an entity to develop its own assumptions, such as valuations derived from valuation techniques in which one or more significant inputs or significant value drivers are unobservable. |
In some circumstances, the inputs used to measure fair value might be categorized within different levels of the fair value hierarchy. In those instances, the fair value measurement is categorized in its entirety in the fair value hierarchy based on the lowest level input that is significant to the fair value measurement.
As of December 31, 2020, the carrying values of cash, accounts payable and accrued expenses approximate their fair values due to the short-term nature of the instruments. The Company’s portfolio of investments held in the Trust Account is comprised of investments in U.S. Treasury securities with an original maturity of 185 days or less or investments in money market funds that invest in U.S. government securities, or a combination thereof. The fair value for trading securities is determined using quoted market prices in active markets.
Derivative warrant liabilities
The Company does not use derivative instruments to hedge exposures to cash flow, market, or foreign currency risks. The Company evaluates all of its financial instruments, including issued stock purchase warrants, to determine if such instruments are derivatives or contain features that qualify as embedded derivatives, pursuant to ASC 480 and ASC 815-15. The classification of derivative instruments, including whether such instruments should be recorded as liabilities or as equity, is re-assessed at the end of each reporting period.
The Company accounts for its 9,000,000 common stock warrants issued in connection with its Initial Public Offering and exercise of over-allotment option (4,600,000 warrants) and Private Placement (4,400,000 warrants) as derivative warrant liabilities in accordance with ASC 815-40. Accordingly, the Company recognizes the warrant instruments as liabilities at fair value and adjusts the instruments to fair value at each reporting period. The liabilities are subject to re-measurement at each balance sheet date until exercised, and any change in fair value is recognized in the Company’s statement of operations. The fair value of warrants issued by the Company in connection with the Public Offering, over-Allotment exercise and Private Placement has been estimated using Monte-Carlo simulations at each measurement date.
Offering Costs Associated with the Initial Public Offering
Offering costs consisted of legal, accounting, underwriting and other costs incurred that were directly related to the Initial Public Offering. Offering costs are allocated to the separable financial instruments issued in the Initial Public Offering based on a relative fair value basis, compared to total proceeds received. Offering costs associated with warrant liabilities are expensed as incurred, presented as non-operating expenses in the statement of operations. Offering costs associated with the Class A ordinary shares were charged to shareholders’ equity upon the completion of the Initial Public Offering.
Class A Ordinary Shares Subject to Possible Redemption
The Company accounts for its Class A ordinary shares subject to possible redemption in accordance with the guidance in ASC Topic 480 “Distinguishing Liabilities from Equity.” Class A ordinary shares subject to mandatory redemption (if any) are classified as liability instruments and are measured at fair value. Conditionally redeemable Class A ordinary shares (including Class A ordinary shares that feature redemption rights that are either within the control of the holder or subject to redemption upon the occurrence of uncertain events not solely within the Company’s control) are classified as temporary equity. At all other times, Class A ordinary shares are
F-16
classified as shareholders’ equity. The Company’s Class A ordinary shares feature certain redemption rights that are considered to be outside of the Company’s control and subject to the occurrence of uncertain future events. Accordingly, at December 31, 2020, 20,484,749 Class A ordinary shares subject to possible redemption are presented as temporary equity, outside of the shareholders’ equity section of the Company’s balance sheet.
Income Taxes
FASB ASC 740 prescribes a recognition threshold and a measurement attribute for the financial statements recognition and measurement of tax positions taken or expected to be taken in a tax return. For those benefits to be recognized, a tax position must be more likely than not to be sustained upon examination by taxing authorities. There were no unrecognized tax benefits as of December 31, 2020. The Company’s management determined that the Cayman Islands is the Company’s only major tax jurisdiction. The Company recognizes accrued interest and penalties related to unrecognized tax benefits as income tax expense. NaN amounts were accrued for the payment of interest and penalties as of December 31, 2020. The Company is currently not aware of any issues under review that could result in significant payments, accruals or material deviation from its position. The Company is subject to income tax examinations by major taxing authorities since inception.
There is currently no taxation imposed on income by the Government of the Cayman Islands. In accordance with Cayman income tax regulations, income taxes are not levied on the Company. Consequently, income taxes are not reflected in the Company’s financial statements. The Company’s management does not expect that the total amount of unrecognized tax benefits will materially change over the next twelve months.
Net Income (Loss) Per Ordinary Share
Net income (loss) per ordinary share is computed by dividing net income (loss) by the weighted-average number of ordinary shares outstanding during the periods. The Company has not considered the effect of the warrants sold in the Initial Public Offering and the Private Placement to purchase an aggregate of 9,000,000, of the Company’s Class A ordinary shares in the calculation of diluted net income (loss) per share, since their inclusion would be anti-dilutive under the treasury stock method.
The Company’s statement of operations includes a presentation of net income (loss) per share for ordinary shares subject to redemption in a manner similar to the
two-class
method of net income (loss) per share. Net income (loss) per ordinary share, basic and diluted for Class A ordinary shares is calculated by dividing the interest income (loss) earned on investments held in the Trust Account, net of applicable taxes and interest to fund working capital requirements, subject to an annual limit of $165,000, available to be withdrawn from the Trust Account, resulting in income of approximately $19,000 for the period from October 2, 2020 (inception) through December 31, 2020, by the weighted average number of Class A ordinary shares outstanding for the period. Net income (loss) per ordinary share, basic and diluted for Class B ordinary shares is calculated by dividing the net income (loss), less net income (loss) attributable to Class A ordinary shares by the weighted average number of Class B ordinary shares outstanding for the period.Recent Accounting Pronouncements
Management does not believe that any recently issued, but not yet effective, accounting pronouncement if currently adopted would have a material effect on the Company’s financial statements.
Note 4 — Initial Public Offering
On November 23, 2020, the Company consummated its Initial Public Offering of 23,000,000 Units, including 3,000,000 Over-Allotment Units, at $10.00 per Unit, generating gross proceeds of $230.0 million, and incurring offering costs of approximately $13.1 million, inclusive of approximately $8.1 million in deferred underwriting commissions.
F-17
Each Unit consists of one Class A ordinary share and
one-fifth
of one redeemable warrant (“Public Warrant”). Each whole Public Warrant will entitle the holder to purchase one Class A ordinary share at an exercise price of $11.50 per share, subject to adjustment (see Note 8).Note 5 — Private Placement
Substantially concurrently with the closing of the Initial Public Offering, the Company consummated the Private Placement of 4,400,000 Private Placement Warrants, at a price of $1.50 per Private Placement Warrant to the Sponsor, generating gross proceeds of $6.6 million.
Each Private Placement Warrant is exercisable for 1 whole Class A ordinary share at a price of $11.50 per share. A portion of the proceeds from the sale of the Private Placement Warrants to the Sponsor was added to the proceeds from the Initial Public Offering held in the Trust Account. If the Company does not complete a Business Combination within the Combination Period, the Private Placement Warrants will expire worthless. The Private Placement Warrants will be
non-redeemable
for cash and exercisable on a cashless basis, except as described in Note 8, so long as they are held by the Sponsor or its permitted transferees.The Sponsor and the Company’s officers and directors agreed, subject to limited exceptions, not to transfer, assign or sell any of their Private Placement Warrants until 30 days after the completion of the initial Business Combination.
Note 6 — Related Party Transactions
Founder Shares
On October 7, 2020, the Sponsor paid an aggregate of $25,000 to cover for certain expenses on behalf of the Company in exchange for issuance of 5,750,000 ordinary shares (the “Founder Shares”). The Sponsor agreed to forfeit up to an aggregate of 750,000 Founder Shares to the extent that the option to purchase additional units was not exercised in full by the underwriters, so that the Founder Shares would represent 20% of the Company’s issued and outstanding shares after the Initial Public Offering. The underwriters fully exercised their over-allotment option on November 19, 2020; thus, those Founder Shares were no longer subject to forfeiture.
The Initial Shareholders agreed not to transfer, assign or sell any of their Founder Shares until the earlier to occur of (1) one year after the completion of the initial Business Combination; and (2) subsequent to the initial Business Combination (x) if the last reported sale price of Class A ordinary shares equals or exceeds $12.00 per share (as adjusted for share
sub-divisions,
share dividends, rights issuances, consolidations, reorganizations, recapitalizations and other similar transactions) for any 20 trading days within any30-trading
day period commencing at least 150 days after the initial Business Combination or (y) the date on which the Company completes a liquidation, merger, share exchange, reorganization or other similar transaction that results in all of the Public Shareholders having the right to exchange their ordinary shares for cash, securities or other property.Related Party Loans
On October 7, 2020, the Sponsor agreed to loan the Company up to $300,000 to be used for the payment of costs related to the Initial Public Offering pursuant to a promissory note (the “Note”). The Note was
non-interest
bearing, unsecured and due upon the earlier of December 31, 2021 and the closing of the Initial Public Offering. The Company borrowed approximately $60,000 under the Note, and fully repaid this on November 20, 2020.In addition, in order to finance transaction costs in connection with a Business Combination, the Sponsor, members of the Company’s founding team or any of their affiliates may, but are not obligated to, loan the Company funds as may be required (“Working Capital Loans”). If the Company completes a Business Combination, the Company would repay the Working Capital Loans out of the proceeds of the Trust Account
F-18
released to the Company. Otherwise, the Working Capital Loans would be repaid only out of funds held outside the Trust Account. In the event that a Business Combination does not close, the Company may use a portion of proceeds held outside the Trust Account to repay the Working Capital Loans but no proceeds held in the Trust Account would be used to repay the Working Capital Loans. The Working Capital Loans would either be repaid upon consummation of a Business Combination, without interest, or, at the lender’s discretion, up to $2,000,000 of such Working Capital Loans may be convertible into warrants of the post Business Combination entity at a price of $1.50 per warrant. The warrants would be identical to the Private Placement Warrants. Except for the foregoing, the terms of such Working Capital Loans, if any, have not been determined and no written agreements exist with respect to such loans. To date, the Company had no borrowings under the Working Capital Loans.
Support Services Agreement
The Company entered into the Support Services Agreement that provides that, commencing on the date that the Company’s securities were first listed on the NYSE through the earlier of consummation of the initial Business Combination and the liquidation, the Company will pay Support Services Fees to Reinvent Capital that total $625,000 per year for support and administrative services, as well as reimburse Reinvent Capital for anyexpenses it incurs in connection with providing services or for office space under the Support Services Agreement. As of December 31, 2020, the Company paid $156,250 to Reinvent Capital as part of the Support Services Agreement and recognized approximately $52,000 in the statement of operations for the period from October 2, 2020 (inception) through December 31, 2020, the balance of approximately $104,000 in included in Prepaid Expenses on the balance sheet at December 31, 2020.
out-of-pocket
In addition, the Sponsor, officers and directors, or any of their respective affiliates will be reimbursed for anyexpenses incurred in connection with activities on the Company’s behalf such as identifying potential target businesses and performing due diligence on suitable Business Combinations. The Company’s audit committee will review on a quarterly basis all payments that were made to the Sponsor, officers or directors, or the Company’s or their affiliates. Any such payments prior to an initial Business Combination will be made from funds held outside the Trust Account, including funds released from the Trust Account to pay for working capital, subject to an annual limit of $165,000. For the period from October 2, 2020 through December 31, 2020, the Company incurred approximately $12,000 in reimbursable expenses paid by Reinvent Capital under the Support Services Agreement, which was recognized in the statement of operations and included in Due to Related Party on the balance sheet at December 31, 2020.
out-of-pocket
Note 7 — Commitments and Contingencies
Registration Rights
The holders of the Founder Shares, Private Placement Warrants and any warrants that may be issued upon conversion of Working Capital Loans (and any Class A ordinary shares issuable upon the exercise of the Private Placement Warrants or warrants issued upon conversion of the Working Capital Loans and upon conversion of the Founder Shares) are entitled to registration rights pursuant to a registration rights agreement. The holders of these securities are entitled to make up to three demands, excluding short form demands, that the Company registers such securities. In addition, the holders have certain “piggy-back” registration rights with respect to registration statements filed subsequent to the completion of the initial Business Combination. The Company will bear the expenses incurred in connection with the filing of any such registration statements.
Underwriting Agreement
The Company granted the underwriters a
45-day
option from the date of the final prospectus to purchase up to 3,000,000 Over-Allotment Units at the Initial Public Offering price less the underwriting discounts and commissions. The underwriters fully exercised their over-allotment option on November 19, 2020.The underwriters were entitled to an underwriting discount of $0.20 per unit, or $4.6 million in the aggregate, paid upon the closing of the Initial Public Offering. In addition, $0.35 per unit, or $8.05 million in the
F-19
aggregate will be payable to the underwriters for deferred underwriting commissions. The deferred fee will become payable to the underwriters from the amounts held in the Trust Account solely in the event that the Company completes a Business Combination, subject to the terms of the underwriting agreement.
Note 8 — Derivative Warrant Liabilities
As of December 31, 2020, the Company has 4,600,000 and 4,400,000 Public Warrants and Private Placement Warrants, respectively, outstanding.
Public Warrants may only be exercised for a whole number of shares. No fractional Public Warrants will be issued upon separation of the Units and only whole Public Warrants will trade. The Public Warrants will become exercisable on the later of (a) 30 days after the completion of a Business Combination and (b) 12 months from the closing of the Initial Public Offering; provided in each case that the Company has an effective registration statement under the Securities Act covering the issuance of the Class A ordinary shares issuable upon exercise of the warrants and a current prospectus relating to them is available and such shares are registered, qualified or exempt from registration under the securities, or blue sky, laws of the state of residence of the holder (or the Company permits holders to exercise their warrants on a cashless basis under the circumstances specified in the warrant agreement). The Company has agreed that as soon as practicable, but in no event later than 15 business days after the closing of the initial Business Combination, the Company will use its commercially reasonable efforts to file with the SEC a registration statement covering the issuance of the Class A ordinary shares issuable upon exercise of the warrants, and the Company will use its commercially reasonable efforts to cause the same to become effective within 60 business days after the closing of the initial Business Combination and to maintain the effectiveness of such registration statement and a current prospectus relating to those Class A ordinary shares until the warrants expire or are redeemed; provided that if the Class A ordinary shares are at the time of any exercise of a warrant not listed on a national securities exchange such that they satisfy the definition of a “covered security” under Section 18(b)(1) of the Securities Act, the Company may, at its option, requires holders of Public Warrants who exercise their warrants to do so on a “cashless basis” in accordance with Section 3(a)(9) of the Securities Act and, in the event the Company so elects, it will not be required to file or maintain in effect a registration statement.
The warrants have an exercise price of $11.50 per share, subject to adjustments, and will expire five years after the completion of a Business Combination or earlier upon redemption or liquidation. In addition, if (x) the Company issues additional ordinary shares or equity-linked securities for capital raising purposes in connection with the closing of the initial Business Combination at an issue price or effective issue price of less than $9.20 per ordinary share (with such issue price or effective issue price to be determined in good faith by the board of directors and, in the case of any such issuance to the Sponsor or its affiliates, without taking into account any Founder Shares held by the Sponsor or such affiliates, as applicable, prior to such issuance) (the “Newly Issued Price”), (y) the aggregate gross proceeds from such issuances represent more than 60% of the total equity proceeds, and interest thereon, available for the funding of the initial Business Combination on the date of the completion of the initial Business Combination (net of redemptions), and (z) the volume weighted average trading price of Class A ordinary shares during the 20 trading day period starting on the trading day prior to the day on which the Company consummates its initial business Combination (such price, the “Market Value”) is below $9.20 per share, the exercise price of the warrants will be adjusted (to the nearest cent) to be equal to 115% of the higher of the Market Value and the Newly Issued Price, the $18.00 per share redemption trigger price described below under “Redemption of warrants when the price per Class A ordinary share equals or exceeds $18.00” and “Redemption of warrants when the price per Class A ordinary share equals or exceeds $10.00” will be adjusted (to the nearest cent) to be equal to 180% of the higher of the Market Value and the Newly Issued Price, and the $10.00 per share redemption trigger price described below under “Redemption of warrants when the price per Class A ordinary share equals or exceeds $10.00” will be adjusted (to the nearest cent) to be equal to the higher of the Market Value and the Newly Issued Price.
The Private Placement Warrants are identical to the Public Warrants underlying the Units sold in the Initial Public Offering, except that the Private Placement Warrants and the Class A ordinary shares issuable upon
F-20
exercise of the Private Placement Warrants will not be transferable, assignable or salable until 30 days after the completion of a Business Combination, subject to certain limited exceptions. Additionally, the Private Placement Warrants will be
non-redeemable,
except as described below, so long as they are held by the initial purchasers or such purchasers’ permitted transferees. If the Private Placement Warrants are held by someone other than the Initial Shareholders or their permitted transferees, the Private Placement Warrants will be redeemable by the Company and exercisable by such holders on the same basis as the Public Warrants.Redemption of warrants when the price per Class A ordinary share equals or exceeds $18.00:
Once the warrants become exercisable, the Company may redeem the outstanding warrants (except as described herein with respect to the Private Placement Warrants):
| • | in whole and not in part; |
| • | at a price of $0.01 per warrant; |
| • | upon not less than 30 days’ prior written notice of redemption to each warrant holder; and |
| • | if, and only if, the last reported sale price of Class A ordinary shares for any 20 trading days within a 30-trading day period ending on the third trading day prior to the date on which the Company sends the notice of redemption to the warrant holders (the “Reference Value”) equals or exceeds $18.00 per share (as adjusted). |
The Company will not redeem the warrants as described above unless a registration statement under the Securities Act covering the issuance of the Class A ordinary shares issuable upon exercise of the warrants is then effective and a current prospectus relating to those Class A ordinary shares is available throughout the
30-day
redemption period. If and when the warrants become redeemable by the Company, it may exercise its redemption right even if the Company is unable to register or qualify the underlying securities for sale under all applicable state securities laws.Redemption of warrants when the price per Class A ordinary share equals or exceeds $10.00:
Once the warrants become exercisable, the Company may redeem the outstanding warrants (except as described herein with respect to the Private Placement Warrants):
| • | in whole and not in part; |
| • | at $0.10 per warrant upon a minimum of 30 days’ prior written notice of redemption provided that holders will be able to exercise their warrants on a cashless basis prior to redemption and receive that number of shares determined by reference to an agreed table based on the redemption date and the “fair market value” of Class A ordinary shares; |
| • | if, and only if, the Reference Value equals or exceeds $10.00 per share (as adjusted); and |
| • | if the Reference Value is less than $ 18.00 per share (as adjusted), the Private Placement Warrants must also concurrently be called for redemption on the same terms as the outstanding Public Warrants, as described above. |
The “fair market value” of Class A ordinary shares shall mean the volume-weighted average price of Class A ordinary shares for the 10 trading days following the date on which the notice of redemption is sent to the holders of warrants. In no event will the warrants be exercisable in connection with this redemption feature for more than 0.361 Class A ordinary shares per warrant (subject to adjustment).
In no event will the Company be required to net cash settle any warrant. If the Company is unable to complete a Business Combination within the Combination Period and the Company liquidates the funds held in the Trust Account, holders of warrants will not receive any of such funds with respect to their warrants, nor will they receive any distribution from the Company’s assets held outside of the Trust Account with the respect to such warrants. Accordingly, the warrants may expire worthless.
F-21
Note 9 — Shareholders’ Equity
Class
A Ordinary Shares
Class
B Ordinary Shares
Class A ordinary shareholders and Class B ordinary shareholders of record are entitled to one vote for each share held on all matters to be voted on by shareholders and vote together as a single class, except as required by law; provided, that, prior to the initial Business Combination, holders of Class B ordinary shares will have the right to appoint all of the Company’s directors and remove members of the board of directors for any reason, and holders of Class A ordinary shares will not be entitled to vote on the appointment of directors during such time.
The Class B ordinary shares will automatically convert into Class A ordinary shares at the time of the initial Business Combination, or earlier at the option of the holder, on abasis, subject to adjustment for share
one-for-one
sub-divisions,
share dividends, rights issuances, consolidations, reorganizations, recapitalizations and the like, and subject to further adjustment. In the case that additional Class A ordinary shares, or equity-linked securities, are issued or deemed issued in excess of the amounts issued in the Initial Public Offering and related to the closing of the initial Business Combination, the ratio at which the Class B ordinary shares will convert into Class A ordinary shares will be adjusted (unless the holders of a majority of the issued and outstanding Class B ordinary shares agree to waive such anti-dilution adjustment with respect to any such issuance or deemed issuance) so that the number of Class A ordinary shares issuable upon conversion of all Class B ordinary shares will equal, in the aggregate, on anas-converted
basis, 20% of the sum of all ordinary shares issued and outstanding upon the completion of the Initial Public Offering plus all Class A ordinary shares and equity-linked securities issued or deemed issued in connection with the initial Business Combination, excluding any shares or equity-linked securities issued, or to be issued, to any seller in the initial Business Combination. In no event will the Class B ordinary shares convert into Class A ordinary shares at a rate of less than one to one.Preference Shares
F-22
Note 10 — Fair Value Measurements
The following table presents information about the Company’s assets and liabilities that are measured at fair value on a recurring basis as of December 31, 2020 and indicates the fair value hierarchy of the valuation techniques that the Company utilized to determine such fair value.
Description | Quoted Prices in Active Markets (Level 1) | Significant Other Observable Inputs (Level 2) | Significant Other Unobservable Inputs (Level 3) | |||||||||
Assets: | ||||||||||||
Investments held in Trust Account | $ | 230,017,782 | $ | 0 | $ | 0 | ||||||
Liabilities: | ||||||||||||
Derivative warrant liabilities — Public Warrants | $ | 0 | $ | 0 | $ | 6,762,630 | ||||||
Derivative warrant liabilities — Private Warrants | $ | 0 | $ | 0 | $ | 6,705,000 | ||||||
The remainder of the balance in Investments held in Trust Account is comprised of cash equivalents. Level 1 instruments include investments in cash, money market funds and U.S. Treasury securities. The Company uses inputs such as actual trade data, benchmark yields, quoted market prices from dealers or brokers, and other similar sources to determine the fair value of its investments.
Transfers to/from Levels 1, 2, and 3 are recognized at the end of the reporting period. There were no transfers between levels for the period from October 2, 2020 (inception) through December 31, 2020.
The changes in Level 3 liability measured at fair value for the period ended December 31, 2020 was solely due to the change in the fair value of the stock warrant liability reflected on the statement of operations. Both observable and unobservable inputs were used to determine the fair value of positions that the Company has classified within the Level 3 category. Unrealized gains and losses associated with liabilities within the Level 3 category include changes in fair value that were attributable to both observable (e.g., changes in market interest rates) and unobservable (e.g., changes in unobservable long- dated volatilities) inputs.
The warrants are accounted for as liabilities in accordance with ASC
815-40
and are presented within derivative warrants liability on the balance sheet. The warrants liabilities are measured at fair value at inception and on a recurring basis, with changes in fair value presented within change in fair value of derivative warrants liability in the statement of operations.The Company utilizes a binomial Monte-Carlo simulation to estimate the fair value of the warrants at each reporting period, with changes in fair value recognized in the statement of operations. The Company recognized $12,601,580 for the derivative warrant liabilities upon their issuance on November 18, 2020. For the period from October 2, 2020 (inception) through December 31, 2020, the Company recognized a charge to the statement of operations resulting from an increase in the fair value of liabilities of approximately $866,000 presented as change in fair value of derivative warrant liabilities on the accompanying statement of operations.
The estimated fair value of the derivative warrant liabilities is determined using Level 3 inputs. Inherent in a Monte Carlo simulation are assumptions related to expected stock-price volatility, expected life, risk-free interest rate and dividend yield. The Company estimates the volatility of its common stock warrants based on implied volatility from the historical volatility of select peer company’s traded common stock warrants that matches the expected remaining life of the warrants. The risk-free interest rate is based on the U.S. Treasury
zero-coupon
yield curve on the grant date for a maturity similar to the expected remaining life of the warrants. The expected life of the warrants is assumed to be equivalent to their remaining contractual term. The dividend rate is based on the historical rate, which the Company anticipates remaining at zero.F-23
The following table provides quantitative information regarding Level 3 fair value measurements inputs as their measurement dates:
As of November 18, 2020 | As of December 31, 2020 | |||||||
Stock price | $ | 9.72 | $ | 9.98 | ||||
Volatility | 23.20 | % | 23.50 | % | ||||
Expected life of the options to convert | 5.6 | 5.5 | ||||||
Risk-free rate | 0.47 | % | 0.43 | % | ||||
Dividend yield | 0 | 0 | ||||||
Note 11 — Subsequent Events
Management has evaluated subsequent events to determine if events or transactions occurring through May 10, 2021, the date the financial statements were issued, require potential adjustment to or disclosure in the financial statements and has concluded that, other than as described below, all such events that would require recognition or disclosure have been recognized or disclosed.
Proposed Hippo Business Combination
On February 23, 2021, the Company entered into an Agreement and Plan of Merger (the “Merger Agreement”) with Hippo Enterprises Inc., a Delaware corporation (“Hippo”), and RTPZ Merger Sub Inc., a Delaware corporation and a direct wholly-owned subsidiary of the Company (“Merger Sub”). The Merger Agreement provides that, among other things and upon the terms and subject to the conditions thereof, the following transactions will occur (together with the other agreements and transactions contemplated by the Merger Agreement, the “Hippo Business Combination”): (i) at the closing of the transactions contemplated by the Merger Agreement (the “Closing”), upon the terms and subject to the conditions of the Merger Agreement and in accordance with the General Corporation Law of the State of Delaware, as amended (the “DGCL”), (a) Merger Sub will merge with and into Hippo, the separate corporate existence of Merger Sub will cease and Hippo will be the surviving corporation and a wholly owned subsidiary of the Company (the “First Merger”) and (b) immediately following the First Merger, Hippo (as the surviving corporation of the First Merger) will merge with and into the Company, the separate corporate existence of Hippo will cease and the Company will be the surviving corporation (the “Second Merger” and, together with the First Merger, the “Mergers”); (ii) as a result of the Merger, among other things, all outstanding shares of capital stock of Hippo will be canceled in exchange for the right to receive, in the aggregate, a number of shares of RTPZ Common Stock (as defined below) equal to the quotient obtained by dividing (x) $5,522,000,000 (representing the enterprise value of $5,000,000,000 plus Hippo’s cash as of December 31, 2020 ($522,000,000)) by (y) $10.00; and (iii) upon the effective time of the Domestication (as defined below), the Company will immediately be renamed “Hippo Holdings Inc.”
Prior to the Closing, subject to the approval of the Company’s shareholders, and in accordance with the DGCL, Cayman Islands Companies Act (as revised) (the “CICA”) and the Company’s amended and restated memorandum and articles of association, the Company will effect a deregistration under the CICA and a domestication under Section 388 of the DGCL (by means of filing a certificate of domestication with the Secretary of State of Delaware), pursuant to which the Company’s jurisdiction of incorporation will be changed from the Cayman Islands to the State of Delaware (the “Domestication”).
In connection with the Domestication, (i) each of the then issued and outstanding Class A ordinary shares, par value $0.0001 per share, of the Company, will convert automatically, on abasis, into a share of common stock, par value $0.0001, of the Company (after its Domestication) (the “RTPZ Common Stock”), (ii) each of the then issued and outstanding Class B ordinary shares, par value $0.0001 per share, of the Company, will convert automatically, on abasis, into a share of RTPZ Common Stock, (iii) each then issued and outstanding warrant to acquire the Company’s Class A Ordinary Shares will convert automatically into a
one-for-one
one-for-one
F-24
warrant to acquire an equal number of shares of RTPZ Common Stock (“Domesticated RTPZ Warrant”), and (iv) each then issued and outstanding unit of the Company (the “Cayman RTPZ Units”) will convert automatically into a share of RTPZ Common Stock, on abasis, and
one-for-one
one-fifth
of one Domesticated RTPZ Warrant.On March 3, 2021, concurrently with the execution of the Merger Agreement, the Company entered into subscription agreements with certain investors (collectively, the “PIPE Investors”), pursuant to, and on the terms and subject to the conditions of which, the PIPE Investors have collectively subscribed for 55 million shares of RTPZ Common Stock for an aggregate purchase price equal to $550 million (the “PIPE Investment”).
The consummation of the proposed Hippo Business Combination is subject to certain conditions as further described in the Merger Agreement.
Sponsor Support Agreement
On March 3, 2021, the Sponsor entered into the Sponsor Agreement (the “Sponsor Agreement”) with the Company and Hippo, pursuant to which the parties thereto agreed to, among other things, (i) certain vesting terms with respect to the RTPZ Common Stock beneficially owned by the Sponsor as of the Domestication, (ii) a lock-up of securities held by the Sponsor, (iii) the mandatory exercise of the Domesticated RTPZ Warrants held by the Sponsor if (a) RTPZ elects to redeem the Domesticated RTPZ Warrants held by RTPZ’s public shareholders and (b) the last reported sales price of the RTPZ Common Stock for any 20 Trading Days (as defined in the Sponsor Agreement) within a period of 30 consecutive Trading Days exceeds $25.00 per share and (iv) certain rights of Sponsor with respect to board representation of the combined company at the Closing, in each case, on the terms and subject to the conditions set forth in the Sponsor Agreement.
F-25
PART I — FINANCIAL INFORMATION
Item 1. Financial Statements.
HIPPO HOLDINGS INC.
CONDENSED CONSOLIDATED BALANCE SHEETS
June 30, 2021 | December 31, 2020 | |||||||
| (unaudited) | ||||||||
Assets: | ||||||||
Current assets: | ||||||||
Cash | $ | 101,045 | $ | 622,985 | ||||
Prepaid expenses | 800,310 | 1,074,689 | ||||||
Total current assets | 901,355 | 1,697,674 | ||||||
Cash and investments held in Trust Account | 230,004,108 | 230,018,693 | ||||||
Total Assets | $ | 230,905,463 | $ | 231,716,367 | ||||
Liabilities and Shareholders’ Equity: | ||||||||
Current liabilities: | ||||||||
Accounts payable | $ | 89,189 | $ | 0 | ||||
Accrued expenses | 874,866 | 139,684 | ||||||
Due to related party | 334,663 | 11,560 | ||||||
Total current liabilities | 1,298,718 | 151,244 | ||||||
Deferred legal fees | 200,000 | 200,000 | ||||||
Deferred underwriting commissions | 8,050,000 | 8,050,000 | ||||||
Derivative warrant liabilities | 16,603,180 | 13,467,630 | ||||||
Total liabilities | 26,151,898 | 21,868,874 | ||||||
Commitments and Contingencies | 0 | 0 | ||||||
Class A ordinary shares; 19,975,356 and 20,484,749 shares subject to possible redemption at $10.00 per share at June 30, 2021 and December 31, 2020, respectively | 199,753,560 | 204,847,490 | ||||||
Shareholders’ Equity: | ||||||||
Preference shares, $0.0001 par value; 5,000,000 shares authorized; NaN issued and outstanding | 0 | 0 | ||||||
Class A ordinary shares, $0.0001 par value; 500,000,000 shares authorized; 3,024,644 and 2,515,251 shares issued and outstanding (excluding 19,975,356 and 20,484,749 shares subject to possible redemption) at June 30, 2021 and December 31, 2020, respectively | 303 | 252 | ||||||
Class B ordinary shares, $0.0001 par value; 50,000,000 shares authorized; 5,750,000 shares issued and outstanding at June 30, 2021 and December 31, 2020 | 575 | 575 | ||||||
Additional paid-in capital | 11,565,268 | 6,471,389 | ||||||
Accumulated deficit | (6,566,141 | ) | (1,472,213 | ) | ||||
Total shareholders’ equity | 5,000,005 | 5,000,003 | ||||||
Total Liabilities and Shareholders’ Equity | $ | 230,905,463 | $ | 231,716,367 | ||||
The accompanying notes are an integral part of these unaudited consolidated condensed financial statements.
F-26
HIPPO HOLDINGS INC.
UNAUDITED CONDENSED CONSOLIDATED STATEMENT OF OPERATIONS
FOR THE THREE AND SIX MONTHS ENDED JUNE 30, 2021
For the three months ended June 30, 2021 | For the six months ended June 30, 2021 | |||||||
General and administrative expenses | $ | 561,581 | $ | 2,017,703 | ||||
Loss from operations | (561,581 | ) | (2,017,703 | ) | ||||
Other income (expense) | ||||||||
Unrealized gain on investments held in Trust Account | 6,408 | 59,325 | ||||||
Change in fair value of derivative warrant liabilities | (2,076,920 | ) | (3,135,550 | ) | ||||
Total other income (expense) | (2,070,512 | ) | (3,076,225 | ) | ||||
Net loss | $ | (2,632,093 | ) | $ | (5,093,928 | ) | ||
Basic and diluted weighted average shares outstanding of Class A ordinary shares | 23,000,000 | 23,000,000 | ||||||
Basic and diluted net loss per Class A ordinary share | $ | 0 | $ | 0 | ||||
Basic and diluted weighted average shares outstanding of Class B ordinary shares | 5,750,000 | 5,750,000 | ||||||
Basic and diluted net loss per Class B ordinary share | $ | (0.46 | ) | $ | (0.89 | ) | ||
The accompanying notes are an integral part of these unaudited condensed consolidated financial statements.
F-27
HIPPO HOLDINGS INC.
UNAUDITED CONDENSED CONSOLIDATED STATEMENT OF CHANGES IN SHAREHOLDERS’ EQUITY
FOR THE THREE AND SIX MONTHS ENDED JUNE 30, 2021
Ordinary Shares | Additional | Total | ||||||||||||||||||||||||||
Class A | Class B | Paid-in | Accumulated | Shareholders’ | ||||||||||||||||||||||||
Shares | Amount | Shares | Amount | Capital | Deficit | Equity | ||||||||||||||||||||||
Balance — December 31, 2020 | 2,515,251 | $ | 252 | 5,750,000 | $ | 575 | $ | 6,471,389 | $ | (1,472,213 | ) | $ | 5,000,003 | |||||||||||||||
Shares subject to possible redemption | 246,184 | 24 | — | — | 2,461,816 | — | 2,461,840 | |||||||||||||||||||||
Net loss | — | — | — | — | — | (2,461,835 | ) | (2,461,835 | ) | |||||||||||||||||||
Balance — March 31, 2021 (unaudited) | 2,761,435 | $ | 276 | 5,750,000 | $ | 575 | $ | 8,933,205 | $ | (3,934,048 | ) | $ | 5,000,008 | |||||||||||||||
Shares subject to possible redemption | 263,209 | 27 | — | — | 2,632,063 | — | 2,632,090 | |||||||||||||||||||||
Net loss | — | — | — | — | — | (2,632,093 | ) | (2,632,093 | ) | |||||||||||||||||||
Balance — June 30, 2021 (unaudited) | 3,024,644 | $ | 303 | 5,750,000 | $ | 575 | $ | 11,565,268 | $ | (6,566,141 | ) | $ | 5,000,005 | |||||||||||||||
The accompanying notes are an integral part of these unaudited condensed consolidated financial statements.
F-28
HIPPO HOLDINGS INC.
UNAUDITED CONDENSED CONSOLIDATED STATEMENT OF CASH FLOWS
FOR THE SIX MONTHS ENDED JUNE
30, 2021Cash Flows from Operating Activities: | ||||
Net loss | $ | (5,093,928 | ) | |
Adjustments to reconcile net loss to net cash used in operating activities: | ||||
Unrealized gain on investments held in Trust Account | (59,325 | ) | ||
Change in fair value of derivative warrant liabilities | 3,135,550 | |||
Changes in operating assets and liabilities: | ||||
Prepaid expenses | 274,379 | |||
Accounts payable | 89,189 | |||
Accrued expenses | 735,182 | |||
Due to related party | 323,103 | |||
Net cash used in operating activities | (595,850 | ) | ||
Cash Flows from Investing Activities: | ||||
Cash received from Trust Account | 73,910 | |||
Net cash provided by investing activities | 73,910 | |||
Net decrease in cash | (521,940 | ) | ||
Cash - beginning of the period | 622,985 | |||
Cash - end of the period | $ | 101,045 | ||
Supplemental disclosure of noncash investing and financing activities: | ||||
Change in value of Class A ordinary shares subject to possible redemption | $ | (5,093,930 | ) |
The accompanying notes are an integral part of these unaudited condensed consolidated financial statements.
F-29
HIPPO HOLDINGS INC.
NOTES TO UNAUDITED CONDENSED CONSOLIDATED FINANCIAL STATEMENTS
Note 1 — Description of Organization, Business Operations and Basis of Presentation
Hippo Holdings Inc, formerly known as Reinvent Technology Partners Z, which was formerly known as Reinvent Technology Partners B (the “Company”), was a blank check company incorporated as a Cayman Islands exempted company on October 2, 2020. On February 23, 2021, RTPZ Merger Sub Inc., a Delaware corporation and a direct wholly-owned subsidiary of the Company, was formed. The Company was incorporated for the purpose of effecting a merger, share exchange, asset acquisition, share purchase, reorganization or similar business combination with one or more businesses that the Company has not yet identified (a “Business Combination”).
All activity for the period from October 2, 2020 (inception) through June 30, 2021 relates to the Company’s formation and the initial
public offering (the “Initial Public Offering”), which is described below, and, subsequent to the Initial Public Offering, the search for a target company for a Business Combination. The Company has selected December 31 as its fiscal year end. The Company will not generate any operating revenues until after the completion of its initial Business Combination, at the earliest. The Company willgenerate non-operating income
in the form of interest income on cash and cash equivalents from the net proceeds derived from the Initial Public Offering and Private Placement (defined below).The Company’s sponsor is Reinvent Sponsor Z LLC, a Cayman Islands limited liability company (the “Sponsor”). The registration statement for the Company’s Initial Public Offering was declared effective on
November 18, 2020
. OnNovember 23, 2020
, the Company consummated its Initial Public Offering of 23,000,000 units (the “Units” and, with respect to the Class A ordinary shares included in the Units, the “Public Shares”), including 3,000,000 additional Units to cover over-allotments (the “Over-Allotment Units”), at $10.00 per Unit, generating gross proceeds of $230.0 million, and incurring offering costs of approximately $13.1 million, inclusive of approximately $8.1 million in deferred underwriting commissions (Note 6).Substantially concurrently with the closing of the Initial Public Offering, the Company consummated the private placement (the “Private Placement”) of 4,400,000 warrants (each, a “Private Placement Warrant” and collectively, the “Private Placement Warrants”), at a price of $1.50 per Private Placement Warrant to the Sponsor, generating gross proceeds of $6.6 million (Note 4).
Upon the closing of the Initial Public Offering and the Private Placement, $230.0 million ($10.00 per Unit) of the net proceeds of the Initial Public Offering and certain of the proceeds of the Private Placement were placed in a trust account (“Trust Account”) with Continental Stock Transfer & Trust Company acting as trustee and invested in United States government treasury bills with a maturity of 185 days or less or in money market funds investing solely in U.S. Treasuries and meeting certain conditions under
Rule 2a-7 under
the Investment Company Act of 1940, as amended, or the Investment Company Act, as determined by the Company, until the earlier of: (i) the completion of a Business Combination and (ii) the distribution of the Trust Account as described below.The Company’s management has broad discretion with respect to the specific application of the net proceeds of its Initial Public Offering and the sale of Private Placement Warrants, although substantially all of the net proceeds are intended to be applied generally toward consummating a Business Combination. The Company’s initial Business Combination must be with one or more operating businesses or assets with a fair market value equal to at least 80% of the net assets held in the Trust Account (net of amounts disbursed to management for working capital purposes, if permitted, and excluding the amount of any deferred underwriting discount held in Trust) at the time the Company signs a definitive agreement in connection with the initial Business Combination. However, the Company will only complete a Business Combination if the post-transaction company owns or acquires 50% or more of the outstanding voting securities of the target or otherwise
F-30
HIPPO HOLDINGS INC.
NOTES TO UNAUDITED CONDENSED CONSOLIDATED FINANCIAL STATEMENTS
acquires a controlling interest in the target sufficient for it not to be required to register as an investment company under the Investment Company Act.
The Company will provide its holders of Public Shares (the “Public Shareholders”) with the opportunity to redeem all or a portion of their Public Shares upon the completion of a Business Combination either (i) in connection with a general meeting called to approve the Business Combination or (ii) by means of a tender offer. The decision as to whether the Company will seek shareholder approval of a Business Combination or conduct a tender offer will be made by the Company, solely in its discretion. The Public Shareholders will be entitled to redeem their Public Shares for a pro rata portion of the amount then in the Trust Account (initially anticipated to be $10.00 per share, plus any pro rata interest earned on the funds held in the Trust Account and not previously released to the Company to pay its tax obligations). The
per-share amount
to be distributed to Public Shareholders who redeem their Public Shares will not be reduced by the deferred underwriting commissions the Company will pay to the underwriters (as discussed in Note 6). These Public Shares will be recorded at a redemption value and classified as temporary equity upon the completion of the Initial Public Offering, in accordance with the Financial Accounting Standards Board (“FASB”) Accounting Standards Codification (“ASC”) Topic 480 “Distinguishing Liabilities from Equity” (“ASC 480”) In such case, the Company will proceed with a Business Combination if the Company has net tangible assets of at least $5,000,001 upon such consummation of a Business Combination and a majority of the shares voted are voted in favor of the Business Combination. If a shareholder vote is not required by law and the Company does not decide to hold a shareholder vote for business or other reasons, the Company will, pursuant to the amended and restated memorandum and articles of association which were adopted by the Company upon the consummation of the Initial Public Offering (the “Amended and Restated Memorandum and Articles of Association”), conduct the redemptions pursuant to the tender offer rules of the U.S. Securities and Exchange Commission (the “SEC”), and file tender offer documents with the SEC prior to completing a Business Combination. If, however, a shareholder approval of the transactions is required by law, or the Company decides to obtain shareholder approval for business or other reasons, the Company will offer to redeem shares in conjunction with a proxy solicitation pursuant to the proxy rules and not pursuant to the tender offer rules. Additionally, each Public Shareholder may elect to redeem their Public Shares irrespective of whether they vote for or against the proposed transaction. If the Company seeks shareholder approval in connection with a Business Combination, the holders of the Founder Shares (as defined in Note 5) prior to the Initial Public Offering (the “Initial Shareholders”) have agreed to vote their Founder Shares and any Public Shares purchased by them during or after the Initial Public Offering in favor of a Business Combination. In addition, the Initial Shareholders have agreed to waive their redemption rights with respect to their Founder Shares and Public Shares in connection with the completion of a Business Combination.Notwithstanding the foregoing, the Company’s Amended and Restated Memorandum and Articles of Association provides that a Public Shareholder, together with any affiliate of such shareholder or any other person with whom such shareholder is acting in concert or as a “group” (as defined under Section 13 of the Securities Exchange Act of 1934, as amended (the “Exchange Act”)), will be restricted from redeeming its shares with respect to more than an aggregate of 15% of the Class A ordinary shares sold in the Initial Public Offering, without the prior consent of the Company.
The Sponsor and the Company’s executive officers and directors have agreed not to propose an amendment to the Company’s Amended and Restated Memorandum and Articles of Association that would affect the substance or timing of the Company’s obligation to provide for the redemption of its Public Shares in connection with a Business Combination or to redeem 100% of its Public Shares if the Company does not complete a Business Combination, unless the Company provides the Public Shareholders with the opportunity to redeem their Class A ordinary shares in conjunction with any such amendment.
F-31
HIPPO HOLDINGS INC.
NOTES TO UNAUDITED CONDENSED CONSOLIDATED FINANCIAL STATEMENTS
If the Company is unable to complete a Business Combination within 24 months from the closing of the Initial Public Offering, or 27 months from the closing of the Initial Public Offering if the Company has executed a letter of intent, agreement in principle or definitive agreement for an initial Business Combination within 24 months from the closing of the Initial Public Offering (as such period may be extended, the “Combination Period”), the Company will (i) cease all operations except for the purpose of winding up; (2) as promptly as reasonably possible but not more than 10 business days thereafter, redeem the Public Shares, at a
per-share price,
payable in cash, equal to the aggregate amount then on deposit in the Trust Account, including interest earned on the funds held in the Trust Account and not previously released to the Company to fund its working capital requirements, subject to an annual limit of $165,000, and/or to pay its taxes (less up to $100,000 of interest to pay dissolution expenses and which interest shall be net of taxes payable), divided by the number of then issued and outstanding Public Shares, which redemption will completely extinguish Public Shareholders’ rights as shareholders (including the right to receive further liquidating distributions, if any); and (3) as promptly as reasonably possible following such redemption, subject to the approval of the remaining shareholders and the board of directors, liquidate and dissolve, subject in each case to the Company’s obligations under Cayman Islands law to provide for claims of creditors and the requirements of other applicable law.The Initial Shareholders agreed to waive their liquidation rights with respect to the Founder Shares if the Company fails to complete a Business Combination within the Combination Period. However, if the Initial Shareholders should acquire Public Shares in or after the Initial Public Offering, they will be entitled to liquidating distributions from the Trust Account with respect to such Public Shares if the Company fails to complete a Business Combination within the Combination Period. The underwriters have agreed to waive their rights to their deferred underwriting commission (see Note 6) held in the Trust Account in the event the Company does not complete a Business Combination within the Combination Period and, in such event, such amounts will be included with the funds held in the Trust Account that will be available to fund the redemption of the Company’s Public Shares. In the event of such distribution, it is possible that the per share value of the residual assets remaining available for distribution (including Trust Account assets) will be only $10.00 per share initially held in the Trust Account. In order to protect the amounts held in the Trust Account, the Sponsor has agreed that it will be liable to the Company if and to the extent any claims by a third party for services rendered or products sold to the Company, or a prospective target business with which the Company has entered into a written letter of intent, confidentiality or other similar agreement or business combination agreement, reduce the amount of funds in the Trust Account to below the lesser of (i) $10.00 per Public Share and (ii) the actual amount per Public Share held in the Trust Account as of the date of the liquidation of the Trust Account, if less than $10.00 per share due to reductions in the value of the trust assets, less taxes payable, provided that such liability will not apply to any claims by a third party or prospective target business who executed a waiver of any and all rights to the monies held in the Trust Account (whether or not such waiver is enforceable) nor will it apply to any claims under the Company’s indemnity of the underwriters of the Initial Public Offering against certain liabilities, including liabilities under the Securities Act of 1933, as amended (the “Securities Act”). In the event that an executed waiver is deemed to be unenforceable against a third party, the Sponsor will not be responsible to the extent of any liability for such third-party claims. The Company will seek to reduce the possibility that the Sponsor will have to indemnify the Trust Account due to claims of creditors by endeavoring to have vendors, service providers (except the Company’s independent registered public accounting firm), prospective target businesses or other entities with which the Company does business, execute agreements with the Company waiving any right, title, interest or claim of any kind in or to monies held in the Trust Account.
Proposed Hippo Business Combination
On February 23, 2021, the Company entered into an Agreement and Plan of Merger (the “Merger Agreement”) with Hippo Enterprises Inc., a Delaware corporation (“Hippo”), and RTPZ Merger Sub Inc., a Delaware corporation and a direct wholly-owned subsidiary of the Company (“Merger Sub”). The Merger
F-32
HIPPO HOLDINGS INC.
NOTES TO UNAUDITED CONDENSED CONSOLIDATED FINANCIAL STATEMENTS
Agreement provides that, among other things and upon the terms and subject to the conditions thereof, the following transactions will occur (together with the other agreements and transactions contemplated by the Merger Agreement, the “Hippo Business Combination”): (i) at the closing of the transactions contemplated by the Merger Agreement (the “Closing”), upon the terms and subject to the conditions of the Merger Agreement and in accordance with the General Corporation Law of the State of Delaware, as amended (the “DGCL”), (a) Merger Sub will merge with and into Hippo, the separate corporate existence of Merger Sub will cease and Hippo will be the surviving corporation and a wholly owned subsidiary of the Company (the “First Merger”) and (b) immediately following the First Merger, Hippo (as the surviving corporation of the First Merger) will merge with and into the Company, the separate corporate existence of Hippo will cease and the Company will be the surviving corporation (the “Second Merger” and, together with the First Merger, the “Mergers”); (ii) as a result of the Merger, among other things, all outstanding shares of capital stock of Hippo will be canceled in exchange for the right to receive, in the aggregate, a number of shares of RTPZ Common Stock (as defined below) equal to the quotient obtained by dividing (x) $5,522,000,000 (representing the enterprise value of $5,000,000,000 plus Hippo’s cash as of December 31, 2020 ($522,000,000)) by (y) $10.00; and (iii) upon the effective time of the Domestication (as defined below), the Company will immediately be renamed “Hippo Holdings Inc.”
Prior to the Closing, subject to the approval of the Company’s shareholders, and in accordance with the DGCL, Cayman Islands Companies Act (as revised) (the “CICA”) and the Company’s amended and restated memorandum and articles of association, the Company will effect a deregistration under the CICA and a domestication under Section 388 of the DGCL (by means of filing a certificate of domestication with the Secretary of State of Delaware), pursuant to which the Company’s jurisdiction of incorporation will be changed from the Cayman Islands to the State of Delaware (the “Domestication”).
In connection with the Domestication, (i) each of the then issued and outstanding Class A ordinary shares, par value $0.0001 per share, of the Company, will convert automatically, on abasis, into a share of common stock, par value $0.0001, of the Company (after its Domestication) (the “RTPZ Common Stock”), (ii) each of the then issued and outstanding Class B ordinary shares, par value $0.0001 per share, of the Company, will convert automatically, on abasis, into a share of RTPZ Common Stock, (iii) each then issued and outstanding warrant to acquire the Company’s Class A Ordinary Shares will convert automatically into a warrant to acquire an equal number of shares of RTPZ Common Stock (“Domesticated RTPZ Warrant”), and (iv) each then issued and outstanding unit of the Company will convert automatically into a share of RTPZ Common Stock, on abasis, and
one-for-one
one-for-one
one-for-one
one-fifth
of one Domesticated RTPZ Warrant.On March 3, 2021, concurrently with the execution of the Merger Agreement, the Company entered into subscription agreements with certain investors (collectively, the “PIPE Investors”), pursuant to, and on the terms and subject to the conditions of which, the PIPE Investors have collectively subscribed for 55 million shares of RTPZ Common Stock for an aggregate purchase price equal to $550 million (the “PIPE Investment”). The PIPE Investment will be consummated substantially concurrently with the Closing, subject to the terms and conditions contemplated by the applicable subscription agreements.
On August 2, 2021, the Company closed the Business Combination and on August 3, 2021, Hippo Holdings common stock and warrants begin publicly trading on The New York Stock Exchange under the new symbols “HIPO” and “HIPO.WS”, respectively.
Note 2 — Summary of Significant Accounting Policies
Basis of Presentation
The accompanying unaudited condensed consolidated financial statements are presented in U.S. dollars in conformity with accounting principles generally accepted in the United States of America (“GAAP”) for
F-33
HIPPO HOLDINGS INC.
NOTES TO UNAUDITED CONDENSED CONSOLIDATED FINANCIAL STATEMENTS
financial information and pursuant to the rules and regulations of the SEC. Accordingly, they do not include all of the information and footnotes required by GAAP. In the opinion of management, the unaudited condensed consolidated financial statements reflect all adjustments, which include only normal recurring adjustments necessary for the fair statement of the balances and results for the periods presented. Operating results for the three and six months ended June 30, 2021 are not necessarily indicative of the results that may be expected through December 31, 2021 or any future period. The accompanying unaudited condensed consolidated financial statements should be read in conjunction with the audited financial statements contained in Amendment No. 1 to the Company’s Annual Report on
Form 10-K/A filed
with the SEC on May 11, 2021.Emerging Growth Company
The Company is an “emerging growth company,” as defined in Section 2(a) of the Securities Act, as modified by the Jumpstart Our Business Startups Act of 2012 (the “JOBS Act”), and it may take advantage of certain exemptions from various reporting requirements that are applicable to other public companies that are not emerging growth companies including, but not limited to, not being required to comply with the independent registered public accounting firm attestation requirements of Section 404 of the Sarbanes-Oxley Act, reduced disclosure obligations regarding executive compensation in its periodic reports and proxy statements, and exemptions from the requirements of holding a nonbinding advisory vote on executive compensation and shareholder approval of any golden parachute payments not previously approved.
Further, Section 102(b)(1) of the JOBS Act exempts emerging growth companies from being required to comply with new or revised financial accounting standards until private companies (that is, those that have not had a Securities Act registration statement declared effective or do not have a class of securities registered under the Exchange Act) are required to comply with the new or revised financial accounting standards. The JOBS Act provides that an emerging growth company can elect to opt out of the extended transition period and comply with the requirements
that apply to non-emerging growth companies but
any such an election to opt out is irrevocable. The Company has elected not to opt out of such extended transition period, which means that when a standard is issued or revised and it has different application dates for public or private companies, the Company, as an emerging growth company, can adopt the new or revised standard at the time private companies adopt the new or revised standard.This may make comparison of the Company’s financial statements with another public company that is neither an emerging growth company nor an emerging growth company that has opted out of using the extended transition period difficult or impossible because of the potential differences in accounting standards used.
Liquidity and Capital Resources
As of June 30, 2021, the Company had approximately $101,000 in its operating bank account and a working capital deficit of approximately $397,000.
The Company’s liquidity needs to date have been satisfied through a contribution of $25,000 from Sponsor to cover for certain expenses in exchange for the issuance of the Founder Shares, the loan of approximately $194,000 from the Sponsor pursuant to the promissory note (see Note 4), and the proceeds from the consummation of the Initial Public Offering and Private Placement not held in the Trust Account. The Company fully repaid the promissory note as of September 21, 2020 (see Note 4). In addition, in order to finance transaction costs in connection with a Business Combination, the Sponsor or an affiliate of the Sponsor, or certain of the Company’s officers and directors may, but are not obligated to, provide the Company Working Capital Loans (see Note 4). As of June 30, 2021, there were no amounts outstanding under any Working Capital Loan.
F-34
HIPPO HOLDINGS INC.
NOTES TO UNAUDITED CONDENSED CONSOLIDATED FINANCIAL STATEMENTS
On August 2, 2021, the Company closed the Business Combination. On August 2, 2021, the Company issued, in the aggregate, 55,000,000 shares of its common stock to investors at $10.00 per share for aggregate consideration of $550,000,000.
Risk and Uncertainties
On January 30, 2020, the World Health Organization (“WHO”) announced a global health emergency because of a new strain of coronavirus (the
“COVID-19
outbreak”). In March 2020, the WHO classified theCOVID-19
outbreak as a pandemic, based on the rapid increase in exposure globally. The full impact of theCOVID-19
outbreak continues to evolve. The impact of theCOVID-19
outbreak on the Company’s results of operations, financial position and cash flows will depend on future developments, including the duration and spread of the outbreak and related advisories and restrictions. These developments and the impact of theCOVID-19
outbreak on the financial markets and the overall economy are highly uncertain and cannot be predicted. If the financial markets and/or the overall economy are impacted for an extended period, the Company’s results of operations, financial position and cash flows may be materially adversely affected. Additionally, the Company’s ability to complete an initial Business Combination may be materially adversely affected due to significant governmental measures that have been, and may in the future be, implemented to contain theCOVID-19
outbreak or treat its impact, including travel restrictions, the shutdown of businesses and quarantines, among others, which may limit the Company’s ability to have meetings with potential investors or affect the ability of a potential target company’s personnel, vendors and service providers to negotiate and consummate an initial Business Combination in a timely manner. The Company’s ability to consummate an initial Business Combination may also be dependent on the ability to raise additional equity and debt financing, which may be impacted by theCOVID-19
outbreak and the resulting market downturn.Use of Estimates
The preparation of the Company’s unaudited condensed consolidated financial statements in conformity with GAAP requires management to make estimates and assumptions that affect the reported amounts of assets and liabilities and disclosure of contingent assets and liabilities at the date of the financial statements and the reported amounts of revenues and expenses during the reporting period. Making estimates requires management to exercise significant judgment. It is at least reasonably possible that the estimate of the effect of a condition, situation or set of circumstances that existed at the date of the financial statements, which management considered in formulating its estimate, could change in the near term due to one or more future confirming events. One of the more significant accounting estimates included in these condensed consolidated financial statements is the determination of the fair value of the warrant liability. Such estimates may be subject to change as more current information becomes available and accordingly the actual results could differ significantly from those estimates.
Cash and Cash Equivalents
The Company considers all short-term investments with an original maturity of three months or less when purchased to be cash equivalents. The Company had no cash equivalents as of June 30, 2021 and December 31, 2020.
Investments Held in the Trust Account
The Company’s portfolio of investments is comprised of U.S. government securities, within the meaning set forth in Section 2(a)(16) of the Investment Company Act, with a maturity of 185 days or less, or investments in money market funds that invest in U.S. government securities and generally have a readily determinable fair
F-35
HIPPO HOLDINGS INC.
NOTES TO UNAUDITED CONDENSED CONSOLIDATED FINANCIAL STATEMENTS
value, or a combination thereof. When the Company’s investments held in the Trust Account are comprised of U.S. government securities, the investments are classified as trading securities. When the Company’s investments held in the Trust Account are comprised of money market funds, the investments are recognized at fair value. Trading securities and investments in money market funds are presented on the condensed consolidated balance sheets at fair value at the end of each reporting period. Gains and losses resulting from the change in fair value of these securities is included in unrealized gain on investments held in Trust Account in the accompanying unaudited condensed consolidated statements of operations. The estimated fair values of investments held in the Trust Account are determined using available market information.
Concentration of Credit Risk
Financial instruments that potentially subject the Company to concentrations of credit risk consist of cash accounts in a financial institution, which, at times, may exceed the Federal Depository Insurance Corporation coverage limit of $250,000. As of June 30, 2021 and December 31, 2020, the Company had not experienced losses on these accounts and management believes the Company is not exposed to significant risks on such accounts.
Fair Value of Financial Instruments
The fair value of the Company’s assets and liabilities, which qualify as financial instruments under the FASB ASC Topic 820, “Fair Value Measurements,” approximates the carrying amounts represented in the condensed consolidated balance sheets.
Fair Value Measurements
Fair value is defined as the price that would be received for sale of an asset or paid for transfer of a liability, in an orderly transaction between market participants at the measurement date. U.S. GAAP establishes a three-tier fair value hierarchy, which prioritizes the inputs used in measuring fair value.
The hierarchy gives the highest priority to unadjusted quoted prices in active markets for identical assets or liabilities (Level 1 measurements) and the lowest priority to unobservable inputs (Level 3 measurements). These tiers include:
| • | Level 1, defined as observable inputs such as quoted prices for identical instruments in active markets; |
| • | Level 2, defined as inputs other than quoted prices in active markets that are either directly or indirectly observable such as quoted prices for similar instruments in active markets or quoted prices for identical or similar instruments in markets that are not active; and |
| • | Level 3, defined as unobservable inputs in which little or no market data exists, therefore requiring an entity to develop its own assumptions, such as valuations derived from valuation techniques in which one or more significant inputs or significant value drivers are unobservable. |
In some circumstances, the inputs used to measure fair value might be categorized within different levels of the fair value hierarchy. In those instances, the fair value measurement is categorized in its entirety in the fair value hierarchy based on the lowest level input that is significant to the fair value measurement.
Derivative Warrant Liabilities
The Company does not use derivative instruments to hedge exposures to cash flow, market, or foreign currency risks. The Company evaluates all of its financial instruments, including issued stock purchase warrants,
F-36
HIPPO HOLDINGS INC.
NOTES TO UNAUDITED CONDENSED CONSOLIDATED FINANCIAL STATEMENTS
to determine if such instruments are derivatives or contain features that qualify as embedded derivatives, pursuant to ASC 480 and FASB ASC Topic 815, “Derivatives and Hedging” (“ASC 815”). The classification of derivative instruments, including whether such instruments should be recorded as liabilities or as equity, is
re-assessed
at the end of each reporting period.The warrants issued in the Initial Public Offering (the “Public Warrants”) and the Private Placement Warrants are recognized as derivative liabilities in accordance with ASC 815. Accordingly, the Company recognizes the warrant instruments as liabilities at fair value and adjusts the carrying value of the instruments to fair value at each reporting period until they are exercised. The initial fair value of Public Warrants issued in connection with the Public Offering and the fair value of Private Placement Warrants have been estimated using a Monte Carlo simulation model each measurement date. The fair value of the Public Warrants as of June 30, 2021 is based on observable listed prices for such warrants. The fair value of the Public Warrants as of December 31, 2020 was estimated using a Monte Carlo simulation model. Derivative warrant liabilities are classified as
non-current
liabilities as their liquidation is not reasonably expected to require the use of current assets or require the creation of current liabilities.Offering Costs Associated with the Initial Public Offering
Offering costs consisted of legal, accounting, underwriting fees and other costs incurred through the Initial Public Offering that were directly related to the Initial Public Offering. Offering costs were allocated to the separable financial instruments issued in the Initial Public Offering based on a relative fair value basis, compared to total proceeds received. Offering costs associated with derivative warrant liabilities were expensed as incurred and presented as
non-operating
expenses in the condensed consolidated statements of operations. Offering costs associated with the Class A ordinary shares were charged to shareholders’ equity upon the completion of the Initial Public Offering. The Company will keep deferred underwriting commissions classified asnon-current
liabilities as their liquidation is not reasonably expected to require the use of current assets or require the creation of current liabilities.Class A Ordinary Shares Subject to Possible Redemption
The Company accounts for its Class A ordinary shares subject to possible redemption in accordance with the guidance in ASC 480. Class A ordinary shares subject to mandatory redemption (if any) are classified as liability instruments and are measured at fair value. Conditionally redeemable Class A ordinary shares (including Class A ordinary shares that feature redemption rights that are either within the control of the holder or subject to redemption upon the occurrence of uncertain events not solely within the Company’s control) are classified as temporary equity. At all other times, Class A ordinary shares are classified as shareholders’ equity. The Company’s Class A ordinary shares feature certain redemption rights that are considered to be outside of the Company’s control and subject to the occurrence of uncertain future events. Accordingly, at June 30, 2021 and December 31, 2020, 19,975,356 and 20,484,749, respectively, of Class A ordinary shares subject to possible redemption are presented as temporary equity, outside of the shareholders’ equity section of the Company’s condensed consolidated balance sheets.
Income Taxes
FASB ASC Topic 740, “Income Taxes” prescribes a recognition threshold and a measurement attribute for the financial statement recognition and measurement of tax positions taken or expected to be taken in a tax return. For those benefits to be recognized, a tax position must be more likely than not to be sustained upon examination by taxing authorities. There were no unrecognized tax benefits as of June 30, 2021. The Company’s management determined that the Cayman Islands is the Company’s only major tax jurisdiction. The Company
F-37
HIPPO HOLDINGS INC.
NOTES TO UNAUDITED CONDENSED CONSOLIDATED FINANCIAL STATEMENTS
recognizes accrued interest and penalties related to unrecognized tax benefits as income tax expense. NaN amounts were accrued for the payment of interest and penalties as of June 30, 2021. The Company is currently not aware of any issues under review that could result in significant payments, accruals or material deviation from its position. The Company is subject to income tax examinations by major taxing authorities since inception.
There is currently no taxation imposed on income by the Government of the Cayman Islands. In accordance with Cayman income tax regulations, income taxes are not levied on the Company. Consequently, income taxes are not reflected in the Company’s unaudited condensed consolidated financial statements. The Company’s management does not expect that the total amount of unrecognized tax benefits will materially change over the next twelve months.
Net Income (Loss) Per Ordinary Share
Net income (loss) per ordinary share is computed by dividing net income (loss) by the weighted-average number of ordinary shares outstanding during the periods. The Company has not considered the effect of the warrants sold in the Initial Public Offering and the Private Placement to purchase an aggregate of 9,000,000, of the Company’s Class A ordinary shares in the calculation of diluted net income (loss) per share, since the exercise of the warrants are contingent upon the occurrence of future events.
The Company’s unaudited condensed consolidated statements of operations includes a presentation of net income (loss) per share for ordinary shares subject to redemption in a manner similar to the
two-class
method of net income (loss) per share. Net income (loss) per ordinary share, basic and diluted for Class A ordinary shares is calculated by dividing the unrealized gain on investments held in the Trust Account, net of applicable taxes and interest to fund working capital requirements, subject to an annual limit of $165,000, available to be withdrawn from the Trust Account, resulting in income of approximately $6,000 and $59,000 for the three and six months ended June 30, 2021, respectively, by the weighted average number of Class A ordinary shares outstanding for the period. Net income (loss) per ordinary share, basic and diluted for Class B ordinary shares is calculated by dividing the net income (loss), less net income (loss) attributable to Class A ordinary shares by the weighted average number of Class B ordinary shares outstanding for the period.Recent Accounting Pronouncements
In August 2020, the FASB issued Accounting Standards Update (“ASU”)
No. 2020-06, “Debt—Debt
with Conversion and Other Options(Subtopic 470-20) and
Derivatives and Hedging—Contracts in Entity’s Own Equity(Subtopic 815-40): Accounting
for Convertible Instruments and Contracts in an Entity’s OwnEquity” (“ASU 2020-06”), which
simplifies accounting for convertible instruments by removing major separation models required under current GAAP. The ASU also removes certain settlement conditions that are required for equity-linked contracts to qualify for the derivative scope exception, and it simplifies the diluted earnings per share calculation in certain areas. The Company adoptedASU 2020-06 on
January 1, 2021. Adoption of the ASU did not impact the Company’s financial position, results of operations or cash flows.The Company’s management does not believe that any other recently issued, but not yet effective, accounting pronouncement if currently adopted would have a material effect on the Company’s unaudited condensed financial statements.
Note 3 — Initial Public Offering
On November 23, 2020, the Company consummated its Initial Public Offering of 23,000,000 Units, including 3,000,000 Over-Allotment Units, at $10.00 per Unit, generating gross proceeds of $230.0 million, and incurring offering costs of approximately $13.1 million, inclusive of approximately $8.1 million in deferred underwriting commissions.
F-38
HIPPO HOLDINGS INC.
NOTES TO UNAUDITED CONDENSED CONSOLIDATED FINANCIAL STATEMENTS
Each Unit consists of one Class A ordinary share and
one-fifth of
one redeemable warrant (“Public Warrant”). Each whole Public Warrant will entitle the holder to purchase one Class A ordinary share at an exercise price of $11.50
per share, subject to adjustment (see Note 7).Note 4 — Private Placement
Substantially concurrently with the closing of the Initial Public Offering, the Company consummated the Private Placement of 4,400,000 Private Placement Warrants, at a price of $1.50 per Private Placement Warrant to the Sponsor, generating gross proceeds of $6.6 million.
Each Private Placement Warrant is exercisable for 1 whole Class A ordinary share at a price of $11.50 per share. A portion of the proceeds from the sale of the Private Placement Warrants to the Sponsor was added to the proceeds from the Initial Public Offering held in the Trust Account. If the Company does not complete a Business Combination within the Combination Period, the Private Placement Warrants will expire worthless. The Private Placement Warrants will be
non-redeemable for
cash and exercisable on a cashless basis, except as described in Note 7, so long as they are held by the Sponsor or its permitted transferees.The Sponsor and the Company’s officers and directors agreed, subject to limited exceptions, not to transfer, assign or sell any of their Private Placement Warrants until 30 days after the completion of the initial Business Combination.
Note 5 — Related Party Transactions
Founder Shares
On October 7, 2020, the Sponsor paid an aggregate of $25,000 to cover for certain expenses on behalf of the Company in exchange for issuance of 5,750,000 Class B ordinary shares (the “Founder Shares”). The Sponsor agreed to forfeit up to an aggregate of 750,000 Founder Shares to the extent that the option to purchase Over-Allotment Units was not exercised in full by the underwriters, so that the Founder Shares would represent 20% of the Company’s issued and outstanding shares after the Initial Public Offering. The underwriters fully exercised their over-allotment option on November 19, 2020; thus, those Founder Shares were no longer subject to forfeiture.
The Initial Shareholders agreed not to transfer, assign or sell any of their Founder Shares until the earlier to occur of (1) one year after the completion of the initial Business Combination; and (2) subsequent to the initial Business Combination (x) if the last reported sale price of Class A ordinary shares equals or exceeds $12.00 per share (as adjusted for share
sub-divisions,
share dividends, rights issuances, consolidations, reorganizations, recapitalizations and other similar transactions) for any 20 trading days within any30-trading
day period commencing at least 150 days after the initial Business Combination or (y) the date on which the Company completes a liquidation, merger, share exchange, reorganization or other similar transaction that results in all of the Public Shareholders having the right to exchange their ordinary shares for cash, securities or other property.Related Party Loans
On October 7, 2020, the Sponsor agreed to loan the Company up to $300,000 to be used for the payment of costs related to the Initial Public Offering pursuant to a promissory note (the “Note”). The Note was
non-interest bearing,
unsecured and due upon the earlier of December 31, 2021 and the closing of the Initial Public Offering. The Company borrowed approximately $60,000 under the Note, and fully repaid this on November 20, 2020.F-39
HIPPO HOLDINGS INC.
NOTES TO UNAUDITED CONDENSED CONSOLIDATED FINANCIAL STATEMENTS
In addition, in order to finance transaction costs in connection with a Business Combination, the Sponsor, members of the Company’s founding team or any of their affiliates may, but are not obligated to, loan the Company funds as may be required (“Working Capital Loans”). If the Company completes a Business Combination, the Company would repay the Working Capital Loans out of the proceeds of the Trust Account released to the Company. Otherwise, the Working Capital Loans would be repaid only out of funds held outside the Trust Account. In the event that a Business Combination does not close, the Company may use a portion of proceeds held outside the Trust Account to repay the Working Capital Loans but no proceeds held in the Trust Account would be used to repay the Working Capital Loans. The Working Capital Loans would either be repaid upon consummation of a Business Combination, without interest, or, at the lender’s discretion, up to $2,000,000 of such Working Capital Loans may be convertible into warrants of the post Business Combination entity at a price of $1.50 per warrant. The warrants would be identical to the Private Placement Warrants. Except for the foregoing, the terms of such Working Capital Loans, if any, have not been determined and no written agreements exist with respect to such loans. As of June 30, 2021 and December 31, 2020, the Company had no borrowings under the Working Capital Loans.
Support Services Agreement
The Company entered into a support services agreement (the “Support Services Agreement”) that provides that, commencing on the date that the Company’s securities were first listed on the NYSE through the earlier of consummation of the initial Business Combination and the liquidation, the Company will pay Support Services Fees to Reinvent Capital LLC (“Reinvent Capital”) that total $625,000 per year for support and administrative services, as well as reimburse Reinvent Capital for anyexpenses it incurs in connection with providing services or for office space under the Support Services Agreement. The Company recognized Support Service Fees of approximately $156,200 and $312,500 in the condensed consolidated statements of operations for the three and six months ended June 30, 2021 and included $312,500 in Due to Related Party on the condensed consolidated balance sheet at June 30, 2021. As of June 30, 2021 and December 31, 2020, the Company had Support Services Fees of $312,500 and $0, respectively, in Due to Related Party on the condensed consolidated balance sheet. The Company ceased paying these quarterly fees following the consummation of the Hippo Business Combination.
out-of-pocket
In addition, the Sponsor, officers and directors, or any of their respective affiliates will be reimbursed for anyincurred in connection with activities on the Company’s behalf such as identifying potential target businesses and performing due diligence on suitable Business Combinations. The Company’s audit committee will review on a quarterly basis all payments that were made to the Sponsor, officers or directors, or the Company’s or their affiliates. Any such payments prior to an initial Business Combination will be made from funds held outside the Trust Account, including funds released from the Trust Account to pay for working capital, subject to an annual limit of $165,000. For the three and six months ended June 30, 2021, the Company incurred reimbursable expenses of approximately $28,800 and $41,200, respectively, in reimbursable expenses paid by the Sponsor, which was recognized in the condensed consolidated statements of operations and included $41,200 in Due to Related Party on the condensed consolidated balance sheet at June 30, 2021. As of June 30, 2021 and December 31, 2020, the Company had reimbursable expenses of approximately $22,000 and $11,500, respectively, in Due to Related Party on the condensed consolidated balance sheet. The Company ceased paying these cost reimbursements following the consummation of the Hippo Business Combination.
out-of-pocket expenses
Note 6 — Commitments and Contingencies
Registration Rights
The holders of the Founder Shares, Private Placement Warrants and any warrants that may be issued upon conversion of Working Capital Loans (and any Class A ordinary shares issuable upon the exercise of the Private
F-40
HIPPO HOLDINGS INC.
NOTES TO UNAUDITED CONDENSED CONSOLIDATED FINANCIAL STATEMENTS
Placement Warrants or warrants issued upon conversion of the Working Capital Loans and upon conversion of the Founder Shares) are entitled to registration rights pursuant to a registration rights agreement. The holders of these securities are entitled to make up to three demands, excluding short form demands, that the Company registers such securities. In addition, the holders have certain “piggy-back” registration rights with respect to registration statements filed subsequent to the completion of the initial Business Combination. The Company will bear the expenses incurred in connection with the filing of any such registration statements.
Underwriting Agreement
The Company granted the underwriters a
45-day option
from the date of the final prospectus to purchase up to 3,000,000 Over-Allotment Units at the Initial Public Offering price less the underwriting discounts and commissions. The underwriters fully exercised their over-allotment option on November 19, 2020.The underwriters were entitled to an underwriting discount of $0.20 per unit, or $4.6 million in the aggregate, paid upon the closing of the Initial Public Offering. In addition, $0.35 per unit, or $8.05 million in the aggregate will be payable to the underwriters for deferred underwriting commissions. The deferred fee will become payable to the underwriters from the amounts held in the Trust Account solely in the event that the Company completes a Business Combination, subject to the terms of the underwriting agreement.
Deferred Legal Fees
The Company engaged a legal counsel firm for legal advisory services, and the legal counsel agreed to defer certain of their fees until the consummation of the initial Business Combination. As of June 30, 2021, the Company recorded deferred legal fees of approximately $200,000 in connection with such services on the accompanying balance sheet.
Note 7 — Shareholders’ Equity
Class
A Ordinary Shares
Class
B Ordinary Shares
Class A ordinary shareholders and Class B ordinary shareholders of record are entitled to one vote for each share held on all matters to be voted on by shareholders and vote together as a single class, except as required by law; provided, that, prior to the initial Business Combination, holders of Class B ordinary shares will have the right to appoint all of the Company’s directors and remove members of the board of directors for any reason, and holders of Class A ordinary shares will not be entitled to vote on the appointment of directors during such time.
The Class B ordinary shares will automatically convert into Class A ordinary shares at the time of the initial Business Combination, or earlier at the option of the holder, on asubject to adjustment for share
one-for-one basis,
sub-divisions,
share dividends, rights issuances, consolidations, reorganizations, recapitalizations and the like, and subject to further adjustment. In the case that additional Class A ordinary shares, or equity-linked securities, are issued or deemed issued in excess of the amounts issued in the Initial Public Offering andF-41
HIPPO HOLDINGS INC.
NOTES TO UNAUDITED CONDENSED CONSOLIDATED FINANCIAL STATEMENTS
related to the closing of the initial Business Combination, the ratio at which the Class B ordinary shares will convert into Class A ordinary shares will be adjusted (unless the holders of a majority of the issued and outstanding Class B ordinary shares agree to waive such anti-dilution adjustment with respect to any such issuance or deemed issuance) so that the number of Class A ordinary shares issuable upon conversion of all Class B ordinary shares will equal, in the aggregate, on an
as-converted basis,
20% of the sum of all ordinary shares issued and outstanding upon the completion of the Initial Public Offering plus all Class A ordinary shares and equity-linked securities issued or deemed issued in connection with the initial Business Combination, excluding any shares or equity-linked securities issued, or to be issued, to any seller in the initial Business Combination. In no event will the Class B ordinary shares convert into Class A ordinary shares at a rate of less than one to one.Preference Shares
Note 8 — Derivative Warrant Liabilities
As of June 30, 2021 and December 31, 2020, the Company had 4,600,000 Public Warrants and 4,400,000 Private Placement Warrants outstanding.
Public Warrants may only be exercised for a whole number of shares. No fractional Public Warrants will be issued upon separation of the Units and only whole Public Warrants will trade. The Public Warrants will become exercisable on the later of (a) 30 days after the completion of a Business Combination and (b) 12 months from the closing of the Initial Public Offering; provided in each case that the Company has an effective registration statement under the Securities Act covering the issuance of the Class A ordinary shares issuable upon exercise of the warrants and a current prospectus relating to them is available and such shares are registered, qualified or exempt from registration under the securities, or blue sky, laws of the state of residence of the holder (or the Company permits holders to exercise their warrants on a cashless basis under the circumstances specified in the warrant agreement). The Company has agreed that as soon as practicable, but in no event later than 15 business days after the closing of the initial Business Combination, the Company will use its commercially reasonable efforts to file with the SEC a registration statement covering the issuance of the Class A ordinary shares issuable upon exercise of the warrants, and the Company will use its commercially reasonable efforts to cause the same to become effective within 60 business days after the closing of the initial Business Combination and to maintain the effectiveness of such registration statement and a current prospectus relating to those Class A ordinary shares until the warrants expire or are redeemed; provided that if the Class A ordinary shares are at the time of any exercise of a warrant not listed on a national securities exchange such that they satisfy the definition of a “covered security” under Section 18(b)(1) of the Securities Act, the Company may, at its option, requires holders of Public Warrants who exercise their warrants to do so on a “cashless basis” in accordance with Section 3(a)(9) of the Securities Act and, in the event the Company so elects, it will not be required to file or maintain in effect a registration statement.
The warrants have an exercise price of $11.50 per share, subject to adjustments, and will expire five years after the completion of a Business Combination or earlier upon redemption or liquidation. In addition, if (x) the Company issues additional ordinary shares or equity-linked securities for capital raising purposes in connection with the closing of the initial Business Combination at an issue price or effective issue price of less than $9.20 per ordinary share (with such issue price or effective issue price to be determined in good faith by the board of directors and, in the case of any such issuance to the Sponsor or its affiliates, without taking into account any Founder Shares held by the Sponsor or such affiliates, as applicable, prior to such issuance) (the “Newly Issued Price”), (y) the aggregate gross proceeds from such issuances represent more than 60% of the total equity
F-42
HIPPO HOLDINGS INC.
NOTES TO UNAUDITED CONDENSED CONSOLIDATED FINANCIAL STATEMENTS
proceeds, and interest thereon, available for the funding of the initial Business Combination on the date of the completion of the initial Business Combination (net of redemptions), and (z) the volume weighted average trading price of Class A ordinary shares during the 20 trading day period starting on the trading day prior to the day on which the Company consummates its initial business Combination (such price, the “Market Value”) is below $9.20 per share, the exercise price of the warrants will be adjusted (to the nearest cent) to be equal to 115% of the higher of the Market Value and the Newly Issued Price, the $18.00 per share redemption trigger price described below under “Redemption of warrants when the price per Class A ordinary share equals or exceeds $18.00” and “Redemption of warrants when the price per Class A ordinary share equals or exceeds $10.00” will be adjusted (to the nearest cent) to be equal to 180% of the higher of the Market Value and the Newly Issued Price, and the $10.00 per share redemption trigger price described below under “Redemption of warrants when the price per Class A ordinary share equals or exceeds $10.00” will be adjusted (to the nearest cent) to be equal to the higher of the Market Value and the Newly Issued Price.
The Private Placement Warrants are identical to the Public Warrants underlying the Units sold in the Initial Public Offering, except that the Private Placement Warrants and the Class A ordinary shares issuable upon exercise of the Private Placement Warrants will not be transferable, assignable or salable until 30 days after the completion of a Business Combination, subject to certain limited exceptions. Additionally, the Private Placement Warrants will be
non-redeemable,
except as described below, so long as they are held by the initial purchasers or such purchasers’ permitted transferees. If the Private Placement Warrants are held by someone other than the Initial Shareholders or their permitted transferees, the Private Placement Warrants will be redeemable by the Company and exercisable by such holders on the same basis as the Public Warrants.Redemption of warrants when the price per Class A ordinary share equals or exceeds $18.00:
Once the warrants become exercisable, the Company may redeem the outstanding warrants (except as described herein with respect to the Private Placement Warrants):
| • | in whole and not in part; |
| • | at a price of $0.01 per warrant; |
| • | upon not less than 30 days’ prior written notice of redemption to each warrant holder; and |
| • | if, and only if, the last reported sale price of Class A ordinary shares for any 20 trading days within a 30-trading day period ending on the third trading day prior to the date on which the Company sends the notice of redemption to the warrant holders (the “Reference Value”) equals or exceeds $18.00 per share (as adjusted). |
The Company will not redeem the warrants as described above unless a registration statement under the Securities Act covering the issuance of the Class A ordinary shares issuable upon exercise of the warrants is then effective and a current prospectus relating to those Class A ordinary shares is available throughout the
30-day redemption
period. If and when the warrants become redeemable by the Company, it may exercise its redemption right even if the Company is unable to register or qualify the underlying securities for sale under all applicable state securities laws.Redemption of warrants when the price per Class A ordinary share equals or exceeds $10.00:
Once the warrants become exercisable, the Company may redeem the outstanding warrants (except as described herein with respect to the Private Placement Warrants):
| • | in whole and not in part; |
F-43
HIPPO HOLDINGS INC.
NOTES TO UNAUDITED CONDENSED CONSOLIDATED FINANCIAL STATEMENTS
| • | at $0.10 per warrant upon a minimum of 30 days’ prior written notice of redemption provided that holders will be able to exercise their warrants on a cashless basis prior to redemption and receive that number of shares determined by reference to an agreed table based on the redemption date and the “fair market value” of Class A ordinary shares; |
| • | if, and only if, the Reference Value equals or exceeds $10.00 per share (as adjusted); and |
| • | if the Reference Value is less than $18.00 per share (as adjusted), the Private Placement Warrants must also concurrently be called for redemption on the same terms as the outstanding Public Warrants, as described above. |
The “fair market value” of Class A ordinary shares shall mean the volume-weighted average price of Class A ordinary shares for the 10 trading days following the date on which the notice of redemption is sent to the holders of warrants. In no event will the warrants be exercisable in connection with this redemption feature for more than 0.361 Class A ordinary shares per warrant (subject to adjustment).
In no event will the Company be required to net cash settle any warrant. If the Company is unable to complete a Business Combination within the Combination Period and the Company liquidates the funds held in the Trust Account, holders of warrants will not receive any of such funds with respect to their warrants, nor will they receive any distribution from the Company’s assets held outside of the Trust Account with the respect to such warrants. Accordingly, the warrants may expire worthless.
Note 9 — Fair Value Measurements
The following tables present information about the Company’s assets and liabilities that are measured at fair value on a recurring basis as of June 30, 2021 and December 31, 2020 and indicates the fair value hierarchy of the valuation techniques that the Company utilized to determine such fair value.
June 30, 2021
Description | Quoted Prices in Active Markets (Level 1) | Significant Other Observable Inputs (Level 2) | Significant Other Unobservable Inputs (Level 3) | |||||||||
Assets: | ||||||||||||
U.S. Treasury Securities | $ | 230,004,108 | $ | — | $ | — | ||||||
Liabilities: | ||||||||||||
Derivative warrant liabilities — public warrants | $ | 8,318,290 | $ | — | $ | — | ||||||
Derivative warrant liabilities — private warrants | $ | — | $ | — | $ | 8,284,890 | ||||||
December 31, 2020
Description | Quoted Prices in Active Markets (Level 1) | Significant Other Observable Inputs (Level 2) | Significant Other Unobservable Inputs (Level 3) | |||||||||
Assets: | ||||||||||||
U.S. Treasury Fund | $ | 230,017,782 | $ | — | $ | — | ||||||
Liabilities: | ||||||||||||
Derivative warrant liabilities — public warrants | $ | — | $ | — | $ | 6,762,630 | ||||||
Derivative warrant liabilities — private warrants | $ | — | $ | — | $ | 6,705,000 | ||||||
F-44
HIPPO HOLDINGS INC.
NOTES TO UNAUDITED CONDENSED CONSOLIDATED FINANCIAL STATEMENTS
The remainder of the balance in Investments held in Trust Account is comprised of cash equivalents. Level 1 assets include investments in cash, money market funds and U.S. Treasury securities. The Company uses inputs such as actual trade data, benchmark yields, quoted market prices from dealers or brokers, and other similar sources to determine the fair value of its investments.
Transfers to/from Levels 1, 2, and 3 are recognized at the beginning of the reporting period. The estimated fair value of the Public Warrants transferred from a Level 3 measurement to a Level 1 fair value measurement in January 2021, when the Public Warrants were separately listed and traded.
The fair value of the Public Warrants issued in connection with the Public Offering and Private Placement Warrants were initially measured at fair value using a Monte Carlo simulation model and subsequently, the fair value of the Private Placement Warrants have been estimated using a Monte Carlo simulation model each measurement date. The fair value of Public Warrants issued in connection with the Initial Public Offering have been measured based on the listed market price of such warrants, a Level 1 measurement, since January 2021. For the three and six months ended June 30, 2021, the Company recognized a charge to the condensed consolidated statements of operations resulting from an increase in the fair value of liabilities of approximately $2.1 million and $3.1 million, respectively, presented as change in fair value of derivative warrant liabilities on the accompanying condensed consolidated statements of operations.
The estimated fair value of the Private Placement Warrants, and the Public Warrants prior to being separately listed and traded, is determined using Level 3 inputs. Inherent in a Monte Carlo simulation are assumptions related to expected stock-price volatility, expected life, risk-free interest rate and dividend yield. The Company estimates the volatility of its warrants based on implied volatility from the Company’s traded warrants and from historical volatility of select peer company’s common stock that matches the expected remaining life of the warrants. The risk-free interest rate is based on the U.S. Treasury
zero-coupon
yield curve on the grant date for a maturity similar to the expected remaining life of the warrants. The expected life of the warrants is assumed to be equivalent to their remaining contractual term. The dividend rate is based on the historical rate, which the Company anticipates remaining at zero.The following table provides quantitative information regarding Level 3 fair value measurements inputs at their measurement dates:
As of June 30, 2021 | As of December 31, 2020 | |||||||
Stock price | $ | 9.93 | $ | 9.98 | ||||
Volatility | 25.7 | % | 23.5 | % | ||||
Expected life of the options to convert | 5.10 | 5.47 | ||||||
Risk-free rate | 0.88 | % | 0.43 | % | ||||
Dividend yield | 0 | 0 | ||||||
The change in the fair value of the Level 3 derivative warrant liabilities for six months ended June 30, 2021 is summarized as follows:
Level 3 – Derivative warrant liabilities at January 1, 2021 | $ | 13,467,630 | ||
Transfer of Public Warrants to Level 1 | (7,285,410 | ) | ||
Change in fair value of derivative warrant liabilities | 2,102,670 | |||
Level 3 – Derivative warrant liabilities at June 30, 2021 | $ | 8,284,890 | ||
F-45
HIPPO HOLDINGS INC.
NOTES TO UNAUDITED CONDENSED CONSOLIDATED FINANCIAL STATEMENTS
Note 10 — Subsequent Events
Management has evaluated subsequent events to determine if events or transactions occurring through August 16, 2021, the date the financial statements were issued, require potential adjustment to or disclosure in the financial statements and has concluded that, other than as described below, all such events that would require recognition or disclosure have been recognized or disclosed.
On July 29, 2021, 19,261,380 of the Company’s Class A ordinary shares amounting to $192,613,300 were presented for redemption in connection with the Business Combination. These redemptions were completed, and amount settled with the shareholders.
On August 2, 2021 the Company closed Business Combination and on August 3, 2021 Hippo Holdings common stock and warrants begin publicly trading on The New York Stock Exchange under the new symbols “HIPO” and “HIPO.WS”, respectively.
F-46
Report of Independent Registered Public Accounting Firm
To the Stockholders and the Board of Directors of Hippo Enterprises Inc. and Subsidiaries
Opinion on the Financial Statements
We have audited the accompanying consolidated balance sheets of Hippo Enterprises Inc. and Subsidiaries (the Company) as of December 31, 2020 and 2019, the related consolidated statements of operations and comprehensive loss, changes in convertible preferred stock and stockholders’ deficit and cash flows for each of the two years in the period ended December 31, 2020, and the related notes and financial statement schedules listed in the Index at Item 15(a) (collectively referred to as the “consolidated financial statements”). In our opinion, the consolidated financial statements present fairly, in all material respects, the financial position of the Company at December 31, 2020 and 2019, and the results of its operations and its cash flows for each of the two years in the period ended December 31, 2020, in conformity with U.S. generally accepted accounting principles.
Basis for Opinion
These financial statements are the responsibility of the Company’s management. Our responsibility is to express an opinion on the Company’s financial statements based on our audits. We are a public accounting firm registered with the Public Company Accounting Oversight Board (United States) (PCAOB) and are required to be independent with respect to the Company in accordance with the U.S. federal securities laws and the applicable rules and regulations of the Securities and Exchange Commission and the PCAOB.
We conducted our audits in accordance with the standards of the PCAOB and in accordance with auditing standards generally accepted in the United States of America. Those standards require that we plan and perform the audit to obtain reasonable assurance about whether the financial statements are free of material misstatement, whether due to error or fraud. Our audits included performing procedures to assess the risks of material misstatement of the financial statements, whether due to error or fraud, and performing procedures that respond to those risks. Such procedures included examining, on a test basis, evidence regarding the amounts and disclosures in the financial statements. Our audits also included evaluating the accounting principles used and significant estimates made by management, as well as evaluating the overall presentation of the financial statements. We believe that our audits provide a reasonable basis for our opinion.
/s/ Ernst & Young LLP
We have served as the Company’s auditor since 2019
San Francisco, California
March 25, 2021
F-47
HIPPO ENTERPRISES INC. AND SUBSIDIARIES
Consolidated Balance Sheets
(In millions, except share and per share data)
As of December 31, | ||||||||
2020 | 2019 | |||||||
Assets | ||||||||
Investments: | ||||||||
Fixed maturities available-for-sale, | $ | 56.0 | $ | 0 | ||||
Short-term investments | 0 | 96.5 | ||||||
Total investments | 56.0 | 96.5 | ||||||
Cash and cash equivalents | 452.3 | 23.3 | ||||||
Restricted cash | 40.1 | 18.7 | ||||||
Accounts receivable, net of allowance of $0.5 and $0, respectively | 37.1 | 3.5 | ||||||
Reinsurance recoverable on paid and unpaid losses and LAE | 134.1 | 0 | ||||||
Deferred policy acquisition costs | 1.9 | 0 | ||||||
Ceding commissions receivable | 21.3 | 0 | ||||||
Prepaid reinsurance premiums | 129.4 | 0 | ||||||
Property and equipment | 0.9 | 0.9 | ||||||
Capitalized internal use software | 14.7 | 7.8 | ||||||
Goodwill | 47.8 | 1.9 | ||||||
Intangible assets | 33.9 | 15.6 | ||||||
Other assets | 9.9 | 2.3 | ||||||
Total assets | $ | 979.4 | $ | 170.5 | ||||
Liabilities, convertible preferred stock, and stockholders’ deficit | ||||||||
Liabilities: | ||||||||
Loss and loss adjustment expense reserve | $ | 105.1 | $ | 0 | ||||
Unearned premiums | 150.3 | 0 | ||||||
Reinsurance premiums payable | 86.1 | 0 | ||||||
Provision for commission | 28.2 | 12.9 | ||||||
Fiduciary liabilities | 17.5 | 10.5 | ||||||
Convertible promissory notes | 273.0 | 0 | ||||||
Derivative liability on notes | 113.3 | 0 | ||||||
Contingent consideration liability | 12.0 | 13.8 | ||||||
Preferred stock warrant liabilities | 22.9 | 6.7 | ||||||
Accrued expenses and other liabilities | 25.7 | 14.6 | ||||||
Total liabilities | 834.1 | 58.5 | ||||||
Commitments and contingencies (Note 14) | ||||||||
Convertible preferred stock: | ||||||||
Preferred stock, $0.000001 par value per share; 46,479,310 and 38,851,220 shares authorized as of December 31, 2020 and 2019, respectively; 43,985,178 and 36,035,688 shares issued and outstanding as of December 31, 2020 and 2019, respectively; Liquidation preferences of $359.4 million and $204.5 million as of December 31, 2020 and 2019, respectively | 344.8 | 190.3 | ||||||
Stockholders’ deficit | ||||||||
Common stock, $0.000001 par value per share; 83,830,000 and 71,000,000 shares authorized as of December 31, 2020 and 2019, respectively; 13,307,826 and 12,069,742 shares issued and outstanding as of December 31, 2020 and 2019, respectively | 0 | 0 | ||||||
Additional paid-in capital | 56.9 | 36.7 | ||||||
Accumulated other comprehensive income | 0.1 | 0.1 | ||||||
Accumulated deficit | (256.6 | ) | (115.1 | ) | ||||
Total Hippo Enterprises Inc. stockholders’ deficit | (199.6 | ) | (78.3 | ) | ||||
Noncontrolling interest | 0.1 | 0 | ||||||
Total stockholders’ deficit | (199.5 | ) | (78.3 | ) | ||||
Total liabilities, convertible preferred stock, and stockholders’ deficit | $ | 979.4 | $ | 170.5 | ||||
F-48
HIPPO ENTERPRISES INC. AND SUBSIDIARIES
Consolidated Statements of Operations and Comprehensive Loss
(In millions, except share and per share data)
Year ended December 31, | ||||||||
2020 | 2019 | |||||||
Revenue: | ||||||||
Net earned premium | $ | 17.1 | $ | 0 | ||||
Commission income, net | 27.1 | 28.9 | ||||||
Service and fee income | 6.3 | 3.6 | ||||||
Net investment income | 1.1 | 2.2 | ||||||
Total revenue | 51.6 | 34.7 | ||||||
Expenses: | ||||||||
Losses and loss adjustment expenses | 25.3 | 0 | ||||||
Insurance related expenses | 19.3 | 7.1 | ||||||
Technology and development | 18.0 | 7.7 | ||||||
Sales and marketing | 69.4 | 66.3 | ||||||
General and administrative | 36.8 | 34.6 | ||||||
Interest and other expense | 26.0 | 2.0 | ||||||
Total expenses | 194.8 | 117.7 | ||||||
Loss before income taxes | (143.2 | ) | (83.0 | ) | ||||
Income taxes (benefit) expense | (1.8 | ) | 0.1 | |||||
Net loss | (141.4 | ) | (83.1 | ) | ||||
Net income attributable to noncontrolling interests, net of tax | 0.1 | 0 | ||||||
Net loss attributable to Hippo Enterprises Inc. | $ | (141.5 | ) | $ | (83.1 | ) | ||
Other comprehensive income: | ||||||||
Change in net unrealized gain on available-for-sale | 0 | 0.1 | ||||||
Comprehensive loss | $ | (141.5 | ) | $ | (83.0 | ) | ||
Per share data: | ||||||||
Net loss attributable to Hippo Enterprises Inc. — basic and diluted | $ | (141.5 | ) | $ | (83.1 | ) | ||
Weighted-average shares used in computing net loss per share attributable to Hippo Enterprises Inc. — basic and diluted | 12,495,509 | 10,652,088 | ||||||
Net loss per share attributable to Hippo Enterprises Inc. — basic and diluted | $ | (11.32 | ) | $ | (7.80 | ) | ||
F-49
HIPPO ENTERPRISES INC. AND SUBSIDIARIES
Consolidated Statements of Changes in Convertible Preferred Stock and Stockholders’ Deficit
(In millions, except share data)
Convertible Preferred Stock | Common Stock | Additional Paid-in Capital | Accumulated Other Comprehensive Income | Accumulated Deficit | Total Hippo Enterprises Inc. Stockholders’ Deficit | Noncontrolling Interests | Total Stockholders’ Deficit | |||||||||||||||||||||||||||||||||
Shares | Amount | Shares | Amount | |||||||||||||||||||||||||||||||||||||
Balance at January 1, 2019 | 28,627,021 | $ | 87.3 | 8,586,503 | $ | 0 | $ | 13.9 | $ | 0 | $ | (32.0 | ) | $ | (18.1 | ) | $ | 0 | $ | (18.1 | ) | |||||||||||||||||||
Net loss | — | — | — | — | — | 0.1 | (83.1 | ) | (83.0 | ) | — | (83.0 | ) | |||||||||||||||||||||||||||
Other comprehensive income | — | — | — | — | — | — | — | — | — | — | ||||||||||||||||||||||||||||||
Issuance of Series C preferred stock, net of issuance costs | 1,135,603 | 8.0 | — | — | — | — | — | — | — | — | ||||||||||||||||||||||||||||||
Issuance of Series D preferred stock, net of issuance costs | 6,273,064 | 95.0 | — | — | — | — | — | — | — | — | ||||||||||||||||||||||||||||||
Issuance of common stock upon exercise of warrants | — | — | 58,500 | — | — | — | — | — | — | — | ||||||||||||||||||||||||||||||
Issuance of common stock upon exercise of stock options | — | — | 1,212,945 | — | 0.9 | — | — | 0.9 | — | 0.9 | ||||||||||||||||||||||||||||||
Vesting of early exercised stock options | — | — | 56,791 | — | 0.1 | — | — | 0.1 | — | 0.1 | ||||||||||||||||||||||||||||||
Vesting of restricted stock awards | — | — | 2,155,003 | — | — | — | — | — | — | — | ||||||||||||||||||||||||||||||
Share-based compensation expense | — | — | — | — | 21.8 | — | — | 21.8 | — | 21.8 | ||||||||||||||||||||||||||||||
Balance at December 31, 2019 | 36,035,688 | $ | 190.3 | 12,069,742 | $ | 0 | 36.7 | 0.1 | (115.1 | ) | (78.3 | ) | 0 | $ | (78.3 | ) | ||||||||||||||||||||||||
Net loss | — | $ | — | — | $ | — | $ | — | $ | — | $ | (141.5 | ) | $ | (141.5 | ) | $ | 0.1 | $ | (141.4 | ) | |||||||||||||||||||
Other comprehensive income | — | — | — | — | — | — | — | — | — | — | ||||||||||||||||||||||||||||||
Issuance of Series D preferred stock, net of issuance costs | 321,415 | 4.8 | — | — | — | — | — | — | — | — | ||||||||||||||||||||||||||||||
Issuance of Series E preferred stock, net of issuance costs | 7,628,075 | 149.7 | — | — | — | — | — | — | — | — | ||||||||||||||||||||||||||||||
Issuance of common stock upon exercise of stock options | — | — | 1,179,870 | — | 2.5 | — | — | 2.5 | — | 2.5 | ||||||||||||||||||||||||||||||
Vesting of early exercised stock options | — | — | 38,694 | — | — | — | — | — | — | — | ||||||||||||||||||||||||||||||
Vesting of restricted stock awards | — | — | 19,520 | — | — | — | — | — | — | — | ||||||||||||||||||||||||||||||
Share-based compensation expense | — | — | — | — | 17.7 | — | — | 17.7 | — | 17.7 | ||||||||||||||||||||||||||||||
Balance at December 31, 2020 | 43,985,178 | $ | 344.8 | 13,307,826 | $ | 0 | $ | 56.9 | $ | 0.1 | $ | (256.6 | ) | $ | (199.6 | ) | $ | 0.1 | $ | (199.5 | ) | |||||||||||||||||||
F-50
HIPPO ENTERPRISES INC. AND SUBSIDIARIES
Consolidated Statements of Cash Flows
(In millions)
Year ended December 31, | ||||||||
2020 | 2019 | |||||||
Cash flows from operating activities: | ||||||||
Net loss | $ | (141.4 | ) | $ | (83.1 | ) | ||
Adjustments to reconcile net loss to net cash used in operating activities: | ||||||||
Depreciation and amortization of property and equipment, intangible assets and capitalized internal use software | 6.7 | 2.9 | ||||||
Share–based compensation expense | 17.2 | 21.6 | ||||||
Change in fair value of preferred stock warrant liabilities | 16.2 | 2.0 | ||||||
Change in fair value of contingent consideration liability | 3.4 | 1.9 | ||||||
Change in fair value of derivative liability on notes | 6.2 | — | ||||||
Other | 1.3 | (0.8 | ) | |||||
Changes in assets and liabilities, net of effect from business acquisitions: | ||||||||
Accounts receivable, net | (14.7 | ) | (1.6 | ) | ||||
Reinsurance recoverable on paid and unpaid losses and LAE | (17.7 | ) | — | |||||
Deferred policy acquisition costs | (0.9 | ) | — | |||||
Ceding commissions receivable | (3.4 | ) | — | |||||
Prepaid reinsurance premiums | 2.5 | — | ||||||
Other assets | (6.9 | ) | (1.7 | ) | ||||
Provision for commission slide and cancellations | 15.3 | 11.2 | ||||||
Fiduciary liabilities | 6.9 | 7.4 | ||||||
Accrued expenses and other liabilities | 4.0 | 11.1 | ||||||
Loss and loss adjustment expense reserves | 11.8 | — | ||||||
Unearned premiums | 18.1 | — | ||||||
Reinsurance premiums payable | 10.0 | — | ||||||
Net cash used in operating activities | (65.4 | ) | (29.1 | ) | ||||
Cash flows from investing activities: | ||||||||
Capitalized internal use software costs | (9.0 | ) | (5.7 | ) | ||||
Purchase of intangible assets | — | (3.7 | ) | |||||
Purchases of property and equipment | (0.4 | ) | (0.9 | ) | ||||
Purchases of investments | (16.7 | ) | (121.2 | ) | ||||
Maturities of investments | 76.8 | 59.8 | ||||||
Sales of investments | 30.7 | — | ||||||
Cash paid for acquisition, net of cash acquired | (83.7 | ) | (0.6 | ) | ||||
Net cash used in investing activities | (2.3 | ) | (72.3 | ) | ||||
Cash flows from financing activities: | ||||||||
Proceeds from Series C preferred stock, net of issuance costs | — | 8.0 | ||||||
Proceeds from Series D preferred stock, net of issuance costs | 4.9 | 95.0 | ||||||
Proceeds from Series E preferred stock, net of issuance costs | 149.7 | — | ||||||
Proceeds from exercise of options | 2.4 | 1.0 | ||||||
Payments of contingent consideration | (3.9 | ) | (2.6 | ) | ||||
Proceeds from promissory notes, net of issuance costs | 365.0 | — | ||||||
Net cash provided by financing activities | 518.1 | 101.4 | ||||||
Net increase in cash, cash equivalents, and restricted cash | 450.4 | 0.0 | ||||||
Cash, cash equivalents, and restricted cash at the beginning of the year | 42.0 | 42.0 | ||||||
Cash, cash equivalents, and restricted cash at the end of the year | $ | 492.4 | $ | 42.0 | ||||
Supplemental disclosures of non-cash financing and investing activities: | ||||||||
Acquisition related contingent consideration | $ | — | $ | 14.9 | ||||
Convertible promissory notes issued for asset acquisition | 12.5 | — | ||||||
Share-based compensation expense capitalized for internal use software | (0.5 | ) | (0.3 | ) | ||||
Purchases of software, accrued but unpaid | (0.4 | ) | — | |||||
F-51
HIPPO ENTERPRISES INC. AND SUBSIDIARIES
Notes to Consolidated Financial Statements
1. Description of Business and Summary of Significant Accounting Policies
Description of Business
Hippo Enterprises Inc., the holding company, was incorporated in January 2019 in Delaware (together with its subsidiaries, the “Company”). On October 3, 2019, the Company completed a corporate
re-organization
(a common control transaction) to improve its overall corporate structure, in which it brought under its control Hippo Analytics Inc., which was incorporated in October 2015 in Delaware, along with Hippo Analytics Inc.’s other subsidiaries.Results of operations for 2019 comprise those of the previously separate entities (the Company and Hippo Analytics Inc. and subsidiaries) combined from the beginning of the period to October 2019 (the date the transaction was completed) and those of the combined operations from October to the end of the period. By eliminating the effects of intra-entity transaction in determining the results of operations for the period before the combination, these results are substantially the same as the results of operations for the period after the date of combination. The Company is headquartered in Palo Alto, California, with its insurance operations headquartered in Austin, Texas. The Company’s goal is to make homes safer and better protected so customers spend less time worrying about the burdens of homeownership and more time enjoying their lives within their homes. Harnessing real-time data, smart home technology, and a growing suite of home services, thereby create a vertically integrated home protection platform.
In January 2020, the Company began assuming insurance risk of policies underwritten by Hippo through a wholly owned Cayman domiciled insurance captive, RH Solutions Ltd. (“RHS”). In August 2020, the Company acquired its largest insurance carrier partner, Spinnaker Insurance Company (“Spinnaker”). Beginning in September, in connection with the acquisition of Spinnaker, the Company also retains portions of direct insurance risk for programs underwritten by third parties. The amount of risk retention is varied across the different programs. The Company retained an average of 10% risk across all programs.
The Company provides personal property insurance brokerage services and underwrites insurance policies. The Company’s subsidiaries are licensed insurance companies and agencies including a licensed insurance program manager, producers, and insurance carriers. As of March 31, 2021, the Company was licensed as an insurance agency in 50 states and the District of Columbia and currently underwrites and distributes policies in 34 states as a managing general agent, and Spinnaker writes commercial and personal lines products and is a licensed property casualty carrier in all 50 states and the District of Columbia. The Company distributes insurance products and services (e.g., claims processing) through its innovative technology platform. The Company offers its policies online, over the phone, or through licensed insurance agents. The insurance products offered through Hippo Analytics Inc. primarily include homeowners’ insurance against risks of fire, wind, and theft.
Basis of Presentation and Consolidation
The consolidated financial statements and accompanying notes of the Company have been prepared in accordance with generally accepted accounting principles in the United States of America (“U.S. GAAP”). The consolidated financial statements include the accounts of the Company and its wholly owned subsidiaries. All intercompany transactions and balances have been eliminated in consolidation.
The Company assesses whether they are the primary beneficiary of a variable interest entity (“VIE”) at the inception of the arrangement and at each reporting date. If the Company is the primary beneficiary, the Company consolidates the VIE and records noncontrolling interest in consolidated financial statements to recognize the minority ownership interest. If the Company is not the primary beneficiary of a VIE, the Company accounts for the investment or other variable interests in a VIE applicable U.S. GAAP.
F-52
HIPPO ENTERPRISES INC. AND SUBSIDIARIES
Notes to Consolidated Financial Statements
Use of Estimates
The preparation of the Company’s consolidated financial statements in conformity with U.S. GAAP requires management to make estimates that affect the reported amounts of assets and liabilities, disclosure of contingent assets and liabilities at the date of the consolidated financial statements, and the reported amounts of revenues and expenses during the reporting periods. Significant items subject to such estimates and assumptions include, but are not limited to, loss and loss adjustment expense (“LAE”) reserves, provision for commission, reinsurance recoverable on paid and unpaid losses and LAE, the fair values of investments, common stock, share-based awards, preferred stock warrant liabilities, contingent consideration liabilities, embedded derivative liabilities, acquired intangible assets and goodwill, deferred tax assets and uncertain tax positions, and revenue recognition. The Company evaluates these estimates on an ongoing basis. These estimates are informed by experience and other assumptions that the Company believes are reasonable under the circumstances. Actual results may differ significantly from these estimates.
Segment Information
The Company’s chief operating decision maker reviews financial information presented on a consolidated basis for purposes of allocating resources and evaluating financial performance. As such, the Company has a single operating and reportable segment structure. All the Company’s long-lived assets are in the United States.
Cash, Cash Equivalents, and Restricted Cash
Cash consists of cash on deposit. The Company considers all highly liquid securities readily convertible to cash, that mature within three months or less from the original date of purchase to be cash equivalents. The Company’s restricted cash relates to cash restricted to support issued letter of credits and collateral to insurers. The Company’s restricted cash also includes fiduciary assets.
Fiduciary Assets and Liabilities
In its capacity as an insurance agent and broker, the Company collects premiums from insureds and, after deducting its commission, remits the premiums to the respective insurers. The Company also processes claims on behalf of insurers and collects claims from insurers on behalf of insureds. Premiums collected from insureds but not yet remitted to insurance companies and claims collected from insurance companies but not yet remitted to insureds are fiduciary assets. Fiduciary assets are recorded within restricted cash in the Company’s consolidated balance sheets. Unremitted insurance premiums and claims are held in a fiduciary capacity and the obligation to remit these funds is recorded as fiduciary liabilities in the consolidated balance sheets.
Investments
The Company has categorized its investment portfolio asand has reported the portfolio at fair value, adjusted for other-than-temporary declines in fair value, with unrealized gains and losses, net of tax, reported as an amount in other comprehensive loss. Fair values are based on quoted market prices or dealer quotes, if available. If a quoted market price is not available, fair value is estimated using quoted market prices for similar securities. Amortization of premium and accretion of discount are computed using the scientific method (constant yield to worst). Realized gains and losses are determined using specific identification method and included in the determination of income. Net investment income includes interest and dividend income, amortization and accretion of investment premiums and discounts, respectively, realized gains and losses on sales of securities, and other-than-temporary declines in the fair value of securities, if any. The cost of securities sold is based on the specific identification method.
available-for-sale
F-53
HIPPO ENTERPRISES INC. AND SUBSIDIARIES
Notes to Consolidated Financial Statements
The Company regularly reviews all the investments for other-than-temporary declines in fair value. The review includes the consideration of the cause of the impairment, including the creditworthiness of the security issuers, the number of securities in an unrealized loss position, the severity and duration of the unrealized losses, whether the Company has the intent to sell the securities, and whether it is more likely than not the Company will be required to sell the securities before the recovery of their amortized cost basis. When the Company determines that the decline in fair value of an investment is below the accounting basis and the decline is other-than-temporary, it reduces the carrying value of the security and records a loss for the amount of such decline in net investment income in the consolidated statements of operations and comprehensive loss.
Fair Value of Financial Instruments
The Company applies fair value accounting for all financial assets and liabilities and
non-financial
assets and liabilities that are recognized or disclosed at fair value in the consolidated financial statements on a recurring basis. The Company defines fair value as the price that would be received from selling an asset or paid to transfer a liability in an orderly transaction between market participants at the measurement date. When determining the fair value measurements for assets and liabilities, which are required to be recorded at fair value, the Company considers the principal or most advantageous market in which the Company would transact and the market-based risk measurements or assumptions that market participants would use in pricing the asset or liability, such as risks inherent in valuation techniques, transfer restrictions, and credit risk. Fair value is estimated by applying the following hierarchy, which prioritizes the inputs used to measure fair value into three levels and bases the categorization within the hierarchy upon the lowest level of input that is available and significant to the fair value measurement:| • | Level 1 — Quoted prices in active markets for identical assets or liabilities that are publicly accessible at the measurement date. |
| • | Level 2 — Observable inputs other than quoted prices in active markets for identical assets and liabilities, quoted prices for identical or similar assets or liabilities in inactive markets, or other inputs that are observable or can be corroborated by observable market data for substantially the full term of the assets or liabilities. |
| • | Level 3 — Inputs that are generally unobservable and typically reflect management’s estimate of assumptions that market participants would use in pricing the asset or liability. |
The Company’s financial instruments include cash equivalents, restricted cash, fixed maturities, short-term investments, accounts receivable, accounts payable, assumed and ceded reinsurance contracts and preferred stock warrants. Cash equivalents and restricted cash are principally stated at amortized cost, which approximates their fair value. Short-term investments and preferred stock warrants are reported at fair value. The recorded carrying amount of accounts receivable, assumed and ceded reinsurance contracts, and accounts payable approximates their fair value due to their short-term nature.
Concentration of Credit Risks
Financial instruments that potentially subject the Company to concentrations of credit risk are primarily comprised of cash and cash equivalents, short-term investments, fixed maturitiesand reinsurance recoverables. Cash deposits may, at times, exceed amounts insured by the Federal Deposit Insurance Corporation and the Securities Investor Protection Corporation. However, its exposure to credit risk in the event of default by the financial institutions is limited to the extent of amounts recorded on the balance sheet. The Company performs evaluations of the relative credit standing of these financial institutions to limit the amount of credit exposure. The Company has not experienced any losses on its deposits of cash and cash equivalents to date. The Company limits its exposure to credit losses by investing in money market funds, U.S. government
available-for-sale,
F-54
HIPPO ENTERPRISES INC. AND SUBSIDIARIES
Notes to Consolidated Financial Statements
securities, or securities with average credit quality of
AA-
or better. Premium receivables are a mix of receivables due from policyholders, agents, and program administrators. The Company has no significantoff-balance-sheet
concentration of credit risks such as foreign exchange contracts, option contracts, or other foreign hedging arrangements.The Company enters into quota share and excess of loss contracts which may be susceptible to catastrophe exposure. The ceding of insurance does not legally discharge the Company from its primary liability for the full amount of the policy coverage, and therefore the Company will be required to pay the loss and bear collection risk if the reinsurer fails to meet its obligations under the reinsurance agreement. To minimize exposure to significant losses from reinsurance insolvencies, the Company evaluates the financial condition of its reinsurers, monitors concentrations of credit risk and, in certain circumstances, holds substantial collateral (in the form of funds withheld and letters of credit) as security under the reinsurance agreements.
Accounts Receivable
Accounts receivable consists of premium receivables and commission receivables and is reported net of an allowance for premium amounts or estimated uncollectible commission. Such allowance is based upon an ongoing review of amounts outstanding, length of collection periods, the creditworthiness of the insured and other relevant factors. Amounts deemed to be uncollectible are written off against the allowance. At December 31, 2020 and 2019, the Company has established an allowance of $0.5 million and $0.0 million, respectively. Write-offs of receivables have not been material to the Company during the years ended December 31, 2020 and 2019.
Reinsurance
Reinsurance recoverable, including amounts related to incurred but not reported claims (“IBNR”), represent paid losses and LAE and reserves for unpaid losses and LAE ceded to reinsurers that are subject to reimbursement under reinsurance treaties. To minimize exposure to losses related to a reinsurer’s inability to pay, the financial condition of such reinsurer is evaluated initially upon placement of the reinsurance and periodically thereafter. In addition to considering the financial condition of a reinsurer, the collectability of the reinsurance recoverable is evaluated based upon a number of other factors. Such factors include the amounts outstanding, length of collection periods, disputes, any collateral or letters of credit held and other relevant factors. To the extent that an allowance for uncollectible reinsurance recoverable is established, amounts deemed to be uncollectible would be written off against the allowance for estimated uncollectible reinsurance recoverable. The Company currently has no allowance for uncollectible reinsurance recoverable.
Ceded premium written is recorded in accordance with the applicable terms of the reinsurance contracts and ceded premium earned is charged against revenue over the period of the reinsurance contracts. Ceded losses incurred reduce net loss and LAE incurred over the applicable periods of the reinsurance contracts with third-party reinsurers.
Amounts recoverable from reinsurers are estimated in a manner consistent with the liability associated with the reinsured business and consistent with the terms of the underlying contract.
Deferred Policy Acquisition Costs, net of Ceding Commissions
Incremental direct costs of acquiring insurance contracts and certain costs related directly to the acquisition process are deferred and amortized over the term of the policies or reinsurance treaties to which they relate. Those costs include commissions, premium taxes, and board and bureau fees. Ceding commissions relating to
F-55
HIPPO ENTERPRISES INC. AND SUBSIDIARIES
Notes to Consolidated Financial Statements
reinsurance agreements are recorded as a reimbursement for both deferrable and
non-deferrable
acquisition costs. The portion of the ceding commission that is equal to thepro-rata
share of acquisition costs based on quota share percentage is recorded as an offset to the direct deferred acquisition costs. Any portion of the ceding commission that exceeds the deferable acquisition costs of the business ceded is recorded as a deferred liability and amortized over the same period in which the related premiums are earned. The amortization of deferred policy acquisition costs is included in insurance related expenses on the consolidated statements of operations and comprehensive loss.Premium Deficiency
A premium deficiency is recognized if the sum of expected losses and LAE, unamortized acquisition costs, and policy maintenance costs exceeds the remaining unearned premiums. A premium deficiency would first be recognized by charging any unamortized acquisition costs to expense to the extent required to eliminate the deficiency. If the premium deficiency was greater than unamortized acquisition costs, a liability would be accrued for the excess deficiency. The Company does not consider anticipated investment income when determining if a premium deficiency exists. There was 0 premium deficiency at December 31, 2020 or 2019.
Property and Equipment
Property and equipment is stated at cost, net of accumulated depreciation. Depreciation of property and equipment is calculated using the straight-line method over the estimated useful life of three years for furniture, fixtures, and equipment and two years for computer equipment. Leasehold improvements are also depreciated using the straight-line method and are amortized over the shorter of the remaining term of the lease or the useful life of the improvement. Depreciation expense totaled $0.4 million and $0.2 million for the years ended December 31, 2020 and 2019, respectively.
Expenditures for improvements are capitalized, and expenditures for maintenance and repairs are expensed as incurred. Upon sale or retirement, the cost and related accumulated depreciation is removed from the related accounts, and the resulting gain or loss, if any, is reflected in interest and other expense in the consolidated statements of operations and comprehensive loss.
Capitalized Internal Use Software
The Company capitalizes the costs to develop its internal use software when preliminary development efforts are successfully completed, management has authorized and committed project funding, it is probable that the project will be completed, and the software will be used as intended. Such costs are amortized on a straight-line basis over the estimated useful life of five years. Costs incurred prior to meeting these criteria, in addition to costs incurred for training and maintenance, are expensed as incurred.
Goodwill and Intangible Assets
The Company accounts for business combinations using the acquisition method of accounting, which requires that assets acquired and liabilities assumed be recorded at their fair values as of the acquisition date on the consolidated balance sheets. Any excess of purchase price over the fair value of net assets acquired is recorded as goodwill. The determination of estimated fair value requires the Company to make significant estimates and assumptions. As a result, the Company has up to one year to finalize its estimates of fair value, any changes of which would be offset against previously recorded goodwill. Transaction costs associated with business combinations are expensed as they are incurred.
Included in the purchase price of an acquisition may be an estimation of the fair value of liabilities associated with contingent consideration. The fair value of contingent consideration is based upon the present value of the
F-56
HIPPO ENTERPRISES INC. AND SUBSIDIARIES
Notes to Consolidated Financial Statements
expected future payments to be made to the sellers of an acquired business in accordance with the provisions contained in the respective purchase agreement(s). Subsequent changes in the fair value of contingent consideration are recorded in the consolidated statements of operations and comprehensive loss.
When the Company determines net assets acquired does not meet the definition of a business combination under the acquisition method of accounting, the transaction is accounted for as an acquisition of assets and, therefore, no goodwill is recorded.
Amortization and Impairment
Intangible assets with finite useful lives are amortized over their estimated useful lives in the consolidated statements of operations and comprehensive loss.
Indefinite-lived intangible assets and goodwill are not amortized but are tested for impairment annually, or more frequently if necessary. The goodwill impairment test is performed at the reporting unit level. The Company may initially perform a qualitative analysis to determine if it is more likely than not that the goodwill balance is impaired. If a qualitative assessment is not performed or if a determination is made that it is not more likely than not that the value of the respective reporting unit exceeds its carrying amount, then the Company will perform a
two-step
quantitative analysis. First, the fair value of each reporting unit is compared to its carrying value. If the fair value of the reporting unit is less than its carrying value, the Company performs a hypothetical purchase price allocation based on the reporting unit’s fair value to determine the fair value of the reporting unit’s goodwill. Any resulting difference will be a charge to operations in the consolidated statements of operations and comprehensive loss in the period in which the determination is made. Fair value is determined using a combination of present value techniques and market prices of comparable businesses. Indefinite-lived intangible assets are tested for impairment by comparing the estimated fair value of the asset to the asset’s carrying value. If the carrying value of the asset exceeds its estimated fair value, an impairment loss is recognized, and the asset is written down to its estimated fair value. There wereno
material impairment losses recognized on indefinite-lived intangible assets or goodwill during the years ended December 31, 2020 and 2019.The Company evaluates the recoverability of long-lived assets, excluding goodwill and indefinite-lived intangible assets, whenever events or changes in circumstances indicate the carrying value of such asset may not be recoverable. Should there be an indication of impairment, the Company tests for recoverability by comparing the estimated undiscounted future cash flows expected to result from the use of the asset to the carrying amount of the asset or asset group. If the asset or asset group is determined to be impaired, any excess of the carrying value of the asset or asset group over its estimated fair value is recognized as an impairment loss. There were no material impairment losses recognized on long-lived assets during the years ended December 31, 2020 and 2019.
Loss and Loss Adjustment Expense Reserve
Recorded loss and loss adjustment expense reserve represents the Company’s best estimate of the amounts yet to be paid for all loss and loss adjustment expenses that will be paid on claims that occurred during the period and prior, whether those claims are currently known or unknown. The Company’s carriers are required to estimate and hold a provision for the carriers’ loss and loss adjustment expense reserve as of a given date.
Loss and loss adjustment reserves at December 31, 2020 are the amount of ultimate loss and loss adjustment expense less the paid amounts as of December 31, 2020.
Ultimate loss and loss adjustment expense for an accident period is the sum of the following items:
| 1- | Loss and loss adjustment expense paid for an accident period as of a given evaluation date |
F-57
HIPPO ENTERPRISES INC. AND SUBSIDIARIES
Notes to Consolidated Financial Statements
| 2- | Case reserves for loss and loss adjustment expense for losses for an accident period that have been reported but not yet paid as of a given evaluation date |
| 3- | IBNR amounts for loss and loss adjustment expense for an accident period are the costs of events or conditions that have not been reported to, or specifically identified by the Company, as of a given date, but have occurred during the period. |
Case reserves are established within the claims adjustment process based on all known circumstances of a claim at the time. In addition, IBNR reserves are established by the Company based on reported Loss and Loss Adjustment Expenses and actuarially determined estimates of ultimate Loss and Loss Adjustment Expenses.
The Company’s loss and loss adjustment expense reserve amounts are reviewed quarterly, and adjustments, if any, are reflected in current operations in the consolidated statements of operations and comprehensive loss in the period in which they become known. The establishment of new loss and loss adjustment expense reserves or the adjustment of previously recorded loss and loss adjustment expense reserves could result in significant positive or negative changes to our financial condition for any particular period. While the Company believes that it has made a reasonable estimate of loss and loss adjustment expense reserves, the ultimate loss experience may not be as reliably predicted as may be the case with other insurance expenses, and it is possible that actual Loss and Loss Adjustment Expenses will be higher or lower than the loss and loss adjustment reserve amount recorded by the Company.
Provision for Commission
Provision for commission includes return commission payable to insurers based on the actual performance of insurance policies issued by the Company against a contractual range of performance targets. The Company’s reserve estimation is based on current and historical performance of the portfolio of insurance policies placed with the insurance carriers.
Provision for commission also includes cancellation reserve which represent the Company’s estimate of return commission payable to insureds based on policy cancellations after the effective date. The Company’s estimation for the reserve uses historical policy cancellation.
The commission slide and cancellation liabilities are based on assumptions and estimates, and while management believes the amount recorded is the Company’s best estimate, the ultimate liability may differ from the amount recorded. The methods for making such estimates and for establishing the resulting liability are continually reviewed, and any adjustments are reflected in the period in which they become known.
Leases
The Company categorizes leases at their inception as either operating or capital leases. As of and for the years ended December 31, 2020 and 2019, the Company’s leases are categorized as operating. In certain lease agreements, the Company may receive rent holidays and other incentives. For operating leases, the Company recognizes lease costs on a straight-line basis once control of the space is achieved, without regard to deferred payment terms such as rent holidays that defer the commencement date of required payments. Additionally, incentives received are treated as a reduction of costs over the term of the agreement.
Revenue Recognition
Net Earned Premium
Net earned premium represents the earned portion of the Company’s gross written premium for insurance policies written or assumed by the Company and less ceded written premium (any portion of the Company’s
F-58
HIPPO ENTERPRISES INC. AND SUBSIDIARIES
Notes to Consolidated Financial Statements
gross written premium that is ceded to third-party reinsurers under the Company’s reinsurance agreements). The Company earns written premiums on a
pro-rata
basis over the term of the policies.Commission Income, net includes
| 1. | Managing General Agent (“MGA”) Commission: The Company operates as a MGA for multiple insurers. The Company designs and underwrites insurance products on behalf of the insurers culminating in the sale of insurance policies. The Company earns recurring commission and policy fees associated with the policies, they sell. While the Company has underwriting authority and responsibility for administering claims, the Company does not take the risk associated with policies on the consolidated balance sheets. Rather, the Company works with carrier platforms and a diversified panel of highly rated reinsurance companies who pay the Company commission in exchange for the opportunity to take that risk on their balance sheets. The Company’s performance obligation associated with these contracts is the placement of the policy, which is met on the effective data. Upon issuance of a new policy, the Company charge policy fees and inspection fees, retain the share of ceding commission, and remit the balance premium to the respective insurers. Subsequent ceding commission adjustments arising from policy changes such as endorsements, are recognized when the adjustments can be reasonably estimated. |
| 2. | Agency Commission: The Company also operate licensed insurance agencies that are engaged solely in the sale of policies, including non-Hippo policies. For these policies, the Company earns a recurring agency commission from the carriers whose policies the Company sells, which is recorded in the commission income, net line in the consolidated statements of operations and comprehensive loss. Similar to the MGA business, the performance obligation from the agency contracts is the placement of the insurance policies. For both MGA and insurance agency activities, the Company recognizes commission received from insurers for the sale of insurance contracts as revenue at a point in time on the policy effective dates. |
| 3. | Ceding Commission: The Company receives revenue based on the premium they cede to third-party reinsurers for the compensation reimbursement for the Company’s acquisition and underwriting services. Excess of ceding commission over the cost of acquisition and underwriting expenses is included in commission income, net line on the consolidated statements of operations and comprehensive loss. For the policies that the Company write on their own carrier as MGA, the Company recognizes the commission as ceding commission on the consolidated statements of operations and comprehensive loss. The Company earns commission on reinsurance premium ceded in a matter consistent with the recognition of the earned premium on the underlying insurance policies, on a pro-rata basis over the terms of the policies reinsured. The Company records the portion of ceding commission income which represents reimbursement of successful direct acquisition costs related to the underlying policies as an offset to the applicable direct acquisition costs. |
| 4. | Carrier Fronting Fees: Through the Company’s insurance-as-a-service pro-rata basis over the terms of the policies. This revenue is included in the commission income, net line on the consolidated statements of operations and comprehensive loss. |
| 5. | Claim Processing Fees: As a MGA the Company receives a fee, that is calculated as a percent of the premium, from the insurers in exchange for providing claims adjudication services. The Claims adjudication services are provided over the term of the policy and recognized ratably over the same period. |
Service and Fee Income
Service and fee income mainly represent policy fees and small portion of other revenue. The Company directly bill policyholders for policy fees and collect and retain fees per the terms of the contracts between the Company
F-59
HIPPO ENTERPRISES INC. AND SUBSIDIARIES
Notes to Consolidated Financial Statements
and our insurers. Similar to the commission revenue, the Company estimates a cancellation reserve for policy fees using historical information. The performance obligation associated with these fees is satisfied at a point in time upon completion of the underwriting process, which is the policy effective date. Accordingly, the Company recognizes all fees as revenue on the policy effective date.
Disaggregated Revenue
The following table disaggregates the Company’s revenues by major source (in millions):
Year Ended December 31, | ||||||||
2020 | 2019 | |||||||
Net earned premium | $ | 17.1 | $ | — | ||||
MGA commissions, net | 12.4 | 20.1 | ||||||
Agency commissions, net | 10.0 | 6.6 | ||||||
Policy fees | 4.3 | 2.8 | ||||||
Claims processing fees | 4.7 | 2.2 | ||||||
Other revenue | 2.0 | 0.8 | ||||||
Net investment income | 1.1 | 2.2 | ||||||
Total revenue, net | $ | 51.6 | $ | 34.7 | ||||
All revenues for the years ended December 31, 2020 and 2019 are from business conducted in the United States.
Insurance Related Expenses
Insurance related expenses primarily consist of amortization of commissions costs and deferred acquisition costs, and credit card processing fees not charged to the Company’s customers. Insurance related expenses also include employee compensation, including stock-based compensation and benefits, of our underwriting teams as well as allocated occupancy costs and related overhead based on headcount, and amortization of capitalized internal use software costs. Insurance related expenses are offset by the portion of ceding commission income which represents reimbursement of successful acquisition costs related to the underlying policies. Additionally, insurance related expenses are comprised of the costs of providing bound policies and delivering claims services to the Company’s customers. These costs include technology service costs including software, data services, and third-party call center costs in addition to personnel-related costs.
Technology and Development
Technology and development expenses primarily consist of employee compensation, including stock-based compensation and benefits for the Company’s technology staff, which includes information technology development, infrastructure support, actuarial, and third-party services. Technology and development also includes allocated facility costs and related overhead based on headcount.
Sales and Marketing
Sales and marketing expenses primarily consist of sales commissions expense for policies placed on third-party carriers by us as a managing general agent, advertising costs, and marketing expenditures as well as employee compensation, including stock-based compensation and benefits for employees engaged in sales, marketing, data analytics, and consumer acquisition functions. The Company expenses advertising costs as incurred. Advertising expenses were $11.8 million and $22.8 million for the years ended December 31, 2020 and 2019, respectively.
F-60
HIPPO ENTERPRISES INC. AND SUBSIDIARIES
Notes to Consolidated Financial Statements
General and Administrative
General and administrative expenses primarily consist of employee compensation, including stock-based compensation and benefits for the Company’s finance, human resources, legal, and general management functions as well as facilities and professional services.
Interest and Other Expense
Interest and other expense primarily consist of interest expense incurred for the convertible promissory notes, and fair value adjustments on preferred stock warrant liabilities and embedded derivative liability on convertible promissory notes.
Share-Based Compensation Expense
The Company recognizes share-based compensation expense based on the estimated fair value of equity-based payment awards on the date of grant using the Black-Scholes-Merton option-pricing model. The Company recognizes share-based compensation expenses for the value of its awards granted based on the straight-line method over the requisite service period of each of the awards in the Company’s consolidated statements of operations and comprehensive loss. The Company has elected to record forfeitures as they occur.
Certain employees early exercised stock options in exchange for promissory notes. The Company has accounted for the promissory notes as nonrecourse in their entirety since the promissory notes are not aligned with a corresponding percentage of the underlying shares. The fair value of the stock option is recognized over the requisite service period through a charge to share-based compensation expenses. The maturity date of the promissory notes reflects the legal term of the stock option for purposes of valuing the award.
Income Taxes
The Company accounts for income taxes using the asset and liability method, under which deferred tax liabilities and assets are recognized for the expected future tax consequences of temporary differences between consolidated financial statement carrying amounts and the tax basis of assets and liabilities and net operating loss and tax credit carryforwards. Valuation allowances are established when necessary to reduce deferred tax assets to the amount expected to be realized. The effect on deferred taxes of a change in tax rate is recognized in income in the period that includes the enactment date.
The Company determines whether it is more likely than not that a tax position will be sustained upon examination. If it is not more likely than not that a position will be sustained, no amount of benefit attributable to the position is recognized. The tax benefit to be recognized of any tax position that meets the more likely than not recognition threshold is calculated as the largest amount that is more than 50% likely of being realized upon resolution of the contingency.
Net Loss Per Share Attributable to Common Stockholders of Hippo Enterprises Inc.
Basic and diluted net loss per share attributable to common stockholders of Hippo Enterprises Inc. is presented in conformity with the
two-class method
required for common stock and participating securities. Under thetwo-class method,
net loss is attributed to common stockholders and participating securities based on their participation rights. The Company considers all series of its convertible preferred stock and unvested common stock, which includes early exercised stock options and restricted stock awards (“RSAs”), to be participating securities as holders of such securities havenon-forfeitable
dividend rights in the event of the Company’s declaration of a dividend for shares of common stock.F-61
HIPPO ENTERPRISES INC. AND SUBSIDIARIES
Notes to Consolidated Financial Statements
Under the
two-class method,
the net loss attributable to common stockholders of Hippo Enterprises Inc. is not allocated to the convertible preferred stock and unvested common stock as these securities do not have a contractual obligation to share in the Company’s losses.Distributed and undistributed earnings allocated to participating securities are subtracted from net loss in determining net loss attributable to common stockholders. Under the
two-class method,
basic net loss per share attributable to common stockholders is computed by dividing the net loss attributable to common stockholders by the weighted-average shares used in computing net loss per share attributable to common stockholders.For periods in which the Company reports net losses, diluted net loss per share attributable to common stockholders is the same as basic net loss per share attributable to common stockholders because potentially dilutive common shares are not assumed to have been issued if their effect is anti-dilutive.
Related Party
In February 2020, Comcast Neptune, LLC assumed the Master Services Agreement between Loop Labs, Inc. d/b/a Notion and the Company. Comcast Neptune, LLC and its affiliated funds is a beneficial owner of more than 5% of our outstanding capital stock. The Company incurred a total of $3.2 million of expenses during the year ended December 31, 2020 related to this services agreement.
In December 2020, we acquired First Connect Insurance Services, a wholesale P&C insurance provider for independent agents interested in gaining access to the advanced quoting platforms that are provided by InsurTech companies. One of our executive officers, Richard McCathron, was the President and Chief Executive Officer of First Connect Insurance services from 2012 to 2017 and owned greater than 10% of First Connect Insurance Services prior to the time of the transaction. The Company paid Mr. McCathron $6.4 million for his equity interests in First Connect Insurance Services prior to the transaction. The Company also entered into an agency aggregator agreement with First Connect. The Company incurred a total of $9.9 million and $7.2 million of expenses during the year ended December 31, 2020 and 2019 respectively, related to this agreement.
In October 2020, Hippo entered into a Master Services Agreement with Forecast Labs, LLC, which operates a startup studio for Comcast Ventures, LP, which provides accelerator and incubator services to select portfolio companies of Comcast Ventures. Comcast Ventures and its affiliated funds are beneficial owners of more than 5% of outstanding Hippo capital stock. Hippo incurred a total of $2.2 million of expenses during the years ended December 31, 2020 and 2019 related to this agreement.
On April 15, 2019, the Company closed on an acquisition agreement with CalAtlantic Title Group, LLC to purchase 100% of the equity interests in North American Advantage Insurance Services, LLC (“NAAIS”), which provides insurance services to homebuilder customers. The seller’s ultimate parent is an investor in the Company that participated in the Company’s Series C and Series D financing. See Note 18 for additional information of the acquisition.
In February 2019, we entered into an Accelerate Agreement with Comcast Ventures, LLC. Comcast Ventures, LLC and its affiliated funds are beneficial owners of more than 5% of our outstanding capital stock. The Company incurred over $120,000 of expenses during the years ended December 31, 2020 and 2019 related to this services agreement.
In February 2018, we entered into a
Co-Marketing
Program Agreement with Comcast Warranty and Home Insurance Agency, LLC. Comcast Warranty and Home Insurance, LLC and its affiliated funds are beneficial owners of more than 5% of our outstanding capital stock. The Company incurred a total of $500,000 of expenses during the years ended December 31, 2020, 2019 and 2018 related to this program agreement.F-62
HIPPO ENTERPRISES INC. AND SUBSIDIARIES
Notes to Consolidated Financial Statements
Recent Accounting Pronouncements
Emerging Growth Company
Section 102(b)(1) of the Jumpstart Our Business Startups Act of 2012 (the “JOBS Act”) exempts emerging growth companies from being required to comply with new or revised financial accounting standards until private companies (that is, those that have not had a Securities Act registration statement declared effective or do not have a class of securities registered under the Exchange Act) are required to comply with the new or revised financial accounting standards. The JOBS Act provides that an emerging growth company can elect to opt out of the extended transition period and comply with the requirements that apply to
non-emerging
growth companies but any such election to opt out is irrevocable. This opt out election is applied individually to each standard. The Company has elected not to opt out of such extended transition period, which means that when a standard is issued or revised, and it has different application dates for public or private companies, the Company, as an emerging growth company, can adopt the new or revised standard at the time private companies adopt the new or revised standard. In certain cases, as indicated below, management has exercised the opt out election when it determines it is preferable to take advantage of early adoption provisions offered within the applicable guidance.This may make comparison of the Company’s consolidated financial statements with another public company that is neither an emerging growth company nor an emerging growth company that has opted out of using the extended transition period difficult or impossible because of the potential differences in accounting standards used.
Accounting Pronouncements Recently Adopted
In May 2014, the Financial Accounting Standards Board (“FASB”) issued Accounting Standards Update (“ASU”)(“Topic 606”), requiring an entity to recognize revenue relating to contracts with customers that depicts the transfer of promised goods or services to customers in an amount reflecting the consideration to which the entity expects to be entitled in exchange for such goods or services. In order to meet this requirement, the entity must apply the following steps: (i) identify the contracts with the customers; (ii) identify performance obligations in the contracts; (iii) determine the transaction price; (iv) allocate the transaction price to the performance obligations per the contracts; and (v) recognize revenue when (or as) the entity satisfies a performance obligation. Additionally, disclosures required for revenue recognition include qualitative and quantitative information about contracts with customers, significant judgments and changes in judgments, and assets recognized from costs to obtain or fulfill a contract. The Company adopted Topic 606 as of January 1, 2019, using the full retrospective method to restate each prior reporting period presented.
2014-09,
Revenue from Contracts with Customers
In January 2016, the FASB issued ASU(“ASUdebt securities in combination with other deferred tax assets. The Company adopted the standard and all related amendments prospectively, effective January 1, 2019. The adoption of ASU
No. 2016-01
Financial Instruments, Overall, Recognition and Measurement of Financial Assets and Financial Liabilities
2016-01”).
ASU2016-01
affected the recognition, measurement, presentation, and disclosure of financial instruments. The guidance requires equity investments to be measured at fair value with changes in fair value recognized through net income (other than those accounted for under the equity method of accounting or those that result in consolidation of the investee) and an assessment of a valuation allowance on deferred tax assets related to unrealized losses ofavailable-for-sale
2016-01
did not have a material impact on the financial condition and results of operations of the Company.In January 2017, the FASB issued ASU(“ASU
No. 2017-01,
Business Combinations (Topic 805): Clarifying the Definition of a Business
2017-01”).
ASU2017-01
changes the criteria for determining whether a group of assets acquired is a business. Specifically, when substantially all of the fair value of the gross assets acquired is concentrated in a single identifiable asset or group of similar identifiable assets, the assets acquired would not be considered a business. The Company adopted ASU2017-01
as of January 1, 2019 on a prospective basis and, accordingly, this guidance will only affect the Company’s analysis of the accounting for any future acquisitions occurring after the date of adoption.F-63
HIPPO ENTERPRISES INC. AND SUBSIDIARIES
Notes to Consolidated Financial Statements
Accounting Pronouncements Not Yet Adopted
In February 2016, the FASB issued ASU No.(“ASU ASUrepresenting its right to use the underlying asset for the lease term. This ASU is effective for public and private companies’ fiscal years beginning after December 15, 2018, and December 15, 2021, respectively, with early adoption permitted. The Company expects to adopt ASU
2016-02,
Leases (Topic 842)
2016-02”)
.
2016-02
requires a lessee to recognize in the consolidated balance sheet a liability to make lease payments (the lease liability) and aright-to-use asset
2016-02 under
the private company transition guidance beginning January 1, 2022 and is currently evaluating the impact on the Company’s consolidated financial statements.In June 2016, the FASB issued ASU No.(“ASU
2016-13,
Financial instruments — Credit Losses (Topic 326): Measurement of Credit Losses on Financial Instruments
2016-13”),
and subsequent related ASUs, which amends the guidance on the impairment of financial instruments by requiring measurement and recognition of expected credit losses for financial assets held. ASU2016-13
is effective for public and private companies’ fiscal years, and for interim periods within those fiscal years, beginning after December 15, 2019, and December 15, 2022, respectively. The Company expects to adopt ASU2016-13 under
the private company transition guidance beginning January 1, 2023 and is currently evaluating the impact on the Company’s consolidated financial statements.In August 2018, the FASB issued ASU No. (“ASU
2018-15,
Intangibles — Goodwill and Other — Internal Use
Software (Subtopic
350-40):
Customer’s Accounting for Implementation Costs Incurred in a Cloud Computing Arrangement That Is a Service Contract2018-15”).
The intent of this pronouncement is to align the requirements for capitalizing implementation costs incurred in a cloud computing arrangement that is a service contract with the requirements for capitalizing implementation costs incurred to develop or obtain internal use software as defined in ASC350-40.
Under ASU2018-15,
the capitalized implementation costs related to a cloud computing arrangement will be amortized over the term of the arrangement and all capitalized implementation amounts will be required to be presented in the same line items of the consolidated financial statements as the related hosting fees. ASU2018-15 is
effective for public and private companies’ fiscal years beginning after December 15, 2019, and December 15, 2020, respectively, and interim periods within those fiscal years, with early adoption permitted. The Company expects to adopt ASU2018-15 under
the private company transition guidance beginning January 1, 2021 and is currently evaluating the impact on the Company’s consolidated financial statements.In December 2019, the FASB issued ASU No. (“ASU
2019-12,
Income Taxes (Topic 740): Simplifying the Accounting for Income Taxes
2019-12”).
ASU2019-12 removes
certain exceptions to the general principles in Topic 740 and clarifies and amends existing guidance to improve consistent application. ASU2019-12 will
be effective for public entities for interim and annual periods beginning after December 15, 2020, with early adoption permitted. ASU2019-12 will
be effective for private entities for annual periods beginning after December 15, 2021, and interim periods beginning after December 15, 2020, with early adoption permitted. The Company expects to adopt ASU2019-12 under
the private company transition guidance beginning January 1, 2022 and is currently assessing the impact the guidance will have on the Company’s consolidated financial statements.In August 2020, the FASB issued ASU(“ASU
No. 2020-06,
Debt—Debt with Conversion and Other Options (Subtopic
470-20)
and Derivatives and Hedging—Contracts in Entity’s Own Equity (Subtopic815-40):
Accounting for Convertible Instruments and Contracts in an Entity’s Own Equity2020-06”),
which simplifies the accounting for convertible instruments by reducing the number of accounting models available for convertible debt instruments. This guidance also eliminates the treasury stock method to calculate diluted earnings per share for convertible instruments and requires the use of theif-converted
method. ASU2020-06
is effective for public and private companies’ fiscal years beginning after December 15, 2021, and December 15, 2023, respectively, and interim periods within those fiscal years. Early adoption is permitted, but no earlier than fiscal years beginning after December 15, 2020, including interim periods within those fiscal years. The Company is currently evaluating the timing of adoption and the impact on the consolidated financial statements.F-64
HIPPO ENTERPRISES INC. AND SUBSIDIARIES
Notes to Consolidated Financial Statements
2. Investments
The amortized cost and fair value of fixed maturities securities and short-term investments are as follows (in millions):
As of December 31, 2020 | ||||||||||||||||
Amortized Cost | Unrealized Gains | Unrealized Losses | Fair Value | |||||||||||||
Fixed maturities available-for-sale: | ||||||||||||||||
U.S. government and agencies | $ | 9.5 | $ | 0 | $ | 0 | $ | 9.5 | ||||||||
All other government | 0.6 | 0 | 0 | 0.6 | ||||||||||||
States, and other territories | 5.1 | 0 | 0 | 5.1 | ||||||||||||
Corporate securities | 17.4 | 0 | 0 | 17.4 | ||||||||||||
Foreign securities | 0.8 | 0 | 0 | 0.8 | ||||||||||||
Residential mortgage-backed securities | 12.9 | 0 | 0 | 12.9 | ||||||||||||
Commercial mortgage-backed securities | 5.4 | 0.1 | 0 | 5.5 | ||||||||||||
Asset backed securities | 4.2 | 0 | 0 | 4.2 | ||||||||||||
Total | $ | 55.9 | $ | 0.1 | $ | 0 | $ | 56.0 | ||||||||
As of December 31, 2019 | ||||||||||||||||
Amortized Cost | Unrealized Gains | Unrealized Losses | Fair Value | |||||||||||||
Short-term investments: | ||||||||||||||||
U.S. government securities | $ | 96.4 | $ | 0.1 | $ | 0 | $ | 96.5 | ||||||||
Total | $ | 96.4 | $ | 0.1 | $ | 0 | $ | 96.5 | ||||||||
As of December 31, 2020, 0 securities have been in a continuous unrealized loss position. There were 0 other-than-temporary impairments recognized for the years ended December 31, 2020 and 2019.
The amortized cost and fair value of fixed maturities securities and short-term investments by contractual maturity are as follows (in millions):
As of December 31, 2020 | ||||||||
Amortized Cost | Fair Value | |||||||
Due to mature: | ||||||||
One year or less | $ | 6.4 | $ | 6.4 | ||||
After one year through five years | 21.5 | 21.5 | ||||||
After five years | 5.4 | 5.4 | ||||||
After ten years | 0.1 | 0.1 | ||||||
Residential mortgage-backed securities | 12.9 | 12.9 | ||||||
Commercial mortgage-backed securities | 5.4 | 5.5 | ||||||
Asset backed securities | 4.2 | 4.2 | ||||||
Total fixed maturities available-for-sale | $ | 55.9 | $ | 56.0 | ||||
F-65
HIPPO ENTERPRISES INC. AND SUBSIDIARIES
Notes to Consolidated Financial Statements
As of December 31, 2019 | ||||||||
Amortized Cost | Fair Value | |||||||
Due to mature: | ||||||||
One year or less | $ | 96.4 | $ | 96.5 | ||||
Total short-term investments | $ | 96.4 | $ | 96.5 | ||||
Expected maturities will differ from contractual maturities because issuers may have the right to call or prepay obligations with or without call or prepayment penalties.
Net realized gains fixed maturity securities and short-term investments were insignificant for the year ended December 31, 2020 and 2019, respectively.
The Company’s net investment income is comprised of the following (in millions):
Year ended December 31, | ||||||||
2020 | 2019 | |||||||
Fixed maturities income | $ | 1.1 | $ | — | ||||
Short-term investment income | — | 2.2 | ||||||
Total gross investment income | 1.1 | 2.2 | ||||||
Investment expenses | 0 | 0 | ||||||
Net investment income | $ | 1.1 | $ | 2.2 | ||||
Pursuant to certain regulatory requirements, the Company is required to hold assets on deposit with various state insurance departments for the benefit of policyholders. These special deposits are included in fixed maturities,on the consolidated balance sheets. The following table reflects special deposits (in millions):
available-for-sale
As of December 31, 2020 | ||||||||
Amortized Cost | Fair Value | |||||||
State | ||||||||
Illinois | $ | 1.6 | $ | 1.6 | ||||
Colorado | 1.5 | 1.5 | ||||||
Nevada | 0.4 | 0.4 | ||||||
North Carolina | 0.3 | 0.3 | ||||||
Virginia | 0.4 | 0.4 | ||||||
New Mexico | 0.4 | 0.4 | ||||||
New York | 3.1 | 3.1 | ||||||
Vermont | 0.3 | 0.3 | ||||||
Massachusetts | 0.1 | 0.1 | ||||||
Florida | 0.3 | 0.3 | ||||||
Total states | $ | 8.4 | $ | 8.4 | ||||
F-66
HIPPO ENTERPRISES INC. AND SUBSIDIARIES
Notes to Consolidated Financial Statements
3. Cash, Cash Equivalents, and Restricted Cash
The following table sets forth the cash, cash equivalents, and restricted cash (in millions):
As of December 31, | ||||||||
2020 | 2019 | |||||||
Cash and cash equivalents: | ||||||||
Cash | $ | 56.7 | $ | 19.6 | ||||
Money market funds | 372.1 | 3.7 | ||||||
Treasury bills | 23.5 | — | ||||||
Total cash and cash equivalents | 452.3 | 23.3 | ||||||
Restricted cash: | ||||||||
Fiduciary assets | 12.1 | 12.7 | ||||||
Cash on deposit | 28.0 | 6.0 | ||||||
Total restricted cash | 40.1 | 18.7 | ||||||
Total cash, cash equivalents, and restricted cash | $ | 492.4 | $ | 42.0 | ||||
4. Fair Value Measurement
The following table summarizes the Company’s fair value hierarchy for its financial assets and liabilities measured at fair value on a recurring basis (in millions):
As of December 31, 2020 | ||||||||||||||||
Level 1 | Level 2 | Level 3 | Total | |||||||||||||
Financial assets: | ||||||||||||||||
Cash equivalents: | ||||||||||||||||
Money market funds | $ | 372.1 | $ | 0 | $ | 0 | $ | 372.1 | ||||||||
Treasury bills | 23.5 | 0 | 0 | 23.5 | ||||||||||||
Total cash equivalents | $ | 395.6 | $ | 0 | $ | 0 | $ | 395.6 | ||||||||
Fixed maturities available-for-sale: | ||||||||||||||||
U.S. government and agencies | $ | 9.5 | $ | 0 | $ | 0 | $ | 9.5 | ||||||||
All other government | 0.6 | 0 | 0 | 0.6 | ||||||||||||
States, and other territories | 0 | 5.1 | 0 | 5.1 | ||||||||||||
Corporate securities | 0 | 17.4 | 0 | 17.4 | ||||||||||||
Foreign securities | 0 | 0.8 | 0 | 0.8 | ||||||||||||
Residential mortgage-backed securities | 0 | 12.9 | 0 | 12.9 | ||||||||||||
Commercial mortgage-backed securities | 0 | 5.5 | 0 | 5.5 | ||||||||||||
Asset backed securities | 0 | 4.2 | 0 | 4.2 | ||||||||||||
Total fixed maturities available-for-sale | $ | 10.1 | $ | 45.9 | $ | 0 | $ | 56.0 | ||||||||
Total financial assets | $ | 405.7 | $ | 45.9 | $ | 0 | $ | 451.6 | ||||||||
Financial liabilities: | ||||||||||||||||
Derivative liability on convertible promissory notes | $ | 0 | $ | 0 | $ | 113.3 | $ | 113.3 | ||||||||
Contingent consideration liability | 0 | 0 | 12.0 | 12.0 | ||||||||||||
Preferred stock warrant liabilities | 0 | 0 | 22.9 | 22.9 | ||||||||||||
Total financial liabilities | $ | 0 | $ | 0 | $ | 148.2 | $ | 148.2 | ||||||||
F-67
HIPPO ENTERPRISES INC. AND SUBSIDIARIES
Notes to Consolidated Financial Statements
As of December 31, 2019 | ||||||||||||||||
Level 1 | Level 2 | Level 3 | Total | |||||||||||||
Financial assets: | ||||||||||||||||
Cash equivalents: | ||||||||||||||||
Money market funds | $ | 3.7 | $ | 0 | $ | 0 | $ | 3.7 | ||||||||
Short-term investments: | ||||||||||||||||
U.S. government securities | 96.5 | 0 | 0 | 96.5 | ||||||||||||
Total financial assets | $ | 100.2 | $ | 0 | $ | 0 | $ | 100.2 | ||||||||
Financial liabilities: | ||||||||||||||||
Contingent consideration liability | $ | 0 | $ | 0 | $ | 13.8 | $ | 13.8 | ||||||||
Preferred stock warrant liabilities | 0 | 0 | 6.7 | 6.7 | ||||||||||||
Total financial liabilities | $ | 0 | $ | 0 | $ | 20.5 | $ | 20.5 | ||||||||
The Company’s policy is to recognize transfers into and transfers out of fair value hierarchy levels at the end of each reporting period. During the years ended December 31, 2020 and 2019, there were 0 transfers between levels in the fair value hierarchy.
Contingent Consideration Liability
In April 2019, the Company closed an acquisition agreement with CalAtlantic Title Group, LLC. Included in the purchase price was $14.9 million of the estimated fair value of contingent consideration. The contingent consideration was valued using the present value of future payments based on an estimate of revenue and customer renewals of the acquiree. There is no limit to the maximum potential contingent consideration as the consideration is based on acquired customer retention. See Note 18 for additional information regarding the acquisition.
The following table includes a rollforward of the contingent consideration liability (in millions):
Balance as of January 1, 2019 | $ | 0 | ||
Initial recognition of contingent consideration included | 14.9 | |||
in purchase consideration of acquisition | ||||
Payments of contingent consideration | (3.0 | ) | ||
Changes in fair value | 1.9 | |||
Balance as of December 31, 2019 | $ | 13.8 | ||
Payments of contingent consideration | (5.2 | ) | ||
Changes in fair value | 3.4 | |||
Balance as of December 31, 2020 | $ | 12.0 | ||
F-68
HIPPO ENTERPRISES INC. AND SUBSIDIARIES
Notes to Consolidated Financial Statements
Preferred Stock Warrant Liabilities
The following table includes a rollforward of the preferred stock warrant liability activity valued using Level 3 inputs is (in millions):
Balance as of January 1, 2019 | $ | 4.7 | ||
Changes in fair value | 2.0 | |||
Balance as of December 31, 2019 | 6.7 | |||
Changes in fair value | 16.2 | |||
Balance as of December 31, 2020 | $ | 22.9 | ||
See Note 16 for additional information regarding preferred stock warrant liabilities.
5. Deferred Policy Acquisition Costs
The following table presents the policy acquisition costs deferred and amortized (in millions):
December 31, 2020 | ||||
Deferred policy acquisition costs, net at beginning of year | $ | 0 | ||
Policy acquisition costs deferred during year | 6.4 | |||
Policy acquisition costs amortized during year | (4.5 | ) | ||
Deferred policy acquisition costs, net at end of year | $ | 1.9 | ||
6. Capitalized Internal Use Software
Capitalized internal use software consists of the following (in millions):
As of December 31, | ||||||||
2020 | 2019 | |||||||
Capitalized internal use software | $ | 18.4 | $ | 8.9 | ||||
Less: accumulated amortization | (3.7 | ) | (1.1 | ) | ||||
Total capitalized internal use software | $ | 14.7 | $ | 7.8 | ||||
Amortization expense totaled $2.6 million and $0.9 million for the years ended December 31, 2020 and 2019, respectively.
F-69
HIPPO ENTERPRISES INC. AND SUBSIDIARIES
Notes to Consolidated Financial Statements
7. Intangible Assets
The gross carrying amounts, accumulated amortization, and net carrying amounts of the Company’s amortizable intangible assets are presented in the table below (in millions):
As of December 31, | ||||||||||||||||||||||||||||
2020 | 2019 | |||||||||||||||||||||||||||
Weighted- Average Useful Life Remaining (in years) | Gross Carrying Amount | Accumulated Amortization | Net Carrying Amount | Gross Carrying Amount | Accumulated Amortization | Net Carrying Amount | ||||||||||||||||||||||
Customer relationships | 4.3 | $ | 13.2 | $ | (3.8 | ) | $ | 9.4 | $ | 13.2 | $ | (1.6 | ) | $ | 11.6 | |||||||||||||
Developed technology | 1.8 | 3.6 | (1.4 | ) | 2.2 | 3.6 | (0.2 | ) | 3.4 | |||||||||||||||||||
Agency and carrier relationships | 7.9 | 13.5 | (0.1 | ) | 13.4 | — | — | — | ||||||||||||||||||||
State licenses | Indefinite | 7.1 | — | 7.1 | — | — | — | |||||||||||||||||||||
VOBA | 1.7 | 0.1 | — | 0.1 | — | — | — | |||||||||||||||||||||
Other | 7.3 | 1.9 | (0.2 | ) | 1.7 | 0.7 | (0.1 | ) | 0.6 | |||||||||||||||||||
Total intangible assets, net | $ | 39.4 | $ | (5.5 | ) | $ | 33.9 | $ | 17.5 | $ | (1.9 | ) | $ | 15.6 | ||||||||||||||
Amortization expense related to intangible assets was $3.6 million and $1.9 million for the years ended December 31, 2020 and 2019, respectively. Amortization expense for developed technology is included in technology and development expenses, customer relationships, agency and carrier relationships, and other is included in sales and marketing expenses, and VOBA is included in general and administrative expenses in the accompanying consolidated statements of operations and comprehensive loss.
As of December 31, 2020, the projected annual amortization expense for the Company’s intangible assets for the next five years is as follows (in millions):
Year ending December 31, | ||||
2021 | $ | 5.4 | ||
2022 | 5.2 | |||
2023 | 4.1 | |||
2024 | 4.1 | |||
2025 | 2.5 | |||
Thereafter | 5.5 | |||
Total | $ | 26.8 | ||
8. Goodwill
The following table represents the changes in goodwill (in millions):
Balance at January 1, 2019 | $ | 0 | ||
Additions from acquisitions | 1.9 | |||
Balance at December 31, 2019 | $ | 1.9 | ||
Additions from acquisitions | 45.9 | |||
Balance at December 31, 2020 | $ | 47.8 | ||
See Note 18 for additional information regarding the Company’s acquisitions including recognition of goodwill.
F-70
HIPPO ENTERPRISES INC. AND SUBSIDIARIES
Notes to Consolidated Financial Statements
9. Accrued Expenses and Other Liabilities
Accrued expenses and other liabilities consist of the following (in millions):
As of December 31, | ||||||||
2020 | 2019 | |||||||
Accrued wages and commissions | $ | 5.0 | $ | 5.3 | ||||
Accounts payable | 0.5 | 3.2 | ||||||
Deferred revenue | 1.7 | 0.8 | ||||||
Advances from customers | 4.4 | 1.5 | ||||||
Accrued license fees and taxes | 2.5 | 0 | ||||||
Other | 11.6 | 3.8 | ||||||
Total accrued expenses and other liabilities | $ | 25.7 | $ | 14.6 | ||||
10. Loss and Loss Adjustment Expense Reserves
As described in Note 1, “Description of Business and Summary of Significant Accounting Policies”, the Company acquired Spinnaker Insurance Company on August 31, 2020. Therefore, the Company assumed the obligations of Spinnaker upon acquisition. The reconciliation of the beginning and ending reserve balances for loss and LAE, net of reinsurance is summarized as follows (in millions), reflecting the reserve balances acquired through the Company’s acquisition of Spinnaker:
2020 | ||||
Reserve for losses and LAE, net of reinsurance recoverables as of January 1, 2020 | $ | 0 | ||
Add: Incurred losses and LAE, net of reinsurance, related to: | ||||
Current year | 25.3 | |||
Prior years | 0 | |||
Total incurred | 25.3 | |||
Deduct: Loss and LAE payments, net of reinsurance, related to: | ||||
Current year | (17.0 | ) | ||
Prior year | (0.3 | ) | ||
Total paid | (17.3 | ) | ||
Add: Reserve for losses and LAE, net of reinsurance recoverables acquired from Spinnaker | 5.0 | |||
Reserve for losses and LAE, net of reinsurance recoverables as of December 31, 2020 | 13.0 | |||
Add: Reinsurance recoverables on unpaid losses and LAE as of December 31, 2020 | 92.1 | |||
Reserve for losses and LAE gross of reinsurance recoverables on unpaid losses and LAE as of December 31, 2020 | $ | 105.1 | ||
Unpaid loss and LAE includes anticipated salvage and subrogation recoverable. The amount of anticipated salvage and subrogation recoverable is immaterial as of December 31, 2020.
Incurred loss and loss adjustment expenses (“LAE”), net of reinsurance
The following tables present information about incurred and paid loss development as of December 31, 2020, net of reinsurance, as well as cumulative claim frequency and the total of IBNR reserves. The tables include unaudited information about incurred and paid claims development for the years ended December 31, 2015
F-71
HIPPO ENTERPRISES INC. AND SUBSIDIARIES
Notes to Consolidated Financial Statements
through 2020. In addition, the following table shows incurred loss and LAE by accident year in aggregate as the Company has one single operating and reportable segment. (in millions, except for number of claims):
December 31, | December 31, 2020 | |||||||||||||||||||||||||||||||
2015 | 2016 | 2017 | 2018 | 2019 | 2020 | IBNR | Cumulative Number of Reported Claims | |||||||||||||||||||||||||
(unaudited) | (unaudited) | (unaudited) | (unaudited) | (unaudited) | ||||||||||||||||||||||||||||
Accident Year | ||||||||||||||||||||||||||||||||
2015 | $ | 0 | $ | 0 | $ | 0 | $ | 0 | $ | 0 | $ | 0 | $ | 0 | 7 | |||||||||||||||||
2016 | 0 | 2.5 | 1.9 | 1.9 | 1.8 | 1.8 | 0 | 713 | ||||||||||||||||||||||||
2017 | 0 | 0 | 5.2 | 4.4 | 4.0 | 4.0 | 0 | 3,118 | ||||||||||||||||||||||||
2018 | 0 | 0 | 0 | 7.8 | 7.2 | 7.2 | 0.6 | 6,156 | ||||||||||||||||||||||||
2019 | 0 | 0 | 0 | 0 | 4.8 | 4.9 | 0.3 | 13,676 | ||||||||||||||||||||||||
2020 | 0 | 0 | 0 | 0 | 0 | 28.1 | 6.4 | 26,242 | ||||||||||||||||||||||||
Total incurred Loss and Loss Adjustment Expenses, net | $ | 46.0 | $ | 7.3 | 49,912 | |||||||||||||||||||||||||||
Net incurred losses and LAE attributable to insurance events of the prior year have developed by immaterial amount as of December 31, 2020 as a result of
re-estimation
of unpaid losses and LAE. These changes are generally results of ongoing analysis of recent loss development trends. Original estimates are decreased or increased as additional information becomes known regarding individual claims.Cumulative paid loss and LAE, net of reinsurance
The following table presents cumulative paid loss and LAE, net of reinsurance (in millions):
December 31, | ||||||||||||||||||||||||
2015 | 2016 | 2017 | 2018 | 2019 | 2020 | |||||||||||||||||||
(unaudited) | (unaudited) | (unaudited) | (unaudited) | (unaudited) | ||||||||||||||||||||
Accident Year | ||||||||||||||||||||||||
2015 | $ | 0 | $ | 0 | $ | 0 | $ | 0 | $ | 0 | $ | 0 | ||||||||||||
2016 | 0 | 1.2 | 1.8 | 1.9 | 1.8 | 1.8 | ||||||||||||||||||
2017 | 0 | 0 | 3.0 | 4.0 | 4.0 | 4.0 | ||||||||||||||||||
2018 | 0 | 0 | 0 | 5.3 | 5.7 | 5.7 | ||||||||||||||||||
2019 | 0 | 0 | 0 | 0 | 3.2 | 4.4 | ||||||||||||||||||
2020 | 0 | 0 | 0 | 0 | 0 | 17.1 | ||||||||||||||||||
Total paid losses and LAE, net | $ | 33.0 | ||||||||||||||||||||||
Total unpaid loss and LAE reserves, net | $ | 13.0 | ||||||||||||||||||||||
Ceded unpaid loss and LAE | 92.1 | |||||||||||||||||||||||
Gross unpaid loss and LAE | $ | 105.1 | ||||||||||||||||||||||
F-72
HIPPO ENTERPRISES INC. AND SUBSIDIARIES
Notes to Consolidated Financial Statements
Average annual percentage payout of incurred loss by age, net of reinsurance (unaudited supplementary information)
The following table presents supplementary information about average historical claims duration as of December 31, 2020:
Years | 1 | 2 | 3 | 4 | 5 | |||||||||||||||
Property and Casualty | 60 | % | 28 | % | 4 | % | 7 | % | 0 | % | ||||||||||
The reconciliation of the net incurred and paid loss information in the loss reserve rollforward table and development tables with respect to the current accident year is as follows (in millions):
2020 — Current | ||||||||
Accident Year | ||||||||
Incurred | Paid | |||||||
Rollforward table | $ | 25.3 | $ | 17.0 | ||||
Development table | 28.1 | 17.1 | ||||||
Variance | $ | (2.8 | ) | $ | (0.1 | ) | ||
Unallocated loss adjustment expense | 2.2 | (2.1 | ) | |||||
Loss and LAE of Spinnaker prior to the acquisition | (5.0 | ) | 2.0 | |||||
11. Reinsurance
The Company has entered into quota share and excess of loss contracts which may have catastrophe exposure. The Company is not relieved of its primary obligations to policyholders in the event of a default or the insolvency of its reinsurers, therefore a credit exposure exists to the extent that any reinsurer fails to meet its obligations assumed in the reinsurance agreements. To mitigate this exposure to reinsurance insolvencies, the Company evaluates the financial condition of its reinsurers and, in certain circumstances, holds substantial collateral (in the form of funds withheld and letters of credit) as security under the reinsurance agreements.
The following table reflects amounts affecting the consolidated balance sheets and statements of operations and comprehensive loss for ceded reinsurance as of and for the year ended December 31, 2020 (in millions):
2020 | ||||
Loss and LAE reserves | ||||
Direct | $ | 102.7 | ||
Assumed | 2.4 | |||
Gross loss and LAE reserves | 105.1 | |||
Ceded | (92.1 | ) | ||
Net loss and LAE reserves | $ | 13.0 | ||
Unearned premiums: | ||||
Direct | $ | 143.7 | ||
Assumed | 6.6 | |||
Gross unearned premiums | 150.3 | |||
Ceded | (129.4 | ) | ||
Net unearned premiums | $ | 20.9 | ||
F-73
HIPPO ENTERPRISES INC. AND SUBSIDIARIES
Notes to Consolidated Financial Statements
2020 | ||||
Written premiums: | ||||
Direct | $ | 90.0 | ||
Assumed | 26.1 | |||
Gross written premiums | 116.1 | |||
Ceded | (78.4 | ) | ||
Net written premiums | $ | 37.7 | ||
Earned premiums : | ||||
Direct | $ | 88.7 | ||
Assumed | 9.3 | |||
Gross earned premiums | 98.0 | |||
Ceded | (80.9 | ) | ||
Net earned premiums | $ | 17.1 | ||
Loss and LAE incurred: | ||||
Direct | $ | 93.6 | ||
Assumed | 13.3 | |||
Gross loss and LAE | 106.9 | |||
Ceded | (81.6 | ) | ||
Net loss and LAE | $ | 25.3 | ||
Reconciliation of incurred and paid loss by LAE development to gross loss and loss expense reserves are as follows (in millions):
2020 | ||||
Loss — net of reinsurance | $ | 12.5 | ||
LAE — net of reinsurance | 0.5 | |||
Reinsurance recoverables on unpaid loss | 92.1 | |||
Total loss and LAE reserves—gross of reinsurance | $ | 105.1 | ||
Amounts recoverable from reinsurers are recognized in a manner consistent with the claims liabilities associated with the reinsurance placement and presented on the balance sheet as reinsurance recoverable on paid and unpaid losses and LAE. Such balance as of December 31, 2020 is presented in the table below (in millions).
2020 | ||||
Reinsurance recoverable on paid loss | $ | 42.0 | ||
Ceded unpaid loss and LAE | 92.1 | |||
Total reinsurance recoverable | $ | 134.1 | ||
To reduce credit exposure to reinsurance recoverable and prepaid reinsurance premium balances, the Company evaluates the financial condition of its reinsurers and, in certain circumstances holds collateral in the form of funds withheld and letters of credit as security under the terms of its reinsurance contracts. The Company has the following unsecured reinsurance recoverable and prepaid reinsurance premium balances from reinsurers at December 31, 2020 (in millions):
F-74
HIPPO ENTERPRISES INC. AND SUBSIDIARIES
Notes to Consolidated Financial Statements
AM Best Rating | Reinsurer | 2020 | ||||
A | Validus Reinsurance, Ltd. | $ | 46.9 | |||
A+ | Transatlantic Reinsurance Company | 28.8 | ||||
A | Validus Reinsurance (Switzerland) Ltd. | 22.6 | ||||
A++ | General Reinsurance Corporation | 14.4 | ||||
| $ | 112.7 | |||||
| Other reinsurers | 73.7 | |||||
| $ | 186.4 | |||||
12. Convertible Promissory Notes and Derivative Liability
On November 23, 2020, the Company entered into a Note Purchase Agreement (“Purchase Agreement”) with investors to obtain funding for up to an aggregate amount of $400.0 million. Pursuant to the Purchase Agreement, the Company issued a convertible promissory note of $350.0 million on November 30, 2020 and $15.0 million on December 4, 2020, which mature on November 30, 2023. The Company issued additional convertible promissory notes which aggregate to $12.5 million on December 29, 2020 that mature on December 29, 2023. Prior to the maturity, the convertible promissory notes may be converted either voluntarily at the option of the investor or automatically to equity based on the conversion events specified in the Purchase Agreement, at a rate of 90% of the per share price which is dictated by the conversion event type. The convertible promissory notes bear interest at 2.5% compounded semi-annually. If conversion event has not occurred, this annual interest rate will automatically increase by 2.5% up to 7.5% after certain periods specified in the Purchase Agreement. After 15 months from issuance, if a conversion event has not occurred, interest shall accrue at 5% per annum, compounding semi-annually, unless the Company has filed an
S-1
or signed a letter of intent or definitive agreements with respect to a qualified private round or public issuer merger, in which case the interest rate increase to 5% shall apply after 21 months from issuance, provided a conversion on event has not occurred. With a prior written consent from the investor, the Company may repay the convertible promissory notes and interest, in whole or in part, any time in cash before the maturity date without a prepayment penalty.The convertible promissory notes contain an embedded derivative. The fair value of the derivative is recorded as a liability with an offsetting amount recorded as a debt discount, and the debt discount is recorded against the carrying amount of the related convertible promissory note outstanding. The amortization of the debt discount is recorded as interest expense. The embedded derivative liability is
re-valued
to the current fair value at the end of each reporting period using the income-based approach. The fair value of the embedded derivative is valued at the end of each reporting period based on the with or without 10% discount basis and an expected time to conversion of0.5-3.0
years. Upon conversion, exercise or repayment, the respective embedded derivative liability isre-valued
at the conversion, repayment or exercise date and then the related fair value amount is recorded to interest and other expense in the consolidated statements of operations and comprehensive loss as part of gain or loss on debt extinguishment.The fair value of the embedded derivative upon issuance was $107.2 million, and was adjusted to $113.3 million as of December 31, 2020. Interest expense is accreted on the convertible promissory notes between issuance and maturity dates with the expectation that principal and interest are likely to be settled in shares of common stock of the Company at a variable conversion price calculated at 90% of trade price of common stock of the Company.
Interest expense of $3.5 million on the convertible promissory notes are included in interest and other expense for the year ended December 31, 2020 in the consolidated statements of operations and comprehensive loss.
F-75
HIPPO ENTERPRISES INC. AND SUBSIDIARIES
Notes to Consolidated Financial Statements
On February 4, 2021 the Company signed a letter of intent with respect to a public issuer merger- refer to Note 22, Subsequent Events.
13. Statutory Financial Information
U.S. state insurance laws and regulations prescribe accounting practices for determining statutory net income and capital and surplus for insurance companies. In addition, state regulators may permit statutory accounting practices that differ from prescribed practices. The principal differences between SAP and GAAP as they relate to the financial statements of the Company’s insurance subsidiaries are (a) policy acquisition costs are expensed as incurred under SAP, whereas they are deferred and amortized under GAAP, (b) certain assets are not admitted for purposes of determining surplus under SAP, (c) investments in fixed income securities are carried at amortized cost under SAP whereas such securities are carried at fair value under GAAP , and (d) the criteria for recognizing net DTAs and the methodologies used to determine such amounts are different under SAP and GAAP.
Risk-Based Capital (“RBC”) requirements promulgated by the National Association of Insurance Commissioners require property/casualty insurers to maintain minimum capitalization levels determined based on formulas incorporating various business risks of the insurance subsidiaries. Spinnaker’s statutory net income and statutory surplus as of December 31, 2020 and 2019 and for the years then ended are summarized as follows (in millions):
December 31, | ||||||||
2020 | 2019 | |||||||
Statutory net income | $ | 6.6 | $ | 4.3 | ||||
Statutory capital and surplus | 69.6 | 38.0 | ||||||
14. Dividend Restrictions
RH Solutions
Dividend distributions to RH Solutions’ stakeholders are recognized in the period in which the dividends are declared by the Directors. At December 31, 2020 and 2019, RH Solutions’ stakeholder’s equity balances were $29.4 million and $2.2 million, respectively. In accordance with the terms of the Insurance (Capital and Solvency) (Class B, C, and D Insurers) Regulations, 2012, as a Class B(iii) issuer under the Law, RH Solutions is required to maintain the Prescribed Capital Requirement (“PCR”) of $1.4 million, which is based on net earned premium during the fiscal year. The Cayman Island Monetary Authority (“CIMA”) must be given advanced notice of any dividend payment(s).
Spinnaker Insurance Company
The maximum amount of dividends that can be paid by an Illinois-domiciled property and casualty insurance company without prior approval of the Illinois Insurance Commissioner in a 12 month period, measured retrospectively from the date of payment, is the greater of (1) ten percent (10%) of surplus as regards policyholders as of December 31, 2020; or (2) the net income of such insurer as of December 31, 2020, provided unassigned funds (surplus) exceeds zero following payment of such dividends. At December 31, 2020, surplus as regards policyholders was $69.6 million, net income was $6.6 million and unassigned funds (surplus) was $11.5 million.
F-76
HIPPO ENTERPRISES INC. AND SUBSIDIARIES
Notes to Consolidated Financial Statements
15. Commitments and Contingencies
Operating Leases
The Company leases office space and its internet domain name under operating leases with various expiration dates through 2029. Rent expense, which is recognized on a straight-line basis over the lease term, was $2.8 million and $1.6 million during the years ended December 31, 2020 and 2019, respectively. Future minimum lease payments required under these agreements as of December 31, 2020 are as follows (in millions):
Year Ending December 31, | ||||
2021 | $ | 2.9 | ||
2022 | 4.0 | |||
2023 | 3.5 | |||
2024 | 3.5 | |||
2025 | 3.6 | |||
Thereafter | 7.6 | |||
Total | $ | 25.1 | ||
Purchase Commitments
As of December 31, 2020, the Company has total minimum purchase commitments, which must be made during the next two years, of $19.8 million.
Litigation
The Company is subject to claims and legal proceedings which arise in the normal course of business. Management believes that the ultimate resolution of such matters will not have a material adverse effect on the financial position or results of operations of the Company.
16. Convertible Preferred Stock
The following tables summarize the authorized, issued and outstanding convertible preferred stock of the Company (in millions, except share and per share data):
As of December 31, 2020 | ||||||||||||||||||||
Issuance Price Per Share | Authorized Shares | Shares Issued and Outstanding | Net Carrying Value | Liquidation Preference | ||||||||||||||||
Preferred A-1 Stock | $ | 0.56965 | 5,889,829 | 5,889,829 | $ | 3.4 | $ | 3.4 | ||||||||||||
Preferred A-2 Stock | 1.57432 | 7,015,787 | 6,987,125 | 10.9 | 11.0 | |||||||||||||||
Preferred B Stock | 3.59757 | 6,949,142 | 6,949,142 | 24.9 | 25.0 | |||||||||||||||
Preferred C Stock | 7.04471 | 9,936,529 | 9,936,528 | 56.1 | 70.0 | |||||||||||||||
Preferred C-1 Stock | 11.74119 | 2,465,454 | — | — | — | |||||||||||||||
Preferred D Stock | 15.16420 | 6,594,479 | 6,594,479 | 99.8 | 100.0 | |||||||||||||||
Preferred E Stock | 19.66420 | 7,628,090 | 7,628,075 | 149.7 | 150.0 | |||||||||||||||
Total | 46,479,310 | 43,985,178 | $ | 344.8 | $ | 359.4 | ||||||||||||||
F-77
HIPPO ENTERPRISES INC. AND SUBSIDIARIES
Notes to Consolidated Financial Statements
As of December 31, 2019 | ||||||||||||||||||||
Issuance Price Per Share | Authorized Shares | Shares Issued and Outstanding | Net Carrying Value | Liquidation Preference | ||||||||||||||||
Preferred A-1 Stock | $ | 0.56965 | 5,889,829 | 5,889,829 | $ | 3.4 | $ | 3.4 | ||||||||||||
Preferred A-2 Stock | 1.57432 | 7,015,787 | 6,987,125 | 10.9 | 11.0 | |||||||||||||||
Preferred B Stock | 3.59757 | 6,949,142 | 6,949,142 | 24.9 | 25.0 | |||||||||||||||
Preferred C Stock | 7.04471 | 9,936,529 | 9,936,528 | 56.1 | 70.0 | |||||||||||||||
Preferred C-1 Stock | 11.74119 | 2,465,454 | — | — | — | |||||||||||||||
Preferred D Stock | 15.16420 | 6,594,479 | 6,273,064 | 95.0 | 95.1 | |||||||||||||||
Total | 38,851,220 | 36,035,688 | $ | 190.3 | $ | 204.5 | ||||||||||||||
The rights, preferences and privileges of the convertible preferred stock are as follows:
Voting
Dividend
Conversion
A-1,
SeriesA-2,
Series B, Series C, SeriesC-1,
Series D, and Series E convertible preferred stock shall initially be equal to the respective original issue price, as noted in the table above.Liquidation
If there are any available funds and assets remaining after the payment or distribution to holders of convertible preferred stock of their full preferential amount described above, then all such remaining available funds and assets shall be distributed among the holders of the then outstanding common stock pro rata according to the number of common stock held by each holder thereof.
Although the convertible preferred stock is not mandatorily or currently redeemable, a liquidation or winding up of the Company, a merger or consolidation, or a sale of substantially all the Company’s assets would constitute a redemption event not solely within the Company’s control. Therefore, all shares of convertible preferred stock have been presented outside of permanent equity.
F-78
HIPPO ENTERPRISES INC. AND SUBSIDIARIES
Notes to Consolidated Financial Statements
Preferred Stock Warrant Liabilities
In connection with obtaining a line of credit in March 2017, the Company issued 28,662 warrants to purchase Series
A-2
Preferred Stock. The warrants vested immediately and are exercisable up to March 13, 2027. In case the Company completes its IPO, within the three-year period immediately prior to the expiration date, the expiration date will automatically be extended to three years from the IPO date.In connection with the issuance of Series C Preferred Stock, in October 2018, the Company issued to an investor 2,465,454 warrants to purchase Series
C-1
Preferred Stock. The warrants are exercisable upon vesting. In April 2019, 1,232,727 warrants vested with the remaining 1,232,727 expected to vest in April 2020. The warrants will expire at the earliest of a deemed liquidation event, stock sale, IPO, or October 25, 2022.The preferred stock warrant liability is remeasured at each reporting period end with changes in fair value upon remeasurement being recorded within interest and other expense in the consolidated statements of operations and comprehensive loss. See Note 4 for additional information on the fair value of preferred stock warrant liability.
The aggregate fair value of the preferred stock warrant liability was determined based on significant inputs not observable in the market, which represents a Level 3 measurement within the fair value hierarchy.
The Company used the Black-Scholes-Merton option-pricing model, which incorporates assumptions and estimates, to value the preferred stock warrants. Estimates and assumptions impacting the fair value measurement include the fair value per share of the underlying shares of the Company’s Series
A-2
and SeriesC-1
convertible preferred stock, risk free interest rate, expected dividend yield, expected volatility of the price of the underlying preferred stock, and an expected term of the preferred stock warrants.The most significant assumption impacting the fair value of the preferred stock warrants is the fair value of the Series
A-2
andC-1
Preferred Stock as of each remeasurement date. The Company determined the fair value per share of the underlying preferred stock by taking into consideration the most recent sales of its preferred stock, results obtained from third-party valuations, and additional factors that were deemed relevant.The following assumptions were used in determining fair value of the convertible preferred stock warrant liabilities:
As of December 31, | ||||
2020 | 2019 | |||
Fair value of Series A-2 Preferred Stock | $18.25 | $8.26 | ||
Fair value of Series C-1 Preferred Stock | $20.09 | $12.80 | ||
Exercise price A-2 Preferred Stock | $1.57 | $1.57 | ||
Exercise price C-1 Preferred Stock | $11.74 | $11.74 | ||
Expected term (in years) | 1.8-6.2 | 2.8–7.2 | ||
Expected volatility | 29.0%-40.7% | 21.5%–22.8% | ||
Risk-free interest rate | 0.1%-0.5% | 1.6%–1.8% | ||
Expected dividend yield | — % | — % | ||
F-79
HIPPO ENTERPRISES INC. AND SUBSIDIARIES
Notes to Consolidated Financial Statements
The following convertible preferred stock warrants were outstanding with the related fair values (in millions, except for share and per share data):
As of December 31, | ||||||||||||||||||||
2020 | 2019 | |||||||||||||||||||
Series | Exercise Price Per Share | Warrant Shares Outstanding | Fair Value | Warrant Shares Outstanding | Fair Value | |||||||||||||||
A-2 | $ | 1.57 | 28,662 | $ | 0.5 | 28,662 | $ | 0.2 | ||||||||||||
C-1 | 11.74 | 2,465,454 | 22.4 | 2,465,454 | 6.5 | |||||||||||||||
Total | 2,494,116 | $ | 22.9 | 2,494,116 | $ | 6.7 | ||||||||||||||
17. Stockholders’ Deficit
Common Stock
The Company’s Certificate of Incorporation, as amended and restated, authorizes the Company to issue up to 83,830,000 shares of common stock with par value of $0.000001 per share. Each share of common stock is entitled to one vote. The holders of the common stock are also entitled to receive dividends whenever funds are legally available and when declared by the board of directors. No dividends have been declared or paid since inception.
The Company had reserved shares of common stock for future issuance as follows:
As of December 31, | ||||||||
2020 | 2019 | |||||||
Convertible preferred stock | 43,985,178 | 36,035,688 | ||||||
Warrants to purchase preferred stock | 2,494,116 | 2,494,116 | ||||||
Warrants to purchase common stock | 9,476,102 | 9,476,102 | ||||||
Common stock options outstanding | 10,382,771 | 8,003,108 | ||||||
Shares available for future grant of equity awards | 2,627,921 | 2,324,117 | ||||||
Total | 68,966,088 | 58,333,131 | ||||||
Common Stock Warrants
The following common stock warrants were outstanding as of December 31, 2020:
Issue Date | Exercise Price Per Share | Number of Warrants | Expiration Date | Outstanding as of December 31, 2020 | ||||||||||
December 11, 2017 | $ | 0.01 | 4,738,051 | December 31, 2022 | 4,738,051 | |||||||||
February 19, 2018 | $ | 0.01 | 4,738,051 | August 19, 2022 | 4,738,051 | |||||||||
In December 2017, the Company issued 4,738,051 warrants for common stock to one of its investors. The warrants were subject to performance vesting and are accounted for as share-based compensation expense when it is probable that the awards will vest. In October 2018 in connection with the issuance of Series C Preferred Stock, these warrants were amended to eliminate the performance vesting conditions and replace it with a time-based condition. Up until the amended date, none of the warrants were probable of being vested and no expense had been recorded. The fair value of the warrant upon the amendment was allocated to additional
paid-in
capital as part of the issuance of Series C Preferred Stock, net of issuance costs and preferred stock warrants.F-80
HIPPO ENTERPRISES INC. AND SUBSIDIARIES
Notes to Consolidated Financial Statements
In February 2018, the Company issued 4,738,051 warrants for common stock to one of its investors. The warrants are subject to performance vesting and is accounted for as share-based compensation expense when it is probable that the awards will vest. In December 2020, these warrants were amended, and 62,500 warrants were vested. As a result of the modification, the Company recorded a share-based compensation charge of $1.0 million to reflect the acceleration of 62,500 shares that would otherwise not have vested. Up until the amended date, none of the remaining warrants were probable of being vested and no expense had been recorded.
Share-Based Compensation Plans
In 2016, the Company adopted the 2016 Stock Option and Grant Plan (the “2016 Stock Plan”), which was most recently amended in 2019. The 2016 Stock Plan provided for the direct award or sale of shares, the grant of options to purchase shares and the grant of restricted stock units (“RSUs”) to employees, consultants, and outside directors of the Company. Options granted under the 2016 Stock Plan may be either incentive stock options (“ISOs”) or
non-qualified
stock options (“NSOs”). ISOs may be granted only to Company employees (including officers and directors who are also employees). NSOs may be granted to Company employees, outside directors, and consultants.Following a corporate
re-organization
in 2019, the Company cancelled the 2016 Stock Plan and adopted the 2019 Stock Option and Grant Plan (“the 2019 Stock Plan”). The 2019 Stock Plan replaced all outstanding awards of the 2016 Stock Plan without any changes to the terms and conditions. The 2019 Stock Plan provides for the direct award or sale of shares, the grant of options to purchase shares and the grant of RSUs to employees, consultants, and outside directors of the Company. Stock options under the plan may be either ISOs or NSOs, with an exercise price of not less than 100% of fair market value on the grant date, with a term less than or equal to ten years. The vesting period of each option and RSAs shall be as determined by a committee of the Company’s board of directors but is generally over four years.As of December 31, 2020, the Company has reserved 2,627,921 shares of its common stock for future share-based awards under its stock option plan.
RSAs
In 2016 and 2015, the Company granted RSAs which are subject to service-based vesting conditions to certain employees, with a vesting period of three or four years. Other than the modification charge noted below, the share-based compensation charges relating to these awards are not material for the periods presented. The 19,250 shares of awards outstanding at December 31, 2019 were fully vested during the year ended December 31, 2020.
During the year ended December 31, 2019, the Company entered into Separation Agreements with an employee which resulted in the acceleration of vesting for certain RSAs and stock options. As a result of the modification, the Company recorded a share-based compensation charge of $3.2 million to reflect the revised service period for the stock options and related vesting of shares that would otherwise not have vested.
F-81
HIPPO ENTERPRISES INC. AND SUBSIDIARIES
Notes to Consolidated Financial Statements
Stock Options
The following table summarizes option activity under the Plan:
Options Outstanding | Weighted-Average Remaining Contract Term (In Years) | Aggregate Intrinsic Value (In millions) | ||||||||||||||
Number of Shares | Weighted Average Exercise Price | |||||||||||||||
Outstanding as of January 1, 2020 | 8,003,108 | $ | 3.11 | 9.18 | $ | 20.0 | ||||||||||
Granted | 4,792,500 | 6.94 | ||||||||||||||
Exercised | (1,179,870 | ) | 2.36 | |||||||||||||
Forfeited | (1,181,120 | ) | 3.91 | |||||||||||||
Expired | (51,847 | ) | 1.40 | |||||||||||||
Outstanding as of December 31, 2020 | 10,382,771 | $ | 4.88 | 8.90 | $ | 108.9 | ||||||||||
Vested and exercisable as of December 31, 2020 | 1,425,549 | $ | 3.21 | 8.08 | $ | 17.3 | ||||||||||
The aggregate intrinsic value of exercised options as of December 31, 2020 and 2019 was $15.4 million and $0.5 million, respectively, and is calculated based on the difference between the exercise price and the fair value of the Company’s common stock as of the exercise date. The per share weighted-average grant date fair value of options granted as of December 31, 2020 and 2019 was $4.87 and $2.13, respectively.
Total unrecognized compensation cost of $29.3 million as of December 31, 2020 is expected to be recognized over a weighted-average period of 3.4 years.
Valuation Assumptions of Stock Options
The fair value of granted stock options was estimated as of the date of grant using the Black-Scholes-Merton option-pricing model, based on the following inputs:
As of December 31, | ||||||||
2020 | 2019 | |||||||
Expected term (in years) | 5.63 - 6.12 | 6.02 | ||||||
Expected volatility | 22.6% - 29.9% | 22.7 | % | |||||
Risk-free interest rate | 0.3% - 1.6% | 2.2 | % | |||||
Expected dividend yield | 0 % | 0 | % | |||||
Each of these inputs is subjective and generally requires significant judgment to determine.
Fair Value of Common Stock
–
Expected Term
–
F-82
HIPPO ENTERPRISES INC. AND SUBSIDIARIES
Notes to Consolidated Financial Statements
expected term of options, whereby the expected term equals the arithmetic average of the vesting term and the original contractual term of the option (generally 10 years).
Expected Volatility
Risk-Free Interest Rate
Expected Dividend Yield
During the years ended December 31, 2020 and 2019, certain related parties and economic interest holders purchased common stock from employees at prices ranging from $19.66 to $15.16 per share. The common stock fair value on the dates of sale ranged from $7.36 to $5.60 per share. For the years ended December 31, 2020 and 2019, the Company recorded share-based compensation expense of $12.2 million and $15.8 million, respectively, related to these secondary sales. The share-based compensation expense was calculated as the excess of the sale price over fair value of the shares, on the date of each respective secondary sale, and has been included in technology and development and general and administrative expenses in the accompanying consolidated statements of operations and comprehensive loss.
Early Exercises of Stock Options
The 2016 Stock Plan permits certain option holders to exercise awarded options prior to vesting. Upon early exercise, the options become subject to a restricted stock agreement and remain subject to the same vesting provisions in the corresponding stock option award and unvested options are subject to repurchase by the Company upon termination at the same price exercised. Early exercises of options are not deemed to be substantive exercises for accounting purposes and accordingly, amounts received for early exercises are initially recorded in accrued expenses and other liabilities on the accompanying consolidated balance sheets, and reclassified to
additional paid-in capital
as the underlying shares vest. At December 31, 2020 and 2019, the Company had $2.5 million and $0.0 million, respectively, recorded in accrued expenses and other liabilities related to early exercises of stock options, and the related number of unvested shares subject to repurchase was 345,000 and 38,694, respectively.Total share-based compensation expense, classified in the accompanying consolidated statements of operations and comprehensive loss was as follows (in millions):
Year ended December 31, | ||||||||
2020 | 2019 | |||||||
Losses and Loss Adjustment Expenses | $ | 0.1 | $ | 0 | ||||
Insurance related expenses | 0.2 | 0.2 | ||||||
Technology and development | 2.4 | 1.7 | ||||||
Sales and marketing | 2.1 | 0.6 | ||||||
General and administrative | 12.4 | 19.1 | ||||||
Total share-based compensation expense | $ | 17.2 | $ | 21.6 | ||||
F-83
HIPPO ENTERPRISES INC. AND SUBSIDIARIES
Notes to Consolidated Financial Statements
18. Acquisitions
North American Advantage Insurance Services, LLC Acquisition
On April 15, 2019, the Company reached an agreement with CalAtlantic Title Group, LLC to purchase 100% of the equity interests in NAAIS. NAAIS provides insurance services to homebuilder customers. The acquisition has been accounted for as a business combination and expanded the Company’s customer base.
The total purchase consideration was $15.9 million, which consisted of $14.9 million related to the estimated fair value of contingent consideration and cash of $1.0 million. The maximum potential contingent consideration is unlimited based on customer retention. The contingent consideration was valued by using the present value of future payments based on an estimate of revenue and customer renewals of the acquiree. A portion of cash consideration will be payable in 12 equal monthly payments, totaling $0.5 million, immediately following the acquisition. Of the total purchase consideration, $13.5 million has been recorded to acquired intangible assets, $1.9 million to goodwill, and $0.5 million to accounts comprised primarily of working capital. The Company incurred $0.2 million in acquisition related costs, which were recognized as general and administrative expenses in the accompanying consolidated statements of operations and comprehensive income (loss).
The intangible assets acquired primarily relate to customer relationships and have a useful life of six years. The Company valued the customer relationships using the excess earnings and relief from royalty method under the income approach. The goodwill represents the future economic benefits expected to arise from other intangible assets acquired that do not qualify for separate recognition, including expected future synergies. The goodwill recognized is expected to be deductible for tax purposes.
YourHaus, Inc. Acquisition
On October 17, 2019, the Company completed the acquisition of YourHaus, Inc. (or Sheltr), a protective home maintenance membership company with the aim to make home maintenance effortless and help homeowners care for their homes to catch and mitigate issues before they can become costly repairs. The Company has accounted for this acquisition as an asset acquisition transaction. The total cash consideration for the acquisition of assets was $6.3 million. The Company recognized intangible assets of $4.0 million and cash of $2.3 million. The intangible assets acquired primarily relate to developed technology and have a useful life of three years. The Company valued the developed technology using the replacement cost method under the cost approach. The Company incurred $0.1 million in transaction expenses related to this acquisition, which was capitalized as a part of the consideration.
Spinnaker Insurance Company Acquisition
On August 31, 2020, the Company acquired 100% of all issued and outstanding share capital of Spinnaker Insurance Company (“Spinnaker”), a privately-held entity that is an Illinois domiciled property and casualty insurance carrier licensed in 50 states plus the District of Columbia in exchange for cash consideration. The acquisition has been accounted for as a business combination and allows the Company to vertically integrate an insurance carrier and enhance the Company’s control over unit economics and future carrier capacity.
F-84
HIPPO ENTERPRISES INC. AND SUBSIDIARIES
Notes to Consolidated Financial Statements
There were no other components of Purchase Consideration other than cash payments. The following table summarizes the Closing Date fair value of the consideration transferred, reflecting the measurement period adjustments recorded at the acquisition date (in millions).
Fair Value of Consideration Transferred | ||||
Cash Paid | $ | 95.6 | ||
Less: consideration for settlement of pre-existing liabilities due to Spinnaker | (5.1 | ) | ||
Total value of consideration transferred | $ | 90.5 | ||
The Company recognized $0.8 million of acquisition transaction costs as general and administrative expense in the Company’s consolidated statements of operations and comprehensive loss during the year ended December 31, 2020. The following table presents the allocation of the purchase price for Spinnaker, measured as of the acquisition date:(in millions):
Acquisition- Date Fair Value | Estimated Useful Life of Finite-Lived Intangible Assets | |||||||
Tangible assets acquired and (liabilities) assumed: | ||||||||
Investments: | ||||||||
Fixed maturities available-for-sale, | $ | 45.7 | ||||||
Short-term investments | 5.0 | |||||||
Total investments | 50.7 | |||||||
Cash and cash equivalents | 16.9 | |||||||
Restricted cash | 2.1 | |||||||
Accounts receivable, net | 18.3 | |||||||
Reinsurance recoverable on paid and unpaid losses and LAE | 116.3 | |||||||
Ceding commissions receivable | 18.7 | |||||||
Prepaid reinsurance premiums | 131.9 | |||||||
Other assets | 0.6 | |||||||
Accrued expenses and other liabilities | (6.6 | ) | ||||||
Loss and loss adjustment expense reserves | (93.3 | ) | ||||||
Unearned premiums | (132.1 | ) | ||||||
Reinsurance premium payable | (76.1 | ) | ||||||
Net tangible assets acquired | 47.4 | |||||||
Intangible assets acquired: | ||||||||
Agency relationships | 3.4 | 8 years | ||||||
VOBA | 0.1 | 2 years | ||||||
State licenses | 7.1 | Indefinite | ||||||
Goodwill | 32.5 | |||||||
Total purchase price | 90.5 | |||||||
F-85
HIPPO ENTERPRISES INC. AND SUBSIDIARIES
Notes to Consolidated Financial Statements
Goodwill represents the excess of the preliminary estimated Purchase Consideration over the preliminary estimates of the fair value of the net tangible and intangible assets acquired and has been allocated to the Company’s one operating segment. Goodwill is primarily attributable to expected post-acquisition synergies from integrating Spinnaker’s casualty insurance career business into the Company’s homeowner’s insurance business to improve the Company’s speed to market for new products and offers incremental revenue opportunities from Spinnaker’s existing programs. The goodwill recorded is not deductible for income tax purposes.
The valuation of the assets acquired, and liabilities assumed has not yet been finalized because the acquisition closed on August 31, 2020. As a result, provisional estimates have been recorded and are subject to change, primarily accounts that include the use of estimates, such as receivables, loss and loss adjustment expense reserves, certain acquired intangible assets and certain reinsurance assets and liabilities.
The results of operations of Spinnaker have been included in the Company’s consolidated statements of operations from the acquisition date. The following unaudited pro forma financial information gives effect to the acquisition of Spinnaker as if it were consummated on January 1, 2019 (the beginning of the comparable prior reporting period), including pro forma adjustments related to the valuation and allocation of the purchase price, primarily amortization of acquired intangible assets; share-based compensation expense; alignment of accounting policies; to Spinnaker’s historical financial statements; and direct transaction costs reflected in the historical financial statements. This data is presented for informational purposes only and is not intended to represent or be indicative of the results of operations that would have been reported had the acquisition occurred on January 1, 2019. It should not be taken as representative of future results of operations of the combined company (in millions):
Acquisition | ||||||||
Year Ended December 31, | ||||||||
2020 | 2019 | |||||||
Pro forma revenue | 54.1 | 34.9 | ||||||
Pro forma net loss | (136.6 | ) | (75.8 | ) | ||||
Agency Acquisition
On December 31, 2020
, the Company acquired an insurance agency aggregator for an estimated purchase consideration of approximately $25 million, consisting primarily of cash and the issuance of a convertible promissory note of $12.5 million. See Note 12 for additional information of the convertible promissory note. The acquisition allows the Company to continue to expand its customer base.Of the total purchase consideration, $11.0 million has been recorded to acquired intangible assets, $13.2 million to goodwill, and $0.8 million to accounts comprised primarily of working capital. The Company incurred $0.1 million in acquisition related costs, which were recognized as general and administrative expenses in the accompanying consolidated statements of operations and comprehensive income (loss).
The intangible assets acquired primarily relate to carrier and agency relationships and have a useful life of eight years. The Company valued the intangibles using income-based approaches including the excess earnings and relief from royalty method as well as the with and without approach. The goodwill represents the future economic benefits expected to arise from other intangible assets acquired that do not qualify for separate recognition, including expected future synergies. The goodwill recognized is expected to be deductible for tax purposes.
F-86
HIPPO ENTERPRISES INC. AND SUBSIDIARIES
Notes to Consolidated Financial Statements
The valuation of the assets acquired, and liabilities assumed has not been finalized because the acquisition closed on December 31, 2020. As a result, provisional estimates have been recorded and are subject to change primarily accounts that include the use of estimates, such as acquired intangible assets.
19. Income Taxes
The components of the total provision for income taxes are as follows (in millions):
Year Ended December 31, | ||||||||
2020 | 2019 | |||||||
Loss before income taxes | $ | (143.2 | ) | $ | (83.0 | ) | ||
Income tax benefit from statutory rate | (30.1 | ) | (17.4 | ) | ||||
Effect of: | ||||||||
Meals, entertainment & parking | 0.1 | 0 | ||||||
Deferred compensation | 8.1 | 4.8 | ||||||
Transaction costs | 0.1 | 0 | ||||||
State taxes | (1.1 | ) | 0.1 | |||||
Increase in valuation allowance | 19.9 | 12.0 | ||||||
Other | 1.2 | 0.6 | ||||||
Income taxes (benefit) expense | $ | (1.8 | ) | $ | 0.1 | |||
The components of the provision for income taxes are as follows (in millions):
Year Ended December 31, | ||||||||
2020 | 2019 | |||||||
Income tax applicable to: | ||||||||
Current | ||||||||
State | $ | 0.2 | $ | 0.1 | ||||
Total current provision | $ | 0.2 | $ | 0.1 | ||||
Deferred | ||||||||
Federal | $ | (1.9 | ) | $ | 0 | |||
State | (0.1 | ) | 0 | |||||
Total deferred provision | $ | (2.0 | ) | $ | 0 | |||
Total provision for income taxes | $ | (1.8 | ) | $ | 0.1 | |||
F-87
HIPPO ENTERPRISES INC. AND SUBSIDIARIES
Notes to Consolidated Financial Statements
Deferred Taxes
Significant components of the Company’s deferred tax assets and liabilities are as follows (in millions):
As of December 31, | ||||||||
2020 | 2019 | |||||||
Deferred tax assets: | ||||||||
Net operating loss carryforward | $ | 35.4 | $ | 18.0 | ||||
Provision for commission | 5.4 | 2.9 | ||||||
Intangible assets | 3.1 | 0.2 | ||||||
Research and development credit | 0.2 | 0.2 | ||||||
Deferred compensation | 0.3 | 0.2 | ||||||
Unearned premium reserve | 1.0 | 0 | ||||||
Loss reserve discount | 0.1 | 0.7 | ||||||
Deferred rent | 0.1 | 0 | ||||||
Accruals | 0.9 | 0 | ||||||
Interest expense limitation | 0.6 | 0 | ||||||
Other | 0 | 0.2 | ||||||
Total deferred tax assets | $ | 47.1 | $ | 22.4 | ||||
Valuation allowance | (39.6 | ) | (19.7 | ) | ||||
Total deferred income tax assets | $ | 7.5 | $ | 2.7 | ||||
Deferred tax liabilities | ||||||||
Property and equipment | $ | 0.1 | $ | 0.1 | ||||
Capitalized software | 3.3 | 1.8 | ||||||
Acquired intangibles | 0.5 | 0.8 | ||||||
Unrealized gains | 0.4 | 0 | ||||||
Spinnaker stepped-up adjustment | 2.9 | 0 | ||||||
Deferred acquisition costs | 0.3 | 0 | ||||||
Total deferred tax liabilities | $ | 7.5 | $ | 2.7 | ||||
Deferred income tax assets, net | $ | 0 | $ | 0 | ||||
Valuation Allowance
Recognition of deferred tax assets is appropriate when realization of these assets is more likely than not. Based upon the weight of all available evidence, with primary focus on the Company’s history of recent losses, the Company has concluded that it is not more likely than not that the recorded deferred tax assets will be realized. As a result, the Company has recorded a full valuation allowance against its net deferred tax assets recorded as of December 31, 2020 and 2019.
Unrecognized Tax Benefits
The Company recognizes the tax benefit of tax positions taken in the consolidated financial statements only when it is more likely than not that the position will be sustained on examination by the relevant taxing authority based on the tax technical merits of the position. The tax benefit of a position that meets this standard is measured at the largest amount of benefit that is expected to be more likely than not to be realized on settlement. A liability is established for the difference between the tax benefit of positions taken in a tax return and the tax benefit of tax positions recognized in the consolidated financial statements.
The Company did 0t have an unrecognized tax benefit as of December 31, 2020 and 2019, fully offset by a valuation allowance. NaNinterest or penalties were incurred during the years ended December 31, 2020 or 2019.
F-88
HIPPO ENTERPRISES INC. AND SUBSIDIARIES
Notes to Consolidated Financial Statements
The Company believes it is reasonably possible that there will be 0change in the unrecognized tax benefits within the next twelve months.
Net Operating Losses
As of December 31, 2020, the Company has U.S. federal and state net operating loss (“NOL”) carryforwards of $154.5 million and $41.5 million, respectively. The Company has $8.8 million of Dual Consolidating Losses in a 953(d) company, RH Solutions Insurance. The provisions of the Tax Cuts and Jobs Act of 2017 eliminated the
20-year
carryforward period and made it indefinite for federal NOLs generated in tax years after December 31, 2017. For such amounts generated prior to 2018, the20-year
carryforward periods continue to apply.In general, a corporation’s ability to utilize its NOL carryforwards may be subject to a substantial limitation due to ownership changes that may have occurred or that could occur in the future, as required by section 382 of the Internal Revenue Code of 1986 (the “Code”), as amended, as well as similar state provisions. These ownership changes may limit the amount of NOL and research & development (“R&D”) credit carryforwards that can be utilized annually to offset future taxable income and tax, respectively. In general, an “ownership change,” as defined by section 382 of the Code, results from transaction or series of transactions over a three-year period resulting in an ownership change of more than 50 percent of the capital (as defined) of a company by certain stockholders or public groups. The Company has performed a section 382 analysis and experienced two historical ownership changes in 2016 and 2018, and the Company’s tax attributes subject to such limitations under section 382 have been considered. Components of the NOL carryforwards are as follows (in millions):
20-year Carryforward Expires in 2035 - 2037 | Indefinite Carryforward Period | Total | ||||||||||
U.S. Federal | $ | 9.2 | $ | 145.3 | $ | 154.5 | ||||||
U.S. State | 41.5 | 0 | 41.5 | |||||||||
Balance as of December 31, 2020 | $ | 50.7 | $ | 145.3 | $ | 196.0 | ||||||
Taxing Authority Audits
The Company’s income tax returns are subject to federal and state tax examinations. There are no pending tax examinations as of December 31, 2020. For U.S. federal purposes, the Company is open for the 2017 – 2019 tax years and for state purposes, the Company is open for from 2016 – 2019 tax years.
20. Net Loss Per Share Attributable to Common Stockholders
Net loss per share attributable to common stockholders was computed as follows:
Year Ended December 31, | ||||||||
2020 | 2019 | |||||||
Numerator: | ||||||||
Net loss attributable to Hippo Enterprises Inc. — basic and diluted (in millions) | $ | (141.5 | ) | $ | (83.1 | ) | ||
Denominator: | ||||||||
Weighted-average shares used in computing net loss per share attributable to Hippo Enterprises Inc. — basic and diluted | 12,495,509 | 10,652,088 | ||||||
Net loss per share attributable to Hippo Enterprises Inc. — basic and diluted | $ | (11.32 | ) | $ | (7.80 | ) | ||
F-89
HIPPO ENTERPRISES INC. AND SUBSIDIARIES
Notes to Consolidated Financial Statements
The potential shares of common stock that were excluded from the computation of diluted net loss per share attributable to common stockholders for the periods presented because including them would have been antidilutive are as follows:
As of December 31, | ||||||||
2020 | 2019 | |||||||
Convertible preferred stock (on an as if converted basis) | 39,545,082 | 32,546,081 | ||||||
Outstanding options | 8,364,323 | 5,687,268 | ||||||
Warrants to purchase common shares | 4,763,600 | 4,789,980 | ||||||
Warrants to purchase preferred shares | 2,494,116 | 1,784,876 | ||||||
Common stock subject to repurchase | 1,365,948 | 1,691,897 | ||||||
Convertible notes | 2,177,961 | 0 | ||||||
Total | 58,711,030 | 46,500,102 | ||||||
21. Geographical Breakdown of Gross Written Premium
Gross written premium (“GWP”) by state is as follows (in millions):
December 31, | ||||||||
2020 | ||||||||
Amount | % of GWP | |||||||
State | ||||||||
Texas | $ | 43.9 | 37.8 | % | ||||
California | 10.4 | 8.9 | % | |||||
Florida | 7.3 | 6.3 | % | |||||
Illinois | 4.9 | 4.3 | % | |||||
Georgia | 4.7 | 4.0 | % | |||||
Missouri | 3.4 | 2.9 | % | |||||
Ohio | 3.0 | 2.6 | % | |||||
Oklahoma | 3.0 | 2.6 | % | |||||
Tennessee | 2.4 | 2.1 | % | |||||
Colorado | 2.5 | 2.1 | % | |||||
Other | 30.6 | 26.4 | % | |||||
Total | $ | 116.1 | 100.0 | % | ||||
22. Subsequent Events
The Company has evaluated subsequent events from the balance sheet date through March 25, 2021, the date these consolidated financial statements are available to be issued.
The Company faces loss exposure from the February 2021 winter storm in the State of Texas. The Company is assessing the impact of the event; based on a preliminary review of the range of expected loss, the Company believes this event may have a material impact on its financial condition or results of operations.
F-90
HIPPO ENTERPRISES INC. AND SUBSIDIARIES
Notes to Consolidated Financial Statements
On February 4, 2021, the Company signed a Letter of Intent (“LOI”) with Reinvent Technology Partners Z (“Reinvent”), a Special Purpose Acquisition Company. The contemplated deal with Reinvent would provide all holders of common and preferred stock to receive common shares of the continuing public company, which will be a wholly owned subsidiary of Reinvent. The outstanding principal and unpaid accrued interest of the convertible promissory note will be converted into conversion shares immediately prior to the consummation of the public issuer merger. The transaction will be accounted for as a reverse recapitalization and the Company has been determined to be the accounting acquirer.
F-91
Schedule II
HIPPO ENTERPRISES INC.
Condensed Balance Sheets (Parent Company)
(In millions, except share data)
As of December 31, | ||||||||
2020 | 2019 | |||||||
Assets | ||||||||
Investments: | ||||||||
Short-term investments | $ | — | $ | 96.5 | ||||
Total investments | — | 96.5 | ||||||
Cash and cash equivalents | 374.8 | 3.8 | ||||||
Intecompany receivable | 151.9 | — | ||||||
Other assets | 0.3 | — | ||||||
Investment in subsidiary | 133.8 | 120.8 | ||||||
Total assets | 660.8 | $ | 221.1 | |||||
Liabilities, convertible preferred stock, and stockholders’ deficit | ||||||||
Liabilities: | ||||||||
Intercompany payables | 100.7 | 100.2 | ||||||
Accrued expenses and other liabilities | 3.6 | — | ||||||
Convertible promissory notes, net of discount | 273.0 | — | ||||||
Derivative liability on notes | 113.3 | �� | — | |||||
Preferred stock warrant liabilities | 22.9 | 6.7 | ||||||
Total liabilities | 513.5 | 106.9 | ||||||
Commitments and contingencies | ||||||||
Convertible preferred stock: | ||||||||
Preferred stock, $0.000001 par value per share; 46,479,310 shares authorized as of December 31, 2020; 43,985,178 shares issued and outstanding as of December 31, 2020; Liquidation preferences of $359.4 million as of December 31, 2020 | 344.8 | 190.3 | ||||||
Stockholders’ deficit | ||||||||
Additional paid-in capital | 56.9 | 36.7 | ||||||
Accumulated other comprehensive income | — | 0.1 | ||||||
Accumulated deficit | (254.4 | ) | (112.9 | ) | ||||
Total stockholders’ deficit | (197.5 | ) | (76.1 | ) | ||||
Total liabilities, convertible preferred stock, and stockholders’ deficit | $ | 660.8 | 221.1 | |||||
F-92
HIPPO ENTERPRISES INC.
Condensed Statements of Operations (Parent Company)
(In millions)
Years ended December 31, 2020 | For the period from January 22, 2019 to December 31, 2019 | |||||||
Revenue: | ||||||||
Net investment income | $ | 0.7 | $ | — | ||||
Total revenue | 0.7 | — | ||||||
Expenses: | ||||||||
Losses and Loss Adjustment Expenses | 0.1 | — | ||||||
Technology and development | 3.0 | 0.3 | ||||||
Sales and marketing | 2.1 | 0.1 | ||||||
General and administrative | 13.1 | 0.5 | ||||||
Insurance related expenses | 0.2 | — | ||||||
Interest and other expense | 25.9 | (0.4 | ) | |||||
Total expenses | 44.4 | 0.5 | ||||||
Loss before equity in net loss of subsidiaries | (43.7 | ) | (0.5 | ) | ||||
Equity in net loss of subsidiaries | (97.8 | ) | (80.3 | ) | ||||
Net loss | $ | (141.5 | ) | $ | (80.8 | ) | ||
F-93
HIPPO ENTERPRISES INC.
Condensed Statements of Cash Flows (Parent Company)
(in millions)
Year ended December 31, 2020 | For the period January 22, 2019 to December 31, 2019 | |||||||
CASH FLOWS FROM OPERATING ACTIVITIES: | ||||||||
Net (loss) income | (141.5 | ) | (80.8 | ) | ||||
Adjustments to reconcile net (loss) income to net cash provided by operating activities: | ||||||||
Share-based compensation expense | 17.7 | 0.9 | ||||||
Change in fair value of preferred stock warrant liabilities | 16.2 | (0.3 | ) | |||||
Change in fair value of derivative liability on notes | 6.2 | — | ||||||
Other | 2.7 | (0.8 | ) | |||||
Equity in net loss of subsidiaries | 97.8 | 80.3 | ||||||
Changes in assets and liabilities: | ||||||||
Intercompany, net | (136.0 | ) | 100.2 | |||||
Other assets | (0.3 | ) | (0.5 | ) | ||||
Accrued expenses and other liabilities | 0.5 | — | ||||||
Net cash (used in) provided by operating activities | (136.7 | ) | 99.0 | |||||
CASH FLOWS FROM INVESTING ACTIVITIES: | ||||||||
Investment in subsidiaries | (105.9 | ) | — | |||||
Purchases of investments | — | (155.4 | ) | |||||
Maturities of investments | 69.6 | 59.8 | ||||||
Sales of investments | 26.8 | — | ||||||
Other | — | — | ||||||
Net cash (used in) provided by investing activities | (9.5 | ) | (95.6 | ) | ||||
CASH FLOWS FROM FINANCING ACTIVITIES: | ||||||||
Proceeds from issuance of series E preferred stock, net of issuance costs | 149.7 | — | ||||||
Proceeds from exercise of options | 2.5 | 0.4 | ||||||
Proceeds from promissory notes, net of issuance costs | 365.0 | — | ||||||
Net cash provided by financing activities | 517.2 | 0.4 | ||||||
Net increase (decrease) in cash and cash equivalents and restricted cash | 371.0 | 3.8 | ||||||
Cash, cash equivalents and restricted cash at the beginning of the period | 3.8 | — | ||||||
Cash, cash equivalents and restricted cash at the end of the period | 374.8 | 3.8 | ||||||
Non-cash and other disclosures | ||||||||
Convertible promissory notes issued for receivable from subsidiary | $ | 12.5 | $ | — | ||||
Transfer of preferred stock from Hippo Analytics Inc. to Hippo Enterprises Inc. | 4.9 | 190.3 | ||||||
Transfer of preferred stock warrant liability from Hippo Analytics Inc. to Hippo Enterprises Inc. | — | 7.0 | ||||||
Transfer of equity from Hippo Analytics Inc. to Hippo Enterprises Inc. | — | 35.4 | ||||||
F-94
HIPPO ENTERPRISES INC.
Notes to the Condensed Financial Statements (Parent Company)
1. Business
Hippo Enterprises Inc. (“Parent Company”) was incorporated on January 22, 2019 in Delaware. As a result, the Parent Company only financial statements reflect the periods following the incorporation. Hippo Enterprises Inc. became the Parent Company as a result of a corporate
re-organization
in October 2019. As a result, these Parent Company only financial statements reflect the periods following thisre-organization.
See Note 1, “Description of Business and Summary of Significant Accounting Policies” for additional information on there-organization
included in the consolidated financial statements elsewhere in this registration statement.2. Accounting Policies
The accompanying condensed financial statements have been prepared using the equity method. Under the equity method, the investment in consolidated subsidiaries is stated at cost plus equity in undistributed losses of consolidated subsidiaries since the date of acquisition. These condensed financial statements should be read in conjunction with the Company’s consolidated financial statements.
Use of Estimates
The preparation of the Company’s condensed financial statements in conformity with U.S. GAAP requires management to make estimates and assumptions that affect the amounts reported in the financial statements and accompanying disclosures. These estimates are informed by experience and other assumptions that the Company believes are reasonable under the circumstances. Actual results may differ significantly from these estimates.
F-95
Schedule V
HIPPO ENTERPRISES INC. AND SUBSIDIARIES
VALUATION AND QUALIFYING ACCOUNTS
Additions | ||||||||||||||||||||
($in millions) | Balance at beginning of period | Charged to costs and expenses | Charged to other accounts 1 | Deduction- Amounts Written Off 2 | Balance at end of period | |||||||||||||||
Year Ended December 31, 2019 | ||||||||||||||||||||
Valuation allowance for deferred tax assets | $ | 7.7 | $ | 12.0 | $ | — | $ | — | $ | 19.7 | ||||||||||
Allowance for account receivable | $ | — | $ | — | ||||||||||||||||
Provision for commission | $ | 1.7 | $ | — | $ | 12.2 | $ | (1.0 | ) | $ | 12.9 | |||||||||
Year Ended December 31, 2020 | ||||||||||||||||||||
Valuation allowance for deferred tax assets | $ | 19.7 | $ | 19.9 | $ | — | $ | — | $ | 39.6 | ||||||||||
Allowance for account receivable | $ | — | $ | 0.5 | $ | — | $ | — | $ | 0.5 | ||||||||||
Provision for commission | $ | 12.9 | $ | — | $ | 24.1 | $ | (8.8 | ) | $ | 28.2 | |||||||||
| 1 | Additions charged to other accounts are comprised of amounts charged to commission revenue and amounts acquired from Spinnaker. |
| 2 | Deductions are comprised of refund of cancelled policies and payments of commission slide. |
F-96
Part I. Financial Information
Item 1. Financial Statements
HIPPO HOLDINGS INC.
Consolidated Balance Sheets
(In millions, except share and per share data)
June 30, 2021 | December 31, 2020 | |||||||
(Unaudited) | ||||||||
Assets | ||||||||
Investments: | ||||||||
Fixed maturities available-for-sale, | $ | 56.6 | $ | 56.0 | ||||
Total investments | 56.6 | 56.0 | ||||||
Cash and cash equivalents | 364.1 | 452.3 | ||||||
Restricted cash | 46.1 | 40.1 | ||||||
Accounts receivable, net of allowance of $0.4 million and $0.5 million, respectively | 54.0 | 37.1 | ||||||
Reinsurance recoverable on paid and unpaid losses and LAE | 242.8 | 134.1 | ||||||
Prepaid reinsurance premiums | 195.3 | 129.4 | ||||||
Ceding commissions receivable | 34.2 | 21.3 | ||||||
Deferred policy acquisition costs | 0 | 1.9 | ||||||
Capitalized internal use software | 18.7 | 14.7 | ||||||
Goodwill | 48.2 | 47.8 | ||||||
Intangible assets | 34.6 | 33.9 | ||||||
Other assets | 27.2 | 10.8 | ||||||
Total assets | $ | 1,121.8 | $ | 979.4 | ||||
Liabilities, convertible preferred stock, and stockholders’ deficit | ||||||||
Liabilities: | ||||||||
Loss and loss adjustment expense reserve | $ | 195.2 | $ | 105.1 | ||||
Unearned premiums | 216.5 | 150.3 | ||||||
Reinsurance premiums payable | 137.0 | 86.1 | ||||||
Provision for commission | 13.0 | 28.2 | ||||||
Fiduciary liabilities | 28.2 | 17.5 | ||||||
Convertible promissory notes | 299.0 | 273.0 | ||||||
Derivative liability on notes | 162.6 | 113.3 | ||||||
Contingent consideration liability | 11.6 | 12.0 | ||||||
Preferred stock warrant liabilities | 137.5 | 22.9 | ||||||
Accrued expenses and other liabilities | 46.0 | 25.7 | ||||||
Total liabilities | 1,246.6 | 834.1 | ||||||
Commitments and contingencies (Note 10) | ||||||||
Convertible preferred stock: | ||||||||
Preferred stock, $0.000001 par value per share; 46,479,310 shares authorized as of June 30, 2021 and December 31, 2020, respectively; 43,985,178 shares issued and outstanding as of June 30, 2021 and December 31, 2020, respectively; Liquidation preferences of $359.4 million as of June 30, 2021 and December 31, 2020, respectively | 344.8 | 344.8 | ||||||
Stockholder’s deficit | ||||||||
Common stock, $0.000001 par value per share; 83,830,000 shares authorized as of June 30, 2021 and December 31, 2020, respectively; 14,200,750 and 13,307,826 shares issued and outstanding as of June 30, 2021 and December 31, 2020, respectively | 0 | 0 | ||||||
Additional paid-in capital | 65.8 | 56.9 | ||||||
Accumulated other comprehensive (loss) income | (0.3 | ) | 0.1 | |||||
Accumulated deficit | (536.4 | ) | (256.6 | ) | ||||
Total Hippo stockholders’ deficit | (470.9 | ) | (199.6 | ) | ||||
Noncontrolling interest | 1.3 | 0.1 | ||||||
Total stockholders’ deficit | (469.6 | ) | (199.5 | ) | ||||
Total liabilities, convertible preferred stock, and stockholder’s deficit | $ | 1,121.8 | $ | 979.4 | ||||
See Notes to the Consolidated Financial Statements
F-97
HIPPO HOLDINGS INC.
Consolidated Statements of Operations and Comprehensive Loss
(In millions, except share and per share data)
(Unaudited)
Three Months Ended June 30, | Six Months Ended June 30, | |||||||||||||||
2021 | 2020 | 2021 | 2020 | |||||||||||||
Revenue: | ||||||||||||||||
Net earned premium | $ | 10.2 | $ | 2.5 | $ | 19.0 | $ | 4.0 | ||||||||
Commission income, net | 6.5 | 8.4 | 11.6 | 15.5 | ||||||||||||
Service and fee income | 4.1 | 0.8 | 7.1 | 2.1 | ||||||||||||
Net investment income | 0.1 | 0.2 | 0.2 | 0.6 | ||||||||||||
Total revenue | 20.9 | 11.9 | 37.9 | 22.2 | ||||||||||||
Expenses: | ||||||||||||||||
Losses and loss adjustment expenses | 21.4 | 3.3 | 38.7 | 5.2 | ||||||||||||
Insurance related expenses | 8.5 | 4.1 | 16.0 | 8.0 | ||||||||||||
Technology and development | 7.5 | 3.7 | 14.5 | 7.3 | ||||||||||||
Sales and marketing | 22.2 | 17.3 | 46.9 | 35.3 | ||||||||||||
General and administrative | 8.8 | 5.5 | 17.1 | 11.1 | ||||||||||||
Interest and other expense | 36.0 | 2.9 | 183.1 | 4.0 | ||||||||||||
Total expenses | 104.4 | 36.8 | 316.3 | 70.9 | ||||||||||||
Loss before income taxes | (83.5 | ) | (24.9 | ) | (278.4 | ) | (48.7 | ) | ||||||||
Income taxes (benefit) expense | 0.2 | — | 0.3 | — | ||||||||||||
Net loss | (83.7 | ) | (24.9 | ) | (278.7 | ) | (48.7 | ) | ||||||||
Net income (loss) attributable to noncontrolling interests, net of tax | 0.8 | (0.1 | ) | 1.1 | 0 | |||||||||||
Net loss attributable to Hippo | $ | (84.5 | ) | $ | (24.8 | ) | $ | (279.8 | ) | $ | (48.7 | ) | ||||
Other comprehensive income: | ||||||||||||||||
Change in net unrealized gain or loss on investments, net of tax | 0.3 | (0.2 | ) | (0.3 | ) | — | ||||||||||
Comprehensive loss attributable to Hippo | $ | (84.2 | ) | $ | (25.0 | ) | $ | (280.1 | ) | $ | (48.7 | ) | ||||
Per share data: | ||||||||||||||||
Net loss attributable to Hippo - basic and diluted | $ | (84.5 | ) | $ | (24.8 | ) | $ | (279.8 | ) | $ | (48.7 | ) | ||||
Weighted-average shares used in computing net loss per share attributable to Hippo - basic and diluted | 14,134,399 | 12,360,596 | 13,968,160 | 12,236,471 | ||||||||||||
Net loss per share attributable to Hippo - basic and diluted | $ | (5.98 | ) | $ | (2.01 | ) | $ | (20.03 | ) | $ | (3.98 | ) | ||||
See Notes to the Consolidated Financial Statements
F-98
HIPPO HOLDINGS INC.
Consolidated Statements of Changes in Convertible Preferred Stock and Stockholders’ Deficit
(In millions, except share data)
(Unaudited)
Convertible Preferred Stock | Common Stock | Additional Paid-in | Accumulated Other Comprehensive | Accumulated | Total Hippo Stockholders’ | Non controlling | Total Stockholders’ | |||||||||||||||||||||||||||||||||
Shares | Amount | Shares | Amount | Capital | Income (Loss) | Deficit | Deficit | Interests | Deficit | |||||||||||||||||||||||||||||||
Balance at January 1, 2021 | 43,985,178 | $ | 344.8 | 13,307,826 | $ | 0 | $ | 56.9 | $ | 0.1 | $ | (256.6 | ) | $ | (199.6 | ) | $ | 0.1 | $ | (199.5 | ) | |||||||||||||||||||
Net income (loss) | — | — | — | — | — | — | (195.2 | ) | (195.2 | ) | 0.3 | (194.9 | ) | |||||||||||||||||||||||||||
Other comprehensive income | — | — | — | — | — | (0.6 | ) | — | (0.6 | ) | — | (0.6 | ) | |||||||||||||||||||||||||||
Issuance of common stock upon exercise of stock options | — | — | 662,101 | — | 1.9 | — | — | 1.9 | — | 1.9 | ||||||||||||||||||||||||||||||
Vesting of early exercised stock options | — | — | 24,689 | — | 0.2 | — | — | 0.2 | — | 0.2 | ||||||||||||||||||||||||||||||
Repurchase of common stock | — | — | (3,125 | ) | — | — | — | — | — | — | — | |||||||||||||||||||||||||||||
Share-based compensation expense | — | — | — | — | 2.9 | — | — | 2.9 | — | 2.9 | ||||||||||||||||||||||||||||||
Other | — | — | — | — | — | — | (0.1 | ) | (0.1 | ) | 0.1 | — | ||||||||||||||||||||||||||||
Balance at April 1, 2021 | 43,985,178 | $ | 344.8 | 13,991,491 | $ | 0 | $ | 61.9 | $ | (0.5 | ) | $ | (451.9 | ) | $ | (390.5 | ) | $ | 0.5 | $ | (390.0 | ) | ||||||||||||||||||
Net income (loss) | — | — | — | — | — | — | (84.5 | ) | (84.5 | ) | 0.8 | (83.7 | ) | |||||||||||||||||||||||||||
Other comprehensive loss | — | — | — | — | — | 0.2 | — | 0.2 | — | 0.2 | ||||||||||||||||||||||||||||||
Issuance of common stock upon exercise of stock options | — | — | 184,573 | — | 0.6 | — | — | 0.6 | — | 0.6 | ||||||||||||||||||||||||||||||
Vesting of early exercised stock options | — | — | 24,686 | — | 0.2 | — | — | 0.2 | — | 0.2 | ||||||||||||||||||||||||||||||
Share-based compensation expense | — | — | — | — | 3.1 | — | — | 3.1 | — | 3.1 | ||||||||||||||||||||||||||||||
Other | — | — | — | — | — | — | — | — | — | — | ||||||||||||||||||||||||||||||
Balance at June 30, 2021 | 43,985,178 | 344.8 | 14,200,750 | 0 | 65.8 | (0.3 | ) | (536.4 | ) | (470.9 | ) | 1.3 | $ | (469.6 | ) | |||||||||||||||||||||||||
Balance at January 1, 2020 | 36,035,688 | $ | 190.3 | 12,069,742 | $ | 0 | $ | 36.7 | $ | 0.1 | $ | (115.1 | ) | $ | (78.3 | ) | $ | 0 | $ | (78.3 | ) | |||||||||||||||||||
Net income (loss) | — | — | — | — | — | — | (23.9 | ) | (23.9 | ) | — | (23.9 | ) | |||||||||||||||||||||||||||
Other comprehensive income | — | — | — | — | — | 0.2 | — | 0.2 | — | 0.2 | ||||||||||||||||||||||||||||||
Issuance of Series D preferred stock, net of issuance costs | 321,415 | 4.9 | — | — | — | — | — | — | — | — | ||||||||||||||||||||||||||||||
Issuance of common stock upon exercise of stock options | — | — | 82,697 | — | 0.1 | — | — | 0.1 | — | 0.1 | ||||||||||||||||||||||||||||||
Vesting of early exercised stock options | — | — | 38,694 | — | — | — | — | — | — | — | ||||||||||||||||||||||||||||||
Vesting of restricted stock awards | — | — | 10,557 | — | — | — | — | — | — | — | ||||||||||||||||||||||||||||||
Share-based compensation expense | — | — | — | — | 1.0 | — | — | 1.0 | — | 1.0 | ||||||||||||||||||||||||||||||
Other | — | — | — | — | — | — | — | — | 0.1 | 0.1 | ||||||||||||||||||||||||||||||
Balance at March 31, 2020 | 36,357,103 | $ | 195.2 | 12,201,690 | $ | 0 | $ | 37.8 | $ | 0.3 | $ | (139.0 | ) | $ | (100.9 | ) | $ | 0.1 | $ | (100.8 | ) | |||||||||||||||||||
Net income (loss) | — | — | — | — | — | — | (24.8 | ) | (24.8 | ) | (0.1 | ) | (24.9 | ) | ||||||||||||||||||||||||||
Other comprehensive loss | — | — | — | — | — | (0.2 | ) | — | (0.2 | ) | — | (0.2 | ) | |||||||||||||||||||||||||||
Issuance of common stock upon exercise of stock options | — | — | 258,673 | — | 0.5 | — | — | 0.5 | — | 0.5 | ||||||||||||||||||||||||||||||
Vesting of restricted stock awards | — | — | 5,000 | — | — | — | — | — | — | — | ||||||||||||||||||||||||||||||
Share-based compensation expense | — | — | — | — | 1.0 | — | — | 1.0 | — | 1.0 | ||||||||||||||||||||||||||||||
Balance at June 30, 2020 | 36,357,103 | 195.2 | 12,465,363 | 0 | 39.3 | 0.1 | (163.8 | ) | (124.4 | ) | 0 | $ | (124.4 | ) | ||||||||||||||||||||||||||
See Notes to the Consolidated Financial Statements
F-99
HIPPO HOLDINGS INC.
Consolidated Statements of Cash Flows
(In millions)
(Unaudited)
Six Months Ended June 30, 2021 | ||||||||
2021 | 2020 | |||||||
Cash flows from operating activities: | ||||||||
Net loss | $ | (278.7 | ) | $ | (48.7 | ) | ||
Adjustments to reconcile net loss to net cash used in operating activities: | ||||||||
Depreciation and amortization | 5.0 | 3.0 | ||||||
Share–based compensation expense | 5.3 | 1.8 | ||||||
Change in fair value of preferred stock warrant liabilities | 114.6 | 4.1 | ||||||
Change in fair value of contingent consideration liability | 1.3 | — | ||||||
Change in fair value of derivative liability on notes | 46.5 | — | ||||||
Amortization of debt discount | 17.1 | — | ||||||
Non-cash service expense | 7.0 | — | ||||||
Other | 5.4 | 0.3 | ||||||
Changes in assets and liabilities: | ||||||||
Accounts receivable, net | (17.0 | ) | (3.8 | ) | ||||
Reinsurance recoverable on paid and unpaid losses and LAE | (108.7 | ) | — | |||||
Deferred policy acquisition costs | 1.9 | (1.8 | ) | |||||
Ceding commissions receivable | (12.9 | ) | — | |||||
Prepaid reinsurance premiums | (65.9 | ) | (1.2 | ) | ||||
Other assets | (12.5 | ) | (3.7 | ) | ||||
Provision for commission slide and cancellations | (15.2 | ) | 3.2 | |||||
Fiduciary liabilities | 10.8 | 8.7 | ||||||
Accrued expenses and other liabilities | 19.6 | 2.0 | ||||||
Loss and loss adjustment expense reserves | 90.1 | 1.9 | ||||||
Unearned premiums | 66.2 | 9.9 | ||||||
Reinsurance premiums payable | 50.9 | 1.4 | ||||||
Net cash used in operating activities | (69.2 | ) | (22.9 | ) | ||||
Cash flows from investing activities: | ||||||||
Capitalized internal use software costs | (5.5 | ) | (4.3 | ) | ||||
Purchase of intangible assets | (3.3 | ) | — | |||||
Purchases of property and equipment | — | (0.2 | ) | |||||
Purchases of investments | (7.1 | ) | — | |||||
Maturities of investments | 2.0 | 42.6 | ||||||
Sales of investments | 3.7 | 26.7 | ||||||
Net cash (used in) provided by investing activities | (10.2 | ) | 64.8 | |||||
Cash flows from financing activities: | ||||||||
Proceeds from Series D preferred stock, net of issuance costs | — | 4.9 | ||||||
Proceeds from exercise of options | 2.6 | 0.5 | ||||||
Payments of contingent consideration | (1.3 | ) | (2.4 | ) | ||||
Payments for reverse recapitalization and transaction costs | (4.1 | ) | — | |||||
Net cash (used in) provided by financing activities | (2.8 | ) | 3.0 | |||||
Net (decrease) increase in cash, cash equivalents, and restricted cash | (82.2 | ) | 44.9 | |||||
Cash, cash equivalents, and restricted cash at the beginning of the period | 492.4 | 42.1 | ||||||
Cash, cash equivalents, and restricted cash at the end of the period | $ | 410.2 | $ | 87.0 | ||||
Supplemental disclosures of non-cash financing and investing activities: | ||||||||
Convertible promissory notes issued for services | 7.0 | — | ||||||
Unpaid transaction costs | 1.1 | — | ||||||
See Notes to the Consolidated Financial Statements
F-100
HIPPO HOLDINGS INC.
Notes to Consolidated Financial Statements
(Unaudited)
1. Description of Business and Summary of Significant Accounting Policies
Description of Business
Hippo Holdings Inc. (f/k/a Hippo Enterprises Inc.) was originally incorporated under the name Reinvent Technology Partners Z (“RTPZ”) as a blank check company incorporated, a Cayman Islands exempted company, on October 2, 2020 for the purpose of effecting a merger, capital stock-exchange, asset acquisition, share purchase, reorganization, or similar business combination. On August 2, 2021, RTPZ domesticated as a Delaware corporation (the “Domestication”) and consummated the merger of RTPZ Merger Sub Inc. (“Merger Sub”), a Delaware corporation and subsidiary of RTPZ, with and into Hippo Enterprises Inc. (“Hippo”), a Delaware corporation (the “First Merger”), with Hippo surviving the Merger as a wholly owned subsidiary of Hippo Holdings, and, immediately following the First Merger, the merger of Hippo (as the surviving corporation of the First Merger) with and into Hippo Holdings, with Hippo Holdings surviving (the “Second Merger” and, together with the First Merger, the “Mergers”), in each case pursuant to the terms of the Agreement and Plan of Merger, dated as of March 3, 2021, by and among RTPZ, Merger Sub and Hippo.
Hippo Enterprises Inc., the holding company, was incorporated in January 2019 in Delaware (together with its subsidiaries, the “Company”, “Hippo”, “we”, “us”, or “our”). On October 3, 2019, the Company completed a corporate
re-organization
(a common control transaction) to improve its overall corporate structure, in which it brought under its control Hippo Analytics Inc., which was incorporated in October 2015 in Delaware, along with Hippo Analytics Inc.’s other subsidiaries.The Company provides property insurance brokerage services and underwrites insurance policies for customers. The Company’s subsidiaries are licensed insurance companies and agencies including a licensed insurance program manager, producers, and insurance carriers. The Company distributes insurance products and services (e.g., claims processing) through its innovative technology platform aiming to provide the best offering in market coverage and pricing. The Company offers its policiesor through licensed insurance agents. The insurance products offered through Hippo Analytics Inc. primarily include homeowners’ insurance against risks of fire, wind, and theft. The Company is licensed as an insurance agency in 50 states and the District of Columbia and currently underwrites and distributes policies in 36 states as a managing general agent. The Company’s headquarters are located in Palo Alto, California.
direct-to-consumer,
In August 2020, the Company acquired its largest insurance carrier partner, Spinnaker Insurance Company (“Spinnaker”). Spinnaker writes commercial and personal lines products and is a licensed property casualty carrier in all 50 states and the District of Columbia. Beginning in September 2020, in connection with the acquisition of Spinnaker, the Company also retains portions of direct insurance risk for programs underwritten by third parties. The amount of risk retention is varied across the different programs. In January 2020, the Company began assuming insurance risk of policies underwritten by Hippo through a wholly owned Cayman domiciled insurance captive, RH Solutions Insurance Ltd. (“RHS”).
Basis of Presentation and Consolidation
The accompanying interim consolidated financial statements have been prepared in conformity with U.S. generally accepted accounting principles (“GAAP”) and are consistent in all material respects with those applied in the Company’s financial statements for the year ended December 31, 2020 included in Reinvent Technology Partners Z prospectus on Form
S-4/A
filed with the Securities and Exchange Commission (the “SEC”) on May 11, 2021. All intercompany transactions have been eliminated in consolidation. The Company bases its estimates on historical experience and on various other assumptions that the Company believes to be reasonable under the circumstances.F-101
HIPPO HOLDINGS INC.
Notes to Consolidated Financial Statements
(Unaudited)
The interim financial information is unaudited, but reflects all normal recurring adjustments that are, in the opinion of management, necessary to fairly present the information set forth herein. Interim results are not necessarily indicative of the results for a full year.
Reclassifications
Certain amounts in the prior period financial statements have been reclassified to conform to the presentation of the current period financial statements. These reclassifications had no effect on previously reported revenue, expenses, net loss or the consolidate balance sheets.
Use of Estimates
The preparation of the Company’s consolidated financial statements in conformity with U.S. GAAP requires management to make estimates that affect the reported amounts of assets and liabilities, disclosure of contingent assets and liabilities at the date of the consolidated financial statements, and the reported amounts of revenues and expenses during the reporting periods. Significant items subject to such estimates and assumptions include, but are not limited to, loss and loss adjustment expense (“LAE”) reserves, provision for commission slide and cancellations, reinsurance recoverable on paid and unpaid losses and LAE, the fair values of investments, common stock, share-based awards, preferred stock warrant liabilities, contingent consideration liabilities, embedded derivative liabilities, acquired intangible assets and goodwill, deferred tax assets and uncertain tax positions, and revenue recognition. The Company evaluates these estimates on an ongoing basis. These estimates are informed by experience and other assumptions that the Company believes are reasonable under the circumstances. Actual results may differ significantly from these estimates.
Recent Accounting Pronouncements
Emerging Growth Company
The Company currently qualifies as an “emerging growth company” under the Jumpstart Our Business Startups Act of 2012, and is provided the option to adopt new or revised accounting guidance either (i) within the same periods as those otherwise applicable to
non-emerging
growth companies or (ii) within the same time periods as private companies.In certain cases, as indicated below, management has exercised the opt out election when it determines it is preferable to take advantage of early adoption provisions offered within the applicable guidance.
Accounting Pronouncements Recently Adopted
Internal-Use
SoftwareIn August 2018, the FASB issued ASU No.. The intent of this pronouncement is to align the requirements for capitalizing implementation costs incurred in a cloud computing arrangement that is a service contract with the requirements for capitalizing implementation costs incurred to develop or obtain internal use software as defined in ASC
2018-15,
Intangibles — Goodwill and Other — Internal Use
Software (Subtopic
350-40):
Customer’s Accounting for Implementation Costs Incurred in a Cloud Computing Arrangement That Is a Service Contract350-40.
ASU2018-15 is
effective for fiscal years beginning after December 15, 2020, and interim periods within those fiscal years. The Company adopted this new guidance on a prospective basis on January 1, 2021. The adoption of this guidance did not have a material effect on the Company’s consolidated financial statements.F-102
HIPPO HOLDINGS INC.
Notes to Consolidated Financial Statements
(Unaudited)
Accounting Pronouncements Not Yet Adopted
In February 2016, the FASB issued ASU No.(“ASU Lessees will be required to recognize aasset and a lease liability for virtually all of their leases (other than leases that meet the definition of a short-term lease). The liability will be equal to the present value of future lease payments. The asset will be based on the liability, subject to adjustment, such as for initial direct costs. For income statement purposes, a dual model was retained, requiring leases to be classified as either operating or finance leases. Operating leases will result in straight-line expense (similar to current operating leases) while finance leases will result in a front-loaded expense pattern (similar to current capital leases). This ASU is effective for annual reporting periods beginning after December 15, 2021, and interim reporting periods beginning after December 15, 2022. The adoption of the new standard is expected to result in the recognition of lease liabilities and right-of-use assets as of January 1, 2022. The Company is evaluating the potential impact of this pronouncement.
2016-02,
Leases (Topic 842)
2016-02”)
.
right-of-use
In June 2016, the FASB issued ASU No.(“ASU
2016-13,
Financial instruments — Credit Losses (Topic 326): Measurement of Credit Losses on Financial Instruments
2016-13”),
and subsequent related ASUs, which amends the guidance on the impairment of financial instruments by requiring measurement and recognition of expected credit losses for financial assets held. ASU2016-13
is effective for fiscal years, and for interim periods within the fiscal years, beginning after December 15, 2022. The Company is currently evaluating the impact on the Company’s consolidated financial statements.In December 2019, the FASB issued ASU No.. ASU
2019-12,
Income Taxes (Topic 740): Simplifying the Accounting for Income Taxes
2019-12 removes
certain exceptions to the general principles in Topic 740 and clarifies and amends existing guidance to improve consistent application. This ASU will be effective for annual periods beginning after December 15, 2021, and interim periods beginning after December 15, 2020. ASU2019-12
will be effective for private entities for annual periods beginning after December 15, 2021, and interim periods beginning after December 15, 2020, with early adoption permitted. The Company expects to adopt ASU2019-12
under the private company transition guidance beginning January 1, 2022 and does not expect the adoption of this standard to have a material impact on the Company’s consolidated financial statements.In August 2020, the FASB issued ASU, which simplifies the accounting for convertible instruments by reducing the number of accounting models available for convertible debt instruments. This guidance also eliminates the treasury stock method to calculate diluted earnings per share for convertible instruments and requires the use of the
No. 2020-06,
Debt — Debt with Conversion and Other Options (Subtopic
470-20)
and Derivatives and Hedging — Contracts in Entity’s Own Equity (Subtopic815-40):
Accounting for Convertible Instruments and Contracts in an Entity’s Own Equityif-converted
method. This ASU is effective for fiscal years beginning after December 15, 2023, and interim periods within those fiscal years. The Company is currently evaluating the timing of adoption and the impact on the consolidated financial statements.F-103
HIPPO HOLDINGS INC.
Notes to Consolidated Financial Statements
(Unaudited)
2. Investments
The amortized cost and fair value of fixed maturities securities are as follows (in millions):
June 30, 2021 | ||||||||||||||||
Amortized Cost | Unrealized Gains | Unrealized Losses | Fair Value | |||||||||||||
Fixed maturities available-for-sale: | ||||||||||||||||
U.S. government and agencies | 10.0 | 0 | 0 | 10.0 | ||||||||||||
States, and other territories | 5.9 | 0 | 0 | 5.9 | ||||||||||||
Corporate securities | 18.5 | 0 | (0.1 | ) | 18.4 | |||||||||||
Foreign securities | 0.3 | 0 | 0 | 0.3 | ||||||||||||
Residential mortgage-backed securities | 10.7 | 0 | (0.1 | ) | 10.6 | |||||||||||
Commercial mortgage-backed securities | 5.1 | 0 | (0.1 | ) | 5.0 | |||||||||||
Asset backed securities | 6.4 | 0 | 0 | 6.4 | ||||||||||||
Total | $ | 56.9 | $ | 0 | $ | (0.3 | ) | $ | 56.6 | |||||||
December 31, 2020 | ||||||||||||||||
Amortized Cost | Unrealized Gains | Unrealized Losses | Fair Value | |||||||||||||
Fixed maturities available-for-sale: | ||||||||||||||||
U.S. government and agencies | 10.1 | 0 | 0 | 10.1 | ||||||||||||
States, and other territories | 5.1 | 0 | 0 | 5.1 | ||||||||||||
Corporate securities | 17.4 | 0 | 0 | 17.4 | ||||||||||||
Foreign securities | 0.8 | 0 | 0 | 0.8 | ||||||||||||
Residential mortgage-backed securities | 12.9 | 0 | 0 | 12.9 | ||||||||||||
Commercial mortgage-backed securities | 5.4 | 0.1 | 0 | 5.5 | ||||||||||||
Asset backed securities | 4.2 | 0 | 0 | 4.2 | ||||||||||||
Total | $ | 55.9 | $ | 0.1 | �� | $ | 0 | $ | 56.0 | |||||||
As of June 30, 2021, 0securities have been in a continuous unrealized loss position for greater than 12 months. There were 0other-than-temporary impairments recognized for the three month periods ended June 30, 2021 and 2020.
F-104
HIPPO HOLDINGS INC.
Notes to Consolidated Financial Statements
(Unaudited)
The amortized cost and fair value of fixed maturities securities by contractual maturity are as follows (in millions):
June 30, 2021 | ||||||||
Amortized Cost | Fair Value | |||||||
Due to mature: | ||||||||
One year or less | $ | 9.3 | $ | 9.3 | ||||
After one year through five years | 21.1 | 21.1 | ||||||
After five years | 4.2 | 4.1 | ||||||
After ten years | 0.1 | 0.1 | ||||||
Residential mortgage-backed securities | 10.7 | 10.6 | ||||||
Commercial mortgage-backed securities | 5.1 | 5.0 | ||||||
Asset backed securities | 6.4 | 6.4 | ||||||
Total fixed maturities available-for-sale | $ | 56.9 | $ | 56.6 | ||||
Expected maturities will differ from contractual maturities because issuers may have the right to call or prepay obligations with or without call or prepayment penalties.
Net realized gains on fixed maturity securities and short-term investments were insignificant for the periods ended June 30, 2021 and 2020, respectively.
The Company’s net investment income is comprised of the following (in millions):
Three Months Ended June 30, | Six Months Ended June 30, | |||||||||||||||
2021 | 2020 | 2021 | 2020 | |||||||||||||
Fixed maturities income | $ | 0.1 | $ | 0.2 | $ | 0.2 | $ | 0.6 | ||||||||
Total gross investment income | 0.1 | 0.2 | 0.2 | 0.6 | ||||||||||||
Investment expenses | 0 | 0 | 0 | 0 | ||||||||||||
Net investment income | $ | 0.1 | $ | 0.2 | $ | 0.2 | $ | 0.6 | ||||||||
F-105
HIPPO HOLDINGS INC.
Notes to Consolidated Financial Statements
(Unaudited)
Pursuant to certain regulatory requirements, the Company is required to hold assets on deposit with various state insurance departments for the benefit of policyholders. These special deposits are included in fixed maturities,on the consolidated balance sheets. The following table reflects special deposits (in millions):
available-for-sale
June 30, 2021 | ||||||||
Amortized Cost | Fair Value | |||||||
State | ||||||||
Illinois | $ | 1.6 | $ | 1.6 | ||||
Colorado | 1.5 | 1.5 | ||||||
Nevada | 0.2 | 0.2 | ||||||
North Carolina | 0.3 | 0.3 | ||||||
Virginia | 0.3 | 0.4 | ||||||
New Mexico | 0.3 | 0.4 | ||||||
New York | 3.1 | 3.1 | ||||||
Vermont | 0.3 | 0.3 | ||||||
Massachusetts | 0.1 | 0.1 | ||||||
Florida | 0.3 | 0.3 | ||||||
Georgia | 0.1 | 0.1 | ||||||
Total states | $ | 8.1 | $ | 8.3 | ||||
3. Cash, Cash Equivalents, and Restricted Cash
The following table sets forth the cash, cash equivalents, and restricted cash (in millions):
June 30, 2021 | December 31, 2020 | |||||||
Cash and cash equivalents: | ||||||||
Cash | $ | 126.2 | $ | 56.7 | ||||
Money market funds | 237.9 | 372.1 | ||||||
Treasury bills | 0 | 23.5 | ||||||
Total cash and cash equivalents | 364.1 | 452.3 | ||||||
Restricted cash: | ||||||||
Fiduciary assets | 28.0 | 12.1 | ||||||
Letters of credit and cash on deposit | 18.1 | 28.0 | ||||||
Total restricted cash | 46.1 | 40.1 | ||||||
Total cash, cash equivalents, and restricted cash | $ | 410.2 | $ | 492.4 | ||||
F-106
HIPPO HOLDINGS INC.
Notes to Consolidated Financial Statements
(Unaudited)
4. Fair Value Measurement
The following table summarizes the Company’s fair value hierarchy for its financial assets and liabilities measured at fair value on a recurring basis (in millions):
June 30, 2021 | ||||||||||||||||
Level 1 | Level 2 | Level 3 | Total | |||||||||||||
Financial assets: | ||||||||||||||||
Cash equivalents: | ||||||||||||||||
Money market funds | 237.9 | $ | 0 | $ | 0 | $ | 237.9 | |||||||||
Total cash equivalents | $ | 237.9 | $ | 0 | $ | 0 | $ | 237.9 | ||||||||
Fixed maturities available-for-sale: | ||||||||||||||||
U.S. government and agencies | $ | 10.0 | $ | 0 | $ | 0 | $ | 10.0 | ||||||||
States, and other territories | 0 | 5.9 | 0 | 5.9 | ||||||||||||
Corporate securities | 0 | 18.4 | 0 | 18.4 | ||||||||||||
Foreign securities | 0 | 0.3 | 0 | 0.3 | ||||||||||||
Residential mortgage-backed securities | 0 | 10.6 | 0 | 10.6 | ||||||||||||
Commercial mortgage-backed securities | 0 | 5.0 | 0 | 5.0 | ||||||||||||
Asset backed securities | 0 | 6.4 | 0 | 6.4 | ||||||||||||
Total fixed maturities available-for-sale | 10.0 | 46.6 | 0 | 56.6 | ||||||||||||
Total financial assets | $ | 247.9 | $ | 46.6 | $ | 0 | $ | 294.5 | ||||||||
Financial liabilities: | ||||||||||||||||
Derivative liability on convertible promissory notes | $ | 0 | $ | 0 | $ | 162.6 | $ | 162.6 | ||||||||
Contingent consideration liability | 0 | 0 | 11.6 | 11.6 | ||||||||||||
Preferred stock warrant liabilities | 0 | 0 | 137.5 | 137.5 | ||||||||||||
Total financial liabilities | $ | 0 | $ | 0 | $ | 311.7 | $ | 311.7 | ||||||||
F-107
HIPPO HOLDINGS INC.
Notes to Consolidated Financial Statements
(Unaudited)
December 31, 2020 | ||||||||||||||||
Level 1 | Level 2 | Level 3 | Total | |||||||||||||
Financial assets: | ||||||||||||||||
Cash equivalents: | ||||||||||||||||
Money market funds | $ | 372.1 | $ | 0 | $ | 0 | $ | 372.1 | ||||||||
Treasury Bills | 23.5 | 0 | 0 | 23.5 | ||||||||||||
Total cash equivalents | $ | 395.6 | $ | 0 | $ | 0 | $ | 395.6 | ||||||||
Fixed maturities available-for-sale: | ||||||||||||||||
U.S. government and agencies | $ | 10.1 | $ | 0 | $ | 0 | $ | 10.1 | ||||||||
States, and other territories | 0 | 5.1 | 0 | 5.1 | ||||||||||||
Corporate securities | 0 | 17.4 | 0 | 17.4 | ||||||||||||
Foreign securities | 0 | 0.8 | 0 | 0.8 | ||||||||||||
Residential mortgage-backed securities | 0 | 12.9 | 0 | 12.9 | ||||||||||||
Commercial mortgage-backed securities | 0 | 5.5 | 0 | 5.5 | ||||||||||||
Asset backed securities | 0 | 4.2 | 0 | 4.2 | ||||||||||||
Total fixed maturities available-for-sale | $ | 10.1 | $ | 45.9 | $ | 0 | $ | 56.0 | ||||||||
Total financial assets | $ | 405.7 | $ | 45.9 | $ | 0 | $ | 451.6 | ||||||||
Financial liabilities: | ||||||||||||||||
Derivative liability on convertible promissory notes | $ | 0 | $ | 0 | $ | 113.3 | $ | 113.3 | ||||||||
Contingent consideration liability | 0 | 0 | 12.0 | 12.0 | ||||||||||||
Preferred stock warrant liabilities | 0 | 0 | 22.9 | 22.9 | ||||||||||||
Total financial liabilities | $ | 0 | $ | 0 | $ | 148.2 | $ | 148.2 | ||||||||
The Company’s policy is to recognize transfers into and transfers out of fair value hierarchy levels at the end of each reporting period. During the six months ended June 30, 2021 and December 31, 2020 there were 0transfers between levels in the fair value hierarchy.
Preferred Stock Warrant Liabilities
The table below presents changes in the preferred stock warrant liability valued using Level 3 inputs (in millions):
2021 | 2020 | |||||||
Balance as of January 1, | $ | 22.9 | $ | 6.7 | ||||
Changes in fair value | 114.6 | 4.1 | ||||||
Balance as of June 30, | $ | 137.5 | $ | 10.8 | ||||
F-108
HIPPO HOLDINGS INC.
Notes to Consolidated Financial Statements
(Unaudited)
Contingent Consideration
The contingent consideration is
re-valued
to fair value at the end of each reporting period using the present value of future payments based on an estimate of revenue and customer renewals of the acquiree. There is 0 limit to the maximum potential contingent consideration as the consideration is based on acquired customer retention. The table below presents the changes in the contingent consideration liability valued using Level 3 inputs (in millions):2021 | 2020 | |||||||
Balance as of January 1, | $ | 12.0 | $ | 13.8 | ||||
Payments of contingent consideration | (1.7 | ) | (3.2 | ) | ||||
Changes in fair value | 1.3 | 0 | ||||||
Balance as of June 30, | $ | 11.6 | $ | 10.6 | ||||
Derivative liability on notes
The embedded derivative liabilities on the issued and outstanding convertible promissory notes are
re-valued
to the current fair value at the end of each reporting period using the income-based approach based on the with or without 10% discount basis. As of June 30, 2021, the expected time to conversion used in the valuation was0.1-2.9
years. The table below presents the changes in derivative liability on convertible promissory notes valued using Level 3 inputs (in millions):2021 | ||||
Balance as of January 1, | $ | 113.3 | ||
Initial measurement of new derivative | 2.8 | |||
Changes in fair value | 46.5 | |||
Balance as of June 30, | $ | 162.6 | ||
5. Intangible Assets
June 30, 2021 | December 31, 2020 | |||||||||||||||||||||||||||
Weighted- Average Useful Life Remaining (in years) | Gross Carrying Amount | Accumulated Amortization | Net Carrying Amount | Gross Carrying Amount | Accumulated Amortization | Net Carrying Amount | ||||||||||||||||||||||
| (in millions) | (in millions) | |||||||||||||||||||||||||||
Agency and carrier | 7.9 | $ | 13.5 | $ | (0.9 | ) | $ | 12.6 | $ | 13.5 | $ | (0.1 | ) | $ | 13.4 | |||||||||||||
State licenses and domain name | Indefinite | 10.5 | 0 | 10.5 | 7.1 | 0 | 7.1 | |||||||||||||||||||||
Customer relationships | 3.8 | 13.2 | (4.9 | ) | 8.3 | 13.2 | (3.8 | ) | 9.4 | |||||||||||||||||||
Developed technology | 1.3 | 3.6 | (2.0 | ) | 1.6 | 3.6 | (1.4 | ) | 2.2 | |||||||||||||||||||
VOBA | 1.2 | 0.1 | 0 | 0.1 | 0.1 | 0 | 0.1 | |||||||||||||||||||||
Other | 7.1 | 1.9 | (0.4 | ) | 1.5 | 1.9 | (0.2 | ) | 1.7 | |||||||||||||||||||
Total intangible assets, net | $ | 42.8 | $ | (8.2 | ) | $ | 34.6 | $ | 39.4 | $ | (5.5 | ) | $ | 33.9 | ||||||||||||||
F-109
HIPPO HOLDINGS INC.
Notes to Consolidated Financial Statements
(Unaudited)
Amortization expense related to intangible assets was $2.7 million and $1.8 million for the six months ended June 30, 2021 and 2020, respectively, and is included in technology and development expenses for developed technology, sales and marketing expenses for customer relationships, agency relationships, carrier relationships and other. Amortization expense related to value of business acquired (VOBA) is included in general and administrative expenses in the accompanying consolidated statements of operations and comprehensive loss.
6. Accrued Expenses and Other Liabilities
June 30, 2021 | December 31, 2020 | |||||||
| (in millions) | ||||||||
Accrued wages and commissions | $ | 7.0 | $ | 5.0 | ||||
Deferred revenue | 7.2 | 1.7 | ||||||
Advances from customers | 9.6 | 4.4 | ||||||
Accrued licenses and taxes | 3.0 | 2.5 | ||||||
Accrued transaction cost | 1.1 | 0 | ||||||
Accrued interest | 0.9 | 0.8 | ||||||
Other | 17.2 | 11.3 | ||||||
Total accrued expenses and other liabilities | $ | 46.0 | $ | 25.7 | ||||
7. Loss and Loss Adjustment Expense Reserves
The reconciliation of the beginning and ending reserve balances for losses and loss adjustment expenses, net of reinsurance is summarized as follows for the six months ended June 30, (in millions):
2021 | 2020 | |||||||
Reserve for losses and LAE gross of reinsurance recoverables on unpaid losses and LAE as of beginning of the period | $ | 105.1 | $ | 0 | ||||
Reinsurance recoverables on unpaid losses | (92.1 | ) | 0 | |||||
Reserve for losses and LAE, net of reinsurance recoverables as of beginning of the period | 13.0 | 0 | ||||||
Add: Incurred losses and LAE, net of reinsurance, related to: | ||||||||
Current year | 39.0 | 5.3 | ||||||
Prior years | (0.3 | ) | (0.1 | ) | ||||
Total incurred | 38.7 | 5.2 | ||||||
Deduct: Loss and LAE payments, net of reinsurance, related to: | ||||||||
Current year | (19.5 | ) | (3.3 | ) | ||||
Prior year | (5.1 | ) | 0 | |||||
Total paid | (24.6 | ) | (3.3 | ) | ||||
Reserve for losses and LAE, net of reinsurance recoverables at end of period | 27.1 | 1.9 | ||||||
Add: Reinsurance recoverables on unpaid losses and LAE at end of period | 168.1 | 0 | ||||||
Reserve for losses and LAE gross of reinsurance recoverables on unpaid losses and LAE as of end of the period | $ | 195.2 | $ | 1.9 | ||||
F-110
HIPPO HOLDINGS INC.
Notes to Consolidated Financial Statements
(Unaudited)
Included in the Loss and LAE for the six months ended June 30, 2021 are losses related to weather-related loss experience, including the Texas winter storm in February 2021 and the wind and hail storms in April 2021.
Net incurred losses and LAE experienced favorable development of $
0.3
million and0.1
million for the six months ended June 30, 2021 and 2020, respectively. These changes are generally a result of ongoing analysis of recent loss development trends. Loss and LAE are updated as additional information becomes known.Unpaid loss and LAE includes anticipated salvage and subrogation recoverable. The amount of anticipated salvage and subrogation recoverable is insignificant as of June 30, 2021.
8. Reinsurance
The Company has entered into quota share and excess of loss contracts, which may have catastrophe exposure. The Company is not relieved of its primary obligations to policyholders in the event of a default or the insolvency of its reinsurers, therefore a credit exposure exists to the extent that any reinsurer fails to meet its obligations in the reinsurance agreements. To mitigate this exposure to reinsurance insolvencies, the Company evaluates the financial condition of its reinsurers and, in certain circumstances, holds substantial collateral (in the form of letters of credit, trusts and funds withheld) as security under the reinsurance agreements.
NaN
amounts have been recorded in the three and six months ended June 30, 2021 and 2020 for amounts anticipated to be uncollectible or for the anticipated failure of a reinsurer to meet its obligations under the contracts.For its primary reinsurance treaty incepting in 2021, the Company secured quota share reinsurance from a diverse panel of nine third-party reinsurers with A.M. Best ratings of
A-
or better. A total of approximately11
% of the risk was retained either by Spinnaker or Hippo’s captive, RHS, which aligns interests with third-party reinsurers. Two of the reinsurers, representing approximately one third of the program, are three-year agreements.The following tables reflect amounts affecting the statements of operations and comprehensive loss for ceded reinsurance for the three and six months ended June 30, 2021 and 2020 (in millions):
For the Three Months Ended June 30, | ||||||||||||||||||||||||
2021 | 2020 | |||||||||||||||||||||||
| Written premiums | Earned premiums | Loss and LAE incurred | Written premiums | Earned premiums | Loss and LAE incurred | |||||||||||||||||||
Direct | $ | 129.3 | $ | 83.9 | $ | 135.7 | $ | 0 | $ | 0 | $ | 0 | ||||||||||||
Assumed | (0.7 | ) | 3.2 | 4.8 | 5.5 | 3.1 | 3.3 | |||||||||||||||||
Gross | 128.6 | 87.1 | 140.5 | 5.5 | 3.1 | 3.3 | ||||||||||||||||||
Ceded | (116.4 | ) | (76.9 | ) | (119.1 | ) | 0 | (0.6 | ) | 0 | ||||||||||||||
Net | $ | 12.2 | $ | 10.2 | $ | 21.4 | $ | 5.5 | $ | 2.5 | $ | 3.3 | ||||||||||||
F-111
HIPPO HOLDINGS INC.
Notes to Consolidated Financial Statements
(Unaudited)
For the Six Months Ended June 30, | ||||||||||||||||||||||||
2021 | 2020 | |||||||||||||||||||||||
| Written premiums | Earned premiums | Loss and LAE incurred | Written premiums | Earned premiums | Loss and LAE incurred | |||||||||||||||||||
Direct | $ | 224.3 | $ | 154.9 | $ | 276.1 | $ | 0 | $ | 0 | $ | 0 | ||||||||||||
Assumed | 3.4 | 6.6 | 10.1 | 14.7 | 4.8 | 5.2 | ||||||||||||||||||
Gross | 227.7 | 161.5 | 286.2 | 14.7 | 4.8 | 5.2 | ||||||||||||||||||
Ceded | (208.4 | ) | (142.5 | ) | (247.5 | ) | (2.0 | ) | (0.8 | ) | 0 | |||||||||||||
Net | $ | 19.3 | $ | 19.0 | $ | 38.7 | $ | 12.7 | $ | 4.0 | $ | 5.2 | ||||||||||||
9. Convertible Promissory Notes and Derivative Liability
In February 2021, the Company issued an additional convertible promissory note of $7.0 million that matures in
February 2024
for management services provided. The convertible promissory notes bear interest at 2.5% compounded semi-annually. If conversion event has not occurred, this annual interest rate will automatically increase by 2.5% up to 7.5% after certain periods specified in the Purchase Agreement. After 15 months from issuance, if a conversion event has not occurred, interest shall accrue at 5% per annum, compounding semi-annually, unless the Company has filed anS-1
or signed a letter of intent or definitive agreements with respect to a qualified private round or public issuer merger, in which case the interest rate increase to 5% shall apply after 21 months from issuance, provided a conversion on event has not occurred. With a prior written consent from the investor, the Company may repay the convertible promissory notes and interest, in whole or in part, any time in cash before the maturity date without a prepayment penalty. The convertible promissory notes contain an embedded derivative.The fair value of the embedded derivative upon issuance of this note was $
2.8
million. Interest expense is accreted on the convertible promissory notes between issuance and maturity dates with the expectation that principal and interest are likely to be settled in shares of common stock of the Company at a variable conversion price calculated at 90% of trade price of common stock of the Company. For additional information on derivative liability, refer to Note 4 of these interim consolidated financial statements.As of June 30, 2021, the Company had aggregate outstanding convertible promissory notes of $299.0 million, net of $
90.2
million of debt discount and issuance costs, with varying maturities. As of December 31, 2020, the Company had aggregate outstanding convertible promissory notes of $273.0
million, net of $104.5
million of debt discount and issuance costs.10. Commitments and Contingencies
Operating Leases
The Company leases office space
under non-cancelable operating
leases with various expiration dates through 2029. Rent expense, which is recognized on a straight-line basis over the lease term, for the three and six months ended June 30, 2021 were $0.7 million and $1.5 million, respectively and for the three and six months ended June 30, 2020 were $0.7 million and $1.4 million, respectively.Litigation
On June 4, 2021, Nicholas Kalair filed a putative class action complaint against Hippo in the U.S. District Court, Northern District of California, alleging violations of the Telephone Consumer Protection Act,
F-112
HIPPO HOLDINGS INC.
Notes to Consolidated Financial Statements
(Unaudited)
individually and on behalf of a putative nationwide class of individuals who received calls or voice messages from Hippo or its agents in the
four
years prior to the filing of the complaint. Plaintiff voluntarily dismissed the lawsuit without prejudice on July 23, 2021.11. Convertible Preferred Stock
There was no change in preferred stock during the six month period ended June 30, 2021 (in millions, except for share and per share data).
June 30, 2021 | ||||||||||||||||||||
Issuance Price Per Share | Authorized Shares | Shares Issued and Outstanding | Net Carrying Value | Liquidation Preference | ||||||||||||||||
Preferred A-1 Stock | $ | 0.56965 | 5,889,829 | 5,889,829 | $ | 3.4 | $ | 3.4 | ||||||||||||
Preferred A-2 Stock | 1.57432 | 7,015,787 | 6,987,125 | 10.9 | 11.0 | |||||||||||||||
Preferred B Stock | 3.59757 | 6,949,142 | 6,949,142 | 24.9 | 25.0 | |||||||||||||||
Preferred C Stock | 7.04471 | 9,936,529 | 9,936,528 | 56.1 | 70.0 | |||||||||||||||
Preferred C-1 Stock | 11.74119 | 2,465,454 | 0 | 0 | 0 | |||||||||||||||
Preferred D Stock | 15.16420 | 6,594,479 | 6,594,479 | 99.8 | 100.0 | |||||||||||||||
Preferred E Stock | 19.66420 | 7,628,090 | 7,628,075 | 149.7 | 150.0 | |||||||||||||||
Total | 46,479,310 | 43,985,178 | $ | 344.8 | $ | 359.4 | ||||||||||||||
Preferred Stock Warrant Liabilities
In connection with obtaining a line of credit in March 2017, the Company issued 28,662 warrants to purchase Series
A-2
Preferred Stock. The warrants vested immediately and are exercisable up to March 13, 2027. In case the Company completes its IPO, within the three-year period immediately prior to the expiration date, the expiration date will automatically be extended to three years from the IPO date.In connection with the issuance of Series C Preferred Stock, in October 2018, the Company issued to an investor 2,465,454 warrants to purchase Series
C-1
Preferred Stock. The warrants are exercisable upon vesting. In April 2020, the warrants were fully vested. The warrants will expire at the earliest of a deemed liquidation event, stock sale, IPO, or October 25, 2022.The preferred stock warrant liability is remeasured at each reporting period end with changes in fair value upon remeasurement being recorded within interest and other expense in the consolidated statements of operations and comprehensive loss. See Note 4 for additional information on the fair value of preferred stock warrant liability.
The Company used the Black-Scholes-Merton option-pricing model, which incorporates assumptions and estimates, to value the preferred stock warrants. Estimates and assumptions impacting the fair value measurement include the fair value per share of the underlying shares of the Company’s Series
A-2
and SeriesC-1
convertible preferred stock, risk free interest rate, expected dividend yield, expected volatility of the price of the underlying preferred stock, and an expected term of the preferred stock warrants.The most significant assumption impacting the fair value of the preferred stock warrants is the fair value of the Series
A-2
andC-1
Preferred Stock as of each remeasurement date. The Company determined the fair value per share of the underlying preferred stock by taking into consideration the most recent sales of its preferred stock, results obtained from third-party valuations, and additional factors that were deemed relevant.F-113
HIPPO HOLDINGS INC.
Notes to Consolidated Financial Statements
(Unaudited)
The following assumptions were used in determining fair value of the convertible preferred stock warrant liabilities:
June 30, 2021 | December 31, 2020 | |||||||
Fair value of Series A-2 Preferred Stock | $ | 66.64 | $ | 18.25 | ||||
Fair value of Series C-1 Preferred Stock | $ | 66.74 | $ | 20.09 | ||||
Exercise price A-2 Preferred Stock | $ | 1.57 | $ | 1.57 | ||||
Exercise price C-1 Preferred Stock | $ | 11.74 | $ | 11.74 | ||||
Expected term (in years) | 1.3-5.7 | 1.8-6.2 | ||||||
Expected volatility | 26.6%-29.1% | 29.0%-40.7% | ||||||
Risk-free interest rate | 0.1%-1.1% | 0.1%-0.5% | ||||||
Expected dividend yield | 0% | 0% | ||||||
The following convertible preferred stock warrants were outstanding with the related fair values (in millions, except for share and per share data):
June 30, 2021 | December 31, 2020 | |||||||||||||||||||
Series | Exercise Price Per Share | Warrant Shares Outstanding | Fair Value | Warrant Shares Outstanding | Fair Value | |||||||||||||||
A-2 | $ | 1.57 | 28,662 | $ | 1.9 | 28,662 | $ | 0.5 | ||||||||||||
C-1 | 11.74 | 2,465,454 | 135.6 | 2,465,454 | 22.4 | |||||||||||||||
Total | 2,494,116 | $ | 137.5 | 2,494,116 | $ | 22.9 | ||||||||||||||
12. Stockholders’ Deficit
Common Stock
The Company’s Certificate of Incorporation, as amended and restated, authorizes the Company to issue up to 83,830,000 shares of common stock with par value of $0.000001 per share. Each share of common stock is entitled to one vote. The holders of the common stock are also entitled to receive dividends whenever funds are legally available and when declared by the board of directors. No dividends have been declared or paid since inception.
The Company had reserved shares of common stock for future issuance as follows:
June 30, 2021 | December 31, 2020 | |||||||
Convertible preferred stock | 43,985,178 | 43,985,178 | ||||||
Warrants to purchase preferred stock | 2,494,116 | 2,494,116 | ||||||
Warrants to purchase common stock | 9,476,102 | 9,476,102 | ||||||
Common stock options outstanding | 9,449,400 | 10,382,771 | ||||||
Shares available for future grant of equity awards | 2,617,273 | 2,627,921 | ||||||
Total | 68,022,069 | 68,966,088 | ||||||
F-114
HIPPO HOLDINGS INC.
Notes to Consolidated Financial Statements
(Unaudited)
Common Stock Warrants
There was 0 change in the number of common stock warrants issued during the three and six month period ended June 30, 2021. The following common stock warrants were outstanding as of June 30, 2021:
Issue Date | Exercise Price Per Share | Number of Warrants | Expiration Date | Outstanding as of June 30, 2021 | ||||||||||||
December 11, 2017 | $ | 0.01 | 4,738,051 | December 31, 2022 | 4,738,051 | |||||||||||
February 19, 2018 | $ | 0.01 | 4,738,051 | August 19, 2022 | 4,738,051 | |||||||||||
Share-Based Compensation Plan
Adopted in 2019 and replacing the 2016 Stock Option and Grant Plan, the 2019 Stock Option and Grant Plan (“the 2019 Stock Plan”) provides for the direct award or sale of shares, the grant of options to purchase shares and the grant of restricted stock units (“RSUs”) to employees, consultants, and outside directors of the Company. Stock options under the plan may be either incentive stock options (“ISOs”) or
non-qualified
stock options (“NSOs”), with an exercise price of not less than 100% of fair market value on the grant date, with a term less than or equal to ten years. The vesting period of each option and RSU shall be as determined by a committee of the Company’s board of directors but is generally over four years.Stock Options
The following table summarizes option activity under the plan:
Options Outstanding | Weighted-Average Remaining | Aggregate Intrinsic | ||||||||||||||
Number of Shares | Weighted Average Exercise Price | Contract Term (In Years) | Value (In Millions) | |||||||||||||
Outstanding as of January 1, 2021 | 10,382,771 | $ | 4.88 | 8.90 | $ | 108.9 | ||||||||||
Granted | 569,350 | 25.44 | ||||||||||||||
Exercised | (846,674 | ) | 2.56 | |||||||||||||
Forfeited | (649,324 | ) | 6.67 | |||||||||||||
Expired | (6,723 | ) | 3.95 | |||||||||||||
Outstanding as of June 30, 2021 | 9,449,400 | $ | 6.20 | 8.55 | $ | 547.0 | ||||||||||
Vested and exercisable as of June 30, 2021 | 1,555,878 | $ | 4.27 | 8.01 | $ | 93.0 | ||||||||||
The aggregate intrinsic value of options exercised during the six months ended June 30, 2021 and 2020 was $52.8 million and $2.0 million, respectively, and is calculated based on the difference between the exercise price and the fair value of the Company’s common stock as of the exercise date. The weighted-average grant date fair value of options granted during the six months ended June 30, 2021 and 2020 was $19.90 and $1.80 per share, respectively.
Total unrecognized compensation cost of $32.1 million as of June 30, 2021 is expected to be recognized over a weighted-average period of 3.1 years.
F-115
HIPPO HOLDINGS INC.
Notes to Consolidated Financial Statements
(Unaudited)
Valuation Assumptions of Stock Options
The fair value of granted stock options was estimated as of the date of grant using the Black-Scholes-Merton option-pricing model, based on the following inputs:
June 30, 2021 | December 31, 2020 | |||||||
Expected term (in years) | 5.8 - 6.1 | 5.6 - 6.1 | ||||||
Expected volatility | 29.7% - 30.1% | 22.6% - 29.9% | ||||||
Risk-free interest rate | 0.6% - 1.0% | 0.3% - 1.6% | ||||||
Expected dividend yield | —% | —% | ||||||
Each of these inputs is subjective and generally requires significant judgment to determine.
Expected Term
Expected Volatility
Risk-Free Interest Rate
Expected Dividend Yield
Early Exercises of Stock Options
At June 30, 2021 and December 31, 2020, the Company had $2.5 million and $2.5 million, respectively, recorded in accrued expenses and other liabilities related to early exercises of stock options, and the related number of unvested shares subject to repurchase was 345,625 and 345,000, respectively.
Total share-based compensation expense, classified in the accompanying consolidated statements of operations and comprehensive loss was as follows (in millions):
Three Months Ended June 30, | Six Months Ended June 30, | |||||||||||||||
2021 | 2020 | 2021 | 2020 | |||||||||||||
Losses and loss adjustment expenses | $ | 0.1 | $ | 0 | $ | 0.1 | $ | 0 | ||||||||
Insurance related expenses | 0 | 0 | 0.1 | 0.1 | ||||||||||||
Technology and development | 0.5 | 0.2 | 1.0 | 0.4 | ||||||||||||
Sales and marketing | 1.2 | 0.2 | 2.1 | 0.4 | ||||||||||||
General and administrative | 1.0 | 0.5 | 2.0 | 0.9 | ||||||||||||
Total share-based compensation expense | $ | 2.8 | $ | 0.9 | $ | 5.3 | $ | 1.8 | ||||||||
F-116
HIPPO HOLDINGS INC.
Notes to Consolidated Financial Statements
(Unaudited)
13. Income Taxes
The consolidated effective tax rate was (0.1)% and (0.1)% for the six months ended June 30, 2021 and 2020, respectively. The difference between these rates and the U.S. federal income tax rate of 21% was primarily due to a full valuation allowance against the Company’s net deferred tax assets.
The Company did 0t have an unrecognized tax benefit as of June 30, 2021 and 2020. NaN interest or penalties were incurred during the six months ended June 30, 2021 and 2020.
14. Net Loss Per Share Attributable to Common Stockholders
Net loss per share attributable to common stockholders was computed as follows:
Three Months Ended June 30, | Six Months Ended June 30, | |||||||||||||||
2021 | 2020 | 2021 | 2020 | |||||||||||||
Numerator: | ||||||||||||||||
Net loss attributable to Hippo - basic and diluted (in millions) | $ | (84.5 | ) | $ | (24.8 | ) | $ | (279.8 | ) | $ | (48.7 | ) | ||||
Denominator: | ||||||||||||||||
Weighted-average shares used in computing net loss per share attributable to Hippo — basic and diluted | 14,134,399 | 12,360,596 | 13,968,160 | 12,236,471 | ||||||||||||
Net loss per share attributable to Hippo — basic and diluted | $ | (5.98 | ) | $ | (2.01 | ) | $ | (20.03 | ) | $ | (3.98 | ) | ||||
The potential shares of common stock that were excluded from the computation of diluted net loss per share attributable to common stockholders for the periods presented because including them would have been antidilutive are as follows:
As of June 30, | ||||||||
2021 | 2020 | |||||||
Convertible preferred stock (on an as if converted basis) | 43,985,178 | 36,330,613 | ||||||
Outstanding options | 9,741,833 | 8,141,970 | ||||||
Warrants to purchase common shares | 4,800,551 | 4,738,051 | ||||||
Warrants to purchase preferred shares | 2,494,116 | 2,494,116 | ||||||
Common stock subject to repurchase | 1,713,658 | 1,366,513 | ||||||
Convertible notes | 21,603,512 | 0 | ||||||
Total | 84,338,848 | 53,071,263 | ||||||
F-117
HIPPO HOLDINGS INC.
Notes to Consolidated Financial Statements
(Unaudited)
15. Geographical Breakdown of Gross Written Premium
Gross written premium (“GWP”) by state is as follows (in millions):
Three Months Ended June 30, | Six Months Ended June 30, | |||||||||||||||||||||||||||||||
2021 | 2020 | 2021 | 2020 | |||||||||||||||||||||||||||||
Amount | % of GWP | Amount | % of GWP | Amount | % of GWP | Amount | % of GWP | |||||||||||||||||||||||||
State | ||||||||||||||||||||||||||||||||
Texas | $ | 39.9 | 31.0 | % | $ | 4.0 | 72.7 | % | $ | 72.9 | 32.0 | % | $ | 10.9 | 74.1 | % | ||||||||||||||||
California | 22.8 | 17.7 | % | 0 | 0 | % | 41.6 | 18.3 | % | 0 | 0 | % | ||||||||||||||||||||
Florida | 8.6 | 6.7 | % | 0 | 0 | % | 14.4 | 6.3 | % | 0 | 0 | % | ||||||||||||||||||||
Georgia | 5.6 | 4.4 | % | 0.2 | 3.6 | % | 9.8 | 4.3 | % | 0.4 | 2.7 | % | ||||||||||||||||||||
Illinois | 4.5 | 3.5 | % | 0.3 | 5.5 | % | 7.6 | 3.3 | % | 0.7 | 4.8 | % | ||||||||||||||||||||
Missouri | 3.5 | 2.7 | % | 0.2 | 3.6 | % | 5.9 | 2.6 | % | 0.5 | 3.4 | % | ||||||||||||||||||||
Colorado | 3.1 | 2.4 | % | 0 | 0 | % | 5.7 | 2.5 | % | 0 | 0 | % | ||||||||||||||||||||
Arizona | 2.9 | 2.3 | % | 0 | 0 | % | 5.3 | 2.3 | % | 0 | 0 | % | ||||||||||||||||||||
New Jersey | 2.3 | 1.8 | % | 0 | 0 | % | 4.5 | 2.0 | % | 0 | 0 | % | ||||||||||||||||||||
Ohio | 2.8 | 2.2 | % | 0.2 | 3.6 | % | 4.8 | 2.1 | % | 0.5 | 3.4 | % | ||||||||||||||||||||
Other | 32.6 | 25.3 | % | 0.6 | 10.9 | % | 55.2 | 24.2 | % | 1.7 | 11.6 | % | ||||||||||||||||||||
Total | $ | 128.6 | 100 | % | $ | 5.5 | 100 | % | $ | 227.7 | 100 | % | $ | 14.7 | 100 | % | ||||||||||||||||
16. Related Party
Hippo has agreements with multiple Comcast entities and affiliated funds who are beneficial owners of more than 5% of outstanding Hippo stock. Hippo incurred expenses of $1.3 million and $2.3 million, during the three and six months ended June 30, 2021, respectively, and $1.7 million and $3.1 million, during the three and six months ended June 30, 2020, respectively, related to these marketing and consulting agreements.
17. Subsequent Events
The Company has evaluated subsequent events from the balance sheet date through August 16, 2021, the date these consolidated financial statements are available to be issued.
The Company filed a Report on Form
8-K
on July 30, 2021, describing subsequent events relating to the shareholders meeting and proposal as presented and voted on July 29, 2021.On July 29, 2021, 19,261,380 of the RTPZ’s Class A ordinary shares amounting to $192.6 million were presented for redemption in connection with the Business Combination. These redemptions were completed, and amount settled with the shareholders.
On August 2, 2021, RTPZ and Hippo Enterprises Inc. closed Business Combination and on August 3, 2021 Hippo Holdings common stock and warrants begin publicly trading on The New York Stock Exchange under the new symbols “HIPO” and “HIPO.WS”, respectively.
On August 2, 2021, the Company issued, in the aggregate, 55,000,000 shares of its common stock to investors at $10.00 per share for aggregate consideration of $550.0 million (the “PIPE Investment”).
F-118
HIPPO HOLDINGS INC.
Notes to Consolidated Financial Statements
(Unaudited)
On August 5, 2021, the Company filed a Report on Form
8-K
describing subsequent events related to the Business Combination and PIPE Investment.There were no other items identified in the period subsequent to the consolidated financial statement date that required adjustment or disclosure.
F-119
SPINNAKER INSURANCE COMPANY
INDEPENDENT AUDITORS’ REPORT
To the Board of Directors
Spinnaker Insurance Company
We have audited the accompanying financial statements of Spinnaker Insurance Company, which comprise the balance sheets as of December 31, 2019 and 2018, and the related statements of operations and comprehensive income, changes in stockholder’s equity, and cash flows for the years then ended, and the related notes to the financial statements.
Management’s Responsibility for the Financial Statements
Management is responsible for the preparation and fair presentation of these financial statements in accordance with accounting principles generally accepted in the United States of America; this includes the design, implementation, and maintenance of internal control relevant to the preparation and fair presentation of financial statements that are free from material misstatement, whether due to fraud or error.
Auditors’ Responsibility
Our responsibility is to express an opinion on these financial statements based on our audits. We conducted our audits in accordance with auditing standards generally accepted in the United States of America. Those standards require that we plan and perform the audit to obtain reasonable assurance about whether the financial statements are free from material misstatement.
An audit involves performing procedures to obtain audit evidence about the amounts and disclosures in the financial statements. The procedures selected depend on the auditor’s judgment, including the assessment of the risks of material misstatement of the financial statements, whether due to fraud or error. In making those risk assessments, the auditor considers internal control relevant to the entity’s preparation and fair presentation of the financial statements in order to design audit procedures that are appropriate in the circumstances, but not for the purpose of expressing an opinion on the effectiveness of the entity’s internal control. Accordingly, we express no such opinion. An audit also includes evaluating the appropriateness of accounting policies used and the reasonableness of significant accounting estimates made by management, as well as evaluating the overall presentation of the financial statements.
We believe that the audit evidence we have obtained is sufficient and appropriate to provide a basis for our audit opinion.
Opinion
In our opinion, the financial statements referred to above present fairly, in all material respects, the financial position of Spinnaker Insurance Company as of December 31, 2019 and 2018, and the results of its operations and its cash flows for the years then ended in accordance with accounting principles generally accepted in the United States of America.
/s/ Mazars USA LLP
Fort Washington, Pennsylvania
November 12, 2020
F-120
SPINNAKER INSURANCE COMPANY
(dollars in thousands)
BALANCE SHEETS
December 31, 2019 and 2018
2019 | 2018 | |||||||
Assets | ||||||||
Cash, cash equivalents, and short term investments | $ | 25,364 | $ | 18,460 | ||||
Fixed maturities, at fair value | 44,077 | 30,638 | ||||||
Total cash, cash equivalents, and investments | 69,441 | 49,098 | ||||||
Accrued interest and dividends | 240 | 163 | ||||||
Premium and agents’ balances (net of allowance for doubtful accounts) | ||||||||
amount of $0 and $0 in 2019 and 2018, respectively) | 31,169 | 19,726 | ||||||
Deferred policy acquisition costs | 2,462 | 1,921 | ||||||
Ceded unearned premium | 110,139 | 44,968 | ||||||
Ceding commissions receivable | 9,776 | 14,156 | ||||||
Reinsurance recoverable on paid and unpaid losses and LAE | 42,475 | 15,295 | ||||||
Deferred income taxes, net | 820 | — | ||||||
Other assets | 118 | 41 | ||||||
Property, plant, & equipment | 258 | 16 | ||||||
Total assets | $ | 266,898 | $ | 145,384 | ||||
Liabilities | ||||||||
Unpaid losses and loss expenses | $ | 36,457 | $ | 13,072 | ||||
Unearned premiums | 113,177 | 47,880 | ||||||
Commissions payable and contingent commissions | 3,340 | 6,566 | ||||||
Advanced premium | 690 | 535 | ||||||
Reinsurance payable | 58,560 | 34,539 | ||||||
Federal income taxes payable | 664 | — | ||||||
Accrued expenses and other liabilities | 5,308 | 2,902 | ||||||
Other amounts due to reinsurers | 22 | 1,825 | ||||||
Deferred ceding fees | 7,436 | 3,369 | ||||||
Total liabilities | 225,654 | 110,688 | ||||||
Stockholder’s Equity | ||||||||
Common stock | 4,200 | 4,200 | ||||||
Additional paid in capital | 29,910 | 29,910 | ||||||
Retained earnings | 6,736 | 889 | ||||||
Accumulated other comprehensive income (loss): | ||||||||
Net unrealized gains (losses) on securities, net of tax expense (benefit) of $106 and ($81) in 2019 and 2018, respectively | 398 | (303 | ) | |||||
Total stockholder’s equity | 41,244 | 34,696 | ||||||
Total liabilities and stockholder’s equity | $ | 266,898 | $ | 145,384 | ||||
The accompanying notes are an integral part of these financial statements
F-121
SPINNAKER INSURANCE COMPANY
(dollars in thousands)
STATEMENTS OF OPERATIONS AND COMPREHENSIVE INCOME
For the Years Ended December 31, 2019 and 2018
2019 | 2018 | |||||||
Revenues: | ||||||||
Premiums earned | $ | 143,098 | $ | 51,441 | ||||
Premiums ceded | (135,641 | ) | (32,684 | ) | ||||
Net premiums earned | 7,457 | 18,757 | ||||||
Net investment income | 1,166 | 726 | ||||||
Net realized capital gain on investments | — | 5 | ||||||
Other income | 15 | 1 | ||||||
Total revenues | 8,638 | 19,489 | ||||||
Expenses: | ||||||||
Loss and Loss Adjustment Expenses | 3,795 | 6,932 | ||||||
Commission expense | (9,155 | ) | 4,742 | |||||
Underwriting and general expenses | 8,217 | 4,639 | ||||||
Total expenses | 2,857 | 16,313 | ||||||
Income from operations before income taxes | 5,781 | 3,176 | ||||||
Provision for income taxes | (66 | ) | 62 | |||||
Net income | 5,847 | 3,114 | ||||||
Other comprehensive income (loss), before tax: | ||||||||
Unrealized holding gains (losses) on securities | 887 | (283 | ) | |||||
Reclassification adjustment for net realized capital gains | — | (5 | ) | |||||
Income tax (expense) benefit related to items of other comprehensive income (loss) | (186 | ) | 60 | |||||
Other comprehensive income (loss), net of tax | 701 | (228 | ) | |||||
Comprehensive income | $ | 6,548 | $ | 2,886 | ||||
The accompanying notes are an integral part of these financial statements
F-122
SPINNAKER INSURANCE COMPANY
(dollars in thousands)
STATEMENTS OF CHANGES IN STOCKHOLDER’S EQUITY
For the Years Ended December 31, 2019 and 2018
Common Stock | Total Paid-in Capital | Retained Earnings (Accumulated Deficit) | Accumulated Other Comprehensive Income (Loss) | Total Stockholder’s Equity | ||||||||||||||||||||
Shares | Par Value | |||||||||||||||||||||||
Balance at December 31, 2017 | 1,000 | $ | 4,200 | $ | 29,910 | $ | (2,225 | ) | $ | (75 | ) | $ | 31,810 | |||||||||||
Net income | — | — | — | 3,114 | — | 3,114 | ||||||||||||||||||
Other comprehensive (loss), net of tax | — | — | — | — | (228 | ) | (228 | ) | ||||||||||||||||
Balance at December 31, 2018 | 1,000 | 4,200 | $ | 29,910 | $ | 889 | $ | (303 | ) | $ | 34,696 | |||||||||||||
Net income | — | — | — | 5,847 | — | 5,847 | ||||||||||||||||||
Other comprehensive income, net of tax | — | — | — | — | 701 | 701 | ||||||||||||||||||
Balance at December 31, 2019 | 1,000 | $ | 4,200 | $ | 29,910 | $ | 6,736 | $ | 398 | $ | 41,244 | |||||||||||||
The accompanying notes are an integral part of these financial statements
F-123
SPINNAKER INSURANCE COMPANY
(dollars in thousands)
STATEMENTS OF CASH FLOWS
For the Years Ended December 31, 2019 and 2018
2019 | 2018 | |||||||
Cash flows from operating activities: | ||||||||
Net income | $ | 5,847 | $ | 3,114 | ||||
Adjustments to reconcile net income to net cash provided by operating activities: | ||||||||
Deferred income taxes | (1,007 | ) | 63 | |||||
Net realized capital gain on investment | — | (5 | ) | |||||
Depreciation of fixed assets | 5 | — | ||||||
Amortization of right-of-use | 32 | — | ||||||
Net amortization of premiums and discounts on investments | 105 | 106 | ||||||
Amortization of deferred policy acquisition costs | 3,696 | 7,944 | ||||||
Amortization of deferred ceding fees | (8,546 | ) | (2,594 | ) | ||||
Changes in assets and liabilities: | ||||||||
Accrued interest and dividends | (77 | ) | (35 | ) | ||||
Premium and agents’ balances | (11,443 | ) | (8,866 | ) | ||||
Deferred policy acquisition costs | (4,237 | ) | (6,007 | ) | ||||
Ceded unearned premium | (65,171 | ) | (34,594 | ) | ||||
Ceding commissions receivable | 4,380 | (11,440 | ) | |||||
Reinsurance recoverable on paid and unpaid losses and LAE | (27,180 | ) | (13,404 | ) | ||||
Other assets | (72 | ) | (26 | ) | ||||
Unpaid losses and loss expenses | 23,385 | 9,322 | ||||||
Unearned premiums | 65,297 | 28,518 | ||||||
Commissions payable and contingent commissions | (3,226 | ) | 4,056 | |||||
Advanced premium | 155 | 298 | ||||||
Reinsurance payable | 24,021 | 27,036 | ||||||
Federal income taxes payable | 664 | — | ||||||
Operating lease right-of-use-office | (259 | ) | — | |||||
Accrued expenses and other liabilities | 2,406 | 1,923 | ||||||
Other amounts due to reinsurers | (1,803 | ) | 1,825 | |||||
Deferred ceding fees | 12,613 | 5,118 | ||||||
Net cash provided by operating activities | 19,585 | 12,352 | ||||||
Cash flows from investing activities: | ||||||||
Proceeds from sales of investments | 7,231 | 8,719 | ||||||
Purchases of investments | (19,892 | ) | (8,916 | ) | ||||
Fixed assets acquired | (20 | ) | (16 | ) | ||||
Net cash used in investing activities | (12,681 | ) | (213 | ) | ||||
Net increase in cash | 6,904 | 12,139 | ||||||
Cash, cash equivalents, and short term investments at beginning of year | 18,460 | 6,321 | ||||||
Cash, cash equivalents, and short term investments at end of year | $ | 25,364 | $ | 18,460 | ||||
The accompanying notes are an integral part of these financial statements
F-124
SPINNAKER INSURANCE COMPANY
NOTES TO FINANCIAL STATEMENTS
For the Years Ended December 31, 2019 and 2018
1. | Nature of Operations and Summary of Significant Accounting Policies: |
Spinnaker Insurance Company (the “Company”) is an Illinois domiciled property and casualty insurance carrier licensed in 50 states plus the District of Columbia. The Company primarily underwrites voluntary homeowners’ business sourced through program administrators.
The Company entered into a transfer and assumption agreement with Sirius America Insurance Company, effective July 15, 2015. Sirius assumed all known, unknown and contingent liabilities of the Company relating to events occurring on or before July 15, 2015. On September 24, 2015, 100% of the assets and stock of the Company (formerly known as Woodridge Insurance Company) were acquired by Sojourner Holding Company, LLC (“Sojourner”), a Delaware domiciled limited liability company. Following the acquisition, Sojourner increased the Company’s capitalization to $34 million through the contribution of cash and invested assets. In the fourth quarter of 2015, the Company commenced operations. On August 31st, 2020, the Company was acquired by Hippo Enterprises Inc. (“Hippo”). Hippo is also the parent of Hippo Analytics, Inc, which is the Company’s largest program administrator producing insurance business.
The accompanying financial statements have been prepared in conformity with generally accepted accounting principles. The significant accounting policies followed by the Company are summarized as follows:
Adoption of Accounting Standard
In February 2016, the FASB issued Accounting Standards Updateasset representing the right to use the underlying asset and the lease liability representing the present value of future lease payments. As discussed further in Note 5, on January 1, 2019 the Company early adopted ASU
2016-02,
Leases (Topic 842). The core principle of ASU2016-02
is that a lessee should recognize on its Balance Sheet the assets and liabilities that arise from leases, including operating leases. Under the new requirements, a lessee recognizes on the balance sheet theright-of-use
2016-02
and its related amendments.Use of Estimates
The preparation of financial statements in conformity with generally accepted accounting principles requires management to make estimates and assumptions that affect the reported amounts of assets and liabilities and disclosure of contingent assets and liabilities at the date of the financial statements and the reported amounts of revenues and expenses during the reporting period. Actual results could differ from those estimates.
Investments
The Company has categorized its investment portfolio asand has reported the portfolio at fair value, adjusted for other than temporary declines in fair value, with unrealized gains and losses, net of tax, reported as a net amount in other comprehensive income. Fair values are based on quoted market prices or dealer quotes, if available. If a quoted market price is not available, fair value is estimated using quoted market prices for similar securities. Amortization of premium and accretion of discount are computed using the scientific (constant yield to worst) method. Realized gains and losses are determined using the specific identification method and included in the determination of income. Net investment income includes interest and dividend income together with amortization of market premiums and discounts, and is net of investment management and custody fees.
“available-for-sale”
The Company reviews its investments each quarter to determine whether a decline in fair value below the amortized cost basis is other than temporary. Accordingly, the Company assesses whether it intends to sell or it is
F-125
more likely than not that it will be required to sell a security before recovery of its amortized cost basis less any current-period credit losses. For debt securities that are considered other-than-temporarily impaired and that the Company does not intend to sell and will not be required to sell prior to recovery of the amortized cost basis, the Company separates the amount of the impairment into the amount that is credit related (credit loss component) and the amount due to all other factors. The credit loss component is recognized in earnings and is the difference between the security’s amortized cost basis and the present value of its expected future cash flows discounted at the security’s effective yield. The remaining difference between the security’s fair value and the present value of future expected cash flows is due to factors that are not credit related and, therefore, is not required to be recognized as losses in the statement of operations, but is recognized in other comprehensive income.
A company must establish the appropriate level in the fair value hierarchy for each fair value measurement. The hierarchy gives the highest priority to unadjusted quoted market price in active markets for identical assets or liabilities (Level I measurements) and the lowest priority to unobservable inputs (Level III measurements). An asset’s or liability’s classification within the fair value hierarchy is based on the lowest level of significant input to its valuation.
Level I – Quoted price in active markets for identical assets and liabilities.
Level II – Quoted prices in markets that are not active or inputs that are observable either directly or indirectly. Level II inputs include quoted prices for similar assets or liabilities other than quoted in prices in Level I; quoted prices in markets that are not active; or other inputs that are observable or can be derived principally from or corroborated by observable market data for substantially the full term of the assets or liabilities.
Level III – Unobservable inputs that are supported by little or no market activity and are significant to the fair value of the assets or liabilities. Unobservable inputs reflect the reporting entity’s own assumptions that market participants would use in pricing the asset or liability. Level III assets and liabilities include financial instruments whose values are determined using pricing models, discounted cash flow methodologies, or similar techniques, as well as instruments for which the determination of fair value requires significant management judgment or estimation.
Fair Value of Financial Instruments
The Company’s financial instruments are cash and cash equivalents, premium and agents’ balances, and accrued expenses and accounts payable. The carrying amounts for cash and cash equivalents, premium and agents’ balances, and accrued expenses and accounts payable approximate their fair value based on their short-term nature.
Cash, Cash Equivalents, and Short Term Investments
The Company considers short-term, highly liquid investments with original maturities of three months or less to be cash equivalents. Cost approximates fair value for these short-term investments.
Revenue Recognition
Premiums written are recorded at policy inception and are recognized as revenue on a pro rata basis over the policy term. The portion of premiums that could be earned in the future is deferred and reported as unearned premiums. Generally, premiums are collected in advance of providing risk coverage, minimizing the Company’s exposure to credit risk. When policies lapse, the Company writes off the written premium and the applicable unearned premium.
Reinsurance
In the normal course of business, the Company seeks to reduce losses or generate fee income by reinsuring certain levels of risk with reinsurers. Amounts recoverable from or payable to reinsurers are estimated in a manner consistent with the insurance business.
F-126
Concentrations of Credit Risk
The Company’s financial instruments exposed to concentrations of credit risk consist primarily of its cash and cash equivalents, investments, reinsurance recoveries, and premium receivables. Premium receivables are a mix of receivables due from policyholders, agents, and program administrators. The Company maintains cash balances at banks that are insured by the Federal Deposit Insurance Corporation (“FDIC”) up to $250. During the normal course of business, balances are maintained above the FDIC insurance limit. The Company maintains short-term investment balances in investment grade money market accounts that are insured by the Securities Investor Protection Corporation (“SIPC”) up to $500. Balances for these accounts are maintained in excess of the SIPC insurance limit.
Unpaid Losses and Loss Expenses
The liability for unpaid losses and loss expenses includes case basis estimates of reported losses, plus amounts for incurred but not reported losses (“IBNR”) calculated based upon loss projections utilizing historical company and industry data. The liability for losses has been established on the basis of actuarial assumptions and management judgments. In establishing the liability for Loss and Loss Adjustment Expenses, the Company utilizes the findings of an independent consulting actuary.
The actuary used a variety of actuarial methods to estimate the ultimate cost of Loss and Loss Adjustment Expenses. These methods included paid loss and incurred loss development techniques, as well as the Bornhuetter-Ferguson technique. For each method, judgmental selections of low and high ultimate losses are made, and the selection of the ultimate value is based on the actuary’s judgment.
Management believes that its aggregate liability for unpaid Loss and Loss Adjustment Expenses at
year-end
represents its best estimate, based upon the available data, of the amount necessary to cover the ultimate cost of losses and claims to date.Projections of future ultimate losses and loss expenses are inherently uncertain because of the random nature of claims occurrences and the dependency on future contingent events, which are affected by economic, legal, political and social factors. Due to these uncertainties, it is not possible to determine whether actual loss experience will conform to the assumptions used in estimating the liability. As a result, the actual liability may be significantly in excess of or less than the amount indicated in the financial statements. As adjustments to those estimates become necessary, such adjustments are reflected in current operations.
Deferred Policy Acquisition Costs
Incremental direct costs of acquiring insurance contracts and certain costs related directly to the acquisition process are deferred and amortized over the terms of the policies or reinsurance treaties to which they relate. Those costs include commissions, premium taxes and board and bureau fees. Expense allowances recorded in connection with reinsurance arrangements are accounted for as a reduction of the related acquisition cost. Amortization for the periods ending December 31, 2019 and 2018 was $3,696 and $7,944, respectively.
Deferred Ceding Fees
Ceding fees that are associated with unearned premiums are established as a liability and amortized into income pro rata over the life of the underlying business.
Income Taxes
Deferred federal income taxes have been provided for temporary differences between the tax basis of assets and liabilities and their reported amounts in the financial statements. Such differences are related principally to the deferral of policy acquisition costs, discounting of losses for tax purposes and unearned premium reserves.
F-127
The Company recognizes the effect of an uncertain tax position only if it is more likely than not that the position is sustainable based on its technical merits. Measurement of the tax position’s effect on the income tax provision is based on the largest amount of benefit that is greater than 50% likely of being realized upon the ultimate settlement. Differences between the amount of benefits taken or expected to be taken in the Company’s income tax returns and the amount of benefits recognized based on this evaluation and measurement of the related tax positions represent the unrecognized income tax benefit, which is reflected as a liability. The Company includes interest and penalties related to unrecognized income tax benefits in income tax expense in the statements of operations.
The Company files a federal and several state income tax returns. The current provision for Federal and state income taxes is based on Spinnaker’s income which is currently taxable.
2. | Investments |
Investments are carried at fair value and their associated cost or amortized cost as of December 31, 2019 and 2018 as follows:
2019 | ||||||||||||||||
Amortized Cost | Gross Unrealized Gains | Gross Unrealized Losses | Fair Value | |||||||||||||
Fixed maturities: | ||||||||||||||||
U.S. Government and agencies | $ | 7,854 | $ | 35 | $ | — | $ | 7,889 | ||||||||
All Other Government | 500 | — | — | 500 | ||||||||||||
States, territories and possessions and political subdivisions | 2,662 | 69 | (3 | ) | 2,728 | |||||||||||
Corporate securities | 16,455 | 243 | (10 | ) | 16,688 | |||||||||||
Foreign securities | 3,002 | 53 | — | 3,055 | ||||||||||||
Residential mortgage-backed securities | 7,347 | 61 | (10 | ) | 7,398 | |||||||||||
Commercial mortgage-backed securities | 2,753 | 42 | (19 | ) | 2,776 | |||||||||||
Asset backed securities | 3,000 | 44 | (1 | ) | 3,043 | |||||||||||
Total investments | $ | 43,573 | $ | 547 | $ | (43 | ) | $ | 44,077 | |||||||
2018 | ||||||||||||||||
Amortized Cost | Gross Unrealized Gains | Gross Unrealized Losses | Fair Value | |||||||||||||
Fixed maturities: | ||||||||||||||||
U.S. Government and agencies | $ | 7,800 | $ | 2 | $ | (72 | ) | $ | 7,730 | |||||||
States, territories and possessions and political subdivisions | 203 | — | (3 | ) | 200 | |||||||||||
Corporate securities | 10,664 | 8 | (106 | ) | 10,566 | |||||||||||
Foreign securities | 1,801 | — | (17 | ) | 1,784 | |||||||||||
Residential mortgage-backed securities | 6,716 | — | (176 | ) | 6,540 | |||||||||||
Commercial mortgage-backed securities | 1,388 | — | (23 | ) | 1,365 | |||||||||||
Asset backed securities | 2,449 | 9 | (5 | ) | 2,453 | |||||||||||
Total investments | $ | 31,021 | $ | 19 | $ | (402 | ) | $ | 30,638 | |||||||
Preferred stocks | ||||||||||||||||
Industrial miscellaneous | — | — | — | — | ||||||||||||
Common stocks | ||||||||||||||||
Finance and banking | — | — | — | — | ||||||||||||
Total investments | $ | 31,021 | $ | 19 | $ | (402 | ) | $ | 30,638 | |||||||
F-128
The cost and fair value of fixed maturities are shown by contractual maturity as of December 31, 2019 and 2018. Expected maturities will differ from contractual maturities because borrowers may have the right to call or prepay obligations with or without call or prepayment penalties.
December 31, 2019 | ||||||||
Amortized Cost | Fair Value | |||||||
Due to mature: | ||||||||
One year or less | $ | 9,096 | $ | 9,120 | ||||
After one year through five years | 17,672 | 17,935 | ||||||
After five years | 3,598 | 3,699 | ||||||
After ten years | 107 | 106 | ||||||
Residential mortgage-backed securities | 7,347 | 7,398 | ||||||
Commercial mortgage-backed securities | 2,753 | 2,776 | ||||||
Asset backed securities | 3,000 | 3,043 | ||||||
Total fixed maturities | $ | 43,573 | $ | 44,077 | ||||
December 31, 2018 | ||||||||
Amortized Cost | Fair Value | |||||||
Due to mature: | ||||||||
One year or less | $ | 3,600 | $ | 3,575 | ||||
After one year through five years | 14,917 | 14,781 | ||||||
After five years | 1,240 | 1,232 | ||||||
After ten years | 711 | 692 | ||||||
Residential mortgage-backed securities | 6,716 | 6,540 | ||||||
Commercial mortgage-backed securities | 1,388 | 1,365 | ||||||
Asset backed securities | 2,449 | 2,453 | ||||||
Total fixed maturities | $ | 31,021 | $ | 30,638 | ||||
Proceeds from sales or maturities of investments during 2019 and 2018 were $7,231 and $8,719, respectively. The Company recognized gross realized gains of $1 and $8 and gross realized losses of $1 and $3 during 2019 and 2018, respectively.
Investments with a carrying value of $8,050 and $6,634 at December 31, 2019 and 2018, respectively have been deposited with various state regulatory agencies as required by law.
The Company’s net investment income for 2019 and 2018 is comprised of the following:
2019 | 2018 | |||||||
Fixed income | $ | 944 | $ | 690 | ||||
Cash and cash equivalents | 362 | 170 | ||||||
Total gross investment income | 1,306 | 860 | ||||||
Investment expenses | 140 | 134 | ||||||
Net investment income | $ | 1,166 | $ | 726 | ||||
F-129
At December 31, 2019 and 2018, the Company’s investment portfolio had unrealized losses of $43 and $402, respectively. As of December 31, 2019 and 2018, the Company’s investments in securities which had unrealized losses by the length of time the investments had been in an unrealized loss position by major category are as follows:
December 31, 2019 | ||||||||||||||||||||||||
Less than 12 months | Greater than 12 months | Total | ||||||||||||||||||||||
Fair Value | Unrealized Losses | Fair Value | Unrealized Losses | Fair Value | Unrealized Losses | |||||||||||||||||||
Fixed maturities: | ||||||||||||||||||||||||
U.S. Government and agencies | $ | 998 | $ | — | $ | — | $ | — | $ | 998 | $ | — | ||||||||||||
States, territories and possessions and political subdivisions | 743 | (3 | ) | 107 | — | 850 | (3 | ) | ||||||||||||||||
Corporate securities | 1,567 | (10 | ) | — | — | 1,567 | (10 | ) | ||||||||||||||||
Residential mortgage-backed securities | 1,957 | (6 | ) | 991 | (4 | ) | 2,948 | (10 | ) | |||||||||||||||
Commercial mortgage-backed securities | 1,022 | (17 | ) | 159 | (2 | ) | 1,181 | (19 | ) | |||||||||||||||
Asset-backed securities | 749 | (1 | ) | — | — | 749 | (1 | ) | ||||||||||||||||
Total investments | $ | 7,036 | $ | (37 | ) | $ | 1,257 | $ | (6 | ) | $ | 8,293 | $ | (43 | ) | |||||||||
December 31, 2018 | ||||||||||||||||||||||||
Less than 12 months | Greater than 12 months | Total | ||||||||||||||||||||||
Fair Value | Unrealized Losses | Fair Value | Unrealized Losses | Fair Value | Unrealized Losses | |||||||||||||||||||
Fixed maturities: | ||||||||||||||||||||||||
U.S. Government and agencies | $ | 2,583 | $ | (1 | ) | $ | 4,845 | $ | (71 | ) | $ | 7,428 | $ | (72 | ) | |||||||||
States, territories and possessions and political subdivisions | — | — | 201 | (3 | ) | 201 | (3 | ) | ||||||||||||||||
Corporate securities | 5,478 | (65 | ) | 3,333 | (41 | ) | 8,811 | (106 | ) | |||||||||||||||
Foreign securities | 1,784 | (17 | ) | — | — | 1,784 | (17 | ) | ||||||||||||||||
Residential mortgage-backed securities | 606 | (9 | ) | 5,442 | (167 | ) | 6,048 | (176 | ) | |||||||||||||||
Commercial mortgage-backed securities | 255 | — | 1,109 | (23 | ) | 1,364 | (23 | ) | ||||||||||||||||
Asset-backed securities | — | — | 944 | (5 | ) | 944 | (5 | ) | ||||||||||||||||
Total investments | $ | 10,706 | $ | (92 | ) | $ | 15,874 | $ | (310 | ) | $ | 26,580 | $ | (402 | ) | |||||||||
The Company frequently reviews its investment portfolio for declines in fair value. The Company’s process for identifying declines in the fair value of investments that are other than temporary involves consideration of several factors. These factors include (i) the time period in which there has been a significant decline in value, (ii) an analysis of the liquidity, business prospects and overall financial condition of the issuer, (iii) the significance of the decline and (iv) the Company’s intent and ability to hold the investment for a sufficient period of time for the value to recover. When the Company’s analysis of the above factors results in the Company’s conclusion that declines in fair values are other than temporary, the cost of the securities is written down to fair value and the previously unrealized loss is therefore reflected as a realized loss. As of December 31, 2019 and 2018, 17 and 59 fixed maturities have unrealized losses, respectively. In conjunction with its outside investment advisors, the Company analyzed the credit ratings of the securities as well as the historical monthly amortized cost to fair value ratio of securities in an unrealized loss position. Based on these analyses, the Company does not consider these investments to be other-than-temporarily impaired at December 31, 2019 and 2018.
F-130
3. | Fair Value Measurements |
The Company maximizes the use of observable inputs in its valuation techniques and applies unobservable inputs only to the extent that observable inputs are unavailable. The largest class of assets and liabilities carried at fair value by the Company at December 31, 2019 and 2018 were fixed income securities.
Prices provided by independent pricing services and independent broker quotes can vary widely, even for the same security.
The Company’sinvestments are comprised of a variety of different securities, which are classified into levels based on the valuation technique and inputs used in their valuation. The valuation of cash equivalents are generally based on Level I inputs, which use the market approach valuation technique. The valuation of the Company’s otherinvestments, including the vast majority of fixed income securities generally incorporate significant Level II inputs using the market and income approach techniques. The Company may assign a lower level to inputs typically considered to be Level II based on its assessment of liquidity and relative level of uncertainty surrounding inputs. There were no assets or liabilities classified at Level III at December 31, 2019 and 2018.
available-for-sale
available-for-sale
The following table sets forth the Company’s assets and liabilities which are measured on a recurring basis by the level within the fair value hierarchy in which fair value measurements fall as of December 31, 2019 and 2018:
Fair Value Measurement at December 31, 2019 | ||||||||||||||||
Total | Level I | Level II | Level III | |||||||||||||
Assets: | ||||||||||||||||
Fixed maturity securities: | ||||||||||||||||
U.S. Government and agencies | $ | 7,889 | $ | 7,889 | $ | — | $ | — | ||||||||
All Other Government | 500 | — | 500 | |||||||||||||
States, territories and possessions and political subdivisions | 2,728 | — | 2,728 | — | ||||||||||||
Corporate securities | 16,688 | — | 16,688 | — | ||||||||||||
Foreign securities | 3,055 | — | 3,055 | — | ||||||||||||
Residential mortgage-backed securities | 7,398 | — | 7,398 | — | ||||||||||||
Commercial mortgage-backed securities | 2,776 | — | 2,776 | — | ||||||||||||
Asset backed securities | 3,043 | — | 3,043 | — | ||||||||||||
Total fixed maturity securities | 44,077 | 7,889 | 36,188 | — | ||||||||||||
Cash equivalents | 25,481 | 3,726 | 21,755 | — | ||||||||||||
Total assets at fair value | $ | 69,558 | $ | 11,615 | $ | 57,943 | $ | — | ||||||||
Fair Value Measurement at December 31, 2018 | ||||||||||||||||
Total | Level I | Level II | Level III | |||||||||||||
Assets: | ||||||||||||||||
Fixed maturity securities: | ||||||||||||||||
U.S. Government and agencies | $ | 7,730 | $ | 7,730 | $ | — | $ | — | ||||||||
States, territories and possessions and political subdivisions | 200 | — | 200 | — | ||||||||||||
Corporate securities | 10,566 | — | 10,566 | — | ||||||||||||
Foreign securities | 1,784 | — | 1,784 | — | ||||||||||||
Residential mortgage-backed securities | 6,540 | — | 6,540 | — | ||||||||||||
Commercial mortgage-backed securities | 1,365 | — | 1,365 | — | ||||||||||||
Asset backed securities | 2,453 | — | 2,453 | — | ||||||||||||
Total fixed maturity securities | 30,638 | 7,730 | 22,908 | — | ||||||||||||
Cash equivalents | 18,576 | 3,269 | 15,307 | — | ||||||||||||
Total assets at fair value | $ | 49,214 | $ | 10,999 | $ | 38,215 | $ | — | ||||||||
F-131
4. | Insurance and Reinsurance Activity |
The Company’s subsidiary, Spinnaker, has entered into quota share and excess of loss contracts which may have catastrophe exposure. Spinnaker is not relieved of its primary obligations to policyholders in the event of a default or the insolvency of its reinsurers, therefore a credit exposure exists to the extent that any reinsurer fails to meet its obligations assumed in the reinsurance agreements. To mitigate this exposure to reinsurance insolvencies, Spinnaker evaluates the financial condition of its reinsurers and, in certain circumstances, holds substantial collateral (in the form of funds withheld and letters of credit) as security under the reinsurance agreements.
A reconciliation of direct to net premiums on both a written and an earned basis is as follows:
2019 | 2018 | |||||||||||||||
Premiums Written | Premiums Earned | Premiums Written | Premiums Earned | |||||||||||||
Direct premium | $ | 208,395 | $ | 143,098 | $ | 79,960 | $ | 51,441 | ||||||||
Ceded premium — nonaffiliated | (200,812 | ) | (135,641 | ) | (67,278 | ) | (32,684 | ) | ||||||||
Net premiums | $ | 7,583 | $ | 7,457 | $ | 12,682 | $ | 18,757 | ||||||||
A reconciliation of direct to net losses and loss adjustment expense is as follows:
2019 | 2018 | |||||||
Direct losses and loss adjustment expenses | $ | 109,900 | $ | 34,414 | ||||
Ceded losses and loss adjustment expenses | (106,105 | ) | (27,482 | ) | ||||
Net losses and loss adjustment expenses | $ | 3,795 | $ | 6,932 | ||||
Activity in the liability for unpaid losses and loss adjustment expenses is summarized as follows:
2019 | 2018 | |||||||
Balance at beginning of period: | ||||||||
Liability for unpaid losses and loss adjustment expense | $ | 13,072 | $ | 3,750 | ||||
Reinsurance ceded | 10,223 | 1,537 | ||||||
Net balance at beginning of year | 2,849 | 2,213 | ||||||
Incurred related to: | ||||||||
Current year | 4,780 | 7,794 | ||||||
Prior years | (985 | ) | (862 | ) | ||||
Total incurred | 3,795 | 6,932 | ||||||
Paid related to: | ||||||||
Current year | (3,249 | ) | (5,317 | ) | ||||
Prior years | (365 | ) | (979 | ) | ||||
Total paid | (3,614 | ) | (6,296 | ) | ||||
Balance at end of year: | ||||||||
Liability for unpaid losses and loss adjustment expense | 36,457 | 13,072 | ||||||
Reinsurance ceded | 33,427 | 10,223 | ||||||
Net balance at end of year | $ | 3,030 | $ | 2,849 | ||||
F-132
Net incurred losses and LAE attributable to insurance events of the prior year have developed by ($985) and ($862) in 2019 and 2018, respectively, as a result of
re-estimation
of unpaid losses and LAE. These changes are generally a result of ongoing analysis of recent loss development trends. Original estimates are decreased or increased as additional information becomes known regarding individual claims.The following tables present information about incurred and paid claims development as of December 31, 2019, net of reinsurance, as well as cumulative claim frequency and the total of IBNR reserves plus expected development on reported claims. The tables include unaudited information about incurred and paid claims development for the years ended December 31, 2009 through 2016.
Property and Casualty | At December 31, 2019 | |||||||||||||||||||||||||||||||||||||||||||||||
Incurred Claims and Allocated Claim Adjustment Expenses, Net of Reinsurance For the Year Ended December 31, 2019 | Total IBNR Plus Expected Development on Reported Claims | |||||||||||||||||||||||||||||||||||||||||||||||
Cumulative Number of Reported Claims | ||||||||||||||||||||||||||||||||||||||||||||||||
Accident Year | 2010 | 2011 | 2012 | 2013 | 2014 | 2015 | 2016 | 2017 | 2018 | 2019 | ||||||||||||||||||||||||||||||||||||||
unaudited | ||||||||||||||||||||||||||||||||||||||||||||||||
| (in thousands, except claim counts) | ||||||||||||||||||||||||||||||||||||||||||||||||
2010 | $ | — | $ | — | $ | — | $ | — | $ | — | $ | — | $ | — | $ | — | $ | — | $ | — | $ | — | — | |||||||||||||||||||||||||
2011 | — | — | — | — | — | — | — | — | — | — | — | — | ||||||||||||||||||||||||||||||||||||
2012 | — | — | — | — | — | — | — | — | — | — | — | — | ||||||||||||||||||||||||||||||||||||
2013 | — | — | — | — | — | — | — | — | — | — | — | — | ||||||||||||||||||||||||||||||||||||
2014 | — | — | — | — | — | — | — | — | — | — | — | — | ||||||||||||||||||||||||||||||||||||
2015 | — | — | — | — | — | 24 | 25 | 25 | 25 | 25 | — | 7 | ||||||||||||||||||||||||||||||||||||
2016 | — | — | — | — | — | — | 2,457 | 1,858 | 1,859 | 1,770 | — | 713 | ||||||||||||||||||||||||||||||||||||
2017 | — | — | — | — | — | — | — | 5,219 | 4,354 | 4,034 | 10 | 3,118 | ||||||||||||||||||||||||||||||||||||
2018 | — | — | — | — | — | — | — | — | 7,793 | 7,184 | 952 | 6,133 | ||||||||||||||||||||||||||||||||||||
2019 | — | — | — | — | — | — | — | — | — | 4,780 | 946 | 12,421 | ||||||||||||||||||||||||||||||||||||
Total | $ | 17,793 | ||||||||||||||||||||||||||||||||||||||||||||||
Property and Casualty | ||||||||||||||||||||||||||||||||||||||
Paid Claims and Allocated Claim Adjustment Expenses, Net of Reinsurance For the Year Ended December 31, | ||||||||||||||||||||||||||||||||||||||
Accident Year | 2010 | 2011 | 2012 | 2013 | 2014 | 2015 | 2016 | 2017 | 2018 | 2019 | ||||||||||||||||||||||||||||
unaudited | ||||||||||||||||||||||||||||||||||||||
| (in thousands) | ||||||||||||||||||||||||||||||||||||||
2010 | $— | $— | $— | $— | $— | $— | $— | $— | $— | $— | ||||||||||||||||||||||||||||
2011 | — | — | — | — | — | — | — | — | — | — | ||||||||||||||||||||||||||||
2012 | — | — | — | — | — | — | — | — | — | — | ||||||||||||||||||||||||||||
2013 | — | — | — | — | — | — | — | — | — | — | ||||||||||||||||||||||||||||
2014 | — | — | — | — | — | — | — | — | — | — | ||||||||||||||||||||||||||||
2015 | — | — | — | — | — | 8 | 25 | 25 | 25 | 25 | ||||||||||||||||||||||||||||
2016 | — | — | — | — | — | — | 1,244 | 1,846 | 1,858 | 1,770 | ||||||||||||||||||||||||||||
2017 | — | — | — | — | — | — | — | 3,019 | 3,983 | 4,021 | ||||||||||||||||||||||||||||
2018 | — | — | — | — | — | — | — | — | 5,317 | 5,698 | ||||||||||||||||||||||||||||
2019 | — | — | — | — | — | — | — | — | — | 3,249 | ||||||||||||||||||||||||||||
Total | $ | 14,763 | ||||||||||||||||||||||||||||||||||||
| All outstanding liabilities prior to 2009, net of reinsurance | $ | — | ||||||||||||||||||||||||||||||||||||
| | Liabilities for Claims and Claim adjustment expenses, net of reinsurance | | $ | 3,030 | ||||||||||||||||||||||||||||||||||
F-133
The following table presents supplementary information about average historical claims duration as of December 31, 2019:
Average Annual Percentage Payout of Incurred Claims by Age, Net of Reinsurance | ||||||||||||||||||||||||||||||||||||||||
Years | 1 | 2 | 3 | 4 | 5 | 6 | 7 | 8 | 9 | 10 | ||||||||||||||||||||||||||||||
Property and Casualty | 63.8 | % | 32.8 | % | 0.5 | % | -2.5 | % | — | % | — | % | — | % | — | % | — | % | — | % | ||||||||||||||||||||
5. | Operating Leases |
The Company has an operating lease of home office space under a
non-cancellable
agreement that expires July 31, 2024. The lease has an option to extend for up to an additional 5 years. The discount rate used for the operating lease is 7.87%.The following summarizes the line items in the balance sheet which include amounts for operating and finance leases as of December 31, 2019:
2019 | 2018 | |||||||
Operating lease right-of-use-office | $ | 259 | $ | — | ||||
Accumulated amortization | (32 | ) | — | |||||
Operating lease included in property, plant, & equipment | $ | 227 | $ | — �� | ||||
Opiating lease liability included in included in accrued expenses and other liabilities | $ | (246 | ) | $ | — | |||
The maturities of the lease liability as of December 31, 2019 were as follows:
| Year Ending December 31: | Operating | |||
2020 | $ | 62 | ||
2021 | 63 | |||
2022 | 66 | |||
2023 | 66 | |||
2024 | 38 | |||
Total lease Payments | 295 | |||
Less: interest | (49 | ) | ||
Present value of the lease liability | $ | 246 | ||
The following summarizes the line items in the income statements which include the components of lease expense for the year ended December 31:
2019 | 2018 | |||||||
Operating lease included in underwriting and general expenses | $ | 55 | $ | 27 | ||||
The following summarizes cash flow information related to leases for the year ended December 31, 2019:
2019 | 2018 | |||||||
Cash paid for amounts included in the measurement of the lease liabilities: | ||||||||
Operating cash flows from operating leases | $ | 26 | $ | 27 | ||||
Lease assets obtained in exchange for the lease obligation: | ||||||||
Operating leases | 259 | — | ||||||
F-134
6. | Contingencies |
The Company is not aware of any contingencies that will materially impact the Company’s financial position, cash flows, or results of operations.
7. | Debt |
The Company had a $1,000,000 line of credit with PNC Bank, N.A., of which there was no outstanding amount as of December 31, 2019. The line of credit expired on September 18, 2020.
8. | Benefit Plans |
The Company sponsors a 401(k) plan that covers all eligible employees. Beginning in 2018, the Company provides a match of 50% of the first 6% of the employees’ contributions. The Company contributed $49 and $48 to the defined contribution plan in 2019 and 2018, respectively.
9. | Income Taxes |
The components of our provision for income taxes for the years ended December 31, 2019 and 2018 are as follows:
2019 | 2018 | |||||||
Current | $ | 940 | $ | — | ||||
Deferred | (1,006 | ) | 62 | |||||
| $ | (66 | ) | $ | 62 | ||||
The provision for income taxes differs from the amount that would be computed by applying the statutory federal rate to income before provisions for income taxes for the years ended December 31, 2019 and 2018, as a result of the following:
2019 | % of Pre-Tax Income | 2018 | % of Pre-Tax Income | |||||||||||||
Expected provision computed at statutory rate | $ | 1,216 | 21.0 | % | $ | 667 | 21.0 | % | ||||||||
Effect of permanent differences | 5 | 0.1 | % | 3 | 0.1 | % | ||||||||||
Change in valuation allowance | (1,284 | ) | -22.2 | % | (607 | ) | -19.1 | % | ||||||||
Other items | (8 | ) | -0.1 | % | (1 | ) | 0.0 | % | ||||||||
Prior year over accrual | 5 | 0.1 | % | — | 0.0 | % | ||||||||||
Total | $ | (66 | ) | (1.1 | )% | $ | 62 | 2.0 | % | |||||||
The major components of the deferred income tax expense are the differences between the tax basis of deferred acquisition costs, unpaid losses and loss expenses and unearned premium reserves and their reported amounts in the financial statements. For tax purposes, acquisition costs are deducted as incurred, unpaid losses and loss expenses are discounted to determine the deductible portion of incurred losses and twenty percent of the change in unearned premium reserves is not deductible in the current year.
The Company will recognize a valuation allowance if based on the weight of all available evidence, it is more likely than not that some, or all, of a deferred tax asset will not be realized. The Company recorded no valuation allowance at December 31, 2019 as management has determined that it is more likely than not that the Company’s net deferred tax asset will be fully realized. The Company recorded a full valuation allowance at December 31, 2018 of $1,284. The change in valuation allowance in 2019 was $1,284.
At December 31, 2019 and 2018, the Company had no net operating losses and $1,348 of net operating losses, respectively. The Company had no unused AMT credit carryforward. The Company had $34 and $34 of
F-135
capital loss carryforwards at December 31, 2019 and 2018, respectively. The Company’s capital loss carryforwards will expire through December 31, 2024.
On December 22, 2018, President Trump signed the Tax Cuts and Jobs Act (the “Act”) into legislation. The Company had recorded a deferred tax provision of $1,158 due to a remeasurement of deferred tax assets and liabilities as the corporate income tax rate decreased effective January 1, 2019 from 34% tax rate to 21%. As the Company maintained a valuation allowance against its federal and state deferred tax assets at December 31, 2018, a corresponding reduction in the valuation allowance was recorded against this tax provision; therefore, there was no net impact to the Company’s statement of operations for the year ended December 31, 2018 as a result of this corporate income tax rate change.
On March 27, 2020, President Trump signed into law the. Based on a review of the Act, the Company does not believe that the Act will have a material impact on the Company’s financial statement. The Company will continue to monitor ongoing guidance on the Act at such time they are issued.
Coronavirus Aid, Relief, and Economic Security Act (H.R. 248)
The tax effects of temporary differences that give rise to significant portions of our deferred income tax assets and deferred income tax liabilities at December 31, 2019 and 2018 are as follows:
2019 | 2018 | |||||||
Deferred income tax assets: | ||||||||
Unearned premium | $ | 132 | $ | 122 | ||||
Unpaid Loss and Loss Adjustment Expenses | 37 | 30 | ||||||
Advanced premium | 28 | 22 | ||||||
Net operation loss carryovers | — | 282 | ||||||
Intangible Assets | 1,038 | 1,106 | ||||||
Other | 249 | 142 | ||||||
Total gross deferred income tax assets | 1,484 | 1,704 | ||||||
Deferred income tax liabilities: | ||||||||
Deferred policy acquisition costs | 530 | 403 | ||||||
Other | 134 | 17 | ||||||
Total gross deferred income tax liabilities | 664 | 420 | ||||||
Net deferred income tax assets | 820 | 1,284 | ||||||
Valuation allowance | — | (1,284 | ) | |||||
Deferred income tax assets, net | $ | 820 | $ | — | ||||
10. | Stockholder’s Equity |
The Company has 1,000 shares of $4,200 par value authorized, issued and outstanding common stock at December 31, 2019 and 2018. Sojourner was the sole shareholder prior to the Company’s acquisition by Hippo.
11. | Statutory Net Earnings and Stockholder’s Equity |
The Company, which is domiciled in Illinois, prepares its statutory financial statements in accordance with accounting principles and practices prescribed or permitted by the Illinois Insurance Department. These principles are recognized for determining solvency under applicable state law. The commissioner of the Illinois Insurance Department has the right to permit other practices that may deviate from prescribed practices. Prescribed statutory accounting practices are those practices that are incorporated directly or by reference in state laws, regulations and general administrative rules applicable to all insurance enterprises domiciled in Illinois.
F-136
Generally accepted accounting principles differ in certain respects from the accounting practices prescribed or permitted by insurance regulatory authorities (statutory basis). As filed in the statutory basis annual statement with the Insurance Department of the State of Illinois, the differences in members’ equity and net earnings are as follows:
2019 | 2018 | |||||||
Total stockholder’s equity | $ | 41,244 | $ | 34,696 | ||||
Non-admitted assets | (788 | ) | (53 | ) | ||||
Deferred acquisition costs | (2,462 | ) | (1,921 | ) | ||||
Deferred taxes | 615 | — | ||||||
Book Value of Bonds (PGAAP) | (70 | ) | (81 | ) | ||||
Market Value of Bonds | (504 | ) | 383 | |||||
Provision for reinsurance | (38 | ) | 9 | |||||
Miscellaneous differences | (1 | ) | (16 | ) | ||||
Aggregate statutory surplus of insurance subsidiaries | $ | 37,996 | $ | 33,017 | ||||
Net income | $ | 5,847 | $ | 3,114 | ||||
Deferred acquisition costs | (541 | ) | 1,937 | |||||
Deferred taxes | (1,005 | ) | 60 | |||||
GAAP to STAT bond amortization difference | 7 | 8 | ||||||
Miscellaneous differences | — | 16 | ||||||
Aggregate statutory net earnings | $ | 4,308 | $ | 5,135 | ||||
The insurance laws of the State of Illinois restrict dividend payments by the Company. In most cases, the Company cannot pay dividends without the prior approval of the Insurance Commissioner of the State of Illinois. In addition, insurance laws require the maintenance of minimum capital and surplus. Illinois requires the Company to maintain
paid-in
capital of $1,000 and surplus of $2,000. The Company is in compliance with these requirements.Insurance regulators use multiple metrics to regulate insurance companies and determine the appropriate levels of capital an insurer should maintain above the statutory minimum capital levels noted above. Risk-based capital (“RBC”), which is the most commonly used tool, is designed to measure the acceptable amount of capital an insurer should have, based on the inherent risks of its business. Insurers failing to meet adequate capital levels may be subject to insurance department scrutiny, and ultimately, rehabilitation or liquidation. The Company maintained surplus in excess of prescribed minimum risk-based capital requirements as calculated by the Company and filed with the Illinois Insurance Department as of December 31, 2019 and 2018.
12. | Related Parties |
One of Sojourner’s owners, Arch Reinsurance Company and its affiliates (collectively “Arch”), participates on certain reinsurance contracts on an annual basis at market terms consistent with the terms for unaffiliated reinsurers. For 2019 and 2018, the Company ceded premiums to Arch of $24,876 and $6,963, respectively. At December 31, 2019 and 2018, the Company had unsecured net balances due from Arch of $6,480 and $1,936, respectively. Other similar owners participate in the Company’s reinsurance programs, however, the amounts of premiums ceded and unsecured balances due from these related parties is deemed to be not material by Management.
13. | Subsequent Events |
The Company has evaluated subsequent events through November 12, 2020, the date these financial statements were available for issuance.
F-137
COVID-19
As a result of the spread of the
COVID-19
coronavirus, economic uncertainties have arisen which may negatively affect the financial position, results of operations and cash flows of the Company. The duration of these uncertainties and the ultimate financial effects cannot be reasonably estimated at this time.Acquisition by Hippo
On August 31
st
, 2020, Hippo acquired 100% of the Company’s common stock from Sojourner. Hippo was also the parent of one of the program administrators sourcing insurance business for the Company in 2019 and 2018.F-138
SPINNAKER INSURANCE COMPANY
(dollars in thousands, unaudited)
BALANCE SHEETS
June 30, 2020 and December 31, 2019
June 30, 2020 | December 31, 2019 | |||||||
Assets | ||||||||
Cash and cash equivalents | $ | 17,461 | $ | 24,560 | ||||
Restricted cash | 1,886 | 804 | ||||||
Short-term investments | 4,998 | — | ||||||
Fixed maturities, at fair value | 47,159 | 44,077 | ||||||
Accrued interest and dividends | 239 | 240 | ||||||
Premium and agents’ balances | 31,259 | 31,169 | ||||||
Deferred policy acquisition costs | 2,403 | 2,462 | ||||||
Ceded unearned premium | 134,419 | 110,139 | ||||||
Ceding commissions receivable | 22,160 | 9,776 | ||||||
Reinsurance recoverable on paid and unpaid losses and LAE | 85,602 | 42,475 | ||||||
Deferred income taxes, net | 501 | 820 | ||||||
Property and equipment, net | 238 | 258 | ||||||
Other assets | 398 | 118 | ||||||
Total assets | $ | 348,723 | $ | 266,898 | ||||
Liabilities | ||||||||
Unpaid losses and loss expenses | 57,138 | $ | 36,457 | |||||
Unearned premiums | 134,987 | 113,177 | ||||||
Commissions payable and contingent commissions | 825 | 3340 | ||||||
Advanced premium | 1,691 | 690 | ||||||
Reinsurance payable | 94,745 | 58,560 | ||||||
Federal income taxes payable | 1,354 | 664 | ||||||
Accrued expenses and other liabilities | 3,531 | 5,308 | ||||||
Other amounts due to reinsurers | — | 22 | ||||||
Deferred ceding fees | 8,683 | 7,436 | ||||||
Total liabilities | 302,954 | 225,654 | ||||||
Commitments and contingencies (Note 6) | ||||||||
Stockholder’s Equity | ||||||||
Common Stock | 4,200 | 4,200 | ||||||
Additional paid-in-capital | 29,910 | 29,910 | ||||||
Retained earnings | 10,329 | 6,736 | ||||||
Accumulated other comprehensive income | ||||||||
Net unrealized gains on securities, net of tax expense of $354 and $106 during the periods ended June 30, 2020 and December 31, 2019 respectively | 1,330 | 398 | ||||||
Total stockholder’s equity | 45,769 | 41,244 | ||||||
Total liabilities and stockholder’s equity | $ | 348,723 | $ | 266,898 | ||||
F-139
SPINNAKER INSURANCE COMPANY
(dollars in thousands, unaudited)
STATEMENTS OF OPERATIONS AND COMPREHENSIVE INCOME
For the Six Months Ended June 30, 2020 and 2019
Six Months Ended | ||||||||
June 30, 2020 | June 30, 2019 | |||||||
Revenues: | ||||||||
Premiums earned | $ | 111, 223 | $ | 53,531 | ||||
Premiums ceded | (107,146 | ) | (49,812 | ) | ||||
Net premiums earned | 4,077 | 3,719 | ||||||
Net investment income | 556 | 557 | ||||||
Net realized capital gain on investments | 39 | — | ||||||
Other income | 9 | 6 | ||||||
Total revenues | 4,681 | 4,282 | ||||||
Expenses: | ||||||||
Loss and Loss Adjustment Expenses | 2,695 | 2,118 | ||||||
Commission income | (8,548 | ) | (4,011 | ) | ||||
Underwriting and general expenses | 5,933 | 4,347 | ||||||
Total expenses | 80 | 2,454 | ||||||
Income from operations before income taxes | 4,601 | 1,828 | ||||||
(Benefit) provision for income taxes | 1,008 | (123 | ) | |||||
Net income | 3,593 | 1,951 | ||||||
Other comprehensive income, before tax: | ||||||||
Unrealized holding gains on securities | 1,180 | 783 | ||||||
Income tax expense related to items of other comprehensive income | (248 | ) | (164 | ) | ||||
Other comprehensive income, net of tax: | 932 | 619 | ||||||
Comprehensive income | $ | 4,525 | $ | 2,570 | ||||
F-140
SPINNAKER INSURANCE COMPANY
(dollars in thousands, unaudited)
STATEMENTS OF CHANGES IN STOCKHOLDER’S EQUITY
For the Six Months Ended June 30, 2020 and 2019
Common Stock | Additional Paid-In Capital | Retained Earnings | Accumulated Other Comprehensive Income (Loss) | Total Stockholder’s Equity | ||||||||||||||||||||
Shares | Amount | |||||||||||||||||||||||
Balance at December 31, 2018 | 1,000 | $ | 4,200 | $ | 29,910 | $ | 889 | $ | (303 | ) | $ | 34,696 | ||||||||||||
Net income | — | — | — | 1,951 | — | 1,951 | ||||||||||||||||||
Other comprehensive income, net of tax | — | — | — | — | 619 | 619 | ||||||||||||||||||
Balance at June 30, 2019 | 1,000 | $ | 4,200 | $ | 29,910 | $ | 2,840 | $ | 316 | $ | 37,266 | |||||||||||||
Balance at December 31, 2019 | 1,000 | $ | 4,200 | $ | 29,910 | $ | 6,736 | $ | 398 | $ | 41,244 | |||||||||||||
Net income | — | — | — | 3,593 | — | 3,593 | ||||||||||||||||||
Other comprehensive income, net of tax | — | — | — | — | 932 | 932 | ||||||||||||||||||
Balance at June 30, 2020 | 1,000 | $ | 4,200 | $ | 29,910 | $ | 10,329 | $ | 1,330 | $ | 45,769 | |||||||||||||
F-141
SPINNAKER INSURANCE COMPANY
(dollars in thousands, unaudited)
STATEMENTS OF CASH FLOWS
For the Six Months Ended June 30, 2020 and 2019
Six Months Ended. | ||||||||
June 30, 2020 | June 30, 2019 | |||||||
Cash flows from operating activities: | ||||||||
Net income | $ | 3,593 | $ | 1,951 | ||||
Adjustments to reconcile net income to net cash used in operating activities: Net realized capital loss (gain) on investment | (39 | ) | — | |||||
Depreciation of fixed assets | 4 | 2 | ||||||
Amortization of right-of-use | 21 | 12 | ||||||
Net amortization of premiums and discounts on investments | 72 | 37 | ||||||
Amortization of deferred policy acquisition costs | 2,017 | 1,709 | ||||||
Amortization of deferred ceding fees | (7,261 | ) | (3,341 | ) | ||||
Changes in assets and liabilities: | ||||||||
Accrued interest and dividends | 1 | (31 | ) | |||||
Premium and agents’ balances | (90 | ) | (11,122 | ) | ||||
Deferred policy acquisition costs | (1,958 | ) | (2,170 | ) | ||||
Deferred income taxes, net | 72 | (164 | ) | |||||
Ceded unearned premium | (24,280 | ) | (39,892 | ) | ||||
Ceding commissions receivable | (12,384 | ) | (7,307 | ) | ||||
Reinsurance recoverable on paid and unpaid losses and LAE | (43,127 | ) | (20,889 | ) | ||||
Other assets | (280 | ) | (81 | ) | ||||
Unpaid losses and loss expenses | 20,681 | 16,212 | ||||||
Unearned premiums | 21,810 | 39,499 | ||||||
Commissions and contingencies (Note 6) | (2,515 | ) | 3,348 | |||||
Advanced premium | 1,001 | 1,059 | ||||||
Reinsurance payable | 36,185 | 31,869 | ||||||
Federal income taxes payable | 690 | 10 | ||||||
Operating lease right-of-use-office | — | (259 | ) | |||||
Accrued expenses and other liabilities | 5,484 | 3,639 | ||||||
Other amounts due to reinsurers | (22 | ) | (1,825 | ) | ||||
Deferred ceding fees | 1,247 | 2,071 | ||||||
Net cash provided by operating activities | 922 | 14,337 | ||||||
Cash flows from investing activities: | ||||||||
Proceeds from sales of investments with fixed maturities | 6,071 | 2,372 | ||||||
Purchases of short-term investments | (4,998 | ) | — | |||||
Purchases of investments with fixed maturities | (8,007 | ) | (7,245 | ) | ||||
Fixed assets acquired | (5 | ) | (16 | ) | ||||
Net cash used in investing activities | (6,939 | ) | (4,889 | ) | ||||
�� | ||||||||
Net (decrease) increase in cash | (6,017 | ) | 9,448 | |||||
Cash, cash equivalents and restricted cash, beginning of year | 25,364 | 18,460 | ||||||
Cash, cash equivalents and restricted cash, end of period | $ | 19,347 | $ | 27,908 | ||||
Supplemental disclosures of cash flow information Cash paid for income taxes | $ | 238 | $ | 261 | ||||
F-142
SPINNAKER INSURANCE COMPANY
NOTES TO UNAUDITED FINANCIAL STATEMENTS
For the Six Months Ended June 30, 2020 and June 30, 2019
1. Nature of Operations and Summary of Significant Accounting Policies:
Spinnaker Insurance Company (the “Company”) is an Illinois domiciled property and casualty insurance carrier licensed in 50 states plus the District of Columbia. The Company primarily underwrites voluntary homeowners’ business sourced through program administrators.
The Company entered into a transfer and assumption agreement with Sirius America Insurance Company (“Sirius”), effective July 15, 2015. Sirius assumed all known, unknown and contingent liabilities of the Company relating to events occurring on or before July 15, 2015. On September 24, 2015, 100% of the assets and stock of the Company (formerly known as Woodridge Insurance Company) were acquired by Sojourner Holding Company, LLC (“Sojourner”), a Delaware domiciled limited liability company. Following the acquisition, Sojourner increased the Company’s capitalization to $34 million through the contribution of cash and invested assets. In the fourth quarter of 2015, the Company commenced operations. On August 31st, 2020, the Company was acquired by Hippo Enterprises Inc. (“Hippo”). Hippo is also the parent of Hippo Analytics, Inc, which is the Company’s largest program administrator producing insurance business.
The accompanying financial statements have been prepared in conformity with generally accepted accounting principles in the United States of America (“GAAP”). The significant accounting policies followed by the Company are summarized as follows:
Reclassifications
Certain amounts from prior periods have been reclassified to conform to the current period presentation.
Use of Estimates
The preparation of financial statements in conformity with GAAP requires management to make estimates and assumptions that affect the reported amounts of assets and liabilities and disclosure of contingent assets and liabilities at the date of the financial statements and the reported amounts of revenues and expenses during the reporting period. Actual results could differ from those estimates.
Fair Value of Financial Instruments
The Company’s financial instruments are cash and cash equivalents, short-term investments, premium and agents’ balances, and accrued expenses and accounts payable. The carrying amounts for cash and cash equivalents, premium and agents’ balances, and accrued expenses and accounts payable approximate their fair value based on their short-term nature.
A company must establish the appropriate level in the fair value hierarchy for each fair value measurement. The hierarchy gives the highest priority to unadjusted quoted market price in active markets for identical assets or liabilities (Level I measurements) and the lowest priority to unobservable inputs (Level III measurements). An asset’s or liability’s classification within the fair value hierarchy is based on the lowest level of significant input to its valuation.
Level I – Quoted price in active markets for identical assets and liabilities.
Level II – Quoted prices in markets that are not active or inputs that are observable either directly or indirectly. Level II inputs include quoted prices for similar assets or liabilities other than quoted in prices in Level I; quoted prices in markets that are not active; or other inputs that are observable or can be derived principally from or corroborated by observable market data for substantially the full term of the assets or liabilities.
F-143
Level III – Unobservable inputs that are supported by little or no market activity and are significant to the fair value of the assets or liabilities. Unobservable inputs reflect the reporting entity’s own assumptions that market participants would use in pricing the asset or liability. Level III assets and liabilities include financial instruments whose values are determined using pricing models, discounted cash flow methodologies, or similar techniques, as well as instruments for which the determination of fair value requires significant management judgment or estimation.
Cash and Cash Equivalents
Cash and cash equivalents consist of cash and temporary investments with maturities of three months or less when purchased. The securities classified as cash equivalents within the accompanying balance sheets are highly liquid and readily convertible to known amounts of cash. Cost approximates fair value for these securities.
Investments
The Company’s investments consist of short-term investments and investments with fixed maturities.
The Company has categorized its investment portfolio asand has reported the portfolio at fair value, adjusted for other than temporary declines in fair value, with unrealized gains and losses, net of tax, reported as a net amount in other comprehensive income. Fair values are based on quoted market prices or dealer quotes, if available. If a quoted market price is not available, fair value is estimated using quoted market prices for similar securities. Amortization of premium and accretion of discount are computed using the scientific (constant yield to worst) method. Realized gains and losses are determined using the specific identification method and included in the determination of income. Net investment income includes interest and dividend income together with amortization of market premiums and discounts, and is net of investment management and custody fees.
“available-for-sale”
The Company reviews its investments each quarter to determine whether a decline in fair value below the amortized cost basis is other than temporary. Accordingly, the Company assesses whether it intends to sell or it is more likely than not that it will be required to sell a security before recovery of its amortized cost basis less any current-period credit losses. For debt securities that are considered other-than-temporarily impaired and that the Company does not intend to sell and will not be required to sell prior to recovery of the amortized cost basis, the Company separates the amount of the impairment into the amount that is credit related (credit loss component) and the amount due to all other factors. The credit loss component is recognized in earnings and is the difference between the security’s amortized cost basis and the present value of its expected future cash flows discounted at the security’s effective yield. The remaining difference between the security’s fair value and the present value of future expected cash flows is due to factors that are not credit related and, therefore, is not required to be recognized as losses in the statement of operations, but is recognized in other comprehensive income.
Restricted Cash
Restricted cash consists of cash bank accounts. Restricted cash represents amounts held in the Company’s bank account to satisfy collateral requirements associated with the reinsurance recoverable balances. All restricted cash is invested in money market. The reconciliation between the balance sheet and the statement of cash flows is as follows:
June 30, 2020 | December 31, 2019 | |||||||
Cash and cash equivalents | $ | 17,461 | $ | 24,560 | ||||
Restricted cash | 1,886 | 804 | ||||||
Total cash, cash equivalents, and restricted cash | $ | 19,347 | $ | 25,364 | ||||
F-144
Revenue Recognition
Premiums written are recorded at policy inception and are recognized as revenue on a pro rata basis over the policy term. The portion of premiums that could be earned in the future is deferred and reported as unearned premiums. Generally, premiums are collected in advance of providing risk coverage, minimizing the Company’s exposure to credit risk. When policies lapse, the Company writes off the written premium and the applicable unearned premium.
Reinsurance
In the normal course of business, the Company seeks to reduce losses or generate fee income by reinsuring certain levels of risk with reinsurers. Amounts recoverable from or payable to reinsurers are estimated in a manner consistent with the insurance business.
Concentrations of Credit Risk
The Company’s financial instruments exposed to concentrations of credit risk consist primarily of its cash and cash equivalents, investments, reinsurance recoveries, and premium receivables. Premium receivables are a mix of receivables due from policyholders, agents, and program administrators. The Company maintains cash balances at banks that are insured by the Federal Deposit Insurance Corporation (“FDIC”) up to $250. During the normal course of business, balances are maintained above the FDIC insurance limit. The Company maintains short-term investment balances in investment grade money market accounts that are insured by the Securities Investor Protection Corporation (“SIPC”) up to $500. Balances for these accounts are maintained in excess of the SIPC insurance limit.
Unpaid Losses and Loss Expenses
The liability for unpaid losses and loss expenses includes case basis estimates of reported losses, plus amounts for incurred but not reported losses (“IBNR”) calculated based upon loss projections utilizing historical company and industry data. The liability for losses has been established on the basis of actuarial assumptions and management judgments. In establishing the liability for Loss and Loss Adjustment Expenses, the Company utilizes the findings of an independent consulting actuary.
The actuary used a variety of actuarial methods to estimate the ultimate cost of Loss and Loss Adjustment Expenses. These methods included paid loss and incurred loss development techniques, as well as the Bornhuetter-Ferguson technique. For each method, judgmental selections of low and high ultimate losses are made, and the selection of the ultimate value is based on the actuary’s judgment.
Management believes that its aggregate liability for unpaid Loss and Loss Adjustment Expenses at
year-end
represents its best estimate, based upon the available data, of the amount necessary to cover the ultimate cost of losses and claims to date.Projections of future ultimate losses and loss expenses are inherently uncertain because of the random nature of claims occurrences and the dependency on future contingent events, which are affected by economic, legal, political and social factors. Due to these uncertainties, it is not possible to determine whether actual loss experience will conform to the assumptions used in estimating the liability. As a result, the actual liability may be significantly in excess of or less than the amount indicated in the financial statements. As adjustments to those estimates become necessary, such adjustments are reflected in current operations.
Deferred Policy Acquisition Costs
Incremental direct costs of acquiring insurance contracts and certain costs related directly to the acquisition process are deferred and amortized over the terms of the policies or reinsurance treaties to which they relate.
F-145
Those costs include commissions, premium taxes and board and bureau fees. Expense allowances recorded in connection with reinsurance arrangements are accounted for as a reduction of the related acquisition cost. Amortization for the periods ended June 30, 2020 and 2019 was $5,244 and $1,632 respectively.
Deferred Ceding Fees
Ceding fees that are associated with unearned premiums are established as a liability and amortized into income pro rata over the life of the underlying business.
Income Taxes
Deferred federal income taxes have been provided for temporary differences between the tax basis of assets and liabilities and their reported amounts in the financial statements. Such differences are related principally to the deferral of policy acquisition costs, discounting of losses for tax purposes and unearned premium reserves.
The Company recognizes the effect of an uncertain tax position only if it is more likely than not that the position is sustainable based on its technical merits. Measurement of the tax position’s effect on the income tax provision is based on the largest amount of benefit that is greater than 50% likely of being realized upon the ultimate settlement. Differences between the amount of benefits taken or expected to be taken in the Company’s income tax returns and the amount of benefits recognized based on this evaluation and measurement of the related tax positions represent the unrecognized income tax benefit, which is reflected as a liability. The Company includes interest and penalties related to unrecognized income tax benefits in income tax expense in the statements of operations.
The Company files a federal and several state income tax returns. The current provision for Federal and state income taxes is based on Spinnaker’s income which is currently taxable.
Recently Adopted Accounting Pronouncements
In July 2018, the Financial Accounting Standards Board (“FASB”) issued Accounting Standards Update (“ASU”) No.
2018-13, Changes
to the Disclosure Requirements for Fair Value Measurement, which will remove, modify, and add disclosure requirements for fair value measurements to improve the overall usefulness of such disclosures. This guidance is effective for financial statements issued for fiscal years beginning after December 15, 2019, and interim periods within those fiscal years, with early adoption permitted for any removed or modified disclosure requirements. Transition is on a prospective basis for the new and modified disclosures, and on a retrospective basis for disclosures that have been eliminated. The Company adopted ASU No.2018-13
on January 1, 2020, and the adoption did not have a material impact on the Company’s financial statements.In November 2016, the FASB issued ASU (ASU 2016-18). This ASU requires changes in restricted cash during the period to be included with cash and cash equivalents when reconciling theandtotal amounts shown on the statement of cash flows. If cash, cash equivalents and restricted cash are presented in more than one line item on the balance sheet, the new guidance requires a reconciliation of the total in the statement of cash flows to the related captions in the balance sheet. The Company elected to adopt (ASU
No. 2016-18,
Statement of Cash Flows, Restricted Cash
beginning-of-period
end-of-period
ASU 2016-18 on
January 1, 2019 and has retroactively reflected the adoption in Company’s financial statements. In addition, the Company adopted ASU No2016-15,
Statement of Cash Flow
2016-15)
on January 1, 2019. The guidance reduces diversity in how certain cash receipts and cash payments are presented and classified in the statements of cash flows. The adoption of ASUNo. 2016-15
did not have a material impact on the Company’s condensed financial statements.In February 2016 FASB issued ASU), which supersedes FASB ASC Topic 840,and provides principles for the recognition, measurement, presentation, and disclosure of leases for both lessees and the lessors. Topic 842 requires the lessees to apply a dual approach, classifying leases as either finance or operating leases based on the principle of whether or not the lease is effectively a financed
No. 2016-02,
Leases (Topic 842
Leases (Topic 840)
F-146
purchase by the lessee. The classification will determine whether lease expense is recognized based on an effective interest method or on a straight-line basis over the term of the lease, respectively. A lessee is also required to record aasset and a lease liability for all leases with a term of greater than twelve months regardless of classification. Leases with a term of twelve months or less will be accounted for similar to existing guidance for operating leases. In November 2019 FASB issued ASU No
right-of-use
2019-10
and revised the effective date based on updated criteria with the effective date for fiscal years beginning after December 15, 2020. In June 2020 FASB issued ASU No2020-05
further delaying the effective date for fiscal years beginning after December 15, 2021 due to theCOVID-19
pandemic.The Company adopted Topic 842 on January 1, 2019, and the impact of the adoption was disclosed in Note 5.
Recent Accounting Pronouncements Not Yet Adopted
In June 2016, the FASB issued ASU No., and subsequent related ASUs, which amends the guidance on the impairment of financial instruments by requiring measurement and recognition of expected credit losses for financial assets held. This ASU is effective for private companies’ fiscal year, and for interim periods within those fiscal year, beginning after December 15, 2022. The Company expects to adopt ASU No.
2016-13,
Financial instruments — Credit Losses (Topic 326): Measurement of Credit Losses on Financial Instruments
2016-13 beginning
January 1, 2023 and is currently evaluating the impact on the Company’s financial statements.In December 2019, the FASB issued ASU No.. ASU
2019-12,
Income Taxes (Topic 740): Simplifying the Accounting for Income Taxes
No. 2019-12
removes certain exceptions to the general principles in Topic 740 and also clarifies and amends existing guidance to improve consistent application. ASUNo. 2019-12
will be effective for private entities for annual periods beginning after December 15, 2021, and interim periods beginning after December 15, 2020, with early adoption permitted. The Company expects to adopt ASUNo. 2019-12
beginning January 1, 2022 and is currently assessing the impact the guidance will have on the Company’s financial statements.2. Investments
Investments are carried at fair value and their associated cost or amortized cost as of June 30, 2020 and December 31, 2019 as follows:
June 30.2020 | ||||||||||||||||
Amortized Cost | Gross Unrealized Gains | Gross Unrealized Losses | Fair Value | |||||||||||||
Short-term investments | ||||||||||||||||
Treasury bills | $ | 4,998 | — | — | $ | 4,998 | ||||||||||
Total short-term investments | 4,998 | — | — | 4,998 | ||||||||||||
Fixed maturities: | ||||||||||||||||
U.S. government and agencies | $ | 6307 | $ | 89 | $ | — | $ | 6,396 | ||||||||
All other government | 489 | 145 | — | 634 | ||||||||||||
States, territories and possessions and political subdivisions | 3,149 | 221 | — | 3,370 | ||||||||||||
Corporate securities | 18,491 | 667 | (1 | ) | 19,157 | |||||||||||
Foreign securities | 1,802 | 90 | — | 1,892 | ||||||||||||
Residential mortgage-backed securities | 6,227 | 195 | — | 6,422 | ||||||||||||
Commercial mortgage-backed securities | 5,250 | 234 | — | 5,484 | ||||||||||||
Asset backed securities | 3,691 | 113 | — | 3,804 | ||||||||||||
Total fixed maturities | $ | 45,406 | $ | 1,754 | $ | (1 | ) | $ | 47,159 | |||||||
Total investments | $ | 50,404 | $ | 1,754 | $ | (1 | ) | $ | 52,157 | |||||||
F-147
December 31, 2019 | ||||||||||||||||
Amortized Cost | Gross Unrealized Gains | Gross Unrealized Losses | Fair Value | |||||||||||||
Fixed maturities: | ||||||||||||||||
U.S. government and agencies | $ | 7,854 | $ | 35 | $ | — | $ | 7,889 | ||||||||
All other government | 500 | — | — | 500 | ||||||||||||
States ; territories and possessions and political subdivisions | 2,662 | 69 | (3 | ) | 2,728 | |||||||||||
Corporate securities | 16,455 | 243 | (10 | ) | 16,688 | |||||||||||
Foreign securities | 3,002 | 53 | — | 3,055 | ||||||||||||
Residential mortgage-backed securities | 7,347 | 61 | (10 | ) | 7,398 | |||||||||||
Commercial mortgage-backed securities | 2,753 | 42 | (19 | ) | 2,776 | |||||||||||
Asset backed securities | 3,000 | 44 | (1 | ) | 3,043 | |||||||||||
Total investments | $ | 43,573 | $ | 547 | $ | (43 | ) | $ | 44,077 | |||||||
The cost and fair value of short-term investments and investments with fixed maturities are shown by contractual maturity as of June 30, 2020 and December 31, 2019. Expected maturities will differ from contractual maturities because borrowers may have the right to call or prepay obligations with or without call or prepayment penalties.
June 31, 2020 | ||||||||
Amortized Cost | Fair Value | |||||||
Due to mature: | ||||||||
One year or less | $ | 12,783 | $ | 12,819 | ||||
After one year through five years | 18,045 | 18,785 | ||||||
After five years | 4,321 | 4,756 | ||||||
After ten years | 87 | 87 | ||||||
Residential mortgage-backed securities | 6,227 | 6,422 | ||||||
Commercial mortgage-backed securities | 5,250 | 5,484 | ||||||
Asset backed securities | 3,691 | 3,804 | ||||||
Total investments | $ | 50,404 | $ | 52,157 | ||||
December 31, 2019 | ||||||||
Amortized Cost | Fair Value | |||||||
Due to mature: | ||||||||
One year or less | $ | 9,096 | $ | 9,120 | ||||
After one year through five years | 17,672 | 17,935 | ||||||
After five years | 3,598 | 3,699 | ||||||
After ten years | 107 | 106 | ||||||
Residential mortgage-backed securities | 7,347 | 7,398 | ||||||
Commercial mortgage-backed securities | 2,753 | 2,776 | ||||||
Asset backed securities | 3,000 | 3,043 | ||||||
Total investments | $ | 43,573 | $ | 44,077 | ||||
Proceeds from sales or maturities of investments during the six months ended June 30, 2020 and 2019 were $6,071 and $2,372, respectively. The Company recognized gross realized gains of $40 and $0 and gross realized losses of $1 and $0 during the six months ended June 30, 2020 and 2019, respectively.
F-148
Investments with a carrying value of $8,087 and $8,050 at June 30, 2020 and December 31, 2019, respectively have been deposited with various state regulatory agencies as required by law.
The Company’s net investment income for the six months ended June 30, 2020 and 2019 is comprised of the following:
Six months ended. | ||||||||
June 30, 2020 | June 30, 2019 | |||||||
Fixed income | $ | 562 | $ | 445 | ||||
Cash and cash equivalents | 68 | 178 | ||||||
Total gross investment income | 630 | 623 | ||||||
Investment expenses | 74 | 66 | ||||||
Net investment income | $ | 556 | $ | 557 | ||||
At June 30, 2020 and December 31, 2019, the Company’s investment portfolio had unrealized losses of $1 and $43, respectively. As of June 30, 2020 and December 31, 2019, the Company’s investments in securities which had unrealized losses by the length of time the investments had been in an unrealized loss position by major category are as follows:
June 30. 2020 | ||||||||||||||||||||||||
Less than 12 months | Greater than 12 months | Total | ||||||||||||||||||||||
Fair Value | Unrealized Losses | Fair Value | Unrealized Losses | Fair Value | Unrealized Losses | |||||||||||||||||||
Short-term investments | ||||||||||||||||||||||||
Treasury bills | $ | 4,998 | $ | — | $ | — | $ | — | $ | 4,998 | $ | — | ||||||||||||
Total short-tenn investments | 4,998 | — | — | — | 4,998 | — | ||||||||||||||||||
Fixed maturities: | ||||||||||||||||||||||||
U.S. government and agencies | $ | 1,011 | $ | — | $ | — | $ | — | $ | 1,011 | $ | — | ||||||||||||
Corporate securities | — | — | 504 | (1 | ) | 504 | (1 | ) | ||||||||||||||||
Commercial mortgage- backed securities | — | — | 118 | — | 118 | — | ||||||||||||||||||
Total fixed maturities | 1,011 | 622 | (1 | ) | 1,633 | (1 | ) | |||||||||||||||||
Total investments | $ | 6,009 | $ | — | $ | 622 | $ | (1 | ) | $ | 6,631 | $ | (1 | ) | ||||||||||
December 31.2019 | ||||||||||||||||||||||||
Less than 12 months | Greater than 12 months | Total | ||||||||||||||||||||||
Fair Value | Unrealized Losses | Fair Value | Unrealized Losses | Fair Value | Unrealized Losses | |||||||||||||||||||
Fixed matunties: | ||||||||||||||||||||||||
U.S. government and agencies | $ | 998 | $ | — | $ | — | $ | — | $ | 998 | $ | — | ||||||||||||
States, territories and possessions and political subdivisions | 743 | (3 | ) | 107 | — | 850 | (3 | ) | ||||||||||||||||
Corporate securities | 1,567 | (10 | ) | — | — | 1,567 | (10 | ) | ||||||||||||||||
Residential mortgage-backed securities | 1,957 | (6 | ) | 991 | (4 | ) | 2,948 | (10 | ) | |||||||||||||||
Commercial mortgage- backed securities | 1,022 | (17 | ) | 159 | (2 | ) | 1,181 | (19 | ) | |||||||||||||||
Asset-backed secunties | 749 | (1 | ) | — | — | 749 | (1 | ) | ||||||||||||||||
Total investments | $ | 7,036 | $ | (37 | ) | $ | 1,257 | $ | (6 | ) | $ | 8,293 | $ | (43 | ) | |||||||||
F-149
The Company frequently reviews its investment portfolio for declines in fair value. The Company’s process for identifying declines in the fair value of investments that are other than temporary involves consideration of several factors. These factors include (i) the time period in which there has been a significant decline in value, (ii) an analysis of the liquidity, business prospects and overall financial condition of the issuer, (iii) the significance of the decline and (iv) the Company’s intent and ability to hold the investment for a sufficient period of time for the value to recover. When the Company’s analysis of the above factors results in the Company’s conclusion that declines in fair values are other than temporary, the cost of the securities is written down to fair value and the previously unrealized loss is therefore reflected as a realized loss. As of June 30, 2020 and December 31, 2019, three and seventeen fixed maturity investments have unrealized losses, respectively. In conjunction with its outside investment advisors, the Company analyzed the credit ratings of the securities as well as the historical monthly amortized cost to fair value ratio of securities in an unrealized loss position. Based on these analyses, the Company does not consider these investments to be other-than-temporarily impaired at June 30, 2020 and December 31, 2019.
3. Fair Value Measurements
The Company maximizes the use of observable inputs in its valuation techniques and applies unobservable inputs only to the extent that observable inputs are unavailable. The largest class of assets and liabilities carried at fair value by the Company at June 30, 2020 and December 31, 2019 were fixed income securities.
Prices provided by independent pricing services and independent broker quotes can vary widely, even for the same security.
The Company’sinvestments are comprised of a variety of different securities, which are classified into levels based on the valuation technique and inputs used in their valuation. The valuation of cash equivalents is generally based on Level I inputs, which use the market approach valuation technique. The valuation of the Company’s otherinvestments, including the vast majority of fixed income securities generally incorporate significant Level II inputs using the market and income approach techniques. The Company may assign a lower level to inputs typically considered to be Level II based on its assessment of liquidity and relative level of uncertainty surrounding inputs. There were no assets or liabilities classified at Level III at June 30, 2020 and December 31, 2019.
available-for-sale
available-for-sale
F-150
The following table sets forth the Company’s assets and liabilities which are measured on a recurring basis by the level within the fair value hierarchy in which fair value measurements fall as of June 30, 2020 and December 31, 2019:
Fair Valve Measurement at June 30. 2020 | ||||||||||||||||
Total | Level I | Level II | Level III | |||||||||||||
Assets: | ||||||||||||||||
Cash equivalents: | ||||||||||||||||
Money market fund | $ | 296 | $ | 296 | $ | — | $ | — | ||||||||
Treasury bill | 8,499 | 8,499 | — | — | ||||||||||||
Total Cash equivalents | 8,795 | 8,795 | — | — | ||||||||||||
Short-term investments: | ||||||||||||||||
Treasury bills | 4,998 | 4,998 | — | |||||||||||||
Total short-term investments | 4,998 | 4,998 | — | — | ||||||||||||
Fixed maturity securities: | ||||||||||||||||
U.S. government and agencies | 6,396 | 6,396 | — | — | ||||||||||||
All other government | 634 | — | 634 | — | ||||||||||||
States, territories and possessions | — | — | ||||||||||||||
and political subdivisions | 3,370 | — | 3,370 | — | ||||||||||||
Corporate securities | 19,157 | — | 19,157 | — | ||||||||||||
Foreign securities | 1,892 | — | 1,892 | — | ||||||||||||
Residential mortgage-backed securities | 6,422 | — | 6,422 | — | ||||||||||||
Commercial mortgage-backed securities | 5,484 | — | 5,484 | — | ||||||||||||
Asset backed securities | 3,804 | — | 3,804 | — | ||||||||||||
Total fixed maturity securities | 47,159 | 6,396 | 40,763 | — | ||||||||||||
Total assets at fair value | $ | 60,952 | $ | 20,189 | $ | 40,763 | $ | — | ||||||||
Fair Value Measurement at December 31. 2019 | ||||||||||||||||
Total | Level I Level II | Level HI | ||||||||||||||
Assets: | ||||||||||||||||
Cash equivalents: | ||||||||||||||||
Treasury bills | $ | 21,755 | $ | 21,755 | $ | — | $ | — | ||||||||
Total Cash equivalents | 21,755 | 21,755 | — | — | ||||||||||||
Fixed maturity securities: | ||||||||||||||||
U.S. government and agencies | 7,889 | 7,889 | — | — | ||||||||||||
All other government | 500 | — | 500 | |||||||||||||
States, territories and possessions and political subdivisions | 2,728 | — | 2,728 | — | ||||||||||||
Corporate securities | 16,688 | — | 16,688 | — | ||||||||||||
Foreign securities | 3,055 | — | 3,055 | — | ||||||||||||
Residential mortgage-backed securities | 7,398 | — | 7,398 | — | ||||||||||||
Commercial mortgage-backed securities | 2,776 | — | 2,776 | — | ||||||||||||
Asset backed securities | 3,043 | — | 3,043 | — | ||||||||||||
Total fixed maturity securities | 44,077 | 7,889 | 36,188 | |||||||||||||
Total assets at fair value | $ | 65,832 | $ | 29,644 | $ | 36,188 | $ | — | ||||||||
F-151
4. Insurance and Reinsurance Activity
The Company has entered into quota share and excess of loss contracts which may have catastrophe exposure. The Company is not relieved of its primary obligations to policyholders in the event of a default or the insolvency of its reinsurers, therefore a credit exposure exists to the extent that any reinsurer fails to meet its obligations assumed in the reinsurance agreements. To mitigate this exposure to reinsurance insolvencies, The Company evaluates the financial condition of its reinsurers and, in certain circumstances, holds substantial collateral (in the form of funds withheld and letters of credit) as security under the reinsurance agreements.
A reconciliation of direct to net premiums on both a written and an earned basis is as follows:
Six Months Ended June 30, 2020 | Six Months Ended June 30, 2019 | |||||||||||||||
Premiums Written | Premiums Earned | Premiums Written | Premiums Earned | |||||||||||||
Direct premium | $ | 133,033 | $ | 111,223 | $ | 93,030 | $ | 53,531 | ||||||||
Ceded premium — nonaffiliated | (131,425 | ) | (107,146 | ) | (89,704 | ) | (49,812 | ) | ||||||||
Net premiums | $ | 1,608 | $ | 4,077 | $ | 3,326 | $ | 3,719 | ||||||||
A reconciliation of direct to net Loss and Loss Adjustment Expense is as follows:
Six Months Ended, | ||||||||
June 30, 2020 | June 30. 2019 | |||||||
Direct Loss and Loss Adjustment Expenses | $ | 93,942 | $ | 48,574 | ||||
Ceded Loss and Loss Adjustment Expenses | (91,247 | ) | (46,456 | ) | ||||
Net Loss and Loss Adjustment Expenses | $ | 2,695 | $ | 2,118 | ||||
Activity in the liability for unpaid Loss and Loss Adjustment Expenses is summarized as follows:
Six Months Ended. | ||||||||
June 30, 2020 | June 30, 2019 | |||||||
Balance at beginning of period: | ||||||||
Liability for unpaid Loss and Loss Adjustment Expense | $ | 36,457 | $ | 13,072 | ||||
Reinsurance recoverable | 33,427 | $ | 10,223 | |||||
Net balance at beginning of period | 3,030 | 2,849 | ||||||
Incurred related to: | ||||||||
Current year | 2,739 | 2,107 | ||||||
Prior years | (40 | ) | 13 | |||||
Total incurred | 2,699 | 2.120 | ||||||
Paid related to: | ||||||||
Current year | 1,412 | 1,016 | ||||||
Prior years | 646 | (756 | ) | |||||
Total paid | 2,058 | 260 | ||||||
Balance at end of period: | ||||||||
Liability for unpaid Loss and Loss Adjustment Expense | 57,138 | 29,284 | ||||||
Reinsurance recoverable | 53,467 | 24,576 | ||||||
Net balance at end of period | $ | 3,671 | $ | 4,708 | ||||
F-152
Net incurred income (losses) and LAE attributable to insurance events of the prior year have developed by ($40) and $13 during the six months ended June 30, 2020 and 2019, respectively, as a result of
re-estimation
of unpaid losses and LAE. These changes are generally a result of ongoing analysis of recent loss development trends. Original estimates are decreased or increased as additional information becomes known regarding individual claims.5. Operating Leases
The Company has an operating lease of home office space under a
non-cancellable
agreement that expires July 31, 2024. The lease has an option to extend for up to an additional 5 years. The discount rate used for the operating lease is 7.87%.The following summarizes the line items in the balance sheet which include amounts for operating and finance leases as of June 30, 2020 and December 31, 2019:
June 30, 2020 | December 31, 2019 | |||||||
Operating lease right-of-use-office | $ | 259 | $ | 259 | ||||
Accumulated amortization | (53 | ) | (32 | ) | ||||
Operating lease included in property, plant & equipment | 206 | 227 | ||||||
Operating lease liability included in included in accrued expenses and other liabilities | $ | (225 | ) | $ | (246 | ) | ||
The maturities of the lease liability as of June 30, 2020 were as follows:
Remaining fiscal 2020 | $ | 31 | ||
Fiscal year 2021 | 63 | |||
Fiscal year 2022 | 66 | |||
Fiscal year 2023 | 66 | |||
Fiscal year 2024 | 38 | |||
Total lease Payments | 264 | |||
Less: interest | (39 | ) | ||
Present value of the lease liability | $ | 225 | ||
The following summarizes the line items in the income statements which include the components of lease expense for the six months ended June 30, 2020 and 2019:
Six Months Ended, | ||||||||
June 30, 2020 | June 30, 2019 | |||||||
Operating lease included in underwriting and general expenses | $ | 32 | $ | 23 | ||||
The following summarizes cash flow information related to leases for the six months ended June 30, 2020 and 2019:
Six Months Ended, | ||||||||
2020 | 2019 | |||||||
Cash paid for amounts included in the measurement of the lease liabilities: Operating cash flows from operating leases | $ | 31 | $ | 8 | ||||
Lease assets obtained in exchange for the lease obligation: Operating leases | $ | — | $ | 259 | ||||
F-153
6. Commitments and contingencies
The Company is not aware of any contingencies that will materially impact the Company’s financial position, cash flows, or results of operations.
The Company has a $1,000,000 line of credit with PNC Bank, N.A., of which there is no outstanding amount as of June 30, 2020 and December 31, 2019. The line of credit matures on September 18, 2020. During the term of the line of credit, the Company can borrow at any time and partially or wholly repay any outstanding borrowings and then
re-borrow,
as necessary up to the total amount of the line of credit, until the maturity date of September 18, 2020. Any future borrowings under the line of credit are expected to be used for ongoing working capital requirements and other general corporate purposes. Any borrowings on the line of credit bear interest at a rate of LIBOR plus 1.2 percent. The line of credit is collateralized by substantially all of the business assets of the Company.7. Benefit Plans
The Company sponsors a 401(k) plan that covers all eligible employees. Beginning in 2018, the Company provides a match of 50% of the first 6% of the employees’ contributions. The Company contributed $31 and $25 to the defined contribution plan during the six months ended June 30, 2020 and 2019, respectively.
8. Income Taxes
The effective income tax rate was 21.9% for the six months ended June 30, 2020 compared to (6.7%) for the six months ended June 30, 2019. The difference between the rate at June 30, 2020 and the U.S. federal income tax rate of 21% was primarily due to
non-deductible
expenses and state income taxes. The difference between the rate at June 30, 2019 and the U.S. federal income tax rate of 21% was driven by a full valuation allowance against the Company’s net deferred tax assets, including a deferred tax benefit related to an increase in the fair value of the Company’s debt investment portfolio, reflected in other comprehensive income.The Company will recognize a valuation allowance if based on the weight of all available evidence, it is more likely than not that some, or all, of a deferred tax asset will not be realized. The Company recorded no valuation allowance at June 30, 2020 and December 31, 2019 as management has determined that it is more likely than not that the Company’s net deferred tax asset will be fully realized. The change in valuation allowance for the six months ended June 30, 2020 was $0.
The Company did not have an unrecognized tax benefit as of June 30, 2020 and 2019. No interest or penalties were incurred during the six months ended June 30, 2020 and 2019.
On March 27, 2020, the Coronavirus Aid, Relief, and Economic Security Act (“CARES Act”) was signed into law in the U.S. to provide certain relief as a result of the
COVID-19
pandemic. As of June 30, 2020, the Company has determined that neither the CARES Act nor changes to income tax laws or regulations in other jurisdictions had a significant impact on the Company’s effective tax rate.9.
Stockholder’s
Equity
The Company has 1,000 shares of $4,200 par value authorized, issued and outstanding common stock at June 30, 2020 and December 31, 2019. Sojourner was the sole shareholder prior to the Company’s acquisition by Hippo.
There were no issuances during the six months ended June 30, 2020 and the year ended 2019, respectively. There were no dividends declared or paid during the six months ended June 30, 2020 and year ended December 31, 2019.
F-154
10. Statutory Net Earnings and Shareholder’s Equity
The Company, which is domiciled in Illinois, prepares its statutory financial statements in accordance with accounting principles and practices prescribed or permitted by the Illinois Insurance Department. These principles are recognized for determining solvency under applicable state law. The commissioner of the Illinois Insurance Department has the right to permit other practices that may deviate from prescribed practices. Prescribed statutory accounting practices are those practices that are incorporated directly or by reference in state laws, regulations and general administrative rules applicable to all insurance enterprises domiciled in Illinois.
Generally accepted accounting principles differ in certain respects from the accounting practices prescribed or permitted by insurance regulatory authorities (statutory basis). As filed in the statutory basis annual statement with the Insurance Department of the State of Illinois, the differences in members’ equity and net earnings are as follows:
June 30, 2020 | June 30, 2019 | |||||||
Total shareholder’s equity | $ | 45,769 | $ | 37,266 | ||||
Non-admitted assets | (859 | ) | (132 | ) | ||||
Deferred policy acquisition costs | (2,403 | ) | (2,382 | ) | ||||
Deferred taxes | 879 | — | ||||||
Book value of bonds (PGAAP) | (70 | ) | (77 | ) | ||||
Market value of bonds | (1,684 | ) | (400 | ) | ||||
Aggregate statutory surplus of insurance subsidiaries | $ | 41,632 | $ | 34,275 | ||||
June 30, 2020 | June 30, 2019 | |||||||
Net Income | $ | 3,593 | $ | 1,951 | ||||
Deferred policy acquisition costs | 58 | (462 | ) | |||||
Deferred taxes | 70 | (164 | ) | |||||
GAAP to STAT bond amortization difference | 4 | 4 | ||||||
Other differences | 1 | — | ||||||
Aggregate statutory net earnings | $ | 3,726 | $ | 1,329 | ||||
The insurance laws of the State of Illinois restrict dividend payments by the Company’s insurance subsidiary. In most cases, Spinnaker cannot pay dividends without the prior approval of the Insurance Commissioner of the State of Illinois. In addition, insurance laws require the maintenance of minimum capital and surplus. Illinois requires the Company to maintain
paid-in
capital of $1,000 and surplus of $2,000. The Company is in compliance with these requirements.Insurance regulators use multiple metrics to regulate insurance companies and determine the appropriate levels of capital an insurer should maintain above the statutory minimum capital levels noted above. Risk-based capital (“RBC”), which is the most commonly used tool, is designed to measure the acceptable amount of capital an insurer should have, based on the inherent risks of its business. Insurers failing to meet adequate capital levels may be subject to insurance department scrutiny, and ultimately, rehabilitation or liquidation. Spinnaker maintained surplus in excess of prescribed minimum risk-based capital requirements as calculated by the Company and filed with the Illinois Insurance Department as of December 31, 2019.
11. Related Parties
One of the Company’s owners, Arch Reinsurance Company and its affiliates (collectively “Arch”), participates on certain reinsurance contracts on an annual basis at market terms consistent with the terms for unaffiliated reinsurers. For the periods ended June 30, 2020 and 2019, the Company ceded premiums to Arch of
F-155
$28,648 and $24,876, respectively. At June 30, 2020 and December 31, 2019, the Company had unsecured net balances due from Arch of $5,705 and $6,480, respectively. Other similar owners participate in the Company’s reinsurance programs, however, the amounts of premiums ceded and unsecured balances due from these related parties is deemed to be not material by Management.
12. Subsequent Events
The Company has evaluated subsequent events through November 30, 2020, the date these financial statements were available for issuance.
COVID-19
As a result of the spread of the
COVID-19
coronavirus, economic uncertainties have arisen which may negatively affect the financial position, results of operations and cash flows of the Company. The duration of these uncertainties and the ultimate financial effects cannot be reasonably estimated at this time.Acquisition by Hippo Enterprises Inc.
In June 2020, Hippo Enterprises Inc. (“Hippo”) entered into a stock purchase agreement to acquire the Company for approximately $95 million, consisting primarily of cash, subject to customary net debt and working capital adjustments. The transaction closed on September 1, 2020. Hippo was also the parent of one of the program administrators sourcing insurance business for the Company in 2020 and 2019.
F-156

Hippo Holdings Inc.
Up to
386,233,065
Shares of Common Stock
Up to
5,037,463
Warrants
PROSPECTUS
, 2021
PART II: INFORMATION NOT REQUIRED IN PROSPECTUS
Item 13. Other Expenses of Issuance and Distribution.
The following table sets forth the estimated expenses to be borne by the registrant in connection with the issuance and distribution of the shares of common stock and warrants being registered hereby.
Securities and Exchange Commission registration fee | $ | 183,510.65 | ||
Accounting fees and expenses | $ | 35,000.00 | ||
Legal fees and expenses | $ | 75,000.00 | ||
Financial printing and miscellaneous expenses | $ | 115,000.00 | ||
Total | $ | 408,510.65 |
Item 14. Indemnification of Directors and Officers.
Subsection (a) of Section 145 of the General Corporation Law of the State of Delaware (the “DGCL”) empowers a corporation to indemnify any person who was or is a party or who is threatened to be made a party to any threatened, pending or completed action, suit or proceeding, whether civil, criminal, administrative or investigative (other than an action by or in the right of the corporation) by reason of the fact that the person is or was a director, officer, employee or agent of the corporation, or is or was serving at the request of the corporation as a director, officer, employee or agent of another corporation, partnership, joint venture, trust or other enterprise, against expenses (including attorneys’ fees), judgments, fines and amounts paid in settlement actually and reasonably incurred by the person in connection with such action, suit or proceeding if the person acted in good faith and in a manner the person reasonably believed to be in or not opposed to the best interests of the corporation, and, with respect to any criminal action or proceeding, had no reasonable cause to believe the person’s conduct was unlawful.
Subsection (b) of Section 145 empowers a corporation to indemnify any person who was or is a party or is threatened to be made a party to any threatened, pending or completed action or suit by or in the right of the corporation to procure a judgment in its favor by reason of the fact that the person acted in any of the capacities set forth above, against expenses (including attorneys’ fees) actually and reasonably incurred by the person in connection with the defense or settlement of such action or suit if the person acted in good faith and in a manner the person reasonably believed to be in or not opposed to the best interests of the corporation, except that no indemnification shall be made in respect of any claim, issue or matter as to which such person shall have been adjudged to be liable to the corporation unless and only to the extent that the Court of Chancery or the court in which such action or suit was brought shall determine upon application that, despite the adjudication of liability but in view of all the circumstances of the case, such person is fairly and reasonably entitled to indemnity for such expenses which the Court of Chancery or such other court shall deem proper.
Section 145 further provides that to the extent a director or officer of a corporation has been successful on the merits or otherwise in the defense of any action, suit or proceeding referred to in subsections (a) and (b) of Section 145, or in defense of any claim, issue or matter therein, such person shall be indemnified against expenses (including attorneys’ fees) actually and reasonably incurred by such person in connection therewith; that indemnification provided for by Section 145 shall not be deemed exclusive of any other rights to which the indemnified party may be entitled; and the indemnification provided for by Section 145 shall, unless otherwise provided when authorized or ratified, continue as to a person who has ceased to be a director, officer, employee or agent and shall inure to the benefit of such person’s heirs, executors and administrators. Section 145 also empowers the corporation to purchase and maintain insurance on behalf of any person who is or was a director, officer, employee or agent of the corporation, or is or was serving at the request of the corporation as a director, officer, employee or agent of another corporation, partnership, joint venture, trust or other enterprise against any liability asserted against such person and incurred by such person in any such capacity, or arising out of his status as such, whether or not the corporation would have the power to indemnify such person against such liabilities under Section 145.
II-1
Section 102(b)(7) of the DGCL provides that a corporation’s certificate of incorporation may contain a provision eliminating or limiting the personal liability of a director to the corporation or its stockholders for monetary damages for breach of fiduciary duty as a director, provided that such provision shall not eliminate or limit the liability of a director (i) for any breach of the director’s duty of loyalty to the corporation or its stockholders, (ii) for acts or omissions not in good faith or which involve intentional misconduct or a knowing violation of law, (iii) under Section 174 of the DGCL, or (iv) for any transaction from which the director derived an improper personal benefit.
Additionally, our Certificate of Incorporation limits the liability of our directors to the fullest extent permitted by the DGCL, and our Bylaws provide that we will indemnify them to the fullest extent permitted by such law. We have entered into and expect to continue to enter into agreements to indemnify our directors, executive officers and other employees as determined by our board of directors. Under the terms of such indemnification agreements, we are required to indemnify each of our directors and officers, to the fullest extent permitted by the laws of the state of Delaware, if the basis of the indemnitee’s involvement was by reason of the fact that the indemnitee is or was our director or officer or was serving at our request in an official capacity for another entity. We must indemnify our officers and directors against all direct and indirect costs, fees and expenses of any type or nature whatsoever, including all other disbursements, obligations or expenses of the types customarily incurred in connection with prosecuting, defending, preparing to prosecute or defend, investigating, being or preparing to be witness in, settlement or appeal of, or otherwise participating in any threatened, pending or completed action, suit, claim, counterclaim, cross claim, arbitration, mediation, alternate dispute resolution mechanism, investigation, inquiry, administrative hearing or any other actual, threatened or completed proceeding. The indemnification agreements also require us to advance, to the extent not prohibited by law, all direct and indirect costs, fees and expenses that such director or officer incurred, provided that such person will return any such advance if it is ultimately determined that such person is not entitled to indemnification by us. Any claims for indemnification by our directors and officers may reduce our available funds to satisfy successful third-party claims against us and may reduce the amount of money available to us.
Item 15. Recent Sales of Unregistered Securities.
Since January 1, 2018, we have made sales of the following unregistered securities:
| • | On October 7, 2020, RTPZ issued an aggregate of 5,750,000 RTPZ Class B ordinary shares to the Sponsor for an aggregate gross proceeds of $25,000; |
| • | On November 23, 2020, RTPZ issued 4,400,000 warrants to purchase an equivalent number of RTPZ Class A ordinary shares to the Sponsor for aggregate gross proceeds of $6,600,000; and |
| • | On August 2, 2021, Hippo Holdings issued 55,000,000 shares of Hippo Holdings common stock to certain qualified institutional buyers and accredited investors that agreed to purchase such shares in connection with the Business Combination for aggregate gross proceeds of $550,000,000. |
The foregoing securities were issued in transactions not involving an underwriter and not requiring registration under Section 5 of the Securities Act of 1933, as amended, in reliance on the exemption afforded by Section 4(a)(2) thereof.
II-2
Item 16. Exhibits and Financial Statement Schedules.
The financial statements filed as part of this registration statement are listed in the index to the financial statements immediately preceding such financial statements, which index to the financial statements is incorporated herein by reference.
II-3
II-4
| † | The schedules, and certain exhibits to this Exhibit have been omitted pursuant to Item 601(b)(2) of Regulation S-K. The Registrant hereby agrees to furnish supplementally a copy of any omitted schedule or exhibit to the SEC upon request. |
| + | Indicates a management contract or compensatory plan. |
Item 17. Undertakings.
The undersigned Registrant hereby undertakes:
| (a) | To file, during any period in which offers or sales are being made, a post-effective amendment to this Registration Statement: |
| (i) | To include any prospectus required by section 10(a)(3) of the Securities Act of 1933; |
| (ii) | To reflect in the prospectus any facts or events arising after the effective date of this Registration Statement (or the most recent post-effective amendment thereof) which, individually or in the aggregate, represent a fundamental change in the information set forth in this Registration Statement. Notwithstanding the foregoing, any increase or decrease in volume of securities offered (if the total dollar value of securities offered would not exceed that which was registered) and any deviation from the low or high end of the estimated maximum offering range may be reflected in the form of prospectus filed with the Commission pursuant to Rule 424(b) if, in the aggregate, the changes in volume and price represent no more than 20% change in the maximum aggregate offering price set forth in the “Calculation of Registration Fee” table in the effective registration statement; and |
| (iii) | To include any material information with respect to the plan of distribution not previously disclosed in this Registration Statement or any material change to such information in this Registration Statement; and |
II-5
| (b) | That, for the purpose of determining any liability under the Securities Act of 1933, each such post-effective amendment that contains a form of prospectus will be deemed to be a new registration statement relating to the securities offered therein, and the offering of such securities at that time will be deemed to be the initial bona fide offering thereof. |
| (c) | To remove from registration by means of a post-effective amendment any of the securities being registered which remain unsold at the termination of the offering. |
| (d) | That, for the purpose of determining liability under the Securities Act of 1933 to any purchaser, each prospectus filed pursuant to Rule 424(b) as part of a registration statement relating to an offering, other than registration statements relying on Rule 430B or other than prospectuses filed in reliance on Rule 430A, will be deemed to be part of and included in the registration statement as of the date it is first used after effectiveness. Provided, however, that no statement made in a registration statement or prospectus that is part of the registration statement or made in a document incorporated or deemed incorporated by reference into the registration statement or prospectus that is part of the registration statement will, as to a purchaser with a time of contract of sale prior to such first use, supersede or modify any statement that was made in the registration statement or prospectus that was part of the registration statement or made in any such document immediately prior to such date of first use. |
| (e) | That, for the purpose of determining liability of the registrant under the Securities Act of 1933 to any purchaser in the initial distribution of the securities, the undersigned registrant undertakes that in a primary offering of securities of the undersigned registrant pursuant to this registration statement, regardless of the underwriting method used to sell the securities to the purchaser, if the securities are offered or sold to such purchaser by means of any of the following communications, the undersigned registrant will be a seller to the purchaser and will be considered to offer or sell such securities to such purchaser: |
| (i) | Any preliminary prospectus or prospectus of the undersigned registrant relating to the offering required to be filed pursuant to Rule 424; |
| (ii) | Any free writing prospectus relating to the offering prepared by or on behalf of the undersigned registrant or used or referred to by the undersigned registrant; |
| (iii) | The portion of any other free writing prospectus relating to the offering containing material information about the undersigned registrant or its securities provided by or on behalf of the undersigned registrant; and |
| (iv) | Any other communication that is an offer in the offering made by the undersigned registrant to the purchaser. |
| 2. | Insofar as indemnification for liabilities arising under the Securities Act of 1933 may be permitted to directors, officers and controlling persons of the Registrant pursuant to the foregoing provisions, or otherwise, the Registrant has been advised that in the opinion of the SEC such indemnification is against public policy as expressed in the Securities Act of 1933 and is, therefore, unenforceable. In the event that a claim for indemnification against such liabilities (other than the payment by the Registrant of expenses incurred or paid by a director, officer or controlling person of the Registrant in the successful defense of any action, suit or proceeding) is asserted by such director, officer or controlling person in connection with the securities being registered, the Registrant will, unless in the opinion of its counsel the matter has been settled by controlling precedent, submit to a court of appropriate jurisdiction the question whether such indemnification by them is against public policy as expressed in the Securities Act of 1933 and will be governed by the final adjudication of such issue. |
| 3. | The undersigned registrant hereby undertakes as follows: that prior to any public reoffering of the securities registered hereunder through use of a prospectus which is a part of this registration statement, by any person or party who is deemed to be an underwriter within the meaning of Rule 145(c), the issuer undertakes that such reoffering prospectus will contain the information called for by the applicable registration form with |
II-6
| respect to reofferings by persons who may be deemed underwriters, in addition to the information called for by the other items of the applicable form. |
| 4. | The registrant undertakes that every prospectus: (1) that is filed pursuant to the immediately preceding paragraph, or (2) that purports to meet the requirements of Section 10(a)(3) of the Act and is used in connection with an offering of securities subject to Rule 415, will be filed as a part of an amendment to the registration statement and will not be used until such amendment is effective, and that, for purposes of determining any liability under the Securities Act of 1933, each such post-effective amendment will be deemed to be a new registration statement relating to the securities offered therein, and the offering of such securities at that time will be deemed to be the initial bona fide offering thereof. |
| 5. | The undersigned Registrant hereby undertakes to respond to requests for information that is incorporated by reference into the prospectus pursuant to Items 4, 10(b), 11, or 13 of this Form S-4, within one business day of receipt of such request, and to send the incorporated documents by first class mail or other equally prompt means. This includes information contained in documents filed subsequent to the effective date of the Registration Statement through the date of responding to the request. |
| 6. | The undersigned Registrant hereby undertakes to supply by means of a post-effective amendment all information concerning a transaction, and the company being acquired involved therein, that was not the subject of and included in the Registration Statement when it became effective. |
II-7
SIGNATURES
Pursuant to the requirements of the Securities Act, the registrant has duly caused this registration statement to be signed on its behalf by the undersigned, thereunto duly authorized, in the City of San Francisco, State of California, on August 24, 2021.
HIPPO HOLDINGS INC. | ||
| By: | /s/ Assaf Wand | |
Name: Assaf Wand Title: Chief Executive Officer | ||
Each person whose signature appears below constitutes and appoints each of Assaf Wand, Stewart Ellis and Tracy Bowden acting alone or together with anotheras his or her true and lawfuland agent, with full power of substitution and resubstitution, for such person and in his or her name, place and stead, in any and all capacities, to sign any or all further amendments (including post-effective amendments) to this registration statement (and any additional registration statement related hereto permitted by Rule 462(b) promulgated under the Securities Act of 1933 (and all further amendments, including post-effective amendments, thereto)), and to file the same, with all exhibits thereto, and other documents in connection therewith, with the Securities and Exchange Commission, granting unto saidand agents, and each of them, full power and authority to do and perform each and every act and thing requisite and necessary to be done in and about the premises, as fully to all intents and purposes as he might or could do in person, hereby ratifying and confirming all that saidand agent, or his or her substitute or substitutes, may lawfully do or cause to be done by virtue hereof.
attorney-in-fact,
attorney-in- fact
attorneys-in-fact
attorney-in-fact
Pursuant to the requirements of the Securities Act, this registration statement has been signed by the following persons in the capacities and on August 24, 2021.
Signature | Title | |
/s/ Assaf Wand Assaf Wand | Director, Co-Founder and Chief Executive Officer(Principal Executive Officer) | |
/s/ Stewart Ellis Stewart Ellis | Chief Financial Officer (Principal Financial Officer and Principal Accounting Officer) | |
/s/ Amy Errett Amy Errett | Director | |
/s/ Eric Feder Eric Feder | Director | |
/s/ Lori Dickerson Fouché Lori Dickerson Fouché | Director | |
/s/ Hugh R. Frater Hugh R. Frater | Director | |
/s/ Noah Knauf Noah Knauf | Director | |
/s/ Sam Landman Sam Landman | Director | |
/s/ Sandra Wijnberg Sandra Wijnberg | Director | |