
Letter to Shareholders Q4 2021
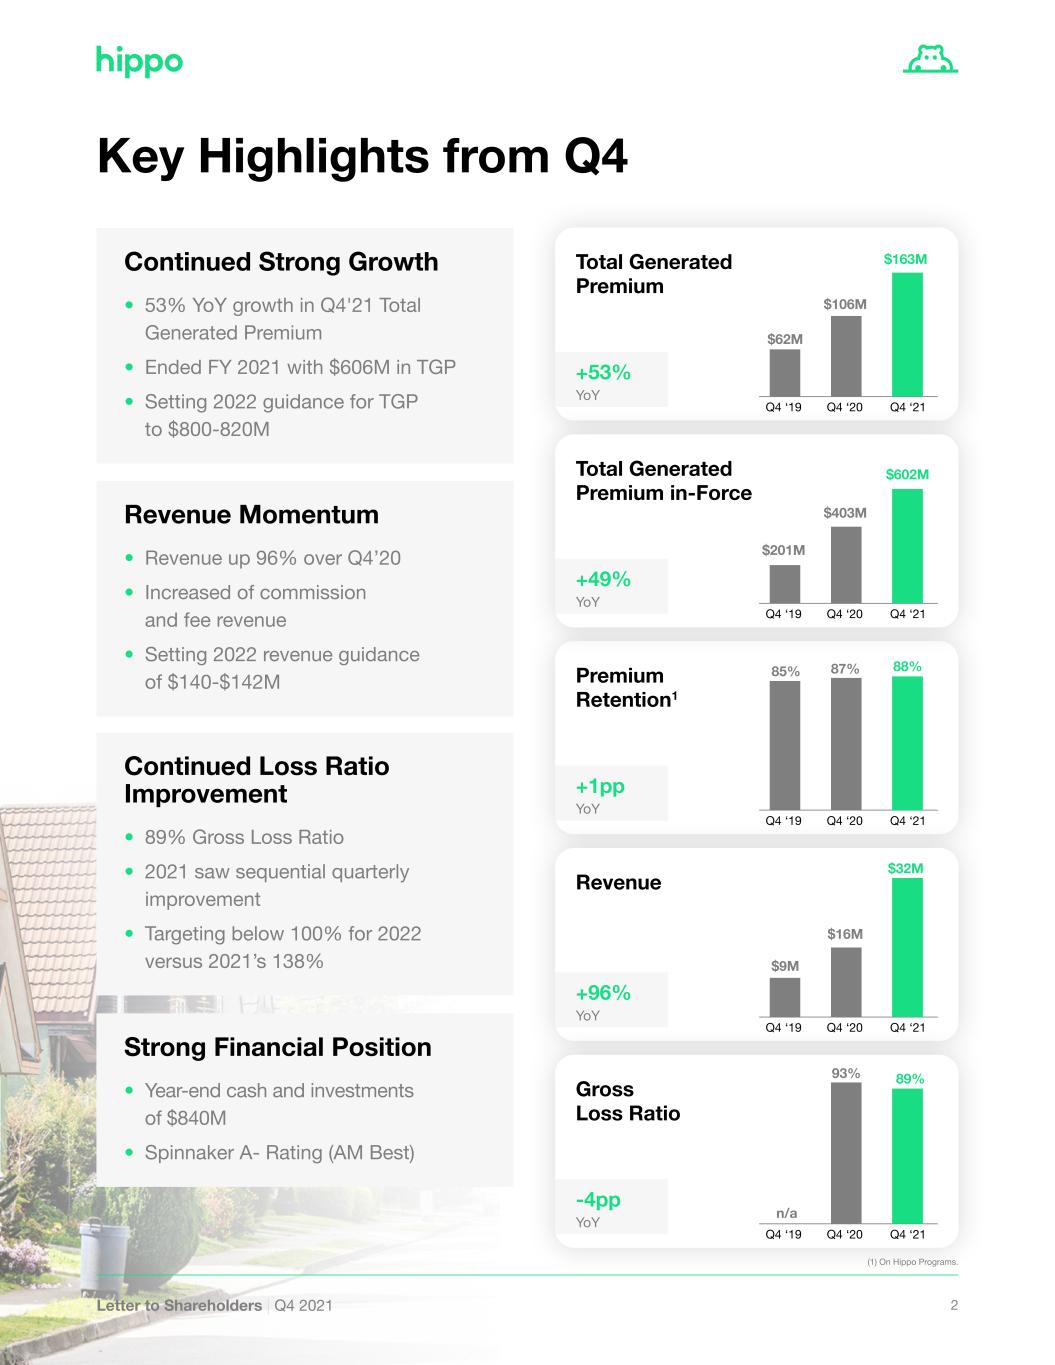
2Letter to Shareholders | Q4 2021 Key Highlights from Q4 (1) On Hippo Programs. Continued Strong Growth ‹ 53% YoY growth in Q4'21 Total Generated Premium ‹ Ended FY 2021 with $606M in TGP ‹ Setting 2022 guidance for TGP to $800-820M Revenue Momentum ‹ Revenue up 96% over Q4’20 ‹ Increased of commission and fee revenue ‹ Setting 2022 revenue guidance of $140-$142M Continued Loss Ratio Improvement ‹ 89% Gross Loss Ratio ‹ 2021 saw sequential quarterly improvement ‹ Targeting below 100% for 2022 versus 2021’s 138% Strong Financial Position ‹ Year-end cash and investments of $840M ‹ Spinnaker A- Rating (AM Best) +1pp YoY +96% YoY 0 20 40 60 80 100 88% Q4 ‘21Q4 ‘20Q4 ‘19 87%85% 0 5 10 15 20 25 30 35 $32M Q4 ‘21Q4 ‘20Q4 ‘19 $16M $9M +53% YoY 0 50 100 150 200 $163M Q4 ‘21Q4 ‘20Q4 ‘19 $106M $62M Total Generated Premium Premium Retention1 +49% YoY $602M Q4 ‘21Q4 ‘20Q4 ‘19 $403M $201M Total Generated Premium in-Force Revenue -4pp YoY 0 20 40 60 80 100 89% Q4 ‘21Q4 ‘20Q4 ‘19 93% n/a Gross Loss Ratio

3Letter to Shareholders | Q4 2021 Moving Forward Dear Shareholders, 2021 was a year of milestones for Hippo including the public listing of HIPO shares and annual Total Generated Premium crossing $600 million. Some of these successes were tempered by headwinds such as a sell-off in equity markets for many tech/growth-oriented companies, catastrophe losses in our major geographic markets and heightened loss cost pressures for home repairs. However, Hippo ended the year operationally and financially strong, in a position to patiently weather the volatility of financial markets and laser-focused on executing against our long- term vision of protecting the joy of home ownership. We believe we are transforming the home insurance industry with our proactive and holistic approach to home protection. Our growth in annual Total Generated Premium of 80%+ in 2021, supported by an 88% Hippo Homeowners premium retention rate, has validated that belief so we are broadening our reach in 2022. In coming months, we plan to extend our geographic presence from 37 states by adding major states in the northeast, as well as by expanding within our existing footprint with new products. We also will continue to grow through our key partnerships. Through major US homebuilders such as Lennar and Toll Brothers, we are sourcing some of our best customers: newly built, tech-enabled homes with owners who want to use tech- nology to improve their home ownership experience. Through our partnerships with major financial service companies, we are able to reach potential homeowners at the critical moment when home protection is at the forefront of their mind. Our Q4 Gross Loss Ratio of 89% was the best quarter of the year, in part benefit- ting from seasonality and 13 points of reserve releases from periods earlier in the year due to favorable development across all perils. By using our technology to better calibrate pricing to match premium to risk, to increase our geographic diver- sity, and to unlock new markets, we are improving our loss ratios as we mature. We view our progress in this area as particularly encouraging given the many pressures on loss costs. We also had a successful reinsurance renewal in January. Our reinsurance partners are able to closely examine our underwriting practices and we are grateful to have their continued support and confidence in our future results.

4Letter to Shareholders | Q4 2021 Technology remains a key differentiator for Hippo. First, we leverage technology to help customers rest easy in their homes through preventive maintenance and home care. Through our home inspection program, either in-person or through live video, we can inspect a customer’s home, often leading to us facilitating preventative home repair measures. We also offer discounts to customers who partner with us to use technology like leak sensors or home security to prevent losses. What customers may not see is that we’re also leveraging our technology to build a modern insurance company. Our Actuaries, Underwriters, Claim Adjusters and Insurance & Customer Support Agents, all leverage our modern tech stack to turbo-charge their productivity and scale their daily operations with consistency and reliability. Recognizing the all-encompassing role of technology at Hippo, we are elevating one of our long-serving Hippos, Ran Harpaz, to the newly created position of Chief Operating Officer. Ran will maintain his current responsibilities as Chief Technology Officer and will now also oversee our end-to-end customer experience, from Product Inception, all the way through Customer Support. Another major accomplishment of the year was that despite a difficult hiring envi- ronment, we expanded the Hippo team to 621, attracting top talent across a range of expertise. Starting her first day in 2022, we’re particularly excited to welcome Grace Hanson, formerly with Hiscox, to our Hippo pod to become our first Chief Claims Officer. While we prefer to prevent losses, when unfortunate events do happen, we prioritize supporting our customers and Grace will be working to enhance our capabilities. While we are unsatisfied with the share price performance since our August 2021 listing, we have more confidence than ever in Hippo’s long-term prospects and ability to modernize home insurance and protect the joy of home ownership. Thank you, Assaf Wand Founder & CEO
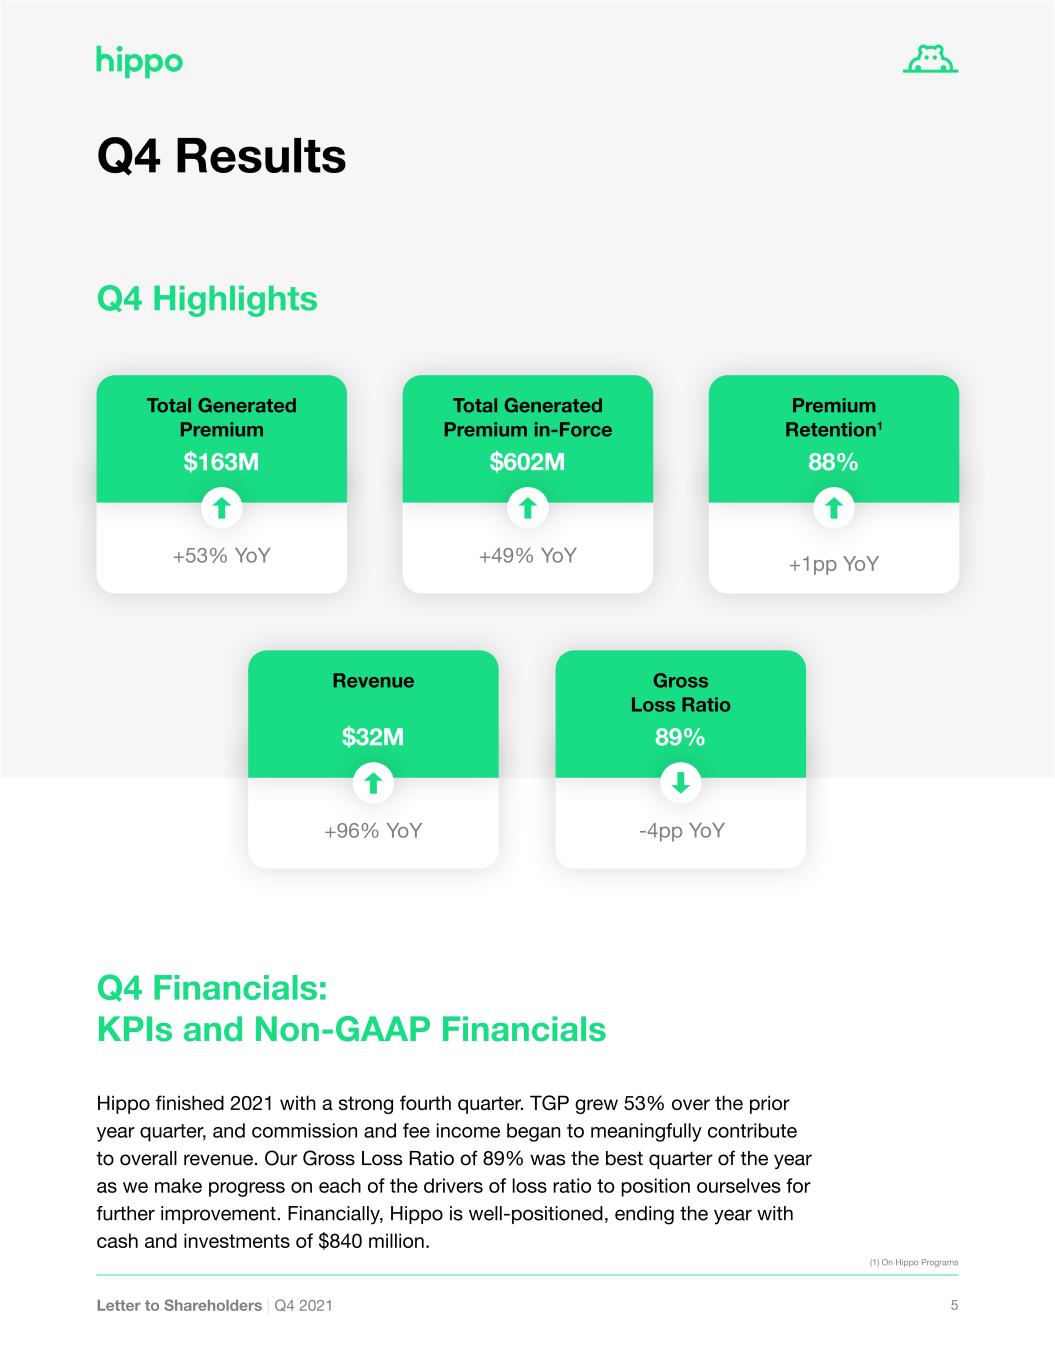
5Letter to Shareholders | Q4 2021 Q4 Results Q4 Highlights Gross Loss Ratio -4pp YoY 89% Revenue +96% YoY $32M Premium Retention1 88% Total Generated Premium in-Force +49% YoY $602M Total Generated Premium +53% YoY $163M Q4 Financials: KPIs and Non-GAAP Financials Hippo finished 2021 with a strong fourth quarter. TGP grew 53% over the prior year quarter, and commission and fee income began to meaningfully contribute to overall revenue. Our Gross Loss Ratio of 89% was the best quarter of the year as we make progress on each of the drivers of loss ratio to position ourselves for further improvement. Financially, Hippo is well-positioned, ending the year with cash and investments of $840 million. +1pp YoY (1) On Hippo Programs

6Letter to Shareholders | Q4 2021 Total Generated Premium up 53% TGP was $163 million in Q4 and $606 million for the full year. Our premium reten- tion rate of 88% remains high, an indicator that our customers are pleased with our service and product. Growth was spread across our distribution channels. We’re happy for our customers to purchase Hippo policies however they like-whether directly from Hippo, through independent agents or by way of one of our partnerships with homebuilders or finan- cial institutions. We also grew in each of our 37 states, including Texas and California, where we have repositioned our regional mix within these large states. We expect to launch additional major states in 2022. For full year 2022, we are targeting TGP in the range of $800-$820 million. Revenue up 96% Revenue of $32M in Q4 was up 96% year over year. Our revenue includes premiums earned on business we retain, growing streams of ceding, MGA, and agency commissions paid to us by reinsurers or other carriers in exchange for sourcing customers and/or risk that they retain on their balance sheets, as well as service and fee income from our customers. Finally, through Spinnaker and its affiliates, our wholly owned A.M. Best A- rated group of insurance companies, we continue to expand our business with third party program administrators, earning fronting fee income through our insurance-as-a-service model. Over time, we expect an increased share of our earn- ings will be derived from a stable and recurring stream of fee and commission-based income. In 2022, we expect our revenue growth rate will exceed our TGP growth rate and that we will generate revenue in the range of $140-$142 million. Gross Loss Ratio of 89% We continue to make progress improving our Gross Loss Ratio. Q4’s 89% was the best quarter of 2021. Given historical patterns of seasonally and catastrophic weather events, we don’t expect sequential improvements in each quarter of 2022, but we do expect meaningful year over year improvement. We’re making great strides on each of our initiatives to reach our intermediate goal of industry level loss ratios while growing strongly. During the fourth quarter, PCS catastrophic losses accounted for 25 percentage points of our Gross Loss Ratio, the largest of which was the Marshall Fire in Colorado on December 30th, and non-PCS large loss events accounted for an additional 11 percentage points. Our Gross Loss Ratio also benefitted by 13 percentage points from releases of reserves from prior periods in 2021 due to favorable development across Over time, we expect an increased share of our earnings will be derived from a stable and recurring stream of fee-based income.

7Letter to Shareholders | Q4 2021 all perils. As our book of business matures and achieves more balance and geographic diversification, we expect volatility from catastrophic and large loss events to decline. We believe 2021 was a preview of the long-term environment for the homeowners insurance industry. Increased volatility, unpredictable climate activity, inflationary home repair costs, and supply chain disruptions will require providers to have a level of responsiveness not previously seen in the industry. We have been developing a tech- nology platform well-positioned for such challenges. In December, we began rolling out the latest iteration of our underwriting engine. With increased data and granularity in our models, we’re better matching price to risk for our customers, and while some existing customers will see price increases, others will see reductions. We’re also constantly updating and re-underwriting each individual risk in our portfolio. When a policy comes up for renewal, we don’t simply mechani- cally add on an inflation adjustment, we re-underwrite the policy, updating it for all the new data we’ve accumulated since the last renewal to ensure that our customers are properly protected. Our efforts to geographically diversify continue to yield results with 63% of new busi- ness coming from outside of our two largest states and even within those two large states, we have grown by adding regional diversity. We’ve also begun rolling out the underwriting platforms of Ally and Incline as part of our multi-carrier strategy giving us additional avenues to file and set rates for targeted markets. Our fastest growing distri- bution partnerships with homebuilders also are our most profitable, having a positive impact on company wide profitability. Reinsurance Renewals Despite a hardening reinsurance market, we successfully renewed and placed our primary homeowners reinsurance program for 2022. We expanded our quota-share panel from 9 to 11 reinsurers, all of whom are either rated A- Excellent or better by AM Best or appropriately collateralized. As a reminder, we also have multi-year reinsurance for approximately one third of our capacity from a separate reinsurance treaty we signed at the end of 2020, and 2022 will be the second of its three-year term. We expect to retain approximately 10% of the homeowners premium that our MGA underwrites on the balance sheets of our insurance company subsidiaries or our captive reinsurance company. As in 2021, our 2022 proportional reinsurance treaty also includes loss participation features which may increase the amount of risk retained by the company in excess of our pro rata participation of 10%.

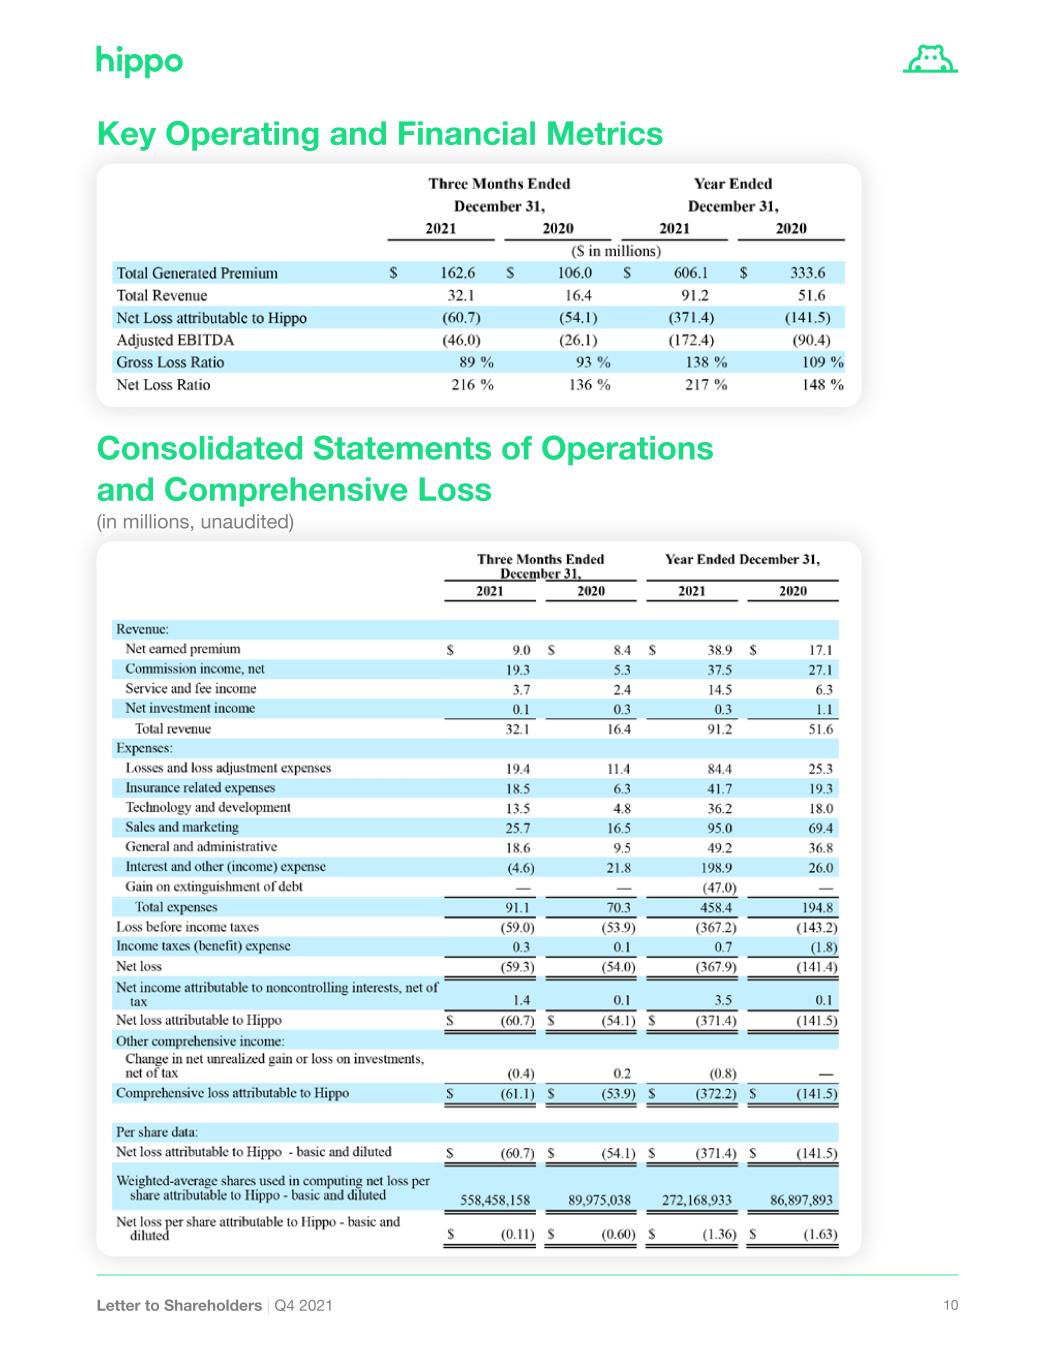
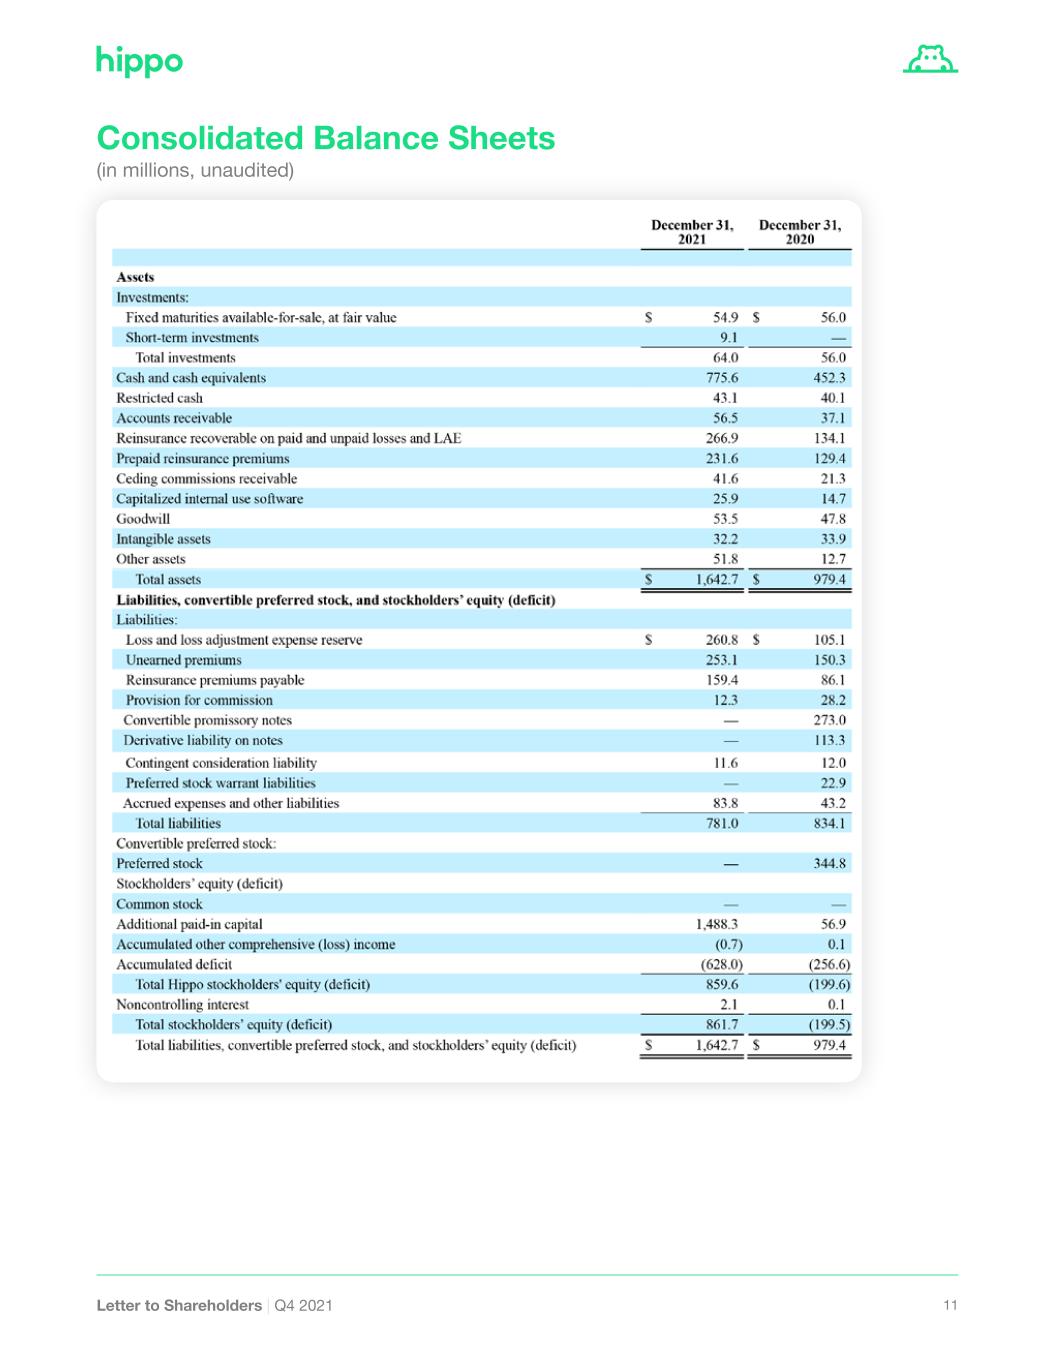
8Letter to Shareholders | Q4 2021 We reduce our risk retention through purchases of non-proportional reinsurance like excess-of-loss coverage. This program provides protection from catastrophes that could impact a large number of our customers in a single event. We buy XOL coverage to a 1:250 year return period. Or said another way, the probability that losses from a single occurrence exceeds the purchased protection is 0.4% or less, protecting us from all but the most severe catastrophic events. Sales and Marketing Sales and Marketing expenses increased to $25.7 million versus $16.5 million in the prior year quarter. As we continue to see progress in our key KPIs, we have increased confidence in raising the profile of our brand with potential customers nationwide. Investment in Technological Differentiation Technology and Development expenses were $13.5 million versus $4.8 million in the prior year quarter. Technology is the backbone of Hippo and we continue to relent- lessly invest to better improve our customer offering, our API-oriented ecosystem, and the efficiency of our platform. Nearly a quarter of our employees are on the Tech team, with talent depth that any Silicon Valley company would be proud to have. General and Administrative Expenses General and Administrative expenses were $18.6 million in Q4 versus $9.5 million in the prior year quarter reflecting the increased costs of operating as a public company and increases in stock-based compensation. Balance Sheet and Cash Position Our cash and investments at the end of the quarter stood at $839.6 million, positioning us well for an extended period of growth and investment. Net Loss and Adjusted EBITDA Net Loss attributable to Hippo was $60.7 million or $0.11 per share in Q4 compared to a Net Loss of $54.1 million or $0.60 per share in the prior year quarter. Adjusted EBITDA was a loss of $46.0 million vs a loss of $26.1 million in the year ago quarter. 2022 Guidance We remain confident in our outlook as we diversify and develop our business. To summarize our guidance for the year, we expect overall TGP in the range of $800 to $820 million, revenue to reach $140-$142 million and barring major catastrophes, a full year 2022 Gross Loss Ratio under 100%, down from 138% for 2021, and on track for further material improvements.

Appendix
10Letter to Shareholders | Q4 2021 Key Operating and Financial Metrics Consolidated Statements of Operations and Comprehensive Loss (in millions, unaudited)
11Letter to Shareholders | Q4 2021 Consolidated Balance Sheets (in millions, unaudited)

12Letter to Shareholders | Q4 2021 Consolidated Statements of Cash Flows (in millions, unaudited)
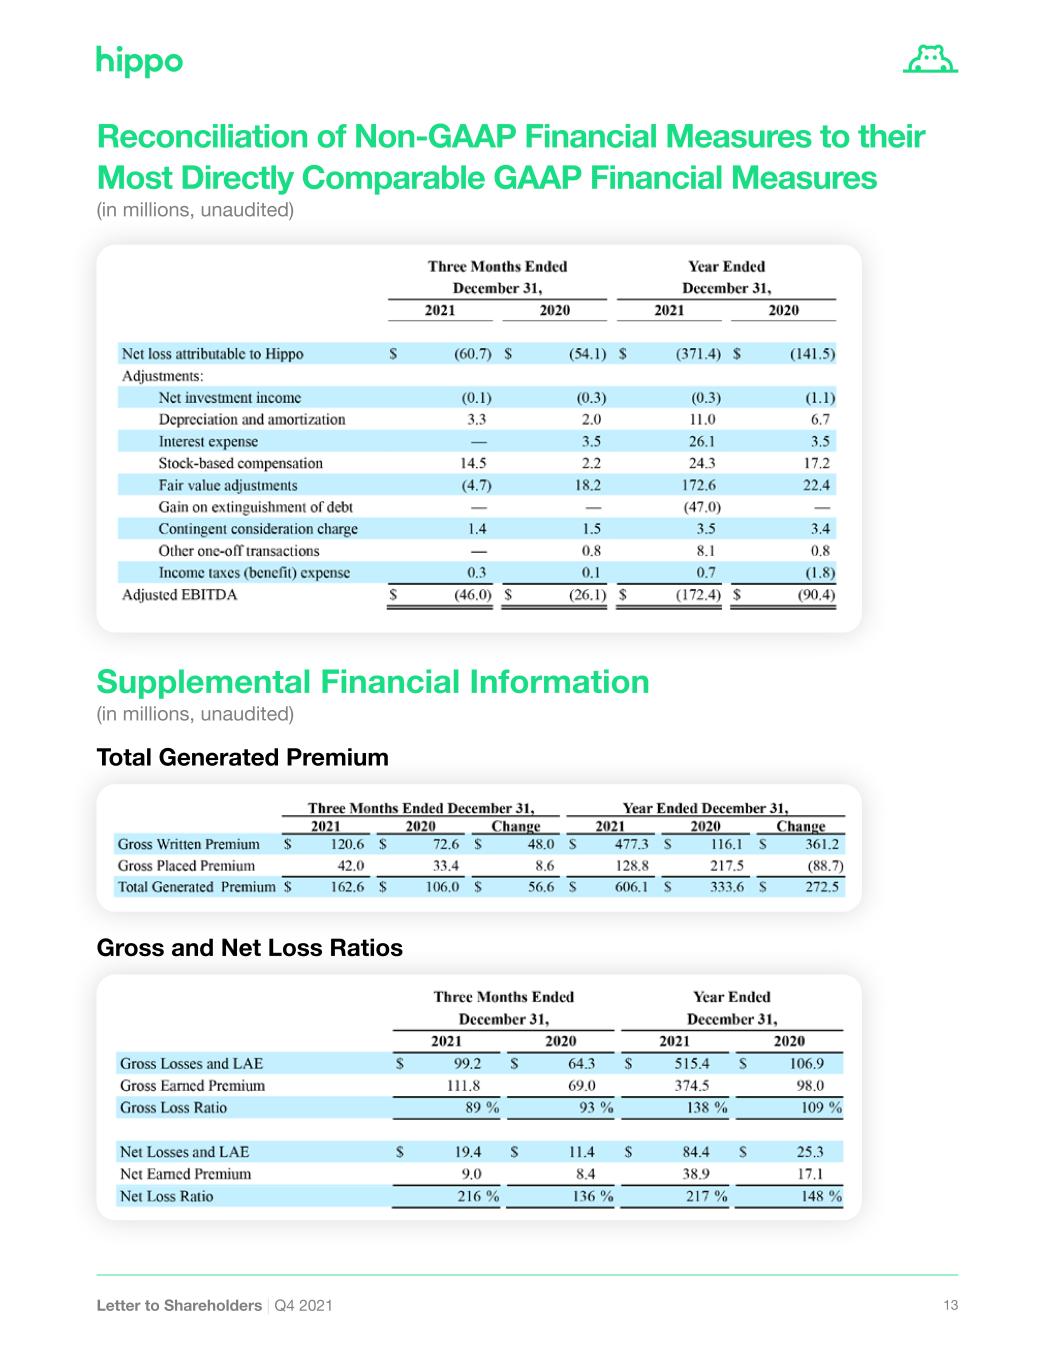
13Letter to Shareholders | Q4 2021 Reconciliation of Non-GAAP Financial Measures to their Most Directly Comparable GAAP Financial Measures (in millions, unaudited) Supplemental Financial Information (in millions, unaudited) Total Generated Premium Gross and Net Loss Ratios

14Letter to Shareholders | Q4 2021 Gross Loss Ratio Breakdown Insurance Related Expenses Breakdown (1) Refers to Losses from named Property Claims Services events. (2) Defined as the excess portion of non-weather losses in excess of $100k Loss and Allocated Loss Adjustment Expense per claim. (1) included in Employee-related costs for the three months ended December 31, 2021 and 2020, are $2.2 million and $0.3 million related to our underwriting department, respectively. Included in Employee-related costs for the year ended December 31, 2021 and 2020, are $4.2 million and $0.8 million related to our underwriting department, respectively. (2) included in Other for the three months ended December 31, 2021 and 2020, are $1.5 million and $0.6 million related to overhead allocations, consultants, product filings, agent appointment fees, and other operating expenses, respectively. Included in Other for the year ended December 31, 2021 and 2020, are $5.3 million and $1.4 million related to overhead allocations, consultants, product filings, agent appointment fees, and other operating expenses, respectively. Direct acquisition costs were $36.9 million for the year ended December 31, 2021, of which $23.0 million were offset by ceding commission income. Direct acquisition costs were $4.6 million for the year ended December 31, 2020, of which $0.9 million was offset by ceding commission income. Direct acquisition costs were $13.9 million for the three months ended December 31, 2021, of which $4.9 million were offset by ceding commission income. Direct acquisi- tion costs were $2.9 million for the three months ended December 31, 2020, of which $0.8 million was offset by ceding commission income.
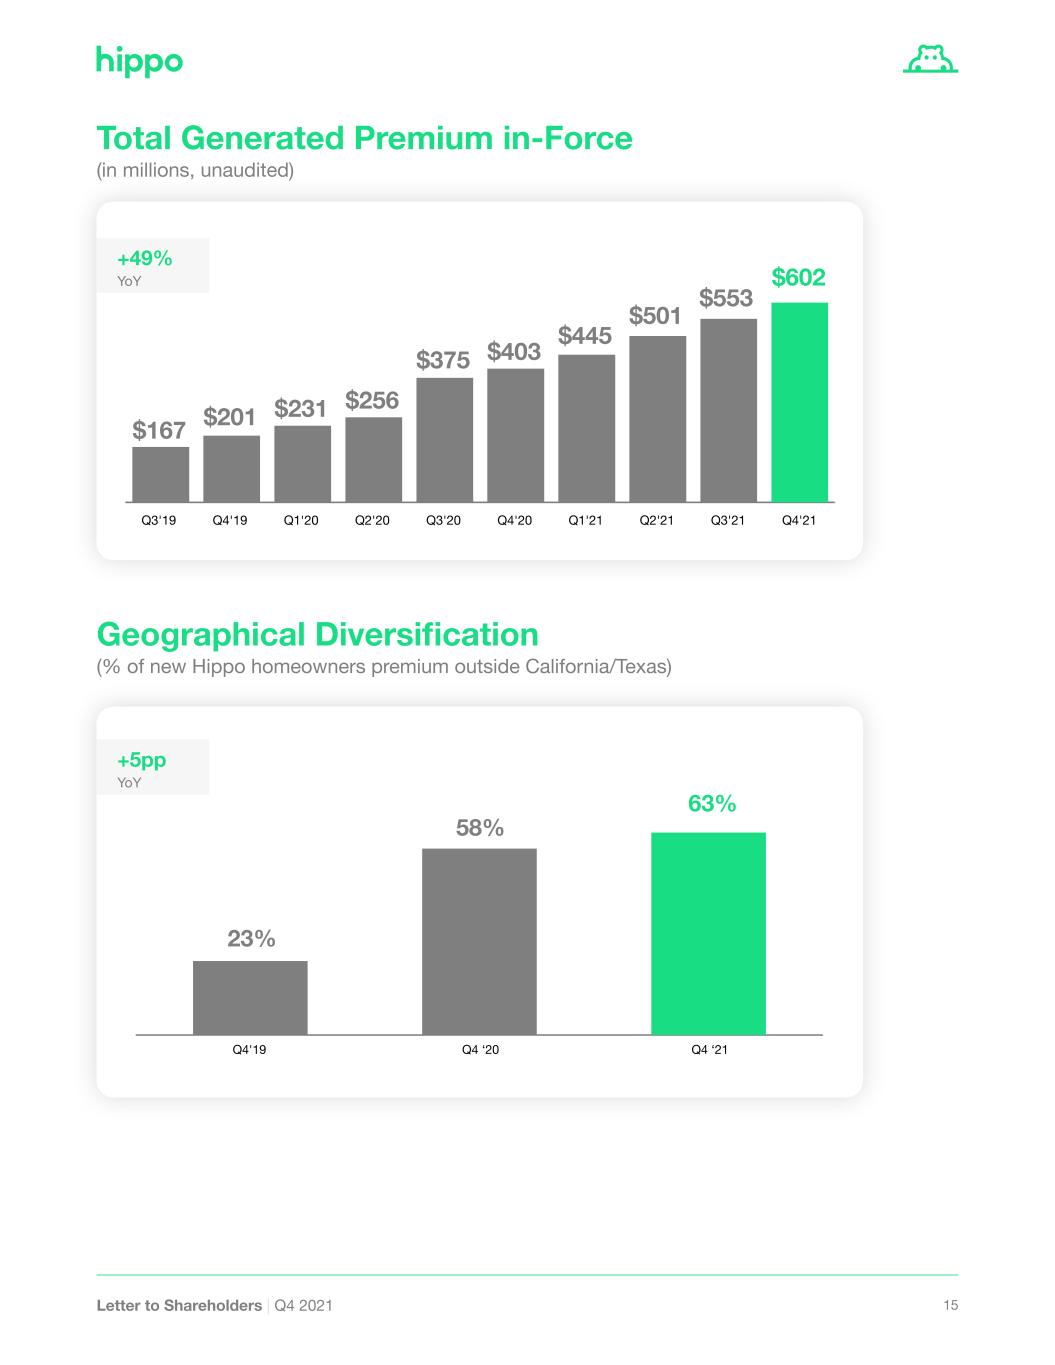
15Letter to Shareholders | Q4 2021 0 10 20 30 40 50 60 70 80 63% Q4 ‘20 Q4 ‘21Q4'19 58% 23% Geographical Diversification (% of new Hippo homeowners premium outside California/Texas) +5pp YoY 0 100 $256 $375 $403 $445 $501 $602 $553 Q4'19 Q1'20 Q2'20Q3'19 Q4'20 Q1'21 Q2'21 Q4'21Q3'21Q3'20 $231$201$167 Total Generated Premium in-Force (in millions, unaudited) +49% YoY
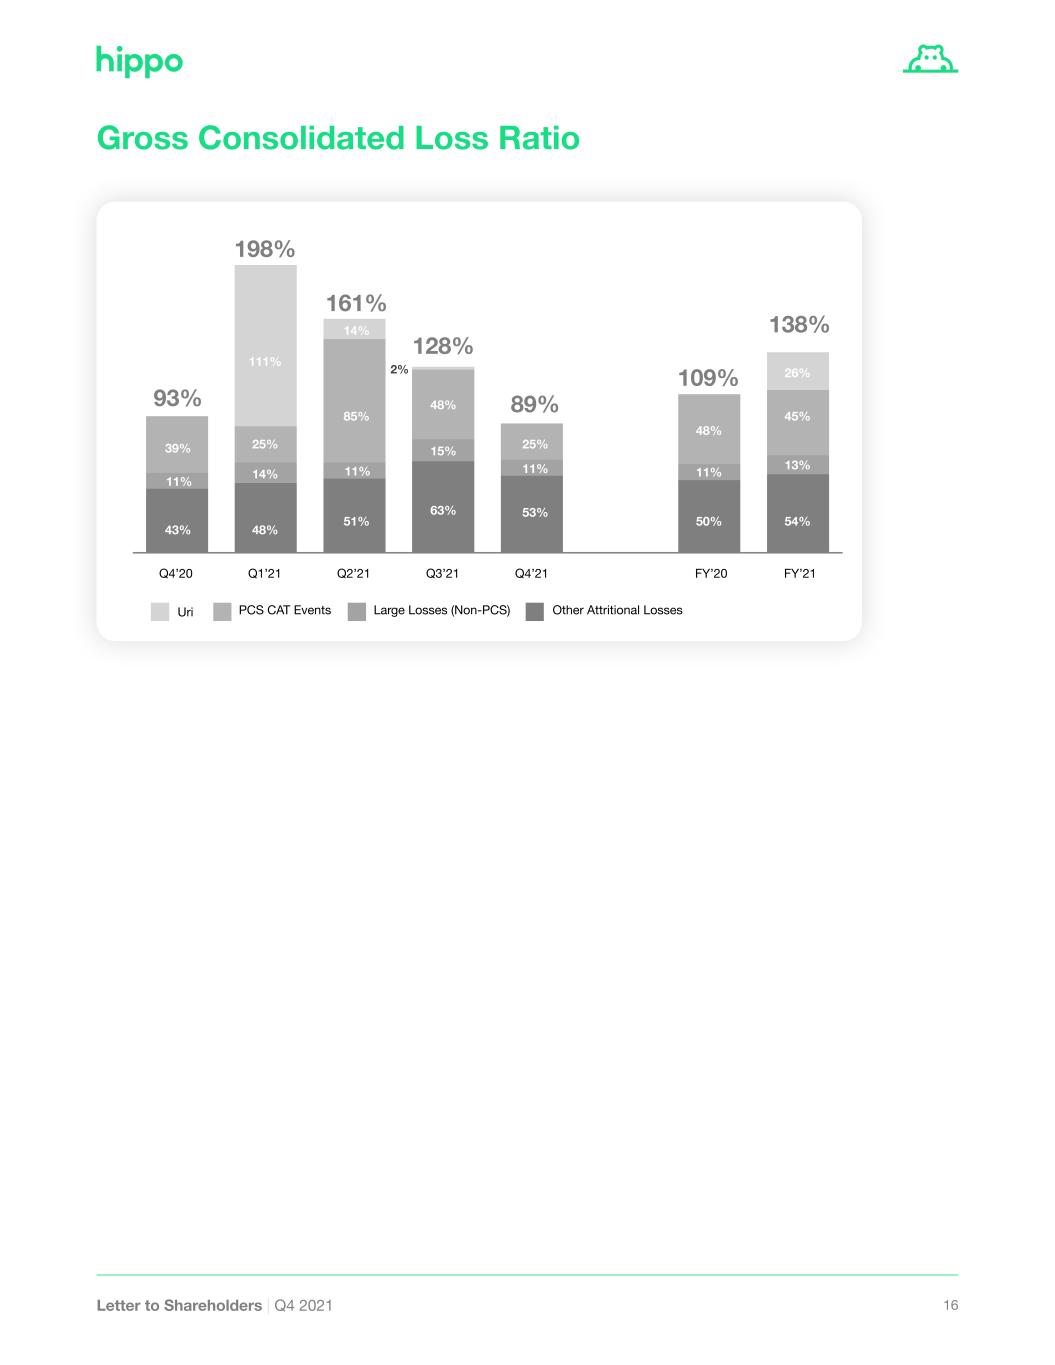
16Letter to Shareholders | Q4 2021 Gross Consolidated Loss Ratio Q1’21 Q2’21Q4’20 Uri PCS CAT Events Large Losses (Non-PCS) Other Attritional Losses Q4’21Q3’21 FY’21FY’20 93% 198% 161% 128% 109% 138% 39% 48% 2% 25% 111% 25% 85% 14% 11% 11% 11%14% 15% 43% 48% 51% 45% 26% 13% 54% 48% 11% 50% 63% 53% 89%


