
Analyst Supplement: Guidance 2023 March 2, 2023
Executive summary • In 2023, we will begin segment reporting which will align with how we have begun to operate Hippo this year. We believe the additional level of detail will also help investors better understand Hippo’s business • Hippo’s Services businesses are fee-driven, not exposed to loss ratio volatility, and fast growing. Investments in sales and marketing to fuel growth currently offset profit margins, but we view the attractive economics and high LTV as worthy of aggressive investment. We believe that over time, much of our differentiated consumer experience will be driven by offerings within this business line • Hippo’s Insurance as a Service business generates recurring revenue streams that have limited exposure to loss ratio. This business is stable, growing and already expected to report positive adjusted EBITDA in 2023, while adding financial benefits of diversification to our overall reinsurance program • The Hippo Home Insurance Program currently drives the bulk of our negative adjusted EBITDA but is positioned to turn positive over the next 18-24 months as the loss ratio continues to improve, driven primarily by actions that have already been undertaken • We expect Hippo to turn adjusted EBITDA positive by the end of 2024 with cash of at least $400 million at year end 2024

Hippo is a proactive partner for homeowners who seek to better maintain and protect their homes
2023 Guidance Principles and Business Unit Reporting • Align external reporting with how we are managing the business starting in Q1’23 • Improve public understanding of the components of Hippo’s business • Allow the investment community to more easily model the relationship between the drivers of our business and our future financial results • More easily monitor and report on our progress toward our strategic and financial vision

Components of Hippo’s Business First Connect Home Care Platform to support small and medium-sized independent insurance agents Proactive, tech-enabled services to help homeowners better maintain and protect their homes Hippo Home Insurance Program Insurance as a Service Consumer Agency Modern Home Insurance Platform to support other MGAs Sell both Hippo and 3rd party carrier policies, directly and through partners (like builders)
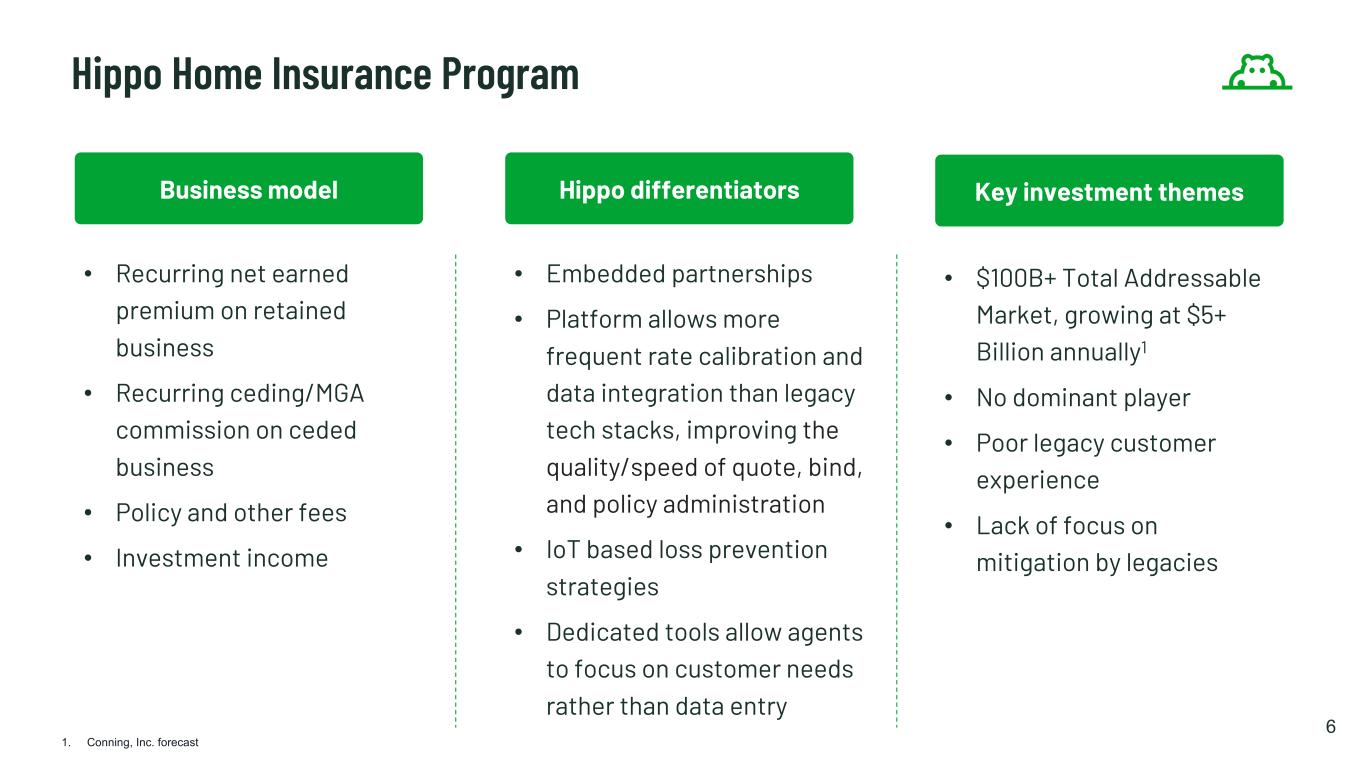
6 • Recurring net earned premium on retained business • Recurring ceding/MGA commission on ceded business • Policy and other fees • Investment income • $100B+ Total Addressable Market, growing at $5+ Billion annually1 • No dominant player • Poor legacy customer experience • Lack of focus on mitigation by legacies Business model Key investment themesHippo differentiators • Embedded partnerships • Platform allows more frequent rate calibration and data integration than legacy tech stacks, improving the quality/speed of quote, bind, and policy administration • IoT based loss prevention strategies • Dedicated tools allow agents to focus on customer needs rather than data entry Hippo Home Insurance Program 1. Conning, Inc. forecast
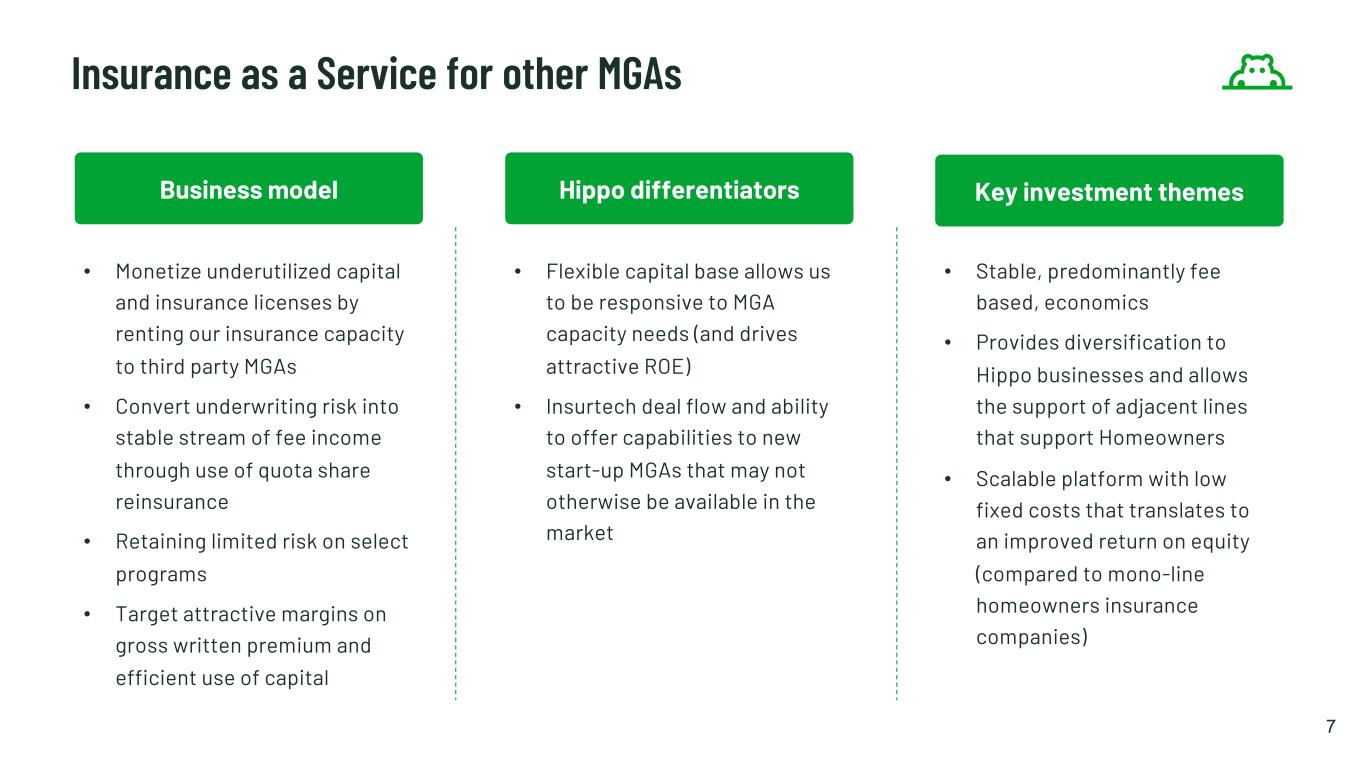
7 • Stable, predominantly fee based, economics • Provides diversification to Hippo businesses and allows the support of adjacent lines that support Homeowners • Scalable platform with low fixed costs that translates to an improved return on equity (compared to mono-line homeowners insurance companies) • Flexible capital base allows us to be responsive to MGA capacity needs (and drives attractive ROE) • Insurtech deal flow and ability to offer capabilities to new start-up MGAs that may not otherwise be available in the market Business model • Monetize underutilized capital and insurance licenses by renting our insurance capacity to third party MGAs • Convert underwriting risk into stable stream of fee income through use of quota share reinsurance • Retaining limited risk on select programs • Target attractive margins on gross written premium and efficient use of capital Key investment themesHippo differentiators Insurance as a Service for other MGAs

8 • Earn recurring agency commission on active policies • Cross-sell to increase policies sold per customer • Cross-carrier transitions to improve renewal rate • Predictable, fee-based revenue, not dependent on loss ratio or reinsurance dynamics • Low variable cost for renewal revenue • Differentiated consumer experience built around proactive home care services • Next-generation tools to increase agent productivity and efficiency Business model Key investment themesHippo differentiators Consumer Agency
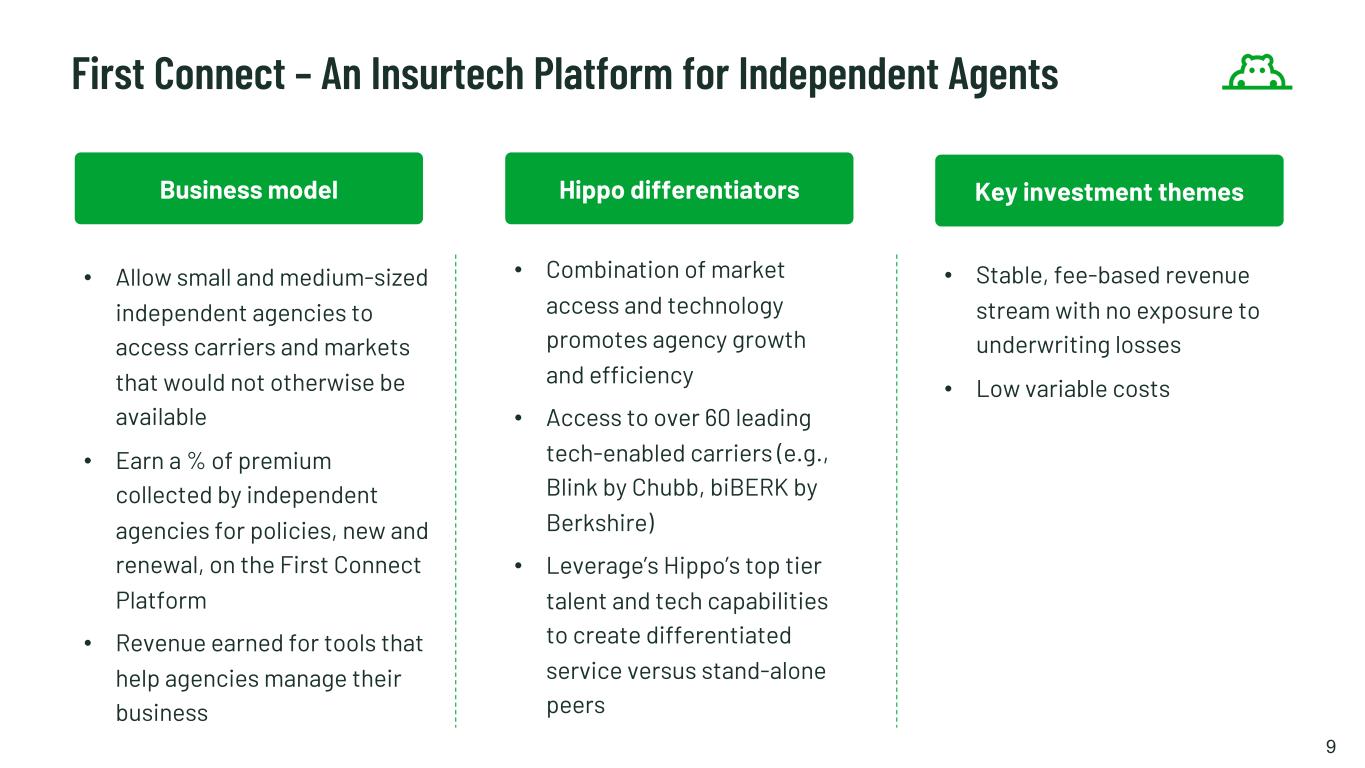
9 • Allow small and medium-sized independent agencies to access carriers and markets that would not otherwise be available • Earn a % of premium collected by independent agencies for policies, new and renewal, on the First Connect Platform • Revenue earned for tools that help agencies manage their business • Stable, fee-based revenue stream with no exposure to underwriting losses • Low variable costs • Combination of market access and technology promotes agency growth and efficiency • Access to over 60 leading tech-enabled carriers (e.g., Blink by Chubb, biBERK by Berkshire) • Leverage’s Hippo’s top tier talent and tech capabilities to create differentiated service versus stand-alone peers Business model Key investment themesHippo differentiators First Connect – An Insurtech Platform for Independent Agents
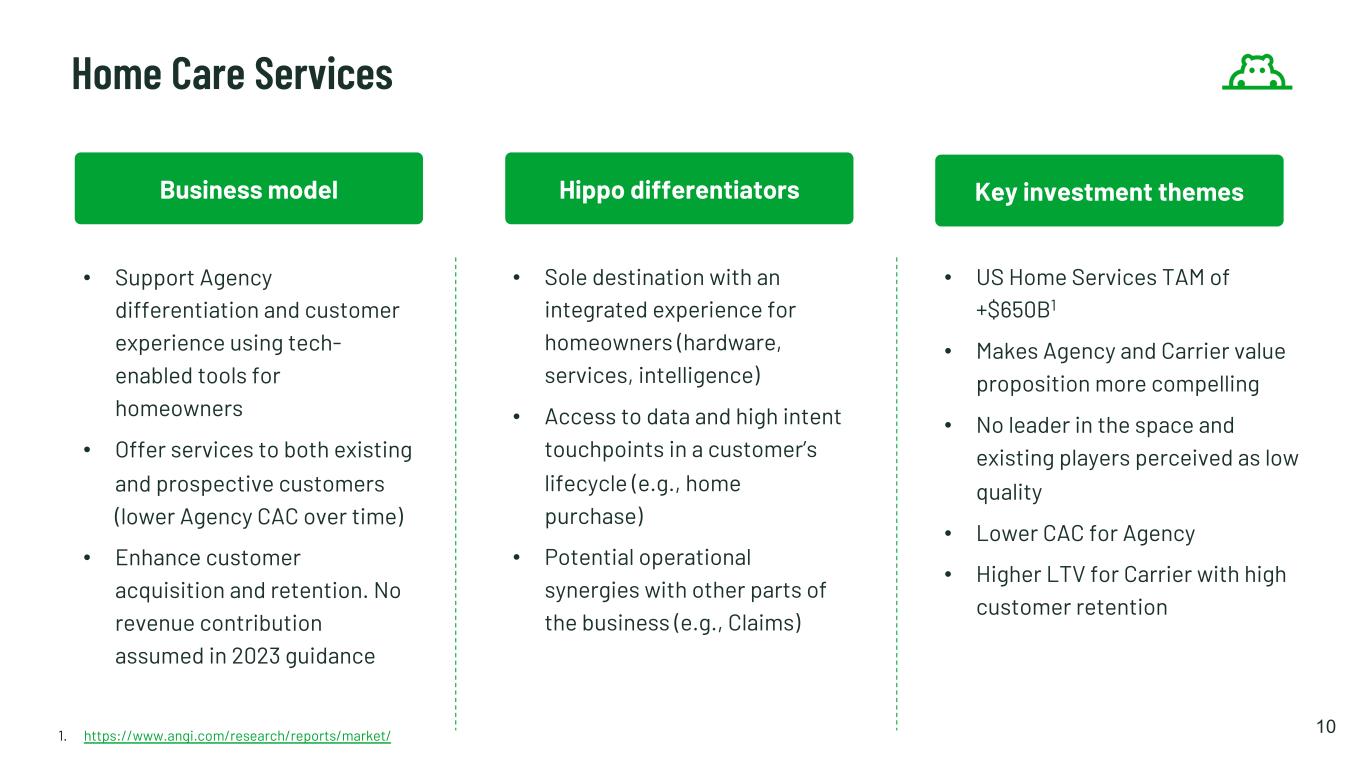
10 • Support Agency differentiation and customer experience using tech- enabled tools for homeowners • Offer services to both existing and prospective customers (lower Agency CAC over time) • Enhance customer acquisition and retention. No revenue contribution assumed in 2023 guidance • US Home Services TAM of +$650B1 • Makes Agency and Carrier value proposition more compelling • No leader in the space and existing players perceived as low quality • Lower CAC for Agency • Higher LTV for Carrier with high customer retention • Sole destination with an integrated experience for homeowners (hardware, services, intelligence) • Access to data and high intent touchpoints in a customer’s lifecycle (e.g., home purchase) • Potential operational synergies with other parts of the business (e.g., Claims) 1. https://www.angi.com/research/reports/market/ Business model Key investment themesHippo differentiators Home Care Services

11 Business Models and Reporting Underlying Economics Businesses within Hippo Reportable Businesses Primarily based on underwriting results Recurring, fee-based revenue with no underwriting exposure Agency Services Insurance as a Service First Connect Home Care Insurance as a Service Hippo Home Insurance Program Hippo Home Insurance Program Primarily fee-based revenue with limited underwriting exposure 2023F TGP (before eliminations1) 2023F Revenue (before eliminations2) $459m $44m $364m $50m $380m $100m ($ in millions) 1. Agency and First Connect (in Services) sell Hippo Home Insurance Program Policies directly and through Partners, so a portion of HHIP TGP appears in both 2. Services revenue includes commissions paid from Hippo Home Insurance Program for policies sold by the Agency and First Connect

12 Total Generated Premium 2021 2022 2023 31 36 44 2022 20232021 351 459 288 Accelerating Growth in 2023 • Streamlining customer flow, optimizing right product and service for each customer • Adding new builder partners • Increasing focus on cross-selling 3rd party policies • Growing number of agents and existing agent productivity on First Connect Platform • Revenue growing slower than TGP because First Connect (lower monetization rate) is growing faster than the Agency 1. Prior to consolidation eliminations 2. Presented as if organized in business units from 1/1/21 +22% +31%YoY Revenue2 +16% +22%YoY Agency First Connect Services Top Line Guidance1 $ in millions Agency First Connect
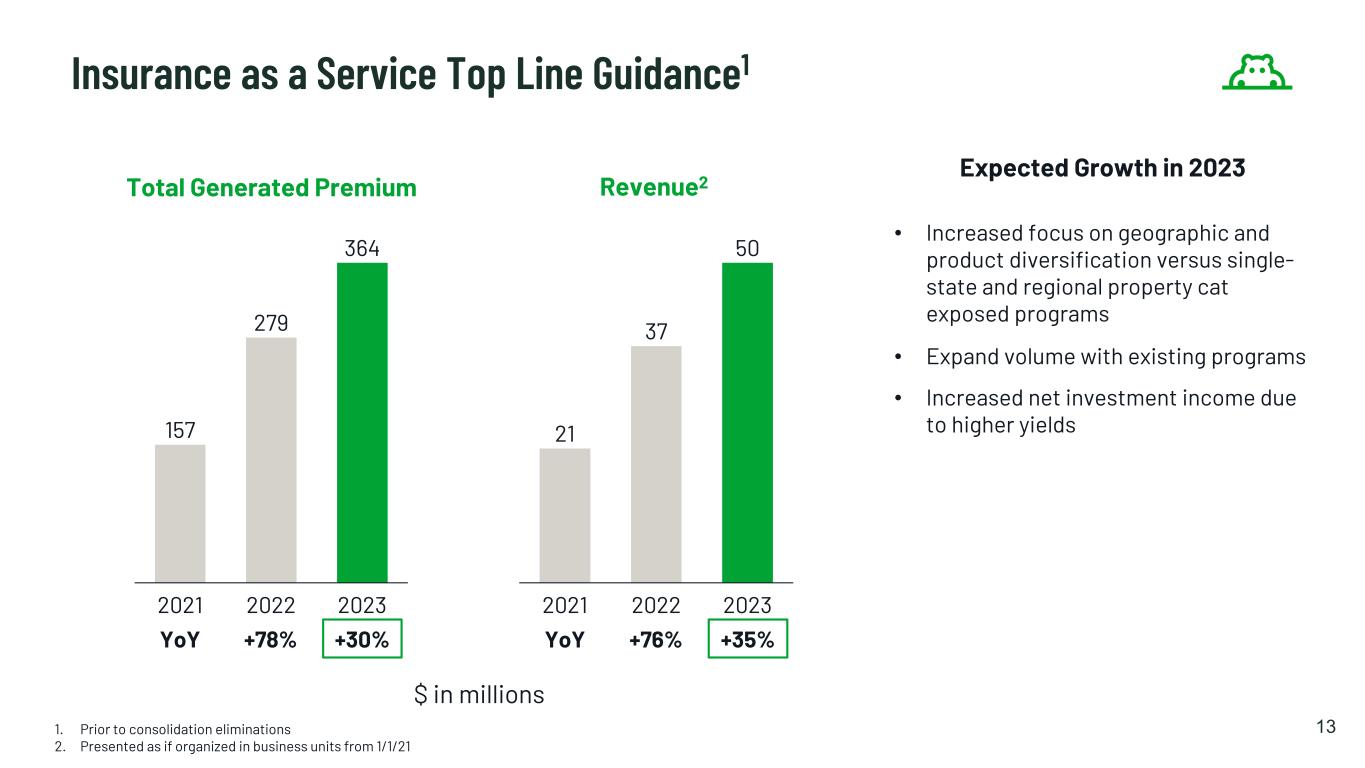
13 21 37 50 20232021 2022 157 279 364 2021 2022 2023 Insurance as a Service Top Line Guidance1 Expected Growth in 2023 • Increased focus on geographic and product diversification versus single- state and regional property cat exposed programs • Expand volume with existing programs • Increased net investment income due to higher yields $ in millions +78% +30%YoY +76% +35%YoY 1. Prior to consolidation eliminations 2. Presented as if organized in business units from 1/1/21 Total Generated Premium Revenue2

14 57 65 100 2021 2022 2023 331 367 380 20232021 2022 Hippo Home Insurance Program Top Line Guidance1 Expected Growth in 2023 • Focus on Generation Better customers (~75% of new business in Q422) • Expand Builder Channel • Continue geographic diversification • Continue rate action offsetting proactive pruning of policies where we are overly concentrated in high-CAT areas (continuation of 2022 efforts) • Revenue growth driven by earned premium increase as policies renew onto 2023 reinsurance treaty • Higher net investment income $ in millions +11% +4%YoY +14% +54%YoY 1. Prior to consolidation eliminations 2. Presented as if organized in business units from 1/1/21 Total Generated Premium Revenue2

15 1. Includes Allocated and Unallocated Loss Adjusted Expense 2021 2022 138% 76% 2021 2022 113% 93% -20PP Reported Consolidated Gross Loss Ratio (CY)1 Consolidated Gross Loss Ratio (CY) $91m of 2021 reserves released in 2022 Consolidated Gross Loss Ratio Improved 20pp YoY after excluding impact of reserves released in 2022
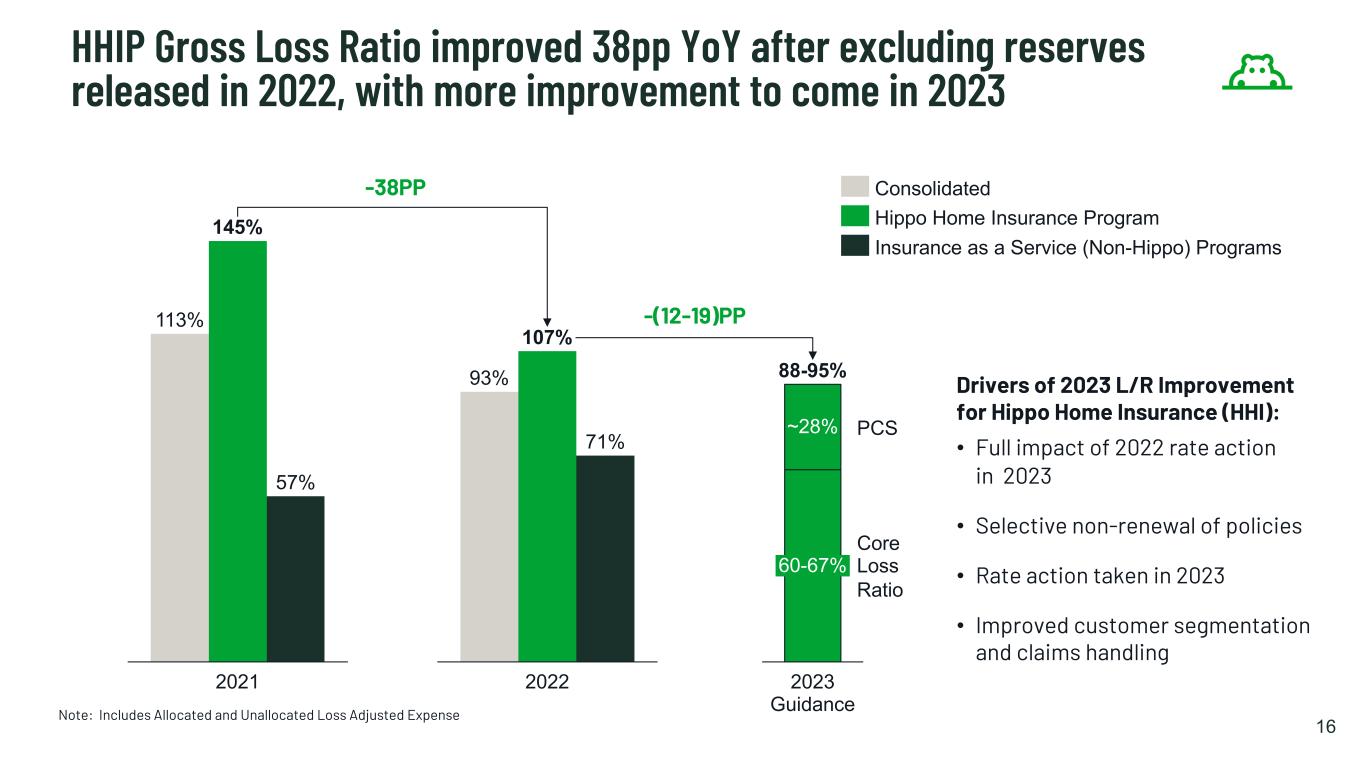
16 Note: Includes Allocated and Unallocated Loss Adjusted Expense Drivers of 2023 L/R Improvement for Hippo Home Insurance (HHI): • Full impact of 2022 rate action in 2023 • Selective non-renewal of policies • Rate action taken in 2023 • Improved customer segmentation and claims handling ~28% 60-67% 2023 Guidance PCS Core Loss Ratio 88-95% -38PP 2022 93% 107% 71% HHIP Gross Loss Ratio improved 38pp YoY after excluding reserves released in 2022, with more improvement to come in 2023 2021 113% 145% 57% -(12-19)PP Consolidated Hippo Home Insurance Program Insurance as a Service (Non-Hippo) Programs
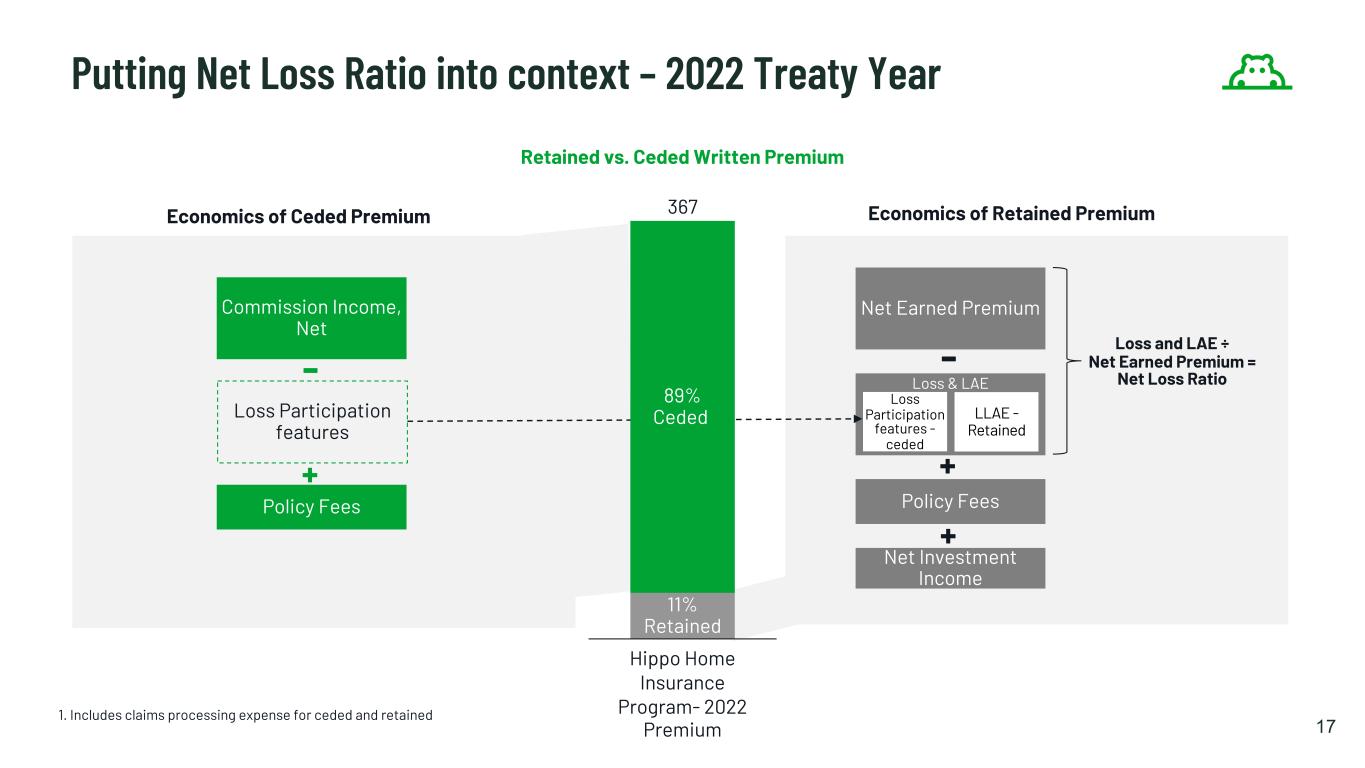
Loss & LAE 17 1. Includes claims processing expense for ceded and retained Putting Net Loss Ratio into context – 2022 Treaty Year 89% Ceded 11% Retained Hippo Home Insurance Program- 2022 Premium 367 Retained vs. Ceded Written Premium Economics of Ceded Premium Commission Income, Net Loss Participation features Policy Fees Loss and LAE ÷ Net Earned Premium = Net Loss Ratio Net Earned Premium Economics of Retained Premium Policy Fees Net Investment Income + - + LLAE - Retained Loss Participation features - ceded - +

18 2023 Renewal highlights • Structural shift to retain more of the day-to-day risks our customers face (and where we believe our loss prevention strategies can make a difference) while increasing use of Cat XoL to protect against severe weather exposure – Utilize quota share to manage capital requirements, and XoL to manage weather risk • 2023 Net Loss Ratio will show the changing economics of the 2023 reinsurance treaty – Q1'23 will be similar to 2022 (> 200%) but by Q4'23, it will be closer to the Gross Loss Ratio (< 100%) • We are protected up to a 1 in 250 year level of severity (0.4% probability) • No changes to required capital vs 2022 2023 TY 12% 2022 TY 39% 42% 30% % Retained Premium % Retained Loss + Loss participation TY=Treaty Year 2023 Hippo Homeowners Insurance Program Reinsurance Placement Quota Share Retention

19 Elimination Mechanics: 1. Remove duplicate Total Generated Premium: Agency and First Connect (in Services) sell Hippo Home Insurance Program Policies directly and through Partners, so a portion of HHIP TGP appears in both 2. Revenue: Services revenue includes commissions paid from Hippo Home Insurance Program for policies sold by the Agency and First Connect (revenue and cost in respective business units eliminated as part of consolidation) 2023 Guidance 1 2
20 Path to Profitability Business-level Detail
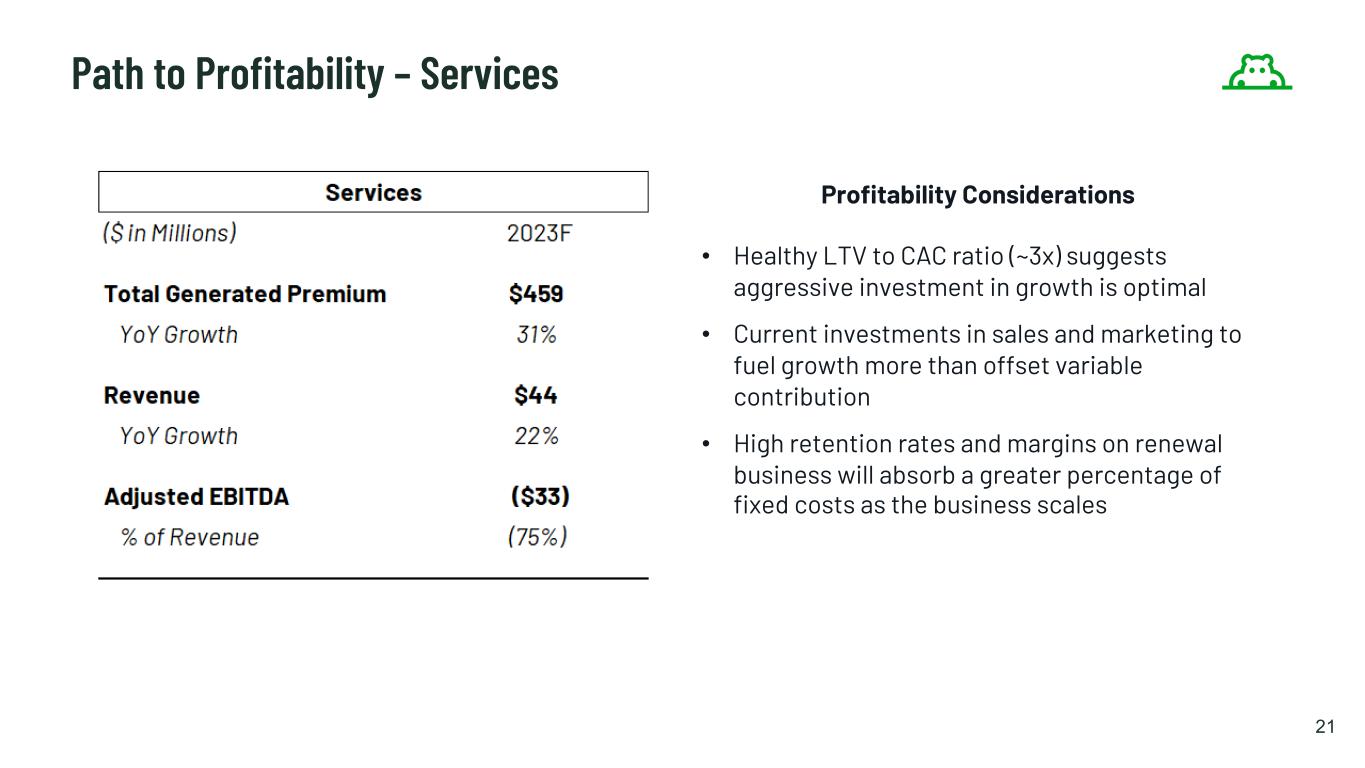
21 Profitability Considerations • Healthy LTV to CAC ratio (~3x) suggests aggressive investment in growth is optimal • Current investments in sales and marketing to fuel growth more than offset variable contribution • High retention rates and margins on renewal business will absorb a greater percentage of fixed costs as the business scales Path to Profitability – Services
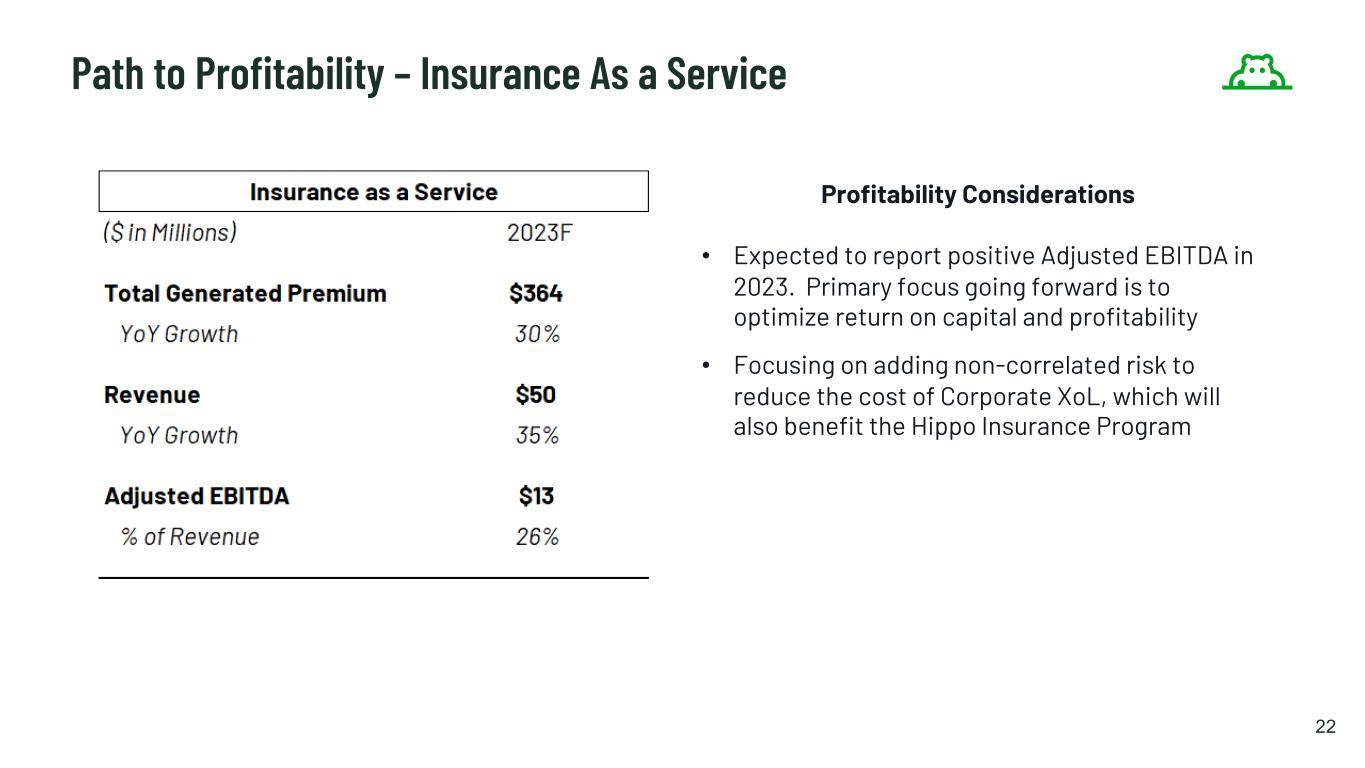
22 Path to Profitability – Insurance As a Service Profitability Considerations • Expected to report positive Adjusted EBITDA in 2023. Primary focus going forward is to optimize return on capital and profitability • Focusing on adding non-correlated risk to reduce the cost of Corporate XoL, which will also benefit the Hippo Insurance Program
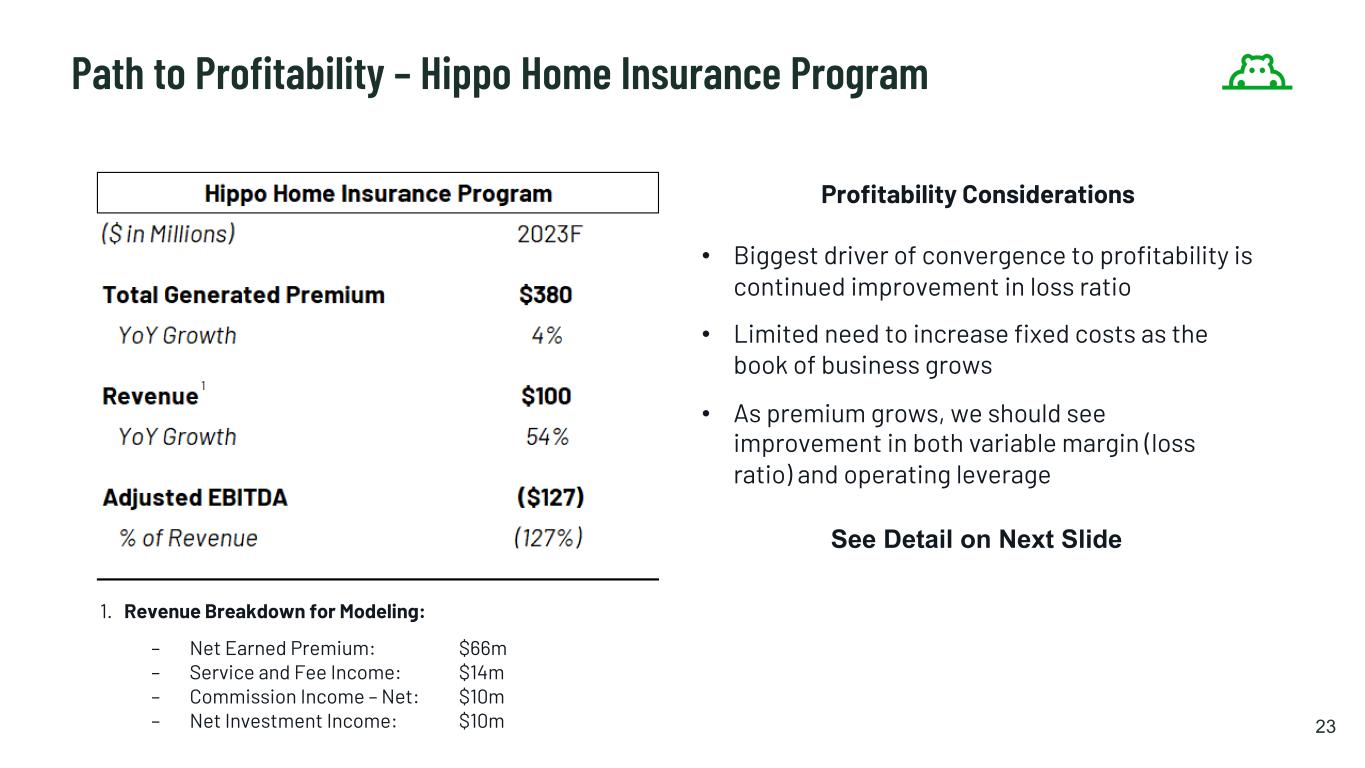
23 Path to Profitability – Hippo Home Insurance Program See Detail on Next Slide Profitability Considerations • Biggest driver of convergence to profitability is continued improvement in loss ratio • Limited need to increase fixed costs as the book of business grows • As premium grows, we should see improvement in both variable margin (loss ratio) and operating leverage 1. Revenue Breakdown for Modeling: – Net Earned Premium: $66m – Service and Fee Income: $14m – Commission Income – Net: $10m – Net Investment Income: $10m 1

Summary of Initiatives • 2023A − 73 rate filings across 31 states planned − ~85% of rate plan ($) already filed − Continue non-renewal action − Additional Claims and UW initiatives • 2022 – Proven track record − 64 rate filings across 28 states − Improved customer targeting − Updated segmentation model and re-underwriting − Non-renewal of select policies 24 107% 65% 2023 CY Expected Loss Ratio -(23-30)% Impact of 2023 Initiatives beyond 2023 CY Target Loss Ratio 2023 Impact from 2023 Initiatives -(0-7)% 2023 Impact from 2022 initiatives -12% 2022 Loss Ratio 88-95% Loss Ratio Walk (Calendar Year) Hippo Home Insurance Program – We target a loss ratio of 65% 2022 Initiatives 2023 Initiatives A. As of 3/2/23
Key Takeaways • In 2023, we will begin segment reporting which will align with how we have begun to operate Hippo this year. We believe the additional level of detail will also help investors better understand Hippo’s business • Hippo’s Services businesses are fee-driven, not exposed to loss ratio volatility, and fast growing. Investments in sales and marketing to fuel growth currently offset profit margins, but we view the attractive economics and high LTV as worthy of aggressive investment. We believe that over time, much of our differentiated consumer experience will be driven by offerings within this business line • Hippo’s Insurance as a Service business generates recurring revenue streams that have limited exposure to loss ratio. This business is stable, growing and already expected to report positive adjusted EBITDA in 2023, while adding financial benefits of diversification to our overall reinsurance program • The Hippo Home Insurance Program currently drives the bulk of our negative adjusted EBITDA but is positioned to turn positive over the next 18-24 months as the loss ratio continues to improve, driven primarily by actions that have already been undertaken • We expect Hippo to turn adjusted EBITDA positive by the end of 2024 with cash of at least $400 million at year end 2024
Disclaimer Forward Looking Statements Certain statements included in this Presentation that are not historical facts are forward-looking statements for purposes of the safe harbor provisions under the United States Private Securities Litigation Reform Act of 1995. Forward-looking statements generally are accompanied by words such as “believe,” “may,” “will,” “estimate,” “continue,” “anticipate,” “intend,” “expect,” “should,” “would,” “plan,” “predict,” “potential,” “seem,” “seek,” “future,” “outlook,” and similar expressions that predict or indicate future events or trends or that are not statements of historical matters. These forward-looking statements include, but are not limited to, statements regarding estimates and forecasts of financial results and other operating and performance metrics, our business strategy, the quality of our products and services, and the potential growth of our business. These statements are based on various assumptions, whether or not identified in this Presentation, and on the current expectations of Hippo Management and are not predictions of actual performance. These forward-looking statements are provided for illustrative purposes only and are not intended to serve as and must not be relied on by an investor as a guarantee, an assurance, a prediction, or a definitive statement of fact or probability. Actual events and circumstances are difficult or impossible to predict and will differ from assumptions. These forward-looking statements are subject to a number of risks and uncertainties, including changes in domestic and foreign business, market, financial, political, and legal conditions; natural or man-made catastrophes such as hurricanes, typhoons, earthquakes, floods, climate change (including effects on weather patterns; greenhouse gases; sea, land and air temperatures; sea levels; and rain and snow), nuclear accidents, pandemics (including COVID-19), or terrorism; continued impact of COVID-19 and related risks; ability to collect reinsurance recoverable, credit developments of reinsurers, and any delays with respect thereto and changes in the cost, quality, or availability of reinsurance; effects of data privacy or cyber laws or regulation; actual amount of new and renewal business, market acceptance of products, and risks associated with the introduction of new products and services and entering new markets; ability to increase use of data analytics and technology as part of business strategy; ability to attract, retain, and expand customer base; ability to compete effectively in the industry; effects of seasonal trends on results of operations; risks relating to the uncertainty of the projected financial information with respect to Hippo; risks related to the performance of Hippo’s business and the timing of expected business or revenue milestones; the effects of competition on Hippo’s business; and others risks as set forth in Hippo’s forms 10K and 10Q. If any of these risks materialize or our assumptions prove incorrect, actual results could differ materially from the results implied by these forward-looking statements. There may be additional risks that Hippo presently knows, or that Hippo currently believes are immaterial, that could also cause actual results to differ from those contained in the forward-looking statements. In addition, forward-looking statements reflect Hippo’s expectations, plans, or forecasts of future events and views as of the date of this Presentation. Hippo anticipate that subsequent events and developments will cause Hippo’s assessments to change. However, while Hippo may elect to update these forward-looking statements at some point in the future, Hippo specifically disclaims any obligation to do so. These forward-looking statements should not be relied upon as representing Hippo’s assessments of any date subsequent to the date of this Presentation. Accordingly, undue reliance should not be placed upon the forward-looking statements. Use of Data The data contained herein is derived from various internal and external sources. No representation is made as to the reasonableness of the assumptions made within or the accuracy or completeness of any projections or modeling or any other information contained herein. Any data on past performance or modeling contained herein is not an indication as to future performance. Hippo assumes no obligation to update the information in this presentation. Use of Non-GAAP Financial Metrics and Other Key Financial Metrics This Presentation includes the non-GAAP financial measure (including on a forward-looking basis) Adjusted EBITDA. Hippo defines Adjusted EBITDA, a non-GAAP financial measure, as net loss attributable to Hippo excluding interest expense, income tax expense, depreciation, amortization, stock-based compensation, net investment income, other non-cash fair market value adjustments, and contingent consideration for one of our acquisition and other transactions that we consider to be unique in nature. Hippo excludes these items from Adjusted EBITDA because it does not consider them to be directly attributable to its underlying operating performance. These non- GAAP measures are an addition, and not a substitute for or superior to measures of financial performance prepared in accordance with GAAP and should not be considered as an alternative to net income, operating income or any other performance measures derived in accordance with GAAP. Reconciliations of non-GAAP measures to their most directly comparable GAAP counterparts are included in our second quarter 2022 Shareholder Letter, which can be found on our website, Hippo.com. Hippo believes that these non-GAAP measures of financial results (including on a forward-looking basis) provide useful supplemental information to investors about Hippo. Hippo’s management uses forward looking non-GAAP measures to evaluate Hippo’s projected financial and operating performance. However, there are a number of limitations related to the use of these non-GAAP measures and their nearest GAAP equivalents. For example, other companies may calculate non-GAAP measures differently or may use other measures to calculate their financial performance; therefore, Hippo’s non-GAAP measures may not be directly comparable to similarly titled measures of other companies. This Presentation also includes certain projections of non-GAAP financial measures. Due to the high variability and difficulty in making accurate forecasts and projections of some of the information excluded from these projected measures, together with some of the excluded information not being ascertainable or accessible, Hippo is unable to quantify certain amounts that would be required to be included in the most directly comparable GAAP financial measures without unreasonable effort. Consequently, no disclosure of estimated comparable GAAP measures is included and no reconciliation of the forward-looking non-GAAP financial measures is included. This Presentation also includes key operating and financial metrics including Total Generated Premium (“TGP”), gross loss ratio, and net loss ratio. We define TGP as the aggregate written premium placed across all our business platforms for the period presented. We measure TGP as it reflects the volume of our business irrespective of choices related to how we structure our reinsurance treaties, the amount of risk we retain on our own balance sheet, or the amount of business written in our capacity as an MGA, agency, or as an insurance carrier/reinsurer. We define Total Generated Premium in Force as the aggregate annualized premium for all the policies in force as of the period end date. We use Gross Loss Ratio as a defined term expressed as a percentage, as the ratio of the gross losses and loss adjustment expenses (including Hippo and non-Hippo retained insurance risk), to the gross earned premium. We define net loss ratio expressed as a percentage, as the ratio of the net losses and loss adjustment expenses, to the net earned premium.


