As filed with the Securities and Exchange Commission on February 4, 2022
Registration No. 333-
Delaware | | | 3674 | | | 81-4816270 |
(State or other jurisdiction of incorporation or organization) | | | (Primary Standard Industrial Classification Code Number) | | | (I.R.S. Employer Identification Number) |
Andrea L. Nicolás, Esq. Skadden, Arps, Slate, Meagher & Flom LLP One Manhattan West New York, New York 10001 (212) 735-3000 | | | Jacob D. Wolf, Esq. General Counsel and Secretary FTC Solar, Inc. 9020 N Capital of Texas Hwy, Suite I-260, Austin, Texas 78759 (737) 787-7906 |
Large accelerated filer | | | ☐ | | | Accelerated filer | | | ☐ |
Non-accelerated filer | | | ☒ | | | Smaller reporting company | | | ☐ |
| | | | | Emerging growth company | | | ☒ |
| | | ||
| | | ||
| | | ||
| | | ||
| | | ||
| | | ||
| | | ||
| | | ||
| | | ||
| | | ||
| | | ||
| | | ||
| | | ||
| | | ||
| | | ||
| | | ||
| | | ||
| | | ||
| | | ||
| | |
| • | our limited operating history and the rapidly changing solar industry make it difficult to evaluate our current business and future prospects and we may not achieve profitability in the future; |
| • | we have a history of losses that may continue in the future, and we may not achieve profitability; |
| • | the market for our products and services is highly competitive and rapidly evolving and we expect to face increased competition; |
| • | if potential owners of solar energy systems incorporating our solar tracker systems are unable to secure financing on acceptable terms, we could experience a reduction in the demand for our products; |
| • | our dependence on a limited number of customers may impair our ability to operate profitably; |
| • | we invest significant time, resources and management attention to identifying and developing project leads that are subject to our sales and marketing focus and if we are unsuccessful in converting such project leads (or awarded orders) into binding purchase orders, our business, financial condition or results of operations could be materially adversely affected; |
| • | we plan to expand into additional international markets, which will expose us to additional regulatory, economic, political, reputational and competitive risks; |
| • | we may acquire other companies or technologies, which could divert our management’s attention, result in dilution to our stockholders, reduce our available cash that could be used for other purposes and otherwise disrupt our operations and harm our results of operations; |
| • | defects or quality or performance problems in our products could result in loss of customers, reputational damage and decreased revenue, and we may face warranty, indemnity and product liability claims arising from defective products; |
| • | we face risks related to actual or threatened health epidemics, such as the coronavirus (“COVID-19”) pandemic, and other outbreaks, which could significantly disrupt our operations; |
| • | if we fail, in whole or in part, to obtain, maintain, protect, defend or enforce our intellectual property and other proprietary rights, our business and results of operations could be materially harmed; |
| • | we depend upon a limited number of outside contract manufacturers, and our operations could be disrupted if our relationships with these contract manufacturers are compromised; |
| • | we may experience delays, disruptions or quality control problems in our contract manufacturers’ manufacturing operations, which could result in reputational damage and other liabilities to our customers; |
| • | failure by our contract manufacturers to use ethical business practices and comply with applicable laws and regulations may adversely affect our business; |
| • | we and our contract manufacturers are dependent on domestic and international transportation and logistics markets to deliver our products. If we or our contract manufacturers experience disruptions, unavailability or escalated pricing in the transportation and logistics markets, which include trucking, vessels, ports and related infrastructure and logistics, our business, results of operations and financial condition could be materially and adversely impacted; |
| • | the reduction, elimination or expiration of government incentives for, or regulations mandating the use of, as well as corporate commitments to the use of, renewable energy and solar energy specifically could reduce demand for solar energy systems and harm our business; |
| • | changes in the U.S. trade environment, including the imposition of import tariffs, could adversely affect the amount or timing of our revenue, results of operations or cash flows; |
| • | forced labor practices in China and legislation and policies adopted to address such practices may disrupt the global supply of solar panels and affect our business; and |
| • | we could be adversely affected by any violations of the U.S. Foreign Corrupt Practices Act of 1977, as amended (the “FCPA”), and other foreign anti-bribery laws, as well as of export controls and economic sanctions laws. |
| • | we are permitted to include only two years of audited financial statements and “Management’s Discussion and Analysis of Financial Condition and Results of Operations” disclosure; |
| • | we are not required to engage an auditor to report on our internal controls over financial reporting pursuant to Section 404(b) of the Sarbanes-Oxley Act of 2002, as amended, or the Sarbanes-Oxley Act; |
| • | we are permitted to take advantage of extended transition periods for complying with new or revised accounting standards which allows an emerging growth company to delay the adoption of some accounting standards until those standards would otherwise apply to private companies; |
| • | we are not required to submit certain executive compensation matters to stockholder advisory votes, such as “say-on-pay,” “say-on-frequency” and “say-on-golden parachutes;” and |
| • | we are not required to comply with certain disclosure requirements related to executive compensation, such as the requirement to disclose the correlation between executive compensation and performance and the requirement to present a comparison of our Chief Executive Officer’s compensation to our median employee compensation. |
| * | The number of shares of our common stock outstanding as of the date of this prospectus is based on 96,751,102 shares of our common stock outstanding as of February 4, 2022 and excludes: |
| • | 12,980,886 shares of common stock reserved for future grant or issuance under our 2021 Stock Incentive Plan (the “2021 Plan”) and 1,702,891.31 shares of common stock reserved for future grant or issuance under our 2021 Employee Stock Purchase Plan (the “ESPP”), which shares will automatically increase each year, as more fully described in “Executive and Director Compensation;” |
| • | 5,568,770 shares of common stock issuable upon exercise of options outstanding as of February 4, 2022, having a weighted-average exercise price of $3.26 per share (with 2,660,864 of such options being vested as of February 4, 2022); and |
| • | 11,115,517 shares of common stock issuable upon settlement of restricted stock units (“RSUs”) outstanding as of February 4, 2022, having an estimated grant date fair value of $3.82 per share (with 6,107,784 of such RSUs being vested as of February 4, 2022). |
| • | the cost competitiveness, reliability and performance of solar energy systems compared to conventional and non-solar renewable energy sources and products, including the pricing of component parts (e.g., panels) used in solar energy systems; |
| • | the availability, scale and scope of federal, state, local and foreign government subsidies and incentives to support the development and deployment of solar energy products; |
| • | prices of traditional carbon-based energy sources and government subsidies for these sources; |
| • | the extent to which the electric power industry and broader energy industries are deregulated to permit broader adoption of solar electricity generation; |
| • | investment by end-users of solar energy products, which tends to decrease when economic growth slows; and |
| • | the emergence, continuance or success of, or increased government support for, other alternative energy generation technologies and products. |
| • | our ability to produce solar tracker systems that compete favorably against other products on the basis of price, quality, cost of installation, overall cost savings, reliability and performance; |
| • | the rate and extent of deployment of tracker systems versus fixed-tilt ground-mounted systems within the solar industry, especially in international markets; |
| • | the rate and extent of deployment of two-panel in-portrait tracker systems versus one-panel in-portrait tracker systems; |
| • | our ability to timely introduce new products and complete new designs, and qualify and certify our products; |
| • | whether project developers, solar asset owners, EPC contractors and solar financing providers will continue to adopt and finance our solar tracker systems and other products and services, including as a result of the quality, reliability and performance of our tracker systems that are in operation, which have a relatively limited history; |
| • | the ability of prospective customers to obtain financing, including tax equity financing, for solar energy installations using our products on acceptable terms or at all; |
| • | our ability to develop products and related processes that comply with local standards and regulatory requirements, as well as local content requirements; and |
| • | our ability to develop and maintain successful relationships with our customers and contract manufacturers. |
| • | construction of a significant number of new, lower-cost power generation plants, including plants utilizing natural gas, renewable energy or other generation technologies; |
| • | relief of transmission constraints that enable distant, lower-cost generation to transmit energy less expensively or in greater quantities; |
| • | reductions in the price of natural gas or other fuels; |
| • | utility rate adjustment and customer class cost reallocation; |
| • | decreased electricity demand, including from energy conservation technologies and public initiatives to reduce electricity consumption; |
| • | development of smart-grid technologies that lower peak energy requirements; |
| • | development of new or lower-cost customer-sited energy storage technologies that have the ability to reduce a customer’s average cost of electricity by shifting load to off-peak times; and |
| • | development of new energy generation technologies that provide less expensive energy. |
| • | difficulty in establishing and managing international operations, including establishment of local customer service operations and local sales operations, and the associated legal compliance costs; |
| • | risks related to the usage of international sales representatives, who we do not presently engage but may in the future, who would not be our employees and would not be under our direct control, including legal compliance risks and reputational risks; |
| • | acceptance of our single-axis tracker systems or other solar energy products and services in markets in which they have not traditionally been used; |
| • | our ability to accurately forecast product demand and manage manufacturing capacity and production; |
| • | willingness of our potential customers to incur a higher upfront capital investment for Voyager than may be required for competing fixed-tilt ground-mounted systems; |
| • | our ability to reduce production costs to price our products competitively; |
| • | availability of government subsidies and economic incentives for solar energy products and services; |
| • | timely qualification and certification of new products; |
| • | the ability to protect and enforce intellectual property rights abroad; |
| • | compliance with sanctions laws and anti-bribery laws, such as the FCPA, by us, our employees, our sales representatives and our business partners; |
| • | import and export controls and restrictions and changes in trade regulations; |
| • | tariffs and other non-tariff barriers, tax consequences and local content requirements; |
| • | fluctuations in currency exchange rates and the requirements of currency control regulations, which might restrict or prohibit conversion of other currencies into U.S. dollars; and |
| • | political or social unrest or economic instability in a specific country or region in which we operate. |
| • | diversion of management time and focus from operating our business to addressing acquisition integration challenges; |
| • | retention of key employees from the acquired company; |
| • | failure to realize long-term value and synergies from the acquisition; |
| • | failure to realize incremental revenue that was anticipated to result from the acquisition; |
| • | synchronization and integration of the operations of the acquired company with our operations, including blending of corporate cultures; |
| • | assumption of liabilities for activities of the acquired company before the acquisition; and |
| • | litigation or other claims in connection with the acquisition, including claims from terminated employees, customers, former stockholders or other third parties. |
| • | additional trade enforcement actions that lead to imposition of additional tariffs and other charges on imports and exports that could relate to imports from a number of different countries; |
| • | the potential imposition of restrictions on our acquisition, importation or installation of equipment under future U.S. regulations implementing the Executive Order on Securing the United States Bulk-Power System; |
| • | quotas imposed by bilateral trade agreements; |
| • | foreign currency fluctuations; |
| • | public health issues and epidemic diseases, their effects (including any disruptions they may cause) or the perception of their effects, such as the ongoing COVID-19 pandemic; and |
| • | significant labor disputes, such as transportation worker strikes. |
| • | changes in laws or regulations applicable to our industry or offerings; |
| • | speculation about our business in the press or investment community; |
| • | price and volume fluctuations in the overall stock market; |
| • | volatility in the market price and trading volume of companies in our industry or companies that investors consider comparable; |
| • | share price and volume fluctuations attributable to inconsistent trading levels of our common stock; |
| • | our ability to protect our intellectual property and other proprietary rights and to avoid infringement, misappropriation or violation of the intellectual property and other proprietary rights of third parties or claims by third parties of such infringement, misappropriation or violation; |
| • | sales of our common stock by us or our principal stockholders, officers and directors; |
| • | the expiration of contractual lock-up agreements; |
| • | the sustainability of an active trading market for our common stock; |
| • | success of competitive products or services; |
| • | the public’s response to press releases or other public announcements by us or others, including our filings with the SEC, announcements relating to litigation or significant changes in our key personnel; |
| • | the effectiveness of our internal controls over financial reporting; |
| • | changes in our capital structure, such as future issuances of debt or equity securities; |
| • | our entry into new markets; |
| • | tax developments in the U.S. or other markets; |
| • | strategic actions by us or our competitors, such as acquisitions or restructurings; and |
| • | changes in accounting principles. |
| • | a staggered board, which means that our board of directors is classified into three classes of directors with staggered three-year terms; |
| • | limitations on convening special stockholder meetings, which could make it difficult for our stockholders to adopt desired governance changes; |
| • | advance notice procedures, which apply for stockholders to nominate candidates for election as directors or to bring matters before an annual meeting of stockholders; |
| • | a prohibition on stockholder action by written consent, which means that our stockholders will only be able to take action at a meeting of stockholders; |
| • | a forum selection clause, which means certain litigation against us can only be brought in Delaware; |
| • | no authorization of cumulative voting, which limits the ability of minority stockholders to elect director candidates; |
| • | directors will only be able to be removed for cause; |
| • | certain amendments to our certificate of incorporation will require the approval of two-thirds of the then outstanding voting power of our capital stock; |
| • | the affirmative vote of two-thirds of the then outstanding voting power of our capital stock, voting as a single class, is required for stockholders to amend or adopt any provision of our bylaws; and |
| • | the authorization of undesignated or “blank check” preferred stock, the terms of which may be established and shares of which may be issued without further action by our stockholders. |
| • | We did not have a sufficient complement of experienced personnel with the requisite technical knowledge of public company accounting and reporting and for non-routine, unusual or complex transactions. This material weakness contributed to the following material weakness. |
| • | We did not design and maintain adequate controls over the period-end close and financial reporting process including establishment of accounting policies and procedures, certain account reconciliations, cut-off, segregation of duties, journal entries and financial statement preparation. This material weakness contributed to material adjustments in the 2019 consolidated financial statements principally, but not limited to, in the following areas: definite-lived intangibles, warranty obligation, cut-off of revenue transactions and related cost of sales. This material weakness also contributed to misstatements in our stock-based compensation and weighted-average common shares outstanding, which led to the revision of our consolidated financial statements as of June 30, 2021 and for the three and six months period then ended. |
| • | We did not design and maintain effective information technology general controls over the IT systems used for preparation of the financial statements. Specifically, we did not design and maintain (i) program change management controls to ensure that information technology program and data changes affecting financial IT applications and underlying accounting records are identified, tested, authorized and implemented appropriately; (ii) user access controls to ensure appropriate segregation of duties and that adequately restrict user and privileged access to financial applications, programs and data to appropriate Company personnel; and (iii) testing and approval controls for program development to ensure that new software development is aligned with business and IT requirements. |
| | | Years Ended December 31, | | | Three Months Ended September 30 | | | Nine Months Ended September 30, | ||||||||||
| | | 2019 | | | 2020 | | | 2020 | | | 2021 | | | 2020 | | | 2021 | |
| | | (in thousands) | ||||||||||||||||
Net loss | | | $(13,495) | | | $(15,924) | | | $(2,840) | | | $(22,916) | | | $(6,196) | | | $(82,707) |
Income tax (benefit) expense | | | (39) | | | (83) | | | 24 | | | 41 | | | (115) | | | 137 |
Interest expense, net | | | 454 | | | 364 | | | 70 | | | 128 | | | 303 | | | 227 |
Depreciation expense | | | 12 | | | 13 | | | 3 | | | 53 | | | 10 | | | 95 |
Amortization of intangibles | | | 400 | | | 33 | | | — | | | — | | | 33 | | | — |
Amortization of debt issuance costs | | | — | | | — | | | | | 173 | | | — | | | 288 | |
Stock-based compensation | | | 906 | | | 1,818 | | | 448 | | | 5,381 | | | 1,381 | | | 58,531 |
(Gain) loss on extinguishment of debt(a) | | | — | | | 116 | | | 34 | | | — | | | 75 | | | (790) |
Non-routine legal fees(b) | | | — | | | — | | | — | | | 988 | | | — | | | 1,763 |
Severance(c) | | | — | | | — | | | — | | | — | | | — | | | 295 |
Other costs(d) | | | — | | | — | | | — | | | 270 | | | — | | | 3,135 |
(Gain) from disposal of unconsolidated subsidiary | | | — | | | — | | | — | | | (210) | | | — | | | (20,829) |
Loss (Income) from unconsolidated subsidiary(e) | | | 709 | | | (1,399) | | | 186 | | | — | | | 345 | | | 354 |
Adjusted EBITDA | | | $(11,053) | | | $(15,062) | | | $(2,075) | | | $(16,092) | | | $(4,164) | | | $(39,501) |
| (a) | The gain on extinguishment of debt for the nine months ended September 30, 2021 resulted from forgiveness of a loan under SBA’s PPP. See “Note-8 Debt and Other Borrowings”. |
| (b) | Represents legal fees incurred that were not ordinary or routine to the operations of the business. |
| (c) | Represents severance accrued related to an agreement with an employee due to restructuring changes. |
| (d) | Represents consulting fees in connection with operations and finance and other costs associated with our IPO and one-time CEO transition cost. |
| (e) | Represents results of an entity that we do not consolidate, as our management excludes these results when evaluating our operating performance. |
| | | Years Ended December 31, | | | Three Months Ended September 30, | | | Nine Months Ended September 30, | ||||||||||||||||||||||||||||
| | | 2019 | | | 2020 | | | 2020 | | | 2021 | | | 2020 | | | 2021 | |||||||||||||||||||
| | | Loss | | | EPS | | | Loss | | | EPS | | | Loss | | | EPS | | | Loss | | | EPS | | | Loss | | | EPS | | | Loss | | | EPS | |
| | | (in thousands, except per share data) | ||||||||||||||||||||||||||||||||||
Net loss and EPS (basic & diluted) | | | $(13,495) | | | $(0.22) | | | $(15,924) | | | $(0.23) | | | $(2,840) | | | $(0.04) | | | $(22,916) | | | $(0.24) | | | $(6,196) | | | $(0.09) | | | $(82,707) | | | $(1.00) |
Amortization of intangibles | | | 400 | | | 0.01 | | | 33 | | | — | | | — | | | | | — | | | | | 33 | | | | | — | | | ||||
Amortization of debt issuance costs | | | — | | | — | | | — | | | — | | | — | | | | | 173 | | | | | — | | | | | 288 | | | ||||
Stock-based compensation | | | 906 | | | 0.01 | | | 1,818 | | | 0.03 | | | 448 | | | 0.01 | | | 5,381 | | | 0.06 | | | 1,381 | | | 0.02 | | | 58,531 | | | 0.71 |
| | | Years Ended December 31, | | | Three Months Ended September 30, | | | Nine Months Ended September 30, | ||||||||||||||||||||||||||||
| | | 2019 | | | 2020 | | | 2020 | | | 2021 | | | 2020 | | | 2021 | |||||||||||||||||||
| | | Loss | | | EPS | | | Loss | | | EPS | | | Loss | | | EPS | | | Loss | | | EPS | | | Loss | | | EPS | | | Loss | | | EPS | |
| | | (in thousands, except per share data) | ||||||||||||||||||||||||||||||||||
(Gain) loss from extinguishment of debt(a) | | | — | | | — | | | — | | | — | | | 34 | | | — | | | — | | | | | 75 | | | — | | | (790) | | | 0.01 | |
(Gain) from disposal of equity investment | | | | | | | | | | | — | | | | | (210) | | | — | | | — | | | | | (20,829) | | | (0.25) | ||||||
Non-routine legal fees(b) | | | | | | | | | | | — | | | | | 988 | | | 0.01 | | | — | | | | | 1,763 | | | 0.02 | ||||||
Severance(c) | | | | | | | | | | | — | | | | | — | | | | | — | | | | | 295 | | | — | |||||||
Other costs(d) | | | | | | | | | | | — | | | | | 270 | | | — | | | — | | | | | 3,135 | | | 0.03 | ||||||
Loss (Income) from unconsolidated subsidiary(e) | | | 709 | | | 0.01 | | | (1,399) | | | (0.02) | | | 186 | | | — | | | — | | | — | | | 345 | | | — | | | 354 | | | — |
Income tax expense of adjustments(f) | | | 3 | | | — | | | (3) | | | — | | | — | | | — | | | — | | | — | | | (3) | | | — | | | — | | | — |
Adjusted Non-GAAP Net Loss and Adjusted EPS | | | $(11,477) | | | $(0.18) | | | $(15,475) | | | $(0.22) | | | $(2,172) | | | $(0.03) | | | $(16,314) | | | $(0.17) | | | $(4,365) | | | $(0.06) | | | $(39,960) | | | $(0.48) |
| (a) | The gain on extinguishment of debt for the nine months ended September 30, 2021 resulted from forgiveness of a loan under SBA’s PPP. |
| (b) | Represents legal fees incurred that were not ordinary or routine to the operations of the business. |
| (c) | Represents severance accrued related to an agreement with an employee due to restructuring changes. |
| (d) | Represents consulting fees in connection with operations and finance and other costs associated with our IPO and one-time CEO transition cost. |
| (e) | Represents results of an entity that we do not consolidate, as our management excludes these results when evaluating our operating performance. |
| (f) | Represents incremental tax expense of adjustments made to reconcile Net Loss to Adjusted Non-GAAP Net Loss driven from loss from unconsolidated subsidiary. |
| | | Years Ended December 31, | | | Three Months Ended September 30, | | | Nine Months Ended September 30, | ||||||||||
| | | 2019 | | | 2020 | | | 2020 | | | 2021 | | | 2020 | | | 2021 | |
| | | (dollars in thousands, except per share data) | ||||||||||||||||
Revenue: | | | | | | | | | | | | | ||||||
Product revenue | | | $43,085 | | | $158,925 | | | $48,879 | | | $45,582 | | | 122,197 | | | 137,799 |
Service revenue | | | 10,039 | | | 28,427 | | | 10,761 | | | 7,407 | | | 20,976 | | | 31,005 |
Total revenue | | | 53,124 | | | 187,352 | | | 59,640 | | | 52,989 | | | 143,173 | | | 168,804 |
Cost of Revenue | | | | | | | | | | | | | ||||||
Product cost of revenue | | | 44,212 | | | 155,967 | | | 46,513 | | | 48,090 | | | 114,883 | | | 146,964 |
Service cost of revenue | | | 10,863 | | | 27,746 | | | 10,261 | | | 12,938 | | | 19,826 | | | 45,810 |
Total cost of revenue | | | 55,075 | | | 183,713 | | | 56,774 | | | 61,028 | | | 134,709 | | | 192,774 |
Gross (loss) profit | | | (1,951) | | | 3,639 | | | 2,866 | | | (8,039) | | | 8,464 | | | (23,970) |
Operating expenses | | | | | | | | | | | | | ||||||
Research and development(a) | | | 3,960 | | | 5,222 | | | 1,438 | | | 2,116 | | | 4,047 | | | 9,653 |
Selling and marketing(a) | | | 1,897 | | | 3,545 | | | 1,041 | | | 2,224 | | | 2,374 | | | 6,421 |
General and administrative(a) | | | 4,563 | | | 11,798 | | | 2,912 | | | 10,392 | | | 7,630 | | | 63,217 |
Total operating expenses | | | 10,420 | | | 20,565 | | | 5,391 | | | 14,732 | | | 14,051 | | | 79,291 |
Loss from operations | | | (12,371) | | | (16,926) | | | (2,525) | | | (22,771) | | | (5,587) | | | (103,261) |
Interest expense, net | | | 454 | | | 480 | | | (70) | | | (301) | | | (303) | | | (515) |
Gain from disposal in equity investment | | | — | | | — | | | — | | | 210 | | | — | | | 20,829 |
Gain (loss) on extinguishment of debt | | | — | | | — | | | (34) | | | — | | | (75) | | | 790 |
Other expense | | | — | | | — | | | (1) | | | (13) | | | (1) | | | (59) |
Loss before income taxes | | | (12,825) | | | (17,406) | | | (2,630) | | | (22,875) | | | (5,966) | | | (82,216) |
(Expense) benefit from income taxes | | | (39) | | | (83) | | | (24) | | | (41) | | | 115 | | | (137) |
Loss (Income) from unconsolidated subsidiary | | | 709 | | | (1,399) | | | (186) | | | — | | | (345) | | | (354) |
Net loss | | | $(13,495) | | | $(15,924) | | | $(2,840) | | | $(22,916) | | | $(6,196) | | | $(82,707) |
Other comprehensive income (loss): | | | | | | | | | | | | | ||||||
Foreign currency translation adjustments | | | — | | | (3) | | | (12) | | | 3 | | | (20) | | | 9 |
| | | | | | | | | | | | | |||||||
Comprehensive loss | | | $(13,495) | | | $(15,927) | | | $(2,852) | | | $(22,913) | | | $(6,216) | | | $(82,698) |
| | | | | | | | | | | | | |||||||
Non-GAAP Measures | | | | | | | | | | | | | ||||||
Adjusted EBITDA | | | $(11,053) | | | $(15,062) | | | $(2,075) | | | $(16,092) | | | $(4,164) | | | $(39,501) |
Adjusted Non-GAAP Net Loss | | | $(11,477) | | | $(15,475) | | | $(2,172) | | | $(16,314) | | | $(4,365) | | | $(39,960) |
Adjusted EPS | | | $(0.18) | | | $(0.22) | | | $(0.03) | | | $(0.17) | | | $(0.06) | | | $(0.48) |
| (a) | Includes stock-based compensation expense as follows: |
| | | Years Ended December 31, | | | Three Months Ended September 30, | | | Nine Months Ended September 30, | ||||||||||
| | | 2019 | | | 2020 | | | 2020 | | | 2021 | | | 2020 | | | 2021 | |
Cost of revenue | | | $176 | | | $322 | | | $80 | | | $342 | | | $244 | | | $7,571 |
Research and development | | | 51 | | | 57 | | | 16 | | | 200 | | | 47 | | | 3,925 |
| | | Years Ended December 31, | | | Three Months Ended September 30, | | | Nine Months Ended September 30, | ||||||||||
| | | 2019 | | | 2020 | | | 2020 | | | 2021 | | | 2020 | | | 2021 | |
Selling and marketing | | | 26 | | | 38 | | | 9 | | | 1,135 | | | 28 | | | 2,942 |
General and administrative | | | 653 | | | 1,401 | | | 343 | | | 3,704 | | | 1,062 | | | 44,093 |
Total stock-based compensation expense | | | $906 | | | $1,818 | | | $448 | | | $5,381 | | | $1,381 | | | $58,531 |
| | | Years Ended December 31, | | | Three Months Ended September 30, | | | Nine Months Ended September 30, | ||||||||||
| | | 2019 | | | 2020 | | | 2020 | | | 2021 | | | 2020 | | | 2021 | |
| | | (as a percentage of revenue) | ||||||||||||||||
Revenue: | | | | | | | | | | | | | ||||||
Product revenue | | | 81% | | | 85% | | | 82% | | | 86% | | | 85% | | | 82% |
Service revenue | | | 19 | | | 15 | | | 18 | | | 14 | | | 15 | | | 18 |
Total revenue | | | 100 | | | 100 | | | 100 | | | 100 | | | 100 | | | 100 |
Cost of revenue: | | | | | | | | | | | | | ||||||
Product cost of revenue | | | 83 | | | 83 | | | 78 | | | 91 | | | 80 | | | 87 |
Service cost of revenue | | | 20 | | | 15 | | | 17 | | | 24 | | | 14 | | | 27 |
Total cost of revenue | | | 104 | | | 98 | | | 95 | | | 115 | | | 94 | | | 114 |
Gross (loss) profit | | | (4) | | | 2 | | | 5 | | | (15) | | | 6 | | | (14) |
Operating expenses | | | | | | | | | | | | | ||||||
Research and development | | | 7 | | | 3 | | | 2 | | | 4 | | | 3 | | | 6 |
Selling and marketing | | | 4 | | | 2 | | | 2 | | | 4 | | | 2 | | | 4 |
General and administrative | | | 9 | | | 6 | | | 5 | | | 20 | | | 5 | | | 37 |
Total operating expenses | | | 20 | | | 11 | | | 9 | | | 28 | | | 10 | | | 47 |
Loss from operations | | | (24) | | | (9) | | | (4) | | | (43) | | | (4) | | | (61) |
Interest expense, net | | | 1 | | | — | | | 0 | | | (1) | | | 0 | | | 0 |
Gain from disposal in equity investment | | | — | | | — | | | — | | | 0 | | | — | | | 12 |
Gain (loss) on extinguishment of debt | | | — | | | — | | | 0 | | | — | | | 0 | | | 0 |
Other expense | | | — | | | — | | | 0 | | | 0 | | | 0 | | | 0 |
Loss before income taxes | | | (25) | | | (9) | | | (4) | | | (43) | | | (4) | | | (49) |
(Expense) benefit from income taxes | | | — | | | 0 | | | 0 | | | 0 | | | 0 | | | |
Loss (Gain) from unconsolidated subsidiary | | | 1 | | | (1) | | | 0 | | | — | | | 0 | | | 0 |
Net loss | | | (25)% | | | (8)% | | | (5)% | | | (43)% | | | (4)% | | | (49)% |
| | | Years Ended December 31, | | | Nine Months Ended September 30, | |||||||
| | | 2019 | | | 2020 | | | 2020 | | | 2021 | |
| | | (in thousands) | ||||||||||
Net cash used in operating activities | | | $(254) | | | $(511) | | | $(14,638) | | | $(92,414) |
Net cash (used in) provided by investing activities | | | (18) | | | 1,868 | | | — | | | 21,554 |
Net cash provided by financing activities | | | 7,000 | | | 23,784 | | | 26,784 | | | 178,140 |
Effect on exchange rate changes on cash and restricted cash | | | — | | | (3) | | | (20) | | | 9 |
Increase in cash and restricted cash | | | $6,728 | | | $25,138 | | | $12,126 | | | $107,289 |
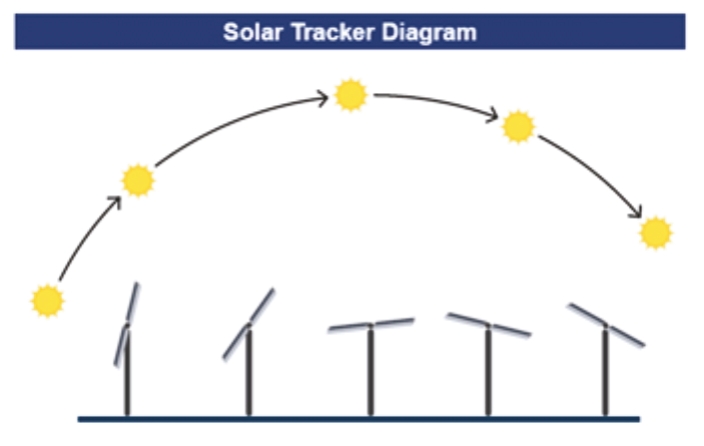

| • | Terrain-Based Tracking. This feature enables Voyager to reduce shading on sloped terrain sites during morning and afternoon backtracking. Elevation data is captured by a drone survey during site commissioning and then stored within each Voyager Tracker that utilizes the SunPath software. Using elevation information for each row in the tracker system allows this algorithm to calculate the daily setpoint angles to minimize row-to-row shading and maximize energy output. |
| • | Diffuse Light Optimization. This feature enables Voyager to maximize energy yield during diffuse light conditions created by elements such as clouds, fog, smoke and sand. Typically, trackers try to angle themselves as close to perpendicular to the sun’s position as possible, but during diffuse light conditions, it is advantageous to position the tracker at a flatter or lower angle. This algorithm uses short-term irradiance forecasts based on satellite imagery to determine when a diffuse light condition will exist, and then positions Voyager Trackers that utilize the SunPath software at the angle that maximizes energy output. Our method is unique because it is a purely software-driven optimization with no reliance on on-site sensors that require regular maintenance and cleaning. |
| • | Contract Manufacturers. All Voyager components are built to our specification. Based on set criteria, we select contract manufacturers from countries around the world that are well versed in component engineering and change management and stand behind their craftsmanship by providing warranties on defects to support the warranties we provide to our customers. Our contract manufacturers undergo a |
| • | Logistics. We select our logistics providers based on similar criteria that we use to select our contract manufacturers. We partner with a leading global third party logistics provider to support our logistic operations. This partnership allows us to develop flexible delivery plans that can accommodate the specific site and construction needs of our customers. |
| • | Capacity. We maintain supply source redundancy to help protect our customers from disruptive risks. We have sized our supply chain to meet the variability and seasonality of our customers and industry. We currently have eight GW of annualized supply capacity and seek to deliver a 100% tariff-free solution to our U.S. customers by sourcing supply from qualified manufacturers that are located outside tariff zones and who satisfy our qualification specifications. |
Name | | | Age | | | Position |
Sean Hunkler | | | 59 | | | President and Chief Executive Officer, Director |
Patrick M. Cook | | | 38 | | | Chief Financial Officer and Treasurer |
Nagendra Cherukupalli | | | 62 | | | Chief Technology Officer |
Ali Mortazavi | | | 61 | | | Executive Vice President, Global Sales and Marketing |
Kristian Nolde | | | 44 | | | Vice President, Marketing and Strategy |
Thurman J. “T.J.” Rodgers | | | 73 | | | Chairman of the Board |
David Springer | | | 53 | | | Director |
Ahmad Chatila | | | 54 | | | Director |
William Aldeen (“Dean”) Priddy, Jr. | | | 61 | | | Director |
Isidoro Quiroga Cortés | | | 33 | | | Director |
Shaker Sadasivam | | | 61 | | | Director |
Lisan Hung | | | 52 | | | Director |
| • | the Class I directors will be Isidoro Quiroga Cortés, David Springer and Thurman J. “T.J.” Rodgers and their initial terms will expire at the annual meeting of stockholders to be held in 2022; |
| • | the Class II directors will be Shaker Sadasivam and Sean Hunkler and their initial terms will expire at the annual meeting of stockholders to be held in 2023; and |
| • | the Class III directors will be Ahmad Chatila, William Aldeen (“Dean”) Priddy, Jr. and Lisan Hung and their initial terms will expire at the annual meeting of stockholders to be held in 2024. |
| • | personal and professional integrity; |
| • | ethics and values; |
| • | experience in corporate management, such as serving as an officer or former officer of a publicly held company; |
| • | experience in the industries in which we compete; |
| • | experience as a board member or executive officer of another publicly held company; |
| • | diversity of background and expertise and experience in substantive matters pertaining to our business relative to other board members; |
| • | conflicts of interest; and |
| • | practical and mature business judgment. |
| • | selecting and hiring our independent auditors, and approving the audit and non-audit services to be performed by our independent auditors; |
| • | assisting the board of directors in evaluating the qualifications, performance and independence of our independent auditors; |
| • | assisting the board of directors in monitoring the quality and integrity of our financial statements and our accounting and financial reporting; |
| • | assisting the board of directors in monitoring our compliance with legal and regulatory requirements; |
| • | reviewing with management and our independent auditors the adequacy and effectiveness of our internal controls over financial reporting processes; |
| • | assisting the board of directors in monitoring the performance of our internal audit function; |
| • | reviewing with management and our independent auditors our annual and quarterly financial statements; |
| • | reviewing and overseeing all transactions between us and a related person for which review or oversight is required by applicable law or that are required to be disclosed in our financial statements or SEC filings, and developing policies and procedures for the committee’s review, approval and/or ratification of such transactions; |
| • | establishing procedures for the receipt, retention and treatment of complaints received by us regarding accounting, internal accounting controls or auditing matters and the confidential, anonymous submission by our employees of concerns regarding questionable accounting or auditing matters; and |
| • | preparing the audit committee report that the rules and regulations of the SEC require to be included in our annual proxy statement. |
| • | reviewing and approving corporate goals and objectives relevant to the compensation of our Chief Executive Officer, evaluating our Chief Executive Officer’s performance in light of those goals and objectives, and, either as a committee or together with the other independent directors (as directed by the board of directors), determining and approving our Chief Executive Officer’s compensation level based on such evaluation; |
| • | reviewing and approving, or making recommendations to the board of directors with respect to, the compensation of our other executive officers, including annual base salary, bonus and equity-based incentives and other benefits; |
| • | reviewing and recommending to the board of directors the compensation of our directors; |
| • | appointing and overseeing any compensation consultants; |
| • | reviewing and discussing with management our “Compensation Discussion and Analysis” disclosure required by SEC rules; |
| • | preparing the compensation committee report required by the SEC to be included in our annual proxy statement; and |
| • | reviewing and making recommendations with respect to our equity and equity-based compensation plans. |
| • | assisting our board of directors in identifying prospective director nominees and recommending nominees to the board of directors; |
| • | overseeing the evaluation of the board of directors and management; |
| • | reviewing developments in corporate governance practices and developing and recommending a set of corporate governance guidelines; and |
| • | recommending members for each committee of our board of directors. |
| • | Sean Hunkler, President and Chief Executive Officer; |
| • | Ali Mortazavi, Executive Vice President of Global Sales & Marketing; |
| • | Deepak Navnith, former Chief Operations Officer; and |
| • | Anthony P. Etnyre, former President and Chief Executive Officer. |
Name and Principal Position | | | Year | | | Salary ($)(1) | | | Bonus ($) | | | Stock Awards ($)(2) | | | Option Awards ($)(3) | | | Non-Equity Incentive Plan Compensation ($) | | | All Other Compensation ($)(4) | | | Total ($) |
Sean Hunkler Chief Executive Officer | | | 2021 | | | 182,308 | | | 250,000(5) | | | 5,146,515 | | | 9,141,334 | | | 0 | | | 1,020 | | | 14,721,177 |
Ali Mortazavi Executive Vice President of Global Sales & Marketing | | | 2021 | | | 293,750 | | | 0 | | | 4,561,611 | | | 0 | | | 0 | | | 9,055 | | | 4,256,010 |
Deepak Navnith(6) Former Chief Operations Officer | | | 2021 | | | 206,346 | | | 0 | | | 3,319,281 | | | 0 | | | 0 | | | 1,045 | | | 3,155,572 |
Anthony P. Etnyre(7) Former Chief Executive Officer | | | 2021 | | | 433,266 | | | 0 | | | 0 | | | 0 | | | 0 | | | 11,600 | | | 444,866 |
| | 2020 | | | 336,369 | | | 188,622 | | | 5,374,000 | | | 0 | | | 0 | | | 11,577 | | | 5,910,568 |
| (1) | Amounts in this column reflect salary paid to the Named Executive Officers with respect to the relevant fiscal year. See the section entitled “Employment Agreements with Named Executive Officers” below for additional details. Each of Messrs. Hunkler, Mortazavi and Navnith first became a Named Executive Officer in respect of 2021. |
| (2) | Amounts in this column represent the aggregate grant date fair value, computed in accordance with FASB ASC Topic 718, of stock awards granted to the Named Executive Officers with respect to the relevant fiscal year. Grants of restricted stock units were valued at the fair value of our common stock on the date of grant. The fair value per share of our common stock prior to our initial public offering was established by our board of directors based on the methodology described in Note 12 of our consolidated financial statements for the years ended December 31, 2019 and 2020. Subsequent to our initial public offering, grants of restricted stock units are valued at the closing price of our common stock on the date of grant as reported on the Nasdaq stock exchange. |
| (3) | The options granted to Mr. Hunkler contain market conditions requiring that our common stock achieve a value of $30 per share for one-half of the options (“$30 hurdle price”) and $60 per share for the other half of the options (“$60 hurdle price”), both over an established period of time. In addition, the options provide for a 4-year vesting period to begin upon achievement of the market conditions. The options, which have an exercise price of $8.14 per share, have been valued using a Monte Carlo simulation assuming Geometric Brownian Motion (GBM) in a risk-neutral framework using 100,000 simulation paths. Each of the simulation paths involved estimates of: |
| • | a time to vest based on estimated achievement of each hurdle price; |
| • | a simulated stock price upon vesting; and |
| • | assumptions as to the payoff upon immediate exercise of in-the-money options, discounted to present value using 7 year term-matched risk free rates based on the time to vest in each simulation path. |
| (4) | Amounts in this column reflect (i) in the case of Mr. Hunkler, $1,000 in 401(k) plan matching contributions and $20 in insurance premiums to Insperity Life Insurance made on his behalf during the 2021 Fiscal Year, (ii) in the case of Mr. Mortazavi, $9,000 in 401(k) plan matching contributions and $55 in insurance premiums to Insperity Life Insurance made on his behalf during the 2021 Fiscal Year, (iii) in the case of Mr. Navnith, $1,000 in 401(k) plan matching contributions and $45 in insurance premiums to Insperity Life Insurance made on his behalf during the 2021 Fiscal Year and (iv) in the case of Mr. Etnyre, $11,600 in 401(k) plan matching contributions made on his behalf during the 2021 Fiscal Year. |
| (5) | Amount represents the portion of the sign-on bonus for Mr. Hunkler payable pursuant to his Employment Agreement in the 2021 Fiscal Year (see the section entitled “Employment Agreements with Named Executive Officers” below for additional details). |
| (6) | Mr. Navnith stepped down from his office as of January 23, 2022. He remains employed as a non-executive employee in order to assist with the transition of his duties for a period of up to 45 days. |
| (7) | Mr. Etnyre stepped down from his position as Chief Executive Officer as of September 21, 2021 and terminated employment with us after a transition period which ended on January 7, 2022. |
| | | Option Awards | | | Stock Awards | ||||||||||||||||||||||
Name | | | Number of Securities Underlying Unexercised Options (#) Exercisable | | | Number of Securities Underlying Unexercised Options (#) Unexercisable | | | Equity Incentive Plan Awards: Number of Securities Underlying Unexercised Unearned Options(1) (#) | | | Option Exercise Price ($) | | | Option Expiration Date | | | Number of Shares or Units of Stock That Have Not Vested (#)(2) | | | Market Value of Shares or Units of Stock That Have Not Vested ($)(3) | | | Equity Incentive Plan Awards: Number of Unearned Shares, Units or Other Rights That Have Not Vested (#) | | | Equity Incentive Plan Awards: Market or Payout Value of Unearned Shares, Units or Other Rights That Have Not Vested ($) |
Sean Hunkler | | | 0 | | | 0 | | | 1,053,750 | | | 8.14 | | | 9/23/2031 | | | 632,250 | | | 4,779,810 | | | 0 | | | 0 |
| | | | | | | 1,053,750 | | | 8.14 | | | 9/23/2031 | | | | | | | | | |||||||
Ali Mortazavi | | | 0 | | | 0 | | | 0 | | | N/A | | | N/A | | | 645,714 | | | 4,881,598 | | | 0 | | | 0 |
Deepak Navnith | | | 0 | | | 0 | | | 0 | | | N/A | | | N/A | | | 329,867 | | | 2,493,795 | | | 0 | | | 0 |
Anthony Etnyre | | | 0 | | | 0 | | | 0 | | | 0 | | | 0 | | | 0 | | | 0 | | | 0 | | | 0 |
| (1) | The options granted to Mr. Hunkler contain market conditions requiring that our common stock achieve a value of $30 per share for one-half of the options (“$30 hurdle price”) and $60 per share for the other half of the options (“$60 hurdle price”), both over an established period of time. In addition, the options provide for a 4-year vesting period to begin upon achievement of the market conditions. |
| (2) | The restricted stock unit awards made to our Named Executive Officers generally vest over a four-year vesting period, with one quarter of the award vesting on the first anniversary of the grant date and 1/48 of the award vesting each month thereafter on the anniversary until the end of the four-year vesting period, based on continued employment. This column indicates restricted stock units that had not vested as of December 31, 2021. |
| (3) | Based on the closing price of $7.56 per share of our common stock as of December 31, 2021. |
| • | $20,000 annual cash retainer for service as the committee chair of the audit committee; |
| • | $15,000 annual cash retainer for service as the committee chair of the compensation committee; and |
| • | $10,000 annual cash retainer for service as the committee chair of the nominating and corporate governance committee. |
Name | | | Fees Earned or Paid in Cash(1) ($) | | | Stock Awards(2) ($) | | | All Other Compensation(3) ($) | | | Total ($) |
Thurman J. (“T.J.”) Rodgers | | | 80,000 | | | 1,353,508 | | | 0 | | | 1,433,508 |
David Springer | | | 34,611 | | | 338,476 | | | 154,226 | | | 527,313 |
Ahmad Chatila | | | 50,000 | | | 258,144 | | | 25,886 | | | 334,030 |
William Aldeen (“Dean”) Priddy, Jr. | | | 70,000 | | | 822,417 | | | 32,324 | | | 924,741 |
Isidoro Quiroga Cortés | | | 50,000 | | | 1,353,508 | | | 0 | | | 1,403,508 |
Shaker Sadasivam | | | 65,000 | | | 1,353,508 | | | 8,478 | | | 1,426,986 |
Lisan Hung | | | 60,000 | | | 1,353,508 | | | 0 | | | 1,413,508 |
| (1) | Amounts represent cash retainer payments made with respect to services as a non-employee director in 2021. Mr. Springer ceased to be employed by us and continued in service on the board as a non-employee director on July 16, 2021. Accordingly, his cash fees have been prorated for the portion of 2021 during which he served solely on the board. |
| (2) | Includes grants of RSUs under the 2017 Plan to each of the independent directors prior to the IPO. The RSUs will vest in four equal installments on each anniversary of the date of grant subject to continued service by the director through each applicable vesting date. The RSUs listed above also include the RSUs granted under the director compensation program described above in fiscal 2021 under the 2021 Plan. Amounts represent the aggregate grant date fair value of the restricted stock unit awards made to the non-employee director during the 2021 Fiscal Year, computed in accordance with FASB ASC Topic 718. As of December 31, 2021, our directors held the following restricted stock unit awards in the aggregate: |
Name | | | RSUs (#) |
Thurman J. (“T.J.”) Rodgers | | | 166,838 |
David Springer | | | 33,119 |
Ahmad Chatila | | | 30,768 |
William Aldeen (“Dean”) Priddy, Jr. | | | 166,837 |
Isidoro Quiroga Cortés | | | 166,838 |
Shaker Sadasivam | | | 166,838 |
Lisan Hung | | | 166,838 |
| (3) | Amounts represent the incremental cost to the Company of providing health insurance benefits to certain directors. The column for Mr. Springer represents $148,593 paid to him during 2021 for his services as our employee and $5,633 for health benefits described above; the column for Mr. Chatila represents $17,408 paid to him as salary prior to the IPO and $8,478 for health benefits described above; the column for Mr. Priddy represents $23,846 paid to him as salary prior to the IPO and $8,478 for health benefits described above. . |
| • | each stockholder known by us to own beneficially more than 5% of our outstanding shares of common stock; |
| • | each of our directors and named executive officers individually; and |
| • | all of our directors and executive officers as a group. |
| | | Shares of Common Stock Beneficially Owned | ||||
Name of Beneficial Owner | | | Number | | | % |
5% Stockholders: | | | | | ||
ARC Family Trust(1) | | | 21,941,357 | | | 22.7% |
South Lake One LLC(2) | | | 14,652,750 | | | 15.1% |
Named Executive Officers and Directors: | | | | | ||
Sean Hunkler | | | 0 | | | *% |
Ali Mortazavi(3) | | | 209,258 | | | *% |
Deepak Navnith(4) | | | 82,466 | | | *% |
Anthony P. Etnyre(5) | | | 4,127,622 | | | 4.1% |
Thurman J. “T.J.” Rodgers(6) | | | 3,768,069 | | | 3.9% |
David Springer(7) | | | 7,563,375 | | | 7.5% |
Ahmad Chatila | | | 310,850 | | | *% |
William Aldeen (“Dean”) Priddy, Jr.(8) | | | 37,109 | | | *% |
Isidoro Quiroga Cortés | | | 683,880 | | | *% |
Shaker Sadasivam(9) | | | 24,415,358 | | | 24.1% |
Lisan Hung | | | 0 | | | *% |
All Executive Officers and Directors as a group (12 individuals) | | | 41,545,921 | | | 41.2% |
| * | Represents beneficial ownership of less than 1% |
| (1) | The ARC Family Trust was established by Mr. Chatila for the benefit of certain members of his family. Mr. Sadasivam is the trustee of the ARC Family Trust and has sole voting and dispositive power with respect to these shares. The address of this shareholder is 20 Montchanin Road, Suite 100, Greenville, DE 19807. |
| (2) | Isidoro Quiroga Cortés, María Victoria Quiroga Moreno, Martín Guiloff Salvador and Felipe Correa González, in their capacity as members of the board of directors, may be deemed to have voting and dispositive power (acting jointly Isidoro Quiroga Cortés or María Victoria Quiroga Moreno with any of Martín Guiloff Salvador and Felipe Correa González) with respect to all shares held by South Lake One LLC. The principal business address for South Lake One LLC is shareholder is 5711 Pdte. Riesco, Office No. 1603, Las Condes, Santiago, Chile. |
| (3) | Consists of 21,118 shares of common stock held by Mr. Mortazavi and (ii) 188,140 shares of common stock to be issued from the settlement of restricted stock units that have vested held by Mr. Mortazavi. |
| (4) | Consists of 82,466 shares of common stock to be issued from the settlement of restricted stock units that have vested held by Mr. Navnith. |
| (5) | Consists of (i) 3,228,288 shares of common stock held by Mr. Etnyre, (ii) 899,334 shares of common stock to be issued from the settlement of restricted stock units that have vested held by Mr. Etnyre and (iii) 1,372,040 shares of common stock held by the Tony Etnyre 2021 GRAT. With respect to the Tony Etnyre 2021 GRAT, Mr. Etnyre (a) is the sole trustee, (b) has sole voting and dispositive power with respect to the shares held by the trust, and (c) has sole power to acquire for himself any asset held in the trust, including the shares, by substituting other property of equivalent value. With respect to the Etnyre 2021 Family Trust, Mr. Etnyre’s spouse, Brooke Murray-Etnyre, has sole power to acquire for herself any asset held in the trust, including the shares, by substituting other property of equivalent value. Mr. Etnyre disclaims beneficial ownership over the shares held by the Etnyre 2021 Family Trust. |
| (6) | Consists of 3,768,069 shares of common stock held by the Rodgers Massey Revocable Living Trust dated April 4, 2011 (the “Rodgers Trust”). Mr. Rodgers is the trustee of the Rodgers Trust and has sole voting and dispositive power with respect to these shares. The address of this shareholder is 575 Eastview Way Woodside, CA 94062. |
| (7) | Consists of (i) 7,596,494 shares of common stock held by Mr. Springer, (ii) 2,474,001 shares of common stock held by the DS 2021 GRAT, (iii) 329,867 shares of common stock held by the KC 2021 Trust, (iv) 247,400 shares held by the JT 2021 Trust, (v) 247,400 shares held by the SF 2021 Trust and (vi) 32,987 shares of common stock held by the KNS 2021 Trust. With respect to the DS 2021 GRAT, Mr. Springer (a) is the sole trustee, (b) has sole voting and dispositive power with respect to the shares held by the trust and (c) has sole power to acquire for himself any asset held in the trust, including the shares, by substituting other property of equivalent value. With respect to the KC 2021 Trust, the JT 2021 Trust, the SF 2021 Trust and the KNS 2021 Trust, Mr. Springer has sole power to acquire for himself any asset held in the trust, including the shares, by substituting other property of equivalent value. |
| (8) | Consists of 37,109 shares of common stock to be issued from the settlement of restricted stock units that have vested held by Mr. Priddy. |
| (9) | Consists of (i) 2,474,001 shares of common stock held by ChristSivam, LLC, (ii) 543,093 shares of common stock to be issued from the settlement of restricted stock units that have vested and are held by ChristSivam, LLC and (iii) 21,941,357 shares of common stock held by the ARC Family Trust for the benefit of certain members of Mr. Chatila’s family. Mr. Sadasivam is the Manager of ChristSivam, LLC and has sole voting and dispositive power with respect to the shares held by ChristSivam, LLC. See also above footnote (1) for further information about ARC Family Trust. The address of this shareholder is 1950 Pine Run Drive, Chesterfield, MO 63108. |
| | | Beneficial Ownership of Common Shares Prior to this Offering | | | | | Beneficial Ownership of Common Shares after this Offering | ||||||||
Selling Stockholder | | | Number of Shares | | | Percent of Class | | | Number of Shares to be Sold Under this Prospectus | | | Number of Shares | | | Percent of Class |
ARC Family Trust(1) | | | 21,941,357 | | | 22.7% | | | 21,941,357 | | | 0 | | | 0% |
South Lake One LLC(2) | | | 14,652,750 | | | 15.1% | | | 14,652,750 | | | 0 | | | 0% |
Isidoro Quiroga Cortés(3) | | | 683,880 | | | 0.7% | | | 683,880 | | | 0 | | | 0% |
| (1) | The business address of this stockholder is 20 Montchanin Road, Suite 100, Greenville, DE 19807. |
| (2) | The principal business address of this stockholder is 5711 Pdte. Riesco, Office No. 1603, Las Condes, Santiago, Chile. |
| (3) | The principal business address of this stockholder is 5711 Pdte. Riesco, Office No. 1603, Las Condes, Santiago, Chile. |
| • | we have been or are to be a participant; |
| • | the amount involved exceeds $120,000; and |
| • | any of our directors, officers or holders of more than 5% of our outstanding capital stock, or any immediate family member of, or person sharing the household with, any of these individuals or entities, had or will have a direct or indirect material interest. |
| | | Number of shares of common stock purchased | | | Aggregate Purchase Price | |
Nagendra Cherukupalli | | | 281,575 | | | $3,422,544 |
Ali Mortazavi | | | 21,118 | | | 256,689 |
Jay B. Grover | | | 78,841 | | | 958,312 |
Kristian Nolde | | | 21,400 | | | 260,117 |
David Springer | | | 473,046 | | | 5,749,874 |
Isidoro Quiroga Cortés(1) | | | 140,787 | | | 1,711,266 |
ARC Family Trust(2) | | | 563,150 | | | 6,845,088 |
South Lake One LLC(1) | | | 619,465 | | | 7,529,597 |
Catherine L. Springer | | | 335,275 | | | 4,075,268 |
ChristSivam, LLC(3) | | | 281,574 | | | 3,422,532 |
Total | | | 2,816,231 | | | $34,231,287 |
| (1) | South Lake One LLC is an entity affiliated with our director Isidoro Quiroga Cortés. |
| (2) | ARC Family Trust is an entity affiliated with our director Shaker Sadasivam and family members of our director Ahmad Chatila are beneficiaries of the ARC Family Trust. |
| (3) | ChristSivam, LLC is an entity affiliated with our director Shaker Sadasivam. |
| • | 850,000,000 shares of common stock, par value $0,0001 per share; and |
| • | 10,000,000 shares of preferred stock, par value $0.0001 per share. |
| • | the designation of the series; |
| • | the number of shares of the series, which our board of directors may, except where otherwise provided in the preferred stock designation, increase (but not above the total number of authorized shares of the class) or decrease (but not below the number of shares then outstanding); |
| • | whether dividends, if any, will be cumulative or non-cumulative and the dividend rate of the series; |
| • | the dates at which dividends, if any, will be payable; |
| • | the redemption or repurchase rights and price or prices, if any, for shares of the series; |
| • | the terms and amounts of any sinking fund provided for the purchase or redemption of shares of the series; |
| • | the amounts payable on shares of the series in the event of any voluntary or involuntary liquidation, dissolution or winding-up of our affairs; |
| • | whether the shares of the series will be convertible into shares of any other class or series, or any other security, of us or any other entity, and, if so, the specification of the other class or series or other security, the conversion price or prices or rate or rates, any rate adjustments, the date or dates as of which the shares will be convertible and all other terms and conditions upon which the conversion may be made; |
| • | restrictions on the issuance of shares of the same series or of any other class or series; and |
| • | the voting rights, if any, of the holders of the series. |
| • | a stockholder who owns 15% or more of our outstanding voting stock (otherwise known as an “interested stockholder”); |
| • | an affiliate of an interested stockholder; or |
| • | an associate of an interested stockholder for a period of three years following the date that the stockholder became an interested stockholder. |
| • | our board of directors approves the transaction that made the stockholder an “interested stockholder” prior to the date of the transaction; |
| • | after the completion of the transaction that resulted in the stockholder becoming an interested stockholder, that stockholder owned at least 85% of our voting stock outstanding at the time the transaction commenced, other than statutorily excluded shares of common stock; or |
| • | on or subsequent to the date of the transaction, the business combination is approved by our board of directors and authorized at a meeting of our stockholders, and not by written consent, by an affirmative vote of at least two-thirds of the outstanding voting stock not owned by the interested stockholder. |
| • | 1% of the number of shares of our common stock then outstanding; and |
| • | the average weekly trading volume of our common stock on Nasdaq during the four calendar weeks preceding the filing of a notice on Form 144 with respect to that sale. |
| • | On Nasdaq or any other national common stock exchange or automated quotation system on which our common stock is traded, which may involve transactions solely between a broker-dealer and its customers which are not traded across an open market and block trades. |
| • | Through one or more dealers or agents (which may include one or more underwriters). |
| • | Block trades in which the broker or dealer as principal and resale by such broker or dealer for its account pursuant to this prospectus. |
| • | Purchases by a broker or dealer as principal and resale by such broker or dealer for its account pursuant to this prospectus. |
| • | Ordinary brokerage transactions (including pursuant to 10b5-1 plans). |
| • | Transactions in which the broker solicits purchasers. |
| • | Directly to one or more purchasers. |
| • | A combination of these methods. |
| | | Pages | |
| | | ||
| | | ||
| | | ||
| | | ||
| | | ||
| | | ||
| | |
| | | ||
| | | ||
| | | ||
| | | ||
| | |
| | | As of December 31, | ||||
| | | 2019 | | | 2020 | |
ASSETS | | | | | ||
Current assets | | | | | ||
Cash | | | $ 7,221 | | | $ 32,359 |
Restricted cash | | | 1,014 | | | 1,014 |
Accounts receivable, net | | | 14,048 | | | 23,734 |
Inventories | | | 4,505 | | | 1,686 |
Prepaid and other current assets | | | 3,848 | | | 6,924 |
Total current assets | | | 30,636 | | | 65,717 |
Intangible assets, net | | | 33 | | | 0 |
Investments in unconsolidated subsidiary | | | 2,582 | | | 1,857 |
Other assets | | | 579 | | | 3,819 |
Total assets | | | $ 33,830 | | | $ 71,393 |
| | | | | |||
LIABILITIES AND STOCKHOLDERS’ EQUITY (DEFICIT) | | | | | ||
Current liabilities | | | | | ||
Accounts payable | | | $ 8,191 | | | $ 17,127 |
Line of credit | | | 0 | | | 1,000 |
Accrued expenses and other liabilities | | | 5,375 | | | 18,495 |
Accrued interest – related party | | | 285 | | | 207 |
Deferred revenue | | | 19,873 | | | 22,980 |
Total current liabilities | | | 33,724 | | | 59,809 |
Long-term debt and other borrowings | | | 1,976 | | | 784 |
Long-term debt – related party | | | 5,857 | | | 0 |
Other non-current liabilities | | | 715 | | | 3,349 |
Deferred income taxes | | | 3 | | | 0 |
Total liabilities | | | 42,275 | | | 63,942 |
Commitments and contingencies (Note 9) | | | 0 | | | 0 |
Stockholders’ equity (deficit) | | | | | ||
Common stock par value of $0.0001 per share, 98,960,064 shares authorized at December 31, 2020 and 2019; 66,155,340 and 63,633,981 shares issued and outstanding as of December 31, 2020 and 2019, respectively | | | 1 | | | 1 |
Treasury stock, at cost (9,896,666 and 0 shares as of December 31, 2020 and 2019, respectively) | | | 0 | | | 0 |
Additional paid-in capital | | | 18,273 | | | 50,096 |
Accumulated other comprehensive loss | | | 0 | | | (3) |
Accumulated deficit | | | (26,719) | | | (42,643) |
Total stockholders’ equity (deficit) | | | (8,445) | | | 7,451 |
Total liabilities and stockholders’ equity (deficit) | | | $ 33,830 | | | $ 71,393 |
| | | Years Ended December 31, | ||||
| | | 2019 | | | 2020 | |
Revenue: | | | | | ||
Product | | | $43,085 | | | $158,925 |
Service | | | 10,039 | | | 28,427 |
Total revenue | | | 53,124 | | | 187,352 |
Cost of revenue: | | | | | ||
Product | | | 44,212 | | | 155,967 |
Service | | | 10,863 | | | 27,746 |
Total cost of revenue | | | 55,075 | | | 183,713 |
Gross profit (loss) | | | (1,951) | | | 3,639 |
Operating expenses | | | | | ||
Research and development | | | 3,960 | | | 5,222 |
Selling and marketing | | | 1,897 | | | 3,545 |
General and administrative | | | 4,563 | | | 11,798 |
| | | 10,420 | | | 20,565 | |
Loss from operations | | | (12,371) | | | (16,926) |
Interest expense, net | | | 454 | | | 480 |
Loss before income taxes | | | (12,825) | | | (17,406) |
(Benefit from) income taxes | | | (39) | | | (83) |
(Income) Loss from unconsolidated subsidiary | | | 709 | | | (1,399) |
Net loss | | | $(13,495) | | | $(15,924) |
Net loss per share | | | | | ||
Basic and diluted | | | $(0.22) | | | $(0.23) |
Weighted-average common shares outstanding | | | | | ||
Basic and diluted | | | 62,043,383 | | | 68,810,533 |
| | | Common Stock | | | Treasury Stock | | | | | | | | | |||||||||||
| | | Shares | | | Amount | | | Shares | | | Amount | | | Additional Paid-In Capital | | | Accumulated Other Comprehensive Loss | | | Accumulated Deficit | | | Total Stockholders’ Equity (Deficit) | |
Balance as of December 31, 2018 | | | 56,146,407 | | | $1 | | | 0 | | | $0 | | | $11,367 | | | $0 | | | $(13,224) | | | $(1,856) |
Restricted stock awards vested during the period | | | 3,822,019 | | | — | | | — | | | — | | | — | | | — | | | — | | | — |
Issuance of common stock | | | 3,665,555 | | | — | | | — | | | — | | | 6,000 | | | — | | | — | | | 6,000 |
Stock-based compensation | | | — | | | — | | | — | | | — | | | 906 | | | — | | | — | | | 906 |
Net loss | | | — | | | — | | | — | | | — | | | — | | | — | | | (13,495) | | | (13,495) |
Balance as of December 31, 2019 | | | 63,633,981 | | | $1 | | | 0 | | | $0 | | | $18,273 | | | $0 | | | $(26,719) | | | $(8,445) |
Restricted stock awards vested during the period | | | 3,255,049 | | | — | | | — | | | — | | | — | | | — | | | — | | | — |
Issuance of common stock | | | 9,162,976 | | | — | | | — | | | — | | | 30,000 | | | — | | | — | | | 30,000 |
Repurchase of common stock, held in treasury | | | (9,896,666) | | | — | | | 9,896,666 | | | — | | | — | | | — | | | — | | | — |
Stock-based compensation | | | — | | | — | | | — | | | — | | | 1,823 | | | — | | | — | | | 1,823 |
Net loss | | | — | | | — | | | — | | | — | | | — | | | — | | | (15,924) | | | (15,924) |
Other comprehensive loss | | | — | | | — | | | — | | | — | | | — | | | (3) | | | — | | | (3) |
Balance at December 31, 2020 | | | 66,155,340 | | | $1 | | | 9,896,666 | | | $0 | | | $50,096 | | | $(3) | | | $(42,643) | | | $7,451 |
| | | Years Ended December 31, | ||||
| | | 2019 | | | 2020 | |
Cash flows from operating activities | | | | | ||
Net loss | | | $(13,495) | | | $(15,924) |
Adjustments to reconcile net loss to cash (used in) provided by operating activities: | | | | | ||
Stock-based compensation | | | 906 | | | 1,818 |
Depreciation and amortization | | | 412 | | | 47 |
(Income)/Loss from unconsolidated subsidiary, net of distributions received | | | 709 | | | (1,399) |
Loss on debt extinguishment | | | 0 | | | 116 |
Warranty provision | | | 2,057 | | | 7,866 |
Warranty recoverable from manufacturers | | | (284) | | | (1,021) |
Bad debt expense | | | 444 | | | 24 |
Deferred income taxes | | | (3) | | | (3) |
Other non-cash items | | | 89 | | | 50 |
Changes in operating assets and liabilities: | | | | | ||
Accounts receivable, net | | | (13,838) | | | (9,710) |
Inventories | | | (4,505) | | | 2,819 |
Prepaid and other current assets | | | (3,154) | | | (2,847) |
Other assets | | | (156) | | | (1,672) |
Accounts payable | | | 7,781 | | | 8,936 |
Accruals and other current liabilities | | | 3,389 | | | 7,162 |
Accrued interest – related party debt | | | (289) | | | (78) |
Deferred revenue | | | 19,683 | | | 3,107 |
Other non-current liabilities | | | 1 | | | 496 |
Other, net | | | (1) | | | (298) |
Net cash used in operating activities | | | (254) | | | (511) |
Cash flows from investing activities: | | | | | ||
Purchases of property and equipment | | | (18) | | | (256) |
Distributions received from unconsolidated subsidiary, return of investment | | | 0 | | | 2,124 |
Net cash provided by (used in) investing activities: | | | (18) | | | 1,868 |
Cash flows from financing activities: | | | | | ||
Proceeds from borrowings | | | 1,000 | | | 784 |
Repayments of borrowings | | | 0 | | | (7,000) |
Proceeds from stock issuance | | | 6,000 | | | 30,000 |
Net cash provided by financing activities | | | 7,000 | | | 23,784 |
Effect of exchange rate changes on cash and restricted cash | | | 0 | | | (3) |
Net increase in cash and restricted cash | | | 6,728 | | | 25,138 |
Cash and restricted cash at beginning of period | | | 1,507 | | | 8,235 |
Cash and restricted cash at end of period | | | $8,235 | | | $33,373 |
Supplemental disclosures of cash flow information: | | | | | ||
Cash paid during the year for interest | | | $708 | | | $350 |
Cash paid during the year for income taxes | | | $0 | | | $0 |
Reconciliation of cash and restricted cash at period end | | | | | ||
Cash | | | 7,221 | | | 32,359 |
Restricted cash | | | 1,014 | | | 1,014 |
Total cash and restricted cash | | | $8,235 | | | $33,373 |
| • | Level 1: Quoted (unadjusted) prices in active markets for identical assets or liabilities. |
| • | Level 2: Observable inputs other than quoted prices included in Level 1, such as quoted prices for similar assets or liabilities in active markets; quoted prices for identical or similar assets or liabilities in markets that are not active; or other inputs that are observable or can be corroborated by observable market data for substantially the full term of the asset or liability. |
| • | Level 3: Unobservable inputs that are supported by little or no market activity and that are significant to the fair value of the assets or liabilities. |
| | | As of December 31, | ||||
| | | 2019 | | | 2020 | |
Accrued cost of revenue | | | $2,106 | | | $ 7,812 |
Accrued expenses | | | 1,644 | | | 2,856 |
Warranty reserves | | | 1,368 | | | 3,985 |
Accrued compensation | | | 177 | | | 2,869 |
Accrued interest expense | | | 47 | | | 28 |
Other | | | 33 | | | 945 |
Total | | | $5,375 | | | $18,495 |
| | | As of December 31, | ||||
| | | 2019 | | | 2020 | |
Vendor deposits | | | $1,738 | | | $4,205 |
Prepaid expenses | | | 209 | | | 1,043 |
Deferred cost of revenue | | | 19 | | | 992 |
Surety collateral* | | | 1,835 | | | 113 |
Other current assets | | | 47 | | | 571 |
| | | $3,848 | | | $6,924 | |
| * | Surety collateral represents amounts held in deposit to secure performance bonds, which is expected to be ultimately received back in cash when settled. |
| | | As of December 31, | ||||
| | | 2019 | | | 2020 | |
Dimension Energy LLC | | | | | ||
Carrying value | | | $2,582 | | | $1,857 |
Ownership percentage | | | 23.7% | | | 23.6% |
| | | As of December 31, | ||||
| | | 2019 | | | 2020 | |
Current assets | | | $4,466 | | | $10,162 |
Non-current assets | | | 13,123 | | | 9,045 |
Current liabilities | | | 3,219 | | | 12,350 |
Non-current liabilities | | | 14,344 | | | 9,723 |
Members’ equity (deficit) | | | 25 | | | (2,866) |
| | | Years Ended December 31 | ||||
| | | 2019 | | | 2020 | |
Revenue | | | $0 | | | $22,570 |
Gross profit | | | 0 | | | 17,360 |
Income (loss) from operations | | | (3,413) | | | 9,185 |
Net income (loss) | | | (2,987) | | | 5,933 |
Share of earnings from equity method investment | | | (709) | | | 1,399 |
| | | | | As of December 31, | |||||
| | | Estimated Useful Lives (Years) | | | 2019 | | | 2020 | |
Developed technology | | | 3 | | | 1,200 | | | 1,200 |
Total intangible assets | | | | | 1,200 | | | 1,200 | |
Less: accumulated amortization | | | | | 1,167 | | | 1,200 | |
Total intangible assets, net | | | | | $ 33 | | | $ 0 | |
| | | Years Ended December 31, | ||||
| | | 2019 | | | 2020 | |
Balance at beginning of period | | | $ 0 | | | $ 2,057 |
Warranties issued during the period | | | 2,057 | | | 7,866 |
Settlements made during the period | | | 0 | | | (3,111) |
Changes in liability for pre-existing warranties | | | 0 | | | (1) |
Balance at end of period | | | $2,057 | | | $ 6,811 |
| | | As of December 31, | ||||
Reported as: | | | 2019 | | | 2020 |
Assets: | | | | | ||
Operating lease right of use assets (included in Other assets) | | | $43 | | | $571 |
Liabilities: | | | | | ||
Operating lease liabilities, current portion (included in Accrued expenses and other current liabilities) | | | $11 | | | $242 |
Operating lease liabilities, non-current (included in Other non-current liabilities) | | | 27 | | | 355 |
Total operating lease liabilities | | | $38 | | | $597 |
| | | As of December 31, | ||||
| | | 2019 | | | 2020 | |
Cash payments for operating leases | | | $38 | | | $140 |
New operating lease assets obtained in exchange for operating lease liabilities | | | $42 | | | $672 |
2021 | | | $266 |
2022 | | | 241 |
2023 | | | 128 |
Total future lease payments | | | $635 |
Less imputed interest | | | (38) |
Total lease liability | | | $597 |
| | | Options Outstanding | | | | | ||||||
| | | Number of Shares | | | Weighted Average Exercise Price | | | Weighted- Average Remaining Contractual Term (in years) | | | Aggregate Intrinsic Value (in thousands) | |
Outstanding - December 31, 2019 | | | 8,081,739 | | | $0.22 | | | | | ||
Granted during the year | | | 525,725 | | | 0.48 | | | | | ||
Exercised or released | | | 0 | | | 0 | | | | | ||
Cancelled or forfeited | | | 82,467 | | | 0.07 | | | | | ||
Expired | | | 0 | | | 0 | | | | | ||
Balances - December 31, 2020 | | | 8,524,997 | | | $0.23 | | | 7.51 | | | $25,785 |
Vested and expected to vest - December 31, 2020 | | | 8,524,997 | | | $0.23 | | | 7.51 | | | $25,785 |
Exercisable - December 31, 2020 | | | 5,379,164 | | | $0.16 | | | 7.11 | | | $16,693 |
| | | Unvested Restricted Stock Units | | | Unvested Restricted Stock Awards | |||||||
| | | Number of Shares | | | Weighted- Average Intrinsic Value | | | Number of Shares | | | Weighted- Average Grant Date Fair Value | |
Unvested as of December 31, 2019 | | | 824,667 | | | $1.64 | | | 4,424,652 | | | $0.07 |
Granted | | | 12,201,611 | | | 3.26 | | | 0 | | | 0 |
Vested | | | 0 | | | 0 | | | 3,255,052 | | | 0.07 |
Forfeited or canceled | | | 82,467 | | | 3.26 | | | 0 | | | 0 |
Unvested as of December 31, 2020 | | | 12,943,811 | | | $ 3.16 | | | 1,169,600 | | | $0.07 |
| | | Years Ended December 31, | ||||
| | | 2019 | | | 2020 | |
Cost of revenue | | | $176 | | | 322 |
General and administrative | | | 653 | | | 1,401 |
Research and development | | | 51 | | | 57 |
Selling and marketing | | | 26 | | | 38 |
Total stock-based compensation expense | | | $906 | | | 1,818 |
| | | Years Ended December 31, | ||||
| | | 2019 | | | 2020 | |
Expected term (years) | | | 5.66–6.09 | | | 5.99–6.17 |
Expected volatility | | | 52.01%—54.10% | | | 51.52%—51.58% |
Risk-free interest rate | | | 1.63%—2.3% | | | 1.60%—1.61% |
Expected dividends | | | 0 | | | 0 |
Grant date fair value per option | | | $1.27—$1.30 | | | $2.85—$2.86 |
| | | Years Ended December 31, | ||||
| | | 2019 | | | 2020 | |
Basic and diluted: | | | | | ||
Net loss | | | $(13,495) | | | $(15,924) |
Weighted-average number of common shares outstanding | | | 62,043 | | | 68,811 |
Basic and diluted loss per share | | | $(0.22) | | | $(0.23) |
| | | As of December 31, | ||||
| | | 2019 | | | 2020 | |
Shares of common stock issuable under stock option plans outstanding | | | 8,082 | | | 8,525 |
Shares of common stock issuable upon vesting of restricted stock awards | | | 5,249 | | | 14,122 |
Potential common shares excluded from diluted net loss per share | | | 13,331 | | | 22,647 |
| | | Years Ended December 31, | ||||
| | | 2019 | | | 2020 | |
U.S. | | | $(13,534) | | | $(16,269) |
Foreign | | | 0 | | | 262 |
Total loss before income taxes | | | $(13,534) | | | $(16,007) |
| | | Years Ended December 31, | ||||
| | | 2019 | | | 2020 | |
Current | | | | | ||
Federal | | | $0 | | | $(159) |
State | | | (37) | | | 1 |
Foreign | | | 0 | | | 78 |
Deferred | | | | | ||
Federal | | | (2) | | | (3) |
State | | | 0 | | | 0 |
Total income tax expense/(benefit) | | | $(39) | | | $(83) |
| | | Years Ended December 31, | ||||
| | | 2019 | | | 2020 | |
Income tax expense (benefit) derived by applying the federal statutory tax rate to income (loss) before income taxes | | | $(2,842) | | | $(3,362) |
State taxes, net of federal | | | (551) | | | (215) |
Research and experimentation tax credit | | | (118) | | | (179) |
Valuation allowance | | | 3,184 | | | 3,523 |
Stock compensation | | | 225 | | | 406 |
Dividends received deduction | | | 0 | | | (308) |
Permanent differences and other | | | 63 | | | 52 |
| | | $(39) | | | $(83) | |
| | | As of December 31, | ||||
| | | 2019 | | | 2020 | |
Deferred tax assets: | | | | | ||
Fixed assets and intangibles | | | $156 | | | $135 |
Leases | | | 0 | | | 106 |
Accrued expenses | | | 333 | | | 2,066 |
Net operating loss carryforward | | | 4,626 | | | 6,679 |
Capital loss carryforward | | | 501 | | | 0 |
Investment difference | | | 0 | | | 148 |
R&D credit carryforward | | | 181 | | | 325 |
Subtotal | | | 5,797 | | | 9,459 |
Less valuation allowance | | | (5,774) | | | (9,297) |
Total deferred tax asset | | | 23 | | | 162 |
Deferred tax (liabilities): | | | | | ||
Investment difference | | | (15) | | | 0 |
Leases | | | 0 | | | (101) |
Prepaid expenses | | | (11) | | | (61) |
Total deferred tax (liability) | | | (26) | | | (162) |
Net deferred tax asset (liability) | | | $(3) | | | $0 |
| | | Years Ended December 31, | ||||
| | | 2019 | | | 2020 | |
Balance, beginning of the year | | | $22 | | | $45 |
Increase for tax positions related to the current year | | | 23 | | | 36 |
Decrease for tax positions related to prior years | | | 0 | | | 0 |
Balance, end of year | | | $45 | | | $81 |
| | | Years Ended December 31, | ||||
| | | 2019 | | | 2020 | |
United States | | | $45,264 | | | $187,093 |
Vietnam | | | 7,149 | | | 38 |
Other | | | 711 | | | 221 |
Total net revenue | | | $53,124 | | | $187,352 |
| | | December 31, 2020 | | | September 30, 2021 | |
ASSETS | | | | | ||
Current assets | | | | | ||
Cash | | | $ 32,359 | | | $ 140,662 |
Restricted cash | | | 1,014 | | | 0 |
Accounts receivable, net | | | 23,734 | | | 53,668 |
Inventories | | | 1,686 | | | 11,276 |
Prepaid and other current assets | | | 6,924 | | | 23,558 |
Total current assets | | | 65,717 | | | 229,164 |
Investments in unconsolidated subsidiary | | | 1,857 | | | 0 |
Other assets | | | 3,819 | | | 6,265 |
Total assets | | | $ 71,393 | | | $ 235,429 |
LIABILITIES AND STOCKHOLDERS' EQUITY | | | | | ||
Current liabilities | | | | | ||
Accounts payable | | | $ 17,127 | | | $ 16,556 |
Line of credit | | | 1,000 | | | 0 |
Accrued expenses and other liabilities | | | 18,495 | | | 40,246 |
Accrued interest - related party | | | 207 | | | 0 |
Deferred revenue | | | 22,980 | | | 9,606 |
Total current liabilities | | | 59,809 | | | 66,408 |
Long-term debt and other borrowings | | | 784 | | | 0 |
Other non-current liabilities | | | 3,349 | | | 5,662 |
Total liabilities | | | 63,942 | | | 72,070 |
Commitments and contingencies (Note 9) | | | 0 | | | 0 |
Stockholders’ equity | | | | | ||
Preferred stock par value of $0.0001 per share, 10,000,000 shares authorized; NaN issued as of December 31, 2020 and September 30, 2021 | | | 0 | | | 0 |
Common stock par value of $0.0001 per share, 850,000,000 shares authorized; 66,155,340 and 84,944,145 shares issued and outstanding as of December 31, 2020 and September 30, 2021 | | | 1 | | | 8 |
Treasury stock, at cost; 9,896,666 and 10,762,566 shares as of December 31, 2020 and September 30, 2021 | | | 0 | | | 0 |
Additional paid-in capital | | | 50,096 | | | 288,696 |
Accumulated other comprehensive income (loss) | | | (3) | | | 6 |
Accumulated deficit | | | (42,643) | | | (125,351) |
Total stockholders' equity | | | 7,451 | | | 163,359 |
Total liabilities and stockholders' equity | | | $ 71,393 | | | $ 235,429 |
| | | Three Months Ended September 30, | | | Nine Months Ended September 30, | |||||||
| | | 2020 | | | 2021 | | | 2020 | | | 2021 | |
Revenue: | | | | | | | | | ||||
Product | | | $ 48,879 | | | $ 45,582 | | | $ 122,197 | | | $ 137,799 |
Service | | | 10,761 | | | 7,407 | | | 20,976 | | | 31,005 |
Total revenue | | | 59,640 | | | 52,989 | | | 143,173 | | | 168,804 |
Cost of revenue: | | | | | | | | | ||||
Product | | | 46,513 | | | 48,090 | | | 114,883 | | | 146,964 |
Service | | | 10,261 | | | 12,938 | | | 19,826 | | | 45,810 |
Total cost of revenue | | | 56,774 | | | 61,028 | | | 134,709 | | | 192,774 |
Gross profit (loss) | | | 2,866 | | | (8,039) | | | 8,464 | | | (23,970) |
Operating expenses | | | | | | | | | ||||
Research and development | | | 1,438 | | | 2,116 | | | 4,047 | | | 9,653 |
Selling and marketing | | | 1,041 | | | 2,224 | | | 2,374 | | | 6,421 |
General and administrative (Note 10) | | | 2,912 | | | 10,392 | | | 7,630 | | | 63,217 |
Total operating expenses | | | 5,391 | | | 14,732 | | | 14,051 | | | 79,291 |
Loss from operations | | | (2,525) | | | (22,771) | | | (5,587) | | | (103,261) |
Interest expense | | | (70) | | | (301) | | | (303) | | | (515) |
Gain from disposal in equity investment | | | 0 | | | 210 | | | 0 | | | 20,829 |
Gain (loss) on extinguishment of debt | | | (34) | | | 0 | | | (75) | | | 790 |
Other expense | | | (1) | �� | | (13) | | | (1) | | | (59) |
Loss before income taxes | | | (2,630) | | | (22,875) | | | (5,966) | | | (82,216) |
(Expense) benefit from income taxes | | | (24) | | | (41) | | | 115 | | | (137) |
Loss from unconsolidated subsidiary | | | (186) | | | (400) | | | (345) | | | (354) |
Net loss | | | $ (2,840) | | | $ (22,916) | | | $ (6,196) | | | $ (82,707) |
Other comprehensive income (loss): | | | | | | | | | ||||
Foreign currency translation adjustments | | | (12) | | | 3 | | | (20) | | | 9 |
Comprehensive loss | | | $ (2,852) | | | $ (22,913) | | | $ (6,216) | | | $ (82,698) |
Net loss per share: | | | | | | | | | ||||
Basic | | | $ (0.04) | | | $ (0.24) | | | $ (0.09) | | | $ (1.00) |
Diluted | | | $ (0.04) | | | $ (0.24) | | | $ (0.09) | | | $ (1.00) |
Weighted-average common shares outstanding: | | | | | | | | | ||||
Basic | | | 67,567,724 | | | 94,596,519 | | | 69,857,468 | | | 82,677,824 |
Diluted | | | 67,567,724 | | | 94,596,519 | | | 69,857,468 | | | 82,677,824 |
| | | Preferred Stock | | | Common Stock | | | Treasury Stock | | | Additional Paid-In Capital | | | Accumulated Other Comprehensive Income (Loss) | | | Accumulated Deficit | | | Total Stockholders' Equity | ||||||||||
| | | Shares | | | Amount | | | Shares | | | Amount | | | Shares | | | Amount | | ||||||||||||
Balance as of December 31, 2019 | | | 0 | | | $0 | | | 63,633,981 | | | $ 1 | | | 0 | | | $0 | | | $18,273 | | | $ 0 | | | $(26,719) | | | $ (8,445) |
Restricted stock awards vested during the period | | | — | | | — | | | 2,014,091 | | | — | | | — | | | — | | | — | | | — | | | — | | | — |
Issuance of common stock | | | — | | | — | | | 9,162,976 | | | — | | | — | | | — | | | 30,000 | | | — | | | — | | | 30,000 |
Stock-based compensation | | | — | | | — | | | — | | | — | | | — | | | — | | | 933 | | | — | | | — | | | 933 |
Net loss | | | — | | | — | | | — | | | — | | | — | | | — | | | — | | | — | | | (3,356) | | | (3,356) |
Other comprehensive loss | | | — | | | — | | | — | | | — | | | — | | | — | | | — | | | (8) | | | — | | | (8) |
Balance as of June 30, 2020 | | | 0 | | | $0 | | | 74,811,048 | | | $ 1 | | | 0 | | | $0 | | | $49,206 | | | $ (8) | | | $(30,075) | | | $19,124 |
Restricted stock awards vested during the period | | | — | | | — | | | 594,712 | | | — | | | — | | | — | | | — | | | — | | | — | | | — |
Repurchase of common stock, held in treasury | | | — | | | — | | | (9,896,666) | | | — | | | 9,896,666 | | | — | | | — | | | — | | | — | | | — |
Stock-based compensation | | | — | | | — | | | — | | | — | | | — | | | — | | | 448 | | | — | | | — | | | 448 |
Net loss | | | — | | | — | | | — | | | — | | | — | | | — | | | — | | | — | | | (2,840) | | | (2,840) |
Other comprehensive loss | | | — | | | — | | | — | | | — | | | — | | | — | | | — | | | (12) | | | — | | | (12) |
Balance as of September 30, 2020 | | | 0 | | | $0 | | | 65,509,094 | | | $ 1 | | | 9,896,666 | | | $0 | | | $49,654 | | | $(20) | | | $(32,915) | | | $16,720 |
| | | Preferred Stock | | | Common Stock | | | Treasury Stock | | | Additional Paid-In Capital | | | Accumulated Other Comprehensive Income (Loss) | | | Accumulated Deficit | | | Total Stockholders' Equity | ||||||||||
| | | Shares | | | Amount | | | Shares | | | Amount | | | Shares | | | Amount | | ||||||||||||
Balance as of December 31, 2020 | | | 0 | | | $0 | | | 66,155,340 | | | $ 1 | | | 9,896,666 | | | $0 | | | $ 50,096 | | | $ (3) | | | $ (42,643) | | | $ 7,451 |
Restricted stock awards vested during the period | | | — | | | — | | | 3,413,849 | | | — | | | — | | | — | | | — | | | — | | | — | | | — |
Repurchase of treasury stock | | | — | | | — | | | (865,900) | | | — | | | 865,900 | | | — | | | — | | | — | | | — | | | — |
Issuance of common stock upon exercise of stock options | | | — | | | — | | | 213,690 | | | — | | | — | | | — | | | 50 | | | — | | | — | | | 50 |
Repurchase and retirement of common stock | | | — | | | — | | | (4,455,384) | | | (1) | | | — | | | — | | | (54,154) | | | — | | | — | | | (54,155) |
Issuance of common stock in connection with IPO | | | — | | | — | | | 19,840,000 | | | 2 | | | — | | | — | | | 241,153 | | | — | | | — | | | 241,155 |
Impact of stock split | | | — | | | — | | | — | | | 6 | | | — | | | — | | | (6) | | | — | | | — | | | — |
Deferred offering costs | | | — | | | — | | | — | | | — | | | — | | | — | | | (7,093) | | | — | | | — | | | (7,093) |
Stock-based compensation | | | — | | | — | | | — | | | — | | | — | | | — | | | 53,150 | | | — | | | — | | | 53,150 |
Net loss | | | — | | | — | | | — | | | — | | | — | | | — | | | — | | | — | | | (59,792) | | | (59,792) |
Other comprehensive income | | | — | | | — | | | — | | | — | | | — | | | — | | | — | | | 6 | | | — | | | 6 |
Balance as of June 30, 2021 | | | 0 | | | $0 | | | 84,301,595 | | | $ 8 | | | 10,762,566 | | | $0 | | | $283,196 | | | $ 3 | | | $(102,435) | | | $180,772 |
Issuance of common stock upon exercise of stock options | | | — | | | — | | | 642,550 | | | — | | | — | | | — | | | 107 | | | — | | | — | | | 107 |
Deferred offering costs | | | — | | | — | | | — | | | — | | | — | | | — | | | 12 | | | — | | | — | | | 12 |
Stock-based compensation | | | — | | | — | | | — | | | — | | | — | | | — | | | 5,381 | | | — | | | — | | | 5,381 |
Net loss | | | — | | | — | | | — | | | — | | | — | | | — | | | — | | | — | | | (22,916) | | | (22,916) |
Other comprehensive loss | | | — | | | — | | | — | | | — | | | — | | | — | | | — | | | 3 | | | | | 3 | |
Balance as of September 30, 2021 | | | 0 | | | $0 | | | 84,944,145 | | | $ 8 | | | 10,762,566 | | | $0 | | | $288,696 | | | $ 6 | | | $(125,351) | | | $163,359 |
| | | Nine Months Ended September 30, | ||||
| | | 2020 | | | 2021 | |
Cash flows from operating activities | | | | | ||
Net loss | | | $ (6,196) | | | $ (82,707) |
Adjustments to reconcile net loss to cash used in operating activities: | | | | | ||
Stock-based compensation | | | 1,381 | | | 58,531 |
Depreciation and amortization | | | 43 | | | 383 |
(Gain) loss from unconsolidated subsidiary | | | 345 | | | 354 |
Gain from disposal of equity investment | | | 0 | | | (20,829) |
(Gain) loss on extinguishment of debt | | | 75 | | | (790) |
Warranty provision | | | 5,195 | | | 2,118 |
Warranty asset | | | (726) | | | (484) |
Bad debt expense | | | 0 | | | 83 |
Deferred income taxes | | | (2) | | | 0 |
Other non-cash items | | | 43 | | | 0 |
Changes in operating assets and liabilities: | | | | | ||
Accounts receivable, net | | | (12,219) | | | (30,017) |
Inventories | | | (1,523) | | | (9,590) |
Prepaid and other current assets | | | (4,351) | | | (16,609) |
Other assets | | | (365) | | | 180 |
Accounts payable | | | 4,009 | | | (535) |
Accruals and other current liabilities | | | 13,825 | | | 21,243 |
Accrued interest – related party debt | | | (112) | | | (207) |
Deferred revenue | | | (14,108) | | | (13,374) |
Other non-current liabilities | | | 386 | | | 904 |
Other, net | | | (338) | | | (1,068) |
Net cash used in operating activities | | | (14,638) | | | (92,414) |
Cash flows from investing activities: | | | | | ||
Purchases of property and equipment | | | 0 | | | (778) |
Proceeds from disposal of equity method investment | | | 0 | | | 22,332 |
Net cash provided by investing activities: | | | 0 | | | 21,554 |
Cash flows from financing activities: | | | | | ||
Proceeds from borrowings | | | 784 | | | 0 |
Repayments of borrowings | | | (4,000) | | | (1,000) |
Repurchase and retirement of common stock | | | 0 | | | (54,155) |
Offering costs paid | | | 0 | | | (5,942) |
Deferred financing costs for revolving credit facility | | | 0 | | | (2,077) |
Proceeds from stock issuance | | | 30,000 | | | 241,314 |
Net cash provided by financing activities | | | 26,784 | | | 178,140 |
Effect of exchange rate changes on cash and restricted cash | | | (20) | | | 9 |
Net increase in cash and restricted cash | | | 12,126 | | | 107,289 |
Cash and restricted cash at beginning of period | | | 8,235 | | | 33,373 |
Cash and restricted cash at end of period | | | $ 20,361 | | | $ 140,662 |
| | | Nine Months Ended September 30, | ||||
| | | 2020 | | | 2021 | |
Supplemental disclosures of cash flow information: | | | | | ||
Purchase of property and equipment included in accounts payable | | | $ 0 | | | $ 40 |
Non-cash gain on extinguishment of debt from PPP loan forgiveness | | | $ 0 | | | $ (790) |
Cash paid during the period for interest | | | $ 350 | | | $ 332 |
December 31, 2020 | September 30, 2021 | |||||
Reconciliation of cash and restricted cash at period end | | | | | ||
Cash | | | $32,359 | | | $140,662 |
Restricted cash | | | 1,014 | | | 0 |
Total cash and restricted cash | | | $33,373 | | | $140,662 |
| | | As of and for Three Months Ended June 30, 2021 (As Previously Reported) | | | Adjustments | | | As of and for Three Months Ended June 30, 2021 (As Revised) | |
| | | (in thousands, except share and per share data) | |||||||
Condensed Consolidated Balance Sheet | | | | | | | |||
Additional paid-in capital | | | $286,687 | | | $(3,491) | | | $283,196 |
Accumulated deficit | | | (105,926) | | | 3,491 | | | (102,435) |
Condensed Consolidated Statement of Comprehensive Loss | | | | | | | |||
Cost of Revenue - Product | | | $43,885 | | | $(7) | | | $43,878 |
Research and development | | | 5,585 | | | (2) | | | 5,583 |
Selling and Marketing | | | 3,258 | | | (161) | | | 3,097 |
General and administrative | | | 51,063 | | | (3,321) | | | 47,742 |
Total operating expenses | | | 59,906 | | | (3,484) | | | 56,422 |
Loss from operations | | | (75,963) | | | 3,491 | | | (72,472) |
Loss before income taxes | | | (55,590) | | | 3,491 | | | (52,099) |
Net loss | | | (55,841) | | | 3,491 | | | (52,350) |
Comprehensive loss | | | (55,834) | | | 3,491 | | | (52,343) |
Net loss per share - basic | | | (0.70) | | | 0.09 | | | (0.61) |
Net loss per share - diluted | | | (0.70) | | | 0.09 | | | (0.61) |
Weighted-average common shares outstanding-basic | | | 79,229,174 | | | 6,927,135 | | | 86,156,309 |
Weighted-average common shares outstanding - diluted | | | 79,229,174 | | | 6,927,135 | | | 86,156,309 |
Condensed Consolidated Statement of Stockholders’ Equity | | | | | | | |||
Additional paid-in capital | | | $286,687 | | | $(3,491) | | | $283,196 |
Accumulated deficit | | | (105,926) | | | 3,491 | | | (102,435) |
Net loss | | | (55,841) | | | 3,491 | | | (52,350) |
Stock-based compensation | | | 56,192 | | | (3,491) | | | 52,701 |
Note 11. Net loss per share | | | | | | | |||
Net loss | | | $(55,841) | | | $3,491 | | | $(52,350) |
Basic weighted-average number of common shares outstanding | | | 79,229,174 | | | 6,927,135 | | | 86,156,309 |
Diluted weighted-average number of common shares outstanding | | | 79,229,174 | | | 6,927,135 | | | 86,156,309 |
Basic loss per share | | | (0.70) | | | 0.09 | | | (0.61) |
Diluted loss per share | | | (0.70) | | | 0.09 | | | (0.61) |
| | | As of and for Six Months Ended June 30, 2021 (As Previously Reported) | | | Adjustments | | | As of and for Six Months Ended June 30, 2021 (As Revised) | |
| | | (in thousands, except share and per share data) | |||||||
| Condensed Consolidated Balance Sheet | |||||||||
Additional paid-in capital | $286,687 | $(3,491) | $283,196 | ||||||
Accumulated deficit | (105,926) | 3,491 | (102,435) | ||||||
| Condensed Consolidated Statement of Comprehensive Loss | |||||||||
Cost of Revenue - Product | $98,881 | $(7) | $98,874 | ||||||
Research and development | 7,539 | (2) | 7,537 | ||||||
Selling and Marketing | 4,358 | (161) | 4,197 | ||||||
General and administrative | 56,147 | (3,321) | 52,826 | ||||||
Total operating expenses | 68,044 | (3,484) | 64,560 | ||||||
Loss from operations | | | (83,982) | | | 3,491 | | | (80,491) |
Loss before income taxes | | | (62,833) | | | 3,491 | | | (59,342) |
Net loss | | | (63,283) | | | 3,491 | | | (59,792) |
Comprehensive loss | | | (63,277) | | | 3,491 | | | (59,786) |
Net loss per share - basic | | | (0.87) | | | 0.09 | | | (0.78) |
Net loss per share - diluted | | | (0.87) | | | 0.09 | | | (0.78) |
Weighted-average common shares outstanding - basic | | | 73,106,935 | | | 3,474,582 | | | 76,581,517 |
Weighted-average common shares outstanding - diluted | | | 73,106,935 | | | 3,474,582 | | | 76,581,517 |
Condensed Consolidated Statement of Cash Flows | | | | | | | |||
Net loss | | | $ (63,283) | | | $ 3,491 | | | $ (59,792) |
Stock-based compensation | | | 56,641 | | | (3,491) | | | 53,150 |
Note 11. Net loss per share | | | | | | | |||
Net loss | | | $ (63,283) | | | $ 3,491 | | | $ (59,792) |
Basic weighted-average number of common shares outstanding | | | 73,106,935 | | | 3,474,582 | | | 76,581,517 |
Diluted weighted-average number of common shares outstanding | | | 73,106,935 | | | 3,474,582 | | | 76,581,517 |
Basic loss per share | | | (0.87) | | | 0.09 | | | (0.78) |
Diluted loss per share | | | (0.87) | | | 0.09 | | | (0.78) |
Shares of common stock issuable upon vesting of restricted stock awards | | | 15,079 | | | (9,885) | | | 5,194 |
Potential common shares excluded from diluted net loss per share | | | 23,231 | | | (9,885) | | | 13,346 |
| | | December 31, 2020 | | | September 30, 2021 | |
Vendor deposits | | | $4,205 | | | $18,125 |
Prepaid expenses | | | 1,043 | | | 4,060 |
Deferred cost of revenue | | | 992 | | | 0 |
Surety collateral | | | 113 | | | 246 |
Other current assets | | | 571 | | | 1,127 |
| | | $6,924 | | | $23,558 |
| | | December 31, 2020 | | | September 30, 2021 | |
Accrued cost of revenue | | | $ 7,812 | | | $33,279 |
Accrued expenses | | | 2,856 | | | 3,205 |
Warranty reserves | | | 3,985 | | | 1,183 |
Accrued compensation | | | 2,869 | | | 1,766 |
Accrued interest expense | | | 28 | | | 128 |
Other | | | 945 | | | 685 |
Total | | | $18,495 | | | $40,246 |
| | | September 30, 2021 | |
Balance at beginning of period, December 31, 2020 | | | $ 6,811 |
Warranties issued during the period | | | 2,902 |
Settlements made during the period | | | (3,507) |
Changes in liability for pre-existing warranties | | | (783) |
Balance at end of period | | | $ 5,423 |
| | | Three Months Ended September 30, | | | Nine Months Ended September 30, | |||||||
| | | 2020 | | | 2021 | | | 2020 | | | 2021 | |
Basic and diluted: | | | | | | | | | ||||
Net loss | | | $ (2,840) | | | $ (22,916) | | | $ (6,196) | | | $ (82,707) |
Basic weighted-average number of common shares outstanding | | | 67,567,724 | | | 94,596,519 | | | 69,857,468 | | | 82,677,824 |
Diluted weighted-average number of common shares outstanding | | | 67,567,724 | | | 94,596,519 | | | 69,857,468 | | | 82,677,824 |
Basic loss per share | | | $ (0.04) | | | $ (0.24) | | | $ (0.09) | | | $ (1.00) |
Diluted loss per share | | | $ (0.04) | | | $ (0.24) | | | $ (0.09) | | | $ (1.00) |
| | | As of September 30, | ||||
| | | 2020 | | | 2021 | |
Shares of common stock issuable under stock option plans outstanding | | | 8,566 | | | 9,610 |
Shares of common stock issuable upon vesting of restricted stock awards | | | 13,622 | | | 5,598 |
Potential common shares excluded from diluted net loss per share | | | 22,188 | | | 15,208 |
| | | Three Months Ended September 30, | | | Nine Months Ended September 30, | |||||||
| | | 2020 | | | 2021 | | | 2020 | | | 2021 | |
United States | | | $59,591 | | | $52,984 | | | $143,034 | | | $168,540 |
Other | | | 49 | | | 5 | | | 139 | | | 264 |
Total net revenue | | | $59,640 | | | $52,989 | | | $143,173 | | | $168,804 |
| Item 13. | Other Expenses of Issuance and Distribution. |
Expenses of Issuance and Distribution ($ thousands) | | | $Amount to be Paid |
SEC registration fee | | | $ 12,284.91 |
FINRA filing fee | | | * |
Transfer agent and registrar fees | | | * |
Printing expenses | | | * |
Legal fees and expenses | | | * |
Accounting fees and expenses | | | * |
Blue Sky fees and expenses | | | * |
Miscellaneous expenses | | | * |
Total | | | $ 12,284.91 |
| * | Estimates not presently known. |
| Item 14. | Indemnification of Directors and Officers. |
| Item 15. | Recent Sales of Unregistered Securities. |
| Item 16. | Exhibits and Financial Statement Schedules. |
| (a) | Exhibits. See the Exhibit Index immediately preceding the signature pages hereto, which is incorporated by reference as if fully set forth herein. |
| (b) | Financial Statement Schedules. None. |
| Item 17. | Undertakings. |
| 1. | To file, during any period in which offers or sales are being made, a post-effective amendment to this registration statement: |
| i. | to include any prospectus required by Section 10(a)(3) of the Securities Act of 1933; |
| ii. | to reflect in the prospectus any facts or events arising after the effective date of the registration statement (or the most recent post-effective amendment thereof) which, individually or in the aggregate, represent a fundamental change in the information set forth in the registration statement. Notwithstanding the foregoing, any increase or decrease in volume of shares of common stock offered (if the total dollar value of shares of common stock offered would not exceed that which was registered) and any deviation from the low or high end of the estimated maximum offering range may be reflected in the form of prospectus filed with the Securities and Exchange Commission pursuant to Rule 424(b) if, in the aggregate, the changes in volume and price represent no more than a 20% change in the maximum aggregate offering price set forth in the “Calculation of Registration Fee” table in the effective registration statement; and |
| iii. | to include any material information with respect to the plan of distribution not previously disclosed in the registration statement or any material change to such information in the registration statement |
| 2. | That, for the purpose of determining any liability under the Securities Act of 1933, each such post-effective amendment shall be deemed to be a new registration statement relating to the shares of common stock offered therein, and the offering of such shares of common stock at that time shall be deemed to be the initial bona fide offering thereof. |
| 3. | To remove from registration by means of a post-effective amendment any of the shares of common stock being registered which remain unsold at the termination of the offering. |
| 4. | Each prospectus filed pursuant to Rule 424(b) as part of a registration statement relating to an offering, other than registration statements relying on Rule 430B or other than prospectuses filed in reliance on Rule 430A, shall be deemed to be part of and included in the registration statement as of the date it is first used after effectiveness. Provided, however, that no statement made in a registration statement or prospectus that is part of the registration statement or made in a document incorporated or deemed incorporated by reference into the registration statement or prospectus that is part of the registration statement will, as to a purchaser with a time of contract of sale prior to such first use, supersede or modify any statement that was made in the registration statement or prospectus that was part of the registration statement or made in any such document immediately prior to such date of first use. |
Exhibit Number | | | Description |
| | | Amended and Restated Certificate of Incorporation of FTC Solar, Inc. (filed as Exhibit 3.1 to the Registrant’s Current Report on Form 8-K filed with the SEC on May 3, 2021 and incorporated herein by reference) | |
| | | Amended and Restated Bylaws of FTC Solar, Inc (filed as Exhibit 3.2 to the Registrant’s Current Report on Form 8-K filed with the SEC on May 3, 2021 and incorporated herein by reference) | |
| | | Certificate of Correction of Amended and Restated Certificate of Incorporation (filed as Exhibit 3.3 to the Registrant’s Quarterly Report on Form 10-Q filed with the SEC on June 8, 2021 and incorporated herein by reference) | |
| | | Specimen Common Stock Certificate (filed as Exhibit 4.1 to the Registrant’s Registration Statement on Form S-1 filed with the SEC on April 19, 2021 and incorporated herein by reference) | |
| | | Opinion of Skadden, Arps, Slate, Meagher & Flom LLP(a) | |
| | | Registration Rights Agreement, dated April 29, 2021, by and among FTC Solar, Inc. and certain holders of its capital stock (filed as Exhibit 10.1 to the Registrant’s Current Report on Form 8-K with the SEC on May 3, 2021 and incorporated herein by reference) | |
| | | Senior Secured Revolving Credit Facility Credit Agreement, by and among FTC Solar, Inc., as borrower, the several financial institutions from time to time parties thereto, and Barclays Bank PLC, as an issuing lender, the swingline lender and as administrative agent (filed as Exhibit 10.2 to the Registrant’s Current Report on Form 8-K with the SEC on May 3, 2021 and incorporated herein by reference) | |
| | | FTC Solar, Inc. 2021 Stock Incentive Plan and form of agreement(b) (filed as Exhibit 10.6 to the Registrant’s Quarterly Report on Form 10-Q with the SEC on August 11, 2021 and incorporated herein by reference) | |
| | | FTC Solar, Inc. 2021 Employee Stock Purchase Plan(b) (filed as Exhibit 10.7 to the Registrant’s Quarterly Report on Form 10-Q with the SEC on August 11, 2021 and incorporated herein by reference) | |
| | | Form of Indemnification Agreement (filed as Exhibit 10.4 to the Registrant’s Registration Statement on Form S-1 filed with the SEC on April 19, 2021 and incorporated herein by reference) | |
| | | Employment Agreement by and between FTC Solar, Inc. and Sean Hunkler(b) (filed as Exhibit 10.3 to the Registrant’s Quarterly Report on Form 10-Q filed with the SEC on November 12, 2021 and incorporated herein by reference) | |
| | | Employment Agreement by and between FTC Solar, Inc. and Ali Mortazavi(a)(b) | |
| | | Employment Agreement by and between FTC Solar, Inc. and Deepak Navnith(a)(b) | |
| | | Employment Agreement by and between FTC Solar, Inc. and Anthony P. Etnyre(b) (filed as Exhibit 10.3 to the Registrant’s Current Report on Form 8-K filed with the SEC on May 3, 2021 and incorporated herein by reference) | |
| | | List of Subsidiaries of FTC Solar, Inc. (filed as Exhibit 21.1 to the Registrant’s Registration Statement on Form S-1 filed with the SEC on March 26, 2021 and incorporated herein by reference) | |
| | | Consent of PricewaterhouseCoopers LLP(a) | |
| | | Consent of Skadden, Arps, Slate, Meagher & Flom LLP (included in Exhibit 5.1)(a) | |
| | | Power of Attorney (included in signature page)(a) | |
| | | Filing Fee Table(a) |
| (a) | Filed herewith. |
| (b) | Management contract or compensatory plan or arrangement. |
| | | FTC SOLAR, INC. | ||||
| | | | | |||
| | | By: | | | /s/ Sean Hunkler | |
| | | | | Name: Sean Hunkler | ||
| | | | | Title: Chief Executive Officer | ||
Signature | | | Title | | | Date |
| | | | | |||
/s/ Sean Hunkler | | | Chief Executive Officer and Director (Principal Executive Officer) | | | February 4, 2022 |
Sean Hunkler | | |||||
| | | | | |||
/s/ Patrick M. Cook | | | Chief Financial Officer (Principal Financial Officer) | | | February 4, 2022 |
Patrick M. Cook | | |||||
| | | | | |||
/s/ M. Cathy Behnen | | | Chief Accounting Officer (Principal Accounting Officer) | | | February 4, 2022 |
M. Cathy Behnen | | |||||
| | | | | |||
/s/ T.J. Rodgers | | | Director | | | February 4, 2022 |
T.J. Rodgers | | |||||
| | | | | |||
/s/ David Springer | | | Director | | | February 4, 2022 |
David Springer | | |||||
| | | | | |||
/s/ Ahmad Chatila | | | Director | | | February 4, 2022 |
Ahmad Chatila | | |||||
| | | | | |||
/s/ William Aldeen (“Dean”) Priddy, Jr. | | | Director | | | February 4, 2022 |
William Aldeen (“Dean”) Priddy, Jr. | | |||||
| | | | | |||
/s/ Isidoro Quiroga Cortés | | | Director | | | February 4, 2022 |
Isidoro Quiroga Cortés | | |||||
| | | | |