Filed by Seven Oaks Acquisition Corp.
pursuant to Rule 425 under the Securities Act of 1933
and deemed filed pursuant to Rule 14a-12
under the Securities Exchange Act of 1934
Subject Company: Seven Oaks Acquisition Corp.
Commission File No. 001-39817
Proposed merger with Seven Oaks Acquisition Corp. (NASDAQ: SVOK)

2 Disclaimer About this Presentation This investor presentation (this “Presentation”) does not constitute ( i ) a solicitation of a proxy, consent or authorization with respect to any securities or in respect of the proposed Business Combination or (ii) an offer to sell, a solicitation of an offer to buy, or a recommendation to purchase any security of SVOK, the Company, or any of their respective affiliates . No such offering of securities shall be made except by means of a prospectus meeting the requirements of Section 10 of the Securities Act of 1933 , as amended, or an exemption therefrom . Forward Looking Statements Certain statements, estimates, targets and projections in this Presentation may be considered forward - looking statements . Forward - looking statements generally relate to future events or SVOK’s or the Company’s future financial or operating performance . For example, statements regarding anticipated growth in the industry in which the Company operates and anticipated growth in demand for the Company’s services, projections of the Company’s future financial results and other metrics, the satisfaction of closing conditions to the Business Combination and the timing of the completion of the Business Combination are forward - looking statements . In some cases, you can identify forward - looking statements by terminology such as “pro forma”, “may”, “should”, “could”, “might”, “plan”, “possible”, “project”, “strive”, “budget”, “forecast”, “expect”, “intend”, “will”, “estimate”, “anticipate”, “believe”, “predict”, “potential” or “continue”, or the negatives of these terms or variations of them or similar terminology . Such forward - looking statements are subject to risks, uncertainties, and other factors which could cause actual results to differ materially from those expressed or implied by such forward - looking statements . These forward - looking statements are based upon estimates and assumptions that, while considered reasonable by SVOK and its management, and the Company and its management, as the case may be, are inherently uncertain . Factors that may cause actual results to differ materially from current expectations include, but are not limited to : ( i ) the occurrence of any event, change or other circumstances that could give rise to the termination of negotiations and any subsequent definitive agreements with respect to the Business Combination ; (ii) the outcome of any legal proceedings that may be instituted against SVOK, the Company, the combined company or others following the announcement of the Business Combination and any definitive agreements with respect thereto ; (iii) the inability to complete the Business Combination due to the failure to obtain approval of the stockholders of SVOK or the Company ; (iv) the inability of the Company to satisfy other conditions to closing ; (v) changes to the proposed structure of the Business Combination that may be required or appropriate as a result of applicable laws or regulations or as a condition to obtaining regulatory approval of the Business Combination ; (vi) the ability to meet stock exchange listing standards following the consummation of the Business Combination ; (vii) the risk that the Business Combination disrupts current plans and operations of the Company as a result of the announcement and consummation of the Business Combination ; (viii) the ability to recognize the anticipated benefits of the Business Combination, which may be affected by, among other things, competition, the ability of the combined company to grow and manage growth profitably, maintain relationships with customers and suppliers and retain its management and key employees ; costs related to the Business Combination ; (ix) changes in applicable laws or regulations ; (x) the possibility that the Company or the combined company may be adversely affected by other economic, business, regulatory, and/or competitive factors ; (xi) the Company’s estimates of expenses and profitability, which may be affected by, among other things, the Company's proposed strategic commercial agreement with Palantir ; (xii) the evolution of the markets in which the Company competes ; (xiii) the ability of the Company to implement its strategic initiatives and continue to innovate its existing products ; (xiv) the ability of the Company to defend its intellectual property ; (xv) the ability of the Company to satisfy regulatory requirements ; (xvi) the impact of the COVID - 19 pandemic on the Company’s and the combined company’s business ; and (xvii) other risks and uncertainties set forth in the section entitled “Risk Factors” and “Cautionary Note Regarding Forward - Looking Statements” in SVOK’s annual report on Form 10 - K for the fiscal year ended December 31 , 2020 , which was filed with the SEC on March 31 , 2021 and amended on June 3 , 2021 , and other risks and uncertainties indicated from the time to time in the definitive proxy statement to be delivered to SVOK’s stockholders and related registration statement on Form S - 4 , including those set forth under “Risk Factors” therein, and other document to be filed with the SEC by SVOK . Nothing in this Presentation should be regarded as a representation by any person that the forward - looking statements set forth herein will be achieved or that any of the contemplated results of such forward - looking statements will be achieved . You should not place undue reliance on forward - looking statements, which speak only as of the date they are made . Neither SVOK nor the Company undertakes any duty to update these forward - looking statements . Use of Projections This Presentation contains financial forecasts for the Company with respect to certain financial results for the Company’s fiscal years 2021 through 2026 . Neither SVOK’s nor the Company’s independent auditors have audited, studied, reviewed, compiled or performed any procedures with respect to the projections for the purpose of their inclusion in this Presentation, and accordingly, they did not express an opinion or provide any other form of assurance with respect thereto for the purpose of this Presentation . These projections are forward - looking statements and should not be relied upon as being necessarily indicative of future results . In this Presentation, certain of the above - mentioned projected information has been provided for purposes of providing comparisons with historical data . The assumptions and estimates underlying the prospective financial information are inherently uncertain and are subject to a wide variety of significant business, economic and competitive risks and uncertainties that could cause actual results to differ materially from those contained in the prospective financial information . Accordingly, there can be no assurance that the prospective results are indicative of the future performance of the Company or that actual results will not differ materially from those presented in the prospective financial information . Inclusion of the prospective financial information in this Presentation should not be regarded as a representation by any person that the results contained in the prospective financial information will be achieved . Financial Information ; Non - GAAP Financial Measures The historical financial information and data contained in this Presentation has not been audited in accordance with the standards of the Public Company Accounting Oversight Board and does not conform to Regulation S - X . Such information and data may not be included in, may be adjusted in or may be presented differently in the registration statement to be filed by SVOK relating to the Business Combination and the proxy statement/prospectus contained therein . This Presentation also includes certain financial measures not presented in accordance with generally accepted accounting principles (“GAAP”) including Adjusted EBITDA and certain ratios and other metrics derived therefrom as well as Adjusted Cash Operating Costs . The Company defines Adjusted EBITDA as net income (loss) before interest expense, tax expense, depreciation and amortization, stock - based compensation expense and other one - time or non - recurring expenses, such as executive recruiting fees, severance, 3 rd party consulting fees, and transaction - related fees, among others, that the Company does not believe are recurring in nature or necessary for the ongoing operations of the business . The Company defines Adjusted Cash Operating Costs as Operating Expenses less depreciation and amortization, stock - based compensation expense and other one - time or non - recurring expenses, such as executive recruiting fees, severance, 3 rd party consulting fees, and transaction - related fees, among others, that the Company does not believe are recurring in nature or necessary for the ongoing operations of the business . These non - GAAP financial measures are not measures of financial performance in accordance with GAAP and may exclude items that are significant in understanding and assessing the Company’s financial results . Therefore, these measures should not be considered in isolation or as an alternative to net income, cash flows from operations or other measures of profitability, liquidity or performance under GAAP . You should be aware that the Company’s presentation of these measures may not be comparable to similarly - titled measures used by other companies . SVOK and the Company believe these non - GAAP measures of financial results provide useful information to management and investors regarding certain financial and business trends relating to the Company’s financial condition and results of operations . SVOK and the Company believe that the use of these non - GAAP financial measures provides an additional tool for investors to use in evaluating ongoing operating results and trends in comparing the Company’s financial measures with other similar companies, many of which present similar non - GAAP financial measures to investors . These non - GAAP financial measures are subject to inherent limitations as they reflect the exercise of judgments by management about which expense and income are excluded or included in determining these non - GAAP financial measures . This Presentation also includes certain projections of non - GAAP financial measures . Due to the high variability and difficulty in making accurate forecasts and projections of some of the information excluded from these projected measures, together with some of the excluded information not being ascertainable or accessible, SVOK and the Company are unable to quantify certain amounts that would be required to be included in the most directly comparable GAAP financial measures without unreasonable effort . Consequently, no disclosure of estimated comparable GAAP measures is included and no reconciliation of the forward - looking non - GAAP financial measures is included . Industry and Market Data In this Presentation, the Company relies on and refers to certain information and statistics obtained from third - party sources which it believes to be reliable . Neither SVOK nor the Company has independently verified the accuracy or completeness of any such third - party information . Trademarks and Copyright This Presentation may contain trademarks, service marks, trade names and copyrights of other companies, which are the property of their respective owners . Solely for convenience, some of the trademarks, service marks, trade names and copyrights referred to in this Presentation may be listed without the TM, SM, © or ® symbols, but SVOK and the Company will assert, to the fullest extent under applicable law, the rights of the applicable owners, if any, to these trademarks, service marks, trade names and copyrights . Additional Information SVOK has filed a registration statement on Form S - 4 with the Securities Exchange Commission (the “SEC”), which includes a proxy statement/prospectus, that will be both the proxy statement to be distributed to SVOK's stockholders in connection with its solicitation of proxies for the vote by SVOK’s stockholders with respect to the Business Combination and other matters as may be described in the registration statement, as well as the prospectus, and relating to the offer and sale of the securities to be issued in the Business Combination . After the registration statement is declared effective, SVOK will mail a definitive proxy statement/prospectus and other relevant documents to its stockholders . This Presentation does not contain all the information that should be considered concerning the proposed Business Combination and is not intended to form the basis of any investment decision or any other decision in respect of the Business Combination . SVOK's stockholders and other interested persons are advised to read, when available, the preliminary proxy statement/prospectus included in the registration statement and the amendments thereto and the definitive proxy statement/prospectus and other documents filed in connection with the proposed Business Combination, as these materials will contain important information about the Company, SVOK and the Business Combination . When available, the definitive proxy statement/prospectus and other relevant materials for the proposed Business Combination will be mailed to stockholders of SVOK as of a record date to be established for voting on the proposed Business Combination . Stockholders will also be able to obtain copies of the preliminary proxy statement, the definitive proxy statement and other documents filed with the SEC, without charge, once available, at the SEC’s website at www . sec . gov , or by directing a request to SVOK’s secretary at 445 Park Avenue, 17 th Floor, New York, NY 10022 , ( 917 ) 214 - 6371 . Participants in the Solicitation SVOK and its directors and executive officers may be deemed participants in the solicitation of proxies from SVOK’s stockholders with respect to the proposed Business Combination . A list of the names of those directors and executive officers and a description of their interests in SVOK is contained in SVOK’s registration statement on Form S - 4 , which was filed with the SEC on July 20 , 2021 , and is available free of charge at the SEC’s website at www . sec . gov . To the extent such holdings of SVOK’s securities may have changed since that time, such changes have been or will be reflected on Statements of Change in Ownership on Form 4 filed with the SEC . Additional information regarding the interests of such participants will be contained in the proxy statement/prospectus for the proposed Business Combination when available . The Company and its directors and executive officers may also be deemed to be participants in the solicitation of proxies from the stockholders of SVOK in connection with the proposed Business Combination . A list of the names of such directors and executive officers and information regarding their interests in the proposed Business Combination will be included in the proxy statement/prospectus for the proposed Business Combination when available .

Introduction Company Overview Investment Highlights Financials Transaction Overview & Valuation Conclusion 1 2 3 4 5 6 Table of Contents 3

Gary Matthews Chairman and CEO Drew Pearson Chief Financial Officer Randolph Tucker Chief ESG Officer David Harris Chief Operating Officer Boxed is the Perfect Match for Seven Oaks’ Investment Criteria 4 1. Track record of growth despite capital constraints 2. Strong alignment on ESG principles 3. World - class management team • SVOK capital will accelerate growth behind a focused strategy • Significant margin expansion and negative working capital dynamics with scale SAVE AMERICA’S PARKS Tri - State Law Enforcement Foundation

5 Proposed Transaction Summary • Seven Oaks Acquisition Corp. is proposing a business combination with Boxed, an e - commerce platform selling bulk, high - repeat essentials that serves B2C and B2B customers and expects growing Software revenue in the future • Valuation implies an estimated pro forma Enterprise Value of $647mm (2.1x 2022E Revenue of $306M) • Existing Boxed shareholders will own 62% of the pro forma equity – no secondary selling • 30% of SVOK Founder Shares deferred, and $1M Founder Shares allocated to an ESG foundation • Transaction is expected to close in Q4’21 TRANSACTION OVERVIEW TRANSACTION FUNDING • The transaction will be funded by a combination of Seven Oaks cash held in a trust account & proceeds from the PIPE financing, and convertible notes issuance with Boxed & Seven Oaks equity rolling into the deal • Transaction is expected to result in an estimated $327 million of cash to the balance sheet to invest in marketing and customer acquisition, assortment expansion, B2B growth and the expansion of the fulfillment network 1 1) Assumes 0% redemptions from SVOK Trust
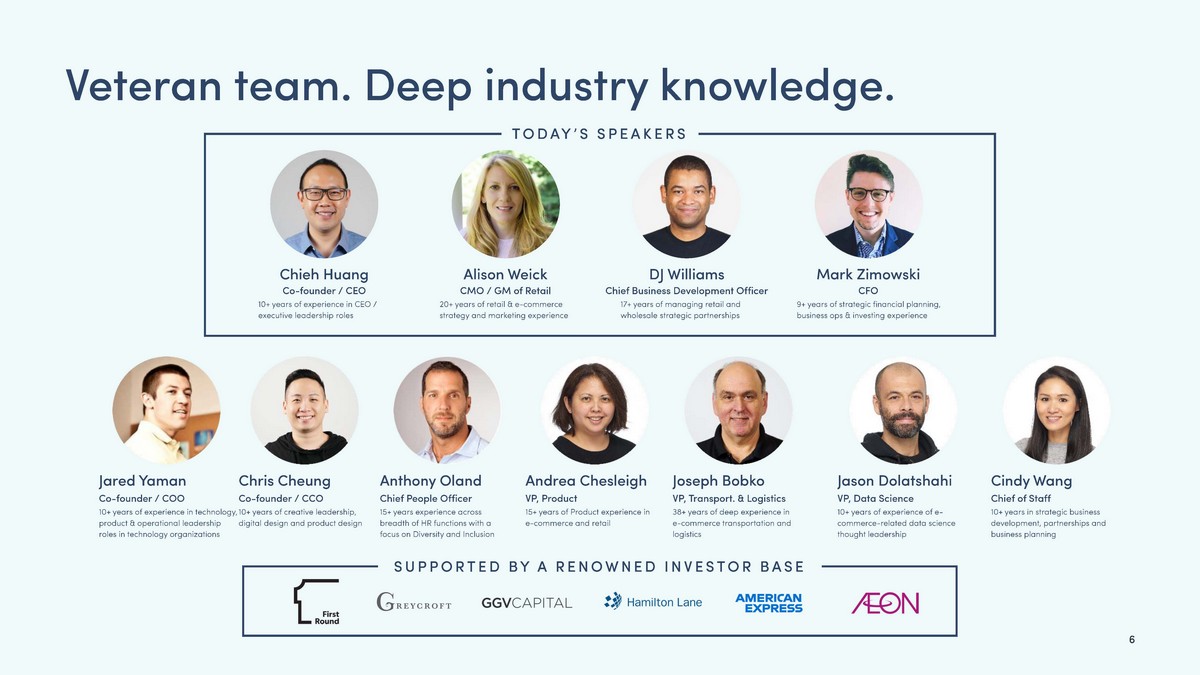
6 SUPPORTED BY A RENOWNED INVESTOR BASE Veteran team. Deep industry knowledge. Anthony Oland Chief People Officer 15+ years experience across breadth of HR functions with a focus on Diversity and Inclusion Andrea Chesleigh VP, Product 15+ years of Product experience in e - commerce and retail Joseph Bobko VP, Transport. & Logistics 38+ years of deep experience in e - commerce transportation and logistics Jason Dolatshahi VP, Data Science 10+ years of experience of e - commerce - related data science thought leadership Cindy Wang Chief of Staff 10+ years in strategic business development, partnerships and business planning Chieh Huang Co - founder / CEO 10+ years of experience in CEO / executive leadership roles Jared Yaman Co - founder / COO 10+ years of experience in technology, product & operational leadership roles in technology organizations Alison Weick CMO / GM of Retail 20+ years of retail & e - commerce strategy and marketing experience DJ Williams Chief Business Development Officer 17+ years of managing retail and wholesale strategic partnerships Mark Zimowski CFO 9+ years of strategic financial planning, business ops & investing experience Chris Cheung Co - founder / CCO 10+ years of creative leadership, digital design and product design TODAY’S SPEAKERS

CONFIDENTIAL 7 Meet Boxed

8 How Boxed Works 1. We are an e - commerce platform selling bulk, high - repeat essentials to consumers and businesses. 2. We monetize the proprietary technology that powers our core business through advertising, marketplace and software solutions.

9 How Boxed Works CRM reminds customers to replenish Boxed Software Technology constantly improving and monetized through licensing Boxed Retail Customers re - enter top of funnel to maintain sticky engagement Customer traffic driven by need to stock up on household and business essentials High AOV orders allows for higher margins Further margin enhancement driven by proprietary advertising platform Revenue share from 3P sellers in adjacent categories

10 Convenience Bulk Brand Curated, simple to browse assortment enables discovery of new products and large baskets (8 items per order) Customers are looking for an easy way to stock up and a simple way to buy bulk, without the required membership fees A resonant brand known for doing right for our customers, employees and society NPS = 69 (a) A seamless experience, efficient fulfillment and award - winning customer service yields highly satisfied customers B2B A consumer - like shopping experience with procurement tools and solutions built for business needs Why Customers Chose Boxed Millions of Times (a) Reflects NPS from 6.4k survey respondents collected during Q1’21 YTD period
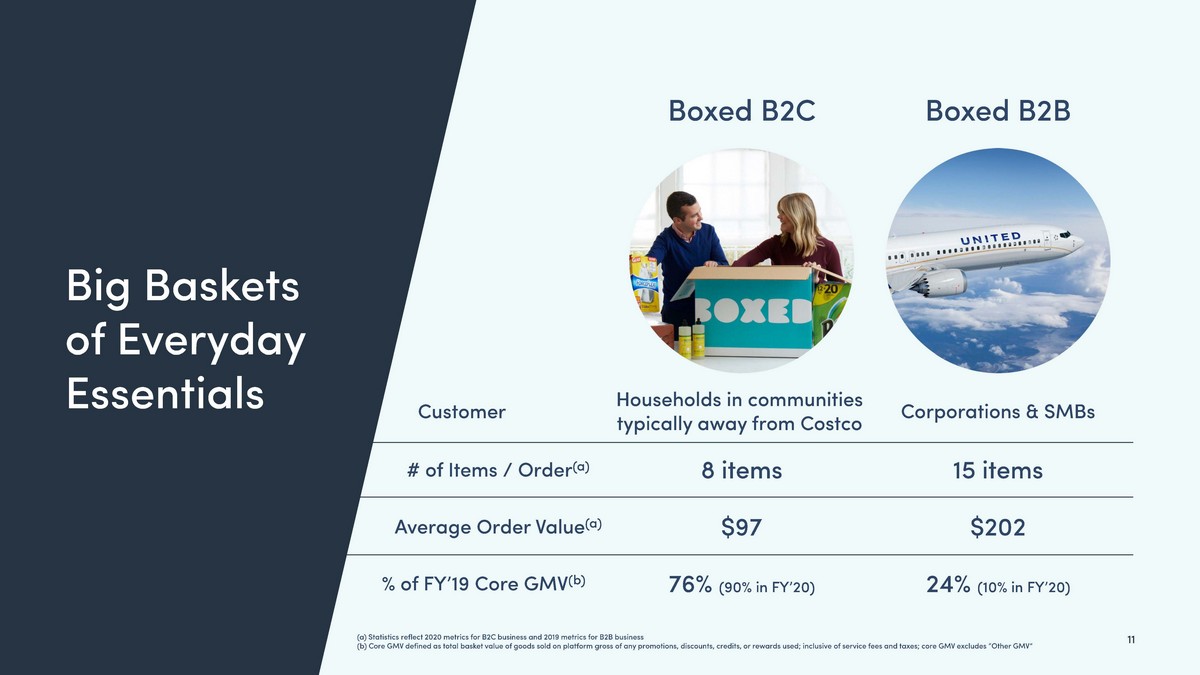
11 Big Baskets of Everyday Essentials (a) Statistics reflect 2020 metrics for B2C business and 2019 metrics for B2B business (b) Core GMV defined as total basket value of goods sold on platform gross of any promotions, discounts, credits, or rewards use d; inclusive of service fees and taxes; core GMV excludes “Other GMV” Boxed B2B Boxed B2C Customer # of Items / Order (a) Average Order Value (a) % of FY’19 Core GMV (b) Households in communities typically away from Costco 8 items $97 76% (90% in FY’20) Corporations & SMBs 15 items $202 24% (10% in FY’20)

$187 $1,031 2020A 2026F 14% 30% 2020A 2026F 12 Boxed Plans to Achieve $1BN in Sales and a 30%+ Gross Margin by 2026 Note: FYE December GROSS MARGIN NET REVENUE ($M) +16 pts 33% CAGR

13 Proven Commitment to ESG Mission Less Waste Majority Minority Fighting Inequality Stepping Up Large, consolidated orders reduce boxes and energy consumption. One large shipment produces up to 30% less carbon impact from packaging materials as compared to several shipments* Over half of our corporate office team nationwide identifies as an ethnic minority. A rare statistic yielding diversity of thought. We are a leader in the fight against the Pink Tax where women are unfairly taxed on feminine care and “pink” products. We do the right thing. Valuing our team with a strong benefits and workplace offering. This powerful approach drives efficiency and hourly team loyalty (avg. tenure of >2 years) *Source: Third - party consulting firm research
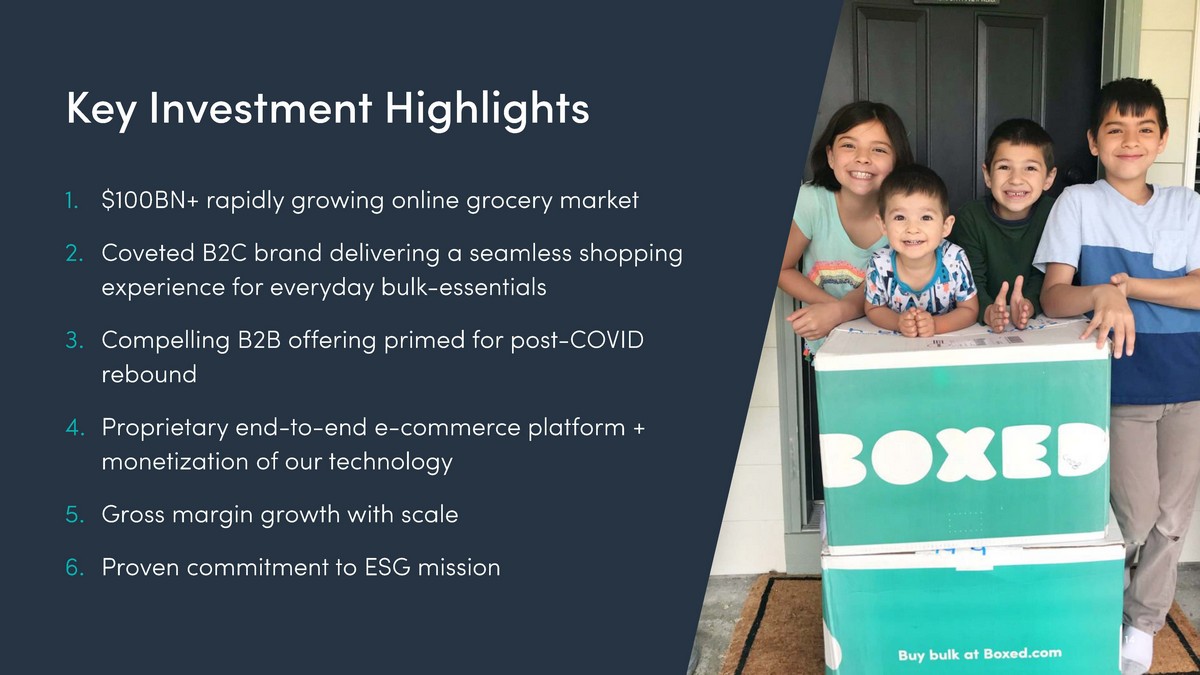
14 Key Investment Highlights 1. $100BN+ rapidly growing online grocery market 2. Coveted B2C brand delivering a seamless shopping experience for everyday bulk - essentials 3. Compelling B2B offering primed for post - COVID rebound 4. Proprietary end - to - end e - commerce platform + monetization of our technology 5. Gross margin growth with scale 6. Proven commitment to ESG mission

10% 11% 21% 14% 20% USA UK China $106 $248 2020 2025 1. $100BN+ rapidly growing online grocery market 15 Source: Wall Street Research, Reuters, Kantar Research, Forrester Research, FMI U.S. Grocery Shopper Trends, 2020 and Mercatus – The Evolution of the Grocery Customer, 2020 Estimated at $ 31B in 2020 All Other Online Grocery Grocery e - commerce (% of Total) 10% 21% ONLINE GROCERY PENETRATION BY COUNTRY TOTAL GROCERY E - COMMERCE SALES ($B) Boxed Increasing Share in $31BN+ “Other” Segment $75 $154 $31 $63 2020 2024 TAM OF ALL OTHER ONLINE GROCERY RETAILERS All Other Online Grocery (% of Total) 29% 29% Online Grocery Growing Rapidly U.S. Penetration Rate Estimated at 21% by 2025 Current Penetration Rate Projected Penetration Rate

16 $ 97 2020 Average Order Value B2C 109 % $ 160 M 2020 BoxedUp GMV YoY Growth % ( b) 2020 GMV The simple way to stock - up on bulk essentials 2. Rapidly growing multi - faceted e - commerce platform expected to reach $1BN in sales within 5 years 2. Coveted B2C brand delivering a seamless shopping experience for everyday bulk - essentials 452 K 2020 Active Customers ( a) • ~ 50% ages 25 – 49, majority Female, 46% have children in home • Highly engaged repeat customer base • Rapidly growing recurring revenue streams through loyalty offerings (a) # of distinct B2C customers placing at least 1 order during 2020 (b) BoxedUP GMV reflects $ GMV from customers who at the time of order were enrolled in the BoxedUP loyalty program

$113 $160 $977 2019A 2020A 2026F B2C GMV ($M) 17 36% CAGR Strategy to Drive B2C Growth 1. Increased marketing investment expanding brand awareness and driving customer acquisition 2. Drive recurring revenue through expansion of BoxedUp loyalty and auto - ship 3. Expansion of product assortment (e.g., Healthy / Organic, Pet, Home, etc.) to capture increased wallet share • 3 rd party marketplace tech enables expansion in high margin, capital - efficient manner • Private label drives loyalty and delivers further margin upside B2C: Poised For Dynamic Growth $14 $30 $425 - 480 2. Coveted B2C brand delivering a seamless shopping experience for everyday bulk - essentials BOXEDUP GMV ($M)

2. Coveted B2C brand delivering a seamless shopping experience for everyday bulk - essentials 173 302 304 218 348 257 $9 $20 $20 $12 $21 $5 -- $5 $10 $15 $20 $25 $30 $35 -- 50 100 150 200 250 300 350 400 FY'15 FY'16 FY'17 FY'18 FY'19 FY'20 $45 $31 $37 $46 $17 +125% +51% +6% +28% +7% Customer Acquisition Cost: YoY GMV Growth : ANNUAL NEW CUSTOMERS Marketing Spend ($M) (1) New Customers (K) Notes: (1) Marketing spend includes acquisition cost and other non - working marketing spend. Marketing spend divided by new customers is not reflective of CAC 18 +42% ) – B2C ( - 51%) – B2B Marketing Investment Delivers Awareness & Scale Proven track record of delivering growth through marketing investment

2. Coveted B2C brand delivering a seamless shopping experience for everyday bulk - essentials % of Users 3 6 % 33% 20% 1 1 % More Likely to Be • Rural, rent, single, far from Costco • Rural/suburban, married, own home • Suburban, married, parents • Urban, close to Costco Value Prop • Live far from Costco • Like value of bulk sizes • Enjoy promos and giveaways • Small business mentality, anti - Amazon • Stocking up for the family • Like the value in bulk sizes with no membership fee • Small business mentality, anti - Amazon • Stocking up for the family • Like the value in bulk sizes with no membership fee • Convenience • Convenience • Ship heavy items like seltzer • Don’t want to spend free time at wholesale clubs % of BoxedUp Customers 42% 32% 17% 9% TAM (# of Households) 54m 40m 19m 8m % Household Penetration (a ) 0.21% 0.35% 0.64% 0.68% 19 BACKROADERS SMALL TOWNERS PLEASANTVILLERS URBANITES A Look at Our Customers Note: Boxed analysis based on segmentation data as of Dec’20 (a) Reflects # of distinct customers placing at least 1 order during 2020 applied to total household TAM

2. Coveted B2C brand delivering a seamless shopping experience for everyday bulk - essentials 20 Delivering Outsized Value to Customers Assortment & Price • Ease of Use / Discovery for Basket Building • Personalized Recommendations • Mobile - First Technologies • Delivery Options & Speed Customer Experience Brand • Bulk Assortment in Core Categories • Competitive Pricing on Entire Basket of Goods • No Membership Required • Free Shipping on Most Orders • Relevant Promotions • Fun, Personable Brand Identity & Messaging • ESG Principles • Customer Appreciation through Every Touchpoint (Customer Service, Note Cards, etc.)

2. Coveted B2C brand delivering a seamless shopping experience for everyday bulk - essentials 21 BoxedUp & Auto - Save Improve Engagement BOXEDUP (LAUNCHED Q2’18) AUTO - SAVE (LAUNCHED Q2’21) BoxedUp Member Perks x 2% c ash rewards x Free ship on orders >$19.98 x Priority shipping x Exclusive deals x Priority customer s ervice Enrolled Users (as of 6/30/21) 36K Share of Q1’21 GMV 17% Annual Fee $49 FY’20 YoY GMV Growth 109% Q2’21 Subscription AOV $86 Lift GMV per User over 60 - day test period +34% Lift in User Retention over 60 - day test period +80% Auto - Save Perks x 10% off item on first order x 5% product discount thereafter x Select between 4, 6, 8, 10, 12, week replenishment intervals NEAR - TERM OPPORTUNITIES x Increasing BoxedUp and Subscription Adoption x BoxedUp Pricing Tiers x BoxedUp for Business x Subscription Improvements
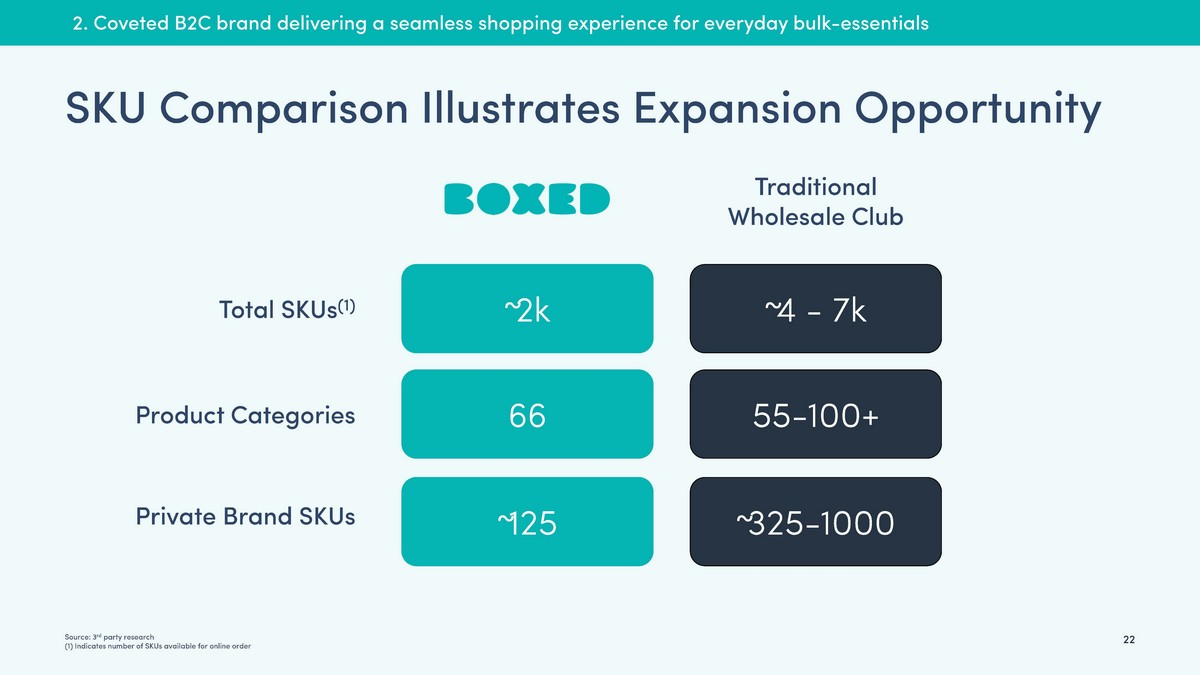
22 2. Coveted B2C brand delivering a seamless shopping experience for everyday bulk - essentials SKU Comparison Illustrates Expansion Opportunity ~ 2k 66 ~ 4 - 7 k 55 - 100+ Traditional Wholesale Club Source: 3 rd party research (1) Indicates number of SKUs available for online order Total SKUs (1) Product Categories Private Brand SKUs ~ 125 ~ 325 - 1000

$480 B $593 B $1.1 Trillion US Household Spend on Addressable Categories 2. Coveted B2C brand delivering a seamless shopping experience for everyday bulk - essentials Category Breadth Unlocks Potential Wallet Share Source: U.S. Bureau of Labor Statistics, Statistica .com, Global Newswire Note : Market data reflects estimated 2019, 2020 & 2021 U.S. household spend in addressable categories Fresh Beauty Pet Vitamins Baby Home Goods Personal Care Grocery Beverage Household Snacks Boxed Core Categories Today Boxed Expansion Categories Boxed Total Market Opportunity 124% Wallet Share Lift Potential Expansion into adjacent categories unlocks a +$593bn opportunity (+124% potential increase in wallet share) 23
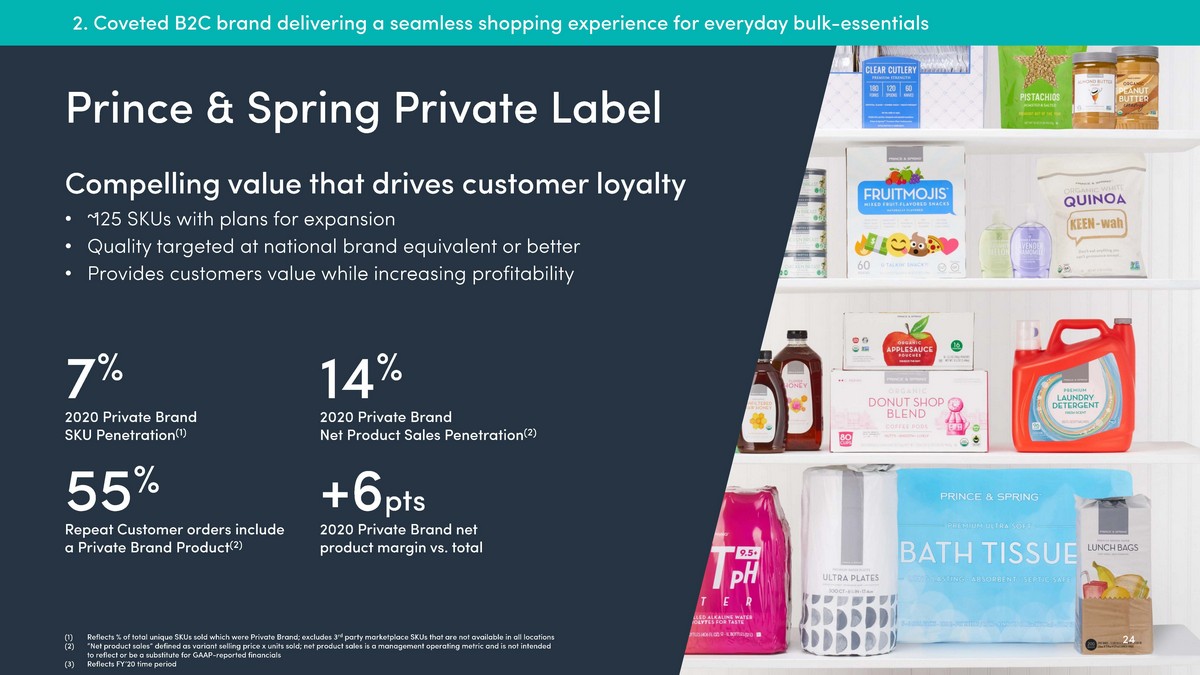
24 7 % 55 % 2020 Private Brand SKU Penetration (1) Repeat Customer orders include a Private Brand Product (2) 14 % 2020 Private Brand Net Product Sales Penetration (2 ) +6 pts 2020 Private Brand net product margin vs. total Prince & Spring Private Label Compelling value that drives customer loyalty • ~ 125 SKUs with plans for expansion • Quality targeted at national brand equivalent or better • Provides customers value while increasing profitability (1) Reflects % of total unique SKUs sold which were Private Brand; excludes 3 rd party marketplace SKUs that are not available in all locations (2) “Net product sales” defined as variant selling price x units sold; net product sales is a management operating metric and is not intended to reflect or be a substitute for GAAP - reported financials (3) Reflects FY’20 time period 2. Coveted B2C brand delivering a seamless shopping experience for everyday bulk - essentials

25 B2B B2B procurement through a B2C - like experience $ 1.5 K $ 202 2019 GMV per Customer 2019 Average Order Value 25 K $ 37 M 2019 Active Customers ( a) 2019 GMV 55 % GMV CAGR ’15 - ’19A 3. Compelling B2B offering primed for post - COVID rebound • Higher AOVs, retention, & profitability • Blue Chip customer base across SMB and enterprise • Proven track record of rapid growth pre - COVID (a) # of distinct B2B customers placing at least 1 order during 2019

26 3. Compelling B2B offering primed for post - COVID rebound B2B: A Look at Our Customers SMB ENTERPRISE % of B2B Active Users (a) 95% 5% Primary Users Annual Revenue Size Small business owners, office assistants, HR / Employee program administrators Procurement & purchasing leads, operations / program managers Up to $500K $500K+ (a) Data reflect 2019 metrics for B2B business

27 3. Compelling B2B offering primed for post - COVID rebound An Easy Buying Experience With Robust Tools • B2B - centric assortment • Multi - user account management • Approval workflows curb rogue spending • Flexible payments & invoicing • Reporting & analytics • Enterprise portals • eProcurement integrations • Pallet program

$37 $18 $241 2019A 2020A 2026F B2B GMV ($M) 28 Clear Growth Strategy 1. COVID rebound expected to drive meaningful tailwinds for growth 2. Expand sales force targeting attractive sectors 3. Optimize assortment for B2B customers 56% CAGR COVID Impact 3. Compelling B2B offering primed for post - COVID rebound B2B: Primed For Post - COVID Rebound Fortune 500 companies Tech / SMB Education / Non - for Profit SELECT B2B CUSTOMER SEGMENTS

Customer Experience 29 Why Customers Choose Boxed Assortment & Price Brand BOXED TODAY BOXED TOMORROW x Ease of use / discovery for basket building x Personalized recommendations x Mobile - first technologies x Delivery options & speed x Bulk assortment in core categories x Competitive pricing on entire basket of goods x No membership required x Free shipping on most orders x Fun, personable and relatable brand x ESG principles x Customer appreciation through every touchpoint + Expanded loyalty offerings + Personalized life - cycle marketing + Enhanced B2B experience + Expanded assortment for B2C and B2B + Competitive unit pricing at scale + Dynamic targeted promotions + Incremental investment in private label + Amplified brand awareness at scale + Deeper focus on emotional connection and ESG programs + More surprise and delight for repeat customers 3. Compelling B2B offering primed for post - COVID rebound

30

31 Comprehensive In - house Tech Platform 4. Proprietary end - to - end e - commerce platform + Monetization of our technology Storefront Business Ops Seller Tech Automation TECHNOLOGY + + + User Experience Personalization Omnichannel Unified Data Platform Tools Supply Chain Marketplace Ad Tech Custom Integration In - house Robotics Customizable Software Human - integrated VERTICALLY - INTEGRATED TECHNOLOGY PLATFORM

4. Proprietary end - to - end e - commerce platform + Monetization of our technology 32 Robust Data & Insight Power Smart Decisions 25M User Sessions/Year, 40B+ Events in Data Warehouse, Captures Entire Lifecycle External Data Shopping Behavior Supply Chain Data Marketing Data Marketing Attribution Customer Journey Insights Order Profitability Predictive Models Machine Learning APIs e.g. Add - to - cart event, product impression e.g. Demographics e.g. Inventory update e.g. Ad click event Unified Data

4. Proprietary end - to - end e - commerce platform + Monetization of our technology $82 $92 $99 $103 $109 1st Order 3rd Order 5th Order 10th Order 20th Order # of Orders 33 AVERAGE ORDER VALUE BY CUSTOMER ORDER COUNT 1 Personalization Engine Drives Basket - building (1) Figures reflect AOV data from cohorts acquired from Jan’17 to Q1’21 x UX built for simplicity & discoverability x Curated product selection x Fast & convenient x Subscription optionality x Seamless checkout

34 Flexible, Efficient Fulfillment & Logistics Platform TBU 4. Proprietary end - to - end e - commerce platform + Monetization of our technology Current State 2020A Future State 2026E • Efficient inventory management • 11x average inventory turnover • 90% delivery availability within 2 days or less • Proprietary robotics and fulfillment software • ~ $1M in capex & ~ 30 days to stand - up new facility • Boxed robotics supports low - cost expansion ANNUAL CAPACITY ~ 4.5M+ Orders / ~ 35M+ Items ANNUAL CAPACITY ~ 12.5M Orders / ~ 100M Items ADDITIONAL FULFILLMENT CENTERS YIELD 2.7x 10 - 15 % Capacity Growth Est. Cost Savings

35
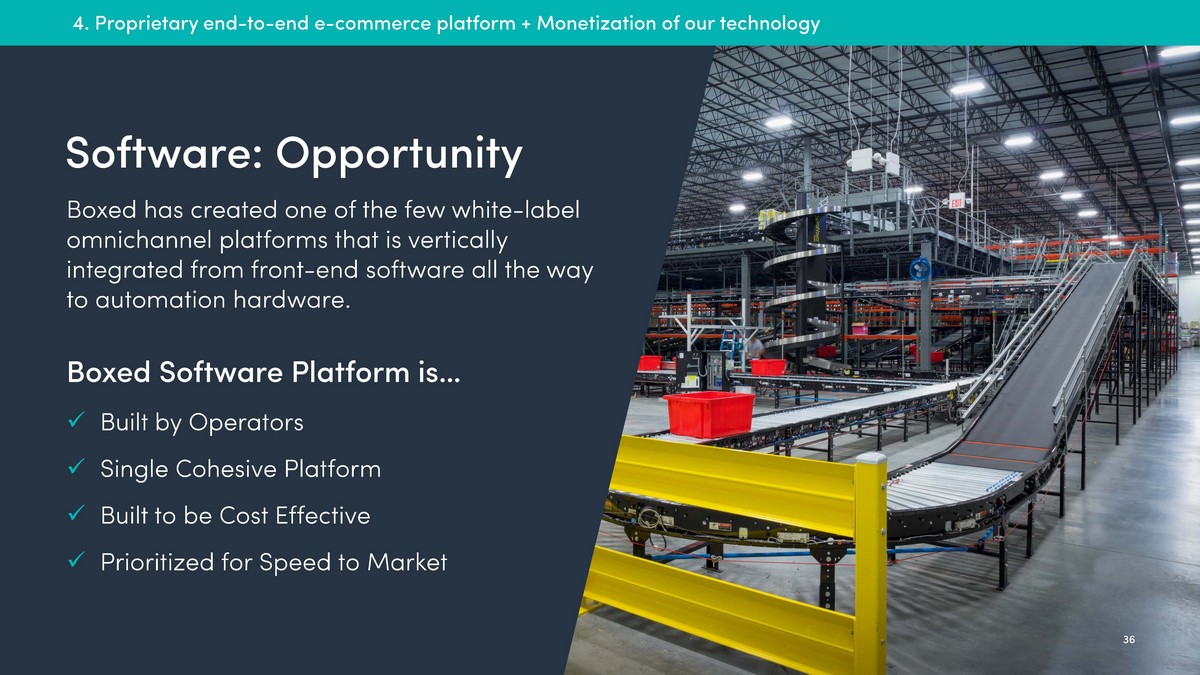
4. Proprietary end - to - end e - commerce platform + Monetization of our technology Software: Opportunity Boxed has created one of the few white - label omnichannel platforms that is vertically integrated from front - end software all the way to automation hardware. Boxed Software Platform is… x Built by Operators x Single Cohesive Platform x Built to be Cost Effective x Prioritized for Speed to Market 36
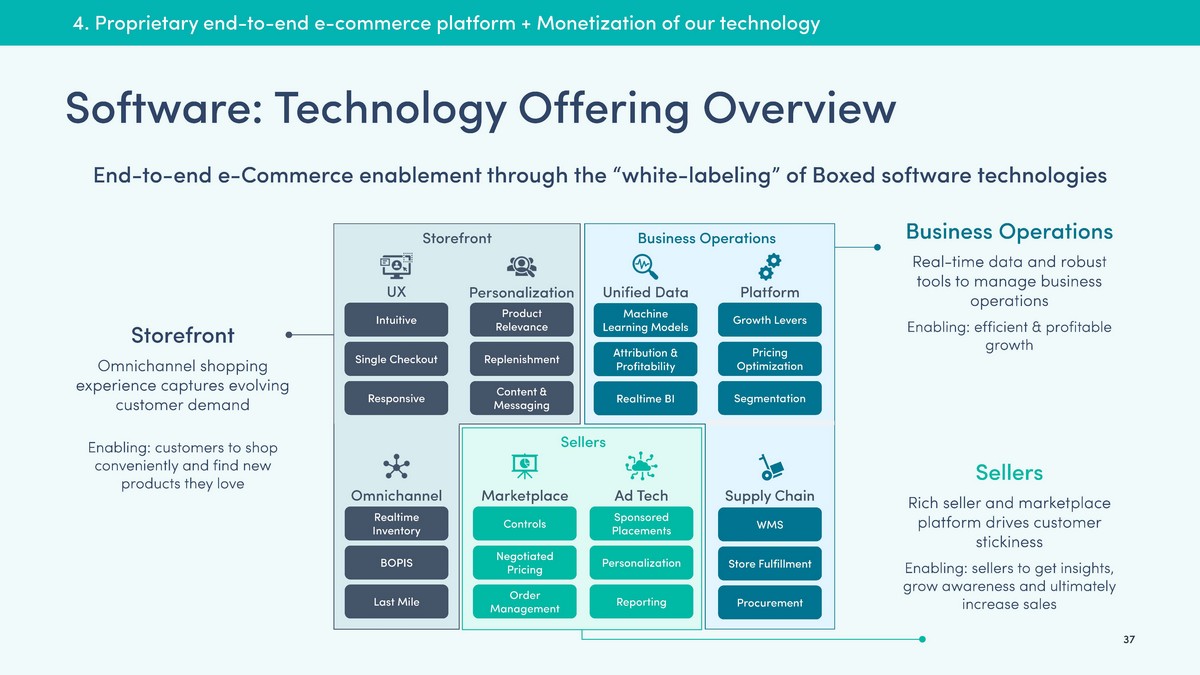
Software: Technology Offering Overview 4. Proprietary end - to - end e - commerce platform + Monetization of our technology End - to - end e - Commerce enablement through the “white - labeling” of Boxed software technologies Business Operations Real - time data and robust tools to manage business operations Enabling: efficient & profitable growth Unified Data Machine Learning Models Attribution & Profitability Realtime BI Platform Tools Growth Levers Pricing Optimization Segmentation Supply Chain WMS Store Fulfillment Procurement Business Operations Storefront Omnichannel shopping experience captures evolving customer demand Enabling: customers to shop conveniently and find new products they love UX Intuitive Single Checkout Responsive Personalization Product Relevance Replenishment Content & Messaging Omnichannel Realtime Inventory BOPIS Last Mile Storefront Sellers Rich seller and marketplace platform drives customer stickiness Enabling: s ellers to get insights, grow awareness and ultimately increase sales Marketplace Controls Negotiated Pricing Order Management Ad Tech Sponsored Placements Personalization Reporting Sellers 37

4. Proprietary end - to - end e - commerce platform + Monetization of our technology End - to - end Omnichannel E - commerce Launch with ~ $ 80bn Global Retailer x High margin, recurring software revenue x Rapid 6 - month launch x Opportunity for worldwide expansion Software: Execution 38 $12 $13 $27 $42 $69 $106 FY'21F FY'22F FY'23F FY'24F FY'25F FY'26F Software & Services Net Revenue ($M) Leading to broader monetization of Retail Software offerings
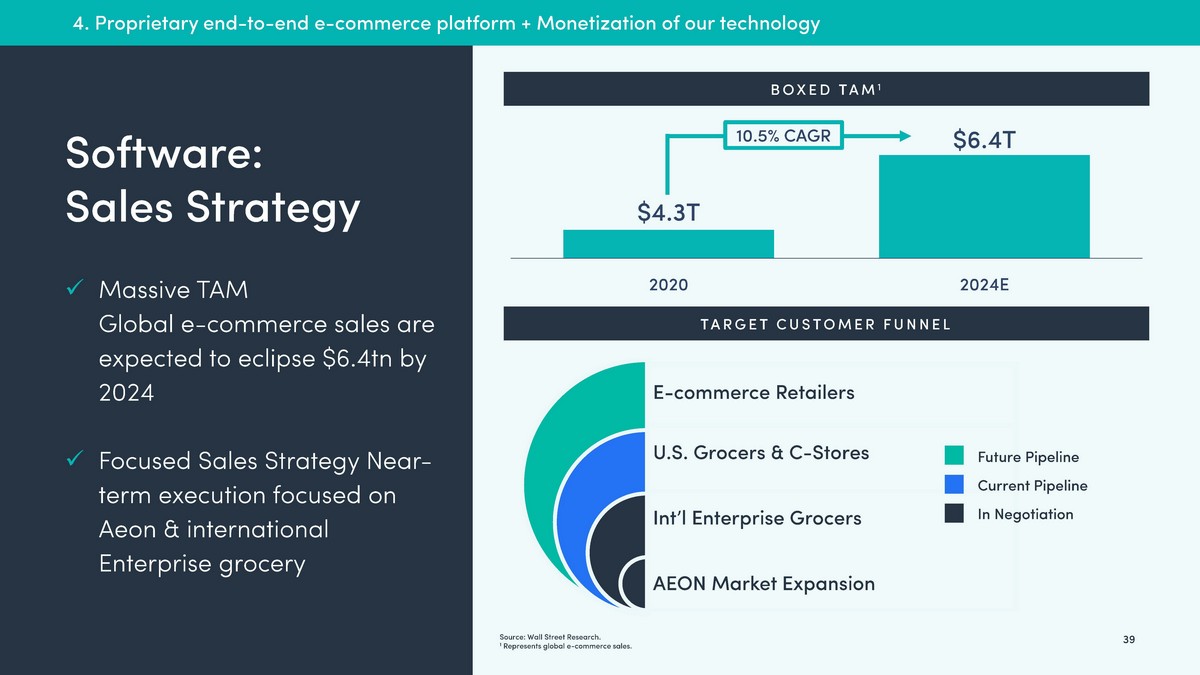
39 Source: Wall Street Research. 1 Represents global e - commerce sales. TARGET CUSTOMER FUNNEL $4.3T $6.4T 2020 2024E BOXED TAM 1 10.5% CAGR E - commerce Retailers U.S. Grocers & C - Stores Int’l Enterprise Grocers AEON Market Expansion In Negotiation Current Pipeline Future Pipeline Software: Sales Strategy x Massive TAM Global e - commerce sales are expected to eclipse $6.4tn by 2024 x Focused Sales Strategy Near - term execution focused on Aeon & international Enterprise grocery 4. Proprietary end - to - end e - commerce platform + Monetization of our technology

40 Financials

FUTURE (FY’2 6E) $187M $5M (FY’19 - $21M) ~ 2k 17% 3 $12M (contracted for FY’21) <1% 3 14% $1.0BN $66M 4k+ ~ 35 - 40% ~ 30 $106M 2.5 - 3.5% 8 30% 41 Focused Approach (a) BoxedUP member GMV $ contribution / (B2C + B2B GMV $) B2C B2B Margin Improvement Software Monetization Net Revenue ($M) Marketing Spend ($M) Avg. # SKUs Offered BoxedUP GMV Penetration % (a) B2B Sales Reps Software & Services Revenue Ad - tech Rev % of Total Rev # of FCs Gross Margin % TODAY ( FY ‘ 20)

42 GROSS MERCHANDISE VALUE (“GMV”) ACTIVE CUSTOMERS AVERAGE ORDER VALUE (“ AOV”) ADVERTISING EXPENSES $12.2 $20.7 $4.9 $9.5 2018A 2019A 2020A LTM 3/31/21A $92 $95 $108 $110 2018A 2019A 2020A LTM 3/31/21A $152.7 $195.1 $207.9 $199.1 2018A 2019A 2020A LTM 3/31/21A 372 515 472 466 2018A 2019A 2020A LTM 3/31/21A ($M) ($M) (K) Impacted by significant reduction in advertising expenses and COVID related decline in B2B business Impacted by capital constraints and supply chain considerations Continuing momentum Post - COVID with further upside expected from B2B Impacted by significant reduction in advertising expenses and COVID related decline in B2B business ($) Historical KPI Review

$140.2 $174.0 $187.2 $181.6 2018A 2019A 2020A LTM 3/31/21A ($44.2) ($59.0) ($21.8) ($23.0) 2018A 2019A 2020A LTM 3/31/21A 43 NET REVENUE ($M) GROSS PROFIT ADJUSTED EBITDA $6.7 $9.9 $25.9 $27.7 2018A 2019A 2020A LTM 3/31/21A 4.8% 5.7% 13.8% 15.2% ($M) ($M) (31.5%) (33.9%) (11.7%) (13.8%) Step - function improvement in unit economics Rapid B2C growth combined with temporary B2B declines Meaningful operating leverage and margin expansion Summary Historical Financial Results

44 Future Opportunity

$113 $160 $173 $265 $397 $561 $748 $977 2019A 2020A 2021F 2022F 2023F 2024F 2025F 2026F 36% CAGR $37 $18 $23 $53 $88 $132 $184 $241 2019A 2020A 2021F 2022F 2023F 2024F 2025F 2026F 45 Poised for Acceleration w/Incremental Funding • Marketing investment • Assortment expansion • Loyalty program investment / enhancements Primed for Post - COVID Rebound • Industry tailwinds from post - COVID recovery • Expanded sales force focused on core verticals • Assortment optimization for B2B ($M) ($M) COVID impact 56% CAGR B2B B2C Rapid GMV Growth

5% 14% 24% 2018A 2020A 2026F Retail Gross Margin % • Vendor Negotiations and Trade Funding • Improved pricing and increased vendor promotional funding as the business scales ~ 5x over next 5 years • Ad Tech Monetization • Opportunity to monetize an additional 2.5+ pts with release of new offerings and increased vendor adoption • Broaden Product Assortment • Optimize product mix, including private label • Leverage high margin marketplace offering for category expansion • Customer Loyalty • Increased loyalty program & subscription revenue • Improved retention delivers higher margin customer (high AOVs) • Supply Chain Optimization • Fulfillment center buildout reduces time in transit & lowers shipping costs 46 LEVERS TO DRIVE MARGIN EXPANSION 1 2 3 4 5 +10 pts +1.5 - 2.5 pts +2 - 4 pts 2 - 4 pts 1+ pts 1+ pts Estimated Increase +9 pts Prolific Margin Expansion Opportunities with Scale 1 2 3 4 5
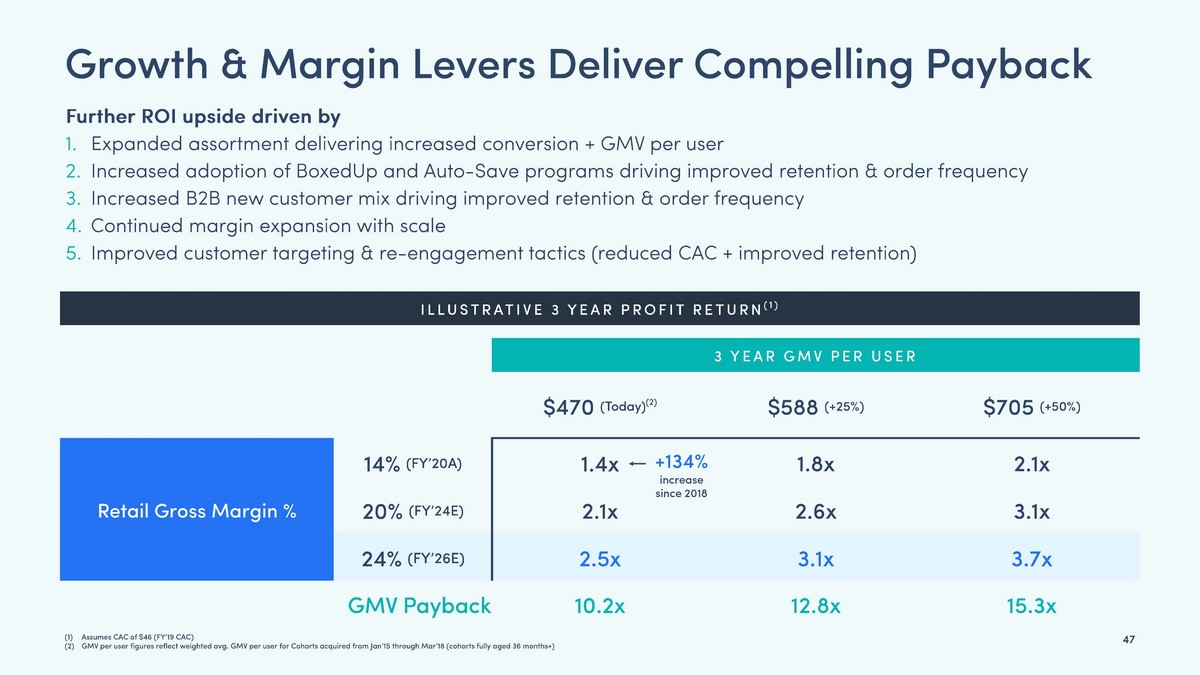
47 Growth & Margin Levers Deliver Compelling Payback ILLUSTRATIVE 3 YEAR PROFIT RETURN (1) 3 YEAR GMV PER USER $470 (Today) (2) $588 (+25%) $705 (+50%) Retail Gross Margin % 14% (FY’20A) 1.4x 1.8x 2.1x 20% (FY’24E) 2.1x 2.6x 3.1x 24% (FY’26E) 2.5x 3.1x 3.7x Further ROI upside driven by 1. Expanded assortment delivering increased conversion + GMV per user 2. Increased adoption of BoxedUp and Auto - Save programs driving improved retention & order frequency 3. Increased B2B new customer mix driving improved retention & order frequency 4. Continued margin expansion with scale 5. Improved customer targeting & re - engagement tactics (reduced CAC + improved retention) (1) Assumes CAC of $46 (FY’19 CAC) (2) GMV per user figures reflect weighted avg. GMV per user for Cohorts acquired from Jan’15 through Mar’ 18 (cohorts fully aged 36 months+) GMV Payback 10.2x 12.8x 15.3x +134% increase since 2018

48 • Launch & expansion of high margin Software & Services business with upfront investments in FY’21 & FY’22 COMMENTARY • GMV expected to re - accelerate post - deSPAC , with FY’22F growth of 50%+, driven by reinvestment in marketing, B2B rebound, and launch of 3P marketplace 1 • H2’21E capital infusion of $300M+ enables top - line growth acceleration through increased marketing investment, growth in B2B sales force, FC expansion, & scaling teams to support further technology monetization 4 • +16 pts of gross margin expansion from FY’20 to FY’26E, supported by proven history combined with new capital infusion & Software expansion 2 3 Model Overview • Proprietary fulfillment technology & robotics enables efficient capital - light model, delivering strong working capital & capex dynamics 5 $M (A) FY'19A FY'20A FY'21F FY'22F FY'23F FY'24F FY'25F FY'26F GMV BREAKDOWN (RETAIL) (B) B2C GMV $113 $160 $173 $265 $397 $561 $748 $977 B2B GMV 37 18 23 53 88 132 184 241 Other GMV 45 30 37 42 47 52 58 64 Total GMV $195 $208 $233 $360 $532 $745 $990 $1,282 YoY Growth % 28% 7% 12% 54% 48% 40% 33% 29% Net Revenue (Retail) $174 $187 $200 $294 $402 $538 $711 $925 Net Revenue (Software & Services) -- -- 12 13 27 42 69 106 Net Revenue $174 $187 $212 $306 $429 $580 $780 $1,031 YoY Growth % 24% 8% 14% 44% 40% 35% 35% 32% Total Gross Profit $10 $26 $31 $49 $90 $142 $216 $313 Gross Margin (Total) % 6% 14% 15% 16% 21% 24% 28% 30% ADJ. CASH OPERATING COSTS (C) Advertising Costs $21 $5 $35 $39 $45 $52 $59 $66 Fulfillment, Staff & Overhead 48 43 55 77 101 127 154 184 Total $69 $48 $89 $117 $146 $179 $213 $250 Adj. EBITDA ($59) ($22) ($59) ($68) ($56) ($37) $3 $63 Adj. EBITDA Margin % (32%) (12%) (28%) (22%) (13%) (6%) 0% 6% Change in Net Working Capital $13 ($3) $10 $2 $9 $10 $13 $24 Capital Expenditures (PPE) (2) (0) (3) (2) (2) (3) (3) (3) 1 2 3 4 5 Note: Figures based on financial projections that were prepared as of Q1’21, and do not take into account any circumstances o r e vents occurring after the date they were prepared, including uncertainty over timing of cash funding and impact of the Delta var iant a) Financial projections are not reflective of potential revenue upside or cost savings associated with the proposed commercial par tnership with Palantir, nor do they include the associated software licensing expenses, which are expected to be $20M in tota l, incurred over the next 5 years; actual results may vary depending on, among other things, exact timing of deSPAC transaction, final funding amount, & execution of commercial agreement b) Retail Segment GMV defined as total basket value of goods sold, gross of any customer promotions, discounts, credits, or rewa rds used, and inclusive of shipping fees, service fees and taxes c) Excludes non - cash depreciation, amortization, and stock - based compensation expenses; excludes one - time cash costs including certain sever ance and executive recruiting fees, consulting fees, & transaction - related costs

Software & Services B2C Channel B2B Channel Near - term Considerations RETAIL x Successful Aeon Execution a Key Milestone in 6 - month time frame • Proven software is transferrable to other retailers • Proven we can deploy efficiently and successfully • $12M+ of revenue in FY’21E x Growth Drivers Remain Clear • Capital investment fuels growth through sustained marketing • Loyalty programs deliver attractive customer behavior • Assortment expansion key to future wallet - share expansion x Prolific back - to - work opportunity in 2H’21 • Signs of momentum entering Q3’21 • Impact of Delta variant TBD Due to latest expected timing of cash funding (bridge financing & deSPAC transaction), associated variability in our marketing budget, uncertainty over the impact of the Delta variant, and considerations around timing of revenue recognition of our Software & S erv ices business, we expect to provide an updated outlook for FY’21 during Q3’21 Once cash funding is available post - deSPAC, we remain confident in our ability to achieve longer - term growth rates and margin targets previously discussed 49

50 Transaction Overview & Valuation
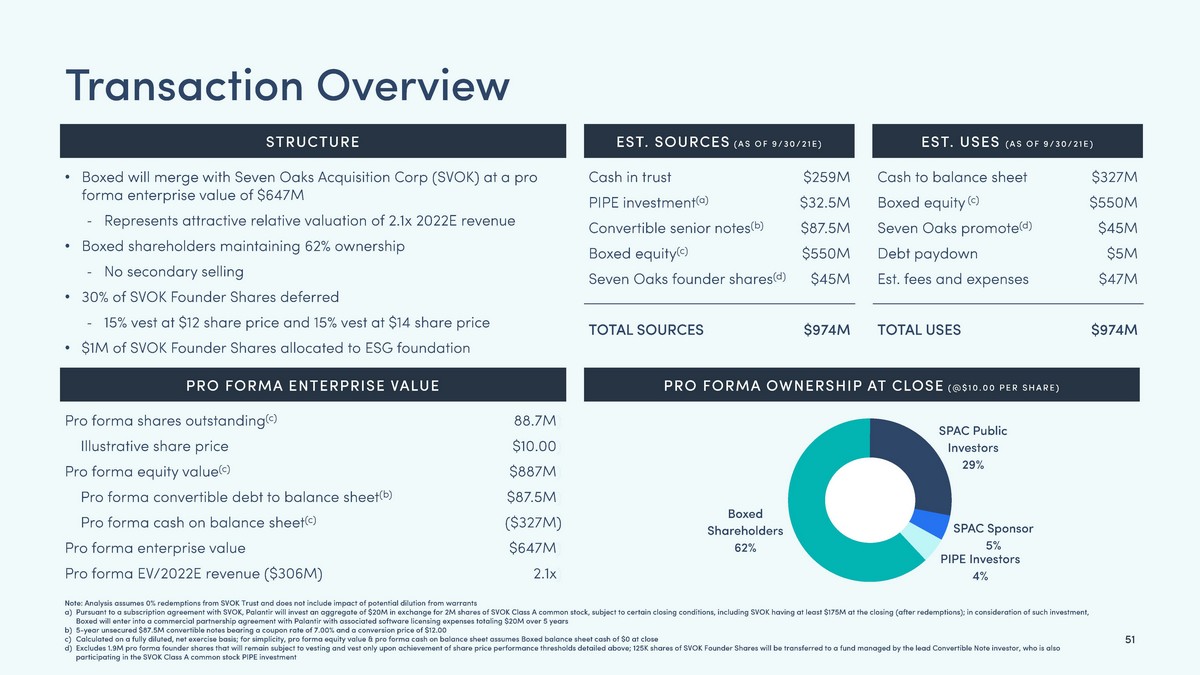
51 Transaction Overview Cash in trust PIPE investment (a) Convertible senior notes (b) Boxed equity (c) Seven Oaks founder shares (d) TOTAL SOURCES Cash to balance sheet Boxed equity (c) Seven Oaks promote (d) Debt paydown Est. fees and expenses TOTAL USES $259M $32.5M $87.5M $550M $45M $974M $327M $550M $45M $5M $47M $974M • Boxed will merge with Seven Oaks Acquisition Corp (SVOK) at a pro forma enterprise value of $647M - Represents attractive relative valuation of 2.1x 2022E revenue • Boxed shareholders maintaining 62% ownership - No secondary selling • 30% of SVOK Founder Shares deferred - 15% vest at $12 share price and 15% vest at $14 share price • $1M of SVOK Founder Shares allocated to ESG foundation Boxed Shareholders 62% SPAC Public Investors 29% SPAC Sponsor 5% PIPE Investors 4% EST. USES (AS OF 9/30/21E) EST. SOURCES (AS OF 9/30/21E) STRUCTURE PRO FORMA ENTERPRISE VALUE PRO FORMA OWNERSHIP AT CLOSE (@$10.00 PER SHARE) Pro forma shares outstanding (c) Illustrative share price Pro forma equity value (c) Pro forma convertible debt to balance sheet (b) Pro forma cash on balance sheet (c) Pro forma enterprise value Pro forma EV/2022E revenue ($306M) 88.7M ) $10.00 ) $887M ) $87.5M ) ($327M) $647M ) 2.1x ) Note: Analysis assumes 0% redemptions from SVOK Trust and does not include impact of potential dilution from warrants a) Pursuant to a subscription agreement with SVOK, Palantir will invest an aggregate of $20M in exchange for 2M shares of SVOK C las s A common stock, subject to certain closing conditions, including SVOK having at least $175M at the closing (after redemptio ns) ; in consideration of such investment, Boxed will enter into a commercial partnership agreement with Palantir with associated software licensing expenses totaling $20M over 5 years b) 5 - year unsecured $87.5M convertible notes bearing a coupon rate of 7.00% and a conversion price of $12.00 c) Calculated on a fully diluted, net exercise basis; for simplicity, pro forma equity value & pro forma cash on balance sheet a ssu mes Boxed balance sheet cash of $0 at close d) Excludes 1.9M pro forma founder shares that will remain subject to vesting and vest only upon achievement of share price perf orm ance thresholds detailed above; 125K shares of SVOK Founder Shares will be transferred to a fund managed by the lead Converti ble Note investor, who is also participating in the SVOK Class A common stock PIPE investment

2.1 x 6.2 x 6.0 x 5.3 x 4.3 x 3.3 x 3.2 x 2.3 x 1.5 x 9.4 x 4.3 x 2.3 x 1.2 x 30.4 x 19.2 x 11.0 x 3.0 x 7.9 x 7.7 x 6.3 x 5.0 x 4.4 x 4.0 x 2.9 x 1.8 x 11.2 x 4.6 x 2.6 x 1.4 x 41.0 x 23.6 x 13.8 x E - COMMERCE SAAS MARKETPLACE 52 Valuation EV/2021E Revenue EV/2022E Revenue E - COMMERCE SAAS MARKETPLACE Median: 4.7x Median: 3.6 x Median: 23.6x Median: 3.8x Median: 3.3x Median: 19.2x ATTRACTIVE ENTRY VALUATION RELATIVE TO COMPARABLE PUBLIC COMPANI ES 1 Source: Publicly available information Note: Market data as of July 29, 2021; Boxed figures based on financial projections that were prepared as of Q1’21, and do not take into account any circumstances or events occurring afte r t he date they were prepared, including uncertainty over timing of cash funding and impact of the Delta variant
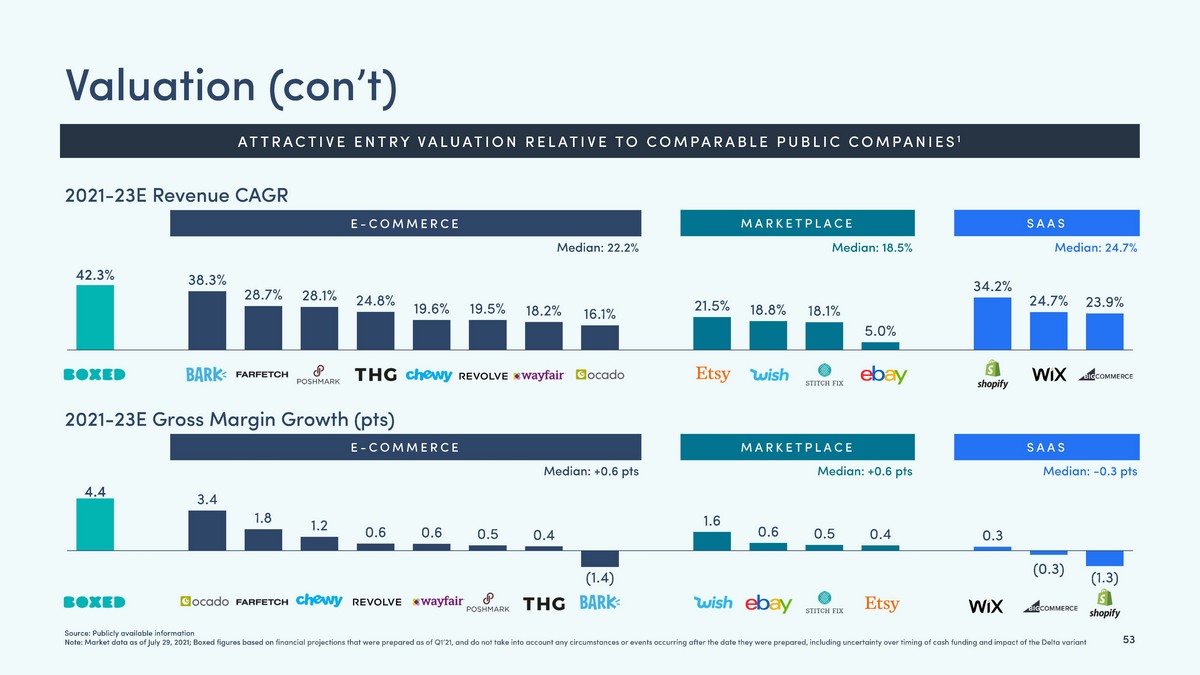
4.4 3.4 1.8 1.2 0.6 0.6 0.5 0.4 (1.4) 1.6 0.6 0.5 0.4 0.3 (0.3) (1.3) 42.3% 38.3% 28.7% 28.1% 24.8% 19.6% 19.5% 18.2% 16.1% 21.5% 18.8% 18.1% 5.0% 34.2% 24.7% 23.9% 53 Valuation ( con’t ) 2021 - 23E Revenue CAGR 2021 - 23E Gross Margin Growth (pts) Median: 22.2 % Median: 18.5% Median: 24.7% Median: +0.6 pts Median: +0.6 pts Median: - 0.3 pts E - COMMERCE SAAS MARKETPLACE E - COMMERCE SAAS MARKETPLACE ATTRACTIVE ENTRY VALUATION RELATIVE TO COMPARABLE PUBLIC COMPANI ES 1 Source: Publicly available information Note: Market data as of July 29, 2021; Boxed figures based on financial projections that were prepared as of Q1’21, and do not take into account any circumstances or events occurring afte r t he date they were prepared, including uncertainty over timing of cash funding and impact of the Delta variant
54 Conclusion

The Opportunity 55 1. $100BN+ rapidly growing online grocery market 2. Coveted B2C brand delivering a seamless shopping experience for everyday bulk - essentials 3. Compelling B2B offering primed for post - COVID rebound 4. Proprietary end - to - end e - commerce platform + monetization of our technology 5. Gross margin growth with scale 6. Proven commitment to ESG mission

56

57 Financial Appendix

58 KPI Review (Definitions) 1. Advertising Expenses – consist of investment in customer acquisition and retention related marketing, public relations and third - party marketing agency costs, and marketing content related expenses, including television content, print, photography, and direct mail 2. Active Customers - the total number of customers in our Retail segment with at least one order in the referenced respective time - period 3. Average Order Value (AOV) - GMV for the respective time - period divided by the total number of orders placed by customers during the same period 4. Gross Merchandise Value (GMV) - We define GMV as (i) the total value of Boxed goods sold (ii) 3rd party goods sold on Boxed - owned Web, App, or technology proprieties, gross of any customer promotions, price discounts, credits, or rewards used, all of which are (iii) inclusive of shipping fees, service fees and taxes.
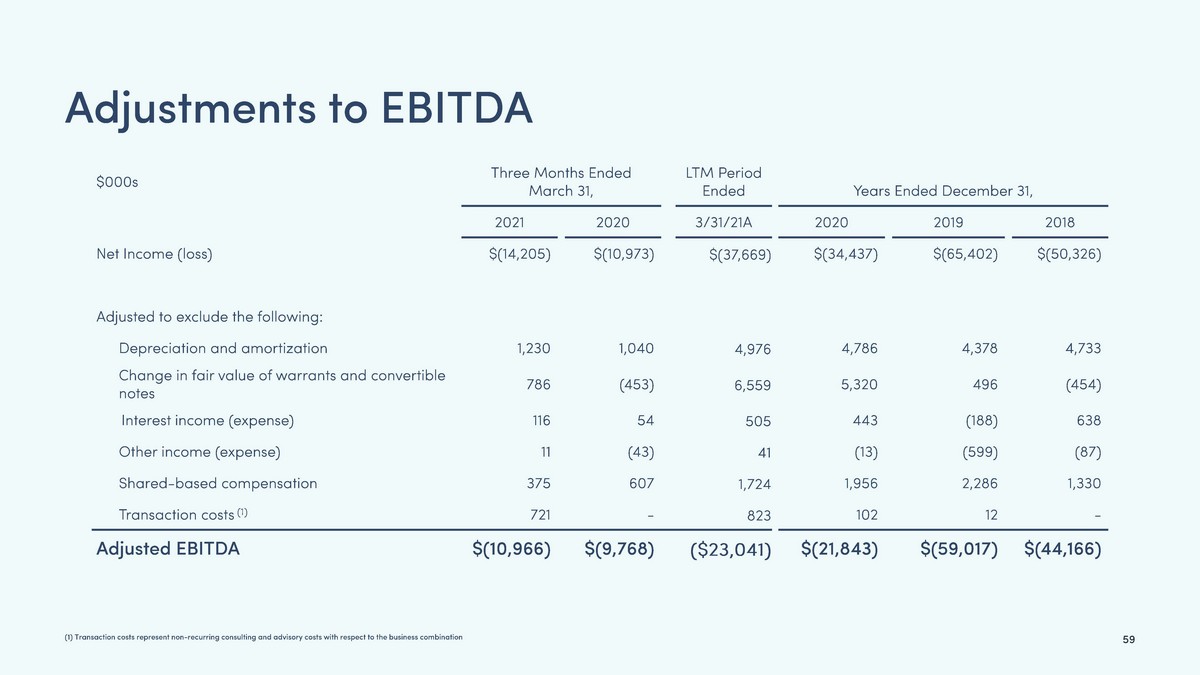
59 Adjustments to EBITDA (1) Transaction costs represent non - recurring consulting and advisory costs with respect to the business combination $000s Three Months Ended March 31, LTM Period Ended Years Ended December 31, 2021 2020 3/31/21A 2020 2019 2018 Net Income (loss) $(14,205) $(10,973) $(37,669) $(34,437) $(65,402) $(50,326) Adjusted to exclude the following: Depreciation and amortization 1,230 1,040 4,976 4,786 4,378 4,733 Change in fair value of warrants and convertible notes 786 (453) 6,559 5,320 496 (454) Interest income (expense) 116 54 505 443 (188) 638 Other income (expense) 11 (43) 41 (13) (599) (87) Shared - based compensation 375 607 1,724 1,956 2,286 1,330 Transaction costs (1) 721 - 823 102 12 - Adjusted EBITDA $(10,966) $(9,768) ($23,041) $(21,843) $(59,017) $(44,166)
60 Appendix

61 CEO OF IES HOLDINGS (IESC) Gary Matthews has Extensive Operating History Seven Oaks Acquisition Corp Overview MANAGING DIRECTOR AT MORGAN STANLEY CAPITAL PARTNERS Oversaw a turnaround with significant increases in EBITDA and share price over 18 months as CEO 12 years experience investing in and managing portfolio companies • Drove results with improved operations • Secured accretive acquisitions • ESG improvements including • US Army hiring program • Created electrician training centers recruiting heavily from a diverse population • Increased diversity and inclusion on the management leadership team $10 $15 $20 $25 $30 $35 $40 $45 $50 Gary Matthews hired as CEO
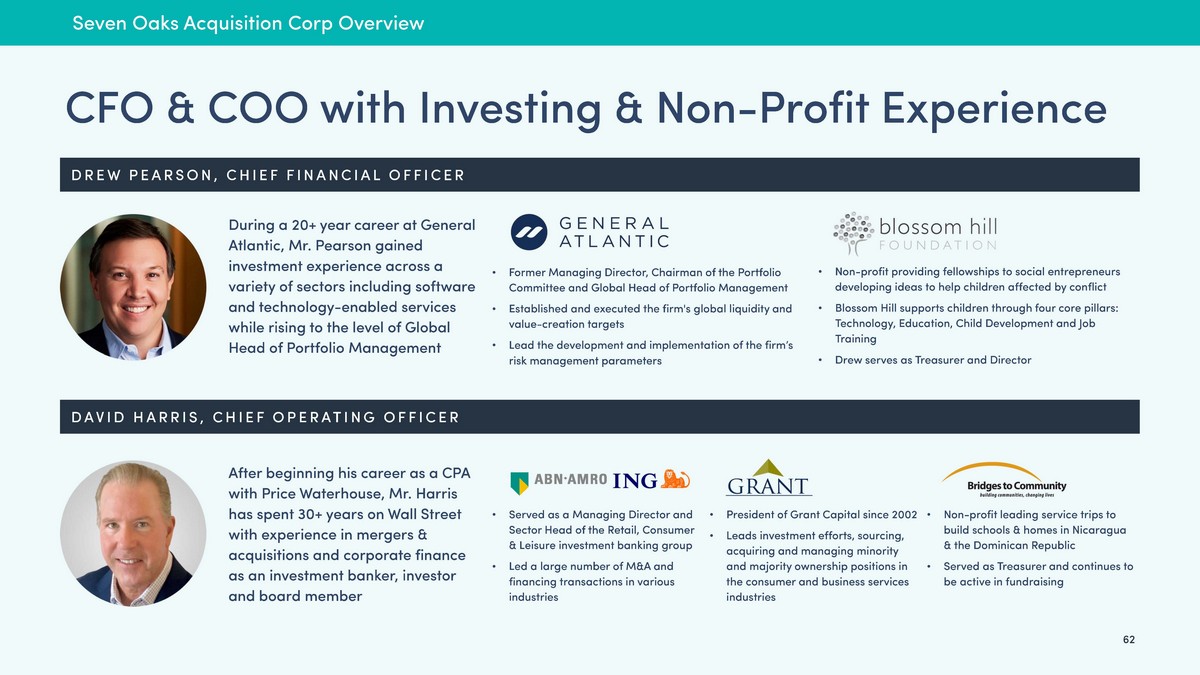
62 DREW PEARSON, CHIEF FINANCIAL OFFICER CFO & COO with Investing & Non - Profit Experience Seven Oaks Acquisition Corp Overview DAVID HARRIS, CHIEF OPERATING OFFICER During a 20+ year career at General Atlantic, Mr. Pearson gained investment experience across a variety of sectors including software and technology - enabled services while rising to the level of Global Head of Portfolio Management After beginning his career as a CPA with Price Waterhouse, Mr. Harris has spent 30+ years on Wall Street with experience in mergers & acquisitions and corporate finance as an investment banker, investor and board member • Former Managing Director, Chairman of the Portfolio Committee and Global Head of Portfolio Management • Established and executed the firm's global liquidity and value - creation targets • Lead the development and implementation of the firm’s risk management parameters • Non - profit providing fellowships to social entrepreneurs developing ideas to help children affected by conflict • Blossom Hill supports children through four core pillars: Technology, Education, Child Development and Job Training • Drew serves as Treasurer and Director • Served as a Managing Director and Sector Head of the Retail, Consumer & Leisure investment banking group • Led a large number of M&A and financing transactions in various industries • President of Grant Capital since 2002 • Leads investment efforts, sourcing, acquiring and managing minority and majority ownership positions in the consumer and business services industries • Non - profit leading service trips to build schools & homes in Nicaragua & the Dominican Republic • Served as Treasurer and continues to be active in fundraising

63 RANDY TUCKER, CHIEF ESG OFFICER First SPAC with a Dedicated Chief ESG Officer 1 Seven Oaks Acquisition Corp Overview Mr. Tucker brings a wealth of managerial experience across a broad range of labor and non - profit organizations emphasizing various ESG principles and social impact missions including diversity, land use, healthcare quality, and access to education. In addition, he also has deep experience in insurance services and managing corporate employee benefits (current Vice President of Employee Benefits at USI Insurance Services). • Started his career with the United Food & Commercial Workers Union in 1995 • Fought for workplace safety for more than 5,000 members • Became Secretary Treasurer in 2004 and Chairman of Health & Pension Funds in 2010 • Chairman & Trustee of the Pension Fund (1) Based on review of SPAC IPOs completed prior to Seven Oaks Acquisition Corp’s IPO in December 2020 • From 2004 to 2012, Randy served under Civil Rights icon Dr. Annie B. Martin as First Vice President of the New York Branch • Randy served as President from 2012 to 2014, over which time he oversaw all monthly Board and membership meetings • Served as Chairman of two Annual Fundraisers • Randy served as Director of Development for Save America’s Parks, helping raise capital to alleviate budgetary challenges • Randy helped arranged for numerous skilled union volunteers to provide labor and other assistance to address backlogged repairs and maintenance projects facing America’s Parks • Vice Chairman of the Tri - State Law Enforcement Foundation, which works with top law enforcement officials in NY, NJ, & CT • The Foundation provides support to families of officers in times of need, offers scholarships to children of fallen officers, and works to foster cooperation between law enforcement agencies and their local community SAVE AMERICA’S PARKS Tri - State Law Enforcement Foundation