Exhibit 99.1
Item 9.01 Financial Statements and Exhibits
(a) Financial statements of businesses or funds acquired
TABLE OF CONTENTS
| 1 |

REPORT OF INDEPENDENT REGISTERED PUBLIC ACCOUNTING FIRM
The Board of Directors and Stockholders
of StarFIN Holdings Limited
OMC Chambers, Wickhams Cay 1,
Road Town, Tortola,
British Virgin Islands
Opinion on the Financial Statements
We have audited the accompanying consolidated balance sheets of StarFIN Holdings Limited (the ‘Company’) as of December 31, 2022 and 2021, and the related statements of operations and comprehensive loss, stockholders’ equity, and cash flows for the year ended December 31, 2022 and 2021, and the related notes (collectively referred to as the “financial statements”). In our opinion, the financial statements present fairly, in all material respects, the financial position of the Company as of December 31, 2022 and 2021, and the results of its operations and its cash flows for the year ended December 31, 2022 and 2021, in conformity with accounting principles generally accepted in the United States of America.
Basis for Opinion
These financial statements are the responsibility of the Company’s management. Our responsibility is to express an opinion on the Company’s financial statements based on our audits. We are a public accounting firm registered with the Public Company Accounting Oversight Board (United States) (“PCAOB”) and are required to be independent with respect to the Company in accordance with the U.S. federal securities laws and the applicable rules and regulations of the Securities and Exchange Commission and the PCAOB.
We conducted our audits in accordance with the standards of the PCAOB. Those standards require that we plan and perform the audit to obtain reasonable assurance about whether the financial statements are free of material misstatement, whether due to error or fraud. The Company is not required to have, nor were we engaged to perform, an audit of its internal control over financial reporting. As part of our audits we are required to obtain an understanding of internal control over financial reporting but not for the purpose of expressing an opinion on the effectiveness of the Company’s internal control over financial reporting. Accordingly, we express no such opinion.
Our audits included performing procedures to assess the risks of material misstatement of the financial statements, whether due to error or fraud, and performing procedures that respond to those risks. Such procedures included examining, on a test basis, evidence regarding the amounts and disclosures in the financial statements. Our audits also included evaluating the accounting principles used and significant estimates made by management, as well as evaluating the overall presentation of the financial statements. We believe that our audits provide a reasonable basis for our opinion.
Critical Audit Matters
Critical audit matters are matters arising from the current period audit of the financial statements that were communicated or required to be communicated to those charged with governance that: (1) relate to accounts or disclosures that are material to the financial statements and (2) involved our especially challenging, subjective, or complex judgements. We determined that there are no critical matters.
| /s/ JP CENTURION & PARTNERS PLT | |
| JP CENTURION & PARTNERS PLT | |
| We have served as the Company’s auditor since 2020. | |
| JP Centurion & Partners PLT (PCAOB: 6723) | |
| Kuala Lumpur, Malaysia | |
| March 3, 2023 |
| 2 |
AUDITED CONSOLIDATED BALANCE SHEETS
AS OF DECEMBER 31, 2022 AND 2021
(Currency expressed in United States Dollars (“US$”), except for number of shares or otherwise stated)
| As of December 31, 2022 | As of December 31, 2021 | |||||||
| ASSETS | ||||||||
| CURRENT ASSETS | ||||||||
| Cash and cash equivalents | $ | 705,480 | $ | 2,080,472 | ||||
| Trade receivables, net | 676,396 | 724,826 | ||||||
| Prepayment, deposits and other receivables | 202,414 | 96,393 | ||||||
| Tax assets | 539,096 | 255,335 | ||||||
| Amount due from related parties | - | 3,258 | ||||||
| TOTAL CURRENT ASSETS | 2,123,386 | 3,160,284 | ||||||
| NON-CURRENT ASSETS | ||||||||
| Right-of-use assets, net | $ | 134,807 | $ | 65,358 | ||||
| Plant and equipment, net | 413,922 | 211,740 | ||||||
| Other investment | 171,894 | - | ||||||
| Deferred income tax assets | 873 | 922 | ||||||
| Investment in Associates | 8,657 | - | ||||||
| TOTAL NON-CURRENT ASSETS | 730,153 | 278,020 | ||||||
| TOTAL ASSETS | $ | 2,853,539 | $ | 3,438,304 | ||||
| LIABILITIES AND STOCKHOLDERS’ EQUITY | ||||||||
| CURRENT LIABILITIES | ||||||||
| Other payables and accrued liabilities | $ | 734,476 | $ | 509,408 | ||||
| Trade payable | 24,736 | 28,325 | ||||||
| Income tax payable | 207,490 | 3,443 | ||||||
| Amount due to director | 283,703 | 1,900 | ||||||
| Amount due to related parties | 1,673 | - | ||||||
| Hire purchase – current portion | 11,601 | 11,820 | ||||||
| Lease liability – current portion | 84,361 | 61,790 | ||||||
| TOTAL CURRENT LIABILITIES | $ | 1,348,040 | $ | 616,686 | ||||
| NON-CURRENT LIABILITIES | ||||||||
| Hire purchase – non-current portion | $ | 4,953 | $ | 17,494 | ||||
| Lease liability – non-current portion | 50,446 | 3,568 | ||||||
| Deferred tax liabilities | 6,034 | 6,377 | ||||||
| TOTAL NON-CURRENT LIABILITIES | 61,433 | 27,439 | ||||||
| TOTAL LIABILITIES | $ | 1,409,473 | $ | 644,125 | ||||
| STOCKHOLDERS’ DEFICIT | ||||||||
| Common stock | $ | 10,000 | $ | 10,000 | ||||
| Additional paid in capital | 2,538,271 | 2,538,271 | ||||||
| Accumulated other comprehensive loss | (333,066 | ) | (184,830 | ) | ||||
| Accumulated (loss)/income | (771,139 | ) | 430,738 | |||||
| TOTAL STOCKHOLDERS’ EQUITY | $ | 1,444,066 | $ | 2,794,179 | ||||
| TOTAL LIABILITIES AND STOCKHOLDERS’ EQUITY | $ | 2,853,539 | $ | 3,438,304 | ||||
See accompanying notes to consolidated financial statements.
| 3 |
AUDITED CONSOLIDATED STATEMENTS OF OPERATIONS AND COMPREHENSIVE LOSS
FOR YEARS ENDED DECEMBER 31, 2022 AND 2021
(Currency expressed in United States Dollars (“US$”), except for number of shares or otherwise stated)
Year ended December 31, 2022 | Year ended December 31, 2021 | |||||||
| REVENUE | $ | 2,854,319 | $ | 3,161,892 | ||||
| COST OF REVENUE | (196,247 | ) | (252,890 | ) | ||||
| GROSS PROFIT | $ | 2,658,072 | $ | 2,909,002 | ||||
| OPERATING EXPENSES | ||||||||
| General and administrative expenses | (2,348,325 | ) | (2,357,968 | ) | ||||
| PROFIT FROM OPERATION BEFORE INCOME TAX | 309,747 | 551,034 | ||||||
| INTEREST INCOME | 10,293 | 17,751 | ||||||
| PROFIT BEFORE INCOME TAX | $ | 320,040 | $ | 568,785 | ||||
| INCOME TAX EXPENSES | (204,149 | ) | (138,047 | ) | ||||
| NET PROFIT | $ | 115,891 | $ | 430,738 | ||||
| Other comprehensive income: | ||||||||
| - Foreign currency translation loss | (148,236 | ) | (184,830 | ) | ||||
| TOTAL COMPREHENSIVE INCOME | $ | 32,345 | $ | 245,908 | ||||
| NET INCOME PER SHARE, BASIC AND DILUTED | 11.59 | 43.07 | ||||||
| WEIGHTED AVERAGE NUMBER OF COMMON SHARES OUTSTANDING, BASIC AND DILUTED | 10,000 | 10,000 | ||||||
See accompanying notes to consolidated financial statements.
| 4 |
AUDITED CONSOLIDATED STATEMENT OF SHAREHOLDERS’ EQUITY
FOR YEARS ENDED DECEMBER 31, 2022 AND 2021
(Currency expressed in United States Dollars (“US$”), except for number of shares or otherwise stated)
| Common Stock | ADDITIONAL | ACCUMULATED | Total STOCKHOLDERS’ | |||||||||||||||||||||
| NUMBER OF Shares | Amount | paid in capital | Accumulated INCOME | comprehensive INCOME/(loss) | EQUITY/ (DEFICIT) | |||||||||||||||||||
| Incorporate on August 19, 2021 | 10,000 | $ | 10,000 | $ | - | $ | - | $ | - | $ | 10,000 | |||||||||||||
| Net profit for the year | - | - | 430,738 | - | 430,738 | |||||||||||||||||||
| Foreign currency translation loss | - | - | - | (184,830 | ) | (184,830 | ) | |||||||||||||||||
| Acquisition of StarFIN Asia Sdn. Bhd. | - | - | 2,538,271 | - | - | 2,538,271 | ||||||||||||||||||
| Balance as of December 31, 2021 | 10,000 | $ | 10,000 | $ | 2,538,271 | $ | 430,738 | $ | (184,830 | ) | $ | 2,794,179 | ||||||||||||
| Net profit for the year | - | - | - | 115,891 | - | 115,891 | ||||||||||||||||||
| Dividend | - | - | - | (1,317,768 | ) | - | (1,317,768 | ) | ||||||||||||||||
| Foreign currency translation loss | - | - | - | - | (148,236 | ) | (148,236 | ) | ||||||||||||||||
| Balance as of December 31, 2022 | 10,000 | $ | 10,000 | $ | 2,538,271 | (771,139 | ) | (333,066 | ) | 1,444,066 | ||||||||||||||
See accompanying notes to consolidated financial statements.
| 5 |
AUDITED CONSOLIDATED STATEMENTS OF CASH FLOWS
FOR YEARS ENDED DECEMBER 31, 2022 AND 2021
(Currency expressed in United States Dollars (“US$”), except for number of shares or otherwise stated)
Year Ended December 31, 2022 | Year Ended December 31, 2021 | |||||||
| CASH FLOWS FROM OPERATING ACTIVITIES: | ||||||||
| Net profit | $ | 115,891 | $ | 430,738 | ||||
| Adjustments to reconcile net profit to net cash used in operating activities: | ||||||||
| Depreciation and amortization | 95,017 | 184,189 | ||||||
| Changes in operating assets and liabilities: | ||||||||
| Account receivable | 49,202 | 8,523 | ||||||
| Prepayment, deposits and other receivables | (124,652 | ) | (52,686 | ) | ||||
| Deferred tax assets | (297,108 | ) | (214,708 | ) | ||||
| Deferred tax liabilities | - | 6,121 | ||||||
| Account payable | (2,066 | ) | (33,376 | ) | ||||
| Accrued liabilities and other payables | 125,871 | (65,257 | ) | |||||
| Receipt in advance | 86,498 | 154,150 | ||||||
| Income tax payable | 203,982 | - | ||||||
| Change in lease liability | (1,364 | ) | (87,869 | ) | ||||
| Net cash used in operating activities | $ | 251,271 | $ | 329,825 | ||||
| CASH FLOWS FROM INVESTING ACTIVITIES: | ||||||||
| Purchase of plant and equipment | $ | (58,916 | ) | $ | (97,572 | ) | ||
| Investment in investment property | (419,711 | ) | - | |||||
| Investment in Associate | (8,646 | ) | - | |||||
| Net cash used in investing activities | $ | (487,273 | ) | $ | (97,572 | ) | ||
| CASH FLOWS FROM FINANCING ACTIVITIES: | ||||||||
| Repayment of hire purchase | $ | (11,172 | ) | $ | (11,086 | ) | ||
| Repayment of amount due to director | 281,458 | 1,031 | ||||||
| Repayment of amount due to related parties | 4,675 | (2,139 | ) | |||||
| Dividend paid | (1,314,488 | ) | (603,821 | ) | ||||
| Net cash generated by/(used in) financing activities | $ | (1,039,527 | ) | $ | (616,015 | ) | ||
| Effect of exchange rate changes in cash and cash equivalents | $ | (99,463 | ) | $ | (85,521 | ) | ||
| Net changes in cash and cash equivalents | $ | (1,374,992 | ) | $ | (469,283 | ) | ||
| Cash and cash equivalents, beginning of year | 2,080,472 | 2,549,755 | ||||||
| CASH AND CASH EQUIVALENTS, END OF YEAR | $ | 705,480 | $ | 2,080,472 | ||||
| SUPPLEMENTAL CASH FLOWS INFORMATION | ||||||||
| Cash paid for income taxes | $ | 203,982 | $ | 138,047 | ||||
| Cash paid for interest paid | $ | 4,395 | $ | 1,500 | ||||
| SUPPLEMENTAL DISCLOSURES OF NON-CASH INVESTING AND FINANCING ACTIVITIES | ||||||||
| Right-of-use assets obtained in exchange for operating lease obligations | $ | 163,956 | $ | 144,486 | ||||
See accompanying notes to consolidated financial statements.
| 6 |
NOTES TO AUDITED CONSOLIDATED FINANCIAL STATEMENTS
FOR YEARS ENDED DECEMBER 31, 2022 AND 2021
(Currency expressed in United States Dollars (“US$”), except for number of shares or otherwise stated)
1. ORGANIZATION AND BUSINESS BACKGROUND
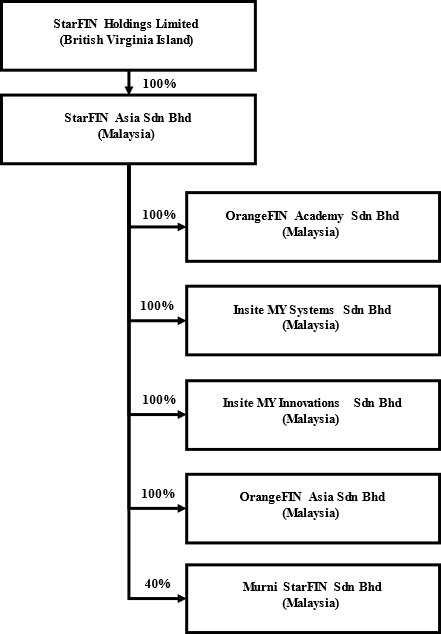
StarFIN Holdings Limited (“the Company”) was incorporated under the jurisdiction of British Virginia Island on August 19, 2021. The Company, through its wholly owned subsidiaries, provides information technology services. Details of the Company’s subsidiaries and associate:
| No. | Subsidiary Company Name | Domicile and Date of Incorporation | Particulars of Issued Capital | Principal Activities | ||||
| 1 | StarFIN Asia Sdn. Bhd. | Malaysia at May 24, 2018 | 11,400,102 shares of common stock | Investment holding company | ||||
| 2 | OrangeFIN Academy Sdn. Bhd. | Malaysia at February 2, 2000 | 100,000 shares of common stock | Provision of business system integration and management services | ||||
| 3 | Insite MY Systems Sdn. Bhd. | Malaysia at January 18, 2000 | 500,000 shares of common stock | Provision of information technology services | ||||
| 4 | Insite MY Innovations Sdn. Bhd. | Malaysia at January 18, 2010 | 540,000 shares of common stock | Provision of information technology services | ||||
| 5 | OrangeFIN Asia Sdn. Bhd. | Malaysia at January 25, 2018 | 50,000 shares of common stock | Provision of computer programming activities and services |
| No. | Associate Company Name | Domicile and Date of Incorporation | Particulars of Issued Capital | Principal Activities | ||||
| 1 | Murni StarFIN Sdn. Bhd. | Malaysia at September 9, 2022 | 100,000 shares of common stock | Provision of information technology services |
On April 30, 2021, StarFIN Asia Sdn. Bhd. acquired 100% of equity interest of OrangeFIN Academy Sdn. Bhd..
On May 5, 2021, StarFIN Asia Sdn. Bhd. acquired 100% of equity interests of both Insite MY Systems Sdn. Bhd. and Insite MY Innovations Sdn. Bhd..
On September 9, 2022, StarFIN Asia Sdn. Bhd. incorporate Murni StarFIN Sdn. Bhd. together PT Murni Solusindo Nusantra, a company incorporated in Indonesia, of which StarFIN Asia Sdn. Bhd. controls 40% and PT Murni Solusindo Nusantra controls 60%.
On September 28, 2022, StarFIN Asia Sdn. Bhd. acquired 100% of equity interest of OrangeFIN Asia Sdn. Bhd..
On January 20, 2023, StarFIN Holdings Limited acquired 100% of equity interest of StarFIN Asia Sdn. Bhd..
Mr. Wong Kai Cheong is the common director of all of aforementioned companies.
| 7 |
2. SUMMARY OF SIGNIFICANT ACCOUNTING POLICIES
Basis of Presentation
These accompanying financial statements have been prepared in accordance with generally accepted accounting principles in the United States of America (“US GAAP”).
The accompanying financial statements include the accounts of the Company and its subsidiaries and associates. Intercompany transactions and balances were eliminated in consolidation. The Company has adopted December 31 as its fiscal year end. Below is the organization chart of the Group.
Use of Estimates
In preparing these financial statements, management makes estimates and assumptions that affect the reported amounts of assets and liabilities in the balance sheets and revenues and expenses during the years reported. Actual results may differ from these estimates.
Cash and Cash Equivalents
The Company considers short-term, highly liquid investments with an original maturity of 90 days or less to be cash equivalents.
Our deposit in Malaysia banks are secured by Perbadanan Insurans Deposit Malaysia, compensating up to a limit of Malaysia Ringgit MYR250,000 per deposit per member bank, which is equivalent to $56,787, if any of our bank fail.
Plant and Equipment
Plant and equipment are stated at cost, with depreciation and amortization provided using the straight-line method over the following periods:
| Asset Categories | Depreciation Periods | |
| Renovation | over the remaining lease period | |
| Computer Systems | 4 to 5 years | |
| Furniture and Fittings | 10 years | |
| Electrical Fittings | 10 years | |
| Handphone | 5 years | |
| Office Equipment | 10 years | |
| Motor Vehicle | 5 years |
| 8 |
Revenue recognition
The Company through subsidiaries generate multiple streams of revenues based on different business model adopted by each subsidiary through provisions of services and recognized upon customer obtained control of promised services and recognized in an amount that reflects the consideration that the Company expects to receive in exchange for those services. In addition, the standard requires disclosure of the nature, amount, timing, and uncertainty of revenue and cash flows arising from contracts with customers. The Company applies the following five-step model in order to determine this amount:
(i) identification of the promised services in the contract;
(ii) determination of whether the promised services are performance obligations, including whether they are distinct in the context of the contract;
(iii) measurement of the transaction price, including the constraint on variable consideration;
(iv) allocation of the transaction price to the performance obligations; and
(v) recognition of revenue when (or as) the Company satisfies each performance obligation.
Cost of revenue
Cost of revenue includes direct costs associated with provision of services such as development costs, purchases of third-party software, maintenance fees and consultation fees.
Income tax expense
Income taxes are determined in accordance with the provisions of ASC Topic 740, “Income Taxes” (“ASC Topic 740”). Under this method, deferred tax assets and liabilities are recognized for the future tax consequences attributable to differences between the financial statement carrying amounts of existing assets and liabilities and their respective tax basis. Deferred tax assets and liabilities are measured using enacted income tax rates expected to apply to taxable income in the years in which those temporary differences are expected to be recovered or settled. Any effect on deferred tax assets and liabilities of a change in tax rates is recognized in income in the period that includes the enactment date.
ASC 740 prescribes a comprehensive model for how companies should recognize, measure, present, and disclosed in their financial statements uncertain tax positions taken or expected to be taken on a tax return. Under ASC 740, tax positions must initially be recognized in the financial statements when it is more likely than not the position will be sustained upon examination by the tax authorities. Such tax positions must initially and subsequently be measured as the largest amount of tax benefit that has a greater than 50% likelihood of being realized upon ultimate settlement with the tax authority assuming full knowledge of the position and relevant facts.
The Company conducts major businesses in Malaysia and is subject to tax in their own jurisdictions. As a result of its business activities, the Company will file separate tax returns that are subject to examination by the foreign tax authorities.
Foreign currencies translation
Transactions denominated in currencies other than the functional currency are translated into the functional currency at the exchange rates prevailing at the dates of the transaction. Monetary assets and liabilities denominated in currencies other than the functional currency are translated into the functional currency using the applicable exchange rates at the balance sheet dates. The resulting exchange differences are recorded in the statement of operations and comprehensive income (loss).
The functional currency of the Company is the United States Dollars (“US$”) and the accompanying financial statements have been expressed in US$. In addition, the Company’s subsidiary maintains its books and record in Malaysia Ringgits (“MYR”) and United States Dollars (“US$”), which is the respective functional currency as being the primary currency of the economic environment in which the entity operates.
In general, for consolidation purposes, assets and liabilities of its subsidiaries whose functional currency is not US$ are translated into US$, in accordance with ASC Topic 830-30, “Translation of Financial Statement”, using the exchange rate on the balance sheet date. Revenues and expenses are translated at average rates prevailing during the period. The gains and losses resulting from translation of financial statements of foreign subsidiary are recorded as a separate component of accumulated other comprehensive income.
| 9 |
Translation of amounts from the local currency of the Company into US$1 has been made at the following exchange rates for the respective periods:
For the year ended December 31 | ||||||||
| 2022 | 2021 | |||||||
| Period-end MYR : US$1 exchange rate | 4.40 | 4.17 | ||||||
| Period-average MYR : US$1 exchange rate | 4.41 | 4.14 | ||||||
Related parties
Parties, which can be a corporation or individual, are considered to be related if the Company has the ability, directly or indirectly, to control the other party or exercise significant influence over the other party in making financial and operating decisions. Companies are also considered to be related if they are subject to common control or common significant influence.
Fair value of financial instruments
The carrying value of the Company’s financial instruments: cash and cash equivalents, trade receivable, deposits and other receivables, amount due to related parties and other payables approximate at their fair values because of the short-term nature of these financial instruments.
The Company also follows the guidance of the ASC Topic 820-10, “Fair Value Measurements and Disclosures” (“ASC 820-10”), with respect to financial assets and liabilities that are measured at fair value. ASC 820-10 establishes a three-tier fair value hierarchy that prioritizes the inputs used in measuring fair value as follows:
Level 1 : Observable inputs such as quoted prices in active markets;
Level 2 : Inputs, other than the quoted prices in active markets, that are observable either directly or indirectly; and
Level 3 : Unobservable inputs in which there is little or no market data, which require the reporting entity to develop its own assumptions.
As of December 31, 2022 and 2021, the Company did not have any nonfinancial assets and liabilities that are recognized or disclosed at fair value in the financial statements, at least annually, on a recurring basis, nor did the Company have any assets or liabilities measured at fair value on a non-recurring basis.
Net Income/(Loss) per Share
The Company calculates net income/(loss) per share in accordance with ASC Topic 260, “Earnings per Share.” Basic income/(loss) per share is computed by dividing the net income/(loss) by the weighted-average number of common shares outstanding during the period. Diluted income per share is computed similar to basic income/(loss) per share except that the denominator is increased to include the number of additional common shares that would have been outstanding if the potential common stock equivalents had been issued and if the additional common shares were dilutive.
Lease
The Company offices for fixed periods pre-emptive extension options. The Company recognizes lease payments for its short-term lease on a straight-line basis over the lease term.
As of December 31, 2022, the Company have five operating leases of which lease liability is initially and subsequently measured at the present value of the unpaid lease payments at the lease commencement date. The right-of-use asset is initially measured at cost, which comprises the initial amount of the lease liability adjusted for lease payments made at or before the lease commencement date, plus any initial direct costs incurred less any lease incentives received. Costs associated with operating lease assets are recognized on a straight-line basis within operating expenses over the term of the lease.
| 10 |
In determining the present value of the unpaid lease payments, ASC 842 requires a lessee to discount its unpaid lease payments using the interest rate implicit in the lease or, if that rate cannot be readily determined, its incremental borrowing rate. As most of the Company leases do not provide an implicit rate, the Company uses its incremental borrowing rate as the discount rate for the lease. The Company incremental borrowing rate is estimated to approximate the interest rate on a collateralized basis with similar terms and payments.
Recently Issued Accounting Standards
In June 2016, the FASB issued ASU 2016-13, Measurement of Credit Losses on Financial Instruments (Topic 326). ASU 2016-13 requires entities to use a forward-looking approach based on current expected credit losses (“CECL”) to estimate credit losses on certain types of financial instruments, including trade receivables. This may result in the earlier recognition of allowances for losses. ASU 2016-13 is effective for the Company beginning January 1, 2023, and early adoption is permitted.
The Company reviews new accounting standards as issued. Management has not identified any other new standards that it believes will have a significant impact on the Company’s financial statements.
3. ACQUISITION OF STARFIN ASIA SDN. BHD. AND OTHER SUBSIDIARIES
Acquisition of OrangeFIN Academy Sdn. Bhd., Insite MY Systems Sdn. Bhd., Insite MY Innovations Sdn. Bhd. and OrangeFIN Asia Sdn. Bhd. by StarFIN Asia Sdn. Bhd.
| Acquisition of OrangeFIN Academy Sdn. Bhd. on April 30, 2021 | |||
| Fair value of consideration | $ | 1 | |
| Registered Capital | (24,861 | ) | |
| Accumulated loss | 40,090 | ||
| Goodwill reclasses to Additional Paid in Capital | $ | 15,230 |
| Acquisition of Insite MY Sytems Sdn. Bhd. on May 5, 2021 | |||
| Fair value of consideration | $ | 720,115 | |
| Registered Capital | (124,304 | ) | |
| Accumulated earnings | (273,406 | ) | |
| Goodwill reclasses to Additional Paid in Capital | $ | 322,405 |
| Acquisition of Insite MY Innovations Sdn. Bhd. on May 5, 2021 | |||
| Fair value of consideration | $ | 1,944,311 | |
| Registered Capital | (134,248 | ) | |
| Accumulated earnings | (1,951,634 | ) | |
| Bargain purchase reclasses to Additional Paid in Capital | $ | (141,571 | ) |
| Acquisition of OrangeFIN Asia Sdn. Bhd. on September 28, 2022 | |||
| Fair value of consideration | $ | 72,012 | |
| Registered Capital | (12,430 | ) | |
| Accumulated earnings | (13,370 | ) | |
| Goodwill reclasses to Additional Paid in Capital | $ | 46,212 |
Acquisition of StarFIN Asia Sdn. Bhd.
| Acquisition of OrangeFIN Asia Sdn. Bhd. on September 28, 2022 | |||
| Fair value of consideration | $ | 9,990 | |
| Registered Capital | (2,834,154 | ) | |
| Accumulated loss | 43,617 | ||
| Bargain purchase reclasses to Additional Paid in Capital | $ | (2,780,547 | ) |
As a result of aforementioned acquisition, the Company reclass $2,538,271 in additional paid in capital for the year ended December 31, 2021.
| 11 |
4. PREPAID EXPENSES AND DEPOSITS
As of December 31, 2022 | As of December 31, 2021 | |||||||
| Rental deposits | $ | 22,976 | $ | 22,839 | ||||
| Prepaid expenses | 19,789 | 10,289 | ||||||
| Other receivables | 32,723 | 13,876 | ||||||
| Other deposits | 6,941 | 49,389 | ||||||
| Unbilled revenue | 119,985 | - | ||||||
| Total | $ | 202,414 | $ | 96,393 | ||||
The rental deposits represent the deposit of the tenancy agreements.
Prepaid expenses include website domain, third party software maintenance and subscription, rental, employee and motor vehicle insurance.
Other receivables include deposits payment made for utility purposes, car park for director.
Other deposits primarily consist of deposit made for purchase of investment property.
5. PLANT AND EQUIPMENT
As of December 31, 2022 | As of December 31, 2021 | |||||||
| Computer systems | $ | 252,276 | $ | 227,455 | ||||
| Furniture and fittings | 82,940 | 82,116 | ||||||
| Electrical fittings | 9,935 | 10,499 | ||||||
| Handphone | 49,644 | 44,692 | ||||||
| Office equipment | 90,807 | 93,553 | ||||||
| Renovation | 82,404 | 79,586 | ||||||
| Motor vehicle | 380,202 | 401,777 | ||||||
| Total plant and equipment | $ | 948,208 | $ | 939,678 | ||||
| Less: Accumulated depreciation | (776,314 | ) | (727,938 | ) | ||||
| Total plant and equipment | $ | 171,894 | $ | 211,740 | ||||
| For the year ended December 31, 2022 | For the year ended December 31, 2021 | |||||||
| Investment in computer systems | $ | 36,989 | $ | 23,945 | ||||
| Investment in furniture and fittings | 5,227 | 304 | ||||||
| Investment in handphone | 7,342 | 2,228 | ||||||
| Investment in office equipment | 2,275 | 1,947 | ||||||
| Investment in motor vehicle | - | 69,148 | ||||||
| Investment in renovation | 7,083 | - | ||||||
| Total investment in property and plant | $ | 58,916 | $ | 97,572 | ||||
| Depreciation for the period | 93,653 | $ | 96,307 | |||||
| 12 |
6. OTHER INVESTMENT
For the year ended December 31, 2022, the Company acquired an investment property amounted $420,225 financed through loan from director which is unsecured, non-interest bearing and payable on demand and cash in hand.
| Investment property | $ | 420,225 | $ | - | ||||
| Less: Accumulated depreciation | (6303 | ) | - | |||||
| Total other investment | $ | 413,922 | $ | - |
7. ACCRUED EXPENSES AND OTHER PAYABLES
As of December 31, 2022 | As of December 31, 2021 | |||||||
| Accrued expenses | $ | 438,972 | $ | 268,583 | ||||
| Other payable | 35,413 | 57,534 | ||||||
| Receipt in advance | 260,091 | 183,291 | ||||||
| Total | $ | 734,476 | $ | 509,408 | ||||
Accrued expenses consist of outstanding audit fee, employee claims and salary, service tax and miscellaneous expenses.
Other payable includes primarily service tax payable.
Receipt in advance consist of monies received from customer but have yet to satisfied performance obligation.
8. AMOUNT DUE TO DIRECTOR
| StarFIN Holdings Limited – Advances from director – Mr. Wong Kai Cheong | $ | 1,900 | ||
| Amount due to director, as of December 31, 2021 | 1,900 | |||
| Insite MY Systems Sdn. Bhd. – Loan from director –– Mr. Wong Kai Cheong | 340,723 | |||
| Insite MY Systems Sdn. Bhd. – Repayment to director –– Mr. Wong Kai Cheong | (54,204 | ) | ||
| Insite MY Systems Sdn. Bhd. – Claims from director –– Mr. Wong Kai Cheong | (2,009 | ) | ||
| OrangeFIN Academy Sdn. Bhd. – Claims from director – Mr. Wong Kai Cheong | 679 | |||
| Insite MY Innovations Sdn. Bhd. – Advances to director – Mr. Hoo Swee Ping | (6,058 | ) | ||
| Insite MY Innovations Sdn. Bhd. - Advances from director – Mr. Hoo Swee Ping | 2,272 | |||
| StarFIN Holdings Limited – Advances from director – Mr. Wong Kai Cheong | 2,000 | |||
| StarFIN Holdings Limtied – Advances from director – Mr. Hoo Swee Ping | 300 | |||
| Amount due to director, as of December 31, 2022 | 283,703 |
Aforementioned amount is unsecured, non-interest bearing and payable on demand.
9. AMOUNT DUE TO A RELATED PARTIES
As of December 31, 2022 and 2021, the Company has an outstanding amount due to Insite MY International, Inc., AsiaFIN Holdings Corp., AsiaFIN Talent Sdn. Bhd. pertaining to miscellaneous expenses made by these related parties on behalf in aggregate amounted $1,673 and $0, respectively.
Aforementioned amount is unsecured, non-interest bearing and payable on demand.
| 13 |
10. HIRE PURCHASE
The outstanding balance of hire purchase loan as of December 31 and March 31, 2022 can be summarized as follow:
| As of December 31, 2020 | $ | 40,332 | ||
| Acquisition of new motor vehicle | 36,006 | |||
| Repayment of hire purchase loan for the year ended December 31, 2021 | (47,024 | ) | ||
| As of December 31, 2021 | $ | 29,314 | ||
| Repayment of hire purchase loan for the year ended December 31, 2022 | (11,172 | ) | ||
| Foreign currency translation difference | (1,588 | ) | ||
| As of December 31, 2022 | $ | 16,554 |
On April 30, 2021, the Company acquired a motor vehicle amounted $69,148 financed by $36,006 hire purchase loan for 36 months at a fixed flat rate of 1.88% per annum with first installment commencing June 5, 2021 and monthly installment amounted approximately $1,063. Remaining balance finance through cash in hand.
Maturities of the loan for each of the two years and thereafter are as follows:
| Year ending December 31 | ||||
| 2023 | $ | 11,601 | ||
| 2024 | $ | 4,953 | ||
| Total | $ | 16,554 |
11. LEASE RIGHT-OF-USE ASSET AND LEASE LIABILITIES
| Right-Of-Use Assets | ||||
| Balance as of December 31, 2020 | $ | 152,685 | ||
| Amortization for the year ended December 31, 2021 | (87,327 | ) | ||
| Balance as of December 31, 2021 | $ | 65,358 | ||
| Recognition of new lease | 163,956 | |||
| Amortization for the year ended December 31, 2022 | (90,886 | ) | ||
| Adjustment for foreign currency translation difference | (3,621 | ) | ||
| Balance as of December 31, 2022 | $ | 134,807 |
| Lease Liability | ||||
| Balance as of December 31, 2020 | $ | 152,685 | ||
| Imputed interest for the year ended December 31, 2021 | 5,369 | |||
| Gross repayment for the year ended December 31, 2021 | (92,696 | ) | ||
| Balance as of December 31, 2021 | $ | 65,358 | ||
| Recognition of new lease | 163,956 | |||
| Imputed interest for the year ended December 31, 2022 | 4,212 | |||
| Gross repayment for the year ended December 31, 2022 | (95,098 | ) | ||
| Adjustment for foreign currency translation difference | (3,621 | ) | ||
| Balance as of December 31, 2022 | $ | 134,807 | ||
| Lease liability current portion | 84,361 | |||
| Lease liability non-current portion | $ | 50,446 |
Other information:
| For the year ended December 31 | ||||||||
| 2022 | 2021 | |||||||
| Cash paid for amounts included in the measurement of lease liabilities: | ||||||||
| Operating cash flow to operating lease | $ | 95,098 | $ | 92,696 | ||||
| Right-of-use assets obtained in exchange for operating lease liabilities | 163,956 | - | ||||||
| Remaining lease term for operating lease (years) | 1.58 | 0.78 | ||||||
| Weighted average discount rate for operating lease | 5.40 | % | 5.40 | % | ||||
| 14 |
12. CONCENTRATION OF RISK
| (a) | Major Customers |
As of December 31, 2022, there were 1 customer who accounted for 10% or more of the Company’s revenues:
| Revenues (US$) | Percentages of Revenues | Accounts Receivable (US$) | ||||||||||
| Hong Leong Bank Bhd. | 310,318 | 10.87 | % | 127,943 | ||||||||
| Total: | 310,318 | 10.87 | % | 127,943 | ||||||||
| (b) | Major Suppliers |
As of December 31, 2022, there were 2 suppliers who accounted for 10% or more of the Company’s purchases:
| Purchases (US$) | Percentages of Purchases | Accounts Payables (US$) | ||||||||||
| Insite MY International, Inc. 1 | 102,514 | 45.99 | % | 20,293 | ||||||||
| DTS Semangat Sdn. Bhd. | 47,540 | 21.33 | % | 1,199 | ||||||||
| Total: | 150,054 | 67.32 | % | 21,492 | ||||||||
As of December 31, 2021, there were 2 suppliers who accounted for 10% or more of the Company’s purchases:
| Purchases (US$) | Percentages of Purchases | Accounts Payables (US$) | ||||||||||
| Insite MY International, Inc. 1 | 70,446 | 27.86 | % | 21,445 | ||||||||
| DTS Semangat Sdn. Bhd. | 50,768 | 20.08 | % | 1,792 | ||||||||
| Total: | 121,214 | 47.94 | % | 23,237 | ||||||||
1 Our Chief Executive Officer, Mr Wong Kai Cheong is a 77.51% shareholder of Insite MY International, Inc. and is a 32.68% shareholder of AsiaFIN Holdings Corp.. Our shareholder, Mr Hoo Swee Ping is a 22.49% shareholder of Insite MY International, Inc. and is a 13.87% shareholder of AsiaFIN Holdings Corp.
13. INCOME TAXES
The income/(loss) before income taxes of the Company for the year ended December 31, 2022 and 2021 were comprised of the following:
| For the year ended December 31 | ||||||||
| 2022 | 2021 | |||||||
| Tax jurisdictions from: | ||||||||
| British Virginia Island (non-taxable jurisdiction) | $ | (2,300 | ) | $ | (1,900 | ) | ||
| Malaysia | 322,340 | 570,685 | ||||||
| Income before income taxes | $ | 320,040 | $ | 568,785 | ||||
Provision for income taxes consisted of the following:
| For the year ended December 31 | ||||||||
| 2022 | 2021 | |||||||
| Current: | ||||||||
| British Virginia Island (non-taxable jurisdiction) | - | - | ||||||
| Malaysia | 204,149 | 138,047 | ||||||
| Effective tax rate | 63.33 | % | 31.91 | % | ||||
| Deferred tax assets: | ||||||||
| British Virginia Island (non-taxable jurisdiction) | - | - | ||||||
| Malaysia | 539,969 | 256,258 | ||||||
| Deferred tax liabilities: | ||||||||
| British Virginia Island (non-taxable jurisdiction) | - | - | ||||||
| Malaysia | 213,524 | 9,820 | ||||||
| 15 |
All Malaysia companies are subject to the Malaysia Corporate Tax Laws at a two-tier corporate income tax rate based on amount of paid-up capital. The 2022 tax rate for company with paid-up capital of MYR2,500,000 (approximately $567,872) or less and that are not part of a group containing a company exceeding this capitalization threshold is 17% on the first MYR600,000 (approximately $136,289) taxable profit with the remaining balance being taxed at 24%.
Of which, Insite MY Systems Sdn. Bhd., OrangeFIN Asia Sdn. Bhd. and Insite MY Innovations Sdn. Bhd. were awarded tier 1 Multimedia Super Corridor (“MSC”) which allows taxpayer to enjoy 100% tax exemption.
14. DIVIDEND
For the year ended December 31, 2021, Insite MY Innovations Sdn. Bhd. and Insite MY Systems Sdn. Bhd., passed a board resolution for declaration of dividend amounted MYR500,000 (approximately $113,574) and MYR2,000,000 (approximately $454,298), respectively to Mr. Wong Kai Cheong and Mr. Hoo Swee Ping, before acquired by StarFIN Asia Sdn. Bhd. on May 5, 2021.
For the year ended December 31, 2022, Insite MY Innovations Sdn. Bhd. and Insite MY Systems Sdn. Bhd., passed a board resolution for declaration of dividend amounted MYR1,700,000 (approximately $385,680) and MYR4,294,000 (approximately $974,182), respectively to StarFIN Asia Sdn. Bhd.. Subsequently, StarFIN Asia Sdn. Bhd. passed a board resolution for declaration of dividend amounted MYR5,794,000 to Mr. Wong Kai Cheong and Mr. Hoo Swee Ping, before acquired by StarFIN Holdings Limited on January 20, 2023.
15. FOREIGN CURRENCY EXCHANGE RATE
The Company cannot guarantee that the current exchange rate will remain stable, therefore there is a possibility that the Company could post the same amount of income for two comparable periods and because of the fluctuating exchange rate post higher or lower income depending on exchange rate converted into US$ at the end of the financial year. The exchange rate could fluctuate depending on changes in political and economic environments without notice.
16. SEGMENT REPORTING
ASC 280, “Segment Reporting” establishes standards for reporting information about operating segments on a basis consistent with the Company’s internal organization structure as well as information about services categories, business segments and major customers in financial statements. The Company has single reportable segment based on business unit, information technology business and two reportable segments based on country, British Virgin Island and Malaysia.
In accordance with the “Segment Reporting” Topic of the ASC, the Company’s chief operating decision maker has been identified as the Chief Executive Officer and President, who reviews operating results to make decisions about allocating resources and assessing performance for the entire Company. Existing guidance, which is based on a management approach to segment reporting, establishes requirements to report selected segment information quarterly and to report annually entity-wide disclosures about products and services, major customers, and the countries in which the entity holds material assets and reports revenue. All material operating units qualify for aggregation under “Segment Reporting” due to their similar customer base and similarities in economic characteristics; nature of products and services; and procurement, manufacturing and distribution processes.
| For the year ended and as of December 31, 2022 | ||||||||
| By Business Unit | Information Technology Business | Total | ||||||
| Revenue | $ | 2,854,319 | $ | 2,854,319 | ||||
| Cost of revenue | (196,247 | ) | (196,247 | ) | ||||
| Gross profit | $ | 2,658,072 | $ | 2,658,072 | ||||
| General and administrative expenses and other income | (2,348,325 | ) | (2,348,325 | ) | ||||
| Profit from operations | 309,747 | 309,747 | ||||||
| Total assets | $ | 2,853,539 | $ | 2,853,539 | ||||
| Capital expenditure | $ | 487,273 | $ | 487,273 | ||||
| 16 |
| For the year ended and as of December 31, 2022 | ||||||||||||
| By Country | British Virginia Island | Malaysia | Total | |||||||||
| Revenue | $ | - | $ | 2,854,319 | $ | 2,854,319 | ||||||
| Cost of revenue | - | (196,247 | ) | (196,247 | ) | |||||||
| Gross profit | $ | - | $ | 2,658,072 | $ | 2,658,072 | ||||||
| General and administrative expenses and other income | (2,300 | ) | (2,346,025 | ) | (2,348,325 | ) | ||||||
| (Loss)/Profit from operations | (2,300 | ) | 312,047 | 309,747 | ||||||||
| Total assets | $ | 10 | $ | 2,853,529 | $ | 2,853,539 | ||||||
| Capital expenditure | $ | - | $ | 487,273 | $ | 487,273 | ||||||
For the year ended and as of December 31, 2021 | ||||||||
| By Business Unit | Information Technology Business | Total | ||||||
| Revenue | $ | 3,161,892 | $ | 3,161,892 | ||||
| Cost of revenue | (252,890 | ) | (252,890 | ) | ||||
| Gross profit | $ | 2,909,002 | $ | 2,909,002 | ||||
| General and administrative expenses and other income | (2,357,968 | ) | (2,357,968 | ) | ||||
| Profit from operations | 551,034 | 551,034 | ||||||
| Total assets | $ | 3,438,304 | $ | 3,438,304 | ||||
| Capital expenditure | $ | 97,572 | $ | 97,572 | ||||
| For the year ended and as of December 31, 2021 | ||||||||||||
| By Country | British Virginia Island | Malaysia | Total | |||||||||
| Revenue | $ | - | $ | 3,161,892 | $ | 3,161,892 | ||||||
| Cost of revenue | - | (252,890 | ) | (252,890 | ) | |||||||
| Gross profit | $ | - | $ | 2,909,002 | $ | 2,909,002 | ||||||
| General and administrative expenses and other income | (1,900 | ) | (2,356,068 | ) | (2,357,968 | ) | ||||||
| (Loss)/Profit from operations | (1,900 | ) | 552,934 | 551,034 | ||||||||
| Total assets | $ | 10 | $ | 3,438,294 | $ | 3,438,304 | ||||||
| Capital expenditure | $ | - | $ | 97,572 | $ | 97,572 | ||||||
17. SUBSEQUENT EVENTS
In accordance with ASC Topic 855, “Subsequent Events”, which establishes general standards of accounting for and disclosure of events that occur after the balance sheet date but before financial statements are issued, the Company has evaluated all events or transactions that occurred after December 31, 2022 up through the date the Company presented these unaudited financial statements.
| 17 |