
Investor Presentation Second Quarter 2021

Forward-Looking Statements 2 This information contains certain forward-looking statements within the meaning of the Private Securities Litigation Reform Act of 1995. Forward-looking statements generally relate to our financial condition, results of operations, plans, objectives, outlook for earnings, revenues, expenses, capital and liquidity levels and ratios, asset levels, asset quality, financial position, and other matters regarding or affecting Carter Bankshares, Inc. and its future business and operations. Forward looking statements are typically identified by words or phrases such as “will likely result,” “expect,” “anticipate,” “estimate,” “forecast,” “project,” “intend,” “ believe,” “assume,” “strategy,” “trend,” “plan,” “outlook,” “outcome,” “continue,” “remain,” “potential,” “opportunity,” “believe,” “comfortable,” “current,” “position,” “maintain,” “sustain,” “seek,” “achieve” and variations of such words and similar expressions, or future or conditional verbs such as will, would, should, could or may. Although we believe the assumptions upon which these forward- looking statements are based are reasonable, any of these assumptions could prove to be inaccurate and the forward-looking statements based on these assumptions could be incorrect. The matters discussed in these forward-looking statements are subject to various risks, uncertainties and other factors that could cause actual results and trends to differ materially from those made, projected, or implied in or by the forward-looking statements depending on a variety of uncertainties or other factors including, but not limited to: changes in accounting policies, practices, or guidance, for example, our adoption of CECL; credit losses; cyber-security concerns; rapid technological developments and changes; the Company’s liquidity and capital positions; the potential adverse effects of unusual and infrequently occurring events, such as weather-related disasters, terrorist acts or public health events (such as the current COVID-19 pandemic), and of governmental and societal responses thereto; these potential adverse effects may include, without limitation, adverse effects on the ability of the Company's borrowers to satisfy their obligations to the Bank, on the value of collateral securing loans, on the demand for the Company's loans or its other products and services, on incidents of cyberattack and fraud, on the Company’s liquidity or capital positions, on risks posed by reliance on third-party service providers, on other aspects of the Company's business operations and on financial markets and economic growth; sensitivity to the interest rate environment including a prolonged period of low interest rates, a rapid increase in interest rates or a change in the shape of the yield curve; a change in spreads on interest-earning assets and interest-bearing liabilities; regulatory supervision and oversight; legislation affecting the financial services industry as a whole, and Carter Bankshares, Inc., in particular; the outcome of pending and future litigation to which the Company is party and the potential impacts thereon, and governmental proceedings; increasing price and product/service competition; the ability to continue to introduce competitive new products and services on a timely, cost-effective basis; managing our internal growth and acquisitions; the possibility that the anticipated benefits from acquisitions cannot be fully realized in a timely manner or at all, or that integrating the acquired operations will be more difficult, disruptive or more costly than anticipated; containing costs and expenses; reliance on significant customer relationships; general economic or business conditions; deterioration of the housing market and reduced demand for mortgages; re-emergence of turbulence in significant portions of the global financial and real estate markets that could impact our performance, both directly, by affecting our revenues and the value of our assets and liabilities, and indirectly, by affecting the economy generally and access to capital in the amounts, at the times and on the terms required to support our future businesses. Many of these factors, as well as other factors, are described in our filings with the Securities and Exchange Commission. Forward-looking statements are based on beliefs and assumptions using information available at the time the statements are made. We caution you not to unduly rely on forward-looking statements because the assumptions, beliefs, expectations and projections about future events may, and often do, differ materially from actual results. Any forward-looking statement speaks only as to the date on which it is made, and we undertake no obligation to update any forward-looking statement to reflect developments occurring after the statement is made.

Non-GAAP Statements 3 Statements included in this press release include non-GAAP financial measures and should be read along with the accompanying tables in our definitions and reconciliations of GAAP to non-GAAP financial measures. This press release and the accompanying tables discuss financial measures, such as adjusted core net income, pre-tax pre-provision income, noninterest income, noninterest expense, adjusted efficiency ratio, and net interest income on a fully taxable equivalent basis, which are all non-GAAP measures. We believe that such non-GAAP measures are useful because they enhance the ability of investors and management to evaluate and compare the Company’s operating results from period to period in a meaningful manner. Non-GAAP measures should not be considered as an alternative to any measure of performance as promulgated under GAAP, nor are they necessarily comparable to non-GAAP performance measures that may be presented by other companies. Investors should consider the Company’s performance and financial condition as reported under GAAP and all other relevant information when assessing the performance or financial condition of the Company’s. Non-GAAP measures have limitations as analytical tools, and investors should not consider them in isolation or as a substitute for analysis of the Company’s results or financial condition as reported under GAAP.

4 TABLE OF CONTENTS Section Title Slides 1 Overview 05-12 2 Financial Highlights 13-20 3 Balance Sheet Transformation 21-25 4 Asset Quality 26-33 5 Deposit Mix & Cost of Funds 34-38 6 Loan Deferral Update 39-40 7 Commercial Loan Portfolio Metrics 41-44 8 PPP Loan Update 45

Overview 01 5

Our Mission At Carter Bank & Trust, we strive to be the preferred lifetime financial partner for our customers and shareholders, and the employer of choice in the communities we are privileged to serve. Our Purpose Enrich lives and enhance communities today, to build a better tomorrow. Our Values Loyalty We serve to build lifetime relationships Care We care, it’s our tradition and what we do best Optimism We work collaboratively, as one team Trustworthiness We act with integrity and speak with respect Innovation We make bold decisions to continuously improve

Bank established denovo in 1974 as First National Bank of Rocky Mount, VA Carter Bank & Trust charter established in 2006 with the merger of ten banks. Carter Bancshares, Inc. holding company established in Q4 2020 with the assets of Carter Bank & Trust. Our Company History 7 As of June 30, 2021 Headquartered in Martinsville, VA 69 Branches* 7 Commercial Centers 3 Corporate Offices in VA and NC Assets $4.1B Loans $2.9B Deposits $3.7B Focused on the Future, a Well-Capitalized Franchise with Momentum New Branches / Markets • Greensboro, NC: Westridge Branch opened May 2021 • Charlottesville, VA: Mill Creek Branch opened Q4 2020 • Commercial Team expansion into Raleigh/Cary and Charlotte, NC

8 Our Leadership Team Litz Van Dyke Chief Executive Officer Wendy Bell Senior Executive Vice President Chief Financial Officer Bradford Langs President Chief Strategy Officer ‘Our leadership team is collaborative and courageous. Together we continue to press forward, through the uncertainties and opportunities, economic, industry or pandemic related. Our mission is not a slogan, it's what we do every day.’ Litz Van Dyke, CEO

North Carolina | Total Deposits: $0.4MM 1 5 2 1 4 13 Charlotte Greensboro Raleigh Durham Fayetteville Non MSA TOTAL CRA Assessment area includes two new counties. Randolph, NC: Greensboro MSA Niagra, NY: Varsity Bank Our Footprint YE 2020 92 Branches YE 2019 101 Branches YE 2018 105 Branches July 2021 69 Branches Branches in VA and NC Metropolitan Statistical Areas June 2021 "We are transforming facilities, talent and delivery in our legacy and strategic growth markets. Shrinking the branch banking footprint, as we grow our digital footprint, is how we will succeed." Wendy Bell, CFO Virginia | Total Deposits: $3.3MM 6 13 7 3 5 22 56 Washington DC Roanoke Lynchburg Charlottesville Blacksburg-Christiansburg Non MSA TOTAL 9

10 PPP Totals # Funded: 650 $ Funded: $51,000,000 March 2021: Municipal bond - Refinance of funds used to make improvements to Laurel Park Middle School & Magna Vista High School in Henry County in VA in which 100% of tracts are LMI or Distressed or Underserved May 2021: Through FHLB membership, the Bank sponsored six Affordable Housing Program applications for a low income housing developer in North Carolina Year end 2020: Since 2016, the Bank reduced pounds of letter paper purchased by 41% and pounds of legal paper purchased by 97% The Bank is identifying & tracking ESG metrics & initiatives and staying abreast of industry standard frameworks and best practices. The following is a sampling of metrics & projects included in the ESG program. YTD 2021: $10 is donated to a designated nonprofit in each community for every checking account opened in 2021. Additionally, the retail teams are partnering with the nonprofits for volunteer service initiatives Our Commitment ESG Coordinator & Advisory Team Identified DEI Advisory Lead Identified & Program Initiated $73,000 paid in Donations/ Sponsorships for YTD 2021 800 Hours of Volunteer Service for YTD 2021

Our Culture of Care 11 Club Care is a biweekly interactive program designed to energize and inspire our teammates. World-class athletes, celebrities and our own heroes share tips for holistic well-being and personal stories of fortitude, resilience and care. $32,000 Contribution to the American Red Cross Q1 2021 CARE Forward is a year-long giving campaign with themed marketing, community activities and a $10 donation to local nonprofits and the American Red Cross for every new checking account opened at Carter Bank & Trust. $32,470 Contribution to 15+ charities and the American Red Cross Q2 2021 After reading a Facebook post, Carter Bank & Trust hero, Jessica Delgado, donates kidney and saves a 13-year old's life.

Strategic Initiatives Update • Ongoing diversification of earning asset mix to maximize yield without increasing risk profile of the Bank. • Renewed focus on noninterest income sources (fee revenue) to supplement the Net Interest Income. • Improved funding cost and deposit mix to reduce reliance on higher cost Certificates of Deposits while simultaneously growing lower cost core Non Maturing Deposits. • Solid liquidity management platform supported by various liquidity sources, both on and off balance sheet. • Actively managing legacy loan issues with adversely classified assets reduction plans in place. • Increase treasury management marketing and sales to grow and retain deposits. • Greater virtual presence with online banking and the Carter On The Go mobile app, especially during the COVID-19 pandemic. • Launched Mortgage to Go Mobile App, a new tool used to streamline our mortgage application process. • Centralized retail consumer loan underwriting and currently implementing automated risk-based decision platform. • Identified strategic growth areas in existing markets for future relocation and/or consolidation. • Opened a new branch in Greensboro, NC, mobilizing talent and resources to increase market and wallet share. • Finalizing plans for a flagship center in Charlotte, NC featuring technology and design innovation to drive efficiency and high performance. Branch, Community, Commercial and Mortgage services will be offered to serve consumers and businesses in this vibrant high-growth market. • ATMs installed at 6 locations; developing roadmap for future installations in key markets across the footprint. Financial Performance Channel Optimization Network Optimization

Financial Highlights 02 13 Insert CB&T photo here

2Q2021 1Q2021 2Q2020 Operational Results Net Interest Income $ 27,203 $ 26,529 $ 26,262 Provision for Credit Losses 967 1,857 5,473 Provision for Unfunded Commitments (603) (282) — Noninterest income 7,238 8,952 6,201 Noninterest expense 27,759 23,605 23,023 Income tax expense 886 926 (488) Net Income $ 5,432 $ 9,375 $ 4,455 Balance Sheet Condition Assets $ 4,120,513 $ 4,142,130 $ 4,151,733 Portfolio loans, net 2,807,335 2,855,003 2,909,939 Securities 843,538 780,032 749,029 Deposits 3,659,341 3,691,521 3,606,707 Shareholders' equity 399,108 387,889 489,059 Balance Sheet and Income Statement 14 Favorable Net Interest Income increased $674K QoQ and $941K YoY due primarily to ongoing reduction in funding costs. Favorable Provision for credit losses declined $(890)K QoQ and $(4.5)M YoY driven by the resolution of our two largest nonperforming credits. Unfavorable Noninterest Expense increased $4.2M QoQ and $4.7M YoY driven by a $3.0M one-time write-down for bank branches closed in Q2 and transferred to OREO. As well as, $523K related to branch consolidation expenses. $ in thousands

2Q2021 1Q2021 2Q2020 Shareholder Ratios Diluted Earnings Per Share (QTD) $ 0.21 $ 0.36 $ 0.17 Diluted Earnings Per Share (YTD) $ 0.56 $ 0.36 $ 0.34 Financial Ratios Return on Assets (YTD) 0.72 % 0.92 % 0.44 % Return on Equity (YTD) 7.62 % 9.72 % 3.71 % Total Capital Ratio 14.66 % 14.14 % 14.57 % Tier I Capital 13.40 % 12.88 % 13.32 % Leverage Ratio 10.23 % 10.16 % 10.30 % Core Efficiency (QTD) 74.86 % 72.36 % 75.17 % Net Interest Margin (FTE)(QTD) 2.79 % 2.78 % 2.83 % Financial / Shareholder Ratios 15 Q2 2021 EPS, ROA, ROE, and Core Efficiency metrics have improved YoY. The QoQ metrics were impacted by the aforementioned one-time charges. The Company continues to recognize a strategic shift in the deposit mix to lower cost funding due to an increase in non-maturing deposits. As a result, the Net Interest Margin (FTE) has shown improvement over the prior quarter.

Capital Management 16 As of June 30, 2021 We adopted CECL effective January 1, 2021 and elected to implement the capital transition relief over the permissible three-year period. • Focus on maintaining a "well capitalized" capital position allowing for the resolution of legacy credit issues. • Establishment of bank holding company provides flexibility and efficiency for potential sub-debt issuance and stock buybacks. • Establishment of a buy-back program as soon as legacy credit issues are resolved. Regulatory Well Capitalized Carter Bankshares 06/30/2021 Excess ($) (In Thousands) 06/30/2021 Common Equity Tier 1 Ratio ("CET1") 6.5 % 13.40 % $219,856 Tier 1 Risk-based Ratio 8.0 % 13.40 % 172,036 Total Risk-based Capital Ratio 10.0 % 14.66 % 148,413 Leverage Ratio 5.0 % 10.23 % 218,332 Critically Undercapitalized Category Tangible equity to total assets ≤2% Capital Conservation Buffer ≥2.5%; composed of CET1

Liquidity 17 (1) For the periods presented above, the Company maintained a secured FHLB Borrowing Facility with FHLB of Atlanta equal to 25% of the Bank's assets approximating $1.0 billion, with available borrow capacity subject to the amount of eligible collateral pledged at any given time. • Continue to maintain a strong liquidity position: ◦ Increased Excess Cash Position during COVID ◦ Majority of Bond Portfolio is unpledged ◦ Ongoing FHLB Collateral Pledging (1) ◦ Maintain 6 Unsecured Lines of Credit June 30, 2021 December 31, 2020 Favorable / (Unfavorable) Cash and Due From Banks $ 41,850 $ 38,535 $ 3,315 Interest-bearing Deposits 72,538 39,954 32,584 Excess Reserves 102,263 163,453 (61,190) Unpledged Investment Securities 697,606 632,724 64,882 Excess Pledged Securities 9,263 7,857 1,406 FHLB Borrowing Availability(1) 547,881 510,533 37,348 Unsecured Lines of Credit 145,000 145,000 — Total Liquidity Sources $ 1,616,401 $ 1,538,056 $ 78,345

Deposit Composition 18 $ in thousands Improving Deposit Mix Reliance on Certificates of Deposit continues to decline with a net decrease of $368.6M (20.19%) from Q2 2020 to Q2 2021 while all Non Maturing Deposit categories showed an increase in ending balances for the same period. For the Period Ending Variance 06/30/21 03/31/21 06/30/20 Quarter Year Lifetime Free Checking $ 720,231 $ 733,291 $ 662,639 $ (13,060) $ 57,592 Interest-Bearing Demand 414,677 384,425 318,903 30,252 95,774 Money Market 405,962 323,008 190,664 82,954 215,298 Savings 661,303 646,722 608,716 14,581 52,587 Certificates of Deposits 1,457,168 1,522,510 1,825,785 (65,342) (368,617) Deposits Held-for-Assumption in Connection with Sale of Bank Branches — 81,565 — (81,565) — Total Deposits $ 3,659,341 $ 3,691,521 $ 3,606,707 $ (32,180) $ 52,634 Total Deposits Composition $3,670 $3,591 $3,504 $3,685 $3,659 3,140 3,066 2,949 2,976 2,939 530 525 555 709 720 Interest-bearing Deposits Noninterest-bearing Deposits YE 2017 YE 2018 YE 2019 YE 2020 Q2 2021 $0 $500 $1,000 $1,500 $2,000 $2,500 $3,000 $3,500 $4,000 DDA - Int.- Bearing 11% CDs 40% DDA - Int. Free 20% Savings 18% Money Market 11% (1) Period end balances. (1)
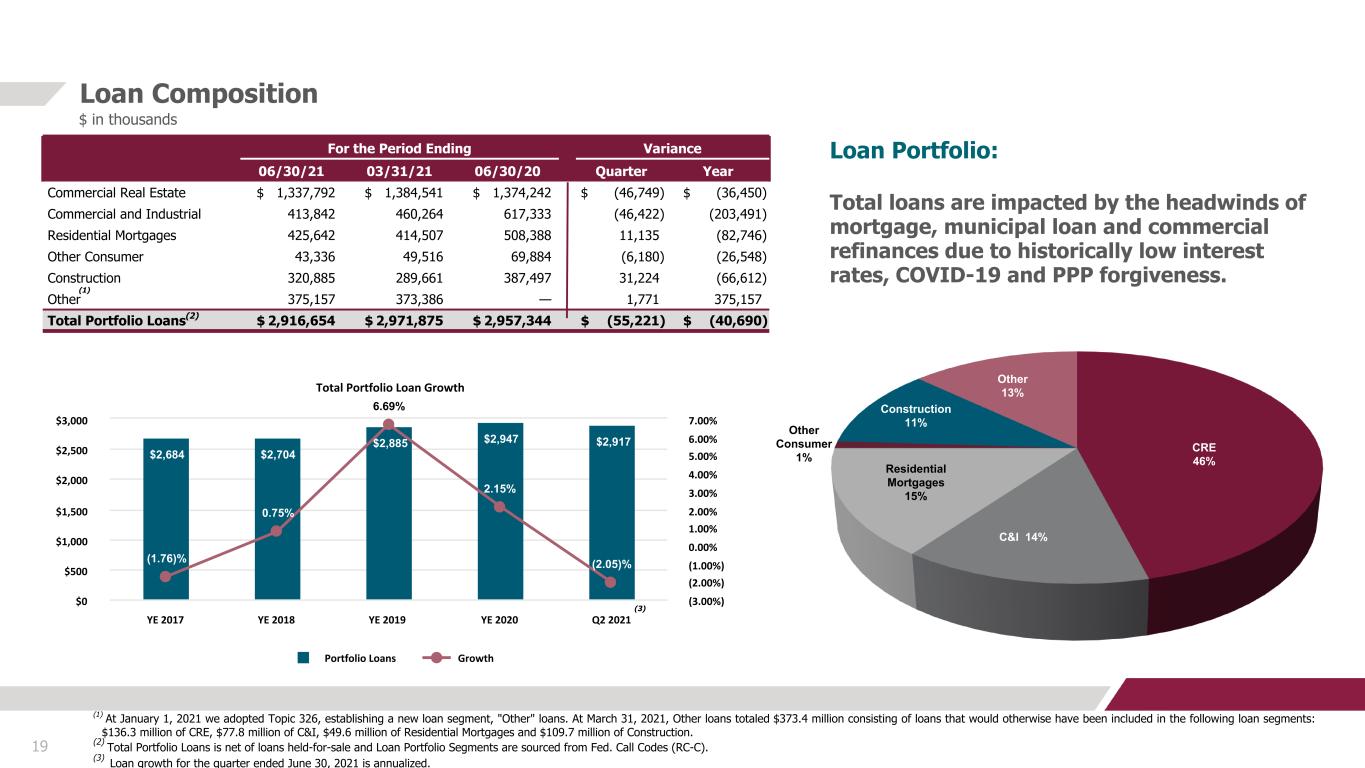
Total Portfolio Loan Growth $2,684 $2,704 $2,885 $2,947 $2,917 (1.76)% 0.75% 6.69% 2.15% (2.05)% Portfolio Loans Growth YE 2017 YE 2018 YE 2019 YE 2020 Q2 2021 $0 $500 $1,000 $1,500 $2,000 $2,500 $3,000 (3.00%) (2.00%) (1.00%) 0.00% 1.00% 2.00% 3.00% 4.00% 5.00% 6.00% 7.00% Loan Composition 19 $ in thousands Loan Portfolio: Total loans are impacted by the headwinds of mortgage, municipal loan and commercial refinances due to historically low interest rates, COVID-19 and PPP forgiveness. For the Period Ending Variance 06/30/21 03/31/21 06/30/20 Quarter Year Commercial Real Estate $ 1,337,792 $ 1,384,541 $ 1,374,242 $ (46,749) $ (36,450) Commercial and Industrial 413,842 460,264 617,333 (46,422) (203,491) Residential Mortgages 425,642 414,507 508,388 11,135 (82,746) Other Consumer 43,336 49,516 69,884 (6,180) (26,548) Construction 320,885 289,661 387,497 31,224 (66,612) Other 375,157 373,386 — 1,771 375,157 Total Portfolio Loans(2) $ 2,916,654 $ 2,971,875 $ 2,957,344 $ (55,221) $ (40,690) Other Consumer 1% CRE 46% C&I 14% Construction 11% Residential Mortgages 15% (1) At January 1, 2021 we adopted Topic 326, establishing a new loan segment, "Other" loans. At March 31, 2021, Other loans totaled $373.4 million consisting of loans that would otherwise have been included in the following loan segments: $136.3 million of CRE, $77.8 million of C&I, $49.6 million of Residential Mortgages and $109.7 million of Construction. (2) Total Portfolio Loans is net of loans held-for-sale and Loan Portfolio Segments are sourced from Fed. Call Codes (RC-C). (3) Loan growth for the quarter ended June 30, 2021 is annualized. (3) Other 13% (1)

20 LOAN PORTFOLIO REPRICING & INDEX Q2 2021 $ in millions (1) Floating Rate Loans are defined as loans with contractual interest rate terms that allow the loan to reprice at lease once each month. (2) Variable Rate Loans are defined as loans with contractual interest rate terms that allow the loan to reprice at least once during the life of the loan agreement, but not more frequently than once per quarter. Loan Portfolio by Rate Type - Q2 2021 Fixed $962 33% Floating $743 25% Variable $1,212 42% Loan Portfolio by Rate Index Type - Q2 2021 Fixed $962 33% Libor $408 14% Prime $366 13% Treasury $1,181 40% $2.92B $2.92B (1) (2)

21 Balance Sheet Transformation 03
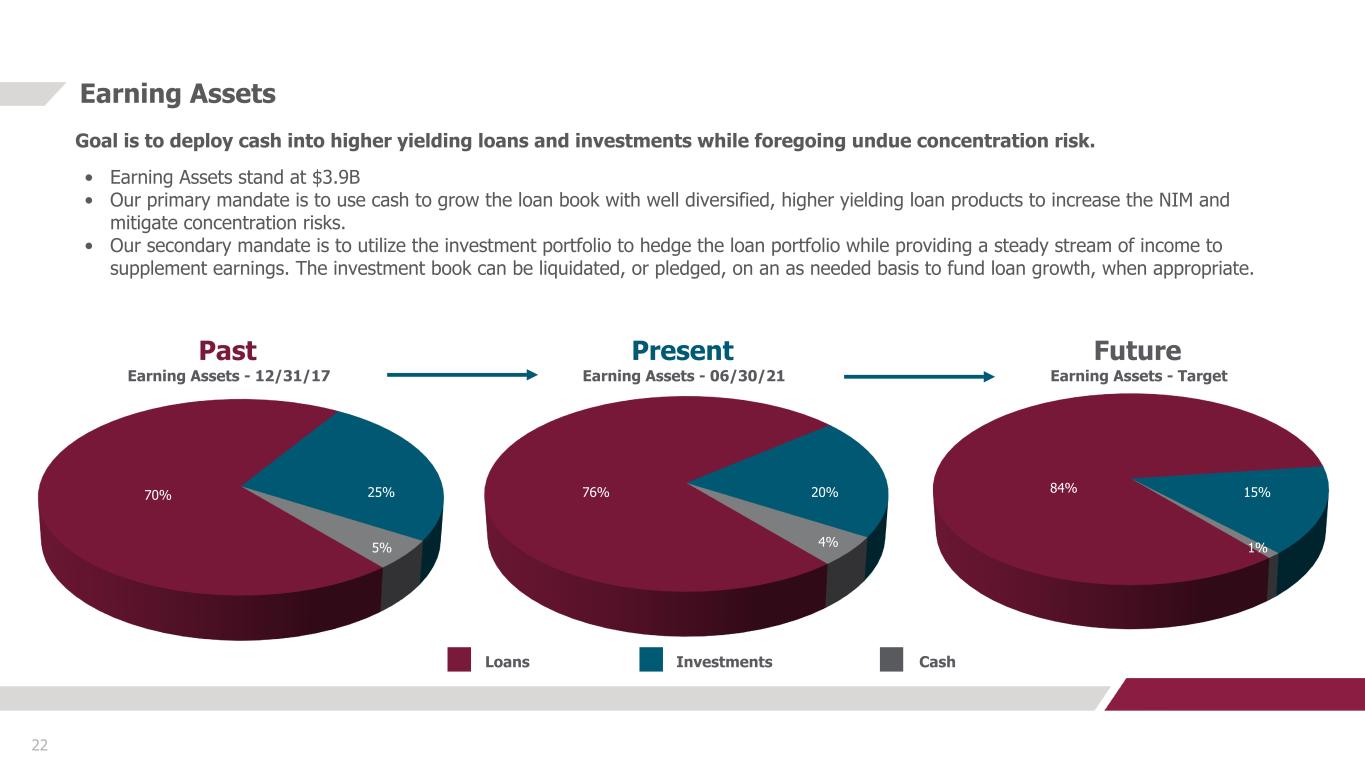
22 Earning Assets Goal is to deploy cash into higher yielding loans and investments while foregoing undue concentration risk. • Earning Assets stand at $3.9B • Our primary mandate is to use cash to grow the loan book with well diversified, higher yielding loan products to increase the NIM and mitigate concentration risks. • Our secondary mandate is to utilize the investment portfolio to hedge the loan portfolio while providing a steady stream of income to supplement earnings. The investment book can be liquidated, or pledged, on an as needed basis to fund loan growth, when appropriate. Past Present Future Loans Investments Cash 70% 76% 84% 15%20%25% 5% 4% 1% Earning Assets - 12/31/17 Earning Assets - 06/30/21 Earning Assets - Target

Commercial Real Estate Commercial & Industrial Residential Mortgages Construction Other Consumer Other(1) 23 Loans Past Present Future 57% 46% 40% 20% 15% 5% 3% 1% 5% Loan Portfolio - 12/31/17 Loan Portfolio - 06/30/21 Loan Portfolio - Target 5% 11% 5% 30% 14% 30% Goal is to further diversify and de-risk the loan portfolio by reducing dependency on CRE loans and increasing C&I loans, consumer loans and single-family mortgages. Increased granularity is also a focus. • Portfolio loans currently stand at $2.9B • Our primary mandate is to always provide solutions to our customers in our footprint. CRE loans will continue to be a foundation of the portfolio • We are layering in additional loan products, tapping previously underutilized markets within the footprint and partnering with new borrowers to help with diversification, utilizing excess liquidity and maximizing the NIM 13% (1) In connection with our adoption of Topic 326, we made changes to our loan portfolio segments to align with the methodology applied in determining the allowance under CECL. Our new segmentation breaks out Other loans from our original loan segments: CRE, C&I , residential mortgages, other consumer and construction.

Muni MBS Corporates Agencies & Treasuries ABS SBA CMBS CMO 24 Bond Portfolio Past Present Future 7% 8% 25% 41% 16% 10% Bond Portfolio - 06/30/17 Bond Portfolio - 06/30/21 Bond Portfolio - Target 10% 34% 27% 28% 15% 5% 31% 12% 25% Goal is to increase diversification, maintain strong credit quality, and improve performance versus peer group. • Portfolio stands at $843.5M, or about 20.5% of total assets, target is 15-22% of total assets • Per the charts, diversification has improved significantly over the past several years • The portfolio is now about 50% floating rate (versus 0% floating rate two years ago) • All bonds are “available-for-sale”, and can be used for liquidity and pledging purposes as needed (1) At June 30, 2021, Asset Backed Securities (ABS) represented approximately 16% of the entire Bond Portfolio and were further diversified into the following sub-segments (presented as a percentage of the entire Bond Portfolio): 1) ABS- Student Loans 10.6%, 2) ABS - CLO 5.4%, 3) ABS - Consumer 0.4%, and 4) ABS - SBA 0.1%. 1% 2% 2% (1) 1%

CDs DDA - Int. Free DDA - Int. Bearing Money Markets Savings 25 Deposits Past Present Future 56% 40% 35% 15%11%3% 10% Deposit Mix - 12/31/17 Deposit Mix - 06/30/21 Deposit Mix - Target 20% 18% 15% 7% 20% 25% 14% 11% Goal is to restructure and diversify funding sources with a focus on lower cost/core relationships (both retail and commercial): • Deposits currently stand at $3.7B • Dependence on CDs has significantly declined, and maturities and pricing are proactively managed on a weekly basis • Multiple strategies are in place to grow all non maturity deposit accounts with a focus on lower cost of funds • New product launches include mobile/online banking, Treasury Management, Instant Open, Card Valet, Click Switch, ATM Network, etc.

Asset Quality 04 26 Insert CB&T photo here
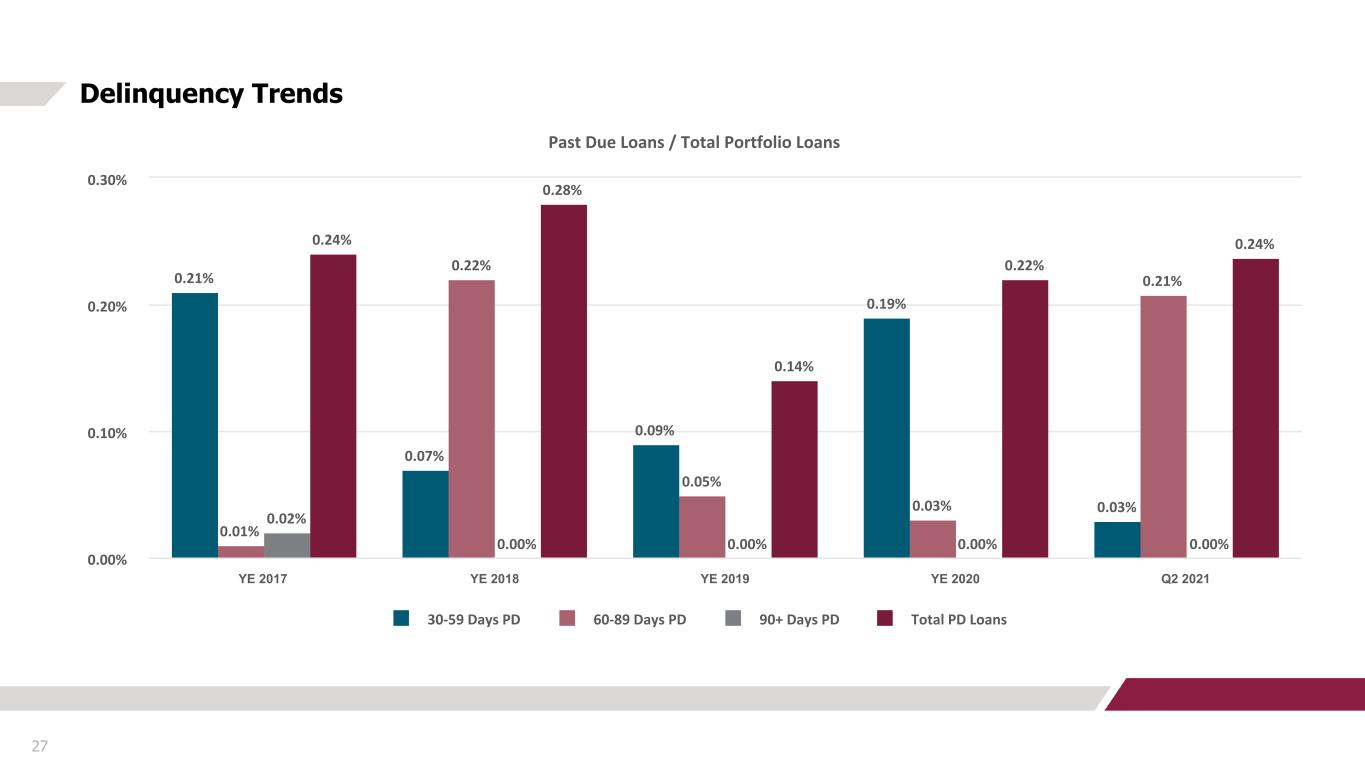
27 Delinquency Trends Past Due Loans / Total Portfolio Loans 0.21% 0.07% 0.09% 0.19% 0.03% 0.01% 0.22% 0.05% 0.03% 0.21% 0.02% 0.00% 0.00% 0.00% 0.00% 0.24% 0.28% 0.14% 0.22% 0.24% 30-59 Days PD 60-89 Days PD 90+ Days PD Total PD Loans YE 2017 YE 2018 YE 2019 YE 2020 Q2 2021 0.00% 0.10% 0.20% 0.30%
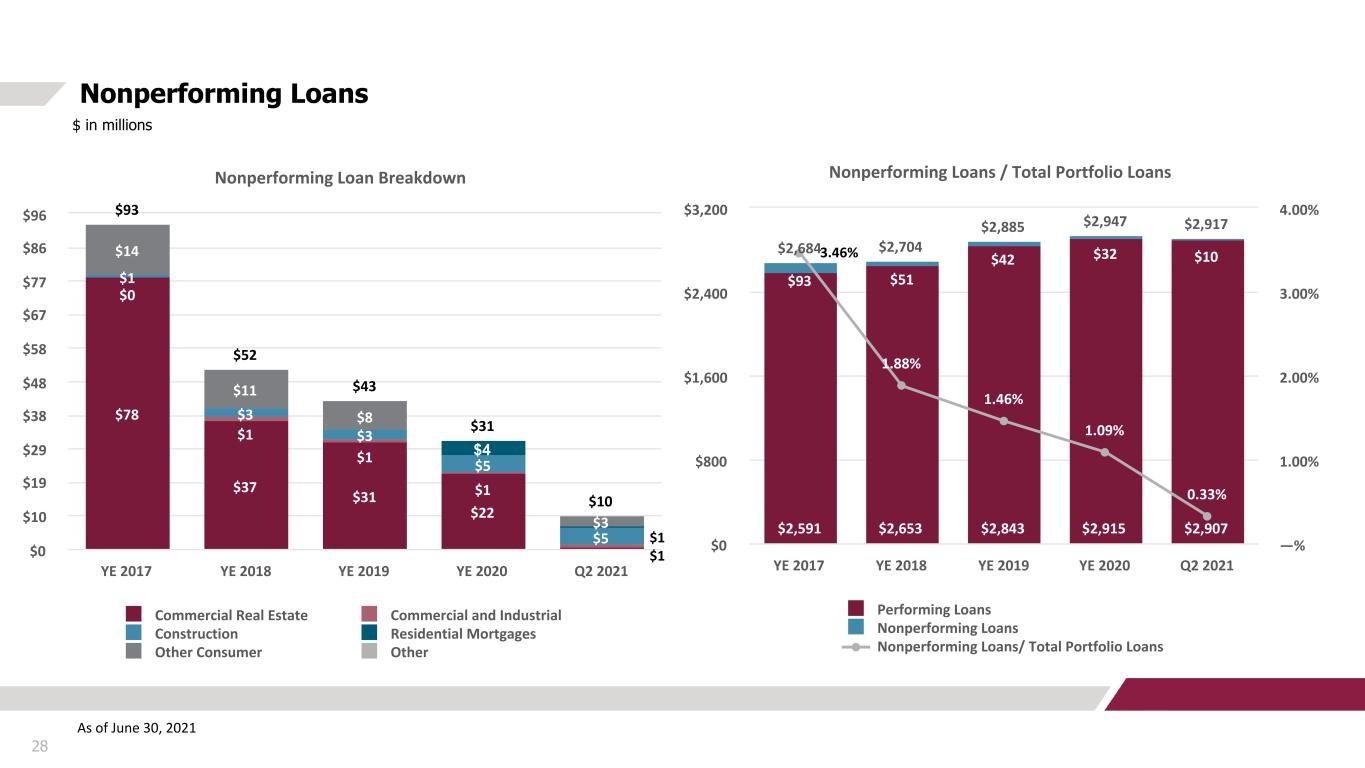
Nonperforming Loan Breakdown $93 $52 $43 $31 $10 $78 $37 $31 $22 $0 $1 $1 $1 $1 $1 $3 $3 $5 $5 $4 $14 $11 $8 $3 Commercial Real Estate Commercial and Industrial Construction Residential Mortgages Other Consumer Other YE 2017 YE 2018 YE 2019 YE 2020 Q2 2021 $0 $10 $19 $29 $38 $48 $58 $67 $77 $86 $96 28 Nonperforming Loans $ in millions As of June 30, 2021 Nonperforming Loans / Total Portfolio Loans $2,684 $2,704 $2,885 $2,947 $2,917 $2,591 $2,653 $2,843 $2,915 $2,907 $93 $51 $42 $32 $10 1.88% 1.46% 1.09% 0.33% Performing Loans Nonperforming Loans Nonperforming Loans/ Total Portfolio Loans YE 2017 YE 2018 YE 2019 YE 2020 Q2 2021 $0 $800 $1,600 $2,400 $3,200 —% 1.00% 2.00% 3.00% 4.00% 3.46% $1 $1

29 Nonperforming Relationships $ in thousands Type Nonaccrual Balance 6/30/21 Nonaccrual Balance 3/31/21 Variance Q1 2021 to Q4 2020 Comments 1. Construction $1,741 $1,741 $0 Commercial lot development 2. Construction $1,739 $1,739 $0 Residential lot developer; has a specific reserve of $1.5 million as of 6/30/2021 3. Construction $1,332 $1,332 $0 Residential lot developer 4. Residential $846 $859 ($13) Residential mortgage loan 5. CRE $324 $327 ($3) Owner Occupied Commercial property Subtotal: Top 5 Nonaccrual Loans $5,982 $5,998 ($16) Total Nonaccrual Loans $9,568 $31,956 ($22,388) During the 2nd quarter 2021, our two largest nonperforming credits were resolved, resulting in a reduction of $17.8 million and $3.5 million.Top 5 Nonaccrual Loans / Total Nonaccrual Loans 62.52 % 18.77 % 43.75 % Total Portfolio Loans $2,916,654 $2,971,875 ($55,221) Total Nonaccrual Loans / Total Portfolio Loans 0.33 % 1.08 % (0.75) % As of June 30, 2021

Nonperforming Assets $133 $84 $60 $48 $31 $40 $33 $18 $16 $21 $42 $47 $35 $25 $3 $51 $4 $7 $7 $7 OREO Nonperforming TDRs Nonperforming Loans YE 2017 YE 2018 YE 2019 YE 2020 Q2 2021 $0 $14 $28 $42 $56 $70 $84 $98 $112 $126 $140 30 Nonperforming Assets $ in millions As of June 30, 2021 (1) During the 2nd quarter of 2021 twenty branch closures were completed. These branches were marked to fair value and transferred to OREO in the amount of $9.0 million, net. Nonperforming Assets / Total Assets $4,112 $4,040 $4,006 $4,179 $4,121 $133 $84 $60 $48 $31 3.23% 2.09% 1.51% 1.14% 0.75% Total Assets Nonperforming Assets Nonperforming Assets / Total Assets YE 2017 YE 2018 YE 2019 YE 2020 Q2 2021 $0 $600 $1,200 $1,800 $2,400 $3,000 $3,600 $4,200 $4,800 0.0% 1.0% 2.0% 3.0% 4.0% (1)

Portfolio Credit Quality Trend $2,684 $2,704 $2,885 $2,947 $2,917 $1,868 $2,232 $2,451 $2,523 $2,470 $719 $461 $430 $238 $243$97 $186 $204 Pass Substandard Special Mention YE 2017 YE 2018 YE 2019 YE 2020 Q2 2021 $0 $1,000 $2,000 $3,000 $4,000 Non-Pass Credit Quality Trend $816 $472 $434 $424 $447 $719 $461 $430 $238 $243 $97 $186 $204 Substandard Special Mention YE 2017 YE 2018 YE 2019 YE 2020 Q2 2021 $0 $250 $500 $750 $1,000 31 Loan Portfolio – Risk Ratings $ in millions *Excludes loans held-for-sale As of June 30, 2021 $11 $4 $11 $4

32 Net Charge-off & Provision Expense Trends $ in thousands As of June 30, 2021 (1) Net charge-offs for the 2nd quarter of 2021 consist of $6.3 million and $1.9 million for the resolution of our two largest nonperforming credits of which $13.1 million was previously reserved. $42,379 $12,989 $3,841 $2,694 $9,221 $43,197 $16,870 $3,404 $18,006 2,824 1.56% 0.47% 0.13% 0.09% 0.63% Net Charge-offs Provision Expense Net Charge-offs (annualized)/ Average Loans YE 2017 YE 2018 YE 2019 YE 2020 Q2 2021 $0 $5,000 $10,000 $15,000 $20,000 $25,000 $30,000 $35,000 $40,000 $45,000 0.00% 0.50% 1.00% 1.50% 2.00% (1)

33 ACL Composition & ACL Coverage Ratio Trends $ in thousands As of June 30, 2021 (1) Included in the three months ended March 31, 2021 is the $61.6 million Day 1 adjustment related to the adoption ASU No. 2016-13, “Financial Instruments – Credit Losses (Topic 326): Measurement of Credit Losses on Financial Instruments”. Refer to the Company's Form 10-Q filed with the Securities and Exchange Commission ("SEC") for more details. $35,286 $34,000 $32,593 $38,824 $101,870 $107,446 $32 $5,199 $6,169 $15,250 $15,002 $1,873 1.32% 1.45% 1.34% 1.83% 3.93% 3.75% General Reserves Specific Reserves ACL to Total Portfolio Loans YE 2017 YE 2018 YE 2019 YE 2020 Q1 2021 Q2 2021 $0 $30,000 $60,000 $90,000 $120,000 0.0% 1.0% 2.0% 3.0% 4.0% $35,318 $39,199 $38,762 $54,074 $116,872 (1) $109,319
34 Deposit Mix and Cost of Funds 05

Total Deposit Composition $3,669 $3,592 $3,504 $3,685 $3,659 3,139 3,067 2,949 2,976 2,939 530 525 555 709 720 Interest-bearing deposits Nonnterest-bearing deposits YE 2017 YE 2018 YE 2019 YE 2020 Q2 2021 $0 $500 $1,000 $1,500 $2,000 $2,500 $3,000 $3,500 $4,000 35 Deposits $ in millions (1) (1) Period end balances.

Interest-bearing Deposit Composition & Deposit Rates $3,312 $3,097 $3,020 $2,937 $2,940 $2,199 $2,090 $2,054 $1,819 $1,566 $727 $664 $582 $600 $651 $245 $247 $249 $321 $392 $141 $96 $135 $197 $331 Certificates of Deposit Savings Interest-bearing Deposits Money Market Deposit Rate YE 2017 YE 2018 YE 2019 YE 2020 Q2 2021 $0 $500 $1,000 $1,500 $2,000 $2,500 $3,000 $3,500 $4,000 —% 0.40% 0.80% 1.20% 1.60% 36 Deposits $ in millions (1) Deposit rates and interest bearing deposit balances presented above are year-to-date averages for periods ending YE 2017 – YE 2020. (1) 1.12% 1.23% 1.21% 0.83% 1.54%

Total Deposits and Cost of Deposits $3,485 $3,570 $3,617 $3,641 $3,665 $3,681 $2,934 $2,919 $2,949 $2,946 $2,954 $2,926 $551 $651 $668 $695 $711 $755 Interest-bearing Deposits Noninterest-bearing Deposits Total Cost of Deposits Q1 2020 Q2 2020 Q3 2020 Q4 2020 Q1 2021 Q2 2021 $0 $1,000 $2,000 $3,000 $4,000 0.60% 0.80% 1.00% 1.20% 1.40% 37 Total Deposits & Total Cost Of Deposits $ in millions (1) Quarterly Average Balances (2) Total Cost of Deposits incorporates the noninterest-bearing demand deposits with the rate on total interest-bearing deposits to illustrate the impact of those free funds on the overall cost of deposits (2) (1) 1.04% 1.21% 0.93% 0.79% 0.70% 0.63%

38 Net Interest Margin (1) Cost of Funds incorporates the free funds contribution with the rate on total interest-bearing liabilities to illustrate the impact of noninterest-bearing liabilities on the overall cost of funds (2) Net Interest Margin has been computed on a fully taxable equivalent basis (FTE) using 35% federal income tax statutory rate for 2017 and 21% federal income tax statutory rate for 2018 through 2021. 0.90% 1.01% 1.23% 0.94% 0.63% 3.70% 4.11% 4.28% 3.74% 3.41% 2.80% 3.10% 3.05% 2.80% 2.78% Total Cost of Funds Yield on Interest-earning Assets Net Interest Margin YE 2017 YE 2018 YE 2019 YE 2020 YTD Q2 2021 0.00% 0.80% 1.60% 2.40% 3.20% 4.00% 0.00% 1.00% 2.00% 3.00% 4.00% 5.00% (1) (2)

39 Loan Deferral Update 06

40 COVID-19 Loan Deferral Program Update The Company has offered loan deferrals in three parts: ◦ Deferrals allow the operating company and its principals to preserve liquidity and develop strategies to operate at a lower break even level to ensure long term survival ◦ The Part I program began in March 2020 and expired August 31, 2020 ◦ The Part II program began in August 2020 and expired on December 31, 2020 ◦ The Part III program began in December 2020 and expired on June 30, 2021 ◦ Operating companies in the Part III program were required to provide monthly statements and were subject to cash flow recapture payments ◦ The majority of these companies reported improved cash flows through Q121; recapture payments due of $2.2MM of which $1.8MM was collected to date ◦ June 2021 operating statements are due at the end of July ◦ To date, 70% of the operating companies in the Part III program have remitted their July 2021 contractual payment ◦ We expect the majority of our clients to resume regularly scheduled payments

41 Commercial Loan Portfolio Metrics 07

25% 16% 15% 11% 9% 9% 7% 5% 3% 42 CRE Segment Overview By Collateral Code ($ in thousands) (1) Other CRE & Other Commercial Construction Segments include, but are not limited to, Special / Limited Use, Church, Mobile Home Park, Gas Station, Self-Storage Facilities, Auto Shops As of June 30, 2021 Segment Categories CRE Portfolio Balance Percentage of Total Balance Hotel $486,381 25 % Multifamily 312,843 16 % Retail/Restaurant 307,686 15 % Land 223,789 11 % Other 175,760 9 % Office 174,327 9 % Warehouse 140,037 7 % Single Family 101,670 5 % Country Club 59,327 3 % Grand Total $1,981,820 100 % $2.0B (1)

38% 32% 12% 12% 3% 2% 1% 43 Hospitality Metrics By State $ in thousands As of June 30, 2021 State Hospitality Portfolio Balance Percentage of Total Balance Avg. LTV Avg. GL Balance Size Avg. of Debt per Key - Total Commitment NC $185,048 38 % 61.7 % $4,513 $69 SC 156,006 32 % 61.3 % 6,240 90 VA 59,434 12 % 24.9 % 14,858 67 WV 57,018 12 % 55.4 % 3,168 80 FL 12,697 3 % 64.6 % 6,349 121 GA 11,728 2 % 61.9 % 5,864 68 TN 4,450 1 % 45.9 % 4,450 22 Total $486,381 100 % 56.3 % $5,170 $76 $486.4M

27% 24% 14% 12% 7% 5% 4% 4% 3% 44 Hospitality Metrics By Brand $ in thousands Brand Hospitality Portfolio Balance Percentage of Total Balance Avg. LTV Avg. GL Balance Size Avg. of Debt per Key - Total Commitment Hilton $132,367 27 % 63.6 % $8,824 $101 IHG 116,000 24 % 60.4 % 5,273 65 Marriott 69,979 14 % 56.8 % 7,775 79 Upscale Independent/ Boutique 57,520 12 % 28.3 % 28,760 75 Wyndham 36,556 7 % 63.2 % 2,611 46 Choice 22,803 5 % 56.5 % 2,850 156 Independent 19,595 4 % 55.0 % 2,177 31 Best Western 17,359 4 % 49.2 % 2,170 30 Other 14,202 3 % 56.8 % 2,367 41 Total $486,381 100 % 56.3 % $5,170 $76 As of June 30, 2021 $486.4M
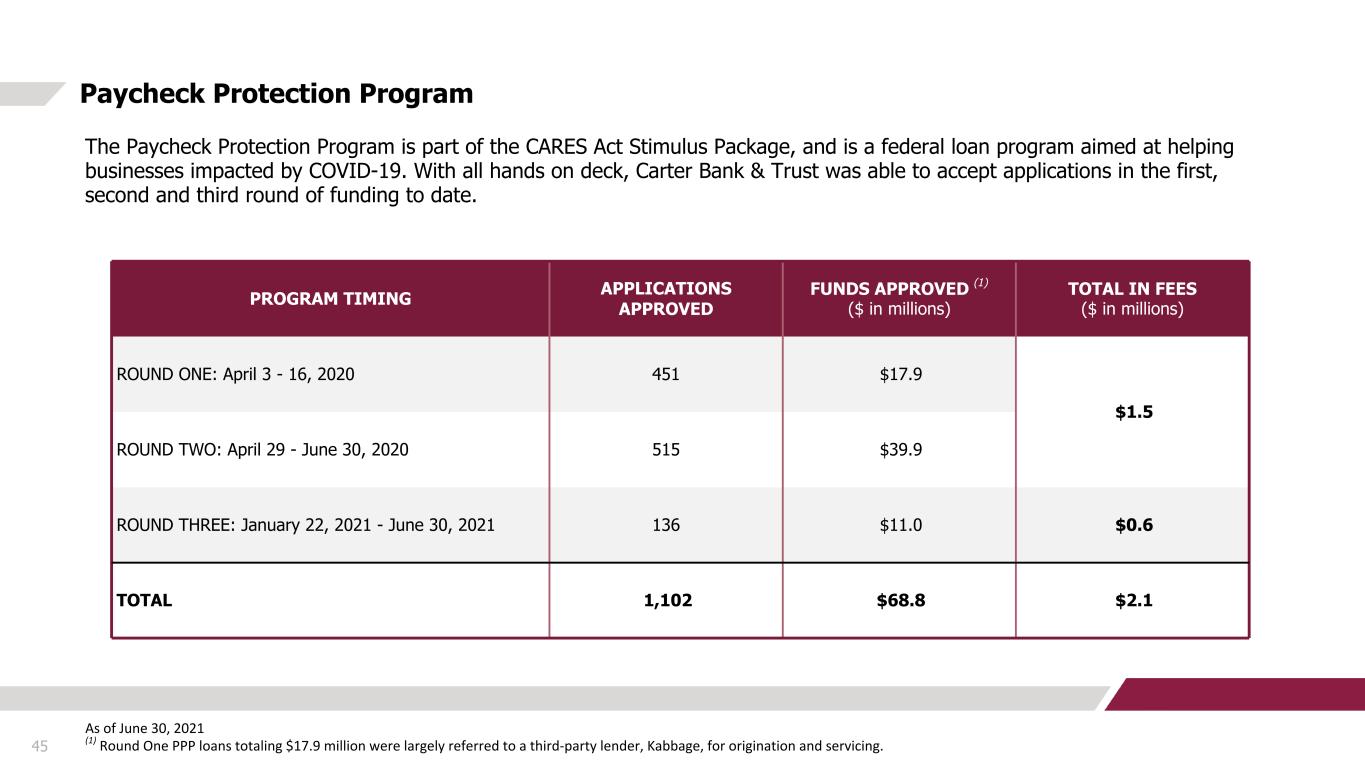
Paycheck Protection Program PROGRAM TIMING APPLICATIONS APPROVED FUNDS APPROVED (1) ($ in millions) TOTAL IN FEES ($ in millions) ROUND ONE: April 3 - 16, 2020 451 $17.9 $1.5 ROUND TWO: April 29 - June 30, 2020 515 $39.9 ROUND THREE: January 22, 2021 - June 30, 2021 136 $11.0 $0.6 TOTAL 1,102 $68.8 $2.1 45 The Paycheck Protection Program is part of the CARES Act Stimulus Package, and is a federal loan program aimed at helping businesses impacted by COVID-19. With all hands on deck, Carter Bank & Trust was able to accept applications in the first, second and third round of funding to date. As of June 30, 2021 (1) Round One PPP loans totaling $17.9 million were largely referred to a third-party lender, Kabbage, for origination and servicing.


