Exhibit 99.6
| ANNUAL REPORT 2020 |

| All financial amounts in this Annual Report are in Canadian dollars unless stated otherwise. |

| About CI Financial 2 2020 At a Glance 5 Financial Highlights 5 Operating Highlights 5 Letter to Shareholders 6 Subsidiary Profiles 14 Asset Management 14 Wealth Management 17 Corporate Social Responsibility Report 24 TABLE OF CONTENTS |
| CI Financial Corp. is an independent, diversified global asset and wealth management company operating in Canada, the United States and Australia. Since 1965, we have been driven by a commitment to provide our clients with the highest-quality investments and advice. We have $139 billion in assets under management and $102 billion in wealth management assets for total assets of $241 billion (as at March 31, 2021). We are guided by our core beliefs that active management adds value to clients’ portfolios and that investors benefit from working with professional financial advisors. CI has been listed on the Toronto Stock Exchange under the symbol CIX since June 1994 and on the New York Stock Exchange under the symbol CIXX since November 2020. ABOUT CI FINANCIAL |
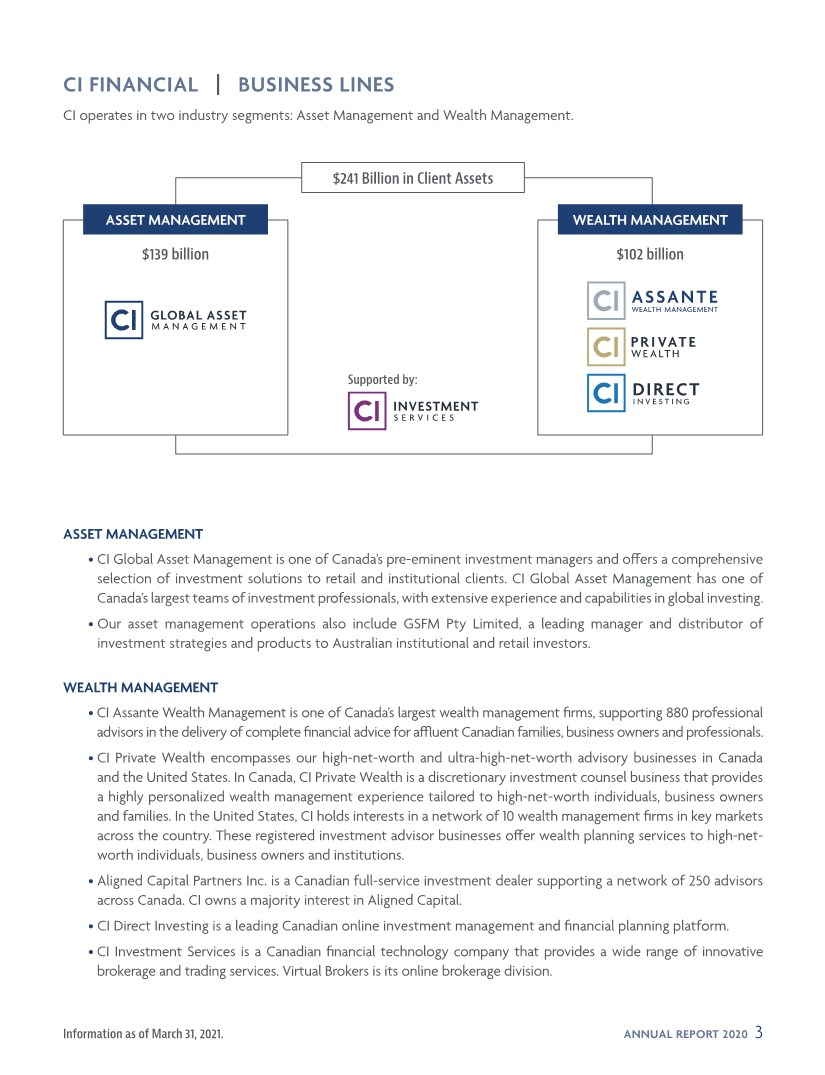
| ANNUAL REPORT 2020 3 ASSET MANAGEMENT • CI Global Asset Management is one of Canada’s pre-eminent investment managers and offers a comprehensive selection of investment solutions to retail and institutional clients. CI Global Asset Management has one of Canada’s largest teams of investment professionals, with extensive experience and capabilities in global investing. • Our asset management operations also include GSFM Pty Limited, a leading manager and distributor of investment strategies and products to Australian institutional and retail investors. WEALTH MANAGEMENT • CI Assante Wealth Management is one of Canada’s largest wealth management firms, supporting 880 professional advisors in the delivery of complete financial advice for affluent Canadian families, business owners and professionals. • CI Private Wealth encompasses our high-net-worth and ultra-high-net-worth advisory businesses in Canada and the United States. In Canada, CI Private Wealth is a discretionary investment counsel business that provides a highly personalized wealth management experience tailored to high-net-worth individuals, business owners and families. In the United States, CI holds interests in a network of 10 wealth management firms in key markets across the country. These registered investment advisor businesses offer wealth planning services to high-net- worth individuals, business owners and institutions. • Aligned Capital Partners Inc. is a Canadian full-service investment dealer supporting a network of 250 advisors across Canada. CI owns a majority interest in Aligned Capital. • CI Direct Investing is a leading Canadian online investment management and financial planning platform. • CI Investment Services is a Canadian financial technology company that provides a wide range of innovative brokerage and trading services. Virtual Brokers is its online brokerage division. CI FINANCIAL | BUSINESS LINES CI operates in two industry segments: Asset Management and Wealth Management. $102 billion $139 billion $241 Billion in Client Assets WEALTH MANAGEMENT ASSET MANAGEMENT Supported by: Information as of March 31, 2021. |
| 4 ANNUAL REPORT 2020 CI FINANCIAL DIRECTORS Kurt MacAlpine Chief Executive Officer and Director David P. Miller Director William T. Holland Chairman of the Board Tom P. Muir Director William (Bill) Butt Director Sheila A. Murray Director Brigette Chang-Addorisio Director Paul J. Perrow Director |

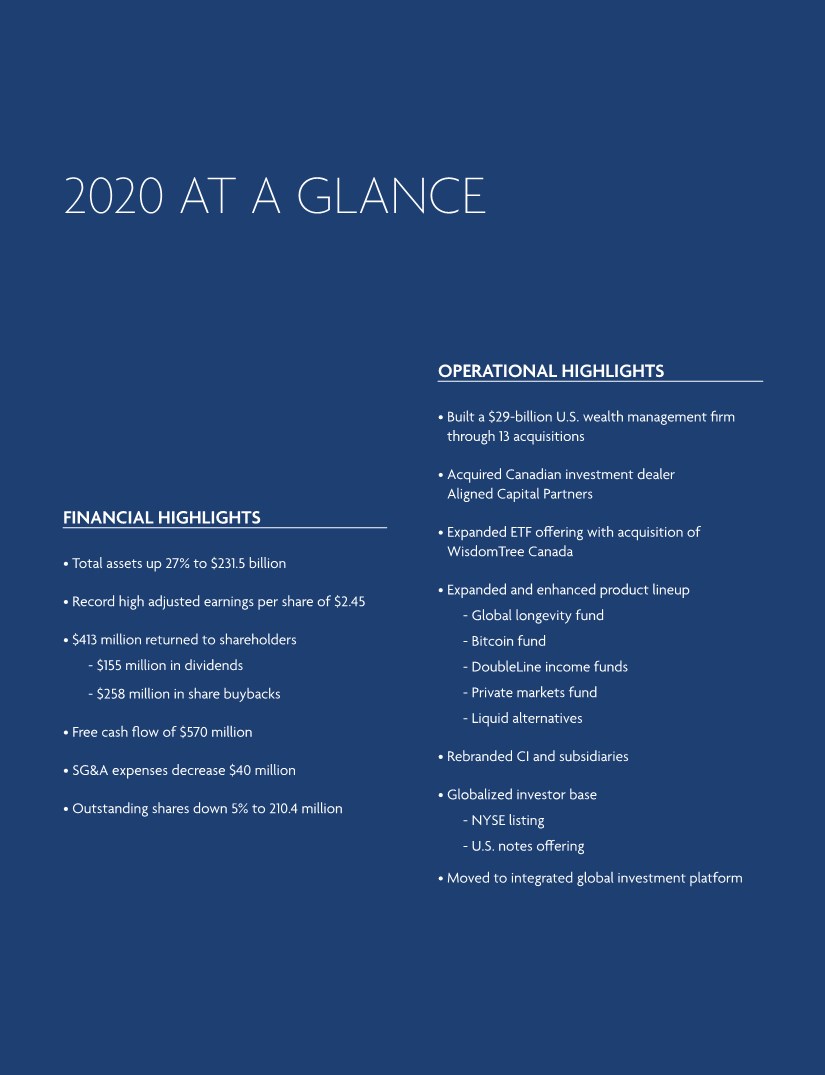
| 2020 AT A GLANCE FINANCIAL HIGHLIGHTS • Total assets up 27% to $231.5 billion • Record high adjusted earnings per share of $2.45 • $413 million returned to shareholders - $155 million in dividends - $258 million in share buybacks • Free cash flow of $570 million • SG&A expenses decrease $40 million • Outstanding shares down 5% to 210.4 million OPERATIONAL HIGHLIGHTS • Built a $29-billion U.S. wealth management firm through 13 acquisitions • Acquired Canadian investment dealer Aligned Capital Partners • Expanded ETF offering with acquisition of WisdomTree Canada • Expanded and enhanced product lineup - Global longevity fund - Bitcoin fund - DoubleLine income funds - Private markets fund - Liquid alternatives • Rebranded CI and subsidiaries • Globalized investor base - NYSE listing - U.S. notes offering • Moved to integrated global investment platform |
| 6 ANNUAL REPORT 2020 LETTER TO SHAREHOLDERS Dear Shareholders, It was truly a year unlike any other. In 2020, we faced both a global health crisis and an economic crisis, as the pandemic shuttered many companies and profoundly changed how we live and do business. Increasing political polarization and anger over racial inequality also roiled society. To say it was a challenging year is an understatement. However, you can be proud of the performance of CI Financial and its employees during this difficult period. Not only did we adapt quickly and efficiently to a work-from-home environment and continue to provide an exceptional level of service to our clients, but we made tremendous progress in executing against our strategic priorities. In fact, 2020 was transformative for CI. The company is larger, stronger, more diversified and more global than it was just a year ago. And while we are still in the early stages of our strategic transformation, I believe CI is exceptionally well positioned for continued success given the advances we’ve made over the past year. In this letter, I will reprise our strategic priorities and discuss the achievements of 2020, as well as touch on other key concerns for shareholders, including our financial results and capital allocation. |

| ANNUAL REPORT 2020 7 OUR STRATEGIC PRIORITIES We introduced a new strategic direction for the company in November 2019 centred on three strategic priorities: These priorities leverage CI’s many strengths and capabilities to extend our industry leadership and take advantage of opportunities for growth in a rapidly changing environment. Every initiative we undertake supports one or more of these priorities. For example, the buildout of our U.S. business, described below, both expands our wealth management business and globalizes the company. Before reviewing each strategic priority in more detail, I would like to mention two projects that support all three priorities — the rebranding of our firm and our digital transformation. REBRANDING THE FIRM In 2020, we initiated a company-wide rebrand, which includes newly designed logos and the renaming of several subsidiaries, accompanied by new signage and a crucial update of our websites. This process is being completed in the first half of this year and, as our company grows, all of our operations will eventually adopt branding that’s consistent with the rest of CI. Prior to these changes, we had approximately 20 brands, most of which had no obvious association with CI. This created confusion for advisors, clients and anyone else doing business with us. Having so many unrelated brands reduced the effectiveness and increased the cost of our marketing. You will have seen all of the new logos at the start of this report, but let’s briefly review the naming changes: • CI Global Asset Management represents our investment management business, with the legacy boutique brands (such as Signature Global Asset Management) to be phased out. • CI Assante Wealth Management is the new name for Assante Wealth Management, which provides a connection to CI while maintaining the positive brand equity of the Assante name. • CI Private Wealth represents our high-net-worth advisory business. Stonegate Private Counsel adopted this brand in the first quarter of 2021 and it will also represent our U.S. advisory businesses. • CI Direct Investing is the new business name for WealthBar and will eventually include Virtual Brokers, so that CI Direct Investing becomes CI’s integrated digital wealth platform. • CI Investment Services is the former BBS Securities, and is a name that better represents the firm’s product offerings. What we have created is a streamlined group of brands with a consistent look and a relationship to CI. We have improved the client experience while enhancing our marketing return on investment, as marketing for any one brand will support the whole. Most importantly, this new approach more effectively communicates the breadth and depth of CI’s capabilities and scale and supports our continued development as a diversified global asset and wealth management company. MODERNIZE ASSET MANAGEMENT EXPAND WEALTH MANAGEMENT GLOBALIZE THE COMPANY |
| 8 ANNUAL REPORT 2020 DIGITAL TRANSFORMATION When I introduced our new strategic direction, I said it was important that we drive advanced technology into everything we do. This sustained effort, which we call our “digital transformation,” underpins the execution of our entire strategy. I am pleased to report that we have made great strides in harnessing new technologies and processes to enhance our capabilities and efficiency in all aspects of our work, from sales and marketing to operations to client services. For more detail on this important undertaking, please see the following section, “CI’s Digital Transformation: Innovating to Lead in an Agile, Competitive Marketplace.” MODERNIZING ASSET MANAGEMENT Our strategic priority of modernizing asset management addresses a number of developments within our industry, including evolving demographics, shifting investor preferences and needs, increased expectations for service and support among both investors and advisors, and a changing regulatory regime. The high levels of volatility and rapid shifts in market dynamics that accompanied the pandemic over the past year underscore the need to be agile and forward-looking. There were many accomplishments in this area in 2020; however, I am going to focus on two key areas: the restructuring of our portfolio management function and the upgrading of our product lineup with the introduction of a number of innovative and relevant new products. In portfolio management, as I explained above, we rebranded CI Investments to CI Global Asset Management and made the decision to phase out the brands for our in-house investment boutiques. In conjunction with this, we also began to integrate the boutiques themselves into one team operating under the CI Global Asset Management (“CI GAM”) name. By moving from a multi-boutique model to an integrated platform, we are reducing complexity and fostering improved communication and collaboration across the entire group, leading to the increased sharing of research and insights. As a result, we are delivering to our clients in all of our mandates the full benefits of CI GAM’s scale and expertise, not just what was available within that boutique. To date, these changes have been well received. It’s important to note that the individuals managing each mandate and their investment approaches did not change as a result of the integration, minimizing the disruption to clients. The implementation of this model will continue this year as we review the naming conventions within our fund lineup. We are confident that this structure will lead to better investment outcomes and an improved experience for our clients. In the area of product innovation, we launched an ambitious number of new mandates to meet the evolving needs of investors and help them achieve their objectives in a challenging investment environment. In several cases, we teamed with outside firms to harness globally leading expertise that was not available in-house. |
| ANNUAL REPORT 2020 9 Notable product initiatives included: • The launch of three income funds sub-advised by DoubleLine Capital, which is led by the legendary Jeffrey Gundlach, one of the world’s best-known and most successful income investors. These mandates, exclusive to CI in Canada, bolster our lineup of income products, which are so crucial as increasing numbers of retirees seek reliable cash flow in a time of low interest rates. • A strategic relationship with Adams Street Partners, a global leader in private markets investing, to develop the CI Adams Street Global Private Markets Fund, which was launched in January 2021. This fund is just one step in expanding our lineup of alternative investments, which offer strong diversification and other benefits to investors and are particularly well suited for our high-net-worth and ultra-high-net-worth clients. • The launch of the CI Global Longevity Economy Fund, which draws on the research and insights of Dr. Joseph Coughlin, a global expert on demographic change and Founder and Director of the Massachusetts Institute of Technology AgeLab. The fund focuses on companies benefiting from changes resulting from the trend towards longer, healthier lifespans. • In December 2020, we launched the CI Galaxy Bitcoin Fund, a closed-end fund that provides secure and convenient exposure to bitcoin. This was followed in the new year by the launch of a bitcoin ETF and mutual fund, as well as an Ethereum ETF and mutual fund, giving CI an industry-leading suite of digital asset mandates. Our sub-advisor on these funds is Galaxy Digital, a well-established firm in this sector. • The launch of several mandates to meet the demand for investments in real assets — infrastructure and real estate — as well as the expansion of our lineup of liquid alternative mutual funds and ETFs. CI has established an industry-leading presence in liquid alternatives, with $3.8 billion in assets under management as at March 31, 2021. It’s worth noting that many mandates are offered in multiple product structures, including mutual funds, private pools and ETFs, allowing our clients to access our investment expertise in the structure they prefer — an advantage of our scale and diversity that few competitors can match. Also in 2020, we completed the acquisition of WisdomTree Asset Management Canada, Inc., adding approximately $1 billion in assets and new capabilities to our ETF lineup. Our ETF business is experiencing strong growth and has a significant presence in the Canadian market, with over $12 billion in assets under management and a comprehensive lineup of 70 ETFs (as at March 31, 2021), with a focus on actively managed and factor-based mandates. I would like to reiterate that the process of modernizing our asset management is advancing on many fronts. Other initiatives include: adopting a radically different approach to marketing, with a focus on digital and data; the introduction of a new model for our sales and distribution team; and the hiring of a new head of institutional sales to revitalize that group. EXPANDING WEALTH MANAGEMENT At CI, we firmly believe in the value of advice and the future of the wealth management industry. This view underlies our strategic priority of expanding our wealth management platform in both Canada and the U.S. The role of the financial advisor is more important now than ever, and likely to remain so for years to come, as clients’ lives become increasingly complex. |
| 10 ANNUAL REPORT 2020 CI also has considerable experience in wealth management, with our Canadian advisory businesses — Assante and Stonegate, which is now CI Private Wealth — earning exceptional reputations for service and quality. For many years, our firms have put forth a comprehensive approach to wealth management as their value proposition. We have a high level of credibility in this area, given the experience of our advisors and the high level of support we provide to them and their clients through a diverse group of in-house experts in wealth planning. This approach represents the future of the wealth management business, in our view, given the increasing complexity of our clients’ lives. It is also crucial in attracting the coveted high-net-worth and ultra-high-net-worth clientele, and we have been very successful on that front. It is on this solid foundation that we built a dramatic expansion of our wealth management business in 2020. Wealth management assets almost doubled during the year — to $96.5 billion from $50.5 billion — through impressive organic growth and onboarding $38.7 billion in new client assets in Canada and the United States. In contrast, we onboarded $1 billion in new client assets in each of the previous two years. In Canada, we continued to make significant investments in Assante and CI Private Wealth, including the extensive use of technology to add efficiency to our operations and provide enhanced tools and services for advisors and clients. In particular, Assante continued the development of its discretionary platform, which will launch this year. It will provide an attractive new service option for existing advisors and for advisors we are seeking to recruit. Assante has also made a concerted effort in recent years to assist its advisors in moving “up market,” and one sign of that campaign’s success in 2020 was a 70% increase in net sales at Assante Private Client, a high-net-worth program exclusive to Assante and managed by CI Private Counsel. A significant boost to our Canadian wealth management business came through the October acquisition of Aligned Capital Partners, a fast-growing, profitable investment dealer with 250 advisors across Canada and $13.5 billion in assets (March 31, 2021). In the United States, CI went from being an unknown to one of the fastest-growing firms in the market in a very short time. In 2020, we completed 13 acquisitions of registered investment advisor firms (which includes three transactions by affiliates) to establish a significant presence in U.S. wealth management with total assets of $29 billion at the end of the year. Let’s step back for a moment to review why we entered this market, which supports the strategic priorities of expanding our wealth management platform and globalizing the firm. First, the U.S. is a logical market for global expansion, given its size, proximity, similarity in business practices, and shared language. While competition is high, barriers to entry are low. Second, the registered investment advisor, or RIA, sector is the fastest-growing segment of U.S. wealth management with a strong focus on financial planning for clients. However, the sector is highly fragmented, offering the potential for an acquiror such as CI to realize the benefits of economies of scale. CI is also a natural owner of these businesses, given our own long experience in wealth management and our emphasis on complete wealth planning for clients. Our vision is to create the leading private wealth platform in the United States and provide a comprehensive and unrivalled client experience. This vision, our experience, and our long-term commitment to the industry resonated strongly with RIA owners who were seeking a larger partner. The RIAs we have acquired are very high-quality, profitable and growing firms, in locations across the United States. (A list and description of each firm can be found in the Subsidiary Profiles section of this report.) |
| ANNUAL REPORT 2020 11 In the first quarter of 2021, we signed agreements to acquire another three RIAs — Segall, Bryant & Hamill, LLC (“SBH”) of Chicago, Barret Asset Management, LLC of New York and Brightworth, LLC of Atlanta. SBH, our largest U.S. acquisition to date, also has a $22-billion institutional money management business in addition to about $8 billion in wealth management assets. Combined, these transactions will add $38 billion to our U.S. assets, bringing the total to approximately $69 billion, based on asset levels as of March 31, 2021. Our RIA firms are already contributing to our revenues and profitability even before the achievement of any synergies. And we intend to continue to scale our U.S. wealth platform through acquisitions and organic growth. Even with our success to date, we are just at the beginning of building this business, which we believe holds tremendous potential. GLOBALIZING THE COMPANY As you can see from the previous section, we have made excellent progress in globalizing the company, having added approximately $69 billion in U.S.-based assets once our most recent transactions close. Further global diversification is the key to growth for various reasons. Achieving scale is critical today in asset and wealth management, and this is difficult to achieve in Canada, a smaller and more concentrated market. We were very pleased to acquire Aligned Capital, but opportunities to purchase such a quality business in Canada are few and far between. Additionally, clients today want to be serviced and supported globally, given that many of them work or have residences in more than one country. In 2020, we launched a referral program between our Canadian advisors and our U.S. RIAs, to provide such support to our clients. Globalization also means that we are accessing expertise that we may not have in-house and examples of that include our relationships with DoubleLine, Adams Street, Galaxy Digital and Dr. Joseph Coughlin of MIT. There were two other important initiatives in 2020 promoting the globalization of our firm in addition to our entry into the RIA business — listing our common shares on the New York Stock Exchange (“NYSE”) and issuing debt into the U.S. Our NYSE listing, which occurred in November, has helped to broaden our shareholder base and increase our profile in the United States. It also gives us the option to offer shares as part of the purchase price in any U.S. transaction. Our U.S. bond offering also diversified our investor base and, in fact, shifted the majority of our creditors from Canada to the U.S. The offering and a subsequent re-opening in early 2021 were so well received that we raised a total principal amount of US$960 million at an attractive rate of 3.2% and a favourable term of 10 years. This allowed us to proceed with the early redemption of bond issues due this year and in 2023, reducing costs and extending the overall maturity of our debt. FINANCIAL RESULTS I am going to touch on a few important highlights in this section, and I refer you to the Management Discussion & Analysis section of this report for a detailed look at our results in 2020. Despite the market volatility stemming from the pandemic and the accompanying lockdowns around the world, CI registered strong results for the year. Our adjusted earnings per share were a record $2.45 and our free cash flow was $570.2 million. As mentioned earlier, our wealth management assets grew by 91% during the year to an all-time high of $96.5 billion. Our assets under management increased 3% year over year to $135.1 billion. As a result, our total assets were up by $49.3 billion or 27% to $231.5 billion. |
| 12 ANNUAL REPORT 2020 Redemptions were still present in our Canadian asset management business, but we believe that the many changes we are making to modernize that business and its operations — including the launch of a number of innovative and relevant products and the move to an integrated global investment management platform — should lead to improved net sales. We believe it’s important that as we grow our business, we maintain cost discipline. In 2020, we reduced selling, general and administrative (“SG&A”) expenses by $40 million or 8%, even as we took on the expenses of acquired businesses. Excluding acquisitions, we reduced expenses by 11% — savings that will benefit the company on an ongoing basis. In realizing these efficiencies, we are aligning our company’s resources with our strategic priorities and the opportunities we see in the marketplace. CAPITAL ALLOCATION CI’s ability to generate significant cash flow allows us to finance our M&A strategy while continuing to return money to our shareholders through dividends and share repurchases. In 2020, we maintained our quarterly dividend at $0.18 per share, and paid total dividends of $155.3 million. We also believe that our share price remains undervalued by the market and during the year we repurchased 14.0 million shares for a total cost of $257.9 million. However, we will continue to take a dynamic approach to capital allocation by varying our share repurchases according to market conditions and our corporate priorities. LOOKING FORWARD It’s incredible that we were able to accomplish so much in the space of year — especially during a year when our work lives and our entire society were disrupted. I continue to be impressed by the high level of engagement, resilience and adaptability shown by our employees, advisors and associates in Canada and around the world during this most challenging of times. I thank all of you for your work and dedication. I would also like to thank our shareholders for their continued support. As I said at the start of this letter, 2020 was a transformative year for CI. We are continuing to build on this progress, guided by our strategic priorities. As we look forward to an economic recovery and the return to a more normal environment, there are many reasons to be excited about the coming year and the future of CI. Sincerely, Kurt MacAlpine Chief Executive Officer March 31, 2021 |
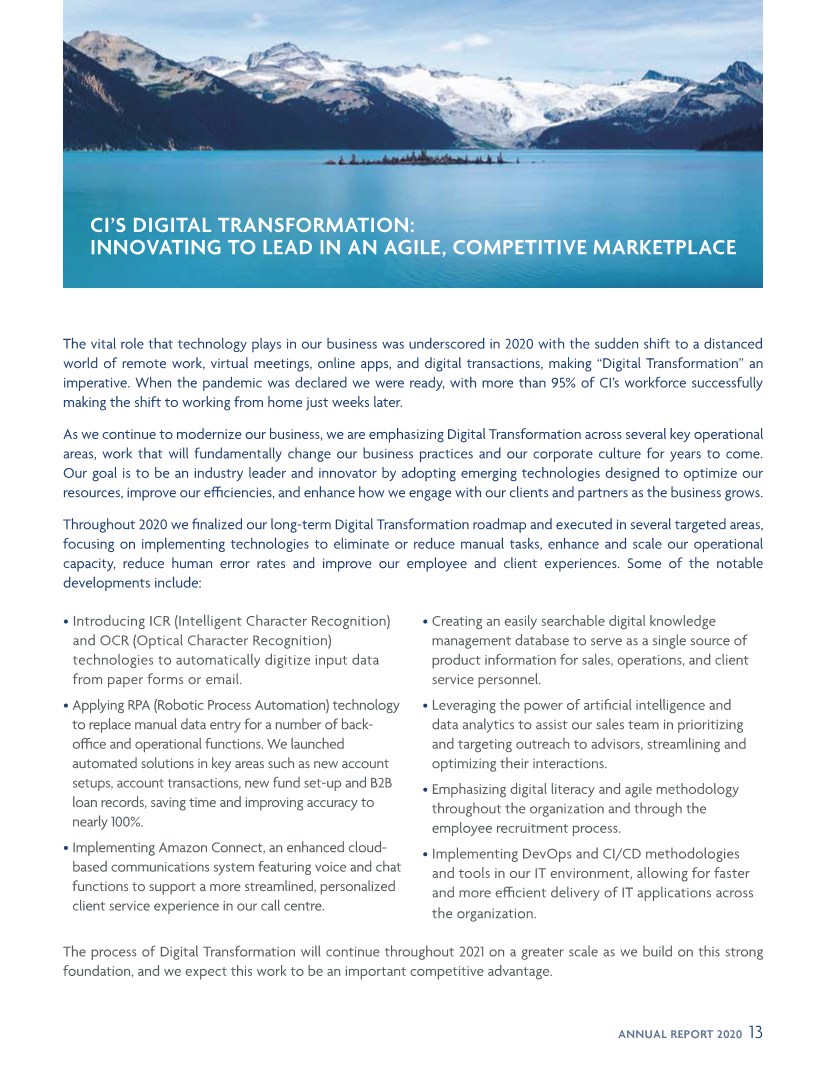
| ANNUAL REPORT 2020 13 The vital role that technology plays in our business was underscored in 2020 with the sudden shift to a distanced world of remote work, virtual meetings, online apps, and digital transactions, making “Digital Transformation” an imperative. When the pandemic was declared we were ready, with more than 95% of CI’s workforce successfully making the shift to working from home just weeks later. As we continue to modernize our business, we are emphasizing Digital Transformation across several key operational areas, work that will fundamentally change our business practices and our corporate culture for years to come. Our goal is to be an industry leader and innovator by adopting emerging technologies designed to optimize our resources, improve our efficiencies, and enhance how we engage with our clients and partners as the business grows. Throughout 2020 we finalized our long-term Digital Transformation roadmap and executed in several targeted areas, focusing on implementing technologies to eliminate or reduce manual tasks, enhance and scale our operational capacity, reduce human error rates and improve our employee and client experiences. Some of the notable developments include: • Introducing ICR (Intelligent Character Recognition) and OCR (Optical Character Recognition) technologies to automatically digitize input data from paper forms or email. • Applying RPA (Robotic Process Automation) technology to replace manual data entry for a number of back- office and operational functions. We launched automated solutions in key areas such as new account setups, account transactions, new fund set-up and B2B loan records, saving time and improving accuracy to nearly 100%. • Implementing Amazon Connect, an enhanced cloud- based communications system featuring voice and chat functions to support a more streamlined, personalized client service experience in our call centre. • Creating an easily searchable digital knowledge management database to serve as a single source of product information for sales, operations, and client service personnel. • Leveraging the power of artificial intelligence and data analytics to assist our sales team in prioritizing and targeting outreach to advisors, streamlining and optimizing their interactions. • Emphasizing digital literacy and agile methodology throughout the organization and through the employee recruitment process. • Implementing DevOps and CI/CD methodologies and tools in our IT environment, allowing for faster and more efficient delivery of IT applications across the organization. The process of Digital Transformation will continue throughout 2021 on a greater scale as we build on this strong foundation, and we expect this work to be an important competitive advantage. CI’S DIGITAL TRANSFORMATION: INNOVATING TO LEAD IN AN AGILE, COMPETITIVE MARKETPLACE |
| ASSET MANAGEMENT As a global investment manager, CI Financial is committed to providing innovative and effective solutions for retail and institutional clients, and to helping a broad range of investors meet their financial goals. As part of our larger strategic priority to modernize our asset management business, we made significant advancements in 2020, responding to evolving investor needs amid an increasingly complex environment. CI operates in this segment primarily through CI Global Asset Management (the business name of CI Investments Inc.) in Canada and GFSM Pty in Australia. CI also owns a majority stake in Marret Asset Management Inc., a Toronto-based fixed- income investment manager, and minority interests in Altrinsic Global Advisors, LLC, a global asset manager based in Greenwich, Connecticut, and Lawrence Park Capital Partners Ltd. of Toronto, which specializes in alternative fixed-income strategies. (In 2021, CI and Lawrence Park reached an agreement under which CI will purchase full ownership of the company.) SUBSIDIARY PROFILES |
| ANNUAL REPORT 2020 15 CI GLOBAL ASSET MANAGEMENT CI Global Asset Management (“CI GAM”) is one of Canada’s largest investment management companies. We are proud to partner with financial advisors to serve approximately 1.4 million investors across the country. We also provide investment services to pension funds, foundations and other institutional investors through a dedicated institutional group. We offer a wide range of innovative and effective investment solutions, including mutual funds, exchange-traded funds, segregated funds, managed solutions and alternative investments. Our product lineup spans a wide range of investment disciplines and mandates covering various geographic regions, asset classes and industries. As part of CI Financial’s strategic priority of modernizing its asset management business, we rebranded CI Investments as CI Global Asset Management in 2020, unveiling the new name and modern logo as part of a broader corporate update. At CI GAM, we believe that the key to delivering the best possible outcomes for our clients lies in gathering highly talented people who bring a diverse range of thoughts and ideas to the investment process. To truly leverage the depth of talent within our in-house portfolio management teams, we took the bold step of transforming our asset management structure, beginning to phase out our legacy in-house investment management boutique brands in favour of an integrated global investment management platform in November 2020. The new CI Global Asset Management model promotes efficiency and enhances the solutions we offer our clients by aligning investment professionals according to their areas of specialization. It encourages them to effectively channel our common technology-based platforms and resources for greater collaboration and improved communication. At the same time, it allows for a cohesive marketing message, simplifying the investment selection process for advisors and their clients. We are confident that this development will support enhanced portfolio results and allow investors to benefit from the full spectrum of capabilities within CI GAM over the coming years. 2020 OPERATING HIGHLIGHTS • CI GAM teamed up with DoubleLine Capital LP, led by legendary U.S. bond investor Jeffrey Gundlach, to launch three exclusive income mandates to the Canadian marketplace in May 2020. Available in both mutual fund and ETF series, the CI DoubleLine Funds provide investors with access to the unique structured products segment of the U.S. fixed-income market. • Throughout a turbulent year, CI GAM continued to show leadership in key areas of the business, building on earlier successes in the ETF and liquid alternatives spaces. Our ETF business experienced strong inflows and annual growth of about 35%, finishing the year at $11.6 billion in AUM. In February, CI completed the acquisition of WisdomTree’s Canadian ETF business and several new ETFs were launched in 2020, including a well-received suite of liquid alternative ETFs with similar mandates to the popular CI Liquid Alternatives™ mutual funds. • CI GAM launched its first mandate based on the research and insights of Dr. Joseph Coughlin, a global expert on demographic change and Founder and Director of the Massachusetts Institute of Technology AgeLab. CI Global Longevity Economy Fund focuses on companies benefiting from the trend towards longer lifespans. |
| 16 ANNUAL REPORT 2020 • To meet investor demand for access to the cryptocurrency space, CI GAM launched CI Galaxy Bitcoin Fund in December, a closed-end fund listed on the Toronto Stock Exchange. The success of this initial offering set the stage for further collaboration with Galaxy Digital Capital Management LLP to offer ETFs and mutual funds investing in bitcoin and Ether in early 2021. • In April 2020, we announced plans to collaborate with private equity fund manager Adams Street Partners to develop a private equity offering for accredited high-net-worth clients. This fund was launched in January 2021. • Our sales team leveraged a combination of artificial intelligence and sales best practices to launch the Advisor Smart List program, a tool designed to improve the effectiveness of the sales process. By identifying advisor preferences and sales trends, the custom-built lists provide guidance to the CI GAM sales team on how and when to contact advisors with specific product recommendations, resulting in enhanced sales coverage and improved market penetration. GFSM PTY LIMITED GSFM is a leading manager and distributor of investment funds to institutional and retail investors in Australia. The firm was founded in 2007 and today manages approximately $7.1 billion in assets (as at March 31, 2021). GSFM partners with high-calibre investment managers in Australia and globally to offer unique investment strategies to the Australian market. We have formed relationships with eight investment managers — New York-based Epoch Investment Partners, Los Angeles-based Payden & Rygel, London-based Man Group, Toronto-based CI Global Asset Management, and Australian-based managers Munro Partners, Redpoint Investment Management, Tribeca Investment Partners and Triple3 Partners. Each offers a differentiated investment strategy in their specialist asset classes. These mandates span Australian equities, global equities, fixed income, infrastructure, alternatives and volatility. CI Financial owns 84% of GSFM, and GSFM executives hold a 16% equity stake. 2020 OPERATING HIGHLIGHTS • Munro Partners was named winner of a Zenith Fund Award for International Equities, Alternative Strategies. The awards recognize excellence in funds management. • Munro Global Growth Fund was named best long/short equity fund at the 2020 Hedge Funds Rock + Australian Alternative Investment Awards. These awards were established in 2005 to recognize and honour the industry’s top performers. • We launched our first actively managed ETF, the Munro Global Growth Fund, a hedge fund (ASX: MAET). • GFSM was awarded new institutional fixed-income mandates totalling $590 million. |
| WEALTH MANAGEMENT CI provides a wide range of wealth management services focused on protecting and enhancing our clients’ wealth. When the pandemic began, many people were understandably concerned about the safety of their investments and their future financial security, and our advisors were there to support their clients through a difficult time. As part of our strategic priority to expand our wealth management platform, CI made significant strategic investments in this area of our business in 2020, particularly within the growing high-net-worth and ultra-high-net-worth segments. In addition to strong results at Assante and CI Private Wealth, we acquired a majority interest in Aligned Capital Partners Inc., one of the fastest-growing wealth firms in Canada by revenues, and accelerated our expansion into the U.S. registered investment advisor (“RIA”) market with 13 acquisitions, including 10 direct acquisitions and three indirect transactions. At the same time, we directed investment toward digitally transforming our business to improve efficiencies and expand our range of product and service offerings. |
| 18 ANNUAL REPORT 2020 CI ASSANTE WEALTH MANAGEMENT CI Assante Wealth Management (“Assante”) is one of Canada’s largest wealth management firms, supporting 880 advisors in the delivery of complete financial advice for affluent Canadian families, business owners and professionals. Assante’s services are offered through Assante Capital Management, an investment dealer, and Assante Financial Management, a mutual fund dealer. Assante advisors also have exclusive access to Assante Private Client, a division of CI Private Counsel, for high-net-worth investment management and holistic advice services. Despite the onset of the global pandemic and heightened market volatility, Assante ended the year with record assets under advisement (“AUA”) of $46 billion, highlighting the strength of client relationships and the value of trusted advice. Our success is closely linked to the strong partnerships we have developed with our advisor network and our goal of delivering an industry-leading advisor and client experience. Across our lines of business, we support our advisors by providing comprehensive investment and wealth planning capability through Evolution Private Managed Accounts and Assante Private Client. Backed by a wealth of resources, including investment analysts, portfolio managers, tax lawyers, accountants, estate planning and insurance specialists and wealth planners, our advisors provide a comprehensive and integrated approach to wealth management. 2020 OPERATING HIGHLIGHTS • Assante ended the year with a record $46 billion in AUA, reflecting organic net client growth, market gains and advisor recruiting. • We rolled out the new, sophisticated CI Assante Wealth Management branding to showcase and reinforce the strength, scale and stability of CI Financial standing behind Assante advisors and their clients. • We launched the volunteer-led Be Well-Advised program to support individuals and families through the depths of the global pandemic with free financial advice. • We continued to digitally transform our business to improve the client and advisor experience by introducing further efficiencies into our back-office capability. Highlights include digital onboarding, the introduction of robotic process automation, an app for Assante Investor Online and the growth of Assante Connect, our digital advice platform powered by CI Direct Investing. • We implemented new platform functionalities to add more services for clients and advisors, including on-book margin capability and U.S.-dollar registered accounts. • The high-net-worth segment represents a significant area of growth, and 2020 brought a 70% increase in net sales for Assante Private Client, with assets standing at $3.1 billion. • Assante ranked #1 in the 2020 Investment Executive Dealer Report Card for full-service and mutual fund dealers, and #2 in the 2020 J.D. Power Full-Service Investor Satisfaction Study. • Development of Assante’s discretionary platform, powered by d1g1t Inc.’s enterprise wealth management platform with institutional-grade analytics and risk management tools, continued in 2020. With completion expected in early 2021, this capability will augment the firm’s recruiting pipeline and foster continued growth in the affluent segments. |
| ANNUAL REPORT 2020 19 ALIGNED CAPITAL PARTNERS CI acquired a majority interest in Aligned Capital Partners Inc. (“ACPI”) of Burlington, Ontario in October 2020. The firm supports a network of 250 advisors servicing over 41,000 clients with total assets of $13.5 billion (as at March 31, 2021). ACPI is one of the fastest-growing, progressive securities dealers in the country. The reason: a strong solid foundation and an adaptive digital platform. Unique to the industry, ACPI was founded on the principle that Canadian financial advisors should have the freedom to run their businesses independently while being supported by an unconflicted dealer platform. The end goal for both: a better, more customized investor experience and ultimately a better outcome for investors. In its evolution, ACPI has become an industry leader on several fronts. First by recognizing the need for change and challenging the status quo, then by inciting that change not just on a platform level, but also on a wider industry level. Innovation is at the core of the ACPI initiative. A large part of that is developing a fully integrated digital ecosystem designed to grow and support both the company’s business and our advisor partners’ businesses, while at the same time remaining flexible enough to meet the demands of technological advancements as they come into play. The Aligned 360 Digital Platform is the sum of many inter-related digital components through which data is flowing live 24/7. ACPI continues to push the boundaries by working collaboratively within the industry itself, and by forging strategic partnerships with other like-minded companies all interested in one common goal — to build a better Canadian wealth management landscape. 2020 OPERATING HIGHLIGHTS • We added 43 new advisor teams with approximately $1.5 billion in assets. • Our assets under administration ended the year at $12 billion, an increase of more than 26% year over year. • We completed our Data Lake Historical Transaction Project, which serves as the core source of data for the firm and allows for greater flexibility in upgrading technology platforms. • We launched our new Compliance Supervision system. |
| 20 ANNUAL REPORT 2020 CI PRIVATE WEALTH — CANADA CI Private Wealth (“CI PW”) is a full-service wealth management firm that offers a highly personalized experience tailored to the financial goals, unique needs and evolving priorities of high-net-worth individuals, business owners and families. It combines the benefits of a boutique client experience, one guided by the fiduciary standard and principle of always placing client interests first, supported by the strength, size and scale of being part of CI Financial. CI PW offers an unrivalled experience that combines discretionary investment management and comprehensive wealth planning, including sophisticated financial planning, retirement planning, estate and legacy planning, and tax strategies for individuals, businesses and multi-generational families. Supporting our advisory teams across Canada in the delivery of an integrated client experience is a robust, multi- disciplinary team of experts — including lawyers, accountants, Certified Financial Planners, Certified Financial Analysts, MBAs and other professionals. They are all part of a dedicated client service team that is available to help plan, provide guidance, and answer technical questions that may impact our clients — be they business owners contemplating transition, professionals and executives looking to mitigate tax, individuals working through a divorce, who’ve inherited money or dealing with other life events. Despite the challenges of 2020, CI PW continued to see great success, especially among ultra-high-net-worth investors. We’ve also seen an increase in liquidity from business and real estate sales this year, furthering our growth opportunities through prospecting as well supporting existing clients. CI PW is a division of CI Private Counsel LP, which also manages the Assante Private Client Program. 2020 OPERATING HIGHLIGHTS • Our assets reached a record high at year-end of $7.8 billion, consisting of assets in Assante Private Client and those managed by advisors with Stonegate Private Counsel. • In 2020, we began the rebranding of Stonegate to CI Private Wealth, which was completed in the first quarter of 2021. • We accelerated our efforts to modernize our firm through digital automation, increasingly specialized investment management expertise, and enhancing our client and advisor experiences. • The d1g1t wealth management platform launched with a rollout to all investment counsellors and Stonegate advisors. The next phase will focus on improving the service experience by introducing client and advisor portals. • We continued to focus on providing a diverse lineup of alternative investment strategies for accredited investors, including CI Global Private Real Estate Fund and launching CI Adams Street Global Private Markets Fund. • In the fourth quarter of 2020, we welcomed our first Assante Private Client household to CI Investment Services Inc., rolling out a new custodial relationship that will allow us to better control the end-to-end experience for our high-net-worth clients, offer custodial optionality and streamline the onboarding process. • Our financial planning team completed its shift to NaviPlan Online, improving our abilities in NaviPlan file sharing between our Wealth Planning Group and advisors, and furthering our digital transformation goals. |
| ANNUAL REPORT 2020 21 CI PRIVATE WEALTH — UNITED STATES A major element supporting CI’s corporate strategy to globalize the firm and expand its wealth management platform has been its expanding presence in the U.S. RIA industry. As a well-capitalized company with extensive experience in wealth management and a unique value proposition relative to other firms, CI’s competitive advantages have supported the acquisition of several leading RIAs located in key U.S. markets. At December 31, 2020, CI’s U.S. wealth management holdings comprised 10 firms with aggregate assets of $29 billion. They include: BDF LLC (“BDF”), Itasca, IL — The BDF team of 62 people provides customized wealth management services to individuals and families, business owners and institutions and non-profit organizations from offices in the Chicago area. The firm advises on approximately $6.7 billion in assets. BDF was ranked Number 30 on the RIA Channel Top 100 Wealth Managers for 2020, and was listed on the 2020 FT300: Top Registered Investment Advisors and the Barron’s Top RIAs for 2020. CI owns 100% of BDF. Bowling Portfolio Management LLC (“Bowling”), Cincinnati, OH — Bowling provides customized financial planning and investment management services to high-net-worth clients. The firm, which advises on approximately $600 million in assets, has been a stalwart in the Cincinnati market since its founding in 1982. CI owns 100% of Bowling. The Cabana Group LLC (“Cabana”), Fayetteville, AR — Cabana oversees approximately $2.2 billion in assets from offices in Fayetteville and Plano, TX. Cabana also manages the Cabana Target Drawdown series of ETFs and separately managed portfolios. CI owns a minority interest in Cabana. Congress Wealth Management LLC (“Congress”), Boston, MA — Congress advises on approximately $3.6 billion in assets from offices in Boston, Westport, CT, Scottsdale, AZ, and Orange City and Avila Beach, CA. Congress provides wealth management and family office services to high-net-worth individuals, families, foundations, and endowments, with an emphasis on comprehensive and customized client plans. The firm was named to the Financial Times 300 Top Registered Investment Advisors list of 2019, the third time in four years it has received the award. CI owns a minority interest in Congress. Doyle Wealth Management LLC (“DWM”), St. Petersburg, FL — DWM advises on approximately $1.6 billion in assets, providing a wide range of wealth management services to high-net-worth individuals in the Tampa Bay region. The firm’s accolades include being named to the Barron’s magazine list of Florida’s Top Financial Advisors from 2015-2020, ranking No. 3 in North Florida on the 2020 Forbes list of America’s Best in State Wealth Advisors, and appearing on the Forbes list of America’s Top Wealth Advisors from 2016-2019. CI owns 100% of DWM. One Capital Management LLC (“OCM”), Westlake Village, CA — OCM advises on approximately $3.3 billion in assets. The firm features well-developed expertise in advanced wealth planning, including specializations in family office services and a division focused on the needs of professional athletes and entertainers. It also has a robust cross-border servicing capability. CI owns a majority interest in OCM. |
| 22 ANNUAL REPORT 2020 RGT Wealth Advisors, LLC (“RGT”), Dallas, TX — RGT, with $6.1 billion in assets, offers a fully integrated approach to investment management and wealth management, with specializations in wealth management and planning for corporate executives, business owners, multi-generational families, and current and retired professional athletes. The firm’s accolades include being recognized by Barron’s magazine as one of America’s Best Registered Investment Advisor Firms in 2019 and 2020. CI owns a majority interest in RGT. Roosevelt Investment Group, LLC (“Roosevelt”), New York, NY — Roosevelt advises on approximately $3.8 billion, specializing in providing financial planning and wealth management services to high-net-worth families in the greater New York area. CI owns 100% of Roosevelt. Stavis & Cohen Private Wealth LLC (“Stavis”), Houston, TX — Stavis is a leading Houston-based wealth management firm advising on approximately $800 million in assets. Its service offerings include retirement planning, investment management, risk management, estate planning and business succession, as well as specializations in serving energy industry executives, business owners and financially independent women. CI owns a majority interest in Stavis. Surevest Private Wealth LLC (“Surevest”), Los Angeles, CA — Surevest advises on approximately $600 million in assets from offices in Los Angeles and Phoenix. It specializes in providing a wide range of fee-only financial planning and investment management services to high-net-worth individuals through a concierge approach to wealth management. CI owns a majority interest in Surevest. CI DIRECT INVESTING CI Direct Investing, the operating name of WealthBar Financial Services Inc., exists to give Canadians an easy and affordable way to build a brighter financial future, whether they’re starting with $1,000 or $1 million. We make it easy to build one’s financial future with convenient online savings and investing tools, and financial advice. CI Direct Investing has approximately $562 million in assets under management, as at March 31, 2021. Our “hybrid model” combines technology with professional advice for a personalized experience. Through our online platform, investors can access a mix of investment portfolios. The firm operates two advisor channels, including Assante Connect, which launched in 2019 exclusively for clients of Assante advisors. This digital wealth management platform pairs seasoned portfolio managers with digital advice services to help advisors scale their business and augment their offerings. The other is PPI Valet, which delivers a far- ranging suite of investment options for PPI advisors and their clients. 2020 OPERATING HIGHLIGHTS • CI Financial extended its ownership of CI Direct Investing to 100%. • We adopted the CI Direct Investing brand as part of a first step in creating in an integrated online investment platform. • Our total AUM grew by 29% to approximately $518 million. |
| ANNUAL REPORT 2020 23 CI INVESTMENT SERVICES AND VIRTUAL BROKERS CI Investment Services (“CIIS”), formerly BBS Securities Inc., is a Canadian financial technology company and a registered investment dealer that provides a wide range of innovative brokerage, trading and investment services to a diverse client base of portfolio managers, broker dealers, institutional and retail investors. Through our online brokerage division, Virtual Brokers, CIIS provides services using a proprietary system that offers innovative trading platforms to the retail Canadian market. CIIS offers a wide range of brokerage services, including clearing, custody, settlement and trade execution services for all investment types, multiple trading platforms, access to new issues and risk monitoring to a wide range of customers (from registered portfolio managers to retail clients). We leverage our technological capability to provide online brokerage and trade execution services to individual investors, active traders and institutions. 2020 OPERATING HIGHLIGHTS • Our total assets grew to $4.2 billion. • We rebranded to CI Investment Services from BBS Securities, as part of CI Financial’s overall corporate rebrand. • We modernized the firm’s proprietary books and records system. • Virtual Brokers was recognized by the Globe and Mail as one of the top discount brokerages in Canada for 2020. • CIIS implemented a digital client portal for CI’s high-net-worth client base based on the d1g1t technology platform. |
| CI Financial (“CI”) strives to operate with responsibility and integrity, from the management of our funds to the conduct of all aspects of our business. We are committed to treating our employees and business partners with respect and consideration, to supporting communities across Canada, and to reducing our impact on the environment. This section highlights some of CI’s efforts and achievements in these areas. CORPORATE SOCIAL RESPONSIBILITY |

| ANNUAL REPORT 2020 25 MEMBERSHIPS & RECOGNITION SIGNATORY TO THE UNPRI The United Nations Principles for Responsible Investment (UNPRI) is the world’s leading proponent of responsible investment. It encourages investors to use responsible investment to enhance returns and better manage risks. ASSOCIATE MEMBER OF THE RIA The Responsible Investment Association (RIA) is Canada’s membership association for responsible investment. RIA members believe that the integration of environmental, social and governance (ESG) factors into the selection and management of investments can provide superior risk-adjusted returns while contributing to positive societal change. GREAT PLACE TO WORK CI Financial was certified as a Great Place to Work, a Canada-wide survey program that recognizes companies where employees exhibit a high level of trust in their employer, pride in their work and camaraderie with colleagues. COMMITMENT TO CORPORATE GOVERNANCE AND INTEGRITY • CI’s Board of Directors and management are committed to maintaining a high standard of governance consistent with the governance guidelines of the Canadian Securities Administrators and best practices recommendations of the Canadian Coalition for Good Governance. • All directors, officers, and employees of CI Financial and its subsidiaries and affiliates are governed by the CI Code of Business Conduct and Ethics, which requires them to follow prescribed standards of integrity and ethical business conduct. • The Board of Directors oversees risk management through the board’s Audit and Risk Committee, and governance through its Governance, Human Resources, and Compensation Committee. • CI upholds principles, policies, and procedures that promote integrity and ensure compliance with applicable laws and regulations in specialized areas of the company. These include policies addressing money laundering, bribery and corruption, personal trading by portfolio managers and other employees, as well as sales practices. • We are dedicated to respecting and protecting the privacy and confidentiality of the information entrusted to us. Our Privacy Notice outlines our principles and practices. • CI has established formal Ethical Reporting Procedures through which employees can anonymously report questionable conduct and concerns to the Board’s Lead Director. • CI employees are required to complete annual Security Awareness Training and acknowledgement of key corporate policies. • In recognition of our increased efforts to enhance the quality of our disclosure on environmental, social and governance (“ESG”) factors and to improve our overall performance, CI established a multi-departmental ESG committee. The committee includes members from finance, legal, investor relations and our ESG team. |
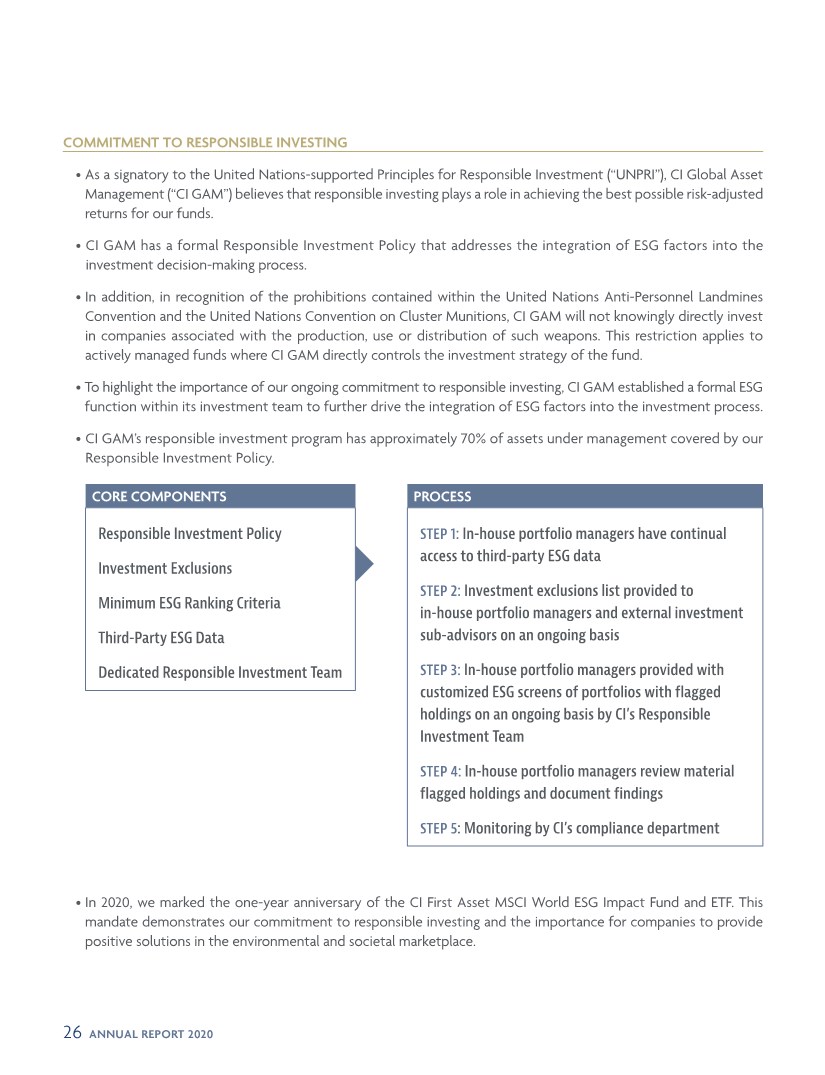
| 26 ANNUAL REPORT 2020 COMMITMENT TO RESPONSIBLE INVESTING • As a signatory to the United Nations-supported Principles for Responsible Investment (“UNPRI”), CI Global Asset Management (“CI GAM”) believes that responsible investing plays a role in achieving the best possible risk-adjusted returns for our funds. • CI GAM has a formal Responsible Investment Policy that addresses the integration of ESG factors into the investment decision-making process. • In addition, in recognition of the prohibitions contained within the United Nations Anti-Personnel Landmines Convention and the United Nations Convention on Cluster Munitions, CI GAM will not knowingly directly invest in companies associated with the production, use or distribution of such weapons. This restriction applies to actively managed funds where CI GAM directly controls the investment strategy of the fund. • To highlight the importance of our ongoing commitment to responsible investing, CI GAM established a formal ESG function within its investment team to further drive the integration of ESG factors into the investment process. • CI GAM’s responsible investment program has approximately 70% of assets under management covered by our Responsible Investment Policy. • In 2020, we marked the one-year anniversary of the CI First Asset MSCI World ESG Impact Fund and ETF. This mandate demonstrates our commitment to responsible investing and the importance for companies to provide positive solutions in the environmental and societal marketplace. CORE COMPONENTS Responsible Investment Policy Investment Exclusions Minimum ESG Ranking Criteria Third-Party ESG Data Dedicated Responsible Investment Team PROCESS STEP 1: In-house portfolio managers have continual access to third-party ESG data STEP 2: Investment exclusions list provided to in-house portfolio managers and external investment sub-advisors on an ongoing basis STEP 3: In-house portfolio managers provided with customized ESG screens of portfolios with flagged holdings on an ongoing basis by CI’s Responsible Investment Team STEP 4: In-house portfolio managers review material flagged holdings and document findings STEP 5: Monitoring by CI’s compliance department |
| ANNUAL REPORT 2020 27 COMMITMENT TO EMPLOYEES • In 2020, we were Great Place to Work® certified, with an 85% employee participation rate in the survey. CI was also named one of Canada’s Best Workplaces in Financial Services & Insurance for 2020 by the Great Place to Work organization. • CI believes that to be competitive in a global environment, we must create a culture of trust where people know their differences are valued as they strive to be innovative without barriers. Diversity will strengthen our collective success and potential by enabling CI to attract and retain the best talent, bringing innovation and different perspectives to the table. CI is committed to a diverse and inclusive culture where all employees feel: Valued — They are appreciated and respected for their unique perspectives and talents. Trusted — They make meaningful contributions and are influential in decision-making. Authentic — They can bring their full selves to work and express aspects of themselves that may be different from their peers. Psychologically Safe — They feel free to hold differing views and make mistakes without being penalized and secure enough to address tough issues or take risks. • In 2020, CI launched a Diversity and Inclusion Committee made up of volunteer employees, people managers and leaders to further the important work of creating an inclusive culture and workplace environment. • CI provides extensive training and learning opportunities for employees, giving them access to a variety of tools and resources to support skill development, including eLearning courses and classroom-based workshops. CI also supports those who pursue education and training on their own initiative through tuition reimbursement and other recognition. • To support our strategic imperative of modernizing our business through digital automation, we implemented Learning Paths to provide development content for employees to build their digital competencies, as well as their skills in agile methodologies, critical thinking, embracing change and fostering innovation. • CI’s successful Women’s Mentoring Program has been supporting female employees since 2012. The newly redesigned MentorHub is a virtual cross-country mentoring program for top talent with consideration for inclusive representation. About 70% of participants identified as members of a designated group. • Despite the global pandemic, CI offered important learning opportunities and work experience to 85 students through summer and co-op placements. |
| 28 ANNUAL REPORT 2020 SPOTLIGHT: COVID-19 RESPONSE • As a result of investments in technology and crisis planning, CI was well prepared to respond to the COVID-19 pandemic. In March 2020, CI created a COVID-19 Response Team which oversaw a quick and efficient transition to a work-from-home environment for most employees. The team has supplied regular company-wide updates of the ever-changing pandemic conditions, including a Wellness Check-in Survey for employees to provide feedback on CI’s response. • By mid-March 2020, more than 95% of employees were successfully working from home. For staff members whose duties require them to be in the office, CI has taken extraordinary measures to help ensure their safety, including providing them with private transportation, parking and meals. • Due to the growing mental health challenges presented by the pandemic, CI expanded employee wellness benefits, including doubling benefit coverage for psychological services. Throughout the year, virtual mental health resources were offered, including coping mechanisms, strategies for well-being, and access to mental health professionals. In November 2020, CI hosted a Virtual Wellness Day to provide fitness and wellness workshops for employees. • In response to the pandemic, CI took steps to respond to our communities’ most urgent needs. We made donations to Second Harvest to help Canada’s most food-insecure communities, while Assante launched the Be Well-Advised program, in which Assante advisors volunteer to provide free financial advice to Canadians experiencing financial hardship. COMMITMENT TO COMMUNITIES • CI is committed to supporting communities across Canada and to being a good corporate citizen. In addition to making significant donations to charitable and community causes, we provide employees with one paid day off per year, known as a Ray Day, to volunteer with a community organization or charity of their choice. This program was named in memory of CI’s former Chairman and Chief Executive Officer Ray Chang, who was well known for his commitment to philanthropy. |
| ANNUAL REPORT 2020 29 HIGHLIGHTS OF CI’S CHARITABLE GIVING: • CI made donations to organizations that are focused on improving the lives of the Black community, including the: CEE Centre for Young Black Professionals — Focused on youth workforce development, education and advocacy to influence systems and policy. Black Business and Profession Association — Facilitates the delivery of programs that support business and professional excellence, higher education and economic development. Black Health Alliance — Supports the health and well-being of Black communities in Canada. • SickKids GetLoud — CI was a Premier Sponsor of SickKids GetLoud, a campaign to help build a new SickKids hospital in Toronto, and donated over $150,000. • Second Harvest — In 2020, CI was a premium sponsor of Second Harvest’s mission to feed families, support communities and protect the environment. • SAAAC Autism Centre — CI’s donation supported culturally responsive autism practices and accessible programming • The Arthritis Society — CI has been a supporter of the Arthritis Society since 2008, with funds contributing to cutting-edge research, proactive advocacy and innovative solutions that will deliver better health outcomes for people affected by arthritis. • Wilfrid Laurier University — CI is proud to partner with Wilfrid Laurier University in preparing Canada’s next generation of financial managers and to provide support for the “Building Canada’s Best Business School” fundraising campaign. In 2020, CI donated $50,000 as part of a larger $500,000 commitment to supporting the finance program at the Lazaridis School of Business and Economics and the CI Financial Finance Lab, which opened in 2017. SPOTLIGHT: AUSTRALIA WILDFIRES RELIEF EFFORTS • In January 2020, CI launched a campaign to raise funds for Australia wildfire relief efforts through the Canadian Red Cross, raising over $40,000. The proceeds helped send Australian Red Cross staff and volunteers to communities affected by the fires and provided support for displaced persons. |
| 30 ANNUAL REPORT 2020 COMMITMENT TO ENVIRONMENTAL SUSTAINABILITY • We continue to use paper certified under the Sustainable Forestry Initiative. This standard sets mandatory practice requirements for the responsible procurement of all fibre sourced directly from forests. • In support of our ongoing effort to reduce CI’s environmental footprint, we have launched several waste reduction initiatives, including introducing composting and eliminating the provision of disposable plates, cups, cutlery and water bottles at certain Toronto locations. SPOTLIGHT: E-DELIVERY INITIATIVE • In support of our mission to modernize our asset management business and reduce our environmental footprint, CI decided in 2020 to deliver client documents primarily through online tools. This successful initiative saw a 57% decline in printed statements year over year, with 83% of CI statements being delivered electronically. |
| QUARTERLY FINANCIAL REPORT Q4 | 2020 DECEMBER 31, 2020 |
| TABLE OF CONTENTS 01 — Financial Highlights 02 — Management’s Discussion and Analysis 38 — Consolidated Financial Statements 46 — Notes to Consolidated Financial Statements |

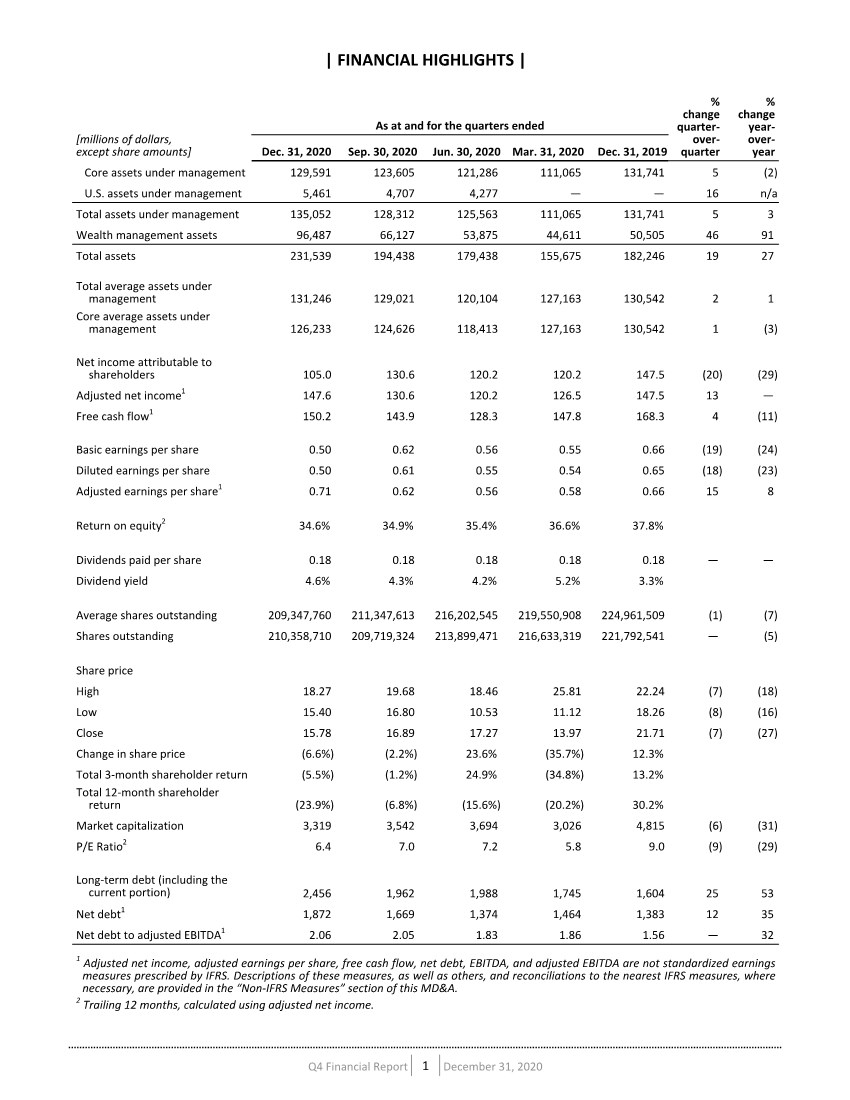
| | FINANCIAL HIGHLIGHTS | [millions of dollars, except share amounts] As at and for the quarters ended % change quarter- over- quarter % change year- over- year Dec. 31, 2020 Sep. 30, 2020 Jun. 30, 2020 Mar. 31, 2020 Dec. 31, 2019 Core assets under management 129,591 123,605 121,286 111,065 131,741 5 (2) U.S. assets under management 5,461 4,707 4,277 — — 16 n/a Total assets under management 135,052 128,312 125,563 111,065 131,741 5 3 Wealth management assets 96,487 66,127 53,875 44,611 50,505 46 91 Total assets 231,539 194,438 179,438 155,675 182,246 19 27 Total average assets under management 131,246 129,021 120,104 127,163 130,542 2 1 Core average assets under management 126,233 124,626 118,413 127,163 130,542 1 (3) Net income attributable to shareholders 105.0 130.6 120.2 120.2 147.5 (20) (29) Adjusted net income1 147.6 130.6 120.2 126.5 147.5 13 — Free cash flow1 150.2 143.9 128.3 147.8 168.3 4 (11) Basic earnings per share 0.50 0.62 0.56 0.55 0.66 (19) (24) Diluted earnings per share 0.50 0.61 0.55 0.54 0.65 (18) (23) Adjusted earnings per share1 0.71 0.62 0.56 0.58 0.66 15 8 Return on equity2 34.6% 34.9% 35.4% 36.6% 37.8% Dividends paid per share 0.18 0.18 0.18 0.18 0.18 — — Dividend yield 4.6% 4.3% 4.2% 5.2% 3.3% Average shares outstanding 209,347,760 211,347,613 216,202,545 219,550,908 224,961,509 (1) (7) Shares outstanding 210,358,710 209,719,324 213,899,471 216,633,319 221,792,541 — (5) Share price High 18.27 19.68 18.46 25.81 22.24 (7) (18) Low 15.40 16.80 10.53 11.12 18.26 (8) (16) Close 15.78 16.89 17.27 13.97 21.71 (7) (27) Change in share price (6.6%) (2.2%) 23.6% (35.7%) 12.3% Total 3-month shareholder return (5.5%) (1.2%) 24.9% (34.8%) 13.2% Total 12-month shareholder return (23.9%) (6.8%) (15.6%) (20.2%) 30.2% Market capitalization 3,319 3,542 3,694 3,026 4,815 (6) (31) P/E Ratio2 6.4 7.0 7.2 5.8 9.0 (9) (29) Long-term debt (including the current portion) 2,456 1,962 1,988 1,745 1,604 25 53 Net debt1 1,872 1,669 1,374 1,464 1,383 12 35 Net debt to adjusted EBITDA1 2.06 2.05 1.83 1.86 1.56 — 32 1 Adjusted net income, adjusted earnings per share, free cash flow, net debt, EBITDA, and adjusted EBITDA are not standardized earnings measures prescribed by IFRS. Descriptions of these measures, as well as others, and reconciliations to the nearest IFRS measures, where necessary, are provided in the “Non-IFRS Measures” section of this MD&A. 2 Trailing 12 months, calculated using adjusted net income. Q4 Financial Report 1 December 31, 2020 |
| Management’s Discussion and Analysis DECEMBER 31, 2020 CI FINANCIAL CORP. |
| This Management’s Discussion and Analysis (“MD&A”) dated February 11, 2021 presents an analysis of the financial position of CI Financial Corp. and its subsidiaries (“CI”) as at December 31, 2020, compared with December 31, 2019, and the results of operations for the quarter and year ended December 31, 2020, compared with the quarter and year ended December 31, 2019 and the quarter ended September 30, 2020. CI’s Consolidated Financial Statements have been prepared in accordance with International Financial Reporting Standards (“IFRS”) as issued by the International Accounting Standards Board. Amounts are expressed in Canadian dollars. The principal subsidiaries referenced herein include CI Investments Inc. (“CI Investments”) and Assante Wealth Management (Canada) Ltd. (“AWM” or “Assante”). CI has two reportable segments: Asset Management and Wealth Management (formerly Asset Administration). These segments reflect CI’s current internal financial reporting, performance measurement, and strategic priorities. The Asset Management segment of the business includes the operating results and financial position of CI Investments and its subsidiaries, as well as the operating results and financial position of GSFM Pty Limited (“GSFM”). First Asset Investment Management Inc., formerly a subsidiary of CI Investments, was amalgamated on July 1, 2019. CI ETF Investment Management Inc. (“CI ETF”), formerly WisdomTree Asset Management Canada, Inc. and a subsidiary of CI Investments, was amalgamated on July 1, 2020. The Wealth Management segment includes the operating results and financial position of AWM and its subsidiaries, including Assante Capital Management Ltd. (“ACM”) and Assante Financial Management Ltd. (“AFM”), as well as the operating results and financial position of CI Investment Services Inc. (“CI Investment Services”, formerly BBS Securities Inc.), WealthBar Financial Services Inc., operating as CI Direct Investing (“CI Direct Investing”), Aligned Capital (“Aligned”), Surevest LLC (“Surevest”), OCM Capital Partners LLC (“One Capital”), The Cabana Group LLC (“Cabana”), Congress Wealth Management LLC (“Congress”), Balasa Dinverno Foltz LLC (“BDF”), Bowling Portfolio Management LLC (“Bowling”), Stavis & Cohen Private Wealth LLC (“Stavis Cohen”), Doyle Wealth Management LLC (“Doyle”), The Roosevelt Investment Group LLC (“Roosevelt”), and RGT Wealth Advisors LLC (“RGT”). CI Private Counsel LP (“CIPC”), previously included in the Asset Management segment, is included in the Wealth Management segment effective January 1, 2020. The impact of this change was to move revenue of approximately $69.0 million and related expenses to the Wealth Management segment in the year ended December 31, 2020. The operating results of prior periods have been restated for comparative purposes. | MANAGEMENT’S DISCUSSION & ANALYSIS | Q4 Financial Report 3 December 31, 2020 |
| This MD&A contains forward-looking statements concerning anticipated future events, results, circumstances, performance or expectations with respect to CI Financial Corp. and its products and services, including its business operations, strategy and financial performance and condition. Forward-looking statements are typically identified by words such as “believe”, “expect”, “foresee”, “forecast”, “anticipate”, “intend”, “estimate”, “goal”, “plan” and “project” and similar references to future periods, or conditional verbs such as “will”, “may”, “should”, “could” or “would”. These statements are not historical facts but instead represent management beliefs regarding future events, many of which by their nature are inherently uncertain and beyond management’s control. Although management believes that the expectations reflected in such forward-looking statements are based on reasonable assumptions, such statements involve risks and uncertainties. The material factors and assumptions applied in reaching the conclusions contained in these forward-looking statements include that the investment fund industry will remain stable and that interest rates will remain relatively stable. Factors that could cause actual results to differ materially from expectations include, among other things, general economic and market conditions, including interest and foreign exchange rates, global financial markets, the impact of the coronavirus pandemic, changes in government regulations or in tax laws, industry competition, technological developments and other factors described or discussed in CI’s disclosure materials filed with applicable securities regulatory authorities from time to time. The foregoing list is not exhaustive and the reader is cautioned to consider these and other factors carefully and not to place undue reliance on forward-looking statements. Other than as specifically required by applicable law, CI undertakes no obligation to update or alter any forward-looking statement after the date on which it is made, whether to reflect new information, future events or otherwise. This MD&A includes several non-IFRS financial measures that do not have any standardized meaning prescribed by IFRS and may not be comparable to similar measures presented by other companies. CI believes that these financial measures provide information that is useful to investors in understanding CI’s performance and facilitate a comparison of quarterly and full year results from period to period. Descriptions of these non-IFRS measures and reconciliations to the nearest IFRS measure, where necessary, are provided in the “Non-IFRS Measures” section of this MD&A. Note that figures in tables may not add due to rounding. | MANAGEMENT’S DISCUSSION & ANALYSIS | Q4 Financial Report 4 December 31, 2020 |
| BUSINESS OVERVIEW CI is a diversified wealth management firm and one of Canada’s largest independent asset management companies. CI’s principal business is the management, marketing, distribution and administration of investment products for Canadian investors. CI also provides financial advice, tax, retirement, estate and wealth planning services in Canada through Assante, CIPC, CI Direct Investing, Aligned, and in the United States through Surevest, One Capital, Cabana, Congress, BDF, Bowling, Stavis Cohen, Doyle, Roosevelt, and RGT. In addition, CI has asset management operations in Australia through its subsidiary GSFM. CI’s products are distributed primarily through brokers, independent financial planners and insurance advisors, including ACM, AFM, and Aligned financial advisors. CI operates through two business segments, Asset Management and Wealth Management. The Asset Management segment provides the majority of CI’s income and derives its revenue principally from the fees earned on the management of investment funds and other fee-earning investment products. CI uses in-house teams and external investment managers to provide portfolio management services. These investment managers typically have long careers in the industry as well as extensive track records with CI. This lineup of investment managers provides a wide selection of styles and areas of expertise for CI’s funds and ETFs. The Wealth Management segment (previously called Asset Administration) was renamed to better reflect CI’s performance measurement and business strategy, and now includes the results of operations of CIPC (previously in Asset Management). The Wealth Management segment derives its revenue principally from fees and commissions for providing financial planning and advice (which may include investment management services), and on the sale of investment funds and other financial products. Prior results have been restated for comparative purposes. BUSINESS STRATEGY In the fourth quarter of 2019, CI Financial announced a new strategic direction for the company, with the introduction of three strategic priorities: • Modernize the asset management business • Expand the wealth management platform • Globalize the company In establishing these priorities, CI sought input from a series of critical sources, including employees, clients, shareholders and industry analysts, and incorporated insights from observing market dynamics and industry trends. Each strategic priority builds on CI’s existing extensive capabilities to take advantage of opportunities in the marketplace. A key factor in CI’s focus on modernizing its asset management business is that the rate and pace of change in the industry is at an all-time high, due to changes in demographics and investor preferences, changing client expectations for service and support, and ongoing regulatory change. This environment requires new services, new products and new approaches to meet investors’ changing needs. | MANAGEMENT’S DISCUSSION & ANALYSIS | Q4 Financial Report 5 December 31, 2020 |
| CI also believes that the role of the advisor is more important than ever. As consumers' lives become increasingly complex and digital, CI’s breadth of capabilities uniquely positions the firm to be Canada's market leader; this is why expanding its wealth management platform is a strategic priority. With scale becoming increasingly important in the industry and difficult to achieve in Canada alone, CI is globalizing the company. This strategic priority will also help the firm secure access to global talent to complement its existing capabilities. In executing its strategy, the firm is leveraging its strategic foundation comprised of people, technology, speed and financial strength. By deploying its human capital and capabilities, driving advanced technology into everything the firm does, embedding new ways of working to be faster and more nimble, and maximizing the benefits of its financial strength, CI intends to maintain and grow its leadership in the asset management and wealth management industries. As CI evolves to meet the challenges of a rapidly changing investment industry, it continues to make significant investments in key areas of the business to drive growth and broaden revenue opportunities, while prudently controlling expenditures. As of November 17, 2020, the Corporation’s shares began trading on the New York Stock Exchange (“NYSE”) under the symbol CIXX. CI sought the listing to broaden its investor base, increase its corporate profile in the U.S. market, and provide the option of offering shares as part of the purchase price when acquiring companies in the U.S. The listing supports CI’s strategic priorities of globalizing the firm and expanding its wealth management platform. COVID-19 IMPACT The COVID-19 pandemic has contributed to significant volatility in the financial markets. CI activated its business continuity plan in early March 2020 to mitigate risks, maintain operational efficiency and service levels, and address the health and safety concerns of our employees, clients and advisors. The extent to which CI’s business, financial condition and results of operations will be impacted by the COVID-19 pandemic, including attempts to mitigate its effects, is uncertain and will depend on future developments, which continues to be unpredictable and rapidly evolving. A more detailed discussion can be found in “Business Continuity Risk” of the “Risk Management” section of this report. KEY PERFORMANCE DRIVERS Total assets under management (“total AUM”) includes core assets under management (“core AUM”) and U.S. assets under management. The key performance indicator for the Asset Management segment is the level of core AUM, and for the Wealth Management segment, the level of wealth management assets. CI’s total AUM and wealth management assets are primarily driven by fund performance, gross sales and redemptions of investment products, attracting new clients and the addition of new assets from current clients. As most of CI’s revenues and expenses are based on daily asset levels throughout the year, average assets for a particular period are critical to the analysis of CI’s financial results. While some expenses, such as trailer fees, vary directly with the level of AUM, a portion of CI’s expenses do not, such as a portion of overhead, discretionary spend, and deferred sales commissions. Over the long term, CI manages the level of its discretionary spend to be | MANAGEMENT’S DISCUSSION & ANALYSIS | Q4 Financial Report 6 December 31, 2020 |
| consistent with, or below, the growth in its revenue. In any given period, CI may choose to make investments in people or technology that benefit the long-term growth of the company. CI uses several performance indicators to assess its results. These indicators are described throughout the results of operations and the discussion of the two operating segments and include the following measures prescribed by IFRS: net income and earnings per share; and measures not prescribed by IFRS: adjusted net income, adjusted earnings per share, operating cash flow, free cash flow, EBITDA, adjusted EBITDA, EBITDA margin, adjusted EBITDA margin, dealer gross margin, net debt, asset management margin, and SG&A efficiency margin. Descriptions of these non-IFRS measures and reconciliations to IFRS are provided below. | MANAGEMENT’S DISCUSSION & ANALYSIS | Q4 Financial Report 7 December 31, 2020 |
| NON-IFRS MEASURES CI reports certain financial information using non-IFRS measures as CI believes that these financial measures provide information that is useful to investors in understanding CI’s performance and facilitate a comparison of quarterly and full-year results from period to period. ADJUSTED NET INCOME AND ADJUSTED EARNINGS PER SHARE CI defines adjusted net income as net income, net of non-controlling interest, and net of other provisions and adjustments. CI uses adjusted net income and adjusted earnings per share to compare underlying profitability for different periods. TABLE 1: ADJUSTED NET INCOME AND ADJUSTED EARNINGS PER SHARE [millions of dollars, except per share amounts] Quarter ended Dec. 31, 2020 Quarter ended Sep. 30, 2020 Quarter ended Dec. 31, 2019 Year ended Dec. 31, 2020 Year ended Dec. 31, 2019 Net Income 105.7 130.2 147.3 475.5 537.5 Add: Legal and restructuring charges 39.6 — — 45.9 26.6 Write-down of investments 1.6 — — 1.6 — Bond redemption costs 1.4 — — 1.4 — Less: Non-controlling interest 0.6 (0.4) (0.3) (0.4) (0.9) Adjusted net income 147.6 130.6 147.5 524.8 565.0 Adjusted earnings per share 0.71 0.62 0.66 2.45 2.41 OPERATING CASH FLOW AND FREE CASH FLOW CI measures its operating cash flow before the change in operating assets and liabilities, and the actual cash amount paid for interest and income taxes, as these items often distort the cash flow generated during the period. Operating assets and liabilities are affected by seasonality, the timing of interest payments depends on terms in specific debt instruments, and tax installments paid may differ materially from the cash tax accrual. Free cash flow is calculated as operating cash flow, net of non-controlling interest, and net of other provisions and adjustments. CI uses this measure, among others, when determining how to deploy capital. | MANAGEMENT’S DISCUSSION & ANALYSIS | Q4 Financial Report 8 December 31, 2020 |
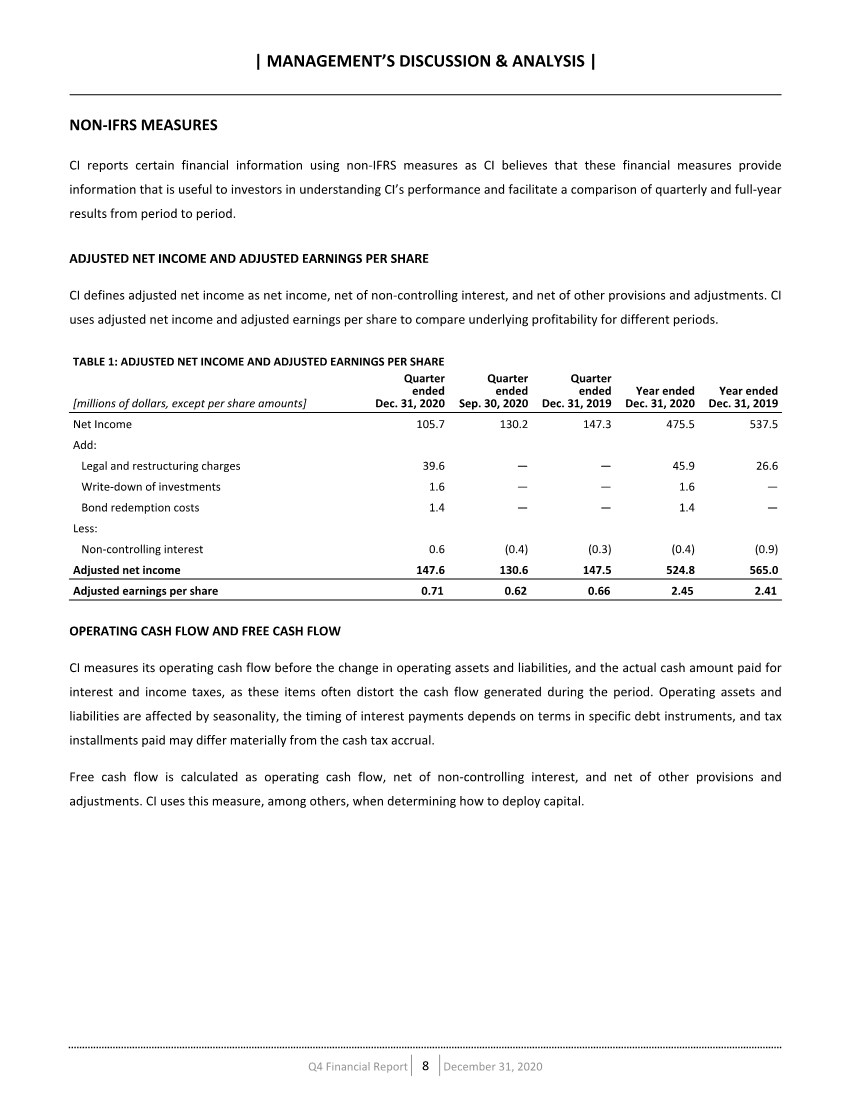
| TABLE 2: OPERATING CASH FLOW AND FREE CASH FLOW [millions of dollars] Quarter ended Dec. 31, 2020 Quarter ended Sep. 30, 2020 Quarter ended Dec. 31, 2019 Year ended Dec. 31, 2020 Year ended Dec. 31, 2019 Cash provided by operating activities 77.3 140.1 157.0 542.0 558.0 Net change in working capital 31.6 4.3 11.3 (18.6) 23.2 Operating cash flow 108.9 144.4 168.3 523.4 581.2 Add: Legal and restructuring charges 39.6 — — 45.9 26.6 Write-down on investments 1.6 — — 1.6 — Bond redemption costs 1.4 — — 1.4 — Less: Non-controlling interest 1.3 0.4 — 2.0 — Free cash flow 150.2 143.9 168.3 570.2 607.8 EBITDA, ADJUSTED EBITDA AND ADJUSTED EBITDA MARGIN CI uses EBITDA (earnings before interest, taxes, depreciation and amortization) and adjusted EBITDA, which it defines as EBITDA, net of non-controlling interest and other provisions and adjustments, to assess its underlying profitability prior to the impact of its financing structure, income taxes and amortization and depreciation. This permits comparisons of companies within the industry, normalizing for different financing methods and levels of taxation. Adjusted EBITDA is a measure of operating performance, a facilitator for valuation and a proxy for cash flow. Adjusted EBITDA margin expresses adjusted EBITDA as a percentage of total revenue. | MANAGEMENT’S DISCUSSION & ANALYSIS | Q4 Financial Report 9 December 31, 2020 |
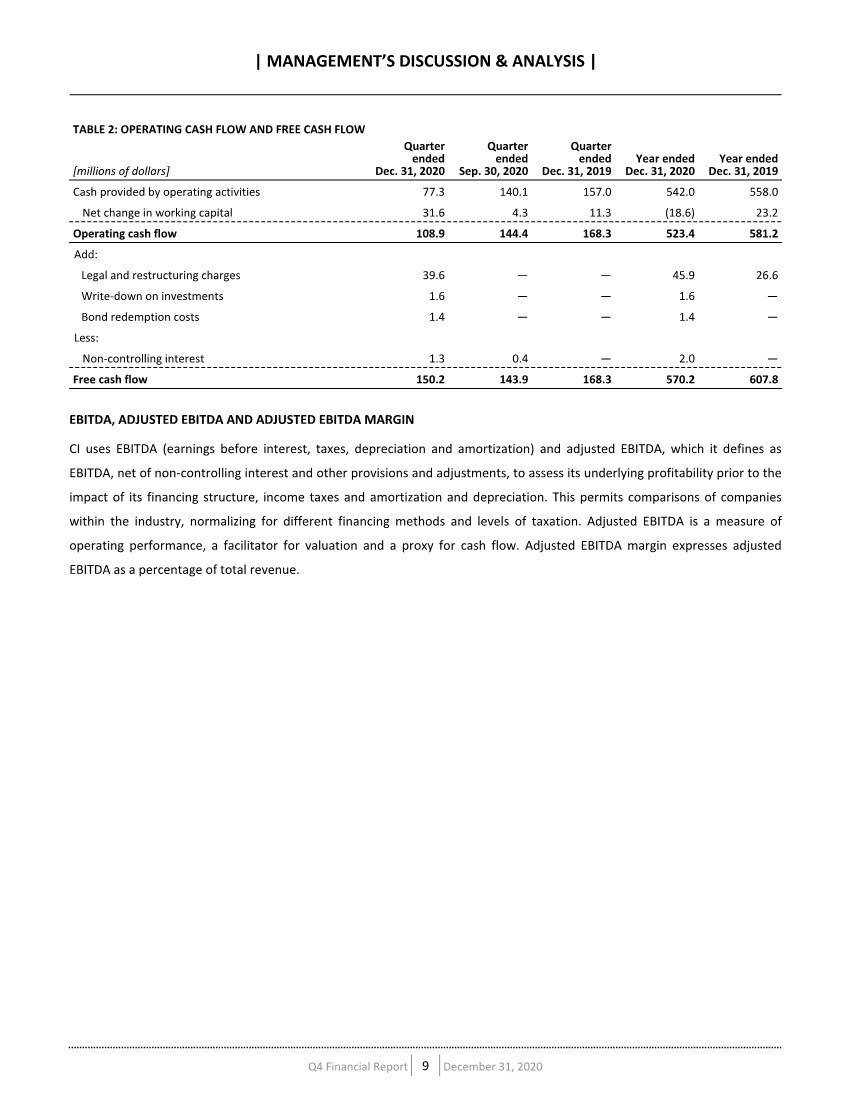
| TABLE 3: EBITDA, ADJUSTED EBITDA AND ADJUSTED EBITDA MARGIN [millions of dollars, except per share amounts] Quarter ended Dec. 31, 2020 Quarter ended Sep. 30, 2020 Quarter ended Dec. 31, 2019 Year ended Dec. 31, 2020 Year ended Dec. 31, 2019 Net Income 105.7 130.2 147.3 475.5 537.5 Add: Interest and lease finance 17.8 17.3 14.2 65.4 55.4 Provision for income taxes 36.6 46.1 53.8 167.2 189.3 Amortization and depreciation1 14.2 11.5 8.2 44.2 32.9 EBITDA 174.2 205.1 223.5 752.4 815.1 EBITDA per share 0.83 0.97 0.99 3.51 3.48 Add: Legal and restructuring provision 52.1 0.0 0.0 60.6 35.0 Write-down on investments 1.8 0.0 0.0 1.8 0.0 Bond redemption costs 1.9 0.0 0.0 1.9 0.0 Less: Non-controlling interest 1.5 0.5 (0.2) 2.2 (0.4) Adjusted EBITDA 228.4 204.5 223.7 814.5 850.5 Adjusted EBITDA per share 1.09 0.97 0.99 3.80 3.63 Total revenue 566.4 509.4 536.3 2,050.5 2,122.5 Adjusted EBITDA Margin 40.3% 40.2% 41.7% 39.7% 40.1% 1Includes amortization of equity accounted investments of $0.3 million for the quarter ended December 31, 2020 and $0.7 million for the year ended December 31, 2020 ($0.4 million for the quarter ended September 30, 2020, nil for the quarter ended December 31, 2019, and nil for the year ended December 31, 2019). NET DEBT CI calculates net debt as long-term debt (including the current portion) less cash and marketable securities, net of cash required for regulatory purposes and non-controlling interests. Net debt is a measure of leverage and CI uses this measure to assess its financial flexibility. TABLE 4: NET DEBT As at As at [millions of dollars] Dec. 31, 2020 Dec. 31, 2019 Current portion of long-term debt 203.8 449.5 Long-term debt 2,252.3 1,155.0 2,456.1 1,604.5 Less: Cash and short-term investments 483.6 118.4 Marketable securities, excluding CI Investment Services’ securities owned, at market 118.1 118.2 Add: Regulatory capital and non-controlling interests 18.0 14.7 Net Debt 1,872.4 1,382.6 | MANAGEMENT’S DISCUSSION & ANALYSIS | Q4 Financial Report 10 December 31, 2020 |
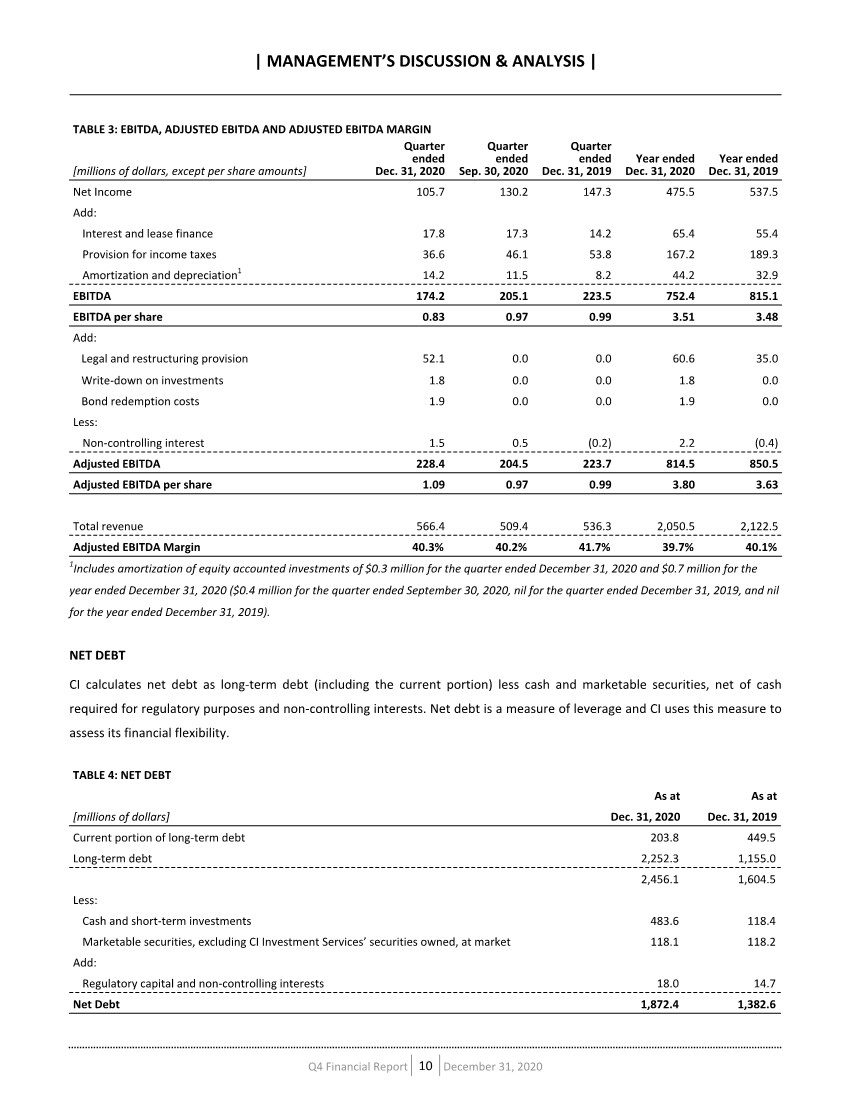
| DEALER GROSS MARGIN CI monitors its operating profitability on the revenues earned within its Wealth Management segment by measuring its dealer gross margin, which is calculated as administration fee revenue less advisor and dealer fees (previously investment dealer fees), divided by administration fee revenue (all figures before inter-segment eliminations). CI uses this measure to assess the profitability of the Wealth Management segment before SG&A expenses. TABLE 5: DEALER GROSS MARGIN [millions of dollars] Quarter ended Dec. 31, 2020 Quarter ended Sep. 30, 2020 Quarter ended Dec. 31, 2019 Year ended Dec. 31, 2020 Year ended Dec. 31, 2019 Administration fees 167.9 128.2 120.4 530.1 457.5 Less: Advisor and dealer fees 121.4 94.1 90.2 389.3 342.1 46.5 34.1 30.2 140.8 115.4 Dealer gross margin 27.7% 26.6% 25.1% 26.6% 25.2% ASSET MANAGEMENT MARGIN CI assesses the overall performance of the asset management segment using a trailing 12-month asset management margin, where deferred sales commissions, trailer fees, and SG&A expenses are deducted from management fees and measured as a percentage of management fees (all figures are before inter-segment eliminations). This removes distortion caused by other revenues and expenses, eliminates the financing impact of back-end load funds, and eliminates revenue mix variances because it is measured as a percentage of management fees and not average AUM. Using a trailing 12-month margin eliminates any seasonality associated with SG&A expenses. TABLE 6: ASSET MANAGEMENT MARGIN [millions of dollars - trailing 12 months] Quarter ended Dec. 31, 2020 Quarter ended Sep. 30, 2020 Quarter ended Jun. 30, 2020 Quarter ended Mar. 31, 2020 Quarter ended Dec. 31, 2019 Management fees 1,650.1 1,681.2 1,718.9 1,783.1 1,802.3 Less: Deferred sales commissions paid 8.0 9.1 10.4 12.1 13.5 Trailer fees 538.4 547.3 558.4 578.2 583.7 Net management fees 1,103.7 1,124.8 1,150.2 1,192.9 1,205.0 Less: SG&A expenses 325.2 327.1 343.2 358.9 370.6 778.4 797.7 807.0 834.0 834.4 Asset management margin 47.2% 47.4% 46.9% 46.8% 46.3% SG&A EFFICIENCY MARGIN CI uses a trailing 12-month SG&A efficiency margin to assess its costs relative to management fees earned, net of deferred sales commissions and trailer fees, which are not directly controllable by CI. SG&A expenses are subtracted from these net management fees and the remainder is measured as a percentage of net management fees. Using a trailing 12-month margin | MANAGEMENT’S DISCUSSION & ANALYSIS | Q4 Financial Report 11 December 31, 2020 |
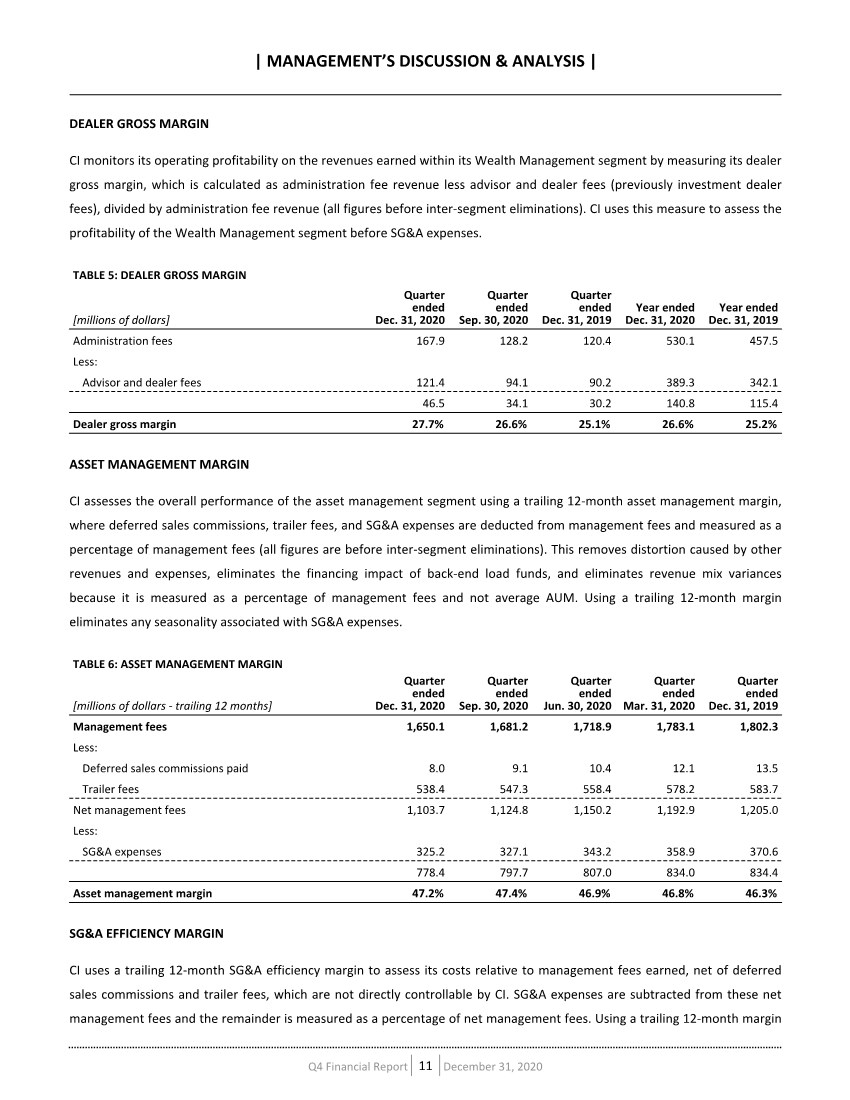
| eliminates any seasonality associated with SG&A expenses. TABLE 7: SG&A EFFICIENCY MARGIN [millions of dollars - trailing 12 months] Quarter ended Dec. 31, 2020 Quarter ended Sep. 30, 2020 Quarter ended Jun. 30, 2020 Quarter ended Mar. 31, 2020 Quarter ended Dec. 31, 2019 Management fees 1,650.1 1,681.2 1,718.9 1,783.1 1,802.3 Less: Deferred sales commissions paid 8.0 9.1 10.4 12.1 13.5 Trailer fees 538.4 547.3 558.4 578.2 583.7 Net management fees 1,103.7 1,124.8 1,150.2 1,192.9 1,205.0 Less: SG&A expenses 325.2 327.1 343.2 358.9 370.6 778.4 797.7 807.0 834.0 834.4 SG&A efficiency margin 70.5% 70.9% 70.2% 69.9% 69.2% | MANAGEMENT’S DISCUSSION & ANALYSIS | Q4 Financial Report 12 December 31, 2020 |
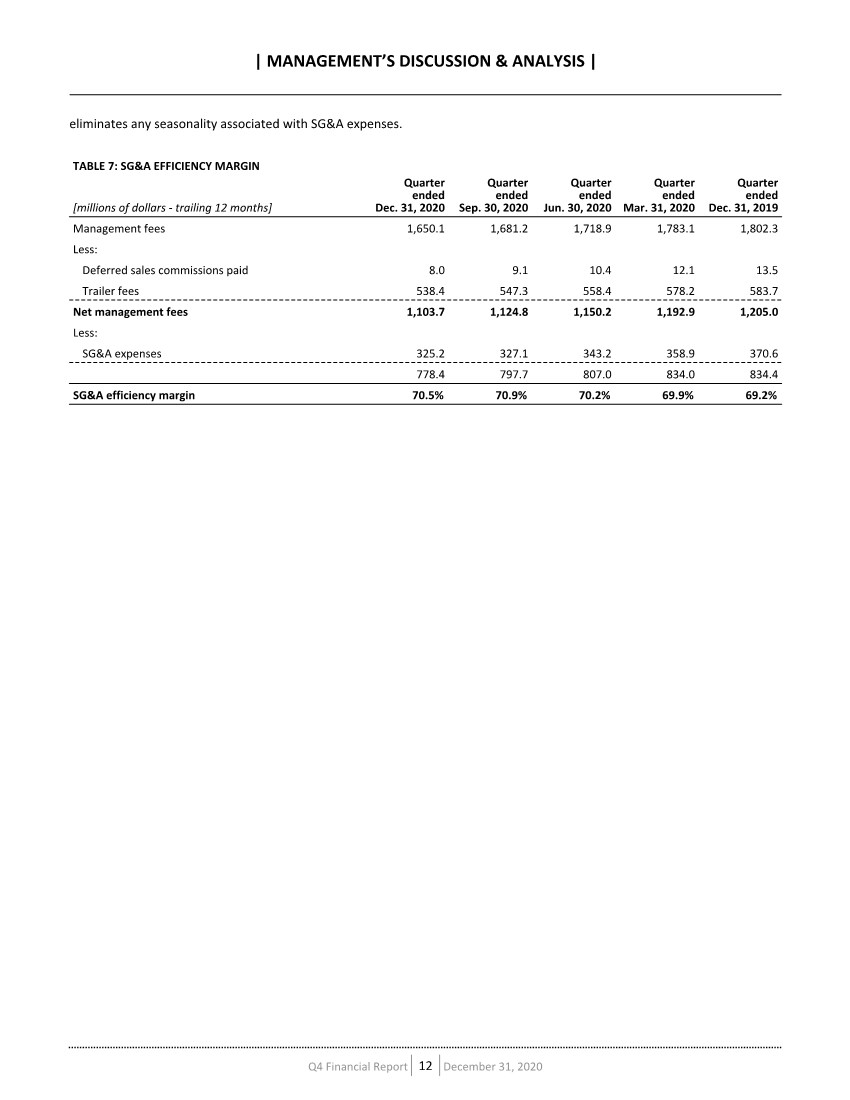
| ASSETS AND SALES CI is one of Canada’s largest independent investment fund companies with total assets under management of $135.1 billion and wealth management assets of $96.5 billion at December 31, 2020, as shown in Table 8. Core assets under management represents assets managed by CI Investments and GSFM. Operating results related to core assets under management are included in the Asset Management segment. U.S. assets under management are included in the Wealth Management segment as the related revenues are part of a holistic fee charged to clients for providing wealth management services. The operating results of CIPC, previously included in the Asset Management segment, are included in the Wealth Management segment effective January 1, 2020. Assets and sales for the prior periods have been restated, in the respective segments, for comparative purposes. Assets under management increased 3% year over year due to the acquisitions of CI ETF (formerly WisdomTree Asset Management Canada Inc.), One Capital, and Cabana, and positive investment performance, more than offsetting net redemptions of funds. The 91% increase in wealth management assets from last year was mainly due to the acquisitions of Surevest, One Capital, Cabana, Congress, BDF, Aligned, Bowling, Stavis Cohen, Doyle, Roosevelt and RGT. Total assets, which include mutual, segregated, separately managed accounts, structured products, exchange-traded funds, pooled funds and wealth management assets, were $231.5 billion at December 31, 2020, up $49.3 billion from $182.2 billion at December 31, 2019. TABLE 8: TOTAL ASSETS As at As at [billions of dollars] December 31, 2020 December 31, 2019 % change Core assets under management1 129.6 131.7 (2) U.S. assets under management 5.5 — nmf Total assets under management 135.1 131.7 3 Canadian wealth management 67.3 50.5 33 U.S. wealth management 29.2 — nmf Total wealth management assets 96.5 50.5 91 Total assets 231.5 182.2 27 1 Includes $32.6 billion of assets managed by CI and held by clients of advisors with Assante, Aligned, and CIPC as at December 31, 2020 and $29.0 billion of assets managed by CI and held by clients of advisors with Assante and CIPC as at December 31, 2019. Despite a resurgence of COVID-19 cases and renewed lockdowns in many regions, markets trended upward during the fourth quarter of 2020, boosted by growing clarity around the outcome of the U.S. presidential election and significant COVID-19 vaccine progress. The S&P 500 Index experienced a pullback due to uncertainty in the days leading up to the U.S. election but soared in the weeks that followed, driven by the energy and financials sectors, to end the year at a new all-time high. The S&P 500 Index, a broad representation of the U.S. equity market, was up 6.7% for the fourth quarter and 14.4% for the year in Canadian-dollar terms. The MSCI World Index, which reflects returns for developed equity markets around the globe, was up 8.5% for the quarter and 12.2% for the year in Canadian-dollar terms. | MANAGEMENT’S DISCUSSION & ANALYSIS | Q4 Financial Report 13 December 31, 2020 |
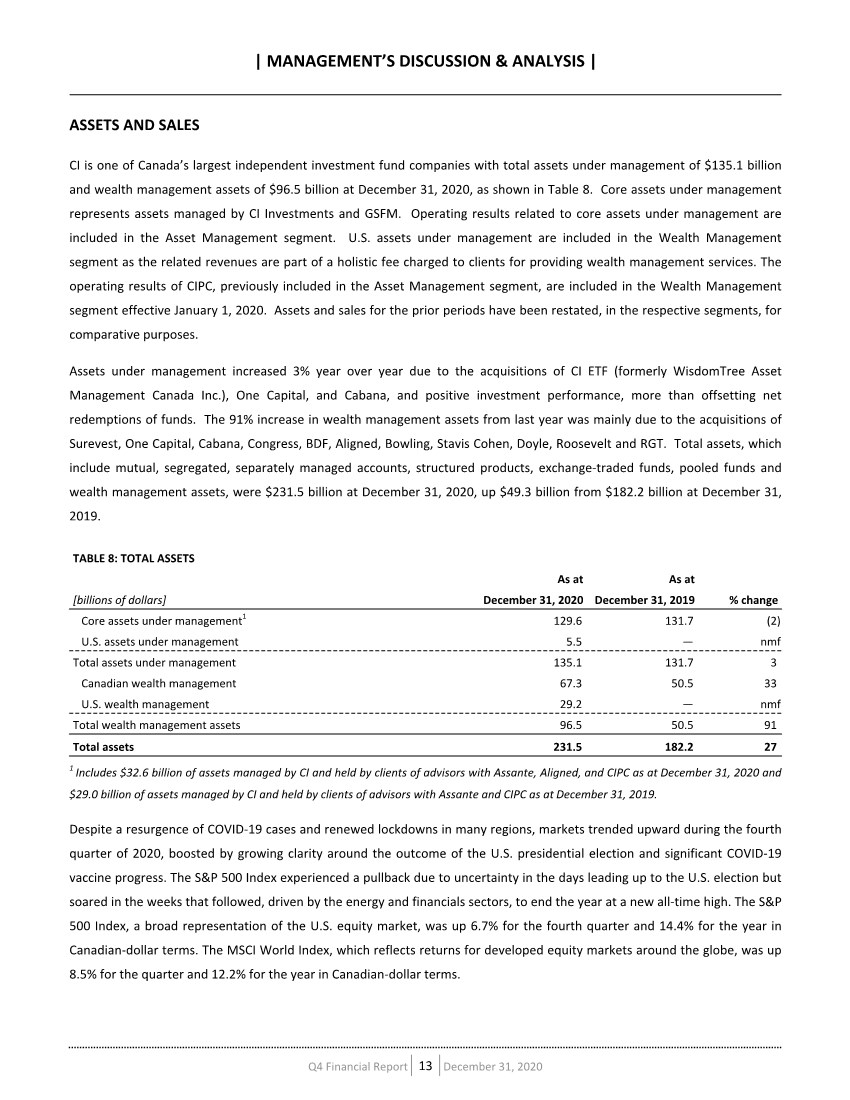
| The Canadian economy was boosted by stronger demand for energy and higher oil prices in the fourth quarter, along with the approval of COVID-19 vaccines. While the S&P/TSX Composite Index has moved upward since its pandemic-induced low in March, the Canadian benchmark has yet to return to the record level reached in February. The index posted a gain of 7.7% for the quarter and 2.2% for the year. Government benchmark interest rates remained unchanged in Canada, the U.S. and Europe during the final three-month period of the year. In December, the Bank of Canada held its benchmark interest rate steady at 0.25% after cutting rates in March in response to the COVID-19 pandemic. The Bank of Canada reiterated it will continue to buy Government of Canada bonds at a rate of about $4 billion per week to keep downward pressure on interest rates, and restated that it would keep the benchmark lending rate near zero until sometime in 2023. The U.S. Federal Reserve maintained its target for the federal funds rate at a range of 0% to 0.25%. The European Central Bank held interest rates on its main refinancing operations, marginal lending facility and key deposit rate at 0.00%, 0.25% and -0.50%, respectively and also expanded its monetary stimulus program. The change in AUM during each of the past five quarters is detailed in Table 9 and a breakdown of CI’s sales is provided in Table 10. TABLE 9: CHANGE IN TOTAL ASSETS UNDER MANAGEMENT [billions of dollars] Quarter ended Dec. 31, 2020 Quarter ended Sep. 30, 2020 Quarter ended Jun. 30, 2020 Quarter ended Mar. 31, 2020 Quarter ended Dec. 31, 2019 Assets under management, beginning 128.312 125.563 111.065 131.741 129.615 Gross sales 4.863 4.320 3.998 5.103 4.430 Redemptions 7.003 6.330 5.910 7.824 6.324 Net sales (2.140) (2.010) (1.911) (2.721) (1.894) Acquisitions (divestitures) — — 3.957 1.033 — Fund performance 8.880 4.759 12.452 (18.988) 4.020 Assets under management, ending 135.052 128.312 125.563 111.065 131.741 Average assets under management 131.246 129.021 120.104 127.163 130.542 Core assets under management, ending 129.591 123.605 121.286 111.065 131.741 Core average assets under management 126.233 124.626 118.413 127.163 130.542 CI reported $2.1 billion in overall net redemptions for the fourth quarter of 2020. CI’s Canadian retail business, excluding products closed to new investors, had $1.3 billion in net redemptions for the fourth quarter of 2020, an improvement of $0.2 billion from the third quarter of 2020 and up from $0.4 billion in net redemptions for the fourth quarter of 2019. CI’s Canadian institutional business had net redemptions of $0.9 billion for the fourth quarter of 2020, and represents an improvement of $0.5 billion over the same quarter a year ago. Sales at GSFM were relatively flat, with $36 million of net redemptions in the fourth quarter of 2020, and CI’s U.S. RIA business had $0.3 billion in net sales. CI’s closed business, comprised primarily of segregated fund contracts that are no longer available for sale, had $0.2 billion in net redemptions for the quarter. | MANAGEMENT’S DISCUSSION & ANALYSIS | Q4 Financial Report 14 December 31, 2020 |
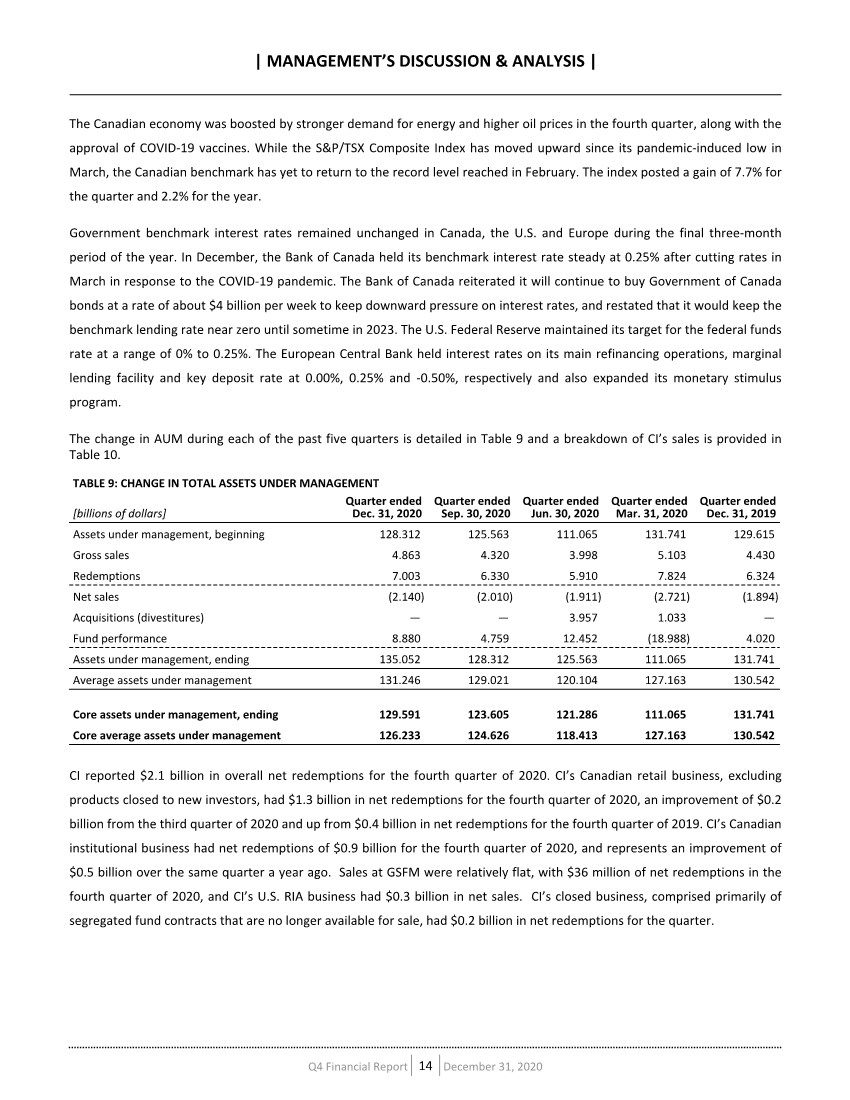
| TABLE 10: SALES BREAKDOWN Quarter ended December 31, 2020 Quarter ended December 31, 2019 [millions of dollars] Gross Sales Redemptions Net Sales Gross Sales Redemptions Net Sales Canadian Business Retail 3,722 4,976 (1,255) 3,771 4,178 (407) Institutional 302 1,226 (925) 383 1,853 (1,469) 4,023 6,203 (2,180) 4,154 6,030 (1,876) GSFM Retail 276 116 160 79 33 46 Institutional 124 320 (197) 190 8 182 400 436 (36) 269 41 228 U.S. RIAs 428 126 301 — — — Closed Business 12 237 (226) 8 253 (245) Total 4,863 7,003 (2,140) 4,430 6,324 (1,894) | MANAGEMENT’S DISCUSSION & ANALYSIS | Q4 Financial Report 15 December 31, 2020 |
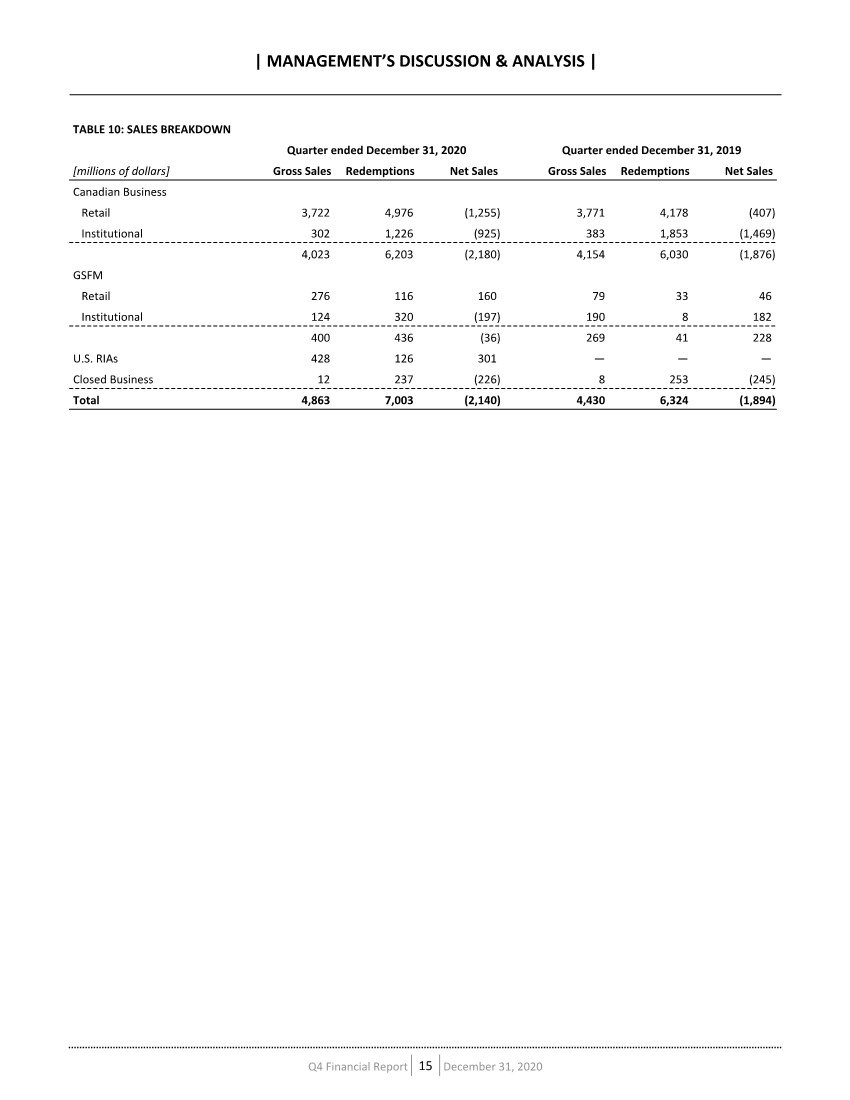
| RESULTS OF OPERATIONS The table below presents the consolidated results of operations of CI. TABLE 11: SELECTED ANNUAL INFORMATION Fiscal Years Ending December 31 [millions, except per share amounts] 2020 2019 2018 Management fees $1,635.8 $1,789.1 $1,933.6 Total revenue $2,050.5 $2,122.5 $2,236.4 Selling, general & administrative $449.4 $489.3 $512.6 Total expenses $1,407.7 $1,395.7 $1,393.1 Income before income taxes $642.7 $726.8 $843.3 Income taxes $167.2 $189.3 $225.5 Non-controlling interest ($0.4) ($0.9) $0.4 Net income available to shareholders $476.0 $538.4 $617.5 Adjusted net income1 $524.8 $565.0 $617.5 Free cash flow1 $570.2 $607.8 $655.5 Basic earnings per share $2.22 $2.30 $2.38 Diluted earnings per share $2.21 $2.29 $2.38 Adjusted earnings per share1 $2.45 $2.41 $2.38 Adjusted EBITDA1 $814.5 $850.5 $906.2 Total assets $6,360 $4,368 $4,292 Gross debt $2,456 $1,604 $1,504 Net debt1 $1,872 $1,383 $1,255 Average shares outstanding 214.1 234.3 259.3 Shares outstanding 210.4 221.8 243.7 Share price $15.78 $21.71 $17.28 Market capitalization $3,319 $4,815 $4,212 1Adjusted net income, adjusted earnings per share, free cash flow, adjusted EBITDA and net debt are not standardized earnings measures prescribed by IFRS. Descriptions of these non-IFRS measures, as well as others, and reconciliations to IFRS, where necessary, are provided in the "Non-IFRS Measures" section of this MD&A. | MANAGEMENT’S DISCUSSION & ANALYSIS | Q4 Financial Report 16 December 31, 2020 |
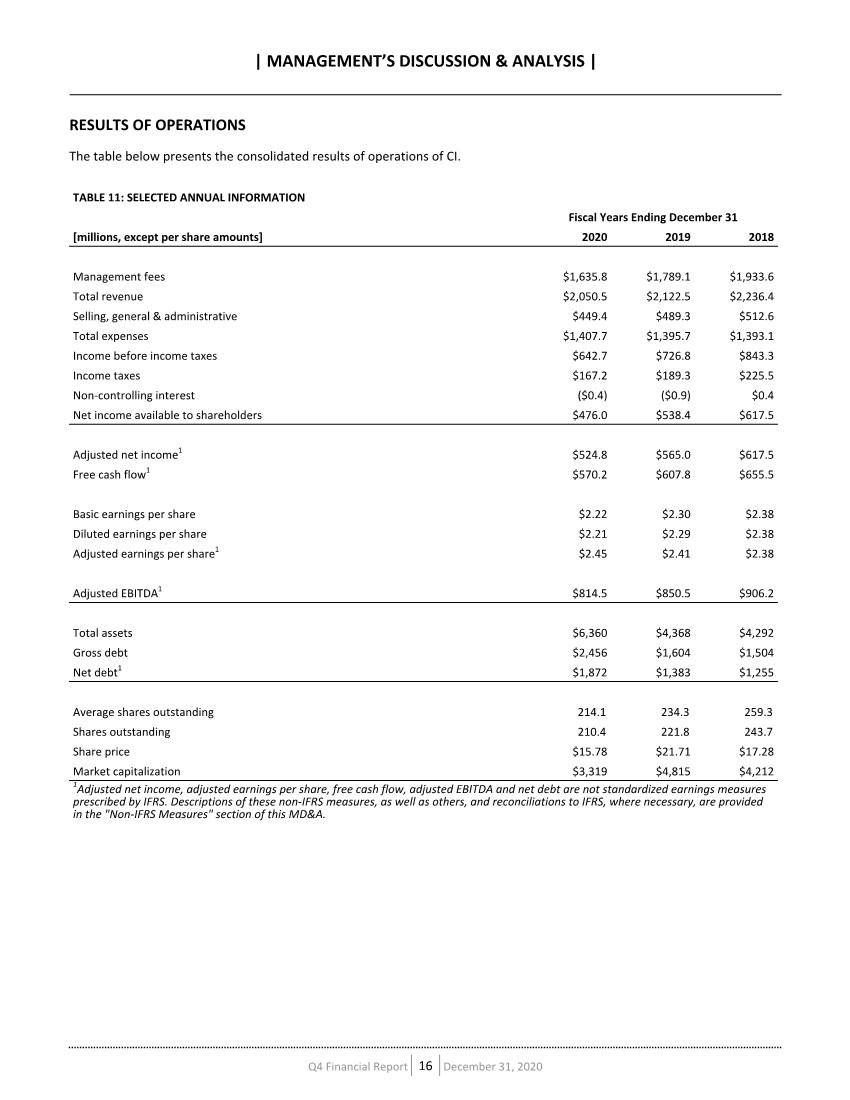
| TABLE 12: SUMMARY OF QUARTERLY RESULTS [millions of dollars, except per share amounts] 2020 2019 Q4 Q3 Q2 Q1 Q4 Q3 Q2 Q1 INCOME STATEMENT DATA Management fees 415.9 410.4 386.9 422.6 447.3 448.4 451.0 442.4 Administration fees 125.6 86.8 75.9 76.2 78.2 73.2 71.7 69.5 Other revenues 24.9 12.1 12.7 0.5 10.8 7.0 8.2 14.9 Total revenues 566.4 509.4 475.4 499.3 536.3 528.6 530.9 526.8 Selling, general & administrative 116.7 108.8 109.0 115.0 113.8 124.6 124.8 126.1 Trailer fees 129.4 128.0 121.0 131.1 138.7 139.1 140.4 136.9 Advisor and dealer fees 87.0 60.3 53.6 52.5 55.4 51.7 50.6 48.5 Deferred sales commissions paid 1.4 1.4 1.4 3.2 2.4 2.6 3.1 4.6 Interest and lease finance 17.8 17.3 15.8 14.6 14.2 13.8 13.7 13.7 Amortization and depreciation 13.9 11.0 10.0 8.6 8.2 8.2 8.3 8.2 Other expenses 58.0 6.2 3.8 11.0 2.3 2.4 37.4 1.6 Total expenses 424.2 333.0 314.6 335.9 335.2 342.4 378.5 339.6 Income before income taxes 142.2 176.3 160.8 163.4 201.1 186.2 152.4 187.2 Income taxes 36.6 46.1 41.1 43.5 53.8 47.4 40.9 47.2 Non-controlling interest 0.6 (0.4) (0.4) (0.3) (0.3) (0.2) (0.3) (0.1) Net income attributable to shareholders 105.0 130.6 120.2 120.2 147.5 139.0 111.9 140.0 Earnings per share 0.50 0.62 0.56 0.55 0.66 0.60 0.47 0.58 Diluted earnings per share 0.50 0.61 0.55 0.54 0.65 0.60 0.47 0.58 Dividends paid per share 0.18 0.18 0.18 0.18 0.18 0.18 0.18 0.18 Year Ended December 31, 2020 For the year ended December 31, 2020, CI reported net income attributable to shareholders of $476.0 million ($2.22 per share) versus $538.4 million ($2.30 per share) for the year ended December 31, 2019 as seen in Table 11 above. Net income for the year ended December 31, 2020 included a $6.2 million ($8.5 million before tax) restructuring provision in the first quarter, $39.6 million ($52.1 million before tax) of legal and severances charges, $1.6 million ($1.8 million before tax) of investment write-downs, and $1.4 million ($1.9 million before tax) of losses from the early redemption of bonds in the fourth quarter of 2020. Net income for the year ended December 31, 2019 included a restructuring provision of $26.6 million ($35.0 million before tax) related to severances and technology write downs in the second quarter. Excluding the non-recurring items in both periods, CI’s adjusted net income attributable to shareholders was $524.8 million ($2.45 per share) for 2020 and $565.0 million ($2.41 per share) for 2019. The year-over-year decrease in adjusted net income was primarily a result of lower management fees due to lower average AUM. | MANAGEMENT’S DISCUSSION & ANALYSIS | Q4 Financial Report 17 December 31, 2020 |
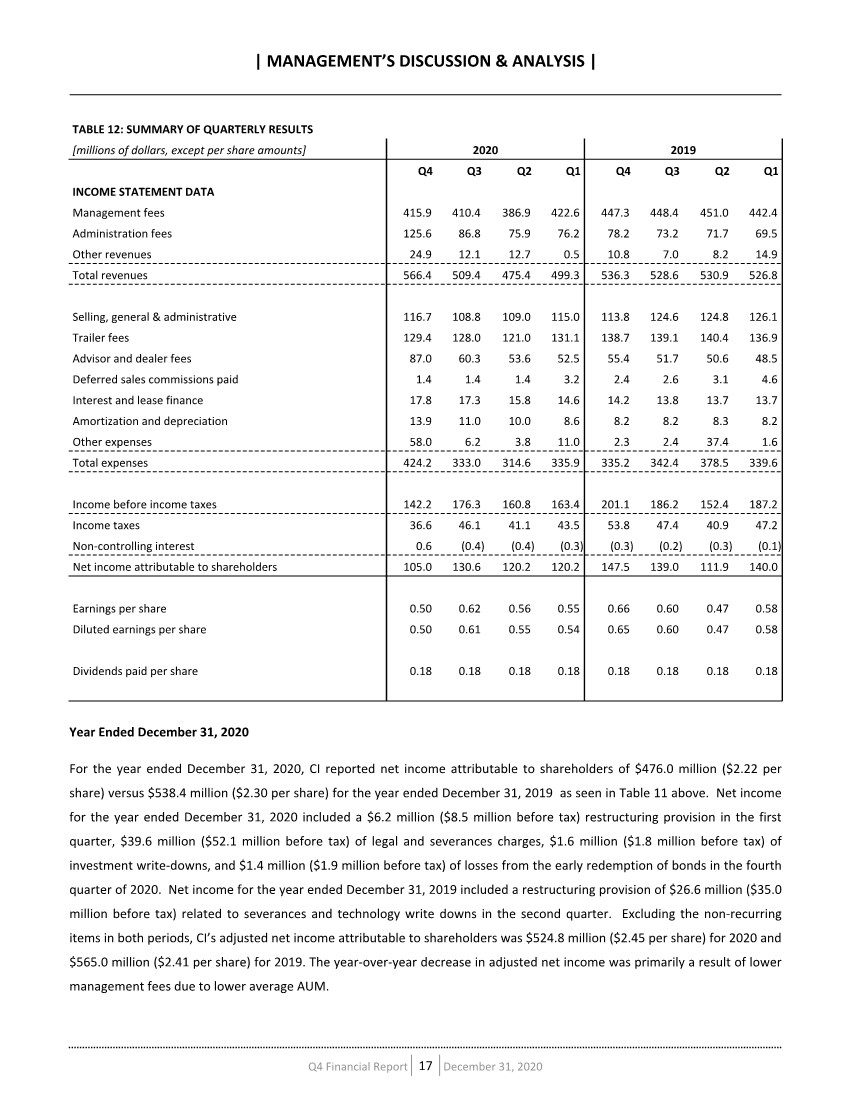
| CI’s total revenue was $2,050.5 million in 2020, a decrease of 3.4% when compared to total revenue of $2,122.5 million in 2019. Total revenue included realized and unrealized gains on investments of $6.9 million in 2020 and $10.8 million in 2019. Similar to net income, the decrease in total revenue was primarily due to a decrease in management fees, as average AUM declined 2.2% offset by acquisitions made in the Wealth Management segment during 2020. For the year ended December 31, 2020, SG&A expenses were $449.4 million, down 8.1% from $489.3 million for the year ended 2019. While CI has been selectively investing in high-growth opportunities and other initiatives, the decrease in SG&A from last year was largely a result of management’s efforts to contain discretionary expenses in the legacy side of its asset management business, partially offset by acquisitions made in the Wealth Management segment during 2020. As a percentage of average core AUM, SG&A expenses were 0.362%, down from 0.377% last year. During 2020, CI paid $7.5 million in deferred sales commissions, compared with $12.8 million in 2019. Consistent with the Canadian mutual fund industry, CI’s sales into deferred load funds have been steadily decreasing over the past decade. Interest expense of $65.4 million was recorded for the year ended December 31, 2020 compared with $55.4 million for the year ended December 31, 2019. The change in interest expense reflects the changes in average debt levels and interest rates, as discussed under the Liquidity and Capital Resources section. For 2020, CI recorded $167.2 million in income tax expense for an effective tax rate of 26.0%, compared to $189.3 million, or 26.0%, in 2019. CI’s effective tax rate may differ from its statutory tax rate, which is currently 26.5%, as a result of some expenses being nondeductible or partially deductible, or some revenue items not being fully taxable. Quarter Ended December 31, 2020 For the quarter ended December 31, 2020, CI reported net income attributable to shareholders of $105.0 million ($0.50 per share) down from $147.5 million ($0.66 per share) for the quarter ended December 31, 2019 and down from $130.6 million ($0.62 per share) for the quarter ended September 30, 2020 as seen in Table 12 above. The fourth quarter of 2020 included $39.6 million ($52.1 million before tax) of legal and severances charges, $1.6 million ($1.8 million before tax) of investment write-downs, and $1.4 million ($1.9 million before tax) of losses from the early redemption of bonds. Excluding the non- recurring items in the current quarter, adjusted net income attributable to shareholders was $147.6 million ($0.71 per share). The slight increase from the prior year was mainly due to cost containment efforts offsetting lower management fees from lower average AUM and the increase from the prior quarter was mainly due to higher average AUM and an increase in client based revenue from the wealth management segment. CI’s total revenue was $566.4 million in the fourth quarter of 2020, an increase of 5.6% when compared to total revenue of $536.3 million in the same period in 2019. On a consecutive quarter basis, total revenue increased 11.2% from $509.4 million. Total revenue included realized and unrealized gains on investments of $9.6 million in the fourth quarter of 2020, compared with $3.0 million in the same period in 2019, and $4.8 million in the prior quarter. The increase from the prior year was related to acquisitions made during the year. The increase from the prior quarter was due to higher asset-based revenue from higher average assets, the inclusion of Congress and BDF for a full quarter, and acquisitions made during the current quarter. | MANAGEMENT’S DISCUSSION & ANALYSIS | Q4 Financial Report 18 December 31, 2020 |

| For the quarter ended December 31, 2020, SG&A expenses were $116.7 million, up 2.5% from $113.8 million in the same quarter of 2019 and up from $108.8 million in the prior quarter. The increase in SG&A from the prior year was related to acquisitions made during the year. The increase from the prior quarter was due to the inclusion of Congress and BDF for a full quarter, and acquisitions made during the current quarter. As an annualized percentage of average core AUM, SG&A expenses were 0.368%, up from 0.346% for the fourth quarter of last year and 0.347% for the prior quarter. In the fourth quarter of 2020, CI paid $1.4 million in deferred sales commissions, compared with $2.4 million in the same quarter of 2019 and $1.4 million in the prior quarter. Consistent with the Canadian mutual fund industry, CI’s sales into deferred load funds have been steadily decreasing over the past decade. Interest expense of $17.8 million was recorded for the quarter ended December 31, 2020 compared with $14.2 million for the quarter ended December 31, 2019 and $17.3 million for the quarter ended September 30, 2020. The change in interest expense reflects the changes in average debt levels and interest rates, as discussed under the Liquidity and Capital Resources section. For the fourth quarter of 2020, CI recorded $36.6 million in income tax expense for an effective tax rate of 25.7% compared to $53.8 million, or 26.8%, in the fourth quarter of 2019, and $46.1 million, or 26.1%, in the prior quarter. The effective tax rate for the current quarter was lower than comparable periods due to the tax effect of unrealized gains on investments and translation-related foreign exchange gains. CI’s effective tax rate may differ from its statutory tax rate, which is currently 26.5%, as a result of some expenses being nondeductible or partially deductible, or some revenue items not being fully taxable. ASSET MANAGEMENT SEGMENT The Asset Management segment is CI’s largest business segment and its operating results are presented in Table 13. This segment excludes U.S. assets under management, as the related revenues are part of a holistic fee charged to clients for providing wealth management services. Accordingly, the key performance indicator for the asset management segment is the level of core AUM. As of January 1, 2020, the operating results of CI Private Counsel LP (previously included in the Asset Management segment) are included in the Wealth Management segment and operating results in the prior periods have been restated for comparative purposes. | MANAGEMENT’S DISCUSSION & ANALYSIS | Q4 Financial Report 19 December 31, 2020 |
| TABLE 13: RESULTS OF OPERATIONS - ASSET MANAGEMENT SEGMENT [millions of dollars] Quarter ended Dec. 31, 2020 Quarter ended Sep. 30, 2020 Quarter ended Dec. 31, 2019 Year ended Dec. 31, 2020 Year ended Dec. 31, 2019 Management fees 419.6 414.1 450.7 1,650.1 1,802.3 Other revenue (1.1) 4.0 1.6 (4.6) 4.0 Total revenue 418.5 418.1 452.4 1,645.5 1,806.3 Selling, general and administrative 82.5 78.4 84.4 325.2 370.6 Trailer fees 137.2 135.3 146.1 538.4 583.7 Deferred sales commissions paid 1.5 1.5 2.6 8.0 13.5 Amortization and depreciation 6.7 6.0 5.4 24.7 21.8 Other expenses 50.7 3.7 1.0 66.8 38.7 Total expenses 278.6 224.9 239.6 963.2 1,028.3 Non-controlling interest 0.4 0.1 0.3 0.9 0.7 Income before taxes and non-segmented items 139.5 193.1 212.5 681.4 777.2 Year Ended December 31, 2020 Revenues Revenues from management fees were $1,650.1 million for the year ended December 31, 2020, a decrease of 8.4% from $1,802.3 million for the year ended December 31, 2019. Net of inter-segment amounts, management fees were $1,635.8 million for 2020, versus $1,789.1 million for 2019. The decrease in management fees was mainly due to the 4.4% decrease in core average AUM and a decline in the management fee rate. The management fee rate has been generally declining due to a change in CI’s mix of business towards newer products with lower pricing, products that do not pay trailer fees, as well as new pricing initiatives intended to keep CI’s products competitive. Net management fees (management fees less trailer fees and deferred sales commissions) as a percentage of average core AUM were 0.889%, down from 0.928% for 2019. For the twelve months ended December 31, 2020, other revenue was $(4.6) million versus $4.0 million for the twelve months ended December 31, 2019. Other revenue in 2020 included a $1.9 million loss on the early repurchase of bonds, and $6.9 million of realized and unrealized gains on investments. This compares with $10.8 million of gains on investments in 2019. Other revenue for the year also included inter-segment related foreign exchange losses of $11.3 million that were offset by gains in the Wealth Management segment (nil in 2019). SG&A expenses for the Asset Management segment were $325.2 million for 2020, compared with $370.6 million for 2019. The decrease from last year was primarily due to ongoing efforts to contain SG&A in the asset management segment. As a percentage of average core AUM, SG&A expenses were 0.262% for the year ended December 31, 2020, down from 0.286% for the year ended December 31, 2019. | MANAGEMENT’S DISCUSSION & ANALYSIS | Q4 Financial Report 20 December 31, 2020 |
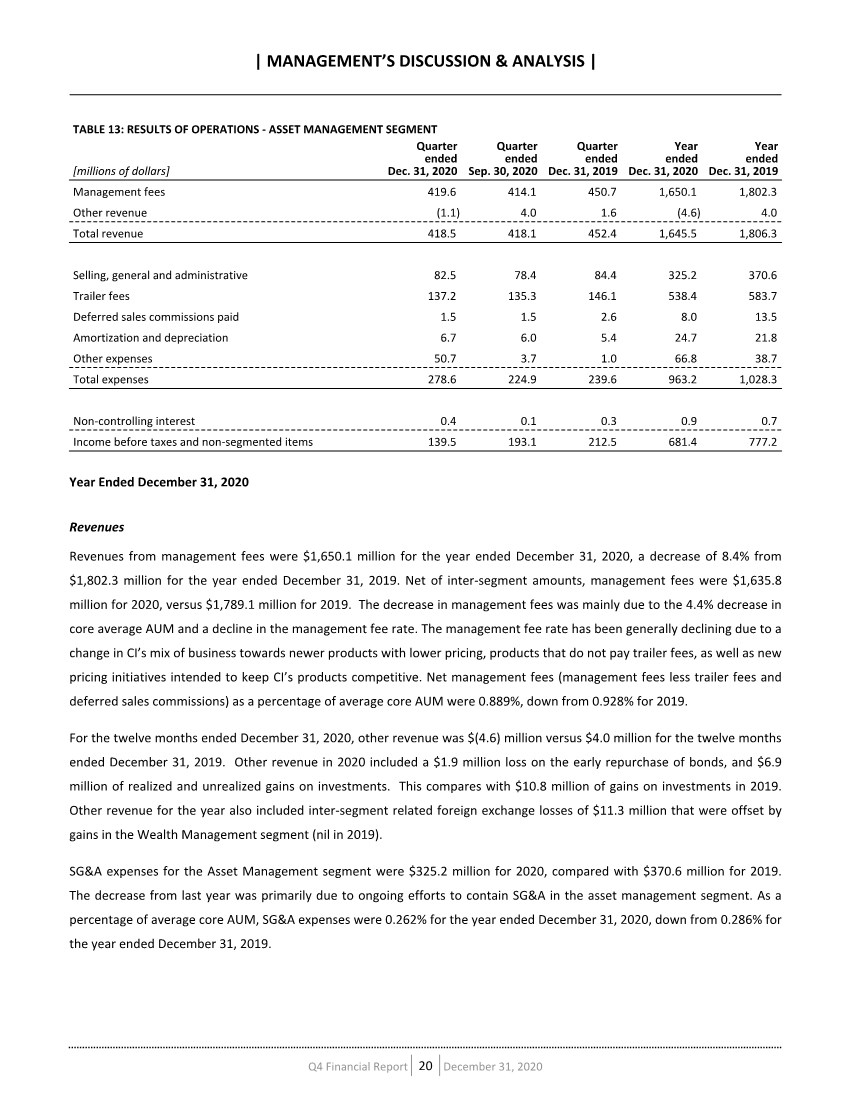
| Trailer fees were $538.4 million for the twelve months ended December 31, 2020, down from $583.7 million for the twelve months ended December 31, 2019. Net of inter-segment amounts, this expense was $509.4 million for the 2020 versus $555.2 million for 2019. The decrease related to the change in average AUM as well as the change in asset mix towards products that do not pay trailer fees. In 2020, before inter-segment eliminations, CI paid $8.0 million in deferred sales commissions, compared with $13.5 million in 2019. Consistent with the industry, CI’s sales into deferred load funds have been steadily decreasing over the past decade. Other expenses for the year ended December 31, 2020 were $66.8 million, compared to $38.7 million for the year ended December 31, 2019. As discussed earlier, 2020 included legal and restructuring charges and investment write-downs, $57.8 million of which related to the asset management segment, and 2019 included a restructuring provision, of which $32.4 million related to the asset management segment. The asset management margin for 2020 was 47.2% compared to 46.3% in 2019. CI was able to hold the annual margin relatively steady through cost containment measures in response to declining fees. During periods of declining AUM and/or fee rates, CI’s management will respond by strategically reducing SG&A. Another measure that CI uses to assess its costs is the SG&A efficiency margin. This measure differs from the asset management margin as it is calculated as a percentage of net management fees (management fees less trailers and deferred sales commissions), and measures CI’s profitability without regard to purchase option preferences available to clients. CI’s 2020 SG&A efficiency margin was 70.5%, a slight improvement from 69.2% in 2019. The calculations and definitions of asset management margin and SG&A efficiency margin can be found in the “Non-IFRS Measures” section. Income before taxes and non-segmented items for CI’s largest segment was $681.4 million for the year ended December 31, 2020, down 12.3% from $777.2 million for the year ended December 31, 2019. Excluding inter-segment foreign exchange losses and non-recurring items discussed earlier, income before taxes and non-segmented items was $752.5 million for the year ended December 31, 2020 and $809.6 million for the year ended December 31, 2019. Quarter Ended December 31, 2020 Revenues Revenues from management fees were $419.6 million for the quarter ended December 31, 2020, a decrease of 6.9% from $450.7 million for the quarter ended December 31, 2019 and an increase of 1.3% from $414.1 million for the quarter ended September 30, 2020. Net of inter-segment amounts, management fees were $415.9 million for the fourth quarter of 2020, versus $447.3 million for the fourth quarter of 2019, and $410.4 million for the third quarter of 2020. The decrease in management fees from the prior year was due to a decline in core average AUM and the management fee rate, and the increase in management fees from the prior quarter was mainly due to an increase in core average AUM. Net management fees (management fees less trailer fees and deferred sales commissions) as a percentage of core average AUM were 0.886%, down from 0.918% for the fourth quarter last year and relatively unchanged from 0.885% for the prior quarter. For the quarter ended December 31, 2020, other revenue was $(1.1) million versus $1.6 million for the quarter ended December 31, 2019 and $4.0 million for the quarter ended September 30, 2020. Other revenue included a $1.9 million loss on | MANAGEMENT’S DISCUSSION & ANALYSIS | Q4 Financial Report 21 December 31, 2020 |
| the early repurchase of bonds, and $9.6 million of realized and unrealized gains on investments in the fourth quarter of 2020. This compares with $3.0 million of gains on investments in the same period in 2019, and $4.8 million of gains in the prior quarter. Other revenue also included inter-segment related foreign exchange losses of $11.7 million that were offset by gains in the Wealth Management segment. This compared to nil in the fourth quarter of 2019, and $1.5 million of inter-segment related gains in the prior quarter. Expenses SG&A expenses for the Asset Management segment were $82.5 million for the quarter ended December 31, 2020, compared with $84.4 million for the fourth quarter in 2019 and $78.4 million for the prior quarter. Changes from the prior periods are primarily due to changes in variable SG&A and management’s efforts to modernize its asset management business and contain costs in this segment. As a percentage of core average AUM, SG&A expenses were 0.260% for the quarter ended December 31, 2020, relatively unchanged from 0.256% for the quarter ended December 31, 2019 and 0.250% for the quarter ended September 30, 2020. Trailer fees were $137.2 million for the quarter ended December 31, 2020, down 6.1% from $146.1 million for the quarter ended December 31, 2019 and up 1.4% from $135.3 million for the quarter ended September 30, 2020. Net of inter-segment amounts, this expense was $129.4 million for the quarter ended December 31, 2020 versus $138.7 million for the fourth quarter of 2019 and $128.0 million for the third quarter of 2020. Changes from the prior periods are due to changes in core average AUM. In the fourth quarter of 2020, before inter-segment eliminations, CI paid $1.5 million in deferred sales commissions, compared with $2.6 million in the same quarter of 2019 and $1.5 million in the prior quarter. Consistent with the Canadian mutual fund industry, CI’s sales into deferred load funds have been steadily decreasing over the past decade. Other expenses for the quarter ended December 31, 2020 were $50.7 million, compared to $1.0 million for the quarter ended December 31, 2019 and $3.7 million for the quarter ended September 30, 2020. As discussed earlier, other expenses for the fourth quarter of 2020 included legal and restructuring charges and investment write-downs, $49.3 million of which related to the asset management segment. On a trailing 12-month basis, CI’s asset management margin was 47.2%, up from 46.3% for the same period last year. CI’s current quarter SG&A efficiency margin was 70.6%, down from 72.1% in the fourth quarter of last year and relatively unchanged from 71.7% in the prior quarter. The calculations and definitions of asset management margin and SG&A efficiency margin can be found in the “Non-IFRS Measures” section. The asset management margin for the fourth quarter of 2020 was 47.3% compared to 48.3% in the fourth quarter of 2019 and 48.0% in the prior quarter. Income before taxes and non-segmented items for the segment was $139.5 million for the quarter ended December 31, 2020, down 34.4% from $212.5 million in the same period in 2019 and down 27.8% from $193.1 million in the previous quarter. Excluding inter-segment related foreign exchange losses and non-recurring items discussed earlier, income before taxes and non-segmented items was $202.4 million for the quarter ended December 31, 2020 compared with $212.5 million for the quarter ended December 31, 2019, and $191.6 million for the prior quarter. | MANAGEMENT’S DISCUSSION & ANALYSIS | Q4 Financial Report 22 December 31, 2020 |
| WEALTH MANAGEMENT SEGMENT The Wealth Management segment operating results are presented in Table 14. As of January 1, 2020, the operating results of CI Private Counsel LP (previously included in the Asset Management segment) are included in the Wealth Management segment and operating results in the prior periods have been restated for comparative purposes. The results also comprise all revenues and expenses from U.S. wealth management companies, including those derived from the management of investment products. TABLE 14: RESULTS OF OPERATIONS - WEALTH MANAGEMENT SEGMENT [millions of dollars] Quarter ended Dec. 31, 2020 Quarter ended Sep. 30, 2020 Quarter ended Dec. 31, 2019 Year ended Dec. 31, 2020 Year ended Dec. 31, 2019 Administration fees 167.9 128.2 120.4 530.1 457.5 Other revenue 26.0 8.1 9.2 54.8 36.9 Total revenue 194.0 136.3 129.6 584.9 494.4 Selling, general and administrative 38.0 34.3 32.9 138.8 131.8 Advisor and dealer fees 121.4 94.1 90.2 389.3 342.1 Amortization and depreciation 7.2 5.0 2.8 18.8 11.1 Other expenses 7.3 2.6 1.3 12.2 5.1 Total expenses 173.9 135.9 127.1 559.0 490.1 Non-controlling interest 0.4 (0.5) (0.9) (1.2) (2.1) Income before taxes and non-segmented items 19.7 0.8 3.4 27.1 6.4 Year Ended December 31, 2020 Revenues Administration fees were $530.1 million for 2020, an increase of 15.9% from $457.5 million for 2019. The increase in administration fees from last year related to higher average wealth management assets and acquisitions made during the year. Net of inter-segment amounts, administration fee revenue was $364.4 million for the year ended December 31, 2020, up from $292.5 million for the year ended December 31, 2019. For the year ended December 31, 2020, other revenue was $54.8 million, up from $36.9 million for the year ended December 31, 2019. Other revenue is derived mainly from non-advisor associated activities, and included inter-segment related foreign exchange gains of $11.3 million in 2020 that were offset by losses in the Asset Management segment (nil in 2019). Advisor and dealer fees were $389.3 million for 2020 compared to $342.1 million for 2019. Net of inter-segment amounts, advisor and dealer fees were $253.4 million, up from $206.3 million for the prior year. The increase from the prior year is consistent with changes in client asset levels and associated administration fee revenues. | MANAGEMENT’S DISCUSSION & ANALYSIS | Q4 Financial Report 23 December 31, 2020 |
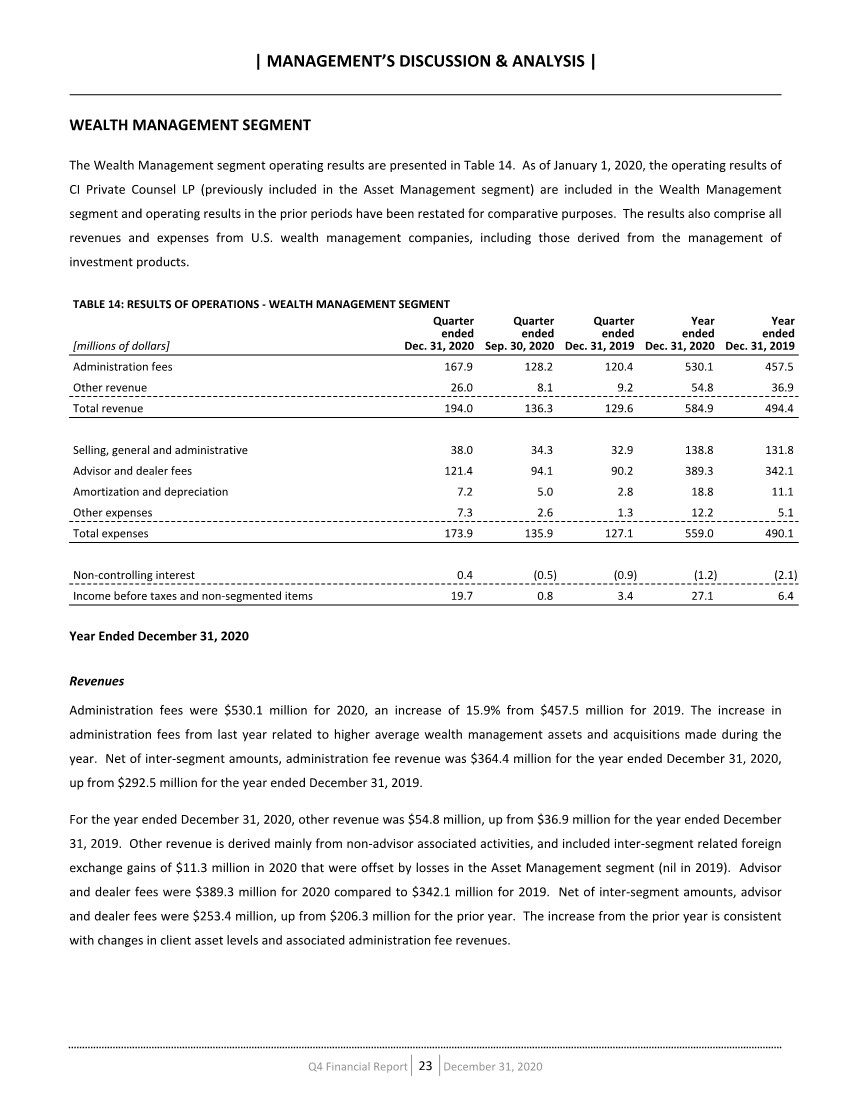
| As discussed in the “Non-IFRS Measures” section of this MD&A and as set out in Table 5, dealer gross margin was $140.8 million or 26.6% of administration fee revenue for the year ended December 31, 2020 compared to $115.4 million or 25.2% for the year ended December 31, 2019. SG&A expenses for the segment were $138.8 million for the twelve months ended December 31, 2020 compared to $131.8 million for the twelve months ended December 31, 2019. Net of inter-segment amounts, SG&A was $124.2 million for the year ended December 31, 2020 compared to $118.6 million for the year ended December 31, 2019. The increase in SG&A was attributable to acquisitions made in the Wealth Management segment during the year. Other expenses were $12.2 million for 2020, up from $5.1 million for 2019. As discussed earlier, 2020 included legal and restructuring charges, of which $4.6 million related to the wealth management segment, and 2019 included a restructuring provision, of which $2.6 million related to the wealth management segment. The Wealth Management segment had income before taxes and non-segmented items of $27.1 million for the year ended December 31, 2020, compared to $6.4 million for the year ended December 31, 2019. Excluding inter-segment related foreign exchange gains and non-recurring items discussed earlier, income before taxes and non-segmented items was $20.3 million for the year ended December 31, 2020 and $9.0 million for the year ended December 31, 2019. Quarter Ended December 31, 2020 Revenues Administration fees were $167.9 million for the quarter ended December 31, 2020, an increase of 39.5% from $120.4 million for the same period a year ago and an increase of 31.0% from $128.2 million for the prior quarter. The increase from the prior year was related to higher average wealth management assets and acquisitions made during the year. The increase from the prior quarter was related to higher average wealth management assets, the inclusion of Congress and BDF for a full quarter, and acquisitions made during the current quarter. Net of inter-segment amounts, administration fee revenue was $125.6 million for the quarter ended December 31, 2020, up from $78.2 million for the quarter ended December 31, 2019 and up from $86.8 million for the quarter ended September 30, 2020. For the quarter ended December 31, 2020, other revenue was $26.0 million, up from $9.2 million for the quarter ended December 31, 2019 and up from $8.1 million for the prior quarter. Other revenue is derived mainly from non-advisor associated activities, and included inter-segment related foreign exchange gains of $11.7 million in the fourth quarter of 2020, that were offset by losses in the Asset Management segment. This compares with nil in the fourth quarter of 2019, and $1.5 million of inter-segmented related losses in the prior quarter. | MANAGEMENT’S DISCUSSION & ANALYSIS | Q4 Financial Report 24 December 31, 2020 |
| Expenses Advisor and dealer fees were $121.4 million for the quarter ended December 31, 2020 compared to $90.2 million for the fourth quarter of 2019 and $94.1 million for the quarter ended September 30, 2020. Net of inter-segment amounts, advisor and dealer fees were $87.0 million, up from $55.4 million for the same quarter last year and up from $60.3 million for the prior quarter. Increases from prior periods are mainly a result of acquisitions, and are consistent with changes in client asset levels and associated administration fee revenues. As discussed in the “Non-IFRS Measures” section of this MD&A and as set out in Table 5, dealer gross margin was $46.5 million or 27.7% of administration fee revenue for the quarter ended December 31, 2020 compared to $30.2 million or 25.1% for the fourth quarter of 2019 and $34.1 million or 26.6% for the previous quarter. SG&A expenses for the segment were $38.0 million for the quarter ended December 31, 2020 compared to $32.9 million in the fourth quarter of 2019 and $34.3 million in the third quarter of 2020. Net of inter-segment amounts, SG&A was $34.1 million for the fourth quarter of 2020, compared with $29.4 million for the fourth quarter of 2019 and $30.4 million for the third quarter of 2020. The increase in SG&A from both comparable periods was attributable to acquisitions made in the U.S. registered investment advisor business. Other expenses were $7.3 million for the quarter ended December 31, 2020, up from $1.3 million in the same quarter of 2019 and up from $2.6 million in the third quarter of 2020. As discussed earlier, other expenses for the fourth quarter of 2020 included legal and restructuring charges, of which $4.6 million related to the wealth management segment. Depreciation and amortization expenses were $7.2 million for the quarter ended December 31, 2020, up from $2.8 million for the quarter ended December 31, 2019 and up from $5.0 million for the prior quarter. The increase from both prior periods was related to the depreciation of right-of-use assets and amortization of intangibles due to the acquisitions made in the segment. The Wealth Management segment had income before taxes and non-segmented items of $19.7 million for the quarter ended December 31, 2020, compared to $3.4 million for the fourth quarter of 2019 and $0.8 million for the prior quarter. Excluding inter-segment foreign exchange gains and legal and restructuring charges described earlier, income before taxes and non- segmented items was $12.6 million for the fourth quarter of 2020, compared to $3.4 million for the fourth quarter of 2019 and $2.3 million for the prior quarter. LIQUIDITY AND CAPITAL RESOURCES CI generated $570.2 million of free cash flow in 2020, compared to $607.8 million for the same period in 2019. Reconciliations of free cash flow to cash provided by operating activities are provided in the “Non-IFRS Measures” section and set out in Table 2. CI primarily uses cash flow to fund capital expenditures, fund acquisitions, pay down debt, pay dividends on its shares, and repurchase shares through its normal course issuer bid. At current levels of cash flow and anticipated dividend payout rates, CI expects to meet its obligations and support planned business operations. | MANAGEMENT’S DISCUSSION & ANALYSIS | Q4 Financial Report 25 December 31, 2020 |
| CI’s cash flows may fluctuate, primarily in the first quarter, as a result of the balance of cash income taxes and incentive compensation related to the prior year being paid at the end of February. TABLE 15: SUMMARY OF CASH FLOWS Year ended Year ended [millions of dollars] December 31, 2020 December 31, 2019 Free cash flow 570.2 607.8 Less: Investments in marketable securities, net of marketable securities sold (6.0) (25.2) Capital expenditures 12.0 12.4 Share repurchases, net of shares issued 257.9 447.3 Dividends paid 155.3 170.8 (Increase) / decrease in debt (846.0) (99.5) Acquisitions, net of cash acquired 527.3 26.1 Working capital and other items 104.4 94.8 204.9 626.7 Net change in cash 365.2 (18.8) Cash at January 1 118.4 137.2 Cash at December 31 483.6 118.4 During 2020, CI invested $17.6 million in marketable securities and received $23.6 million in proceeds from the disposition of marketable securities. Excluding CI Investment Services’ securities owned, at market, the fair value of CI’s investments as of December 31, 2020 was $118.1 million. This was comprised of seed capital investments in CI funds and strategic investments. During the year ended December 31, 2020, CI invested $12.0 million in capital assets, down slightly from $12.4 million in the year ended December 31, 2019. These investments related primarily to leasehold improvements and technology. During the year ended December 31, 2020, CI repurchased 14.0 million shares under its normal course issuer bid at a total cost of $257.9 million, or $18.42 per share. CI had 210,358,710 shares outstanding at the end of December, which differs from CI’s TSX-listed shares outstanding of 210,857,394 by the amount of restricted employee shares held in trust. CI paid dividends of $155.3 million during the year ended December 31, 2020. The Board of Directors declared a quarterly dividend of $0.18 per share, payable on July 15, 2021, to shareholders of record on June 30, 2021. The statement of financial position for CI at December 31, 2020 reflected total assets of $6.360 billion, an increase of $1,992.0 million from $4.368 billion at December 31, 2019. This change was primarily due to acquisitions made during the year. CI’s cash and cash equivalents increased by $365.2 million in 2020 to $483.6 million, mainly due to restructuring debt, as described in greater detail below. In 2020, CI used $527.3 million, net of cash acquired, to fund acquisitions. Accounts receivable and prepaid expenses increased by $70.7 million to $ 240.8 million as of December 31, 2020. Capital assets increased by $1.0 million during the twelve months ended December 31, 2020 as a result of $13.3 million in capital additions, including those from acquisitions, less $12.3 million in amortization. | MANAGEMENT’S DISCUSSION & ANALYSIS | Q4 Financial Report 26 December 31, 2020 |

| Total liabilities increased by $1,873.7 million during 2020 to $4.742 billion at December 31, 2020. The main contributors to the change in liabilities were an increase in debt and changes to working capital. At December 31, 2020, CI had $2,466.0 million in outstanding debentures with a weighted average interest rate of 3.64% and a carrying value of $2,456.6 million. In May 2020, CI issued $450 million of debentures, to ensure sufficient liquidity during a period of market uncertainty in anticipation of an upcoming maturity in December. In December, CI issued US$700 million of debentures with a 10-year maturity, and announced its intention to use part of the proceeds towards the early redemption of debentures maturing in November 2021. CI completed the early redemption in January, resulting in a $1.9 million loss ($1.4 million after tax) in the fourth quarter of 2020. Subsequent to the year-end, CI raised an additional US$260 million by re- opening the December debenture issuance and announced its intention to redeem $325 million of debentures scheduled to mature in July 2023. On December 31, 2020, CI had drawn nil against its $700 million credit facility. Principal repayments on any drawn amounts are only required at the maturity of the facility, which is December 11, 2021. Net debt, as discussed in the “Non-IFRS Measures” section and as set out in Table 4, was $1,872.4 million at December 31, 2020, up from $1,382.6 million at December 31, 2019. The average gross debt level for the year ended December 31, 2020 was $1,881.7 million, compared to $1,587.4 million for the same period last year. At December 31, 2020, CI was in a positive working capital position. This, in addition to the availability of its credit facility, reflects the ability of CI to meet its cash flow requirements. CI’s ratios of debt to adjusted EBITDA and net debt to adjusted EBITDA were 2.7 to 1 and 2.1 to 1, respectively. CI was within its financial covenants with respect to its credit facility, which required that the debt to EBITDA ratio remain below 3.0 to 1, and assets under management not fall below $85 billion, based on a rolling 30-day average. Shareholders’ equity was $1.582 billion at December 31, 2020, an increase of $88.5 million from December 31, 2019. RISK MANAGEMENT CI is exposed to a number of risks that are inherent in the asset and wealth management business. Some factors which introduce or exacerbate risk are within the control of management and others are, by their nature, outside of CI’s direct control but must still be managed. Effective risk management is a key component to achieving CI’s business objectives and protecting company and client assets. It is an ongoing process involving the Board of Directors and the Company’s Risk Management Committee, comprising senior executives from CI’s core business and operating units. The Board has delegated primary responsibility for oversight of risk management to the Audit and Risk Committee of the Board of Directors. The Risk Management Committee monitors, evaluates and manages risk to provide reasonable assurance to the Board that CI’s business strategies and activities are consistent with its risk appetite. Risk updates are regularly provided to the Audit and Risk Committee of CI’s Board. CI has developed an enterprise-wide approach to identifying, measuring, monitoring and managing risk. The members of the Risk Management Committee identify and evaluate specific and material risks, applying both a quantitative and a qualitative | MANAGEMENT’S DISCUSSION & ANALYSIS | Q4 Financial Report 27 December 31, 2020 |

| analysis to assess the likelihood and impact of occurrence of a particular risk event. Once risks have been identified and rated, strategies and procedures are developed to minimize, transfer or avoid negative consequences. These risk mitigation processes are implemented and monitored with each business unit. The risks described below are not the only risks facing CI. The risks set out below are risks and uncertainties that the Risk Management Committee currently believe could materially affect CI’s future financial performance. The reader should carefully consider the risks described below, and the other information contained in this MD&A, including under the heading “Forward-Looking Statements” before making an investment decision. MARKET RISK Market risk is the risk of a financial loss resulting from adverse changes in underlying market factors, such as interest rates, foreign exchange rates, and equity and commodity prices. A description of each component of market risk is described below: CI’s financial performance is indirectly exposed to market risk. Any decline in financial markets or lack of sustained growth in such markets may result in a corresponding decline in the performance of CI’s investment funds and may adversely affect CI’s assets under management, management fees and revenues, which would reduce cash flow to CI and ultimately impact CI’s ability to meet its financial obligations. MARKET RISK FOR THE ASSET MANAGEMENT SEGMENT At December 31, 2020, approximately 29% of CI’s assets under management were held in fixed-income securities, which are exposed to interest rate risk. An increase in interest rates causes market prices of fixed-income securities to fall, while a decrease in interest rates causes market prices to rise. CI’s fund managers invest in a well-diversified portfolio of securities across issuers, durations and maturities, which reduces risk. CI estimates that a 100 basis point change in interest rates across the yield curve would cause a change of approximately $40 million to $50 million in annual pre-tax earnings in the Asset Management segment. At December 31, 2020, about 41% of CI’s assets under management were based in Canadian currency. While CI’s concentration in Canadian currency assets reduces its exposure to foreign exchange risk, approximately 44% of CI’s assets under management were based in U.S. currency. Any change in the value of the Canadian dollar relative to U.S. currency will cause fluctuations in CI’s assets under management. CI estimates that a 10% change in Canadian/U.S. exchange rates would cause a change of approximately $20 million to $30 million in the Asset Management segment’s annual pre-tax earnings. About 66% of CI’s assets under management were held in equity securities at December 31, 2020, which are subject to equity risk. Equity risk is classified into two categories: general equity risk and issuer-specific risk. CI employs internal and external fund managers to take advantage of their expertise in particular market niches, sectors and products and to reduce issuer-specific risk through diversification. CI estimates that a 10% change in the value of equities would cause a change of approximately $60 million to $70 million in annual pre-tax earnings. Please note that exposures and sensitivities do not account for currency hedging that portfolio managers may employ. There are risks and limitations with relying on models and it is possible that actual results may differ from those presented above. | MANAGEMENT’S DISCUSSION & ANALYSIS | Q4 Financial Report 28 December 31, 2020 |
| CI has a control environment that ensures market risks are reviewed regularly. CI’s compliance group reviews and monitors CI’s fund and portfolio investments for compliance with investment policies and regulations. CI also reviews investment processes, portfolio positioning and attribution of results of its investment teams on a regular basis. MARKET RISK FOR THE WEALTH MANAGEMENT SEGMENT CI’s wealth management segment generated approximately 4.0% of the total income before non-segmented items for the twelve months ended December 31, 2020. Excluding inter-segment related foreign exchange gains and non-recurring items, the wealth management segment generated approximately 2.6% of total income before non-segmented items. Investment advisors regularly review their client portfolios to assess market risk and consult with clients to make appropriate changes to mitigate it. POLITICAL AND MACRO-ECONOMIC RISK CI’s performance is directly affected by the performance of the financial markets which may be influenced by various political, demographic and macro-economic conditions or events, including any political change and uncertainty in the United States and globally. These changes may cause significant volatility and decline in the global economy or specific international, regional and domestic financial markets which are beyond the control of CI. There can be no assurance that financial market performance will be favourable in the future. Any decline in financial markets or lack of sustained growth in such markets may result in a corresponding decline in performance, which could negatively impact CI’s business and impede the growth of CI’s assets under management and revenue. REDEMPTION RISK CI earns revenue primarily from management fees earned for advising and managing investment fund assets. The level of these assets is dependent on (i) sales; (ii) redemptions; and (iii) investment performance. Sales and redemptions may fluctuate depending on market and economic conditions, investment preference, or other factors. Significant redemptions could adversely affect investor fund returns by impacting market values and increasing transaction costs or taxable distributions, which could negatively impact the prospects and operating results of CI. A rapid and sustained increase in redemptions, particularly in the face of severe market volatility, may also adversely affect fund liquidity, which in turn could negatively affect CI’s reputation and/or result in further declines in assets under management, all of which could have an unfavourable impact on our business, financial condition or operating results. INFORMATION TECHNOLOGY RISK CI uses information technology and the internet to streamline business operations and to improve the client and advisor experience. CI has, more recently, been expanding its online footprint by automating its product and service delivery systems and acquiring digital platforms. The use of information technology and the internet, email messaging and other online capabilities, however, exposes CI to information security risk that could have an adverse impact on its business. CI is dependent on its information security policies, procedures and capabilities to protect its computer and telecommunications | MANAGEMENT’S DISCUSSION & ANALYSIS | Q4 Financial Report 29 December 31, 2020 |
| systems and the data that it stores on or transmits through its information technology systems. Any information technology event, such as a cybersecurity breach or intrusion into CI’s information technology systems, or failure to implement sufficient controls, could result in unauthorized access to sensitive or confidential information, loss or theft of data, operational disruption, regulatory actions, legal liability or reputational harm. CI actively monitors this risk and continues to develop and implement technology-enabled controls to protect against cyber threats that are becoming increasingly sophisticated and pervasive. In addition, CI has and will continue to implement safeguards to control access to sensitive information, through password protection, encryption of confidential information and other means. Notwithstanding these measures, CI cannot fully mitigate the risk associated with information technology security. CI is dependent on the efficiency and effectiveness of the technology it uses to secure its information technology environment and keeping pace with a continuously evolving information technology landscape. Malfunction of any technology used by CI or inability to keep pace with evolving cybersecurity advancements may increase CI’s exposure to cybersecurity risk. CI’s business is also dependent on the physical integrity of its infrastructure, including its office space, storage centers and other facilities. CI has taken precautions to protect the physical security of its infrastructure, and the sensitive information contained therein, through passkey protection, limited after-hours access and clean desk policies. However, a breach of the physical integrity of CI infrastructure may leave sensitive information vulnerable to unauthorized access and use, increasing a possible security risk, which could negatively impact CI’s business and reputation. DISTRIBUTION RISK CI distributes its investment products through a number of distribution channels, including brokers, independent financial planners and insurance advisors. CI’s access to these distribution channels is impacted by the strength of the relationship with certain business partners and the level of competition faced from the financial institutions that own those channels. While CI continues to develop and enhance existing relationships, there can be no assurance that CI will, in the future, enjoy the level of access that it has in the past, which would adversely affect its sales of investment products. COMPETITION RISK CI operates in a highly competitive environment, with competition based on a variety of factors, including the range of products offered, brand recognition, investment performance, business reputation, financing strength, management and sales relationships, quality of service, level of fees charged and level of commissions and other compensation paid. CI competes with a large number of mutual fund companies and other providers of investment products, investment management firms, broker-dealers, banks, insurance companies and other financial institutions. Some of these competitors have, and potential future competitors may have, greater technical, financial, marketing, distribution or other resources than CI. The trend toward greater consolidation within the investment management industry has increased the strength of a number of CI’s competitors. CI’s competitors seek to expand market share by offering different products and services and more competitive pricing than those offered by CI. While CI continues to develop and market new products and services and remains competitive with respect to fees, there can be no assurance that CI will maintain its current standing or market share or | MANAGEMENT’S DISCUSSION & ANALYSIS | Q4 Financial Report 30 December 31, 2020 |
| investment performance relative to its competitors, which may adversely affect the business, financial condition or operating results of CI. STRATEGIC RISK Strategic risks are risks that directly impact the overall direction of CI and the ability of CI to successfully identify growth opportunities and implement proposed solutions. The key strategic risk is the risk that management fails to anticipate, and respond to, changes in the business environment, including demographic, regulatory and competitive changes. CI’s performance is directly affected by the financial market and business conditions, including the legislation and policies of the governments and regulatory authorities having jurisdiction over CI’s operations. These are beyond the control of CI; however, an important part of the risk management process is the ongoing review and assessment of industry and economic trends and changes. Strategies are then designed to effectively respond to any anticipated changes, including identifying acquisition opportunities, developing new business lines, introducing new products, and implementing cost control strategies. Part of CI’s strategy includes strategic acquisitions and investments in growth opportunities. Strategic acquisitions may benefit CI through increasing fee earning assets, broadening CI’s distribution relationships, enhancing CI’s business capabilities and capturing cost synergies. CI embarks on a thorough due diligence process prior to any acquisition; however, there can be no assurances that the anticipated benefits of any acquisition will be achieved. The success of an acquisition is contingent upon many factors, including retaining key employees, securing assets acquired, obtaining legal and regulatory approvals, integrating operations and vendor relationships, and having favourable economic conditions. BUSINESS CONTINUITY RISKS CI's business, operations and financial results may be adversely affected by its ability to mitigate the effect of natural and man-made disasters, including floods, earthquakes, tornadoes, fires, civil unrest, wars, epidemics, and pandemics. The occurrence of any of these events may pose significant challenges to CI’s business continuity, either by exacerbating one or more of the other risks described in this section, or by introducing new risks. CI has a comprehensive and stress-tested business continuity plan in place to deal with any disaster-related scenario, however there can be no assurance that such plan will be effective to mitigate any adverse effects on CI’s business, financial condition or operating results as a result of any natural or man-made disasters or other similar events, including the recent COVID-19 pandemic. COVID-19, which has been recognized by the World Health Organization as a pandemic, has spread rapidly and extensively across the globe. Efforts by governments to control the spread of COVID-19 have disrupted normal economic activity both domestically and globally and uncertainty related to the extent, duration and severity of the pandemic has contributed to significant volatility in the financial markets, which may result in a decline in equity and commodity prices and lower interest rates and a corresponding decline in CI’s assets under management. In addition, CI may face declines in its assets under management as a result of client redemptions related to a variety of COVID-19 related factors including general market pessimism, poor fund performance, or clients’ needs for immediate cash. To control the spread of COVID-19, many governments at all levels have imposed severe restrictions on business activity and travel. Although certain of these restrictions have subsequently been eased, there can be no certainty when these | MANAGEMENT’S DISCUSSION & ANALYSIS | Q4 Financial Report 31 December 31, 2020 |
| restrictions will be fully lifted or that they will not be expanded. CI activated its business continuity plan in response to the COVID-19 pandemic to mitigate risks, maintain operational efficiency and service levels, and address the health and safety concerns of our employees, clients and advisors. With few exceptions, all of CI’s business operations are being carried out remotely. The extensive use of remote communication tools and third party services may lead to heightened cybersecurity and privacy risks. Market volatility, increased trading volumes and the requirement to work remotely may result in the deterioration in service levels of certain key service providers. Stress on technology resources, new workplace constraints, personal stress and health concerns may all lead to higher operational risks across all of CI’s businesses. With the emergence of several new services as business critical, key supplier risk may also increase significantly. As part of the plan, CI has implemented enhanced monitoring of network assets and management oversight of business processes, active employee engagement and client communication, and built redundancy for critical services and infrastructure, however there can be no guarantee that this will be effective to mitigate these risks. Ultimately, the extent to which CI’s business, financial condition and results of operations will be impacted by the COVID-19 pandemic, including the extensive attempts to mitigate its effects, is uncertain and will depend on future developments, which are unpredictable and rapidly evolving. LIQUIDITY RISK Liquidity risk is the risk that CI may not be able to generate sufficient funds and within the time required in order to meet its obligations as they come due. While CI currently has access to financing, unfavourable market conditions may affect the ability of CI to obtain loans or make other arrangements on terms acceptable to CI. LIQUIDITY RISK FOR THE ASSET MANAGEMENT SEGMENT CI is also exposed to the risk of its investment funds not being able to meet their redemption obligations due to an inability to liquidate the underlying assets in a timely manner. This could be caused by insufficient liquid assets in the fund, an unexpected spike in redemptions triggered by negative market information, sentiment or contagion, adverse liquidity conditions in the financial markets, procedural issues that may delay the liquidation of securities or other factors. Inability to meet its redemption obligations may lead to legal liability, regulatory action and reputational damage. CI has robust mechanisms in place to monitor and maintain adequate liquidity in its investment fund portfolios at all times. However, CI has no control over extreme market events that may result in the sudden loss of liquidity or trigger a run on the funds. REGULATORY AND LEGAL RISK CI’s business is dependent upon compliance with and continued registration under securities laws in all jurisdictions in which CI and its subsidiaries carry on business. Laws and regulations applied at the national and provincial or state level generally grant governmental agencies and self-regulatory bodies broad administrative discretion over the activities of CI, including the power to limit or restrict business activities as well as impose additional disclosure requirements on CI products and services. Possible sanctions include the revocation or imposition of conditions on licenses to operate certain businesses, the suspension or expulsion from a particular market or jurisdiction of any of CI’s business segments or its key personnel or financial advisors, and the imposition of fines and censures. It is also possible that the laws and regulations governing a subsidiary’s operations | MANAGEMENT’S DISCUSSION & ANALYSIS | Q4 Financial Report 32 December 31, 2020 |

| or particular investment products or services could be amended or interpreted in a manner that is adverse to CI. To the extent that existing or future regulations affecting the sale or offering of CI’s product or services or CI’s investment strategies cause or contribute to reduced sales of CI’s products or lower margins or impair the investment performance of CI’s products, CI’s aggregate assets under management and its revenues may be adversely affected. In addition, the ongoing change in the securities regulatory environment governing CI’s business may require additional human resources and operations which will increase costs. Given the nature of CI’s business, CI may from time to time be subject to claims or complaints from investors or others in the normal course of business. The legal risks facing CI, its directors, officers, employees or agents in this respect include potential liability for violations of corporate laws, securities laws, stock exchange rules and misuse of investors’ funds. Some violations of corporate laws, securities laws or stock exchange rules could result in civil liability, fines, sanctions, or expulsion from a self- regulatory organization or the suspension or revocation of CI’s right to carry on an existing business. CI may incur significant costs in connection with such potential liabilities. OPERATIONAL RISK Operational risk is the risk of loss resulting from inadequate or failed internal processes or systems. The operational risk that CI is exposed to may arise from, technology failures, business disruption, theft and fraud, failure of key third parties, employee errors, processing and execution errors, and inaccurate or incomplete client information. Operational risk may result in a financial loss but can also lead to regulatory sanctions and harm to CI’s reputation. Operational risk driven by people and processes are mitigated through human resources policies and practices, and a strong internal control environment. Operational risks driven by systems and services are managed through controls over technology development and change management as well as enhanced procedures for oversight of third-party service providers. While CI continuously monitors its operational risks, there can be no assurances that CI’s internal control procedures can mitigate all operational risks. KEY PERSONNEL RISK The success of CI is dependent to a significant degree upon the contributions of senior management. The loss of any of these individuals, or an inability to attract, retain and motivate sufficient numbers of qualified senior management personnel, could adversely affect CI’s business. The retention of these key managers and the identification and development of the next generation of managers is an area of focus for CI. CI has not purchased any “key person” insurance with respect to any of its directors, officers or key employees and has no current plans to do so. The success of CI is also dependent upon, among other things, the skills and expertise of its human resources, including the management and investment personnel with specialized skills related to, among other things, marketing, risk management, credit, information technology, accounting, administrative operations and legal affairs. These highly skilled and often highly specialized individuals play an important role in developing, implementing, operating, managing and distributing CI’s products and services. Accordingly, the recruitment and retention of skilled personnel, continuous training and transfer of knowledge are key activities that are essential to CI’s performance. CI has taken, and will continue to take, steps to encourage our key employees to remain employed at CI, including the implementation of long-service awards, employee engagement strategies | MANAGEMENT’S DISCUSSION & ANALYSIS | Q4 Financial Report 33 December 31, 2020 |
| and enhanced transparency measures with respect to compensation. In addition, the focus on asset growth and the reliance on investment performance to sell financial products has increased the demand for experienced and high- performing portfolio managers. Compensation packages for these managers may increase at a rate well in excess of inflation and well above the rates of increase observed in other industries and the rest of the labour market. The loss of these individuals or an inability to attract, retain and motivate a sufficient number of qualified personnel could result in a loss of clients and a decline in sales and adversely affect CI’s business. The market for financial advisors is extremely competitive and is increasingly characterized by frequent movement by financial advisors among different firms. Individual financial advisors CI’s Wealth Management businesses have regular direct contact with clients, which can lead to a strong and personal client relationship based on the client’s trust in the individual financial advisor. The loss of a significant number of financial advisors from any of CI’s Wealth Management businesses could lead to the loss of client accounts which could have a material adverse effect on the results of operations and prospects of that business and, in turn, CI. Although CI uses or have used a combination of competitive compensation structures and equity with vesting provisions as a means of seeking to retain financial advisors, there can be no assurance that financial advisors will be retained. REPUTATION RISK Reputation risk is the potential negative impact of a deterioration of CI’s image or lower public confidence in the CI brand, its senior management or its products and services. Operational errors, poor performance, regulatory investigation or sanctions, litigation or employee misconduct could result in reputational harm to CI. Through its Codes of Conduct, governance practices, risk management programs, policies, procedures and training, CI attempts to prevent and detect any activities by CI officers, directors, and employees that would harm CI’s reputation. While all employees, directors and officers are expected to protect the reputation of CI, there can be no assurances that unauthorized or unsuccessful activities may result in damage to CI’s reputation, which could adversely affect CI’s business and profitability. CREDIT RISK Credit risk is the risk of loss associated with the inability of a third party to fulfill its payment obligations. CI is exposed to the risk that third parties that owe it money, securities or other assets will not perform their obligations. These parties include trading counterparties, customers, clearing agents, exchanges, clearing houses and other financial intermediaries, as well as issuers whose securities are held by CI. These parties may default on their obligations due to bankruptcy, lack of liquidity, operational failure or other reasons. CI does not have significant exposure to any individual counterparty. Credit risk is mitigated by regularly monitoring the credit performance of individual counterparties and holding collateral where appropriate. One of the primary sources of credit risk arises when CI extends credit to clients to purchase securities by way of margin lending. Margin loans are due on demand and are collateralized by the financial instruments in the client’s account. CI faces a risk of financial loss in the event a client fails to meet a margin call if market prices for securities held as collateral decline and if CI is unable to recover sufficient value from the collateral held. The credit extended is limited by regulatory requirements and by CI’s internal credit policy. | MANAGEMENT’S DISCUSSION & ANALYSIS | Q4 Financial Report 34 December 31, 2020 |
| INSURANCE RISK CI maintains various types of insurance which include financial institution bonds, errors and omissions insurance, directors’, trustees’ and officers’ liability insurance, agents’ insurance, general commercial liability insurance, and cyber liability insurance. Management evaluates the adequacy of CI’s insurance coverage on an ongoing basis. However, there can be no assurance that a claim or claims will not exceed the limits of available insurance coverage, that any insurer will remain solvent or willing to continue providing insurance coverage with sufficient limits or at a reasonable cost or that any insurer will not dispute coverage of certain claims due to ambiguities in the relevant policies. A judgment against CI in excess of available coverage could have a material adverse effect on CI both in terms of damages awarded and the impact on the reputation of CI. TAXATION RISK CI is subject to various uncertainties concerning the interpretation and application of Canadian tax laws. CI Investments is considered a large case file by the Canada Revenue Agency and, as such, is subject to audit each year. There is a significant lag between the end of a fiscal year and when such audits are completed. Therefore, at any given time, several years may be open for audit and/or adjustments. While CI regularly assesses the likely outcome of these audits in order to determine the appropriateness of its tax provision, there can be no assurance that CI will accurately predict the outcomes of these audits. If tax authorities disagree with CI’s application of such tax laws, CI’s profitability and cash flows could be adversely affected. SHARE CAPITAL As at December 31, 2020, CI had 210,358,710 shares outstanding. Employee Incentive Share Option Plan: At December 31, 2020, 2.6 million options to purchase shares were outstanding, of which 2.0 million options were exercisable at prices ranging from $27.44 to $28.67. Restricted Share Unit (“RSU”) Plan: 503,737 RSUs were outstanding as at December 31, 2020. Deferred Share Unit (“DSU”) Plan: 32,643 DSUs were outstanding as at December 31, 2020. Additional details about the above Plans can be found in Note 6 to the Interim Condensed Consolidated Financial Statements. | MANAGEMENT’S DISCUSSION & ANALYSIS | Q4 Financial Report 35 December 31, 2020 |

| CONTRACTUAL OBLIGATIONS The table that follows summarizes CI’s contractual obligations at December 31, 2020. TABLE 16: PAYMENTS DUE BY YEAR [millions of dollars] Total 1 year or less 2 3 4 5 More than 5 years Long-term debt 2,466.0 200.0 — 325.0 350.0 450.0 1,141.0 Leases 85.4 17.7 16.5 15.1 14.7 12.7 8.7 Total 2,551.4 217.7 16.5 340.1 364.7 462.7 1,149.7 SIGNIFICANT ACCOUNTING ESTIMATES The December 31, 2020 Consolidated Financial Statements have been prepared in accordance with IFRS. For a discussion of all significant accounting policies, refer to Note 1 of the Notes to the Consolidated Financial Statements. Note 3 provides a discussion regarding the methodology used for business acquisitions. Note 5 provides a discussion regarding the recoverable amount of CI’s goodwill and intangible assets compared to its carrying value. DISCLOSURE CONTROLS AND INTERNAL CONTROLS OVER FINANCIAL REPORTING The Chief Executive Officer (“CEO”) and the Chief Financial Officer (“CFO”), together with management, are responsible for the design of CI’s disclosure controls and procedures as defined in National Instrument 52-109 (NI 52-109). Management evaluated, with participation of the CEO and CFO, the effectiveness of the disclosure controls and procedures as at December 31, 2020. Based on this evaluation, the CEO and CFO have concluded that they are reasonably assured these disclosure controls and procedures were effective as at December 31, 2020 and that material information relating to CI was made known to them within the time periods specified under applicable securities legislation. Management, under the supervision of the CEO and CFO, is responsible for the design and maintenance of adequate internal controls over financial reporting as defined in NI 52-109 for the purposes of providing reasonable assurance regarding the reliability of financial reporting and the preparation of financial statements for external purposes in accordance with IFRS. However, due to its inherent limitations, internal controls over financial reporting can only provide reasonable, not absolute, assurance that the financial statements are free of misstatements. The COSO 2013 Framework was used to assist management, along with the CEO and CFO, in the evaluation of these internal control systems. Management, under the direction of the CEO and CFO, concluded that the internal controls over financial reporting were effective as at December 31, 2020. Management used various tools to evaluate internal controls over financial reporting which included interaction with key control systems, review of policy and procedure documentation, observation or reperformance of control procedures to evaluate the effectiveness of controls and concluded that these controls are effective. For the quarter ended December 31, 2020, there have been no changes to the internal controls that have materially affected, or are reasonably likely to affect, internal controls over financial reporting | MANAGEMENT’S DISCUSSION & ANALYSIS | Q4 Financial Report 36 December 31, 2020 |
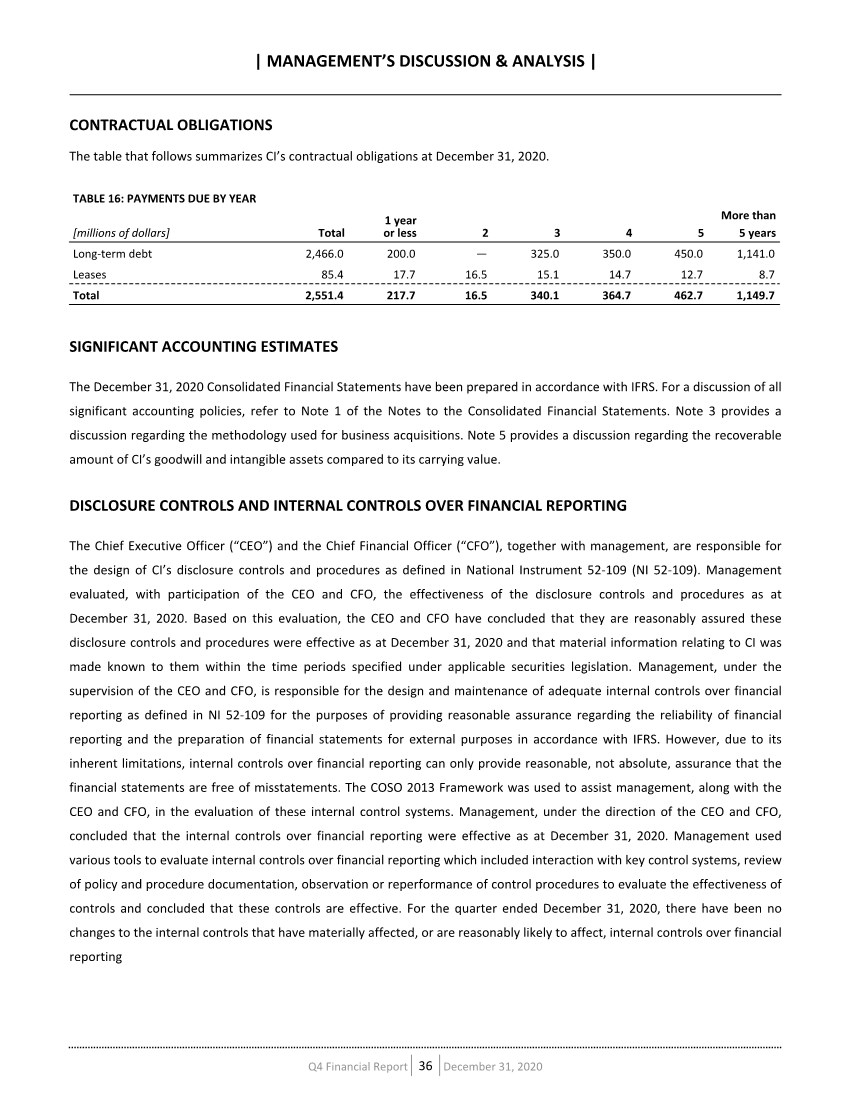
| Additional information relating to CI, including the most recent audited annual financial statements, management information circular and annual information form, is available on SEDAR at www.sedar.com and on CI’s website at www.cifinancial.com. Information contained in or otherwise accessible through the websites mentioned in this MD&A does not form part of, and is not incorporated by reference into, this MD&A. | MANAGEMENT’S DISCUSSION & ANALYSIS | Q4 Financial Report 37 December 31, 2020 |

| Consolidated Financial Statements DECEMBER 31, 2020 CI FINANCIAL CORP. |

| Report of Independent Registered Public Accounting Firm To the shareholders and the Board of Directors of CI Financial Corp. Opinion on the Financial Statements We have audited the accompanying consolidated statements of financial position of CI Financial Corp. and its subsidiaries (the "Company") as of December 31, 2020 and 2019, the related consolidated statements of income and comprehensive income, changes in shareholders’ equity and cash flows for each of the two years in the period ended December 31, 2020, and the related notes (collectively referred to as the "consolidated financial statements"). In our opinion, the consolidated financial statements present fairly, in all material respects, the financial position of the Company at December 31, 2020 and 2019, and the results of its operations and its cash flows for each of the two years in the period ended December 31, 2020, in conformity with International Financial Reporting Standards as issued by the International Accounting Standards Board. Basis for Opinion These financial statements are the responsibility of the Company's management. Our responsibility is to express an opinion on the Company's financial statements based on our audits. We are a public accounting firm registered with the Public Company Accounting Oversight Board (United States) ("PCAOB") and are required to be independent with respect to the Company in accordance with the U.S. federal securities laws and the applicable rules and regulations of the Securities and Exchange Commission and the PCAOB. We conducted our audits in accordance with the standards of the PCAOB. Those standards require that we plan and perform the audit to obtain reasonable assurance about whether the financial statements are free of material misstatement, whether due to error or fraud. The Company is not required to have, nor were we engaged to perform, an audit of its internal control over financial reporting. As part of our audits we are required to obtain an understanding of internal control over financial reporting but not for the purpose of expressing an opinion on the effectiveness of the Company's internal control over financial reporting. Accordingly, we express no such opinion. Our audits included performing procedures to assess the risks of material misstatement of the financial statements, whether due to error or fraud, and performing procedures that respond to those risks. Such procedures included examining, on a test basis, evidence regarding the amounts and disclosures in the financial statements. Our audits also included evaluating the accounting principles used and significant estimates made by management, as well as evaluating the overall presentation of the financial statements. We believe that our audits provide a reasonable basis for our opinion. Critical Audit Matters The critical audit matters communicated below are matters arising from the current period audit of the financial statements that were communicated or required to be communicated to the audit committee and that: (1) relate to accounts or disclosures that are material to the financial statements and (2) involved our especially challenging, subjective, or complex judgments. The communication of critical audit matters does not alter in any way our opinion on the financial statements, Q4 Financial Report 39 December 31, 2020 |
| taken as a whole, and we are not, by communicating the critical audit matters below, providing separate opinions on the critical audit matters or on the accounts or disclosures to which they relate. Business Combinations Description of the Matter During 2020, the Company completed multiple acquisitions accounted for as business combinations which, in aggregate, amounted to $901 million in total consideration, as disclosed in Note 3 to the consolidated financial statements. The cost of an acquisition is measured as the aggregate fair values of the assets given, equity instruments issued, and liabilities incurred or assumed as at the date of the exchange of control of the acquiree. Where the amounts allocated to the assets and liabilities are less than the overall consideration given, the difference is accounted for as goodwill. Auditing the Company’s business combinations was complex due to the degree of judgment and subjectivity in estimating the fair values of the identified assets and liabilities of the acquiree as at the date of acquisition, including identifiable intangible assets, as well as estimating the fair value of contingent consideration included in the purchase consideration.. Management estimated the fair value of the customer relationship contracts using various modelling techniques including the multi-period excess earnings method, which is a specific discounted cash flow method. Management also estimated the fair value of contingent consideration using various modelling techniques, including Monte-Carlo simulations. The fair value determination of the customer relationship contracts and contingent consideration required management to make significant estimates and assumptions related to future cash flows of the acquired businesses and the selection of the discount rate. How We Addressed the Matter in Our Audit To test the estimated fair value of the identified assets and liabilities resulting from the business acquisitions, we performed audit procedures that included, among others, assessing the selection and application of the discount rate by evaluating the inputs and mathematical accuracy of the calculation, and developing a range of independent estimates and comparing those to the discount rates selected by management. We read the purchase agreements to obtain an understanding of the key terms and conditions and to identify the necessary accounting considerations. For certain acquisitions, we also involved our valuation specialists to assess the valuation methodologies applied and assist in testing the significant assumptions and inputs used by the Company, as discussed above, by comparing to externally available industry and economic trends, the Company's budgets and forecasts, the historical results of the acquired businesses, other guidelines used by companies within the same industry and other relevant factors. We performed sensitivity analyses on significant assumptions to consider the impact of changes in the valuation of the intangibles and contingent consideration that would result from changes in management’s assumptions. We also assessed the adequacy of the Company’s disclosures in relation to this matter. Q4 Financial Report 40 December 31, 2020 |
| Impairment of Indefinite Life Intangible Assets, Including Goodwill Description of the Matter As at December 31, 2020, the Company had $4,291 million of intangible assets, which are primarily comprised of goodwill and fund management contracts with an indefinite life acquired in previous business acquisitions, as disclosed in Note 5 to the consolidated financial statements. The Company assesses goodwill and intangibles with an indefinite life for impairment annually or more frequently if impairment indicators are present. Auditing the Company’s impairment tests was complex and required the involvement of specialists due to the judgmental nature of key assumptions and significant estimation required to determine the recoverable amount of the CGUs or groups of CGUs. Significant assumptions in the estimate of the recoverable amount included market appreciation, net sales of funds, operating margins, and discount rates, which are affected by expectations about future market or economic conditions. How We Addressed the Matter in Our Audit To test the estimated recoverable amount of the CGUs or groups of CGUs, our audit procedures included, among others, with the assistance of our valuation specialists, assessing the methodologies and testing the significant assumptions discussed above and the underlying data used by the Company in its assessment. We assessed the selection and application of the discount rate by evaluating the inputs and mathematical accuracy of the calculation and developing a range of independent estimates and comparing those to the discount rates selected by management. We assessed the historical accuracy of management’s forecast estimates by performing a comparison of management’s past projections to actual results. We also compared the market appreciation, net sales of funds and operating margin assumptions to externally available industry and economic trends, and the Company’s budgets, forecasts and historical results. We performed sensitivity analyses on significant assumptions to consider the impact of changes in the recoverable amount of the CGU or groups of CGUs that would result from changes in the assumptions. We also assessed the adequacy of the Company’s disclosures related to the impairment of intangible assets, including goodwill. We have served as the Company's auditor since 1994. /s/ Ernst & Young LLP Chartered Professional Accountants Licensed Public Accountants Toronto, Canada February 11, 2021 Q4 Financial Report 41 December 31, 2020 |
| As at As at December 31, 2020 December 31, 2019 [in thousands of Canadian dollars] $ $ ASSETS Current Cash and cash equivalents 483,598 118,360 Client and trust funds on deposit [note 3] 973,143 364,964 Investments [note 13] 133,375 138,412 Accounts receivable and prepaid expenses [note 3] 240,849 170,156 Income taxes receivable 7,687 25,841 Total current assets 1,838,652 817,733 Capital assets, net [notes 3 and 4] 46,978 45,954 Right-of-use assets [notes 3 and 9] 50,620 44,882 Intangibles [notes 3 and 5] 4,290,998 3,388,482 Deferred income taxes [note 12] 7,846 — Other assets [notes 3 and 6] 124,742 70,755 Total assets 6,359,836 4,367,806 LIABILITIES AND EQUITY Current Accounts payable and accrued liabilities [note 3] 315,884 245,267 Current portion of provisions and other financial liabilities [notes 3 and 8] 275,710 14,643 Dividends payable [note 11] 75,297 79,845 Client and trust funds payable [note 3] 961,080 368,348 Income taxes payable 3,209 — Current portion of long-term debt [note 7] 203,805 449,509 Current portion of lease liabilities [notes 3 and 9] 14,926 11,348 Total current liabilities 1,849,911 1,168,960 Long-term debt [note 7] 2,252,311 1,154,985 Provisions and other financial liabilities [notes 3 and 8] 107,842 18,493 Deferred income taxes [note 12] 470,735 464,841 Lease liabilities [notes 3 and 9] 61,307 61,171 Total liabilities 4,742,106 2,868,450 Equity Share capital [note 10(a)] 1,867,997 1,944,311 Contributed surplus 22,817 23,435 Deficit (287,621) (474,013) Accumulated other comprehensive income (loss) (20,746) 255 Total equity attributable to the shareholders of the Company 1,582,447 1,493,988 Non-controlling interests [note 3] 35,283 5,368 Total equity 1,617,730 1,499,356 Total liabilities and equity 6,359,836 4,367,806 (see accompanying notes) On behalf of the Board of Directors: William T. Holland Director Tom P. Muir Director CONSOLIDATED STATEMENTS OF FINANCIAL POSITION Q4 Financial Report 42 December 31, 2020 |
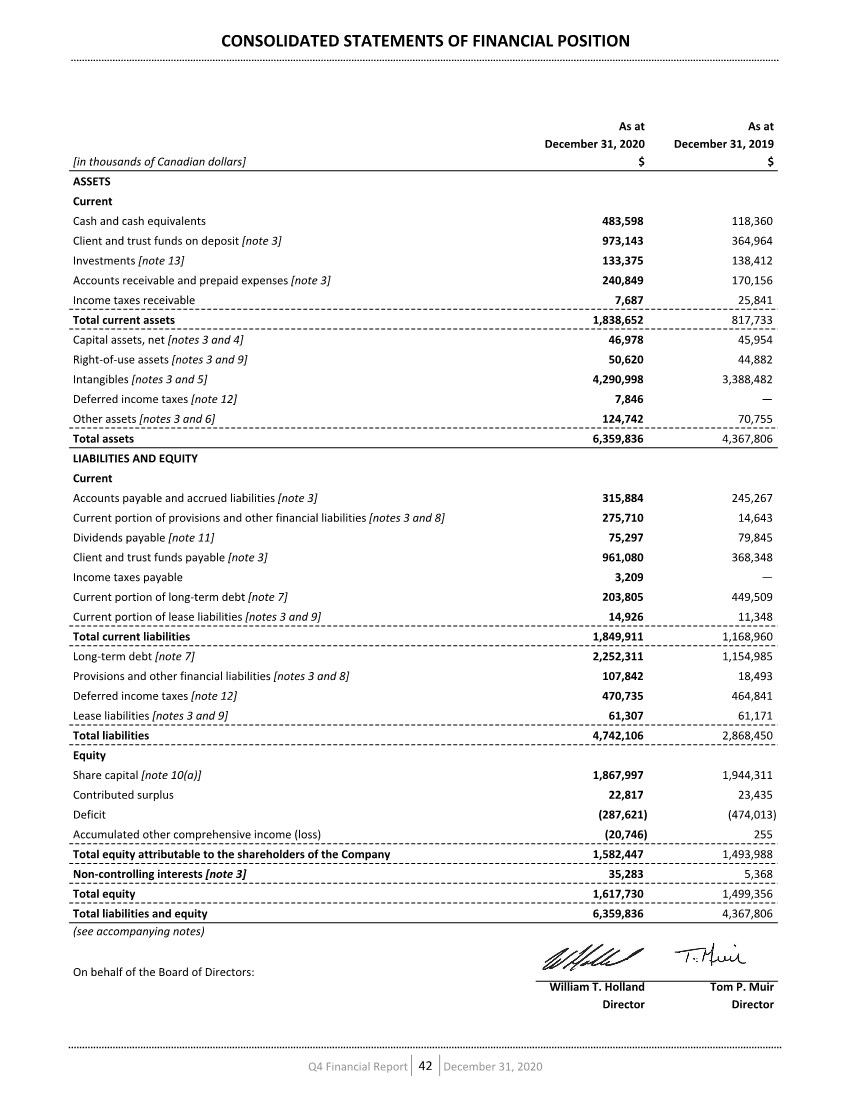
| 2020 2019 [in thousands of Canadian dollars, except per share amounts] $ $ REVENUE Management fees 1,635,773 1,789,100 Administration fees 364,408 292,501 Redemption fees 8,230 11,060 Realized and unrealized gain on investments 6,949 10,788 Other income [note 6] 35,096 19,017 2,050,456 2,122,466 EXPENSES Selling, general and administrative [note 19] 449,439 489,272 Trailer fees 509,444 555,167 Advisor and dealer fees 253,376 206,301 Deferred sales commissions 7,492 12,814 Amortization and depreciation [note 20] 43,514 32,891 Interest and lease finance [notes 7 and 9] 65,440 55,422 Other [notes 6 and 8] 79,004 43,794 1,407,709 1,395,661 Income before income taxes 642,747 726,805 Provision for income taxes [note 12] Current 168,923 188,831 Deferred (1,722) 450 167,201 189,281 Net income for the year 475,546 537,524 Net loss attributable to non-controlling interests (432) (872) Net income attributable to shareholders 475,978 538,396 Basic earnings per share attributable to shareholders [note 10(e)] $2.22 $2.30 Diluted earnings per share attributable to shareholders [note 10(e)] $2.21 $2.29 Other comprehensive loss, net of tax Exchange differences on translation of foreign operations (24,350) (22) Total other comprehensive loss, net of tax (24,350) (22) Comprehensive income for the year 451,196 537,502 Comprehensive loss attributable to non-controlling interests (3,781) (872) Comprehensive income attributable to shareholders 454,977 538,374 (see accompanying notes) CONSOLIDATED STATEMENTS OF INCOME AND COMPREHENSIVE INCOME For the years ended December 31 Q4 Financial Report 43 December 31, 2020 |
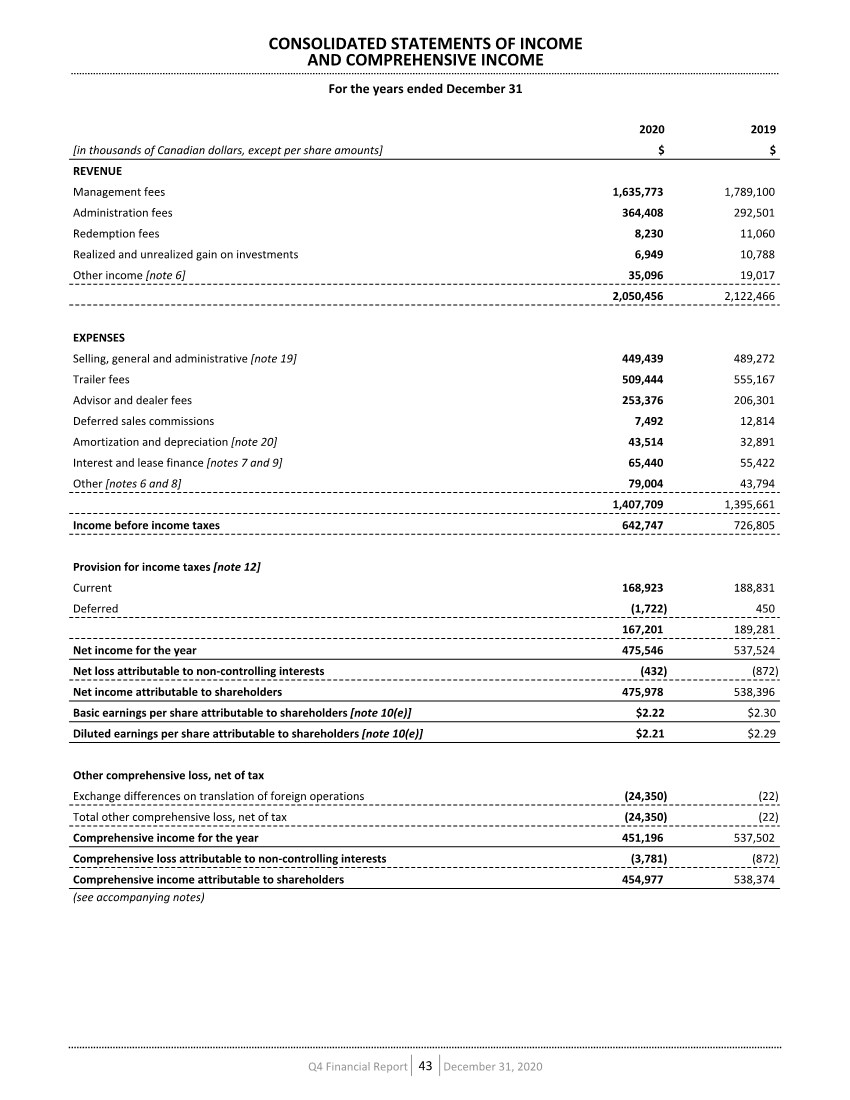
| Share capital [note 10(a)] Contributed surplus Deficit Accumulated other comprehensive income (loss) Total shareholders’ equity Non- controlling interests [note 3] Total equity [in thousands of Canadian dollars] $ $ $ $ $ $ $ Balance, January 1, 2020 1,944,311 23,435 (474,013) 255 1,493,988 5,368 1,499,356 Comprehensive income — — 475,978 (21,001) 454,977 (3,781) 451,196 Dividends declared [note 11] — — (150,765) — (150,765) — (150,765) Shares repurchased, net of tax (120,236) — (135,448) — (255,684) — (255,684) Business combination [note 3] — — (3,373) — (3,373) 32,915 29,542 Issuance of share capital for business combinations, net of transaction costs and tax [notes 3 and 10] 35,434 — — — 35,434 — 35,434 Issuance of share capital for equity- based plans, net of tax 8,488 (8,488) — — — — — Compensation expense for equity-based plans, net of tax — 7,870 — — 7,870 — 7,870 Net contributions from non- controlling interests — — — — — 781 781 Change during the year (76,314) (618) 186,392 (21,001) 88,459 29,915 118,374 Balance, December 31, 2020 1,867,997 22,817 (287,621) (20,746) 1,582,447 35,283 1,617,730 Balance, January 1, 2019 2,125,130 25,270 (730,663) 277 1,420,014 2,849 1,422,863 Comprehensive income — — 538,396 (22) 538,374 (872) 537,502 Dividends declared [note 11] — — (31,483) — (31,483) (875) (32,358) Shares repurchased, net of tax (193,570) — (250,263) — (443,833) — (443,833) Business combination [note 3] — — — — — 4,266 4,266 Issuance of share capital for equity- based plans, net of tax 12,751 (12,751) — — — — — Compensation expense for equity-based plans, net of tax — 10,916 — — 10,916 — 10,916 Change during the year (180,819) (1,835) 256,650 (22) 73,974 2,519 76,493 Balance, December 31, 2019 1,944,311 23,435 (474,013) 255 1,493,988 5,368 1,499,356 (see accompanying notes) CONSOLIDATED STATEMENTS OF CHANGES IN SHAREHOLDERS’ EQUITY For the years ended December 31 Q4 Financial Report 44 December 31, 2020 |
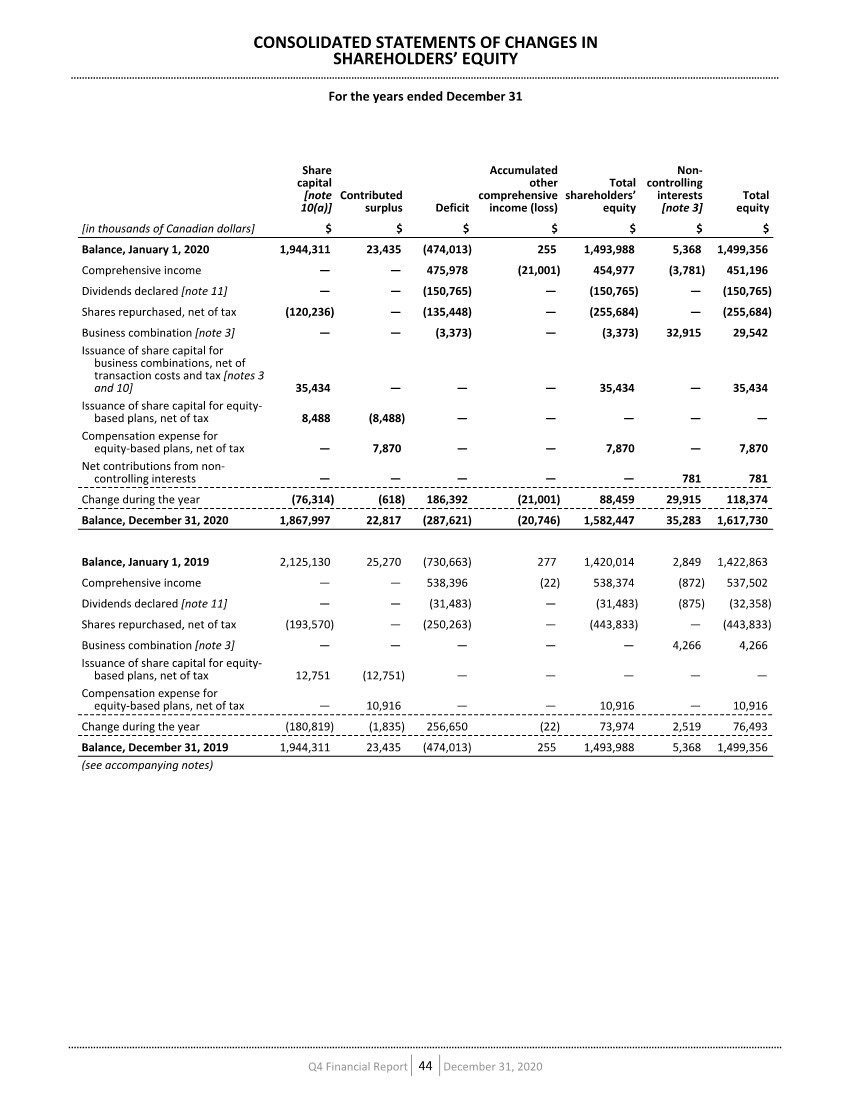
| 2020 2019 [in thousands of Canadian dollars] $ $ OPERATING ACTIVITIES (*) Net income for the year 475,546 537,524 Add (deduct) items not involving cash Realized and unrealized gain on investments (6,949) (10,788) Equity-based compensation 10,657 14,701 Amortization and depreciation 43,514 32,891 Deferred income taxes (1,722) 450 Impairment loss on intangibles [note 5] — 6,442 Loss on long-term debt [note 7] 2,328 — Cash provided by operating activities before net change in operating assets and liabilities 523,374 581,220 Net change in operating assets and liabilities 18,595 (23,211) Cash provided by operating activities 541,969 558,009 INVESTING ACTIVITIES Purchase of investments (17,648) (11,503) Proceeds on sale of investments 23,599 36,741 Additions to capital assets (11,990) (12,351) Increase in other assets (47,645) (26,032) Additions to intangibles (17,132) (4,425) Cash paid to settle put option and contingent liability [note 8] — (2,667) Acquisition of subsidiaries, net of cash acquired [note 3] (527,298) (26,077) Cash used in investing activities (598,114) (46,314) FINANCING ACTIVITIES Repayment of long-term debt (569,015) (591,500) Issuance of long-term debt 1,471,022 690,959 Repurchase of long-term debt (55,985) — Repurchase of share capital (257,939) (447,293) Payment of lease liabilities (12,168) (11,036) Net contributions from non-controlling interests 781 — Dividends paid to shareholders [note 11] (155,313) (170,750) Dividends paid to non-controlling interests — (875) Cash provided by (used in) financing activities 421,383 (530,495) Net increase (decrease) in cash and cash equivalents during the year 365,238 (18,800) Cash and cash equivalents, beginning of year 118,360 137,160 Cash and cash equivalents, end of year 483,598 118,360 (*) Included in operating activities are the following: Interest paid 62,997 49,548 Income taxes paid 147,804 205,592 (see accompanying notes) CONSOLIDATED STATEMENTS OF CASH FLOWS For the years ended December 31 Q4 Financial Report 45 December 31, 2020 |
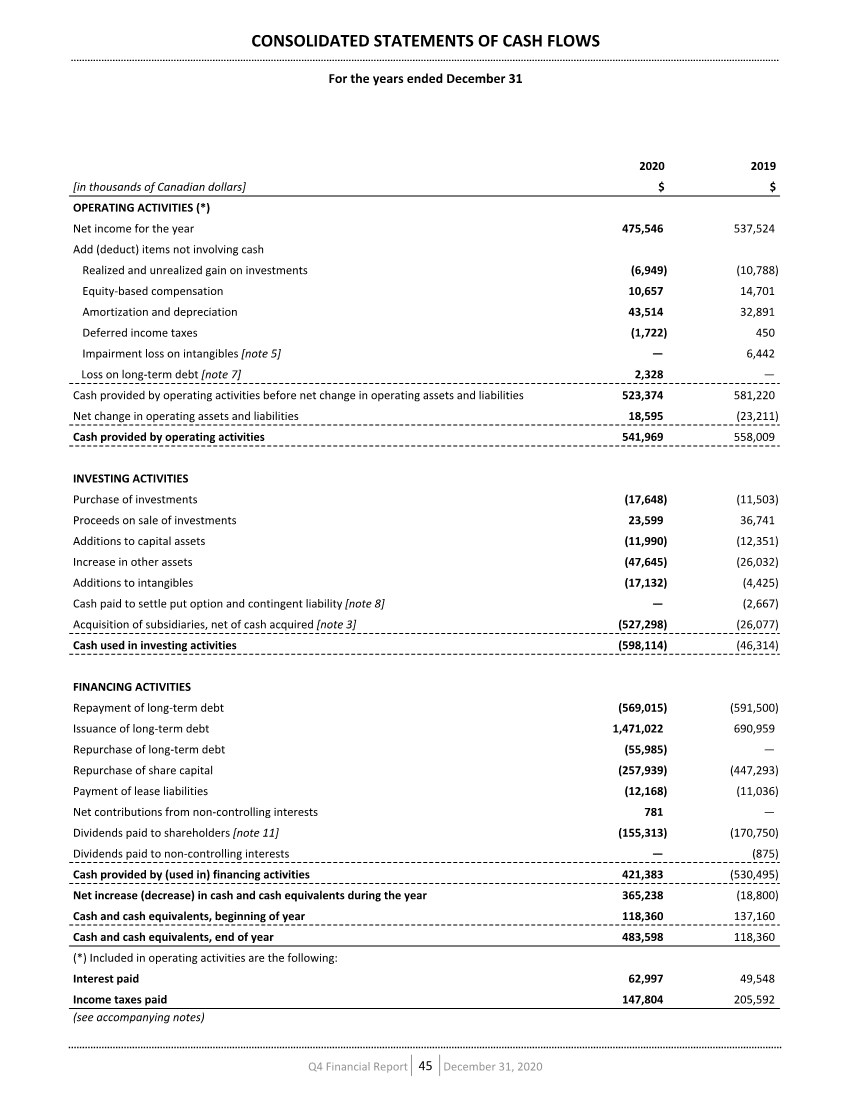
| CI Financial Corp. [“CI”] is a publicly listed company (TSX: CIX; NYSE: CIXX) incorporated under the laws of the Province of Ontario and has its registered office and principal place of business located at 2 Queen Street East, Toronto, Ontario. CI’s primary business is the management and distribution of a broad range of financial products and services, including mutual funds, segregated funds, exchange-traded funds, financial planning, insurance, investment advice, wealth management and estate and succession planning. 1. SUMMARY OF SIGNIFICANT ACCOUNTING POLICIES These consolidated financial statements of CI have been prepared in accordance with International Financial Reporting Standards [“IFRS”] as issued by the International Accounting Standards Board [“IASB”]. These consolidated financial statements were authorized for issuance by the Board of Directors of CI on February 10, 2021. BASIS OF PRESENTATION The consolidated financial statements of CI have been prepared on a historical cost basis, except for certain financial instruments that have been measured at fair value. The consolidated financial statements have been prepared on a going concern basis. CI’s presentation currency is the Canadian dollar, which is CI’s functional currency. BASIS OF CONSOLIDATION The consolidated financial statements include the accounts of CI and all its subsidiaries on a consolidated basis after elimination of intercompany transactions and balances. Subsidiaries are entities over which CI has control, when CI has the power, directly or indirectly, to govern the financial and operating policies of an entity, is exposed to variable returns from its activities, and is able to use its power to affect such variable returns to which it is exposed. CI’s principal subsidiaries are as follows: • CI’s wholly owned Canadian subsidiaries include CI Investments Inc. [“CI Investments”], Assante Wealth Management (Canada) Ltd. [“AWM”], CI Investment Services Inc. [“CI Investment Services”, formerly BBS Securities Inc.], Wealthbar Financial Services Inc., and their respective subsidiaries. CI has a controlling interest in Marret Asset Management Inc. [“Marret”] and Aligned Capital Distributions Inc., and their respective subsidiaries. Effective, July 1, 2019, First Asset Investment Management Inc. amalgamated with CI Investments. • CI’s wholly owned U.S. subsidiaries include, Balasa Dinverno Foltz LLC, Bowling Portfolio Management LLC, The Roosevelt Investment Group, Inc. and Doyle Wealth Management, Inc. CI has a controlling interest in Surevest LLC, OCM Capital Partners LLC, The Cabana Group, LLC, Stavis & Cohen Financial, LLC and RGT Wealth Advisors, LLC [“RGT”], and their respective subsidiaries. • CI has a controlling interest in its Australian subsidiary, GSFM Pty Limited [“GSFM”] and its subsidiaries. NOTES TO CONSOLIDATED FINANCIAL STATEMENTS December 31, 2020 and 2019 • [in thousands of Canadian dollars, except per share amounts] Q4 Financial Report 46 December 31, 2020 |
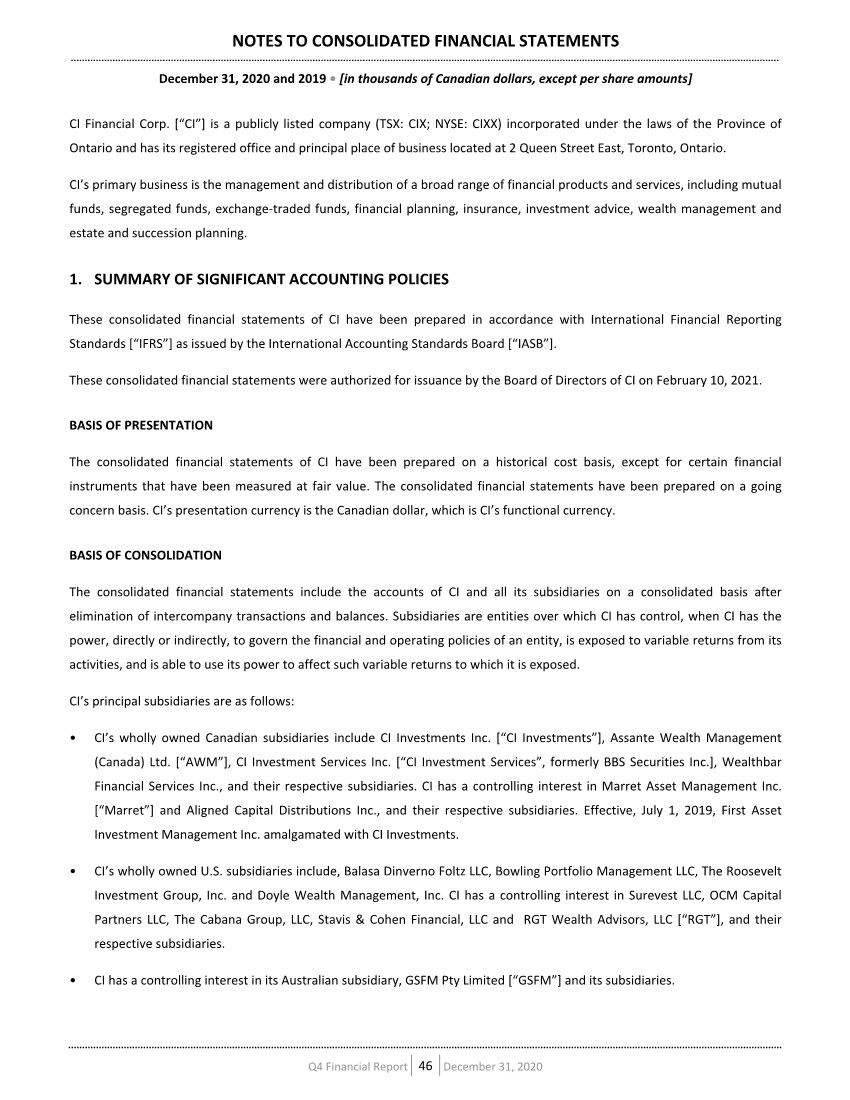
| • CI holds a controlling interest in GSFM and RGT with put and call options over the remaining minority interest. CI considers the non-controlling interest in GSFM and RGT to have already been acquired and consolidates 100% of the income and comprehensive income in the consolidated statements of income and comprehensive income. • For subsidiaries where CI holds a controlling interest, a non-controlling interest is recorded in the consolidated financial statements of income and comprehensive income to reflect the non-controlling interest’s share of the income and comprehensive income, and a non-controlling interest is recorded within equity in the consolidated statements of financial position to reflect the non-controlling interest’s share of the net assets. Hereinafter, CI and its subsidiaries are referred to as CI. CI manages a range of mutual funds, segregated funds, structured products and other funds that meet the definition of structured entities under IFRS. CI earns fees for providing management and administrative services to these investment funds. Fees are calculated on assets under management in these funds, which totalled $135.1 billion as at December 31, 2020 [2019 – $131.7 billion]. CI does not consolidate these investment funds because the form of fees and ownership interest are not significant enough to meet the definition of control under IFRS. CI provides no guarantees against the risk of financial loss to the investors of these investment funds. REVENUE RECOGNITION Revenue is recognized when control of the goods or services are transferred by CI at an amount that reflects the consideration to which CI expects to be entitled in exchange for those goods or services. Revenue is measured at the fair value of the consideration received or receivable. In addition to these general principles, CI applies the following specific revenue recognition policies: Management fees are based upon the net asset value of the funds managed by CI and are recognized on an accrual basis. Administration fees and other income are recognized as services are provided under contractual arrangements. Administration fees include commission revenue, which is recorded on a trade date basis and advisory fees, which are recorded when the services related to the underlying engagements are completed. Redemption fees payable by security holders of deferred sales charge mutual funds, the sales commission of which was financed by CI, are recognized as revenue on the trade date of the redemption of the applicable mutual fund securities. FINANCIAL INSTRUMENTS Classification and measurement of financial assets CI classifies its financial assets as fair value through profit or loss [“FVPL”] and amortized cost. CI had no financial assets classified as fair value through other comprehensive income [“FVOCI”] during the year ended December 31, 2020. The classification of financial assets at initial recognition depends on the financial asset’s contractual cash flow characteristics and CI’s business model for managing them. With the exception of trade receivables, that do not contain a significant NOTES TO CONSOLIDATED FINANCIAL STATEMENTS December 31, 2020 and 2019 • [in thousands of Canadian dollars, except per share amounts] Q4 Financial Report 47 December 31, 2020 |
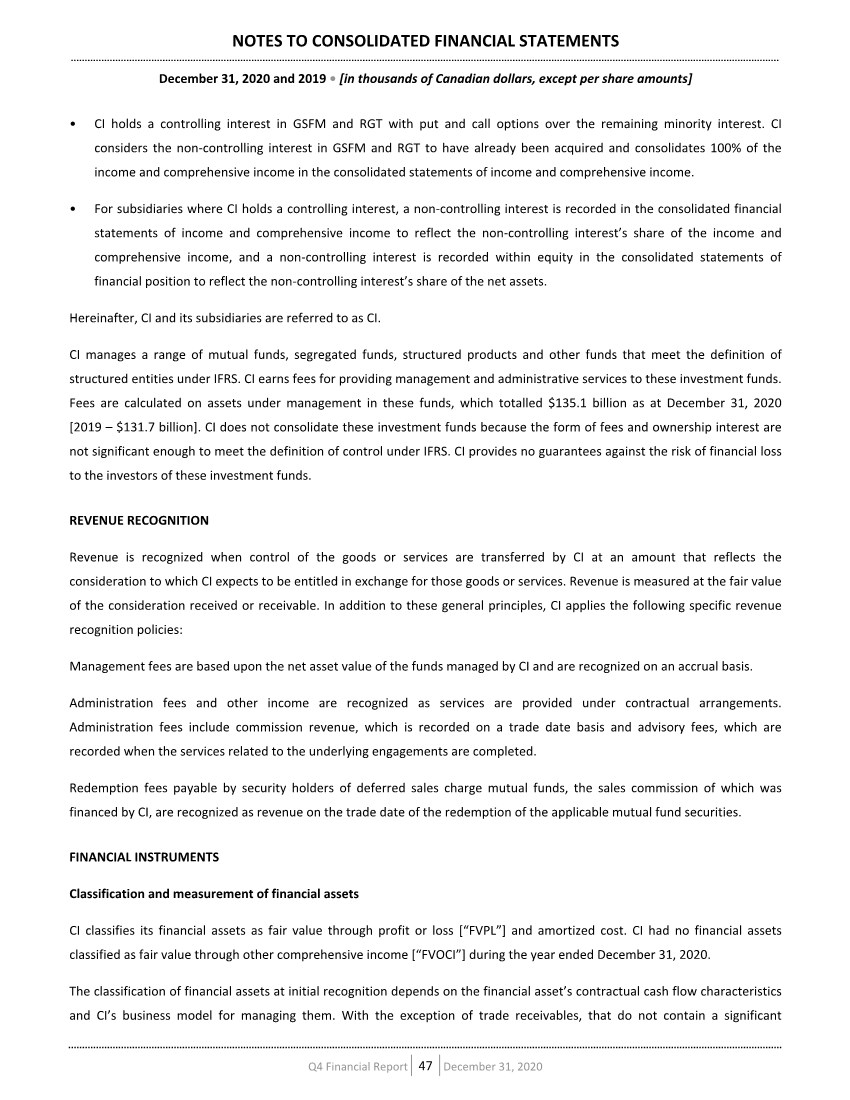
| financing component and are measured at the transaction price in accordance with IFRS 15, Revenue from Contracts with Customers [“IFRS 15”], all financial assets are initially measured at fair value adjusted for transaction costs. Financial assets classified as FVPL are carried at fair value in the consolidated statements of financial position and any gains or losses are recorded in net income in the period in which they arise. Financial assets classified as FVPL include cash and cash equivalents, investments and other assets. Financial assets are classified at amortized cost using the effective interest method if they meet the following conditions and are not designated as FVPL: • they are held within a business model whose objective is to hold the financial assets and collect its contractual cash flows • the contractual terms of the financial assets give rise to cash flows that are solely payments of principal and interest on the principal amount outstanding Financial assets classified at amortized cost include client and trust funds on deposit, accounts receivable and other assets. Cash and cash equivalents Cash and cash equivalents include cash on deposit, highly liquid investments and interest-bearing deposits with original maturities of 90 days or less. Client and trust funds Client and trust funds on deposit include amounts representing cash held in trust with Canadian financial institutions for clients in respect of self-administered Registered Retirement Savings Plans and Registered Retirement Income Funds, and amounts received from clients for which the settlement date on the purchase of securities has not occurred or accounts in which the clients maintain a cash balance. Client and trust funds on deposit also include amounts for client transactions that are entered into on either a cash or margin basis and recorded on the trade date of the transaction. Amounts are due from clients on the settlement date of the transaction for cash accounts. For margin accounts, CI extends credit to a client for the purchase of securities, collateralized by the financial instruments in the client’s account. Amounts loaned are limited by margin regulations of the Investment Industry Regulatory Organization of Canada [“IIROC”] and other regulatory authorities, and are subject to CI’s credit review and daily monitoring procedures. The corresponding liabilities related to the above accounts and transactions are included in client and trust funds payable. Investments Investments include CI Investment Services’s securities owned, at market, principally for the purpose of selling or repurchasing in the near term. Securities owned, at market, are classified as FVPL and are initially recognized on the consolidated statements of financial position at fair value with transaction costs expensed as incurred. Subsequent realized and unrealized gains and losses are included in administration fees income in the consolidated statements of income and comprehensive income in the period in which they arise. Securities transactions are recorded on a trade date basis. Market NOTES TO CONSOLIDATED FINANCIAL STATEMENTS December 31, 2020 and 2019 • [in thousands of Canadian dollars, except per share amounts] Q4 Financial Report 48 December 31, 2020 |
| value is based on quoted prices where an active market exists. For securities in non-active markets, market value is based on valuation techniques and management’s best estimate of fair value. Also included in investments are marketable securities that consist of CI’s seed capital investments in CI mutual funds and strategic investments. Investments in marketable securities are measured at fair value and recognized on the trade date. Mutual fund securities are valued using the net asset value per unit of each fund. Realized and unrealized gains and losses are recognized using average cost and recorded in net income. Distributions from mutual fund securities are recorded as other income. Distributions that are reinvested increase the cost base of the mutual fund investments. Impairment of financial assets CI recognizes a loss allowance for expected credit losses on financial assets that are measured at amortized cost. At each reporting date, the loss allowance for the financial asset is measured at an amount equal to the lifetime expected credit losses if the credit risk on the financial asset has increased significantly since initial recognition. If at the reporting date, the credit risk on the financial asset has not increased significantly since initial recognition, the loss allowance is measured for the credit risk on the financial asset at an amount equal to 12 months of expected credit losses. For trade receivables, CI applies the simplified approach to providing for expected credit losses, which allows for the use of a lifetime expected credit loss provision. Impairment losses on financial assets carried at amortized cost are reversed in subsequent periods if the amount of the loss decreases and is related to an event occurring after the impairment was recognized. Classification and measurement of financial liabilities CI classifies its financial liabilities as FVPL and amortized cost. Financial liabilities are initially measured at fair value, and, where applicable, adjusted for transaction costs unless the financial liability is classified at FVPL. Subsequently, financial liabilities are measured at amortized cost using the effective interest method except for derivatives and financial liabilities designated at FVPL, which are carried subsequently at fair value with gains or losses recognized in net income. Financial liabilities classified at FVPL include derivative financial instruments included in long-term debt and contingent consideration payables included in provisions and other financial liabilities. All other financial liabilities are measured at amortized cost. Derivative financial instruments and hedge accounting CI may use derivative financial instruments such as interest rate swaps and forward foreign exchange contracts to manage its interest rate and foreign currency risk related to long-term debt. Derivative financial instruments are initially recognized at fair value on the date a derivative contract is entered into and are subsequently remeasured at fair value. The accounting for subsequent changes depends on whether the derivative is designated as a hedging instrument, and if so, the nature of the item being hedged and the type of hedge relationship designated. To qualify for hedge accounting, the hedging relationship must meet all of the following requirements: • there is an economic relationship between the hedged item and the hedging instrument • the effect of credit risk does not dominate the value changes that result from that economic relationship NOTES TO CONSOLIDATED FINANCIAL STATEMENTS December 31, 2020 and 2019 • [in thousands of Canadian dollars, except per share amounts] Q4 Financial Report 49 December 31, 2020 |
| • the hedge ratio of the hedging relationship is the same as that resulting from the quantity of the hedged item that the entity actually hedges and the quantity of the hedging instrument that the entity actually uses to hedge that quantity of hedged item CI entered into an interest rate swap designated as a fair value hedge to manage the effect of changes in interest rates relating to its fixed-rate debentures. The swap involves exchanging interest payments without exchanging the notional amount on which the payments are based. The exchange of payments is recorded as an adjustment to interest expense on the hedged item. Changes in the fair value of the swap are recorded in the consolidated statements of income and comprehensive income in other expenses, together with any changes in the fair value of the hedged liability attributable to the hedged risk as an offset. FAIR VALUE MEASUREMENT CI uses valuation techniques to determine the fair value of financial instruments where active market quotes are not available. This involves developing estimates and assumptions consistent with how market participants would price the instrument. CI maximizes the use of observable data when developing estimates and assumptions, but this is not always available. In that case management uses the best information available. All assets and liabilities for which fair value is measured or disclosed in the consolidated financial statements are categorized within the fair value hierarchy, described as follows, based on the lowest level input that is significant to the fair value measurement as a whole: • Level 1 – valuation based on quoted prices (unadjusted) observed in active markets for identical assets or liabilities • Level 2 – valuation techniques based on inputs that are quoted prices of similar instruments in active markets; quoted prices for identical or similar instruments in markets that are not active; inputs other than quoted prices used in a valuation model that are observable for that instrument; and inputs that are derived from or corroborated by observable market data by correlation or other means • Level 3 – valuation techniques with significant unobservable market inputs For assets and liabilities that are recognized in the consolidated financial statements on a recurring basis, CI determines whether transfers have occurred between levels in the hierarchy by reassessing the categorization at the end of each reporting period. COLLATERALIZED SECURITIES TRANSACTIONS CI engages in securities lending and borrowing to facilitate the securities settlement process and to maximize revenue by acting as an agent for such transactions. These transactions are typically short-term in nature, with interest being received on the cash delivered. These transactions are collateralized by either cash, letters of credit or other collateral and are subject to daily margin calls for any deficiency between the market value of the security given and the amount of collateral received. CI manages its credit exposure by establishing and monitoring aggregate limits by counterparty for these transactions. CI’s NOTES TO CONSOLIDATED FINANCIAL STATEMENTS December 31, 2020 and 2019 • [in thousands of Canadian dollars, except per share amounts] Q4 Financial Report 50 December 31, 2020 |
| securities lending and borrowing transactions are recorded in accounts receivable and prepaid expenses and accounts payable and accrued liabilities. CAPITAL ASSETS Capital assets are recorded at cost less accumulated depreciation. These assets are depreciated over their estimated useful lives as follows: Computer hardware Straight-line over three years to five years Office equipment Straight-line over five years Leasehold improvements Straight-line over the term of the lease LEASES CI assesses at inception whether a contract contains a lease that conveys the right to control the use of an identified asset for a period of time in exchange for consideration. All leases are accounted for by recognizing a right-of-use asset and a lease liability except for leases of low value assets and leases with a duration of 12 months or less. Right-of-use assets CI recognizes right-of-use assets at the commencement date of the lease. Right-of-use assets are measured at cost, less any accumulated depreciation and impairment losses, and adjusted for any remeasurement of lease liabilities. The cost of right- of-use assets includes the amount of lease liabilities recognized, initial direct costs incurred, and lease payments made at or before the commencement date less any incentives received. Right-of-use assets are depreciated on a straight-line basis over the shorter of their estimated useful life and the lease term. Lease liabilities At the commencement date of the lease, CI recognizes lease liabilities measured at the present value of lease payments to be made over the lease term. The lease payments include in substance fixed payments less any lease incentives receivable, variable payments that depend on an index or a rate, and amounts expected to be paid under residual value guarantees. The lease payments also include the exercise price of a purchase option reasonably certain to be exercised by CI and payments of penalties for terminating a lease, if the lease term reflects CI exercising the option to terminate. The variable lease payments that do not depend on an index or a rate are recognized as expense in the period on which the event or condition that triggers the payment occurs. In calculating the present value of lease payments, CI uses the incremental borrowing rate at the lease commencement date if the interest rate implicit in the lease is not readily determinable. After the commencement date, the amount of lease liabilities is increased to reflect the accretion of interest and reduced for the lease payments made. In addition, the carrying amount of lease liabilities is remeasured if there is a modification, a change in the lease term, a change in the in-substance fixed lease payments or a change in the assessment to purchase the underlying asset. NOTES TO CONSOLIDATED FINANCIAL STATEMENTS December 31, 2020 and 2019 • [in thousands of Canadian dollars, except per share amounts] Q4 Financial Report 51 December 31, 2020 |
| Short-term leases and lease of low-value assets CI applies the short-term lease recognition exemption to its short-term leases of equipment and property leases (i.e., those leases that have a lease term of 12 months or less from the commencement date and do not contain a purchase option). CI also applies the lease of low-value assets recognition exemption to leases of equipment that are considered of low value (i.e. below $5,000). Lease payments on short-term leases and leases of low-value assets are recognized as an expense on a straight-line basis over the lease term. Sub-leases CI enters into lease agreements as an intermediate lessor with respect to some of its leased properties. When CI is an intermediate lessor, the head lease and the sub-lease are accounted for as two separate contracts. The sub-lease is classified as a finance or operating lease by reference to the right-of-use asset arising from the head lease. Amounts due from lessees under finance leases are recognized as other assets at the amount of CI’s net investment in the leases. Finance lease income is recognized over the lease term using the effective interest rate. Payments received reduce the net investment in the lease. Rental income from operating leases is recognized on a straight-line basis over the term of the relevant lease. BUSINESS COMBINATIONS The acquisition method of accounting is used to account for the acquisition of subsidiaries by CI, whereby the purchase consideration is allocated to the identifiable assets and liabilities on the basis of fair value at the date of acquisition. Provisional fair values allocated at a reporting date are finalized as soon as the relevant information is available, within a period not to exceed 12 months from the acquisition date, with retroactive restatement of the impact of adjustments to those provisional fair values effective as at the acquisition date. CI elects on a transaction-by-transaction basis whether to measure any non-controlling interest at fair value, or at the proportionate share of the recognized amount of the identifiable net assets of the acquired subsidiary, at the acquisition date. Consideration transferred includes the fair values of the assets transferred, liabilities incurred and equity interests issued by CI. Consideration also includes the fair value of any put option or contingent consideration. Subsequent to the acquisition, the put option and contingent consideration that is based on an earnings measurement and classified as a liability is measured at fair value with any resulting gain or loss recognized in net income. Acquisition-related costs are expensed as incurred. INTANGIBLES Fund contracts Fund administration contracts and fund management contracts [collectively, “fund contracts”] are recorded net of any write- down for impairment. CI evaluates the carrying amounts of indefinite life fund contracts at least annually for potential impairment by comparing the recoverable amount with their carrying amounts. CI will evaluate the carrying amount of fund NOTES TO CONSOLIDATED FINANCIAL STATEMENTS December 31, 2020 and 2019 • [in thousands of Canadian dollars, except per share amounts] Q4 Financial Report 52 December 31, 2020 |
| contracts if events or changes in circumstances indicate a potential impairment. Any impairment would be written off to income. Fund administration contracts are amortized on a straight-line basis over a period of up to 25 years. Fund management contracts with a finite life are amortized on a straight-line basis over a period of up to 20 years. The amortization period depends on the contractual terms of such agreements and management’s best estimate of their useful lives. Fund management contracts with an indefinite life are not amortized. Goodwill Goodwill is recorded as the excess of purchase price over identifiable assets acquired. Following initial recognition, goodwill is stated at cost less any accumulated impairment losses. Goodwill is evaluated for impairment at least annually and any impairment is recognized immediately in income and not subsequently reversed. Goodwill is allocated to the asset management and wealth management cash-generating units for the purpose of impairment testing. Other intangibles Other intangibles include the costs of trademarks and computer software, capitalized where it is probable that future economic benefits that are attributable to the assets will flow to CI and the cost of the assets can be measured reliably. Computer software is recorded initially at cost and amortized over its expected useful life of two to ten years on a straight-line basis. Trademarks have an indefinite life and are not amortized. EQUITY-BASED COMPENSATION CI uses the fair value method to account for equity-settled employee incentive share options and restricted share units [“RSUs”]. The value of the equity-based compensation, as at the date of grant, is recognized over the applicable vesting period as compensation expense with a corresponding increase in contributed surplus. When options are exercised, the proceeds received, together with the amount in contributed surplus, are credited to share capital. Upon vesting of the RSUs, the amount accumulated in contributed surplus for the RSUs is reclassified to share capital. CI has a deferred share unit plan for directors. The value of the compensation at the date of grant is recognized immediately as compensation with a corresponding increase in accounts payable and accrued liabilities. At each consolidated statement of financial position date, the liability is revalued with an offset to compensation expense. The amount recognized as an expense is adjusted to reflect the number of awards for which the related service conditions are expected to be met, such that the amount ultimately recognized as an expense is based on the number of awards that do meet the related service condition at the vesting date. INCOME TAXES Current income tax liabilities are measured at the amount expected to be paid to tax authorities, net of recoveries based on the tax rates and tax laws enacted or substantively enacted as at the consolidated statements of financial position dates. NOTES TO CONSOLIDATED FINANCIAL STATEMENTS December 31, 2020 and 2019 • [in thousands of Canadian dollars, except per share amounts] Q4 Financial Report 53 December 31, 2020 |
| The liability method of tax allocation is used in accounting for income taxes. Under this method, deferred income tax assets and liabilities are determined based on differences between the carrying amount and tax basis of assets and liabilities and measured using the substantively enacted tax rates and laws that will be in effect when the differences are expected to reverse. Deferred tax assets are recognized to the extent that it is probable that taxable profits will be available against which deductible temporary differences can be utilized. Deferred tax liabilities are generally recognized for all taxable temporary differences. Deferred tax liabilities are recognized for taxable temporary differences arising in investments in subsidiaries and joint ventures except where the reversal of the temporary difference can be controlled and it is probable that the difference will not reverse in the foreseeable future. Deferred tax liabilities are not recognized on temporary differences that arise from the initial recognition of goodwill, which is not deductible for tax purposes. Deferred tax assets and liabilities are not recognized in respect of temporary differences that arise on initial recognition of assets and liabilities acquired other than in a business combination. PROVISIONS A provision is recognized if, as a result of a past event, CI has a present legal or constructive obligation that can be estimated reliably, and it is probable that an outflow of economic benefits will be required to settle the obligation. In the event that the time value of money is material, provisions are determined by discounting the expected future cash flows at a pre-tax rate that reflects a current market assessment of the time value of money and the risks specific to the liability. FOREIGN CURRENCY (i) Foreign currency transactions Transactions that are denominated in a currency other than the functional currency of the entity are translated as follows: Monetary assets and liabilities are translated into Canadian dollars using the exchange rates in effect as at the consolidated statements of financial position dates. Non-monetary assets and liabilities are translated into Canadian dollars using historical exchange rates. Revenue and expenses are translated at average rates prevailing during the period. Other foreign currency transactions are translated into Canadian dollars using the exchange rate in effect on the transaction date. Translation exchange gains and losses are included in other income in the period in which they occur. (ii) Foreign currency operations The assets and liabilities of foreign operations, including goodwill and fair value adjustments arising on consolidation, are translated at the exchange rate in effect as at the consolidated statements of financial position dates. Revenue and expenses are translated at average rates prevailing during the period. Translation exchange gains and losses are recognized as other comprehensive income and reclassified to net income when the gain or loss on disposal of the foreign subsidiary is recognized. The consolidated statements of cash flows are translated at average exchange rates during the period, whereas cash and cash equivalents are translated at the spot exchange rate in effect as at the consolidated statements of financial position dates. NOTES TO CONSOLIDATED FINANCIAL STATEMENTS December 31, 2020 and 2019 • [in thousands of Canadian dollars, except per share amounts] Q4 Financial Report 54 December 31, 2020 |
| CRITICAL ACCOUNTING ESTIMATES AND JUDGMENTS In the process of applying CI’s accounting policies, management has made significant judgments involving estimates and assumptions, which are summarized as follows: (i) Business combinations The purchase price related to business acquisitions is allocated to the underlying assets and liabilities based on their estimated fair value at the acquisition date. Management makes estimates to determine the fair value of assets and liabilities, including the valuation of separately identifiable intangibles acquired. Contingent consideration and put option payable as part of the acquisitions are generally based on acquired businesses achieving certain performance targets. The estimates are based on management’s best assessment of the related inputs used in the valuation models, such as future cash flows and discount rates. Future performance results that differ from management’s estimates could result in changes to the liabilities, which are recorded as they arise in net income. (ii) Impairment of intangible assets Finite life intangible assets are reviewed for impairment whenever events or changes in circumstances indicate that the carrying amount may not be recoverable. Indefinite life intangible assets, including goodwill, are tested for impairment annually or more frequently if changes in circumstances indicate that the carrying amount may be impaired. The values associated with intangibles involve estimates and assumptions, including those with respect to future cash inflows and outflows, discount rates and asset lives. These estimates require significant judgment regarding market growth rates, fund flow assumptions, expected margins and costs that could affect CI’s future results if the current estimates of future performance and fair values change. These determinations also affect the amount of amortization expense on intangible assets with finite lives recognized in future periods. (iii) Deferred tax assets Deferred tax assets are recognized for unused tax losses to the extent that it is probable that taxable profits will be available against which the losses can be utilized. Significant management judgment is required to determine the amount of deferred tax assets that can be recognized, based upon the likely timing and level of future taxable profits together with future tax planning strategies. (iv) Provisions and other financial liabilities Due to the nature of provisions and other financial liabilities, a considerable part of their determination is based on estimates and judgments, including assumptions concerning the future. The actual outcome of these uncertain factors may be materially different from the estimates, causing differences with the estimated provisions. Further details are provided in Note 8. NOTES TO CONSOLIDATED FINANCIAL STATEMENTS December 31, 2020 and 2019 • [in thousands of Canadian dollars, except per share amounts] Q4 Financial Report 55 December 31, 2020 |
| 2. NEW ACCOUNTING STANDARDS AND AMENDMENTS IFRS 3 Effective January 1, 2020, CI adopted prospectively, the amendment to IFRS 3, Business Combinations, which clarifies that to be considered a business, an integrated set of activities and assets must include, at a minimum, an input and a substantive process that together significantly contribute to the ability to create output. Furthermore, it clarifies that a business can exist without including all of the inputs and processes needed to create outputs. These amendments had no impact on the consolidated financial statements of CI, but may impact future periods should CI enter into additional business combinations. 3. BUSINESS ACQUISITION [A] Acquisitions - Year ended December 31, 2019 WealthBar Financial Services Inc. On January 23, 2019, CI acquired 75% of the outstanding shares and debt obligations of WealthBar Financial Services Inc. [“WealthBar”] and on May 14, 2020, acquired the remaining 25% of the outstanding shares, for all cash consideration. WealthBar provides a leading Canadian online wealth management and financial planning platform. The acquisition was accounted for using the acquisition method of accounting. The fair values of the assets acquired and liabilities assumed and the results of operations have been consolidated from the date of the transaction and are included in the wealth management segment. Snap Projections Inc. On October 16, 2019, WealthBar acquired 100% of the outstanding shares of Snap Projections Inc., a Canadian financial and retirement software provider. The acquisition was accounted for using the acquisition method of accounting. The estimated fair values of the assets acquired and liabilities assumed and the results of operations have been consolidated from the date of the transaction and are included in the wealth management segment. [B] Acquisitions - Year ended December 31, 2020 CI ETF Investment Management Inc. On February 19, 2020, CI acquired 100% of the outstanding shares and debt obligations of CI ETF Investment Management Inc. [“CI ETF”], formerly WisdomTree Asset Management Canada, Inc., an investment fund manager of Canadian exchange- traded funds. The acquisition was accounted for using the acquisition method of accounting. The estimated fair values of the assets acquired and liabilities assumed, and the results of operations have been consolidated from the date of the transaction and are included in the asset management segment. Effective July 1, 2020, CI ETF amalgamated with CI Investments. NOTES TO CONSOLIDATED FINANCIAL STATEMENTS December 31, 2020 and 2019 • [in thousands of Canadian dollars, except per share amounts] Q4 Financial Report 56 December 31, 2020 |

| Aligned Capital Distributions Inc. On October 19, 2020, CI acquired a controlling interest in Aligned Capital Distributions Inc. [“Aligned”], a Canadian full-service investment advisory firm, for cash consideration and the issuance of 855 thousand shares of CI. The estimated fair values of the assets acquired and liabilities assumed and the results of operations have been consolidated from the date of the transaction and are included in the wealth management segment. U.S. Registered Investment Advisors During the year ended December 31, 2020, CI acquired controlling interests in the following registered investment advisory firms, together [“U.S. RIAs”]. The estimated fair values of the assets acquired and liabilities assumed and the results of operations have been consolidated from the date of the transaction and are included in the wealth management segment. • Surevest LLC • OCM Capital Partners LLC • The Cabana Group, LLC • Balasa Dinverno Foltz LLC • Thousand Oaks Financial Corporation • Bowling Portfolio Management LLC • The Roosevelt Investment Group, Inc. • Stavis & Cohen Financial, LLC • Doyle Wealth Management, Inc. • RGT Wealth Advisors, LLC NOTES TO CONSOLIDATED FINANCIAL STATEMENTS December 31, 2020 and 2019 • [in thousands of Canadian dollars, except per share amounts] Q4 Financial Report 57 December 31, 2020 |
| [C] Net Assets Acquired - Year ended December 31, 2020 Details of the net assets acquired during the year ended December 31, 2020, at fair value, are as follows: Wealth Management Asset Management Total $ $ $ Cash and cash equivalents 19,578 1,736 21,314 Client and trust funds on deposit 450,932 — 450,932 Accounts receivable and prepaid expenses 6,398 331 6,729 Capital assets 1,390 5 1,395 Right-of-use assets 14,724 — 14,724 Deferred tax (4,219) 6,896 2,677 Intangibles 393,744 1,753 395,497 Other assets 344 — 344 Accounts payable and accrued liabilities (18,245) (1,298) (19,543) Clients and trust funds payable (450,932) — (450,932) Income taxes payable (312) — (312) Lease liability (15,545) — (15,545) Fair value of identifiable net assets 397,857 9,423 407,280 Non-controlling interest (35,222) — (35,222) Goodwill on acquisition 528,557 763 529,320 Total acquired cost 891,192 10,186 901,378 Cash consideration 537,430 5,500 542,930 Share consideration 35,434 — 35,434 Other financial liabilities 318,328 4,686 323,014 891,192 10,186 901,378 Included in intangibles are fund administration contracts with a fair value of $392,904 with a finite life of 12 years and indefinite life fund management contracts of $1,753. Goodwill of $528,557 has been attributed to the wealth management segment and $763 to the asset management segment. Goodwill of $495,546 for the U.S. RIAs is deductible for income taxes. The acquisition agreements provided for deferred compensation, contingent consideration and a put option payable payable in cash and shares of CI. Deferred compensation payable in cash of $81,937 and shares of $15,294, is payable within 1 year from the date of acquisition. Contingent consideration of $126,485 is payable in cash within 1 to 4 years from the date of acquisition, if certain financial targets are met based on EBITDA. The put option payable of $99,298 in cash or common shares of CI, is exercisable within 270 days following the date of acquisition. The put option granted to the minority shareholders requires CI to purchase the shares owned by each shareholder at a fixed price if exercised within 270 days, after which the price is based on fair market value. CI has estimated the fair value of the contingent consideration and put option payable using a discounted cash flow approach. This approach included assumptions regarding the timing and proportion of shares the NOTES TO CONSOLIDATED FINANCIAL STATEMENTS December 31, 2020 and 2019 • [in thousands of Canadian dollars, except per share amounts] Q4 Financial Report 58 December 31, 2020 |
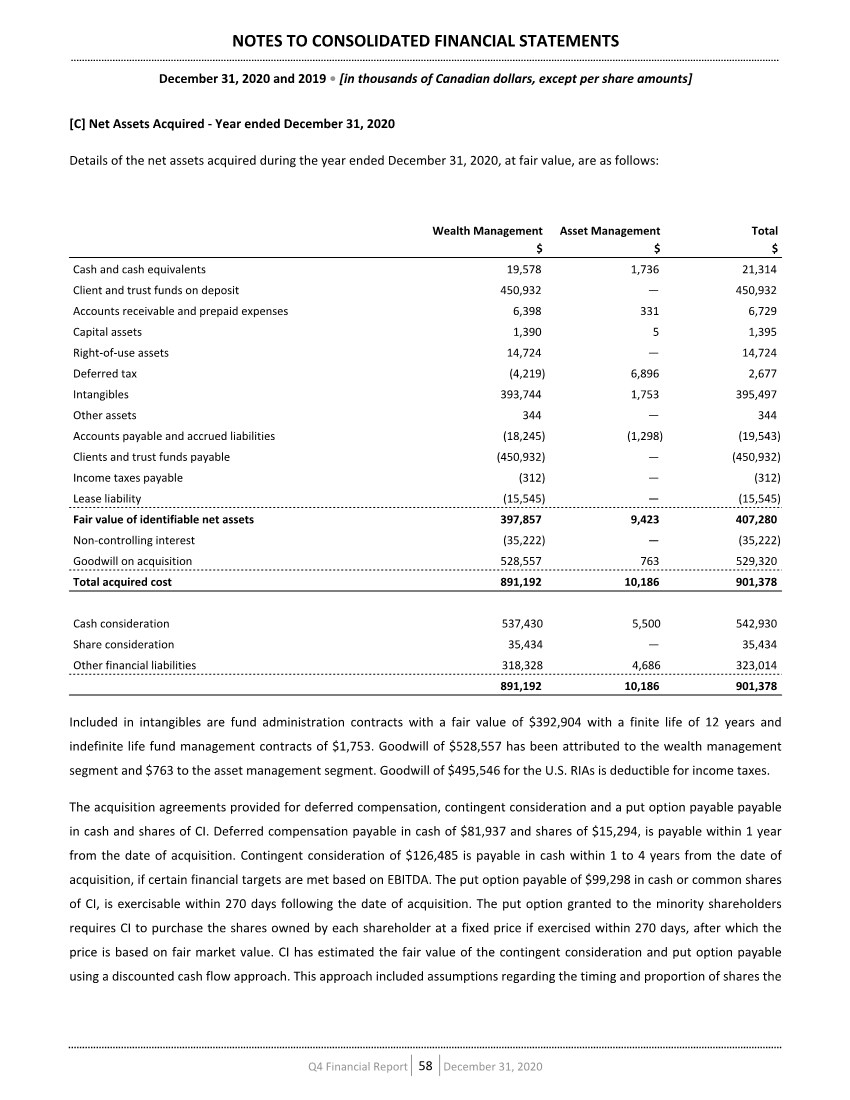
| minority shareholders will require CI to purchase. The fair market measurement is based on significant inputs that are considered level 3 inputs. Non-controlling interests were measured at the proportionate interest in the identifiable net assets of the acquired subsidiary, at the acquisition date. [D] Other Acquisitions Congress Wealth Management LLC On July 2, 2020, CI completed the acquisition of a minority interest in Congress Wealth Management LLC [“Congress”]. The acquisition of Congress has been accounted for using the equity method of accounting. AWM Dorval On September 30, 2020, AWM completed the acquisition of a minority interest in AWM’s Dorval, Quebec operation [“AWM Dorval”]. The acquisition of AWM Dorval has been accounted for using the equity method of accounting. Subsequent events On January 25, 2021, CI reached an agreement to acquire 100% of Segal Bryant & Hamill, LLC, a registered investment advisory and institutional investment management firm. The details of the acquisition are being finalized and is expected to close by June 30, 2021. NOTES TO CONSOLIDATED FINANCIAL STATEMENTS December 31, 2020 and 2019 • [in thousands of Canadian dollars, except per share amounts] Q4 Financial Report 59 December 31, 2020 |
| 4. CAPITAL ASSETS Capital assets consist of the following: Computer hardware Office equipment Leasehold improvements Total $ $ $ $ Cost Balance, December 31, 2018 17,589 17,960 80,554 116,103 Acquired 141 51 28 220 Additions 3,151 2,337 6,863 12,351 Retired (1,678) (6) — (1,684) Balance, December 31, 2019 19,203 20,342 87,445 126,990 Acquired 2,249 3,215 1,930 7,394 Additions 6,687 1,172 4,131 11,990 Retired (1,739) — — (1,739) Translation (105) (46) (18) (169) Balance, December 31, 2020 26,295 24,683 93,488 144,466 Accumulated depreciation Balance, December 31, 2018 12,101 14,323 44,694 71,118 Acquired 66 21 20 107 Depreciation 3,927 1,405 6,159 11,491 Retired (1,674) (6) — (1,680) Balance, December 31, 2019 14,420 15,743 50,873 81,036 Acquired 1,781 2,467 1,751 5,999 Depreciation 3,756 1,644 6,895 12,295 Retired (1,739) — — (1,739) Translation (51) (41) (11) (103) Balance, December 31, 2020 18,167 19,813 59,508 97,488 Carrying amounts At December 31, 2018 5,488 3,637 35,860 44,985 At December 31, 2019 4,783 4,599 36,572 45,954 At December 31, 2020 8,128 4,870 33,980 46,978 NOTES TO CONSOLIDATED FINANCIAL STATEMENTS December 31, 2020 and 2019 • [in thousands of Canadian dollars, except per share amounts] Q4 Financial Report 60 December 31, 2020 |
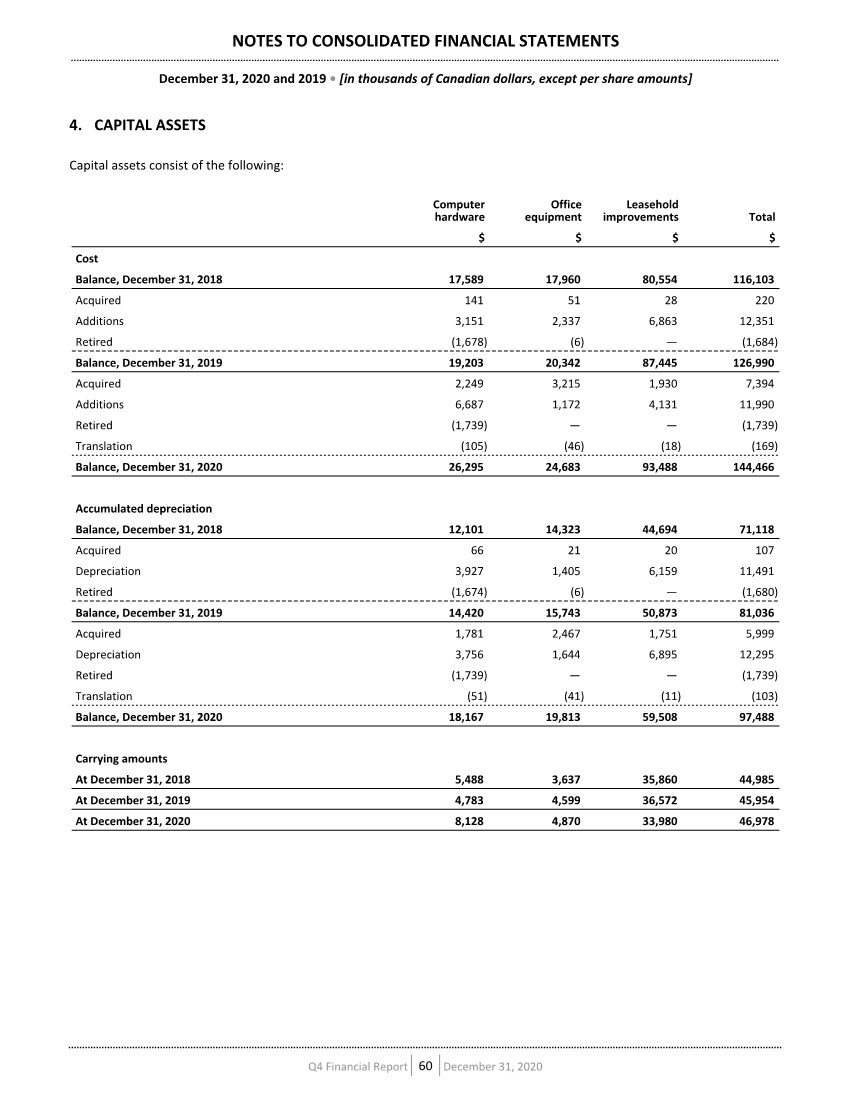
| 5. INTANGIBLES Goodwill Fund administration contracts Fund management contracts finite life Fund management contracts indefinite life Other intangibles Total $ $ $ $ $ $ Cost Balance, December 31, 2018 1,521,105 44,500 50,157 1,779,957 56,116 3,451,835 Acquired 11,670 5,000 — — 16,300 32,970 Additions — — — — 4,425 4,425 Retired — — — — (12,664) (12,664) Translation (1,502) — — — — (1,502) Balance, December 31, 2019 1,531,273 49,500 50,157 1,779,957 64,177 3,475,064 Acquired 529,320 392,904 — 1,753 1,006 924,983 Additions — — — — 17,132 17,132 Translation (6,921) (10,439) (112) (2,809) (29) (20,310) Balance, December 31, 2020 2,053,672 431,965 50,045 1,778,901 82,286 4,396,869 Accumulated amortization Balance, December 31, 2018 — 23,254 29,374 — 28,866 81,494 Acquired — — — — (1,826) (1,826) Amortization — 2,467 2,022 — 6,823 11,312 Retired — — — — (4,398) (4,398) Balance, December 31, 2019 — 25,721 31,396 — 29,465 86,582 Acquired — — — 166 166 Amortization — 9,325 2,037 — 7,955 19,317 Translation — (210) 20 — (4) (194) Balance, December 31, 2020 — 34,836 33,453 — 37,582 105,871 Carrying amounts At December 31, 2018 1,521,105 21,246 20,783 1,779,957 27,250 3,370,341 At December 31, 2019 1,531,273 23,779 18,761 1,779,957 34,712 3,388,482 At December 31, 2020 2,053,672 397,129 16,592 1,778,901 44,704 4,290,998 Remaining term N/A 7.9 – 12.0 yrs 6.3 – 12.9 yrs N/A 0.1 – 8.8 yrs CI has two groups of cash-generating units [“CGUs”] for the purpose of assessing the carrying amount of the allocated goodwill being the asset management and wealth management operating segments as described in Note 17. Goodwill of $1,311,873 is allocated to the asset management segment and $741,799 is allocated to the wealth management segment as at December 31, 2020 [ 2019 – $ 1,309,008 and $222,265, respectively]. Within the asset management segment, CI has indefinite life fund management contracts of $1,778,901 as at December 31, 2020 [2019 – $1,779,957]. The recoverable amounts of the CGUs are based on a fair value less cost to sell calculation. The fair value was determined using the discounted cash flow method, based on estimated future cash flows over a 10-year period with a terminal value for NOTES TO CONSOLIDATED FINANCIAL STATEMENTS December 31, 2020 and 2019 • [in thousands of Canadian dollars, except per share amounts] Q4 Financial Report 61 December 31, 2020 |
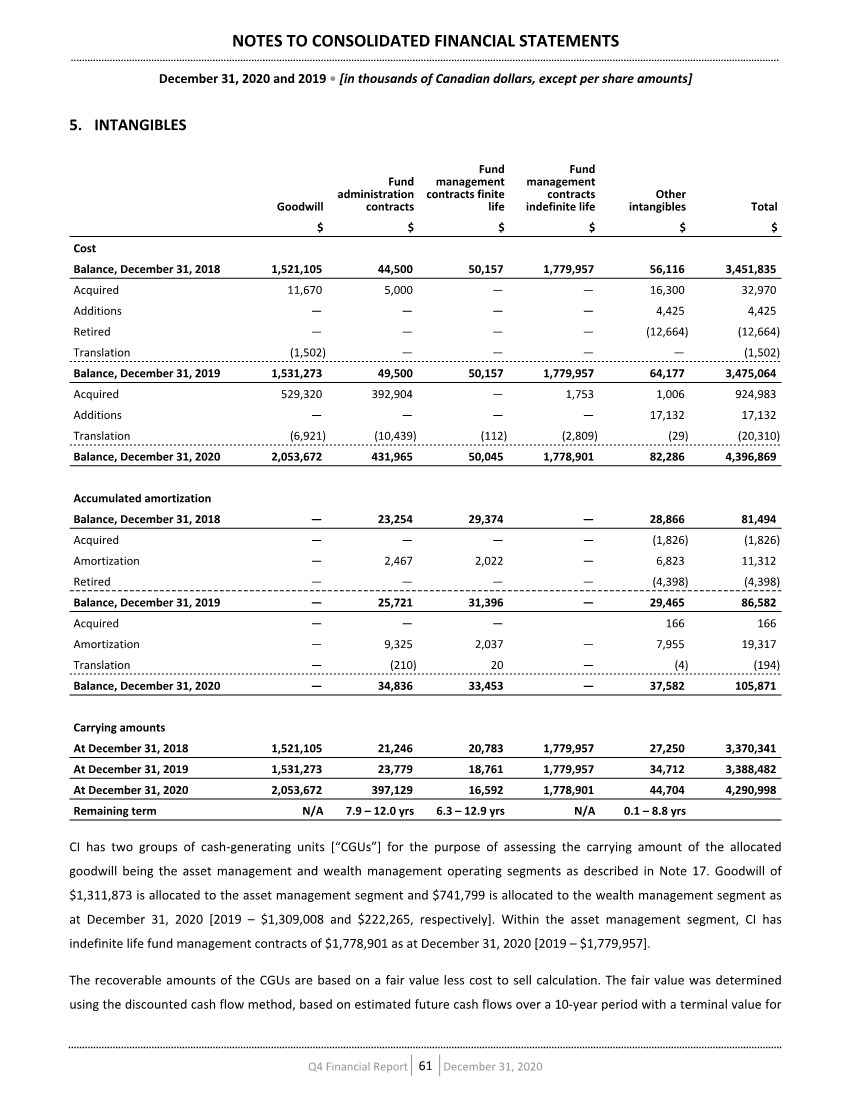
| the period thereafter. CI uses a 10-year period to reflect the expected growth strategies for the various contracts acquired in addition to the fact that it may take several years to fully integrate operations and benefit from synergies. The key assumptions used in the forecast calculation include assumptions on market appreciation, net sales of funds and operating margins. Market appreciation rates are determined using historical inflation-adjusted index returns adjusted for CI’s average management fee. Net sales are determined based on the historical 3-year average as well as management’s forecasts for future sales. Inputs to the operating margin include estimates for management and trailer fees using current average fee rates and historical rates for selling, general and administrative costs that are applied to forecast average assets under management over the 10-year period. The terminal value has been calculated assuming a long-term growth rate of 2% per annum in perpetuity based on a long-term real GDP growth rate as at December 31, 2020 and 2019. A discount rate of 10.10% – 14.94% per annum has been applied to the recoverable amount calculation as at December 31, 2020 [2019 – 11.38% – 13.88%]. The calculation of the recoverable amount exceeds the carrying amount of goodwill and indefinite life fund management contracts as at December 31, 2020 and 2019. 6. OTHER ASSETS, INCOME AND EXPENSE Other assets as at December 31, 2020 consist mainly of long-term investments and advisor and employee loans. 2020 2019 $ $ Long-term investments 64,191 27,774 Advisor loans and employee loans 36,470 24,148 Other 24,081 18,833 124,742 70,755 Long-term investments includes long-term strategic investments including CI’s equity accounted investments in Congress and AWM Dorval. CI has a hiring and retention incentive program whereby loans are extended to current investment advisors. These loans are initially recorded at their fair value, may bear interest at prescribed rates and are contractually forgiven on a straight-line basis over the applicable contractual period, which varies in length from three to seven years. CI utilizes the effective interest method to amortize the forgiven amount. The forgiven amount is included in selling, general and administrative expenses. As at December 31, 2020, loans to investment advisors of $32,774 [2019 – $19,135] are included in other assets. These loans become due on demand upon early termination or breach in the terms of the agreements. CI has an employee share purchase loan program for key employees. These loans are renewable yearly and bear interest at prescribed rates. As at December 31, 2020, the carrying amount of employee share purchase loans is $757 [2019 – $3,933] and is included in other assets. These loans become due immediately upon termination of employment or sale of the shares that are held as collateral. As at December 31, 2020, the shares held as collateral have a market value of approximately $918 [2019 – $4,763]. NOTES TO CONSOLIDATED FINANCIAL STATEMENTS December 31, 2020 and 2019 • [in thousands of Canadian dollars, except per share amounts] Q4 Financial Report 62 December 31, 2020 |
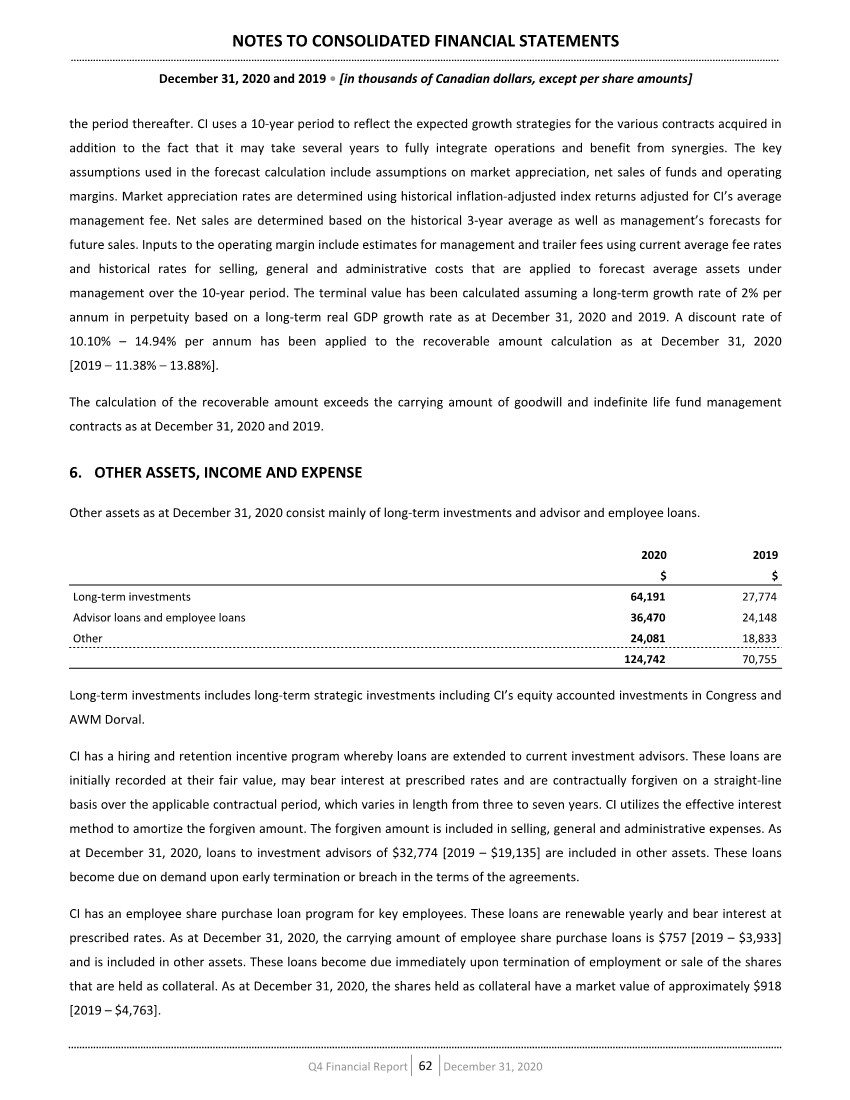
| Other income consists mainly of fees received for the administration of third-party mutual funds, custody fees, investment income, foreign exchange gains (losses), interest income and the revenue earned by Marret. Other expenses consist mainly of the provisions and other financial liabilities as discussed in Note 8, acquisition related costs and expenses incurred by Marret. 7. LONG-TERM DEBT Long-term debt consists of the following: 2020 2019 $ $ Credit facility Bankers’ acceptances — 35,000 — 35,000 Debenture principal amount Interest rate Issued date Maturity date $450 million 2.645 % December 7, 2015 December 7, 2020 — 449,509 $200 million 2.775 % November 25, 2016 November 25, 2021 203,805 199,512 $325 million 3.520 % July 20, 2018 July 20, 2023 323,944 323,616 $350 million 3.215 % July 22, 2019 July 22, 2024 348,454 348,101 $450 million 3.759 % May 26, 2020 May 26, 2025 447,829 — $250 million 3.904 % September 27, 2017 September 27, 2027 248,891 248,756 $700 million USD 3.200 % December 17, 2020 December 17, 2030 883,193 — 2,456,116 1,569,494 Long-term debt 2,456,116 1,604,494 Current portion of long-term debt 203,805 449,509 CREDIT FACILITY CI has a $700,000 revolving credit facility with three Canadian chartered banks. Loans are made by the banks under a three- year revolving credit facility, with the outstanding principal balance due upon maturity on December 11, 2021. Amounts may be borrowed in Canadian dollars through prime rate loans, which bear interest at the greater of the bank’s prime rate and the Canadian Deposit Offering Rate plus 1.00%, or bankers’ acceptances, which bear interest at bankers’ acceptance rates plus 0.90%. Amounts may also be borrowed in U.S. dollars through base rate loans, which bear interest at the greater of the bank’s reference rate for loans made by it in Canada in U.S. funds and the federal funds effective rate plus 1.00%, or LIBOR loans, which bear interest at LIBOR plus 0.90%. CI may also borrow under this facility in the form of letters of credit, which bear a fee of 0.90% on any undrawn portion. As at December 31, 2020 and 2019, CI had not accessed the facility by way of letters of credit. The credit facility contains a number of financial covenants that require CI to meet certain financial ratios and financial condition tests. CI is within its financial covenants with respect to its credit facility, which require that the funded debt to annualized EBITDA ratio remain below 3:1 and that CI’s assets under management not fall below $85 billion, calculated based NOTES TO CONSOLIDATED FINANCIAL STATEMENTS December 31, 2020 and 2019 • [in thousands of Canadian dollars, except per share amounts] Q4 Financial Report 63 December 31, 2020 |
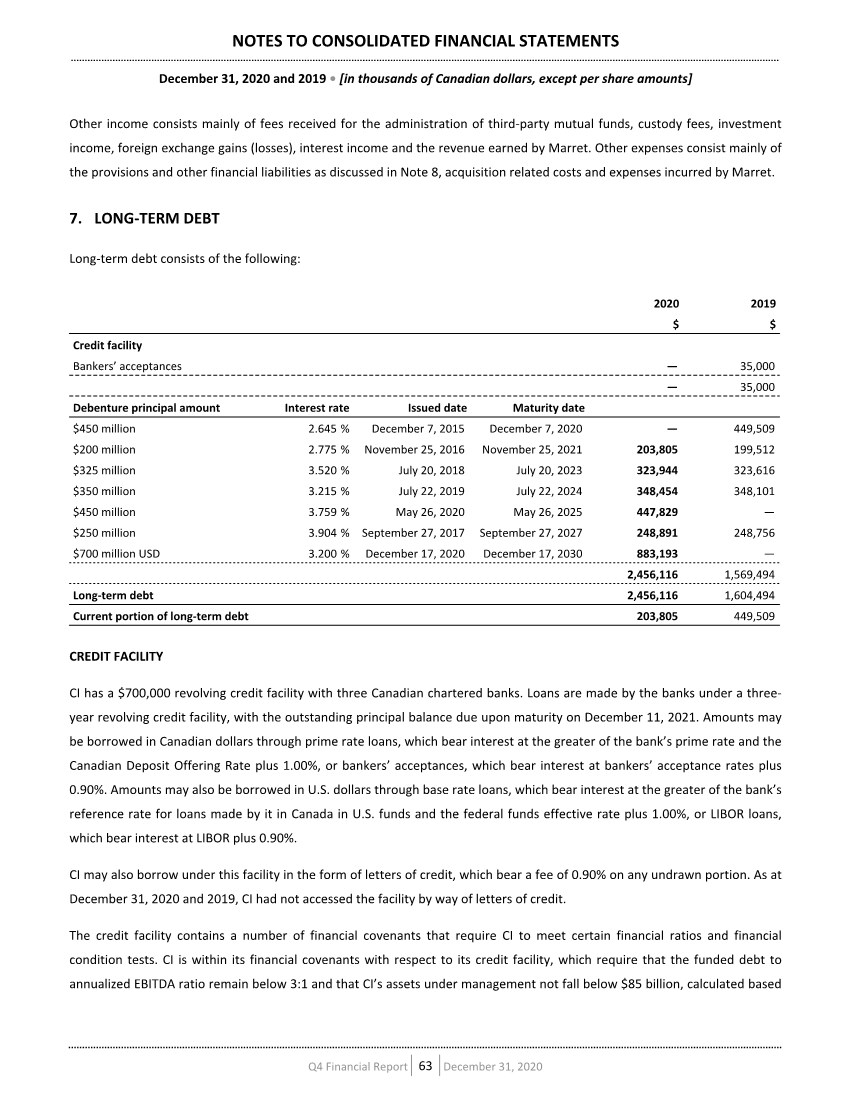
| on a rolling 30-day average. There can be no assurance that future borrowings or equity financing will be available to CI or available on acceptable terms. DEBENTURES AND NOTES On July 22, 2019, CI completed an offering pursuant to which it issued $350,000 principal amount of debentures due July 22, 2024 at par [the “2024 Debentures”]. Interest on the 2024 Debentures is paid semi-annually in arrears at a rate of 3.215%. The proceeds, net of transaction costs, were used to repay outstanding indebtedness under the credit facility. On May 26, 2020, CI completed an offering pursuant to which it issued $450,000 principal amount of debentures due May 26, 2025 at par [the “2025 Debentures”]. Interest on the 2025 Debentures is paid semi-annually in arrears at a rate of 3.759%. The proceeds, net of transaction costs, were used to repay outstanding indebtedness under the credit facility. On December 17, 2020, CI completed an offering pursuant to which it issued $700,000 USD principal amount of notes due December 17, 2030 [the “2030 Notes”]. Interest on the 2030 Notes is paid semi-annually in arrears at a rate of 3.200%. The proceeds, net of transaction costs, were used to repay outstanding indebtedness under the credit facility. CI may, at its option, redeem the 2023 Debentures, the 2024 Debentures, the 2025 Debentures and the 2027 Debentures, in whole or in part, from time to time, on not less than 30 nor more than 60 days’ prior notice to the registered holder, at a redemption price which is equal to the greater of par and the Government of Canada yield, plus 36.0, 44.5, 84.0, 44.5 basis points respectively. CI may also, at its option, redeem the 2030 Notes in whole or in part, from time to time, at a redemption price which is equal to the greater of 100% of the principal amount of the notes to be redeemed and the Treasury Rate plus 35.0 basis points. CI considers these embedded prepayment options to be closely related to the debentures and, as such, does not account for it separately as a derivative. During the year ended December 31, 2020, CI repurchased $55,985 principal amount of debentures due December 7, 2020 at an average price of $100.693 and recorded a loss of $388, included in other income. The remaining principal amount of $394,015 was repaid on the maturity date, December 7, 2020. On January 18, 2021, CI redeemed the $200,000 principal amount of debentures due November 25, 2021 [the “2021 Debentures”] at a price of $101.903, realizing a loss of $3,805 and paying interest of $806. In connection with the redemption of the 2021 Debentures, on January 18, 2021, CI terminated the interest swap agreement entered into on February 2, 2017, and realized a gain of $1,865. The interest rate swap agreement was entered into with a Canadian chartered bank to swap the semi-annual fixed rate payments on the 2021 Debentures for floating rate payments. Based on the terms of the agreement, CI paid a rate equivalent to the three-month Canadian bankers’ acceptance rate plus a spread of 138.4 basis points. The rates reset quarterly and paid semi-annually to match the fixed payment obligations of the 2021 Debentures. As at December 31, 2020, the fair value of the interest rate swap agreement was an unrealized gain of $1,857 [2019 – $2,388] and is included in long-term debt in the consolidated statements of financial position. On January 19, 2021, CI announced its intention to repurchase the 2023 Debentures on or about February 19, 2021 in accordance with their terms. NOTES TO CONSOLIDATED FINANCIAL STATEMENTS December 31, 2020 and 2019 • [in thousands of Canadian dollars, except per share amounts] Q4 Financial Report 64 December 31, 2020 |
| Interest paid on the debentures and notes is paid semi-annually. During the years ended December 31, 2020 and 2019, interest paid is as follows: 2020 2019 Interest rate Issued date Maturity date $ $ Interest paid on debentures and notes $450 million 2.645 % December 7, 2015 December 7, 2020 10,305 11,903 $200 million 2.775 % November 25, 2016 November 25, 2021 5,409 6,841 $325 million 3.520 % July 20, 2018 July 20, 2023 11,440 11,440 $350 million 3.215 % July 22, 2019 July 22, 2024 11,384 4,861 $450 million 3.759 % May 26, 2020 May 26, 2025 10,098 — $250 million 3.904 % September 27, 2017 September 27, 2027 9,760 9,760 $700 million USD 3.200 % December 17, 2020 December 17, 2030 1,115 — 59,511 44,805 Issuance costs and the issuance discount are amortized over the term of the debentures using the effective interest method. The amortization expense related to the discount and transaction costs for CI’s issued debentures for the year ended December 31, 2020 was $2,054 [2019 – $1,302], which is included in other expenses. In the event that both a change of control occurs and the rating of the debentures is lowered to below investment grade by two out of three rating agencies as defined as below BBB- by Standard & Poor’s, BBB (low) by DBRS Limited and Baa3 by Moody’s Investor Service, Inc., CI will be required to make an offer to repurchase all or, at the option of each holder, any part of each holder’s debentures at a purchase price payable in cash equivalent to 101% of the outstanding principal amount of the debentures and notes, together with accrued and unpaid interest, to the date of purchase. Also, in the case of the 2030 Notes, in the event that certain changes affecting Canadian withholding taxes occur, CI will have the option to redeem the notes in whole or in part, at a redemption price equal to 100% of the aggregate principal amount, together with accrued and unpaid interest, to the date of redemption. NOTES TO CONSOLIDATED FINANCIAL STATEMENTS December 31, 2020 and 2019 • [in thousands of Canadian dollars, except per share amounts] Q4 Financial Report 65 December 31, 2020 |
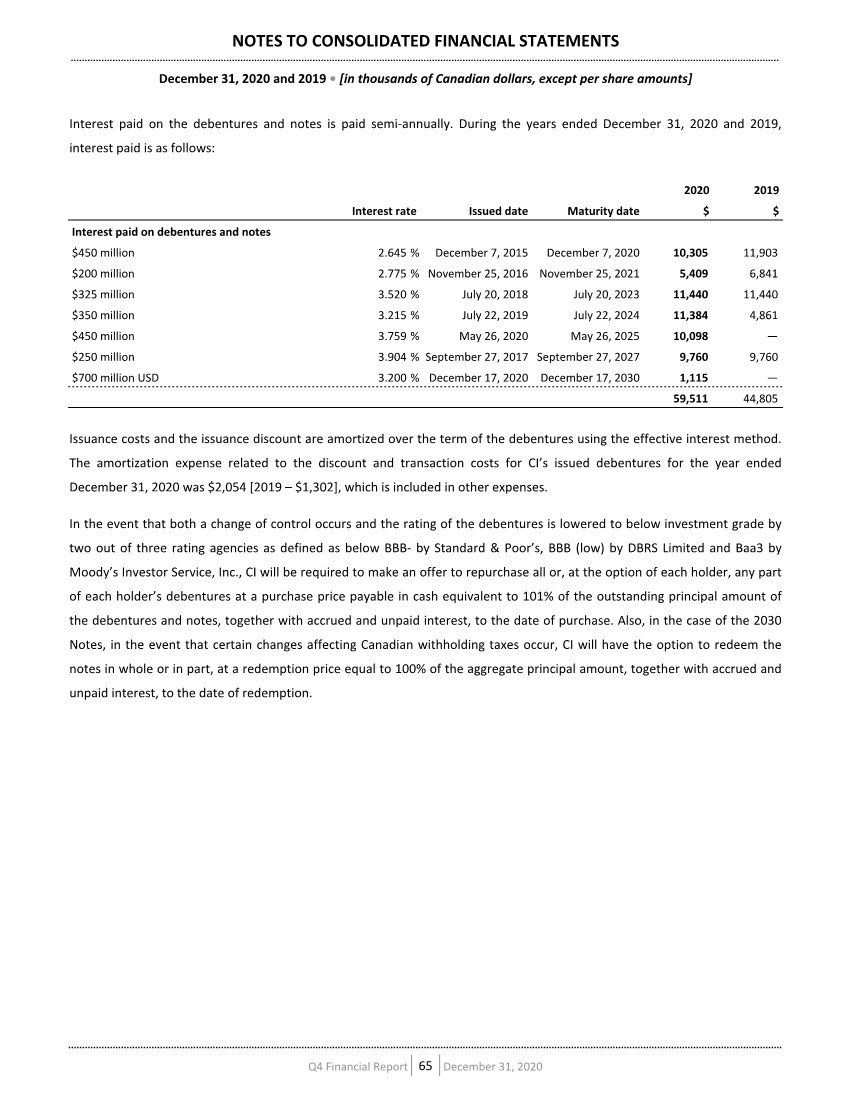
| 8. PROVISIONS AND OTHER FINANCIAL LIABILITIES CI is a party to a number of claims, proceedings and investigations, including legal, regulatory and tax, in the ordinary course of its business. Due to the inherent uncertainty involved in these matters, it is difficult to predict the final outcome or the amount and timing of any outflow related to such matters. Based on current information and consultations with advisors, CI does not expect the outcome of these matters, individually or in aggregate, to have a material adverse effect on its financial position or on its ability to continue normal business operations. CI has made provisions based on current information and the probable resolution of such claims, proceedings and investigations, as well as severance and amounts payable in connection with business acquisitions. The movement in provisions and other financial liabilities during the years ended December 31, are as follows: Provisions Acquisition liabilities Provisions Acquisition liabilities 2020 2020 2019 2019 $ $ $ $ Provisions and other financial liabilities, beginning of year 25,563 7,573 23,330 11,438 Additions 56,277 334,616 35,214 — Amounts used (34,869) (701) (32,639) (3,220) Amounts reversed (790) — (342) — Translation — (4,117) — (645) Provisions and other financial liabilities, end of year 46,181 337,371 25,563 7,573 Current portion of provisions and other financial liabilities 45,298 230,412 12,484 2,159 ACQUISITION RELATED LIABILITIES In connection with the 2020 acquisitions [Note 3], are amounts payable for contingent consideration of $131,122, deferred consideration of $96,855 and a put option payable of $99,025, payable in cash and shares, including foreign exchange translation adjustments since the date of acquisition. Included in provisions and other financial liabilities as at December 31, 2020, is a payable for the fair value of the put option granted to minority interest shareholders for the acquisition of GSFM of $10,369, including foreign exchange translation adjustments [2019 – $ 7,573]. During 2020, there were no GSFM shareholders who exercised their put to CI [2019 - 50 thousand shares for Canadian cash value of $2,667]. LITIGATION AND RESTRUCTURING CI is a defendant to certain lawsuits of which two are class action lawsuits related to events and transactions that gave rise to a settlement agreement with the Ontario Securities Commission [“OSC”] in 2004. Although CI continues to believe that this settlement fully compensated investors affected by frequent trading activity, a provision has been made based on the probable resolution of these claims and related expenses. CI maintains insurance policies that may provide coverage against certain claims. Amounts receivable under these policies are NOTES TO CONSOLIDATED FINANCIAL STATEMENTS December 31, 2020 and 2019 • [in thousands of Canadian dollars, except per share amounts] Q4 Financial Report 66 December 31, 2020 |
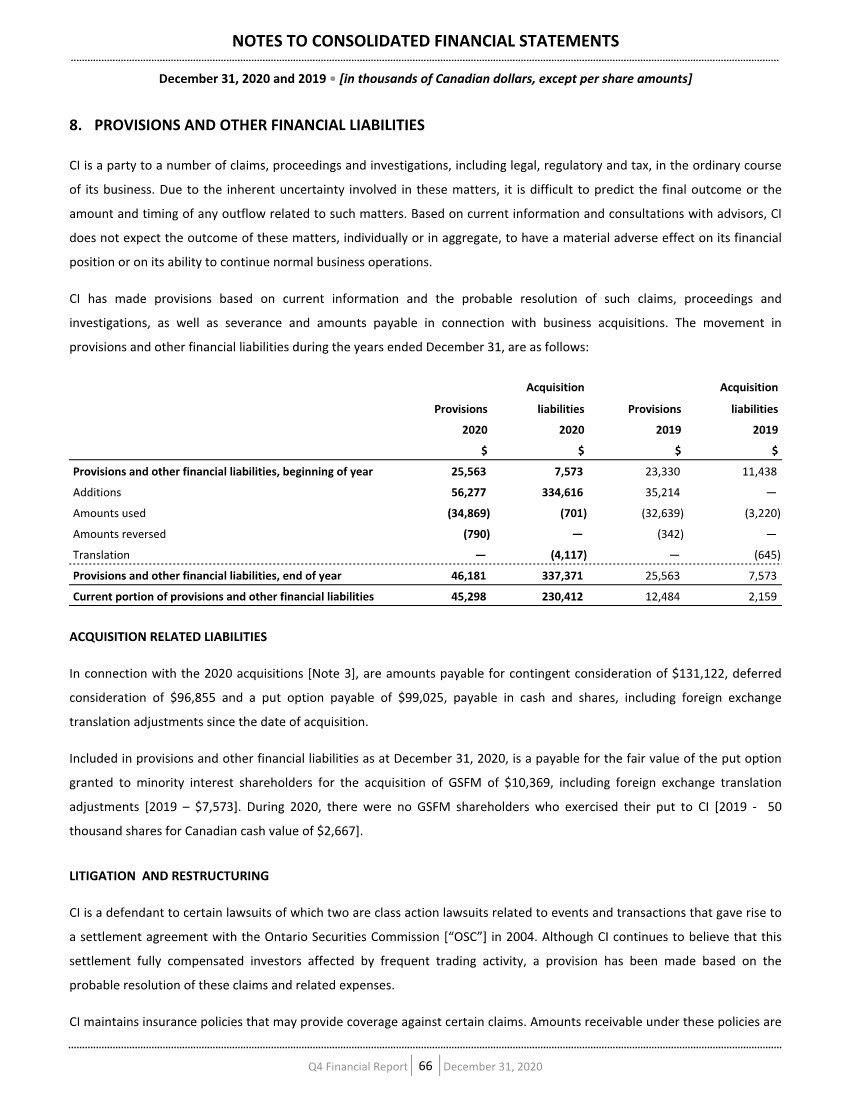
| not accrued for unless the realization of income is virtually certain. During the years ended December 31, 2020 and 2019, no insurance proceeds were received, related to the settlement of legal claims. During the year ended December 31, 2020, CI recorded provisions of $56,277 for legal and severance [2019 - $35,214 for legal, severance and the write-down of software intangibles that were retired]. As at December 31, 2020, a provision of $46,181 remains [2019 - $12,484]. 9. LEASES The following shows the carrying amounts of CI’s right-of-use assets and lease liabilities, and the movements during the year ended December 31, 2020: Right-of-use assets Property leases Equipment leases Total Lease liabilities $ $ $ $ As at January 1, 2020 43,711 1,171 44,882 72,519 Additions & modifications 15,942 183 16,125 16,492 Depreciation expense (9,005) (843) (9,848) — Interest expense — — — 2,905 Payments — — — (15,073) Translation (539) — (539) (610) As at December 31, 2020 50,109 511 50,620 76,233 During the year ended December 31, 2020, CI recognized rent expenses from short-term leases of $355, leases of low-value assets of $29 and variable lease payments of $12,724 [2019 – expenses of $886, $155 and $12,869, respectively]. Included in other income for the year ended December 31, 2020, is finance income of $89 received from sub-leasing right-of- use assets [2019 – $109]. NOTES TO CONSOLIDATED FINANCIAL STATEMENTS December 31, 2020 and 2019 • [in thousands of Canadian dollars, except per share amounts] Q4 Financial Report 67 December 31, 2020 |
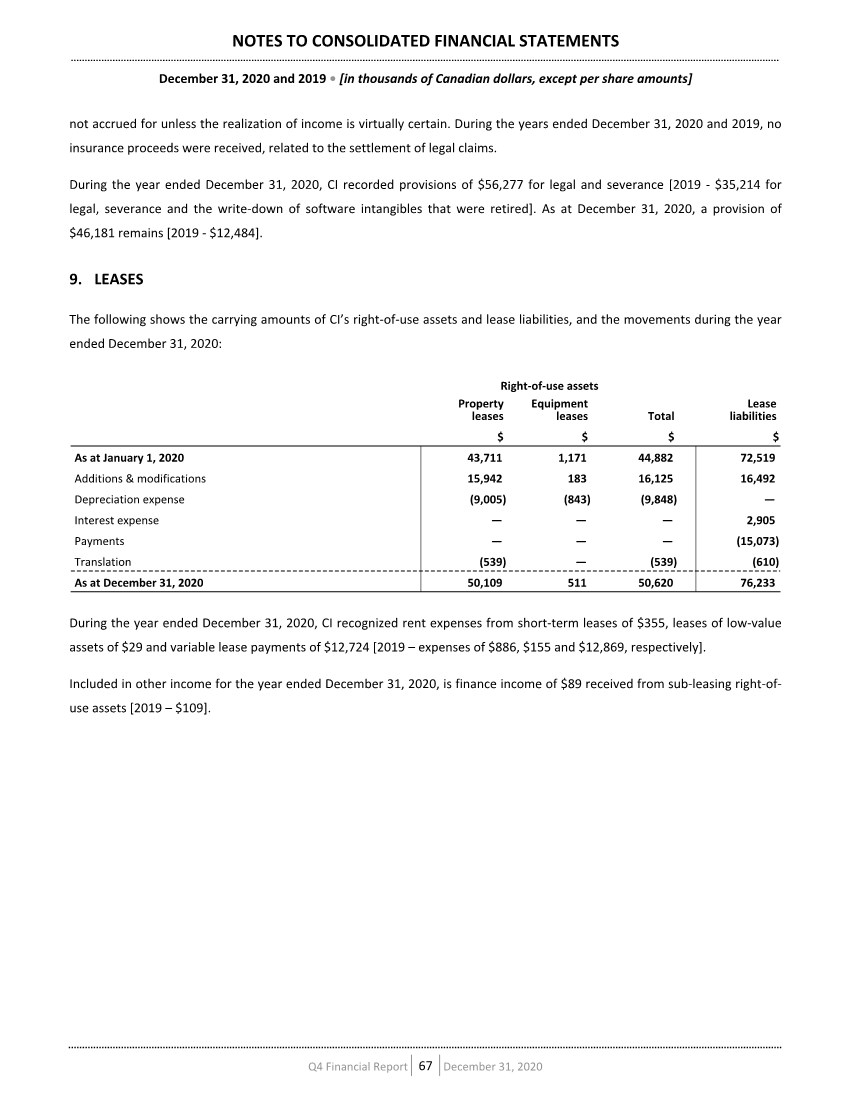
| 10. SHARE CAPITAL A summary of the changes to CI’s share capital for the years ended December 31 is as follows: [A] AUTHORIZED AND ISSUED Number of shares Stated value [in thousands] $ Authorized An unlimited number of common shares of CI Issued Common shares, balance, December 31, 2018 243,721 2,125,130 Issuance of share capital on vesting of restricted share units 711 12,751 Share repurchases, net of tax (22,640) (193,570) Common shares, balance, December 31, 2019 221,792 1,944,311 Issuance for acquisition of subsidiary, net of issuance costs 2,034 35,434 Issuance of share capital on vesting of restricted share units 522 8,488 Share repurchases, net of tax (13,990) (120,236) Common shares, balance, December 31, 2020 210,358 1,867,997 During the year ended December 31, 2020, 13,615 thousand shares [2019 – 21,950 thousand shares] were repurchased under a normal course issuer bid at an average cost of $18.32 per share for total consideration of $249,427 [2019 – $19.78 per share for total consideration of $434,236]. Deficit was increased by $130,216 during the year ended December 31, 2020 [2019 – $243,211] for the cost of the shares repurchased in excess of their stated value. During the year ended December 31, 2020, 375 thousand shares [2019 – 690 thousand shares] were repurchased for CI’s restricted share unit plan at an average cost of $22.70 per share for total consideration of $8,512 [$6,256 after tax] [2019 – $18.92 per share for total consideration of $13,057 [$9,597 net of tax]]. Deficit was increased by $5,231 during the year ended December 31, 2020 [2019 – $7,052] for the cost of the shares repurchased in excess of their stated value. [B] EMPLOYEE INCENTIVE SHARE OPTION PLAN CI has an employee incentive share option plan [the “Share Option Plan”], as amended and restated, for the executives and key employees of CI. During the year, CI granted nil thousand options [2019 – 743 thousand options] to employees. The fair value method of accounting is used for the valuation of the 2020 and 2019 share option grants. Compensation expense is recognized over the vesting period, assuming an estimated average forfeiture rate of nil for the year [2019 – 13%], with an offset to contributed surplus. When exercised, amounts originally recorded against contributed surplus as well as any consideration paid by the option holder are credited to share capital. The fair value of the 2020 and 2019 option grants was estimated using the Black- Scholes option pricing model with the following weighted-average assumptions: NOTES TO CONSOLIDATED FINANCIAL STATEMENTS December 31, 2020 and 2019 • [in thousands of Canadian dollars, except per share amounts] Q4 Financial Report 68 December 31, 2020 |
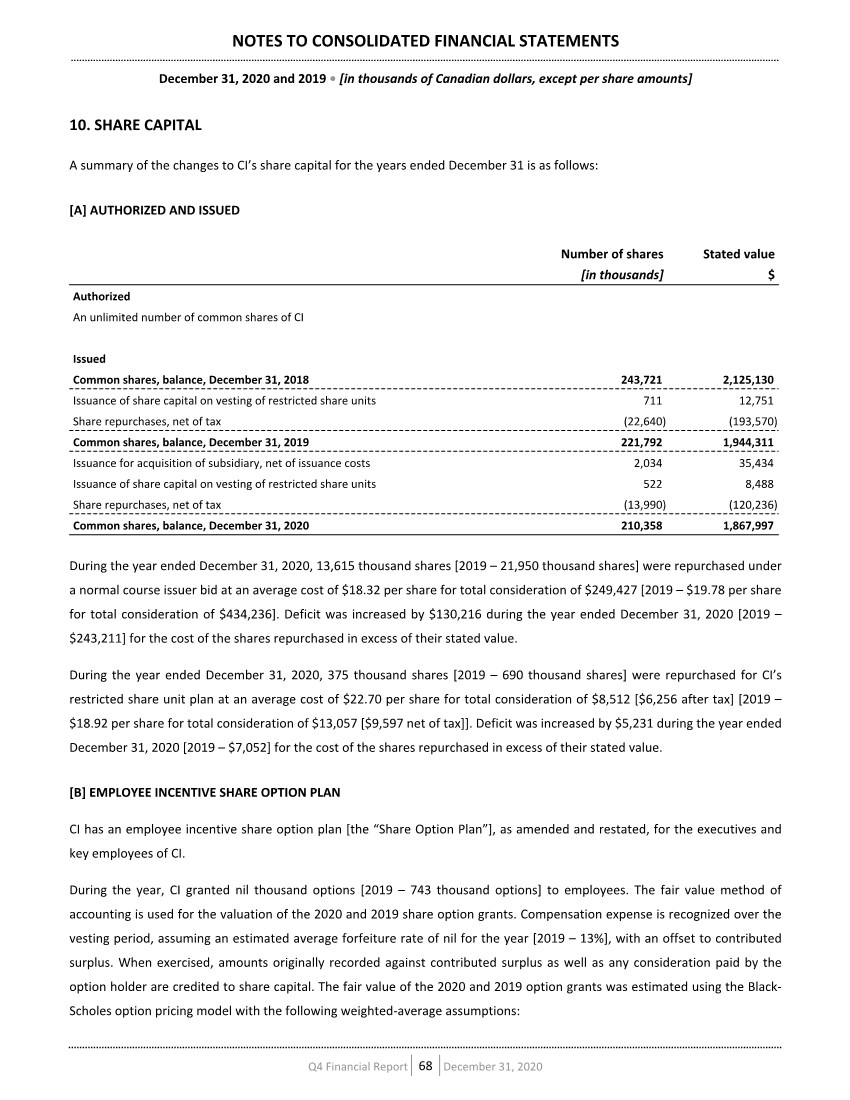
| Year of grant 2019 2019 # of options granted [in thousands] 213 530 Vesting terms At end of year 5 1/3 at end of years 3, 4 and 5 Dividend yield 3.792 % 3.792 % Expected volatility (*) 17 % 17 % Risk-free interest rate 2.238% 2.182% - 2.238% Expected life [years] 6.8 5.2 - 6.8 Forfeiture rate 0 % 13 % Fair value per stock option $2.48 $2.23 - $2.48 Exercise price $18.99 $18.99 (*) Based on historical volatility of CI’s share price The maximum number of shares that may be issued under the Share Option Plan is 14,000 thousand shares. As at December 31, 2020, there are 2,606 thousand shares [2019 – 5,584 thousand shares] reserved for issuance on exercise of share options. These options vest over periods of up to five years, may be exercised at prices ranging from $18.99 to $28.67 per share and expire at dates up to 2029. A summary of the changes in the Share Option Plan is as follows: Number of options Weighted average exercise price [in thousands] $ Options outstanding, December 31, 2018 6,958 32.18 Options exercisable, December 31, 2018 5,789 32.97 Options granted 743 18.99 Options cancelled (2,117) 34.28 Options outstanding, December 31, 2019 5,584 29.63 Options exercisable, December 31, 2019 4,758 31.26 Options cancelled (2,978) 34.28 Options outstanding, December 31, 2020 2,606 26.38 Options exercisable, December 31, 2020 2,020 28.44 (*) Weighted-average share price of options exercised was nil during the year ended December 31, 2020 [2019 - nil] The equity-based compensation expense under the Share Option Plan for the year ended December 31, 2020 of $210 [2019 – $513] has been included in selling, general and administrative expenses. NOTES TO CONSOLIDATED FINANCIAL STATEMENTS December 31, 2020 and 2019 • [in thousands of Canadian dollars, except per share amounts] Q4 Financial Report 69 December 31, 2020 |
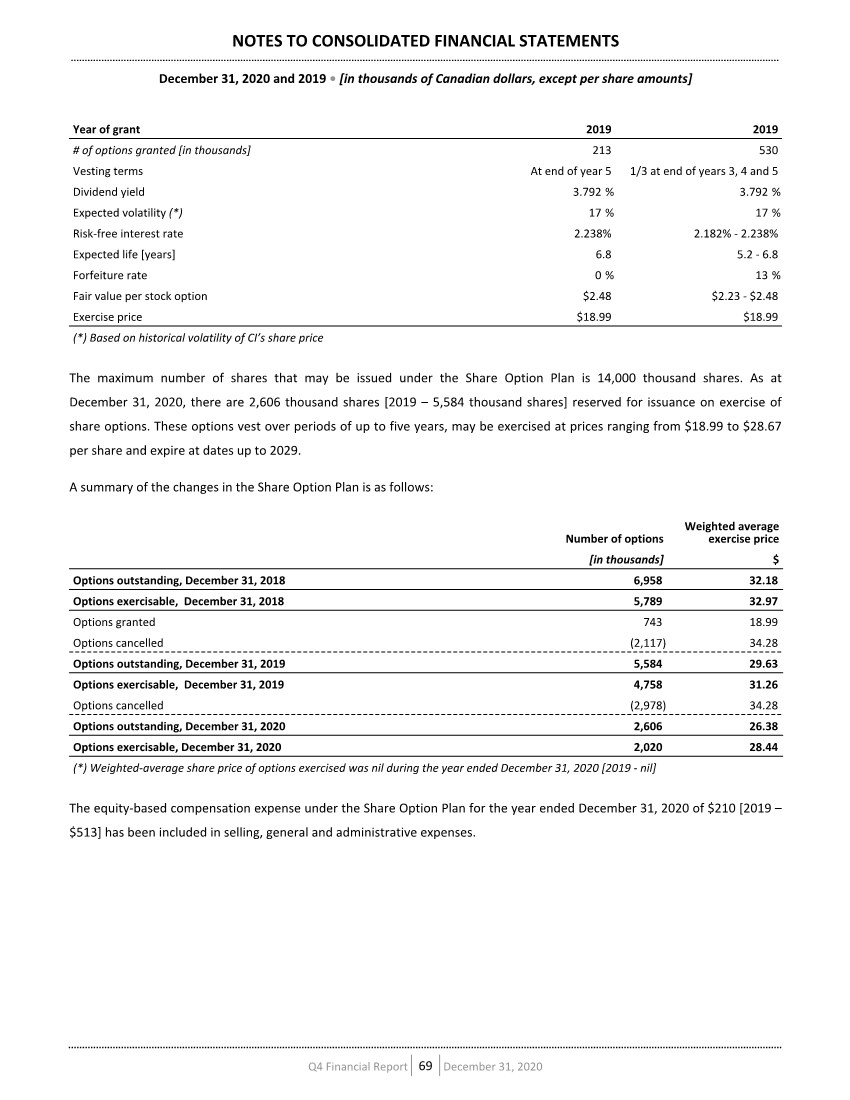
| Options outstanding and exercisable as at December 31, 2020 are as follows: Exercise price Number of options outstanding Weighted average remaining contractual life Number of options exercisable $ [in thousands] [years] [in thousands] 18.99 569 8.2 — 27.44 331 1.2 331 28.63 1,655 0.1 1,655 28.67 51 2.2 34 18.99 to 28.67 2,606 2.0 2,020 [C] RESTRICTED SHARE UNITS CI has an employee restricted share unit plan [the “RSU Plan”] for senior executives and other key employees. Compensation expense is recognized and recorded as contributed surplus based upon the market value of the restricted share units [“RSUs”] at the grant date. Forfeitures of RSUs reduce compensation expense to the extent contributed surplus was previously recorded for such awards. On vesting of RSUs, share capital is credited for the amounts initially recorded as contributed surplus to reflect the issuance of share capital. During the year ended December 31, 2020, CI granted 386 thousand RSUs [2019 - 736 thousand RSUs], including 36 thousand RSUs granted, to reflect dividends declared on the common shares [2019 - 39 thousand RSUs]. Also during the year ended December 31, 2020, 521 thousand RSUs were exercised, and 18 thousand RSUs were forfeited [2019 - 711 thousand RSUs exercised, and 32 thousand RSUs forfeited]. During the year ended December 31, 2020, CI credited contributed surplus for $10,447, related to compensation expense recognized for the RSUs [2019 - $14,188]. As at December 31, 2020, 504 thousand RSUs are outstanding [2019 - 657 thousand RSUs]. CI uses a Trust to hold CI’s common shares, to fulfill obligations to employees arising from the RSU Plan. The common shares held by the Trust are not considered to be outstanding for the purposes of basic and diluted earnings per share calculations. [D] DEFERRED SHARE UNITS The deferred share unit plan [the “DSU Plan”] was established in March 2017, whereby directors may elect to receive all or a portion of their quarterly compensation in either cash or deferred share units [“DSUs”]. The DSUs fully vest on the grant date and an expense is recorded based upon the market value of the DSUs at the grant date with an offset included in accounts payable and accrued liabilities. At the end of each period, the change in the fair value of the DSUs is recorded as an expense with an offset recorded to the liability. DSUs can only be redeemed for cash once the holder ceases to be a director of CI. During the year ended December 31, 2020, 11 thousand DSUs were granted, and nil DSUs were exercised, [2019 - 6 thousand DSUs, and nil exercised]. An expense of $51 was recorded during the year ended December 31, 2020, [2019 - $195]. As at December 31, 2020, included in accounts payable and accrued liabilities, is an accrual of $515 for amounts to be paid under the DSU Plan [2019 - $464]. NOTES TO CONSOLIDATED FINANCIAL STATEMENTS December 31, 2020 and 2019 • [in thousands of Canadian dollars, except per share amounts] Q4 Financial Report 70 December 31, 2020 |
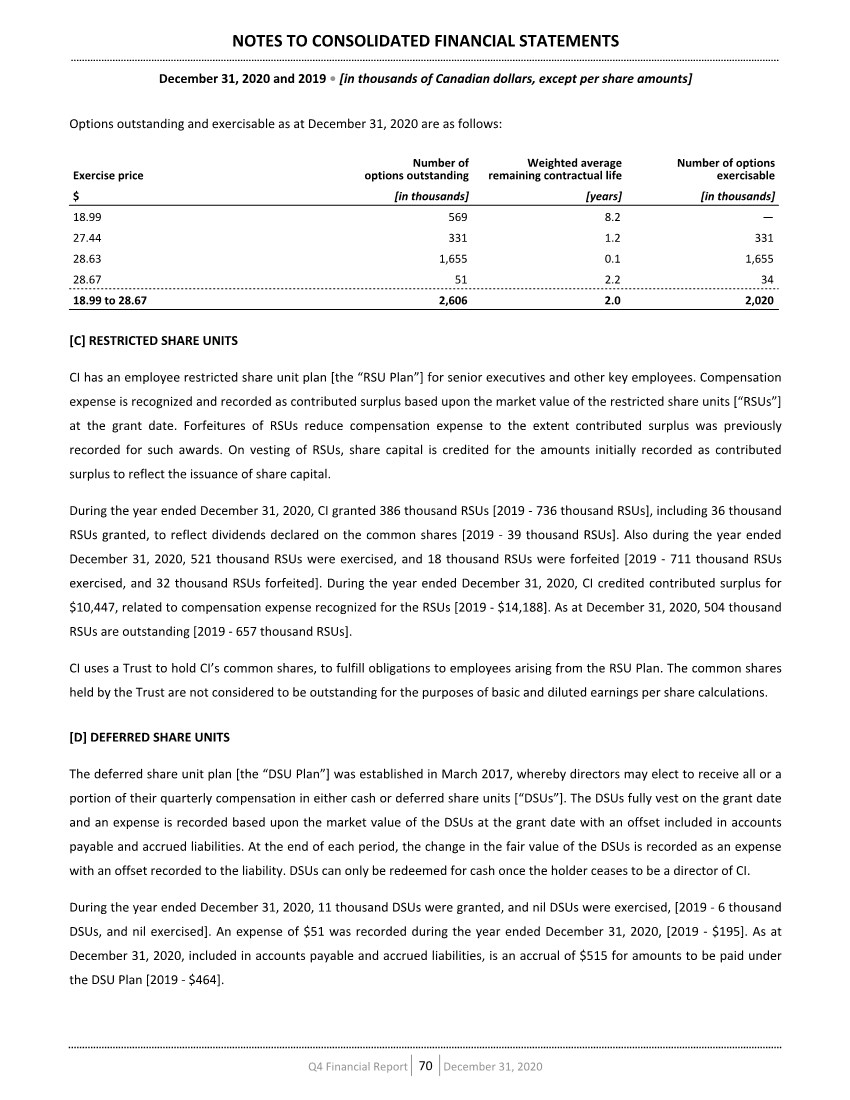
| [E] BASIC AND DILUTED EARNINGS PER SHARE The following table presents the calculation of basic and diluted earnings per common share for the years ended December 31: [in thousands] 2020 2019 Numerator: Net income attributable to shareholders of the Company basic and diluted $475,978 $538,396 Denominator: Weighted average number of common shares - basic 214,092 234,273 Weighted average effect of dilutive stock options and RSU awards (*) 1,527 976 Weighted average number of common shares - diluted 215,619 235,249 Net earnings per common share attributable to shareholders Basic $2.22 $2.30 Diluted $2.21 $2.29 (*) The determination of the weighted average number of common shares - diluted excludes 2,606 thousand shares related to stock options that were anti-dilutive for the year ended December 31, 2020 [2019 - 5,584 thousand shares]. [F] MAXIMUM SHARE DILUTION The following table presents the maximum number of shares that would be outstanding if all the outstanding options were exercised and if all RSU awards vested as at January 31, 2021: [in thousands] Shares outstanding at January 31, 2021 208,330 RSU awards 491 Options to purchase shares 2,587 211,408 NOTES TO CONSOLIDATED FINANCIAL STATEMENTS December 31, 2020 and 2019 • [in thousands of Canadian dollars, except per share amounts] Q4 Financial Report 71 December 31, 2020 |
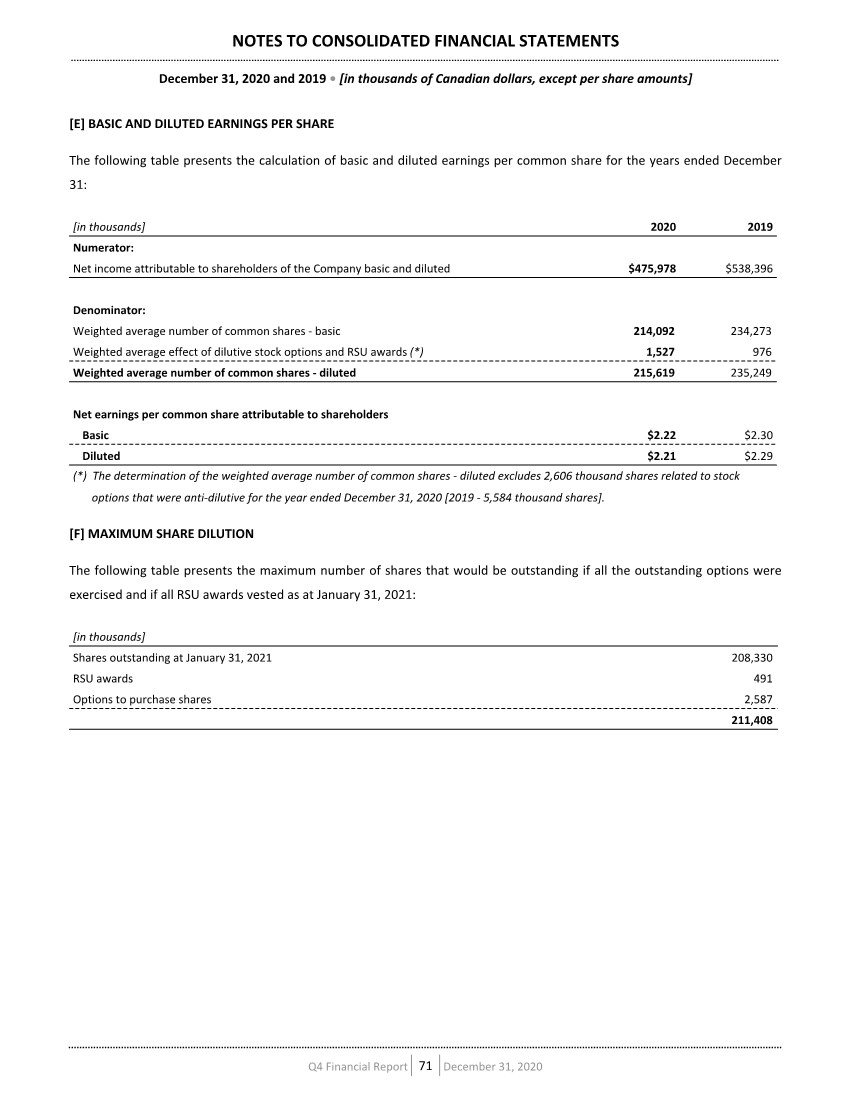
| 11. DIVIDENDS The following dividends were paid by CI during the year ended December 31, 2020: Record date Payment date Cash dividend per share Total dividend amount $ $ December 31, 2019 January 15, 2020 0.18 39,971 March 31, 2020 April 15, 2020 0.18 38,995 June 30, 2020 July 15, 2020 0.18 38,574 September 30, 2020 October 15, 2020 0.18 37,773 Paid during the year ended December 31, 2020 155,313 The following dividends were declared but not paid as at December 31, 2020: Record date Payment date Cash dividend per share Total dividend amount $ $ December 31, 2020 January 15, 2021 0.18 37,649 March 31, 2021 April 15, 2021 0.18 37,648 Declared and accrued as at December 31, 2020 75,297 The following dividends were paid by CI during the year ended December 31, 2019: Record date Payment date Cash dividend per share Total dividend amount $ $ December 31, 2018 January 15, 2019 0.18 43,899 March 31, 2019 April 15, 2019 0.18 43,285 June 30, 2019 July 15, 2019 0.18 42,461 September 30, 2019 October 15, 2019 0.18 41,105 Paid during the year ended December 31, 2019 170,750 The following dividends were declared but not paid as at December 31, 2019: Record date Payment date Cash dividend per share Total dividend amount $ $ December 31, 2019 January 15, 2020 0.18 39,923 March 31, 2020 April 15, 2020 0.18 39,922 Declared and accrued as at December 31, 2019 79,845 NOTES TO CONSOLIDATED FINANCIAL STATEMENTS December 31, 2020 and 2019 • [in thousands of Canadian dollars, except per share amounts] Q4 Financial Report 72 December 31, 2020 |
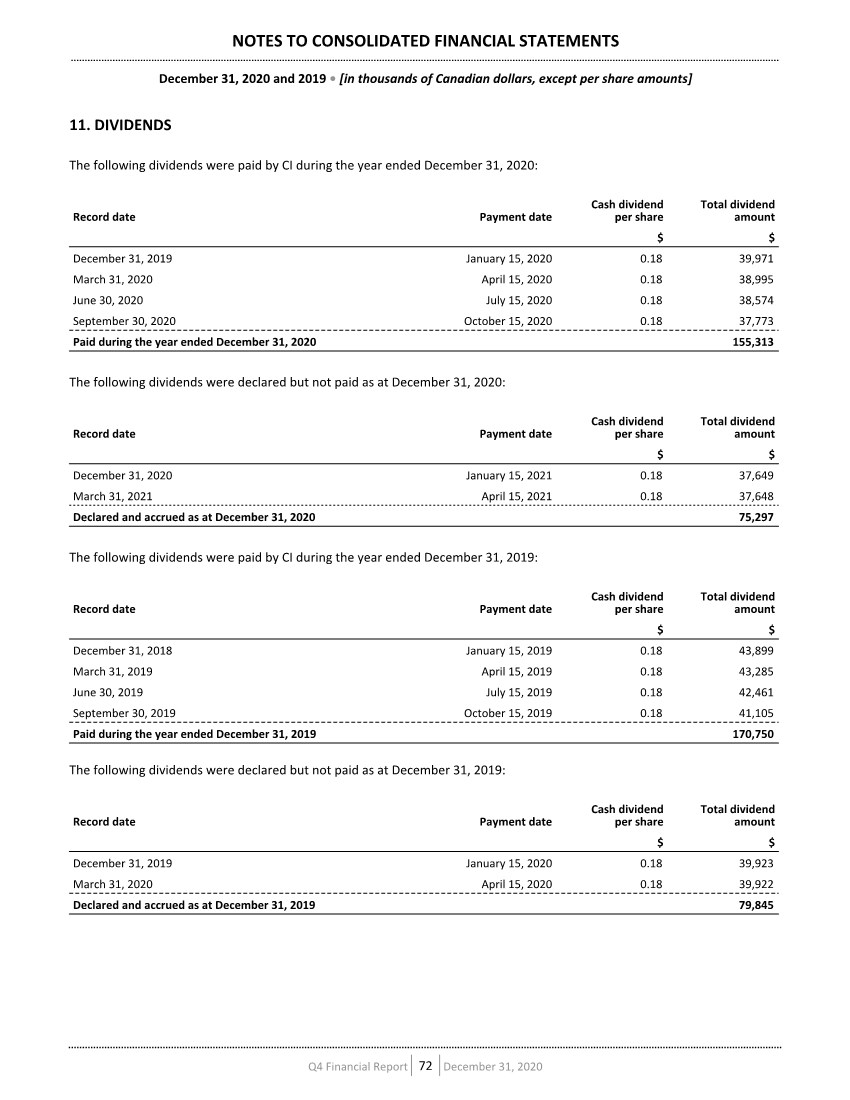
| 12. INCOME TAXES The following are the major components of income tax expense for the years ended December 31: 2020 2019 $ $ Consolidated Statements of Income Current income tax expense Based on taxable income of the current year 171,637 189,438 Adjustments in respect of prior years (2,714) (607) 168,923 188,831 Deferred income tax expense Origination and reversal of temporary differences (net) (1,722) 450 (1,722) 450 Income tax expense reported in the consolidated statements of income 167,201 189,281 The following is a reconciliation between CI’s statutory and effective income tax rates for the years ended December 31: 2020 2019 % % Combined Canadian federal and provincial income tax rate 26.5 26.5 Increase (decrease) in income taxes resulting from Recovery of prior years’ provisions for settled tax items (0.5) (0.6) Other, net — 0.1 Income tax expense reported in the consolidated statements of income and comprehensive income 26.0 26.0 NOTES TO CONSOLIDATED FINANCIAL STATEMENTS December 31, 2020 and 2019 • [in thousands of Canadian dollars, except per share amounts] Q4 Financial Report 73 December 31, 2020 |
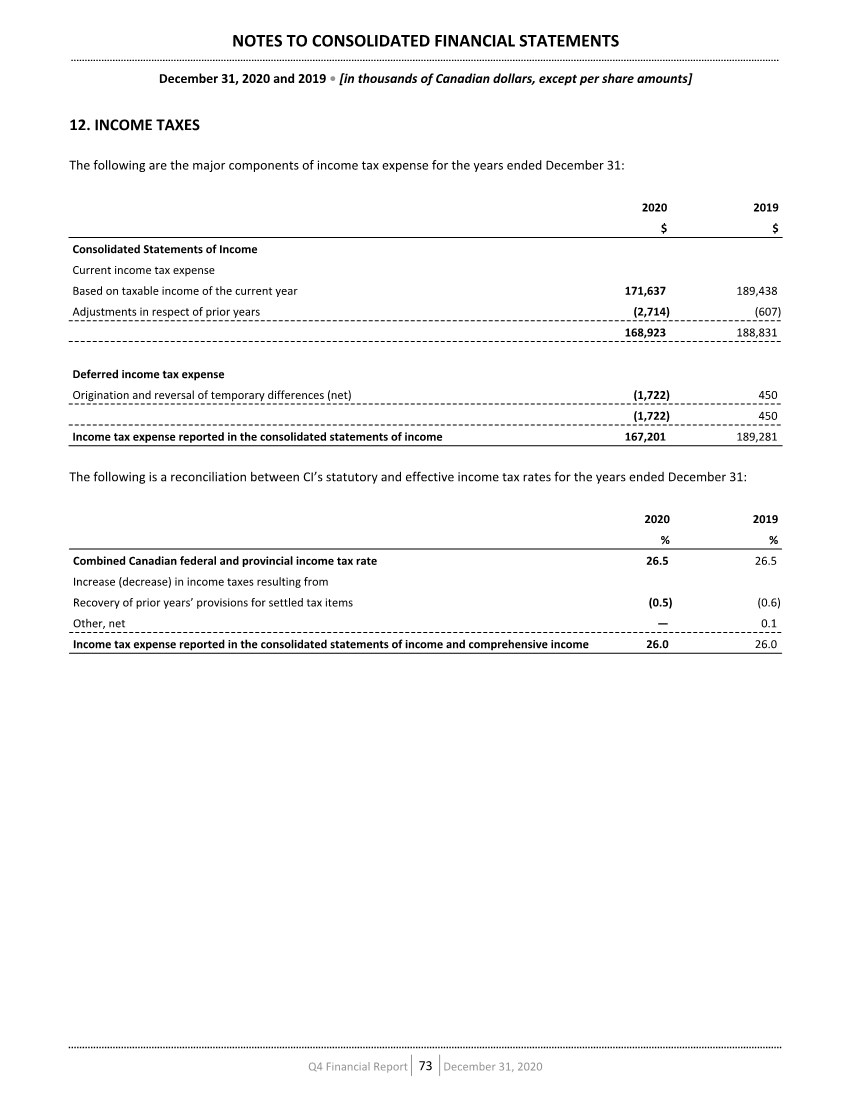
| Deferred income taxes reflect the net tax effects of temporary differences between the carrying amounts of assets and liabilities for financial reporting purposes and the amounts used for income tax purposes. Significant components of CI’s deferred income tax assets and liabilities are as follows at December 31, 2020: December 31, 2019 Recognized in net income Business acquisition [note 3] Recognized in equity and FX December 31, 2020 $ $ $ $ $ Net deferred income tax (assets) liabilities Fund contracts 482,696 (1,197) 4,188 1,661 487,348 Right-of-use assets 11,866 1,038 — — 12,904 Equity-based compensation (12,950) (1,982) — 532 (14,400) Non-capital loss carryforwards (5,116) 4,681 (6,906) — (7,341) Provisions and other financial liabilities (2,690) (4,921) — — (7,611) Lease liabilities (19,163) (246) — — (19,409) Other 10,198 905 41 254 11,398 Net deferred income tax (assets) liabilities 464,841 (1,722) (2,677) 2,447 462,889 Significant components of CI’s deferred income tax assets and liabilities are as follows at December 31, 2019: December 31, 2018 Opening retained earnings adjustments Recognized in net income Business acquisition Recognized in equity and FX December 31, 2019 $ $ $ $ $ $ Net deferred income tax (assets) liabilities Fund contracts 483,776 — (2,425) 1,345 — 482,696 Right-of-use assets — 17,267 (5,401) — — 11,866 Equity-based compensation (12,465) — (785) — 300 (12,950) Non-capital loss carryforwards (1,444) — (912) (2,760) — (5,116) Provision for other liabilities (2,910) — 220 — — (2,690) Lease liabilities — (21,567) 2,404 — — (19,163) Other (874) 635 7,349 4,404 (1,316) 10,198 Net deferred income tax (assets) liabilities 466,083 (3,665) 450 2,989 (1,016) 464,841 NOTES TO CONSOLIDATED FINANCIAL STATEMENTS December 31, 2020 and 2019 • [in thousands of Canadian dollars, except per share amounts] Q4 Financial Report 74 December 31, 2020 |
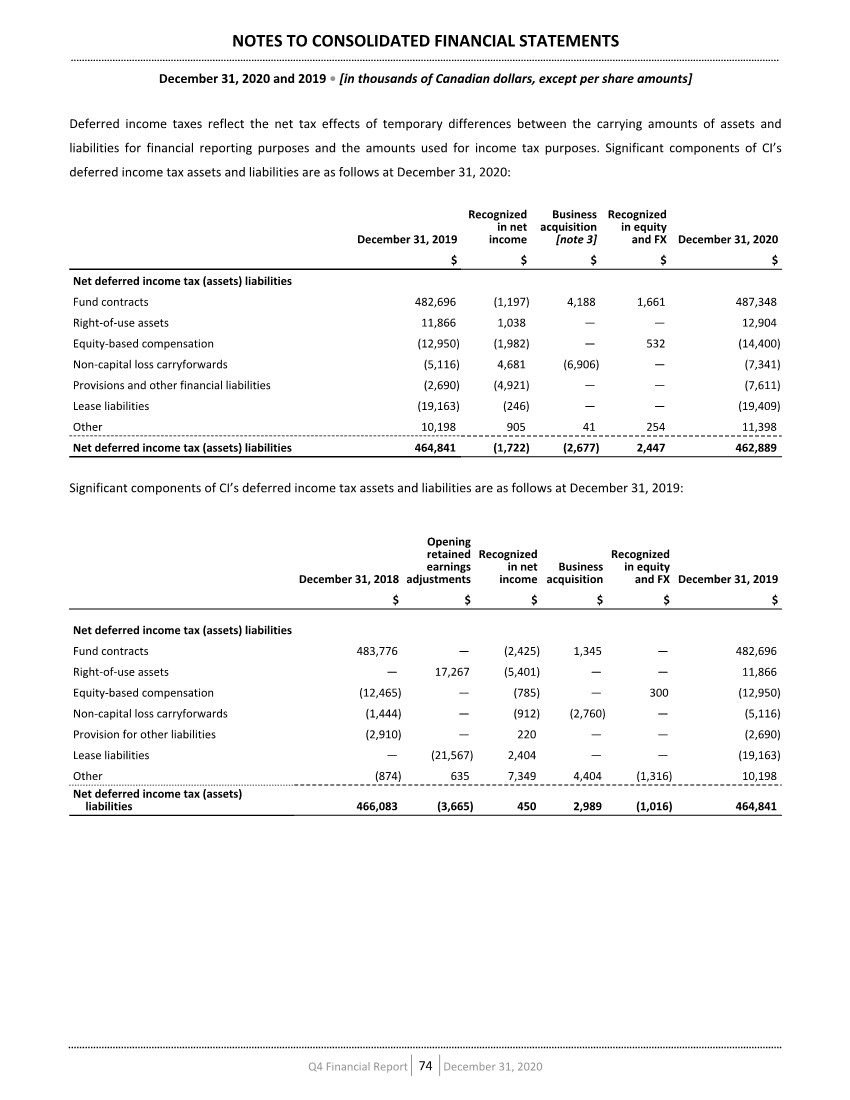
| 13. FINANCIAL INSTRUMENTS The carrying amounts of the financial instruments are presented in the table below and are classified according to the following categories: December 31, 2020 December 31, 2019 $ $ Financial assets Fair value through profit or loss Cash and cash equivalents 483,598 118,360 Investments 133,375 138,412 Other assets 12,210 26,856 Amortized cost Client and trust funds on deposit 973,143 364,964 Accounts receivable 219,074 159,760 Other assets 44,314 39,564 Total financial assets 1,865,714 847,916 Financial liabilities Fair value through profit or loss Provisions and other financial liabilities 240,516 8,650 Amortized cost Accounts payable and accrued liabilities 308,797 242,176 Provisions and other financial liabilities 143,036 24,486 Dividends payable 75,297 79,845 Client and trust funds payable 961,080 368,348 Long-term debt 2,456,116 1,604,494 Total financial liabilities 4,184,842 2,327,999 CI’s investments as at December 31, 2020 and 2019 include CI’s marketable securities which are comprised of seed capital investments in CI’s mutual funds and strategic investments. Mutual fund securities are valued using the net asset value per unit of each fund, which represents the underlying net assets at fair values determined using closing market prices. CI’s mutual fund securities that are valued daily are classified as level 1 in the fair value hierarchy. Mutual fund securities and strategic investments that are valued less frequently are classified as level 2 in the fair value hierarchy. CI’s investments as at December 31, 2020, also include securities owned, at market, consisting of money market and equity securities. Money market and equity securities are valued based on quoted prices and are classified as level 1 in the fair value hierarchy. There have been no transfers between level 1, level 2 and level 3 during the year. NOTES TO CONSOLIDATED FINANCIAL STATEMENTS December 31, 2020 and 2019 • [in thousands of Canadian dollars, except per share amounts] Q4 Financial Report 75 December 31, 2020 |
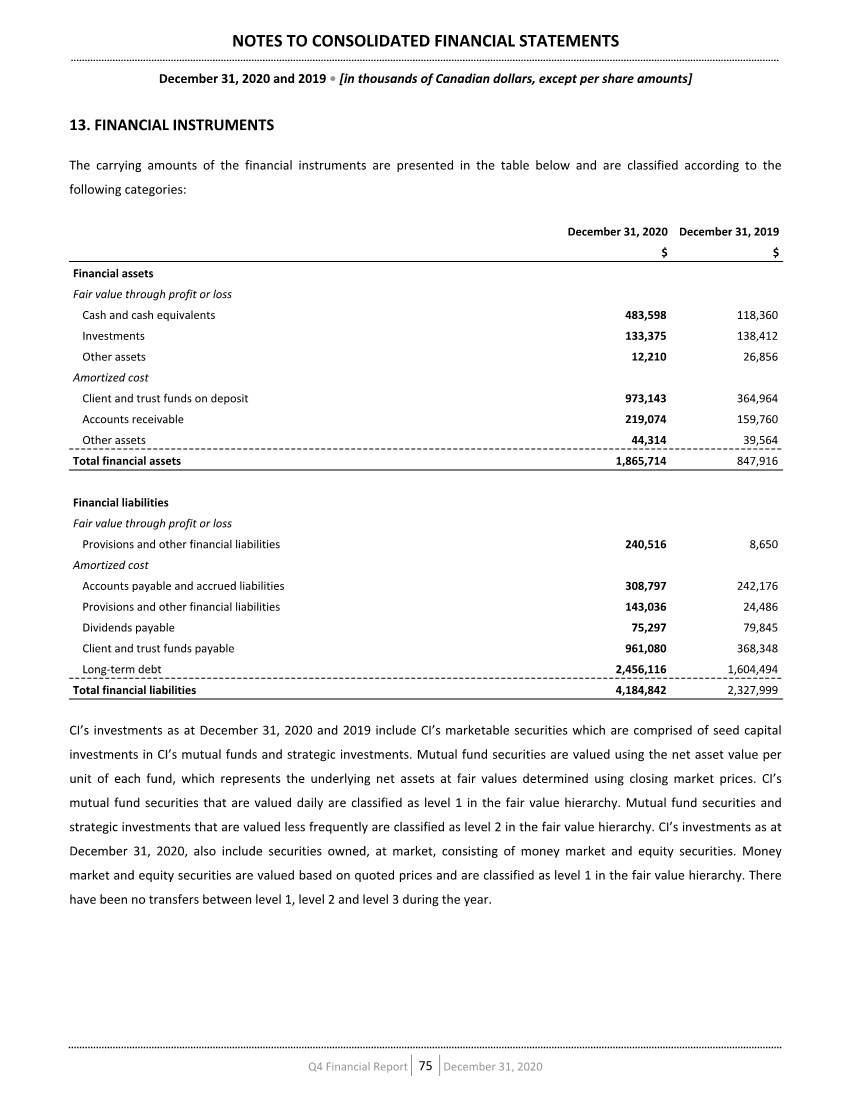
| Investments consist of the following as at December 31, 2020: Total Level 1 Level 2 Level 3 $ $ $ $ Marketable securities 118,126 37,193 77,278 3,655 Securities owned, at market 15,249 15,249 — — Total investments 133,375 52,442 77,278 3,655 Investments consist of the following as at December 31, 2019: Total Level 1 Level 2 Level 3 $ $ $ $ Marketable securities 118,243 40,587 74,003 3,653 Securities owned, at market 20,169 20,169 — — Total investments 138,412 60,756 74,003 3,653 Included in other assets are long-term private equity strategic investments of $12,210 [2019 - $26,856] valued using level 3 inputs. Included in provisions and other financial liabilities, as at December 31, 2020 is put option payable on non-controlling interest of $109,394 [2019 - $7,573] and contingent consideration payable of $131,122 carried at fair value and classified as level 3 in the fair value hierarchy. The fair value of the put option payable and contingent consideration payable was determined using a combination of the discounted cash flow method and Monte-Carlo simulations. Significant unobservable inputs include discount rates in the range of 3% to 16% and volatility of up to 52%. The estimated fair value of the put option payable and contingent consideration payable would increase (decrease) if the discount rate was lower (higher) and volatility was higher (lower). Long-term debt as at December 31, 2020 includes debentures with a fair value of $2,575,740 [ 2019 - $ 1,586,136], as determined by quoted market prices, which have been classified as level 2 in the fair value hierarchy. 14. RISK MANAGEMENT Risk management is an integrated process with independent oversight. Management has developed an enterprise-wide approach to risk management that involves executives in each core business unit and operating area of CI. Using a quantitative and qualitative analysis, risk factors are assessed and procedures are implemented to mitigate the various events that could impact CI’s financial position and results of operations. CI’s financial instruments bear the following financial risks: [A] MARKET RISK Market risk is the risk of a financial loss resulting from adverse changes in underlying market factors, such as interest rates, NOTES TO CONSOLIDATED FINANCIAL STATEMENTS December 31, 2020 and 2019 • [in thousands of Canadian dollars, except per share amounts] Q4 Financial Report 76 December 31, 2020 |
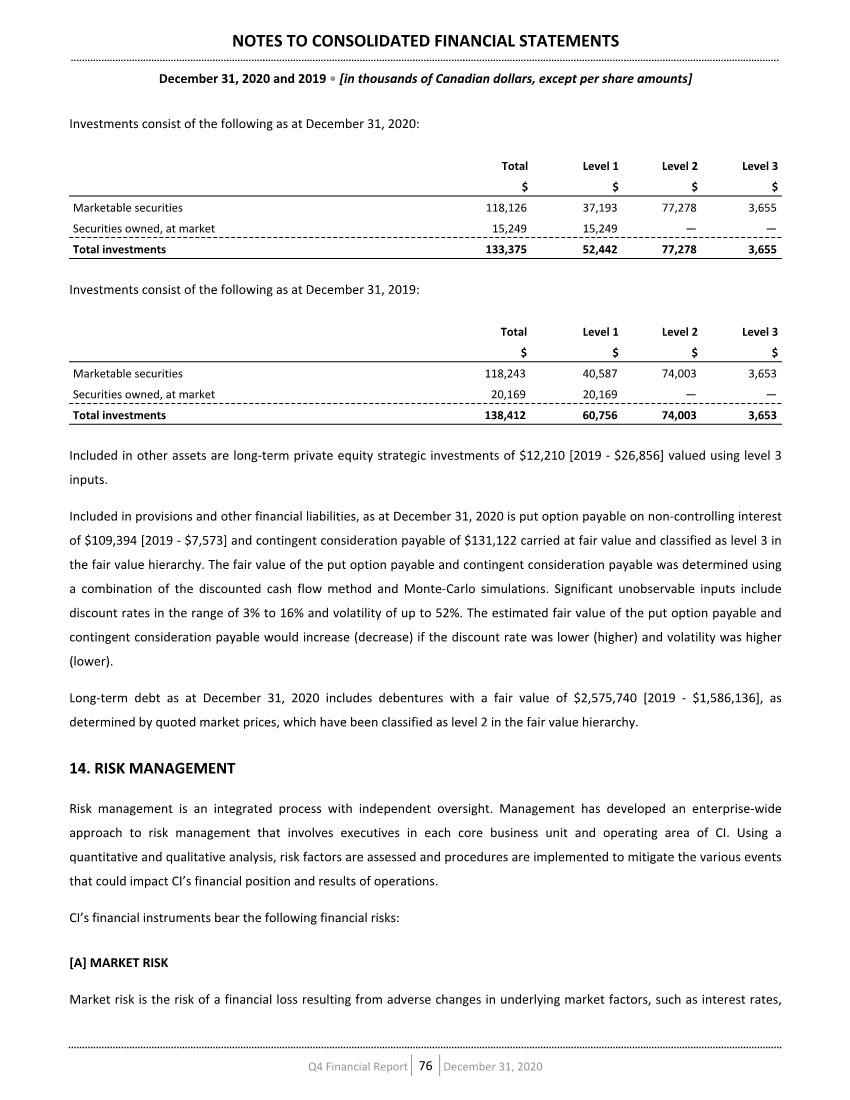
| foreign exchange rates, and equity prices. The corporate finance group reviews the exposure to interest rate risk, foreign exchange risk and price risk by identifying, monitoring and reporting potential market risks to the Chief Financial Officer. A description of each component of market risk is described below: • Interest rate risk is the risk of loss due to the volatility of interest rates. • Foreign exchange risk is the risk of loss due to volatility of foreign exchange rates. • Price risk is the risk of loss due to changes in prices and volatility of financial instruments. CI’s financial performance is indirectly exposed to market risk. Any decline in financial markets or lack of sustained growth in such markets may result in a corresponding decline in the performance and may adversely affect CI’s assets under management and financial results. (i) Interest rate risk Interest rate risk arises from the possibility that changes in interest rates will affect the value of financial instruments. Fluctuations in interest rates have a direct impact on the interest payments CI makes on its long-term debt. Debt outstanding on CI’s credit facility of nil [2019 – $35,000] is borrowed at a floating interest rate. In 2017, CI entered into an interest rate swap agreement with a Canadian chartered bank to swap the semi-annual fixed rate payments on the 2021 Debentures $200,000 principal amount for floating rate payments. Based on the amount borrowed under the credit facility and the 2021 Debentures as at December 31, 2020, each 0.50% increase or decrease in interest rates would result in annual interest expense increasing or decreasing by $1,000 [2019 – $1,175], respectively. (ii) Foreign exchange risk CI is exposed to foreign exchange risk primarily from its investment in foreign subsidiaries operating in the United States, Australia and Hong Kong and from long-term debt denominated in U.S. dollars. The following table provides the impact on net income and other comprehensive income [“OCI”] of a 10% change in the value of foreign currencies with respect to CI’s net financial assets as at December 31, 2020: 10% strengthening of foreign exchange rate on net income 10% strengthening of foreign exchange rate on OCI 10% weakening of foreign exchange rate on net income 10% weakening of foreign exchange rate on OCI United States dollar (75,123) 1,511 75,123 (1,511) Australian dollar 389 761 (389) (761) Hong Kong dollar 127 — (127) — NOTES TO CONSOLIDATED FINANCIAL STATEMENTS December 31, 2020 and 2019 • [in thousands of Canadian dollars, except per share amounts] Q4 Financial Report 77 December 31, 2020 |
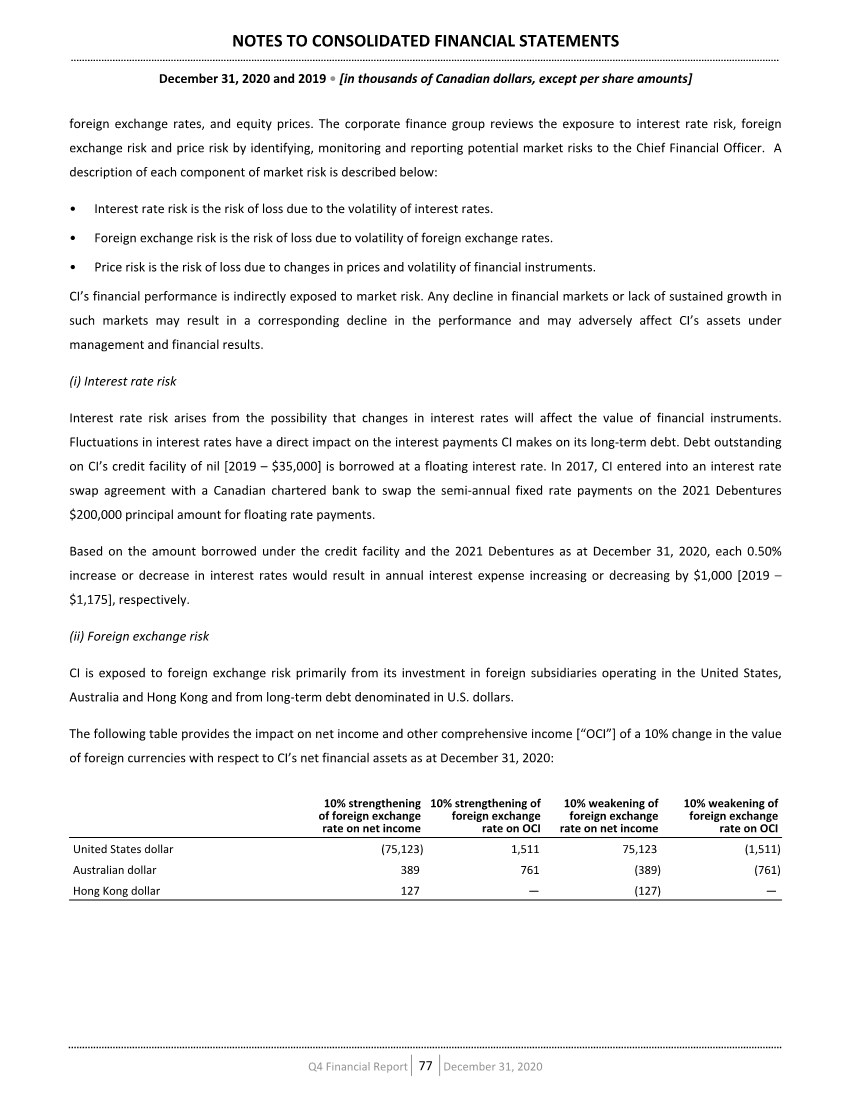
| The following table provides the impact on net income and OCI of a 10% change in the value of foreign currencies with respect to CI’s net financial assets as at December 31, 2019: 10% strengthening of foreign exchange rate on net income 10% strengthening of foreign exchange rate on OCI 10% weakening of foreign exchange rate on net income 10% weakening of foreign exchange rate on OCI United States dollar 12,489 — (12,489) — Australian dollar (220) 552 220 (552) Hong Kong dollar 106 — (106) — [iii] Price risk CI incurs price risk through its investments of $133,375 [2019 – $138,412]. Based on the carrying amount of these assets, an increase or decrease in prices by 10% would result in estimated gains or losses of $13,337 [2019 - $13,841], respectively. [B] LIQUIDITY RISK Liquidity risk arises from the possibility that CI will encounter difficulties in meeting its financial obligations as they fall due. CI manages its liquidity risk through a combination of cash received from operations as well as borrowings under its revolving credit facility. Liquidity is monitored through a daily cash management process that includes the projection of cash flows to ensure CI meets its funding obligations. CI’s liabilities have contractual maturities, excluding interest payments, as follows: Total 2021 2022 2023 2024 2025 2027 2030 $ $ $ $ $ $ $ $ Accounts payable and accrued liabilities 308,797 308,797 — — — — — — Dividends payable 75,297 75,297 — — — — — — Client and trust funds payable 961,080 961,080 — — — — — — Long-term debt 2,466,027 200,000 — 325,000 350,000 450,000 250,000 891,027 Deferred consideration 96,855 96,855 — — — — — — Contingent consideration 131,122 29,695 25,023 23,829 52,575 — — — Put option 109,394 103,862 2,449 — 1,432 — 1,651 — Total 4,148,572 1,775,586 27,472 348,829 404,007 450,000 251,651 891,027 [C] CREDIT RISK Credit risk is the risk of loss associated with the inability of a third party to fulfill its payment obligations. CI is exposed to the risk that third parties that owe it money, securities or other assets will not perform their obligations. Expected credit losses associated with CI’s financial assets are insignificant. As at December 31, 2020, financial assets of $1,248,740 [2019 – $711,359], represented by client and trust funds on deposit of $973,143 [ 2019 – $ 364,964], accounts receivable of $219,074 [ 2019 – $ 159,760] and other assets of $56,523 [ 2019 – $66,420], were exposed to credit risk. CI does not have a significant exposure to any individual counterparty. Credit risk is NOTES TO CONSOLIDATED FINANCIAL STATEMENTS December 31, 2020 and 2019 • [in thousands of Canadian dollars, except per share amounts] Q4 Financial Report 78 December 31, 2020 |
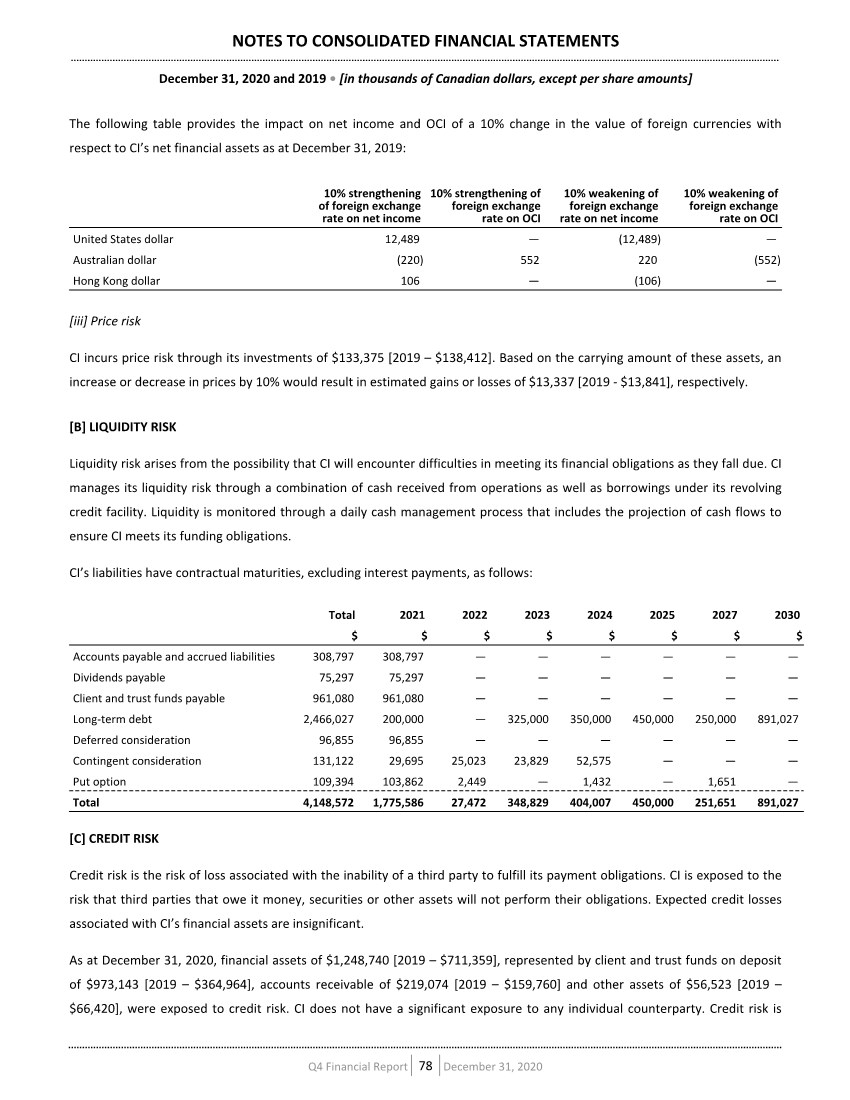
| mitigated by regularly monitoring the credit performance of each individual counterparty and holding collateral, where appropriate. Client and trust funds on deposit consist mainly of cash deposits or unsettled trade receivables. CI may also extend amounts to clients on a margin basis for security purchases. Margin loans are due on demand and are collateralized by the financial instruments in the client’s account. CI faces a risk of financial loss in the event a client fails to meet a margin call if market prices for securities held as collateral decline and if CI is unable to recover sufficient value from the collateral held. The credit extended is limited by regulatory requirements and by CI’s internal credit policy. Credit risk is managed by dealing with counterparties CI believes to be creditworthy and by actively monitoring credit and margin exposure and the financial health of the counterparties. CI’s accounts receivable consist primarily of management fees receivable, amounts due to CI from the government agencies with respect to input tax credits and other short-term receivables due within 90 days. Securities lending and borrowing agreements consist of the following as at December 31, 2020: Cash Securities $ $ Loaned or delivered as collateral 12,321 11,523 Borrowed or received as collateral 31,862 30,520 Securities lending and borrowing agreements consist of the following as at December 31, 2019: Cash Securities $ $ Loaned or delivered as collateral 10,958 11,176 Borrowed or received as collateral 13,051 13,657 CI uses securities lending and borrowing to facilitate the securities settlement process. These transactions are typically short- term in nature, fully collateralized by either cash or securities and subject to daily margin calls for any deficiency between the market value of the security given and the amount of collateral received. CI manages its credit exposure by establishing and monitoring aggregate limits by counterparty for these transactions. Cash loaned or delivered as collateral is included in accounts receivable and cash borrowed or received as collateral is included in accounts payable and accrued liabilities. Other assets consist mainly of long-term investments, long-term accounts receivable, loans granted under CI’s employee share purchase plan and loans extended to investment advisors under CI’s hiring and incentive program. Employee loans are collateralized by CI shares and become due immediately upon termination of the employee or upon the sale of the shares held as collateral. Commissions may be used to offset loan amounts made to investment advisors in the event of default. Credit risk associated with other assets is limited given the nature of the relationship with the counterparties. NOTES TO CONSOLIDATED FINANCIAL STATEMENTS December 31, 2020 and 2019 • [in thousands of Canadian dollars, except per share amounts] Q4 Financial Report 79 December 31, 2020 |
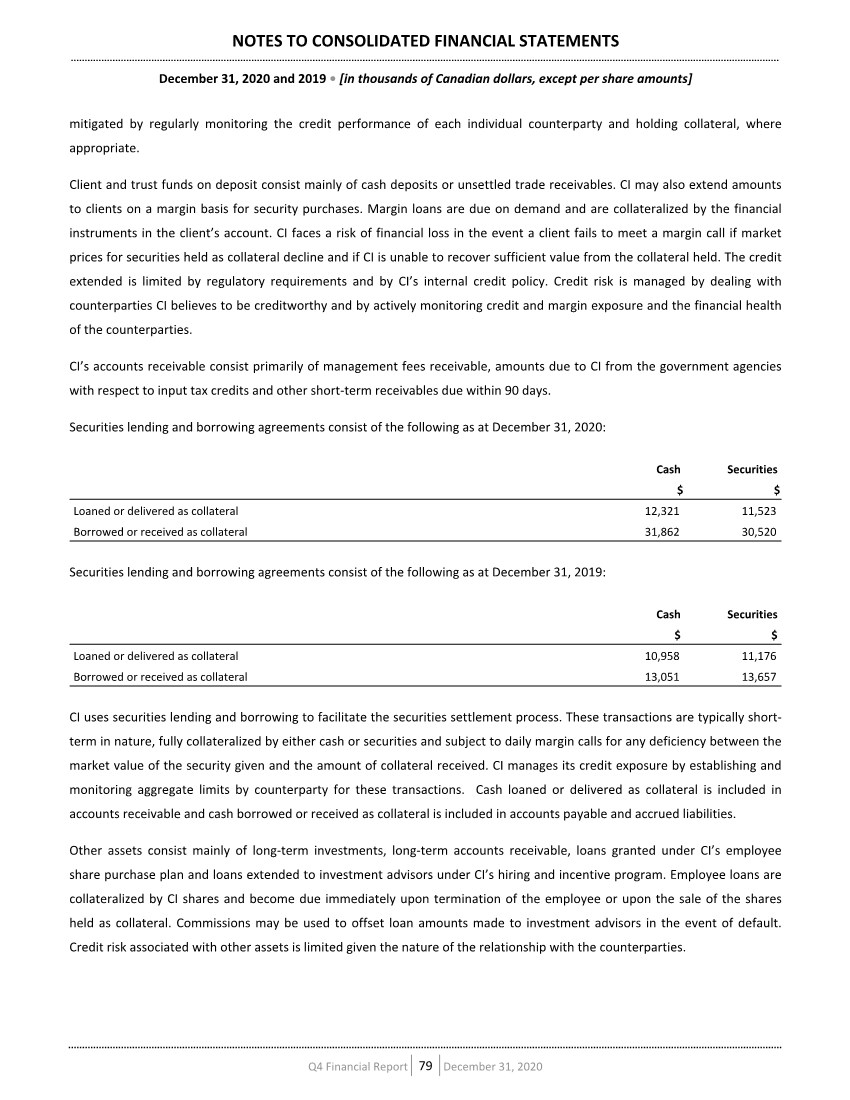
| 15. CAPITAL MANAGEMENT CI’s objectives in managing capital are to maintain a capital structure that allows CI to meet its growth strategies and build long-term shareholder value, while satisfying its financial obligations and meeting its long-term debt covenants. CI’s capital comprises shareholders’ equity and long-term debt (including the current portion of long-term debt). CI and its subsidiaries are subject to minimum regulatory capital requirements whereby sufficient cash and other liquid assets must be on hand to maintain capital requirements rather than using them in connection with its business. As at December 31, 2020, cash and cash equivalents of $14,680 [December 31, 2019 – $12,810] were required to be on hand for regulatory capital maintenance. Failure to maintain required regulatory capital by CI may result in fines, suspension or revocation of registration by the relevant securities regulator. CI from time to time provides loans to its subsidiaries for operating purposes and may choose to subordinate these loans in favour of general creditors. The repayment of subordinated loans is subject to regulatory approval. As at December 31, 2020 and December 31, 2019, CI met its capital requirements. CI’s capital consists of the following: As at As at December 31, 2020 December 31, 2019 $ $ Shareholders’ equity 1,582,447 1,493,988 Long-term debt 2,456,116 1,604,494 Total capital 4,038,563 3,098,482 16. COMMITMENTS LEASE COMMITMENTS CI has entered into leases relating to the rental of office premises and computer equipment. CI has the option to renew certain leases. The approximate future minimum annual rental payments under such leases are as follows: $ 2021 17,708 2022 16,529 2023 15,141 2024 14,704 2025 12,684 2026+ 8,725 ADVISOR SERVICES AGREEMENTS CI is a party to certain advisor services agreements, which provide that the advisor has the option to require CI to purchase a practice that cannot otherwise be transitioned to a qualified buyer. The purchase price would be in accordance with a pre- determined formula contained in the advisor services agreements. NOTES TO CONSOLIDATED FINANCIAL STATEMENTS December 31, 2020 and 2019 • [in thousands of Canadian dollars, except per share amounts] Q4 Financial Report 80 December 31, 2020 |
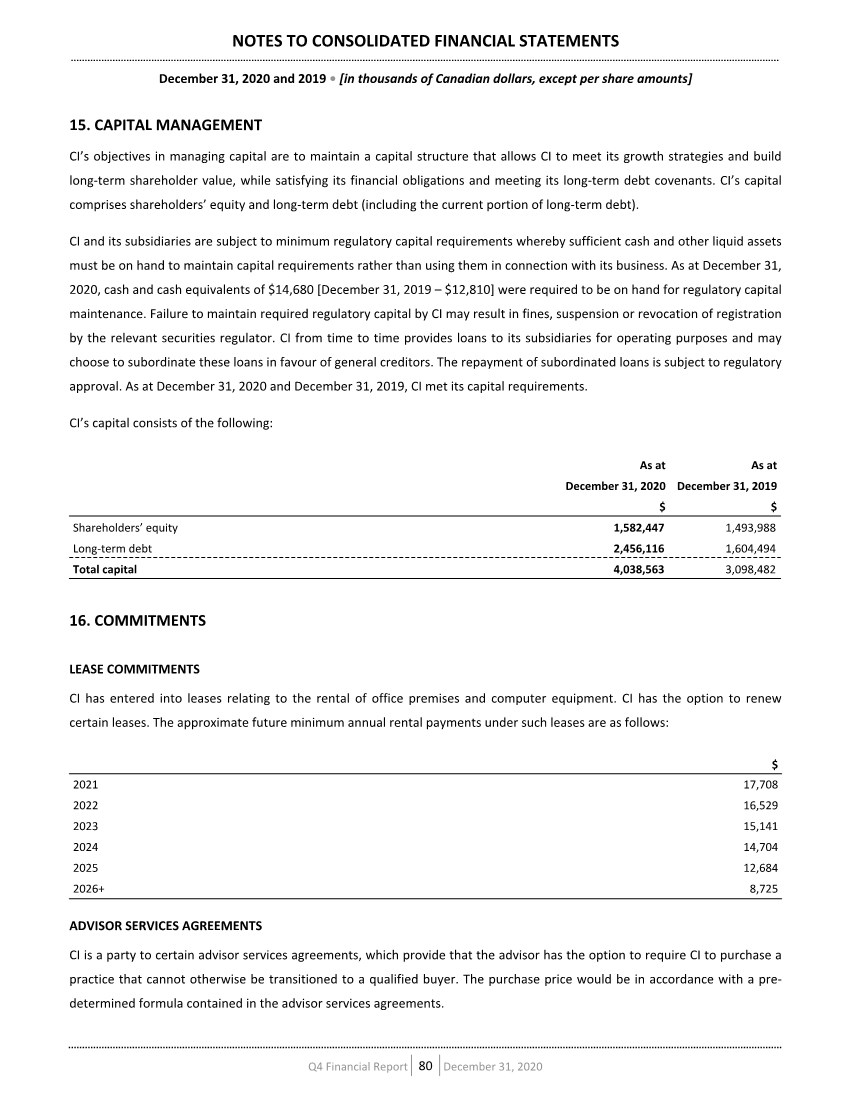
| INDEMNITIES CI has agreed to indemnify its directors and officers, and certain of its employees in accordance with its by-laws. CI maintains insurance policies that may provide coverage against certain claims. 17. SEGMENTED INFORMATION CI has two reportable segments: asset management and wealth management (formerly asset management and asset administration). These segments reflect CI’s internal financial reporting, performance measurement and strategic priorities. Prior year has been recast for comparative purposes. The asset management segment includes the operating results and financial position of CI Investments, GSFM and Marret Asset Management Inc., which derive their revenues principally from the fees earned on the management of several families of mutual funds, segregated funds and exchange-traded funds. The operating results of of CI Private Counsel LP are now included in the wealth management segment. The wealth management segment includes the operating results and financial position of CI Private Counsel LP, the U.S. RIAs, Aligned, CI Investment Services, Wealthbar and AWM and its subsidiaries, including Assante Capital Management Ltd. and Assante Financial Management Ltd. These companies derive their revenues principally from commissions and fees earned on the sale of mutual funds and other financial products, and ongoing service to clients. NOTES TO CONSOLIDATED FINANCIAL STATEMENTS December 31, 2020 and 2019 • [in thousands of Canadian dollars, except per share amounts] Q4 Financial Report 81 December 31, 2020 |

| Segmented information as at and for the year ended December 31, 2020 is as follows: Asset management Wealth management Intersegment eliminations Total $ $ $ $ Management fees 1,650,076 — (14,303) 1,635,773 Administration fees — 530,058 (165,650) 364,408 Other income (4,555) 54,830 — 50,275 Total revenue 1,645,521 584,888 (179,953) 2,050,456 Selling, general and administrative 325,245 138,805 (14,611) 449,439 Trailer fees 538,409 — (28,965) 509,444 Advisor and dealer fees — 389,264 (135,888) 253,376 Deferred sales commissions 7,981 — (489) 7,492 Amortization and depreciation 24,714 18,800 — 43,514 Other expenses 66,848 12,156 — 79,004 Total expenses 963,197 559,025 (179,953) 1,342,269 Income before income taxes and non-segmented items 682,324 25,863 — 708,187 Interest and lease finance (65,440) Provision for income taxes (167,201) Net income for the year 475,546 Identifiable assets 1,293,057 1,234,206 — 2,527,263 Indefinite life intangibles Goodwill 1,311,873 741,799 — 2,053,672 Fund contracts 1,778,901 — — 1,778,901 Total assets 4,383,831 1,976,005 — 6,359,836 NOTES TO CONSOLIDATED FINANCIAL STATEMENTS December 31, 2020 and 2019 • [in thousands of Canadian dollars, except per share amounts] Q4 Financial Report 82 December 31, 2020 |
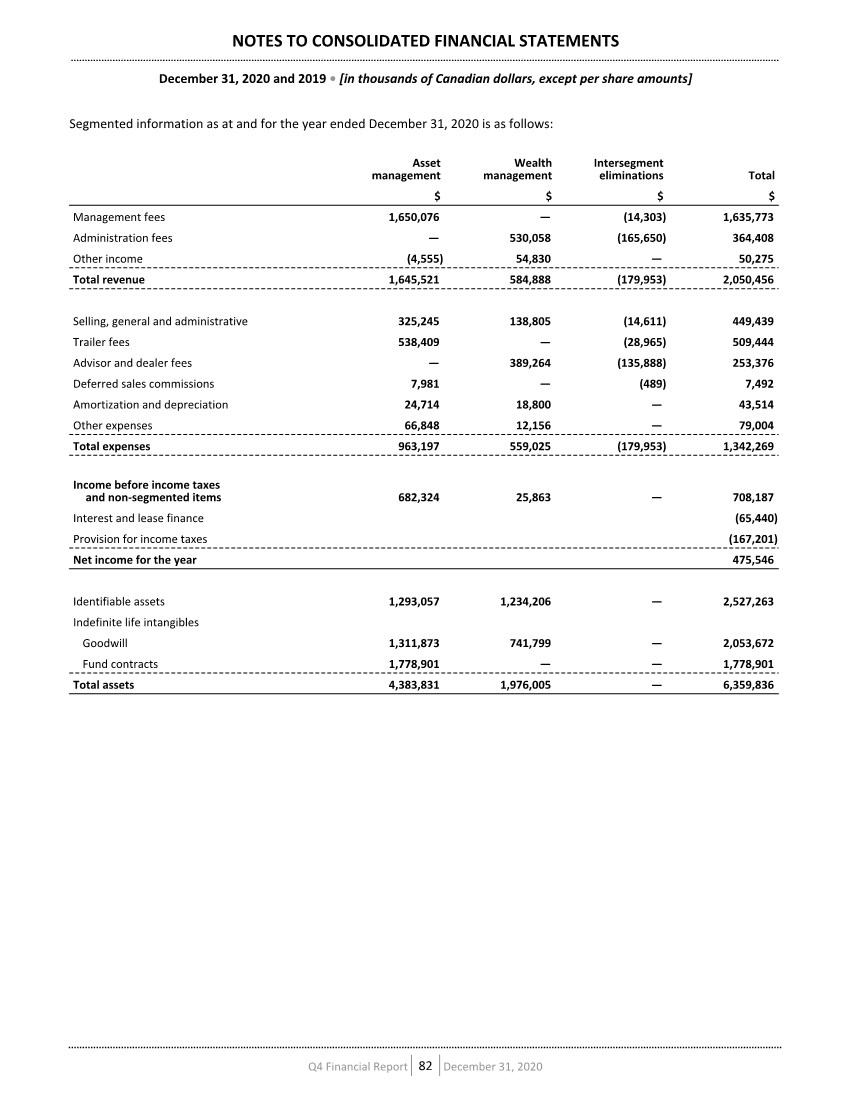
| Segmented information as at and for the year ended December 31, 2019 is as follows: Asset management Wealth management Intersegment eliminations Total $ $ $ $ Management fees 1,802,257 — (13,157) 1,789,100 Administration fees — 457,501 (165,000) 292,501 Other income 4,001 36,864 — 40,865 Total revenue 1,806,258 494,365 (178,157) 2,122,466 Selling, general and administrative 370,638 131,791 (13,157) 489,272 Trailer fees 583,683 — (28,516) 555,167 Advisor and dealer fees — 342,072 (135,771) 206,301 Deferred sales commissions 13,527 — (713) 12,814 Amortization and depreciation 21,785 11,106 — 32,891 Other expenses 38,693 5,101 — 43,794 Total expenses 1,028,326 490,070 (178,157) 1,340,239 Income before income taxes and non-segmented items 777,932 4,295 — 782,227 Interest (55,422) Provision for income taxes (189,281) Net income for the year 537,524 Identifiable assets 463,377 593,199 — 1,056,576 Indefinite life intangibles Goodwill 1,309,008 222,265 — 1,531,273 Fund contracts 1,779,957 — — 1,779,957 Total assets 3,552,342 815,464 — 4,367,806 18. COMPENSATION OF KEY MANAGEMENT The remuneration of directors and other key management personnel of CI during the years ended December 31, is as follows: 2020 2019 $ $ Salaries 5,155 6,976 Equity-based compensation 6,660 1,827 Total 11,815 8,803 NOTES TO CONSOLIDATED FINANCIAL STATEMENTS December 31, 2020 and 2019 • [in thousands of Canadian dollars, except per share amounts] Q4 Financial Report 83 December 31, 2020 |
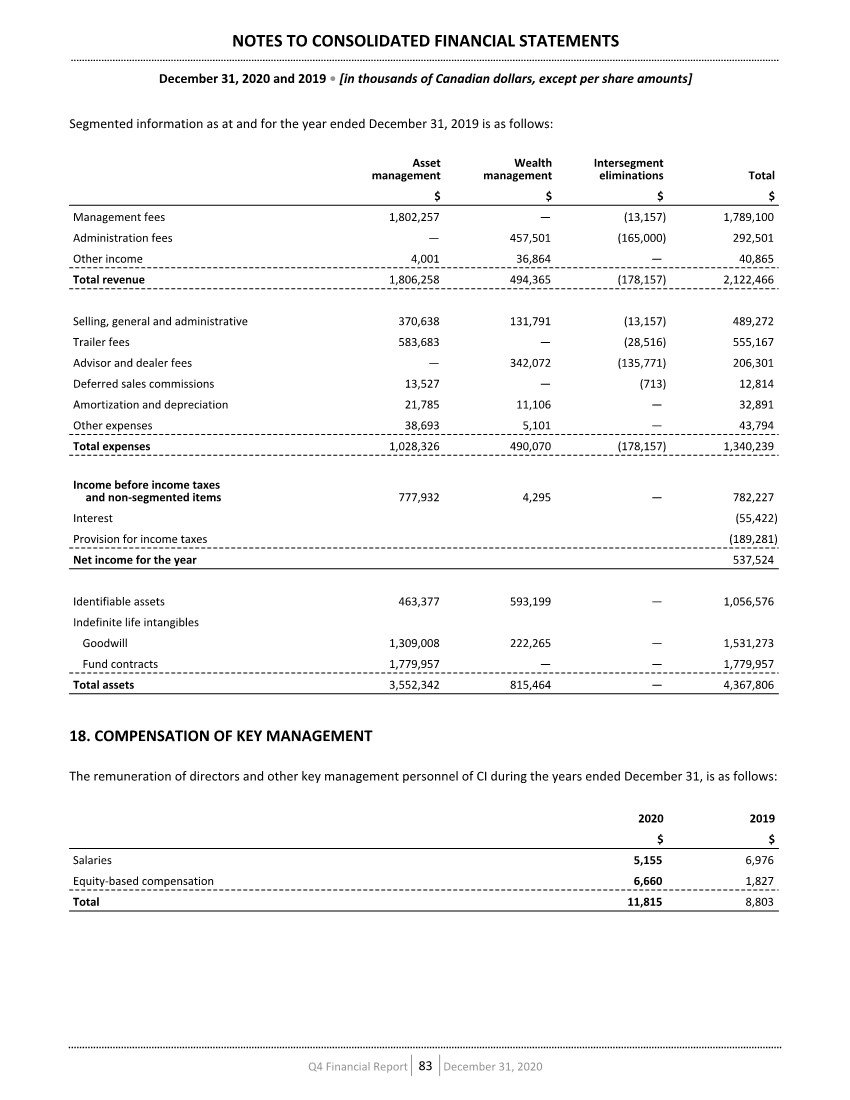
| 19. SELLING, GENERAL AND ADMINISTRATIVE EXPENSES Included in selling, general and administrative expenses [“SG&A”] are salaries and benefits of $241,614 for the year ended December 31, 2020 [2019 - $265,908]. Other SG&A of $207,825 for the year ended December 31, 2020, primarily includes marketing and information technology expenses as well as professional and regulatory fees [2019 - $223,364]. 20. AMORTIZATION AND DEPRECIATION The following table provides details of amortization and depreciation: 2020 2019 $ $ Depreciation of capital assets 12,295 11,491 Depreciation of right-of-use assets 9,848 8,786 Amortization of intangibles 19,317 11,312 Amortization of debenture transaction costs 2,054 1,302 Total amortization and depreciation 43,514 32,891 21. UPDATE ON COVID-19 COVID-19, which has been recognized by the World Health Organization as a pandemic, has spread rapidly and extensively across the globe. Efforts by governments to control the further spread of COVID-19 have disrupted normal economic activity both domestically and globally. Uncertainty related to the extent, duration and severity of the pandemic has contributed to significant volatility in the financial markets, resulting in a decline in certain equity and commodity prices and lower interest rates and a corresponding decline in CI’s assets under management. In addition, CI may face declines in its assets under management as a result of client redemptions related to a variety of COVID-19 related factors including general market pessimism, poor fund performance, or clients’ needs for immediate cash. CI is monitoring the impact of the pandemic and managing expenses accordingly. CI believes it is well positioned to meet its financial obligations and to support planned business operations throughout this pandemic. The extent to which CI’s business, financial condition and results of operations will be impacted by the COVID-19 pandemic, is uncertain and will depend on future developments, which are unpredictable and rapidly evolving. Accordingly, there is a higher level of uncertainty with respect to management’s judgments and estimates. 22. COMPARATIVE FIGURES Certain comparative figures have been reclassified to conform to the consolidated financial statement presentation in the current year. NOTES TO CONSOLIDATED FINANCIAL STATEMENTS December 31, 2020 and 2019 • [in thousands of Canadian dollars, except per share amounts] Q4 Financial Report 84 December 31, 2020 |

| This Report contains forward-looking statements with respect to CI, including its business operations and strategy and financial performance and condition. Although management believes that the expectations reflected in such forward-looking statements are reasonable, such statements involve risks and uncertainties. Actual results may differ materially from those expressed or implied by such forward-looking statements. Factors that could cause results to differ materially include, among other things, general economic and market factors, including interest rates, business competition, changes in government regulations or in tax laws, and other factors discussed in materials filed with applicable securities regulatory authorities from time to time. |

| This Report contains forward-looking statements with respect to CI, including its business operations and strategy and financial performance and condition. Although management believes that the expectations reflected in such forward-looking statements are reasonable, such statements involve risks and uncertainties. Actual results may differ materially from those expressed or implied by such forward-looking statements. Factors that could cause results to differ materially include, among other things, general economic and market factors, including interest rates, business competition, changes in government regulations or in tax laws, and other factors discussed in materials filed with applicable securities regulatory authorities from time to time. 21-02-238362_E (02/21) |

| CORPORATE INFORMATION Head Office 2 Queen Street East Twentieth Floor Toronto, Ontario M5C 3G7 Telephone: 416-364-1145 Toll Free: 1 800 268-9374 www.cifinancial.com Administration Office 15 York Street Second Floor Toronto, Ontario M5J 0A3 Investor Relations Contact: Jason Weyeneth, Vice-President, Investor Relations & Strategy Telephone: (416) 681-8779 Toll Free: 1 (800) 268-9374 E-mail: jweyeneth@ci.com Trading Symbol CI Financial trades on the Toronto Stock Exchange under the symbol “CIX” and on the New York Stock Exchange under “CIXX”. Auditors Ernst & Young LLP Chartered Accountants 100 Adelaide Street West Toronto, Ontario M5H 0B3 Registrar and Transfer Agent Computershare Investor Services Inc. 8th Floor, 100 University Avenue Toronto, Ontario M5J 2Y1 Telephone: 1 (800) 564-6253 Computershare Trust Company N.A. 462 S. 4th Street Louisville, Kentucky USA 40202 1 (800) 962-4284 From all other countries: (514) 982-7555 Normal Course Issuer Bid Effective June 16, 2020, the Toronto Stock Exchange (the “TSX”) accepted CI’s notice of intention to commence a normal course issuer bid. Under the bid, CI may purchase up to 19,676,318 of its shares at the prevailing market price. Common shares may be purchased by CI or purchased by a trustee to satisfy obligations under equity-based compensation plans for CI. All common shares purchased by CI (but not those purchased by such a trustee) will be cancelled. Purchases under the bid will terminate on June 17, 2021, or on such earlier date as CI completes its purchases or provides notice of termination. As of March 31, 2021, CI has acquired an aggregate of 14,374,991 shares under the normal course issuer bid at an average price of $17.49 per share. Shareholders may obtain a copy of the Notice, without charge, by contacting the Corporate Secretary of CI. The Corporation intends to renew its Normal Course Issuer Bid effective June 18, 2021, subject to receipt of approval from the TSX. Digital Report This Annual Report can be downloaded from CI’s website at www.cifinancial.com under “Financials.” Annual Meeting Virtual-only Annual Meeting of Shareholders The Annual Meeting of Shareholders will be held at 2 p.m. EDT on June 16, 2021. The meeting will be held in a virtual-only format by way of live audio webcast. Instructions on how to access the webcast and vote at the virtual meeting will be posted to the Investor Relations section of www.cifinancial.com. |
| As described in greater detail in the MD&A section of this Annual Report, this Report contains forward-looking statements with respect to CI, including its business operations and strategy and financial performance and condition. Although management believes that the expectations reflected in such forward-looking statements are reasonable, such statements involve risks and uncertainties. Actual results may differ materially from those expressed or implied by such forward-looking statements. Factors that could cause results to differ materially include, among other things, general economic and market factors, including interest rates, business competition, changes in government regulations or in tax laws, and other factors discussed in materials filed with applicable securities regulatory authorities from time to time, including the risks described under the heading “Risk Management” in the MD&A section of this Annual Report. 21-04- 311354_E (04/21) |