Exhibit 99.2
Investor Presentation September 2021 Go. Game. Win. Esports Technologies

LEGAL D I S CLA I M ER This presentation (the “presentation”) has been prepared for use by Esports Technologies, Inc . (“Esports Tech”) in connection with their proposed offering . This presentation is for information purposes only and is being provided to assist interested parties in making their own evaluation with respect to a potential investment, and for no other purpose . This presentation may not be reproduced or redistributed, in whole or in part, without the prior written consent of Esports Tech . Esports Tech does not makes any representation or warranty as to the accuracy or completeness of the information contained in this presentation . This presentation is not intended to be all - inclusive or to contain all the information that a person may desire in considering an investment in connection with the proposed offering and is not intended to form the basis of any investment decision . You should consult your own legal, regulatory, tax, business, financial and accounting advisors to the extent you deem necessary, and must make your own investment decision and perform your own independent investigation and analysis of an investment in the transactions contemplated in this presentation . NEITHER THE SECURITIES AND EXCHANGE COMMISSION (“SEC”) NOR ANY STATE OR TERRITORIAL SECURITIES COMMISSION HAS APPROVED OR DISAPPROVED OF THE SECURITIES OR DETERMINED IF THIS PRESENTATION IS TRUTHFUL OR COMPLETE. FORWARD - LOOKING STATEMENTS This presentation includes “forward - looking statements” within the meaning of the “safe harbour” provisions of the United States Private Securities Litigation Reform Act of 1995 . Forward - looking statements may be identified by the use of words such as “estimate”, “project”, “forecast”, “intend”, “will”, “expect”, “anticipate”, “believe”, “seek” or other similar expressions that predict or indicate future events or trends or that are not statements of historical matters . These forward - looking statements include, but are not limited to, statements regarding estimates and forecasts of financial and performance metrics, projections of market opportunity and market share, potential benefits of the transaction and the potential success of Esports Tech’s strategy, and expectations related to the terms and timing of the proposed acquisition and related transactions . These statements are based on various assumptions, whether or not identified in this presentation, and on the current expectations of Esports Tech’s management and are not predictions of the actual performance . These forward - looking statements are provided for illustrative purposes only and are not intended to serve as, and must not be relied on by any investor as, a guarantee, an assurance, a prediction or a definitive statement of fact or probability . Actual events and circumstances are difficult or impossible to predict and will differ from assumptions . Many actual events and circumstances are beyond the control of Esports Tech . These forward - looking statements are subject to a number of risks and uncertainties, including changes in domestic and foreign business, market, financial, political, legal and regulatory conditions ; the inability of the parties to successfully or timely consummate the proposed acquisition ; failure to realize the anticipated benefits of the proposed acquisition ; risks relating to the uncertainty of the projected financial information with respect to Esports Tech ; and the effects of competition and regulation on Esports Tech’s business . If any of these risks materialize or the assumptions prove incorrect, actual results could differ materially from the results implied by these forward - looking statements . There may be additional risks that Esports Tech presently does not know or that Esports Tech currently believes are immaterial that could also cause actual results to differ from those contained in the forward - looking statements . Forward - looking statements speak only as of the date they are made . Readers are cautioned not to put undue reliance on forward - looking statements, and Esports Tech assumes no obligation and does not intend to update or revise these forward - looking statements, whether as a result of new information, future events, or otherwise . Esports Tech gives no assurance that it will achieve its expectations . USE OF DATA The data contained herein is derived from various internal and external sources . No representation is made as to the reasonableness of the assumptions made within or the accuracy or completeness of any projections or modeling or any other information contained herein . Any data on past performance or modeling contained herein is not an indication as to future performance . Esports Tech assumes no obligation to update the information in this presentation . 2 Legal Disclaimer

Introduction
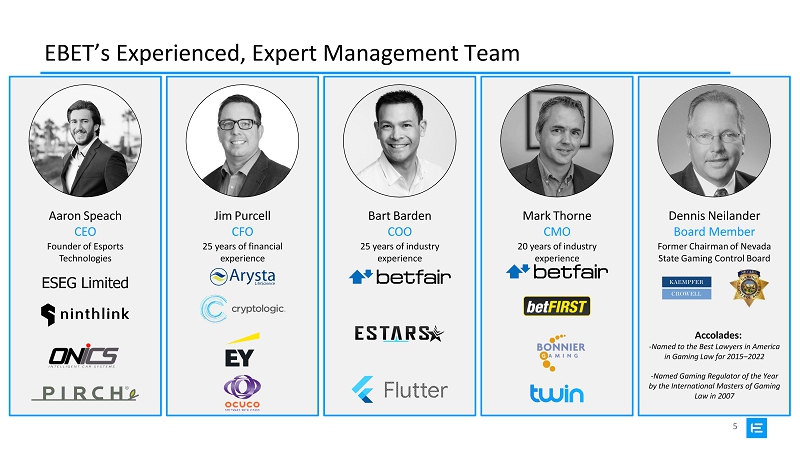
5 EBET’s Experienced, Expert Management Team Jim Purcell CFO 25 years of financial experience Bart Barden COO 25 years of industry experience Dennis Neilander Board Member Former Chairman of Nevada State Gaming Control Board Accolades: - Named to the Best Lawyers in America in Gaming Law for 2015 – 2022 - Named Gaming Regulator of the Year by the International Masters of Gaming Law in 2007 Mark Thorne CMO 20 years of industry experience Aaron Speach CEO Fo und er of E s p or ts Technologies ESEG Limited
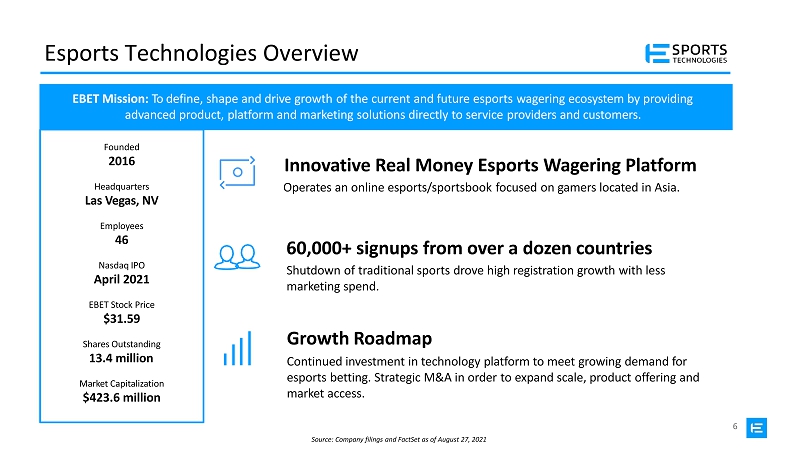
6 Esports Technologies Overview Founded 2016 Headquarters Las Vegas, NV Employees 46 Nasdaq IPO April 2021 EBET Stock Price $31.59 Shares Outstanding 13.4 million Market Capitalization $423.6 million Innovative Real Money Esports Wagering Platform Operates an online esports/sportsbook focused on gamers located in Asia. 60,000+ signups from over a dozen countries Shutdown of traditional sports drove high registration growth with less marketing spend. Growth Roadmap Continued investment in technology platform to meet growing demand for esports betting. Strategic M&A in order to expand scale, product offering and market access. EBET Mission: To define, shape and drive growth of the current and future esports wagering ecosystem by providing advanced product, platform and marketing solutions directly to service providers and customers. Source: Company filings and FactSet as of August 27, 2021

7 Target: Aspire Global B2C iGaming Division B2B Products Casino S po r ts Aspire Global is a leading B2B and B2C provider of iGaming solutions. Aspire is divesting its B2C assets in order to focus on and invest in its B2B platform offering. Founded 2005 Headquarters Sliema, Malta Employees ~500 Ticker / Exchange ASPIRE.ST / Stockholm LTM Revenue Distribution B2B Platform Enables customers with everything they need to operate a successful iGaming brand, covering casino and sports B2C Platform Includes leading brand Karamba, consisting of online casino and sports betting capabilities B2C Products B2C 33% €188.3M B2B 67% Source: Company filings H1 YOY Growth: B2B 29.4% B2C 44.5%

8 A s pi r e B 2C GN OG A s pi r e B 2C R S I A s pi r e B 2C R S I Transaction Terms Acquisition Rationale and Terms ▪ Opportunity to acquire highly respected B2C platform for ~1x revenue, a discount to trading peers ▪ Access to a 1.2M+ player database across 145+ countries ▪ Properties producing ~$2B in gross annual wagers ▪ Acquisition includes $177M+ in customer deposits ▪ Broaden product portfolio into online casino and sports betting, further penetrating the $30B+ rapidly growing iGaming industry ▪ Access to large number of regulated markets globally and unique access to future markets A s pi r e B 2C GN OG Transaction Rationale (1) USD purchase price determined using a EUR to USD exchange rate of 1 - for - 1.2 Note: Additional partnership relationships include managed service fees for Aspire iGaming revenue of 30%, 28% , 26% for each of the first three contract years respectively, and 30% of EBET Esports revenue Aspire managed services fee represents Aspire platform and managed services fee EBET Acquiring: Aspire’s B2C assets: • Brands • Domain Names • Customer Database • Front End Code P urc h as e Price: • €60,000,000 ($72,000,000) in cash (1) M ar k e t A ccess : • Acquiring licenses and/or sublicenses in the UK, Germany, Malta, Ireland, and Denmark Highly Attractive Valuation EV / LTM Revenue EV / LTM EBITDA 8. 0 x 7.0x 10 . 0x 8.8x 7. 0 x 8. 0 x 6. 0 x 7. 0 x 5. 0 x 4. 0 x 5. 0 x EBITDA 3. 0 x 4. 0 x Negative 2. 0 x 1.0x 2. 0 x 1. 0 x 1. 0 x - - 16 . 0x 14 . 0x 14.4x 25 0 .0x 219.1x 12 . 0x 20 0 .0x 10 . 0x 15 0 .0x 8. 0 x 4. 0 x 2. 0 x 1.0x 50 . 0x 8.8x - Sources: Edgar and Factset as of August 27, 2021 GNOG based on acquisition value announced on August 9, 2021 Assumes Aspire acquisition price of $72 million USD
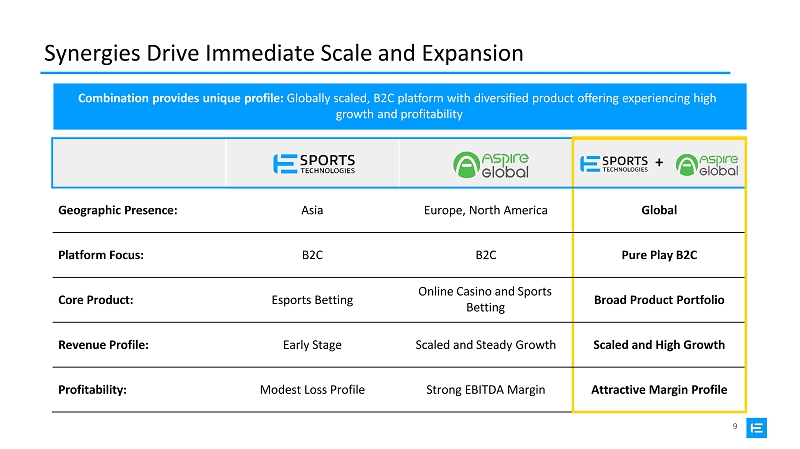
9 Synergies Drive Immediate Scale and Expansion Combination provides unique profile: Globally scaled, B2C platform with diversified product offering experiencing high growth and profitability + Geographic Presence: Asia Europe, North America Global Platform Focus: B2C B2C Pure Play B2C Core Product: Esports Betting Online Casino and Sports Betting Broad Product Portfolio Revenue Profile: Early Stage Scaled and Steady Growth Scaled and High Growth Profitability: Modest Loss Profile Strong EBITDA Margin Attractive Margin Profile

Gaming Market Overview

11 Market Opportunity Market Opportunity Implied Esports Betting TAM Analysis Source: Wall Street Research, Newzoo $64 Billion A nnu al Le g al Wagers E SPOR TS 5% to 8% Take Rate at $3.2 - $5.1B Market Opportunity i m p lies 160 Million with 80 Million implies Regular Viewers Hardcore Viewers $20 - $32 Per Regular Viewer Per Hardcore Viewer or $40 - $64 550 Million Regular Viewers 250 Million Hardcore Viewers w i th at $20 - $32 Per Regular Viewer $40 - $64 Per Hardcore Viewer or i m p lies $10.0 - $17.6B Market Opportunity Viewership
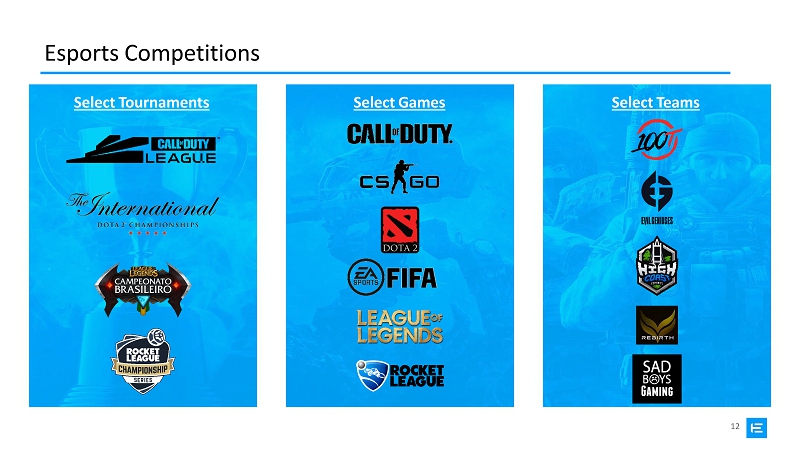
12 Select Tournaments Esports Competitions Select Teams Select Games

13 Target Audience Avid Esports Bettor Russell Age 35 Management Level Professional $100k Income ”I have been playing in Fantasy Sports Leagues and DFS for several years and love watching the NBA and NFL. I own a PS5 console and like to play games with my kids and to be social. I would be interested in potentially betting on esports games focused on sports, during real sport downtime” Games Liked: Games Liked: Avid Esports Bettor Geoff Age 30 IT Finance $75k Income “I am an avid bettor and frequently bet on live sports. I have been watching esports lately. I see an opportunity, since betting in esports is relatively new. I am looking for a trusted platform and I am ready to win big.” Secondary Persona Games Liked: New to Betting - Esports Viewer Johnny Age 25 Tech Lead at Media Co. $55k Income “I have been into video games since I was a kid. I still play, but I really like watching world tournaments. I don’t know much about esports betting but would like to give it a try to see if my knowledge can translate into good choices.” T a rge t P e r s ona Tertiary Persona
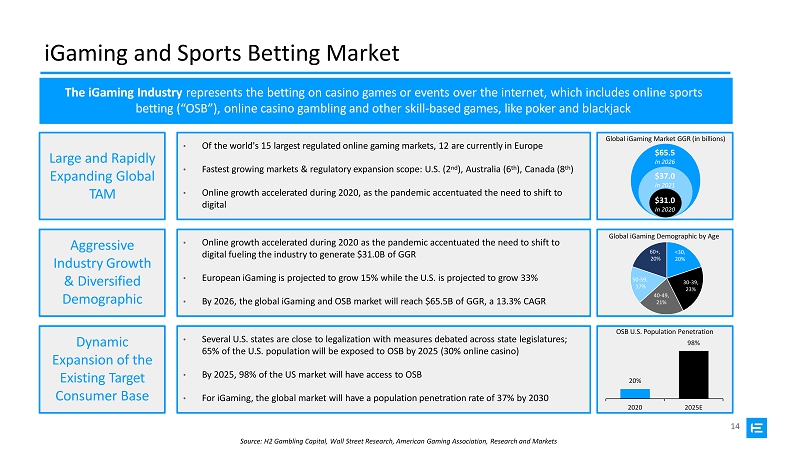
14 30 - 39, 23% 40 - 49, 21% 50 - 59, 17% Global iGaming Demographic by Age 60+, <30, 20% 20% iGaming and Sports Betting Market The iGaming Industry represents the betting on casino games or events over the internet, which includes online sports betting (“OSB”), online casino gambling and other skill - based games, like poker and blackjack Large and Rapidly Expanding Global TAM Dynamic Expansion of the Existing Target Consumer Base • Several U.S. states are close to legalization with measures debated across state legislatures; 65% of the U.S. population will be exposed to OSB by 2025 (30% online casino) • By 2025, 98% of the US market will have access to OSB • For iGaming, the global market will have a population penetration rate of 37% by 2030 Source: H2 Gambling Capital, Wall Street Research, American Gaming Association, Research and Markets • Of the world's 15 largest regulated online gaming markets, 12 are currently in Europe • Fastest growing markets & regulatory expansion scope: U.S. (2 nd ), Australia (6 th ), Canada (8 th ) • Online growth accelerated during 2020, as the pandemic accentuated the need to shift to digital Global iGaming Market GGR (in billions) $65.5 In 2026 $37.0 In 2021 $31.0 In 2020 Aggressive Industry Growth & Diversified Demographic • Online growth accelerated during 2020 as the pandemic accentuated the need to shift to digital fueling the industry to generate $31.0B of GGR • European iGaming is projected to grow 15% while the U.S. is projected to grow 33% • By 2026, the global iGaming and OSB market will reach $65.5B of GGR, a 13.3% CAGR 20% OSB U.S. Population Penetration 98% 0% 20% 40% 60% 80% 12 0 % 10 0 % 2020 2025E

Netherlands Market: Similar to Germany with NL branding being slightly stronger; great land grab opportunity as first group of regulated operators UK Market: Competitive market but immediate growth opportunities based on new brands already exhibiting strong growth + affiliate strength and cross selling 15 Sports Betting TAM by Country Size of Circle = Total Market Opportunity German Market: Large opportunity to grow German SB revenue, once license granted given migration out of market ROW: Large opportunity to leverage cross marketing across ROW markets targeted by esports business Note: Due to TAM penetration there is more upside opportunity to the current SB business than downside due to regulatory changes Aspire Asset Brand Strength Source: H2 Gambling Capital, Management Estimates G e r m a n y Market $1.5B H i gh L ow H i gh Licensing or Regulatory Unknown L ow Digital UK Market $3.3B ROW Ma r k e t ~$20B Aspire = $5M (0.1%) of Market Aspire =$1M ( 0.06%) N e th e rl a nds Market $286M Aspire =$0.5M (0.4%) Aspire Ma r k e t S h a r e = 0 . 001 % Overall Sports Betting is Growing: Global regulated sports betting market will generate $106 billion in gross win from $767 billion by 2025
Esports Technologies Overview
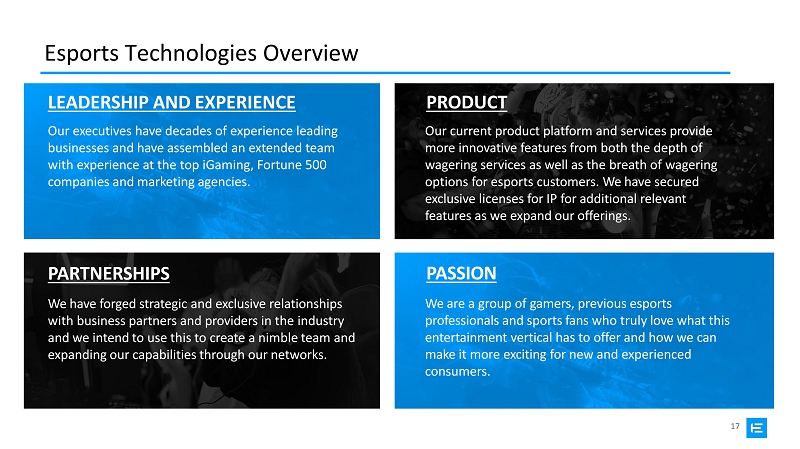
17 Esports Technologies Overview LEADERSHIP AND EXPERIENCE Our executives have decades of experience leading businesses and have assembled an extended team with experience at the top iGaming, Fortune 500 companies and marketing agencies. PRODUCT Our current product platform and services provide more innovative features from both the depth of wagering services as well as the breath of wagering options for esports customers. We have secured exclusive licenses for IP for additional relevant features as we expand our offerings. PASSION We are a group of gamers, previous esports professionals and sports fans who truly love what this entertainment vertical has to offer and how we can make it more exciting for new and experienced consumers. PARTNERSHIPS We have forged strategic and exclusive relationships with business partners and providers in the industry and we intend to use this to create a nimble team and expanding our capabilities through our networks.

18 Company Timeline 2020 2021 - H1 2021 - H2 2022 2017 • Esports T e chno lo g ie s • O p t i m i z e GoGawi • Product and Platform Investment • IPO • Scaling GoGawi • Liquidity for M&A • E S G / B r o w se r Bet/Odds • M&A • Aspire Global Platform • Regulated Market Access • MGA License • Esportsbook.com • Further IP and Licensing Expansion • B2B Product Launches • GoGawi • Southeast Asia • First Mover in Esports
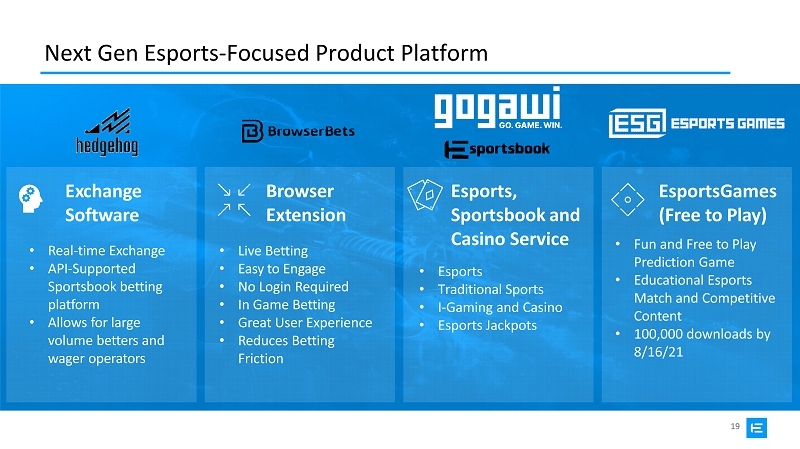
19 Next Gen Esports - Focused Product Platform E x c h a n g e Software • Real - time Exchange • API - Supported Sportsbook betting platform • Allows for large volume betters and wager operators E s p o rt s G a m es (Free to Play) • Fun and Free to Play Prediction Game • Educational Esports Match and Competitive Content • 100,000 downloads by 8/16/21 Browser E x t e n s i on • Live Betting • Easy to Engage • No Login Required • In Game Betting • Great User Experience • Reduces Betting Friction Esports, Sportsbook and Casino Service • Esports • Traditional Sports • I - Gaming and Casino • Esports Jackpots
Aspire Global B2C Synergies

21 Aspire’s Complementary B2C Product Overview B r a nds : Products / Platform: Combination Results in Unprecedented Diversified Product Offering Esports Betting O n li n e C asi no Traditional Sports Betting NGR % 62% 19% 13% 3% 2% 2% (D K)

22 Synergies Drive Immediate Scale and Expansion Geographic Presence: Southeast Asia Brazil North America Europe Africa Countries: 4 Countries 26 Countries (1) Player Database: 68,000+ Verified Depositors 1,200,000+ Verified Depositors Aspire Adds Regulated Market Access in Key Geographies with an Existing Installed Base (1) Combined B2C and Future B2B Market Access

23 Innovative, Leading Edge Product Team Ideal Combination of Technology, Scale and Operations Excellence Revenue Scale with Lean Overhead Operational Expertise and Market Access of Aspire B2B Headcount Synergies Pro Forma Senior Management 6 1 7 Sales & Marketing 17 8 25 Research & Development 17 1 18 General & Administrative 6 4 10 Total Headcount 46 14 60 Total Combined Entity Resources
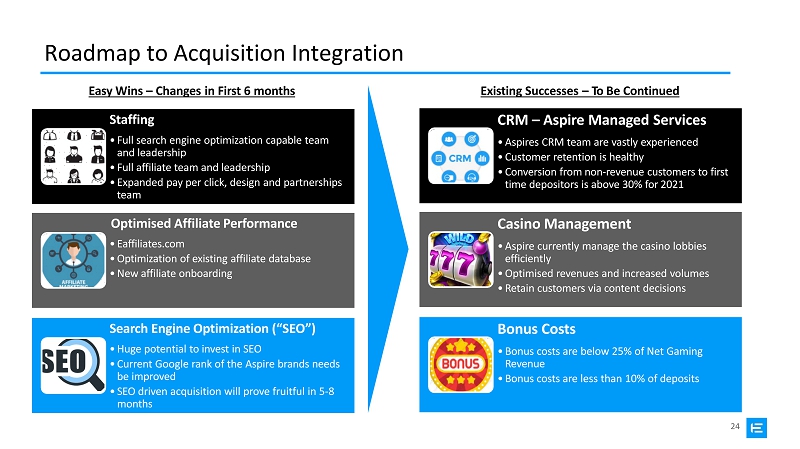
24 Roadmap to Acquisition Integration Staffing • Full search engine optimization capable team and leadership • Full affiliate team and leadership • Expanded pay per click, design and partnerships team Optimised Affiliate Performance • Eaffiliates.com • Optimization of existing affiliate database • New affiliate onboarding Search Engine Optimization (“SEO”) • Huge potential to invest in SEO • Current Google rank of the Aspire brands needs be improved • SEO driven acquisition will prove fruitful in 5 - 8 months CRM – Aspire Managed Services • Aspires CRM team are vastly experienced • Customer retention is healthy • Conversion from non - revenue customers to first time depositors is above 30% for 2021 Casino Management • Aspire currently manage the casino lobbies efficiently • Optimised revenues and increased volumes • Retain customers via content decisions Bonus Costs • Bonus costs are below 25% of Net Gaming Revenue • Bonus costs are less than 10% of deposits Existing Successes – To Be Continued Easy Wins – Changes in First 6 months

Growth Strategy
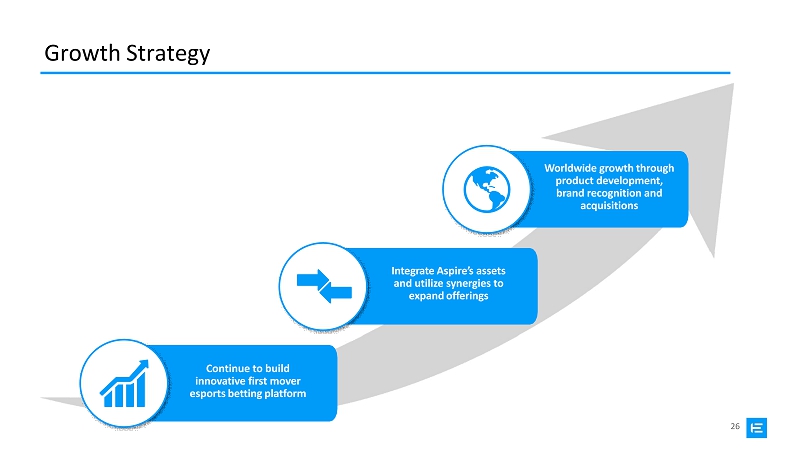
26 Growth Strategy Worldwide growth through product development, brand recognition and acquisitions I nt e g r at e Aspi r e ’ s ass e ts and utilize synergies to expand offerings Continue to build innovative first mover esports betting platform

27 Aspire Transaction Value 1.2M Paying Customers Accelerated E spo rt s P a y ing Customer Growth via Cross - Selling Regulated Market Access for B2C Improved Funnels f or Gogawi.com Accele r a t ing Launch for Esportsbook.com Distribution for Esports IP via Aspire Platform Accelerated Licensing and Esports Product Proof of Distribution Innovation Concept and Revenue Legitimizes Tech Stream E B I T D A and Cash M&A Currency EBET will utilize Aspire’s assets to drive, expand and promote its business
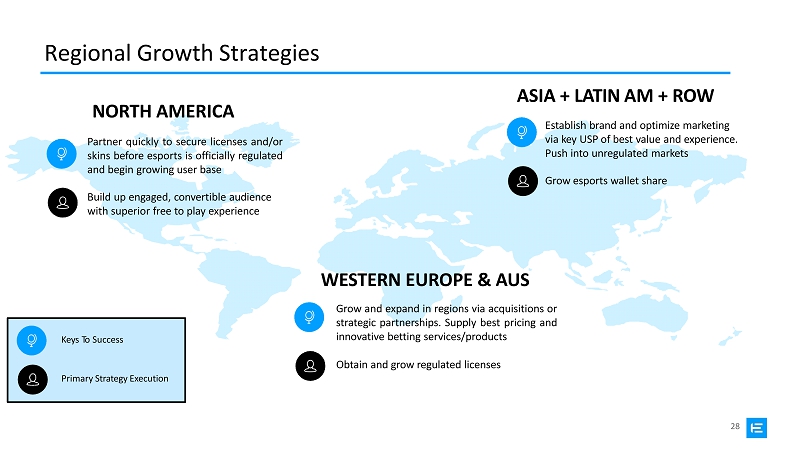
28 Regional Growth Strategies NORTH AMERICA Partner quickly to secure licenses and/or skins before esports is officially regulated and begin growing user base Build up engaged, convertible audience with superior free to play experience WESTERN EUROPE & AUS Grow and expand in regions via acquisitions or strategic partnerships . Supply best pricing and innovative betting services/products Obtain and grow regulated licenses ASIA + LATIN AM + ROW Establish brand and optimize marketing via key USP of best value and experience. Push into unregulated markets Grow esports wallet share K e y s T o S u cc e s s Primary Strategy Execution
Aspire B2C Financial Overview
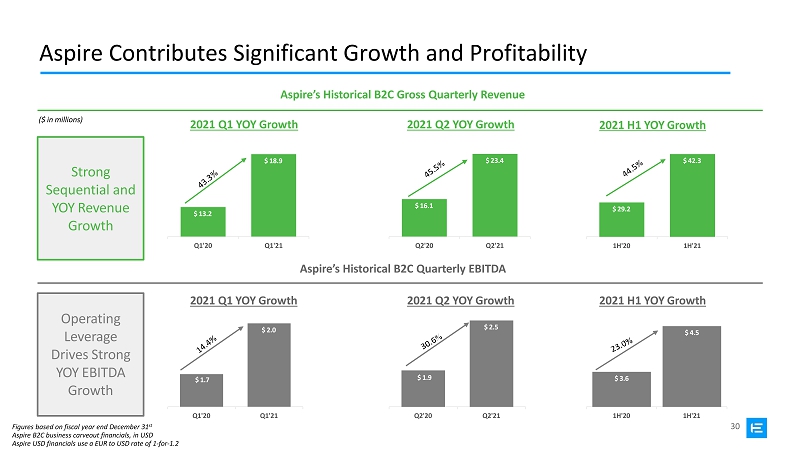
30 $ 3.6 $ 4.5 1 H '20 1 H '21 $ 1.9 $ 2.5 5 Q2' 2 0 Q2' 2 1 $ 1.7 $ 2.0 Q1' 2 0 Q1' 2 1 2021 H1 YOY Growth Aspire Contributes Significant Growth and Profitability ($ in millions) Q2'20 Q2'21 Aspire’s Historical B2C Quarterly EBITDA Aspire’s Historical B2C Gross Quarterly Revenue 2021 Q1 YOY Growth 2021 Q2 YOY Growth $ 13.2 $ 18.9 Q1' 2 0 Q1' 2 1 $ 16.1 $ 23.4 Operating Leverage Drives Strong YOY EBITDA Growth Strong Sequential and YOY Revenue Growth $ 29.2 $ 42.3 1 H '20 1 H '21 2021 Q1 YOY Growth 2021 Q2 YOY Growth 2021 H1 YOY Growth Figures based on fiscal year end December 31 st Aspire B2C business carveout financials, in USD Aspire USD financials use a EUR to USD rate of 1 - for - 1.2
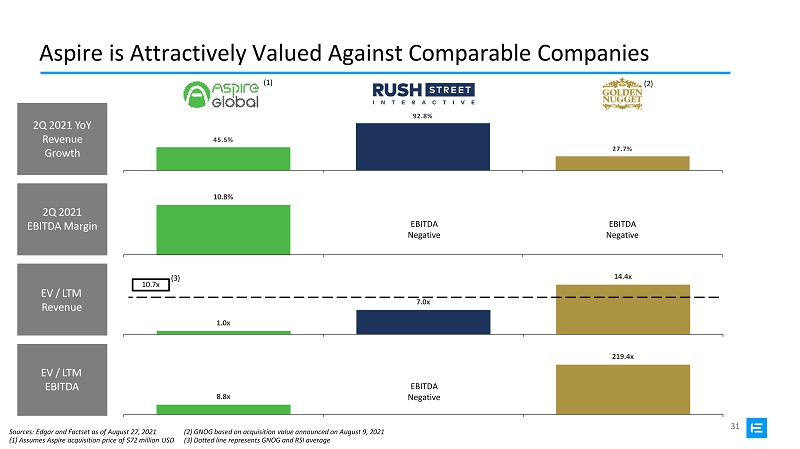
31 10.8% % 8.8x 219.4x - Aspire is Attractively Valued Against Comparable Companies EBITDA Negative 2Q 2021 YoY R e v en u e Growth 2Q 2021 EBITDA Margin EV / LTM Revenue EV / LTM EBITDA EBITDA Negative EBITDA Negative 1.0x 7.0x 14.4x - 45.5% 92.8% 27.7% % 10.7x (2 ) (3 ) (1 ) Sources: Edgar and Factset as of August 27, 2021 (2) GNOG based on acquisition value announced on August 9, 2021 (1) Assumes Aspire acquisition price of $72 million USD (3) Dotted line represents GNOG and RSI average
Appendix A: Company Income Statements
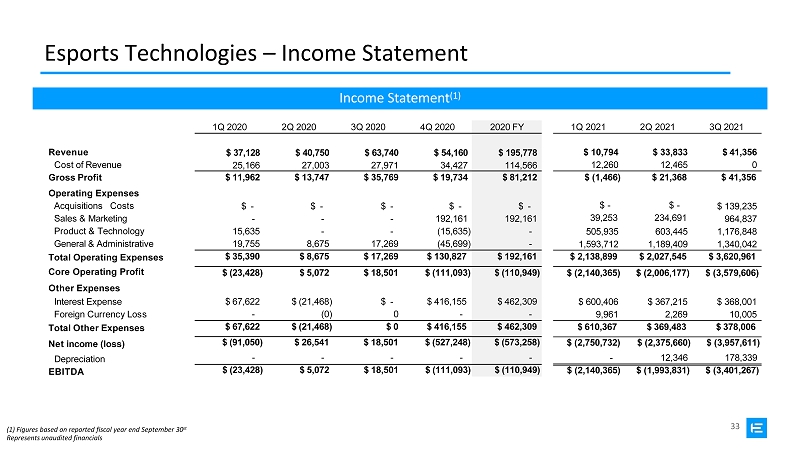
33 Esports Technologies – Income Statement (1) Figures based on reported fiscal year end September 30 st Represents unaudited financials 1Q 2020 2Q 2020 3Q 2020 4Q 2020 2020 FY $ 37 , 128 25,166 $ 40 , 750 27,003 $ 63 , 740 27,971 $ 54 , 160 34,427 $ 195 , 778 114,566 $ 11,962 $ 13,747 $ 35,769 $ 19,734 $ 81,212 $ - $ - $ - $ - $ - - - - 192,161 192,161 15,635 - - (15,635) - 19,755 8,675 17,269 (45,699) - $ 35,390 $ 8,675 $ 17,269 $ 130,827 $ 192,161 $ (23,428) $ 5,072 $ 18,501 $ (111,093) $ (110,949) $ 67,622 $ (21,468) $ - $ 416,155 $ 462,309 - (0) 0 - - $ 67,622 $ (21,468) $ 0 $ 416,155 $ 462,309 $ (91,050) $ 26,541 $ 18,501 $ (527,248) $ (573,258) - - - - - $ (23,428) $ 5,072 $ 18,501 $ (111,093) $ (110,949) 1Q 2021 2Q 2021 3Q 2021 Revenue Cost of Revenue Gross Profit Operating Expenses Acquisitions Costs Sales & Marketing Product & Technology General & Administrative Total Operating Expenses Core Operating Profit Other Expenses Interest Expense F o r eig n C u rr en c y Lo s s Total Other Expenses Net income (loss) Depreciation EBITDA $ 10 , 794 12,260 $ 33 , 833 12,465 $ 41,356 0 $ ( 1 , 466) $ 21 , 368 $ 41 , 356 $ - 39 , 253 505,935 1 , 593 , 712 $ - 234 , 691 603,445 1 , 189 , 409 $ 139 , 235 964,837 1 , 176 , 848 1 , 340 , 042 $ 2 , 138 , 899 $ 2 , 027 , 545 $ 3 , 620 , 961 $ ( 2 , 140 , 365) $ ( 2 , 006 , 177) $ ( 3 , 579 , 606) $ 600 , 406 9,961 $ 367 , 215 2,269 $ 368 , 001 10,005 $ 610,367 $ 369,483 $ 378,006 $ ( 2 , 750 , 732) - $ ( 2 , 375 , 660) 12,346 $ ( 3 , 957 , 611) 178,339 $ ( 2 , 140 , 365) $ ( 1 , 993 , 831) $ ( 3 , 401 , 267) Income Statement (1)
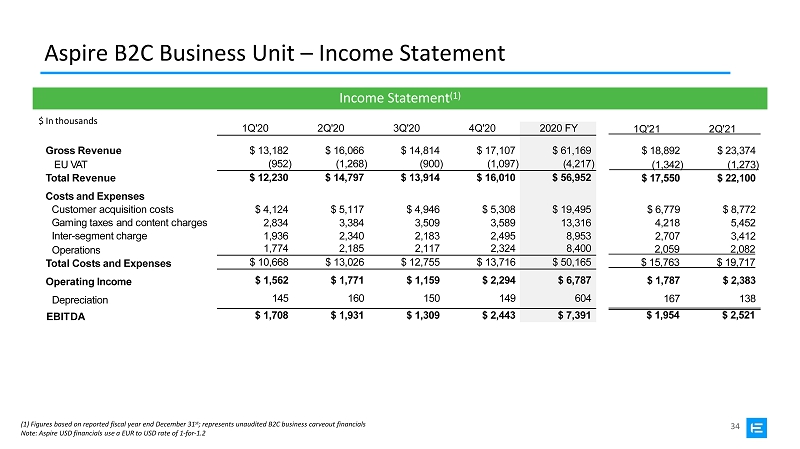
34 Aspire B2C Business Unit – Income Statement (1) Figures based on reported fiscal year end December 31 st ; represents unaudited B2C business carveout financials Note: Aspire USD financials use a EUR to USD rate of 1 - for - 1.2 1Q'20 2Q'20 3Q'20 4Q'20 202 0 F Y $ 13 , 182 (952) $ 16 , 066 (1,268) $ 14 , 814 (900) $ 17 , 107 (1,097) $ 61 , 169 (4,217) $ 12 , 230 $ 14 , 797 $ 13 , 914 $ 16 , 010 $ 56 , 952 $ 4 , 124 $ 5 , 117 $ 4 , 946 $ 5 , 308 $ 19 , 495 2,834 3,384 3,509 3,589 13,316 1,936 2,340 2,183 2,495 8,953 1,774 2,185 2,117 2,324 8,400 $ 10 , 668 $ 13 , 026 $ 12 , 755 $ 13 , 716 $ 50 , 165 $ 1 , 562 $ 1 , 771 $ 1 , 159 $ 2 , 294 $ 6 , 787 145 160 150 149 604 $ 1 , 708 $ 1 , 931 $ 1 , 309 $ 2 , 443 $ 7 , 391 1Q'21 2Q'21 $ 18 , 89 2 $ 23 , 374 ( 1 , 342 ) ( 1 , 273) $ 17 , 55 0 $ 22 , 100 Gross Revenue E U VAT Total Revenue Costs and Expenses Customer acquisition costs G a m in g t a x e s an d c on t en t c ha r ges Inter - segment charge Operations Total Costs and Expenses Operating Income Depreciation E B I T DA $ 6 , 779 4,218 2,707 $ 8 , 772 5,452 3,412 2,059 2,082 $ 15 , 76 3 $ 19 , 71 7 $ 1 , 787 167 $ 2 , 383 138 $ 1 , 954 $ 2 , 521 Income Statement (1) $ In thousands

Appendix B: Esports Industry Information

36 Viewership Age Demographic Sports L e a gues Esports Under 55 yrs. 50% - 75% 92% Esports Market Overview Esports describes the world of competitive, organized video gaming. Competitors from different leagues or teams face off in the same games that are popular with at - home gamers such as Fortnite, League of Legends, Counter - Strike, Call of Duty, Overwatch and Madden NFL Massive Audience with Attractive Demographics Enormous Number of Events / Wagering O pp ort un iti es Rapidly Increasing Regulation and Revenue • Esports reaches a younger and more attractive demographic of ages between 18 – 44 • Streaming services such as Twitch and YouTube allow users to watch live streams of their favorite professional players and enables streamers to communicate in real - time with fans • Esports viewership had grown more than fivefold since 2015, from ~100M viewers to ~550M+ viewers, 250M+ are considered hardcore Note: The Global Games Market includes sales of hardware and software as well as esports industry revenue Source: Wall Street Research, Newzoo • Esports events in 2021: 500+ tournaments and 14,000+ games, streamed in 50+ markets • Increasing number of events with large prize pools and investments in more franchise style leagues: Doda 2 prize pool of $40M vs. Masters (golf) prize pool of $12M • The NFL generates $16B in revenue from its fan base while $64B in legal wagers are made on the NFL in an immature U.S. betting market • Established betting sites not catering to the younger bettor • Global esports revenue was $947M in 2020, and is expected to grow 14.5% to $1.1B in 2021 • 2020 esports revenue equates to under $2.00 per fan, which is estimated to be less than ~10% of what the NHL, NBA, MLB, and NFL generate in aggregate • Over 75% of 2021 revenue is forecasted to come from sponsorship and media rights deals with the balance from ticketing, merchandise, and promoter and game publisher fees 2 0 20 2 0 21E 2 0 24E 300 250 550 0 100 200 300 400 500 600 160 80 80 NFL Esports R eg u l ar V ie w er s Ha rd c o r e V i e w er s In millions of people eSports Market Revenue In millions of dollars $ 1,617 . 7 $ 1,084 . 1 $ 947.1
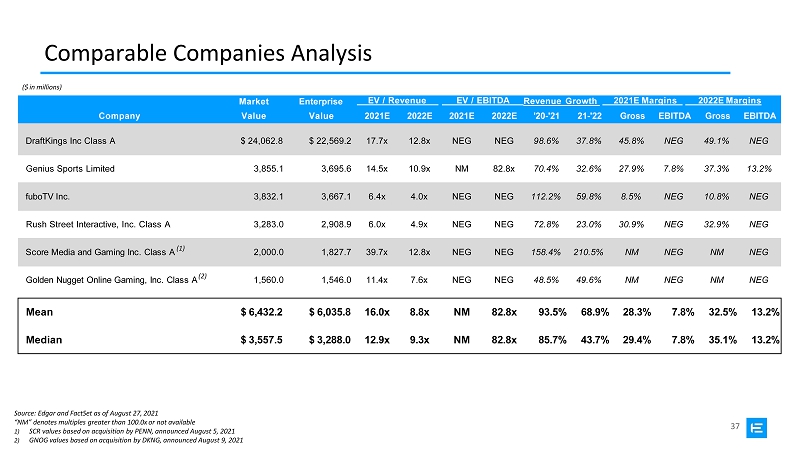
37 Comparable Companies Analysis Market Enterprise EV / Revenue EV / EBITDA Revenue Growth 2021E Margins 2022E Margins Company Value Value 2021E 2022E 2021E 2022E '20 - '21 21 - '22 Gross EBITDA Gross EBITDA DraftKings Inc Class A $ 24,062.8 $ 22,569.2 17.7x 12.8x NEG NEG 98.6% 37.8% 45.8% NEG 49.1% NEG Genius Sports Limited 3,855.1 3,695.6 14.5x 10.9x NM 82.8x 70.4% 32.6% 27.9% 7.8% 37.3% 13.2% fuboTV Inc. 3,832.1 3,667.1 6.4x 4.0x NEG NEG 112.2% 59.8% 8.5% NEG 10.8% NEG Rush Street Interactive, Inc. Class A 3,283.0 2,908.9 6.0x 4.9x NEG NEG 72.8% 23.0% 30.9% NEG 32.9% NEG S c o r e M ed i a an d G a m i n g I n c . C l a s s A (1) 2,000.0 1,827.7 39.7x 12.8x NEG NEG 158.4% 210.5% NM NEG NM NEG G o l de n N ugge t O n li n e G a m i ng , I n c . C l a s s A (2) 1,560.0 1,546.0 11.4x 7.6x NEG NEG 48.5% 49.6% NM NEG NM NEG Mean $ 6,432.2 $ 6,035.8 16.0x 8.8x NM 82.8x 93.5% 68.9% 28.3% 7.8% 32.5% 13.2% Median $ 3,557.5 $ 3,288.0 12.9x 9.3x NM 82.8x 85.7% 43.7% 29.4% 7.8% 35.1% 13.2% Source: Edgar and FactSet as of August 27, 2021 “NM” denotes multiples greater than 100.0x or not available 1) SCR values based on acquisition by PENN, announced August 5, 2021 2) GNOG values based on acquisition by DKNG, announced August 9, 2021 ($ in millions)