Exhibit 99.2

United Homes Group (“UHG”) September 202 2 Investor Presentation

Table of Contents I. Executive Summary II. Macro Housing Overview III. Operational Overview IV. UHG Growth Strategy V. Financial Summary
I. Executive Summary

4 UHG + DiamondHead = Uniquely Positioned Partnership Combination creates a publicly listed homebuilder capitalizing on key industry trends DiamondHead's Acquisition Criteria Competitive Differentiation Attractive Growth Profile Proven Operating History Desired Product Set Fundamental Value with Significant Upside Attractive Long Term Industry Tailwinds 1 3 4 5 2 6 UHG Checks All T h e Boxes One of the largest private homebuilders in the Southeast with access to ~11K lots in high - demand submarkets +16% organic delivery CAGR (1) , accretive M&A and a programmatic build to rent (BTR) vertical has the potential to drive better than industry growth at all points in the cycle Led by Michael Nieri, UHG has delivered 11K plus homes and currently ranks as a top 50 national homebuilder (2) First time and move up home buyers comprise nearly 80% of UHG sales Attractive margins and returns position the company favorably relative to existing public comps 2021 National Association of Realtors study estimated that the United States is 5.5 to 6.8 million homes homes short of demand relative to households formed (3) Source: (1) Represents deliveries generated from 2019 to 2021. (2) 2022 Builder 100 from Builder Online. (3) National Association of Realtors
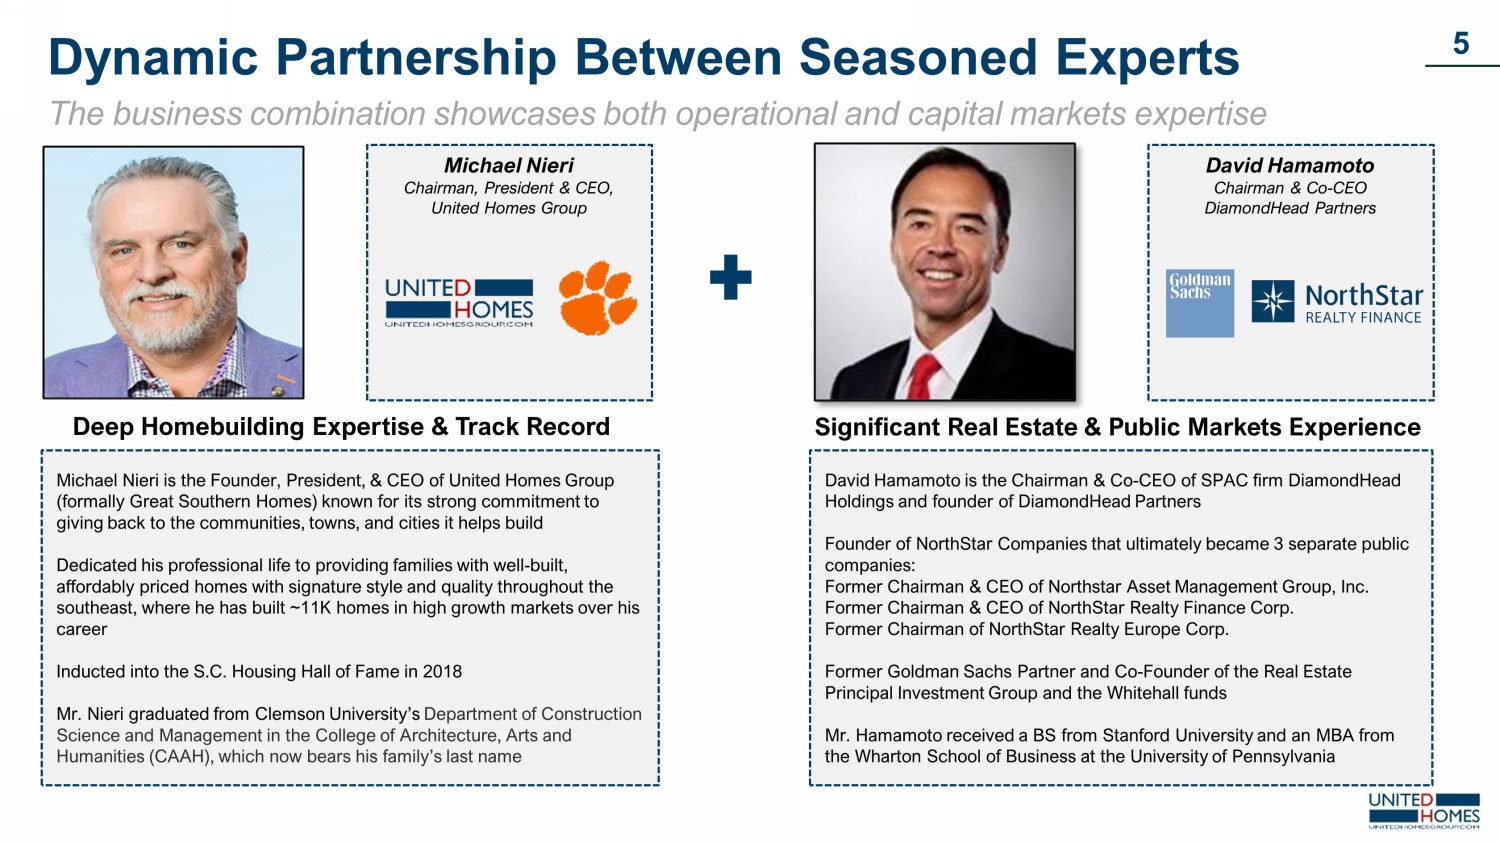
Michael Nieri Chairman, President & CEO, United Homes Group Dynamic Partnership Between Seasoned Experts The business combination showcases both operational and capital markets expertise 5 Michael Nieri is the Founder, President, & CEO of United Homes Group (formally Great Southern Homes) known for its strong commitment to giving back to the communities, towns, and cities it helps build Dedicated his professional life to providing families with well - built, affordably priced homes with signature style and quality throughout the southeast, where he has built ~11K homes in high growth markets over his career Inducted into the S.C. Housing Hall of Fame in 2018 Mr. Nieri graduated from Clemson University’s Department of Construction Science and Management in the College of Architecture, Arts and Humanities (CAAH), which now bears his family’s last name Deep Homebuilding Expertise & Track Record David Hamamoto Chairman & Co - CEO DiamondHead Partners Significant Real Estate & Public Markets Experience David Hamamoto is the Chairman & Co - CEO of SPAC firm DiamondHead Holdings and founder of DiamondHead Partners Founder of NorthStar Companies that ultimately became 3 separate public companies: Former Chairman & CEO of Northstar Asset Management Group, Inc. Former Chairman & CEO of NorthStar Realty Finance Corp. Former Chairman of NorthStar Realty Europe Corp. Former Goldman Sachs Partner and Co - Founder of the Real Estate Principal Investment Group and the Whitehall funds Mr. Hamamoto received a BS from Stanford University and an MBA from the Wharton School of Business at the University of Pennsylvania
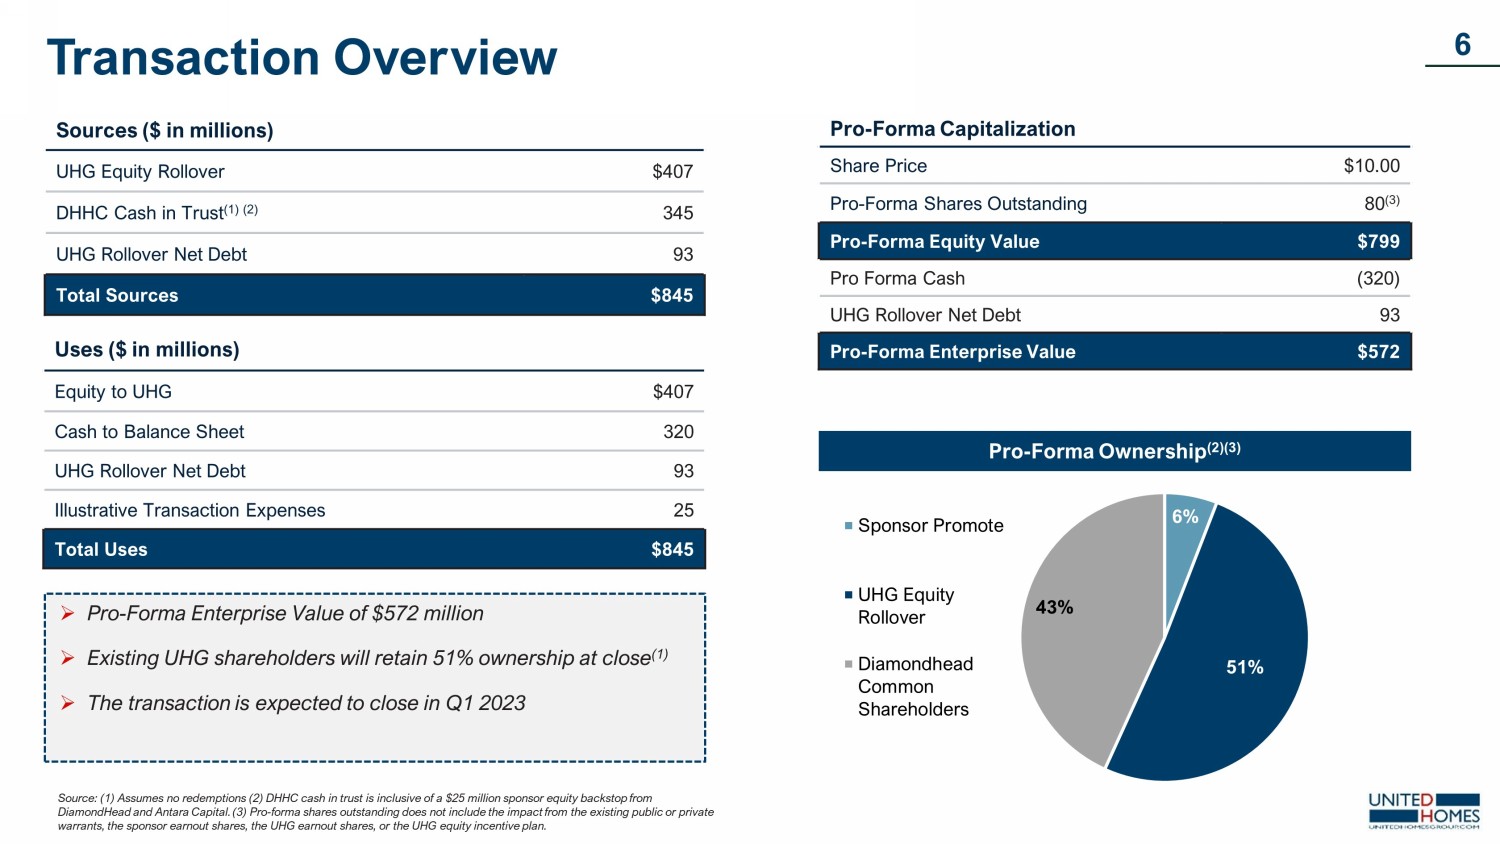
6 Pro - Forma Capitalization Share Price $10.00 Pro - Forma Shares Outstanding 80 (3) Pro - Forma Equity Value $799 Pro Forma Cash (320) UHG Rollover Net Debt 93 Pro - Forma Enterprise Value $572 Pro - Forma Ownership (2)(3) Sources ($ in millions) UHG Equity Rollover $407 DHHC Cash in Trust (1) (2) 345 UHG Rollover Net Debt 93 Total Sources $845 Uses ($ in millions) Equity to UHG $407 Cash to Balance Sheet 320 UHG Rollover Net Debt 93 Illustrative Transaction Expenses 25 Total Uses $845 » Pro - Forma Enterprise Value of $ 572 million » Existing UHG shareholders will retain 51% ownership at close (1) » The transaction is expected to close in Q1 2023 Transaction Overview Source: (1) Assumes no redemptions (2) DHHC cash in trust is inclusive of a $25 million sponsor equity backstop from DiamondHead and Antara Capital. (3) Pro - forma shares outstanding does not include the impact from the existing public or private warrants, the sponsor earnout shares, the UHG earnout shares, or the UHG equity incentive plan. 6% 51% 43% Sponsor Promote UHG Equity Rollover Diamondhead Common Shareholders

Key Facts » HQ : C olumbia, SC » Employees: 160+ » 202 3 E Rev: $630.2 million » 202 3 E EBITDA: $118.2 million 7 Great Southern Homes is being r ebranded under the parent c ompany United Homes Group Michael Nieri is awarded the Richard N. Sendler award by the Central South Carolina Building Industry Association C o l u m b ia GSH HQ Charleston C l e m s on Myrtle Beach Florence Sumter Aiken / Augusta » ~ 1 6% delivery CAGR from 2019 to 2021 » ~669 bps of gross margin expansion from FY 2019 to Q2 2022 » 10 of the top 15 fastest growing markets in the United States within 500 miles (1) » Active M&A discussions with builders in - market » 91 %+ of lots optioned » Growing programmatic build - to - rent (“BTR”) partnerships Great Southern Homes (“GSH”) was founded Michael Nieri built his first home GSH declared 3 rd fastest growing private builder in America Michael Nieri inducted into South Carolina Housing Hall of Fame GSH rises to 44 th on the Builders 100 list GSH wins 5 Pinnacle Awards, including Best Achievement in Energy Efficiency GSH builds it’s 10,000 th home GSH declared 8 th fastest growing private builder in America by Builder Magazine GSH recognized as ‘The Best Builder in the State’ for a 3 rd consecutive year by the State Newspaper Michael Nieri wins 2020 Hearthstone Award for his community contributions UHG’s Ongoing History of Excellence Note: Cities mentioned in the state picture represent major cities in South Carolina & where UHG has held operations at one point in time. Source: (1) U.S. Census Bureau (2) Probuilder.com rankings by types of homes built. 2018 2017 2004 1993 2018 2019 2020 2020 2020 2020 2021 2022 Ranked as the 25 th & 41 st builder nationally for starter & single - family home types (2)

Source: (1) Company model. ( 2 ) Reference page 32 for UHG's targeted M&A opportunity set and calculations of how total closings were derived. (3) U.S. Census Bureau (BOC); Moody's Analytics Estimated and Forecasted 2022 Housing Starts. (4) US Census Bureau. (5) reference page 35 for additional info. 8 UHG has multiple levers to drive strong growth rates throughout all points of the housing cycle Strong organic growth of ~16% delivery CAGR from 2019 to 2021 (1) , along with solid tailwinds in UHG’s core markets position the Company for high in - market growth 1 Organic Growth (In - Market Growth) 2 Based upon 2022 estimated housing starts of 542,886 in UHG’s desired states, a 1% market share would generate ~5,429 closings (2)(3) Accretive M&A 3 The single - family rental market in the U.S. is valued at $4.4 trillion representing a significant upside opportunity for UHG (4) Build - to - Rent Mortgage JV & other ancillary services present an opportunity for incremental high margin EBITDA (5) 4 Mortgage JV & Ancillary Services Significant Shareholder Value & Upside Opportunity

Land - Light Model Provides a Competitive Advantage UHG is strategically positioned to outperform the operating models of traditional homebuilders Traditional Model Land - Light Model Higher ROE Optioned land provides a higher return on capital with more flexibility De - Risks Balance Sheet Land mostly held by 3 rd parties & drawn down on demand through option contracts, which de - risks the company and investors during unfavorable points in a housing cycle Optimal Lot Purchase Times Land development companies produce finished lots for UHG to purchase as close to the start of the home as possible Lower ROE Land ownership is capital intensive and return dilutive through housing cycles Capital and Balance Sheet Intensive Land acquired & held on balance sheet, builders carry higher market risk through housing cycles Static Lot Takedown Schedule Land - heavy builders have limited flexibility with lot purchases Land - Light Homebuilders Have Historically Traded at Higher Valuation Multiples Than Traditional Homebuilders Driven Primarily by Their Lower Risk & Higher Capital Efficiency Profile (1) 9 Source: (1) See page 10 & 23 for empirical data on performance of land - light vs. traditional homebuilders.
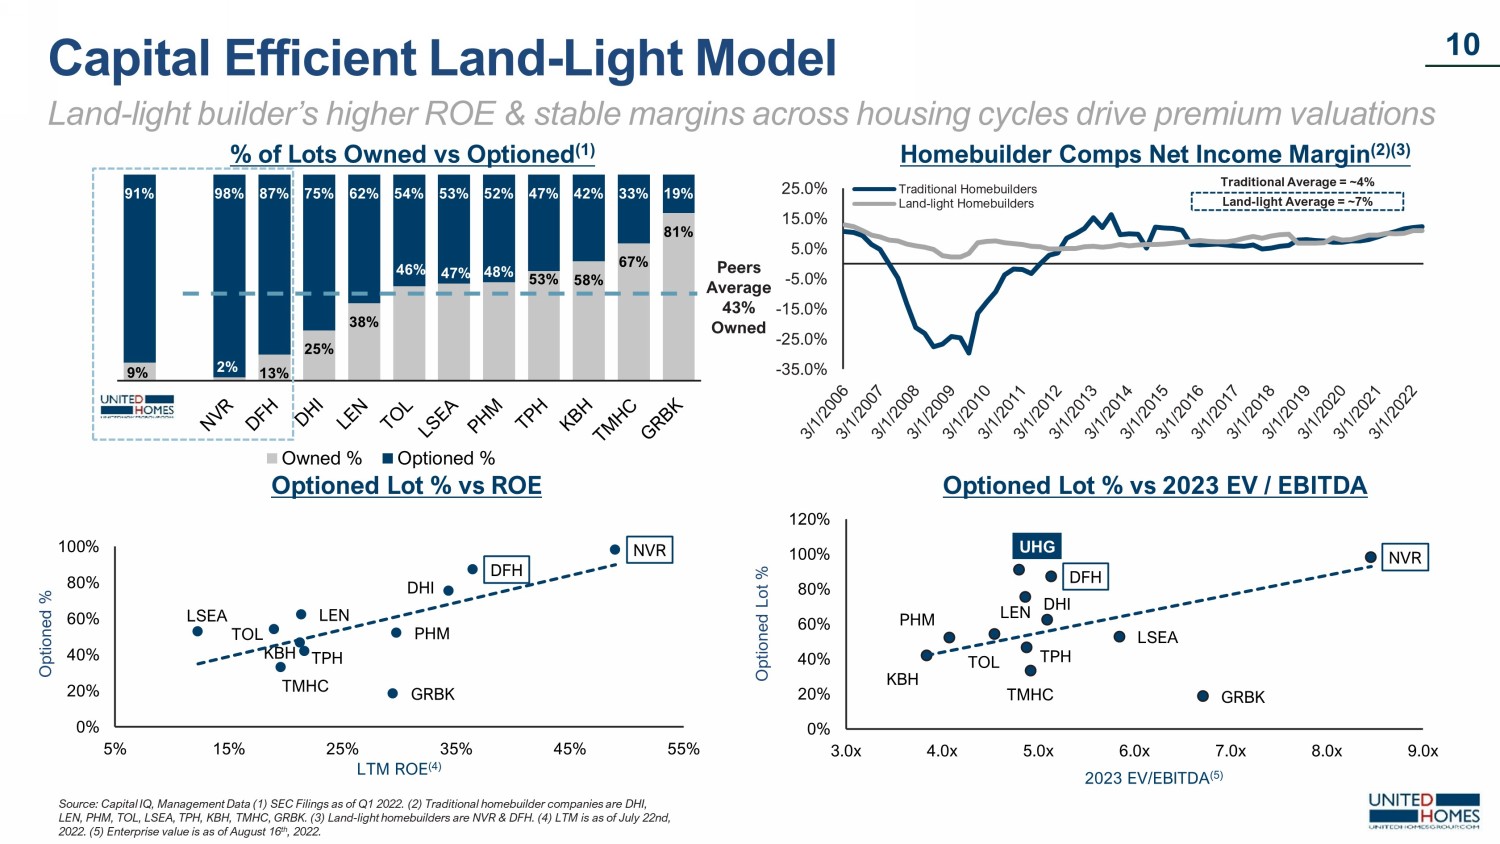
9% 2% 13% 25% 38% 46% 47% 48% 53% 58% 67% 81% 91% 98% 87% 75% 62% 54% 53% 52% 47% 42% 33% 19% Owned % Optioned % -35.0% -25.0% -15.0% -5.0% 5.0% 15.0% 25.0% Traditional Homebuilders Land-light Homebuilders 10 % of Lots Owned vs Optioned (1) Peers Average 43% Owned Optioned % LTM ROE (4) Optioned Lot % vs ROE Capital Efficient Land - Light Model Optioned Lot % vs 2023 EV / EBITDA 2023 EV/EBITDA (5) Homebuilder Comps Net Income Margin (2)(3) Traditional Average = ~4% Land - light Average = ~7% Optioned Lot % DHI NVR LEN PHM DFH LSEA TMHC TPH KBH TOL GRBK 0% 20% 40% 60% 80% 100% 5% 15% 25% 35% 45% 55% Land - light builder’s higher ROE & stable margins across housing cycles drive premium valuations Source: Capital IQ, Management Data (1) SEC Filings as of Q1 2022. (2) Traditional homebuilder companies are DHI, LEN, PHM, TOL, LSEA, TPH, KBH, TMHC, GRBK. (3) Land - light homebuilders are NVR & DFH. (4) LTM is as of July 22nd, 2022. (5) Enterprise value is as of August 16 th , 2022. DHI NVR LEN PHM DFH LSEA TMHC TPH KBH TOL GRBK UHG 0% 20% 40% 60% 80% 100% 120% 3.0x 4.0x 5.0x 6.0x 7.0x 8.0x 9.0x

Rapid population & job growth in the southeast presents a dynamic opportunity for UHG 11 Comparison of UHG Markets to National Averages C l e m s on Savannah Charlotte Columbia Charleston Jacksonville Atlanta Raleigh Nashville Tallahassee Knoxville Greensboro Birmingham Richmond Huntsville Montgomery Current UHG Markets (1) UHG Expansion Markets (2) U.S. (3) Population Growth 2016 to 2021 1.1% 0.7% 0.5% Avg. Home Price Appreciation 2016 to 2021 8.2% 8.8% 8.6% Avg. Job Growth 2016 to 2021 1.1% 0.9% 0.2% Favorable Demographics in UHG’s Core Markets Note: Cities displayed in the picture above are illustrative and do not represent a target city. Source: U.S. Census Bureau, National Association of Realtors (NAR), and BLS. (1) Current UHG Market reflects data for SC. (2) UHG Expansion Markets reflect data from AL, FL, GA, NC, TN, & VA. (3) Reflects national average. UHG’s markets have population and employment growth 2x and 5x the national average

The United Homes Group Management Team Tenured management team with deep operational and public company experience 12 Note: (1) Currently CFO of DHHC and will become CFO of UHG post - acquisition Michael Nieri Chairman, President & CEO, UHG Keith Feldman (1) Chief Financial Officer at UHG Dan Goldstein EVP of Finance at UHG Shelton Twine Chief Operating Officer at UHG Tom O’Grady Board Member & CAO at UHG
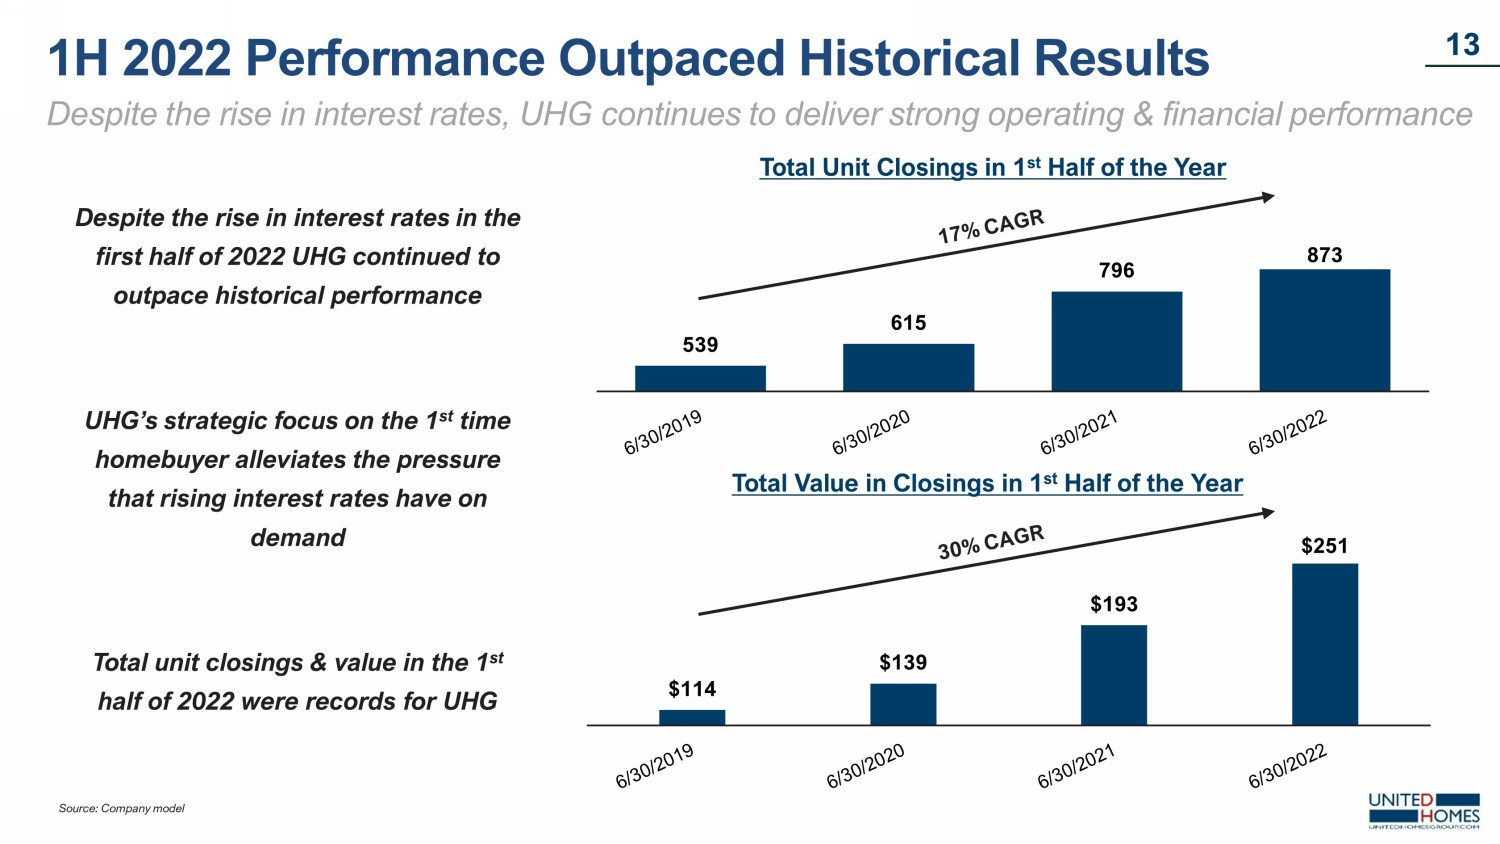
539 615 796 873 13 1H 2022 Performance Outpaced Historical Results Despite the rise in interest rates, UHG continues to deliver strong operating & financial performance Total Unit Closings in 1 st Half of the Year Total Value in Closings in 1 st Half of the Year $114 $139 $193 $251 Despite the rise in interest rates in the first half of 2022 UHG continued to outpace historical performance UHG’s strategic focus on the 1 st time homebuyer alleviates the pressure that rising interest rates have on demand Total unit closings & value in the 1 st half of 2022 were records for UHG Source: Company model
II. Macro Housing Overview

200 400 600 800 1,000 1,200 1,400 1,600 SF Starts Pent-Up Demand 15 Total Housing Starts Normal Production (4) Housing Depression » Sustained underbuilding since 2007 » Shortage of 5.5 to 6.8 million housing units as of June 2021 NAR study » In addition, the U.S. would need to construct more than 2.0M housing units per year for the next 10 years to fill the underbuilding gap » In June of 2022, single - family housing starts fell to 982k (3) » COVID - 19 accelerated existing trends » Increased Demand: Urbanites out - migration in pursuit of larger spaces » Constrained Supply: Institutional investment in single - family rentals removes units from market Cumulative Production Deficit of 5.5 to 6.8 Million Housing Units (Units in 000s) Large Supply & Demand Gap in the U.S. Housing Market Subdued production since the housing crisis has created a multi - year supply deficit (1)(2)(3) Source: (1) US Census Bureau . (2) Freddie Mac. (3) National Association of Realtors. (4) Represents the average annual residential units completed in a year from 1968 – 2000.

“ The many fundamental drivers that have supported the housing market in recent years remained firmly in place. These include favorable demographics, with 150 million millennials and baby boomers experiencing life events that are driving home demand. The supply and demand imbalance resulting from over a decade of underproduction…” – Douglas C. Yearley , JR. – Chairman & CEO, Toll Brothers Toll Brothers Earnings Call, 5/25/22 9.6 1.7 0.0 2.0 4.0 6.0 8.0 10.0 12.0 16 U.S Median Days on Market (2) U.S Rental Vacancy Rate (2) 0 20 40 60 80 100 120 Average: 63 5.8% 5% 6% 7% 8% 9% “ We believe the factors underlying long term demand continue to be healthy, particularly with respect to demographics and the work - from - home trends, coupled with an ongoing under - supply of new homes and low existing home inventory.” – Jeff Mezger – Chairman, President & CEO, KB Homes KB Homes Earnings Call, 6/22/22 U.S. Housing Inventory (1) (Months Supply) “The supply of both new and resale homes at affordable prices remains limited.” – David Auld – President & CEO, D.R. Horton DR Horton Earnings Call, 7/21/22 Historical U.S. Housing and Rental Data U.S. housing supply remains at or near historic lows Source: (1) Bloomberg. (2) FRED, Federal Reserve Bank of St. Louis.

3.0x 3.2x 3.4x 3.6x 3.8x 4.3x 4.3x 4.1x 3.6x 3.4x 3.4x 3.3x 3.3x 3.6x 3.7x 3.7x 3.8x 3.9x 4.0x 3.9x 4.2x 4.7x 5.3x 3.4x 3.6x 3.9x 4.1x 4.3x 4.7x 4.6x 4.2x 3.8x 3.4x 3.5x 3.3x 3.4x 3.7x 3.9x 4.0x 4.1x 4.1x 4.2x 4.1x 4.4x 5.1x 5.6x 2.9x 3.4x 3.9x 4.4x 4.9x 5.4x 5.9x 6.4x Average Home Price / Average Median Household Income UHG Markets Average Home Price / Average Median Household Income National $0 $70 $140 $210 $280 $350 $420 $490 Georgia South Carolina North Carolina Virginia Alabama Florida Tennessee $423 $349 $306 $321 $262 $324 $423 Homebuyers Continue to Flock to Southeast (2)(3) 17 Note: States included are Florida, Tennessee, Georgia, South Carolina, North Carolina, Virginia, and Alabama. (1) National As soc iation of Realtors, Moody’s Analytics . (2) Public Company Filings. (3) Public companies include BZH, CCS, DHI, HOV, KBH, LEN, MDC, MHO, MTH, NVR, PHM, TMHC, TOL, and TPH. Strong Long - Term Fundamentals in the Southeast UHG Market Affordability (1) UHG Market Employment Growth (1) Median Existing Single - Family Home Price (1) ($ in thousands) +70% -8.0% -6.0% -4.0% -2.0% 0.0% 2.0% 4.0% 6.0% UHG Markets Year-over-Year Growth Rate National Year-over-Year Growth Rate UHG Trailing 5 Year Avg: 1.0% National Trailing 5 Year Avg: 0.2% Southeast housing market fundamentals continue to remain attractive 39,258 36,643 34,576 22,619 13,982 6,083 6,047 1,558 Southwest West Southeast East Mideast Northeast Midwest Other 2016 Closings by Region: Public Homebuilders 85,287 65,430 58,700 43,577 16,256 15,973 5,170 3,611 Southwest West Southeast East Northeast Mideast Midwest Other 2021 Closings by Region: Public Homebuilders

0.0% 2.0% 4.0% 6.0% 8.0% 10.0% 12.0% 14.0% 16.0% 0 200 400 600 800 1000 New Home Sales 30 Year Mortgage Rate Unemployment Rate Source: (1) FRED, Federal Reserve Bank of St. L ouis , (2) Bloomberg, (3) FRED, Federal Reserve Bank of St. Louis Note: R - Squared calculation is from 2013 - 2020 pre - pandemic. New Home Sales vs. 30 Year Mortgage Rate (Units in Thousands) R 2 New Home Sales to Unemployment Rate =.7809 R 2 New Home Sales to 30 Year Mortgage Rate =.0032 New Home Sales Activity Shows a Stronger Correlation to the Unemployment Rate than Mortgage Rates & the U.S. Economy Continues to Operate Near Historic Unemployment Lows (1) (2) (3) New Home Sale Trend Line 18 Historical Relationship Between Mortgage Rates & Housing New home sales activity has shown minimal correlation to interest rates since 2013 (Unemployment Rate)

Single - Family Rentals Make - up 1/3 rd of U.S. Rentals (1) Cumulative Investor Commitments to SFR <$50B (2) Single - Family Rents Are Up More Than 13% YoY (3) The Current Single - Family - Rental Yield is ~6% (2) Nationally SFR rents have been increasing over 10% annually in recent years driven by the same dynamics as the for - sale market - limited supply and growing demand SFR investors are increasingly focused on acquiring newly built communities due to lower operating costs and better rental pricing power UHG’s geographical footprint & affordable product provides investors unique exposure to these trends, driving incremental demand & generating more sales 19 Single - Family Rental (SFR) Market Construction of new SFR units supplies an unmet investor demand for units in the sunbelt markets Source: (1) Bloomberg, (2) John Burns Real Estate Consulting, (3) CoreLogic, ATTOM, Housingwire , Hunter Housing Economics. Note: US Rollup is a weighted average of 99 markets *Metropolitan division **Combination of metropolitan divisions, except Raleigh - Durham which is a combination of metros.

III. Operational Overview

21 » UHG is one of the largest production homebuilders - and one of the lowest cost producers - in its markets » UHG produced attractive profit margins in 2021: x Higher gross profit margins than the land - light public peer group x Significant flexibility to build rentals to desired yields » Entry - level and 1 st time move - up buyers comprised nearly ~80% of UHG’s total closings in 2021 x UHG is intimately familiar with the entry - level buyer and single - family renter demographic x UHG’s land supply has been specifically curated to accommodate the affordable and build - to - rent (“BTR”) product » Strong tailwinds persist in the entry & 1 st move - up segment (1) x 80.6 million Americans aged 18 to 35 x ~81% of all U.S. homebuyers in 2021 purchased a single - family detached home x Entry - level and 1 st move - up home starts are at a 5 - decade low with significant upside; market is supply constrained » Purchases by entry level homebuyers are more driven by life changing circumstances and necessity than select macro factors, like interest rates 2021 Revenue By Buyer Segment Entry Level (<$250K) 46% 1st Move Up ($251K - $299K) 34% 2nd Move Up ($300K - $375K) 10% 3rd Move Up (>$376K) 4% BTR 6% Affordable Entry - Level Focus UHG’s core product is focused on affordability & aligns with consumer demand Source: (1) U.S. Census Bureau and 2021 NAR Home Buyer and Seller Generational Trends report.
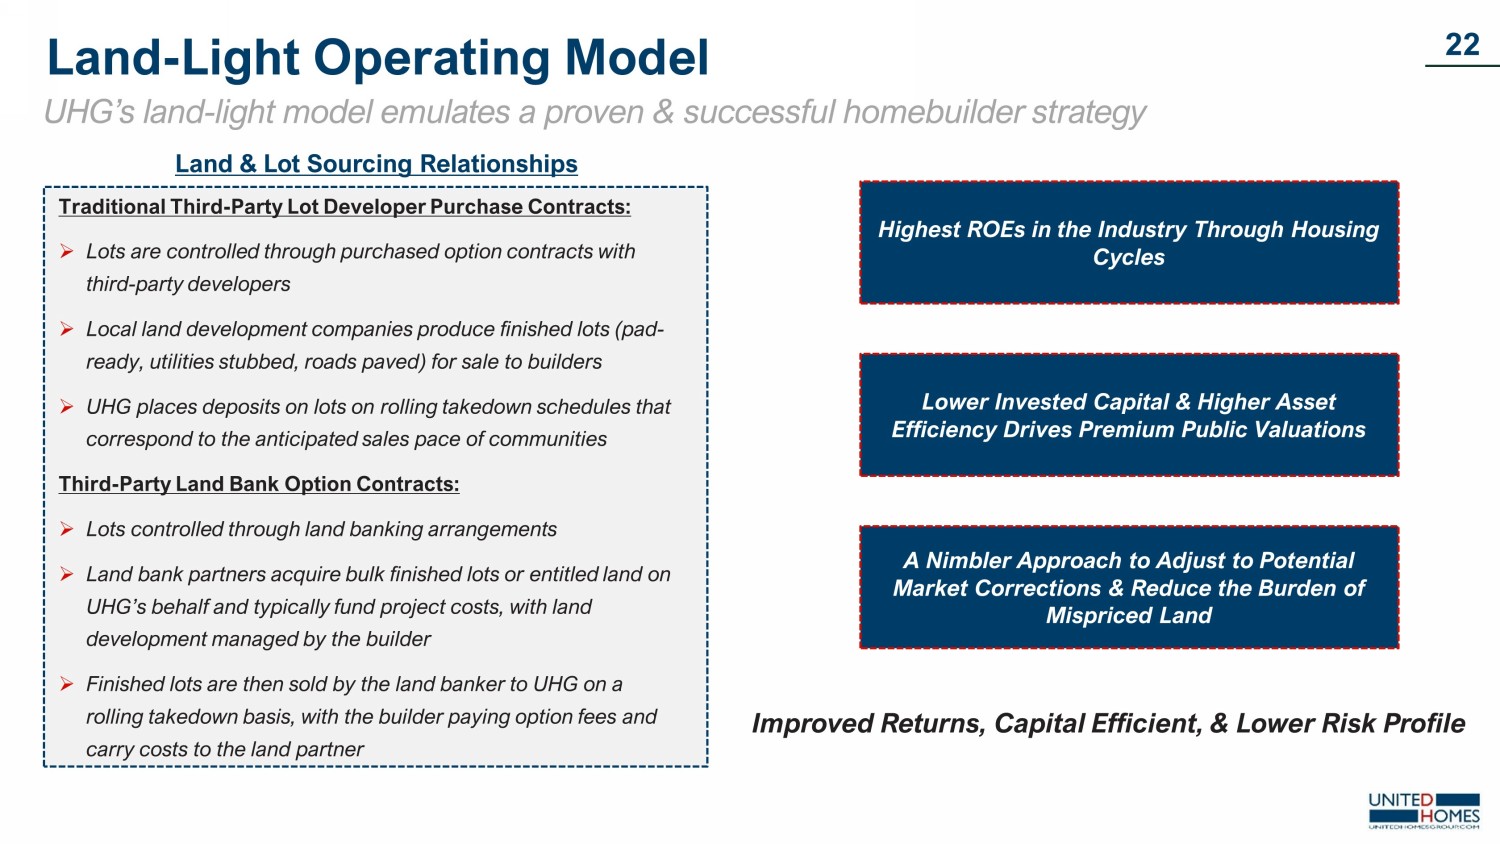
22 Land & Lot Sourcing Relationships Traditional Third - Party Lot Developer Purchase Contracts: » Lots are controlled through purchased option contracts with third - party developers » Local land development companies produce finished lots (pad - ready, utilities stubbed, roads paved) for sale to builders » UHG places deposits on lots on rolling takedown schedules that correspond to the anticipated sales pace of communities Third - Party Land Bank Option Contracts: » Lots controlled through land banking arrangements » Land bank partners acquire bulk finished lots or entitled land on UHG’s behalf and typically fund project costs, with land development managed by the builder » Finished lots are then sold by the land banker to UHG on a rolling takedown basis, with the builder paying option fees and carry costs to the land partner Highest ROEs in the Industry Through Housing Cycles Improved Returns, Capital Efficient, & Lower Risk Profile Lower Invested Capital & Higher Asset Efficiency Drives Premium Public Valuations A Nimbler Approach to Adjust to Potential Market Corrections & Reduce the Burden of Mispriced Land Land - Light Operating Model UHG’s land - light model emulates a proven & successful homebuilder strategy

$99,498 $152,574 $232,265 $246,542 $313,873 $378,117 $383,871 $445,382 $462,017 $573,507 $587,134 $882,866 UHG NVR DFH DHI LSEA KBH PHM LEN GRBK TPH TMHC TOL 23 11 11 10 9 6 6 6 4 3 3 3 NVR DHI LEN TOL MTH BZH KBH WLH MHO HOV MDC PHM Less Capital Required Per Closing (1) 23 % of Builders Generating Free Cash Flow Through Last Housing Cycle (2) Number of Profitable Quarters from Q1 2006 to Q4 2011 (4) Quarterly EBIT Margin Through Last Housing Cycle 2006 - 2011 (3) Homebuilder Comps (3) vs. NVR (2006 - 2014) Mean Homebuilder Profitable Quarters in Downturn = 8 Note: These charts are to display how land – light and traditional homebuilders performed through the last housing cycle. Source: CapIQ , Public Filings. (1) Asset efficiency = [(Assets - Cash) / 2021 Closings]. (2) Defined as cash inflows exceed cash outflows. (3) Includes BZH, DHI, HOV, KBH, LEN, MDC, MHO, MTH, PHM, TOL, and WLH. (4) Profitability as measured by Pre - Tax Net Income. Consistent Financial Performance & Superior Returns Empirical evidence that land - light homebuilders generate consistent returns through housing cycles 27% 91% 100% 91% 64% 18% 27% 18% 18% 100% 0% 20% 40% 60% 80% 100% 120% -10.0% -5.0% 0.0% 5.0% 10.0% 15.0% 20.0% 25.0% NVR HB Comps
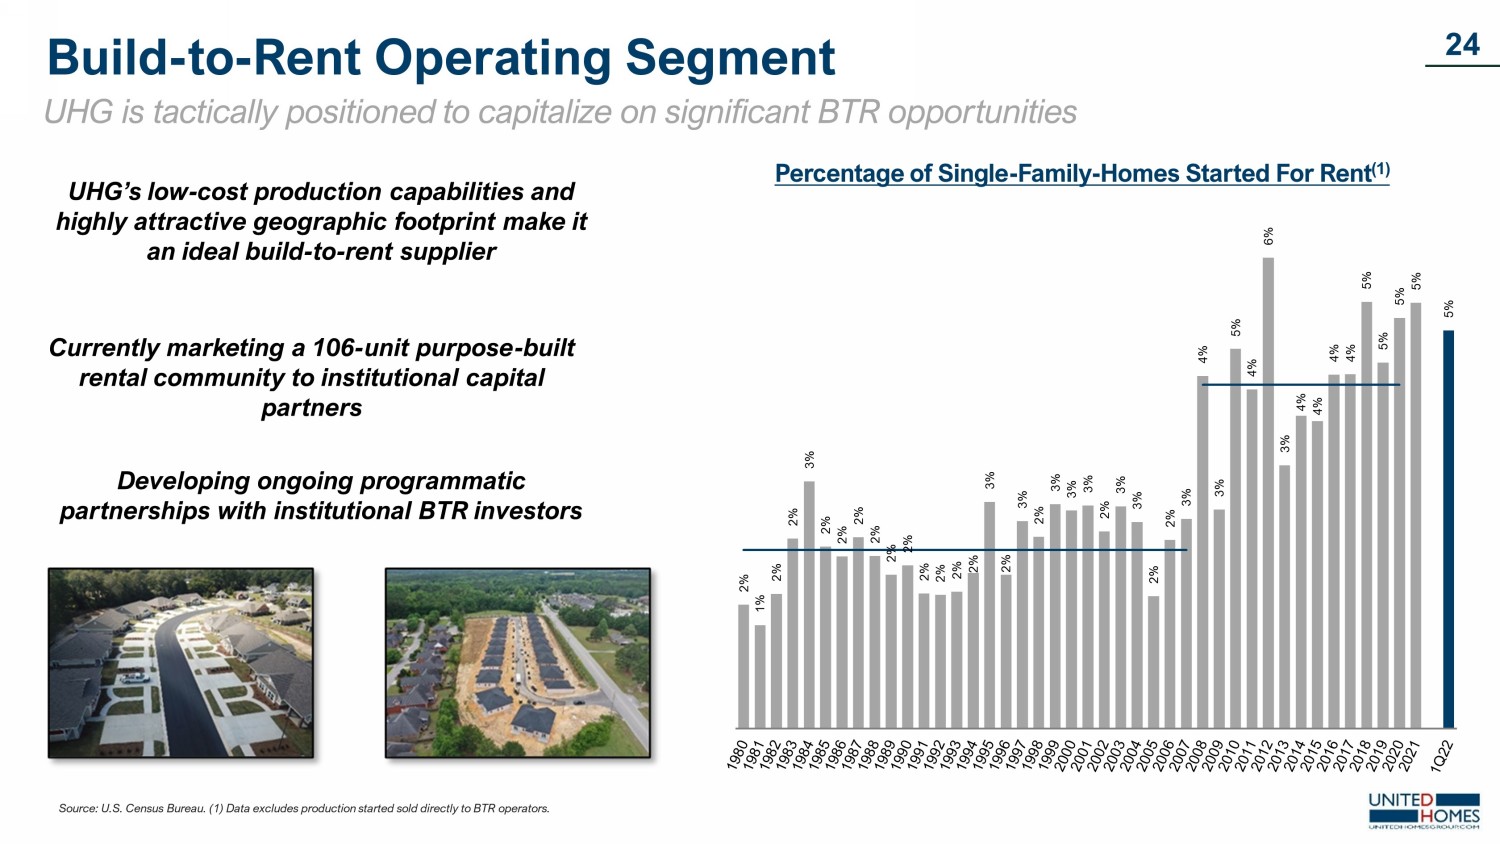
2% 1% 2% 2% 3% 2% 2% 2% 2% 2% 2% 2% 2% 2% 2% 3% 2% 3% 2% 3% 3% 3% 2% 3% 3% 2% 2% 3% 4% 3% 5% 4% 6% 3% 4% 4% 4% 4% 5% 5% 5% 5% 5% Percentage of Single - Family - Homes Started For Rent (1) Source: U.S. Census Bureau. (1) Data excludes production started sold directly to BTR operators. UHG’s low - cost production capabilities and highly attractive geographic footprint make it an ideal build - to - rent supplier Currently marketing a 106 - unit purpose - built rental community to institutional capital partners Developing ongoing programmatic partnerships with institutional BTR investors 24 Build - to - Rent Operating Segment UHG is tactically positioned to capitalize on significant BTR opportunities
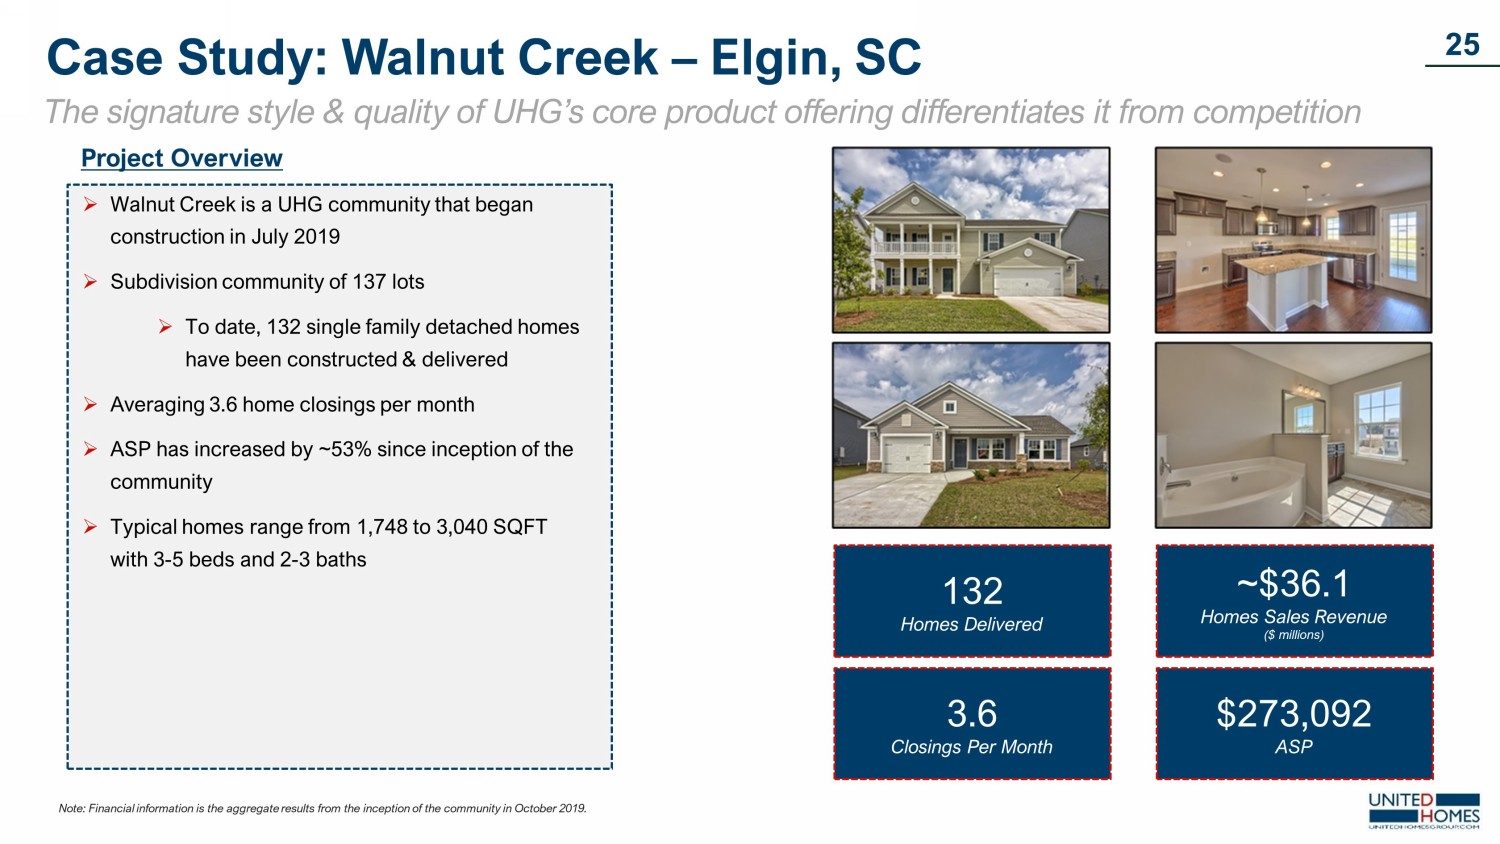
132 Homes Delivered 3.6 Closings Per Month ~$36.1 Homes Sales Revenue ($ millions) $273,092 ASP » Walnut Creek is a UHG community that began construction in July 2019 » Subdivision community of 137 lots » To date, 132 single family detached homes have been constructed & delivered » Averaging 3.6 home closings per month » ASP has increased by ~53% since inception of the community » Typical homes range from 1,748 to 3,040 SQFT with 3 - 5 beds and 2 - 3 baths Note: Financial information is the aggregate results from the inception of the community in October 2019. Project Overview 25 Case Study: Walnut Creek – Elgin, SC The signature style & quality of UHG’s core product offering differentiates it from competition

Project Overview 89 Homes Delivered 4.9 Closings Per Month ~$24.9 Homes Sales Revenue ($ millions) $279,467 ASP » Harvest Glen is a UHG community that began construction in December 2020 » Subdivision community of 160 lots » To date, 89 single family detached homes have been constructed & delivered » Averaging 4.9 home closings per month » ASP has increased by ~43% since inception of the community » Typical homes range from 1,296 to 3,040 SQFT with 3 - 5 beds and 2 - 3 baths Note: Financial information is the aggregate results from the inception of the community in October 2019. 26 Case Study: Harvest Glen – Piedmont, SC The signature style & quality of UHG’s core product offering differentiates it from competition

Michael Nieri Chairman, President & CEO, UHG Tom O’ Grady Board Member & Chief Administrative Officer at UHG James Clements Board Member & President of Clemson University Nikki Haley Board Member & Former Governor of South Carolina and U.S. Ambassador to the U.N. David Hamamoto (1) Chairman & Co - CEO, DiamondHead Holdings Michael Bayles (1) Board Member, Co - CEO DiamondHead Holdings Note: (1) David Hamamoto and Michael Bayles will be joining UHG’s Board of Directors after the D eSPAC transaction closes. 27 Seasoned Board Provides Deep Strategic Insight UHG’s board members have seasoned experience across multiple industries Alan Levine Board Member & Former President/ General Manager of Enterprise Holdings South Florida Group Robert Dozier Board Member & President/COO at First Reliance Bank Jason Enoch Board Member & Former Partner at Deloitte Eric Bland Founder & Partner, Bland Richter

IV. UHG Growth Strategy

29 A strategic buyer of choice, targeting builders in high - value markets with successful track records to expand operationally Expand community count in current operating divisions & continue to expand organically into high growth southeastern markets Expansion of institutional programmatic BTR segment to supplement the end buyer & provide low risk market entry points Increasing profitability & enhancing consumer experience through established mortgage JV & other services UHG’s Growth Strategy Building on the existing operational model to drive incremental growth and scale
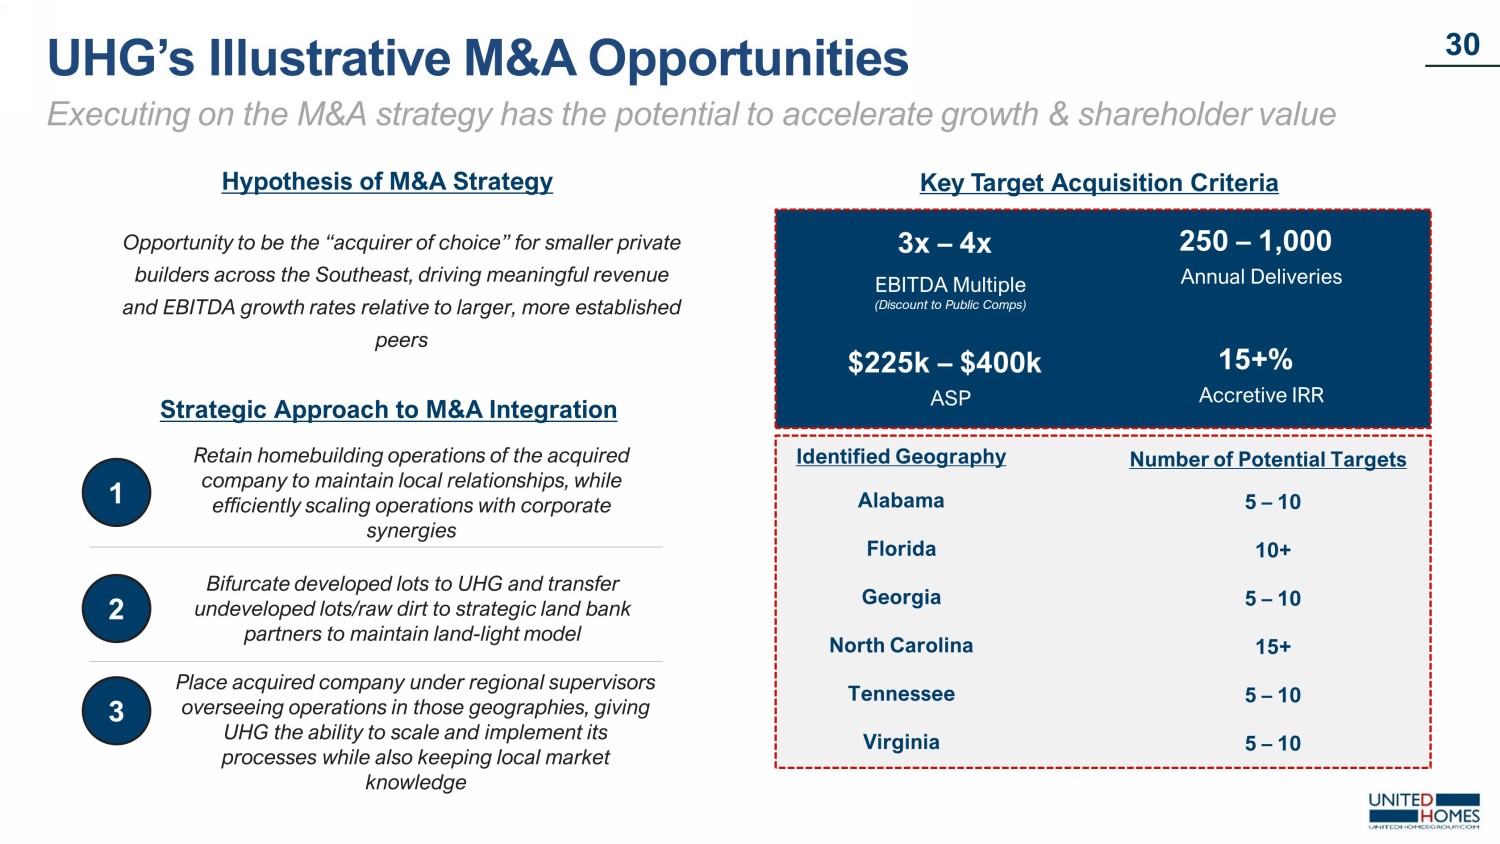
30 Key Target Acquisition Criteria Identified Geography Number of Potential Targets Alabama Florida Georgia North Carolina Tennessee 3x – 4x EBITDA Multiple (Discount to Public Comps) 250 – 1,000 Annual Deliveries $225k – $400k ASP 15+% Accretive IRR Virginia 5 – 10 10+ 5 – 10 15+ 5 – 10 5 – 10 Opportunity to be the “acquirer of choice” for smaller private builders across the Southeast, driving meaningful revenue and EBITDA growth rates relative to larger, more established peers Hypothesis of M&A Strategy Strategic Approach to M&A Integration Retain homebuilding operations of the acquired company to maintain local relationships, while efficiently scaling operations with corporate synergies 1 Bifurcate developed lots to UHG and transfer undeveloped lots/raw dirt to strategic land bank partners to maintain land - light model 2 3 Place acquired company under regional supervisors overseeing operations in those geographies, giving UHG the ability to scale and implement its processes while also keeping local market knowledge UHG’s Illustrative M&A Opportunities Executing on the M&A strategy has the potential to accelerate growth & shareholder value

31 UHG in 2021 Georgia North Carolina ~1,705 Closings ~$433M Revenue Florida Tennessee Alabama Virginia Expansive Array of Regional Acquisition Opportunities Uniquely positioned for regional acquisition strategy with established network of private M&A targets Note: UHG Management believes that being headquartered in the Southeast creates a unique geographical advantage.

32 Columbia Virginia 1% market share of 2022 starts: 413 Implied Revenue: ~$123 million North Carolina 1% market share of 2022 starts: 982 Implied Revenue: ~$291 million Georgia 1% market share of 2022 starts: 761 Implied Revenue: ~$226 million Florida 1% market share of 2022 starts: 2,064 Implied Revenue: ~$613 million Alabama 1% market share of 2022 starts: 222 Implied Revenue: ~$66 million Tennessee 1% market share of 2022 starts: 494 Implied Revenue: ~$147 million United Home Group of Tomorrow Opportunity to develop UHG into a premier Southeast homebuilder (1)(2) Note: 1% market share is purely used for illustrative purpose. Source: (1) U.S. Census Bureau (BOC); Moody's Analytics Estimated and Forecasted 2022 Housing Starts. (2) Revenue numbers reflect the average sales price of ~$297k which is UHG’s 2022E ASP multiplied by 2022E Housing Starts. Targeting a Strategic Acquisition Strategy in One of the Fastest Growing Regions in the United States

33 Illustrative EBITDA Uplift from M&A Acquiring small to mid - size regional homebuilders operating in high growth markets has the potential to drive significant EBITDA upside Incremental Closing s & EBITDA Added from Homebuilder Acquisitions (1)(2) Illustrative Financial Upside from M&A Strategy Significant potential u pside from M&A opportunities Note: (1) Assumes an average sales price of ~$303k per unit which is UHG’s ASP for 2023. (2) Assumes a 12.5% EBITDA margin which was derived from using the average of the small cap public homebuilders. $118.2 $118.2 $118.2 $118.2 $7.6 $11.4 $15.2 2023E UHG EBITDA 200 Unit EBITDA Uplift 300 Unit EBITDA Uplift 400 Unit EBITDA Uplift EBITDA Uplift Baseline EBITDA Forecast $125.8 $129.6 $133.4 +6% Upside +10% Upside +13% Upside

34 Strategic Relationships UHG’s programmatic BTR strategy is centered upon scalable relationships with single - family rental (“SFR”) operators & investors Develop Purpose Built Rental Communities Predetermined takedown schedule to deliver properties over a multiple year period giving investors revenue visibility Predictive Takedown Schedule Focused on constructing communities designed solely for rental properties Scalable platform Ability to scale BTR program to new markets outside of the for - sale business and can use multiple SFR operators Predictive Revenue Model Alleviates Interest Rate Sensitivity Minimal New Market Risk Build - to - Rent (“BTR”) Strategy Overview Differentiated strategy offers a hedge to traditional for sale business

35 Minimal capital required to create scalable mortgage JV that has customer stickiness Allows management to have a valuable backlog conversion function Mortgage JV is accretive to EBITDA margin Monetize customer base in a capital - efficient manner Broker model minimizes risk Homeowners Mortgage TM JV Improved sales, enhanced customer experience & incremental revenues with higher ROE Illustrative 2023 Unit Economics With Minimal Overhead Costs (1) 65.0% 90.0% 2.5% Capture Rate Mortgage LTV Gain on Sale ~$273k Mortgage LTV Per Unit (2) ~$5k Mortgage Revenue Per Unit (3) Note: Capture rate is the percentage of total closings a homebuilder is able to convert into its mortgage JV. Source: (1) Company model. (2) Reflects an average sales price of ~$304k which is UHG’s 2023 ASP. (3) Represents revenue per home pre - JV split of 50%. ~$3.1 (1) Million of EBITDA in 2023 ~65% (1) Capture Rate by 2023 1,138 (1) Captured Units in 2023 Operational Since June 2022

V. Financial Summary

Note: Backlog is defined as h omes under a purchase contract that are signed by homebuyers who have met the preliminary criteria to obtain mortgage financing, but such home sales to end buyers have not yet closed. Contracts for backlog have a total deposit value of 1% of the purchase price of the home 37 ($ in Millions) Historical Backlog & Revenue Relationship UHG's backlog provides a clear line of sight to future revenue Homebuilder backlog has a direct correlation to future closings and revenue over a 6 - to - 12 - month window UHG has grown its backlog value by ~192% since Q1 2019 B acklog fills approximately 75% of the company’s plan for the rest of the year, providing high conviction for hitting 2022 forecasts Cancellations as a percentage of backlog were 8% in Q2 2022 $68 $75 $87 $67 $97 $127 $134 $143 $238 $224 $223 $188 $252 $198 17% 14% 10% 16% 17% 13% 12% 18% 8% 9% 9% 12% 8% 0% 5% 10% 15% 20% 25% $0 $50 $100 $150 $200 $250 $300 Backlog Cancellations % of Backlog (Cancellations as a Percent of Backlog)
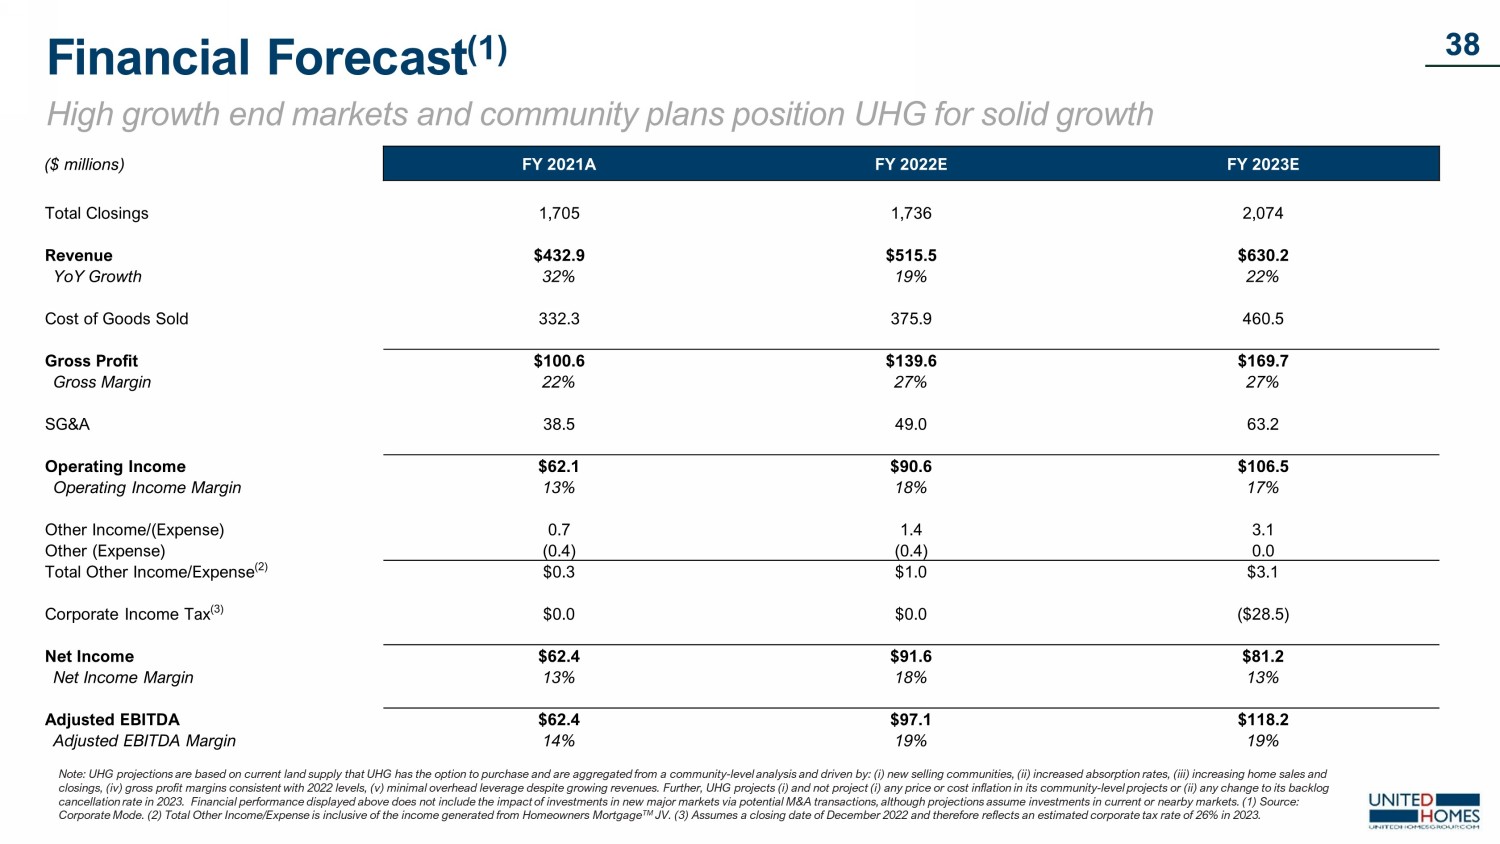
38 Financial Forecast (1) High growth end markets and community plans position UHG for solid growth 38 Note: UHG projections are based on current land supply that UHG has the option to purchase and are aggregated from a communit y - l evel analysis and driven by: ( i ) new selling communities, (ii) increased absorption rates, (iii) increasing home sales and closings, (iv) gross profit margins consistent with 2022 levels, (v) minimal overhead leverage despite growing revenues. Furt her , UHG projects ( i ) an d not project ( i ) any price or cost inflation in its community - level projects or (ii) any change to its backlog cancellation rate in 2023. Financial performance displayed above does not include the impact of investments in new major mar ket s via potential M&A transactions, although projections assume investments in current or nearby markets. (1) Source: Corporate Mode. (2) Total Other Income/Expense is inclusive of the income generated from Homeowners Mortgage TM JV. (3) Assumes a closing date of December 2022 and therefore reflects an estimated corporate tax rate of 26% in 2023. ($ millions) FY 2021A FY 2022E FY 2023E Total Closings 1,705 1,736 2,074 Revenue $432.9 $515.5 $630.2 YoY Growth 32% 19% 22% Cost of Goods Sold 332.3 375.9 460.5 Gross Profit $100.6 $139.6 $169.7 Gross Margin 22% 27% 27% SG&A 38.5 49.0 63.2 Operating Income $62.1 $90.6 $106.5 Operating Income Margin 13% 18% 17% Other Income/(Expense) 0.7 1.4 3.1 Other (Expense) (0.4) (0.4) 0.0 Total Other Income/Expense (2) $0.3 $1.0 $3.1 Corporate Income Tax (3) $0.0 $0.0 ($28.5) Net Income $62.4 $91.6 $81.2 Net Income Margin 13% 18% 13% Adjusted EBITDA $62.4 $97.1 $118.2 Adjusted EBITDA Margin 14% 19% 19%

Valuation & Operational Benchmarking (1) UHG compared to the land - light homebuilder peer group Source: (1) Capital IQ Consensus CY2022 & CY2023 Estimates. (2) Enterprise value is as of August 16 th , 2022. (3) Dream Finders Homes’ gross margin includes a commission expense which is different from UHG & NVR. 39 4.8x 8.5x 5.1x UHG NVR DFH 2023E EV / EBITDA (2) 26.9% 23.9% 19.1% UHG NVR DFH 2023E Gross Margin (3) 18.8% 18.4% 11.6% UHG NVR DFH 2023E EBITDA Margin 5.9x 6.4x 5.0x UHG NVR DFH 2022E EV / EBITDA (2) 2022E Gross Margin (3) 27.1% 26.4% 19.2% UHG NVR DFH 18.8% 22.3% 13.1% UHG NVR DFH 2022E EBITDA Margin

Reconciliations of Non - GAAP Metrics (1)(2) 40 Source: (1) Corporate Model. (2) 15% mark up on self developed lots in cluded in cost of goods sold and net income for the projection period. ($ millions) FY 2021A FY 2022E FY 2023E Adjusted Gross Profit Revenue $432.9 $515.5 $630.2 Cost of Goods Sold 332.3 375.9 460.5 Add: Mark Up on Self Developed Lots 4.2 0.0 0.0 Less: Interest Expense (3.6) (4.9) (7.8) Adjusted Cost of Goods Sold $332.9 $371.0 $452.7 Adjusted Gross Profit $100.6 $144.5 $177.5 Adjusted Gross Margin 23% 28% 28% ($ millions) FY 2021A FY 2022E FY 2023E Adjusted EBITDA Bridge Net Income $62.4 $91.6 $81.2 Add: Interest 3.6 4.9 7.8 Add: D&A 0.4 0.4 0.8 Add: Taxes 0.2 0.2 28.5 Less: Mark Up on Self Developed Lots (4.2) 0.0 0.0 Adjusted EBITDA $62.4 $97.1 $118.2 Adjusted EBITDA Margin 14% 19% 19%

41 Financial Model Assumptions Financial Projections • Included in this Presentation are the UHG’s estimates of its financial performance for fiscal years 2022 through 2023 (the “Financial Projections”), based on information known as of the date of this Presentation . For more information relating to the Financial Projections, see "Disclaimer - Forward - Looking Statements" on page 47 and "Disclaimer - Use of Projections" on page 49 . • The underlying assumptions on which the Financial Projections are based require significant judgment . As a result, there can be no assurance that the Financial Projections will be an accurate prediction of future results . Key estimates and assumptions underlying the Financial Projections include : • Revenue Growth : UHG’s revenue projections are influenced by numerous factors and derived from a community - level analysis driven by : ( i ) current supply of owned & optioned lots that UHG controls, (ii) increasing number of communities where UHG generates sales and a projected increase in the overall size of UHG’s communities, (iii) the ability to keep the sales prices of UHG’s homes constant in 2022 and 2023 , (IV) increasing UHG’s market share in South Carolina, and (V) a larger presence in Georgia • Gross Margin : UHG’s Management team believes that the price of materials will continue to normalize to historical levels, relieving the overall cost of framing a house . As a production homebuilder, the UHG is highly focused on cost sensitivity and believes its operating history has shown its has the ability to efficiently manage costs in the construction process . • Lot Acquisitions/ takedowns : As a land - light homebuilder UHG will buy finished lots as near to "just - in - time" as possible . • Backlog : UHG projects no change to its backlog cancellation rate in 2023 relative to 2022
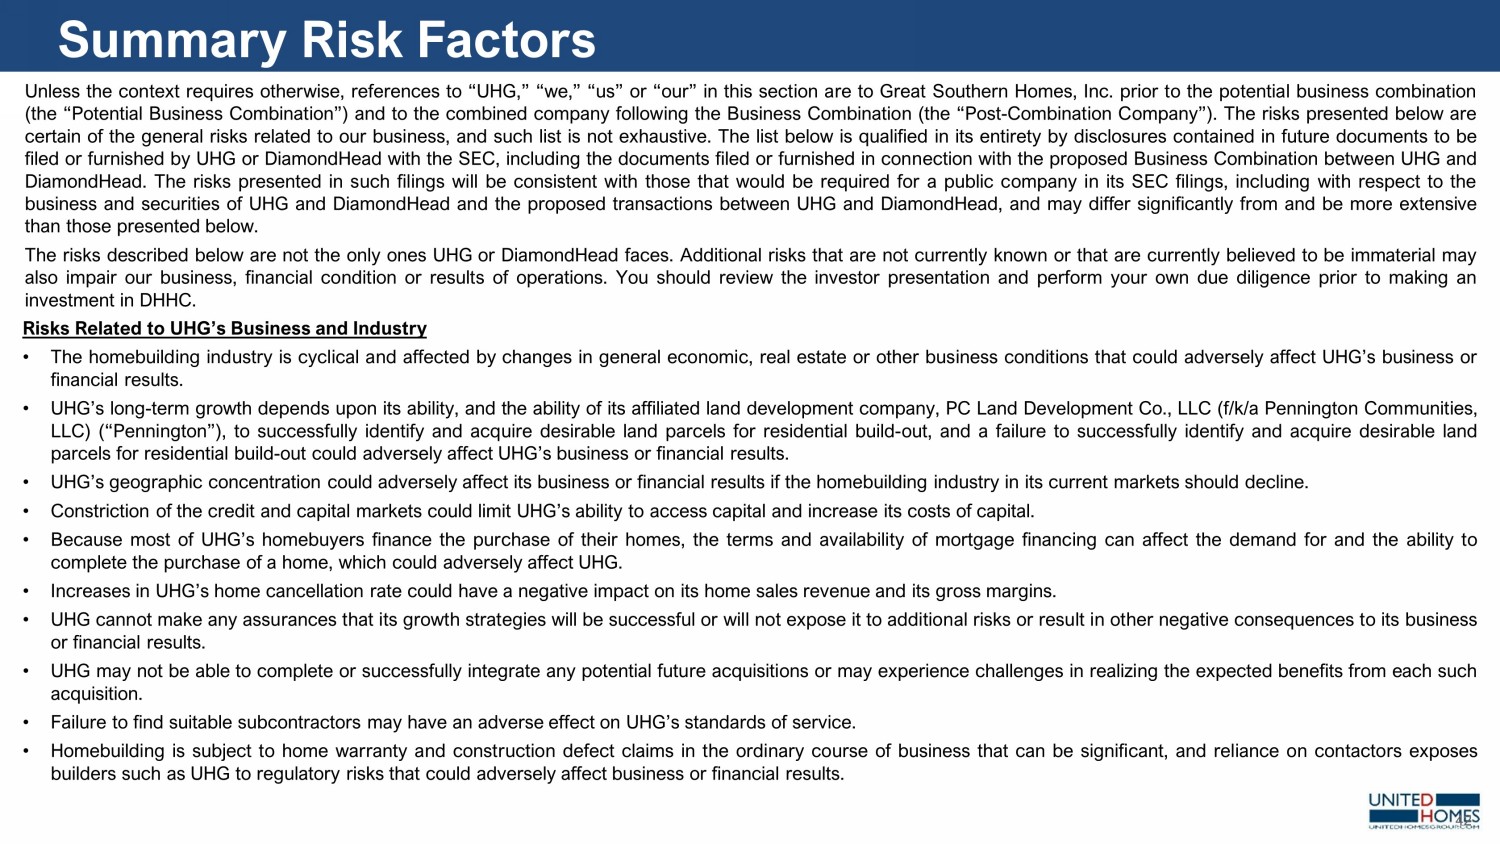
Unless the context requires otherwise, references to “UHG,” “we,” “us” or “our” in this section are to Great Southern Homes, Inc . prior to the potential business combination (the “Potential Business Combination”) and to the combined company following the Business Combination (the “Post - Combination Company”) . The risks presented below are certain of the general risks related to our business, and such list is not exhaustive . The list below is qualified in its entirety by disclosures contained in future documents to be filed or furnished by UHG or DiamondHead with the SEC, including the documents filed or furnished in connection with the proposed Business Combination between UHG and DiamondHead . The risks presented in such filings will be consistent with those that would be required for a public company in its SEC filings, including with respect to the business and securities of UHG and DiamondHead and the proposed transactions between UHG and DiamondHead , and may differ significantly from and be more extensive than those presented below . The risks described below are not the only ones UHG or DiamondHead faces . Additional risks that are not currently known or that are currently believed to be immaterial may also impair our business, financial condition or results of operations . You should review the investor presentation and perform your own due diligence prior to making an investment in DHHC . 42 Summary Risk Factors Risks Related to UHG’s Business and Industry • The homebuilding industry is cyclical and affected by changes in general economic, real estate or other business conditions that could adversely affect UHG’s business or financial results . • UHG’s long - term growth depends upon its ability, and the ability of its affiliated land development company, PC Land Development Co . , LLC (f/k/a Pennington Communities, LLC) (“Pennington”), to successfully identify and acquire desirable land parcels for residential build - out, and a failure to successfully identify and acquire desirable land parcels for residential build - out could adversely affect UHG’s business or financial results . • UHG’s geographic concentration could adversely affect its business or financial results if the homebuilding industry in its current markets should decline . • Constriction of the credit and capital markets could limit UHG’s ability to access capital and increase its costs of capital . • Because most of UHG’s homebuyers finance the purchase of their homes, the terms and availability of mortgage financing can affect the demand for and the ability to complete the purchase of a home, which could adversely affect UHG . • Increases in UHG’s home cancellation rate could have a negative impact on its home sales revenue and its gross margins . • UHG cannot make any assurances that its growth strategies will be successful or will not expose it to additional risks or result in other negative consequences to its business or financial results . • UHG may not be able to complete or successfully integrate any potential future acquisitions or may experience challenges in realizing the expected benefits from each such acquisition . • Failure to find suitable subcontractors may have an adverse effect on UHG’s standards of service . • Homebuilding is subject to home warranty and construction defect claims in the ordinary course of business that can be significant, and reliance on contactors exposes builders such as UHG to regulatory risks that could adversely affect business or financial results .

43 Risk Factors Risks Related to UHG’s Business and Industry (continued) • Supply shortages and other risks related to acquiring land, building materials and skilled labor could increase UHG’s costs and delay deliveries causing an adverse effect its business or financial results . • UHG is required to obtain performance bonds and other government approvals, the unavailability of which could adversely affect its results of operations and cash flows . • Governmental regulations and environmental matters could increase the cost and limit the availability of UHG’s homebuilding projects and adversely affect its business or financial results . • The homebuilding industry is highly competitive and UHG may not be able to compete effectively against competitors in the homebuilding industry . • UHG’s business and financial results could be adversely affected by significant inflation, higher interest rates or deflation . • UHG will be subject to financial reporting and other requirements as a public company for which its accounting and other management systems and resources may not be adequately prepared, adversely impacting stock price . • Natural disasters, severe weather and adverse geologic conditions may increase costs, cause project delays and reduce consumer demand for housing, all of which could materially and adversely affect UHG . Risks Related to UHG’s Organization and Structure • The dual class structure of UHG’s Common Stock has the effect of concentrating voting power with Michael Nieri, which may effectively eliminate stockholders’ ability to influence the outcome of important transactions, including a change in control . • As a result of Michael Nieri’s relationship with UHG and Pennington, conflicts of interest may arise with respect to any transactions involving both UHG and Pennington, and Michael Nieri’s interests may not be aligned with UHG’s shareholders . • UHG may be a “controlled company” within the meaning of the applicable rules of Nasdaq and, as a result, may qualify for exemptions from certain corporate governance requirements . If UHG relies on these exemptions, its stockholders will not have the same protections afforded to stockholders of companies that are subject to such requirements . • UHG’s corporate organizational documents and provisions of state law to which it is subject contain certain provisions that could have an anti - takeover effect and may delay, make more difficult, or prevent an attempted acquisition that stockholders may favor or an attempted replacement of the Board of Directors or management . • UHG may change its operational policies, investment guidelines, and business and growth strategies without stockholder consent which may subject it to different and more significant risks in the future that may adversely impact its business and financial results . • UHG is an “emerging growth company” and, as a result of the reduced disclosure and governance requirements applicable to emerging growth companies, its securities may be less attractive to investors . • Any joint venture investments that UHG makes could be adversely affected by its lack of sole decision - making authority, its reliance on co - ventures’ financial conditions, and disputes between it and its co - ventures .

44 Risk Factors Risks Related to the Potential Business Combination, DiamondHead and the Post - Combination Company • The consummation of the Potential Business Combination is subject to a number of conditions . If those conditions are not satisfied or waived, the Potential Business Combination may not be completed . • If the Potential Business Combination benefits do not meet the expectations of investors or securities analysts, the market price of the Post - Combination Company’s securities may decline . • There can be no assurance that the Post - Combination Company’s common stock will be approved for listing on the Nasdaq or that the Post - Combination Company will be able to comply with the continued listing standards of the Nasdaq . • Potential legal proceedings in connection with the Potential Business Combination, the outcomes of which are uncertain, could delay or prevent the completion of the Potential Business Combination . • If DiamondHead’s due diligence investigation of UHG’s business was inadequate and material risks are not uncovered, stockholders of DiamondHead following the Potential Business Combination could lose some or all of their investment . • UHG’s stockholders and DiamondHead stockholders will each have a reduced ownership and voting interest in the Post - Combination Company following the Potential Business Combination and will exercise less influence over management . • DiamondHead’s sponsor, directors, officers and their affiliates may elect to purchase public shares, which may influence a vote on the Potential Business Combination and reduce the public “float” of DiamondHead’s common shares . • There is no assurance from an independent source that the merger consideration is fair to its stockholders from a financial point of view . • Termination of the Business Combination Agreement could negatively impact UHG and DiamondHead . • UHG will be subject to business uncertainties and contractual restrictions while the Potential Business Combination is pending . • DiamondHead’s sponsor, directors and officers may have interests in the Potential Business Combination different from the interests of DiamondHead stockholders . • UHG directors and officers may have interests in the Potential Business Combination different from the interests of UHG stockholders . • The Potential Business Combination will result in changes to the board of directors that may affect our strategy . • The Business Combination Agreement contains provisions that may discourage other companies from trying to acquire UHG for greater merger consideration . • The Business Combination Agreement contains provisions that may discourage DiamondHead from seeking an alternative business combination . • During the pre - closing period, DiamondHead and UHG are prohibited from entering into certain transactions that might otherwise be beneficial to DiamondHead , UHG or their respective stockholders . • If DiamondHead is not able to complete a business combination or receive shareholder approval for an extension by January 28 , 2023 , DiamondHead will cease all operations except for the purpose of winding - up, public stockholders may only receive approximately $ 10 . 00 per share and warrants will expire worthless .

45 Risk Factors Risks Related to Redemption • Significant redemptions among DiamondHead’s public stockholders may require the post - combination Company to raise future financing after the closing of the Business Combination . • There is no guarantee that a public stockholder’s decision whether to redeem their public shares for a pro rata portion of the trust account will put such stockholder in a better future economic position . • If DiamondHead’s public stockholders fail to comply with the redemption requirements, they will not be entitled to redeem their public shares for a pro rata portion of the funds held in the trust account . • The ability of DiamondHead’s public stockholders to exercise redemption rights with respect to a large number of shares could increase the probability that the Potentia l Business Combination would be unsuccessful . • DiamondHead does not have a specified maximum redemption threshold . The absence of such a redemption threshold may make it possible for DiamondHead to complete the Business Combination even if a substantial majority of DiamondHead’s public stockholder’s do not agree .
About this Presentation • This presentation (together with oral statements made in connection herewith, this “Presentation”) is provided for informational purposes only . This Presentation shall not constitute an offer to sell, or the solicitation of an offer to buy, any securities, nor shall there be any sale of securities in any states or jurisdictions in which such offer, solicitation or sale would be unlawful . This Presentation has been prepared to assist prospective investors in making their own evaluation with respect to a potential business combination between United Homes Group, Inc . (“UHG” or the “Company”) and DiamondHead Holdings Corp . (“ DiamondHead ”) and related transactions (the “Potential Business Combination”), and for no other purpose . • The information contained herein does not purport to be all - inclusive and none of DiamondHead , the Company or their respective affiliates makes any representation or warranty, express or implied, as to the accuracy, completeness or reliability of the information contained in this Presentation . Viewers of this Presentation should make their own evaluation of the Company and of the relevance and accuracy of the information and should make such other investigations as they deem necessary . • This Presentation does not constitute ( i ) a solicitation of a proxy, consent or authorization with respect to any securities or in respect of the Proposed Business Combination or (ii) an offer to sell, a solicitation of an offer to buy, or a recommendation to purchase any security of DiamondHead , the Company, or any of their respective affiliates, nor shall there be any sale of securities in any jurisdiction in which such offer, solicitation or sale would be unlawful prior to registration or qualification under the securities laws of any such jurisdiction . No offering of securities shall be made except by means of a prospectus meeting the requirements of the U . S . Securities Act of 1933 , as amended and the rules and regulations promulgated thereunder (collectively, the “Securities Act”) . You should not construe the contents of this Presentation as legal, tax, accounting or investment advice or a recommendation . You should consult your own counsel and tax and financial advisors as to legal and related matters concerning the matters described herein, and, by accepting this Presentation, you confirm that you are not relying upon the information contained herein to make any decision . Neither the SEC nor any state securities regulator have approved or disapproved of the securities or determined if this Presentation is truthful or complete . • The distribution of this Presentation may also be restricted by law and persons into whose possession this Presentation comes should inform themselves about and observe any such restrictions . The recipient acknowledges that it is (a) aware that the United States securities laws prohibit any person who has material, non - public information concerning a company from purchasing or selling securities of such company or from communicating such information to any other person under circumstances in which it is reasonably foreseeable that such person is likely to purchase or sell such securities, and (b) familiar with the Securities Exchange Act of 1934 , as amended, and the rules and regulations promulgated thereunder (collectively, the "Exchange Act"), and that the recipient will neither use, nor cause any third party to use, this Presentation or any information contained herein in contravention of the Exchange Act, including, without limitation, Rule 10 b - 5 thereunder . • This Presentation does not purport to be all - inclusive or to contain all of the information that may be required to make a full analysis of UHG or the Potential Business Combination . Recipients of this Presentation should each make their own evaluation of UHG, the Potential Business Combination and the potential private placement and of the relevance and adequacy of the information and should make such other investigations as they deem necessary . • Nothing herein should be construed as legal, financial, tax or other advice . You should consult your own advisers concerning any legal, financial, tax or other considerations concerning the opportunity described herein . The general explanations included in this Presentation cannot address, and are not intended to address, your specific investment objectives, financial situations or financial needs . Nothing contained herein shall be deemed a recommendation to any party to enter into any transaction or take any course of action . 46 Disclaimer

Use of Data • Certain information contained in this Presentation relates to or is based on the Company's own internal estimates and research . In addition, all of the market data included in this Presentation involves a number of assumptions and limitations, and there can be no guarantee as to the accuracy or reliability of such assumptions . Finally, while the Company believes its internal research is reliable, such research has not been verified by any independent source and none of DiamondHead , or the Company, nor any of their respective affiliates nor any of its or their control persons, officers, directors, employees or representatives make any representation or warranty with respect to the accuracy of such information . Forward Looking Statements • Certain statements in this Presentation may be considered "forward - looking statements" within the meaning of the "safe harbor" provisions of the United States Private Securities Litigation Reform Act of 1995 . Forward - looking statements generally relate to future events or DiamondHead’s or the Company’s future financial or operating performance . For example, projections of future revenue and other metrics are forward - looking statements . In some cases, you can identify forward - looking statements by terminology such as “may”, “should”, “expect”, “intend”, “will”, “estimate”, “anticipate”, “believe”, “predict”, “potential” or “continue”, or the negatives of these terms or variations of them or similar terminology . Such forward - looking statements are subject to risks, uncertainties, and other factors which could cause actual results to differ materially from those expressed or implied by such forward looking statements . • These forward - looking statements are based upon estimates and assumptions that, while considered reasonable by DiamondHead and its management, and the Company and its management, as the case may be, are inherently uncertain . Nothing in this Presentation should be regarded as a representation by any person that the forward - looking statements set forth herein will be achieved or that any of the contemplated results of such forward - looking statements will be achieved . You should not place undue reliance on forward - looking statements, which speak only as of the date they are made . Neither DiamondHead nor the Company undertakes any duty to update these forward - looking statements . Financial Information • The financial information and data contained in this Presentation may be unaudited and not conform to Regulation S - X promulgated under the Securities Act of 1933 . Accordingly, such information and data may not be included in, may be adjusted in or may be presented differently in, the registration statement to be filed by DiamondHead and UHG with the SEC . • Certain monetary amounts, percentages and other figures included in this Presentation have been subject to rounding adjustments . Certain other amounts that appear in this Presentation may not sum due to rounding . 47 Disclaimer
Additional Information • The Company intends to file with the SEC a proxy statement / prospectus on Form S - 4 relating to the Proposed Business Combination, which will be mailed to DiamondHead’s shareholders once definitive . This Presentation does not contain all the information that should be considered concerning the Proposed Business Combination and is not intended to form the basis of any investment decision or any other decision in respect of the Proposed Business Combination . DiamondHead’s shareholders and other interested persons are advised to read, when available, the preliminary proxy statement / prospectus and the amendments thereto and the proxy statement / prospectus and other documents filed in connection with the Proposed Business Combination, as these materials will contain important information about the Company, DiamondHead and the Proposed Business Combination . When available, the proxy statement / prospectus and other relevant materials for the Proposed Business Combination will be mailed to shareholders of DiamondHead as of a record date to be established for voting on the Proposed Business Combination . Shareholders will also be able to obtain copies of the preliminary proxy statement / prospectus, the definitive proxy statement / prospectus and other documents filed with the SEC, without charge, once available, at the SEC’s website at www . sec . gov, or by directing a request to UHG at 90 North Royal Tower Drive, Irmo, South Carolina 29063 or to DiamondHead at DiamondHead Holdings Corp . , 250 Park Avenue, 7 th Floor, New York, NY 10177 . Participants in the Solicitation • DiamondHead and its directors and executive officers may be deemed participants in the solicitation of proxies from DiamondHead’s shareholders with respect to the Proposed Business Combination . A list of the names of those directors and executive officers and a description of their interests in DiamondHead is contained in DiamondHead’s Registration Statement on Form S - 1 , as effective on January 25 , 2021 , which was filed with the SEC and is available free of charge at the SEC’s web site at www . sec . gov, or by directing a request to DiamondHead at DiamondHead Holdings Corp, 250 Park Avenue, 7 th Floor, New York, NY 10177 . Additional information regarding the interests of such participants will be contained in the proxy statement / prospectus for the Proposed Business Combination when available . • The Company and its directors and executive officers may also be deemed to be participants in the solicitation of proxies from the shareholders of DiamondHead in connection with the Proposed Business Combination . A list of the names of such directors and executive officers and information regarding their interests in the Proposed Business Combination will be included in the proxy statement / prospectus for the Proposed Business Combination when available . Trademarks • The Company has proprietary rights to trademarks used in this presentation that are important to its business, many of which are registered under applicable intellectual property laws . This presentation also contains trademarks, trade names and service marks of other companies, which are the property of their respective owners . Solely for convenience, trademarks, trade names and service marks referred to in this presentation may appear without the ®, Œ or SM symbols, but such references are not intended to indicate, in any way, that the Company will not assert, to the fullest extent permitted under applicable law, its rights or the right of the applicable licensor to these trademarks, trade names and service marks . The Company does not intend our use or display of other parties' trademarks, trade names or service marks to imply, and such use or display should not be construed to imply, a relationship with, or endorsement or sponsorship of us by, any other parties . 48 Disclaimer
Use of Projections • This Presentation contains financial forecasts with respect to UHG’s projected financial results for fiscal years 2022 through 2023 . All projections, estimates, goals, targets, plans, trends or other statements with respect to future results or future events in this Presentation, including projected revenue and EBITDA, are forward - looking statements that ( i ) reflect various estimates and assumptions concerning future industry performance, general business, economic and market conditions for the Company’s products and other matters, which assumptions may or may not prove to be correct, (ii) are inherently subject to significant contingencies and uncertainties, many of which are outside the control of Diamondhead and UHG and (iii) should not be regarded as a representation by Diamondhead, UHG or any other person that such estimates, forecasts or projections will be achieved . Neither Diamondhead’s nor UHG’s independent auditors have studied, reviewed, compiled or performed any procedures with respect to the projections for the purpose of their inclusion in this Presentation, and accordingly, neither of them expressed an opinion or provided any other form of assurance with respect thereto for the purpose of this Presentation . These projections are for illustrative purposes only and should not be relied upon as being necessarily indicative of future results . Actual results can be expected to vary and those variations may be material . Unanticipated events may occur that could affect the outcome of such projections, estimates, goals, targets, plans, trends and other statements . You must make your own determinations as to the reasonableness of these projections, estimates, goals, targets, plans, trends and other statements and should also note that if one or more estimates change, or one or more assumptions are not met, or one or more unexpected events occur, the performance and results set forth in such projections, estimates, goals, targets, plans, trends and other statements may not be achieved . We can give no assurance as to future operations, performance, results or events . The inclusion of financial projections, estimates and targets in this Presentation should not be regarded as an indication that Diamondhead and UHG, or their representatives, considered or consider the financial projections, estimates and targets to be a reliable prediction of future events . 49 Disclaimer