Free signup for more
- Track your favorite companies
- Receive email alerts for new filings
- Personalized dashboard of news and more
- Access all data and search results
Filing tables
Filing exhibits
Related financial report
HMPT similar filings
- 2 Feb 23 Termination of a Material Definitive Agreement
- 16 Dec 22 Departure of Directors or Certain Officers
- 2 Dec 22 Other Events
- 10 Nov 22 Home Point Capital Reports Third Quarter 2022 Financial Results
- 11 Oct 22 Termination of a Material Definitive Agreement
- 7 Oct 22 Unaudited Pro Forma Condensed Consolidated Financial Statements
- 27 Sep 22 Termination of a Material Definitive Agreement
Filing view
External links
Exhibit 99.2

Third Quarter 2022 Earnings Presentation November 10, 2022
Forward-Looking Statements 2 This presentation contains certain “forward-looking statements,” within the meaning of Section 27A of the Securities Act of 1933, as amended, and Section 21E of the Securities Exchange Act of 1934, as amended. All statements other than statements of historical fact are forward-looking statements. Forward-looking statements include, but are not limited to, statements relating to the future financial performance of Home Point Capital Inc. (“we,” “our,” “us” or the “Company”), our business prospects and strategy, anticipated financial position, liquidity and capital needs, the industry in which we operate and other similar matters. Words such as “anticipates,” “expects,” “intends,” “plans,” “predicts,” “believes,” “seeks,” “estimates,” “could,” “would,” “will,” “may,” “can,” “continue,” “potential,” “should” and the negative of these terms or other comparable terminology often identify forward-looking statements. Forward-looking statements are not guarantees of future performance, are based upon assumptions, and are subject to risks and uncertainties that could cause actual results to differ materially from the results contemplated by the forward-looking statements. Factors, risks, and uncertainties that could cause actual outcomes and results to be materially different from those contemplated include, among others: our reliance on our financing arrangements to fund mortgage loans and otherwise operate our business; the dependence of our loan origination and servicing revenues on macroeconomic and U.S. residential real estate market conditions; the requirement to repurchase mortgage loans or indemnify investors if we breach representations and warranties; counterparty risk; the requirement to make servicing advances that can be subject to delays in recovery or may not be recoverable in certain circumstances; risks related to any subservicer; competition for mortgage assets that may limit the availability of desirable originations, acquisitions and result in reduced risk-adjusted returns; our ability to continue to grow our loan origination business or effectively manage significant increases in our loan production volume; difficult conditions or disruptions in the mortgage-backed securities (“MBS”), mortgage, real estate and financial markets; competition in the industry in which we operate; our ability to acquire loans and sell the resulting MBS in the secondary markets on favorable terms in our production activities; our ability to adapt to and implement technological changes; the effectiveness of our risk management efforts; our ability to detect misconduct and fraud; any failure to attract and retain a highly skilled workforce, including our senior executives; our ability to obtain, maintain, protect and enforce our intellectual property; any cybersecurity risks, cyber incidents and technology failures; material changes to the laws, regulations or practices applicable to reverse mortgage programs operated by the Federal Housing Administration (“FHA”) and the U.S. Department of Housing and Urban Development; our vendor relationships; our failure to deal appropriately with various issues that may give rise to reputational risk, including legal and regulatory requirements; any employment litigation and related unfavorable publicity; exposure to new risks and increased costs as a result of initiating new business activities or strategies or significantly expanding existing business activities or strategies; the impact of changes in political or economic stability or by government policies on our material vendors with operations in India; our ability to fully utilize our net operating loss (“NOL”) and other tax carryforwards; any challenge by the Internal Revenue Service of the amount, timing and/or use of our NOL carryforwards; possible changes in legislation and the effect on our ability to use the tax benefits associated with our NOL carryforwards; the impact of other changes in tax laws; the impact of interest rate fluctuations; risks associated with hedging against interest rate exposure; the impact of any prolonged economic slowdown, recession or declining real estate values; risks associated with financing our assets with borrowings; risks associated with a decrease in value of our collateral; the dependence of our operations on access to our financing arrangements, which are mostly uncommitted; risks associated with the financial and restrictive covenants included in our financing agreements; risks associated with changes in the London Inter-Bank Offered Rate reporting practices and the use of alternative reference rates; our ability to raise the debt or equity capital required to finance our assets and grow our business; risks associated with derivative financial instruments; our ability to comply with continually changing federal, state and local laws and regulations; the impact of revised rules and regulations and enforcement of existing rules and regulations by the Consumer Financial Protection Bureau; the impact of revised rules and regulations and enforcement of existing rules and regulations by state regulatory agencies; our ability to comply with the Government-Sponsored Enterprises (“GSE”), FHA, U.S. Department of Veterans Affairs (“VA”) and U.S. Department of Agriculture (“USDA”) guidelines and changes in these guidelines or GSE and Government National Mortgage Association (“Ginnie Mae”) guarantees; changes in regulations or the occurrence of other events that impact the business, operations or prospects of government agencies such as Ginnie Mae, the FHA or the VA, the USDA, or GSEs such as the Federal National Mortgage Association or the Federal Home Loan Mortgage Corporation, or such changes that increase the cost of doing business with such entities; our ability to obtain and/or maintain licenses and other approvals in those jurisdictions where required to conduct our business; our ability to comply with the regulations applicable to our investment management subsidiary; the impact of private legal proceedings; risks associated with our acquisition of mortgage servicing rights; the impact of our counterparties terminating our servicing rights under which we conduct servicing activities; risks associated with higher risk loans that we service; and our ability to foreclose on our mortgage assets in a timely manner or at all. You should carefully consider the foregoing factors and the other risks and uncertainties that may affect the Company’s business, including those listed under the heading “Risk Factors” in our Annual Report on Form 10-K for the year ended December 31, 2021, as such risk factors may be amended, supplemented, or superseded from time to time by other reports filed by the Company with the Securities and Exchange Commission. Many of the important factors that will determine these results are beyond our ability to control or predict. You are cautioned not to put undue reliance on any forward-looking statements, which speak only as of the date thereof. Except as required under applicable law, the Company does not assume any obligation to update these forward-looking statements.
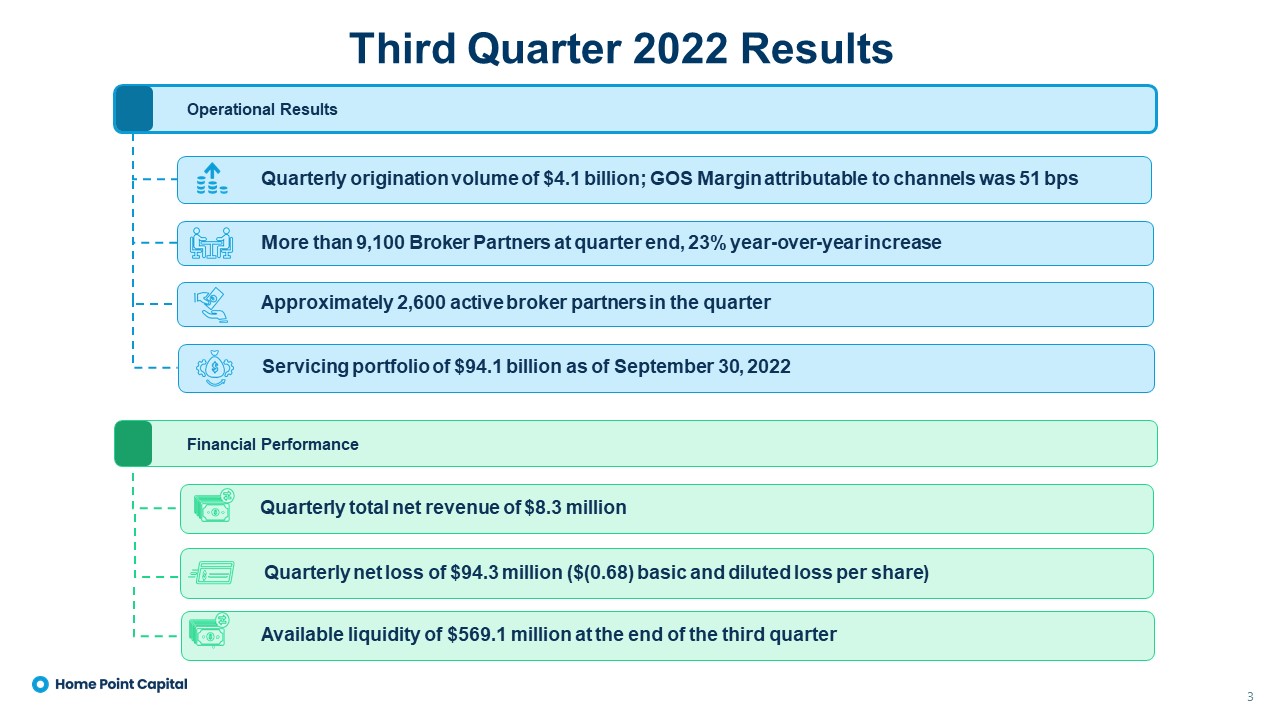
3 Quarterly origination volume of $4.1 billion; GOS Margin attributable to channels was 51 bps Third Quarter 2022 Results Financial Performance Quarterly net loss of $94.3 million ($(0.68) basic and diluted loss per share) Quarterly total net revenue of $8.3 million Approximately 2,600 active broker partners in the quarter Servicing portfolio of $94.1 billion as of September 30, 2022 Operational Results More than 9,100 Broker Partners at quarter end, 23% year-over-year increase Available liquidity of $569.1 million at the end of the third quarter
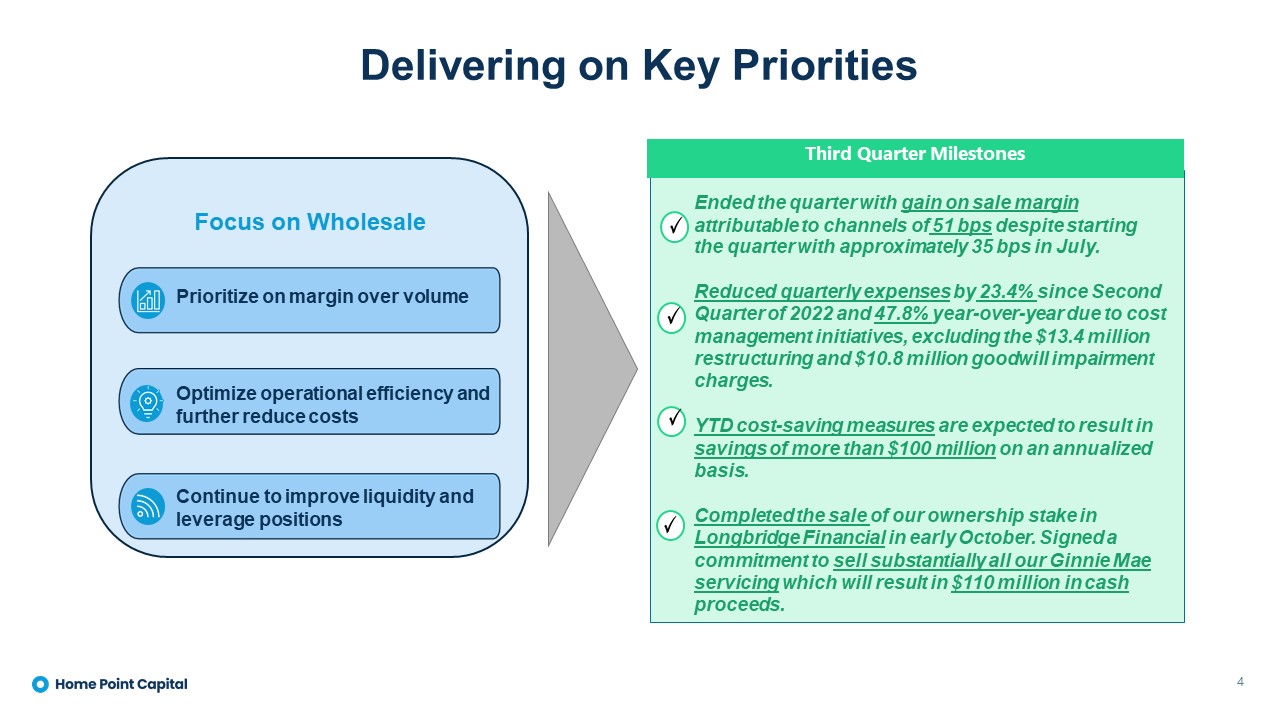
Delivering on Key Priorities 4 Focus on Wholesale Prioritize on margin over volume Optimize operational efficiency and further reduce costs Continue to improve liquidity and leverage positions Third Quarter Milestones Ended the quarter with gain on sale margin attributable to channels of 51 bps despite starting the quarter with approximately 35 bps in July. Reduced quarterly expenses by 23.4% since Second Quarter of 2022 and 47.8% year-over-year due to cost management initiatives, excluding the $13.4 million restructuring and $10.8 million goodwill impairment charges. YTD cost-saving measures are expected to result in savings of more than $100 million on an annualized basis. Completed the sale of our ownership stake in Longbridge Financial in early October. Signed a commitment to sell substantially all our Ginnie Mae servicing which will result in $110 million in cash proceeds.
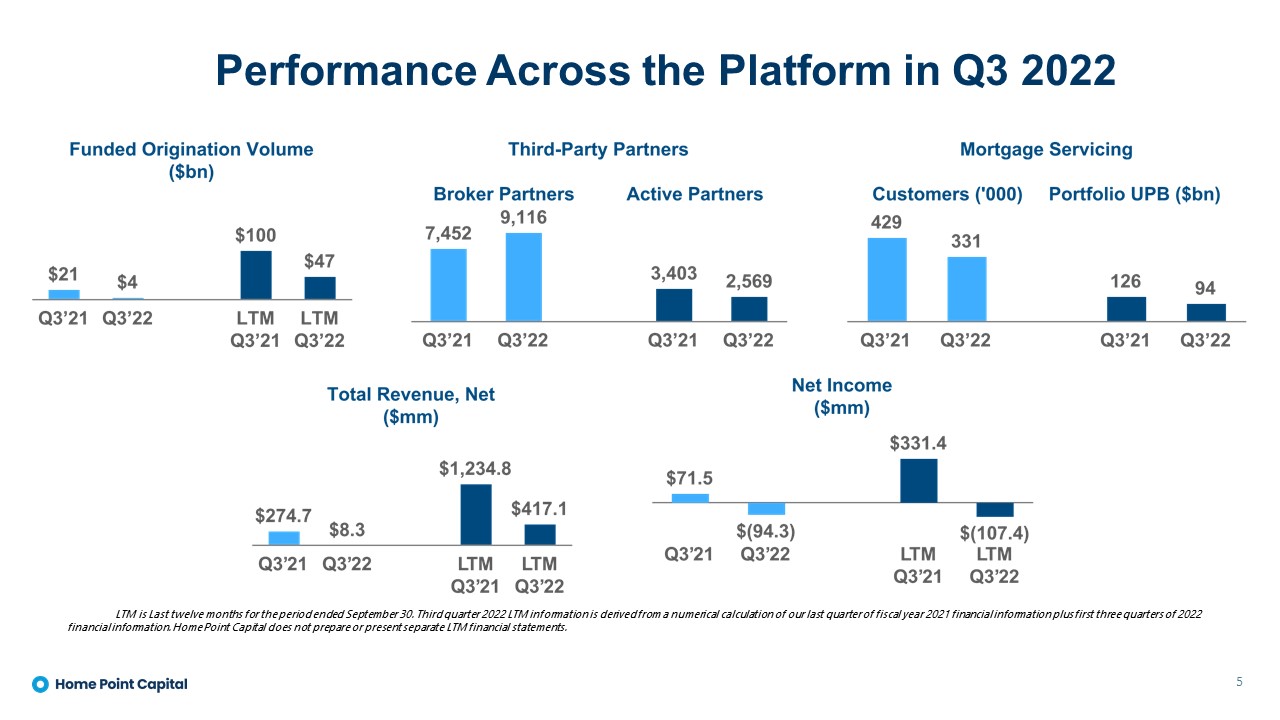
Performance Across the Platform in Q3 2022 5 LTM is Last twelve months for the period ended September 30. Third quarter 2022 LTM information is derived from a numerical calculation of our last quarter of fiscal year 2021 financial information plus first three quarters of 2022 financial information. Home Point Capital does not prepare or present separate LTM financial statements.
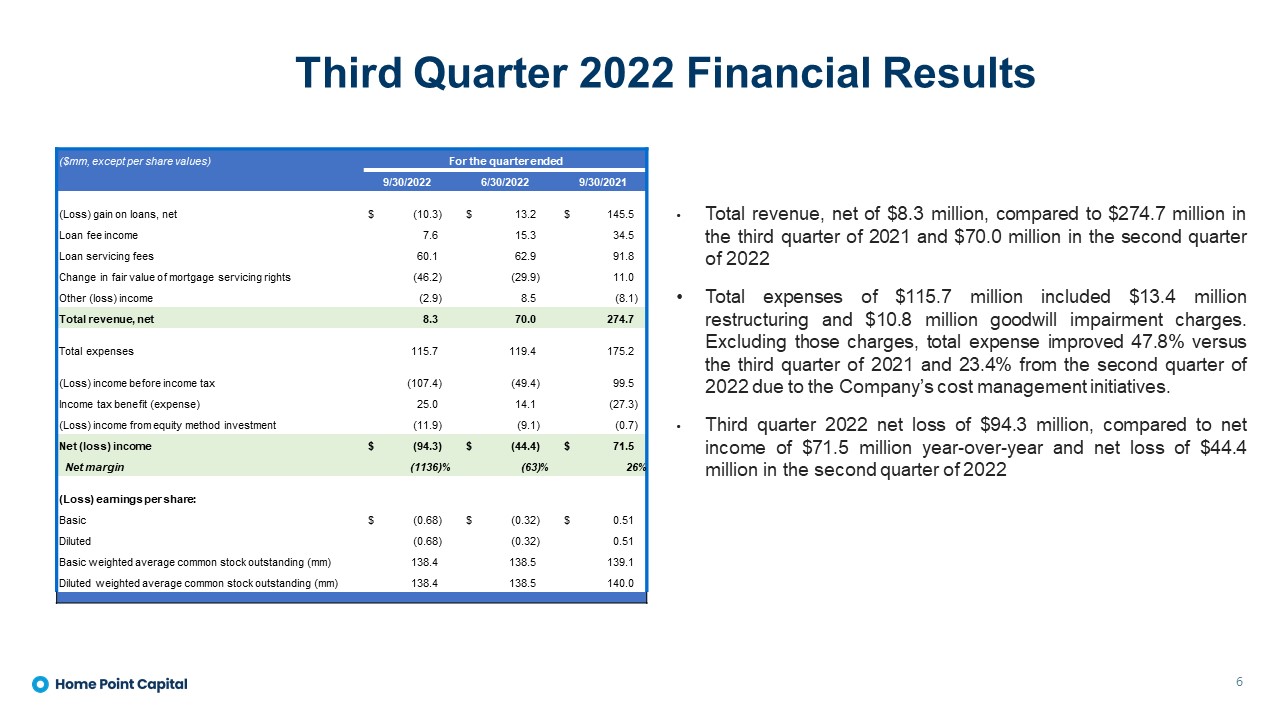
Third Quarter 2022 Financial Results 6 Total revenue, net of $8.3 million, compared to $274.7 million in the third quarter of 2021 and $70.0 million in the second quarter of 2022 Total expenses of $115.7 million included $13.4 million restructuring and $10.8 million goodwill impairment charges. Excluding those charges, total expense improved 47.8% versus the third quarter of 2021 and 23.4% from the second quarter of 2022 due to the Company’s cost management initiatives. Third quarter 2022 net loss of $94.3 million, compared to net income of $71.5 million year-over-year and net loss of $44.4 million in the second quarter of 2022 ($mm, except per share values) For the quarter ended 9/30/2022 6/30/2022 9/30/2021 (Loss) gain on loans, net $ (10.3) $ 13.2 $ 145.5 Loan fee income 7.6 15.3 34.5 Loan servicing fees 60.1 62.9 91.8 Change in fair value of mortgage servicing rights (46.2) (29.9) 11.0 Other (loss) income (2.9) 8.5 (8.1) Total revenue, net 8.3 70.0 274.7 Total expenses 115.7 119.4 175.2 (Loss) income before income tax (107.4) (49.4) 99.5 Income tax benefit (expense) 25.0 14.1 (27.3) (Loss) income from equity method investment (11.9) (9.1) (0.7) Net (loss) income $ (94.3) $ (44.4) $ 71.5 Net margin (1136)% (63) % 26% (Loss) earnings per share: Basic $ (0.68) $ (0.32) $ 0.51 Diluted (0.68) (0.32) 0.51 Basic weighted average common stock outstanding (mm) 138.4 138.5 139.1 Diluted weighted average common stock outstanding (mm) 138.4 138.5 140.0
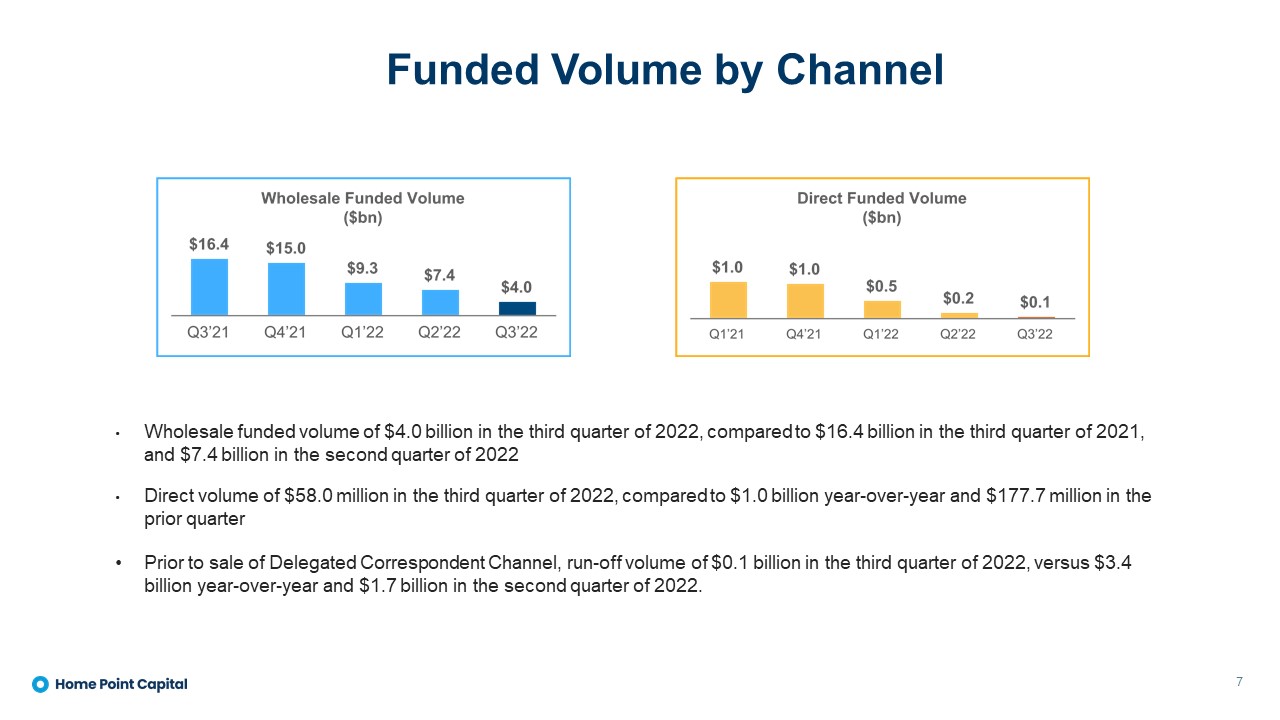
Funded Volume by Channel 7 Wholesale funded volume of $4.0 billion in the third quarter of 2022, compared to $16.4 billion in the third quarter of 2021, and $7.4 billion in the second quarter of 2022 Direct volume of $58.0 million in the third quarter of 2022, compared to $1.0 billion year-over-year and $177.7 million in the prior quarter Prior to sale of Delegated Correspondent Channel, run-off volume of $0.1 billion in the third quarter of 2022, versus $3.4 billion year-over-year and $1.7 billion in the second quarter of 2022.
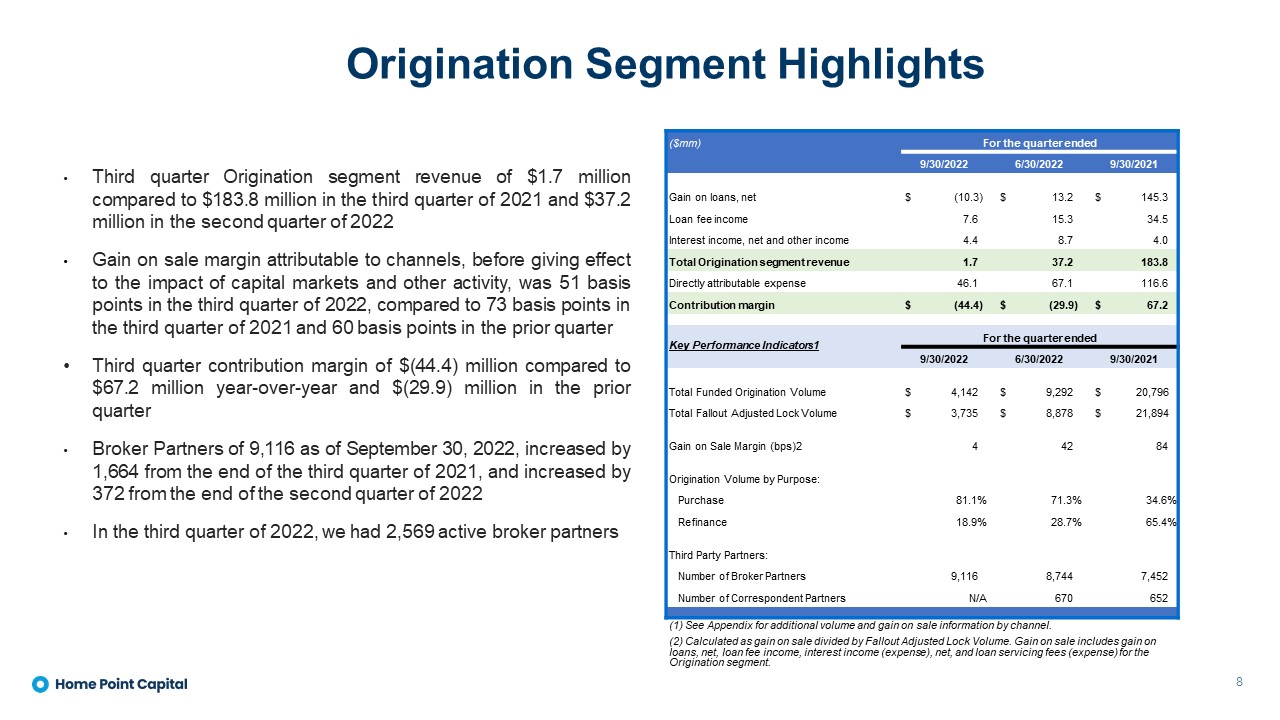
Origination Segment Highlights 8 Third quarter Origination segment revenue of $1.7 million compared to $183.8 million in the third quarter of 2021 and $37.2 million in the second quarter of 2022 Gain on sale margin attributable to channels, before giving effect to the impact of capital markets and other activity, was 51 basis points in the third quarter of 2022, compared to 73 basis points in the third quarter of 2021 and 60 basis points in the prior quarter Third quarter contribution margin of $(44.4) million compared to $67.2 million year-over-year and $(29.9) million in the prior quarter Broker Partners of 9,116 as of September 30, 2022, increased by 1,664 from the end of the third quarter of 2021, and increased by 372 from the end of the second quarter of 2022 In the third quarter of 2022, we had 2,569 active broker partners ($mm) For the quarter ended 9/30/2022 6/30/2022 9/30/2021 Gain on loans, net $ (10.3) $ 13.2 $ 145.3 Loan fee income 7.6 15.3 34.5 Interest income, net and other income 4.4 8.7 4.0 Total Origination segment revenue 1.7 37.2 183.8 Directly attributable expense 46.1 67.1 116.6 Contribution margin $ (44.4) $ (29.9) $ 67.2 Key Performance Indicators1 For the quarter ended 9/30/2022 6/30/2022 9/30/2021 Total Funded Origination Volume $ 4,142 $ 9,292 $ 20,796 Total Fallout Adjusted Lock Volume $ 3,735 $ 8,878 $ 21,894 Gain on Sale Margin (bps)2 4 42 84 Origination Volume by Purpose: Purchase 81.1% 71.3% 34.6% Refinance 18.9% 28.7% 65.4% Third Party Partners: Number of Broker Partners 9,116 8,744 7,452 Number of Correspondent Partners N/A 670 652 (1) See Appendix for additional volume and gain on sale information by channel. (2) Calculated as gain on sale divided by Fallout Adjusted Lock Volume. Gain on sale includes gain on loans, net, loan fee income, interest income (expense), net, and loan servicing fees (expense) for the Origination segment.
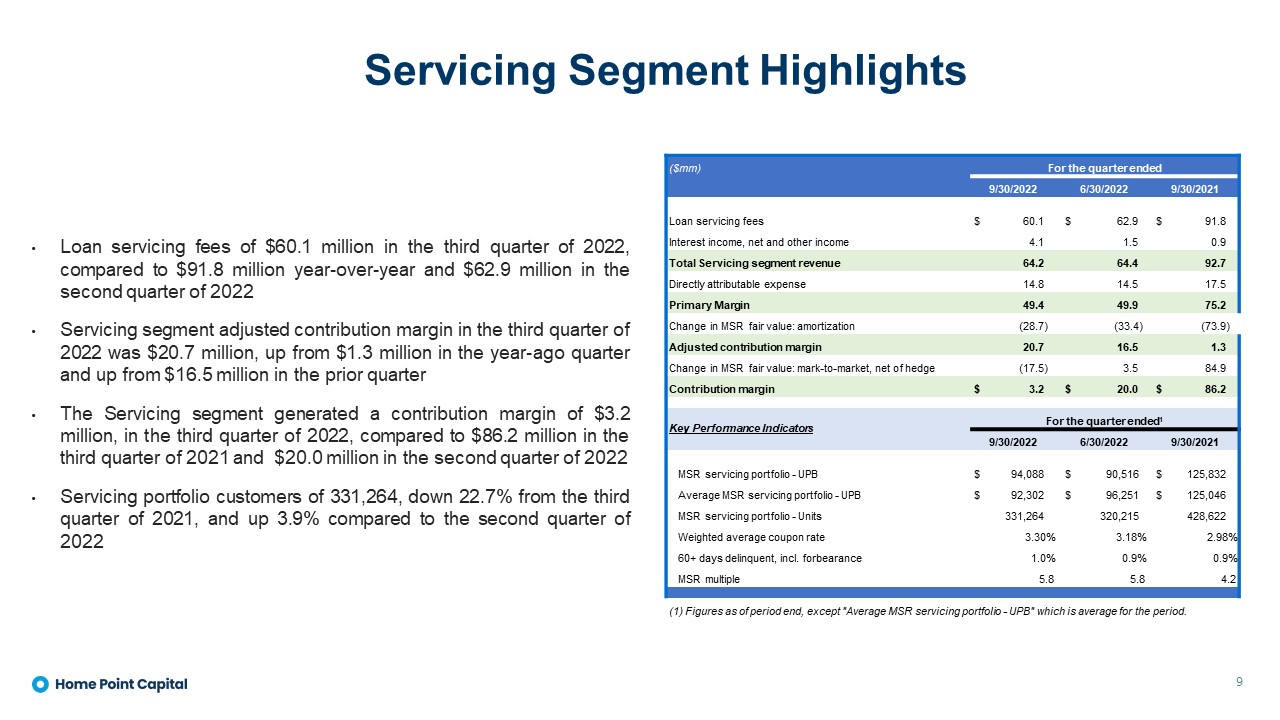
Servicing Segment Highlights 9 Loan servicing fees of $60.1 million in the third quarter of 2022, compared to $91.8 million year-over-year and $62.9 million in the second quarter of 2022 Servicing segment adjusted contribution margin in the third quarter of 2022 was $20.7 million, up from $1.3 million in the year-ago quarter and up from $16.5 million in the prior quarter The Servicing segment generated a contribution margin of $3.2 million, in the third quarter of 2022, compared to $86.2 million in the third quarter of 2021 and $20.0 million in the second quarter of 2022 Servicing portfolio customers of 331,264, down 22.7% from the third quarter of 2021, and up 3.9% compared to the second quarter of 2022 ($mm) For the quarter ended 9/30/2022 6/30/2022 9/30/2021 Loan servicing fees $ 60.1 $ 62.9 $ 91.8 Interest income, net and other income 4.1 1.5 0.9 Total Servicing segment revenue 64.2 64.4 92.7 Directly attributable expense 14.8 14.5 17.5 Primary Margin 49.4 49.9 75.2 Change in MSR fair value: amortization (28.7) (33.4) (73.9) Adjusted contribution margin 20.7 16.5 1.3 Change in MSR fair value: mark-to-market, net of hedge (17.5) 3.5 84.9 Contribution margin $ 3.2 $ 20.0 $ 86.2 Key Performance Indicators For the quarter ended1 9/30/2022 6/30/2022 9/30/2021 MSR servicing portfolio - UPB $ 94,088 $ 90,516 $ 125,832 Average MSR servicing portfolio - UPB $ 92,302 $ 96,251 $ 125,046 MSR servicing portfolio - Units 331,264 320,215 428,622 Weighted average coupon rate 3.30% 3.18% 2.98% 60+ days delinquent, incl. forbearance 1.0% 0.9% 0.9% MSR multiple 5.8 5.8 4.2 (1) Figures as of period end, except "Average MSR servicing portfolio - UPB" which is average for the period.
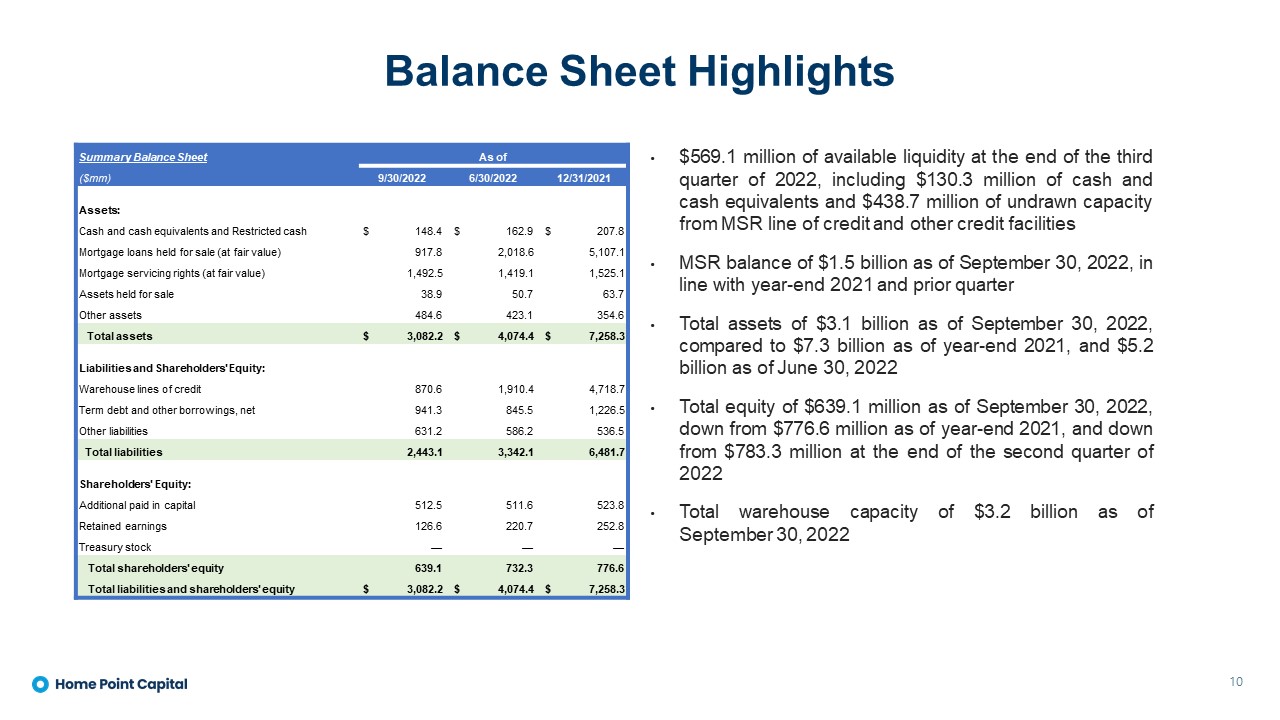
Balance Sheet Highlights 10 $569.1 million of available liquidity at the end of the third quarter of 2022, including $130.3 million of cash and cash equivalents and $438.7 million of undrawn capacity from MSR line of credit and other credit facilities MSR balance of $1.5 billion as of September 30, 2022, in line with year-end 2021 and prior quarter Total assets of $3.1 billion as of September 30, 2022, compared to $7.3 billion as of year-end 2021, and $5.2 billion as of June 30, 2022 Total equity of $639.1 million as of September 30, 2022, down from $776.6 million as of year-end 2021, and down from $783.3 million at the end of the second quarter of 2022 Total warehouse capacity of $3.2 billion as of September 30, 2022 Summary Balance Sheet As of ($mm) 9/30/2022 6/30/2022 12/31/2021 Assets: Cash and cash equivalents and Restricted cash $ 148.4 $ 162.9 $ 207.8 Mortgage loans held for sale (at fair value) 917.8 2,018.6 5,107.1 Mortgage servicing rights (at fair value) 1,492.5 1,419.1 1,525.1 Assets held for sale 38.9 50.7 63.7 Other assets 484.6 423.1 354.6 Total assets $ 3,082.2 $ 4,074.4 $ 7,258.3 Liabilities and Shareholders' Equity: Warehouse lines of credit 870.6 1,910.4 4,718.7 Term debt and other borrowings, net 941.3 845.5 1,226.5 Other liabilities 631.2 586.2 536.5 Total liabilities 2,443.1 3,342.1 6,481.7 Shareholders' Equity: Additional paid in capital 512.5 511.6 523.8 Retained earnings 126.6 220.7 252.8 Treasury stock — — — Total shareholders' equity 639.1 732.3 776.6 Total liabilities and shareholders' equity $ 3,082.2 $ 4,074.4 $ 7,258.3

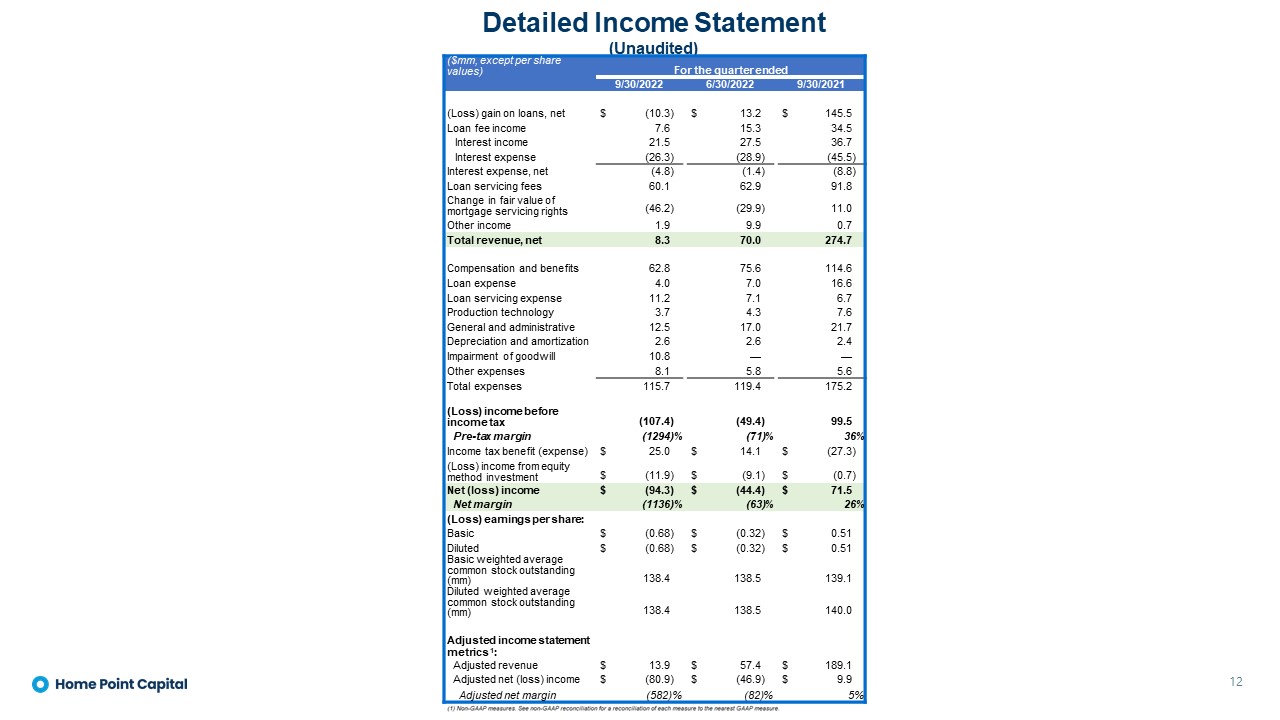
Detailed Income Statement (Unaudited) 12 ($mm, except per share values) For the quarter ended 9/30/2022 6/30/2022 9/30/2021 (Loss) gain on loans, net $ (10.3) $ 13.2 $ 145.5 Loan fee income 7.6 15.3 34.5 Interest income 21.5 27.5 36.7 Interest expense (26.3) (28.9) (45.5) Interest expense, net (4.8) (1.4) (8.8) Loan servicing fees 60.1 62.9 91.8 Change in fair value of mortgage servicing rights (46.2) (29.9) 11.0 Other income 1.9 9.9 0.7 Total revenue, net 8.3 70.0 274.7 Compensation and benefits 62.8 75.6 114.6 Loan expense 4.0 7.0 16.6 Loan servicing expense 11.2 7.1 6.7 Production technology 3.7 4.3 7.6 General and administrative 12.5 17.0 21.7 Depreciation and amortization 2.6 2.6 2.4 Impairment of goodwill 10.8 — — Other expenses 8.1 5.8 5.6 Total expenses 115.7 119.4 175.2 (Loss) income before income tax (107.4) (49.4) 99.5 Pre-tax margin (1294)% (71) % 36% Income tax benefit (expense) $ 25.0 $ 14.1 $ (27.3) (Loss) income from equity method investment $ (11.9) $ (9.1) $ (0.7) Net (loss) income $ (94.3) $ (44.4) $ 71.5 Net margin (1136)% (63) % 26% (Loss) earnings per share: Basic $ (0.68) $ (0.32) $ 0.51 Diluted $ (0.68) $ (0.32) $ 0.51 Basic weighted average common stock outstanding (mm) 138.4 138.5 139.1 Diluted weighted average common stock outstanding (mm) 138.4 138.5 140.0 Adjusted income statement metrics 1: Adjusted revenue $ 13.9 $ 57.4 $ 189.1 Adjusted net (loss) income $ (80.9) $ (46.9) $ 9.9 Adjusted net margin (582)% (82) % 5%
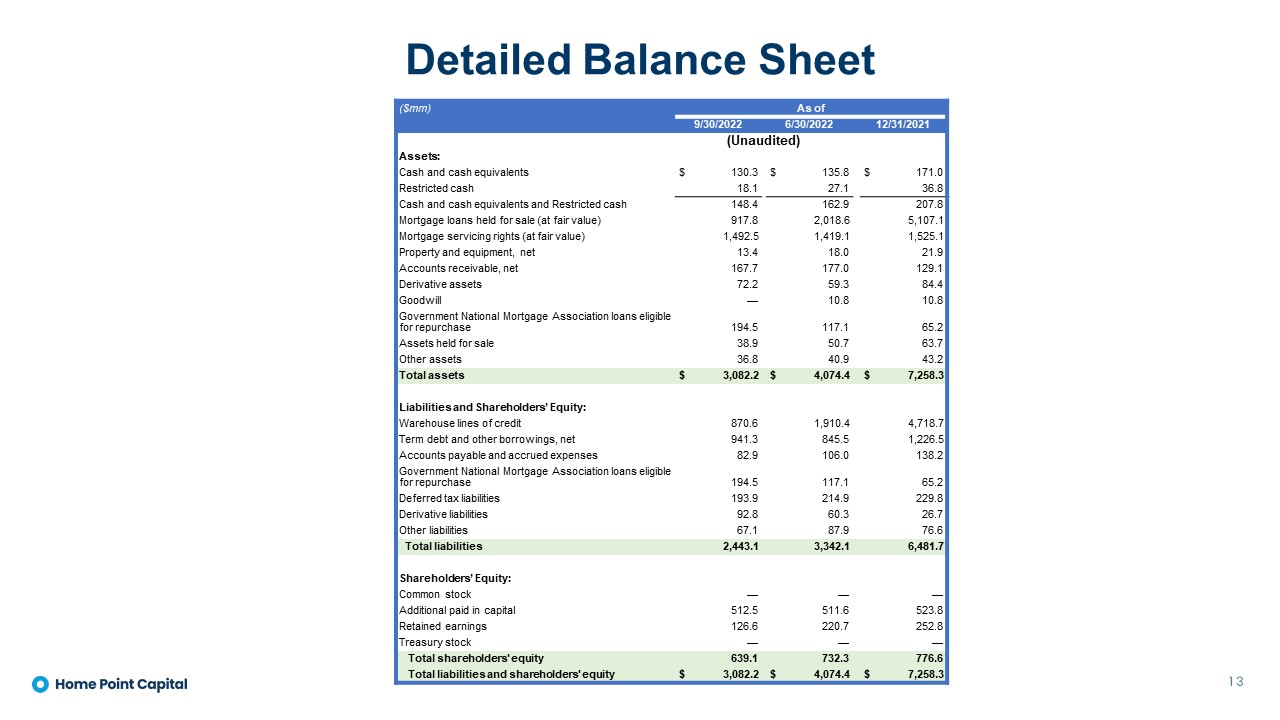
Detailed Balance Sheet 13 ($mm) As of 9/30/2022 6/30/2022 12/31/2021 (Unaudited) Assets: Cash and cash equivalents $ 130.3 $ 135.8 $ 171.0 Restricted cash 18.1 27.1 36.8 Cash and cash equivalents and Restricted cash 148.4 162.9 207.8 Mortgage loans held for sale (at fair value) 917.8 2,018.6 5,107.1 Mortgage servicing rights (at fair value) 1,492.5 1,419.1 1,525.1 Property and equipment, net 13.4 18.0 21.9 Accounts receivable, net 167.7 177.0 129.1 Derivative assets 72.2 59.3 84.4 Goodwill — 10.8 10.8 Government National Mortgage Association loans eligible for repurchase 194.5 117.1 65.2 Assets held for sale 38.9 50.7 63.7 Other assets 36.8 40.9 43.2 Total assets $ 3,082.2 $ 4,074.4 $ 7,258.3 Liabilities and Shareholders’ Equity: Warehouse lines of credit 870.6 1,910.4 4,718.7 Term debt and other borrowings, net 941.3 845.5 1,226.5 Accounts payable and accrued expenses 82.9 106.0 138.2 Government National Mortgage Association loans eligible for repurchase 194.5 117.1 65.2 Deferred tax liabilities 193.9 214.9 229.8 Derivative liabilities 92.8 60.3 26.7 Other liabilities 67.1 87.9 76.6 Total liabilities 2,443.1 3,342.1 6,481.7 Shareholders’ Equity: Common stock — — — Additional paid in capital 512.5 511.6 523.8 Retained earnings 126.6 220.7 252.8 Treasury stock — — — Total shareholders' equity 639.1 732.3 776.6 Total liabilities and shareholders' equity $ 3,082.2 $ 4,074.4 $ 7,258.3
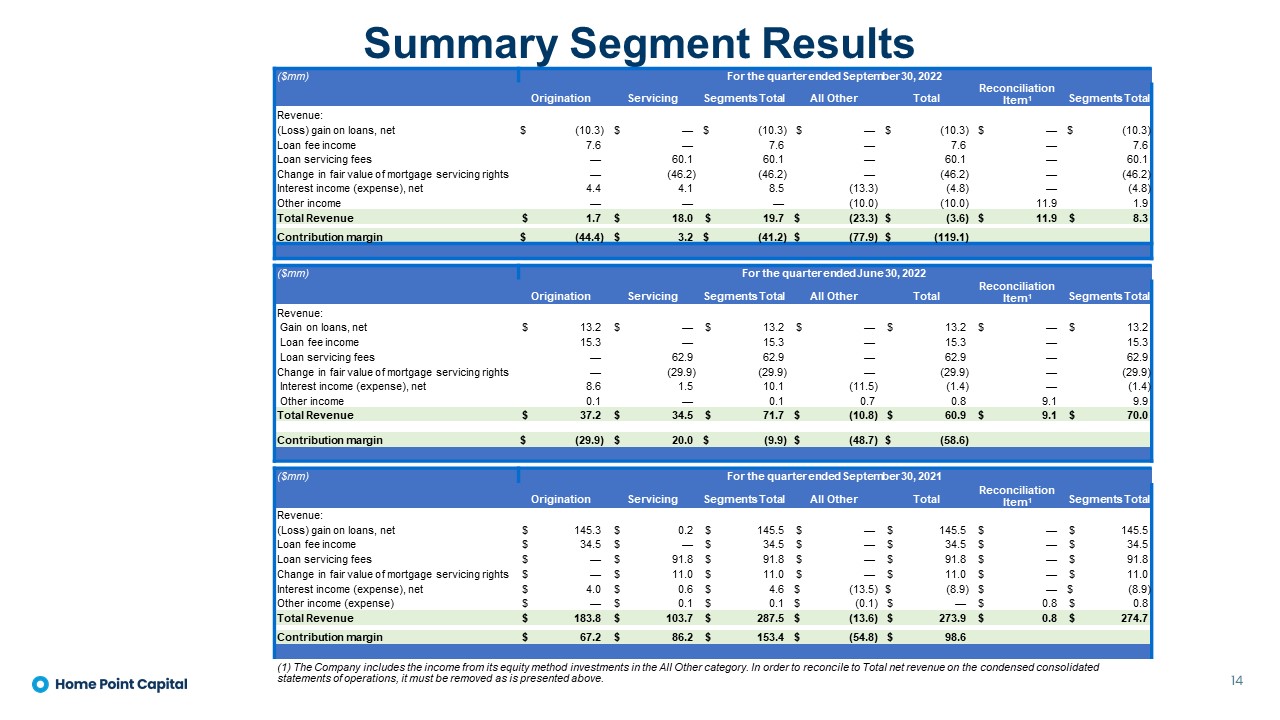
Summary Segment Results 14 ($mm) For the quarter ended September 30, 2022 Origination Servicing Segments Total All Other Total Reconciliation Item1 Segments Total Revenue: (Loss) gain on loans, net $ (10.3) $ — $ (10.3) $ — $ (10.3) $ — $ (10.3) Loan fee income 7.6 — 7.6 — 7.6 — 7.6 Loan servicing fees — 60.1 60.1 — 60.1 — 60.1 Change in fair value of mortgage servicing rights — (46.2) (46.2) — (46.2) — (46.2) Interest income (expense), net 4.4 4.1 8.5 (13.3) (4.8) — (4.8) Other income — — — (10.0) (10.0) 11.9 1.9 Total Revenue $ 1.7 $ 18.0 $ 19.7 $ (23.3) $ (3.6) $ 11.9 $ 8.3 Contribution margin $ (44.4) $ 3.2 $ (41.2) $ (77.9) $ (119.1) ($mm) For the quarter ended June 30, 2022 Origination Servicing Segments Total All Other Total Reconciliation Item1 Segments Total Revenue: Gain on loans, net $ 13.2 $ — $ 13.2 $ — $ 13.2 $ — $ 13.2 Loan fee income 15.3 — 15.3 — 15.3 — 15.3 Loan servicing fees — 62.9 62.9 — 62.9 — 62.9 Change in fair value of mortgage servicing rights — (29.9) (29.9) — (29.9) — (29.9) Interest income (expense), net 8.6 1.5 10.1 (11.5) (1.4) — (1.4) Other income 0.1 — 0.1 0.7 0.8 9.1 9.9 Total Revenue $ 37.2 $ 34.5 $ 71.7 $ (10.8) $ 60.9 $ 9.1 $ 70.0 Contribution margin $ (29.9) $ 20.0 $ (9.9) $ (48.7) $ (58.6) ($mm) For the quarter ended September 30, 2021 Origination Servicing Segments Total All Other Total Reconciliation Item1 Segments Total Revenue: (Loss) gain on loans, net $ 145.3 $ 0.2 $ 145.5 $ — $ 145.5 $ — $ 145.5 Loan fee income $ 34.5 $ — $ 34.5 $ — $ 34.5 $ — $ 34.5 Loan servicing fees $ — $ 91.8 $ 91.8 $ — $ 91.8 $ — $ 91.8 Change in fair value of mortgage servicing rights $ — $ 11.0 $ 11.0 $ — $ 11.0 $ — $ 11.0 Interest income (expense), net $ 4.0 $ 0.6 $ 4.6 $ (13.5) $ (8.9) $ — $ (8.9) Other income (expense) $ — $ 0.1 $ 0.1 $ (0.1) $ — $ 0.8 $ 0.8 Total Revenue $ 183.8 $ 103.7 $ 287.5 $ (13.6) $ 273.9 $ 0.8 $ 274.7 Contribution margin $ 67.2 $ 86.2 $ 153.4 $ (54.8) $ 98.6 (1) The Company includes the income from its equity method investments in the All Other category. In order to reconcile to Total net revenue on the condensed consolidated statements of operations, it must be removed as is presented above.
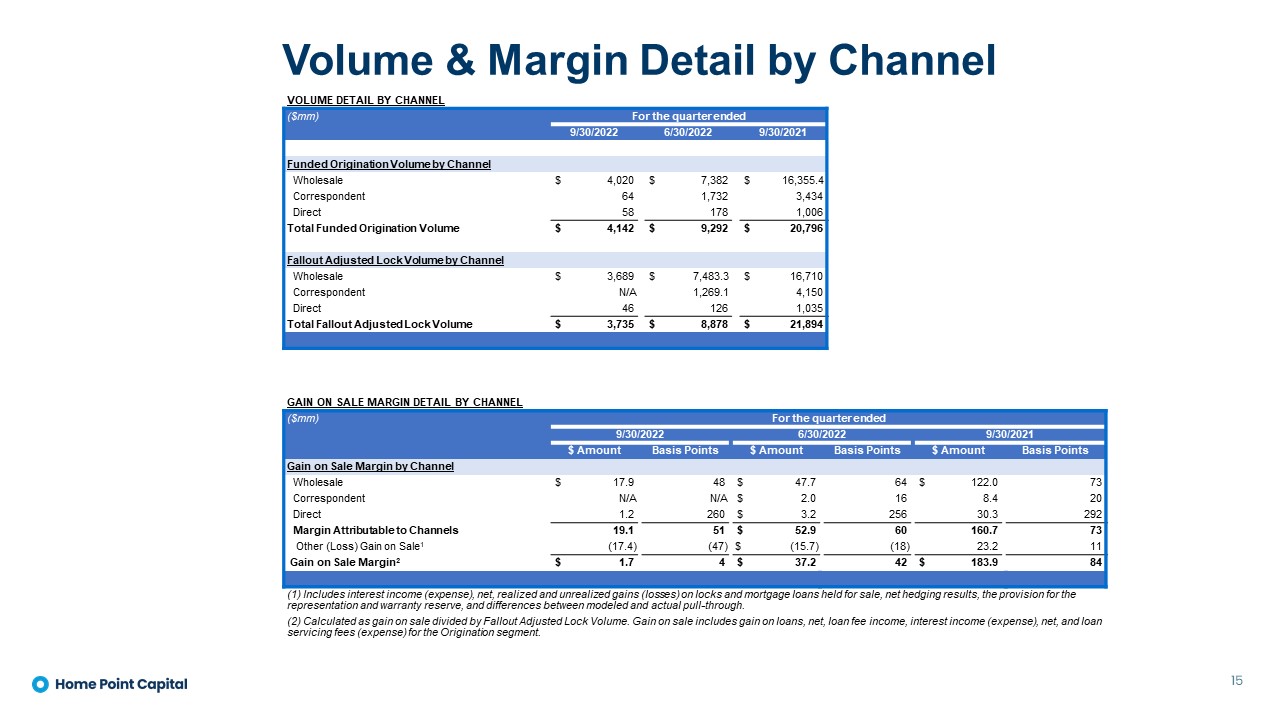
Volume & Margin Detail by Channel 15 VOLUME DETAIL BY CHANNEL ($mm) For the quarter ended 9/30/2022 6/30/2022 9/30/2021 Funded Origination Volume by Channel Wholesale $ 4,020 $ 7,382 $ 16,355.4 Correspondent 64 1,732 3,434 Direct 58 178 1,006 Total Funded Origination Volume $ 4,142 $ 9,292 $ 20,796 Fallout Adjusted Lock Volume by Channel Wholesale $ 3,689 $ 7,483.3 $ 16,710 Correspondent N/A 1,269.1 4,150 Direct 46 126 1,035 Total Fallout Adjusted Lock Volume $ 3,735 $ 8,878 $ 21,894 GAIN ON SALE MARGIN DETAIL BY CHANNEL ($mm) For the quarter ended 9/30/2022 6/30/2022 9/30/2021 $ Amount Basis Points $ Amount Basis Points $ Amount Basis Points Gain on Sale Margin by Channel Wholesale $ 17.9 48 $ 47.7 64 $ 122.0 73 Correspondent N/A N/A $ 2.0 16 8.4 20 Direct 1.2 260 $ 3.2 256 30.3 292 Margin Attributable to Channels 19.1 51 $ 52.9 60 160.7 73 Other (Loss) Gain on Sale1 (17.4) (47) $ (15.7) (18) 23.2 11 Gain on Sale Margin2 $ 1.7 4 $ 37.2 42 $ 183.9 84 (1) Includes interest income (expense), net, realized and unrealized gains (losses) on locks and mortgage loans held for sale, net hedging results, the provision for the representation and warranty reserve, and differences between modeled and actual pull-through. (2) Calculated as gain on sale divided by Fallout Adjusted Lock Volume. Gain on sale includes gain on loans, net, loan fee income, interest income (expense), net, and loan servicing fees (expense) for the Origination segment.
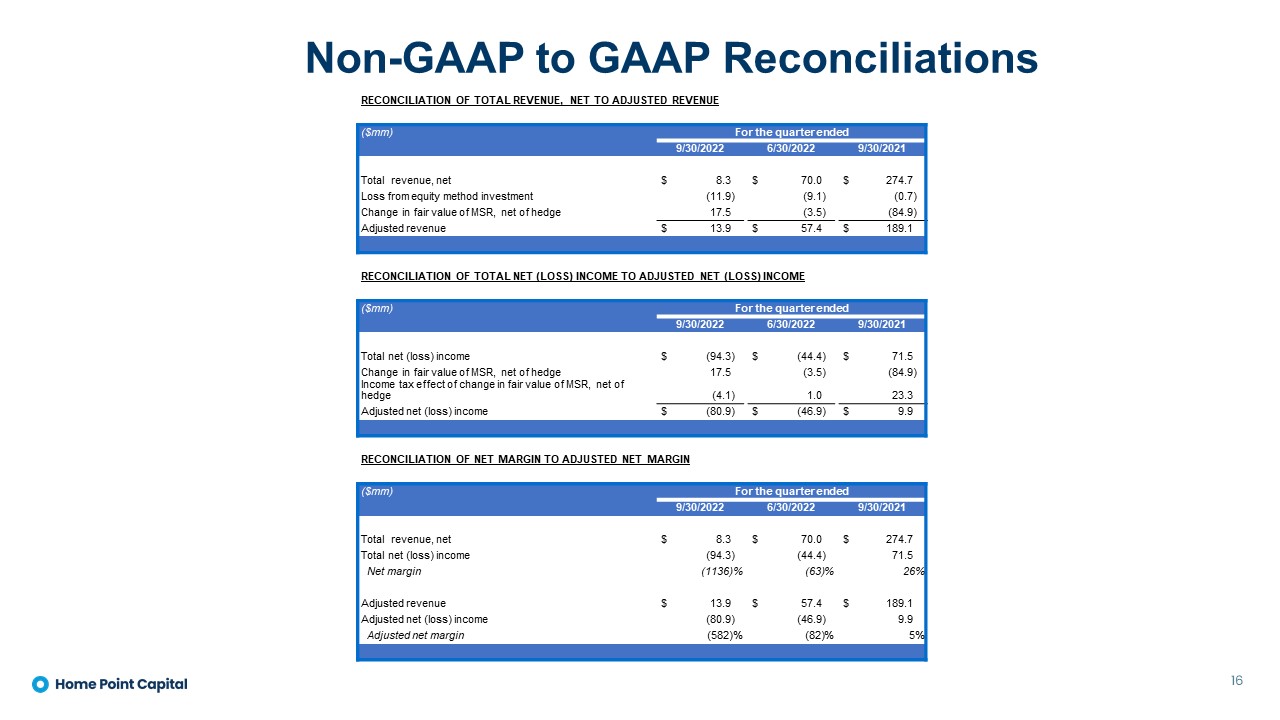
Non-GAAP to GAAP Reconciliations 16 RECONCILIATION OF TOTAL REVENUE, NET TO ADJUSTED REVENUE ($mm) For the quarter ended 9/30/2022 6/30/2022 9/30/2021 Total revenue, net $ 8.3 $ 70.0 $ 274.7 Loss from equity method investment (11.9) (9.1) (0.7) Change in fair value of MSR, net of hedge 17.5 (3.5) (84.9) Adjusted revenue $ 13.9 $ 57.4 $ 189.1 RECONCILIATION OF TOTAL NET (LOSS) INCOME TO ADJUSTED NET (LOSS) INCOME ($mm) For the quarter ended 9/30/2022 6/30/2022 9/30/2021 Total net (loss) income $ (94.3) $ (44.4) $ 71.5 Change in fair value of MSR, net of hedge 17.5 (3.5) (84.9) Income tax effect of change in fair value of MSR, net of hedge (4.1) 1.0 23.3 Adjusted net (loss) income $ (80.9) $ (46.9) $ 9.9 RECONCILIATION OF NET MARGIN TO ADJUSTED NET MARGIN ($mm) For the quarter ended 9/30/2022 6/30/2022 9/30/2021 Total revenue, net $ 8.3 $ 70.0 $ 274.7 Total net (loss) income (94.3) (44.4) 71.5 Net margin (1136)% (63) % 26% Adjusted revenue $ 13.9 $ 57.4 $ 189.1 Adjusted net (loss) income (80.9) (46.9) 9.9 Adjusted net margin (582)% (82) % 5%
To provide investors with information in addition to our results as determined under Generally Accepted Accounting Principles (“GAAP”), we disclose Adjusted revenue, Adjusted net Income (Loss), and Adjusted net margin as “non-GAAP measures,” which management believes provide useful information to investors. These measures are not financial measures calculated in accordance with GAAP and should not be considered as a substitute for revenue, net income, or any other operating performance measure calculated in accordance with GAAP, and may not be comparable to a similarly titled measure reported by other companies. We define Adjusted revenue as Total net revenue exclusive of the impact of the change in fair value of MSRs related to changes in valuation inputs and assumptions, net of MSRs hedge and adjusted for Income from equity method investment. We define Adjusted net Income as Net income (Loss) exclusive of the impact of the change in fair value of MSRs related to changes in valuation inputs and assumptions, net of MSRs hedge. We exclude changes in fair value of MSRs, net of hedge from each of Adjusted revenue and Adjusted net Income (Loss) as they add volatility and are not indicative of the Company’s operating performance or results of operation. This adjustment does not include changes in fair value of MSRs due to realization of cash flows, which remain in each of Adjusted revenue and Adjusted net Income (Loss). Realization of cash flows occurs when cash is collected as customers make scheduled payments, partial prepayments of principal, or pay their mortgage in full. We define Adjusted net margin by dividing Adjusted net Income (Loss) by Adjusted revenue. We believe that Adjusted revenue, Adjusted net Income (Loss), and Adjusted net margin can provide useful information to investors and others in understanding and evaluating our operating results. These measures are not financial measures calculated in accordance with GAAP and should not be considered as a substitute for net income, or any other operating performance measure calculated in accordance with GAAP and may not be comparable to a similarly titled measure reported by other companies. We believe that the presentation of Adjusted revenue, Adjusted net Income (Loss), and Adjusted net margin provides useful information to investors regarding our results of operations because each measure assists both investors and management in analyzing and benchmarking the performance and value of our business. Adjusted revenue, Adjusted net Income (Loss), and Adjusted net margin provide indicators of performance that are not affected by fluctuations in certain costs or other items. Accordingly, management believes that these measurements are useful for comparing general operating performance from period to period, and management relies on these measures for planning and forecasting of future periods. The Company measures the performance of the segments primarily on a contribution margin basis. Additionally, these measures allow management to compare our results with those of other companies that have different financing and capital structures. However, other companies may define Adjusted revenue, Adjusted net Income (Loss), and Adjusted net margin differently, and as a result, our measures of Adjusted revenue, Adjusted net Income (Loss), and Adjusted net margin may not be directly comparable to those of other companies. 17 Non-GAAP Financial Measures