
Confidential Investor Presentation September 2021 Exhibit 99.1

Forward-Looking Statements 2 This presentation contains certain “forward-looking statements,” as that term is defined in the U.S. federal securities laws, including the Private Securities Litigation Reform Act of 1995. In addition, from time to time, Home Point Capital Inc. (“we,” “our,” “us” or the “Company”) or its representatives have made, or may make, forward-looking statements orally or in writing. These forward-looking statements include, but are not limited to, statements other than statements of historical facts, including among others, statements relating to the Company’s future financial performance, the Company’s business prospects and strategy, anticipated financial position, liquidity and capital needs, the industry in which the Company operates and other similar matters. Words such as “anticipates,” “expects,” “intends,” “plans,” “predicts,” “believes,” “seeks,” “estimates,” “could,” “would,” “will,” “may,” “can,” “continue,” “potential,” “should” and the negative of these terms or other comparable terminology often identify forward-looking statements. These forward-looking statements, which are based on currently available information, operating plans, and projections about events and trends, are not guarantees of future performance and are subject to risks and uncertainties that could cause actual results to differ materially from the results contemplated by the forward-looking statements. Factors, risks, and uncertainties that could cause actual outcomes and results to be materially different from those contemplated by forward-looking statements include, among others: the spread of the COVID-19 outbreak and severe disruptions in the U.S. and global economy and financial markets it has caused; our reliance on our financing arrangements to fund mortgage loans and otherwise operate our business; the dependence of our loan origination and servicing revenues on macroeconomic and U.S. residential real estate market conditions; counterparty risk; the requirement to make servicing advances that can be subject to delays in recovery or may not be recoverable in certain circumstances; competition for mortgage assets that may limit the availability of desirable originations, acquisitions and result in reduced risk-adjusted returns; our ability to continue to grow our loan origination business or effectively manage significant increases in our loan production volume; competition in the industry in which we operate; our success and growth of our production and servicing activities and the dependence upon our ability to adapt to and implement technological changes; the effectiveness of our risk management efforts; our ability to detect misconduct and fraud; any cybersecurity risks, cyber incidents and technology failures; our vendor relationships; our failure to deal appropriately with various issues that may give rise to reputational risk, including legal and regulatory requirements; risks and uncertainties associated with litigation, including any employment, intellectual property, consumer protection, class action and other litigation matters, and related unfavorable publicity; exposure to new risks and increased costs as a result of initiating new business activities or strategies or significantly expanding existing business activities or strategies; the impact of changes in political or economic stability or in government policies on our material vendors with operations in India; the impact of interest rate fluctuations; risks associated with hedging against interest rate exposure; the impact of any prolonged economic slowdown, recession or declining real estate values; risks associated with financing our assets with borrowings; risks associated with a decrease in value of our collateral; the dependence of our operations on access to our financing arrangements; risks associated with the financial and restrictive covenants included in our financing agreements; risks associated with higher risk loans that we service; risks associated with derivative financial instruments; our ability to foreclose on our mortgage assets in a timely manner or at all; our ability to obtain and/or maintain licenses and other approvals in those jurisdictions where required to conduct our business; legislative and regulatory changes that impact the mortgage loan industry or housing market; and changes in regulations or the occurrence of other events that impact the business, operations or prospects of government agencies or such changes that increase the cost of doing business with such entities. You should carefully consider the foregoing factors and the other risks and uncertainties that may affect the Company’s business, including those described in documents filed from time to time by the Company with the Securities and Exchange Commission. Many of the important factors that will determine these results are beyond our ability to control or predict. You are cautioned not to put undue reliance on any forward-looking statements, which speak only as of the date thereof. Except as required under applicable law, the Company does not assume any obligation to update these forward-looking statements.

3 Home Point Capital at a Glance One of the largest U.S. residential mortgage originators and servicers Founded in 2015; completed IPO in February 2021 (Nasdaq: HMPT) Headquartered in Ann Arbor, Michigan; ~3,500 associates Primary emphasis on large and growing third-party origination market Differentiated business model focused on optimizing lifetime customer value
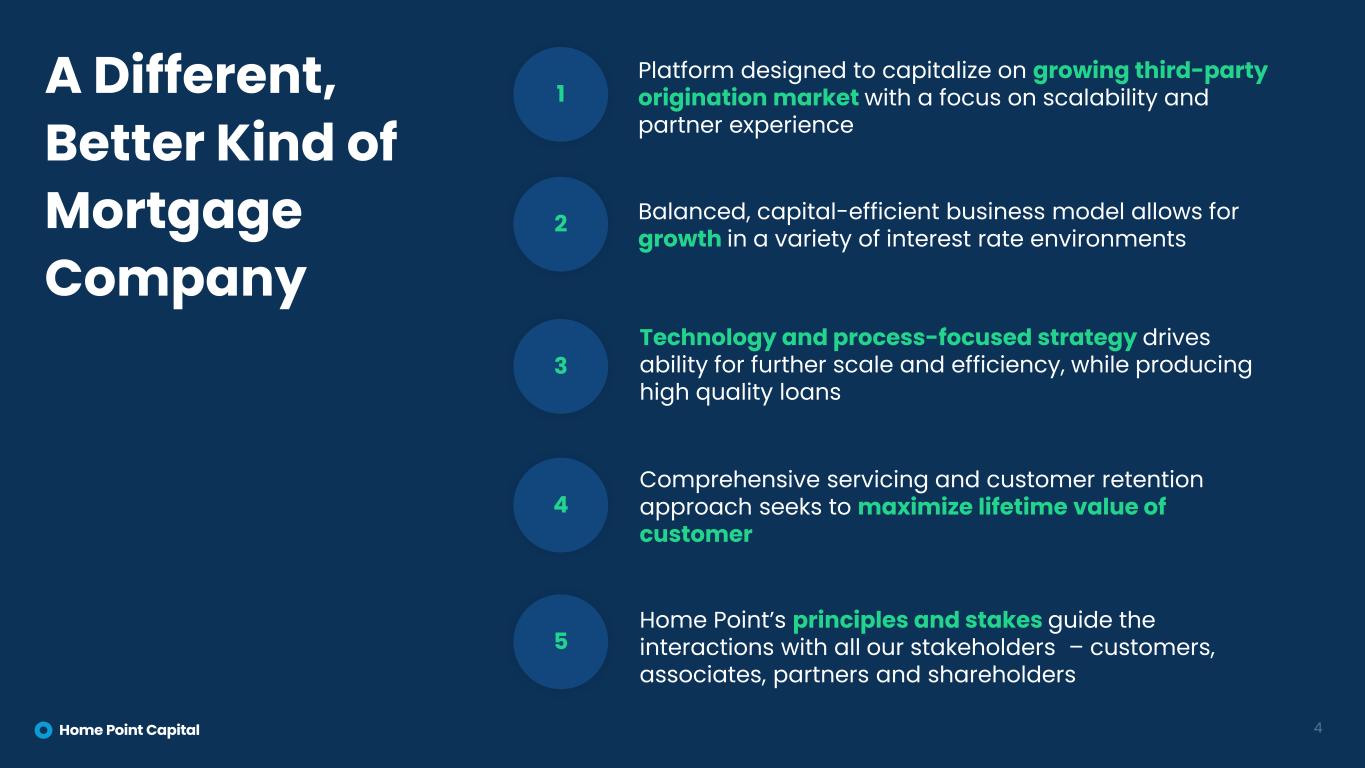
A Different, Better Kind of Mortgage Company 4 Balanced, capital-efficient business model allows for growth in a variety of interest rate environments Comprehensive servicing and customer retention approach seeks to maximize lifetime value of customer Home Point’s principles and stakes guide the interactions with all our stakeholders – customers, associates, partners and shareholders Technology and process-focused strategy drives ability for further scale and efficiency, while producing high quality loans Platform designed to capitalize on growing third-party origination market with a focus on scalability and partner experience 1 2 3 4 5

Home Point Capital by the Numbers $97bn LTM Q2 2021 Funded Origination Volume 10% Q2’2021 Wholesale Channel Market Share2 ~449k Servicing Customers3 $1.5bn LTM Q2 2021 Total Revenue, Net5 5 #7 Non-Bank Mortgage Originator1 ~7,400 Third-Party Origination Relationships4 #3 Wholesale Lender1 (1) Source: Inside Mortgage Finance. As of June 30, 2021. (2) Wholesale channel share calculated as Home Point Capital’s wholesale originations dollar value divided by the total wholesale originations in the United States per Inside Mortgage Finance. (3) As of June 30, 2021. (4) Includes correspondent and broker partners combined. As of June 30, 2021. (5) Last twelve months for the period ended June 30th. Second quarter 2021 LTM information is derived from a numerical calculation of our fiscal year 2020 financial information plus first half 2021 financial information less first half 2020 financial information. Home Point Capital does not prepare or present separate LTM financial statements. $524mm LTM Q2 2021 Net Income4

Highly Experienced Leadership Team 6 Jean Weng General Counsel Corporate Secretary John Forlines Chief Risk Officer Noelle Lipscomb Chief Audit Executive Andrew Bon Salle Chairman of the Board, Home Point Capital Willie Newman CEO and President Mark Elbaum Chief Financial Officer Maria Fregosi Chief Investment Officer Phil Miller Chief Operating Officer Phil Shoemaker President of Originations Perry Hilzendeger President of Servicing

Mortgage is 70% of total consumer debt Massive Addressable Market Residential mortgage is the largest class of consumer debt in the United States, with $10.5 trillion of total mortgage debt outstanding1 7 ~$2.0tn Annual origination volume since 20002 ~$1.5tn Annual purchase volume growing with GDP3 $14.9 trillion Total U.S. Consumer Debt $1.6 trillion1 Student Loan Debt (11%) $1.5 trillion1 Auto Loan Debt (10%) $0.7 trillion1 Credit Card Debt (5%) $0.6 trillion1 Other Debt (4%) (1) Federal Reserve Bank of New York. Data as of August 2021. (2) Fannie Mae Housing Forecast, August 2021. (3) Inside Mortgage Finance. $10.5 trillion1 Mortgage Debt (70%) ~$3.3tn 2022 projected market origination volume2 Market has experienced significant growth
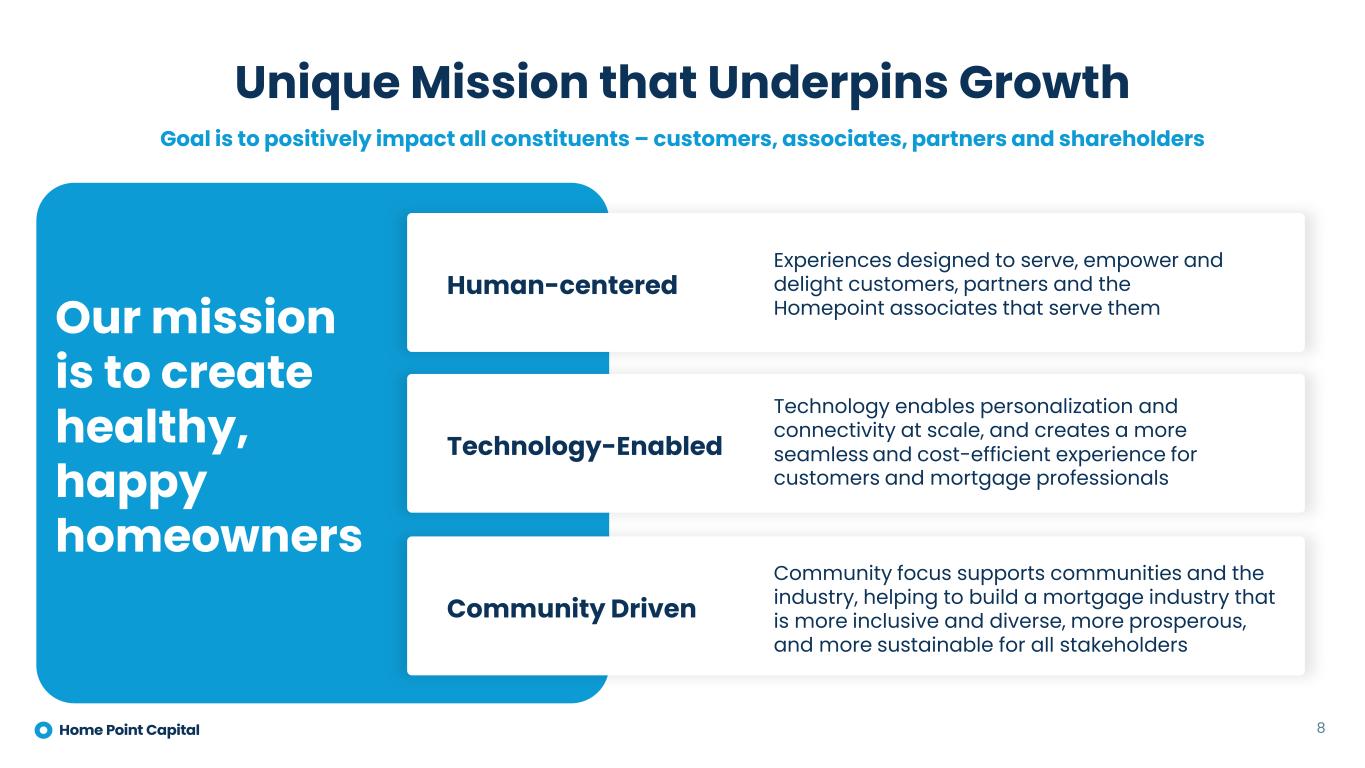
8 Unique Mission that Underpins Growth Human-centered Experiences designed to serve, empower and delight customers, partners and the Homepoint associates that serve themOur mission is to create healthy, happy homeowners Technology-Enabled Technology enables personalization and connectivity at scale, and creates a more seamless and cost-efficient experience for customers and mortgage professionals Community Driven Community focus supports communities and the industry, helping to build a mortgage industry that is more inclusive and diverse, more prosperous, and more sustainable for all stakeholders Goal is to positively impact all constituents – customers, associates, partners and shareholders

Platform Built to Support Sustainable Growth 9 Efficient Access to Growing Network of In-Market Originators Opportunistically Building Scale Through Lowest Cost Customer Acquisition Channel Emphasizing Growth in High Margin Retention Opportunities Providing Customer Experience That Delivers Value Throughout Servicing Life Cycle Focused Strategic Approach Towards Maximizing Lifetime Customer Value Wholesale Correspondent Direct Comprehensive Servicing Model Optimize Lifetime Customer Value
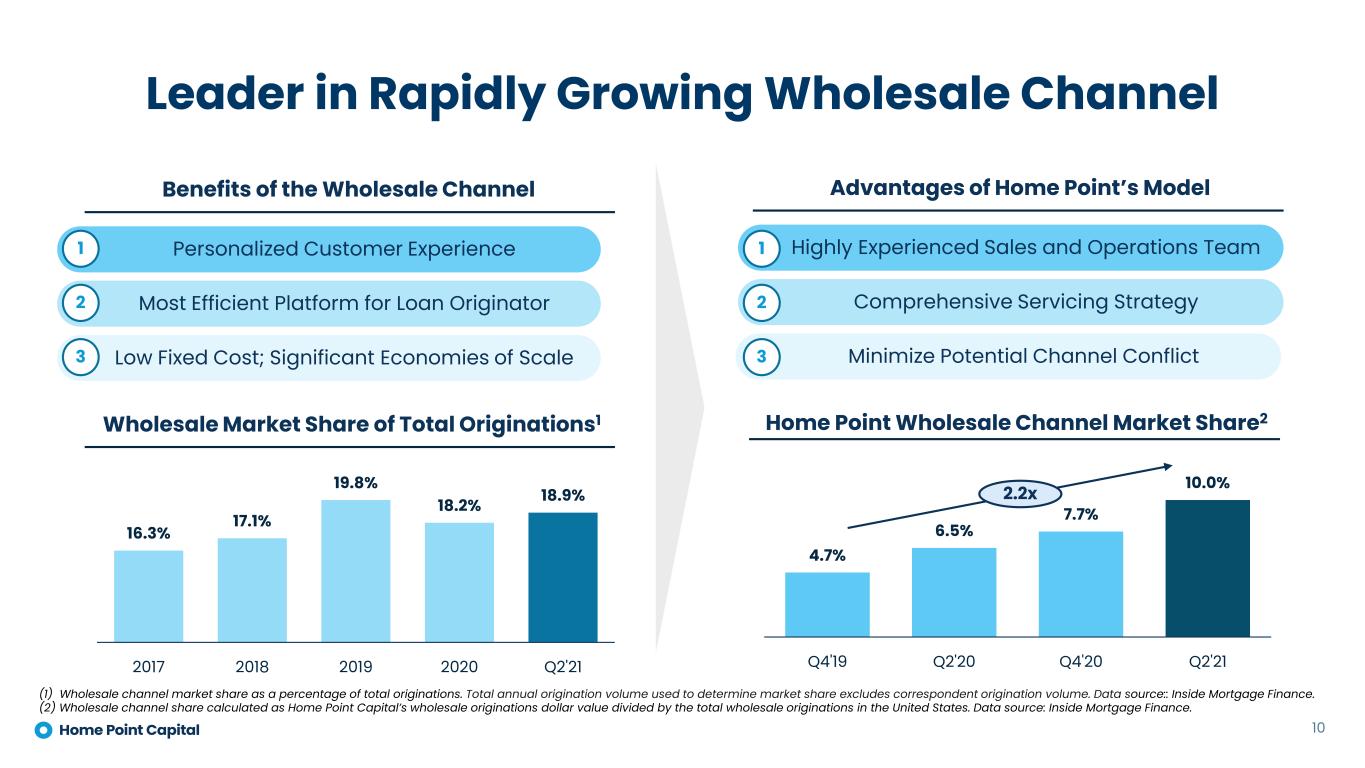
Leader in Rapidly Growing Wholesale Channel 10 Personalized Customer Experience1 Most Efficient Platform for Loan Originator2 Low Fixed Cost; Significant Economies of Scale3 Benefits of the Wholesale Channel Wholesale Market Share of Total Originations1 16.3% 17.1% 19.8% 18.2% 18.9% 2017 2018 2019 2020 Q2'21 Advantages of Home Point’s Model Home Point Wholesale Channel Market Share2 4.7% 6.5% 7.7% 10.0% Q4'19 Q2'20 Q4'20 Q2'21 Highly Experienced Sales and Operations Team Comprehensive Servicing Strategy Minimize Potential Channel Conflict (1) Wholesale channel market share as a percentage of total originations. Total annual origination volume used to determine market share excludes correspondent origination volume. Data source:: Inside Mortgage Finance. (2) Wholesale channel share calculated as Home Point Capital’s wholesale originations dollar value divided by the total wholesale originations in the United States. Data source: Inside Mortgage Finance. 2.2x 1 2 3
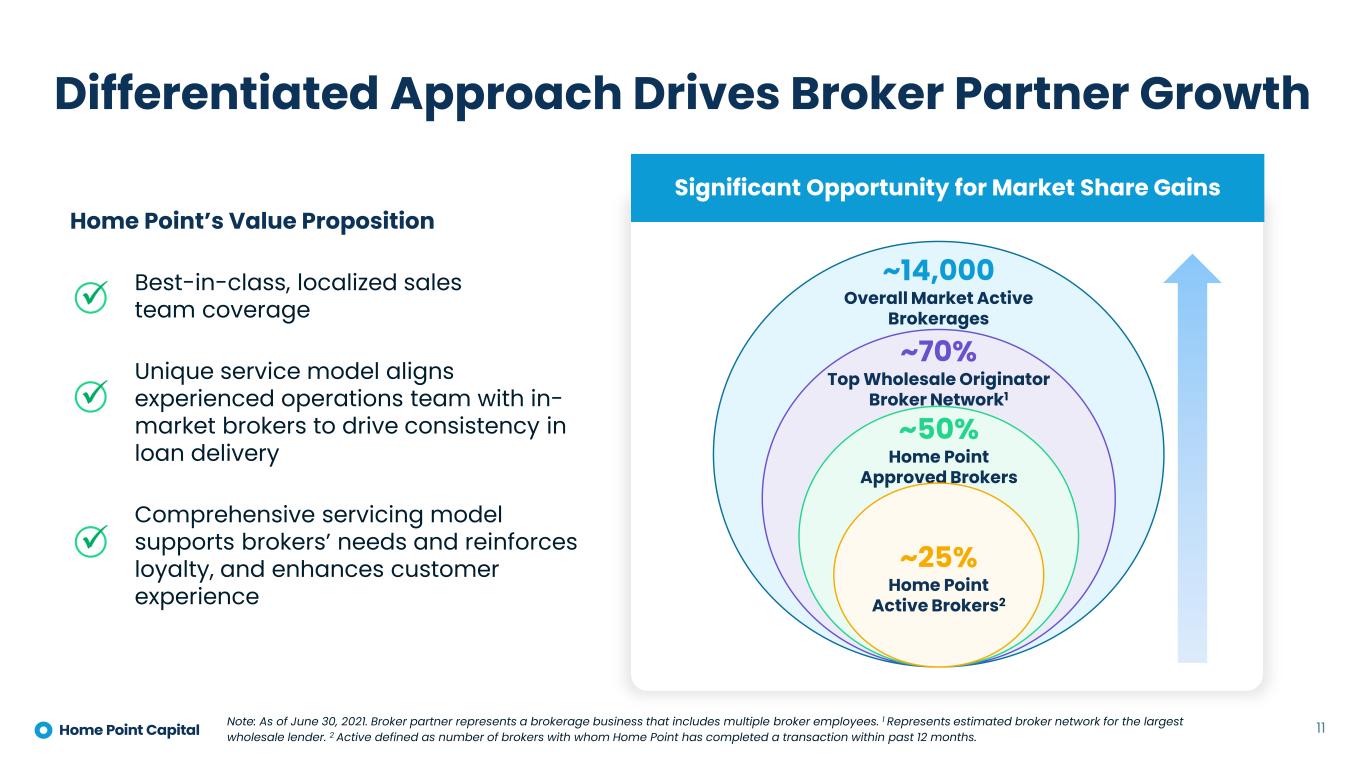
Differentiated Approach Drives Broker Partner Growth Home Point’s Value Proposition Best-in-class, localized sales team coverage Unique service model aligns experienced operations team with in- market brokers to drive consistency in loan delivery Comprehensive servicing model supports brokers’ needs and reinforces loyalty, and enhances customer experience 11 Significant Opportunity for Market Share Gains ~14,000 Overall Market Active Brokerages ~50% Home Point Approved Brokers ~25% Home Point Active Brokers2 ~70% Top Wholesale Originator Broker Network1 Note: As of June 30, 2021. Broker partner represents a brokerage business that includes multiple broker employees. 1 Represents estimated broker network for the largest wholesale lender. 2 Active defined as number of brokers with whom Home Point has completed a transaction within past 12 months.

12 Operations structured around regional support teams aligned with Homepoint’s six regions across the U.S. New path enables accelerated transformation with focus on three core outcomes: efficiency, experience, and quality New origination service model integrates “small lender feel” with the technology, resources and capabilities of a large lender Combines regionalized support with our national platform to help maximize broker efficiency and deliver faster, more personalized customer experience Homepoint Amplify: A New Origination Service Model Introduced in June 2021 to Help Mortgage Brokers Thrive in Purchase Market
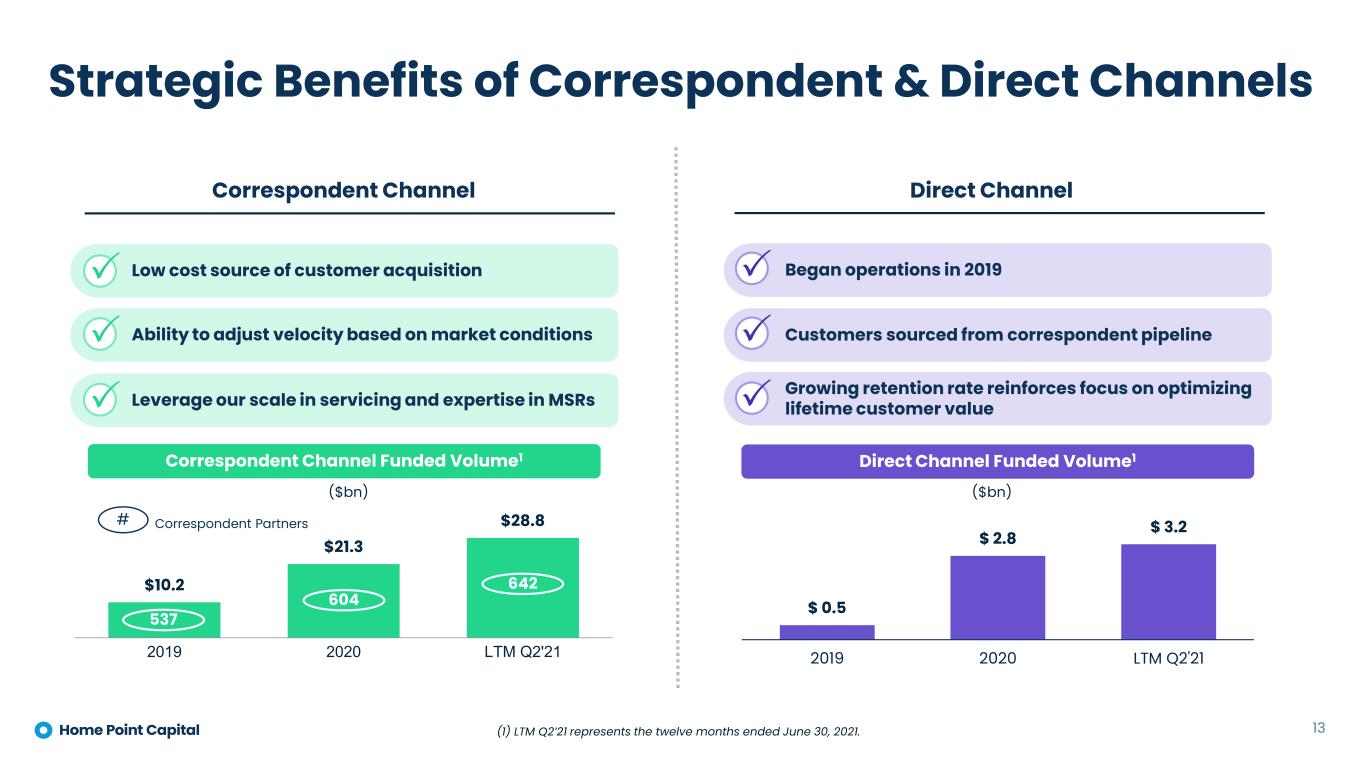
Strategic Benefits of Correspondent & Direct Channels $10.2 $21.3 $28.8 2019 2020 LTM Q2'21 ($bn) 537 604 Correspondent Partners 13 Direct Channel Funded Volume1 $ 0.5 $ 2.8 $ 3.2 2019 2020 LTM Q2'21 Correspondent Channel Funded Volume1 Ability to adjust velocity based on market conditions Leverage our scale in servicing and expertise in MSRs Low cost source of customer acquisition ($bn) Growing retention rate reinforces focus on optimizing lifetime customer value Customers sourced from correspondent pipeline Began operations in 2019 Correspondent Channel Direct Channel # 642 (1) LTM Q2’21 represents the twelve months ended June 30, 2021.

$41 $53 $91 $124 2018 2019 2020 Q2'21 ($bn) 14 Servicing is an integral component of maximizing lifetime value of Homepoint customers Enhances the customer experience throughout loan lifecycle, leading to improved retention Offers unique opportunity to reinforce and strengthen broker relationships Compelling economic model; provides meaningful hedge in rising rate environment Servicing Platform Growth (End of Period UPB) 189,513 236,362 Number of Loans Serviced: 359,323 Comprehensive Approach in Servicing Channel 3.0x 449,029
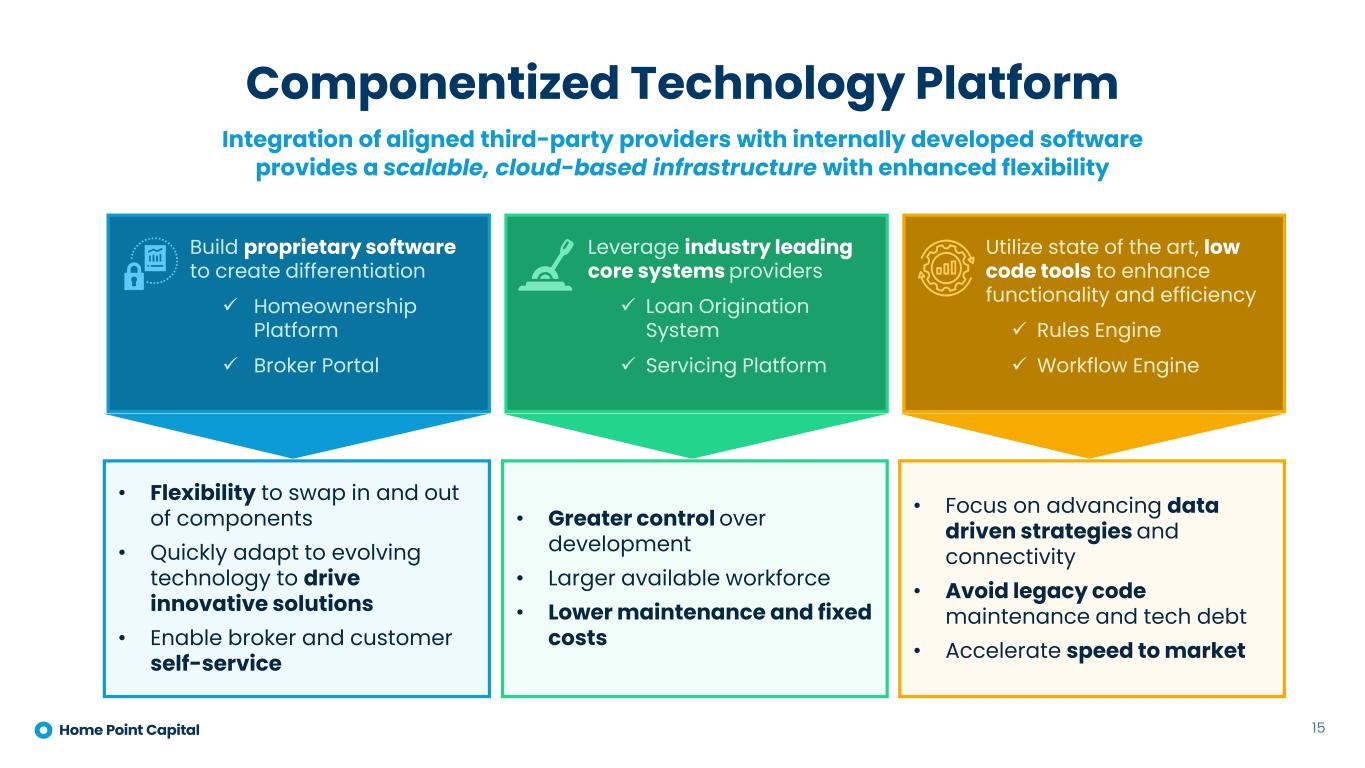
Componentized Technology Platform Integration of aligned third-party providers with internally developed software provides a scalable, cloud-based infrastructure with enhanced flexibility 15 Build proprietary software to create differentiation Homeownership Platform Broker Portal Leverage industry leading core systems providers Loan Origination System Servicing Platform Utilize state of the art, low code tools to enhance functionality and efficiency Rules Engine Workflow Engine • Flexibility to swap in and out of components • Quickly adapt to evolving technology to drive innovative solutions • Enable broker and customer self-service • Greater control over development • Larger available workforce • Lower maintenance and fixed costs • Focus on advancing data driven strategies and connectivity • Avoid legacy code maintenance and tech debt • Accelerate speed to market

Capital Management Strategy 16 Overarching objectives of Home Point’s capital management strategy include: • Maintain adequate liquidity to fund current and future business operations across a variety of projected scenarios • Provide an attractive long-term risk-adjusted return on capital Home Point’s capital management strategy addresses key areas including leverage and capitalization, liquidity, and payments to debt and equity holders Asset Allocation Liquidity Leverage & Capital Ratios • Maintain adequate capital and liquidity to satisfy regulatory, agency, and covenant requirements • Long-term target gross corporate debt to tangible common equity (TCE) ratio of 1.0x • Liquidity is closely monitored and ensured to be held in excess of potential needs

Executing a Well-Defined Strategy to Scale and Optimize Our Business 17 Accelerate productivity and efficiency initiatives Diversify capital markets execution alternatives Continue to enhance partner and customer experience Increase momentum of broker partner growth Driving Home Point Towards a Baseline Return on Equity of At Least 15%

18 Appendix

Detailed Income Statement 19 ($mm, except per share values) 6/30/2021 3/31/2021 6/30/2020 Gain on loans, net 75.0$ 301.2$ 356.9$ Loan fee income 39.5 44.1 20.4 Interest income 34.6 25.6 11.8 Interest expense (44.1) (32.9) (14.4) Interest (expense), net (9.5) (7.4) (2.6) Loan servicing fees 85.6 70.3 42.3 Change in FV of MSR (106.9) 12.8 (72.2) Other income 0.7 0.8 0.3 Total revenue, net 84.4 422.0 345.0 Compensation and benefits 127.3 153.6 81.3 Loan expense 17.5 22.4 7.6 Loan servicing expense 7.5 8.1 8.3 Production technology 8.2 8.6 5.0 General and administrative 26.5 22.2 11.9 Depreciation and amortization 2.4 2.8 1.4 Other expense 8.6 9.3 2.8 Total Expenses 198.0 227.0 118.4 Pre-tax income (113.6) 194.9 226.7 Pre-tax margin NM 46% 66% Income tax expense (benefit) (27.2) 50.1 59.5 Income from equity method investment 13.2 4.2 1.9 Net income (loss) (73.2)$ 149.0$ 169.0$ Net margin NM 35% 49% Basic and diluted earnings per share1: Basic net income (loss) per share (0.53)$ 1.07$ 1.22$ Diluted total net income (loss) per share (0.52) 1.06 1.22 Basic weighted average common stock outstanding (mm) 138.9 138.9 138.9 Diluted weighted average common stock outstanding (mm) 140.5 139.7 139.1 Adjusted income statement metrics2: Adjusted revenue 126.8$ 324.1$ 378.0$ Adjusted net income (51.0) 72.7 192.0 Adjusted net margin NM 22% 51% For the quarter ended (1) On January 21, 2021, Home Point Capital effected a stock split of its outstanding common stock pursuant to which the 100 outstanding shares were split into 1,388,601.11 shares each, for a total of 138,860,103 shares of outstanding common stock. As a result, all amounts relating to per share amounts have been retroactively adjusted to reflect this stock split. (2) Non-GAAP measures. See non-GAAP reconciliation for a reconciliation of each measure to the nearest GAAP measure.
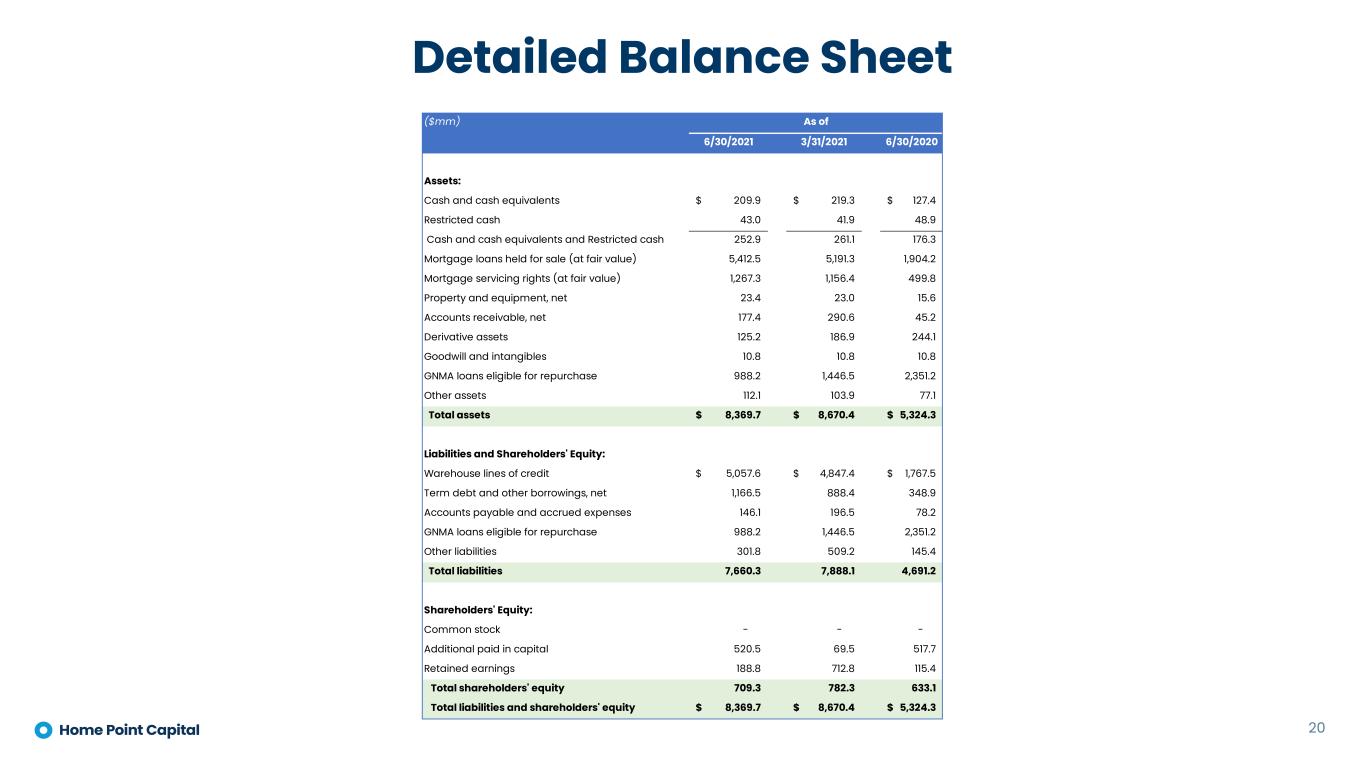
Detailed Balance Sheet 20 ($mm) 6/30/2021 3/31/2021 6/30/2020 Assets: Cash and cash equivalents 209.9$ 219.3$ 127.4$ Restricted cash 43.0 41.9 48.9 Cash and cash equivalents and Restricted cash 252.9 261.1 176.3 Mortgage loans held for sale (at fair value) 5,412.5 5,191.3 1,904.2 Mortgage servicing rights (at fair value) 1,267.3 1,156.4 499.8 Property and equipment, net 23.4 23.0 15.6 Accounts receivable, net 177.4 290.6 45.2 Derivative assets 125.2 186.9 244.1 Goodwill and intangibles 10.8 10.8 10.8 GNMA loans eligible for repurchase 988.2 1,446.5 2,351.2 Other assets 112.1 103.9 77.1 Total assets 8,369.7$ 8,670.4$ 5,324.3$ Liabilities and Shareholders' Equity: Warehouse lines of credit 5,057.6$ 4,847.4$ 1,767.5$ Term debt and other borrowings, net 1,166.5 888.4 348.9 Accounts payable and accrued expenses 146.1 196.5 78.2 GNMA loans eligible for repurchase 988.2 1,446.5 2,351.2 Other liabilities 301.8 509.2 145.4 Total liabilities 7,660.3 7,888.1 4,691.2 Shareholders' Equity: Common stock - - - Additional paid in capital 520.5 69.5 517.7 Retained earnings 188.8 712.8 115.4 Total shareholders' equity 709.3 782.3 633.1 Total liabilities and shareholders' equity 8,369.7$ 8,670.4$ 5,324.3$ As of

Volume & Margin Detail by Channel 21 VOLUME DETAIL BY CHANNEL ($mm) 6/30/2021 3/31/2021 6/30/2020 Funded Origination Volume by Channel Wholesale 18,380$ 19,668$ 7,844$ Correspondent 5,695 8,243 3,491 Direct 1,391 1,514 432 Total Funded Origination Volume 25,466$ 29,426$ 11,767$ Fallout Adjusted Lock Volume by Channel Wholesale 15,566$ 16,140$ 8,171$ Correspondent 3,963 6,673 4,694 Direct 836 740 591 Total Fallout Adjusted Lock Volume 20,365$ 23,553$ 13,456$ GAIN ON SALE MARGIN DETAIL BY CHANNEL ($mm) $ Amount Basis Points $ Amount Basis Points $ Amount Basis Points Gain on Sale Margin by Channel Wholesale 114.5$ 74 245.1$ 152 252.5$ 309 Correspondent 9.3 23 22.2 33 50.2 107 Direct 26.3 315 26.8 362 25.9 439 Margin Attributable to Channels 150.1 74 294.0 125 328.6 244 Other Gain (Loss) on Sale1 (32.9) NA 52.7 NA 47.9 NA Gain on Sale Margin2,3 117.2$ 58 346.6$ 147 376.6$ 280 (1) Includes interest income (expense), net, realized and unrealized gains (losses) on locks and mortgage loans held for sale, net hedging results, the provision for the representation and warranty reserve, and differences between modeled and actual pull-through. (2) Gain on sale margin for the quarter ended June 30, 2021 includes approximately $33 million of adjustments largely related to agency pricing and product actions during the quarter. (3) Calculated as gain on sale divided by Fallout Adjusted Lock Volume. Gain on sale includes gain on loans, net, loan fee income, interest income (expense), net, and loan servicing fees (expense) for the Origination segment. For the quarter ended For the quarter ended 6/30/2021 3/31/2021 6/30/2020

Summary Segment Results 22 ($mm) Origination Servicing Segments Total All Other Total Reconciliation Item1 Segments Total Revenue: 1/0/1900 Gain on loans, net 75.0$ -$ 75.0$ 0.0$ 75.0$ -$ 75.0$ Loan fee income 39.5 - 39.5 - 39.5 - 39.5 Loan servicing fees - 85.6 85.6 - 85.6 - 85.6 Change in FV of MSRs, net - (106.9) (106.9) - (106.9) - (106.9) Interest income (loss), net 2.7 0.4 3.1 (12.6) (9.5) - (9.5) Other income - - - 13.8 13.8 (13.2) 0.6 Total Revenue 117.2$ (20.9)$ 96.3$ 1.2$ 97.5$ (13.2)$ 84.3$ $ Contribution margin (20.8)$ (39.6)$ (60.4)$ (40.0)$ (100.4)$ -$ -$ ($mm) Origination Servicing Segments Total All Other Total Reconciliation Item1 Segments Total Revenue: 1/0/1900 Gain on loans, net 301.2$ -$ 301.2$ -$ 301.2$ -$ 301.2$ Loan fee income 44.1 - 44.1 - 44.1 - 44.1 Loan servicing fees - 70.3 70.3 - 70.3 - 70.3 Change in FV of MSRs, net - 12.8 12.8 - 12.8 - 12.8 Interest income (loss), net 1.3 0.3 1.5 (8.9) (7.4) - (7.4) Other income - 0.1 0.1 4.8 5.0 (4.2) 0.8 Total Revenue 346.6$ 83.5$ 430.1$ (4.1)$ 426.1$ (4.2)$ 421.9$ Contribution margin 188.8$ 64.9$ 253.8$ (54.6)$ 199.2$ -$ -$ ($mm) Origination Servicing Segments Total All Other Total Reconciliation Item1 Segments Total Revenue: 1/0/1900 Gain on loans, net 356.9$ -$ 356.9$ -$ 356.9$ -$ 356.9$ Loan fee income 20.4 - 20.4 - 20.4 - 20.4 Loan servicing fees (1.7) 44.0 42.3 - 42.3 - 42.3 Change in FV of MSRs, net - (72.2) (72.2) - (72.2) - (72.2) Interest income (loss), net 1.0 1.3 2.2 (4.8) (2.6) - (2.6) Other income 0.0 0.1 0.1 2.1 2.2 (1.9) 0.3 Total Revenue 376.6$ (27.0)$ 349.7$ (2.7)$ 346.9$ (1.9)$ 345.1$ 6 .9$ Contribution margin 304.0$ (42.4)$ 261.6$ (33.1)$ 228.5$ -$ -$ For the quarter March 31, 2021 For the quarter June 30, 2020 (1) The Company includes the income from its equity method investments in the All Other category. In order to reconcile to Total net revenue on the condensed consolidated statements of operations, it must be removed as is presented above. For the quarter June 30, 2021
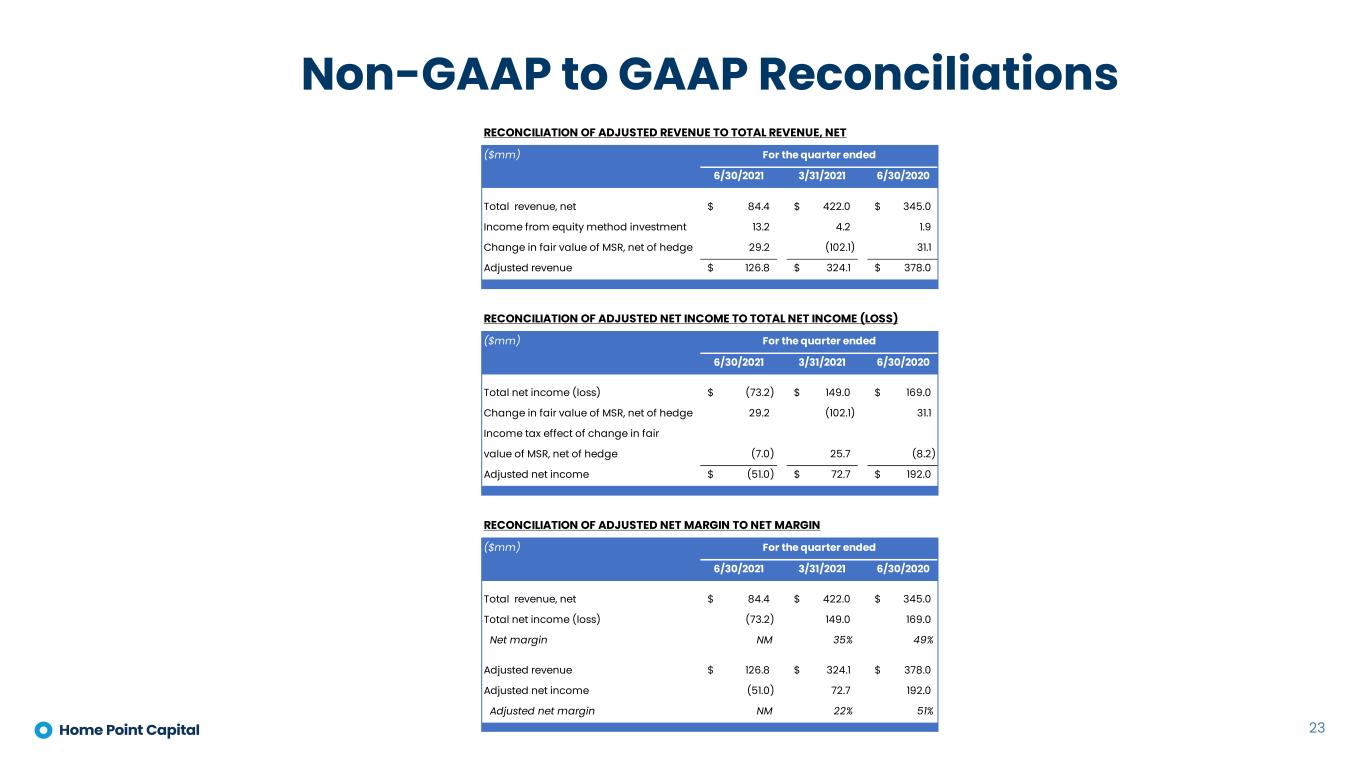
Non-GAAP to GAAP Reconciliations 23 RECONCILIATION OF ADJUSTED REVENUE TO TOTAL REVENUE, NET ($mm) 6/30/2021 3/31/2021 6/30/2020 Total revenue, net 84.4$ 422.0$ 345.0$ Income from equity method investment 13.2 4.2 1.9 Change in fair value of MSR, net of hedge 29.2 (102.1) 31.1 Adjusted revenue 126.8$ 324.1$ 378.0$ RECONCILIATION OF ADJUSTED NET INCOME TO TOTAL NET INCOME (LOSS) ($mm) 6/30/2021 3/31/2021 6/30/2020 Total net income (loss) (73.2)$ 149.0$ 169.0$ Change in fair value of MSR, net of hedge 29.2 (102.1) 31.1 Income tax effect of change in fair value of MSR, net of hedge (7.0) 25.7 (8.2) Adjusted net income (51.0)$ 72.7$ 192.0$ RECONCILIATION OF ADJUSTED NET MARGIN TO NET MARGIN ($mm) 6/30/2021 3/31/2021 6/30/2020 Total revenue, net 84.4$ 422.0$ 345.0$ Total net income (loss) (73.2) 149.0 169.0 Net margin NM 35% 49% Adjusted revenue 126.8$ 324.1$ 378.0$ Adjusted net income (51.0) 72.7 192.0 Adjusted net margin NM 22% 51% For the quarter ended For the quarter ended For the quarter ended
To provide investors with information in addition to our results as determined under Generally Accepted Accounting Principles (“GAAP”), we disclose Adjusted revenue, Adjusted net Income, and Adjusted net margin as “non-GAAP measures,” which management believes provide useful information to investors. These measures are not financial measures calculated in accordance with GAAP and should not be considered as a substitute for revenue, net income, or any other operating performance measure calculated in accordance with GAAP, and may not be comparable to a similarly titled measure reported by other companies. We define Adjusted revenue as Total net revenue exclusive of the impact of the change in fair value of MSRs related to changes in valuation inputs and assumptions, net of MSRs hedge and adjusted for Income from equity method investment. We define Adjusted net income as Net income (loss) exclusive of the impact of the change in fair value of MSRs related to changes in valuation inputs and assumptions, net of MSRs hedge. We exclude changes in fair value of MSRs, net of hedge from each of Adjusted revenue and Adjusted net income (loss) as they add volatility and are not indicative of the Company’s operating performance or results of operation. This adjustment does not include changes in fair value of MSRs due to realization of cash flows, which remain in each of Adjusted revenue and Adjusted net income (loss). Realization of cash flows occurs when cash is collected as customers make scheduled payments, partial prepayments of principal, or pay their mortgage in full. We define Adjusted net margin by dividing Adjusted net income by Adjusted revenue. We believe that the presentation of Adjusted revenue, Adjusted net Income, and Adjusted net margin provides useful information to investors regarding our results of operations because each measure assists both investors and management in analyzing and benchmarking the performance and value of our business. Adjusted revenue, Adjusted net Income, and Adjusted net margin provide indicators of performance that are not affected by fluctuations in certain costs or other items. Accordingly, management believes that these measurements are useful for comparing general operating performance from period to period, and management relies on these measures for planning and forecasting of future periods. The Company measures the performance of the segments primarily on a contribution margin basis. Additionally, these measures allow management to compare our results with those of other companies that have different financing and capital structures. However, these measures are not financial measures calculated in accordance with GAAP and should not be considered as a substitute for net income, or any other operating performance measure calculated in accordance with GAAP and may not be comparable to a similarly titled measure reported by other companies. 24 Non-GAAP Financial Measures

Photo courtesy of Nasdaq Inc.


