FY 2021 Earnings March 28, 2022 Exhibit 99.2
2 Disclaimers Cautionary Note Regarding Forward-Looking Statements Certain statements in this presentation may be considered “forward-looking statements” within the meaning of Section 27A of the Securities Act of 1933 and Section 21E of the Securities Exchange Act of 1934. Forward- looking statements generally relate to future events or the Company’s future financial or operating performance and may be identified by words such as “may,” “should,” “expect,” “intend,” “will,” “estimate,” “anticipate,” “believe,” “predict,” or similar words. These forward-looking statements are based upon assumptions made by the Company as of the date hereof and are subject to risks, uncertainties, and other factors that could cause actual results to differ materially from those expressed or implied by such forward-looking statements. These forward-looking statements include, among other things, statements regarding: the Company’s currently expected guidance regarding its full year 2022 consolidated revenues, revenues for its proprietary soy portfolio, incremental revenues from legacy activity at the Creston facility, segment revenues, gross profit, gross margins, contribution margin, net loss and adjusted EBITDA, and cash usage; the anticipated benefits of the PIPE transaction and the capital raised thereby to the Company and its stockholders; financial or other information based upon or otherwise incorporating judgments or estimates relating to future performance, events or expectations; the Company’s strategies and plans for growth; the Company’s, positioning, resources, capabilities, and expectations for future performance; estimates and forecasts of financial and other performance metrics; projections of market opportunity; and the Company’s outlook and financial and other guidance. Such forward-looking statements are based upon assumptions made by Benson Hill as of the date hereof and are subject to risks, uncertainties, and other factors that could cause actual results to differ materially from those expressed or implied by such forward-looking statements. Factors that may cause actual results to differ materially from current expectations include, but are not limited to, the Company’s ability to achieve anticipated benefits of recent business combinations, which may be affected by, among other things, competition, the ability of the combined company to grow and achieve growth profitably, maintain relationships with customers and suppliers, and retain its management and key employees; the ability to deploy capital raised in the PIPE transaction in a manner that furthers Benson Hill’s growth strategy, as well as the general ability to execute the Company’s business plans; the transition to becoming a public company; and other risks and uncertainties set forth in the sections entitled “Risk Factors” and “Cautionary Note Regarding Forward-Looking Statements” in the Company’s filings with the Securities and Exchange Commission (“SEC”), which are available on the SEC’s website at www.sec.gov. Forward-looking statements are also subject to the risks and other issues described below under “Use of Non-GAAP Financial Measures,” which could cause actual results to differ materially from current expectations included in the Company’s forward-looking statements included in this presentation. Nothing in this presentation should be regarded as a representation by any person that the forward-looking statements set forth herein will be achieved or that any of the contemplated results of such forward looking statements will be achieved. There may be additional risks about which the Company is presently unaware or that the Company currently believes are immaterial that could also cause actual results to differ from those contained in the forward-looking statements. The reader should not place undue reliance on forward-looking statements, which speak only as of the date they are made. Benson Hill expressly disclaims any duty to update these forward-looking statements, except as otherwise required by law. Use of Non-GAAP Financial Measures In this presentation, the Company includes non-GAAP performance measures. The Company uses these non-GAAP financial measures to facilitate management's financial and operational decision-making, including evaluation of the Company’s historical operating results. The Company’s management believes these non-GAAP measures are useful in evaluating the Company’s operating performance and are similar measures reported by publicly listed U.S. competitors, and regularly used by securities analysts, institutional investors, and other interested parties in analyzing operating performance and prospects. These non-GAAP financial measures reflect an additional way of viewing aspects of the Company's operations that, when viewed with GAAP results and the reconciliations to corresponding GAAP financial measures, may provide a more complete understanding of factors and trends affecting the Company’s business. By providing these non-GAAP measures, the Company’s management intends to provide investors with a meaningful, consistent comparison of the Company’s performance for the periods presented. These non-GAAP financial measures should be considered supplemental to, and not a substitute for, financial information prepared in accordance with GAAP. The Company's definition of these non- GAAP measures may differ from similarly titled measures of performance used by other companies in other industries or within the same industry. Because non-GAAP financial measures exclude the effect of items that will increase or decrease the Company's reported results of operations, management strongly encourages investors to review the Company's consolidated financial statements and publicly filed reports in their entirety. A reconciliation of the non-GAAP financial measure to the most directly comparable GAAP financial measure is included in this presentation and in the tables accompanying this presentation.
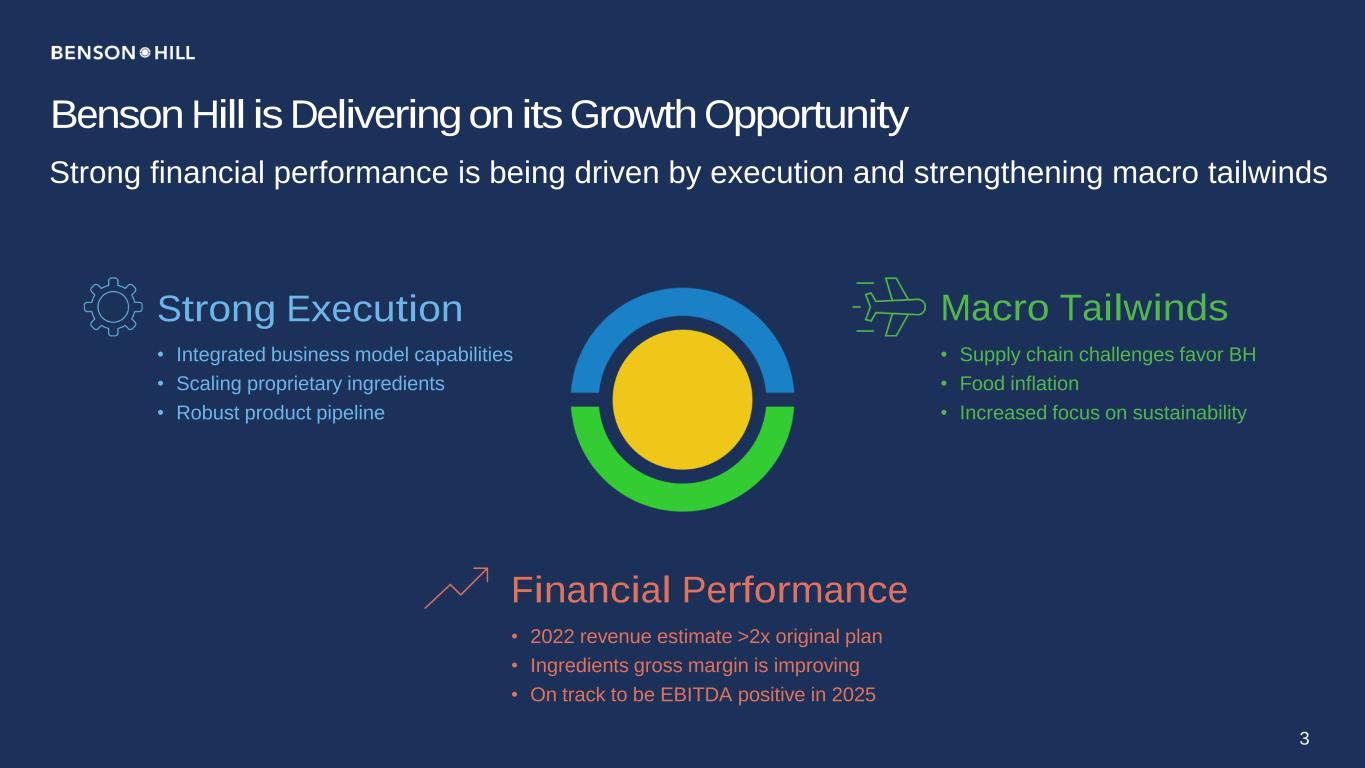
Benson Hill is Delivering on its Growth Opportunity Strong financial performance is being driven by execution and strengthening macro tailwinds • Integrated business model capabilities • Scaling proprietary ingredients • Robust product pipeline Strong Execution • Supply chain challenges favor BH • Food inflation • Increased focus on sustainability Macro Tailwinds • 2022 revenue estimate >2x original plan • Ingredients gross margin is improving • On track to be EBITDA positive in 2025 Financial Performance 3
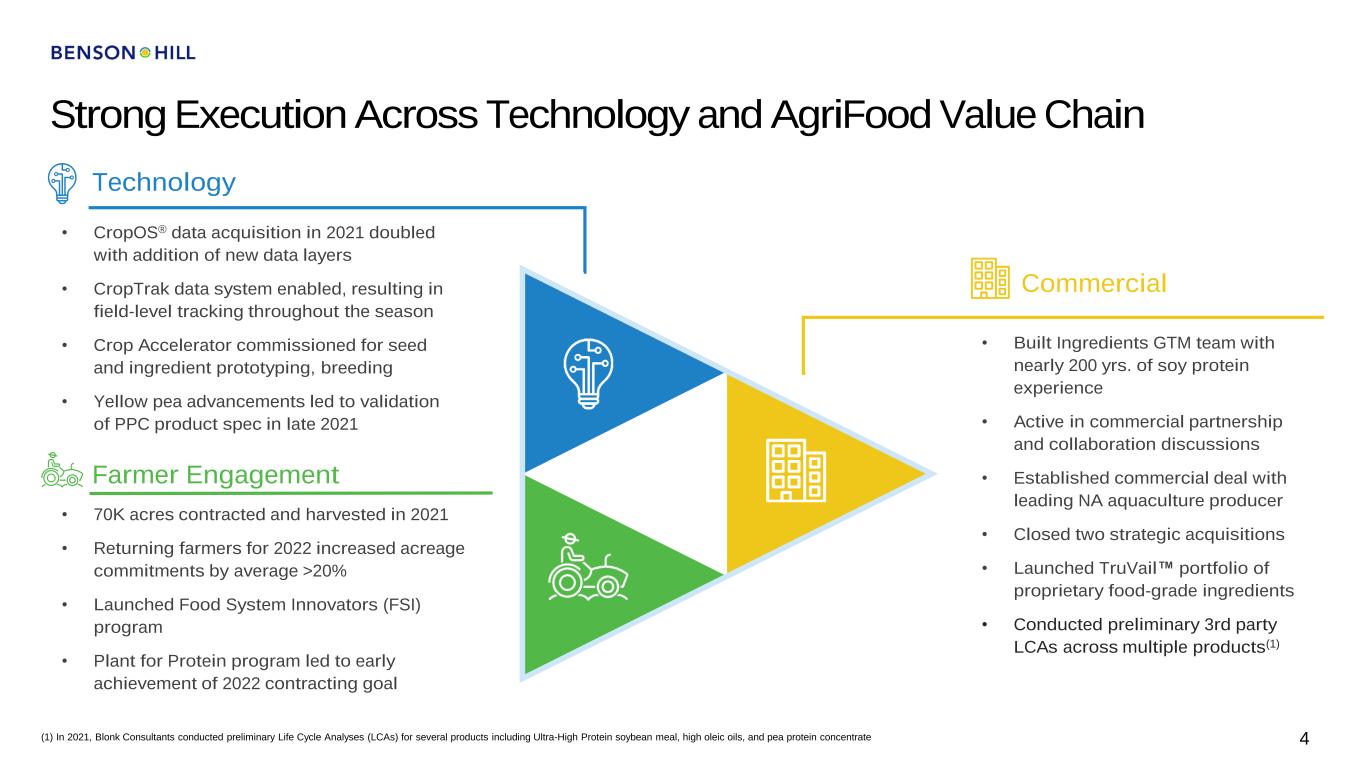
Strong Execution Across Technology and AgriFood Value Chain • CropOS® data acquisition in 2021 doubled with addition of new data layers • CropTrak data system enabled, resulting in field-level tracking throughout the season • Crop Accelerator commissioned for seed and ingredient prototyping, breeding • Yellow pea advancements led to validation of PPC product spec in late 2021 Technology • 70K acres contracted and harvested in 2021 • Returning farmers for 2022 increased acreage commitments by average >20% • Launched Food System Innovators (FSI) program • Plant for Protein program led to early achievement of 2022 contracting goal Farmer Engagement • Built Ingredients GTM team with nearly 200 yrs. of soy protein experience • Active in commercial partnership and collaboration discussions • Established commercial deal with leading NA aquaculture producer • Closed two strategic acquisitions • Launched TruVail™ portfolio of proprietary food-grade ingredients • Conducted preliminary 3rd party LCAs across multiple products(1) Commercial 4(1) In 2021, Blonk Consultants conducted preliminary Life Cycle Analyses (LCAs) for several products including Ultra-High Protein soybean meal, high oleic oils, and pea protein concentrate
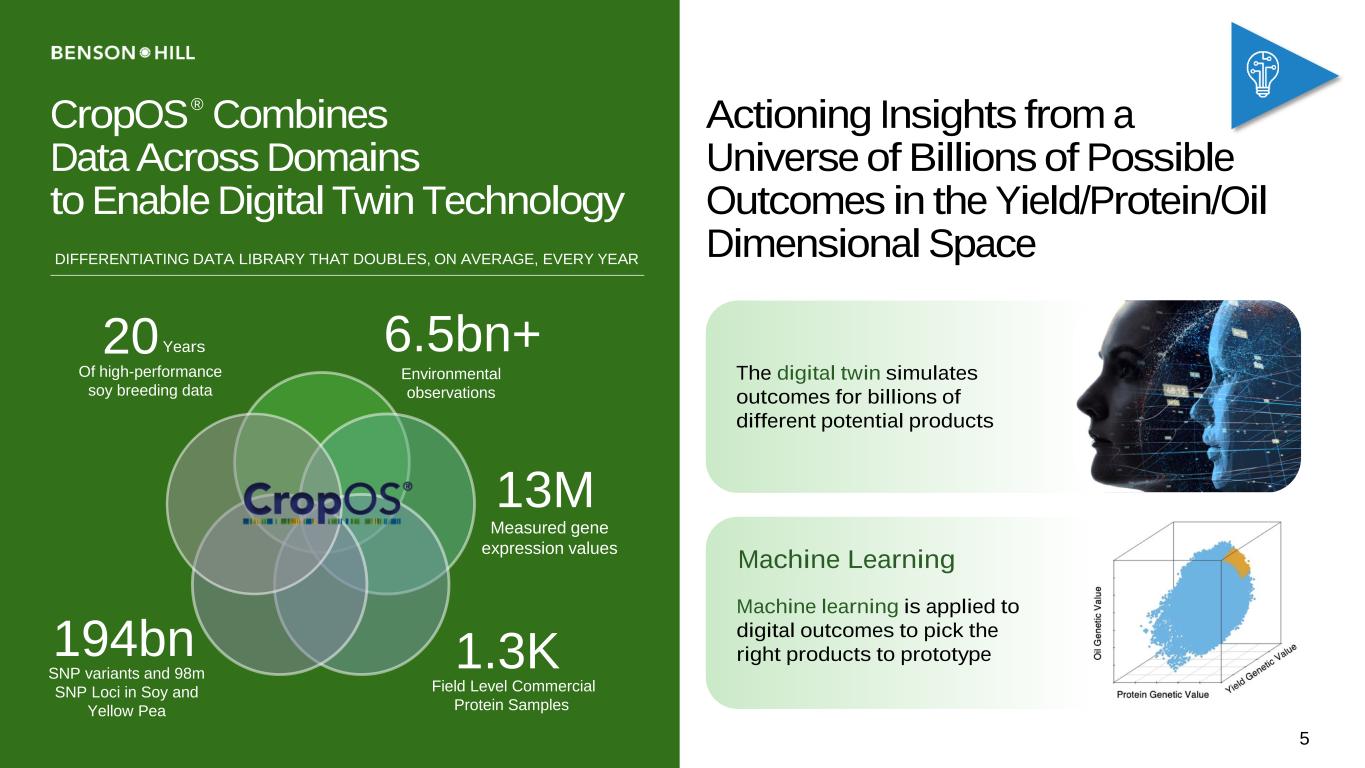
DIFFERENTIATING DATA LIBRARY THAT DOUBLES, ON AVERAGE, EVERY YEAR 20 Of high-performance soy breeding data Years 6.5bn+ Environmental observations 1.3K Field Level Commercial Protein Samples 194bn SNP variants and 98m SNP Loci in Soy and Yellow Pea 13M Measured gene expression values 5 Actioning Insights from a Universe of Billions of Possible Outcomes in the Yield/Protein/Oil Dimensional Space Machine learning is applied to digital outcomes to pick the right products to prototype Machine Learning The digital twin simulates outcomes for billions of different potential products CropOS® Combines Data Across Domains to Enable Digital Twin Technology

6 Production Fields 268 Production Sites >170K Cumulative commercial acres 1.3K Commercial protein samples >80% of 70,000 commercial acres with extensive data collection using CropTrak for items such as protein, yield, and oil Robust Production Footprint Agronomic Recommendations for Yield and Protein On-Farm Production Data High Protein, High Yield Potential Genetics SEYMOUR CRESTON
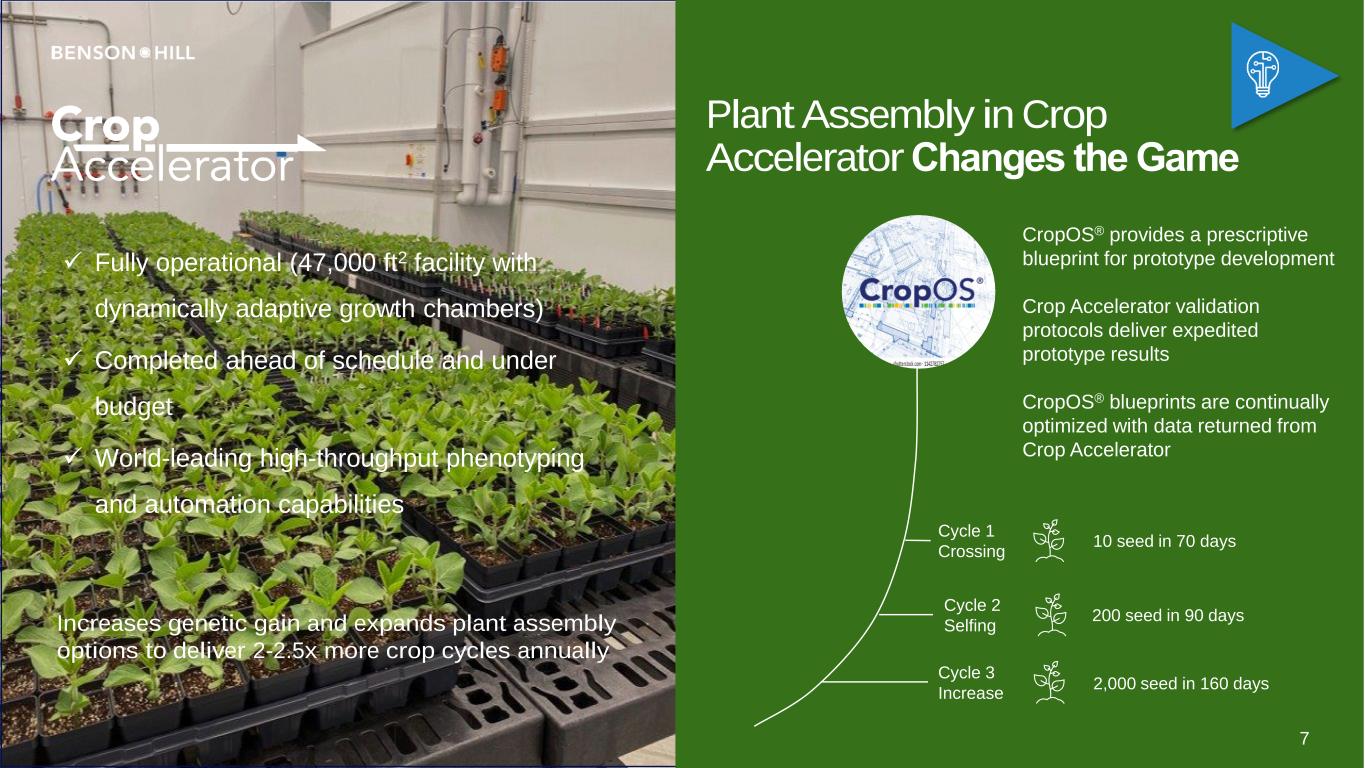
✓ Fully operational (47,000 ft2 facility with dynamically adaptive growth chambers) ✓ Completed ahead of schedule and under budget ✓ World-leading high-throughput phenotyping and automation capabilities Increases genetic gain and expands plant assembly options to deliver 2-2.5x more crop cycles annually Cycle 3 Increase Cycle 2 Selfing Cycle 1 Crossing 10 seed in 70 days 200 seed in 90 days 2,000 seed in 160 days CropOS® provides a prescriptive blueprint for prototype development Crop Accelerator validation protocols deliver expedited prototype results CropOS® blueprints are continually optimized with data returned from Crop Accelerator 7 Plant Assembly in Crop Accelerator Changes the Game

8 Validated PPC from Pre- Commercial Lines in Breeding Benson Hill advantage • Lower costs through high protein productivity • Reduce or eliminate capital intensive processing • Improved sustainability benefits • Validated pea protein concentrate in the range of 61% to 65% without concentrate processing step(1) − Target first plantings of proprietary varieties in 2024 and begin commercialization in 2025 Yellow Pea is the Fastest Growing Protein Source for Plant-Based Meats(2) (1) Internal Benson Hill analysis (2) Context Network analysis and estimates. (3) Projected. Pea Protein Concentrate (PPC) Pea Protein Isolate(PPI) Benson Hill Pea Protein Concentrate Protein Content ~50-52% ~85% ~61-65%(3) Affordability ✓✓✓ ✓ ✓✓✓ Sustainability ✓✓✓ ✓✓✓ Flavor ✓ ✓✓✓ ✓✓✓ Market Fit for Plant-Based Meats ✓✓✓ ✓✓✓ Commodity Genetics Benson Hill Genetics ✓ PPI Replacement S e e d P ro te in ( % ) 40% 23% Our Program Today Pre-harvest Results Yellow Pea High Protein Ingredient Eliminates Costly, and Water and Energy Intensive Processing
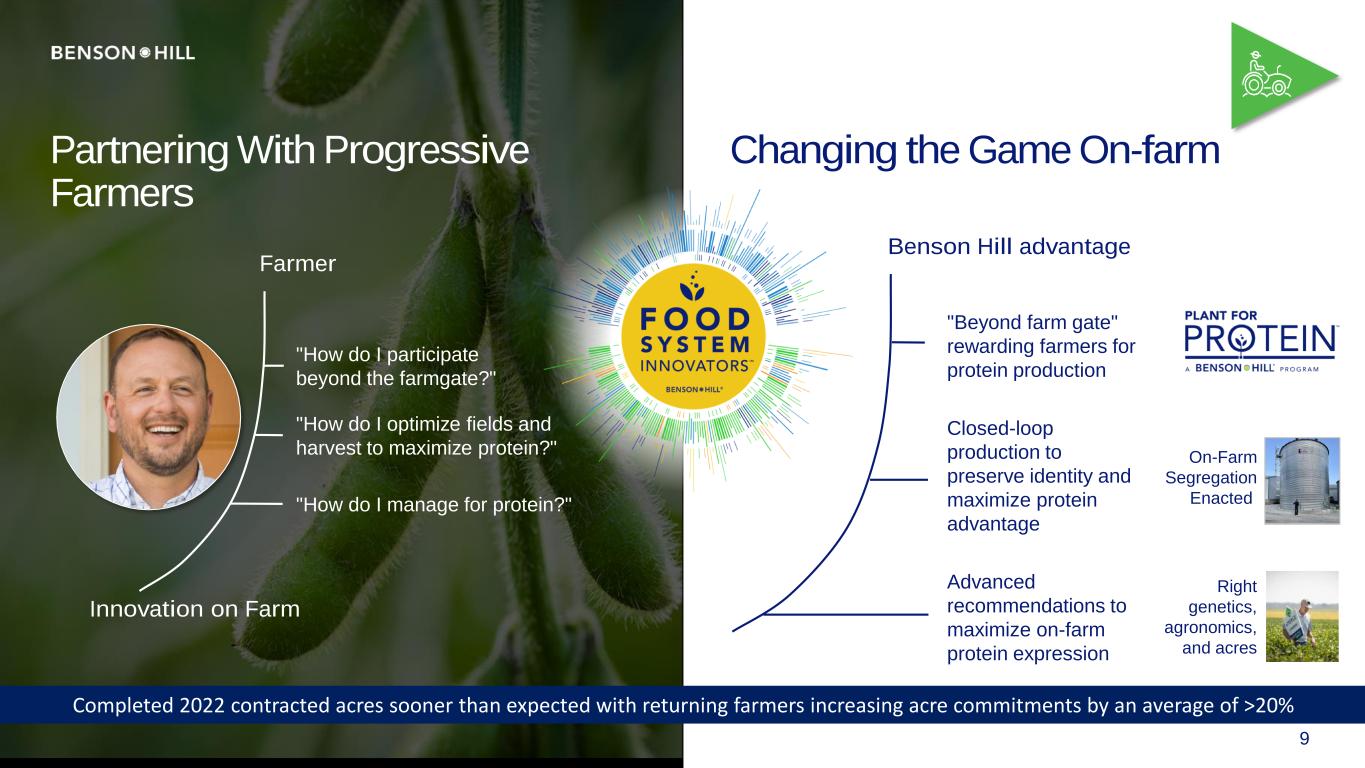
Innovation on Farm Farmer "How do I manage for protein?" "How do I optimize fields and harvest to maximize protein?" "How do I participate beyond the farmgate?" On-Farm Segregation Enacted "Beyond farm gate" rewarding farmers for protein production Closed-loop production to preserve identity and maximize protein advantage Advanced recommendations to maximize on-farm protein expression Right genetics, agronomics, and acres Benson Hill advantage 9 Partnering With Progressive Farmers Changing the Game On-farm Completed 2022 contracted acres sooner than expected with returning farmers increasing acre commitments by an average of >20%
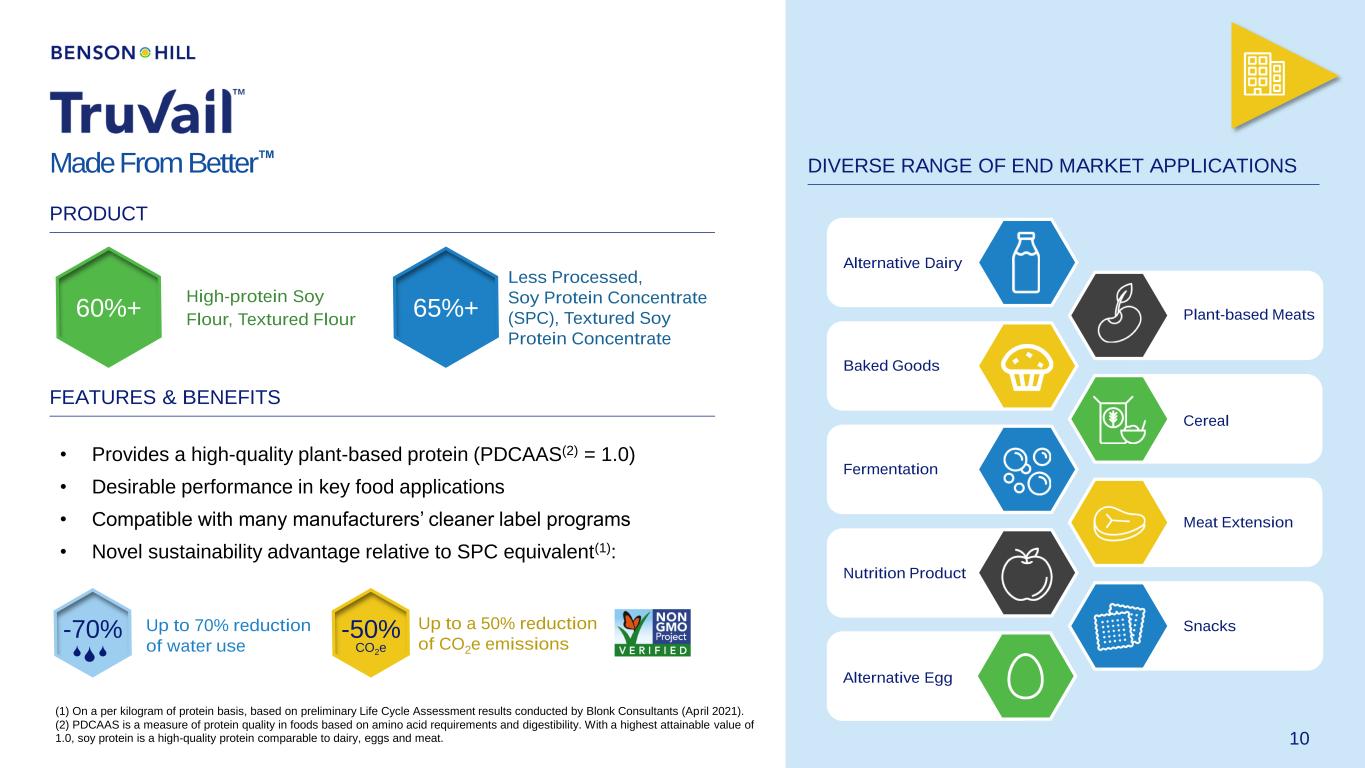
Made From Better™ PRODUCT FEATURES & BENEFITS High-protein Soy Flour, Textured Flour Less Processed, Soy Protein Concentrate (SPC), Textured Soy Protein Concentrate 60%+ 65%+ • Provides a high-quality plant-based protein (PDCAAS(2) = 1.0) • Desirable performance in key food applications • Compatible with many manufacturers’ cleaner label programs • Novel sustainability advantage relative to SPC equivalent(1): -50% CO2e -70% Up to 70% reduction of water use Up to a 50% reduction of CO2e emissions DIVERSE RANGE OF END MARKET APPLICATIONS 10 Alternative Dairy Plant-based Meats Baked Goods Cereal Fermentation Meat Extension Nutrition Product Snacks Alternative Egg (1) On a per kilogram of protein basis, based on preliminary Life Cycle Assessment results conducted by Blonk Consultants (April 2021). (2) PDCAAS is a measure of protein quality in foods based on amino acid requirements and digestibility. With a highest attainable value of 1.0, soy protein is a high-quality protein comparable to dairy, eggs and meat.
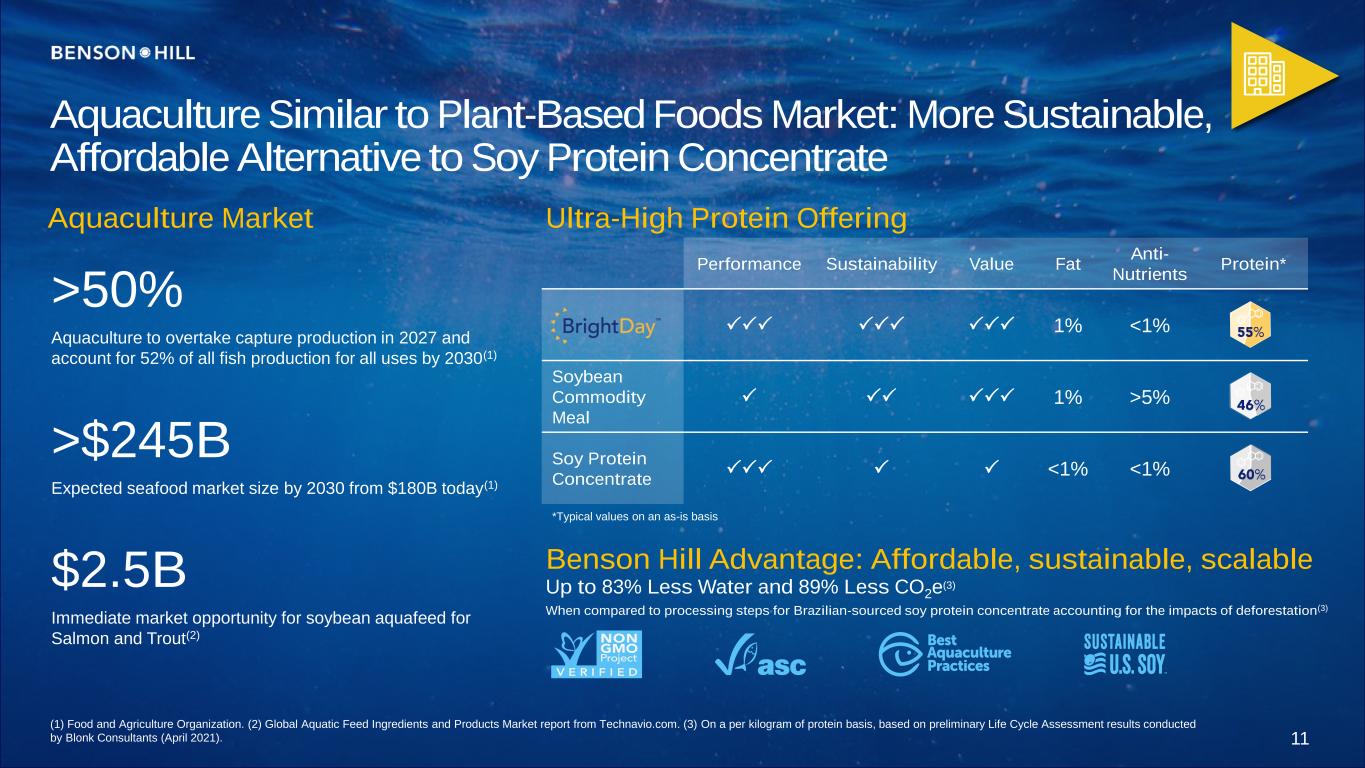
Performance Sustainability Value Fat Anti- Nutrients Protein* 1% <1% Soybean Commodity Meal 1% >5% Soy Protein Concentrate <1% <1% *Typical values on an as-is basis >50% Aquaculture to overtake capture production in 2027 and account for 52% of all fish production for all uses by 2030(1) >$245B Expected seafood market size by 2030 from $180B today(1) Aquaculture Market Ultra-High Protein Offering Up to 83% Less Water and 89% Less CO2e (3) When compared to processing steps for Brazilian-sourced soy protein concentrate accounting for the impacts of deforestation(3) Benson Hill Advantage: Affordable, sustainable, scalable$2.5B Immediate market opportunity for soybean aquafeed for Salmon and Trout(2) 11 Aquaculture Similar to Plant-Based Foods Market: More Sustainable, Affordable Alternative to Soy Protein Concentrate (1) Food and Agriculture Organization. (2) Global Aquatic Feed Ingredients and Products Market report from Technavio.com. (3) On a per kilogram of protein basis, based on preliminary Life Cycle Assessment results conducted by Blonk Consultants (April 2021).
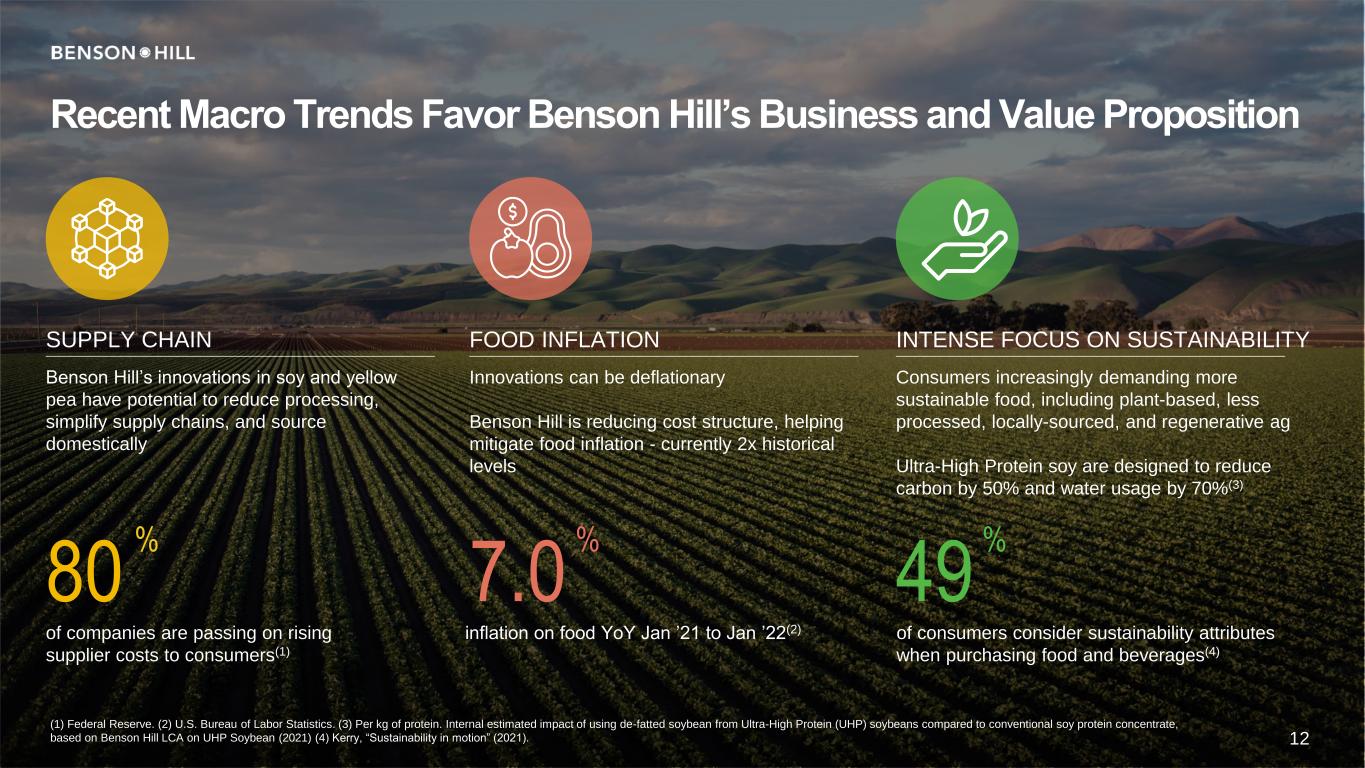
SUPPLY CHAIN FOOD INFLATION INTENSE FOCUS ON SUSTAINABILITY 80 of companies are passing on rising supplier costs to consumers(1) Innovations can be deflationary Benson Hill is reducing cost structure, helping mitigate food inflation - currently 2x historical levels 7.0 inflation on food YoY Jan ’21 to Jan ’22(2) % Recent Macro Trends Favor Benson Hill’s Business and Value Proposition (1) Federal Reserve. (2) U.S. Bureau of Labor Statistics. (3) Per kg of protein. Internal estimated impact of using de-fatted soybean from Ultra-High Protein (UHP) soybeans compared to conventional soy protein concentrate, based on Benson Hill LCA on UHP Soybean (2021) (4) Kerry, “Sustainability in motion” (2021). 49 of consumers consider sustainability attributes when purchasing food and beverages(4) % Benson Hill’s innovations in soy and yellow pea have potential to reduce processing, simplify supply chains, and source domestically Consumers increasingly demanding more sustainable food, including plant-based, less processed, locally-sourced, and regenerative ag Ultra-High Protein soy are designed to reduce carbon by 50% and water usage by 70%(3) % 12
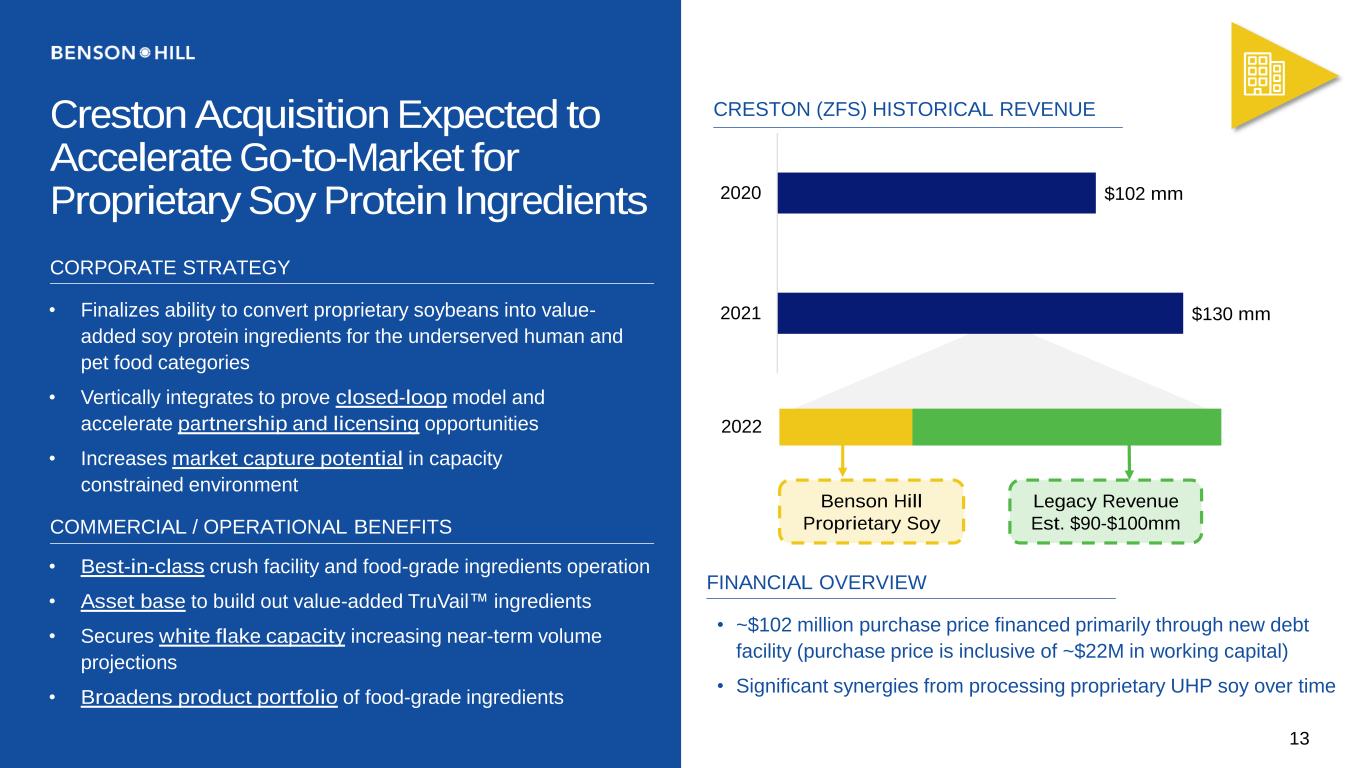
Creston Acquisition Expected to Accelerate Go-to-Market for Proprietary Soy Protein Ingredients $130 mm $102 mm 2021 2020 Benson Hill Proprietary Soy Legacy Revenue Est. $90-$100mm 2022 CRESTON (ZFS) HISTORICAL REVENUE CORPORATE STRATEGY • Finalizes ability to convert proprietary soybeans into value- added soy protein ingredients for the underserved human and pet food categories • Vertically integrates to prove closed-loop model and accelerate partnership and licensing opportunities • Increases market capture potential in capacity constrained environment COMMERCIAL / OPERATIONAL BENEFITS • Best-in-class crush facility and food-grade ingredients operation • Asset base to build out value-added TruVail™ ingredients • Secures white flake capacity increasing near-term volume projections • Broadens product portfolio of food-grade ingredients FINANCIAL OVERVIEW • ~$102 million purchase price financed primarily through new debt facility (purchase price is inclusive of ~$22M in working capital) • Significant synergies from processing proprietary UHP soy over time 13
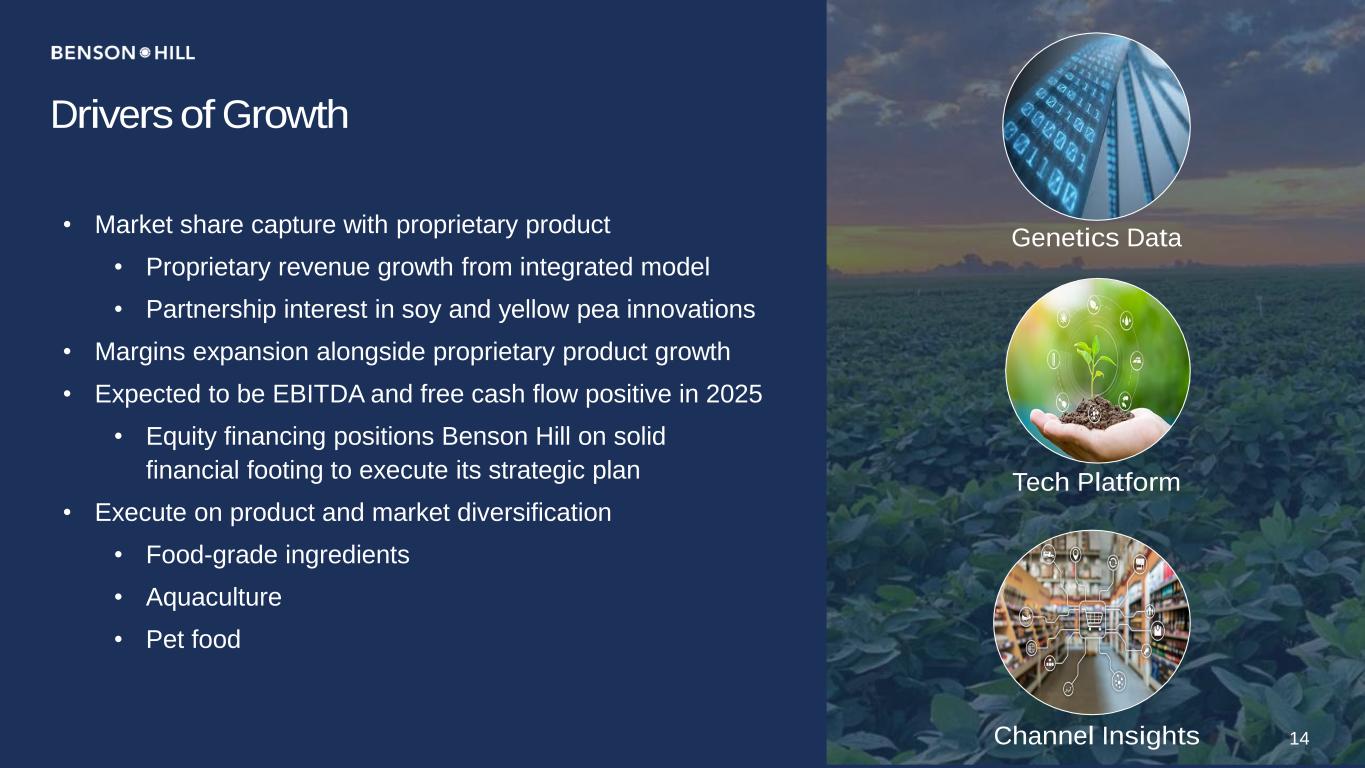
Drivers of Growth • Market share capture with proprietary product • Proprietary revenue growth from integrated model • Partnership interest in soy and yellow pea innovations • Margins expansion alongside proprietary product growth • Expected to be EBITDA and free cash flow positive in 2025 • Equity financing positions Benson Hill on solid financial footing to execute its strategic plan • Execute on product and market diversification • Food-grade ingredients • Aquaculture • Pet food Genetics Data Tech Platform Channel Insights 14
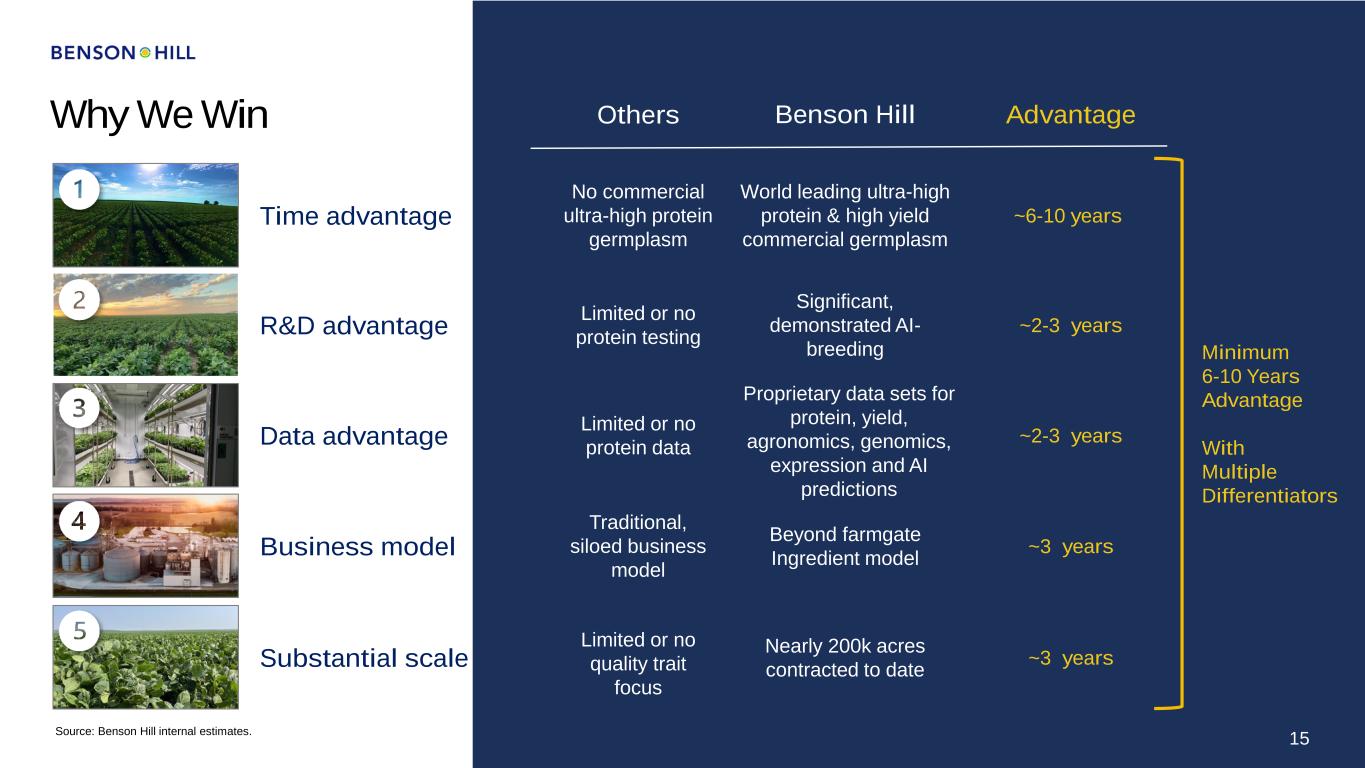
Why We Win 15 Others Benson Hill Advantage Substantial scale ~3 years Nearly 200k acres contracted to date Limited or no quality trait focus Minimum 6-10 Years Advantage With Multiple Differentiators Data advantage ~2-3 years Proprietary data sets for protein, yield, agronomics, genomics, expression and AI predictions Limited or no protein data Business model ~3 years Traditional, siloed business model Beyond farmgate Ingredient model Significant, demonstrated AI- breeding ~2-3 years R&D advantage Limited or no protein testing Time advantage World leading ultra-high protein & high yield commercial germplasm No commercial ultra-high protein germplasm ~6-10 years 15 Source: Benson Hill internal estimates.
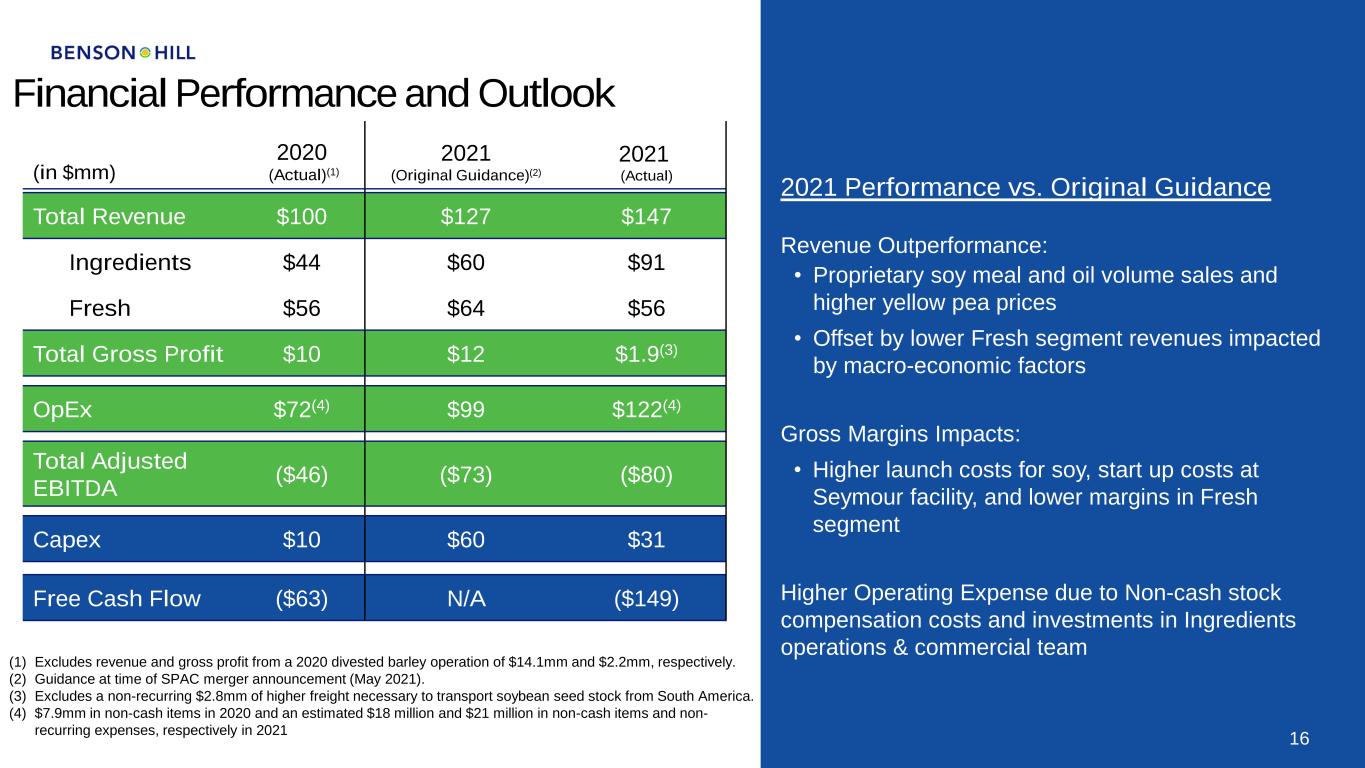
Financial Performance and Outlook (in $mm) 2020 (Actual)(1) 2021 (Original Guidance)(2) 2021 (Actual) Total Revenue $100 $127 $147 Ingredients $44 $60 $91 Fresh $56 $64 $56 Total Gross Profit $10 $12 $1.9(3) OpEx $72(4) $99 $122(4) Total Adjusted EBITDA ($46) ($73) ($80) Capex $10 $60 $31 Free Cash Flow ($63) N/A ($149) 16 2021 Performance vs. Original Guidance Revenue Outperformance: • Proprietary soy meal and oil volume sales and higher yellow pea prices • Offset by lower Fresh segment revenues impacted by macro-economic factors Gross Margins Impacts: • Higher launch costs for soy, start up costs at Seymour facility, and lower margins in Fresh segment Higher Operating Expense due to Non-cash stock compensation costs and investments in Ingredients operations & commercial team (1) Excludes revenue and gross profit from a 2020 divested barley operation of $14.1mm and $2.2mm, respectively. (2) Guidance at time of SPAC merger announcement (May 2021). (3) Excludes a non-recurring $2.8mm of higher freight necessary to transport soybean seed stock from South America. (4) $7.9mm in non-cash items in 2020 and an estimated $18 million and $21 million in non-cash items and non- recurring expenses, respectively in 2021
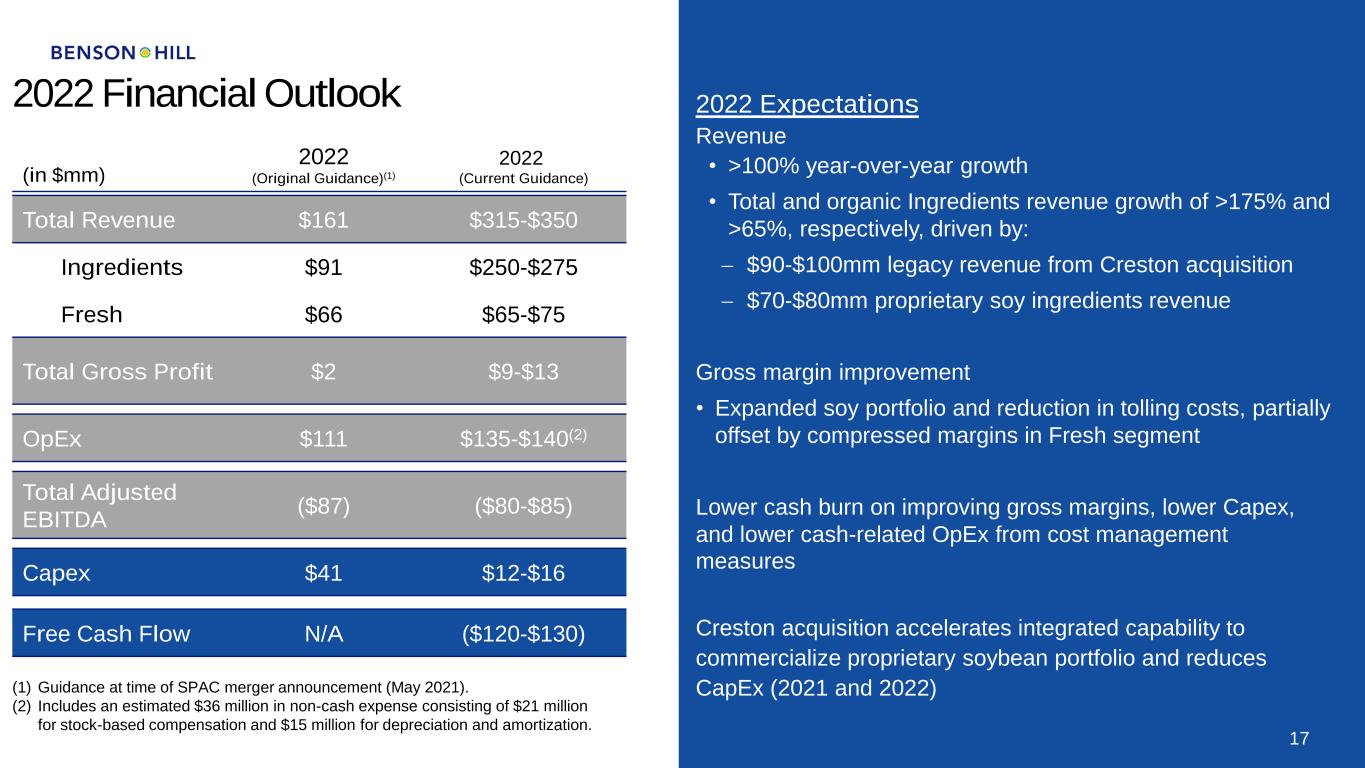
2022 Financial Outlook (in $mm) 2022 (Original Guidance)(1) 2022 (Current Guidance) Total Revenue $161 $315-$350 Ingredients $91 $250-$275 Fresh $66 $65-$75 Total Gross Profit $2 $9-$13 OpEx $111 $135-$140(2) Total Adjusted EBITDA ($87) ($80-$85) Capex $41 $12-$16 Free Cash Flow N/A ($120-$130) 17 2022 Expectations Revenue • >100% year-over-year growth • Total and organic Ingredients revenue growth of >175% and >65%, respectively, driven by: − $90-$100mm legacy revenue from Creston acquisition − $70-$80mm proprietary soy ingredients revenue Gross margin improvement • Expanded soy portfolio and reduction in tolling costs, partially offset by compressed margins in Fresh segment Lower cash burn on improving gross margins, lower Capex, and lower cash-related OpEx from cost management measures Creston acquisition accelerates integrated capability to commercialize proprietary soybean portfolio and reduces CapEx (2021 and 2022)(1) Guidance at time of SPAC merger announcement (May 2021). (2) Includes an estimated $36 million in non-cash expense consisting of $21 million for stock-based compensation and $15 million for depreciation and amortization.
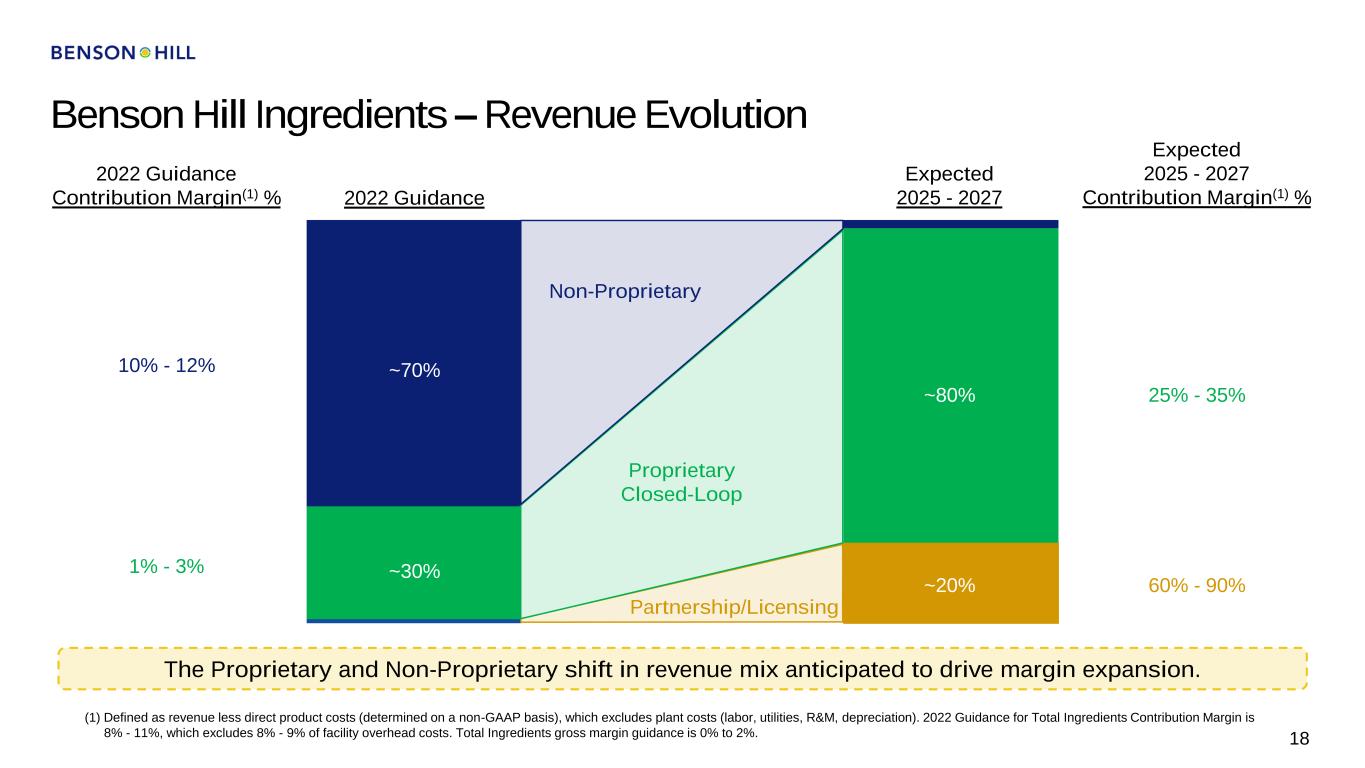
Benson Hill Ingredients – Revenue Evolution 18 (1) Defined as revenue less direct product costs (determined on a non-GAAP basis), which excludes plant costs (labor, utilities, R&M, depreciation). 2022 Guidance for Total Ingredients Contribution Margin is 8% - 11%, which excludes 8% - 9% of facility overhead costs. Total Ingredients gross margin guidance is 0% to 2%. 2022 Guidance Contribution Margin(1) % 1% - 3% 10% - 12% 2022 Guidance Expected 2025 - 2027 Expected 2025 - 2027 Contribution Margin(1) % 25% - 35% 60% - 90% The Proprietary and Non-Proprietary shift in revenue mix anticipated to drive margin expansion. Proprietary Closed-Loop Partnership/Licensing Non-Proprietary ~70% ~30% ~80% ~20%
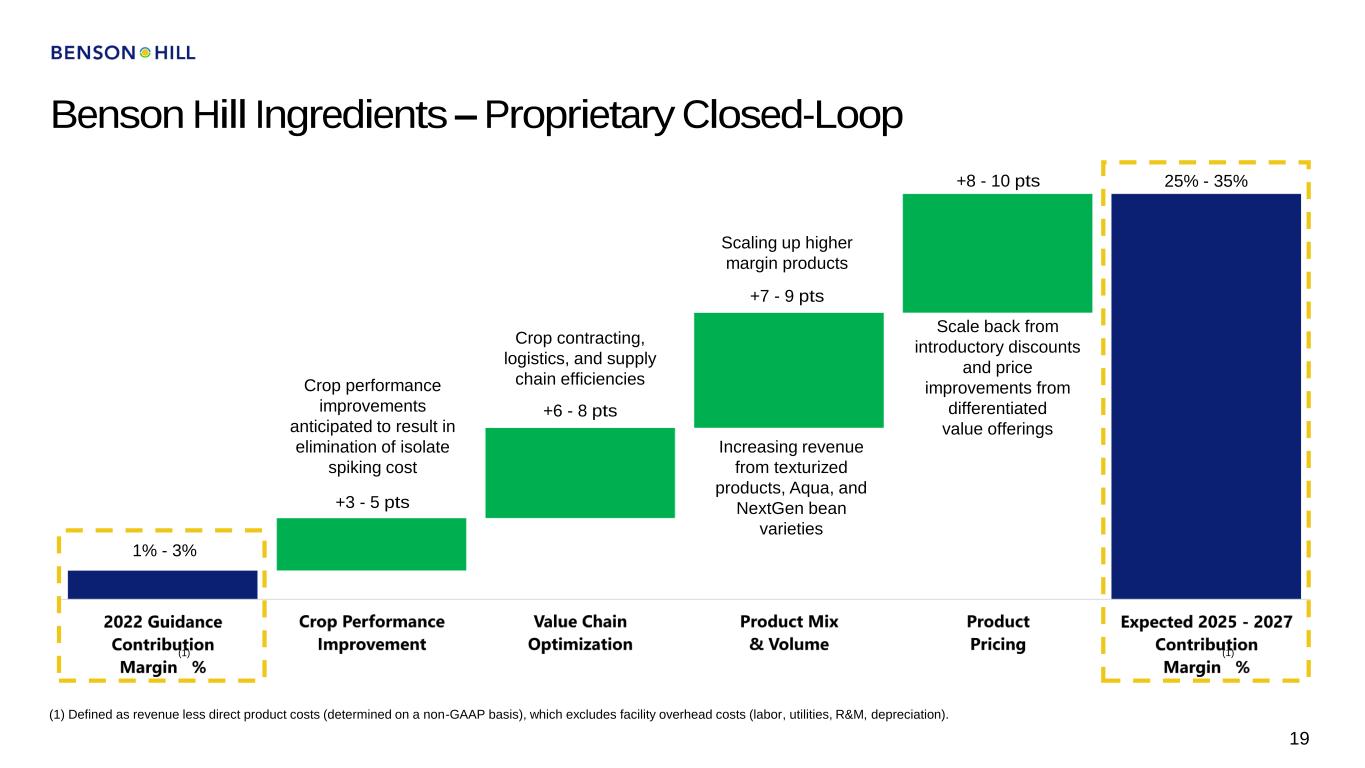
Benson Hill Ingredients – Proprietary Closed-Loop 19 (1) Defined as revenue less direct product costs (determined on a non-GAAP basis), which excludes facility overhead costs (labor, utilities, R&M, depreciation). Crop performance improvements anticipated to result in elimination of isolate spiking cost Crop contracting, logistics, and supply chain efficiencies 1% - 3% +3 - 5 pts +6 - 8 pts +7 - 9 pts +8 - 10 pts 25% - 35% Scaling up higher margin products Scale back from introductory discounts and price improvements from differentiated value offerings Increasing revenue from texturized products, Aqua, and NextGen bean varieties (1)(1)
Appendix
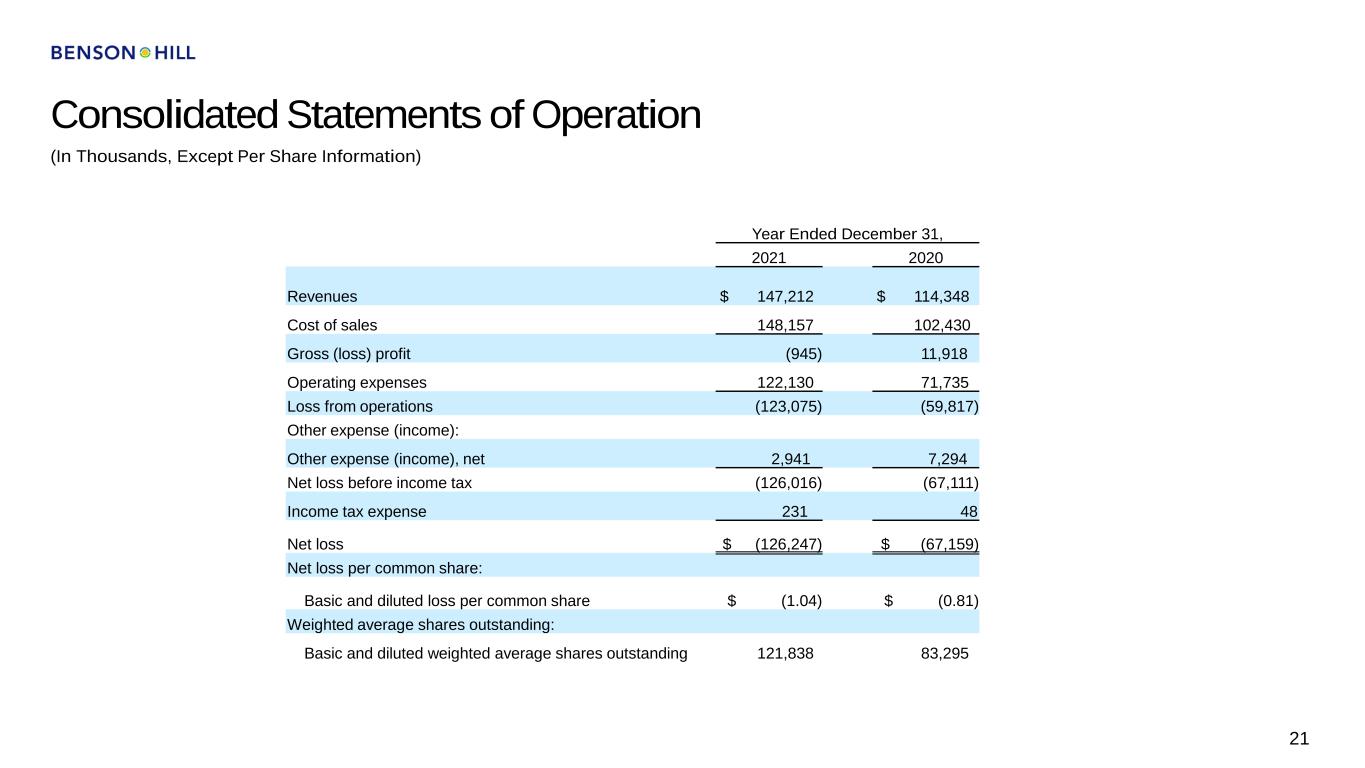
Consolidated Statements of Operation 21 (In Thousands, Except Per Share Information) Year Ended December 31, 2021 2020 Revenues $ 147,212 $ 114,348 Cost of sales 148,157 102,430 Gross (loss) profit (945) 11,918 Operating expenses 122,130 71,735 Loss from operations (123,075) (59,817) Other expense (income): Other expense (income), net 2,941 7,294 Net loss before income tax (126,016) (67,111) Income tax expense 231 48 Net loss $ (126,247) $ (67,159) Net loss per common share: Basic and diluted loss per common share $ (1.04) $ (0.81) Weighted average shares outstanding: Basic and diluted weighted average shares outstanding 121,838 83,295
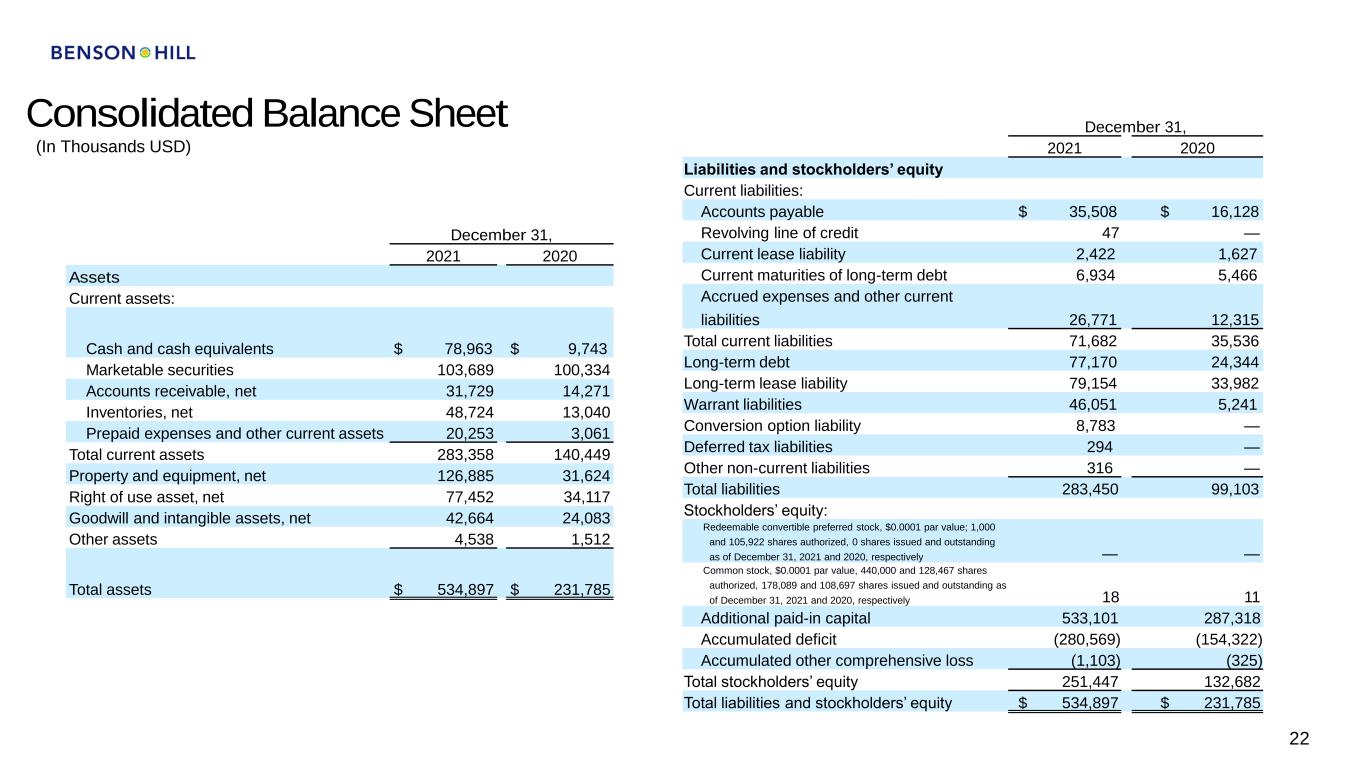
Consolidated Balance Sheet 22 (In Thousands USD) December 31, 2021 2020 Assets Current assets: Cash and cash equivalents $ 78,963 $ 9,743 Marketable securities 103,689 100,334 Accounts receivable, net 31,729 14,271 Inventories, net 48,724 13,040 Prepaid expenses and other current assets 20,253 3,061 Total current assets 283,358 140,449 Property and equipment, net 126,885 31,624 Right of use asset, net 77,452 34,117 Goodwill and intangible assets, net 42,664 24,083 Other assets 4,538 1,512 Total assets $ 534,897 $ 231,785 December 31, 2021 2020 Liabilities and stockholders’ equity Current liabilities: Accounts payable $ 35,508 $ 16,128 Revolving line of credit 47 — Current lease liability 2,422 1,627 Current maturities of long-term debt 6,934 5,466 Accrued expenses and other current liabilities 26,771 12,315 Total current liabilities 71,682 35,536 Long-term debt 77,170 24,344 Long-term lease liability 79,154 33,982 Warrant liabilities 46,051 5,241 Conversion option liability 8,783 — Deferred tax liabilities 294 — Other non-current liabilities 316 — Total liabilities 283,450 99,103 Stockholders’ equity: Redeemable convertible preferred stock, $0.0001 par value; 1,000 and 105,922 shares authorized, 0 shares issued and outstanding as of December 31, 2021 and 2020, respectively — — Common stock, $0.0001 par value, 440,000 and 128,467 shares authorized, 178,089 and 108,697 shares issued and outstanding as of December 31, 2021 and 2020, respectively 18 11 Additional paid-in capital 533,101 287,318 Accumulated deficit (280,569) (154,322) Accumulated other comprehensive loss (1,103) (325) Total stockholders’ equity 251,447 132,682 Total liabilities and stockholders’ equity $ 534,897 $ 231,785
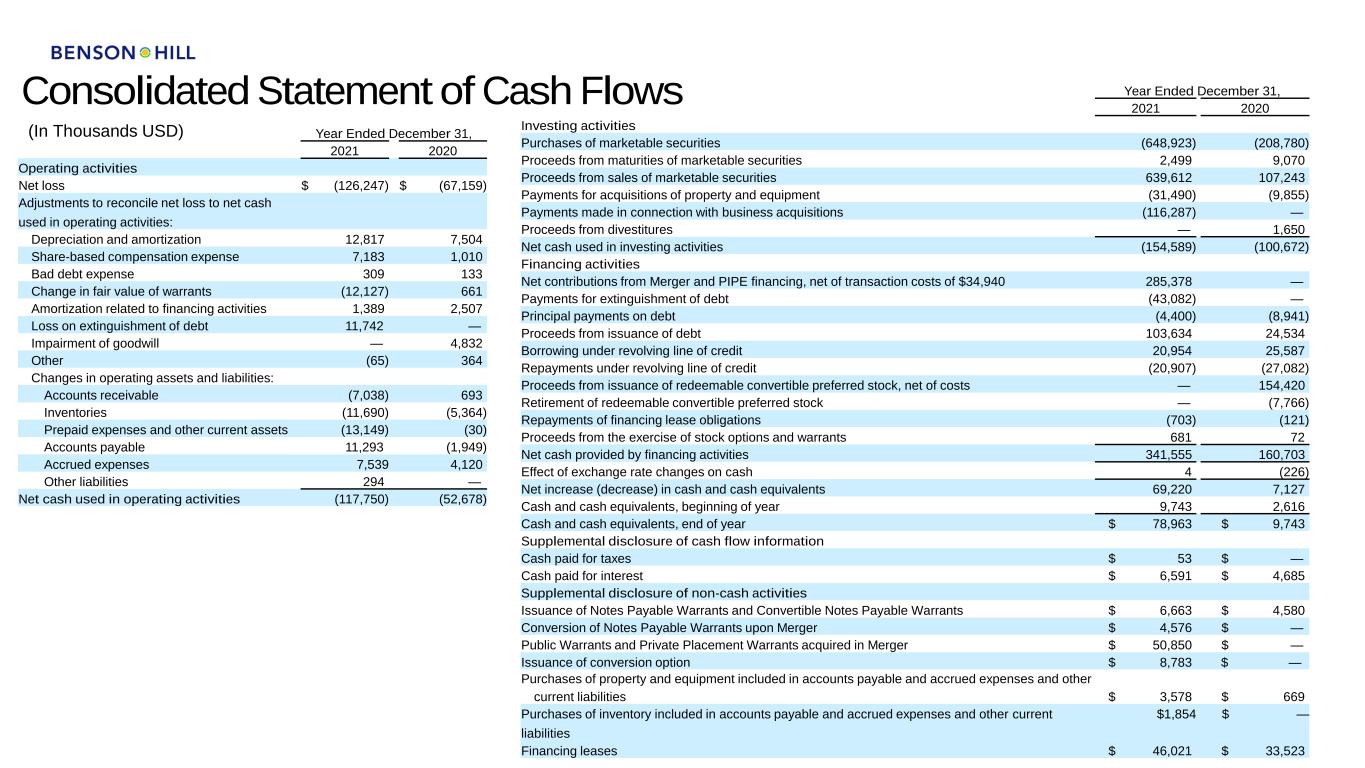
Consolidated Statement of Cash Flows 23 (In Thousands USD) Year Ended December 31, 2021 2020 Operating activities Net loss $ (126,247) $ (67,159) Adjustments to reconcile net loss to net cash used in operating activities: Depreciation and amortization 12,817 7,504 Share-based compensation expense 7,183 1,010 Bad debt expense 309 133 Change in fair value of warrants (12,127) 661 Amortization related to financing activities 1,389 2,507 Loss on extinguishment of debt 11,742 — Impairment of goodwill — 4,832 Other (65) 364 Changes in operating assets and liabilities: Accounts receivable (7,038) 693 Inventories (11,690) (5,364) Prepaid expenses and other current assets (13,149) (30) Accounts payable 11,293 (1,949) Accrued expenses 7,539 4,120 Other liabilities 294 — Net cash used in operating activities (117,750) (52,678) Year Ended December 31, 2021 2020 Investing activities Purchases of marketable securities (648,923) (208,780) Proceeds from maturities of marketable securities 2,499 9,070 Proceeds from sales of marketable securities 639,612 107,243 Payments for acquisitions of property and equipment (31,490) (9,855) Payments made in connection with business acquisitions (116,287) — Proceeds from divestitures — 1,650 Net cash used in investing activities (154,589) (100,672) Financing activities Net contributions from Merger and PIPE financing, net of transaction costs of $34,940 285,378 — Payments for extinguishment of debt (43,082) — Principal payments on debt (4,400) (8,941) Proceeds from issuance of debt 103,634 24,534 Borrowing under revolving line of credit 20,954 25,587 Repayments under revolving line of credit (20,907) (27,082) Proceeds from issuance of redeemable convertible preferred stock, net of costs — 154,420 Retirement of redeemable convertible preferred stock — (7,766) Repayments of financing lease obligations (703) (121) Proceeds from the exercise of stock options and warrants 681 72 Net cash provided by financing activities 341,555 160,703 Effect of exchange rate changes on cash 4 (226) Net increase (decrease) in cash and cash equivalents 69,220 7,127 Cash and cash equivalents, beginning of year 9,743 2,616 Cash and cash equivalents, end of year $ 78,963 $ 9,743 Supplemental disclosure of cash flow information Cash paid for taxes $ 53 $ — Cash paid for interest $ 6,591 $ 4,685 Supplemental disclosure of non-cash activities Issuance of Notes Payable Warrants and Convertible Notes Payable Warrants $ 6,663 $ 4,580 Conversion of Notes Payable Warrants upon Merger $ 4,576 $ — Public Warrants and Private Placement Warrants acquired in Merger $ 50,850 $ — Issuance of conversion option $ 8,783 $ — Purchases of property and equipment included in accounts payable and accrued expenses and other current liabilities $ 3,578 $ 669 Purchases of inventory included in accounts payable and accrued expenses and other current liabilities $1,854 $ — Financing leases $ 46,021 $ 33,523
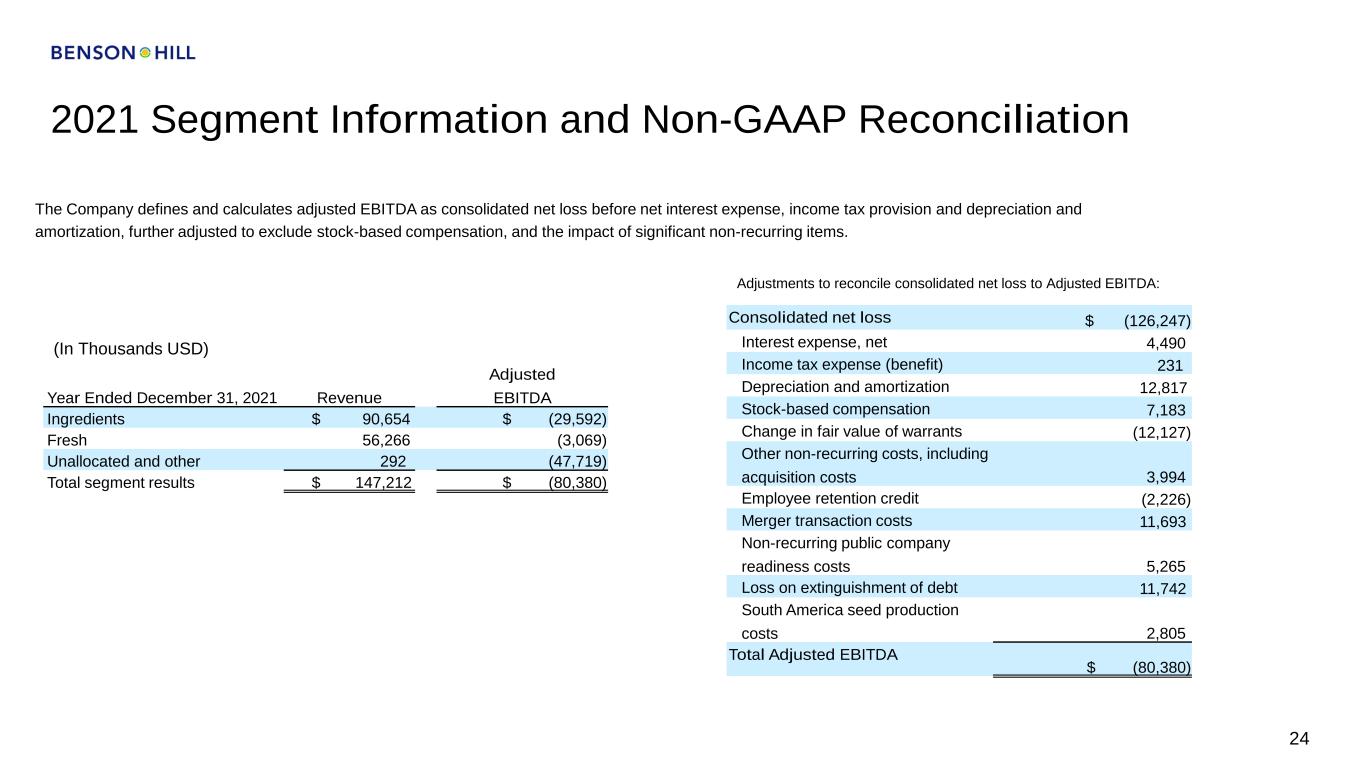
2021 Segment Information and Non-GAAP Reconciliation 24 Adjustments to reconcile consolidated net loss to Adjusted EBITDA: (In Thousands USD) The Company defines and calculates adjusted EBITDA as consolidated net loss before net interest expense, income tax provision and depreciation and amortization, further adjusted to exclude stock-based compensation, and the impact of significant non-recurring items. Year Ended December 31, 2021 Revenue Adjusted EBITDA Ingredients $ 90,654 $ (29,592) Fresh 56,266 (3,069) Unallocated and other 292 (47,719) Total segment results $ 147,212 $ (80,380) Consolidated net loss $ (126,247) Interest expense, net 4,490 Income tax expense (benefit) 231 Depreciation and amortization 12,817 Stock-based compensation 7,183 Change in fair value of warrants (12,127) Other non-recurring costs, including acquisition costs 3,994 Employee retention credit (2,226) Merger transaction costs 11,693 Non-recurring public company readiness costs 5,265 Loss on extinguishment of debt 11,742 South America seed production costs 2,805 Total Adjusted EBITDA $ (80,380)
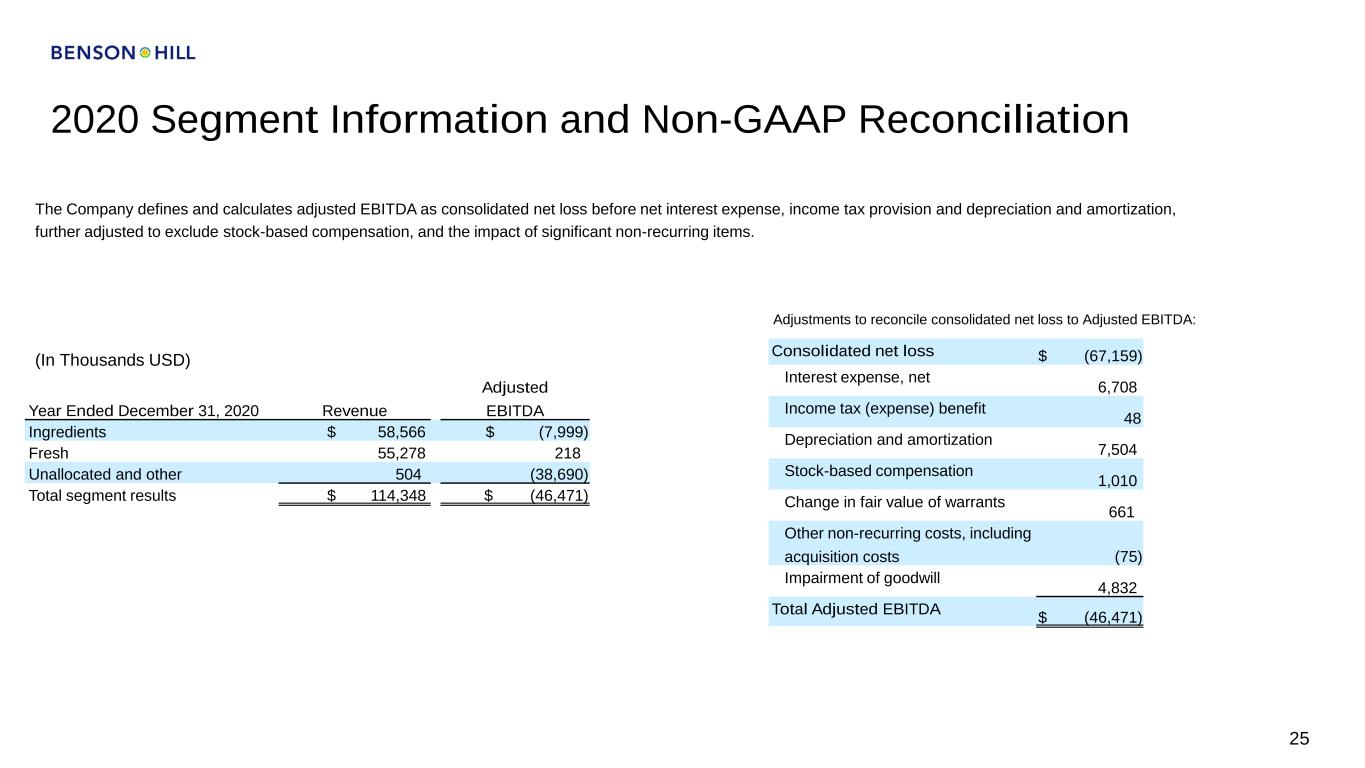
2020 Segment Information and Non-GAAP Reconciliation 25 Adjustments to reconcile consolidated net loss to Adjusted EBITDA: (In Thousands USD) The Company defines and calculates adjusted EBITDA as consolidated net loss before net interest expense, income tax provision and depreciation and amortization, further adjusted to exclude stock-based compensation, and the impact of significant non-recurring items. Year Ended December 31, 2020 Revenue Adjusted EBITDA Ingredients $ 58,566 $ (7,999) Fresh 55,278 218 Unallocated and other 504 (38,690) Total segment results $ 114,348 $ (46,471) Consolidated net loss $ (67,159) Interest expense, net 6,708 Income tax (expense) benefit 48 Depreciation and amortization 7,504 Stock-based compensation 1,010 Change in fair value of warrants 661 Other non-recurring costs, including acquisition costs (75) Impairment of goodwill 4,832 Total Adjusted EBITDA $ (46,471)
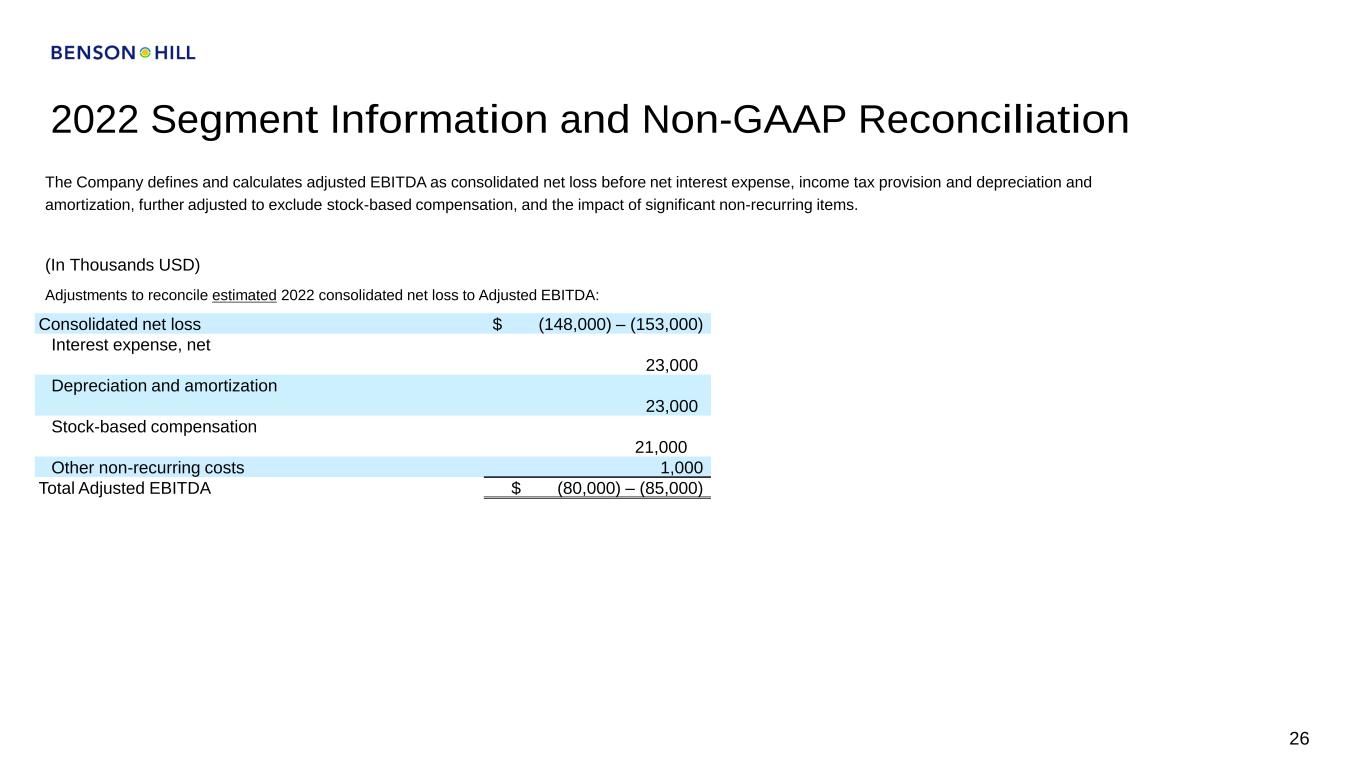
2022 Segment Information and Non-GAAP Reconciliation 26 Adjustments to reconcile estimated 2022 consolidated net loss to Adjusted EBITDA: (In Thousands USD) The Company defines and calculates adjusted EBITDA as consolidated net loss before net interest expense, income tax provision and depreciation and amortization, further adjusted to exclude stock-based compensation, and the impact of significant non-recurring items. Consolidated net loss $ (148,000) – (153,000) Interest expense, net 23,000 Depreciation and amortization 23,000 Stock-based compensation 21,000 Other non-recurring costs 1,000 Total Adjusted EBITDA $ (80,000) – (85,000)