SECOND QUARTER 2022 EARNINGS PRESENTATION AUGUST 8, 2022 Exhibit 99.3
Disclaimers Cautionary Note Regarding Forward-Looking Statements Certain statements in this presentation may be considered “forward-looking statements” within the meaning of the “safe harbor” provisions of the United States Private Securities Litigation Reform Act of 1995. Forward-looking statements relate to future events or the Company’s future financial or operating performance. These forward-looking statements include, among other things, statements regarding: the Company’s currently expected guidance regarding its full year 2022 consolidated revenues, revenues for its proprietary soy portfolio, segment revenues, gross profit, gross margins, contribution margins, net loss, Adjusted EBITDA, and cash usage; the sufficiency of the Company’s cash position to fund the business in future periods; the anticipated benefits and other aspects of the Company’s strategic partnership with ADM and the revenue expected to be generated thereby, including revenue from licensing fees and milestone payments; the markets expected to be served by the Company’s strategic partnership with ADM; management’s plans to explore strategic options for the Company’s Fresh business segment; financial or other information based upon or otherwise incorporating judgments or estimates relating to future performance, events or expectations; expectations regarding the Company’s hedging and other risk management strategies, including expectations about future sales and purchases that relate to the Company’s mark-to-market adjustments; the Company’s strategies and plans for growth; the Company’s, positioning, resources, capabilities, and expectations for future performance; estimates and forecasts of financial and other performance metrics; projections of market opportunity, including with respect to market opportunity expected to result from the Company’s strategic partnership with ADM; the Company’s outlook and financial and other guidance; and management’s strategy and plans for growth. In some cases, the reader can identify forward-looking statements by words such as “may,” “should,” “expect,” “intend,” “will,” “estimate,” “anticipate,” “believe,” “predict,” or similar words. Such forward-looking statements are based upon assumptions made by Benson Hill as of the date hereof and are subject to risks, uncertainties, and other factors that could cause actual results to differ materially from those expressed or implied by such forward-looking statements. Factors that may cause actual results to differ materially from current expectations include, but are not limited to, the Company’s ability to achieve anticipated benefits of recent business combinations, which may be affected by, among other things, competition, the ability of the combined company to grow and achieve growth profitably, maintain relationships with customers and suppliers, and retain its management and key employees; the risk that the anticipated benefits and results of the Company’s strategic partnership with ADM will not be realized, including the risk that certain related milestones and performance objectives will not be achieved; risks related to the effect of the announcement of management’s plans to explore strategic options for the Fresh business segment on the Company’s business relationships, operating results, stock price and business generally; the ability to generate and deploy capital, including capital from operations, capital drawn from the Company’s debt facility and capital expected to result from the Company’s strategic partnership with ADM, in a manner that furthers the Company’s growth strategy, as well as the general ability to execute the Company’s business plans; industry conditions, including fluctuations in supply, demand and prices for agricultural commodities; the effects of weather conditions and the outbreak of crop disease on our business; global and regional economic, agricultural, financial and commodities market, political, social and health conditions; the effectiveness of our risk management strategies; the transition to becoming a public company; and other risks and uncertainties set forth in the sections entitled “Risk Factors” and “Cautionary Note Regarding Forward-Looking Statements” in the Company’s filings with the Securities and Exchange Commission (“SEC”), which are available on the SEC’s website at www.sec.gov. Forward-looking statements are also subject to the risks and other issues described above under “Use of Non-GAAP Financial Measures,” which could cause actual results to differ materially from current expectations included in the Company’s forward-looking statements included in this presentation. Nothing in this presentation should be regarded as a representation by any person that the forward-looking statements set forth herein will be achieved or that any of the contemplated results of such forward looking statements will be achieved, including without limitation any expectations about our operational and financial performance or achievements through and including 2024. There may be additional risks about which the Company is presently unaware or that the Company currently believes are immaterial that could also cause actual results to differ from those contained in the forward-looking statements. The reader should not place undue reliance on forward-looking statements, which speak only as of the date they are made. The Company anticipates that subsequent events and developments will cause its assessments to change. However, while the Company may elect to update these forward-looking statements at some point in the future, it expressly disclaims any duty to update these forward-looking statements, except as otherwise required by law. Use of Non-GAAP Financial Measures In this presentation, the Company includes non-GAAP performance measures. The Company uses these non-GAAP financial measures to facilitate management's financial and operational decision-making, including evaluation of the Company’s historical operating results. The Company’s management believes these non-GAAP measures are useful in evaluating the Company’s operating performance and are similar measures reported by publicly listed U.S. competitors, and regularly used by securities analysts, institutional investors, and other interested parties in analyzing operating performance and prospects. These non-GAAP financial measures reflect an additional way of viewing aspects of the Company’s operations that, when viewed with GAAP results and the reconciliations to corresponding GAAP financial measures, may provide a more complete understanding of factors and trends affecting the Company’s business. By providing these non-GAAP measures, the Company’s management intends to provide investors with a meaningful, consistent comparison of the Company’s performance for the periods presented. These non-GAAP financial measures should be considered supplemental to, and not a substitute for, financial information prepared in accordance with GAAP. The Company’s definition of these non-GAAP measures may differ from similarly titled measures of performance used by other companies in other industries or within the same industry. Because non-GAAP financial measures exclude the effect of items that will increase or decrease the Company’s reported results of operations, management strongly encourages investors to review the Company’s consolidated financial statements and publicly filed reports in their entirety. A reconciliation of the non-GAAP financial measures to the most directly comparable GAAP financial measures and the Company’s definition of these non-GAAP measures is included in the tables accompanying this presentation.

Summary • Strong Ingredients performance resulted in consolidated year-to-date revenue growth of 184 percent, to $203 million • Strategic partnership with ADM represents a significant milestone in the planned scaling of proprietary soy innovations through an asset-light licensing model • Management is assessing strategic alternatives for the Fresh business segment to increase focus and resources to the market opportunity in the ingredients market • Strong year-to-date performance results in an increase in management’s expectations for 2022 Ingredients segment revenue

Market dynamics and macro tailwinds help to drive and even accelerate demand for Benson Hill’s innovative products ACCELERATING FOOD INFLATION ENVIRONMENTAL IMPACT OF THE FOOD SYSTEM FOOD SUPPLY CHAIN DISRUPTION FOOD-DRIVEN HEALTH IMPLICATIONS

Setting the Pace: • Data-driven platform • Genomics • Artificial Intelligence • Predictive breeding • Incentivized for targeted quality traits • Analytical and agronomic support CropOS® FOOD INNOVATION ENGINE: ACCELERATES SPEED TO MARKET FARMER PARTNER PROGRAMS IMPACTFUL, DIVERSIFIED PORTFOLIO: ACCELERATES CUSTOMER UPTAKE • Higher functionality and cost-in-use • Locally sourced • Non-GMO • Heart Healthy Oil† • More sustainable • Identity preservation TruVail™ FOOD INGREDIENTS Veri™ COOKING OIL ANIMAL NUTRITION †Supportive but not conclusive scientific evidence suggests that daily consumption of about 1½ tablespoons (20 grams) of oils containing high levels of oleic acid, when replaced for fats and oils higher in saturated fat, may reduce the risk of coronary heart disease. To achieve this possible benefit, oleic acid-containing oils should not increase the total number of calories you eat in a day. One serving of high oleic soybean oil provides 10 grams of oleic acid (which is 11 grams of monounsaturated fatty acid).
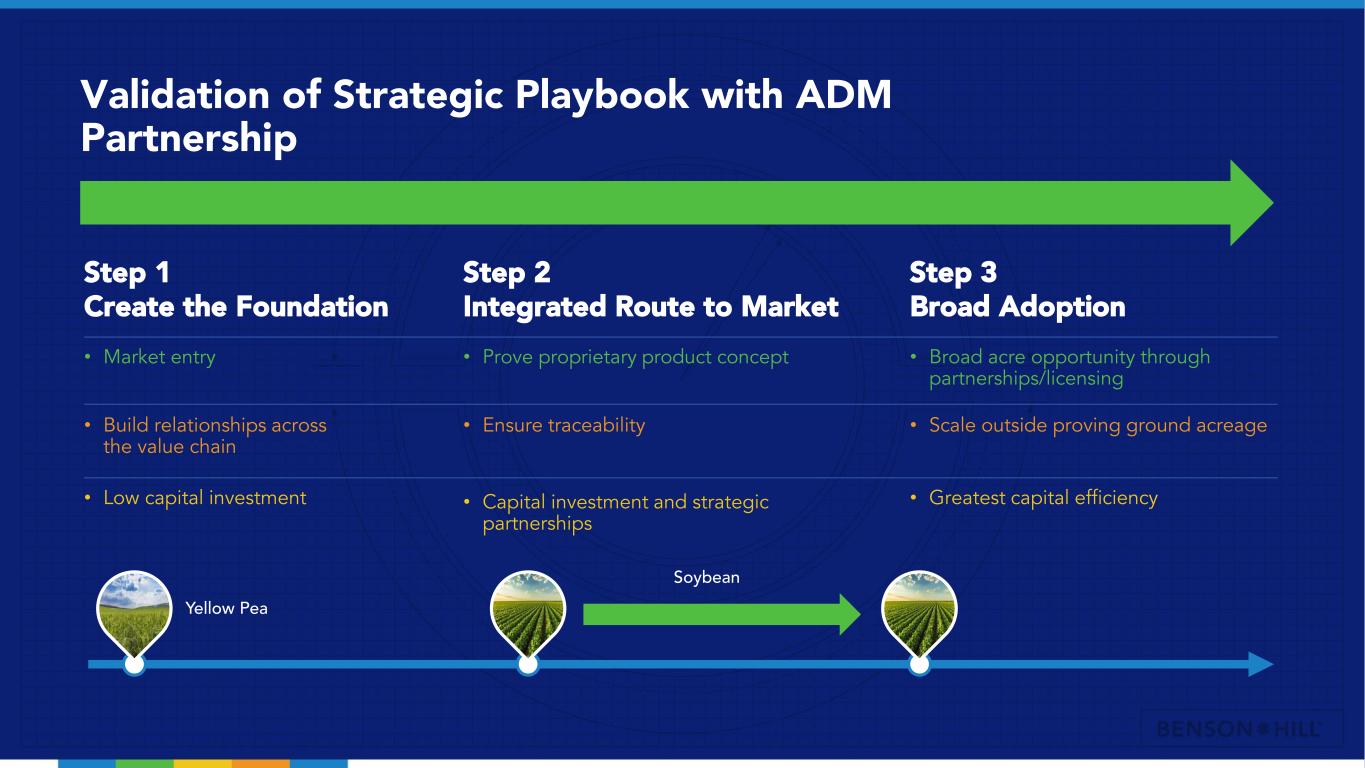
Validation of Strategic Playbook with ADM Partnership • Market entry • Build relationships across the value chain • Low capital investment Step 1 Create the Foundation • Prove proprietary product concept • Ensure traceability • Capital investment and strategic partnerships Step 2 Integrated Route to Market • Broad acre opportunity through partnerships/licensing • Scale outside proving ground acreage • Greatest capital efficiency Step 3 Broad Adoption Yellow Pea Soybean

Benson Hill and ADM entered a long-term partnership to scale Ultra-High Protein soy ingredients in North America (1) Access to ADM’s current and planned protein processing capacity for food markets Access to ADM’s expansive farmer network Leverage ADM’s product application and formulation expertise Markets: Alternative meat, meat extension, alternative dairy, specialized nutrition • Commercial license to exclusively process Benson Hill’s Ultra-High Protein (UHP) soybeans that are non-GMO, traceable and sustainable, with enhanced functionality • Leverage ADM’s expertise from origination to sales to scale and co-brand soy protein concentrates, textured soy proteins and soy isolates derived from Benson Hill UHP soybeans • Benson Hill maintains its existing go-to-market responsibilities for proprietary soy flour, meal and oil products in food, as well as animal feed, including aquaculture • Partnership is limited to products manufactured in North America by ADM using Ultra-High Protein soybeans Strategic Partnership

Ultra-High Protein ingredients provide enhanced functionality, traceability, and sustainability attributes (1) Per kg of protein, Internal estimated impact of using de-fatted soybean from Ultra-High Protein (UHP) soybeans compared to conventional soy protein concentrate, based on preliminary Life Cycle Assessment results conducted by Blonk Consultants (April 2021) (1)
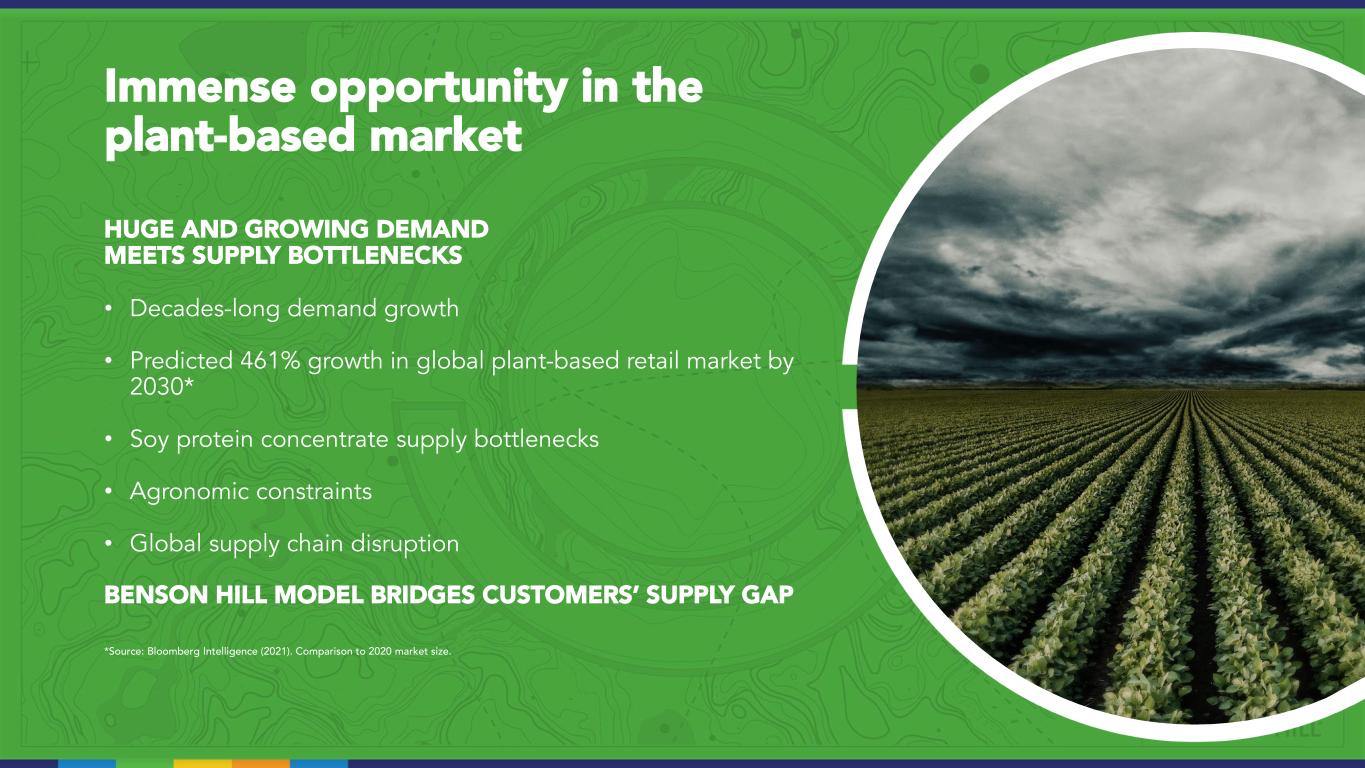
Immense opportunity in the plant-based market HUGE AND GROWING DEMAND MEETS SUPPLY BOTTLENECKS • Decades-long demand growth • Predicted 461% growth in global plant-based retail market by 2030* • Soy protein concentrate supply bottlenecks • Agronomic constraints • Global supply chain disruption BENSON HILL MODEL BRIDGES CUSTOMERS’ SUPPLY GAP *Source: Bloomberg Intelligence (2021). Comparison to 2020 market size.

*preliminary LCA results from Blonk Consultants based on economic allocation and industry averages Veri™ Delivers Superior Performance Veri™ Oil Commodity Soy Oil Heart Healthy Omega-9 X Less polymer buildup on fryer X Long fry life X Cost effectiveness X X Non-GMO Project Verified X Veri™ Provides Sustainability Benefits vs. Canola* Up to 70% less Carbon Up to 66% less Water Up to 15% less Land Use Demand remains strong for Veri™ cooking oil Forward selling expected 2022 crop inventory including a supply agreement with St. Louis-based Schnuck Markets, Inc. to nearly 100 grocery stores in the Mid-West Additional 10k acres planted in the 2022 crop

Performance Sustainability Value Fat Anti- Nutrients Protein* 1% <1% Soybean Commodity Meal 1% >5% Soy Protein Concentrate <1% <1% *Typical values on an as-is basis >50% Aquaculture to overtake capture production in 2027 and account for 52% of all fish production for all uses by 2030(1) >$245B Expected seafood market size by 2030 from $180B today(1) Aquaculture Market Ultra-High Protein Offering Up to 83% Less Water and 89% Less CO2e(3) When compared to processing steps for Brazilian-sourced soy protein concentrate accounting for the impacts of deforestation(3) Benson Hill Advantage: Affordable, sustainable, scalable$2.5B Immediate market opportunity for soybean aquafeed for Salmon and Trout(2) With validated value proposition of Ultra-High Protein soy in the aquaculture feed market, anticipate continued growth in category Source: Benson Hill. (1) Food and Agriculture Organization. (2) Global Aquatic Feed Ingredients and Products Market report from Technavio.com. (3) On a per kilogram of protein basis, based on preliminary Life Cycle Assessment results conducted by Blonk Consultants (April 2021).
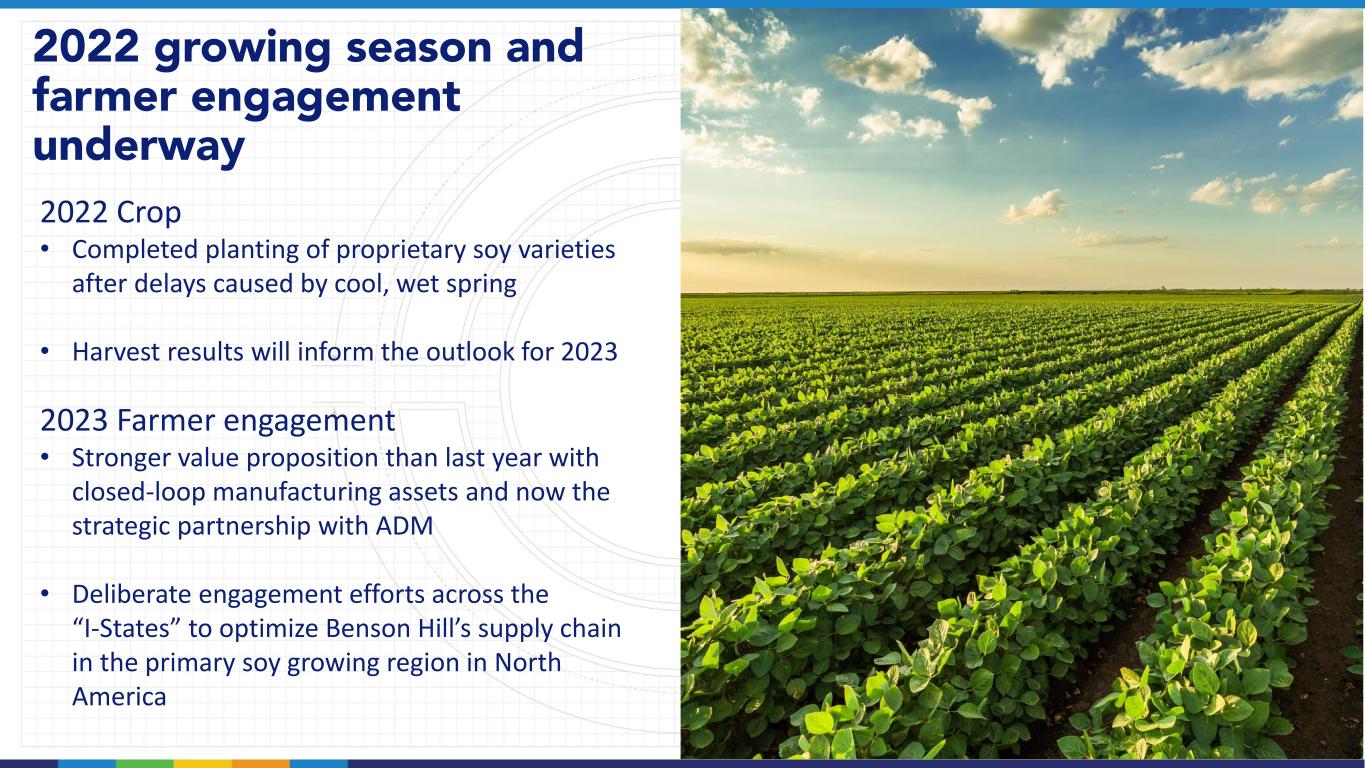
2022 Crop • Completed planting of proprietary soy varieties after delays caused by cool, wet spring • Harvest results will inform the outlook for 2023 2023 Farmer engagement • Stronger value proposition than last year with closed-loop manufacturing assets and now the strategic partnership with ADM • Deliberate engagement efforts across the “I-States” to optimize Benson Hill’s supply chain in the primary soy growing region in North America 2022 growing season and farmer engagement underway

Financial success and ESG impact are inextricably linked (1) Benson Hill Inaugural ESG report • Soil health; Reduced inputs; Reduced emissions; Nutrition density per acre *Per kg of protein. Internal estimated impact of using de-fatted soybean from Ultra-High Protein (UHP) soybeans compared to conventional soy protein concentrate, based on Benson Hill LCA on UHP Soybean (2021). • CleanCRUSH™ ingredients; 50% reduction in carbon*; 70% reduction in water*; Enabling traceability and identity preservation • Grown with Regen Ag.; Net-zero farms; Reduced processing; USA grown • Validates financial success linked to social and environmental KPIs • Sustainability and Governance Committee of the Board of Directors oversees corporate governance best practices • Completed first materiality assessment and GHG scope 1 and scope 2 inventory assessments • Seamlessly leverage data from the farm and through ingredient production to support customer sustainability

ADM partnership to enable Benson Hill to scale its proprietary Ultra-High Protein soy portfolio (1) • Asset-light licensing model consistent with “Step 3” of strategic playbook o Utilize ADM’s processing, operations and commercial infrastructure • Partnership reduces execution, competitive and financial risks • Expected revenues to Benson Hill o Value share on all ingredient sales with ADM o Licensing of Benson Hill soybeans through technology access fees over the duration of the agreement o Additional revenue opportunities upon achievement of mutually agreed upon performance objectives Benson Hill Partnership and Licensing Plan ADM partnership expected to: • Contribute a significant portion of 20% licensing revenue target in 2025-2027 timeframe • Provide majority of currently forecasted gross profit from licensing revenues in 3-year operating plan
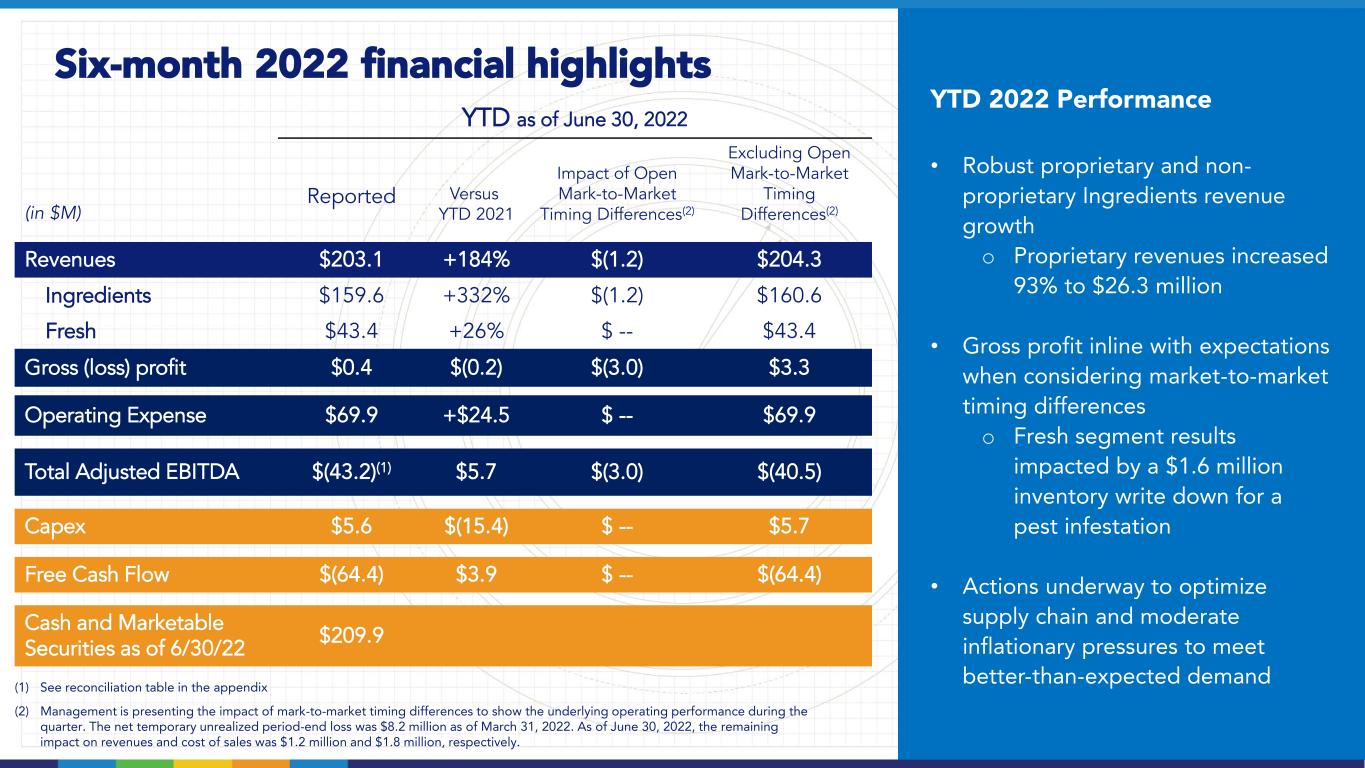
Six-month 2022 financial highlights YTD as of June 30, 2022 (in $M) Reported Versus YTD 2021 Impact of Open Mark-to-Market Timing Differences(2) Excluding Open Mark-to-Market Timing Differences(2) Revenues $203.1 +184% $(1.2) $204.3 Ingredients $159.6 +332% $(1.2) $160.6 Fresh $43.4 +26% $ -- $43.4 Gross (loss) profit $0.4 $(0.2) $(3.0) $3.3 Operating Expense $69.9 +$24.5 $ -- $69.9 Total Adjusted EBITDA $(43.2)(1) $5.7 $(3.0) $(40.5) Capex $5.6 $(15.4) $ -- $5.7 Free Cash Flow $(64.4) $3.9 $ -- $(64.4) Cash and Marketable Securities as of 6/30/22 $209.9 (1) See reconciliation table in the appendix (2) Management is presenting the impact of mark-to-market timing differences to show the underlying operating performance during the quarter. The net temporary unrealized period-end loss was $8.2 million as of March 31, 2022. As of June 30, 2022, the remaining impact on revenues and cost of sales was $1.2 million and $1.8 million, respectively. YTD 2022 Performance • Robust proprietary and non- proprietary Ingredients revenue growth o Proprietary revenues increased 93% to $26.3 million • Gross profit inline with expectations when considering market-to-market timing differences o Fresh segment results impacted by a $1.6 million inventory write down for a pest infestation • Actions underway to optimize supply chain and moderate inflationary pressures to meet better-than-expected demand

Increasing 2022 revenue guidance for Ingredients segment (in $M) 2022 (Updated Guidance) 2022 (Previous Guidance) Total Revenue $340 - $400 $315 - $350 Ingredients $275 - $325 $250 - $275 Fresh $65 - $75 $65 - $75 Total Gross Profit $9 - $13 $9 - $13 Operating Expense $135 - $140(1) $135 - $140(1) Total Adjusted EBITDA ($80-$85)(2) ($80 - $85)(2) Capex $12 - $16 $12 - $16 Free Cash Flow ($120 - $130)(2) ($120 - $130)(2) 2022 Expectations Revenue • >100% year-over-year growth • Total and organic Ingredients revenue growth of >200% and >80%, respectively, driven by: − $70-$80 million proprietary soy ingredients revenue Gross margin improvement • Expanded soy portfolio and reduction in tolling costs, partially offset by supply chain and inflationary pressures and compressed margins in the Fresh segment Focus on free cash flow by disciplined Capex investment, cash operating expenses and working capital usage ADM Partnership expected to provide a minimal revenue contribution in 2022 (1) Includes an estimated $36 million in non-cash expense consisting of $21 million for stock-based compensation and $15 million for depreciation and amortization. (2) See reconciliation table in the appendix.
Securing non-dilutive sources of cash to support strategic plan (1) • Cash and marketable securities were $210 million as of June 30, 2022 • $20 million drawdown on $100 million committed debt facility o Expect no material impact on 2022 interest expense • Technology access licensing fees and expected future milestone payments from ADM over the duration of the partnership are also expected to be a source of non-dilutive funding • Conducting a strategic assessment of the Fresh business Strong execution, achieving commercial objectives, and ongoing cash management discipline are drivers for achieving the 2025 financial targets
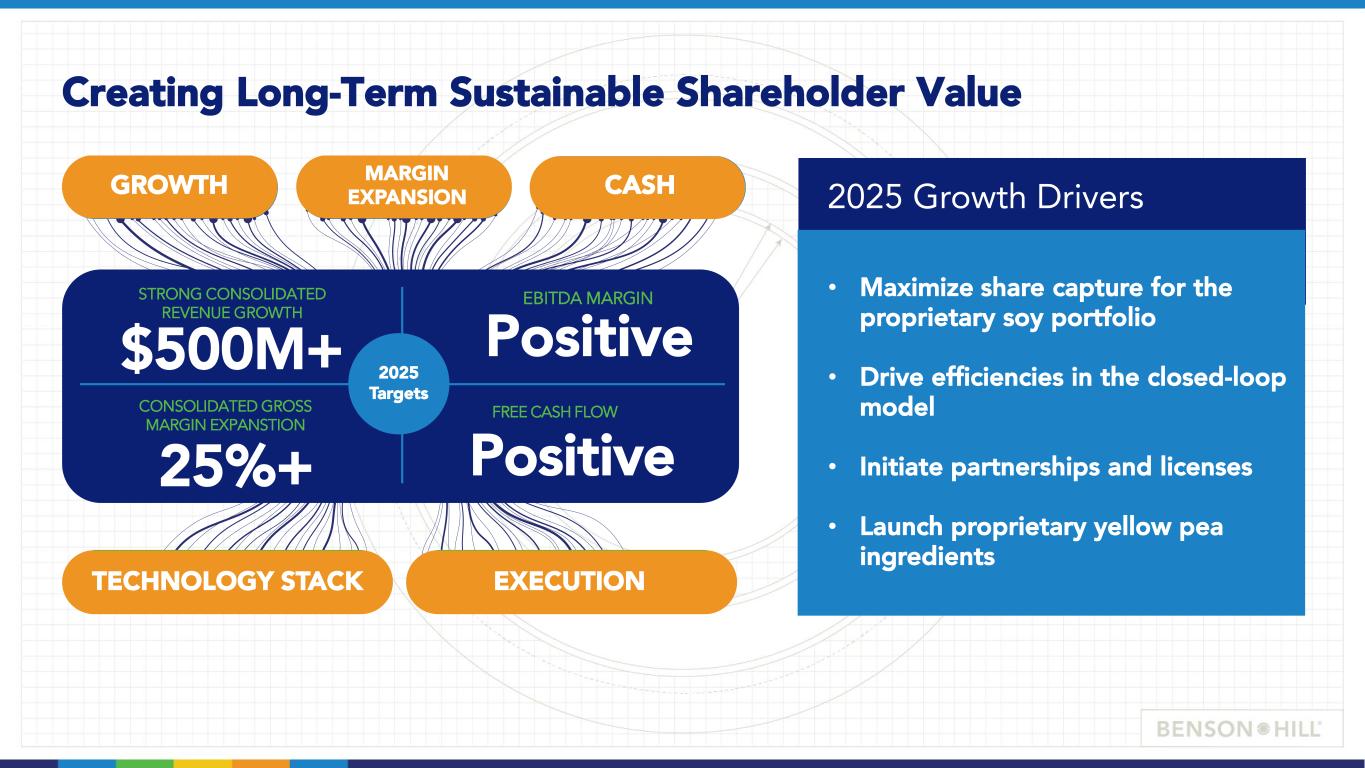
(1) MARGIN EXPANSION TECHNOLOGY STACK EXECUTION Creating Long-Term Sustainable Shareholder Value CASHI IGROWTH STRONG CONSOLIDATED REVENUE GROWTH CONSOLIDATED GROSS MARGIN EXPANSTION EBITDA MARGIN FREE CASH FLOW $500M+ 25%+ Positive Positive 2025 Targets 2025 Growth Drivers • Maximize share capture for the proprietary soy portfolio • Drive efficiencies in the closed-loop model • Initiate partnerships and licenses • Launch proprietary yellow pea ingredients
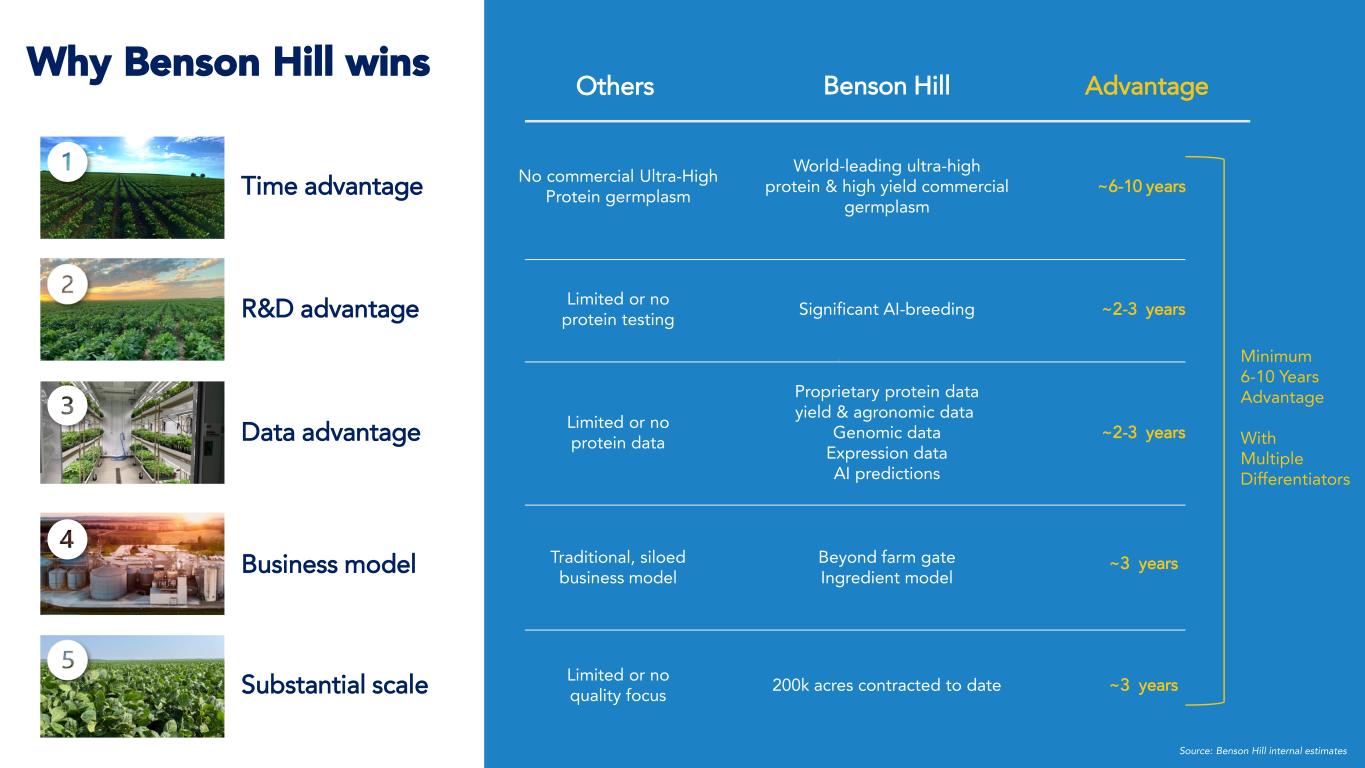
Why Benson Hill wins Data advantage ~2-3 yearsLimited or no protein data Business model ~3 yearsTraditional, siloed business model Substantial scale ~3 yearsLimited or no quality focus ~2-3 yearsR&D advantage Limited or no protein testing Minimum 6-10 Years Advantage With Multiple Differentiators Time advantage Others AdvantageBenson Hill Proprietary protein data yield & agronomic data Genomic data Expression data AI predictions Beyond farm gate Ingredient model 200k acres contracted to date Significant AI-breeding World-leading ultra-high protein & high yield commercial germplasm No commercial Ultra-High Protein germplasm ~6-10 years Source: Benson Hill internal estimates

OUR TECHNOLOGY APPENDIX

Second Quarter 2022 Financial Highlights Q2 as of June 30, 2022 (in $M) Reported Versus YTD 2021 Impact of Open Mark-to-Market Timing Differences(2) Excl Open Mark- to-Market Timing Differences(2) Revenues $110.7 +179% $3.9 $106.8 Ingredients $93.5 +312% $3.9 $89.6 Fresh $17.1 +1% $ -- $17.1 Gross (loss) profit $5.6 +$5.6 $5.2 $0.4 Operating Expense $34.5 +$9.9 $ -- $34.5 Total Adjusted EBITDA $(15.7)(1) $0.1 $5.2 $(20.9) (1) See reconciliation table in the appendix (2) Management is presenting the impact of mark-to-market timing differences to show the underlying operating performance during the quarter. The net temporary unrealized period-end gain was $5.2 million, which partially offset losses in the first quarter. The impact on revenues and cost of sales was $3.9 million and $1.3 million, respectively. Management expects the remaining $2.9 million in loss from the first quarter to reverse in the coming quarters. Q2 2022 Summary • Strong customer demand drove proprietary and non-proprietary soy ingredient sales o Proprietary revenues increased 60% to $12.2 million • Gross profit benefited from expected gains in mark-to-market timing differences o Stronger than expected demand and inflationary pressures have temporarily outpaced current supply chain, driving up costs for freight, logistics and factory overhead o Initiatives underway to optimize the supply chain to better meet demand and moderate inflationary pressures

Consolidated Statements of Operation (In Thousands USD, Except Per Share Information) Three Months Ended June 30, Six Months Ended June 30, 2022 2021 2022 2021 Revenues $ 110,747 $ 39,692 $ 203,192 $ 71,494 Cost of sales 105,171 39,722 202,838 70,955 Gross profit (loss) 5,576 (30) 354 539 Operating expenses: Research and development 12,017 8,818 24,323 15,945 Selling, general and administrative expenses 22,494 15,761 45,618 29,494 Total operating expenses 34,511 24,579 69,941 45,439 Loss from operations (28,935) (24,609) (69,587) (44,900) Other (income) expense: Interest expense, net 3,524 1,277 9,912 2,535 Change in fair value of warrants (5,899) 1,703 (37,640) 2,719 Other expense (income), net 938 (170) 2,254 (388) Total other (income) expense, net (1,437) 2,810 (25,474) 4,866 Net loss before income tax (27,498) (27,419) (44,113) (49,766) Income tax expense (benefit) 56 — 17 — Net loss $ (27,554) $ (27,419) $ (44,130) $ (49,766) Net loss per common share: Basic and diluted loss per common share $ (0.15) $ (0.25) $ (0.25) $ (0.46) Weighted average shares outstanding: Basic and diluted weighted average shares outstanding 185,530 109,222 173,189 108,989

Consolidated Balance Sheet (In Thousands USD) June 30, December 31, 2022 2021 (Unaudited) Assets Current assets: Cash and cash equivalents $ 46,772 $ 78,963 Marketable securities 163,135 103,689 Accounts receivable, net 36,753 31,729 Inventories, net 47,766 48,724 Prepaid expenses and other current assets 14,544 20,253 Total current assets 308,970 283,358 Property and equipment, net 124,762 126,885 Right of use asset, net 74,337 77,452 Goodwill and intangible assets, net 42,665 42,664 Other assets 4,541 4,538 Total assets $ 555,275 $ 534,897 June 30, December 31, 2022 2021 (Unaudited) Liabilities and stockholders’ equity Current liabilities: Accounts payable $ 21,826 $ 35,508 Revolving line of credit 755 47 Current lease liability 3,039 2,422 Current maturities of long-term debt 25,776 6,934 Accrued expenses and other current liabilities 27,423 26,771 Total current liabilities 78,819 71,682 Long-term debt 83,458 77,170 Long-term lease liability 79,599 79,154 Warrant liabilities 32,857 46,051 Conversion option liability 10,940 8,783 Deferred tax liabilities 304 294 Other non-current liabilities 318 316 Total liabilities 286,295 283,45 Stockholders’ equity: Redeemable convertible preferred stock, $0.0001 par value; 1,000 and 1,000 shares authorized, 0 shares issued and outstanding as of June 30, 2022 and December 31, 2021, respectively — — Common stock, $0.0001 par value, 440,000 and 440,000 shares authorized, 205,626 and 178,089 shares issued and outstanding as of June 30, 2022 and December 31, 2021, respectively 21 18 Additional paid-in capital 600,73 533,10 Accumulated deficit (324,699) (280,569) Accumulated other comprehensive loss (7,078) (1,103) Total stockholders’ equity 268,980 251,447 Total liabilities and stockholders’ equity $ 555,275 $ 534,897
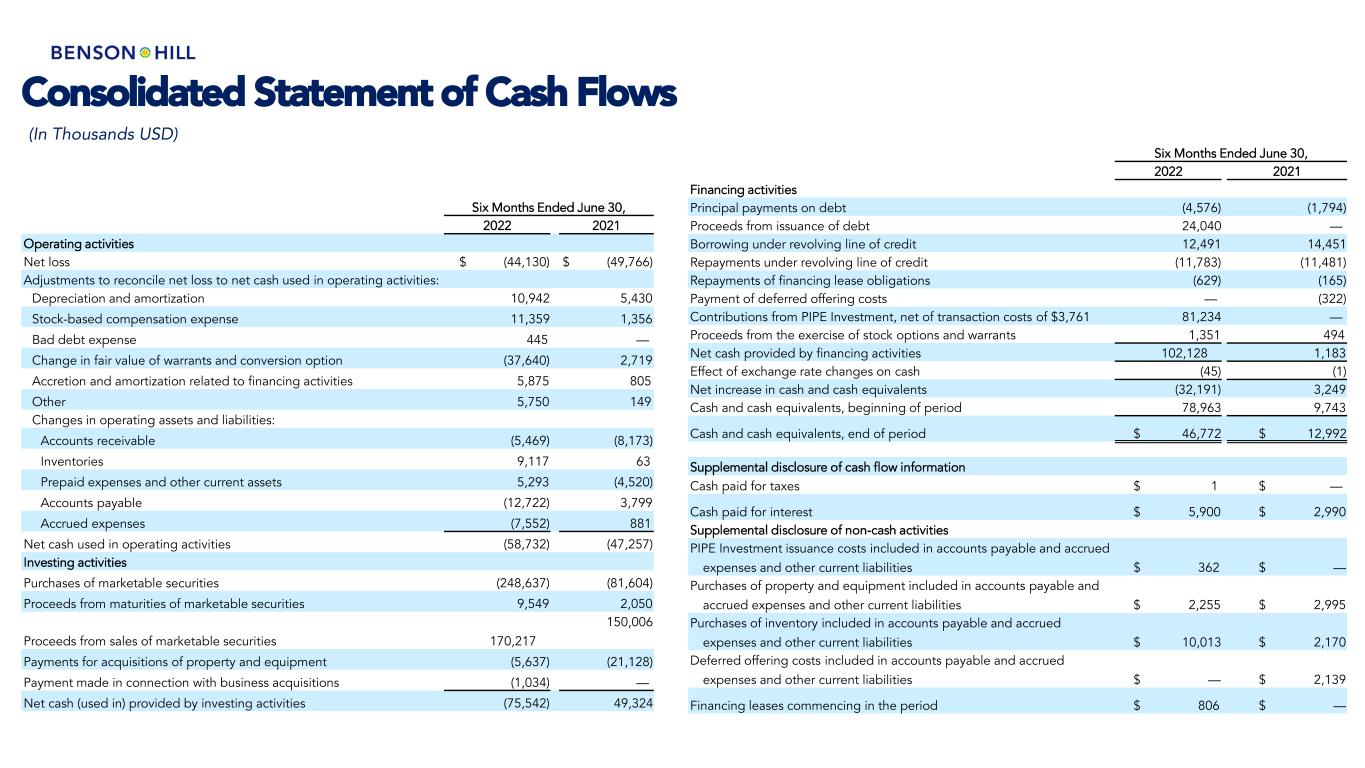
Consolidated Statement of Cash Flows (In Thousands USD) Six Months Ended June 30, 2022 2021 Operating activities Net loss $ (44,130) $ (49,766) Adjustments to reconcile net loss to net cash used in operating activities: Depreciation and amortization 10,942 5,430 Stock-based compensation expense 11,359 1,356 Bad debt expense 445 — Change in fair value of warrants and conversion option (37,640) 2,719 Accretion and amortization related to financing activities 5,875 805 Other 5,750 149 Changes in operating assets and liabilities: Accounts receivable (5,469) (8,173) Inventories 9,117 63 Prepaid expenses and other current assets 5,293 (4,520) Accounts payable (12,722) 3,799 Accrued expenses (7,552) 881 Net cash used in operating activities (58,732) (47,257) Investing activities Purchases of marketable securities (248,637) (81,604) Proceeds from maturities of marketable securities 9,549 2,050 Proceeds from sales of marketable securities 170,217 150,006 Payments for acquisitions of property and equipment (5,637) (21,128) Payment made in connection with business acquisitions (1,034) — Net cash (used in) provided by investing activities (75,542) 49,324 Six Months Ended June 30, 2022 2021 Financing activities Principal payments on debt (4,576) (1,794) Proceeds from issuance of debt 24,040 — Borrowing under revolving line of credit 12,491 14,451 Repayments under revolving line of credit (11,783) (11,481) Repayments of financing lease obligations (629) (165) Payment of deferred offering costs — (322) Contributions from PIPE Investment, net of transaction costs of $3,761 81,234 — Proceeds from the exercise of stock options and warrants 1,351 494 Net cash provided by financing activities 102,128 1,183 Effect of exchange rate changes on cash (45) (1) Net increase in cash and cash equivalents (32,191) 3,249 Cash and cash equivalents, beginning of period 78,963 9,743 Cash and cash equivalents, end of period $ 46,772 $ 12,992 Supplemental disclosure of cash flow information Cash paid for taxes $ 1 $ — Cash paid for interest $ 5,900 $ 2,990 Supplemental disclosure of non-cash activities PIPE Investment issuance costs included in accounts payable and accrued expenses and other current liabilities $ 362 $ — Purchases of property and equipment included in accounts payable and accrued expenses and other current liabilities $ 2,255 $ 2,995 Purchases of inventory included in accounts payable and accrued expenses and other current liabilities $ 10,013 $ 2,170 Deferred offering costs included in accounts payable and accrued expenses and other current liabilities $ — $ 2,139 Financing leases commencing in the period $ 806 $ —

Second quarter segment information and non-GAAP reconciliation Adjustments to reconcile consolidated net loss to Adjusted EBITDA: (In Thousands USD) The Company defines and calculates adjusted EBITDA as consolidated net loss before net interest expense, income tax provision and depreciation and amortization, further adjusted to exclude stock-based compensation, and the impact of significant non-recurring items. Three Months Ended June 30, 2022 Revenue Adjusted EBITDA Ingredients 93,545 (1,145) Fresh 17,116 (304) Unallocated and other 86 (14,217) Total segment results $ 110,747 $ (15,666) Consolidated net loss $ (27,554) Interest expense, net 3,524 Income tax (benefit) expense 56 Depreciation and amortization 5,538 Stock-based compensation 5,676 Other expense (income), net 938 Change in fair value of warrants and conversion option (5,899) Other nonrecurring costs, including acquisition, transaction, and integration costs 294 Non-recurring SOX readiness costs 70 Severance expense 124 Fresh segment crop failure costs 1,567 Total Adjusted EBITDA $ (15,666) Three Months Ended June 30, 2021 Revenue Adjusted EBITDA Ingredients $ 22,724 $ (6,409) Fresh 16,906 165 Unallocated and other 62 (9,530) Total segment results $ 39,692 $ (15,774) Consolidated net loss $ (27,419) Interest expense, net 1,277 Income tax (expense) benefit — Depreciation and amortization 2,839 Stock-based compensation 709 Other expense (income), net (170) Change in fair value of warrants 1,703 Other non-recurring costs, including acquisition costs 527 Non-recurring public company readiness costs 1,955 South America seed production costs 2,805 Total Adjusted EBITDA $ (15,774) Adjustments to reconcile consolidated net loss to Adjusted EBITDA: (In Thousands USD)

Six-month segment information and non-GAAP reconciliation Adjustments to reconcile consolidated net loss to Adjusted EBITDA: (In Thousands USD) The Company defines and calculates adjusted EBITDA as consolidated net loss before net interest expense, income tax provision and depreciation and amortization, further adjusted to exclude stock-based compensation, and the impact of significant non-recurring items. Adjustments to reconcile consolidated net loss to Adjusted EBITDA: (In Thousands USD) Six Months Ended June 30, 2022 Revenue Adjusted EBITDA Ingredients $ 159,618 $ (16,040) Fresh 43,435 1,925 Unallocated and other 139 (29,083) Total segment results $ 203,192 $ (43,198) Consolidated net loss $ (44,130) Interest expense, net 9,912 Income tax (expense) benefit 17 Depreciation and amortization 10,942 Stock-based compensation 11,359 Other expense (income), net 2,254 Change in fair value of warrants and conversion options (37,640) Other nonrecurring costs, including acquisition, transaction, and integration costs 312 Non-recurring SOX readiness costs 282 Severance expense 289 Fresh segment crop failure costs 1,567 PIPE Investment transaction costs 705 Fresh segment restructuring expenses 933 Total Adjusted EBITDA $ (43,198) Six Months Ended June 30, 2021 Revenue Adjusted EBITDA Ingredients $ 36,919 $ (13,197) Fresh 34,470 (172) Unallocated and other 105 (17,252) Total segment results $ 71,494 $ (30,621) Consolidated net loss $ (49,766) Depreciation and amortization 5,430 Stock-based compensation 1,356 Other expense (income), net (388) Change in fair value of warrants and conversion options 2,719 Interest expense, net 2,535 Other nonrecurring items, including acquisition costs 527 South America seed production costs 2,805 Non-recurring public company readiness costs 4,161 Income tax expense — Total Adjusted EBITDA $ (30,621)

2022 Non-GAAP Reconciliations Adjustments to reconcile estimated 2022 Adjusted EBITDA (In Thousands USD) Consolidated net loss $ (148,000) – (153,000) Interest expense, net 23,000 Depreciation and amortization 23,000 Stock-based compensation 21,000 Other non-recurring costs 1,000 Total Adjusted EBITDA $ (80,000) – (85,000) Consolidated net loss $ (148,000) - $ (153,000) Depreciation and Amortization 23,000 23,000 Stock-Based Compensation 21,000 21,000 Changes in Working Capital (9,000) - (10,000) Other 5,000 5,000 Net cash used in operating activities $ (108,000) - $ (114,000) Payments for acquisitions of property and equipment (12,000) - (16,000) Free cash flow $ (120,000) - $ (130,000) Adjustments to reconcile estimated 2022 Free Cash Flow


