THIRD QUARTER 2022 EARNINGS PRESENTATION NOVEMBER 10, 2022 Exhibit 99.2

Disclaimers Cautionary Note Regarding Forward-Looking Statements Certain statements in this presentation may be considered “forward-looking statements” within the meaning of the “safe harbor” provisions of the United States Private Securities Litigation Reform Act of 1995. Forward-looking statements relate to future events or the Company’s future financial or operating performance. These forward-looking statements include, among other things, statements regarding: the Company’s currently expected guidance regarding certain full year 2022 and projected 2025 financial results, including consolidated revenues, gross profit, gross profit margin, revenues for its proprietary soy portfolio, segment revenues, operating expense, capital expenditures, net loss, EBITDA, Adjusted EBITDA, cash usage, and free cash flow; expectations regarding actions intended to fully fund the business, inclusive of debt repayments, to achieve the Company’s 2025 strategic and financial objectives; the sufficiency of the Company’s cash position and planned capital generating activities to fund the business in future periods; the anticipated benefits of the Company’s ATM facility, the anticipated benefits and other aspects of the Company’s strategic partnership with ADM and the revenue expected to be generated thereby; the markets expected to be served by the Company’s strategic partnership with ADM; the potential divestiture and financial impact of the Company’s Fresh business segment; financial or other information based upon or otherwise incorporating judgments or estimates relating to future performance, events or expectations; expectations regarding the Company’s hedging and other risk management strategies, including expectations about future sales and purchases that relate to the Company’s mark-to-market adjustments; the Company’s strategies and plans for growth; the Company’s, positioning, resources, capabilities, and expectations for future performance; estimates and forecasts of financial and other performance metrics; projections of market opportunity, including with respect to market opportunity expected to result from the Company’s strategic partnership with ADM; the Company’s outlook and financial and other guidance; and management’s strategy and plans for growth. In some cases, the reader can identify forward-looking statements by words such as “may,” “should,” “expect,” “intend,” “will,” “estimate,” “anticipate,” “believe,” “predict,” or similar words. Such forward-looking statements are based upon assumptions made by Benson Hill as of the date hereof and are subject to risks, uncertainties, and other factors that could cause actual results to differ materially from those expressed or implied by such forward-looking statements. Factors that may cause actual results to differ materially from current expectations include, but are not limited to, risks that the Company’s actions intended to fully fund the business, inclusive of debt repayments, to achieve the Company’s 2025 strategic and financial objectives may be insufficient to achieve such objectives; risks relating to the Company’s ability to achieve anticipated benefits of recent business combinations, which may be affected by, among other things, competition, the ability of the combined company to grow and achieve growth profitably, maintain relationships with customers and suppliers, and retain its management and key employees; the risk that the anticipated benefits and results of the Company’s strategic partnership with ADM will not be realized, including the risk that certain related milestones and performance objectives will not be achieved; the risk that the anticipated benefits of the Company’s ATM facility will not be achieved, including risks relating to the timing of effectiveness of the ATM facility and risks that the facility’s overall potential contribution to the Company may be less than anticipated; risks relating to the dilutive impact of the ATM facility; risks related to the potential divestiture of the Company’s Fresh business segment on the Company’s business relationships, operating results, stock price and business generally; the ability to generate and deploy capital, including capital from operations, capital drawn from the Company’s debt facility, capital expected to be raised through the Company’s ATM facility, and capital expected to result from the Company’s strategic partnership with ADM, in a manner that furthers the Company’s growth strategy, as well as the general ability to execute the Company’s business plans; industry conditions, including fluctuations in supply, demand and prices for agricultural commodities; the effects of weather conditions and the outbreak of crop disease on our business; global and regional economic, agricultural, financial and commodities market, political, social and health conditions; the effectiveness of our risk management strategies; the transition to becoming a public company; and other risks and uncertainties set forth in the sections entitled “Risk Factors” and “Cautionary Note Regarding Forward-Looking Statements” in the Company’s filings with the Securities and Exchange Commission (“SEC”), which are available on the SEC’s website at www.sec.gov. Forward-looking statements are also subject to the risks and other issues described above under “Use of Non-GAAP Financial Measures,” which could cause actual results to differ materially from current expectations included in the Company’s forward-looking statements included in this presentation. Nothing in this presentation should be regarded as a representation by any person that the forward-looking statements set forth herein will be achieved or that any of the contemplated results of such forward looking statements will be achieved, including without limitation any expectations about our operational and financial performance or achievements through and including 2025. There may be additional risks about which the Company is presently unaware or that the Company currently believes are immaterial that could also cause actual results to differ from those contained in the forward-looking statements. The reader should not place undue reliance on forward- looking statements, which speak only as of the date they are made. The Company anticipates that subsequent events and developments will cause its assessments to change. However, while the Company may elect to update these forward-looking statements at some point in the future, it expressly disclaims any duty to update these forward-looking statements, except as otherwise required by law. Use of Non-GAAP Financial Measures In this presentation, the Company includes non-GAAP performance measures. The Company uses these non-GAAP financial measures to facilitate management's financial and operational decision-making, including evaluation of the Company’s historical operating results. The Company’s management believes these non-GAAP measures are useful in evaluating the Company’s operating performance and are similar measures reported by publicly listed U.S. competitors, and regularly used by securities analysts, institutional investors, and other interested parties in analyzing operating performance and prospects. These non-GAAP financial measures reflect an additional way of viewing aspects of the Company’s operations that, when viewed with GAAP results and the reconciliations to corresponding GAAP financial measures, may provide a more complete understanding of factors and trends affecting the Company’s business. By providing these non-GAAP measures, the Company’s management intends to provide investors with a meaningful, consistent comparison of the Company’s performance for the periods presented. These non-GAAP financial measures should be considered supplemental to, and not a substitute for, financial information prepared in accordance with GAAP. The Company’s definition of these non-GAAP measures may differ from similarly titled measures of performance used by other companies in other industries or within the same industry. Because non-GAAP financial measures exclude the effect of items that will increase or decrease the Company’s reported results of operations, management strongly encourages investors to review the Company’s consolidated financial statements and publicly filed reports in their entirety. A reconciliation of the non-GAAP financial measures to the most directly comparable GAAP financial measures and the Company’s definition of these non-GAAP measures is included in the tables accompanying this presentation.
Summary • Consolidated third quarter revenue growth of 307 percent to $130 million driven by strong Ingredients segment performance o Proprietary soy revenues increased 300 percent to $26 million • Raised 2022 consolidated revenue and gross profit guidance o Revenues of $430 million to $455 million o Gross profit of $14 million to $17 million • Planning for 2023 underway o Harvest of the 2022 proprietary soy crop is progressing as expected o Strategic partnership with ADM is underway with a joint farmer recruitment program in the vicinity of the Decatur, Illinois, facility as well as Benson Hill’s recruitment efforts to support our soy crush facilities • Management took actions intended to fully fund the business to achieve positive EBITDA and free cash flow positive in 2025
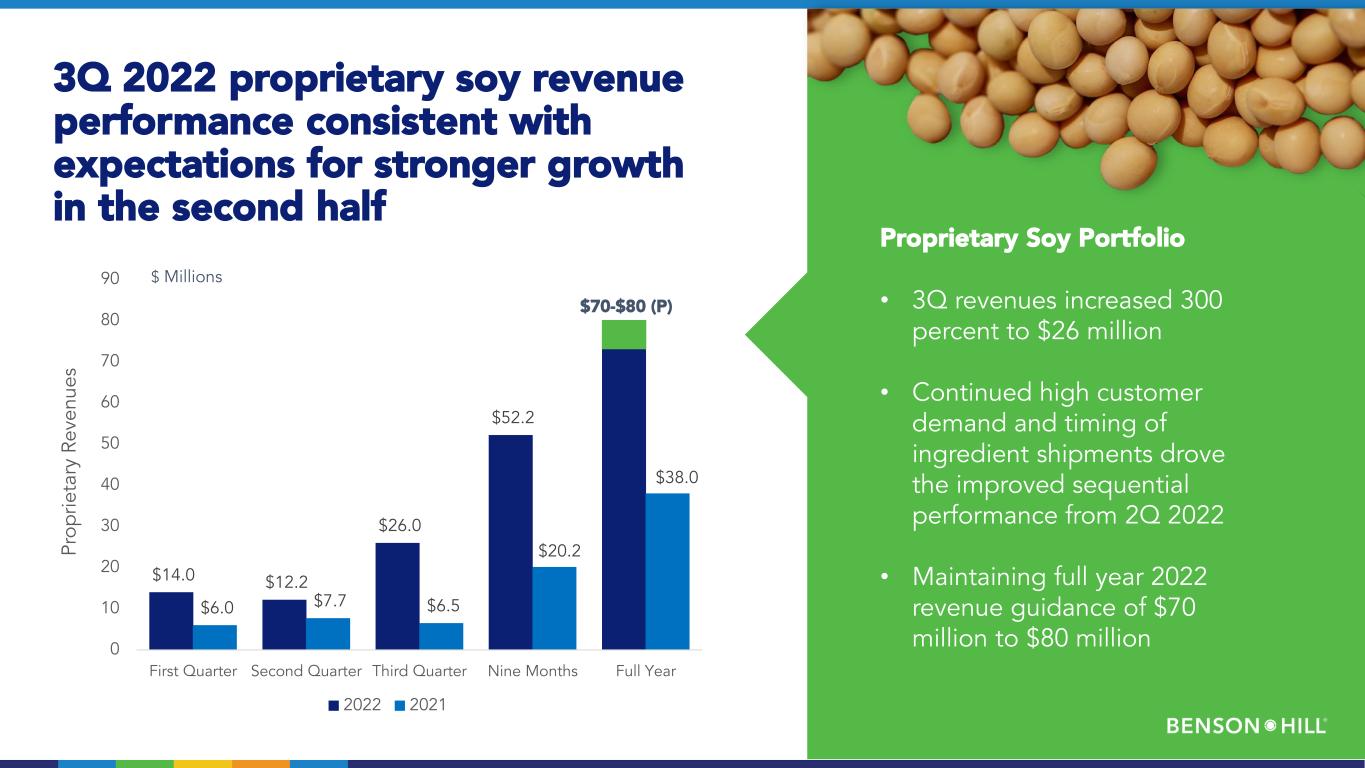
3Q 2022 proprietary soy revenue performance consistent with expectations for stronger growth in the second half Proprietary Soy Portfolio • 3Q revenues increased 300 percent to $26 million • Continued high customer demand and timing of ingredient shipments drove the improved sequential performance from 2Q 2022 • Maintaining full year 2022 revenue guidance of $70 million to $80 million $14.0 $12.2 $26.0 $52.2 $6.0 $7.7 $6.5 $20.2 $38.0 0 10 20 30 40 50 60 70 80 90 First Quarter Second Quarter Third Quarter Nine Months Full Year Pr op rie ta ry R ev en ue s 2022 2021 $70-$80 (P) $ Millions
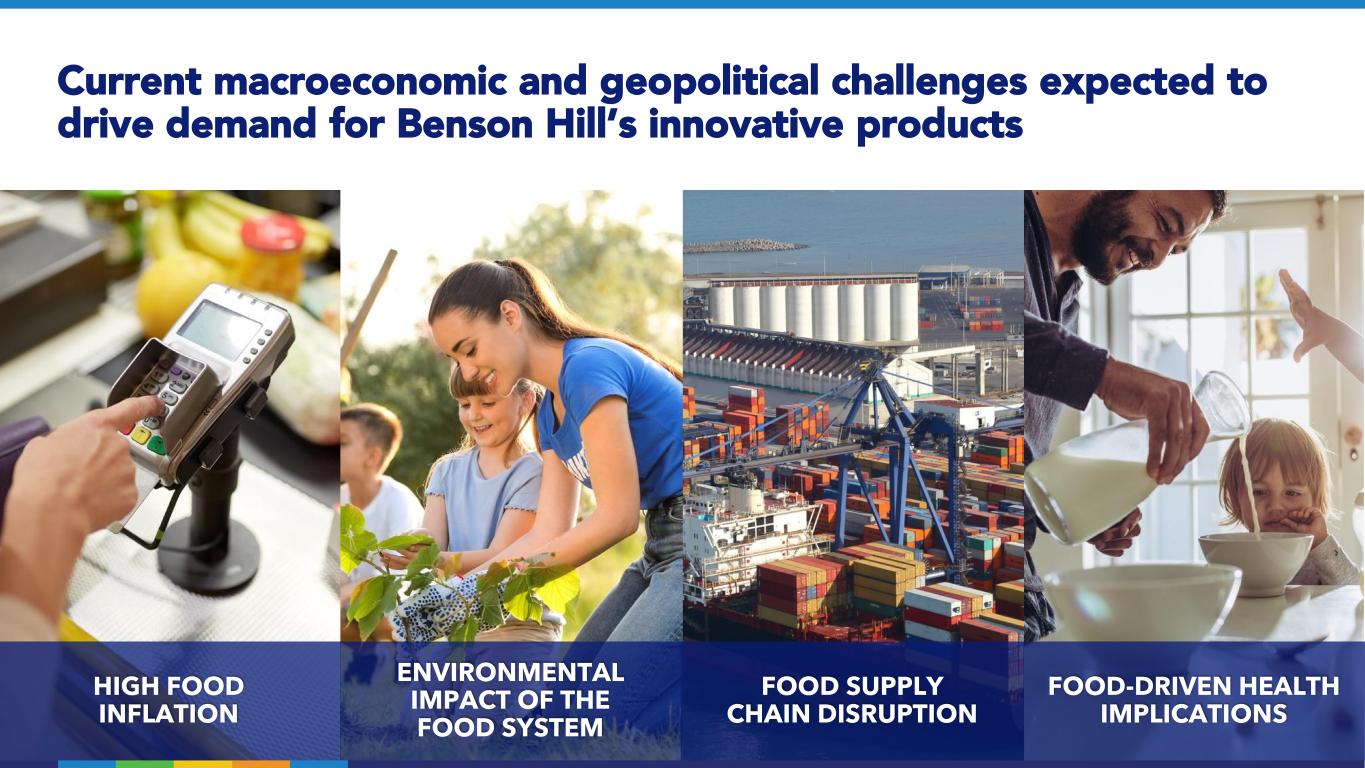
Current macroeconomic and geopolitical challenges expected to drive demand for Benson Hill’s innovative products HIGH FOOD INFLATION ENVIRONMENTAL IMPACT OF THE FOOD SYSTEM FOOD SUPPLY CHAIN DISRUPTION FOOD-DRIVEN HEALTH IMPLICATIONS
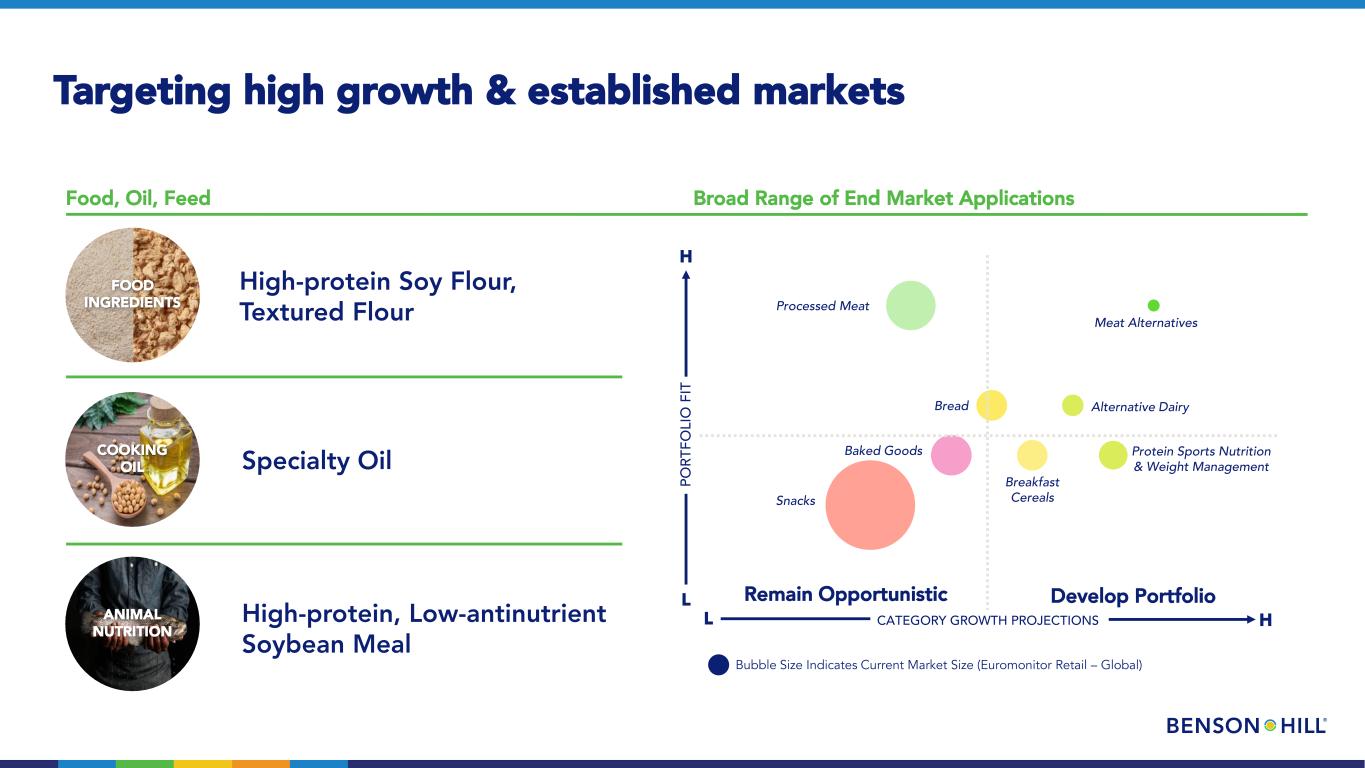
Targeting high growth & established markets High-protein Soy Flour, Textured Flour Food, Oil, Feed Specialty Oil High-protein, Low-antinutrient Soybean Meal FOOD INGREDIENTS COOKING OIL ANIMAL NUTRITION Broad Range of End Market Applications PO RT FO LI O F IT CATEGORY GROWTH PROJECTIONS Bubble Size Indicates Current Market Size (Euromonitor Retail – Global) Develop Portfolio Alternative Dairy Processed Meat Bread Protein Sports Nutrition & Weight Management Breakfast CerealsSnacks Baked Goods Remain Opportunistic L H L H Meat Alternatives
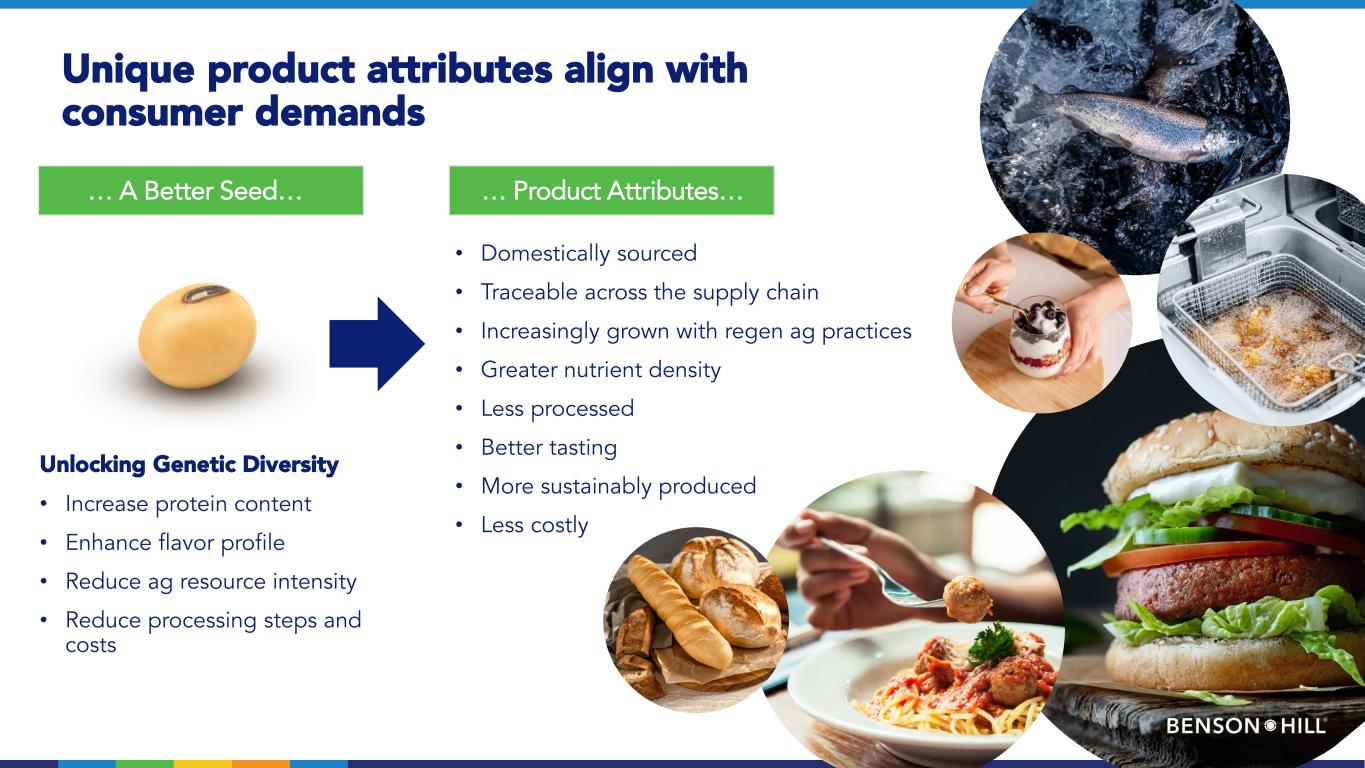
Unique product attributes align with consumer demands • Domestically sourced • Traceable across the supply chain • Increasingly grown with regen ag practices • Greater nutrient density • Less processed • Better tasting • More sustainably produced • Less costly Unlocking Genetic Diversity • Increase protein content • Enhance flavor profile • Reduce ag resource intensity • Reduce processing steps and costs … A Better Seed… … Product Attributes…
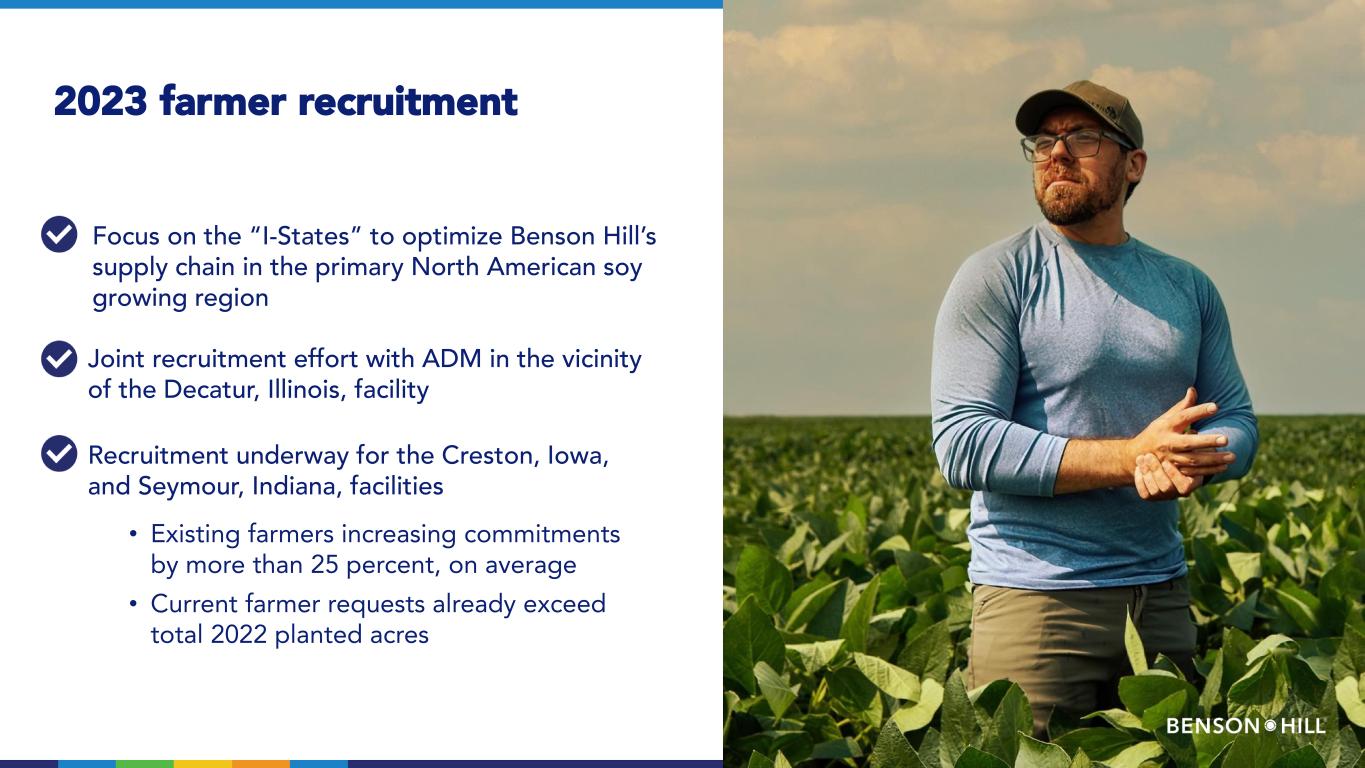
Focus on the “I-States” to optimize Benson Hill’s supply chain in the primary North American soy growing region 2023 farmer recruitment Joint recruitment effort with ADM in the vicinity of the Decatur, Illinois, facility Recruitment underway for the Creston, Iowa, and Seymour, Indiana, facilities • Existing farmers increasing commitments by more than 25 percent, on average • Current farmer requests already exceed total 2022 planted acres
Benson Hill and ADM entered a long-term collaboration to scale Ultra-High Protein soy ingredients in North America (1) Access to ADM’s current and planned protein processing capacity for food ingredients Joint farmer recruitment program Leverage ADM’s product application and formulation expertise Focus: Alternative meat, meat extension, alternative dairy, specialized nutrition • ADM will process and commercialize a portfolio of proprietary ingredients in North America derived from Benson Hill Ultra-High Protein (UHP) soybeans that are non-GMO, traceable and sustainable, with enhanced functionality • Leverage ADM’s expertise from origination to sales to scale and co-brand soy protein concentrates, textured soy proteins and soy isolates derived from Benson Hill UHP soybeans • Benson Hill maintains its existing go-to-market independence for proprietary soy flour, meal and oil products in food, as well as animal feed, including aquaculture Strategic Collaboration
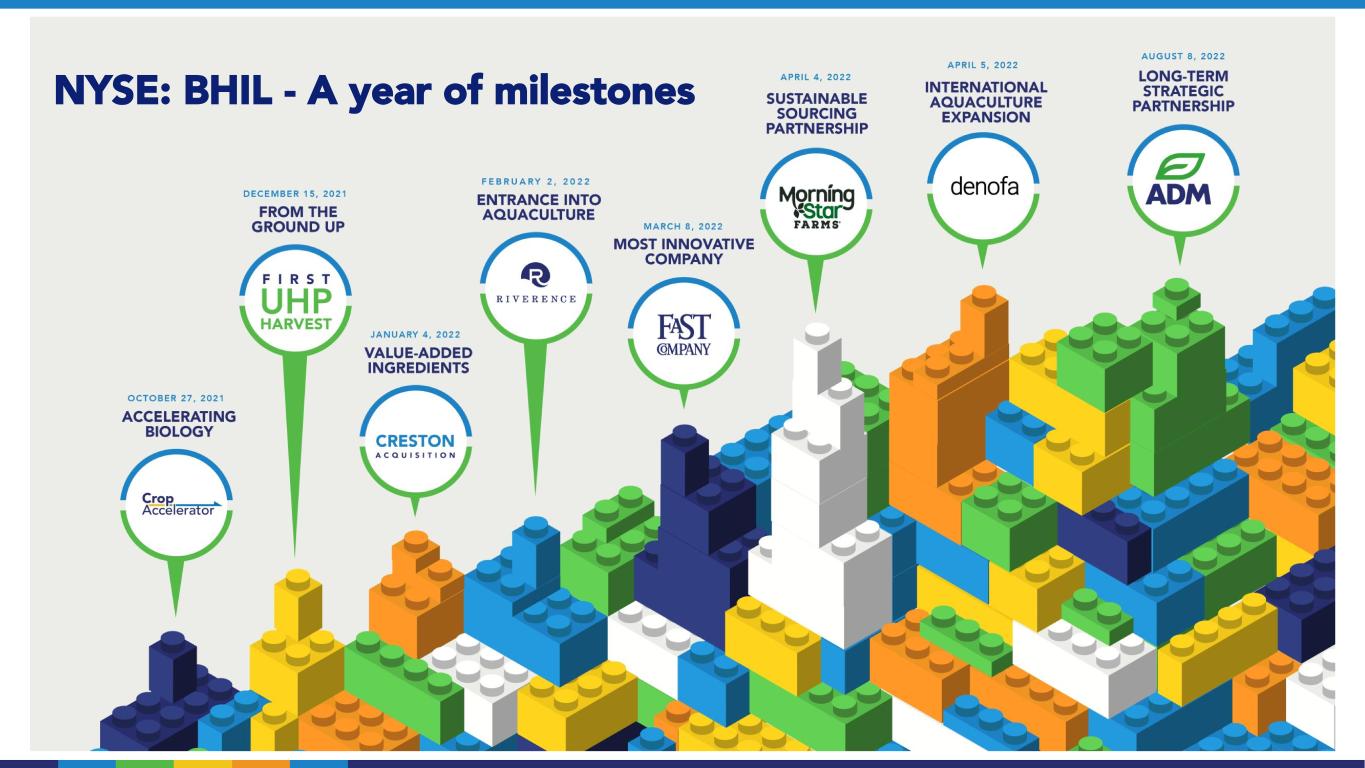
NYSE: BHIL - A year of milestones
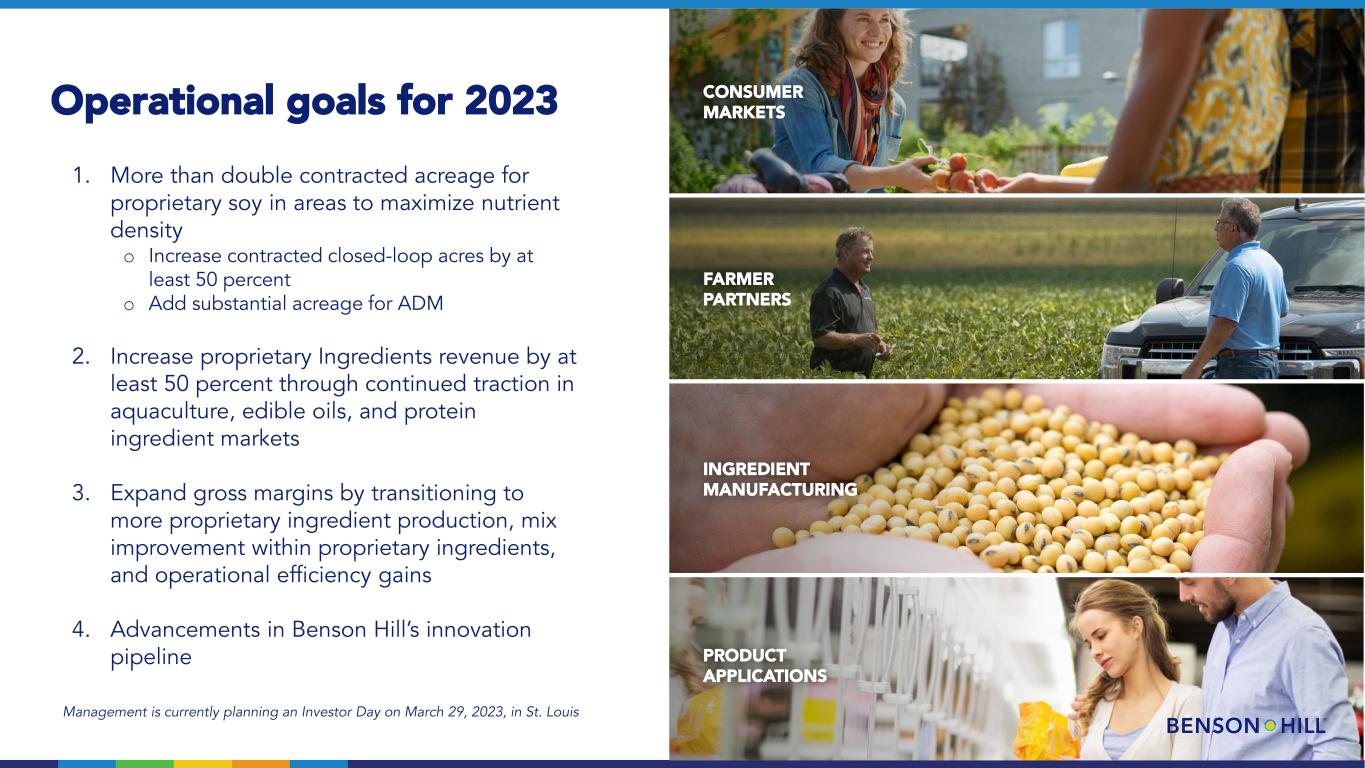
FARMER PARTNERS CONSUMER MARKETS INGREDIENT MANUFACTURING PRODUCT APPLICATIONS Operational goals for 2023 1. More than double contracted acreage for proprietary soy in areas to maximize nutrient density o Increase contracted closed-loop acres by at least 50 percent o Add substantial acreage for ADM 2. Increase proprietary Ingredients revenue by at least 50 percent through continued traction in aquaculture, edible oils, and protein ingredient markets 3. Expand gross margins by transitioning to more proprietary ingredient production, mix improvement within proprietary ingredients, and operational efficiency gains 4. Advancements in Benson Hill’s innovation pipeline Management is currently planning an Investor Day on March 29, 2023, in St. Louis
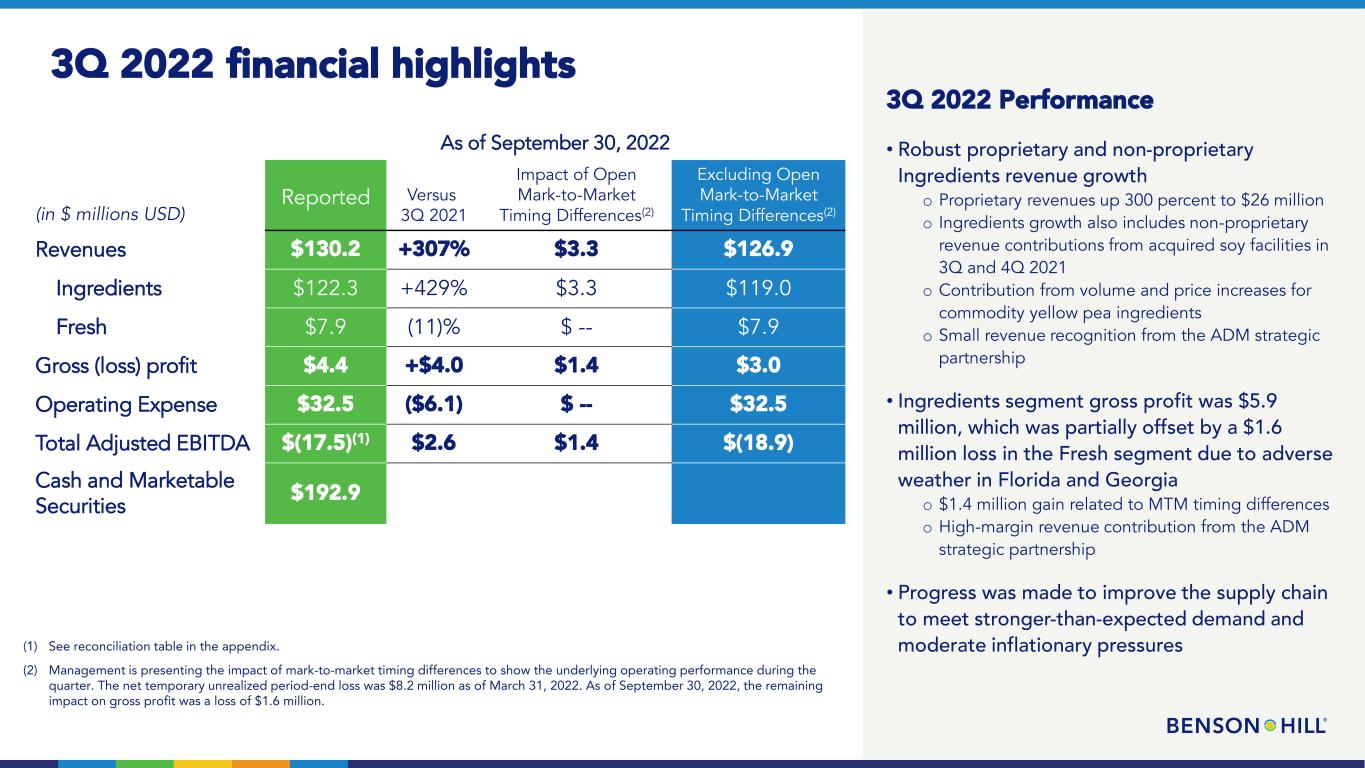
3Q 2022 financial highlights As of September 30, 2022 (in $ millions USD) Reported Versus 3Q 2021 Impact of Open Mark-to-Market Timing Differences(2) Excluding Open Mark-to-Market Timing Differences(2) Revenues $130.2 +307% $3.3 $126.9 Ingredients $122.3 +429% $3.3 $119.0 Fresh $7.9 (11)% $ -- $7.9 Gross (loss) profit $4.4 +$4.0 $1.4 $3.0 Operating Expense $32.5 ($6.1) $ -- $32.5 Total Adjusted EBITDA $(17.5)(1) $2.6 $1.4 $(18.9) Cash and Marketable Securities $192.9 (1) See reconciliation table in the appendix. (2) Management is presenting the impact of mark-to-market timing differences to show the underlying operating performance during the quarter. The net temporary unrealized period-end loss was $8.2 million as of March 31, 2022. As of September 30, 2022, the remaining impact on gross profit was a loss of $1.6 million. 3Q 2022 Performance • Robust proprietary and non-proprietary Ingredients revenue growth o Proprietary revenues up 300 percent to $26 million o Ingredients growth also includes non-proprietary revenue contributions from acquired soy facilities in 3Q and 4Q 2021 o Contribution from volume and price increases for commodity yellow pea ingredients o Small revenue recognition from the ADM strategic partnership • Ingredients segment gross profit was $5.9 million, which was partially offset by a $1.6 million loss in the Fresh segment due to adverse weather in Florida and Georgia o $1.4 million gain related to MTM timing differences o High-margin revenue contribution from the ADM strategic partnership • Progress was made to improve the supply chain to meet stronger-than-expected demand and moderate inflationary pressures
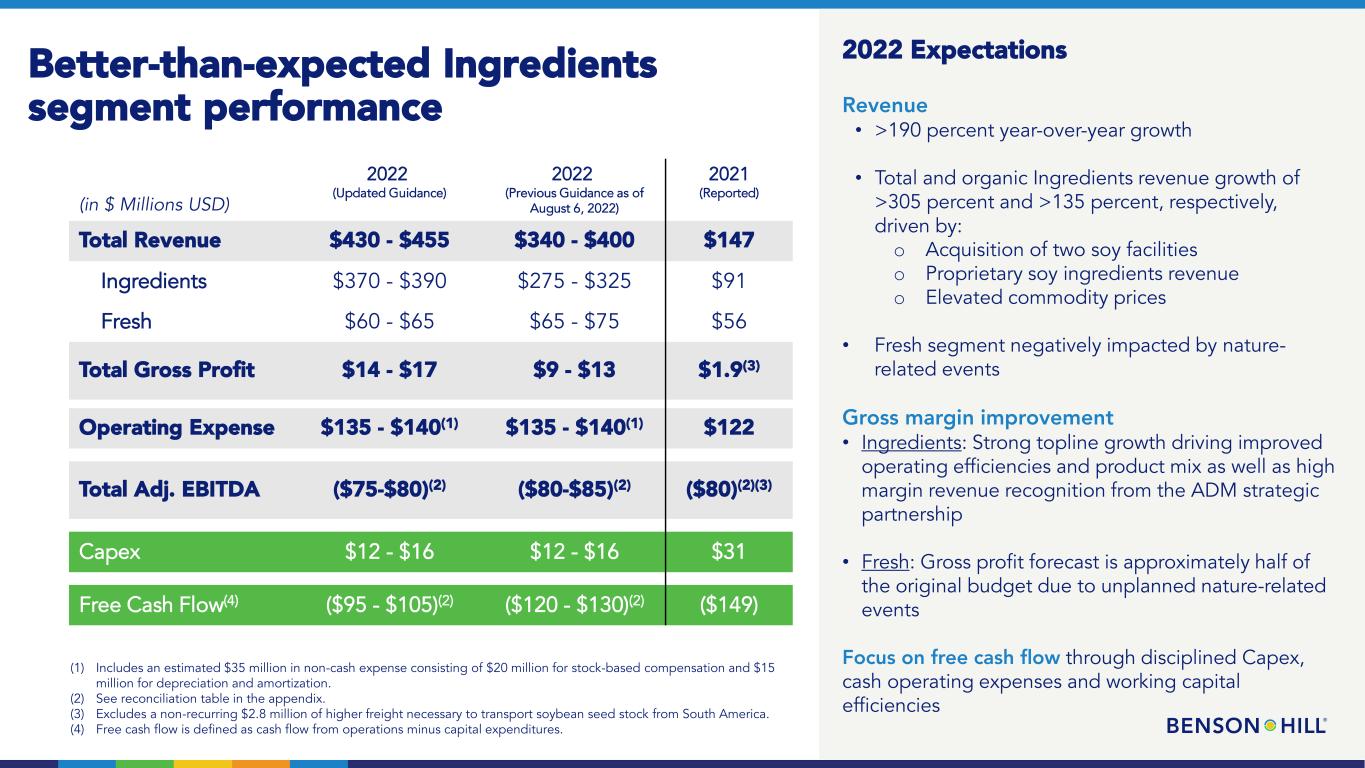
Better-than-expected Ingredients segment performance (in $ Millions USD) 2022 (Updated Guidance) 2022 (Previous Guidance as of August 6, 2022) 2021 (Reported) Total Revenue $430 - $455 $340 - $400 $147 Ingredients $370 - $390 $275 - $325 $91 Fresh $60 - $65 $65 - $75 $56 Total Gross Profit $14 - $17 $9 - $13 $1.9(3) Operating Expense $135 - $140(1) $135 - $140(1) $122 Total Adj. EBITDA ($75-$80)(2) ($80-$85)(2) ($80)(2)(3) Capex $12 - $16 $12 - $16 $31 Free Cash Flow(4) ($95 - $105)(2) ($120 - $130)(2) ($149) 2022 Expectations Revenue • >190 percent year-over-year growth • Total and organic Ingredients revenue growth of >305 percent and >135 percent, respectively, driven by: o Acquisition of two soy facilities o Proprietary soy ingredients revenue o Elevated commodity prices • Fresh segment negatively impacted by nature- related events Gross margin improvement • Ingredients: Strong topline growth driving improved operating efficiencies and product mix as well as high margin revenue recognition from the ADM strategic partnership • Fresh: Gross profit forecast is approximately half of the original budget due to unplanned nature-related events Focus on free cash flow through disciplined Capex, cash operating expenses and working capital efficiencies (1) Includes an estimated $35 million in non-cash expense consisting of $20 million for stock-based compensation and $15 million for depreciation and amortization. (2) See reconciliation table in the appendix. (3) Excludes a non-recurring $2.8 million of higher freight necessary to transport soybean seed stock from South America. (4) Free cash flow is defined as cash flow from operations minus capital expenditures.
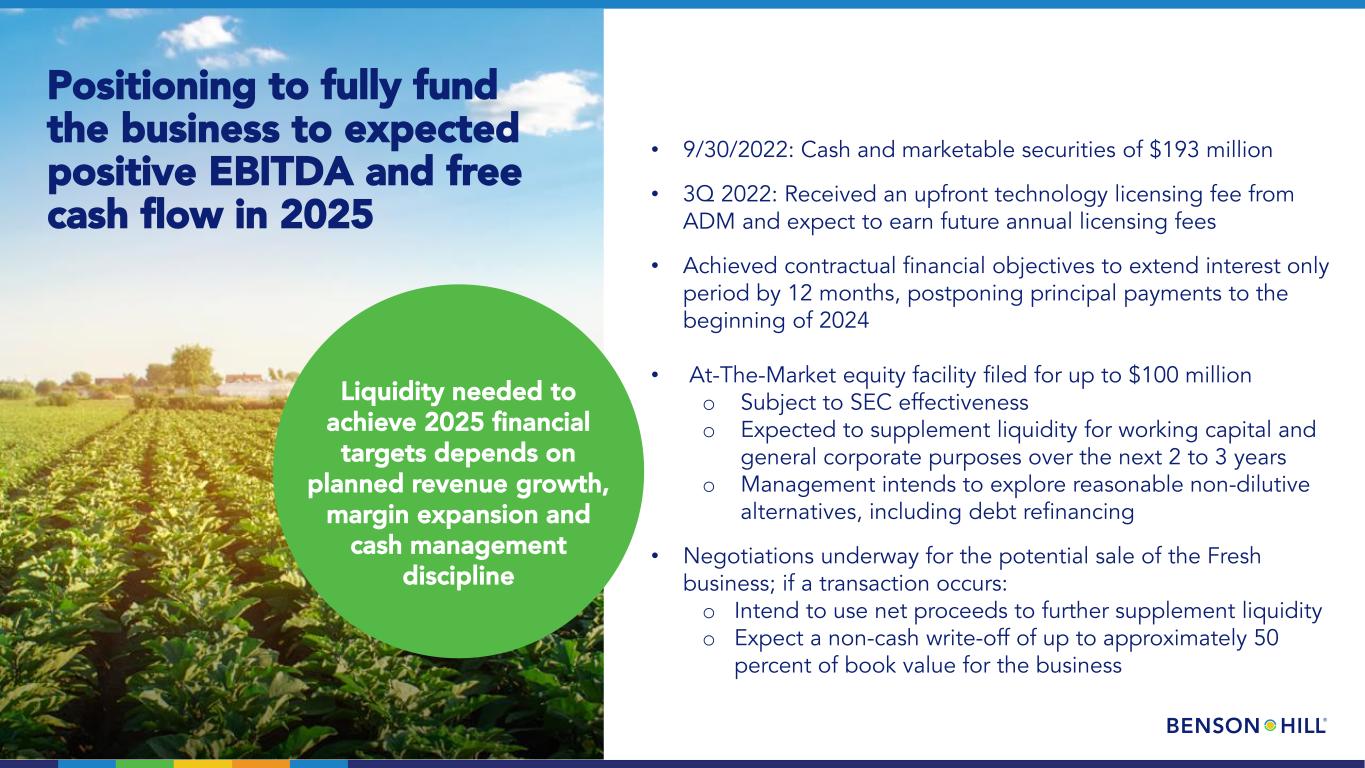
Positioning to fully fund the business to expected positive EBITDA and free cash flow in 2025 (1) Liquidity needed to achieve 2025 financial targets depends on planned revenue growth, margin expansion and cash management discipline • 9/30/2022: Cash and marketable securities of $193 million • 3Q 2022: Received an upfront technology licensing fee from ADM and expect to earn future annual licensing fees • Achieved contractual financial objectives to extend interest only period by 12 months, postponing principal payments to the beginning of 2024 • At-The-Market equity facility filed for up to $100 million o Subject to SEC effectiveness o Expected to supplement liquidity for working capital and general corporate purposes over the next 2 to 3 years o Management intends to explore reasonable non-dilutive alternatives, including debt refinancing • Negotiations underway for the potential sale of the Fresh business; if a transaction occurs: o Intend to use net proceeds to further supplement liquidity o Expect a non-cash write-off of up to approximately 50 percent of book value for the business
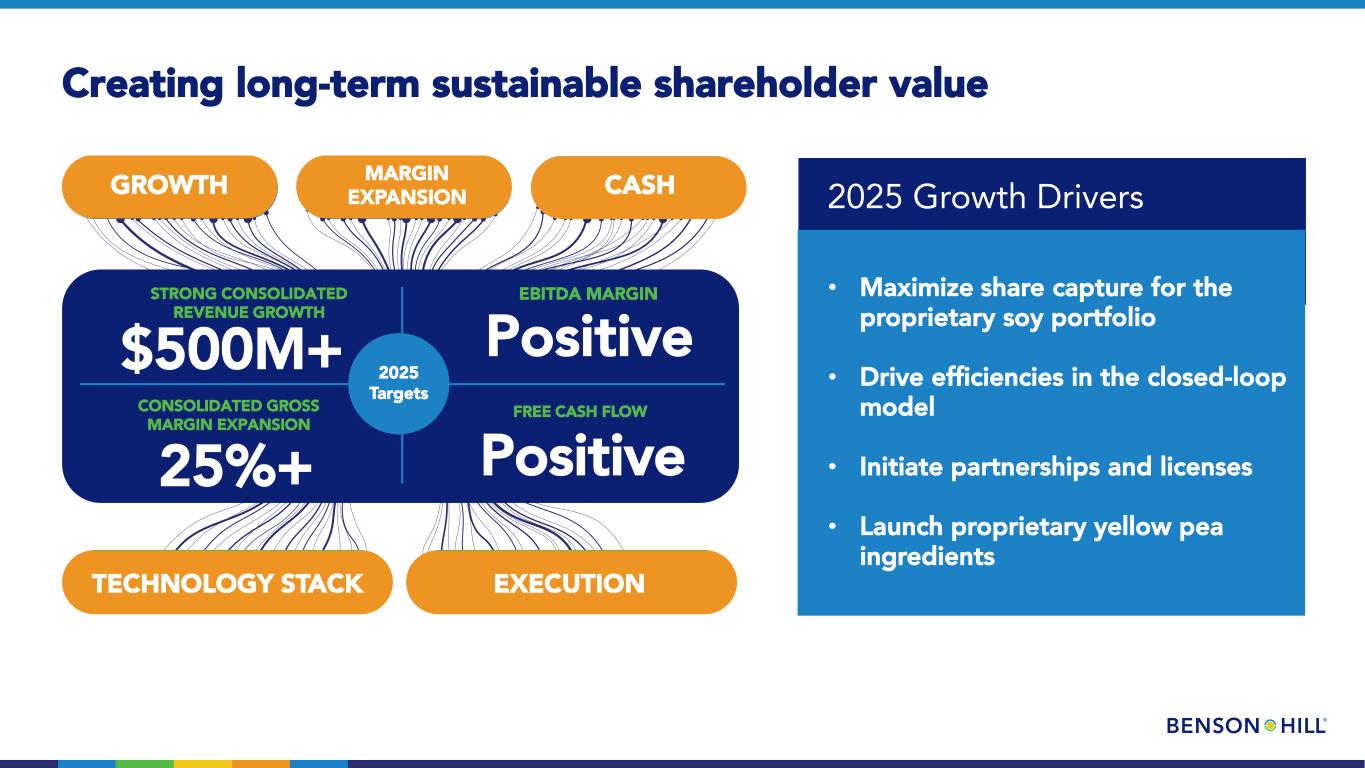
(1) MARGIN EXPANSION TECHNOLOGY STACK EXECUTION Creating long-term sustainable shareholder value CASHI IGROWTH STRONG CONSOLIDATED REVENUE GROWTH CONSOLIDATED GROSS MARGIN EXPANSION EBITDA MARGIN FREE CASH FLOW $500M+ 25%+ Positive Positive 2025 Targets 2025 Growth Drivers • Maximize share capture for the proprietary soy portfolio • Drive efficiencies in the closed-loop model • Initiate partnerships and licenses • Launch proprietary yellow pea ingredients
OUR TECHNOLOGY APPENDIX
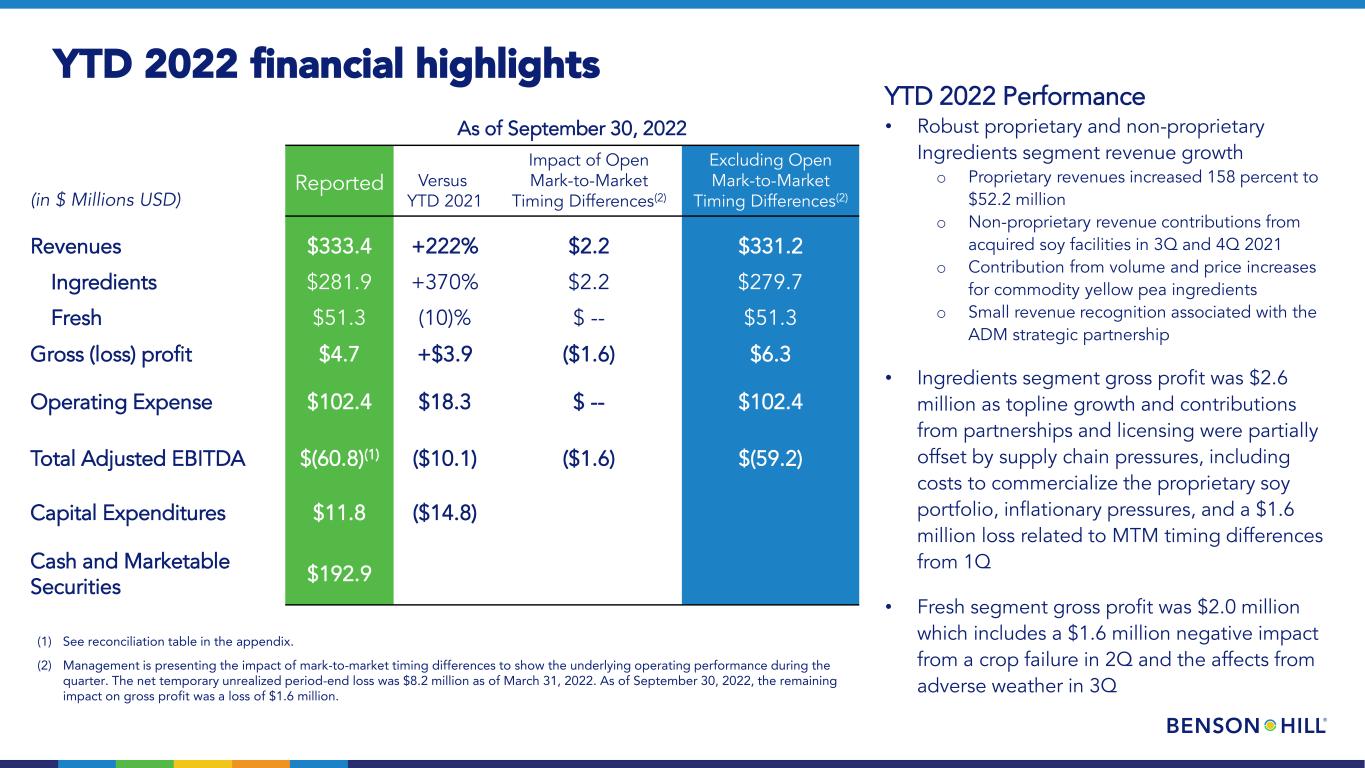
YTD 2022 financial highlights As of September 30, 2022 (in $ Millions USD) Reported Versus YTD 2021 Impact of Open Mark-to-Market Timing Differences(2) Excluding Open Mark-to-Market Timing Differences(2) Revenues $333.4 +222% $2.2 $331.2 Ingredients $281.9 +370% $2.2 $279.7 Fresh $51.3 (10)% $ -- $51.3 Gross (loss) profit $4.7 +$3.9 ($1.6) $6.3 Operating Expense $102.4 $18.3 $ -- $102.4 Total Adjusted EBITDA $(60.8)(1) ($10.1) ($1.6) $(59.2) Capital Expenditures $11.8 ($14.8) Cash and Marketable Securities $192.9 (1) See reconciliation table in the appendix. (2) Management is presenting the impact of mark-to-market timing differences to show the underlying operating performance during the quarter. The net temporary unrealized period-end loss was $8.2 million as of March 31, 2022. As of September 30, 2022, the remaining impact on gross profit was a loss of $1.6 million. YTD 2022 Performance • Robust proprietary and non-proprietary Ingredients segment revenue growth o Proprietary revenues increased 158 percent to $52.2 million o Non-proprietary revenue contributions from acquired soy facilities in 3Q and 4Q 2021 o Contribution from volume and price increases for commodity yellow pea ingredients o Small revenue recognition associated with the ADM strategic partnership • Ingredients segment gross profit was $2.6 million as topline growth and contributions from partnerships and licensing were partially offset by supply chain pressures, including costs to commercialize the proprietary soy portfolio, inflationary pressures, and a $1.6 million loss related to MTM timing differences from 1Q • Fresh segment gross profit was $2.0 million which includes a $1.6 million negative impact from a crop failure in 2Q and the affects from adverse weather in 3Q
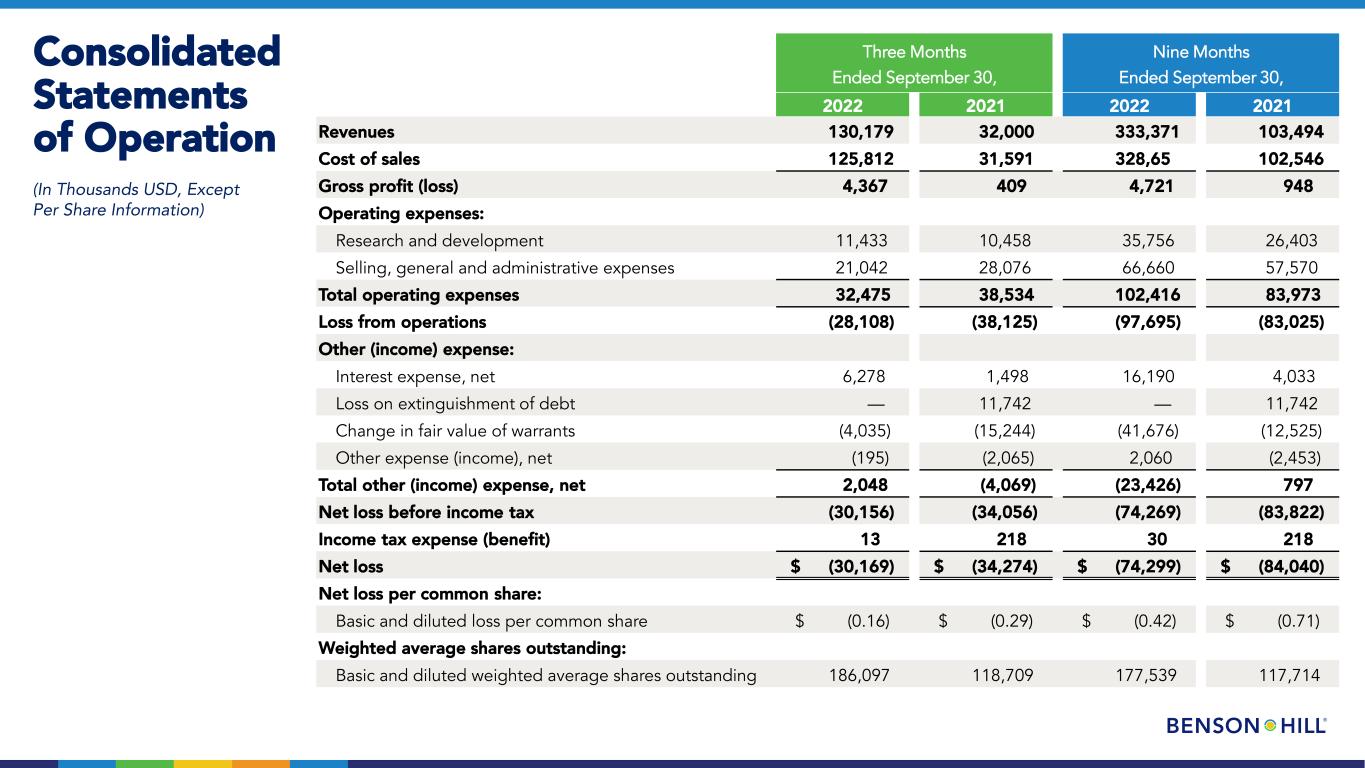
Consolidated Statements of Operation (In Thousands USD, Except Per Share Information) Three Months Ended September 30, Nine Months Ended September 30, 2022 2021 2022 2021 Revenues 130,179 32,000 333,371 103,494 Cost of sales 125,812 31,591 328,65 102,546 Gross profit (loss) 4,367 409 4,721 948 Operating expenses: Research and development 11,433 10,458 35,756 26,403 Selling, general and administrative expenses 21,042 28,076 66,660 57,570 Total operating expenses 32,475 38,534 102,416 83,973 Loss from operations (28,108) (38,125) (97,695) (83,025) Other (income) expense: Interest expense, net 6,278 1,498 16,190 4,033 Loss on extinguishment of debt — 11,742 — 11,742 Change in fair value of warrants (4,035) (15,244) (41,676) (12,525) Other expense (income), net (195) (2,065) 2,060 (2,453) Total other (income) expense, net 2,048 (4,069) (23,426) 797 Net loss before income tax (30,156) (34,056) (74,269) (83,822) Income tax expense (benefit) 13 218 30 218 Net loss $ (30,169) $ (34,274) $ (74,299) $ (84,040) Net loss per common share: Basic and diluted loss per common share $ (0.16) $ (0.29) $ (0.42) $ (0.71) Weighted average shares outstanding: Basic and diluted weighted average shares outstanding 186,097 118,709 177,539 117,714
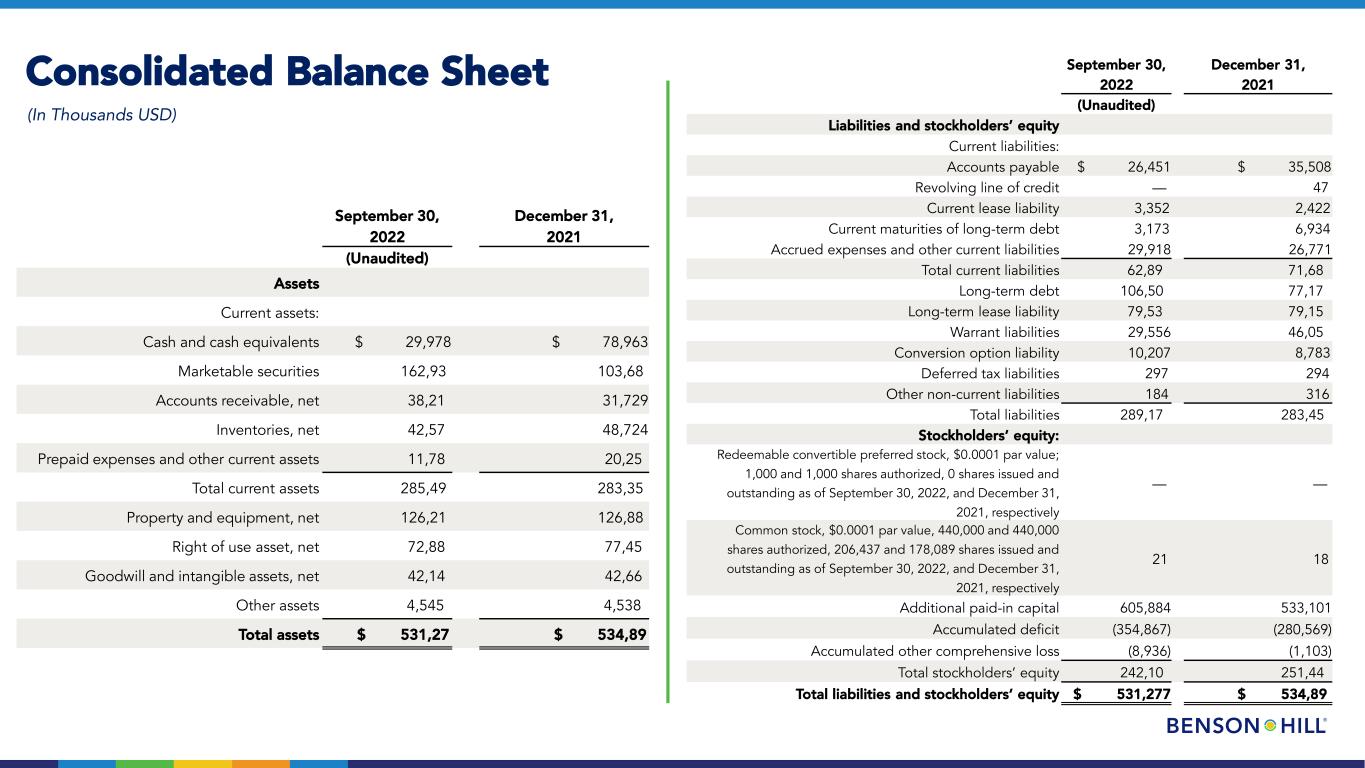
Consolidated Balance Sheet (In Thousands USD) September 30, December 31, 2022 2021 (Unaudited) Assets Current assets: Cash and cash equivalents $ 29,978 $ 78,963 Marketable securities 162,93 103,68 Accounts receivable, net 38,21 31,729 Inventories, net 42,57 48,724 Prepaid expenses and other current assets 11,78 20,25 Total current assets 285,49 283,35 Property and equipment, net 126,21 126,88 Right of use asset, net 72,88 77,45 Goodwill and intangible assets, net 42,14 42,66 Other assets 4,545 4,538 Total assets $ 531,27 $ 534,89 September 30, December 31, 2022 2021 (Unaudited) Liabilities and stockholders’ equity Current liabilities: Accounts payable $ 26,451 $ 35,508 Revolving line of credit — 47 Current lease liability 3,352 2,422 Current maturities of long-term debt 3,173 6,934 Accrued expenses and other current liabilities 29,918 26,771 Total current liabilities 62,89 71,68 Long-term debt 106,50 77,17 Long-term lease liability 79,53 79,15 Warrant liabilities 29,556 46,05 Conversion option liability 10,207 8,783 Deferred tax liabilities 297 294 Other non-current liabilities 184 316 Total liabilities 289,17 283,45 Stockholders’ equity: Redeemable convertible preferred stock, $0.0001 par value; 1,000 and 1,000 shares authorized, 0 shares issued and outstanding as of September 30, 2022, and December 31, 2021, respectively — — Common stock, $0.0001 par value, 440,000 and 440,000 shares authorized, 206,437 and 178,089 shares issued and outstanding as of September 30, 2022, and December 31, 2021, respectively 21 18 Additional paid-in capital 605,884 533,101 Accumulated deficit (354,867) (280,569) Accumulated other comprehensive loss (8,936) (1,103) Total stockholders’ equity 242,10 251,44 Total liabilities and stockholders’ equity $ 531,277 $ 534,89

Consolidated Statement of Cash Flows (In Thousands USD) Nine Months Ended September 30, 2022 2021 Operating activities Net loss $ (74,299) $ (84,040) Adjustments to reconcile net loss to net cash used in operating activities: Depreciation and amortization 16,504 8,460 Stock-based compensation expense 15,771 2,769 Bad debt expense 724 184 Change in fair value of warrants and conversion option (41,676) (12,525) Accretion and amortization related to financing activities 8,481 1,329 Loss on extinguishment of debt — 11,742 Other 6,312 1,766 Changes in operating assets and liabilities: Accounts receivable (7,208) 2,492 Inventories 6,441 (5,450) Prepaid expenses and other current assets 8,052 (7,567) Accounts payable (6,093) 3,917 Accrued expenses 2,604 3,340 Net cash used in operating activities (64,387) (73,583) Investing activities Purchases of marketable securities (350,333) (100,278) Proceeds from maturities of marketable securities 109,514 2,155 Proceeds from sales of marketable securities 170,217 198,195 Payments for acquisitions of property and equipment (11,835) (26,603) Payment made in connection with business acquisitions (1,044) (10,853) Net cash (used in) provided by investing activities (83,481) 62,616 Nine Months Ended September 30, 2022 2021 Financing activities Net contributions from Merger and PIPE financing, net of transaction costs (of $3,761) 80,825 285,378 Payments for extinguishment of debt — (43,082) Principal payments on debt (6,736) (3,917) Proceeds from issuance of debt 24,040 19,816 Borrowing under revolving line of credit 18,970 20,464 Repayments under revolving line of credit (19,017) (20,464) Repayments of financing lease obligations (1,103) (600) Payment of deferred offering costs — — Net Settlement for withholding taxes upon delivery of equity-based awards — — Proceeds from the exercise of stock options and warrants 1,950 635 Net cash provided by financing activities 98,929 258,230 Effect of exchange rate changes on cash (46) 30 Net (decrease) increase in cash and cash equivalents (48,985) 247,293 Cash and cash equivalents, beginning of period 78,963 9,743 Cash and cash equivalents, end of period $ 29,978 $ 257,036 Supplemental disclosure of cash flow information Cash paid for taxes $ 1 $ 30 Cash paid for interest $ 9,864 $ 4,782 Supplemental disclosure of non-cash activities Issuance of stock warrants $ — $ 4,551 Conversion of warrants upon Merger $ — $ 4,576 Warrants acquired in Merger $ — $ 50,850 Merger transaction costs included in accrued expenses and other current liabilities $ — $ 4,231 Business acquisition purchase price included in accrued expense and other current liabilities $ — $ 3,714 Purchases of property and equipment included in accounts payable and accrued expenses and other current liabilities $ 2,710 $ 4,123 Purchases of inventory included in accounts payable, accrued expenses and other current liabilities $ 292 $ — Financing leases commencing in the period $ 806 $ 735
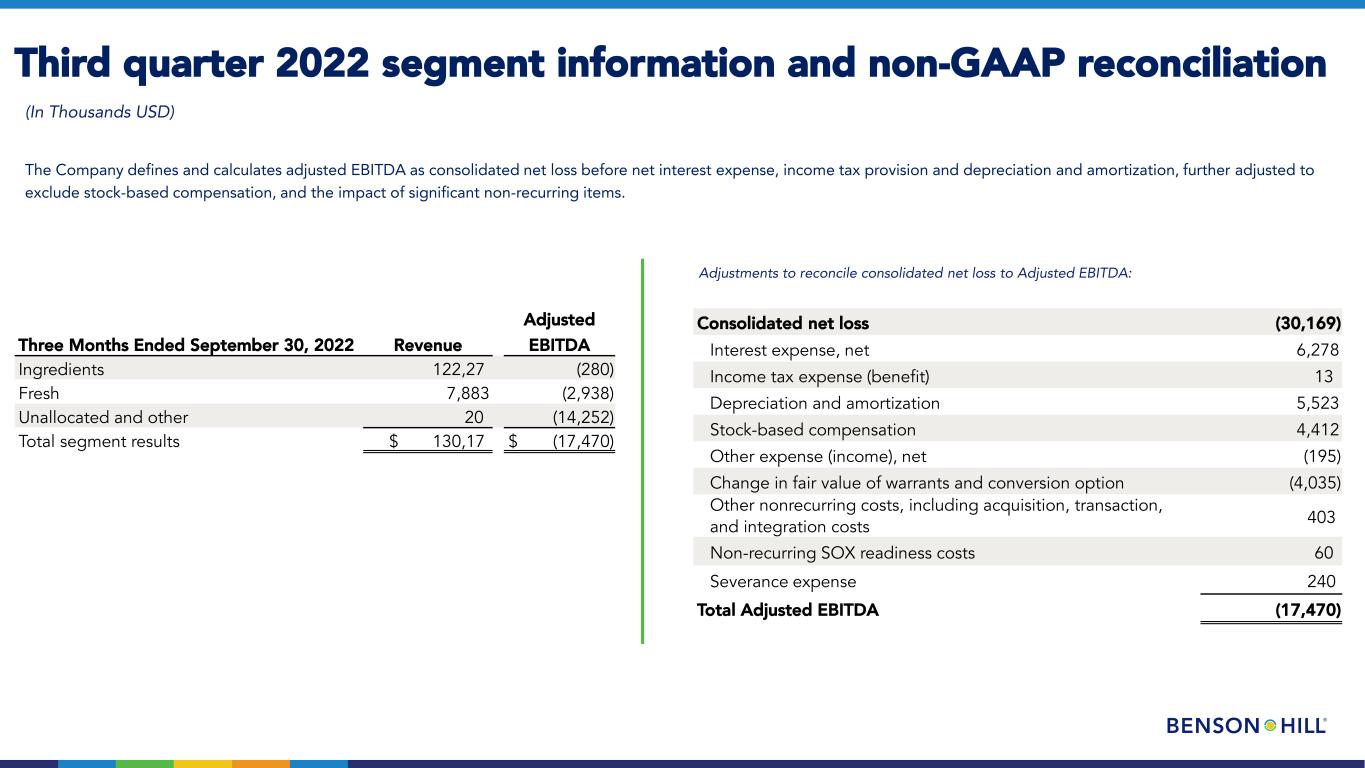
Third quarter 2022 segment information and non-GAAP reconciliation (In Thousands USD) The Company defines and calculates adjusted EBITDA as consolidated net loss before net interest expense, income tax provision and depreciation and amortization, further adjusted to exclude stock-based compensation, and the impact of significant non-recurring items. Adjustments to reconcile consolidated net loss to Adjusted EBITDA: Three Months Ended September 30, 2022 Revenue Adjusted EBITDA Ingredients 122,27 (280) Fresh 7,883 (2,938) Unallocated and other 20 (14,252) Total segment results $ 130,17 $ (17,470) Consolidated net loss (30,169) Interest expense, net 6,278 Income tax expense (benefit) 13 Depreciation and amortization 5,523 Stock-based compensation 4,412 Other expense (income), net (195) Change in fair value of warrants and conversion option (4,035) Other nonrecurring costs, including acquisition, transaction, and integration costs 403 Non-recurring SOX readiness costs 60 Severance expense 240 Total Adjusted EBITDA (17,470)
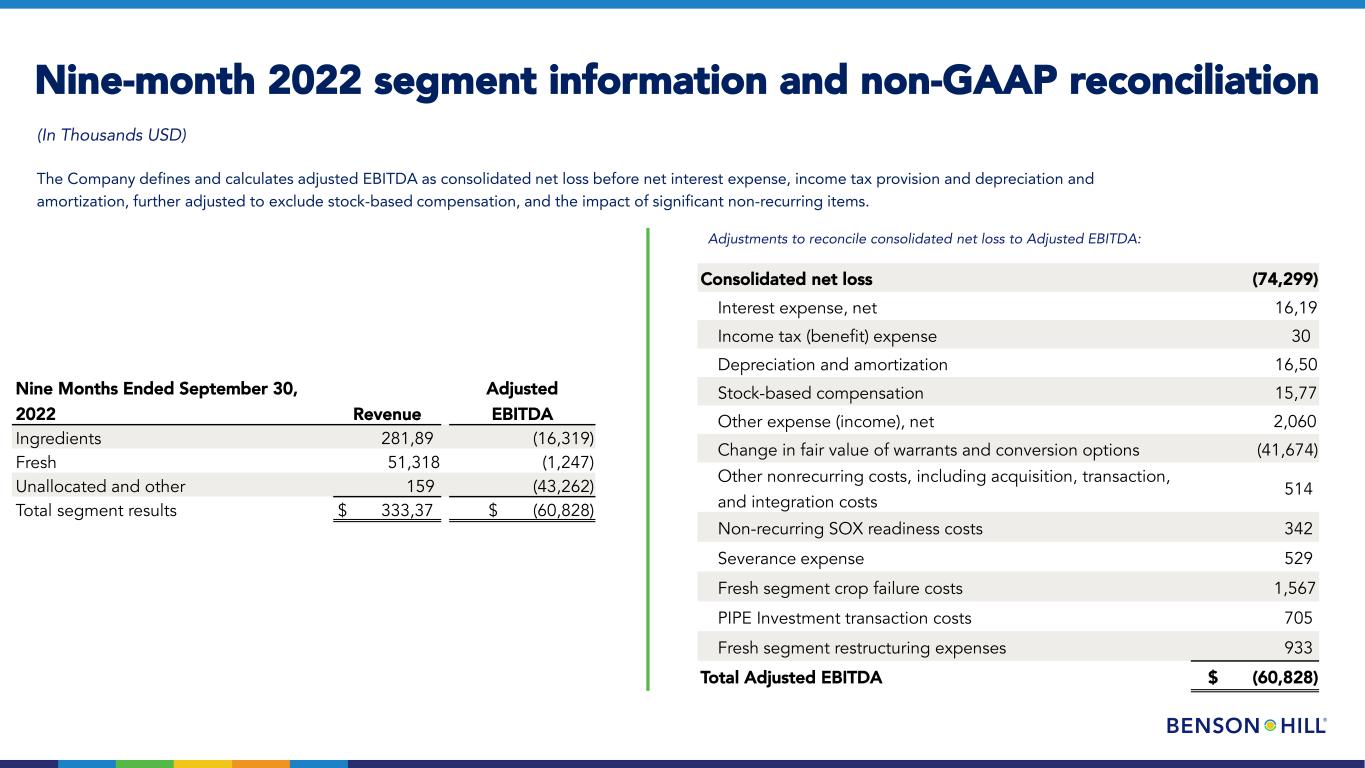
Nine-month 2022 segment information and non-GAAP reconciliation (In Thousands USD) The Company defines and calculates adjusted EBITDA as consolidated net loss before net interest expense, income tax provision and depreciation and amortization, further adjusted to exclude stock-based compensation, and the impact of significant non-recurring items. Adjustments to reconcile consolidated net loss to Adjusted EBITDA: Nine Months Ended September 30, 2022 Revenue Adjusted EBITDA Ingredients 281,89 (16,319) Fresh 51,318 (1,247) Unallocated and other 159 (43,262) Total segment results $ 333,37 $ (60,828) Consolidated net loss (74,299) Interest expense, net 16,19 Income tax (benefit) expense 30 Depreciation and amortization 16,50 Stock-based compensation 15,77 Other expense (income), net 2,060 Change in fair value of warrants and conversion options (41,674) Other nonrecurring costs, including acquisition, transaction, and integration costs 514 Non-recurring SOX readiness costs 342 Severance expense 529 Fresh segment crop failure costs 1,567 PIPE Investment transaction costs 705 Fresh segment restructuring expenses 933 Total Adjusted EBITDA $ (60,828)

2022 non-GAAP Reconciliations Adjustments to reconcile estimated 2022 consolidated net loss to estimated Adjusted EBITDA (In Thousands USD) Consolidated net loss $ (106,000) – (111,000) Interest expense, net 24,000 Depreciation and amortization 22,000 Stock-based compensation 20,000 Other non-recurring costs (35,000) Total Adjusted EBITDA $ (75,000) – (80,000) Consolidated net loss $ (106,000) - $ (111,000) Depreciation and Amortization 24,000 - 24,000 Stock-Based Compensation 20,000 - 20,000 Changes in Working Capital 4,000 - 5,000 Other (25,000) - (27,000) Net cash used in operating activities $ (83,000) - $ (89,000) Payments for acquisitions of property and equipment (12,000) - (16,000) Free cash flow $ (95,000) - $ (105,000)
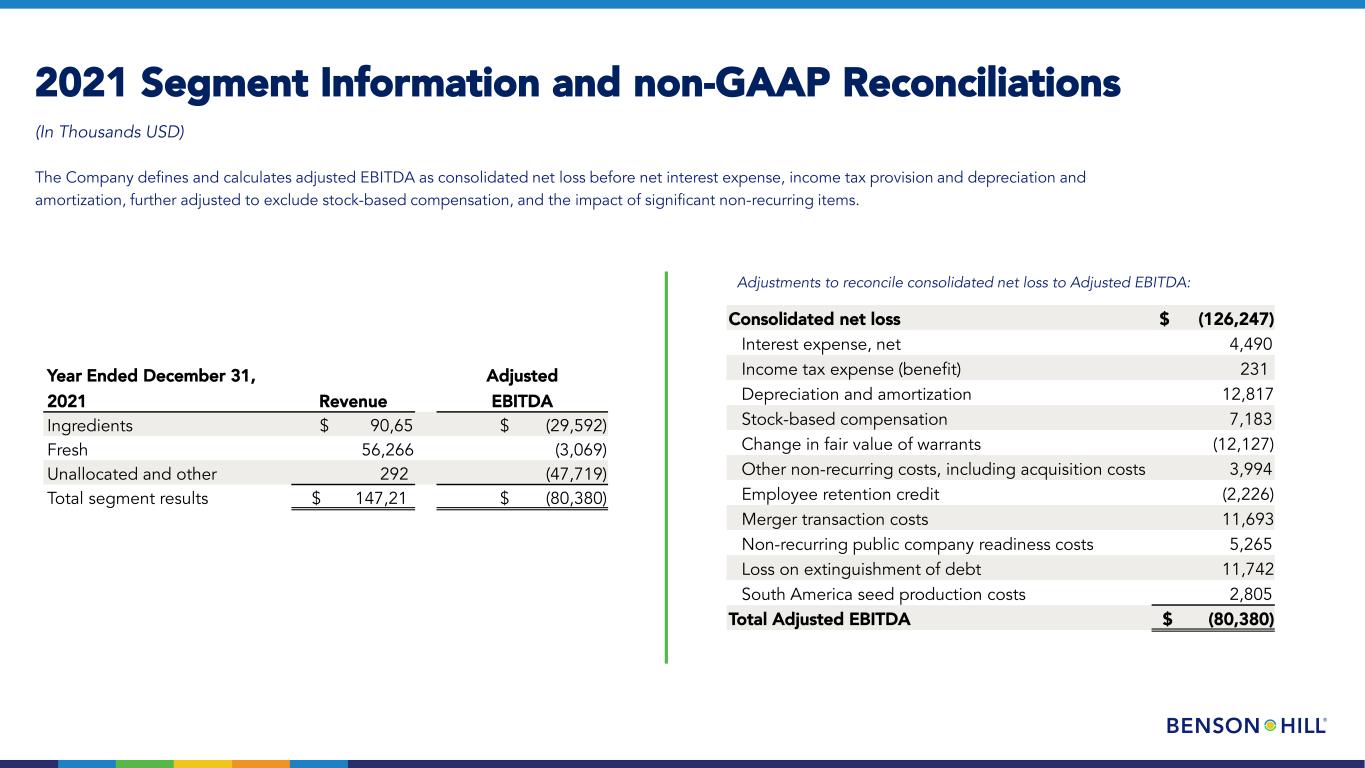
2021 Segment Information and non-GAAP Reconciliations Adjustments to reconcile consolidated net loss to Adjusted EBITDA: (In Thousands USD) The Company defines and calculates adjusted EBITDA as consolidated net loss before net interest expense, income tax provision and depreciation and amortization, further adjusted to exclude stock-based compensation, and the impact of significant non-recurring items. Year Ended December 31, 2021 Revenue Adjusted EBITDA Ingredients $ 90,65 $ (29,592) Fresh 56,266 (3,069) Unallocated and other 292 (47,719) Total segment results $ 147,21 $ (80,380) Consolidated net loss $ (126,247) Interest expense, net 4,490 Income tax expense (benefit) 231 Depreciation and amortization 12,817 Stock-based compensation 7,183 Change in fair value of warrants (12,127) Other non-recurring costs, including acquisition costs 3,994 Employee retention credit (2,226) Merger transaction costs 11,693 Non-recurring public company readiness costs 5,265 Loss on extinguishment of debt 11,742 South America seed production costs 2,805 Total Adjusted EBITDA $ (80,380)


