 |  |  |
BANK 2020-BNK29
Free Writing Prospectus
Structural and Collateral Term Sheet
$871,162,919
(Approximate Total Mortgage Pool Balance)
$711,740,000
(Approximate Offered Certificates)
Morgan Stanley Capital I Inc.
as Depositor
Morgan Stanley Mortgage Capital Holdings LLC
Wells Fargo Bank, National Association
Bank of America, National Association
as Sponsors and Mortgage Loan Sellers
Commercial Mortgage Pass-Through Certificates
Series 2020-BNK29
November 17, 2020
MORGAN STANLEY Co-Lead Bookrunner Manager | BofA SECURITIES Co-Lead Bookrunner Manager | WELLS FARGO SECURITIES Co-Lead Bookrunner Manager |
Academy Securities, Inc. Co-Manager | Drexel Hamilton Co-Manager | |
STATEMENT REGARDING THIS FREE WRITING PROSPECTUS
The depositor has filed a registration statement (including a prospectus) with the SEC (File No. 333-227446) for the offering to which this communication relates. Before you invest, you should read the prospectus in that registration statement and other documents the depositor has filed with the SEC for more complete information about the depositor, the issuing entity and this offering. You may get these documents for free by visiting EDGAR on the SEC web site at www.sec.gov. Alternatively, the depositor or any underwriter or any dealer participating in the offering will arrange to send you the prospectus if you request it by calling toll free 1-866-718-1649 or by email to prospectus@ms.com.
This is not a research report and was not prepared by any Underwriter’s research department. Please see additional important information and qualifications at the end of this Term Sheet.
| BANK 2020-BNK29 |
Neither this Term Sheet nor anything contained herein shall form the basis for any contract or commitment whatsoever. The information contained herein is preliminary as of the date hereof. This Term Sheet is subject to change, completion or amendment from time to time. The information contained herein supersedes information in any other communication relating to the securities described herein; provided, that the information contained herein will be superseded by similar information delivered to you as part of the Preliminary Prospectus. The information contained herein should be reviewed only in conjunction with the entire Preliminary Prospectus. All of the information contained herein is subject to the same limitations and qualifications contained in the Preliminary Prospectus. The information contained herein does not contain all relevant information relating to the underlying mortgage loans or mortgaged properties. Such information is described in the Preliminary Prospectus. The information contained herein will be more fully described in the Preliminary Prospectus. The information contained herein should not be viewed as projections, forecasts, predictions or opinions with respect to value. Prior to making any investment decision, prospective investors are strongly urged to read the Preliminary Prospectus in its entirety. Neither the Securities and Exchange Commission nor any state securities commission has approved or disapproved of these securities or determined if this Term Sheet is truthful or complete. Any representation to the contrary is a criminal offense.
Wells Fargo Securities is the trade name for the capital markets and investment banking services of Wells Fargo & Company and its subsidiaries, including but not limited to Wells Fargo Securities, LLC, a member of the New York Stock Exchange, the Financial Industry Regulatory Authority (“FINRA”), the National Futures Association (“NFA”) and the Securities Investor Protection Corporation (“SIPC”), Wells Fargo Prime Services, LLC, a member of FINRA, NFA and SIPC, and Wells Fargo Bank, National Association. Wells Fargo Securities, LLC and Wells Fargo Prime Services, LLC are distinct entities from affiliated banks and thrifts.
IMPORTANT NOTICE RELATING TO AUTOMATICALLY GENERATED EMAIL DISCLAIMERS
Any legends, disclaimers or other notices that may appear at the bottom of, or attached to, the email communication to which this Term Sheet may have been attached are not applicable to this Term Sheet and should be disregarded. Such legends, disclaimers or other notices have been automatically generated as a result of this Term Sheet having been sent via Bloomberg or another email system.
IMPORTANT NOTICE REGARDING THE CONDITIONS FOR THIS OFFERING OF ASSET-BACKED SECURITIES
THE ASSET-BACKED SECURITIES REFERRED TO IN THIS TERM SHEET ARE BEING OFFERED WHEN, AS AND IF ISSUED. IN PARTICULAR, YOU ARE ADVISED THAT THE ASSET-BACKED SECURITIES, AND THE ASSET POOL BACKING THEM, ARE SUBJECT TO MODIFICATION OR REVISION (INCLUDING, AMONG OTHER THINGS, THE POSSIBILITY THAT ONE OR MORE CLASSES OF SECURITIES MAY BE SPLIT, COMBINED OR ELIMINATED), AT ANY TIME PRIOR TO ISSUANCE OR AVAILABILITY OF A FINAL PROSPECTUS. AS A RESULT, YOU MAY COMMIT TO PURCHASE SECURITIES THAT HAVE CHARACTERISTICS THAT MAY CHANGE, AND YOU ARE ADVISED THAT ALL OR A PORTION OF THE SECURITIES MAY NOT BE ISSUED THAT HAVE THE CHARACTERISTICS DESCRIBED IN THIS TERM SHEET. OUR OBLIGATION TO SELL SECURITIES TO YOU IS CONDITIONED ON THE SECURITIES AND THE UNDERLYING TRANSACTION HAVING THE CHARACTERISTICS DESCRIBED IN THIS TERM SHEET. IF WE DETERMINE THAT THE FOREGOING CONDITION IS NOT SATISFIED IN ANY MATERIAL RESPECT, WE WILL NOTIFY YOU, AND NEITHER THE ISSUING ENTITY NOR ANY UNDERWRITER WILL HAVE ANY OBLIGATION TO YOU TO DELIVER ALL OR ANY PORTION OF THE SECURITIES WHICH YOU HAVE COMMITTED TO PURCHASE, AND THERE WILL BE NO LIABILITY BETWEEN US AS A CONSEQUENCE OF THE NON-DELIVERY.
This is not a research report and was not prepared by any Underwriter’s research department. Please see additional important information and qualifications at the end of this Term Sheet.
2
| BANK 2020-BNK29 | Structural Overview |
Offered Certificates
| Class | Expected Ratings (Fitch/Moody’s/DBRS Morningstar)(1) | Approximate Initial Certificate Balance or Notional Amount(2) | Approximate Initial Credit Support(3) | Pass-Through Rate Description | Expected Weighted Average Life (Years)(4) | Expected Principal Window (Months)(4) | Certificate Principal UW NOI Debt Yield(5) | Certificate Principal to Value Ratio(6) | ||||||||
| Class A-1 | AAAsf/Aaa(sf)/AAA(sf) | $26,400,000 | 30.000% | (7) | 2.69 | 1 – 60 | 15.1% | 38.1% | ||||||||
| Class A-SB | AAAsf/Aaa(sf)/AAA(sf) | $29,800,000 | 30.000% | (7) | 7.21 | 60 – 112 | 15.1% | 38.1% | ||||||||
| Class A-3(8) | AAAsf/Aaa(sf)/AAA(sf) | (8)(9) | 30.000% | (7)(8) | (9) | (9) | 15.1% | 38.1% | ||||||||
| Class A-4(8) | AAAsf/Aaa(sf)/AAA(sf) | (8)(9) | 30.000% | (7)(8) | (9) | (9) | 15.1% | 38.1% | ||||||||
| Class X-A | AAAsf/Aaa(sf)/AAA(sf) | $579,323,000(10) | N/A | Variable IO(11) | N/A | N/A | N/A | N/A | ||||||||
| Class X-B | A-sf/NR/AAA(sf) | $132,417,000(10) | N/A | Variable IO(11) | N/A | N/A | N/A | N/A | ||||||||
| Class A-S(8) | AAAsf/Aa2(sf)/AAA(sf) | $47,587,000(8) | 24.250% | (7)(8) | 10.01 | 120 – 121 | 14.0% | 41.2% | ||||||||
| Class B | AA-sf/NR/AAA(sf) | $41,380,000 | 19.250% | (7) | 10.04 | 121 – 121 | 13.1% | 43.9% | ||||||||
| Class C | A-sf/NR/AA(high)(sf) | $43,450,000 | 14.000% | (7) | 10.04 | 121 – 121 | 12.3% | 46.8% |
Privately Offered Certificates(12)
| Class | Expected Ratings (Fitch/Moody’s/DBRS Morningstar)(1) | Approximate Initial Certificate Balance or Notional Amount(2) | Approximate Initial Credit Support(3) | Pass-Through Rate Description | Expected Weighted Average Life (Years)(4) | Expected Principal Window (Months)(4) | Certificate Principal UW NOI Debt Yield(5) | Certificate Principal to Value Ratio(6) | ||||||||
| Class X-D | BBB-sf/NR/A(sf) | $47,587,000(10) | N/A | Variable IO(11) | N/A | N/A | N/A | N/A | ||||||||
| Class X-F | BB+sf/NR/A(low)(sf) | $13,448,000(10) | N/A | Variable IO(11) | N/A | N/A | N/A | N/A | ||||||||
| Class X-G | BB-sf/NR/BBB(sf) | $11,380,000(10) | N/A | Variable IO(11) | N/A | N/A | N/A | N/A | ||||||||
| Class X-H | B-sf/NR/BBB(low)(sf) | $10,345,000(10) | N/A | Variable IO(11) | N/A | N/A | N/A | N/A | ||||||||
| Class X-J | NR/NR/BB(sf) | $8,276,000(10) | N/A | Variable IO(11) | N/A | N/A | N/A | N/A | ||||||||
| Class X-K | NR/NR/B(high)(sf) | $10,345,000(10) | N/A | Variable IO(11) | N/A | N/A | N/A | N/A | ||||||||
| Class X-L | NR/NR/NR | $14,483,773(10) | N/A | Variable IO(11) | N/A | N/A | N/A | N/A | ||||||||
| Class D | BBBsf/NR/A(high)(sf) | $25,862,000 | 10.875% | (7) | 10.04 | 121 – 121 | 11.9% | 48.5% | ||||||||
| Class E | BBB-sf/NR/A(low)(sf) | $21,725,000 | 8.250% | (7) | 10.04 | 121 – 121 | 11.6% | 49.9% | ||||||||
| Class F | BB+sf/NR/BBB(high)(sf) | $13,448,000 | 6.625% | (7) | 10.04 | 121 – 121 | 11.4% | 50.8% | ||||||||
| Class G | BB-sf/NR/BBB(low)(sf) | $11,380,000 | 5.250% | (7) | 10.04 | 121 – 121 | 11.2% | 51.5% | ||||||||
| Class H | B-sf/NR/BB(high)(sf) | $10,345,000 | 4.000% | (7) | 10.04 | 121 – 121 | 11.0% | 52.2% | ||||||||
| Class J | NR/NR/BB(low)(sf) | $8,276,000 | 3.000% | (7) | 10.04 | 121 – 121 | 10.9% | 52.8% | ||||||||
| Class K | NR/NR/B(sf) | $10,345,000 | 1.750% | (7) | 10.04 | 121 – 121 | 10.8% | 53.4% | ||||||||
| Class L | NR/NR/NR | $14,483,773 | 0.000% | (7) | 10.04 | 121 – 121 | 10.6% | 54.4% |
Non-Offered Eligible Vertical Interest(12)
| Class | Expected Ratings (Fitch/Moody’s/DBRS Morningstar)(1) | Approximate Initial Certificate Balance or Notional Amount(2) | Approximate Initial Credit Support(3) | Pass-Through Rate Description | Expected Weighted Average Life (Years)(4) | Expected Principal Window (Months)(4) | Certificate Principal UW NOI Debt Yield(5) | Certificate Principal to Value Ratio(6) | ||||||||
| RR Interest | NR/NR/NR | $43,558,145.96 | N/A | (13) | 9.57 | 1 – 121 | N/A | N/A |
| (1) | Ratings shown are those of Fitch Ratings, Inc. (“Fitch”), Moody’s Investors Service, Inc. (“Moody’s”) and DBRS, Inc. (“DBRS Morningstar”). Certain nationally recognized statistical rating organizations that were not hired by the depositor may use information they receive pursuant to Rule 17g-5 under the Securities Exchange Act of 1934, as amended, or otherwise to rate the certificates. There can be no assurance as to what ratings a non-hired nationally recognized statistical rating organization would assign. See “Risk Factors—Other Risks Relating to the Certificates—Nationally Recognized Statistical Rating Organizations May Assign Different Ratings to the Certificates; Ratings of the Certificates Reflect Only the Views of the Applicable Rating Agencies as of the Dates Such Ratings Were Issued; Ratings May Affect ERISA Eligibility; Ratings May Be Downgraded” and “Ratings” in the Preliminary Prospectus to be dated on or about the date hereof (the “Preliminary Prospectus”). Capitalized terms used but not defined herein have the meanings assigned to such terms in the Preliminary Prospectus. |
| (2) | Approximate, subject to a permitted variance of plus or minus 5% and further subject to the discussion in footnote (9) below. In addition, the notional amounts of the Class X-A, Class X-B, Class X-D, Class X-F, Class X-G, Class X-H, Class X-J, Class X-K and Class X-L certificates may vary depending upon the final pricing of the classes of principal balance certificates or trust components whose certificate or principal balances comprise such notional amounts, and, if as a result of such pricing the pass-through rate of any class of the Class X-A, Class X-B, Class X-D, Class X-F, Class X-G, Class X-H, Class X-J, Class X-K or Class X-L certificates, as applicable, would be equal to zero at all times, such class of certificates will not be issued on the closing date of this securitization. |
This is not a research report and was not prepared by any Underwriter’s research department. Please see additional important information and qualifications at the end of this Term Sheet.
3
| BANK 2020-BNK29 | Structural Overview |
| (3) | The approximate initial credit support percentages set forth for the certificates are approximate and, for the Class A-1, Class A-SB, Class A-3 and Class A-4 certificates, are presented in the aggregate, taking into account the principal balances of the Class A-3 and Class A-4 trust components. The approximate initial credit support percentage set forth for the Class A-S certificates represents the approximate credit support for the underlying Class A-S trust component. The RR Interest provides credit support only to the limited extent that it is allocated a portion of any losses incurred on the underlying mortgage loans, which such losses are allocated between it, on the one hand, and to the Non-Retained Certificates, on the other hand, pro rata in accordance with their respective Percentage Allocation Entitlements (as defined below). See “Credit Risk Retention” in the Preliminary Prospectus. |
| (4) | The Expected Weighted Average Life and Expected Principal Window during which distributions of principal would be received as set forth in the foregoing table with respect to each class of certificates having a certificate balance are based on the assumptions set forth under “Yield and Maturity Considerations—Weighted Average Life” in the Preliminary Prospectus and on the assumptions that there are no prepayments, modifications or losses in respect of the mortgage loans and that there are no extensions or forbearances of maturity dates or anticipated repayment dates of the mortgage loans. |
| (5) | Certificate Principal UW NOI Debt Yield for any class of principal balance certificates shown in the table above (other than the RR Interest) is calculated as the product of (a) the weighted average UW NOI Debt Yield for the mortgage pool, multiplied by (b) a fraction, the numerator of which is the aggregate initial certificate or principal balance of all the principal balance certificates, and the denominator of which is the sum of (x) the aggregate initial certificate or principal balance of the subject class of principal balance certificates (or, with respect to the Class A-3, Class A-4 or Class A-S certificates, the trust component with the same alphanumeric designation) and all other classes of principal balance certificates (other than the RR Interest), if any, that are senior to such class and (y) the outstanding certificate balance of the RR Interest, multiplied by the applicable RR Interest Computation Percentage. The Certificate Principal UW NOI Debt Yields of the Class A-1, Class A-SB, Class A-3 and Class A-4 certificates are calculated in the aggregate for those classes as if they were a single class. With respect to any class of principal balance certificates, the “RR Interest Computation Percentage” is equal to a fraction, expressed as a percentage, the numerator of which is the total initial certificate or principal balance of the subject class of principal balance certificates (or, with respect to the Class A-3, Class A-4 or Class A-S certificates, the trust component with the same alphanumeric designation) and all other classes of principal balance certificates (other than the RR Interest), if any, that are senior to such class, and the denominator of which is the sum of the aggregate initial certificate or principal balance of all the principal balance certificates (other than the RR Interest). |
| (6) | Certificate Principal to Value Ratio for any class of principal balance certificates shown in the table above (other than the RR Interest) is calculated as the product of (a) the weighted average Cut-off Date LTV Ratio of the mortgage pool, multiplied by (b) a fraction, the numerator of which is the sum of (x) the aggregate initial certificate or principal balance of the subject class of principal balance certificates (or, with respect to the Class A-3, Class A-4 or Class A-S certificates, the trust component with the same alphanumeric designation) and all other classes of principal balance certificates (other than the RR Interest), if any, that are senior to such class and (y) the outstanding certificate balance of the RR Interest, multiplied by the applicable RR Interest Computation Percentage, and the denominator of which is the aggregate initial certificate or principal balance of all the principal balance certificates. The Certificate Principal to Value Ratios of the Class A-1, Class A-SB, Class A-3 and Class A-4 certificates are calculated in the aggregate for those classes as if they were a single class. |
| (7) | The pass-through rate for each class of the Class A-1, Class A-SB, Class A-3, Class A-4, Class A-S, Class B, Class C, Class D, Class E, Class F, Class G, Class H, Class J, Class K and Class L certificates will be one of the following: (i) a fixed rate per annum, (ii) a variable rate per annum equal to the weighted average of the net mortgage interest rates on the mortgage loans for the related distribution date, (iii) a variable rate per annum equal to the lesser of (a) a fixed rate and (b) the weighted average of the net mortgage interest rates on the mortgage loans for the related distribution date or (iv) a variable rate per annum equal to the weighted average of the net mortgage interest rates on the mortgage loans for the related distribution date minus a specified percentage. For purposes of the calculation of the weighted average of the net mortgage interest rates on the mortgage loans for each distribution date, the net mortgage interest rates will be adjusted as necessary to a 30/360 basis. |
| (8) | The Class A-3-1, Class A-3-2, Class A-3-X1, Class A-3-X2, Class A-4-1, Class A-4-2, Class A-4-X1, Class A-4-X2, Class A-S-1, Class A-S-2, Class A-S-X1 and Class A-S-X2 certificates are also offered certificates. Such classes of certificates, together with the Class A-3, Class A-4 and Class A-S certificates, constitute the “Exchangeable Certificates”. The Class A-1, Class A-SB, Class B, Class C, Class D, Class E, Class F, Class G, Class H, Class J, Class K and Class L certificates, together with the RR Interest and the Exchangeable Certificates with a certificate balance, are referred to as the “principal balance certificates.” Each class of Exchangeable Certificates will have the certificate balance or notional amount and pass-through rate described below under “Exchangeable Certificates.” |
| (9) | The exact initial principal balances or notional amounts of the Class A-3, Class A-3-X1, Class A-3-X2, Class A-4, Class A-4-X1 and Class A-4-X2 trust components (and consequently, the exact aggregate initial certificate balances or notional amounts of the Exchangeable Certificates with an “A-3” or “A-4” designation) are unknown and will be determined based on the final pricing of the certificates. However, the initial principal balances, weighted average lives and principal windows of the Class A-3 and Class A-4 trust components are expected to be within the applicable ranges reflected in the following chart. The aggregate initial principal balance of the Class A-3 and Class A-4 trust components is expected to be approximately $523,123,000, subject to a variance of plus or minus 5%. The Class A-3-X1 and Class A-3-X2 trust components will have initial notional amounts equal to the initial principal balance of the Class A-3 trust component. The Class A-4-X1 and Class A-4-X2 trust components will have initial notional amounts equal to the initial principal balance of the Class A-4 trust component. |
| Trust Components | Expected Range of Initial Principal Balance | Expected Range of Weighted Average Life (Years) | Expected Range of Principal Window (Months) |
| Class A-3 | $200,000,000 - $250,000,000 | 9.65 – 9.70 | 112 - 119 / 112- 119 |
| Class A-4 | $273,123,000 - $323,123,000 | 9.94 – 9.96 | 119 - 120 / 119 - 120 |
| (10) | The Class X-A, Class X-B, Class X-D, Class X-F, Class X-G, Class X-H, Class X-J, Class X-K and Class X-L certificates (collectively referred to as the “Class X certificates”) are notional amount certificates and will not be entitled to distributions of principal. The notional amount of the Class X-A certificates will be equal to the aggregate certificate or principal balance of the Class A-1 and Class A-SB certificates and the Class A-3 and Class A-4 trust components. The notional amount of the Class X-B certificates will be equal to the aggregate certificate or principal balance of the Class A-S trust component and the Class B and Class C certificates. The notional amount of the Class X-D certificates will be equal to the aggregate certificate balance of the Class D and Class E certificates. The notional amount of each class of the Class X-F, Class X-G, Class X-H, Class X-J, Class X-K and Class X-L certificates will be equal to the certificate balance of the class of principal balance certificates that, with the addition of “X-,” has the same alphabetical designation as the subject class of Class X certificates. |
| (11) | The pass-through rate for the Class X-A certificates for any distribution date will be a per annum rate equal to the excess, if any, of (a) the weighted average of the net mortgage interest rates on the mortgage loans for the related distribution date, over (b) the weighted average of the pass-through rates on the Class A-1 and Class A-SB certificates and the Class A-3, Class A-3-X1, Class A-3-X2, Class A-4, Class A-4-X1 and Class A-4-X2 trust components for the related distribution date, weighted on the basis of their respective certificate or principal balances or notional amounts outstanding immediately prior to that distribution date (but excluding trust components with a notional amount in the denominator of such weighted average calculation). The pass-through rate for the Class X-B certificates for any distribution date will be a per annum rate equal to the excess, if any, of (a) the weighted average of the net mortgage |
This is not a research report and was not prepared by any Underwriter’s research department. Please see additional important information and qualifications at the end of this Term Sheet.
4
| BANK 2020-BNK29 | Structural Overview |
| interest rates on the mortgage loans for the related distribution date, over (b) the weighted average of the pass-through rates on the Class A-S, Class A-S-X1 and Class A-S-X2 trust components and Class B and Class C certificates for the related distribution date, weighted on the basis of their respective certificate or principal balances or notional amounts outstanding immediately prior to that distribution date (but excluding trust components with a notional amount in the denominator of such weighted average calculation). The pass-through rate for the Class X-D certificates for any distribution date will be a per annum rate equal to the excess, if any, of (a) the weighted average of the net mortgage interest rates on the mortgage loans for the related distribution date, over (b) the weighted average of the pass-through rates on the Class D and Class E certificates for the related distribution date, weighted on the basis of their respective certificate balances outstanding immediately prior to that distribution date. The pass-through rate for each class of the Class X-F, Class X-G, Class X-H, Class X-J, Class X-K and Class X-L certificates for any distribution date will be a per annum rate equal to the excess, if any, of (a) the weighted average of the net mortgage interest rates on the mortgage loans for the related distribution date, over (b) the pass-through rate for the related distribution date on the class of principal balance certificates that, with the addition of “X-,” has the same alphabetical designation as the subject class of Class X certificates. For purposes of the calculation of the weighted average of the net mortgage interest rates on the mortgage loans for each distribution date, the net mortgage interest rates will be adjusted as necessary to a 30/360 basis. |
| (12) | Not offered pursuant to the Preliminary Prospectus or this Term Sheet. Information provided in this Term Sheet regarding the characteristics of these certificates is provided only to enhance your understanding of the offered certificates. The privately offered certificates also include the Class V and Class R certificates, which do not have a certificate balance, notional amount, credit support, pass-through rate, rating, assumed final distribution date or rated final distribution date, and which are not shown in the chart. The Class V certificates represent a beneficial ownership interest held through the grantor trust in a specified percentage of certain excess interest in respect of mortgage loans having anticipated repayment dates, if any. The Class R certificates represent the beneficial ownership of the residual interest in each of the real estate mortgage investment conduits, as further described in the Preliminary Prospectus. |
| (13) | Although it does not have a specified pass-through rate (other than for tax reporting purposes), the effective pass-through rate for the RR Interest will be a variable rate per annum equal to the weighted average of the net mortgage interest rates on the mortgage loans for the related distribution date (in each case adjusted, if necessary, to accrue on the basis of a 360-day year consisting of twelve 30-day months). |
This is not a research report and was not prepared by any Underwriter’s research department. Please see additional important information and qualifications at the end of this Term Sheet.
5
| BANK 2020-BNK29 | Structural Overview |
Issue Characteristics
| Offered Certificates: | $711,740,000 (approximate) monthly pay, multi-class, commercial mortgage pass-through certificates, consisting of 13 principal balance classes (Class A-1, Class A-SB, Class A-3, Class A-3-1, Class A-3-2, Class A-4, Class A-4-1, Class A-4-2, Class A-S, Class A-S-1, Class A-S-2, Class B and Class C) and 8 interest-only classes (Class A-3-X1, Class A-3-X2, Class A-4-X1, Class A-4-X2, Class X-A, Class X-B, Class A-S-X1 and Class A-S-X2) |
| Co-Lead Managers and Joint Bookrunners: | Morgan Stanley & Co. LLC, Wells Fargo Securities, LLC and BofA Securities, Inc. |
| Co-Managers: | Academy Securities, Inc. and Drexel Hamilton, LLC |
| Mortgage Loan Sellers: | Morgan Stanley Mortgage Capital Holdings LLC, Wells Fargo Bank, National Association and Bank of America, National Association |
| Rating Agencies: | Fitch, Moody’s and DBRS Morningstar |
| Master Servicer: | Wells Fargo Bank, National Association |
| Special Servicer: | Rialto Capital Advisors, LLC |
| Certificate Administrator/ Certificate Registrar/Custodian: | Wells Fargo Bank, National Association |
| Trustee: | Wilmington Trust, National Association |
| Operating Advisor: | Pentalpha Surveillance LLC |
| Asset Representations Reviewer: | Pentalpha Surveillance LLC |
| Initial Directing Certificateholder: | RREF IV Debt AIV, LP |
| Risk Retention Consultation Party: | Morgan Stanley Mortgage Capital Holdings LLC |
| U.S. Credit Risk Retention: | For a discussion on the manner in which the U.S. credit risk retention requirements will be addressed by Morgan Stanley Mortgage Capital Holdings LLC, as the retaining sponsor, see “Credit Risk Retention” in the Preliminary Prospectus. |
| EU Risk Retention: | For a summary of the covenants and representations that the originators will make for the benefit of the issuing entity, the depositor and the trustee with respect to retaining a material net economic interest in this securitization for the purposes of the EU Risk Retention and Due Diligence Requirements, see “Credit Risk Retention—EU Credit Risk Retention Agreement” in the Preliminary Prospectus. None of the depositor, the issuing entity, the sponsors or any other person expects to comply or will be required to comply with Article 7 of the EU Securitization Regulation (or with any equivalent or similar requirements). The requirements of the EU Securitization Regulation, including the EU Risk Retention and Due Diligence Requirements, are also applicable in the UK until the end of the transition period put in place in connection with the departure of the UK from the EU (currently scheduled to end on December 31, 2020). |
| Cut-off Date: | The mortgage loans will be considered part of the trust fund as of their respective cut-off dates. The cut-off date with respect to each mortgage loan is the respective due date for the monthly debt service payment that is due in November 2020 (or, in the case of any mortgage loan that has its first due date after November 2020, the date that would have been its due date in November 2020 under the terms of that mortgage loan if a monthly debt service payment were scheduled to be due in that month). |
| Expected Pricing Date: | Week of November 16, 2020 |
| Expected Closing Date: | November 30, 2020 |
| Determination Dates: | The 11th day of each month or, if the 11th day is not a business day, then the business day immediately following such 11th day. |
| Distribution Dates: | The 4th business day following each determination date. The first distribution date will be in December 2020. |
| Rated Final Distribution Date: | The distribution date in November 2053 |
| Interest Accrual Period: | Preceding calendar month |
| Payment Structure: | Sequential pay |
| Tax Treatment: | REMIC, except that the Exchangeable Certificates will evidence interests in a grantor trust |
| Optional Termination: | 1.00% clean-up call |
| Minimum Denominations: | $10,000 for each class of Offered Certificates (other than Class X-A and Class X-B certificates); $1,000,000 for the Class X-A and Class X-B certificates |
| Settlement Terms: | DTC, Euroclear and Clearstream |
| Legal/Regulatory Status: | Each class of Offered Certificates is expected to be eligible for exemptive relief under ERISA. No class of Offered Certificates is SMMEA eligible. |
This is not a research report and was not prepared by any Underwriter’s research department. Please see additional important information and qualifications at the end of this Term Sheet.
6
| BANK 2020-BNK29 | Structural Overview |
| Analytics: | The certificate administrator is expected to make available all distribution date statements, CREFC® reports and supplemental notices received by it to certain modeling financial services as described in the Preliminary Prospectus. |
| Bloomberg Ticker: | BANK 2020-BNK29<MTGE><GO> |
| Risk Factors: | THE CERTIFICATES INVOLVE CERTAIN RISKS AND MAY NOT BE SUITABLE FOR ALL INVESTORS. SEE THE “RISK FACTORS” SECTION OF THE PRELIMINARY PROSPECTUS. |
This is not a research report and was not prepared by any Underwriter’s research department. Please see additional important information and qualifications at the end of this Term Sheet.
7
| BANK 2020-BNK29 | Structural Overview |
Structural Overview
| Allocation Between the RR Interest and the Non-Retained Certificates: |
The aggregate amount available for distributions to the holders of the Certificates (including the RR Interest) on each distribution date (net of specified expenses of the issuing entity, including fees payable to, and costs and expenses reimbursable to, each applicable master servicer, primary servicer and special servicer, the certificate administrator, the trustee, the operating advisor, the asset representations reviewer and CREFC®) will be allocated between amounts available for distribution to the holders of the RR Interest, on the one hand, and to all other Certificates (other than the Class V and Class R Certificates), referred to herein as the “Non-Retained Certificates”, on the other hand. The portion of such amount allocable to (a) the RR Interest will at all times be the product of such amount multiplied by 5% and (b) the Non-Retained Certificates will at all times be the product of such amount multiplied by the difference between 100% and the percentage set forth in clause (a) (each, the respective “Percentage Allocation Entitlement”). |
| Accrual: | Each class of Offered Certificates will accrue interest on a 30/360 basis. |
| Amount and Order of Distributions: | On each distribution date, the Non-Retained Certificates’ Percentage Allocation Entitlement of funds available for distribution from the mortgage loans, net of (i) any yield maintenance charges and prepayment premiums and (ii) any excess interest, will be distributed in the following amounts and order of priority:
First, to the Class A-1, Class A-SB, Class X-A, Class X-B, Class X-D, Class X-F, Class X-G, Class X-H, Class X-J, Class X-K and Class X-L certificates and the Class A-3, Class A-3-X1, Class A-3-X2, Class A-4, Class A-4-X1 and Class A-4-X2 trust components, in respect of interest, up to an amount equal to, and pro rata in accordance with, the interest entitlements for those classes of certificates and trust components;
Second, to the Class A-1 and Class A-SB certificates and the Class A-3 and Class A-4 trust components as follows, to the extent of applicable available funds allocated to principal: either (i)(a) first, to principal on the Class A-SB certificates, until the certificate balance of the Class A-SB certificates is reduced to the planned principal balance for the related distribution date set forth in Annex E to the Preliminary Prospectus, and (b) second, to principal on the Class A-1 certificates, the Class A-3 trust component, the Class A-4 trust component and the Class A-SB certificates, in that order, in each case until the certificate or principal balance of such class of certificates or trust component has been reduced to zero, or (ii) if the certificate or principal balance of each class of principal balance certificates and trust components other than the Class A-1 and Class A-SB certificates, the Class A-3 and Class A-4 trust components and the RR Interest has been reduced to zero as a result of the allocation of losses on the mortgage loans to those certificates, to principal on the Class A-1 and Class A-SB certificates and the Class A-3 and Class A-4 trust components, pro rata, without regard to the distribution priorities described above or the planned principal balance of the Class A-SB certificates;
Third, to the Class A-1 and Class A-SB certificates and the Class A-3 and Class A-4 trust components, first, up to an amount equal to, and pro rata based on, any previously unreimbursed losses on the mortgage loans allocable to principal that were previously borne by each such class or trust component and then in the amount of interest thereon;
Fourth, to the Class A-S, Class A-S-X1 and Class A-S-X2 trust components, as follows: (a) to each such trust component in respect of interest, up to an amount equal to, and pro rata in accordance with, the interest entitlements for those trust components; (b) to the extent of applicable available funds allocable to principal remaining after distributions in respect of principal to each class of certificates or trust component with a higher priority (as set forth in prior enumerated clauses set forth above), to principal on the Class A-S trust component until its principal balance has been reduced to zero; and (c) to reimburse the Class A-S trust component, first, in the amount of any previously unreimbursed losses on the mortgage loans that were previously allocated thereto, then in the amount of interest thereon;
Fifth, to the Class B and Class C certificates, in that order, in each case as follows: (a) to interest on such class of certificates in the amount of its interest entitlement; (b) to the extent of applicable available funds allocable to principal remaining after distributions in respect of principal to each class of certificates or trust component with a higher priority (as set forth in this clause or prior enumerated clauses set forth above), to principal on such class of certificates until its certificate balance has been reduced to zero; and (c) to reimburse such class of certificates, first, in the amount of any previously unreimbursed losses on the mortgage loans that were previously allocated thereto, then in the amount of interest thereon;
Sixth, to the Class D, Class E, Class F, Class G, Class H, Class J, Class K and Class L certificates in the amounts and order of priority described in “Description of the Certificates—Distributions” in the Preliminary Prospectus; and
Seventh, to the Class R certificates, any remaining amounts.
Principal and interest payable on the Class A-3, Class A-3-X1, Class A-3-X2, Class A-4, Class A-4-X1, Class A-4-X2, Class A-S, Class A-S-X1 and Class A-S-X2 trust components will be distributed pro rata to the corresponding classes of Exchangeable Certificates representing interests therein in accordance with their Class Percentage Interests therein as described below under “Exchangeable Certificates.” |
| Interest and Principal Entitlements: | The interest entitlement of each class of Offered Certificates on each distribution date generally will be the interest accrued during the related interest accrual period on the related certificate balance or notional amount at the related pass-through rate, net of any prepayment interest shortfalls allocated to that class for such |
This is not a research report and was not prepared by any Underwriter’s research department. Please see additional important information and qualifications at the end of this Term Sheet.
8
| BANK 2020-BNK29 | Structural Overview |
| distribution date as described below. If prepayment interest shortfalls arise from voluntary prepayments on serviced mortgage loans during any collection period, the applicable master servicer is required to make a limited compensating interest payment to offset those shortfalls. See “Description of the Certificates—Prepayment Interest Shortfalls” in the Preliminary Prospectus. The remaining amount of prepayment interest shortfalls will be allocated between the RR Interest, on one hand, and the Non-Retained Certificates, on the other hand, in accordance with their respective Percentage Allocation Entitlements. The prepayment interest shortfalls allocated to the Non-Retained Certificates will be allocated among such classes of certificates (other than the Exchangeable Certificates) and trust components that are entitled to interest, on a pro rata basis, based on their respective amounts of accrued interest for the related distribution date, to reduce the interest entitlement on each such class of certificates and trust components. For any distribution date, prepayment interest shortfalls allocated to a trust component will be allocated among the related classes of Exchangeable Certificates, pro rata, in accordance with their respective interest accrual amounts for that distribution date. If a class of certificates or trust component receives less than the entirety of its interest entitlement on any distribution date, then the shortfall (excluding any shortfall due to prepayment interest shortfalls), together with interest thereon, will be added to its interest entitlement for the next succeeding distribution date.
The aggregate principal distribution amount for each distribution date generally will be the aggregate amount of principal received or advanced in respect of the mortgage loans, net of any non-recoverable advances and interest thereon and any workout-delayed reimbursement amounts that are reimbursed to the applicable master servicer or the trustee during the related collection period. Non-recoverable advances and interest thereon are reimbursable from principal collections before reimbursement from other amounts. Workout-delayed reimbursement amounts will be reimbursable from principal collections. The Non-Retained Certificates and the RR Interest will be entitled to their respective Percentage Allocation Entitlements of the aggregate principal distribution amount. | |
| Exchangeable Certificates: | Certificates of each class of Exchangeable Certificates may be exchanged for certificates of the corresponding classes of Exchangeable Certificates set forth next to such class in the table below, and vice versa. Following any exchange of certificates of one or more classes of Exchangeable Certificates (the applicable “Surrendered Classes”) for certificates of one or more classes of other Exchangeable Certificates (the applicable “Received Classes”), the Class Percentage Interests (as defined below) of the outstanding principal balances or notional amounts of the Corresponding Trust Components that are represented by the Surrendered Classes (and consequently their related certificate balances or notional amounts) will be decreased, and those of the Received Classes (and consequently their related certificate balances or notional amounts) will be increased. The dollar denomination of the certificates of each of the Received Classes must be equal to the dollar denomination of the certificates of each of the Surrendered Classes. No fee will be required with respect to any exchange of Exchangeable Certificates. |
| Surrendered Classes (or Received Classes) of Certificates | Received Classes (or Surrendered Classes) of Certificates | |
| Class A-3 | Class A-3-1, Class A-3-X1 | |
| Class A-3 | Class A-3-2, Class A-3-X2 | |
| Class A-4 | Class A-4-1, Class A-4-X1 | |
| Class A-4 | Class A-4-2, Class A-4-X2 | |
| Class A-S | Class A-S-1, Class A-S-X1 | |
| Class A-S | Class A-S-2, Class A-S-X2 |
| On the closing date, the issuing entity will issue the following “trust components,” each with the initial principal balance (or, if such trust component has an “X” suffix, notional amount) and pass-through rate set forth next to it in the table below. Each trust component with an “X” suffix will not be entitled to distributions of principal. |
| Trust Component | Initial Principal Balance or Notional Amount | Pass-Through Rate | |
| Class A-3 | See footnote (9) to the first table above under “Structural Overview” | Class A-3 certificate pass-through rate minus 1.00% | |
| Class A-3-X1 | Equal to Class A-3 trust component principal balance | 0.50% | |
| Class A-3-X2 | Equal to Class A-3 trust component principal balance | 0.50% | |
| Class A-4 | See footnote (9) to the first table above under “Structural Overview” | Class A-4 certificate pass-through rate minus 1.00% | |
| Class A-4-X1 | Equal to Class A-4 trust component principal balance | 0.50% | |
| Class A-4-X2 | Equal to Class A-4 trust component principal balance | 0.50% | |
| Class A-S | $47,587,000 | Class A-S certificate pass-through rate minus 1.00% | |
| Class A-S-X1 | Equal to Class A-S trust component principal balance | 0.50% | |
| Class A-S-X2 | Equal to Class A-S trust component principal balance | 0.50% |
| Each class of Exchangeable Certificates represents an undivided beneficial ownership interest in the trust components set forth next to it in the table below (the “Corresponding Trust Components”). Each class of |
This is not a research report and was not prepared by any Underwriter’s research department. Please see additional important information and qualifications at the end of this Term Sheet.
9
| BANK 2020-BNK29 | Structural Overview |
| Exchangeable Certificates has a pass-through rate equal to the sum of the pass-through rates of the Corresponding Trust Components and represents a percentage interest (the related “Class Percentage Interest”) in each Corresponding Trust Component, including principal and interest payable thereon (and reimbursement of losses allocable thereto), equal to (x) the certificate balance (or, if such class has an “X” suffix, notional amount) of such class of certificates, divided by (y) the principal balance of the Class A-3 trust component (if such class of Exchangeable Certificates has an “A-3” designation), the Class A-4 trust component (if such class of Exchangeable Certificates has an “A-4” designation) or the Class A-S trust component (if such class of Exchangeable Certificates has an “A-S” designation). |
| Group of Exchangeable Certificates | Class of Exchangeable Certificates | Corresponding Trust Components | |
| Class A-3 | Class A-3, Class A-3-X1, Class A-3-X2 | ||
| Class A-3-1 | Class A-3, Class A-3-X2 | ||
| “Class A-3 Exchangeable Certificates” | Class A-3-2 | Class A-3 | |
| Class A-3-X1 | Class A-3-X1 | ||
| Class A-3-X2 | Class A-3-X1, Class A-3-X2 | ||
| Class A-4 | Class A-4, Class A-4-X1, Class A-4-X2 | ||
| Class A-4-1 | Class A-4, Class A-4-X2 | ||
| “Class A-4 Exchangeable Certificates” | Class A-4-2 | Class A-4 | |
| Class A-4-X1 | Class A-4-X1 | ||
| Class A-4-X2 | Class A-4-X1, Class A-4-X2 | ||
| Class A-S | Class A-S, Class A-S-X1, Class A-S-X2 | ||
| Class A-S-1 | Class A-S, Class A-S-X2 | ||
| “Class A-S Exchangeable Certificates” | Class A-S-2 | Class A-S | |
| Class A-S-X1 | Class A-S-X1 | ||
| Class A-S-X2 | Class A-S-X1, Class A-S-X2 |
The maximum certificate balance or notional amount of each class of Class A-3 Exchangeable Certificates that could be issued in an exchange is equal to the principal balance of the Class A-3 trust component, the maximum certificate balance or notional amount of each class of Class A-4 Exchangeable Certificates that could be issued in an exchange is equal to the principal balance of the Class A-4 trust component, and the maximum certificate balance or notional amount of each class of Class A-S Exchangeable Certificates that could be issued in an exchange is equal to the principal balance of the Class A-S trust component. The maximum certificate balances of Class A-3, Class A-4 and Class A-S certificates (subject to the constraint on the aggregate initial principal balance of the Class A-3 and Class A-4 trust components discussed in footnote (9) to the first table above under “Structural Overview”) will be issued on the closing date, and the certificate balance or notional amount of each other class of Exchangeable Certificates will be equal to zero on the closing date.
Each class of Class A-3 Exchangeable Certificates, Class A-4 Exchangeable Certificates and Class A-S Exchangeable Certificates will have a certificate balance or notional amount equal to its Class Percentage Interest multiplied by the principal balance of the Class A-3 Trust Component, Class A-4 Trust Component or Class A-S Trust Component, respectively. Each class of Class A-3 Exchangeable Certificates, Class A-4 Exchangeable Certificates and Class A-S Exchangeable Certificates with a certificate balance will have the same approximate initial credit support percentage, Expected Weighted Average Life, Expected Principal Window, Certificate Principal UW NOI Debt Yield and Certificate Principal to Value Ratio as the Class A-3 Certificates, Class A-4 Certificates or Class A-S Certificates, respectively, shown above. | |
| Special Servicer Compensation: | The principal compensation to be paid to a special servicer in respect of its special servicing activities will be the special servicing fee, the workout fee and the liquidation fee.
The special servicing fee for each distribution date is calculated based on the outstanding principal balance of each serviced mortgage loan that is a specially serviced mortgage loan (and any related serviced companion loan) or as to which the related mortgaged property has become an REO property at the special servicing fee rate, which will be a rate equal to the greater of 0.25000% per annum and the per annum rate that would result in a special servicing fee for the related month of $5,000. The special servicing fee will be payable monthly, first, from liquidation proceeds, insurance and condemnation proceeds, and other collections in respect of the related specially serviced mortgage loan or REO property and, then, from general collections on all the mortgage loans and any REO properties.
Each applicable special servicer will also be entitled to (i) liquidation fees generally equal to 1.0% (or, if such rate would result in an aggregate liquidation fee less than $25,000, then the liquidation fee rate will be equal to the lesser of (i) 3.0% and (ii) such lower rate as would result in an aggregate liquidation fee equal to $25,000) of liquidation proceeds and certain other collections in respect of a specially serviced mortgage loan (and any related serviced companion loan) or related REO property and of amounts received in respect of mortgage loan repurchases by the related mortgage loan sellers and (ii) workout fees generally equal to 1.0% of interest (other than post-ARD excess interest on mortgage loans with anticipated repayment dates and other than default interest) and principal payments made in respect of a rehabilitated mortgage loan (and any related serviced companion loan), subject to a floor of $25,000 with respect to any mortgage loan, whole loan or related REO property, and in the case of each of clause (i) and (ii), subject to certain adjustments and exceptions as described in the Preliminary Prospectus under “Pooling and Servicing Agreement—Servicing and Other Compensation and Payment of Expenses—Special Servicing Compensation”. |
This is not a research report and was not prepared by any Underwriter’s research department. Please see additional important information and qualifications at the end of this Term Sheet.
10
| BANK 2020-BNK29 | Structural Overview |
With respect to any non-serviced mortgage loan, the related special servicer under the related other pooling and servicing agreement pursuant to which such mortgage loan is being serviced will be entitled to similar compensation as that described above with respect to such non-serviced mortgage loan under such other pooling and servicing agreement as further described in the Preliminary Prospectus, although any related fees may accrue at a different rate and there may be a higher (or no) cap on liquidation and workout fees. | |
| Prepayment Premiums/Yield Maintenance Charges: |
If any yield maintenance charge or prepayment premium is collected during any collection period with respect to any mortgage loan, then on the immediately succeeding distribution date, the certificate administrator will pay:
(i) to the Non-Retained Certificates, in the following amounts: |
| (a) to the holders of each class of the Class A-1, Class A-SB, Class A-3, Class A-3-1, Class A-3-2, Class A-4, Class A-4-1, Class A-4-2, Class A-S, Class A-S-1, Class A-S-2, Class B, Class C, Class D and Class E certificates, the product of (x) the Non-Retained Certificates’ Percentage Allocation Entitlement of such yield maintenance charge or prepayment premium, (y) the related Base Interest Fraction for such class and the applicable principal prepayment, and (z) a fraction, the numerator of which is equal to the amount of principal distributed to such class for that distribution date, and the denominator of which is the total amount of principal distributed to the Class A-1, Class A-SB, Class B, Class C, Class D and Class E certificates and the Class A-3 Exchangeable Certificates, the Class A-4 Exchangeable Certificates and the Class A-S Exchangeable Certificates for that distribution date, (b) to the holders of the Class A-3-X1 certificates, the product of (x) the Non-Retained Certificates’ Percentage Allocation Entitlement of such yield maintenance charge or prepayment premium, (y) a fraction, the numerator of which is equal to the amount of principal distributed to the Class A-3-1 certificates for that distribution date, and the denominator of which is the total amount of principal distributed to the Class A-1, Class A-SB, Class B, Class C, Class D and Class E certificates and the Class A-3 Exchangeable Certificates, the Class A-4 Exchangeable Certificates and the Class A-S Exchangeable Certificates for that distribution date, and (z) the difference between (1) the Base Interest Fraction for the Class A-3 certificates and the applicable principal prepayment and (2) the Base Interest Fraction for the Class A-3-1 certificates and the applicable principal prepayment, (c) to the holders of the Class A-3-X2 certificates, the product of (x) the Non-Retained Certificates’ Percentage Allocation Entitlement of such yield maintenance charge or prepayment premium, (y) a fraction, the numerator of which is equal to the amount of principal distributed to the Class A-3-2 certificates for that distribution date, and the denominator of which is the total amount of principal distributed to the Class A-1, Class A-SB, Class B, Class C, Class D and Class E certificates and the Class A-3 Exchangeable Certificates, the Class A-4 Exchangeable Certificates and the Class A-S Exchangeable Certificates for that distribution date, and (z) the difference between (1) the Base Interest Fraction for the Class A-3 certificates and the applicable principal prepayment and (2) the Base Interest Fraction for the Class A-3-2 certificates and the applicable principal prepayment, (d) to the holders of the Class A-4-X1 certificates, the product of (x) the Non-Retained Certificates’ Percentage Allocation Entitlement of such yield maintenance charge or prepayment premium, (y) a fraction, the numerator of which is equal to the amount of principal distributed to the Class A-4-1 certificates for that distribution date, and the denominator of which is the total amount of principal distributed to the Class A-1, Class A-SB, Class B, Class C, Class D and Class E certificates and the Class A-3 Exchangeable Certificates, the Class A-4 Exchangeable Certificates and the Class A-S Exchangeable Certificates for that distribution date, and (z) the difference between (1) the Base Interest Fraction for the Class A-4 certificates and the applicable principal prepayment and (2) the Base Interest Fraction for the Class A-4-1 certificates and the applicable principal prepayment, (e) to the holders of the Class A-4-X2 certificates, the product of (x) the Non-Retained Certificates’ Percentage Allocation Entitlement of such yield maintenance charge or prepayment premium, (y) a fraction, the numerator of which is equal to the amount of principal distributed to the Class A-4-2 certificates for that distribution date, and the denominator of which is the total amount of principal distributed to the Class A-1, Class A-SB, Class B, Class C, Class D and Class E certificates and the Class A-3 Exchangeable Certificates, the Class A-4 Exchangeable Certificates and the Class A-S Exchangeable Certificates for that distribution date, and (z) the difference between (1) the Base Interest Fraction for the Class A-4 certificates and the applicable principal prepayment and (2) the Base Interest Fraction for the Class A-4-2 certificates and the applicable principal prepayment, (f) to the holders of the Class A-S-X1 certificates, the product of (x) the Non-Retained Certificates’ Percentage Allocation Entitlement of such yield maintenance charge or prepayment premium, (y) a fraction, the numerator of which is equal to the amount of principal distributed to the Class A-S-1 certificates for that distribution date, and the denominator of which is the total amount of principal distributed to the Class A-1, Class A-SB, Class B, Class C, Class D and Class E certificates and the Class A-3 Exchangeable Certificates, the Class A-4 Exchangeable Certificates and the Class A-S Exchangeable Certificates for that distribution date, and (z) the difference between (1) the Base Interest Fraction for the Class A-S certificates and the applicable principal prepayment and (2) the Base Interest Fraction for the Class A-S-1 certificates and the applicable principal prepayment, |
This is not a research report and was not prepared by any Underwriter’s research department. Please see additional important information and qualifications at the end of this Term Sheet.
11
| BANK 2020-BNK29 | Structural Overview |
| (g) to the holders of the Class A-S-X2 certificates, the product of (x) the Non-Retained Certificates’ Percentage Allocation Entitlement of such yield maintenance charge or prepayment premium, (y) a fraction, the numerator of which is equal to the amount of principal distributed to the Class A-S-2 certificates for that distribution date, and the denominator of which is the total amount of principal distributed to the Class A-1, Class A-SB, Class B, Class C, Class D and Class E certificates and the Class A-3 Exchangeable Certificates, the Class A-4 Exchangeable Certificates and the Class A-S Exchangeable Certificates for that distribution date, and (z) the difference between (1) the Base Interest Fraction for the Class A-S certificates and the applicable principal prepayment and (2) the Base Interest Fraction for the Class A-S-2 certificates and the applicable principal prepayment, (h) to the holders of the Class X-A certificates, the excess, if any, of (x) the product of (1) the Non-Retained Certificates’ Percentage Allocation Entitlement of such yield maintenance charge or prepayment premium and (2) a fraction, the numerator of which is equal to the amount of principal distributed to the Class A-1 and Class A-SB certificates and the Class A-3 Exchangeable Certificates and the Class A-4 Exchangeable Certificates for that distribution date, and the denominator of which is the total amount of principal distributed to the Class A-1, Class A-SB, Class B, Class C, Class D and Class E certificates and the Class A-3 Exchangeable Certificates, the Class A-4 Exchangeable Certificates and the Class A-S Exchangeable Certificates for that distribution date, over (y) the amount of such yield maintenance charge or prepayment premium distributed to the Class A-1 and Class A-SB certificates and the Class A-3 Exchangeable Certificates and the Class A-4 Exchangeable Certificates as described above, (i) to the holders of the Class X-B certificates, the excess, if any, of (x) the product of (1) the Non-Retained Certificates’ Percentage Allocation Entitlement of such yield maintenance charge or prepayment premium and (2) a fraction, the numerator of which is equal to the amount of principal distributed to the Class A-S Exchangeable Certificates and the Class B and Class C certificates for that distribution date, and the denominator of which is the total amount of principal distributed to the Class A-1, Class A-SB, Class B, Class C, Class D and Class E certificates and the Class A-3 Exchangeable Certificates, the Class A-4 Exchangeable Certificates and the Class A-S Exchangeable Certificates for that distribution date, over (y) the amount of such yield maintenance charge or prepayment premium distributed to the Class A-S Exchangeable Certificates and the Class B and Class C certificates as described above, and (j) to the holders of the Class X-D certificates, any remaining portion of the Non-Retained Certificates’ Percentage Allocation Entitlement of such yield maintenance charge or prepayment premium not distributed as described above in this clause (i), | |
| and (ii) to the RR Interest, its Percentage Allocation Entitlement of such yield maintenance charge or prepayment premium. All yield maintenance charges and prepayment premiums referred to above will be net of any liquidation fees payable therefrom. No yield maintenance charges or prepayment premiums will be distributed to the holders of the Class X-F, Class X-G, Class X-H, Class X-J, Class X-K, Class X-L, Class F, Class G, Class H, Class J, Class K, Class L, Class V or Class R Certificates. “Base Interest Fraction” means, with respect to any principal prepayment of any mortgage loan that provides for the payment of a yield maintenance charge or prepayment premium, and with respect to any class of principal balance certificates (other than the RR Interest), a fraction (A) the numerator of which is the greater of (x) zero and (y) the difference between (i) the pass-through rate on that class, and (ii) the applicable discount rate and (B) the denominator of which is the difference between (i) the mortgage interest rate on the related mortgage loan and (ii) the applicable discount rate; provided, that: under no circumstances will the Base Interest Fraction be greater than one; if the discount rate referred to above is greater than or equal to both the mortgage interest rate on the related mortgage loan and the pass-through rate on that class, then the Base Interest Fraction will equal zero; and if the discount rate referred to above is greater than or equal to the mortgage interest rate on the related mortgage loan and is less than the pass-through rate on that class, then the Base Interest Fraction will be equal to 1.0. Consistent with the foregoing, the Base Interest Fraction is equal to: |
| (Pass-Through Rate – Discount Rate) | |||
| (Mortgage Rate – Discount Rate) |
| Realized Losses: | On each distribution date, immediately following the distributions to be made to the certificateholders on that date, the certificate administrator is required to calculate the amount, if any, by which (i) the aggregate stated principal balance of the mortgage loans, including any successor REO loans, expected to be outstanding immediately following that distribution date is less than (ii) the then aggregate certificate balance of the principal balance certificates after giving effect to distributions of principal on that distribution date. The Non-Retained Certificates’ Percentage Allocation Entitlement of such amount will be applied to the Class L, Class K, Class J, Class H, Class G, Class F, Class E, Class D, Class C and Class B certificates and the Class A-S trust component, in that order, in each case until the related certificate or principal balance has been reduced to zero, and then to the Class A-1 and Class A-SB certificates and the Class A-3 and Class A-4 trust components, pro rata based upon their respective certificate or principal balances, until their respective certificate or principal balances have been reduced to zero. The RR Interest’s Percentage Allocation Entitlement of such amount will be applied to the RR Interest until the related RR Interest balance has been reduced to zero. |
This is not a research report and was not prepared by any Underwriter’s research department. Please see additional important information and qualifications at the end of this Term Sheet.
12
| BANK 2020-BNK29 | Structural Overview |
Any portion of such amount applied to the Class A-3, Class A-4 or Class A-S trust component will reduce the certificate balance or notional amount of each class of certificates in the related group of Exchangeable Certificates by an amount equal to the product of (x) its certificate balance or notional amount, divided by the principal balance of such trust component prior to the applicable reduction, and (y) the amount applied to such trust component. | |
| Serviced Whole Loans: | Each of the following mortgaged properties or portfolio of mortgaged properties secures a mortgage loan and one or more pari passu promissory notes and, in some cases, one or more generally subordinate promissory notes (each, a “serviced companion loan”) that will be serviced pursuant to the related intercreditor agreement and the pooling and servicing agreement for this transaction: 250 West 57th Street, Coleman Highline, 120 Wall Street, McDonald’s Global HQ (prior to the securitization of the related promissory note designated Note A-2), The Arboretum, 1890 Ranch and Courtyard Marriott Solana Beach (prior to the securitization of the related control note). With respect to each such mortgaged property or portfolio of mortgaged properties, the related mortgage loan, together with the related serviced companion loan(s), is referred to herein (for so long as it is serviced under the pooling and servicing agreement for this transaction) as a “serviced whole loan.” Each serviced companion loan is not part of the mortgage pool and may be contributed to one or more future securitization transactions (if not already securitized) or may be otherwise transferred at any time, subject to compliance with the related intercreditor agreement. See the table below entitled “Mortgage Loans with Pari Passu Companion Loans,” as well as “Description of the Mortgage Pool—The Whole Loans” in the Preliminary Prospectus, for additional information regarding each such whole loan.
With respect to each of the McDonald’s Global HQ whole loan and the Courtyard Marriott Solana Beach whole loan (each a “servicing shift whole loan”), the pooling and servicing agreement for this transaction will govern servicing of such whole loan until the securitization of the related control note (or, in the case of the McDonald’s Global HQ whole loan, until the securitization of the related promissory note designated Note A-2); however, servicing of such whole loan will generally be directed by the holder of the related control note (which is not included in this securitization), and such holder will have the right to replace the special servicer with respect to the related whole loan with or without cause. After the securitization of such promissory note, such loan will cease to be a serviced whole loan and will be serviced pursuant to the pooling and servicing agreement for another securitization transaction (see “—Non-Serviced Whole Loans” below). Notwithstanding any of the foregoing to the contrary, under the McDonald’s Global HQ intercreditor agreement, control rights with respect to the McDonald’s Global HQ whole loan will be exercisable by the holder of the McDonald’s Global HQ mortgage loan included in the BANK 2020-BNK29 trust, but only until the controlling companion loan is sold to a third party or securitized. |
| Non-Serviced Whole Loans: | Each of the following mortgaged properties or portfolio of mortgaged properties secures a mortgage loan (each, a “non-serviced mortgage loan”), one or more pari passu promissory notes and, in some cases, one or more generally subordinate promissory notes (each such promissory note, a “non-serviced companion loan”) that will be serviced pursuant to the related intercreditor agreement and the pooling and servicing agreement or trust and servicing agreement (referred to herein as a related “pooling and servicing agreement”) for another securitization transaction: Grace Building, McDonald’s Global HQ (after the securitization of the related promissory note designated Note A-2), 711 Fifth Avenue, Chasewood Technology Park, ExchangeRight Net Leased Portfolio #39 and Courtyard Marriott Solana Beach (after the securitization of the related control note). With respect to each such mortgaged property or portfolio of mortgaged properties, the related mortgage loan, together with the related non-serviced companion loan(s), is referred to herein (for so long as it is serviced under the pooling and servicing agreement for another securitization transaction) as a “non-serviced whole loan.” Each non-serviced companion loan is not part of the mortgage pool and may be contributed to one or more future securitization transactions (if not already securitized) or may be otherwise transferred at any time, subject to compliance with the related intercreditor agreement. Servicing of each non-serviced whole loan will generally be directed by the holder of the related control note (or, if such control note is included in a securitization, the directing certificateholder thereunder (or other party designated thereunder to exercise the rights of such control note)), and such holder will have the right to replace the special servicer with respect to the related whole loan with or without cause. See the tables below entitled “Mortgage Loans with Pari Passu Companion Loans” and “Mortgage Loans with Subordinate Debt,” as well as “Description of the Mortgage Pool—The Whole Loans” in the Preliminary Prospectus, for additional information regarding each such whole loan. |
| Directing Certificateholder/ Controlling Class: |
The “Directing Certificateholder” will be (i) with respect to a servicing shift mortgage loan, the related Loan-Specific Directing Certificateholder, and (ii) with respect to each other mortgage loan, the Controlling Class Certificateholder (or its representative) selected by more than 50% (by certificate balance) of the Controlling Class Certificateholders; provided, that (1) absent that selection, (2) until a Directing Certificateholder is so selected or (3) upon receipt of a notice from a majority of the Controlling Class Certificateholders (by certificate balance) that a Directing Certificateholder is no longer designated, the Controlling Class Certificateholder that owns the largest aggregate certificate balance of the Controlling Class (or its representative) will be the Directing Certificateholder; provided, that (a) in the case of clause (3), if no one holder owns the largest aggregate certificate balance of the Controlling Class, then there will be no Directing Certificateholder until appointed in accordance with the terms of the pooling and servicing agreement, and (b) the certificate administrator and the other parties to the pooling and servicing agreement will be entitled to assume that the identity of the Directing Certificateholder has not changed until such parties receive written notice of a replacement of the Directing Certificateholder from a party holding the requisite interest in the Controlling Class (as confirmed by the certificate registrar), or the resignation of the then current Directing Certificateholder. |
This is not a research report and was not prepared by any Underwriter’s research department. Please see additional important information and qualifications at the end of this Term Sheet.
13
| BANK 2020-BNK29 | Structural Overview |
As used herein, the term “Directing Certificateholder,” unless used in relation to a Servicing Shift Mortgage Loan, means the entity determined pursuant to clause (ii) of the definition of such term.
The “Loan-Specific Directing Certificateholder” with respect to a servicing shift mortgage loan is the “controlling holder”, the “directing certificateholder”, the “directing holder”, “directing lender” or any analogous concept under the related intercreditor agreement. Prior to the securitization of the related control note (or, with respect to the McDonald’s Global HQ whole loan, promissory note A-2), the Loan-Specific Directing Certificateholder with respect to a servicing shift mortgage loan will be the holder of the related control note. On and after the securitization of the related control note (or, with respect to the McDonald’s Global HQ whole loan, promissory note A-2), there will be no Loan-Specific Directing Certificateholder under the PSA with respect to such servicing shift mortgage loan.
The “Controlling Class” will be, as of any time of determination, the most subordinate class of Control Eligible Certificates then outstanding that has an aggregate certificate balance (as notionally reduced by any Cumulative Appraisal Reduction Amounts (as defined below) allocable to such class) at least equal to 25% of the initial certificate balance of that class; provided, that if at any time the certificate balances of the certificates other than the Control Eligible Certificates and the RR Interest have been reduced to zero as a result of principal payments on the mortgage loans, then the Controlling Class will be the most subordinate class of Control Eligible Certificates that has a certificate balance greater than zero without regard to any Cumulative Appraisal Reduction Amounts. The Controlling Class as of the closing date will be the Class L certificates.
The “Control Eligible Certificates” will be any of the Class K and Class L certificates. | |
| Control Rights: | Prior to a Control Termination Event, the Directing Certificateholder will have certain consent and consultation rights under the pooling and servicing agreement with respect to certain major decisions and other matters. A “Control Termination Event” will occur when (i) the Class K certificates have a certificate balance (taking into account the application of the allocable portion of any Cumulative Appraisal Reduction Amounts to notionally reduce the certificate balance thereof) of less than 25% of the initial certificate balance of that class or (ii) a holder of the Class K certificates is the majority Controlling Class Certificateholder and has irrevocably waived its right, in writing, to exercise any of the rights of the Controlling Class Certificateholder and such rights have not been reinstated to a successor controlling class certificateholder; provided that no Control Termination Event may occur with respect to the Loan-Specific Directing Certificateholder, and the term “Control Termination Event” will not be applicable to the Loan-Specific Directing Certificateholder; provided, further, that a Control Termination Event will be deemed not continuing in the event that the certificate balances of the principal balance certificates other than the Control Eligible Certificates and the RR Interest have been reduced to zero as a result of principal payments on the mortgage loans.
After the occurrence of a Control Termination Event but prior to the occurrence of a Consultation Termination Event, the Directing Certificateholder will not have any consent rights, but the Directing Certificateholder will have certain non-binding consultation rights under the pooling and servicing agreement with respect to certain major decisions and other matters. A “Consultation Termination Event” will occur when (i) no class of Control Eligible Certificates has a certificate balance (without regard to the application of the allocable portion of any Cumulative Appraisal Reduction Amounts) at least equal to 25% of the initial certificate balance of that class; or (ii) a holder of the Class K certificates is the majority Controlling Class Certificateholder and has irrevocably waived its right, in writing, to exercise any of the rights of the Controlling Class Certificateholder and such rights have not been reinstated to a successor controlling class certificateholder; provided that no Consultation Termination Event resulting solely from the operation of clause (ii) will be deemed to have existed or be in continuance with respect to a successor holder of the Class K certificates that has not irrevocably waived its right to exercise any of the rights of the Controlling Class Certificateholder; provided, further, that no Consultation Termination Event may occur with respect to the Loan-Specific Directing Certificateholder, and the term “Consultation Termination Event” will not be applicable to the Loan-Specific Directing Certificateholder; provided, further, that a Consultation Termination Event will be deemed not continuing in the event that the certificate balances of the principal balance certificates other than the Control Eligible Certificates and the RR Interest have been reduced to zero as a result of principal payments on the mortgage loans.
In the event of any transfer of the Class K certificates by a Controlling Class Certificateholder that had irrevocably waived its rights, the successor Controlling Class Certificateholder that purchased such Class K certificates, even if it does not waive its rights, will not have any consent rights with respect to any Mortgage Loan that became a Specially Serviced Loan prior to such successor Controlling Class Certificateholder’s purchase of such Class K certificates and had not become a Corrected Loan prior to such purchase until such Mortgage Loan becomes a Corrected Loan.
After the occurrence of a Consultation Termination Event, the Directing Certificateholder will not have any consent or consultation rights, except with respect to any rights expressly set forth in the pooling and servicing agreement, and the operating advisor will retain certain non-binding consultation rights under the pooling and servicing agreement with respect to certain major decisions and other matters.
Notwithstanding the proviso to the definitions of “Control Termination Event” and “Consultation Termination Event”, a Control Termination Event and a Consultation Termination Event will each be deemed to have occurred with respect to any Excluded Loan with respect to the Directing Certificateholder or the holder of the majority of the Controlling Class, and neither the Directing Certificateholder nor any Controlling Class Certificateholder will have any consent or consultation rights with respect to the servicing of such Excluded Loan.
An “Excluded Loan” means (a) with respect to the Directing Certificateholder or the holder of the majority of the Controlling Class, a mortgage loan or whole loan with respect to which, as of any date of determination, |
This is not a research report and was not prepared by any Underwriter’s research department. Please see additional important information and qualifications at the end of this Term Sheet.
14
| BANK 2020-BNK29 | Structural Overview |
the Directing Certificateholder or the holder of the majority of the Controlling Class is a Borrower Party or (b) with respect to the Risk Retention Consultation Party or the holder of the majority of the RR Interest, a mortgage loan or whole loan with respect to which, as of any date of determination, the Risk Retention Consultation Party or the holder of the majority of the RR Interest is a Borrower Party. It is expected that there will be no Excluded Loans with respect to this securitization on the closing date.
“Borrower Party” means a borrower, a mortgagor, a manager of a mortgaged property, the holder of a mezzanine loan that has been accelerated or as to which foreclosure or enforcement proceedings have been commenced against the equity collateral pledged to secure the related mezzanine loan, or any Borrower Party Affiliate.
“Borrower Party Affiliate” means, with respect to a borrower, a mortgagor, a manager of a mortgaged property or the holder of a mezzanine loan that has been accelerated or as to which foreclosure or enforcement proceedings have been commenced against the equity collateral pledged to secure the related mezzanine loan, (a) any other person controlling or controlled by or under common control with such borrower, mortgagor, manager or mezzanine lender, as applicable, or (b) any other person owning, directly or indirectly, 25% or more of the beneficial interests in such borrower, mortgagor, manager or mezzanine lender, as applicable. For the purposes of this definition, “control” when used with respect to any specified person means the power to direct the management and policies of such person, directly or indirectly, whether through the ownership of voting securities, by contract or otherwise and the terms “controlling” and “controlled” have meanings correlative to the foregoing.
Notwithstanding any of the foregoing to the contrary, if any mortgage loan is part of a whole loan, the Directing Certificateholder’s consent and/or consultation rights with respect thereto may be limited as described in the Preliminary Prospectus. In particular, with respect to each non-serviced whole loan and each servicing shift whole loan, the Directing Certificateholder (other than a Loan-Specific Directing Certificateholder) will only have certain consultation rights with respect to certain major decisions and other matters related to such whole loan, in each case only prior to a Control Termination Event or Consultation Termination Event, as applicable, and the Loan-Specific Directing Certificateholder will be entitled to similar consent and/or consultation rights with respect to such whole loan. In addition, with respect to any serviced A/B whole loan, for so long as the holder of the related subordinate companion loan is the controlling note holder, the holder of such subordinate companion loan (rather than the Directing Certificateholder) will be entitled to exercise such consent and consultation rights with respect to such whole loan. | |
| Appraisal Reduction Amounts and Collateral Deficiency Amounts: |
An “Appraisal Reduction Amount” generally will be created in the amount, if any, by which the principal balance of a required appraisal loan (which is a mortgage loan with respect to which certain defaults, modifications or insolvency events have occurred as further described in the Preliminary Prospectus) plus other amounts overdue or advanced in connection with such mortgage loan exceeds 90% of the appraised value of the related mortgaged property plus certain escrows and reserves (including letters of credit) held with respect to the mortgage loan.
A mortgage loan will cease to be subject to an Appraisal Reduction Amount when it has been brought current for at least three consecutive months, no additional event of default is foreseeable in the reasonable judgment of the applicable special servicer and no other circumstances exist that would cause such mortgage loan or any related companion loan to be a specially serviced loan; however, a “Collateral Deficiency Amount” may exist with respect to any mortgage loan that is modified into an AB loan structure (an “AB Modified Loan”) and remains a corrected mortgage loan and, if so, will generally equal the excess of (i) the stated principal balance of such AB Modified Loan (taking into account the related junior note(s) and any pari passu notes included therein), over (ii) the sum of (in the case of a whole loan, solely to the extent allocable to the subject mortgage loan) (x) the most recent appraised value for the related mortgaged property or mortgaged properties, plus (y) solely to the extent not reflected or taken into account in such appraised value (or in the calculation of any related Appraisal Reduction Amount) and to the extent on deposit with, or otherwise under the control of, the lender as of the date of such determination, any capital or additional collateral contributed by the related borrower at the time the mortgage loan became (and as part of the modification related thereto) such AB Modified Loan for the benefit of the related mortgaged property or mortgaged properties (provided that in the case of an non-serviced mortgage loan, the amounts set forth in this clause (y) will be taken into account solely to the extent relevant information is received by the applicable special servicer), plus (z) any other escrows or reserves (in addition to any amounts set forth in the immediately preceding clause (y) and solely to the extent not reflected or taken into account in the calculation of any related Appraisal Reduction Amount) held by the lender in respect of such AB Modified Loan as of the date of such determination, which such excess, for the avoidance of doubt, will be determined separately from and exclude any related Appraisal Reduction Amounts.
As used herein, a “Cumulative Appraisal Reduction Amount” will be the sum of any Appraisal Reduction Amounts and any Collateral Deficiency Amounts.
Any Appraisal Reduction Amount in respect of any non-serviced mortgage loan generally will be calculated in accordance with the other servicing agreement pursuant to which such mortgage loan is being serviced, which calculations are expected to be generally similar to those provided for in the pooling and servicing agreement for this transaction.
If any mortgage loan is part of a whole loan, any Appraisal Reduction Amount or Collateral Deficiency Amount will (or effectively will) be calculated in respect of such whole loan taken as a whole and allocated, to the |
This is not a research report and was not prepared by any Underwriter’s research department. Please see additional important information and qualifications at the end of this Term Sheet.
15
| BANK 2020-BNK29 | Structural Overview |
| extent provided in the related intercreditor agreement and the related pooling and servicing agreement, first, to any related subordinate companion loan, and second, to the related mortgage loan and any pari passu companion loan on a pro rata basis by unpaid principal balance.
Appraisal Reduction Amounts will proportionately reduce the interest portion of debt service advances required to be made in respect of the related mortgage loan. Appraisal Reduction Amounts and Collateral Deficiency Amounts (in each case, to the extent of the Non-Retained Certificates’ Percentage Allocation Entitlement thereof) will be (i) taken into account in determining the identity of the controlling class entitled to appoint the Directing Certificateholder, the existence of a Control Termination Event and the allocation and/or exercise of voting rights for certain purposes (see “Directing Certificateholder/Controlling Class” above) and (ii) allocated to the following classes of certificates and trust components, in each case to notionally reduce their certificate balances or principal balances until the certificate balance or principal balance of each such class or trust component is notionally reduced to zero: the Class L, Class K, Class J, Class H, Class G, Class F, Class E, Class D, Class C and Class B certificates and the Class A-S trust component, in that order, and then pro rata to the Class A-1 and Class A-SB certificates and the Class A-3 and Class A-4 trust components. Appraisal Reduction Amounts and Collateral Deficiency Amounts allocated to each of the Class A-3, Class A-4 or Class A-S trust component will be allocated to the corresponding classes of Exchangeable Certificates with certificate balances pro rata to notionally reduce their certificate balances in accordance with their Class Percentage Interests therein.
Neither (i) a Payment Accommodation with respect to any mortgage loan or serviced whole loan nor (ii) any default or delinquency that would have existed but for such Payment Accommodation will constitute an appraisal reduction event, for so long as the related borrower is complying with the terms of such Payment Accommodation.
A “Payment Accommodation” for any mortgage loan or serviced whole loan means the entering into of any temporary forbearance agreement as a result of the COVID-19 emergency (and qualification as a COVID-19 emergency forbearance will be determined by the special servicer in its sole and absolute discretion in accordance with the Servicing Standard) relating to payment obligations or operating covenants under the related mortgage loan documents or the use of funds on deposit in any reserve account or escrow account for any purpose other than the explicit purpose described in the related mortgage loan documents, that in each case (i) is entered into by March 31, 2021, (ii) defers no greater than 3 monthly debt service payments (but no greater than 9 monthly debt service payments in the aggregate with any other Payment Accommodations) and (iii) requires full repayment of deferred payments, reserves and escrows by the date that is 12 months following the date of the first Payment Accommodation for such mortgage loan or serviced whole loan. | |
| Appraised-Out Class: | An “Appraised-Out Class” is any class of Control Eligible Certificates, the certificate balance of which (taking into account the application of the Non-Retained Certificates’ Percentage Allocation Entitlement of any Appraisal Reduction Amounts or Collateral Deficiency Amounts to notionally reduce the certificate balance of such class) has been reduced to less than 25% of its initial certificate balance. Any Appraised-Out Class may not exercise any direction, control, consent and/or similar rights of the Controlling Class until such time, if any, as such class is reinstated as the Controlling Class, and the rights of the Controlling Class will be exercised by the next most senior class of Control Eligible Certificates that is not an Appraised-Out Class, if any, during such period. |
| Appraisal Remedy: | The holders of the majority (by certificate balance) of an Appraised-Out Class (such holders, the “Requesting Holders”) will have the right, at their sole expense, to require the applicable special servicer to order (or, with respect to a non-serviced mortgage loan, require the applicable special servicer to request from the applicable non-serviced special servicer) a second appraisal of any mortgage loan (or serviced whole loan) for which an appraisal reduction event has occurred or as to which there exists a Collateral Deficiency Amount. With respect to any serviced mortgage loan, the applicable special servicer will be required to use its reasonable efforts to ensure that such appraisal is delivered within 30 days from receipt of the Requesting Holders’ written request and will be required to cause such appraisal to be prepared on an “as-is” basis by an MAI appraiser. With respect to any non-serviced mortgage loan, the applicable special servicer will be required to use commercially reasonable efforts to obtain such second appraisal from the applicable non-serviced special servicer. Upon receipt of such supplemental appraisal, the applicable special servicer will be required to determine, in accordance with the Servicing Standard, whether, based on its assessment of such supplemental appraisal, any recalculation of the applicable Appraisal Reduction Amount or Collateral Deficiency Amount is warranted and, if so warranted, such person will be required to recalculate such Appraisal Reduction Amount or Collateral Deficiency Amount, as applicable, based upon such supplemental appraisal as described above. If required by any such recalculation, the applicable Appraised-Out Class will be reinstated as the Controlling Class and each Appraised-Out Class will, if applicable, have its related certificate balance notionally restored to the extent required by such recalculation of the Appraisal Reduction Amount or Collateral Deficiency Amount, if applicable.
In addition, the Requesting Holders of any Appraised-Out Class will have the right to challenge the Appraisal Reduction Amount and to require the applicable special servicer to order an additional appraisal of any serviced mortgage loan as to which there exists a Collateral Deficiency Amount if an event has occurred at, or with respect to, the related mortgaged property or mortgaged properties that would have a material effect on its or their appraised value, and such special servicer is required to use reasonable efforts to obtain an appraisal from an MAI appraiser reasonably acceptable to such special servicer within 30 days from receipt of the Requesting Holders’ written request. |
This is not a research report and was not prepared by any Underwriter’s research department. Please see additional important information and qualifications at the end of this Term Sheet.
16
| BANK 2020-BNK29 | Structural Overview |
| Sale of Defaulted Loans: | Under certain circumstances the applicable special servicer may be required to use reasonable efforts to solicit offers for a defaulted serviced mortgage loan (and any related companion loan (to the extent provided under the related intercreditor agreement) and/or related REO properties).
The Directing Certificateholder will not have a right of first refusal to purchase a defaulted loan.
If the applicable special servicer does not receive an offer at least equal to the outstanding principal balance plus all accrued and unpaid interest and outstanding costs and expenses and certain other amounts specified in the pooling and servicing agreement (the “Par Purchase Price”), the applicable special servicer may purchase the defaulted loan or REO property at the Par Purchase Price or may accept the first cash offer received from any person that is determined to be a fair price for such defaulted loan or REO property. If multiple offers are received during the period designated by the applicable special servicer for receipt of offers, such special servicer is generally required to select the highest offer. The applicable special servicer will be required to determine whether any cash offer constitutes a fair price for any defaulted loan or REO property if the highest offeror is a person other than a party to the pooling and servicing agreement for this transaction (the “PSA”), the Directing Certificateholder, the Risk Retention Consultation Party, any sponsor, any Borrower Party, any independent contractor engaged by a special servicer, the trustee for the securitization of a related companion loan (with respect to a whole loan if it is a defaulted loan), any related companion loan holder or its representative, any holder of a related mezzanine loan or any known affiliate of any of the preceding entities (each, an “Interested Person”). If an offer is made by an Interested Person, the trustee will be required to determine (based upon the most recent appraisal conducted in accordance with the terms of the PSA) whether the offer constitutes a fair price for the defaulted loan or REO property unless (i) the offer is equal to or greater than the applicable Par Purchase Price and (ii) the offer is the highest offer received. Absent an offer at least equal to the Par Purchase Price, no offer from an Interested Person will constitute a fair price unless (x) it is the highest offer received and (y) at least two other offers are received from independent third parties. Neither the trustee nor any of its affiliates may make an offer for or purchase any specially serviced loan or REO property.
Notwithstanding any of the foregoing to the contrary, the applicable special servicer is not required to accept the highest offer and may accept a lower offer for a defaulted loan or REO property if such special servicer determines, in accordance with the Servicing Standard (and subject to the requirements of any related intercreditor agreement), that a rejection of such offer would be in the best interests of the certificateholders and any related companion loan holders as a collective whole as if they constituted a single lender (and with respect to a serviced A/B whole loan, taking into account the subordinate nature of any related subordinate companion loan), so long as such lower offer was not made by such special servicer or any of its affiliates.
If title to any mortgaged property is acquired by the trust fund, the applicable special servicer will generally be required to sell such mortgaged property prior to the close of the third calendar year beginning after the year of acquisition.
The foregoing applies to mortgage loans serviced under the PSA. With respect to any non-serviced whole loan, if the special servicer under the applicable pooling and servicing agreement determines to sell the related controlling companion loan if it becomes a defaulted loan, then the applicable special servicer will be required to sell the related whole loan, including the related mortgage loan included in the BANK 2020-BNK29 securitization trust and the related pari passu companion loan(s) and, under certain circumstances, any subordinate companion loan(s), as a single loan. In connection with any such sale, the special servicer under the applicable pooling and servicing agreement will be required to follow procedures substantially similar to those set forth above. |
| Risk Retention Consultation Party: | A risk retention consultation party may be appointed by the holder or holders of more than 50% of the RR Interest, by certificate balance. The majority RR Interest holder will have a continuing right to appoint, remove or replace the risk retention consultation party in its sole discretion. This right may be exercised at any time and from time to time. Except with respect to an Excluded Loan as to such party or the holder of the majority of the RR Interest, the risk retention consultation party will be entitled to consult with the applicable special servicer, upon request of the risk retention consultation party, with respect to certain material servicing actions proposed by such special servicer; provided, that prior to the occurrence and continuance of a Consultation Termination Event, such mortgage loan must also be a specially serviced mortgage loan. |
| Appointment and Replacement of each Special Servicer: |
The Directing Certificateholder will appoint each initial special servicer as of the closing date. Prior to the occurrence and continuance of a Control Termination Event, any special servicer may generally be replaced by the Directing Certificateholder with or without cause at any time.
After the occurrence and during the continuance of a Control Termination Event and upon (a) the written direction of holders of principal balance certificates evidencing not less than 25% of the voting rights of all classes of certificates (other than the RR Interest) entitled to principal (taking into account the application of Cumulative Appraisal Reduction Amounts to notionally reduce the certificate balances of classes to which such Cumulative Appraisal Reduction Amounts are allocable) requesting a vote to replace the applicable special servicer with a replacement special servicer, (b) payment by such requesting holders to the certificate administrator of all reasonable fees and expenses to be incurred by the certificate administrator in connection with administering such vote and (c) delivery by such holders of a rating agency confirmation from each applicable rating agency, the certificate administrator will be required to promptly post such notice on its internet website and by mail and conduct the solicitation of votes of all certificates in such regard, which requisite affirmative votes must be received within 180 days of the posting of such notice. Upon the written direction of holders of at least 66 |
This is not a research report and was not prepared by any Underwriter’s research department. Please see additional important information and qualifications at the end of this Term Sheet.
17
| BANK 2020-BNK29 | Structural Overview |
| 2/3% of a Certificateholder Quorum, the trustee will be required to immediately replace the applicable special servicer with a qualified replacement special servicer designated by such holders of certificates.
After the occurrence and during the continuance of a Consultation Termination Event, if the operating advisor determines that the applicable special servicer is not performing its duties as required under the pooling and servicing agreement or is otherwise not acting in accordance with the Servicing Standard, the operating advisor may also recommend the replacement of such special servicer. The operating advisor’s recommendation to replace such special servicer must be confirmed by an affirmative vote of holders of principal balance certificates evidencing at least a majority of the aggregate voting rights (taking into account the application of any Cumulative Appraisal Reduction Amounts to notionally reduce the respective certificate balances) of all principal balance certificates on an aggregate basis (which requisite affirmative vote must be received within 180 days of posting of the notice of the operating advisor’s recommendation to the certificate administrator’s website).
A “Certificateholder Quorum” means, in connection with any solicitation of votes in connection with the replacement of a special servicer or the asset representations reviewer, the holders of certificates evidencing at least 50% of the aggregate voting rights (taking into account the application of realized losses and, other than with respect to the termination of the asset representations reviewer, any Cumulative Appraisal Reduction Amounts to notionally reduce the certificate balance of the certificates) of all classes of certificates entitled to principal (other than the RR Interest) on an aggregate basis.
With respect to each serviced whole loan, any holder of a related pari passu companion loan, following a servicer termination event with respect to the applicable special servicer that affects such holder, will be entitled to direct the trustee (and the trustee will be required) to terminate such special servicer solely with respect to such serviced whole loan. A replacement special servicer will be selected by the trustee or, prior to a Control Termination Event, by the Directing Certificateholder; provided, that any successor special servicer appointed to replace the special servicer with respect to such whole loan cannot be the entity (or its affiliate) that was terminated at the direction of the holder of the related pari passu companion loan.
Notwithstanding any of the foregoing to the contrary, with respect to each servicing shift whole loan and any serviced A/B whole loans as to which a subordinate companion loan holder is the related controlling note holder, the holder of the related control note will be entitled to replace the applicable special servicer with respect to such whole loan at any time, with or without cause, and while it is a serviced whole loan, no other party may replace the applicable special servicer for such whole loan unless there is a servicer termination event with respect thereto.
With respect to any non-serviced whole loan, subject to conditions or restrictions in the applicable intercreditor agreement, the BANK 2020-BNK29 trust, as holder of the related mortgage loan, has the right to terminate the applicable special servicer under the related pooling and servicing agreement if a servicer termination event occurs, with respect to such special servicer that affects the trust in its capacity as such holder. Such rights may be exercised by the Directing Certificateholder prior to a Consultation Termination Event (or the applicable special servicer, following the occurrence and during the continuance of a Consultation Termination Event). The successor special servicer will be selected pursuant to the applicable pooling and servicing agreement by the related directing holder prior to a control termination event under such pooling and servicing agreement. | |
| Servicing Standard: | Each applicable master servicer and each applicable special servicer is obligated to service and administer the mortgage loans (and, if applicable, the serviced companion loans) in accordance with the definition of the “Servicing Standard” described in the Preliminary Prospectus and the terms of the pooling and servicing agreement, provided that each non-serviced mortgage loan, if any, will be serviced by another master servicer or special servicer under the pooling and servicing agreement with respect to the securitization of a related companion loan, which entities will be obligated to service and administer such non-serviced mortgage loan pursuant to a similar standard set forth in the related pooling and servicing agreement. |
| Excluded Special Servicer: | If a special servicer obtains knowledge that it has become a Borrower Party with respect to any mortgage loan (an “Excluded Special Servicer Loan”), such special servicer will be required to resign as special servicer of that Excluded Special Servicer Loan. Prior to the occurrence and continuance of a Control Termination Event, the Directing Certificateholder will be required to appoint (and may remove and replace with or without cause) a separate special servicer that is not a Borrower Party (an “Excluded Special Servicer”) with respect to any Excluded Special Servicer Loan, unless such Excluded Special Servicer Loan is also an Excluded Loan with respect to the Directing Certificateholder or the holder of the majority of the Controlling Class. After the occurrence and during the continuance of a Control Termination Event, if at any time the applicable Excluded Special Servicer Loan is also an Excluded Loan with respect to the Directing Certificateholder or the holder of the majority of the Controlling Class or if the Directing Certificateholder is entitled to appoint the Excluded Special Servicer but does not so appoint within 30 days of notice of such resignation, the resigning special servicer will be required to use reasonable efforts to select the related Excluded Special Servicer. Any Excluded Special Servicer will be required to perform all of the obligations of the applicable special servicer and will be entitled to all special servicing compensation with respect to such Excluded Special Servicer Loan earned while the related mortgage loan is an Excluded Special Servicer Loan. |
| Liquidated Loan Waterfall: |
On liquidation of any mortgage loan, all net liquidation proceeds related to the mortgage loan (but not any related companion loan) will be applied so that amounts allocated as a recovery of accrued and unpaid interest will not, in the first instance, include any delinquent interest that was not advanced as a result of |
This is not a research report and was not prepared by any Underwriter’s research department. Please see additional important information and qualifications at the end of this Term Sheet.
18
| BANK 2020-BNK29 | Structural Overview |
Appraisal Reduction Amounts (or would not have been advanced in the absence of a non-recoverability determination) or accrued on the portion of the stated principal balance thereof equal to any related Collateral Deficiency Amount in effect from time to time and as to which no advance was made (collectively, the “Subordinated Interest Amount”). After the adjusted interest amount is so allocated, any remaining liquidation proceeds will be allocated to pay principal on the mortgage loan until the unpaid principal amount of the mortgage loan has been reduced to zero. Any remaining liquidation proceeds will then be allocated to pay the Subordinated Interest Amount. | |
| Operating Advisor: | The operating advisor will be required to perform certain review duties if a Control Termination Event has occurred and is continuing, which will generally include a limited annual review of, and the preparation of a report regarding, certain actions of the applicable special servicer with respect to the resolution and/or liquidation of specially serviced loans. The review and report generally will be based on any asset status reports and additional information delivered to the operating advisor by such special servicer. In addition, if a Control Termination Event has occurred and is continuing, the applicable special servicer must consult with the operating advisor (in addition to the Directing Certificateholder if no Consultation Termination Event has occurred and is continuing) in connection with major decisions with respect to mortgage loans. Furthermore, under certain circumstances, but only if a Consultation Termination Event has occurred and is continuing, the operating advisor may recommend the replacement of the applicable special servicer as described above under “—Appointment and Replacement of each Special Servicer”; however, the operating advisor will not have any rights or obligations with respect to a non-serviced whole loan.
If a Consultation Termination Event has occurred and is continuing, the operating advisor may be removed and replaced without cause upon the affirmative direction of certificates owners holding not less than 75% of the voting rights of all certificates (taking into account the application of Cumulative Appraisal Reduction Amounts), following a proposal from certificate owners holding not less than 25% of the voting rights of all certificates (taking into account the application of Cumulative Appraisal Reduction Amounts). The certificateholders who initiate a vote on a termination and replacement of the operating advisor without cause must cause the payment of the fees and expenses incurred in the replacement. In addition, in the event there are no classes of certificates outstanding other than the Control Eligible Certificates, the RR Interest and the Class X-K, Class X-L, Class V and Class R certificates, then all of the rights and obligations of the operating advisor under the PSA will terminate without payment of any penalty or termination fee (other than any rights or obligations that accrued prior to the date of such termination (including accrued and unpaid compensation) and other than indemnification rights arising out of events occurring prior to such termination). See “Pooling and Servicing Agreement—The Operating Advisor—Termination of the Operating Advisor Without Cause” in the Preliminary Prospectus. |
| Asset Representations Reviewer: | The asset representations reviewer will be required to review certain delinquent mortgage loans (excluding a mortgage loan for which a Payment Accommodation has been made and the related borrower is complying with the terms of such Payment Accommodation) after a specified delinquency threshold has been met and the required percentage of certificateholders vote to direct a review as described below. The asset representations reviewer will be entitled to the Asset Representations Reviewer Fee with respect to such review. See “Pooling and Servicing Agreement—The Asset Representations Reviewer” in the Preliminary Prospectus.
The certificate administrator will be required to notify certificateholders if the specified delinquency threshold has been met as described in the Preliminary Prospectus under “—The Asset Representations Reviewer”.
If certificateholders evidencing not less than 5.0% of the voting rights request a vote to commence an asset review, and if subsequently (i) a majority of those certificateholders who cast votes and (ii) a majority of an Asset Review Quorum authorizes an asset review within 150 days of the request for a vote, the asset representations reviewer will be required to conduct an asset review of delinquent loans.
The asset representations reviewer may be terminated and replaced without cause. Upon (i) the written direction of certificateholders evidencing not less than 25% of the voting rights (without regard to the application of any Cumulative Appraisal Reduction Amounts) requesting a vote to terminate and replace the asset representations reviewer with a proposed successor asset representations reviewer that is an eligible asset representations reviewer, and (ii) payment by such holders to the certificate administrator of the reasonable fees and expenses to be incurred by the certificate administrator in connection with administering such vote, the certificate administrator will be required to promptly provide notice to all certificateholders and the asset representations reviewer of such request by posting such notice on its internet website, and by mailing such notice to all certificateholders and the asset representations reviewer. Upon the written direction of certificateholders evidencing at least 75% of a Certificateholder Quorum (without regard to the application of any Cumulative Appraisal Reduction Amounts), the trustee will be required to terminate all of the rights and obligations of the asset representations reviewer under the pooling and servicing agreement (other than any rights or obligations that accrued prior to the date of such termination and other than indemnification rights arising out of events occurring prior to such termination) by written notice to the asset representations reviewer, and the proposed successor asset representations reviewer will be appointed. See “Pooling and Servicing Agreement—The Asset Representations Reviewer” in the Preliminary Prospectus.
An “Asset Review Quorum” means, in connection with any solicitation of votes to authorize an Asset Review as described above, the holders of certificates evidencing at least 5.0% of the aggregate voting rights represented by all certificates that have voting rights. |
This is not a research report and was not prepared by any Underwriter’s research department. Please see additional important information and qualifications at the end of this Term Sheet.
19
| BANK 2020-BNK29 | Structural Overview |
| Dispute Resolution Provisions: | The mortgage loan sellers will be subject to the dispute resolution provisions set forth in the PSA to the extent those provisions are triggered with respect to any mortgage loan sold to the depositor by a mortgage loan seller, and such mortgage loan seller will be obligated under the related mortgage loan purchase agreement to comply with all applicable provisions and to take part in any mediation or arbitration proceedings that may result. Generally, in the event that a Repurchase Request is not “Resolved” within 180 days after the related mortgage loan seller receives such Repurchase Request, then the enforcing servicer will be required to send a notice to the first certificateholder (or beneficial owner) to deliver a certificateholder repurchase request with respect to the mortgage loan (the “Initial Requesting Certificateholder”) (if any) and to the certificate administrator (which will be required to make such notice available to certificateholders via the certificate administrator’s website) indicating the enforcing servicer’s intended course of action with respect to the Repurchase Request. If (a) the enforcing servicer’s intended course of action with respect to the Repurchase Request does not involve pursuing further action to exercise rights against the related mortgage loan seller with respect to the Repurchase Request and the Initial Requesting Certificateholder, if any, or any other certificateholder or certificate owner wishes to exercise its right to refer the matter to mediation (including nonbinding arbitration) or arbitration, or (b) the enforcing servicer’s intended course of action is to pursue further action to exercise rights against the related mortgage loan seller with respect to the Repurchase Request but the Initial Requesting Certificateholder, if any, or any other certificateholder or certificate owner does not agree with the dispute resolution method selected by the enforcing servicer, then the Initial Requesting Certificateholder, if any, or such other certificateholder or certificate owner may deliver a written notice to the enforcing servicer indicating its intent to exercise its right to refer the matter to either mediation or arbitration.
“Resolved” means, with respect to a Repurchase Request, (i) that the related material defect or breach has been cured, (ii) the related mortgage loan has been repurchased in accordance with the related mortgage loan purchase agreement, (iii) a mortgage loan has been substituted for the related mortgage loan in accordance with the related mortgage loan purchase agreement, (iv) the applicable mortgage loan seller has made a loss of value payment, (v) a contractually binding agreement has been entered into between the enforcing servicer, on behalf of the issuing entity, and the related mortgage loan seller that settles the related mortgage loan seller’s obligations under the related mortgage loan purchase agreement, or (vi) the related mortgage loan is no longer property of the issuing entity as a result of a sale or other disposition in accordance with the pooling and servicing agreement. See “Pooling and Servicing Agreement—Dispute Resolution Provisions” in the Preliminary Prospectus. |
| Investor Communications: | The certificate administrator is required to include on any Form 10-D any request received from a certificateholder to communicate with other certificateholders related to certificateholders exercising their rights under the terms of the PSA. Any certificateholder wishing to communicate with other certificateholders regarding the exercise of its rights under the terms of the PSA will be able to deliver a written request signed by an authorized representative of the requesting investor to the certificate administrator. |
| Deal Website: | The certificate administrator will be required to maintain a deal website which will include, among other items: (a) summaries of asset status reports prepared by a special servicer, (b) inspection reports, (c) appraisals, (d) various “special notices” described in the Preliminary Prospectus, (e) the “Investor Q&A Forum” and (f) a voluntary “Investor Registry”. Investors may access the deal website following execution of a certification and confidentiality agreement. |
This is not a research report and was not prepared by any Underwriter’s research department. Please see additional important information and qualifications at the end of this Term Sheet.
20
| BANK 2020-BNK29 | Collateral Overview |
| Mortgage Loan Sellers | No. of Mortgage Loans | No. of Mortgaged Properties | Aggregate Cut-off Date Balance | % of Pool(1) |
| Wells Fargo Bank, National Association | 12 | 13 | $342,824,490 | 39.4% |
| Morgan Stanley Mortgage Capital Holdings LLC | 17 | 47 | $300,605,900 | 34.5% |
| Bank of America, National Association | 12 | 29 | $227,732,529 | 26.1% |
| Total: | 41 | 89 | $871,162,919 | 100.0% |
| Pool Statistics | |
| Aggregate Cut-off Date Balance: | $871,162,919 |
| Number of Mortgage Loans: | 41 |
| Average Cut-off Date Balance per Mortgage Loan: | $21,247,876 |
| Number of Mortgaged Properties: | 89 |
| Average Cut-off Date Balance per Mortgaged Property: | $9,788,347 |
| Weighted Average Mortgage Rate: | 3.2137% |
| % of Pool Secured by 5 Largest Mortgage Loans: | 43.8% |
| % of Pool Secured by 10 Largest Mortgage Loans: | 65.1% |
| % of Pool Secured by ARD Loans(2): | 9.8% |
| Weighted Average Original Term to Maturity (months)(2): | 120 |
| Weighted Average Remaining Term to Maturity (months)(2): | 119 |
| Weighted Average Seasoning (months): | 1 |
| % of Pool Secured by Single Tenant Mortgaged Properties: | 29.6% |
| % of Pool Secured by Refinance Loans: | 49.9% |
| % of Pool Secured by Acquisition Loans: | 39.4% |
| % of Pool Secured by Recapitalization Loans: | 10.7% |
| Additional Debt | |
| % of Pool with Pari Passu Mortgage Debt: | 58.7% |
| % of Pool with Subordinate Mortgage Debt: | 14.3% |
| Credit Statistics(3)(4) | |
| Weighted Average UW NOI DSCR: | 2.91x |
| Weighted Average UW NOI Debt Yield(5): | 10.6% |
| Weighted Average UW NCF DSCR(6): | 2.79x |
| Weighted Average UW NCF Debt Yield(5): | 10.2% |
| Weighted Average Cut-off Date LTV Ratio(5)(7): | 54.4% |
| Weighted Average Maturity Date LTV Ratio(5)(7): | 51.0% |
Footnotes are set forth on the following page.
This is not a research report and was not prepared by any Underwriter’s research department. Please see additional important information and qualifications at the end of this Term Sheet.
21
| BANK 2020-BNK29 | Collateral Overview |
Amortization
| Weighted Average Original Amortization Term (months)(8): | 340 |
| Weighted Average Remaining Amortization Term (months)(8): | 339 |
| % of Pool Interest Only through Maturity: | 64.2% |
| % of Pool Amortizing Balloon: | 16.4% |
| % of Pool Interest Only, ARD: | 9.8% |
| % of Pool Interest Only followed by Amortizing Balloon: | 9.6% |
| Lockboxes | |
| % of Pool with Hard Lockboxes: | 69.5% |
| % of Pool with Springing Lockboxes: | 24.5% |
| % of Pool with Soft Lockboxes: | 3.2% |
| % of Pool with No Lockboxes: | 2.9% |
| Reserves | |
| % of Pool Requiring Tax Reserves: | 68.3% |
| % of Pool Requiring Insurance Reserves: | 20.4% |
| % of Pool Requiring Replacement Reserves: | 47.4% |
| % of Pool Requiring TI/LC Reserves(9): | 64.5% |
| Call Protection | |
| % of Pool with lockout period, followed by defeasance until open period: | 63.8% |
| % of Pool with no lockout period. The greater of a prepayment premium and yield maintenance, followed by defeasance or the greater of a prepayment premium and yield maintenance until open period: | 9.8% |
| % of Pool with lockout period, followed by defeasance or the greater of a prepayment premium and yield maintenance until open period: | 9.3% |
| % of Pool with no lockout period. Yield Maintenance followed by defeasance or yield maintenance until open period: | 9.2% |
| % of Pool with lockout period, followed by the greater of a prepayment premium and yield maintenance until open period: | 8.0% |
| (1) | Unless otherwise indicated, all references to “% of Pool” in this Term Sheet reflect a percentage of the aggregate principal balance of the mortgage pool as of the Cut-off Date, after application of all payments of principal due during or prior to November 2020. |
| (2) | With respect to any ARD Loan, unless otherwise indicated, references in this Term Sheet to the applicable “maturity date” or “maturity” refer to the applicable anticipated repayment date with respect to such ARD Loan, and such applicable anticipated repayment date is treated as its maturity date for all purposes hereof. |
| (3) | With respect to any mortgage loan that is part of a whole loan, unless otherwise indicated, all LTV, DSCR and Debt Yield calculations in this Term Sheet include any related pari passu companion loans and exclude any subordinate companion loans, as applicable. Additionally, LTV, DSCR and Debt Yield figures in this Term Sheet are calculated for mortgage loans without regard to any additional indebtedness that may be incurred at a future date. For mortgaged properties securing residential cooperative mortgage loans all LTV, DSCR and Debt Yield calculations do not take into account any subordinate debt (whether or not secured by the related mortgaged property), that currently exists or is allowed under the terms of any mortgage loan. See “Description of the Mortgage Pool—Certain Calculations and Definitions” in the Preliminary Prospectus for additional information regarding the calculations of, and assumptions underlying, the LTV, DSCR, Debt Yield and other information presented in this Term Sheet. |
| (4) | For mortgaged properties securing residential cooperative mortgage loans, all DSCR and Debt Yield calculations for each such mortgaged property is calculated using underwritten net operating Income or underwritten net cash flow, as applicable, for the related residential cooperative property which is the projected net operating income or net cash flow, as applicable, reflected in the most recent appraisal obtained by or otherwise in the possession of the related mortgage loan seller as of the Cut-off Date. All LTV ratio calculations are based upon the appraised value of the residential cooperative property determined as if such residential cooperative property is operated as a residential cooperative, inclusive of the amount of the underlying debt encumbering such residential cooperative property. |
| (5) | With respect to certain mortgage loans, debt yields and LTVs (such as, for example, UW NOI Debt Yield, UW NCF Debt Yield or Cut-off Date LTV Ratio) have been calculated based on a principal balance that is net of a holdback or earnout reserve. Such mortgage loans are identified under the definitions of “Underwritten NOI Debt Yield”, “Underwritten NCF Debt Yield” and “Cut-off Date LTV Ratio” set forth under “Description of the Mortgage Pool—Certain Calculations and Definitions” in the Preliminary Prospectus. |
| (6) | With respect to the Courtyard Marriott Solana Beach Mortgage Loan, occupancy as of September 2020 is 59.6%, which is less than underwritten occupancy of 83.9%. A Debt Service Reserve of $709,246 was funded post-loan closing. UW NCF DSCR based on more recent financial information for such mortgage loan would result in a Weighted Average UW NCF DSCR of 2.77x |
| (7) | The LTV ratios set forth in this Term Sheet are generally based on the “as-is” values of the related mortgaged properties; provided that the “as-is” value for a portfolio of mortgaged properties may include a premium relating to the valuation of the mortgaged properties as a whole rather than as the sum of individually valued mortgaged properties; provided, further, that such LTV ratios may be based on “as-stabilized”, “as complete” or other contingent values in certain cases in which reserves have been established at origination for the applicable condition or circumstance that is expected to result in stabilization provided, further, that such LTV ratios may have been calculated based on a principal balance that is net of a holdback or earnout reserve. See the definition of “Appraised Value” under “Description of the Mortgage Pool—Certain Calculations and Definitions” in the Preliminary Prospectus. |
| (8) | Excludes mortgage loans that provide for payments of interest only through the related maturity date or anticipated repayment date, as applicable. With respect to Mortgage Loan No. 6, McDonald’s Global HQ, the Original Amortization Term and Remaining Amortization Term of 270 months is for the McDonald’s Global HQ Whole Loan. The McDonald’s Global HQ Senior Loan amortizes in 186 months. See amortization schedule for the McDonald’s Global HQ Mortgage Loan set forth in Annex A-4 in the Preliminary Prospectus. |
| (9) | Excludes hospitality, multifamily, manufactured housing and self storage properties. |
This is not a research report and was not prepared by any Underwriter’s research department. Please see additional important information and qualifications at the end of this Term Sheet.
22
| BANK 2020-BNK29 | Collateral Overview |
COVID-19 Update
The following table contains information regarding the status of the mortgage loans and mortgaged properties provided by the respective borrowers as of the date set forth in the “Information as of Date” column. The cumulative effects of the COVID-19 emergency on the global economy may cause tenants to be unable to pay their rent and borrowers to be unable to pay debt service under the mortgage loans. As a result, we cannot assure you that the information in the following table is indicative of future performance or that tenants or borrowers will not seek rent or debt service relief (including forbearance arrangements) or other lease or loan modifications in the future. Such actions may lead to shortfalls and losses on the certificates. Any information in the following table will be superseded by the information contained under the heading “Description of the Mortgage Pool—COVID Considerations” in the Preliminary Prospectus.
Loan No. | Mortgage Loan Seller | Info. as of Date | Origination Date | Property Name | Property Type | Debt Service Current as of Sept. Payment (Y/N) | Debt Service Current as of Oct. Payment (Y/N) | Debt Service Current as of Nov. Payment (Y/N) | Forbearance, Loan Modification or other Debt Service Relief Requested (Y/N) | Lease Modification or Rent Relief Requested (Y/N) | Tenants Making Full September Rent Payment (% NRA)(1) | Tenants Making Full September Rent Payment (% of UW rent)(1) | Tenants Making Full October Rent Payment (% NRA)(1) | Tenants Making Full October Rent Payment (% of UW rent)(1) |
| 1 | MSMCH | 10/30/2020 | 11/12/2020 | 250 West 57th Street | Office | N/A(2) | N/A(2) | N/A(2) | N | Y(7) | 68.3% | 68.0% | 90.4% | 91.8% |
| 2 | WFB | 10/19/2020 | 10/30/2020 | Coleman Highline | Office | N/A(3) | N/A(3) | N/A(3) | N | N | 100.0% | 100.0% | 100.0% | 100.0% |
| 3 | WFB | 10/30/2020 | 10/1/2020 | 120 Wall Street | Office | N/A(5) | N/A(5) | Y | N | Y(8) | 92.7%(9) | 95.3%(9) | 93.0%(9) | 96.8%(9) |
| 4 | BANA | 11/6/2020 | 11/17/2020 | Grace Building | Office | N/A(2) | N/A(2) | N/A(2) | N | Y(10) | 98.0% | 97.1% | 98.0% | 97.1% |
| 5 | MSMCH | 11/16/2020 | 10/19/2020 | ExchangeRight Net Leased Portfolio #40 | Retail | N/A(3) | N/A(3) | N/A(3) | N | N | 100.0% | 100.0% | 100.0% | 100.0% |
| 6 | BANA | 11/2/2020 | 10/29/2020 | McDonald’s Global HQ | Office | N/A(3) | N/A(3) | N/A(3) | N | Y(11) | 100.0% | 100.0% | 100.0% | 100.0% |
| 7 | WFB | 10/20/2020 | 10/1/2020 | The Arboretum | Retail | N/A(5) | N/A(5) | Y | N | Y(12) | 94.9% | 93.0% | 91.7% | 90.9% |
| 8 | WFB | 11/2/2020 | 11/10/2020 | IFA Rotorion Building | Industrial | N/A(2) | N/A(2) | N/A(2) | N | N | 100.0% | 100.0% | 100.0% | 100.0% |
| 9 | WFB | 10/22/2020 | 10/29/2020 | Triangle 54 | Office | N/A(3) | N/A(3) | N/A(3) | N | N | 100.0% | 100.0% | 100.0% | 100.0% |
| 10 | MSMCH | 10/29/2020 | 3/6/2020 | 1890 Ranch | Retail | Y | Y | Y | Y(13) | Y(14) | 88.6% | 90.7% | 88.2% | 89.9% |
| 11 | WFB | 11/3/2020 | 10/16/2020 | 2100 River | Office | N/A(3) | N/A(3) | N/A(3) | N | N | 100.0% | 100.0% | 100.0% | 100.0% |
| 12 | BANA | 11/4/2020 | 3/6/2020 | 711 Fifth Avenue | Mixed Use | Y | Y | Y | N | Y(15) | 100.0% | 100.0% | 100.0% | 100.0% |
| 13 | MSMCH | 10/6/2020 | 10/29/2020 | Turner Towers | Multifamily | N/A(3) | N/A(3) | N/A(3) | N | Y(16) | 98.0% | 98.0% | 98.0% | 98.0% |
| 14 | MSMCH | 10/20/2020 | 11/2/2020 | 114 Mulberry Street | Mixed Use | N/A(2) | N/A(2) | N/A(2) | N | N | 100.0% | 100.0% | 100.0% | 100.0% |
| 15 | MSMCH | 11/5/2020 | 8/28/2020 | Chasewood Technology Park | Office | N/A(4) | Y | Y | N | Y(17) | 96.8% | 97.0% | 98.7% | 98.7% |
| 16 | BANA | 10/19/2020 | 10/19/2020 | Interbay Self Storage – Seattle, WA | Self Storage | N/A(3) | N/A(3) | N/A(3) | N | N | N/A(18) | N/A(18) | N/A(18) | N/A(18) |
| 17 | WFB | 10/23/2020 | 9/30/2020 | Superior Self Storage Pocket | Self Storage | N/A(5) | N/A(5) | Y | N | N | N/A(19) | N/A(19) | N/A(19) | N/A(19) |
| 18 | BANA | 11/9/2020 | 2/28/2020 | Glendale Thunderbird Shopping Center | Retail | Y | Y | Y | N | Y(20) | 100.0% | 99.6% | 100.0% | 99.6% |
| 19 | MSMCH | 10/28/2020 | 10/28/2020 | Mission Plaza | Mixed Use | N/A(3) | N/A(3) | N/A(3) | N | N | 97.4% | 97.4% | 96.1% | 96.3% |
| 20 | BANA | 11/2/2020 | 9/2/2020 | ExchangeRight Net Leased Portfolio #39 | Various | N/A(5) | N/A(5) | Y | N | N | 100.0% | 100.0% | 100.0% | 100.0% |
| 21 | MSMCH | 10/21/2020 | 11/3/2020 | 10 Charles Street & 35 Perry Street | Multifamily | N/A(2) | N/A(2) | N/A(2) | N | N | 100.0% | 100.0% | 100.0% | 100.0% |
| 22 | WFB | 11/5/2020 | 2/27/2020 | Courtyard Marriott Solana Beach | Hospitality | Y | Y | Y | Y(21) | N | (22) | (22) | (22) | (22) |
| 23 | BANA | 10/21/2020 | 3/6/2020 | Home2 Suites - Columbus (Airport East), OH | Hospitality | Y | Y | Y | Y(23) | N | (24) | (24) | (24) | (24) |
| 24 | MSMCH | 10/7/2020 | 9/9/2020 | H-Mart - Carrollton, TX | Retail | N/A(5) | N/A(5) | Y | N | N | 100.0% | 100.0% | 100.0% | 100.0% |
| 25 | MSMCH | 10/21/2020 | 11/4/2020 | 169-171 University Avenue | Mixed Use | N/A(2) | N/A(2) | N/A(2) | N | N | 100.0% | 100.0% | 100.0% | 100.0% |
| 26 | WFB | 10/9/2020 | 11/3/2020 | 302 West 12th Street | Retail | N/A(3) | N/A(3) | N/A(3) | N | N | 100.0% | 100.0% | 100.0% | 100.0% |
| 27 | MSMCH | 10/21/2020 | 9/15/2020 | Midwest Dollar General Portfolio | Retail | N/A(5) | N/A(5) | Y | N | N | 100.0% | 100.0% | 100.0% | 100.0% |
| 28 | BANA | 10/8/2020 | 10/1/2020 | Sandy City Self Storage - Sandy, UT | Self Storage | N/A(5) | N/A(5) | Y | N | N | N/A(18) | N/A(18) | N/A(18) | N/A(18) |
| 29 | BANA | 11/2/2020 | 10/26/2020 | Ace Self Storage – Boulder, CO | Self Storage | N/A(3) | N/A(3) | N/A(3) | N | N | N/A(18) | N/A(18) | N/A(18) | N/A(18) |
| 30 | WFB | 10/15/2020 | 9/29/2020 | WAG - Dripping Springs & New Orleans | Retail | N/A(5) | N/A(5) | Y | N | N | 100.0% | 100.0% | 100.0% | 100.0% |
| 31 | BANA | 10/30/2020 | 10/15/2020 | Peak View Park MHC | Manufactured Housing | N/A(3) | N/A(3) | N/A(3) | N | Y(25) | 97.5% | 98.3% | 98.7% | 98.5% |
| 32 | MSMCH | 10/21/2020 | 9/24/2020 | Walgreens Tumwater | Retail | N/A(5) | N/A(5) | Y | N | N | 100.0% | 100.0% | 100.0% | 100.0% |
| 33 | BANA | 10/31/2020 | 11/3/2020 | Arabi Self Storage – Arabi, LA | Self Storage | N/A(2) | N/A(2) | N/A(2) | N | N | N/A(18) | N/A(18) | N/A(18) | N/A(18) |
| 34 | MSMCH | 11/2/2020 | 10/7/2020 | Hillcrest and Chiesa MHCs | Manufactured Housing | N/A(3) | N/A(3) | N/A(3) | N | N | 95.2% | 95.2% | 93.5% | 93.5% |
| 35 | BANA | 11/2/2020 | 10/23/2020 | Riverland Estates MHC | Manufactured Housing | N/A(3) | N/A(3) | N/A(3) | N | N | 100.0% | 100.0% | 100.0% | 100.0% |
| 36 | MSMCH | 10/21/2020 | 10/27/2020 | Walgreens New London CT | Retail | N/A(3) | N/A(3) | N/A(3) | N | N | 100.0% | 100.0% | 100.0% | 100.0% |
| 37 | MSMCH | 11/2/2020 | 10/7/2020 | Oak Haven Estates MHP | Manufactured Housing | N/A(3) | N/A(3) | N/A(3) | N | N | 99.6% | 99.6% | 95.6% | 95.6% |
| 38 | MSMCH | 10/6/2020 | 9/2/2020 | Walgreens Deltona, FL | Retail | N/A(5) | N/A(5) | Y | N | N | 100.0% | 100.0% | 100.0% | 100.0% |
| 39 | MSMCH | 10/21/2020 | 11/2/2020 | Walgreens Aurora | Retail | N/A(2) | N/A(2) | N/A(2) | N | N | 100.0% | 100.0% | 100.0% | 100.0% |
| 40 | WFB | 11/5/2020 | 11/3/2020 | Villa Rose | Multifamily | N/A(3) | N/A(3) | Y | N | N | 100.0% | 100.0% | 100.0% | 100.0% |
| 41 | WFB | 11/3/2020 | 11/4/2020 | Comerica Bank - Dallas, TX | Retail | N/A(3) | N/A(3) | Y | N | N | 100.0% | 100.0% | 100.0% | 100.0% |
Footnotes are set forth on the following page.
This is not a research report and was not prepared by any Underwriter’s research department. Please see additional important information and qualifications at the end of this Term Sheet.
23
| BANK 2020-BNK29 | Collateral Overview |
| (1) | Tenants Making Full September Rent Payment (% NRA), Tenants Making Full September Rent Payment (% NRA), Tenants Making Full October Rent Payment (% of UW rent) and Tenants Making Full October Rent Payment (% of UW rent) is based on occupied space. |
| (2) | The related Mortgage Loan has its first debt service due date in January 2021. On the Closing Date, the lender will deposit sufficient funds to pay the amount of interest that would be due with respect to a December 2020 payment. |
| (3) | The related mortgage loan has its first due date in December 2020. |
| (4) | The related mortgage loan has its first due date in October 2020. |
| (5) | The related mortgage loan has its first due date in November 2020. |
| (6) | The related mortgage loan has scheduled debt service payments on the 11th of each month. |
| (7) | With respect to the 250 West 57th Street mortgaged property, ten tenants (16.2% of NRA and 16.8% of underwritten base rent) requested rent relief and five of such tenants (9.4% of NRA and 10.6% of underwritten base rent) were granted rent relief. Three of such five tenants (6.1% of NRA and 6.6% of underwritten base rent) were granted between 1 and 3 months of deferred rent with repayment over fixed periods. One of such five tenants (3.2% of NRA and 3.9% of underwritten base rent) is in discussions with the borrower regarding a rent deferral plan. One of such five tenants (0.1% of NRA and 0.1% of underwritten base rent) is paying 25% of their monthly gross sales from April to December 2020 and is required to resume paying fixed rent in January 2021. |
| (8) | With respect to the 120 Wall Street mortgaged property, two tenants (Foundation for AIDS Research and AFS-USA, Inc.) representing 10.6% of NRA and 9.9% of UW rent, requested rent relief. The Foundation for AIDS Research’s request was denied and AFS-USA, Inc.’s request is being evaluated. |
| (9) | With respect to the 120 Wall Street mortgaged property, six tenants (11.1% of NRA and 10.4% of UW rent) have not made all of their contractual base rent payments. The Eye-Bank for Sight Research has not made September 2020 rent payments on 7,793 SF of its space (1.2% of NRA and 1.0% of UW Rent). The New Press (1.2% of NRA and 1.3% of UW rent) did not pay rent in April 2020, but it is expected to be paid by year end 2020. Georgoulis / Cohen (0.9% of NRA and 0.8% of UW rent) has not paid rent since July 2020, but has been sending in additional payments to resolve the delinquency. |
| (10) | With respect to the Grace Building mortgage loan, four retail tenants (2.0% of NRA, 2.9% of UW Rent) have not made rent payments for the last few months. The borrower is in the process of negotiating rent deferrals with full rental payments anticipated to commence in late 2021 or early 2022. The parking tenant has not paid the required monthly rental payments since March and an event of default is continuing under the lease. The borrower is in the process of replacing the current operator and plans to employ a new operator under a management agreement. The borrower deposited with the lender $1,608,940 for anticipated parking rent shortfalls. |
| (11) | With respect to the McDonald’s Global HQ mortgaged property, the second largest tenant, Politan Row (1.8% of NRA and 2.1% of UW rent), closed from April to July, in line with local COVID regulations. The tenant re-opened for outdoor dining in August, and recently announced that it was closing temporarily for the winter, with plans to re-open in the spring of 2021. |
| (12) | With respect to The Arboretum mortgaged property, 31 tenants, representing 27.5% of UW rent, were granted rent deferrals ranging from one to four months with leases extended by the number of months deferred. |
| (13) | With respect to the 1890 Ranch mortgaged loan, the borrower entered into a forbearance agreement on May 29, 2020. The lender agreed to 3 months of forbearance of all interest payments and reserve fund payments due on the June, July and August 2020 payment dates. The 1890 Ranch mortgage loan is current as of the November debt service payment and is not subject to any forbearance, modification or debt service relief request. The borrower has repaid all deferred interest, replenished reserve accounts, and established a 3-month debt service reserve. |
| (14) | With respect to the 1890 Ranch mortgaged property, the borrower has reported that 23.5% of tenants by occupied NRA were granted some form of rent relief in past months and have returned to paying full rent and 9.9% of tenants by occupied NRA were granted some form of rent relief and are still paying abated rent. Tenant Gold’s Gym International, Inc. filed for Chapter 11 bankruptcy protection in May 2020. The tenant was bought out of bankruptcy in August 2020 by German fitness company - RSG Group GmbH. The tenant is currently open for business. |
| (15) | With respect to the 711 Fifth Avenue mortgaged property, as of May 18, 2020, the borrower entered into a rent deferral agreement with the sixth largest tenant at the mortgaged property, The Swatch Group (4.2% of NRA and 37.3% of UW rent). For the months of April, May and June 2020, The Swatch Group base rent was reduced to 50.0%. The abated 50% of base rent is required to be repaid by December 31, 2020 (50.0%) and March 31, 2021 (50.0%). All tenants have paid rent for September and October. |
| (16) | With respect to the Turner Towers mortgaged property, one of the professional office units inquired about rent relief. No rent relief has been granted. |
| (17) | With respect to the Chasewood Technology Park mortgaged property, one tenant, Scardello & Associates (0.5% of NRA / 0.7% of underwritten base rent), requested and received rent relief of approximately 50% rent from May through August 2020. In exchange, the tenant extended its lease one month. |
| (18) | Given the timing of collection and reporting, an accurate estimate of the percentage of tenants paying rent in September and/or October is not available. |
| (19) | With respect to the Superior Self Storage Pocket mortgaged property, given the timing of collection and reporting, an accurate estimate of the percentage of tenants who have not paid is not available. As of October 23, 2020, approximately 1.9% of rents were 31-60 days delinquent, and 3.0% of rents were over 60 days delinquent. |
| (20) | With respect to the Glendale Thunderbird Shopping Center mortgaged property, the largest tenant, EOS Fitness (62.0% of NRA and 64.3% of UW rent), was granted abatement of common area maintenance (“CAM”) reimbursement charges for the months of April, May, and June through an approved lease modification. EOS Fitness was also granted deferral of a portion of the base rent and CAM reimbursements for July and full deferral for August. EOS Fitness is expected to repay the $111,344 in six equal installments starting January 1, 2021. One tenant, GNC (1.7% of NRA and 1.4% of UW rent), has declared bankruptcy but continues to pay rent. One tenant, Copperstate Optical (1.3% NRA and 1.6% UW Rent), has only paid 72.5% of its contractual rent for September and October. The borrower is seeking to find a replacement tenant. |
| (21) | With respect to the Courtyard Marriott Solana Beach mortgage loan, the loan has been modified to (a) waive springing cash management triggered by a 1.20x DSCR and waive the springing seasonality reserve for 12 months until January 1, 2022 and (b) include a $709,246 debt service reserve, representing approximately 6 months of payments. |
| (22) | With respect to the Courtyard Marriott Solana Beach mortgaged property, the August and September 2020 occupancy, ADR and RevPAR information was 69.9%, $122.77, $85.77 and 59.6%, $126.52, $75.39, respectively. Occupancy, ADR and RevPAR information is due to the lender 30 days after month’s end; therefore, October 2020 information is not available. |
| (23) | With respect to the Home2 Suites - Columbus (Airport East), OH mortgaged property, the loan has been modified to waive the springing cash management period (due solely to the debt service coverage trigger) until the earlier of (a) the business day preceding October 1, 2021 and (b) the date when an amount equal to four months of debt service ($203,784) is remaining in the twelve-month debt service reserve taken at loan origination. |
| (24) | With respect to the Home2 Suites - Columbus (Airport East), OH mortgaged property, the August and September 2020 occupancy, ADR and RevPAR information was 55.3%, $102.80 and $56.87 and 60.4%, $106.50 and $64.36, respectively. Occupancy, ADR and RevPAR information is due to the lender 30 days after month’s end; therefore, October 2020 information is not available. |
| (25) | With respect to Peak View Park MHC mortgaged property, two pads requested rent relief for September and one pad requested relief for October. The requests are being evaluated. |
This is not a research report and was not prepared by any Underwriter’s research department. Please see additional important information and qualifications at the end of this Term Sheet.
24
| BANK 2020-BNK29 | Characteristics of the Mortgage Loans |
| Top 10 Mortgage Loans or Groups of Cross-Collateralized Mortgage Loans(1) | |||||||||||||
| Loan No. | Mortgage Loan Seller | Property Name | City | State | Property Type | Cut-off Date Balance | % of Pool | SF | Cut-off Date Balance per SF | UW NCF DSCR | UW NOI Debt Yield | Cut-off Date LTV | Maturity Date LTV |
| 1 | MSMCH | 250 West 57th Street | New York | NY | Office | $87,000,000 | 9.99% | 543,743 | $331.04 | 3.49x | 11.1% | 54.5% | 54.5% |
| 2 | WFB | Coleman Highline | San Jose | CA | Office | $85,000,000 | 9.8% | 357,106 | $469.61 | 3.18x | 9.2% | 56.5% | 56.5% |
| 3 | WFB | 120 Wall Street | New York | NY | Office | $80,000,000 | 9.2% | 668,276 | $246.90 | 2.74x | 9.3% | 57.9% | 57.9% |
| 4 | BANA | Grace Building | New York | NY | Office | $75,000,000 | 8.6% | 1,556,972 | $567.13 | 4.25x | 11.8% | 41.1% | 41.1% |
| 5 | MSMCH | ExchangeRight Net Leased Portfolio #40 | Various | Various | Retail | $54,200,000 | 6.2% | 349,816 | $154.94 | 2.44x | 8.8% | 61.3% | 61.3% |
| 6 | BANA | McDonald’s Global HQ | Chicago | IL | Office | $50,000,000 | 5.7% | 575,018 | $295.64 | 1.45x | 11.8% | 41.6% | 17.1% |
| 7 | WFB | The Arboretum | Charlotte | NC | Retail | $39,939,202 | 4.6% | 555,912 | $179.61 | 1.70x | 9.6% | 58.7% | 45.7% |
| 8 | WFB | IFA Rotorion Building | Summerville | SC | Industrial | $34,190,000 | 3.9% | 448,765 | $76.19 | 2.38x | 9.3% | 61.6% | 61.6% |
| 9 | WFB | Triangle 54 | Durham | NC | Office | $32,232,000 | 3.7% | 151,164 | $213.23 | 2.54x | 9.8% | 59.6% | 59.6% |
| 10 | MSMCH | 1890 Ranch | Cedar Park | TX | Retail | $30,000,000 | 3.4% | 441,583 | $114.61 | 2.17x | 12.0% | 66.2% | 56.3% |
| Total/Wtd. Avg. | $567,561,202 | 65.1% | 2.84x | 10.3% | 54.7% | 51.1% | |||||||
| (1) | With respect to any mortgage loan that is part of a whole loan, unless otherwise indicated, all LTV, DSCR, Debt Yield and Cut-off Date Balance per SF calculations in this Term Sheet include any related pari passu companion loans and exclude any subordinate companion loans, as applicable. Additionally, LTV, DSCR, Debt Yield and Cut-off Date Balance per SF figures in this Term Sheet are calculated for mortgage loans without regard to any additional indebtedness that may be incurred at a future date. |
This is not a research report and was not prepared by any Underwriter’s research department. Please see additional important information and qualifications at the end of this Term Sheet.
25
| BANK 2020-BNK29 | Characteristics of the Mortgage Loans |
| Mortgage Loans with Pari Passu Companion Loans | ||||||||||||
| Loan No. | Mortgage Loan Seller | Property Name | Mortgage Loan Cut-off Date Balance | Aggregate Pari Passu Companion Loan Cut-off Date Balance | Combined Cut-off Date Balance | Lead Servicing Agreement | Master Servicer | Special Servicer | Control Rights | Combined UW NCF DSCR(1) | Combined UW NOI Debt Yield(1) | Combined Cut-off Date LTV(1) |
| 1 | MSMCH | 250 West 57th Street | $87,000,000 | $93,000,000 | $180,000,000 | BANK 2020-BNK29 | Wells Fargo | Rialto | BANK 2020-BNK29 | 3.49x | 11.1% | 54.5% |
| 2 | WFB | Coleman Highline | $85,000,000 | $82,700,000 | $167,700,000 | BANK 2020-BNK29 | Wells Fargo | Rialto | BANK 2020-BNK29 | 3.18x | 9.2% | 56.5% |
| 3 | WFB | 120 Wall Street | $80,000,000 | $85,000,000 | $165,000,000 | BANK 2020-BNK29 | Wells Fargo | Rialto | BANK 2020-BNK29 | 2.74x | 9.3% | 57.9% |
| 4 | BANA | Grace Building | $75,000,000 | $808,000,000 | $883,000,000 | GRACE 2020-GRCE | Wells Fargo | Situs | GRACE 2020-GRCE | 4.25x | 11.8% | 41.1% |
| 6 | BANA | McDonald’s Global HQ | $50,000,000 | $120,000,000 | $170,000,000 | (2) | Wells Fargo | Rialto | (2) | 1.45x | 11.8% | 41.6% |
| 7 | WFB | The Arboretum | $39,939,202 | $59,908,803 | $99,848,005 | BANK 2020-BNK29 | Wells Fargo | Rialto | BANK 2020-BNK29 | 1.70x | 9.6% | 58.7% |
| 10 | MSMCH | 1890 Ranch | $30,000,000 | $20,610,000 | $50,610,000 | BANK 2020-BNK29 | Wells Fargo | Rialto | BANK 2020-BNK29 | 2.17x | 12.0% | 66.2% |
| 12 | BANA | 711 Fifth Avenue | $25,500,000 | $519,500,000 | $545,000,000 | GSMS 2020-GC47 | Wells Fargo | KeyBank | GSMS 2020-GC47 | 2.90x | 9.4% | 54.5% |
| 15 | MSMCH | Chasewood Technology Park | $16,000,000 | $30,000,000 | $46,000,000 | BANK 2020-BNK28 | Wells Fargo | KeyBank | BANK 2020-BNK28 | 1.73x | 11.5% | 65.3% |
| 20 | BANA | ExchangeRight Net Leased Portfolio #39 | $12,000,000 | $37,660,000 | $49,660,000 | BANK 2020-BNK28 | Wells Fargo | KeyBank | BANK 2020-BNK28 | 2.35x | 9.8% | 58.1% |
| 22 | WFB | Courtyard Marriott Solana Beach | $11,362,001 | $14,326,002 | $25,688,003 | (3) | Wells Fargo | Rialto | (3) | 2.11x | 12.8% | 67.1% |
| (1) | DSCR, Debt Yield and LTV calculations include any related pari passu companion loans and exclude any subordinate companion loans, as applicable. |
| (2) | The McDonald’s Global HQ controlling companion loan is currently held by Bank of America, National Association. Under the intercreditor agreement, control rights with respect to the McDonald’s Global HQ whole loan will be exercisable by the holder of the McDonald’s Global HQ mortgage loan included in the BANK 2020-BNK29 trust, but only until the controlling companion loan is sold to a third party or securitized. The McDonald’s Global HQ whole loan will be serviced pursuant to the BANK 2020-BNK29 pooling and servicing agreement until the securitization of the related promissory note A-2. |
| (3) | The Courtyard Marriott Solana Beach controlling companion loan is currently held by Wells Fargo Bank, National Association. The Courtyard Marriott Solana Beach whole loan will be serviced pursuant to the BANK 2020-BNK29 pooling and servicing agreement until the securitization of the related controlling pari passu companion loan. |
| Mortgage Loans with Subordinate Debt | |||||||||||
| Loan No. | Mortgage Loan Seller | Property Name | Mortgage Loan Cut-off Date Balance | Cut-off Date Balance per SF | Subordinate Debt Cut-off Date Balance | UW NCF DSCR | UW NOI Debt Yield | Cut-off Date LTV | Whole Loan UW NCF DSCR(1) | Whole Loan UW NOI Debt Yield(1) | Whole Loan Cut-off Date LTV(1) |
| 4 | BANA | Grace Building | $75,000,000 | $567.13 | $367,000,000 | 4.25x | 11.8% | 41.1% | 3.00x | 8.3% | 58.1% |
| 6 | BANA | McDonald’s Global HQ | $50,000,000 | $295.64 | $110,000,000 | 1.45x | 11.8% | 41.6% | 1.17x | 7.2% | 68.5% |
| (1) | Whole Loan UW NCF DSCR, Whole Loan UW NOI Debt Yield and Whole Loan Cut-off Date LTV figures shown above are calculated based on any related pari passu notes and any related subordinate note(s). |
This is not a research report and was not prepared by any Underwriter’s research department. Please see additional important information and qualifications at the end of this Term Sheet.
26
| BANK 2020-BNK29 | Characteristics of the Mortgage Loans |
| Prior Securitization History(1) | ||||||||||||||
| Loan No. | Mortgage Loan Seller | Property Name | City | State | Property Type | Cut-off Date Balance | % of Pool | SF/ Pads | Cut-off Date Balance per SF/Pad | UW NCF DSCR | UW NOI Debt Yield | Cut-off Date LTV | Maturity Date LTV | Prior Securitization |
| 3 | WFB | 120 Wall Street | New York | NY | Office | $80,000,000 | 9.2% | 668,276 | $246.90 | 2.74x | 9.3% | 57.9% | 57.9% | MSBAM 2014-C14 |
| 4 | BANA | Grace Building | New York | NY | Office | $75,000,000 | 8.6% | 1,556,972 | $567.13 | 4.25x | 11.8% | 41.1% | 41.1% | GRCE 2014-GRCE |
| 7 | WFB | The Arboretum | Charlotte | NC | Retail | $39,939,202 | 4.6% | 555,912 | $179.61 | 1.70x | 9.6% | 58.7% | 45.7% | WFRBS 2011-C2 |
| 17 | WFB | Superior Self Storage Pocket | Sacramento | CA | Self Storage | $12,650,000 | 1.5% | 104,131 | $121.48 | 3.19x | 9.7% | 56.0% | 56.0% | WFRBS 2013-C16 |
| 18 | BANA | Glendale Thunderbird Shopping Center | Glendale | AZ | Retail | $12,220,000 | 1.4% | 89,195 | $137.00 | 2.94x | 10.5% | 61.6% | 61.6% | CSMC 2007-C1 |
| 19 | MSMCH | Mission Plaza | Rialto | CA | Mixed Use | $12,000,000 | 1.4% | 141,683 | $84.70 | 1.67x | 9.9% | 54.1% | 48.8% | MSBAM 2015-C21 |
| 24 | MSMCH | H-Mart - Carrollton, TX | Carrollton | TX | Retail | $8,000,000 | 0.9% | 76,130 | $105.08 | 3.33x | 12.9% | 46.1% | 46.1% | WFRBS 2011-C5 |
| 34 | MSMCH | Hillcrest and Chiesa MHCs | Various | TX | Manufactured Housing | $4,500,000 | 0.5% | 137 | $32,846.72 | 1.60x | 9.7% | 52.7% | 43.7% | WFRBS 2014-C19 |
| 37 | MSMCH | Oak Haven Estates MHP | Arlington | TX | Manufactured Housing | $3,950,000 | 0.5% | 98 | $40,306.12 | 1.45x | 8.8% | 52.9% | 43.9% | WFRBS 2014-C24 |
| Total | $248,259,202 | 28.5% | ||||||||||||
| (1) | Includes mortgage loans for which all or a portion of the previously existing debt was most recently securitized in conduit securitizations, based on information provided by the related borrower or obtained through searches of a third-party database. The information has not otherwise been confirmed by the mortgage loan sellers. With respect to any mortgage loan that is part of a whole loan, unless otherwise indicated, all LTV, DSCR, Debt Yield and Cut-off Date Balance per SF/Unit/Pad calculations include any related pari passu companion loans and exclude any related subordinate companion loans, as applicable. |
This is not a research report and was not prepared by any Underwriter’s research department. Please see additional important information and qualifications at the end of this Term Sheet.
27
| BANK 2020-BNK29 | Characteristics of the Mortgage Loans |

| Property Type Distribution(1) | ||||||||
| Property Type | Number of Mortgaged Properties | Aggregate Cut-off Date Balance | % of Pool | Wtd. Avg. Mortgage Rate | Wtd. Avg. UW NCF DSCR | Wtd. Avg. UW NOI Debt Yield | Wtd. Avg. Cut-off Date LTV | Wtd. Avg. Maturity Date LTV |
| Office | 9 | $454,629,769 | 52.2% | 3.0052% | 3.01x | 10.4% | 53.2% | 50.1% |
| CBD | 5 | $320,000,000 | 36.7% | 2.9564% | 3.07x | 10.8% | 51.1% | 47.2% |
| Suburban | 3 | $133,232,000 | 15.3% | 3.1116% | 2.85x | 9.6% | 58.3% | 56.9% |
| Medical | 1 | $1,397,769 | 0.2% | 4.0250% | 2.35x | 9.8% | 58.1% | 58.1% |
| Retail | 59 | $194,468,620 | 22.3% | 3.4407% | 2.33x | 10.1% | 60.0% | 55.1% |
| Single Tenant | 55 | $105,309,418 | 12.1% | 3.5938% | 2.46x | 9.6% | 58.7% | 57.4% |
| Anchored | 3 | $82,159,202 | 9.4% | 3.2806% | 2.06x | 10.6% | 61.9% | 51.9% |
| Unanchored | 1 | $7,000,000 | 0.8% | 3.0150% | 3.60x | 11.3% | 57.1% | 57.1% |
| Mixed Use | 4 | $62,200,000 | 7.1% | 3.4366% | 2.44x | 9.1% | 53.8% | 52.7% |
| Office/Retail | 2 | $32,900,000 | 3.8% | 3.1015% | 3.11x | 10.0% | 51.1% | 51.1% |
| Multifamily/Retail | 1 | $17,300,000 | 2.0% | 3.9500% | 1.69x | 6.8% | 58.6% | 58.6% |
| Industrial/Retail | 1 | $12,000,000 | 1.4% | 3.6150% | 1.67x | 9.9% | 54.1% | 48.8% |
| Self Storage | 5 | $44,675,000 | 5.1% | 3.3956% | 2.80x | 9.5% | 53.5% | 53.5% |
| Self Storage | 5 | $44,675,000 | 5.1% | 3.3956% | 2.80x | 9.5% | 53.5% | 53.5% |
| Multifamily | 4 | $40,200,000 | 4.6% | 2.9391% | 4.27x | 19.5% | 28.1% | 26.6% |
| Cooperative | 1 | $25,000,000 | 2.9% | 2.3900% | 5.61x | 26.4% | 9.5% | 7.1% |
| Low Rise | 2 | $11,800,000 | 1.4% | 3.9650% | 1.68x | 6.8% | 62.4% | 62.4% |
| Garden | 1 | $3,400,000 | 0.4% | 3.4160% | 3.36x | 12.5% | 45.9% | 45.9% |
| Industrial | 1 | $34,190,000 | 3.9% | 3.5630% | 2.38x | 9.3% | 61.6% | 61.6% |
| Flex | 1 | $34,190,000 | 3.9% | 3.5630% | 2.38x | 9.3% | 61.6% | 61.6% |
| Hospitality | 2 | $22,249,530 | 2.6% | 3.6734% | 2.18x | 13.3% | 65.2% | 51.9% |
| Select Service | 1 | $11,362,001 | 1.3% | 3.6000% | 2.11x | 12.8% | 67.1% | 53.3% |
| Extended Stay | 1 | $10,887,529 | 1.2% | 3.7500% | 2.25x | 13.8% | 63.3% | 50.5% |
| Manufactured Housing | 5 | $18,550,000 | 2.1% | 4.1579% | 1.53x | 9.1% | 60.3% | 51.3% |
| Manufactured Housing | 5 | $18,550,000 | 2.1% | 4.1579% | 1.53x | 9.1% | 60.3% | 51.3% |
| Total/Wtd. Avg. | 89 | $871,162,919 | 100.0% | 3.2137% | 2.79x | 10.6% | 54.4% | 51.0% |
| (1) | All numerical information concerning the mortgage loans is approximate and, in the case of mortgage loans secured by multiple properties, is based on allocated loan amounts with respect to such properties. All weighted average information regarding the mortgage loans reflects the weighting of the mortgage loans based on their outstanding principal balances as of the Cut-off Date or, in the case of mortgage loans secured by multiple properties, allocated loan amounts. The sum of numbers and percentages in columns may not match the “Total” due to rounding. With respect to any mortgage loan that is part of a whole loan, unless otherwise indicated, all LTV, DSCR and Debt Yield calculations include any related pari passu companion loans and exclude any related subordinate companion loans, as applicable. For mortgaged properties securing residential cooperative mortgage loans, the UW NCF DSCR and UW NOI Debt Yield for each such mortgaged property is calculated using underwritten net operating income or underwritten net cash flow, as applicable, for the related residential cooperative property which is the projected net operating income or net cash flow, as applicable, reflected in the most recent appraisal obtained by or otherwise in the possession of the related mortgage loan seller as of the Cut-off Date. LTV calculations are based upon the appraised value of the residential cooperative property determined as if such residential cooperative property is operated as a residential cooperative, inclusive of the amount of the underlying debt encumbering such residential cooperative property. |
This is not a research report and was not prepared by any Underwriter’s research department. Please see additional important information and qualifications at the end of this Term Sheet.
28
| BANK 2020-BNK29 | Characteristics of the Mortgage Loans |

| Geographic Distribution(1) | ||||||||||||||||||||||
| State or Other Jurisdiction | Number of Mortgaged Properties | Aggregate Cut-off Date Balance | % of Pool | Wtd. Avg. Mortgage Rate | Wtd. Avg. UW NCF DSCR | Wtd. Avg. UW NOI Debt Yield | Wtd. Avg. Cut-off | Wtd. Avg. Maturity | ||||||||||||||
| New York | 9 | $328,600,000 | 37.7 | % | 2.9844 | % | 3.44 | x | 11.5 | % | 49.4 | % | 49.2 | % | ||||||||
| California | 5 | $128,412,001 | 14.7 | % | 3.0154 | % | 2.98 | x | 9.8 | % | 56.2 | % | 54.5 | % | ||||||||
| California – Northern(2) | 3 | $105,050,000 | 12.1 | % | 2.8837 | % | 3.23 | x | 9.5 | % | 55.2 | % | 55.2 | % | ||||||||
| California – Southern(2) | 2 | $23,362,001 | 2.7 | % | 3.6077 | % | 1.88 | x | 11.3 | % | 60.4 | % | 51.0 | % | ||||||||
| Texas | 14 | $75,961,532 | 8.7 | % | 3.5614 | % | 2.18 | x | 11.3 | % | 60.7 | % | 52.7 | % | ||||||||
| North Carolina | 2 | $72,171,202 | 8.3 | % | 3.3576 | % | 2.08 | x | 9.7 | % | 59.1 | % | 51.9 | % | ||||||||
| Illinois | 4 | $57,968,570 | 6.7 | % | 3.0060 | % | 1.59 | x | 11.4 | % | 44.3 | % | 23.2 | % | ||||||||
| South Carolina | 1 | $34,190,000 | 3.9 | % | 3.5630 | % | 2.38 | x | 9.3 | % | 61.6 | % | 61.6 | % | ||||||||
| Oregon | 1 | $28,000,000 | 3.2 | % | 3.4000 | % | 2.49 | x | 9.2 | % | 64.5 | % | 64.5 | % | ||||||||
| Washington | 2 | $20,265,000 | 2.3 | % | 3.3435 | % | 2.70 | x | 9.1 | % | 51.8 | % | 51.8 | % | ||||||||
| Louisiana | 5 | $15,681,225 | 1.8 | % | 3.4937 | % | 2.55 | x | 10.5 | % | 57.1 | % | 52.6 | % | ||||||||
| Colorado | 3 | $15,275,000 | 1.8 | % | 3.8550 | % | 2.20 | x | 9.3 | % | 58.8 | % | 55.8 | % | ||||||||
| Ohio | 5 | $15,168,569 | 1.7 | % | 3.8276 | % | 2.28 | x | 12.7 | % | 61.8 | % | 52.6 | % | ||||||||
| Arizona | 1 | $12,220,000 | 1.4 | % | 3.2500 | % | 2.94 | x | 10.5 | % | 61.6 | % | 61.6 | % | ||||||||
| Virginia | 2 | $9,875,164 | 1.1 | % | 3.5160 | % | 2.43 | x | 8.9 | % | 60.9 | % | 60.9 | % | ||||||||
| Utah | 2 | $9,750,000 | 1.1 | % | 3.9995 | % | 2.34 | x | 9.5 | % | 56.7 | % | 56.7 | % | ||||||||
| Georgia | 5 | $8,822,754 | 1.0 | % | 3.5203 | % | 2.43 | x | 8.9 | % | 60.9 | % | 60.9 | % | ||||||||
| Michigan | 2 | $6,555,363 | 0.8 | % | 3.4512 | % | 2.44 | x | 8.8 | % | 61.3 | % | 61.3 | % | ||||||||
| Pennsylvania | 4 | $5,880,404 | 0.7 | % | 3.4512 | % | 2.44 | x | 8.8 | % | 61.3 | % | 61.3 | % | ||||||||
| Kentucky | 7 | $5,349,030 | 0.6 | % | 4.0650 | % | 1.69 | x | 9.9 | % | 65.0 | % | 55.0 | % | ||||||||
| Massachusetts | 1 | $4,872,587 | 0.6 | % | 3.4512 | % | 2.44 | x | 8.8 | % | 61.3 | % | 61.3 | % | ||||||||
| Connecticut | 1 | $4,310,000 | 0.5 | % | 3.6700 | % | 2.70 | x | 10.7 | % | 53.2 | % | 53.2 | % | ||||||||
| Florida | 1 | $3,550,000 | 0.4 | % | 4.2200 | % | 1.99 | x | 8.6 | % | 64.5 | % | 64.5 | % | ||||||||
| Alabama | 3 | $3,526,141 | 0.4 | % | 3.4512 | % | 2.44 | x | 8.8 | % | 61.3 | % | 61.3 | % | ||||||||
| Tennessee | 2 | $1,481,870 | 0.2 | % | 4.0650 | % | 1.69 | x | 9.9 | % | 65.0 | % | 55.0 | % | ||||||||
| Wisconsin | 1 | $1,211,896 | 0.1 | % | 4.0250 | % | 2.35 | x | 9.8 | % | 58.1 | % | 58.1 | % | ||||||||
| Oklahoma | 2 | $990,334 | 0.1 | % | 4.0250 | % | 2.35 | x | 9.8 | % | 58.1 | % | 58.1 | % | ||||||||
| Kansas | 1 | $511,078 | 0.1 | % | 4.0250 | % | 2.35 | x | 9.8 | % | 58.1 | % | 58.1 | % | ||||||||
| Missouri | 2 | $317,845 | 0.0 | % | 4.0250 | % | 2.35 | x | 9.8 | % | 58.1 | % | 58.1 | % | ||||||||
| Indiana | 1 | $245,353 | 0.0 | % | 4.0250 | % | 2.35 | x | 9.8 | % | 58.1 | % | 58.1 | % | ||||||||
| Total/Wtd. Avg. | 89 | $871,162,919 | 100.0 | % | 3.2137 | % | 2.79 | x | 10.6 | % | 54.4 | % | 51.0 | % | ||||||||
| (1) | All numerical information concerning the mortgage loans is approximate and, in the case of mortgage loans secured by multiple properties, is based on allocated loan amounts with respect to such properties. All weighted average information regarding the mortgage loans reflects the weighting of the mortgage loans based on their outstanding principal balances as of the Cut-off Date or, in the case of mortgage loans secured by multiple properties, allocated loan amounts. The sum of numbers and percentages in columns may not match the “Total” due to rounding. With respect to any mortgage loan that is part of a whole loan, unless otherwise indicated, all LTV, DSCR and Debt Yield calculations include any related pari passu companion loans and exclude any related subordinate companion loans, as applicable. For mortgaged properties securing residential cooperative mortgage loans, the UW NCF DSCR and UW NOI Debt Yield for each such mortgaged property is calculated using underwritten net operating income or underwritten net cash flow, as applicable, for the related residential cooperative property which is the projected net operating income or net cash flow, as applicable, reflected in the most recent appraisal obtained by or otherwise in the possession of the related mortgage loan seller as of the Cut-off Date. LTV calculations are based upon the appraised value of the residential cooperative property determined as if such residential cooperative property is operated as a residential cooperative, inclusive of the amount of the underlying debt encumbering such residential cooperative property. |
| (2) | “California – Northern” includes zip codes above 93600, and “California – Southern” includes zip codes at or below 93600. |
This is not a research report and was not prepared by any Underwriter’s research department. Please see additional important information and qualifications at the end of this Term Sheet.
29
| BANK 2020-BNK29 | Collateral Statistics |
Collateral Statistics(1)
Cut-off Date Balance ($)
| No. of Mortgage Loans | Aggregate Cut-off Date Balance ($) | % of Pool | |
| 3,000,000 - 10,000,000 | 18 | 93,882,187 | 10.8 |
| 10,000,001 - 20,000,000 | 10 | 131,219,530 | 15.1 |
| 20,000,001 - 30,000,000 | 4 | 108,500,000 | 12.5 |
| 30,000,001 - 40,000,000 | 3 | 106,361,202 | 12.2 |
| 40,000,001 - 50,000,000 | 1 | 50,000,000 | 5.7 |
| 50,000,001 - 60,000,000 | 1 | 54,200,000 | 6.2 |
| 60,000,001 - 87,000,000 | 4 | 327,000,000 | 37.5 |
| Total: | 41 | $871,162,919 | 100.0% |
Min: $3,000,000 Max: $87,000,000 Avg: $21,247,876 | |||
State or Other Jurisdiction(2)
| No. of Mortgaged Properties | Aggregate Cut-off Date Balance ($) | % of Pool | |
| New York | 9 | 328,600,000 | 37.7 |
| California | 5 | 128,412,001 | 14.7 |
| California – Northern(3) | 3 | 105,050,000 | 12.1 |
| California – Southern(3) | 2 | 23,362,001 | 2.7 |
| Texas | 14 | 75,961,532 | 8.7 |
| North Carolina | 2 | 72,171,202 | 8.3 |
| Illinois | 4 | 57,968,570 | 6.7 |
| South Carolina | 1 | 34,190,000 | 3.9 |
| Oregon | 1 | 28,000,000 | 3.2 |
| Washington | 2 | 20,265,000 | 2.3 |
| Louisiana | 5 | 15,681,225 | 1.8 |
| Colorado | 3 | 15,275,000 | 1.8 |
| Ohio | 5 | 15,168,569 | 1.7 |
| Arizona | 1 | 12,220,000 | 1.4 |
| Virginia | 2 | 9,875,164 | 1.1 |
| Utah | 2 | 9,750,000 | 1.1 |
| Georgia | 5 | 8,822,754 | 1.0 |
| Michigan | 2 | 6,555,363 | 0.8 |
| Pennsylvania | 4 | 5,880,404 | 0.7 |
| Kentucky | 7 | 5,349,030 | 0.6 |
| Massachusetts | 1 | 4,872,587 | 0.6 |
| Connecticut | 1 | 4,310,000 | 0.5 |
| Florida | 1 | 3,550,000 | 0.4 |
| Alabama | 3 | 3,526,141 | 0.4 |
| Tennessee | 2 | 1,481,870 | 0.2 |
| Wisconsin | 1 | 1,211,896 | 0.1 |
| Oklahoma | 2 | 990,334 | 0.1 |
| Kansas | 1 | 511,078 | 0.1 |
| Missouri | 2 | 317,845 | 0.0 |
| Indiana | 1 | 245,353 | 0.0 |
| Total: | 89 | $871,162,919 | 100.0% |
Property Type(2)
| No. of Mortgaged Properties | Aggregate Cut-off Date Balance ($) | % of Pool | |
| Office | 9 | 454,629,769 | 52.2 |
| CBD | 5 | 320,000,000 | 36.7 |
| Suburban | 3 | 133,232,000 | 15.3 |
| Medical | 1 | 1,397,769 | 0.2 |
| Retail | 59 | 194,468,620 | 22.3 |
| Single Tenant | 55 | 105,309,418 | 12.1 |
| Anchored | 3 | 82,159,202 | 9.4 |
| Unanchored | 1 | 7,000,000 | 0.8 |
| Mixed Use | 4 | 62,200,000 | 7.1 |
| Office/Retail | 2 | 32,900,000 | 3.8 |
| Multifamily/Retail | 1 | 17,300,000 | 2.0 |
| Industrial/Retail | 1 | 12,000,000 | 1.4 |
| Self Storage | 5 | 44,675,000 | 5.1 |
| Self Storage | 5 | 44,675,000 | 5.1 |
| Multifamily | 4 | 40,200,000 | 4.6 |
| Cooperative | 1 | 25,000,000 | 2.9 |
| Low Rise | 2 | 11,800,000 | 1.4 |
| Garden | 1 | 3,400,000 | 0.4 |
| Industrial | 1 | 34,190,000 | 3.9 |
| Flex | 1 | 34,190,000 | 3.9 |
| Hospitality | 2 | 22,249,530 | 2.6 |
| Select Service | 1 | 11,362,001 | 1.3 |
| Extended Stay | 1 | 10,887,529 | 1.2 |
| Manufactured Housing | 5 | 18,550,000 | 2.1 |
| Manufactured Housing | 5 | 18,550,000 | 2.1 |
| Total: | 89 | $871,162,919 | 100.0% |
Mortgage Rate (%)
| No. of Mortgage Loans | Aggregate Cut-off Date Balance ($) | % of Pool | |
| 2.3900 - 3.2490 | 14 | 495,550,000 | 56.9 |
| 3.2500 - 3.4990 | 7 | 184,991,202 | 21.2 |
| 3.5000 - 3.9990 | 13 | 147,840,817 | 17.0 |
| 4.0000 - 4.3700 | 7 | 42,780,900 | 4.9 |
| Total: | 41 | $871,162,919 | 100.0% |
| Min: 2.3900% Max: 4.3700% Wtd Avg: 3.2137% | |||
Original Term to Maturity or ARD (mos.)
| No. of Mortgage Loans | Aggregate Cut-off Date Balance ($) | % of Pool | |
| 120 | 33 | 630,472,919 | 72.4 |
| 121 | 8 | 240,690,000 | 27.6 |
| Total: | 41 | $871,162,919 | 100.0% |
| Min: 120 mos. Max: 121 mos. Wtd Avg: 120 mos. | |||
Remaining Term to Maturity or ARD (mos.)
| No. of Mortgage Loans | Aggregate Cut-off Date Balance ($) | % of Pool | |
| 112 - 119 | 16 | 286,605,919 | 32.9 |
| 120 - 121 | 25 | 584,557,000 | 67.1 |
| Total: | 41 | $871,162,919 | 100.0% |
| Min: 112 mos. Max: 121 mos. Wtd Avg: 119 mos. | |||
Original Amortization Term (mos.)
| No. of Mortgage Loans | Aggregate Cut-off Date Balance ($) | % of Pool | |
| Interest Only | 27 | 644,542,000 | 74.0 |
| 270 | 1 | 50,000,000 | 5.7 |
| 360 | 13 | 176,620,919 | 20.3 |
| Total: | 41 | $871,162,919 | 100.0% |
| Min: 270 mos. Max: 360 mos. Wtd Avg: 340 mos. | |||
Remaining Amortization Term (mos.)
| No. of Mortgage Loans | Aggregate Cut-off Date Balance ($) | % of Pool | |
| Interest Only | 27 | 644,542,000 | 74.0 |
| 270 | 1 | 50,000,000 | 5.7 |
| 352 - 360 | 13 | 176,620,919 | 20.3 |
| Total: | 41 | $871,162,919 | 100.0% |
| Min: 270 mos. Max: 360 mos. Wtd Avg: 339 mos. | |||
Mortgage Loan Sellers
| No. of Mortgage Loans | Aggregate Cut-off Date Balance ($) | % of Pool | ||
| WFB | 12 | 342,824,490 | 39.4 | |
| MSMCH | 17 | 300,605,900 | 34.5 | |
| BANA | 12 | 227,732,529 | 26.1 | |
| Total: | 41 | $871,162,919 | 100.0% | |
Amortization Type
| No. of Mortgage Loans | Aggregate Cut-off Date Balance ($) | % of Pool | |
| Interest Only | 26 | 559,542,000 | 64.2 |
| Amortizing Balloon | 6 | 143,240,019 | 16.4 |
| Interest Only, ARD | 1 | 85,000,000 | 9.8 |
| Partial Interest Only | 8 | 83,380,900 | 9.6 |
| Total: | 41 | $871,162,919 | 100.0% |
Cut-off Date LTV Ratio (%)
| No. of Mortgage Loans | Aggregate Cut-off Date Balance ($) | % of Pool | |
| 9.5 - 45.0 | 4 | 157,400,000 | 18.1 |
| 45.1 - 50.0 | 5 | 34,400,000 | 3.9 |
| 50.1 - 55.0 | 8 | 146,311,287 | 16.8 |
| 55.1 - 60.0 | 9 | 292,296,202 | 33.6 |
| 60.1 - 68.2 | 15 | 240,755,430 | 27.6 |
| Total: | 41 | $871,162,919 | 100.0% |
| Min: 9.5% Max: 68.2% Wtd Avg: 54.4% | |||
Maturity Date or ARD LTV Ratio (%)
| No. of Mortgage Loans | Aggregate Cut-off Date Balance ($) | % of Pool | |
| 7.1 - 30.0 | 2 | 75,000,000 | 8.6 |
| 30.1 - 40.0 | 1 | 7,400,000 | 0.8 |
| 40.1 - 45.0 | 4 | 89,501,287 | 10.3 |
| 45.1 - 50.0 | 7 | 86,339,202 | 9.9 |
| 50.1 - 55.0 | 8 | 164,890,430 | 18.9 |
| 55.1 - 64.5 | 19 | 448,032,000 | 51.4 |
| Total: | 41 | $871,162,919 | 100.0% |
| Min: 7.1% Max: 64.5% Wtd Avg: 51.0% | |||
UW NCF DSCR (x)
| No. of Mortgage Loans | Aggregate Cut-off Date Balance ($) | % of Pool | |
| 1.38 - 1.60 | 4 | 64,050,000 | 7.4 |
| 1.61 - 1.80 | 8 | 114,720,102 | 13.2 |
| 1.81 - 2.00 | 2 | 9,601,287 | 1.1 |
| 2.01 - 2.20 | 2 | 41,362,001 | 4.7 |
| 2.21 - 2.40 | 4 | 63,252,529 | 7.3 |
| 2.41 - 5.61 | 21 | 578,177,000 | 66.4 |
| Total: | 41 | $871,162,919 | 100.0% |
| Min: 1.38x Max: 5.61x Wtd Avg: 2.79x | |||
UW NOI Debt Yield (%)
| No. of Mortgage Loans | Aggregate Cut-off Date Balance ($) | % of Pool | |
| 6.8 - 9.0 | 8 | 108,015,000 | 12.4 |
| 9.1 - 10.0 | 15 | 398,517,102 | 45.7 |
| 10.1 - 12.0 | 12 | 301,481,287 | 34.6 |
| 12.1 - 13.0 | 4 | 27,262,001 | 3.1 |
| 13.1 - 15.0 | 1 | 10,887,529 | 1.2 |
| 15.1 - 26.4 | 1 | 25,000,000 | 2.9 |
| Total: | 41 | $871,162,919 | 100.0% |
| Min: 6.8% Max: 26.4% Wtd Avg: 10.6% | |||
| (1) | All numerical information concerning the mortgage loans is approximate. All weighted average information regarding the mortgage loans reflects the weighting of the mortgage loans based on their outstanding principal balances as of the Cut-off Date. The sum of numbers and percentages in columns may not match the “Total” due to rounding. With respect to any mortgage loan that is part of a whole loan, unless otherwise indicated, all LTV, DSCR and Debt Yield calculations include any related pari passu companion loans and exclude any related subordinate companion loans, as applicable. For mortgaged properties securing residential cooperative mortgage loans, the UW DSCR and UW NOI Debt Yield for each such mortgaged property is calculated using underwritten net operating income or underwritten net cash flow, as applicable, for the related residential cooperative property which is the projected net operating income or net cash flow, as applicable, reflected in the most recent appraisal obtained by or otherwise in the possession of the related mortgage loan seller as of the Cut-off Date. LTV calculations are based upon the appraised value of the residential cooperative property determined as if such residential cooperative property is operated as a residential cooperative, inclusive of the amount of the underlying debt encumbering such residential cooperative property. |
| (2) | In the case of mortgage loans secured by multiple properties, cut-off date balance information is based on allocated loan amounts with respect to such properties. |
| (3) | “California – Northern” includes zip codes above 93600, and “California – Southern” includes zip codes at or below 93600. |
This is not a research report and was not prepared by any Underwriter’s research department. Please see additional important information and qualifications at the end of this Term Sheet.
30
(THIS PAGE INTENTIONALLY LEFT BLANK)
This is not a research report and was not prepared by any Underwriter’s research department. Please see additional important information and qualifications at the end of this Term Sheet.
31
| Office – CBD | Loan #1 | Cut-off Date Balance: | $87,000,000 | |
| 250 West 57th Street | 250 West 57th Street | Cut-off Date LTV: | 54.5% | |
| New York, NY 10107 | UW NCF DSCR: | 3.49x | ||
| UW NOI Debt Yield: | 11.1% |

This is not a research report and was not prepared by any Underwriter’s research department. Please see additional important information and qualifications at the end of this Term Sheet.
32
| Office – CBD | Loan #1 | Cut-off Date Balance: | $87,000,000 | |
| 250 West 57th Street | 250 West 57th Street | Cut-off Date LTV: | 54.5% | |
| New York, NY 10107 | UW NCF DSCR: | 3.49x | ||
| UW NOI Debt Yield: | 11.1% |

This is not a research report and was not prepared by any Underwriter’s research department. Please see additional important information and qualifications at the end of this Term Sheet.
33
| Office – CBD | Loan #1 | Cut-off Date Balance: | $87,000,000 | |
| 250 West 57th Street | 250 West 57th Street | Cut-off Date LTV: | 54.5% | |
| New York, NY 10107 | UW NCF DSCR: | 3.49x | ||
| UW NOI Debt Yield: | 11.1% |

This is not a research report and was not prepared by any Underwriter’s research department. Please see additional important information and qualifications at the end of this Term Sheet.
34
| Mortgage Loan No. 1 – 250 West 57th Street |
| Mortgage Loan Information | Property Information | ||||||
| Mortgage Loan Seller: | MSMCH | Single Asset/Portfolio: | Single Asset | ||||
| Credit Assessment (DBRSM/Fitch/Moody’s): | NR/NR/NR | Location: | New York, NY 10107 | ||||
| Original Balance(1): | $87,000,000 | General Property Type: | Office | ||||
| Cut-off Date Balance(1): | $87,000,000 | Detailed Property Type: | CBD | ||||
| % of Initial Pool Balance: | 9.99% | Title Vesting: | Fee | ||||
| Loan Purpose: | Recapitalization | Year Built/Renovated: | 1921/2017-2020 | ||||
| Borrower Sponsor: | Empire State Realty OP, L.P. | Size: | 543,743 SF | ||||
| Guarantor: | Empire State Realty OP, L.P. | Cut-off Date Balance per SF(1): | $331 | ||||
| Mortgage Rate: | 2.8290% | Maturity Date Balance per SF(1): | $331 | ||||
| Note Date: | 11/12/2020 | Property Manager: | ESRT Management, L.L.C. | ||||
| First Payment Date(2): | 12/1/2020 | (borrower-related) | |||||
| Maturity Date: | 12/1/2030 | ||||||
| Original Term to Maturity(2): | 121 months | ||||||
| Original Amortization Term: | 0 months | Underwriting and Financial Information(6)(7) | |||||
| IO Period(2): | 121 months | UW NOI: | $19,890,581 | ||||
| Seasoning: | 0 months | UW NOI Debt Yield(1): | 11.1% | ||||
| Prepayment Provisions(2)(3): | LO (24); DEF (90); O (7) | UW NOI Debt Yield at Maturity(1): | 11.1% | ||||
| Lockbox/Cash Mgmt Status: | Hard/In Place | UW NCF DSCR(1): | 3.49x | ||||
| Additional Debt Type(1)(4): | Pari Passu | Most Recent NOI: | $19,265,309 (6/30/2020 TTM) | ||||
| Additional Debt Balance(1)(4): | $93,000,000 | 2nd Most Recent NOI: | $18,978,463 (12/31/2019) | ||||
| Future Debt Permitted (Type): | No (N/A) | 3rd Most Recent NOI: | $19,146,149 (12/31/2018) | ||||
| Reserves(5) | Most Recent Occupancy: | 79.8% (10/29/2020) | |||||
| Type | Initial | Monthly | Cap | 2nd Most Recent Occupancy: | 75.7% (12/31/2019) | ||
| RE Tax: | $3,841,605 | $768,321 | N/A | 3rd Most Recent Occupancy: | 82.8% (12/31/2018) | ||
| Insurance: | $0 | Springing | N/A | Appraised Value (as of): | $330,000,000 (11/1/2020) | ||
| Recurring Replacements: | $0 | Springing | N/A | Appraised Value per SF: | $607 | ||
| Rollover (TI/LC): | $859,958 | Springing | N/A | Cut-off Date LTV Ratio(1): | 54.5% | ||
| Other: | $4,194,083 | $0 | N/A | Maturity Date LTV Ratio(1): | 54.5% | ||
| Sources and Uses | ||||||
| Sources | Proceeds | % of Total | Uses | Proceeds | % of Total | |
| Whole Loan Amount(1): | $180,000,000 | 100.0% | Return of Equity: | $164,840,700 | 91.6% | |
| Reserves: | $8,895,646 | 4.9% | ||||
| Closing Costs: | $6,263,654 | 3.5% | ||||
| Total Sources: | $180,000,000 | 100.0% | Total Uses: | $180,000,000 | 100.0% | |
| (1) | The 250 West 57th Street Mortgage Loan (as defined below) is a part of the 250 West 57th Street Whole Loan (as defined below) with an original aggregate principal balance of $180,000,000. The Cut-off Date Balance Per SF, Maturity Date Balance Per SF, UW NOI Debt Yield, UW NOI Debt Yield at Maturity, UW NCF DSCR, Cut-off Date LTV Ratio and Maturity Date LTV Ratio numbers presented above are based on the aggregate principal balance of the promissory notes comprising the 250 West 57th Street Whole Loan. |
| (2) | The first payment date for the 250 West 57th Street Mortgage Loan is January 1, 2021. On the Closing Date, MSMCH will deposit sufficient funds to pay the amount of interest that would be due with respect to a December 1, 2020 payment. First Payment Date, Original Term to Maturity, IO Period and Prepayment Provisions are inclusive of the additional December 1, 2020 interest-only payment funded by MSMCH on the Closing Date. |
| (3) | Defeasance of the 250 West 57th Street Whole Loan is permitted at any time after the earlier of (i) July 1, 2024, or (ii) two years from the closing date of the securitization that includes the last pari passu note of the 250 West 57th Street Whole Loan to be securitized. The assumed defeasance lockout period of 24 payments is based on the closing date of this transaction in November 2020. |
| (4) | See “The Mortgage Loan” and “Additional Secured Indebtedness (not including trade debts)” below for further discussion of additional debt. |
| (5) | See “Escrows and Reserves” below for further discussion of reserve requirements. |
| (6) | The novel coronavirus pandemic is an evolving situation and could impact the 250 West 57th Street Whole Loan more severely than assumed in the underwriting of the 250 West 57th Street Whole Loan and could adversely affect the NOI, NCF and occupancy information, as well as the appraised value and the DSCR, LTV and Debt Yield metrics presented above and herein. See “Risk Factors-—Risks Related to Market Conditions and Other External Factors—The Coronavirus Pandemic Has Adversely Affected the Global Economy and Will Likely Adversely Affect the Performance of the Mortgage Loans” in the Preliminary Prospectus. |
| (7) | The borrower has informed the lender that it has applied for an Industrial and Commercial Abatement Program (“ICAP”) tax abatement, which has not yet been received. See “The Property—Tax Abatement” below. Approximately $2,178,571 of ICAP benefits was underwritten. Excluding such ICAP benefits, the UW NCF DSCR would be 3.16x, and the UW NOI Debt Yield and the UW NOI Debt Yield at Maturity would be 10.1%. The Appraised Value assumes that the ICAP is in place and has a net present value of $11,000,000. If such net present value of $11,000,000 was excluded from the Appraised Value of $330,000,000, the Cut-off Date LTV Ratio and LTV Ratio at Maturity would be 56.4%. There can be no assurance of what the actual Appraised Value would be if the ICAP abatement is not obtained. |
The Mortgage Loan. The largest mortgage loan (the “250 West 57th Street Mortgage Loan”) is part of a whole loan (the “250 West 57th Street Whole Loan”) evidenced by three pari passu promissory notes in the aggregate original principal amount of $180,000,000 and secured by a first priority fee mortgage encumbering an office property located in New York, New York (the “250 West 57th Street Property”). The controlling Note A-1, in the original principal amount of $87,000,000, represents the 250 West 57th Street Mortgage Loan and will be included in the BANK 2020-BNK29 securitization trust. Each of the non-controlling Notes A-2 and A-3, in the original aggregate principal amount of $93,000,000 (together, the “250 West 57th Street Serviced Pari Passu Companion Loan”), are currently held by Morgan Stanley Bank, N.A. and are expected to be contributed to one or more future securitization transactions. The 250 West 57th Street Whole Loan will be serviced pursuant to the pooling and servicing agreement for the BANK 2020-BNK29 securitization trust. See “Description of the Mortgage Pool—The Whole Loans—The Serviced Pari Passu Whole Loans” and “Pooling and Servicing Agreement” in the Preliminary Prospectus.
This is not a research report and was not prepared by any Underwriter’s research department. Please see additional important information and qualifications at the end of this Term Sheet.
35
| Office – CBD | Loan #1 | Cut-off Date Balance: | $87,000,000 | |
| 250 West 57th Street | 250 West 57th Street | Cut-off Date LTV: | 54.5% | |
| New York, NY 10107 | UW NCF DSCR: | 3.49x | ||
| UW NOI Debt Yield: | 11.1% |
| 250 West 57th Street Whole Loan Summary | |||||
| Note | Original Balance | Cut-off Date Balance | Note Holder | Controlling Piece | |
| A-1 | $87,000,000 | $87,000,000 | BANK 2020-BNK29 | Yes | |
| A-2 | $70,000,000 | $70,000,000 | MSBNA | No | |
| A-3 | $23,000,000 | $23,000,000 | MSBNA | No | |
| Total | $180,000,000 | $180,000,000 | |||
The Borrower and the Borrower Sponsor. The borrower is ESRT 250 West 57th St., L.L.C. (the “250 West 57th Street Borrower”), a Delaware limited liability company structured with two independent directors. The borrower sponsor and the non-recourse carveout guarantor is Empire State Realty OP, L.P. (“ESRT”). Headquartered in New York, New York, ESRT owns, manages, operates, acquires and repositions office and retail properties in Manhattan and the greater New York metropolitan area, including the Empire State Building. ESRT’s office and retail portfolio covers 10.1 million rentable SF, including 9.4 million rentable SF in 14 office properties, with nine in Manhattan and the remaining five properties in Fairfield County, Connecticut and Westchester County, New York.
The Property. The 250 West 57th Street Property is a Class B, 26-story office property totaling 543,743 SF, including 67,867 SF of retail space, located in New York City. The 250 West 57th Street Property was built in 1921 and underwent an approximately $28.7 million renovation starting in 2017 and finishing earlier in 2020. The renovation included a new lobby, new retail storefronts, transportation upgrades, the addition of a west terrace, restroom and common area renovations, and new mechanical upgrades throughout. The 250 West 57th Street Borrower anticipates approximately $4.2 million of capital expenditures over the next three years, which include Local law 11 work, riser pipe replacement and landlord work for the Concord Music space; however, such work is generally not required or reserved for under the 250 West 57th Street Whole Loan documents.
The renovation of the 250 West 57th Street Property included converting multi-tenanted floors into single tenancy floors. The 8th, 10th through 15th, 17th, 19th, 20th and 22nd through 24th floors have been converted to single tenant use. The 250 West 57th Street Borrower intends to convert the 4th, 16th and 21st floors into single tenant spaces, once existing leases on those floors expire. Approximately 282,000 SF have been leased in the building since 2017. Tenants that have signed leases over the past three years include American Society of Composers, Authors and Publishers (“ASCAP”) (87,943 SF), Concord Music, Inc. (“Concord Music”) (46,329 SF), The Icahn School of Medicine at Mount Sinai (“The Icahn School of Medicine”) (26,104 SF), CookFox Architects, D.P.C. (19,185 SF) and Distinguished Concerts Int’l (17,644 SF), which have long-term leases at the 250 West 57th Street Property.
The 250 West 57th Street Property was 79.8% leased as of October 29, 2020 to 45 tenants. Aside from ASCAP (16.8% of underwritten rent), which is the largest overall tenant at the 250 West 57th Street Property and the largest office tenant, and The TJX Companies, Inc. (“TJ Maxx”) (14.0% of underwritten rent), which is the second largest overall tenant at the 250 West 57th Street Property and the largest retail tenant, no other tenant accounts for more than 9.2% of underwritten rent or 8.5% of total SF. The 250 West 57th Street Property contains a retail component that comprises 12.5% of the total rentable area and accounts for approximately 28.2% of underwritten rent. The largest retail tenant is TJ Maxx (46,644 SF), which leases the Eighth Avenue corner space. TJ Maxx leases 2,794 SF at grade, 20,000 SF on the 2nd floor, 18,965 SF on the 3rd floor and 4,885 SF in the basement. In 2018, TJ Maxx extended its lease through November 30, 2030 and expanded on the 3rd floor. The retail component has strong credit tenancy, including HSBC Bank, Bank of America, TJ Maxx and Starbucks.
The three largest office tenants are ASCAP (87,943 SF) on the 12th, 13th, 14th and 20th floors, Concord Music (46,329 SF) on the 5th and 6th floors, and Lighthouse Guild International Inc. (37,680 SF) on the 9th and 10th floors. In total, the three largest office tenants represent 31.6% of NRA and 32.6% of underwritten rent.
Tax Abatement. The 250 West 57th Street Borrower has applied for a 10-year Industrial and Commercial Abatement Program (“ICAP”) tax abatement based on the recent renovation of the 250 West 57th Street Property. The 250 West 57th Street Borrower filed a notice with the Department of Finance of the City of New York on April 28, 2020 certifying that all construction at the 250 West 57th Street Property necessary to obtain the partial tax exemption had been completed. The 250 West 57th Street Borrower has represented that it has complied with all of the statutory requirements of the ICAP program, other than providing proof to the Department of Finance of the City of New York that all of the outstanding violations against the 250 West 57th Street Property set forth in the final loan documents have been cleared and removed of record. The 250 West 57th Street Borrower anticipates submitting the evidence of clearing and removing of record the outstanding violations to the Department of Finance on or about November 1, 2021 and receiving the final approval for the ICAP tax abatement benefits no later than November 1, 2021. In the event that the 250 West 57th Street Borrower fails to clear each of the existing violations from the public record, the 250 West 57th Street Borrower is required to deposit $18,200,000, which will be held as additional collateral for the 250 West 57th Street Whole Loan until the earlier of (i) delivery of a Final Certificate of Eligibility by the New York City Department of Finance evidencing the final approval of the ICAP abatement and (ii) the repayment or defeasance of the 250 West 57th Street Whole Loan.
Once the violations are cleared, the ICAP abatement is expected to commence retroactively in the tax year of 2020/2021 and expire in 2029/2030, providing the 250 West 57th Street Borrower a 100% exemption from any increases in the 250 West 57th Street Property’s real estate taxes for the first five years, then phasing out the exemption by 20% every year thereafter. According to the related appraisal, if the ICAP is obtained it would result in an estimated annual tax savings of $2,178,571, which would then decline as described above. We cannot assure you that the ICAP abatement will be obtained.
This is not a research report and was not prepared by any Underwriter’s research department. Please see additional important information and qualifications at the end of this Term Sheet.
36
| Office – CBD | Loan #1 | Cut-off Date Balance: | $87,000,000 | |
| 250 West 57th Street | 250 West 57th Street | Cut-off Date LTV: | 54.5% | |
| New York, NY 10107 | UW NCF DSCR: | 3.49x | ||
| UW NOI Debt Yield: | 11.1% |
The following table presents certain information relating to the major tenants at the 250 West 57th Street Property:
| Tenant Summary(1) | |||||||||
| Tenant Name | Credit Rating (Fitch/Moody’s/S&P)(2) | Tenant SF | Approx. % of SF | Annual UW Rent | % of Total Annual UW Rent | Annual UW Rent PSF(3) | Lease Expiration | Renewal Options | Termination Option (Y/N) |
| Office Tenants | |||||||||
| ASCAP | NR/NR/NR | 87,943 | 16.2% | $5,250,340 | 16.8% | $59.70 | 8/31/2034 | 2 x 5-year | N |
| Concord Music(4) | NR/NR/NR | 46,329 | 8.5% | $2,872,398 | 9.2% | $62.00 | 12/10/2035 | 1 x 5-year | N |
| Lighthouse Guild International Inc. | NR/NR/NR | 37,680 | 6.9% | $2,082,950 | 6.7% | $55.28 | 5/31/2027 | 1 x 5-year | N |
| UMG Recordings, Inc. | NR/NR/NR | 26,152 | 4.8% | $1,699,880 | 5.4% | $65.00 | 12/31/2028 | 1 x 5-year | N |
| The Icahn School of Medicine(5) | A/A2/A- | 26,104 | 4.8% | $1,566,240 | 5.0% | $60.00 | 2/29/2028 | 1 x 5-year | N |
| Office Subtotal/Wtd. Avg. | 224,208 | 41.2% | $13,471,808 | 43.0% | $60.09 | ||||
| Retail Tenants | |||||||||
| The TJX Companies, Inc. | NR/A2/A | 46,644 | 8.6% | $4,396,663 | 14.0% | $94.26 | 11/30/2030 | 1 x 5-year | N |
| Bank of America | A+/A2/A- | 4,432 | 0.8% | $1,461,984 | 4.7% | $329.87 | 12/31/2026 | 1 x 5-year | N |
| Cingular Wireless | NR/NR/NR | 3,805 | 0.7% | $1,451,874 | 4.6% | $381.57 | 8/31/2023 | 1 x 5-year | N |
| HSBC | A+/A3/A- | 2,864 | 0.5% | $1,181,400 | 3.8% | $412.50 | 10/18/2025 | 1 x 5-year | N |
| Retail Subtotal/Wtd. Avg. | 57,745 | 10.6% | $8,491,921 | 27.1% | $147.06 | ||||
| Other Tenants | 151,831 | 27.9% | $9,330,195 | 29.8% | $61.45 | ||||
| Vacant Space | 109,959 | 20.2% | $0 | 0.0% | $0.00 | ||||
| Total/Wtd. Avg. | 543,743 | 100.0% | $31,293,924 | 100.0% | $72.14 | ||||
| (1) | Information is based on the underwritten rent roll as of October 29, 2020. |
| (2) | Certain ratings are those of the parent company whether or not the parent company guarantees the lease. |
| (3) | Total/Wtd. Avg. Annual UW Rent PSF excludes vacant space. |
| (4) | Concord Music has free rent for eleven months starting in the month in which the commencement date of its lease occurs. Lease commencement is expected occur once the landlord completes its work and is expected by November 30, 2020. Gap rent has not been reserved for the period prior to lease commencement but if rent does not commence by November 30, 2020, the 250 West 57th Borrower is required to make additional deposits into the free rent reserve as described under “Escrows and Reserves” below. At origination, $2,468,189 was reserved in respect of such free rent. |
| (5) | The Icahn School of Medicine has free rent for each of the following months: March 2021, July 2021, November 2021, March 2022, July 2022, March 2023, July 2023, March 2024, July 2024, March 2025, March 2026 and March 2027. At origination, $1,566,240 was reserved in respect of such free rent. |
The following table presents certain information relating to the lease rollover schedule at the 250 West 57th Street Property:
| Lease Rollover Schedule(1)(2) | ||||||||
| Year | # of Leases Rolling(3) | SF Rolling | UW Rent PSF Rolling | Approx. % of Total SF Rolling | Approx. Cumulative % of SF Rolling | Total UW Rent Rolling | Approx. % of Total Rent Rolling | Approx. Cumulative % of Total Rent Rolling |
| MTM | 1 | 0 | $0.00 | 0.0% | 0.0% | $1,766 | 0.0% | 0.0% |
| 2020 | 0 | 0 | $0.00 | 0.0% | 0.0% | $0 | 0.0% | 0.0% |
| 2021 | 2 | 9,078 | $55.60 | 1.7% | 1.7% | $504,770 | 1.6% | 1.6% |
| 2022 | 6 | 16,544 | $49.39 | 3.0% | 4.7% | $817,102 | 2.6% | 4.2% |
| 2023 | 7 | 22,013 | $109.99 | 4.0% | 8.8% | $2,421,172 | 7.7% | 12.0% |
| 2024 | 3 | 6,214 | $100.74 | 1.1% | 9.9% | $625,999 | 2.0% | 14.0% |
| 2025 | 5 | 14,562 | $137.03 | 2.7% | 12.6% | $1,995,403 | 6.4% | 20.3% |
| 2026 | 6 | 37,059 | $91.86 | 6.8% | 19.4% | $3,404,269 | 10.9% | 31.2% |
| 2027 | 4 | 37,680 | $55.45 | 6.9% | 26.3% | $2,089,316 | 6.7% | 37.9% |
| 2028 | 4 | 59,312 | $61.49 | 10.9% | 37.2% | $3,647,144 | 11.7% | 49.6% |
| 2029 | 1 | 13,577 | $64.10 | 2.5% | 39.7% | $870,259 | 2.8% | 52.3% |
| 2030 | 1 | 46,644 | $94.26 | 8.6% | 48.3% | $4,396,663 | 14.0% | 66.4% |
| 2031 & Beyond | 5 | 171,101 | $61.48 | 31.5% | 79.8% | $10,520,061 | 33.6% | 100.0% |
| Vacant Space | 0 | 109,959 | $0.00 | 20.2% | 100.0% | $0 | 0.0% | 100.0% |
| Total/Wtd. Avg.(4) | 45 | 543,743 | $72.14 | 100.0% | $31,293,924 | 100.0% | ||
| (1) | Information is based on the underwritten rent roll as of October 29, 2020. |
| (2) | Certain tenants may have lease termination options that are exercisable prior to the stated expiration date of the subject lease or leases that are not considered in the lease rollover schedule. |
| (3) | The Total # of Leases Rolling includes six telecom tenants, one broadcast tenant and a management office that have no SF associated with their leases. |
| (4) | Total/Wtd. Avg. UW Rent PSF Rolling excludes vacant space. |
This is not a research report and was not prepared by any Underwriter’s research department. Please see additional important information and qualifications at the end of this Term Sheet.
37
| Office – CBD | Loan #1 | Cut-off Date Balance: | $87,000,000 | |
| 250 West 57th Street | 250 West 57th Street | Cut-off Date LTV: | 54.5% | |
| New York, NY 10107 | UW NCF DSCR: | 3.49x | ||
| UW NOI Debt Yield: | 11.1% |
COVID-19 Update. The first debt service payment date for the 250 West 57th Street Whole Loan is January 1, 2021 and, as of November 10, 2020, the 250 West 57th Street Whole Loan is not subject to any forbearance, modification or debt service relief request. As of October 30, 2020, the borrower has reported that the 250 West 57th Street Property is open and operating, while a few tenants are still closed due to the COVID-19 pandemic, with 90.4% of tenants by occupied NRA and 91.8% of tenants by underwritten base rent having paid their full October 2020 rent payments. Ten tenants (16.2% of NRA and 16.8% of underwritten base rent) at the 250 West 57th Street Property have requested rent relief and five of such tenants (9.4% of NRA and 10.6% of underwritten base rent) have been granted deferrals of rent by the 250 West 57th Street Borrower. Three of the five tenants (6.1% of NRA and 6.6% of underwritten base rent) were granted between 1 and 3 months of deferred rent with repayment over fixed periods. One of the five tenants (3.2% of NRA and 3.9% of underwritten base rent) is in discussions with the 250 West 57th Street Borrower regarding a rent deferral plan. One of the five tenants (0.1% of NRA and 0.1% of underwritten base rent) is paying 25% of its monthly gross sales from April to December 2020 and is required to resume paying fixed rent in January 2021.
The Market. The 250 West 57th Street Property is located in New York, New York on the south side of West 57th Street between Broadway and Eighth Avenue in the West Side office submarket of Midtown Manhattan. The 250 West 57th Street Property is in close proximity to Carnegie Hall, Lincoln Center and Central Park, as well as Columbus Circle. Primary access to the 250 West 57th Street Property is provided by four subway lines at the 57th Street station, one block east, and four additional subway lines at the 59th Street - Columbus Circle subway station, two blocks north. Local arteries include the following streets: Eighth Avenue, Broadway and 57th Street. The 250 West 57th Street Property is also accessible from both the West Side Highway and FDR Drive. These roadways provide access to all regional and interstate roadways. According to the appraisal, as of the third quarter of 2020, the vacancy rate in the West Side office submarket was approximately 10.8%, with average asking rents of $79.57 PSF and inventory of approximately 31.0 million SF. According to the appraisal, as of the third quarter of 2020, the vacancy rate in the Midtown office market was approximately 10.6%, with average asking rents of $82.97 PSF and inventory of approximately 248.4 million SF.
The following table presents certain information relating to the appraisal’s market rent conclusion for the 250 West 57th Street Property:
| Market Rent Summary | ||||
| Market Rent (PSF) | Lease Term (Years) | Lease Type (Reimbursements) | Rent Increase Projection | |
| Office (Floors 4-10) | $61.00 | 10 (major); 5 (minor) | Modified Gross | 10.0% year 5 (major); 5.0% year 4 (minor) |
| Office (Floors 11-19) | $66.00 | 10 (major); 5 (minor) | Modified Gross | 10.0% year 5 (major); 5.0% year 4 (minor) |
| Office (Floors 20-26) | $71.00 | 10 (major); 5 (minor) | Modified Gross | 10.0% year 5 (major); 5.0% year 4 (minor) |
| Retail (Inline) | $300.00 | 10 | Modified Gross | 3.0% annually |
| Retail (Corner) | $350.00 | 10 | Modified Gross | 3.0% annually |
| Retail (Floors 2-3) | $75.00 | 10 | Modified Gross | 3.0% annually |
| Retail (Interior) | $50.00 | 10 | Modified Gross | 3.0% annually |
| Retail (Lower Level) | $35.00 | 10 | Modified Gross | 3.0% annually |
| Storage | $35.00 | 10 | Modified Gross | 10.0% year 5 |
Source: Appraisal.
The following table presents recent leasing data with respect to comparable office properties with respect to the 250 West 57th Street Property:
| Comparable Office Lease Summary | |||||||
| Property/Location | Year Built | SF | Tenant Name | Size (SF) | Lease Date | Rent PSF | Lease Type |
114 W. 41st Street New York, NY | 1915 | 261,000 | Spring Fertility Clinic | 31,862 | 8/1/2020 | $70.00 | Modified Gross |
1501 Broadway New York, NY | 1926 | 508,812 | American Academy McAllister Institute | 10,500 | 6/1/2020 | $50.00 | Modified Gross |
1411 Broadway New York, NY | 1969 | 914,000 | Screenvision | 25,000 | 4/1/2020 | $77.65 | Modified Gross |
135 West 50th Street New York, NY | 1964 | 687,568 | Industrious | 36,853 | 2/1/2020 | $52.00 | Gross |
1330 Avenue of the Americas New York, NY | 1965 | 415,000 | Hunt Companies | 10,400 | 2/1/2020 | $88.00 | Modified Gross |
1350 Avenue of the Americas New York, NY | 1966 | 424,000 | The Mark Foundation for Cancer Research | 4,325 | 2/1/2020 | $86.00 | Gross |
1411 Broadway New York, NY | 1969 | 914,000 | TruMid Financial | 12,771 | 1/1/2020 | $76.00 | Modified Gross |
311 West 43rd Street New York, NY | 1905 | 155,000 | Amnesty International | 12,208 | 12/1/2019 | $63.00 | Modified Gross |
Source: Appraisal.
This is not a research report and was not prepared by any Underwriter’s research department. Please see additional important information and qualifications at the end of this Term Sheet.
38
| Office – CBD | Loan #1 | Cut-off Date Balance: | $87,000,000 | |
| 250 West 57th Street | 250 West 57th Street | Cut-off Date LTV: | 54.5% | |
| New York, NY 10107 | UW NCF DSCR: | 3.49x | ||
| UW NOI Debt Yield: | 11.1% |
The following table presents recent leasing data with respect to comparable retail properties with respect to the 250 West 57th Street Property:
| Comparable Retail Lease Summary | |||||||
| Property/Location | Year Built | SF | Tenant Name | Size (SF) | Lease Date | Rent PSF | Lease Type |
1796 Broadway New York, NY | 1941 | 387,428 | Venchi | 801 | 8/1/2020 | $375.00 | Modified Gross |
973 Eighth Avenue New York, NY | 1987 | 257,885 | Dunkin | 1,100 | 3/1/2020 | $245.00 | Modified Gross |
1740 Broadway New York, NY | 1950 | 519,600 | Sweetgreen | 2,706 | 2/1/2020 | $215.00 | Modified Gross |
934 Eighth Avenue New York, NY | 1930 | 5,210 | Popeyes | 1,100 | 1/1/2020 | $225.00 | Modified Gross |
1695 Broadway New York, NY | 1925 | 16,500 | Fle Fle Grill | 1,200 | 11/1/2019 | $300.00 | Modified Gross |
1804 Broadway New York, NY | 1941 | 387,428 | Lenscrafters | 1,375 | 9/1/2019 | $380.00 | Modified Gross |
1700 Broadway New York, NY | 1968 | 596,559 | Shake Shack | 2,009 | 6/1/2019 | $308.00 | Modified Gross |
871 Eighth Avenue New York, NY | 1942 | 59,701 | Just Baked | 520 | 3/1/2019 | $415.00 | Modified Gross |
Source: Appraisal.
Operating History and Underwritten Net Cash Flow. The following table presents certain information relating to the operating history and Underwritten Net Cash Flow at the 250 West 57th Street Property:
| Cash Flow Analysis(1) | ||||||
| 2017 | 2018 | 2019 | 6/30/2020 TTM | UW | UW Per SF | |
| Gross Potential Rent(2) | $26,715,440 | $29,685,939 | $30,865,279 | $30,280,926 | $31,747,553 | $58.39 |
| Total Recoveries | $2,879,551 | $2,644,596 | $3,204,234 | $3,808,372 | $3,724,742 | $6.85 |
| Other Income | $156,376 | $374,306 | $472,969 | $692,603 | $692,603 | $1.27 |
| Less Vacancy & Credit Loss | $0 | $0 | $0 | $0 | $0 | $0.00 |
| Effective Gross Income | $29,751,367 | $32,704,841 | $34,542,482 | $34,781,901 | $36,164,898 | $66.51 |
| Real Estate Taxes(3) | $5,946,368 | $6,338,112 | $7,209,415 | $7,876,811 | $6,391,309 | $11.75 |
| Insurance | $269,348 | $272,947 | $281,778 | $289,728 | $350,000 | $0.64 |
| Other Expenses(4) | $6,646,320 | $6,947,633 | $8,072,826 | $7,350,053 | $9,533,008 | $17.53 |
| Total Expenses | $12,862,036 | $13,558,692 | $15,564,019 | $15,516,592 | $16,274,317 | $29.93 |
| Net Operating Income | $16,889,331 | $19,146,149 | $18,978,463 | $19,265,309 | $19,890,581 | $36.58 |
| Capital Expenditures | $0 | $0 | $0 | $0 | $114,186 | $0.21 |
| TI/LC | $0 | $0 | $0 | $0 | $1,764,049 | $3.24 |
| Net Cash Flow | $16,889,331 | $19,146,149 | $18,978,463 | $19,265,309 | $18,012,345 | $33.13 |
| Occupancy % | 71.4% | 82.8% | 75.7% | 79.8%(5) | 79.8% | |
| NOI DSCR(6) | 3.27x | 3.71x | 3.68x | 3.73x | 3.85x | |
| NCF DSCR(6) | 3.27x | 3.71x | 3.68x | 3.73x | 3.49x | |
| NOI Debt Yield(6) | 9.4% | 10.6% | 10.5% | 10.7% | 11.1% | |
| NCF Debt Yield(6) | 9.4% | 10.6% | 10.5% | 10.7% | 10.0% | |
| (1) | For the avoidance of doubt, no COVID specific adjustments have been made to the lender underwriting. |
| (2) | UW Gross Potential Rent is based on the rent roll as of August 1, 2020, with updates received on October 29, 2020, and includes (i) rent steps of $944,377 through December 31, 2021 and (ii) straight-line rent credit of $453,629 for investment grade tenants. |
| (3) | UW Real Estate Taxes represent the anticipated 2020/2021 abated taxes. See “The Property—Tax Abatement” section above. We cannot assure you that the abatement will be obtained. |
| (4) | UW Other Expenses includes a 3% management fee, equal to $1,000,000. The 250 West 57th Street Property is self-managed. |
| (5) | 6/30/2020 TTM Occupancy % is as of October 29, 2020. |
| (6) | Debt service coverage ratios and debt yields are based on the 250 West 57th Street Whole Loan. |
Escrows and Reserves.
Taxes – The 250 West 57th Street Whole Loan documents provide for an upfront reserve of approximately $3,841,605 for real estate taxes and ongoing monthly deposits into a reserve for real estate taxes in an amount equal to 1/12 of the real estate taxes that the lender estimates will be payable during the next twelve months for the 250 West 57th Street Property (initially $768,321).
This is not a research report and was not prepared by any Underwriter’s research department. Please see additional important information and qualifications at the end of this Term Sheet.
39
| Office – CBD | Loan #1 | Cut-off Date Balance: | $87,000,000 | |
| 250 West 57th Street | 250 West 57th Street | Cut-off Date LTV: | 54.5% | |
| New York, NY 10107 | UW NCF DSCR: | 3.49x | ||
| UW NOI Debt Yield: | 11.1% |
Insurance – The 250 West 57th Street Whole Loan documents provide for monthly deposits into a reserve for insurance premiums in an amount equal to 1/12 of the insurance premiums that the lender estimates will be payable for the renewal of coverage upon the expiration of the insurance policies; provided that such monthly deposits are not required so long as (i) no event of default is continuing, (ii) the liability and casualty insurance coverage for the 250 West 57th Street Property is included in a blanket policy approved by the lender in its reasonable discretion, and (iii) the 250 West 57th Street Borrower provides the lender with evidence of payment of the insurance premiums and renewals of the insurance policies, no later than ten days prior to the expiration of the current policy.
Recurring Replacements Reserve – During a Debt Yield Reserve Trigger Period (as defined below), the 250 West 57th Street Whole Loan documents provide for monthly deposits of approximately $9,543 into a reserve for approved capital expenditures, provided that such deposits are not required if such deposits would cause the amount then on deposit in such reserve to exceed $458,058. However, such deposits are required to resume when (i) a Debt Yield Reserve Trigger Period is continuing and (ii) the balance in such reserve is less than $458,058. “Debt Yield Reserve Trigger Period” means a period (a) commencing upon the debt yield being less than 8.5% at the end of any calendar quarter and (b) expiring upon the debt yield being equal to or greater than 8.5% at the end of any calendar quarter.
Rollover (TI/LC) Reserve – The 250 West 57th Street Whole Loan documents provide for an upfront reserve of $859,958 for outstanding unfunded tenant improvements and/or leasing commissions. During a Debt Yield Reserve Trigger Period, the 250 West 57th Street Whole Loan documents provide for monthly deposits of approximately $90,885 for future tenant improvements and leasing commissions, provided that such deposits are not required if such deposits would cause the amount then on deposit in such reserve to exceed $4,362,456. However, such deposits are required to resume when (i) a Debt Yield Reserve Trigger Period is continuing and (ii) the balance in such reserve falls below $4,362,456.
Free Rent Reserve – The 250 West 57th Street Whole Loan documents provide for an upfront reserve of approximately $4,194,083 for future rent credits or abatements granted to three tenants at the 250 West 57th Street Property, including RZO LLC, The Icahn School of Medicine and Concord Music. In addition, in the event that the landlord work for the tenant Concord Music is not completed by November 30, 2020, the 250 West 57th Street Borrower is required to deposit the amount of the rent abatements due to Concord Music.
Lockbox and Cash Management. The 250 West 57th Street Whole Loan is structured with a hard lockbox and in place cash management, provided that the 250 West 57th Street Borrower is required to use commercially reasonable efforts to cause the cash management account to be established within 15 business days of origination and the signature page of the lockbox bank to the lockbox agreement to be delivered within five business days of origination. The 250 West 57th Street Borrower is required to direct each tenant of the 250 West 57th Street Property to deposit all rents directly into the lockbox account, and to deposit any funds received by the 250 West 57th Street Borrower and property manager, notwithstanding such direction, into the lockbox account within two business days of receipt. On each business day, all funds in the lockbox account are required to be transferred to a lender-controlled cash management account. Provided no event of default under the 250 West 57th Street Whole Loan documents is continuing, all funds in the cash management account are required to be applied on each monthly payment date: (i) to make the monthly deposits into the real estate tax and insurance reserves as described above under “Escrows and Reserves,” (ii) to pay debt service on the 250 West 57th Street Whole Loan, (iii) to make the required monthly deposit, if any, into the Recurring Replacements reserve as described above under “Escrows and Reserves,” (iv) to make the required monthly deposit, if any, into the Rollover (TI/LC) Funds reserve as described above under “Escrows and Reserves,” (v) during a Cash Sweep Event Period (as defined below), to pay operating expenses set forth in the annual budget (which is required to be reasonably approved by the lender during a Cash Sweep Event Period) and lender-approved extraordinary expenses, and (vi) to disburse any remainder in the following order of priority: (a) during a Cash Sweep Event Period, into an excess cash flow subaccount to be held as additional security for the 250 West 57th Street Whole Loan during such Cash Sweep Event Period, and (b) to the extent that no Cash Sweep Event Period is continuing, to the 250 West 57th Street Borrower.
“Cash Sweep Event Period” means a period:
| (i) | commencing upon an event of default under the 250 West 57th Street Whole Loan documents and ending upon the cure, if applicable, of such event of default; or |
| (ii) | commencing upon the debt yield on the 250 West 57th Street Whole Loan falling below 6.5% for two consecutive calendar quarters (a “Debt Yield Event”), and ending on the date the debt yield equals or exceeds 6.5% for two consecutive calendar quarters. |
The 250 West 57th Street Borrower may cure a Debt Yield Event by depositing with the lender cash or a letter of credit in an amount which, if applied to reduce the outstanding principal balance of the 250 West 57th Street Whole Loan, would cause the debt yield to be equal to or greater than 6.5% for two consecutive calendar quarters, as described above.
Additional Secured Indebtedness (not including trade debts). The 250 West 57th Street Property also secures the 250 West 57th Street Serviced Pari Passu Companion Loan, which has a Cut-off Date principal balance of $93,000,000. The 250 West 57th Street Serviced Pari Passu Companion Loan is entitled to payments of principal and interest on a pro rata and pari passu basis with the 250 West 57th Street Mortgage Loan. The holders of the 250 West 57th Street Mortgage Loan and the 250 West 57th Street Serviced Pari Passu Companion Loan have entered into a co-lender agreement which sets forth the allocation of collections on the 250 West 57th Street Whole Loan. See “Description of the Mortgage Pool—The Whole Loans—The Serviced Pari Passu Whole Loans” in the Preliminary Prospectus.
Mezzanine Loan and Preferred Equity. None.
Release of Property. Not permitted.
Letter of Credit. The 250 West 57th Street Borrower has the right, but not the obligation, to end a Cash Sweep Event Period commenced in connection with a Debt Yield Event by depositing with the lender a letter of credit in an amount which would cause the debt yield to be equal to or greater than 6.5% for two consecutive calendar quarters, as described above.
Right of First Offer / Right of First Refusal. None.
Ground Lease. None.
This is not a research report and was not prepared by any Underwriter’s research department. Please see additional important information and qualifications at the end of this Term Sheet.
40
| Office – CBD | Loan #1 | Cut-off Date Balance: | $87,000,000 | |
| 250 West 57th Street | 250 West 57th Street | Cut-off Date LTV: | 54.5% | |
| New York, NY 10107 | UW NCF DSCR: | 3.49x | ||
| UW NOI Debt Yield: | 11.1% |
Terrorism Insurance. The 250 West 57th Street Borrower is required to obtain and maintain an “all risk” property insurance policy that covers perils of terrorism and acts of terrorism in an amount equal to the “full replacement cost” of the 250 West 57th Street Property together with business income insurance covering not less than the 18-month period commencing at the time of loss, together with an extended period of indemnity endorsement of up to twelve months. Notwithstanding the foregoing, for so long as the Terrorism Risk Insurance Act of 2002, as extended and modified by the Terrorism Risk Insurance Program Reauthorization Act of 2015 (“TRIPRA”), is in effect (including any extensions thereof or if another federal governmental program is in effect relating to “acts of terrorism” which provides substantially similar protections as TRIPRA), the lender is required to accept terrorism insurance which insures against “covered acts” as defined by TRIPRA (or such other program) as full compliance with the loan documents, but only in the event that TRIPRA (or such other program) continues to cover both domestic and foreign acts of terrorism. See “Risk Factors—Risks Relating to the Whole Loans—Terrorism Insurance May Not Be Available for All Mortgaged Properties” in the Preliminary Prospectus.
This is not a research report and was not prepared by any Underwriter’s research department. Please see additional important information and qualifications at the end of this Term Sheet.
41
| Office – Suburban | Loan #2 | Cut-off Date Balance: | $85,000,000 | |
| 1143 & 1155 Coleman Avenue | Coleman Highline | Cut-off Date LTV: | 56.5% | |
| San Jose, CA 95110 | UW NCF DSCR: | 3.18x | ||
| UW NOI Debt Yield: | 9.2% |

This is not a research report and was not prepared by any Underwriter’s research department. Please see additional important information and qualifications at the end of this Term Sheet.
42
| Office – Suburban | Loan #2 | Cut-off Date Balance: | $85,000,000 | |
| 1143 & 1155 Coleman Avenue | Coleman Highline | Cut-off Date LTV: | 56.5% | |
| San Jose, CA 95110 | UW NCF DSCR: | 3.18x | ||
| UW NOI Debt Yield: | 9.2% |

This is not a research report and was not prepared by any Underwriter’s research department. Please see additional important information and qualifications at the end of this Term Sheet.
43
| Mortgage Loan No. 2 – Coleman Highline |
| Mortgage Loan Information | Property Information | |||||
| Mortgage Loan Seller: | WFB | Single Asset/Portfolio: | Single Asset | |||
| Credit Assessment (DBRSM/Fitch/Moody’s): | NR/NR/NR | Location: | San Jose, CA 95110 | |||
| Original Balance(1): | $85,000,000 | General Property Type: | Office | |||
| Cut-off Date Balance(1): | $85,000,000 | Detailed Property Type: | Suburban | |||
| % of Initial Pool Balance: | 9.8% | Title Vesting: | Fee | |||
| Loan Purpose: | Acquisition | Year Built/Renovated: | 2017/N/A | |||
| Sponsor: | BREIT Operating Partnership, L.P. | Size: | 357,106 SF | |||
| Guarantor: | BREIT Operating Partnership, L.P. | Cut-off Date Balance per SF(2): | $470 | |||
| Mortgage Rate: | 2.8675% | Maturity Date/ARD Balance per SF(2): | $470 | |||
| Note Date: | 10/30/2020 | Property Manager: | EQ Management, LLC | |||
| First Payment Date: | 12/6/2020 | |||||
| Anticipated Repayment Date (“ARD”) (2): | 11/6/2030 | |||||
| Maturity Date(2): | 11/6/2032 | |||||
| Original Term to Maturity/ARD(2): | 120 months | |||||
| Original Amortization Term: | 0 months | Underwriting and Financial Information(6) | ||||
| IO Period: | 120 months | UW NOI: | $15,507,894 | |||
| Seasoning: | 0 months | UW NOI Debt Yield(1): | 9.2% | |||
| Prepayment Provisions(3): | YM0.5 (24); DEF/YM0.5 (89); O (7) | UW NOI Debt Yield at Maturity/ARD(1): | 9.2% | |||
| Lockbox/Cash Mgmt Status: | Hard/Springing | UW NCF DSCR(1): | 3.18x | |||
| Additional Debt Type(1)(4): | Pari Passu | Most Recent NOI(7): | N/A | |||
| Additional Debt Balance(1)(4): | $82,700,000 | 2nd Most Recent NOI(7): | N/A | |||
| Future Debt Permitted (Type): | No (N/A) | 3rd Most Recent NOI(7): | N/A | |||
| Reserves(5) | Most Recent Occupancy: | 100.0% (11/1/2020) | ||||
| Type | Initial | Monthly | Cap | 2nd Most Recent Occupancy(7): | N/A | |
| Real Estate Taxes: | $0 | Springing | N/A | 3rd Most Recent Occupancy(7): | N/A | |
| Insurance: | $0 | Springing | N/A | Appraised Value (as of)(8): | $296,800,000 (1/1/2022) | |
| Unfunded Obligations Reserve: | $14,814,604 | $0 | N/A | Appraised Value per SF: | $831 | |
| Debt Service Reserve: | $4,875,587 | $0 | N/A | Cut-off Date LTV Ratio(1): | 56.5% | |
| Maturity Date/ARD LTV Ratio(1): | 56.5% | |||||
| Sources and Uses | ||||||
| Sources | Proceeds | % of Total | Uses | Proceeds | % of Total | |
| Whole Loan Amount(1): | $167,700,000 | 55.6% | Purchase Price: | $275,000,000 | 91.2% | |
| Borrower Equity: | $133,838,667 | 44.4% | Unfunded Obligations Reserve: | $14,814,604 | 4.9% | |
| Debt Service Reserve: | $4,875,587 | 1.6% | ||||
| Closing Costs: | $6,848,476 | 2.3% | ||||
| Total Sources: | $301,538,667 | 100.0% | Total Uses: | $301,538,667 | 100.0% | |
| (1) | The Coleman Highline Mortgage Loan (as defined below) is part of the Coleman Highline Whole Loan (as defined below) with an original aggregate principal balance of $167,700,000. The Cut-off Date Balance per SF, Maturity Date/ARD Balance per SF, UW NOI Debt Yield, UW NOI Debt Yield at Maturity Date/ARD, UW NCF DSCR, Cut-off Date LTV Ratio and Maturity Date/ARD LTV Ratio numbers presented above are based on the Coleman Highline Whole Loan. |
| (2) | The Coleman Highline Mortgage Loan has an anticipated repayment date of November 6, 2030 and a final maturity date of November 6, 2032. See “The Mortgage Loan” for further discussion of the ARD (as defined below). |
| (3) | At any time after the earlier of (i) October 30, 2023 and (ii) two years from the closing date of the securitization that includes the last pari passu note of the Coleman Highline Whole Loan to be securitized, the Coleman Highline Borrower (as defined below) has the right to defease the Coleman Highline Whole Loan in whole, but not in part. Additionally, the Coleman Highline Borrower may prepay the Coleman Highline Whole Loan at any time during the term with a 10-day prior notice and, if such prepayment occurs before May 6, 2030, payment of the yield maintenance premium. |
| (4) | See “The Mortgage Loan” and “Additional Secured Indebtedness (not including trade debts)” below for further discussion of additional debt. |
| (5) | See “Escrows and Reserves” below for further discussion of reserve requirements. |
| (6) | The novel coronavirus pandemic is an evolving situation and could impact the Coleman Highline Mortgage Loan more severely than assumed in the underwriting of the Coleman Highline Mortgage Loan and could adversely affect the NOI, NCF and occupancy information, as well as the appraised value and the DSCR, LTV and Debt Yield metrics presented above and herein. See “Risk Factors—Risks Related to Market Conditions and Other External Factors—The Coronavirus Pandemic Has Adversely Affected the Global Economy and Will Likely Adversely Affect the Performance of the Mortgage Loans” in the Preliminary Prospectus. |
| (7) | No historical operating or occupancy statements are available because the Coleman Highline Property (as defined below) was completed in 2017 and was acquired in connection with the origination of the Coleman Highline Whole Loan. No historical operating or occupancy statements are available. |
| (8) | The Appraised Value represents the prospective market value upon stabilization as of January 1, 2022. This assumes that the remaining tenant improvements have been completed on Building 1 (as defined below) and Roku has moved into its space. The As Is Appraised Value, as of October 12, 2020, is $275,700,000, representing a 60.8% loan-to-value ratio. The appraisal also provided a hypothetical as if vacant value, as of October 12, 2020, of $203,300,000, representing an 82.5% loan-to-dark value ratio. |
The Mortgage Loan. The second largest mortgage loan (the “Coleman Highline Mortgage Loan”) is part of a whole loan (the “Coleman Highline Whole Loan”) that is evidenced by three pari passu promissory notes in the aggregate original principal amount of $167,700,000. The Coleman Highline Whole Loan is secured by a first priority fee mortgage encumbering two Class A office buildings located in San Jose, California (the “Coleman Highline Property”). The Coleman Highline Whole Loan has an anticipated repayment date of November 6, 2030 (the “ARD”) and a maturity date of November 6, 2032. Prior to the ARD, the Coleman Highline Whole Loan accrues interest at a fixed rate of 2.8675% per annum (the “Initial Interest Rate”) and requires payments of
This is not a research report and was not prepared by any Underwriter’s research department. Please see additional important information and qualifications at the end of this Term Sheet.
44
| Office – Suburban | Loan #2 | Cut-off Date Balance: | $85,000,000 | |
| 1143 & 1155 Coleman Avenue | Coleman Highline | Cut-off Date LTV: | 56.5% | |
| San Jose, CA 95110 | UW NCF DSCR: | 3.18x | ||
| UW NOI Debt Yield: | 9.2% |
interest only through the ARD. In the event the Coleman Highline Whole Loan is not repaid in full on or before the ARD, the Coleman Highline Borrower will be required to make interest payments based on an interest rate equal to the Initial Interest Rate plus 2.000% per annum (“Rate Increase”). From and after the ARD, interest payments will continue to be made as provided prior to the ARD, with amounts accrued with respect to the Rate Increase being deferred (see “Lockbox and Cash Management” section) and paid on the Maturity Date, if not paid sooner by the Coleman Highline Borrower. The ARD automatically triggers a Cash Sweep Period (see “Lockbox and Cash Management” section) whereby all excess cash flow, after payments of debt service on the Coleman Highline Whole Loan, required deposits to escrows and reserves, and budgeted operating expenses, is required to be used to first pay down the principal balance of the Coleman Highline Whole Loan and thereafter, repay the accrued interest. See “Description of the Mortgage Loans—Certain Terms of the Mortgage Loans—ARD Loans” in the Preliminary Prospectus.
The Coleman Highline Mortgage Loan is evidenced by the controlling promissory Note A-1 in the original principal amount of $85,000,000. The non-controlling promissory Notes A-2 and A-3 (the “Coleman Highline Serviced Pari Passu Companion Loans”) are currently held by Wells Fargo Bank, N.A. and are expected to be contributed to one or more future securitization trusts. The Coleman Highline Whole Loan will be serviced pursuant to the pooling and servicing agreement for the BANK 2020-BNK29 securitization trust. See “Description of the Mortgage Pool—The Whole Loans—The Serviced Pari Passu Whole Loans” and “Pooling and Servicing Agreement” in the Preliminary Prospectus. The proceeds of the Coleman Highline Whole Loan were primarily used to acquire the Coleman Highline Property, fund reserves, and pay closing costs.
| Coleman Highline Whole Loan Summary | ||||
| Notes | Original Balance | Cut-off Date Balance | Note Holder | Controlling Piece |
| A-1 | $85,000,000 | $85,000,000 | BANK 2020-BNK29 | Yes |
| A-2 | $72,700,000 | $72,700,000 | WFB | No |
| A-3 | $10,000,000 | $10,000,000 | WFB | No |
| Total Whole Loan | $167,700,000 | $167,700,000 | ||
The Borrower and the Borrower Sponsors. The borrower is Bcore Coleman Owner LLC (the “Coleman Highline Borrower”), a Delaware limited liability company and single purpose entity with one independent director. In connection with the origination of the loan, counsel to the Coleman Highline Borrower delivered a non-consolidation opinion.
The borrower sponsor and non-recourse carveout guarantor is BREIT Operating Partnership, L.P. (the “Guarantor” or “BREIT OP”), an affiliate of Blackstone Real Estate Income Trust, Inc. (“BREIT”), The Blackstone Group L.P.’s non-traded REIT focused on investing primarily in stabilized commercial real estate properties. As of September 2020, BREIT owned a total of 1,182 properties.
The Coleman Highline Whole Loan documents provide that the Guarantor’s aggregate liability for various bankruptcy-related springing recourse events is subject to a cap equal to 20% of the outstanding principal balance of the Coleman Highline Whole Loan at the time of such event, plus specified costs of enforcement. The Coleman Highline Whole Loan documents also provide for, among other loss carveouts, a loss carveout (instead of springing full recourse) for voluntary transfers of the Coleman Highline Property or a controlling equity interest in the Coleman Highline Borrower made in violation of the Coleman Highline Whole Loan documents. In connection with a cap on the Guarantor’s liability for environmental losses, the Coleman Highline Borrower provided a pollution legal liability-type environmental insurance policy (“PLL Policy”) in the amount of $15,000,000 and with an initial term of at least 5 years. The Coleman Highline Whole Loan documents provide that the Guarantor has no liability for environmental matters if the policy has a term of at least two years past The Coleman Highline Whole Loan maturity date. If the PLL Policy does not run through such period, the Guarantor’s liability for environmental matters is capped at the amount of the related PLL policy limits. The Phase I environmental site assessment obtained at loan origination found one recognized environmental condition (“REC”) at the Coleman Highline Property. An un-related public company is responsible for the ongoing area-wide groundwater remediation-system and monitoring activities. See “Description of the Mortgage Pool—Environmental Considerations” in the Preliminary Prospectus.
The Property. The Coleman Highline Property is a 357,106 SF, Class A office campus located in San Jose, California. Built in 2017, the Coleman Highline Property is 100.0% leased to Roku, Inc. (“Roku” or “Tenant”) as its world headquarters, and is comprised of the following components:
| ● | “Building 1” – a 162,557 SF, 5-story office building; |
| ● | “Building 2” – a 194,549 SF, 6-story office building; |
| ● | “Amenity Building” – a 6,000 SF, 1-story amenities building, programmed as a fitness center; and |
| ● | “Parking Structure” – a 3-story parking garage with 409 parking spaces. |
The Coleman Highline Property is the first phase (“Phase I”) in the larger Coleman Highline mixed-use development, which is expected to include up to eight office buildings totaling 1.5 million SF, a 175-room hotel, 1,600 residential units, and supporting retail. The second phase of the development (“Phase II”), which includes Buildings 3 and 4, was completed in 2020 and is also fully leased to Roku. The Coleman Highline project includes a pedestrian walkway to the Santa Clara Station of Caltrain, access to Valley Transportation Authority (“VTA”) bus and light rail lines and an anticipated future Bay Area Rapid Transit (“BART”) stop.
The Coleman Highline Borrower is acquiring the Coleman Highline Property for $275,000,000, approximately $770 per rentable square foot. The Coleman Highline Property was designed by Gensler and features expansive glasslines, large floorplates (approximately 32,500 SF), and 14’ slab-to-slab heights. The Coleman Highline Property has a modern build-out with an open lobby. Additionally, the Highline extension, an elevated terrace with outdoor landscaped urban courtyards, connects Building 2 with the Amenity Building.
In addition to the Parking Structure, the Coleman Highline Property is subject to a Declaration of Covenants, Conditions and Restrictions (the “CCR”) which provides that (i) all parking structures on the Coleman Highline Property and the adjacent Phase II, which includes a 1,704 space parking garage, are to be shared parking between the Coleman Highline Property and Phase II and (ii) all parking structures throughout the Coleman Highline development are subject to various control rights of CAP Tranche 2, LLC (the “Declarant”), an entity unrelated to the Coleman Highline Borrower. However, the Declarant
This is not a research report and was not prepared by any Underwriter’s research department. Please see additional important information and qualifications at the end of this Term Sheet.
45
| Office – Suburban | Loan #2 | Cut-off Date Balance: | $85,000,000 | |
| 1143 & 1155 Coleman Avenue | Coleman Highline | Cut-off Date LTV: | 56.5% | |
| San Jose, CA 95110 | UW NCF DSCR: | 3.18x | ||
| UW NOI Debt Yield: | 9.2% |
has agreed that the Coleman Highline Property will always have access to sufficient parking to satisfy all legal requirements, as well as parking requirements contained in the Roku lease. In addition to the two parking structures in Phase I and Phase II, there are approximately 314 surface parking spaces in the development. Roku is entitled to primarily unreserved parking spaces equaling a parking ratio of approximately 3.2 spaces per 1,000 SF.
Building 1 is currently in warm shell condition. It was initially leased to 8x8, Inc. in January 2019, but 8x8, Inc. outgrew the space prior to moving in and has assigned the lease to Roku, which is required to begin paying rent January 1, 2021; 8x8, Inc. is required to pay rent through December 31, 2020. There is a $14.8 million outstanding tenant improvement allowance, which was reserved at loan closing, and must be used by December 15, 2021. Building 2 is completely built out and Roku took occupancy in phases between January and September 2019.
Major Tenant.
Roku.(357,106 SF; 100.0% of NRA; 100.0% of underwritten base rent). Roku has been a tenant at the Coleman Highline Property since 2019. A public company founded in 2002, Roku is a pioneer of streaming television. Its streaming devices are used by consumers in North America, Latin America, and parts of Europe including the UK, Ireland and France. Roku is the number one streaming platform in the U.S by hours streamed and its Roku Channel was watched by an estimated 46 million people in the US as of the third quarter of 2020. The company is divided into two segments: Player, which is the sale of streaming players and audio products, and Platform, which generates revenue from advertising, content distribution and ongoing subscription services. As of December 31, 2019, Roku reported a net loss of $59.9 million and total revenue of $1.1 billion, representing an increase of 52.0% from December 31, 2018, with $515.5 million of cash and cash equivalents. Year-over-year, as of the third quarter of 2020, Roku increased its active accounts from 32.3 million to 46.0 million and its streaming hours by 54%. Additionally, Platform revenue increased by 78% year-over-year and gross profit was up by 81%. In the third quarter of 2020, Roku reported net income from operations of $12.0 million and adjusted EBITDA (net income or loss excluding (i) other income, (ii) stock-based compensation expense, (iii) depreciation and amortization, and (iv) income tax expense) of $56.2 million. Year-to-date through the third quarter of 2020, Roku reported a net loss of $85.0 million and adjusted EBITDA of $36.5 million.
Roku currently leases 100.0% of Building 1 and Building 2, for a total of 357,106 SF (the “Roku Premises”). There is no remaining free rent and all outstanding tenant improvements were reserved at loan closing.
| ● | Roku leases 162,557 SF in Building 1 under a lease expiring on December 31, 2029, with one, 5-year renewal option and no termination options. Building 1 was originally leased to 8x8, Inc. (“Assignor”), however, Assignor never moved in and assigned the lease to Roku. Assignor is required to pay rent through December 31, 2020, with Roku’s rent commencing January 1, 2021 and including 3% annual rent escalations. The two months of rent required to be paid by 8x8, Inc. between loan closing and Roku’s required rent start date was not reserved at loan closing. Some work has been completed on the building, however, the majority of the space is in shell condition, as tenant improvement work was put on hold due to COVID restrictions. The remaining $14.8 million tenant improvement allowance, approximately $91 PSF, was reserved at loan closing and work is expected to resume in 2021. If the tenant improvement allowance is not used by December 15, 2021, the remaining amount will be forfeited by Roku. |
| ● | Roku leases 194,549 SF in Building 2 under a lease expiring on September 30, 2020, with one, 7-year renewal option at 97.5% of fair market value and no termination options. The Building 2 lease has staggered lease commencement dates of January 23, 2019 for floors 1 and 2, April 23, 2019 for floor 3, and September 1, 2019 for floors 4-6, and includes 3% annual rent escalations. The Building 2 lease expires September 30, 2030. In addition to base rent for Building 2, Roku is responsible for a monthly payment in the estimated amount of $19,315 (the “Highline Extension Payment”), which represents the reimbursement of amortized capital expenditures for the construction of the connector between Building 2 and the amenities building. Roku fully moved into the space prior to the COVID outbreak and all free rent has burned off. |
Roku has provided a letter of credit for each lease (collectively, the “Roku LC”), which Roku LCs have been collaterally assigned to the lender. With respect to:
| ● | Building 1, Roku provided an $8.1 million letter of credit, which may be reduced by 50% on the later of (i) January 1, 2022 or (ii) the 37th full calendar month of the lease term, so long as Roku has a market capitalization on a public exchange of at least $2.4 billion and is not in default under the lease. The letter of credit can be further reduced by 25% of the original letter of credit amount on the later of (i) July 1, 2026 or (ii) the 91st full calendar month of the lease term, if Roku has a market capitalization of at least $3.6 billion and is not in default under its lease. |
| ● | Building 2, Roku provided a $6.3 million letter of credit, which may be reduced by 50% on the later of (i) July 23, 2026 or (ii) the 90th full calendar month of the lease term, if Roku is cash flow positive based on a trailing twelve month adjusted EBITDA (net income or loss excluding (i) other income, (ii) stock-based compensation expense, (iii) depreciation and amortization, and (iv) income tax expense) basis as of the most recently completed fiscal quarter. |
The Coleman Highline Borrower may draw on the Roku LC (i) to pay amounts due to the landlord under the terms of the lease, (ii) if the lease has terminated prior to expiration of the lease term, or as a result of Roku’s breach or default under the lease, (iii) Roku has filed a voluntary petition for bankruptcy, (iv) an involuntary petition has been filed against Roku under the bankruptcy code, and (v) if the letter of credit has not been renewed through the expiration date.
If the Coleman Highline Borrower draws on a Roku LC, the proceeds are required to be placed in reserve with the lender, and are required to be disbursed by the lender upon the Coleman Highline Borrower’s request for the payment of:
(i) shortfalls in the payment of debt service;
(ii) shortfalls in the required deposits into the reserve accounts;
(iii) tenant improvement costs, tenant allowances, tenant relocations costs, tenant reimbursements, tenant inducement payments and leasing commission obligations under leases entered into, or existing as of the origination of the loan; or
(iv) vacant space preparation costs and marketing costs with respect to potential leasing of the Coleman Highline Property.
This is not a research report and was not prepared by any Underwriter’s research department. Please see additional important information and qualifications at the end of this Term Sheet.
46
| Office – Suburban | Loan #2 | Cut-off Date Balance: | $85,000,000 | |
| 1143 & 1155 Coleman Avenue | Coleman Highline | Cut-off Date LTV: | 56.5% | |
| San Jose, CA 95110 | UW NCF DSCR: | 3.18x | ||
| UW NOI Debt Yield: | 9.2% |
The following table presents certain information relating to the tenancy at the Coleman Highline Property:
| Tenant Summary | |||||||||
| Tenant Name | Credit Rating (Fitch/Moody’s/S&P) | Tenant SF | Approx. % of SF | Annual UW Rent(1) | % of Total Annual UW Rent | Annual UW Rent PSF(1) | Termination Option (Y/N) | Lease Expiration | Renewal Options |
| Roku-Building 1(2) | NR/NR/NR | 162,557 | 45.5% | $7,450,130 | 44.9% | $45.83 | N | 12/31/2029 | 1, 5-year(4) |
| Roku-Building 2(3) | NR/NR/NR | 194,549 | 54.5% | $9,148,134 | 55.1% | $47.02 | N | 9/30/2030 | 1, 7-year(5) |
| Subtotal/Wtd. Avg. | 357,106 | 100.0% | $16,598,264 | 100.0% | $46.49 | ||||
| Vacant Space | 0 | 0.0% | $0 | 0.0% | $0.00 | ||||
| Total/Wtd. Avg. | 357,106 | 100.0% | $16,598,264 | 100.0% | $46.49 | ||||
| (1) | The Annual UW Rent and Annual UW Rent PSF shown above include 3% annual contractual rent steps through November 1, 2021 totaling $259,700. |
| (2) | Roku has not yet moved in, and has not yet commenced paying rent on its Building 1 space. There is no free rent remaining and all outstanding tenant improvements were reserved at loan closing. Roku is required to begin paying rent January 1, 2021. 8x8, Inc. is required to pay rent until December 31, 2020. See “Major Tenant” for additional information. |
| (3) | Building 2 rent includes the Highline Extension Payment of $231,782 annually. |
| (4) | Roku has one, 5-year renewal option for Building 1 at fair market value and with 12-15 months’ prior notice. |
| (5) | Roku has one, 7-year renewal option for Building 2 at 97.5% of fair market value and with 15-18 months’ prior notice. |
The following table presents certain information relating to the lease rollover schedule at the Coleman Highline Property:
| Lease Rollover Schedule(1) | ||||||||
| Year | # of Leases Rolling | SF Rolling | Annual UW Rent PSF Rolling | Approx. % of Total SF Rolling | Approx. Cumulative % of SF Rolling | Total UW Rent Rolling | Approx. % of Total Rent Rolling | Approx. Cumulative % of Total Rent Rolling |
| MTM | 0 | 0 | $0.00 | 0.0% | 0.0% | $0 | 0.0% | 0.0% |
| 2020 | 0 | 0 | $0.00 | 0.0% | 0.0% | $0 | 0.0% | 0.0% |
| 2021 | 0 | 0 | $0.00 | 0.0% | 0.0% | $0 | 0.0% | 0.0% |
| 2022 | 0 | 0 | $0.00 | 0.0% | 0.0% | $0 | 0.0% | 0.0% |
| 2023 | 0 | 0 | $0.00 | 0.0% | 0.0% | $0 | 0.0% | 0.0% |
| 2024 | 0 | 0 | $0.00 | 0.0% | 0.0% | $0 | 0.0% | 0.0% |
| 2025 | 0 | 0 | $0.00 | 0.0% | 0.0% | $0 | 0.0% | 0.0% |
| 2026 | 0 | 0 | $0.00 | 0.0% | 0.0% | $0 | 0.0% | 0.0% |
| 2027 | 0 | 0 | $0.00 | 0.0% | 0.0% | $0 | 0.0% | 0.0% |
| 2028 | 0 | 0 | $0.00 | 0.0% | 0.0% | $0 | 0.0% | 0.0% |
| 2029 | 1 | 162,557 | $45.83 | 45.5% | 45.5% | $7,450,130 | 44.9% | 44.9% |
| 2030 | 1 | 194,549 | $47.02 | 54.5% | 100.0% | $9,148,134 | 55.1% | 100.0% |
| 2031 & Beyond | 0 | 0 | $0.00 | 0.0% | 100.0% | $0.00 | 0.0% | 100.0% |
| Vacant | 0 | 0 | $0.00 | 0.0% | 100.0% | $0.00 | 0.0% | 100.0% |
| Total/Wtd. Avg. | 2 | 357,106 | $46.48 | 100.0% | $16,598,264 | 100.0% | ||
| (1) | Information is based on the underwritten rent roll. |
COVID-19 Update. Building 2 is open and operating, while Building 1 is still in shell condition. The first debt service payment date for the Coleman Highline Whole Loan is December 6, 2020. As of November 9, 2020, the Coleman Highline Whole Loan is current and is not subject to any forbearance, modification or debt service relief request. The majority of Roku employees are working remotely; however, Roku is current on rent payments as of November 2020 and has not requested any relief. Additionally, 8x8, Inc., is required to pay rent on Building 1 until December 31, 2020, and is current on rent payments as of November 2020.
The Market. The Coleman Highline Property is part of the larger Coleman Highline mixed-use development in San Jose, California, adjacent to the Norman Y. Mineta San Jose International Airport. The Coleman Highline Property is located in an area with a high concentration of technology companies, including Google, Facebook, Amazon and Intel. The Coleman Highline Property is located approximately 0.6 miles from the Santa Clara Caltrain station and is connected to that station via a pedestrian footbridge. In addition, VTS operates buses and light rail with stops along Coleman Avenue, and a BART stop is planned adjacent to the Santa Clara Caltrain station. The Coleman Highline Property is 0.7 miles from Interstate 880 and 2.5 miles from U.S. Highway 101.
In addition to the amenities in the larger Coleman Highline project, the Coleman Highline Property is within walking distance to a retail center that includes multiple dining options and a gym. It is also located adjacent to the 175-room Element Hotel and the proposed Gateway Crossing project which is planned to include 1,565 residential units, 157 affordable housing units, as well as 45,000 SF of retail space and a hotel. In addition, the Coleman Highline property is approximately 0.5 miles from the San Jose Earthquakes stadium, home to Major League Soccer’s San Jose Earthquakes, as well as 0.8 miles from Santa Clara University, a private Jesuit university with approximately 5,400 undergraduate students.
This is not a research report and was not prepared by any Underwriter’s research department. Please see additional important information and qualifications at the end of this Term Sheet.
47
| Office – Suburban | Loan #2 | Cut-off Date Balance: | $85,000,000 | |
| 1143 & 1155 Coleman Avenue | Coleman Highline | Cut-off Date LTV: | 56.5% | |
| San Jose, CA 95110 | UW NCF DSCR: | 3.18x | ||
| UW NOI Debt Yield: | 9.2% |
According to a third party market research provider, the estimated 2020 population within a one-, three- and five-mile radius of the Coleman Highline Property was approximately 10,205, 176,399 and 642,978, respectively; and the estimated 2020 average household income within the same radii was approximately $130,114, $135,262 and $140,271, respectively.
According to the appraisal, the subject is located in the San Jose Airport office submarket. As of the second quarter of 2020, the submarket contained approximately 5.5 million SF of office space, with an overall vacancy rate of 8.3% and average asking rent of $44.76 PSF. The appraiser concluded to market rent for the office space at the Coleman Highline Property of $46.20 PSF (see table below).
The following table presents certain information relating to the appraisal’s market rent conclusion for the Coleman Highline Property:
| Market Leasing Assumptions | |
| Office | |
| Market Rent (PSF) | $46.20 |
| Lease Term (Years) | 10.5 |
| Concessions | 6 months |
| Lease Type (Reimbursements) | NNN |
| Rent Increase Projection | 3.0% per annum |
| Source: Appraisal. | ||
The following table presents information relating to comparable office property sales for the Coleman Highline Property:
| Comparable Property Sale Summary | ||||||||
| Property Name/Location | Sale Date | Year Built/ Renovated | Total NRA (SF) | Occupancy | Sale Price | Adjusted Sale Price(1) | Sale Price PSF | Appraiser’s Adjusted Sale Price |
Coleman Highline (subject) 1143 & 1155 Coleman Avenue San Jose, CA | Oct. 2020 | 2017 | 357,106(2) | 100%(2) | $275,000,000 | N/A | $770 | N/A |
Creekside@17 675 Creekside Way Campbell, CA | Mar. 2020 | 2018 | 177,815 | 100% | $139,000,000 | $146,277,732 | $782 | $823 |
2215-2225 Lawson Lane Santa Clara, CA | Feb. 2020 | 2014 | 328,867 | 100% | $276,300,000 | $267,003,829 | $840 | $812 |
Cupertino City Center I & II 20300 Stevens Creek Boulevard Cupertino, CA | Aug. 2019 | 1985/2009 | 300,041 | 100% | $290,000,000 | $250,429,221 | $967 | $835 |
HQ@First Campus 110, 120&130 Holger Way & 95 Headquarters San Jose, CA | Mar. 2019 | 2010 | 603,999 | 100% | $429,000,000 | $486,056,115 | $710 | $805 |
131 Albright Way Los Gatos, CA | Jan. 2019 | 2015 | 113,500 | 100% | $85,000,000 | $87,550,495 | $749 | $771 |
Source: Appraisal.
| (1) | Adjusted Sale Price was adjusted for location, size, age/condition, features/amenities and economic characteristics (as applicable). |
| (2) | Information sourced from the underwritten rent roll. |
This is not a research report and was not prepared by any Underwriter’s research department. Please see additional important information and qualifications at the end of this Term Sheet.
48
| Office – Suburban | Loan #2 | Cut-off Date Balance: | $85,000,000 | |
| 1143 & 1155 Coleman Avenue | Coleman Highline | Cut-off Date LTV: | 56.5% | |
| San Jose, CA 95110 | UW NCF DSCR: | 3.18x | ||
| UW NOI Debt Yield: | 9.2% |
The following table presents certain information relating to comparable office leases for the Coleman Highline Property:
| Comparable Leases Summary | |||||||||
| Property Name/Location | Year Built/ Renovated | Total GLA (SF) | Occupancy(1) | Distance from Subject | Tenant Name | Lease Date/Term | Lease Area (SF) | Annual Base Rent PSF | Lease Type |
Coleman Highline Building 1 (Subject) 1143 & 1155 Coleman Avenue San Jose, CA | 2017(2) | 162,557(2) | 100%(2) | N/A(2) | Roku(2) | Jan. 2021 / 9.0 Yrs(2) | 162,557(2) | $45.83(2) | NNN |
Coleman Highline Building 2 (Subject) 1143 & 1155 Coleman Avenue San Jose, CA | 2017(2) | 194,549(2) | 100%(2) | N/A(2) | Roku(2) | Sep. 2019 11.1 Yrs(2)(3) | 194,549(2) | $47.02(2)(3) | NNN |
2390 Mission College Blvd Santa Clara, CA | 2018 | 42,188 | 100.0% | 4.2 Miles | InfoBlox, Inc. | May 2020 / 10.5 Yrs | 42,188 | $42.00 | NNN |
4301-4401 Great American Pky. Santa Clara, CA | 1984 | 301,163 | 100.0% | 4.8 Miles | Airbnb | Dec. 2019 / 11 Yrs | 301,163 | $45.00 | NNN |
6220 America Ctr Drive San Jose, CA | 2017 | 232,253 | 97.5%(1) | 6.1 Miles | Bill.com | Dec. 2019 / 10 Yrs | 137,613 | $45.00 | NNN |
Coleman Highline Ph 4 San Jose, CA | 2021 | 643,990 | 100.0% | 0.0 Miles | Verizon | Jul. 2019 / 15 Yrs | 643,990 | $49.20 | NNN |
675 Creekside Way Campbell, CA | 2017 | 177,815 | 100.0% | 5.7 Miles | 8x8, Inc. | Jul. 2019 / 11 Yrs | 177,815 | $44.40 | NNN |
3315 Scott Blvd Santa Clara, CA | 2013 | 157,205 | 100.0%(1) | 4.4 Miles | Edelman Financial | Jul. 2019 / 6.1 Yrs | 41,252 | $46.20 | NNN |
Source: Appraisal.
| (1) | Information obtained from a third party market research provider. |
| (2) | Information obtained from the underwritten rent roll. |
| (3) | Building 2 has staggered lease start dates of January 23, 2019 for floors 1 and 2, April 23, 2019 for floor 3, and September 1, 2019 for floors 4-6. The Annual Base Rent PSF includes the annual Highline Extension Payment of $231,782. |
This is not a research report and was not prepared by any Underwriter’s research department. Please see additional important information and qualifications at the end of this Term Sheet.
49
| Office – Suburban | Loan #2 | Cut-off Date Balance: | $85,000,000 | |
| 1143 & 1155 Coleman Avenue | Coleman Highline | Cut-off Date LTV: | 56.5% | |
| San Jose, CA 95110 | UW NCF DSCR: | 3.18x | ||
| UW NOI Debt Yield: | 9.2% |
Underwritten Net Cash Flow. The following table presents certain information relating to the Underwritten Net Cash Flow at the Coleman Highline Property:
| Cash Flow Analysis(1) | ||
| UW | UW PSF | |
| Gross Potential Base Rent(2) | $16,598,264 | $46.48 |
| Contractual Rent Steps | $0.00 | $0.00 |
| Rent Average Benefit | $0.00 | $0.00 |
| Grossed Up Vacant Space | $0.00 | $0.00 |
| Total Recoveries(3) | $5,974,389 | $16.73 |
| Parking Income | $0.00 | $.00 |
| Other Income | $0.00 | $0.00 |
| Less Vacancy & Credit Loss(4) | ($829,913) | ($2.32) |
| Effective Gross Income | $21,742,740 | $60.89 |
| Real Estate Taxes | $3,257,146 | $9.12 |
| Insurance | $468,892 | $1.31 |
| Other Operating Expenses | $2,508,808 | $7.03 |
| Total Expenses | $6,234,846 | $17.46 |
| Net Operating Income | $15,507,894 | $43.43 |
| Capital Expenditures | $0.00 | $0.00 |
| TI/LC | $0.00 | $0.00 |
| Net Cash Flow | $15,507,894 | $43.43 |
| Occupancy %(4) | 95.0% | |
| NOI DSCR(5) | 3.18x | |
| NCF DSCR(5) | 3.18x | |
| NOI Debt Yield(5) | 9.2% | |
| NCF Debt Yield(5) | 9.2% | |
| (1) | No historical operating or occupancy statements are available because the Coleman Highline Property was completed in 2017 and was acquired in connection with the origination of the Coleman Highline Whole Loan. For avoidance of doubt, no COVID-19 specific adjustments have been incorporated in the lender underwriting. |
| (2) | Gross Potential Base Rent is based on leases in-place with 3% annual rent escalations through November 1, 2021. It also includes the annual Highline Extension Payment of $231,782. |
| (3) | Total Recoveries are based on underwritten expenses net of vacancy. |
| (4) | The underwritten economic vacancy is 5.0%. The Coleman Highline Property was 100.0% leased as November 1, 2020. |
| (5) | The debt service coverage ratios and debt yields are based on the Coleman Highline Whole Loan. |
Escrows and Reserves.
Real Estate Taxes – During a Cash Sweep Period (as defined below), the Coleman Highline Whole Loan documents require ongoing monthly real estate tax reserve deposits in an amount equal to one-twelfth of the real estate taxes that the lender estimates will be payable during the next 12 months.
Insurance – During a Cash Sweep Period, the Coleman Highline Whole Loan documents require ongoing monthly insurance reserve deposits in an amount equal to one-twelfth of the insurance premiums that the lender estimates will be payable for the renewal of the required coverages during the next 12 months; provided that so long as no event of default is continuing, to the extent insurance is maintained by the Coleman Highline Borrower under one or more blanket policies reasonably acceptable to the lender, the Coleman Highline Borrower is not required to make ongoing monthly insurance reserve deposits.
Unfunded Obligations Reserve – The Coleman Highline Whole Loan documents require an upfront deposit of $14,814,604 for unfunded tenant improvement allowances, free rent and leasing commissions related to the Roku lease. Any unused portion of the reserve, as of December 15, 2021, is deemed forfeited by Roku pursuant to the Building 1 lease. Provided there is no event of default, any remaining funds in the Unfunded Obligations Reserve thereafter will be released to the Coleman Highline Borrower on the earlier of (i) payment of the Coleman Highline Whole Loan in full, or (ii) subject to the cash management requirements, delivery of evidence reasonably acceptable to the lender that the Unfunded Obligations associated with the Roku lease have been fully satisfied.
Debt Service Reserve – The Coleman Highline Whole Loan documents require an upfront deposit of $4,875,587, which is equal to twelve months of debt service. On each payment date, the lender will apply reserve funds in an amount equal to the difference between the debt service payable and the payment received from the Coleman Highline Borrower. The Debt Service Reserve will be released if, after October 30, 2021, the following conditions have been satisfied: (a) no Cash Sweep Period is continuing; (b) either (i) Roku or (ii) a tenant under a replacement lease for the Roku space has made all rental payments due under the Roku lease or replacement lease for the preceding three months; (c) the debt service coverage ratio equals or exceeds (i) if the
This is not a research report and was not prepared by any Underwriter’s research department. Please see additional important information and qualifications at the end of this Term Sheet.
50
| Office – Suburban | Loan #2 | Cut-off Date Balance: | $85,000,000 | |
| 1143 & 1155 Coleman Avenue | Coleman Highline | Cut-off Date LTV: | 56.5% | |
| San Jose, CA 95110 | UW NCF DSCR: | 3.18x | ||
| UW NOI Debt Yield: | 9.2% |
Roku lease is in place, 3.40x or (ii) if a replacement lease is in place, 2.00x; and (d) no portion of the Debt Service Reserve funds have been allocated to debt service payments in the preceding eleven months.
Lockbox and Cash Management. The Coleman Highline Whole Loan is structured with an in-place hard lockbox and springing cash management. The Coleman Highline Borrower is required to direct tenants to pay rent directly into such lockbox account and all rents received directly by the Coleman Highline Borrower or the property manager are required to be deposited into the lockbox account within one business day of receipt. So long as no Cash Sweep Period is in effect, all funds in the lockbox account are required to be distributed to the Coleman Highline Borrower. Prior to the ARD, during a Cash Sweep Period, all funds in the lockbox account are required to be swept on each business day to a lender-controlled cash management account. Any excess cash flow remaining after satisfaction of the waterfall items outlined in the loan documents is required to be swept to an excess cash flow subaccount controlled by the lender as additional security for the Coleman Highline Whole Loan to be held during the continuance of the Cash Sweep Period, subject to the Roku Trigger Cap (as defined below). After the occurrence of the ARD, all excess cash flow, after payment of debt service on the Coleman Highline Whole Loan, required deposits to escrows and reserves and budgeted operating expenses, is required to be used first, to pay down the principal balance of the Coleman Highline Whole Loan, and thereafter to pay the accrued interest.
In lieu of the Coleman Highline Borrower depositing any excess cash flow into the lender-controlled excess cash flow subaccount, so long as no event of default is continuing and the ARD has not occurred, the Coleman Highline Borrower has the right to cause the Guarantor to deliver to the lender an excess cash flow guaranty with a guaranteed liability amount equal to (x) the aggregate amount of excess cash flow disbursed to the Coleman Highline Borrower in lieu of being deposited into the excess cash flow subaccount less (y) the aggregate amount of excess cash flow the Coleman Highline Borrower actually spends for items permitted under the Coleman Highline Whole Loan documents, which include (a) required deposits for tax and insurance, (b) any fees due to the cash management bank, (c) budgeted operating expenses, and (d) monthly debt service payments; provided that among other requirements outlined in the Coleman Highline Whole Loan documents, (i) such excess cash flow guaranty is accompanied by a legal opinion concerning the validity, authority, execution and enforceability of such guaranty that may be relied upon by the lender and the rating agencies and (ii) to the extent that the amounts guaranteed under the excess cash flow guaranty equal or exceed 15% of the outstanding principal balance of the Coleman Highline Whole Loan, such guaranty is accompanied by an additional insolvency opinion reasonably acceptable to the lender and the rating agencies.
A “Cash Sweep Period” will commence upon the earlier of the following:
| (i) | the occurrence of an event of default under the Coleman Highline Whole Loan documents; |
| (ii) | A “Roku Trigger Event” (as defined below); |
| (iii) | the Coleman Highline Borrower filing, as a debtor, a bankruptcy or similar insolvency proceeding, or otherwise becoming involved, as a debtor, in a bankruptcy or any similar insolvency proceeding (collectively, a “Bankruptcy Action”); |
| (iv) | the net operating income debt service coverage ratio (“NOI DSCR”) falling below 1.20x, based on scheduled interest payments due, for two consecutive calendar quarters; |
| (v) | the date upon which the lender has disbursed funds from the Debt Service Reserve to be applied to the payment of debt service; or |
| (vi) | the ARD. |
A Cash Sweep Period will end upon the occurrence of the following (with regard to clause (vi), no cure is permitted):
| ● | with regard to clause (i), the cure of such event of default; |
| ● | with regard to clause (ii), a “Roku Trigger Event Cure” (as defined below) has taken place; |
| ● | with regard to clause (iii), in the case of an involuntary Bankruptcy Action not consented to by the Coleman Highline Borrower, such Bankruptcy Action is discharged, stayed or dismissed within 90 days of its filing; |
| ● | with regard to clause (iv), the NOI DSCR being equal to or greater than 1.20x for two consecutive calendar quarters or the Coleman Highline Borrower prepaying the Coleman Highline Whole Loan, together with any applicable yield maintenance premiums, in an amount sufficient to cause the NOI DSCR to be equal to or greater than 1.20x; or |
| ● | with regard to clause (v), the Coleman Highline Borrower depositing with the lender into the Debt Service Reserve an amount equal to all amounts disbursed or released from the Debt Service Reserve and applied to the payment of debt service. |
A “Roku Trigger Event” will commence upon the earlier of the following:
| (i) | Roku failing to extend or renew (a) the Building 1 lease 12 months prior to its expiration or (b) the Building 2 lease 15 months prior to its expiration; |
| (ii) | a Bankruptcy Action with respect to Roku; or |
| (iii) | Roku discontinuing, or giving notice of its intent to discontinue, its business (“goes dark”) in more than 50% of its space with the following exceptions: |
(a) the discontinuation is caused by governmental restrictions on the use or occupancy of the Coleman Highline Property in connection with the COVID-19 pandemic (“SIP Order”) or any other pandemic, and Roku resumes operations within 90 days after the restrictions are lifted or, if such discontinuation occurs prior to October 31, 2022, in connection with Roku’s commercially reasonable safety protocols relating to COVID-19, then Roku resumes operations no later than October 31, 2022;
(b) the discontinuation is related to upgrades or renovations that last no longer than 180 days;
(c) the discontinuation is in connection with the ongoing restoration of the Coleman Highline Property following a casualty and lasts no longer than 12 months;
(d) any discontinuation provided that Roku has, and maintains, an investment grade rating; and
(e) no go-dark trigger will have occurred with respect to Roku not yet operating in Building 1, so long as initial buildout has been completed and occupancy has commenced before the earlier of (i) October 31, 2022 and (ii) one year after the termination of the SIP Order.
This is not a research report and was not prepared by any Underwriter’s research department. Please see additional important information and qualifications at the end of this Term Sheet.
51
| Office – Suburban | Loan #2 | Cut-off Date Balance: | $85,000,000 | |
| 1143 & 1155 Coleman Avenue | Coleman Highline | Cut-off Date LTV: | 56.5% | |
| San Jose, CA 95110 | UW NCF DSCR: | 3.18x | ||
| UW NOI Debt Yield: | 9.2% |
Provided no event of default exists and the ARD has not yet occurred, a cash flow sweep tied to a Roku Trigger Event will be capped at the following applicable amounts; (i) during a Roku Trigger Event, other than a go-dark event pursuant to clause (iii) above, $60 PSF for the Roku Premises and (ii) during a Roku Trigger Event caused solely by a go-dark event, (x) $60 PSF of the premises subject to such event, if occurring prior to October 30, 2026, and (y) $60 PSF of the total Roku Premises if such event occurs after October 30, 2026 (the “Roku Trigger Cap”).
A “Roku Trigger Event Cure” will occur upon the following:
| ● | with regard to clause (i), Roku has renewed or extended the lease in accordance with the terms of the Roku lease or the Coleman Highline Borrower has entered into a replacement lease, subject to lender approval, for the Roku Premises that results in an NOI DSCR equal to or greater than 1.20x; |
| ● | with regard to clause (ii), Roku is no longer subject to a Bankruptcy Action and Roku has affirmed the lease pursuant to a final, non-appealable order of court in a competent jurisdiction or the Coleman Highline Borrower has entered into a replacement lease for the Roku Premises that results in an NOI DSCR equal to or greater than 1.20x; and |
| ● | with regard to clause (iii), either (a) Roku resumes its business operations in greater than 50% of its space and continuously operates for at least 30 days or (b) the Coleman Highline Borrower has entered into a replacement lease for the Roku Premises that results in an NOI DSCR equal to or greater than 1.20x. |
Additional Secured Indebtedness (not including trade debts). The Coleman Highline Property also secures the Coleman Highline Serviced Pari Passu Companion Loans, which have an aggregate Cut-off Date principal balance of $82,700,000. The Coleman Highline Serviced Pari Passu Companion Loans accrue interest at the same rate as the Coleman Highline Mortgage Loan. The Coleman Highline Mortgage Loan is entitled to payments of principal and interest on a pro rata and pari passu basis with the Coleman Highline Serviced Pari Passu Companion Loans. The holders of the Coleman Highline Mortgage Loan and Coleman Highline Serviced Pari Passu Companion Loans have entered into a co-lender agreement that sets forth the allocation of collections on the Coleman Highline Whole Loan. See “Description of the Mortgage Pool—The Whole Loans—The Serviced Pari Passu Whole Loans”.
Mezzanine Loan and Preferred Equity. Not permitted.
Release of Property. The Coleman Highline Whole Loan documents provide that the Coleman Highline Borrower may release either Building 1 or Building 2, provided that the following conditions have been satisfied:
| (i) | no event of default is continuing; |
| (ii) | payment of the lesser of (a) the outstanding principal amount of the Coleman Highline Whole Loan or (b) 110% of the allocated loan amount ($75,272,141 for Building 1, and $92,427,859 for Building 2), together with any applicable yield maintenance premiums and costs associated with the release; |
| (iii) | the net operating income debt service coverage ratio on the remaining collateral is greater than or equal to 3.40x; |
| (iv) | the lender has received reasonably satisfactory evidence that, following the release, the Coleman Highline Property complies with all applicable zoning laws, land use, parking requirements, major leases, and permitted encumbrances as defined in the Coleman Highline Whole Loan documents; and |
| (v) | the lender’s reasonable satisfaction that the release will satisfy REMIC requirements. |
Letter of Credit. None.
Ground Lease. None.
Right of First Offer/Right of First Refusal. None.
Terrorism Insurance. The Coleman Highline Whole Loan documents require that the “all risk” insurance policy required to be maintained by the Coleman Highline Borrower provide coverage for terrorism in an amount equal to the full replacement cost of the Coleman Highline Property, as well as business interruption insurance covering no less than the 24-month period following the occurrence of a casualty event, together with a 12-month extended period of indemnity (provided that if TRIPRA or a similar statute is not in effect, the Coleman Highline Borrower will not be obligated to pay terrorism insurance premiums in excess of two times the premium for the casualty and business interruption coverage on a stand-alone basis).
This is not a research report and was not prepared by any Underwriter’s research department. Please see additional important information and qualifications at the end of this Term Sheet.
52
(THIS PAGE INTENTIONALLY LEFT BLANK)
This is not a research report and was not prepared by any Underwriter’s research department. Please see additional important information and qualifications at the end of this Term Sheet.
53
| Office - CBD | Loan #3 | Cut-off Date Balance: | $80,000,000 | |
| 120 Wall Street | 120 Wall Street | Cut-off Date LTV: | 57.9% | |
| New York, NY 10005 | UW NCF DSCR: | 2.74x | ||
| UW NOI Debt Yield: | 9.3% |
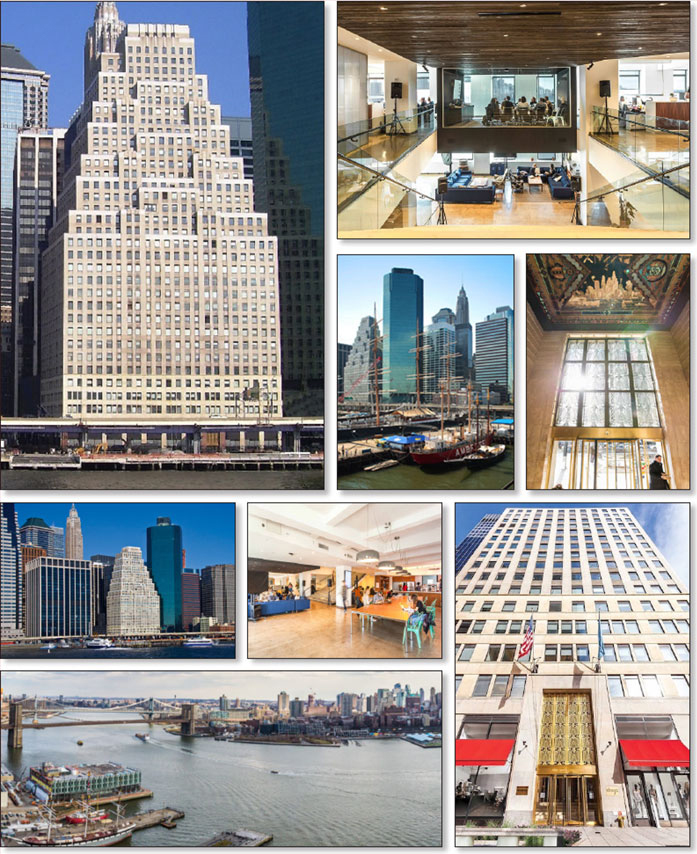
This is not a research report and was not prepared by any Underwriter’s research department. Please see additional important information and qualifications at the end of this Term Sheet.
54
| Office - CBD | Loan #3 | Cut-off Date Balance: | $80,000,000 | |
| 120 Wall Street | 120 Wall Street | Cut-off Date LTV: | 57.9% | |
| New York, NY 10005 | UW NCF DSCR: | 2.74x | ||
| UW NOI Debt Yield: | 9.3% |
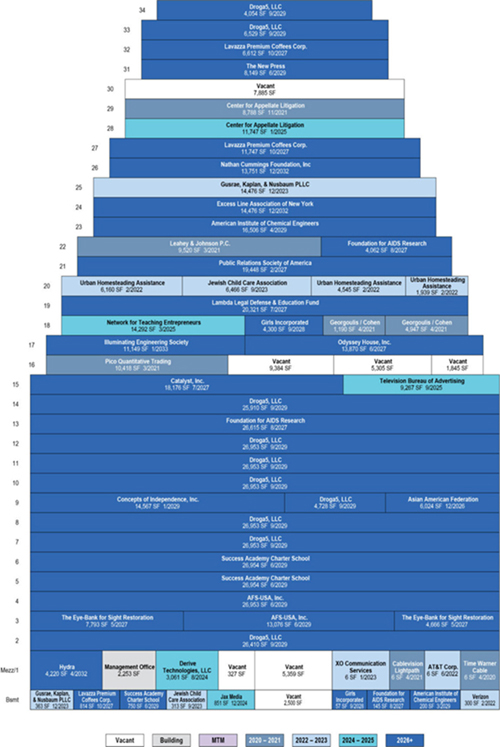
This is not a research report and was not prepared by any Underwriter’s research department. Please see additional important information and qualifications at the end of this Term Sheet.
55
| Office - CBD | Loan #3 | Cut-off Date Balance: | $80,000,000 | |
| 120 Wall Street | 120 Wall Street | Cut-off Date LTV: | 57.9% | |
| New York, NY 10005 | UW NCF DSCR: | 2.74x | ||
| UW NOI Debt Yield: | 9.3% |
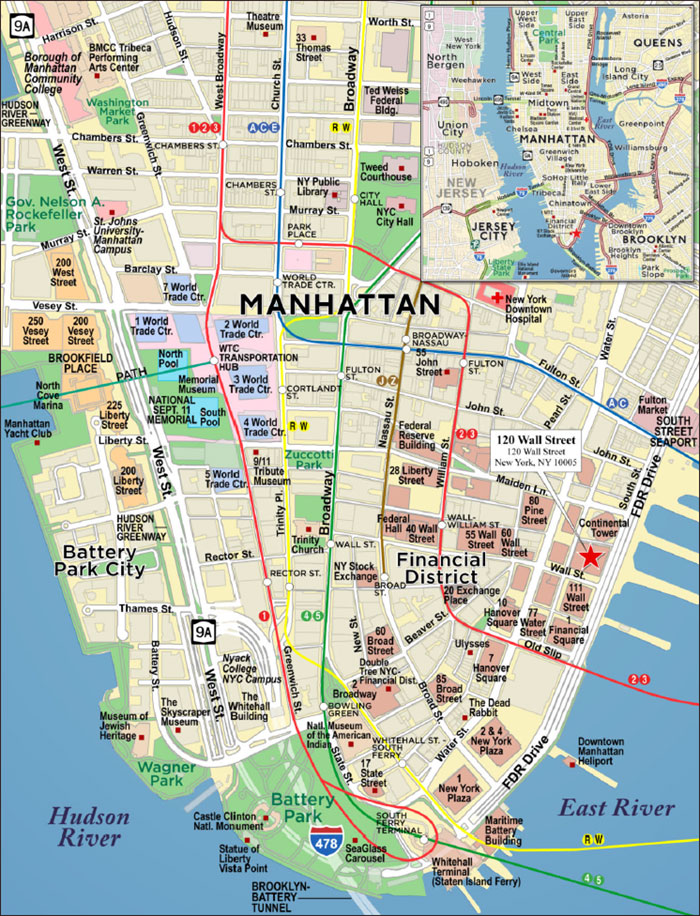
This is not a research report and was not prepared by any Underwriter’s research department. Please see additional important information and qualifications at the end of this Term Sheet.
56
| Mortgage Loan No. 3 – 120 Wall Street |
| Mortgage Loan Information | Mortgaged Property Information | ||||||
| Mortgage Loan Seller: | WFB | Single Asset/Portfolio: | Single Asset | ||||
| Credit Assessment (DBRSM/Fitch/Moody’s): | NR/NR/NR | Location: | New York, NY 10005 | ||||
| Original Balance(1): | $80,000,000 | General Property Type: | Office | ||||
| Cut-off Date Balance(1): | $80,000,000 | Detailed Property Type: | CBD | ||||
| % of Initial Pool Balance: | 9.2% | Title Vesting: | Fee | ||||
| Loan Purpose: | Refinance | Year Built/Renovated: | 1929/2013 | ||||
| Borrower Sponsor: | Silverstein Holdco I LLC | Size: | 668,276 SF | ||||
| Guarantor: | Silverstein Holdco I LLC | Cut-off Date Balance per SF(1): | $247 | ||||
| Mortgage Rate: | 3.2010% | Maturity Date Balance per SF(1): | $247 | ||||
| Note Date: | 10/1/2020 | Property Manager: | Silverstein Properties, LLC | ||||
| First Payment Date: | 11/11/2020 | (borrower-related) | |||||
| Maturity Date: | 10/11/2030 | ||||||
| Original Term to Maturity: | 120 months | ||||||
| Original Amortization Term: | 0 months | Underwriting and Financial Information(6) | |||||
| IO Period: | 120 months | UW NOI(7): | $15,424,845 | ||||
| Seasoning: | 1 month | UW NOI Debt Yield(1): | 9.3% | ||||
| Prepayment Provisions(2): | YM (25); DEF/YM (91); O (4) | UW NOI Debt Yield at Maturity(1): | 9.3% | ||||
| Lockbox/Cash Mgmt Status: | Hard/Springing | UW NCF DSCR(1): | 2.74x | ||||
| Additional Debt Type(1)(3): | Pari Passu | Most Recent NOI(7): | $13,190,289 (7/31/2020 TTM) | ||||
| Additional Debt Balance(1)(3): | $85,000,000 | 2nd Most Recent NOI(7): | $12,952,334 (12/31/2019) | ||||
| Future Debt Permitted (Type)(4): | Yes (Mezzanine) | 3rd Most Recent NOI(7): | $10,046,537 (12/31/2018) | ||||
| Reserves(5) | Most Recent Occupancy: | 95.1% (8/31/2020) | |||||
| Type | Initial | Monthly | Cap | 2nd Most Recent Occupancy: | 92.0% (12/31/2019) | ||
| RE Taxes | $1,306,557 | $326,640 | NAP | 3rd Most Recent Occupancy: | 95.0% (12/31/2018) | ||
| Insurance | $0 | Springing | NAP | Appraised Value (as of): | $285,000,000 (8/25/2020) | ||
| Recurring Replacements | $0 | Springing | NAP | Appraised Value per SF: | $426 | ||
| TI/LC | $3,472,525 | $111,379 | $4,009,656 | Cut-off Date LTV Ratio(1): | 57.9% | ||
| Rent Concession Reserve | $1,759,579 | $0 | NAP | Maturity Date LTV Ratio(1): | 57.9% | ||
| Sources and Uses | ||||||
| Sources | Proceeds | % of Total | Uses | Proceeds | % of Total | |
| Whole Loan Amount: | $165,000,000 | 100.0% | Loan Payoff(8): | $135,478,875 | 82.1% | |
| Upfront Reserves: | $6,538,661 | 4.0% | ||||
| Closing Costs: | $2,147,099 | 1.3% | ||||
| Return of Equity: | $20,835,365 | 12.6% | ||||
| Total Sources: | $165,000,000 | 100.0% | Total Uses: | $165,000,000 | 100.0% | |
| (1) | The 120 Wall Street Mortgage Loan (as defined below) is part of the 120 Wall Street Whole Loan (as defined below), which is comprised of seven pari passu promissory notes with an aggregate original principal balance of $165,000,000. The Cut-off Date Balance per SF, Maturity Date Balance per SF, UW NOI Debt Yield, UW NOI Debt Yield at Maturity, UW NCF DSCR, Cut-off Date LTV Ratio and Maturity Date LTV Ratio numbers presented above are based on 120 Wall Street Whole Loan. |
| (2) | At any time after the earlier of (i) November 11, 2023 and (ii) two years from the closing date of the securitization that includes the last pari passu note of the 120 Wall Street Whole Loan to be securitized, the 120 Wall Street Borrower (as defined below) has the right to defease the 120 Wall Street Whole Loan in whole, but not in part. The assumed lockout period of 25 payments is based on the closing date of this transaction in November 2020. Additionally, the 120 Wall Street Borrower may prepay the 120 Wall Street Whole Loan at any time during the term of the 120 Wall Street Whole Loan with a 15-day prior notice and, if such prepayment occurs before July 11, 2030, payment of the yield maintenance premium. |
| (3) | See “The Mortgage Loan” and “Additional Secured Indebtedness (not including trade debts)” below for further discussion of additional debt. |
| (4) | See “Mezzanine Loan and Preferred Equity” below for further discussion of future permitted mezzanine debt. |
| (5) | See “Escrows and Reserves” below for further discussion of reserve requirements. |
| (6) | The novel coronavirus pandemic is an evolving situation and could impact the 120 Wall Street Whole Loan more severely than assumed in the underwriting of the 120 Wall Street Whole Loan and could adversely affect the NOI, NCF and occupancy information, as well as the appraised value and the DSCR, LTV and Debt Yield metrics presented above and herein. See “Risk Factors-—Risks Related to Market Conditions and Other External Factors—The Coronavirus Pandemic Has Adversely Affected the Global Economy and Will Likely Adversely Affect the Performance of the Mortgage Loans” in the Preliminary Prospectus. |
| (7) | See “Operating History and Underwritten Net Cash Flow” below for further discussion of the increases from Most Recent NOI to UW NOI and from 3rd Most Recent NOI to 2nd Most Recent NOI. |
| (8) | Loan Payoff funds were used to pay off a loan securitized in the MSBAM 2014-C14 securitization trust. |
The Mortgage Loan. The third largest mortgage loan (the “120 Wall Street Mortgage Loan”) is part of a whole loan (the “120 Wall Street Whole Loan”) that is evidenced by seven pari passu promissory notes in the aggregate original principal amount of $165,000,000. The 120 Wall Street Whole Loan is secured by the ESD’s (as defined below) fee simple interest and the borrower’s leasehold interest in a 668,276 SF, Class B, central business district office building located in New York, New York (the “120 Wall Street Property”). The 120 Wall Street Mortgage Loan is evidenced by the controlling promissory Note A-1 in the original principal amount of $70,000,000 and the non-controlling promissory Note A-2 in the original principal amount of $10,000,000. The non-controlling promissory Notes A-4, A-5, A-6 and A-7 (together with the non-controlling promissory Note A-3, collectively the “120 Wall Street Serviced Pari Passu Companion Loans”) have been contributed to the Benchmark 2020-B20 securitization trust. The non-controlling promissory Note A-3 is currently held by Wells Fargo Bank, N.A. and is expected to be contributed to one or more future securitization trusts. The 120 Wall Street Whole Loan will be serviced pursuant to the pooling and servicing agreement for the BANK 2020-BNK29 securitization trust. See “Description of the Mortgage Pool—
This is not a research report and was not prepared by any Underwriter’s research department. Please see additional important information and qualifications at the end of this Term Sheet.
57
| Office - CBD | Loan #3 | Cut-off Date Balance: | $80,000,000 | |
| 120 Wall Street | 120 Wall Street | Cut-off Date LTV: | 57.9% | |
| New York, NY 10005 | UW NCF DSCR: | 2.74x | ||
| UW NOI Debt Yield: | 9.3% |
The Whole Loans—The Serviced Pari Passu Whole Loans” and “Pooling and Servicing Agreement” in the Preliminary Prospectus. The proceeds of the 120 Wall Street Whole Loan were used to pay off existing debt, pay closing costs, fund reserves and return equity to the sponsor.
| 120 Wall Street Whole Loan Summary | ||||
| Note | Original Balance | Cut-off Date Balance | Note Holder | Controlling Piece |
| A-1 | $70,000,000 | $70,000,000 | BANK 2020-BNK29 | Yes |
| A-2 | $10,000,000 | $10,000,000 | BANK 2020-BNK29 | No |
| A-3 | $15,000,000 | $15,000,000 | Wells Fargo Bank, N.A. | No |
| A-4 | $17,500,000 | $17,500,000 | Benchmark 2020-B20 | No |
| A-5 | $17,500,000 | $17,500,000 | Benchmark 2020-B20 | No |
| A-6 | $25,000,000 | $25,000,000 | Benchmark 2020-B20 | No |
| A-7 | $10,000,000 | $10,000,000 | Benchmark 2020-B20 | No |
| Total | $165,000,000 | $165,000,000 | ||
The Borrower and the Sponsors. The borrower is 120 Wall Property Owner, LLC, a Delaware limited liability company and single purpose entity with two independent directors (the “120 Wall Street Borrower”). Legal counsel to the borrower delivered a non-consolidation opinion in connection with the origination of the 120 Wall Street Whole Loan. The borrower sponsor and non-recourse carveout guarantor is Silverstein Holdco I LLC.
Silverstein Properties (“Silverstein”) is a privately held, full-service real estate development, investment and management firm based in New York. Founded in 1957, Silverstein has developed, owned and managed more than 40 million SF of office, residential, hotel, retail and mixed-use properties. Silverstein Properties is widely recognized for its role in rebuilding the World Trade Center following September 11, 2001. Silverstein Properties’ commercial and residential portfolio includes over 12 million SF of office and residential properties in Midtown and Lower Manhattan.
The Property. The 120 Wall Street Property is a 35-story, 668,276 SF, Class B, LEED Gold certified office building located in the Financial District of Manhattan in New York City. The 120 Wall Street Property was constructed in 1929 and most recently renovated in 2013. The borrower sponsor purchased the 120 Wall Street Property in 1980 and has invested significant capital to reposition and modernize the building. In 2005, the borrower sponsor restored the façade of the building, entrance and distinctive art deco lobby. Since 2012, the borrower sponsor has invested $11.0 million in capital improvements ($16.47 PSF) including a $4.5 million lobby renovation that includes the expansion and widening of the lobby footprint, new revolving doors, installing turnstiles, new flooring, new lighting, new security desks and restoration of interior lobby walls, as well as an approximately $3.4 million elevator modernization. The 120 Wall Street Property is designated a historic landmark by the New York City Landmark’s Preservation Commission. Amenities at the 120 Wall Street Property include unobstructed views across the East River, private terraces and 24-hour security. As of August 31, 2020, the 120 Wall Street Property was 95.1% occupied by 35 distinct tenants including 28 office tenants, five telecom tenants and two retail tenants.
The borrower sponsor has owned the 120 Wall Street Property since 1980 and, in 1992, facilitated its designation as New York City’s first association center property, which designation allows not-for-profit (“NFP”) tenants to receive financial incentives for leasing space at the designated property. On September 12, 2012, the 120 Wall Street Property entered into a real estate tax program with the New York State Urban Development Corporation d/b/a Empire State Development (“ESD”), pursuant to which the building was deeded to the ESD and leased back by the 120 Wall Street Borrower. Under the agreement, the 120 Wall Street Borrower is required to make annual payments in lieu of real estate taxes (“PILOT”), and no ground rent is collected. The PILOT amount is reduced (a) proportionately to the extent that NFP tenants lease space at the 120 Wall Street Property (such proportionate reduction, the “NFP Benefit”) and (b) for certain other tax benefits for which the 120 Wall Street Property would otherwise be eligible if the 120 Wall Street Property was owned by the 120 Wall Street Borrower. A proportionate amount of the NFP Benefit is then required to be passed back to each NFP tenant in the form of a rent credit. The ground lease expires on December 31, 2032, at which time the 120 Wall Street Borrower has the right to obtain the fee ownership, upon repurchasing the fee interest for $1. Under the program, any NFP tenant that executes a new lease or renews a current lease is eligible to participate in the program. Currently, 12 NFP tenants representing approximately 32.9% of NRA participate in the program, resulting in an expected tax savings of approximately $1.6 million in 2020. The 120 Wall Street Property is the only office building in Manhattan to offer this incentive for NFP tenants. The average NFP benefit is approximately $6.17 PSF. See “Risk Factors—Risks Relating to the Mortgage Loans—Real Estate and Other Tax Considerations” in the Preliminary Prospectus.
Major Tenants.
Droga5, LLC (202,396 SF; 30.3% of NRA; 32.6% of underwritten base rent). Founded in 2006, Droga5, LLC (“Droga5”), is an international creative and strategic advertising agency. Droga5 was acquired by Accenture plc (NYSE: ACN) in May 2019. Droga5 has worked on advertising campaigns for some of the largest organizations in the world including Coca-Cola, Motorola, Mondelez International, Kraft Heinz Company, LVMH, Unilever and the United Nations. Droga5 executed its lease at the 120 Wall Street Property in October 2013 for 91,442 SF and expanded its space in 2016 and 2018 by 52,320 SF and 58,634 SF, respectively. The 120 Wall Street Property serves as the company’s global headquarters. Droga5 has a lease expiration of September 2029 with one, ten-year renewal option for the entire premises (or at least two full contiguous floors) and has no termination options.
Success Academy Charter School (54,658 SF; 8.2% of NRA; 8.1% of underwritten base rent). Founded in 2006, Success Academy Charter School, is the largest free charter school network in New York City. Admission is open to all New York State children in grades K-12, including those with special needs and English language learners. Success Academy operates 47 schools serving 20,000 students in Manhattan, Brooklyn, Queens and the Bronx. Success Academy Charter School utilizes its space at the 120 Wall Street Property for office and administrative space. Success Academy Charter School has a lease expiration of June 2029 with no renewal options and a one-time right to terminate its lease effective August 31, 2024, with 12 months’ notice and payment of a termination fee of $3,497,468. According to the appraisal, Success Academy Charter School currently receives an NFP Benefit in the form of a rent credit amounting to approximately $244,937, annually.
AFS-USA, Inc. (40,029 SF; 6.0% of NRA; 5.9% of underwritten base rent). AFS-USA, Inc. (“AFS”) is an international youth exchange organization consisting of over 50 independent non-profit organizations. In 2018 alone, AFS served over 66,000 students across nine countries, raised over $36 million in scholarships and had more than 12,000 study-abroad participants. AFS has a lease expiration of June 2029 with one, 10-year renewal option and a
This is not a research report and was not prepared by any Underwriter’s research department. Please see additional important information and qualifications at the end of this Term Sheet.
58
| Office - CBD | Loan #3 | Cut-off Date Balance: | $80,000,000 | |
| 120 Wall Street | 120 Wall Street | Cut-off Date LTV: | 57.9% | |
| New York, NY 10005 | UW NCF DSCR: | 2.74x | ||
| UW NOI Debt Yield: | 9.3% |
one-time right to terminate its lease effective June 30, 2024, with 18 months’ prior notice and payment of a termination fee equal to $2,593,000. According to the appraisal, AFS-USA, Inc. currently receives an NFP Benefit in the form of a rent credit amounting to approximately $181,879, annually.
The following table presents certain information relating to the tenancy at the 120 Wall Street Property:
| Tenant Summary | |||||||||
| Tenant Name | Credit Rating (Fitch/Moody’s/ S&P)(1) | Tenant SF | Approx. % of SF | Annual UW Rent(2) | % of Total Annual UW Rent | Annual UW Rent PSF(2) | Renewal Options | ||
| Term. Option (Y/N) | Lease Expiration | ||||||||
| Major Tenants | |||||||||
| Droga5, LLC(3)(4) | A+/Aa3/A+ | 202,396 | 30.3% | $8,412,323(3)(4) | 32.6% | $41.56(3)(4) | N | 9/30/2029 | 1,10-year |
| Success Academy Charter School(5) | NR/NR/NR | 54,658 | 8.2% | $2,096,120(5) | 8.1% | $38.35(5) | Y(6) | 6/30/2029 | None |
| AFS-USA, Inc.(5) | NR/NR/NR | 40,029 | 6.0% | $1,519,100(5) | 5.9% | $37.95(5) | Y(7) | 6/30/2029 | 1,10-year |
| Foundation for AIDS Research | NR/NR/NR | 30,822 | 4.6% | $1,047,098 | 4.1% | $33.97 | Y(8) | 8/31/2027 | None |
| Center for Appellate Litigation(9)(10) | NR/NR/NR | 20,535 | 3.1% | $839,437(9)(10) | 3.2% | $40.88(9)(10) | N | Multiple(11) | None |
| Lambda Legal Defense & Education Fund | NR/NR/NR | 20,321 | 3.0% | $690,914 | 2.7% | $34.00 | N | 7/31/2027 | None |
| Public Relations Society of America(12) | NR/NR/NR | 19,448 | 2.9% | $933,504(12) | 3.6% | $48.00(12) | N | 2/28/2027 | None |
| Lavazza Premium Coffees Corp. | NR/NR/NR | 19,173 | 2.9% | $827,065 | 3.2% | $43.14 | N | 10/31/2027 | None |
| Catalyst, Inc. | NR/NR/NR | 18,176 | 2.7% | $745,216 | 2.9% | $41.00 | N | 7/31/2027 | None |
| American Institute of Chemical Engineers | NR/NR/NR | 16,706 | 2.5% | $640,401 | 2.5% | $38.33 | Y(13) | Multiple(14) | 1, 5-year |
| Total/Wtd. Avg. | 442,264 | 66.2% | $17,751,178 | 68.7% | $40.14 | ||||
| Non-Major Tenants(15)(16)(17) | 193,407 | 28.9% | $8,082,686 | 31.3% | $41.79 | ||||
| Occupied Collateral Total | 635,671 | 95.1% | $25,833,864 | 100.0% | $40.64 | ||||
| Vacant Space | 32,605 | 4.9% | |||||||
| Total/Wtd. Avg. | 668,276 | 100.0% | |||||||
| (1) | Certain ratings are those of the parent company whether or not the parent guarantees the lease. |
| (2) | Annual UW Rent and Annual UW Rent PSF include contractual rent steps through November 2021 totaling $298,037. |
| (3) | Jax Media is currently subleasing an additional 25,910 SF from Droga5 through June 2029 at a base rental rate of $52.15 PSF. The 120 Wall Street Whole Loan is underwritten based on the prime lease. |
| (4) | Droga5 has a gap rent period from August 1, 2021 to September 30, 2021, totaling $176,067. All gap rent was reserved for at the origination of the 120 Wall Street Whole Loan. |
| (5) | AFS-USA, Inc. is currently subleasing an additional 13,076 SF to Success Academy Charter School through June 2029 at a base rental rate of $39.00 PSF. The 120 Wall Street Whole Loan is underwritten based on the prime lease. |
| (6) | Success Academy Charter School has a one-time right to terminate its lease for the entire premises effective August 2024, with 12 months’ notice and a termination fee of $3,497,468. |
| (7) | AFS-USA, Inc. has a one-time right to terminate its lease for the entire premises effective June 30, 2024, with 18 months’ prior notice and a termination fee equal to $2,593,000. |
| (8) | Foundation for AIDS Research has an ongoing right to terminate its lease after April 1, 2023, with at least nine months’ notice, provided (i) the tenant is not in default under its lease and (ii) a cure of Acquired Immune Deficiency Syndrome has been discovered, developed and is generally recognized in the scientific community as a legitimate cure, which renders tenant’s corporate purpose redundant. The termination option will be subject to a cancellation fee equal to an amortized portion of landlord work and contributions, free rent, calculated in accordance with the lease. |
| (9) | Center for Appellate Litigation is currently subleasing an additional 8,788 SF from American Suicide Foundation through November 2021, at which point Center for Appellate Litigation will pay $58.00 PSF pursuant to a direct lease thereafter. The 120 Wall Street Whole Loan is underwritten based on the prime lease. |
| (10) | Center for Appellate Litigation has a gap rent period from December 1, 2021 to February 28, 2022, totaling $127,426. All gap rent was reserved for at the origination of the 120 Wall Street Whole Loan. |
| (11) | The 8,788 SF space’s lease expires on November 30, 2021 and the 11,747 SF space’s lease expires on January 31, 2025. |
| (12) | Kelley Jasons McGowan Spinelli Hanna & Reber, L.L.P (“KJMSHR”) is subleasing 2,442 SF to Public Relations Society of America at a base rental rate of $46.00 PSF through February 2027. KJMSHR leases no additional space at the 120 Wall Street Property. The 120 Wall Street Whole Loan is underwritten based on the prime lease. |
| (13) | American Institute of Chemical Engineers has the ongoing right to terminate solely its 200 SF storage space with at least 30 days’ notice. |
| (14) | The 200 SF space’s lease expires on March 31, 2029 and the 16,506 SF space’s lease expires on April 8, 2029. |
| (15) | Non-Major Tenants is inclusive of 7,281 SF of retail space. |
| (16) | Non-Major Tenants is inclusive of Pico Quantitative Trading which is currently dark. The tenant continues to pay rent in full at the 120 Wall Street Property. |
| (17) | Non-Major Tenants includes a 2,253 SF management office with no attributable base rent. |
This is not a research report and was not prepared by any Underwriter’s research department. Please see additional important information and qualifications at the end of this Term Sheet.
59
| Office - CBD | Loan #3 | Cut-off Date Balance: | $80,000,000 | |
| 120 Wall Street | 120 Wall Street | Cut-off Date LTV: | 57.9% | |
| New York, NY 10005 | UW NCF DSCR: | 2.74x | ||
| UW NOI Debt Yield: | 9.3% |
The following table presents certain information relating to the lease rollover schedule at 120 Wall Street Property:
| Lease Rollover Schedule(1)(2) | ||||||||
| Year | # of Leases Rolling | SF Rolling(3) | UW Rent PSF Rolling | Approx. % of Total SF Rolling | Approx. Cumulative % of SF Rolling | Total UW Rent Rolling | Approx. % of Total Rent Rolling | Approx. Cumulative % of Total Rent Rolling |
| MTM | 1 | 6 | $0.00 | 0.0% | 0.0% | $0 | 0.0% | 0.0% |
| 2020 | 0 | 0 | $0.00 | 0.0% | 0.0% | $0 | 0.0% | 0.0% |
| 2021 | 6 | 34,869 | $40.34 | 5.2% | 5.2% | $1,406,534 | 5.4% | 5.4% |
| 2022 | 5 | 12,950 | $31.24 | 1.9% | 7.2% | $404,608 | 1.6% | 7.0% |
| 2023 | 5 | 21,624 | $37.59 | 3.2% | 10.4% | $812,918 | 3.1% | 10.2% |
| 2024 | 2 | 3,912 | $49.96 | 0.6% | 11.0% | $195,440 | 0.8% | 10.9% |
| 2025 | 3 | 35,306 | $40.82 | 5.3% | 16.3% | $1,441,320 | 5.6% | 16.5% |
| 2026 | 1 | 6,024 | $36.50 | 0.9% | 17.2% | $219,876 | 0.9% | 17.3% |
| 2027 | 12 | 134,269 | $38.48 | 20.1% | 37.3% | $5,166,723 | 20.0% | 37.3% |
| 2028 | 2 | 4,357 | $36.15 | 0.7% | 37.9% | $157,515 | 0.6% | 38.0% |
| 2029 | 21 | 336,505 | $40.26 | 50.4% | 88.3% | $13,546,996 | 52.4% | 90.4% |
| 2030 | 0 | 0 | $0.00 | 0.0% | 88.3% | $0 | 0.0% | 90.4% |
| Thereafter(3) | 5 | 45,849(3) | $54.13(3) | 6.9% | 95.1% | $2,481,934(3) | 9.6% | 100.0% |
| Vacant | 0 | 32,605 | $0.00 | 4.9% | 100.0% | $0 | 0.0% | 100.0% |
| Total/Wtd. Avg. | 63 | 668,276 | $40.64 | 100.0% | $25,833,864 | 100.0% | ||
| (1) | Information is based on the underwritten rent roll. |
| (2) | Certain tenants may have lease termination options that are exercisable prior to the originally stated expiration date of the related lease and are not considered in the rollover schedule. |
| (3) | Thereafter includes a 2,253 SF management office with no attributable underwritten base rent. |
COVID-19 Update. The first debt service payment date for the 120 Wall Street Whole Loan is scheduled for November 11, 2020. The 120 Wall Street Whole Loan is not subject to any forbearance, modification or debt service relief requests. The 120 Wall Street Property is currently open for operations. As of October 30, 2020, tenants representing approximately 88.9% of occupied NRA and 94.0% of underwritten base rent have made their full October rent payment. For October, approximately 96.8% of underwritten base rent was paid. With respect to 120 Wall Street Property, six tenants (11.1% of NRA and 10.4% of underwritten base rent) have not made all of their contractual base rent payments. The Eye-Bank for Sight Research has not made September 2020 rent payments on 7,793 SF of its space (1.2% of NRA and 1.0% of underwritten base rent). The New Press (1.2% of NRA and 1.3% of underwritten base rent) did not pay rent in April 2020, but it is expected to be paid by year end 2020. Geourgoulis / Cohen (0.9% of NRA and 0.8% of underwritten base rent) has not paid rent since July 2020, but has been sending in additional payments to resolve the delinquency. As of October 30, 2020, four tenants accounting for approximately 11.9% of NRA and 11.2% of underwritten base rent in the aggregate (including Foundation for AIDS Research and AFS, together representing 10.6% of NRA and 9.9% of underwritten base rent) have requested tenant relief in the form of rent modifications and deferral. The borrower sponsor has not agreed to any such relief. See “Risk Factors—Risks Related to Market Conditions and Other External Factors—The Coronavirus Pandemic Has Adversely Affected the Global Economy and Will Likely Adversely Affect the Performance of the Mortgage Loans” in the Preliminary Prospectus.
The Market. The 120 Wall Street Property is situated in the Downtown East office submarket of the Manhattan office market. The 120 Wall Street Property is a short walk from stations providing access to the PATH, 4, 5, A, C, E, J, M, Z, W, R, 1, 2 and 3 trains and the new Fulton Street Transit Center, which provides access to New Jersey, Brooklyn and residential neighborhoods in Lower Manhattan. The FDR Drive, Brooklyn Bridge and Manhattan Bridge are accessible from the 120 Wall Street Property.
The Downtown East office submarket had approximately 49.9 million SF of inventory as of the second quarter of 2020. According to the appraisal, the Downtown East office submarket had a vacancy rate as of the second quarter of 2020 of 7.0% and an average asking rent of $56.27 PSF. The appraisal identified 12 comparable office leases with rents ranging from $52.00 to $70.79 PSF with a weighted average rent of approximately $59.97 PSF. The 120 Wall Street Property’s underwritten weighted average rent for occupied office space is approximately $40.46 PSF, approximately 21.5% below the appraisal’s concluded market rent of $51.80 PSF for the same spaces.
According to the appraisal, the traditional office tenant within the Downtown East office submarket primarily consisted of financial institutions, insurance companies, and real estate firms. However, based on the discounted rents when compared to many other submarkets throughout Manhattan, the Downtown East office submarket has redefined its typical tenancy base, signing large anchor leases to companies within the technology, advertising, media and information technology sector.
According to the appraisal, the estimated 2020 population within a 0.25, 0.5, and 1-mile radius of the 120 Wall Street Property is 9,835, 33,707, and 94,136, respectively. In addition, the appraisal states that the estimated 2020 average household income within a 0.25, 0.5, and 1-mile radius is $268,181, $247,402, and $196,812, respectively.
This is not a research report and was not prepared by any Underwriter’s research department. Please see additional important information and qualifications at the end of this Term Sheet.
60
| Office - CBD | Loan #3 | Cut-off Date Balance: | $80,000,000 | |
| 120 Wall Street | 120 Wall Street | Cut-off Date LTV: | 57.9% | |
| New York, NY 10005 | UW NCF DSCR: | 2.74x | ||
| UW NOI Debt Yield: | 9.3% |
The following table presents certain information relating to the appraisal’s market rent conclusion for 120 Wall Street Property:
| Market Rent Summary | |||||
| Floor 2 | Floors 3-9 | Floors 10-16 | Floors 17-25 | Floors 26-34 | |
| Market Rent (PSF) | $44.00 | $48.00 | $52.00 | $56.00 | $60.00 |
| Lease Term (Years) | 10 | 10 | 10 | 10 | 10 |
| Lease Type (Reimbursements) | Modified Gross | Modified Gross | Modified Gross | Modified Gross | Modified Gross |
| Rent Increase Projection | 10% step midterm | 10% step midterm | 10% step midterm | 10% step midterm | 10% step midterm |
Source: Appraisal.
The table below presents certain information relating to comparable sales with respect to the 120 Wall Street Property identified by the appraisal:
| Comparable Sales | ||||
Property Name | Location | Rentable Area (SF) | Sale Date | Sale Price (PSF) |
| 44 Wall Street | New York, NY | 354,328 | Mar-2020 | $564 |
| 195 Broadway | New York, NY | 1,083,839 | Nov-2019 | $484 |
| 1 Whitehall Street | New York, NY | 387,390 | Oct-2019 | $469 |
| 360 Lexington Avenue | New York, NY | 268,383 | Aug-2019 | $671 |
| 521 Fifth Avenue | New York, NY | 498,711 | May-2019 | $764 |
| 850 Third Avenue | New York, NY | 626,324 | Jan-2019 | $674 |
| 440 Ninth Avenue | New York, NY | 403,127 | Jan-2019 | $667 |
| 1 Broadway | New York, NY | 218,000 | May-2018 | $640 |
| 80 Broad Street | New York, NY | 422,561 | Dec-2017 | $556 |
Source: Appraisal.
The following table presents certain information relating to comparable office leases for the 120 Wall Street Property:
| Comparable Leases Summary | ||||||||
| Property Name/Location | Year Built/ Renovated | Total GLA (SF) | Distance from Subject | Tenant Name | Lease Date/Term | Lease Area (SF) | Annual Base Rent PSF | Lease Type |
120 Wall Street Property New York, NY | 1929/2013 | 668,276(1) | N/A | |||||
44 Wall Street New York, NY | 1927/2006(2) | 354,000(2) | 0.3 Miles | Giant Spoon Baretz + Brunelle | Apr. 2020 / 5.3 Yrs Jan. 2020 / 10.5 Yrs | 16,294 6,136 | $58.00 $60.00 | MG MG |
28 Liberty Street New York, NY | 1963/N/A(2) | 2,303,835(2) | 0.3 Miles | Dotdash | Nov. 2019 / 10.5 Yrs | 68,230 | $55.00 | MG |
100 Pearl Street New York, NY | 1982/N/A(2) | 963,045(2) | 0.3 Miles | Goodwill Industries NYLAG | Oct. 2019 / 30.0 Yrs Oct. 2019 / 30.0 Yrs | 37,115 55,675 | $70.79 $62.79 | Net (MG Adj.) Net (MG Adj.) |
61 Broadway New York, NY | 1916/1988(2) | 787,000(2) | 0.5 Miles | Eko | Sep. 2019 / 10.5 Yrs | 24,479 | $64.00 | MG |
199 Water Street New York, NY | 1984/2014(2) | 1,160,067(2) | 0.3 Miles | American Friends of Hebrew University (AFHU) Trident Brokerage | Sep. 2019 / 15.4 Yrs Jul. 2019 / 7.3 Yrs | 10,895 5,607 | $52.00 $58.00 | MG MG |
101 Greenwich Street New York, NY | 1909/1990(2) | 476,000(2) | 0.5 Miles | Frier & Levitt LLC | Jul. 2019 / 5.7 Yrs | 3,947 | $63.00 | MG |
100 Broadway New York, NY | 1897/1998(2) | 400,000(2) | 0.4 Miles | Tommy John, Inc. | Jul. 2019 / 7.3 Yrs | 17,592 | $60.00 | MG |
100 William Street New York, NY | 1972/2012(2) | 421,000(2) | 0.4 Miles | New York County Defender Services | Jul. 2019 / 13.5 Yrs | 3,748 | $56.00 | MG |
75 Broad Street New York, NY | 1928/N/A(2) | 647,924(2) | 0.4 Miles | Glitch | Jun. 2019 / 10.3 Yrs | 11,159 | $60.00 | MG |
Source: Appraisal, unless otherwise indicated.
| (1) | Information obtained from the underwritten rent roll. |
| (2) | Information obtained from a third party market research provider. |
This is not a research report and was not prepared by any Underwriter’s research department. Please see additional important information and qualifications at the end of this Term Sheet.
61
| Office - CBD | Loan #3 | Cut-off Date Balance: | $80,000,000 | |
| 120 Wall Street | 120 Wall Street | Cut-off Date LTV: | 57.9% | |
| New York, NY 10005 | UW NCF DSCR: | 2.74x | ||
| UW NOI Debt Yield: | 9.3% |
Operating History and Underwritten Net Cash Flow. The following table presents certain information relating to the historical operating performance and Underwritten Net Cash Flow at the 120 Wall Street Property:
| Cash Flow Analysis | ||||||
| 2017(1) | 2018(1) | 2019(1) | 7/31/2020 TTM(2) | UW(2) | UW Per SF | |
| Base Rent | $21,819,923 | $20,742,361 | $23,378,989 | $23,582,233 | $25,833,864(3) | $38.66 |
| Grossed Up Vacant Space | 0 | 0 | 0 | 0 | 1,821,818 | 2.73 |
| NFP Rent Credit(4) | (875,867) | (910,278) | (947,348) | (922,477) | (967,163) | (1.45) |
| Gross Potential Rent | $20,944,056 | $19,832,083 | $22,431,641 | $22,659,756 | $26,688,519 | $39.94 |
| Other Income(5) | 88,120 | 71,433 | 259,483 | 274,069 | 274,069 | 0.41 |
| Total Recoveries | 3,108,126 | 3,395,970 | 3,502,179 | 3,321,088 | 3,467,820 | 5.19 |
| (Vacancy & Credit Loss) | 0 | 0 | 0 | 0 | (1,821,818)(6) | (2.73) |
| Effective Gross Income | $24,140,302 | $23,299,486 | $26,193,303 | $26,254,913 | $28,608,590 | $42.81 |
| Real Estate Taxes(7) | 2,745,617 | 3,540,446 | 3,546,115 | 3,585,184 | 3,736,050 | 5.59 |
| Insurance | 430,433 | 447,661 | 457,799 | 548,792 | 458,205 | 0.69 |
| Management Fee | 603,508 | 582,487 | 654,833 | 656,373 | 715,215 | 1.07 |
| Other Operating Expenses | 7,873,196 | 8,682,355 | 8,582,222 | 8,274,275 | 8,274,275 | 12.38 |
| Total Operating Expenses | $11,652,754 | $13,252,949 | $13,240,969 | $13,064,624 | $13,183,745 | $19.73 |
| Net Operating Income | $12,487,548 | $10,046,537 | $12,952,334 | $13,190,289 | $15,424,845 | $23.08 |
| Capital Expenditures | 0 | 0 | 0 | 0 | 100,241 | 0.15 |
| TI/LC | 0 | 0 | 0 | 0 | 668,276 | 1.00 |
| Net Cash Flow | $12,487,548 | $10,046,537 | $12,952,334 | $13,190,289 | $14,656,328 | $21.93 |
| Occupancy % | 96.0% | 95.0% | 92.0% | 95.1%(8) | 95.1%(8) | |
| NOI DSCR(9) | 2.33x | 1.88x | 2.42x | 2.46x | 2.88x | |
| NCF DSCR(9) | 2.33x | 1.88x | 2.42x | 2.46x | 2.74x | |
| NOI Debt Yield(9) | 7.6% | 6.1% | 7.8% | 8.0% | 9.3% | |
| NCF Debt Yield(9) | 7.6% | 6.1% | 7.8% | 8.0% | 8.9% | |
| (1) | The decrease from 2017 Net Operating Income to 2018 Net Operating Income and subsequent increase from 2018 Net Operating Income to 2019 Net Operating Income is primarily attributable to new leases executed in 2018 accounting for 11.5% of NRA and 13.8% of underwritten base rent. In connection with executing such leases, the 120 Wall Street Borrower provided new tenants with free rent periods accounting for an adjustment of approximately $2,427,673 in 2018 base rent. |
| (2) | The increase from 7/31/2020 TTM Net Operating Income to UW Net Operating Income at the 120 Wall Street Property is primarily attributable to (i) new leases commencing in 2020 and 2021 (including leases with Excess Line Association of New York, Hydra and Nathan Cumming Foundation, Inc., accounting for $810,656, $275,017 and $838,811 in underwritten base rent, respectively) accounting for an increase of approximately $1.9 million in underwritten base rent and (ii) contractual rent steps through November 2021. |
| (3) | UW base rent includes contractual rent steps through November 2021 totaling $298,037. |
| (4) | NFP Rent Credit is based on contractual rent credits for 12 NFP tenants representing approximately 32.9% of NRA at the 120 Wall Street Property. |
| (5) | Other Income includes telecom income, license income, miscellaneous event income, lease cancellation fees and construction management fees. |
| (6) | The underwritten economic vacancy is 6.4%. The 120 Wall Street Property was 95.1% physically occupied and 93.6% economically occupied as of August 31, 2020. |
| (7) | Real Estate Taxes are underwritten based on the actual 2021 tax bill net of the $1,644,088 estimated ESD tax benefit (see “The Property” section above). |
| (8) | Represents occupancy as of August 31, 2020. |
| (9) | The debt service coverage ratios and debt yields shown are based on the 120 Wall Street Whole Loan. |
Escrows and Reserves.
Real Estate Taxes – The loan documents require an upfront real estate tax reserve of $1,306,557 and ongoing monthly real estate tax reserves in an amount equal to one-twelfth of the real estate taxes that the lender estimates will be payable during the next 12 months (initially $326,640).
Insurance – The loan documents do not require ongoing monthly payments to an insurance reserve as long as (i) no event of default is continuing; (ii) the 120 Wall Street Property is covered under blanket or umbrella policies acceptable to the lender; (iii) the 120 Wall Street Borrower provides the lender with evidence of renewal of such policies; and (iv) the 120 Wall Street Borrower provides the lender with paid receipts for payment of the insurance premiums prior to the policy expiration dates. If said conditions are not met, the loan documents require an ongoing monthly escrow of 1/12th of the lender’s estimated insurance premiums estimated for the renewal of coverage at least 30 days’ prior to expiration.
Recurring Replacements – During a Cash Trap Period (as defined below), the loan documents require ongoing monthly replacement reserve deposits of $13,922, subject to a cap of $501,207.
TI/LC Reserve – The loan documents require an upfront general tenant improvements and leasing commissions (“TI/LC”) reserve of $3,472,525 and ongoing monthly TI/LC reserve deposits of $111,379, subject to cap of $4,009,656.
Rent Concession Reserve – The loan documents require an upfront reserve of $1,759,579 for free rent and gap rent related to six tenants at the 120 Wall Street Property. See the “Tenant Summary” chart above for additional details.
This is not a research report and was not prepared by any Underwriter’s research department. Please see additional important information and qualifications at the end of this Term Sheet.
62
| Office - CBD | Loan #3 | Cut-off Date Balance: | $80,000,000 | |
| 120 Wall Street | 120 Wall Street | Cut-off Date LTV: | 57.9% | |
| New York, NY 10005 | UW NCF DSCR: | 2.74x | ||
| UW NOI Debt Yield: | 9.3% |
The 120 Wall Street Borrower has the right to substitute a letter of credit in lieu of ongoing deposits or existing amounts, in accordance with the 120 Wall Street Whole Loan documents.
Lockbox and Cash Management. The 120 Wall Street Whole Loan is structured with an in-place hard lockbox, into which the 120 Wall Street Borrower and property manager are required to cause all rents to be deposited directly and springing cash management. The 120 Wall Street Whole Loan documents also require that all rents received by the 120 Wall Street Borrower or property manager be deposited into the lockbox account within two business days of receipt. So long as no Cash Trap Event Period is in effect, all funds on deposit in the lockbox account will be disbursed to the 120 Wall Street Borrower’s operating account. During a Cash Trap Period, all funds in the lockbox account are required to be swept each business day into the cash management account controlled by the lender and, on each payment date, all funds in the cash management account are required to be applied in accordance with the 120 Wall Street Whole Loan documents. During a Cash Trap Period, any excess cash flow remaining after satisfaction of the waterfall items is required to be swept to an excess cash flow subaccount to be held by the lender as additional security for the 120 Wall Street Whole Loan. If no Cash Trap Period exists, all excess cash flow is required to be disbursed to, or at the written direction of, the 120 Wall Street Borrower.
A “Cash Trap Period” will commence upon the earlier of the following:
| (i) | the occurrence of an event of default; |
| (ii) | the net cash flow debt yield falling below 6.25% (tested quarterly); or |
| (iii) | Droga5 failing to renew or extend its lease by June 30, 2028. |
A Cash Trap Period will end upon the occurrence of the following:
| ● | with regard to clause (i), the cure of such event of default; |
| ● | with regard to clause (ii), the earliest to occur of (x) the net cash flow debt yield being equal to or greater than 6.25% for two consecutive calendar quarters or (y) the 120 Wall Street Borrower delivering a letter of credit reasonably satisfactory to the lender in an amount sufficient such that, after the deduction of the face amount of such letter of credit from the principal balance of the 120 Wall Street Whole Loan, the net cash flow debt yield would not be less than 6.25%; |
| ● | with regard to clause (iii), the 120 Wall Street Borrower depositing with the lender an amount equal to $50.00 PSF of leased space under Droga5’s lease. |
Additional Secured Indebtedness (not including trade debts). The 120 Wall Street Property also secures the 120 Wall Street Serviced Pari Passu Companion Loans, which have a Cut-off Date principal balance of $85,000,000. The 120 Wall Street Serviced Pari Passu Companion Loans accrue interest at the same rate as the 120 Wall Street Mortgage Loan. The 120 Wall Street Mortgage Loan is entitled to payments of interest and principal on a pro rata and pari passu basis with the 120 Wall Street Serviced Pari Passu Companion Loans. The holders of the 120 Wall Street Mortgage Loan and the 120 Wall Street Serviced Pari Passu Companion Loans have entered into a co-lender agreement, which sets forth the allocation of collections on the 120 Wall Street Whole Loan. See “Description of the Mortgage Pool—The Whole Loans—The Serviced Pari Passu Whole Loans” in the Preliminary Prospectus.
Mezzanine Loan and Preferred Equity. The holders of 100% of the indirect equity interests in the 120 Wall Street Borrower have the right to obtain mezzanine debt secured by a pledge of such ownership interests, so long as the following conditions are satisfied, among others, pursuant to the 120 Wall Street Whole Loan documents: (i) no event of default is continuing, (ii) the lender and such mezzanine lender have entered into an intercreditor agreement reasonably satisfactory to the lender, (iii) the aggregate loan-to-value ratio (as calculated in accordance with the 120 Wall Street Whole Loan documents) is no greater than 57.9%, (iv) the aggregate net cash flow debt service coverage ratio (as calculated in accordance with the 120 Wall Street Whole Loan documents) is equal to or greater than 2.37x, (v) the aggregate net cash flow debt yield (as calculated in accordance with the 120 Wall Street Whole Loan documents) is equal to or greater than 7.7%, (vi) the maturity date of the mezzanine loan is not earlier than the maturity date of the 120 Wall Street Whole Loan and (vii) a rating agency confirmation is obtained for each applicable rating agency. See “Description of the Mortgage Pool—Additional Indebtedness—Mezzanine Indebtedness” in the Preliminary Prospectus.
Release of Property. Not permitted.
Letter of Credit. The 120 Wall Street Borrower has the right to substitute a letter of credit in lieu of ongoing deposits or existing amounts, in accordance with the 120 Wall Street Whole Loan documents.
Right of First Offer/ Right of First Refusal. None.
Ground Lease. Please see “The Property” section above for a further discussion of the PILOT ground lease structure.
Terrorism Insurance. The loan documents require that the “all risk” insurance policy required to be maintained by the 120 Wall Street Borrower provides coverage for terrorism in an amount equal to the full replacement cost of the 120 Wall Street Property, as well as business interruption insurance covering no less than the 18-month period following the occurrence of a casualty event, together with a 6-month extended period of indemnity (provided that if TRIPRA or a similar statute is not in effect, the 120 Wall Street Borrower will not be obligated to pay terrorism insurance premiums in excess of two times the premium for the casualty and business interruption coverage on a stand-alone basis). See “Risk Factors—Risks Relating to the Mortgage Loans—Terrorism Insurance May Not Be Available for All Mortgaged Properties” in the Preliminary Prospectus.
This is not a research report and was not prepared by any Underwriter’s research department. Please see additional important information and qualifications at the end of this Term Sheet.
63
| Office – CBD | Loan #4 | Cut-off Date Balance: | $75,000,000 | |
| 1114 Avenue of the Americas | Grace Building | Cut-off Date LTV: | 41.1% | |
| New York, NY 10036 | UW NCF DSCR: | 4.25x | ||
| UW NOI Debt Yield: | 11.8% |
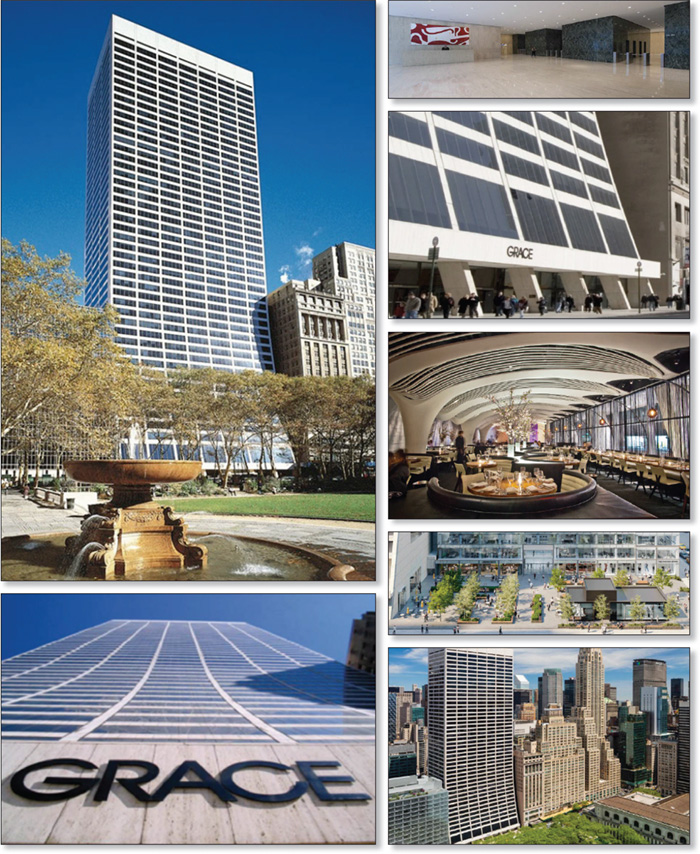
This is not a research report and was not prepared by any Underwriter’s research department. Please see additional important information and qualifications at the end of this Term Sheet.
64
| Office – CBD | Loan #4 | Cut-off Date Balance: | $75,000,000 | |
| 1114 Avenue of the Americas | Grace Building | Cut-off Date LTV: | 41.1% | |
| New York, NY 10036 | UW NCF DSCR: | 4.25x | ||
| UW NOI Debt Yield: | 11.8% |
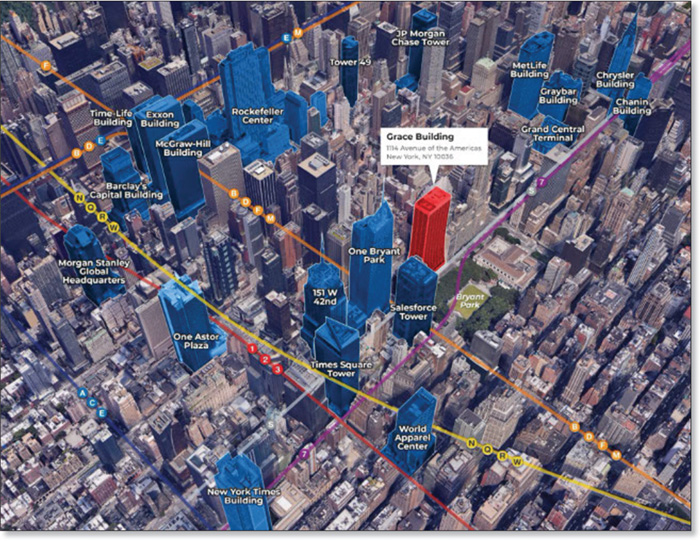
This is not a research report and was not prepared by any Underwriter’s research department. Please see additional important information and qualifications at the end of this Term Sheet.
65
| Office – CBD | Loan #4 | Cut-off Date Balance: | $75,000,000 | |
| 1114 Avenue of the Americas | Grace Building | Cut-off Date LTV: | 41.1% | |
| New York, NY 10036 | UW NCF DSCR: | 4.25x | ||
| UW NOI Debt Yield: | 11.8% |
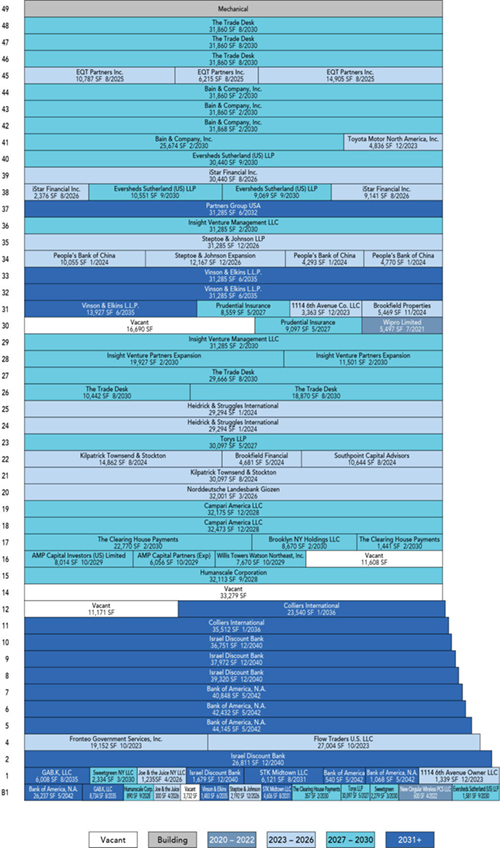
This is not a research report and was not prepared by any Underwriter’s research department. Please see additional important information and qualifications at the end of this Term Sheet.
66
| Office – CBD | Loan #4 | Cut-off Date Balance: | $75,000,000 | |
| 1114 Avenue of the Americas | Grace Building | Cut-off Date LTV: | 41.1% | |
| New York, NY 10036 | UW NCF DSCR: | 4.25x | ||
| UW NOI Debt Yield: | 11.8% |
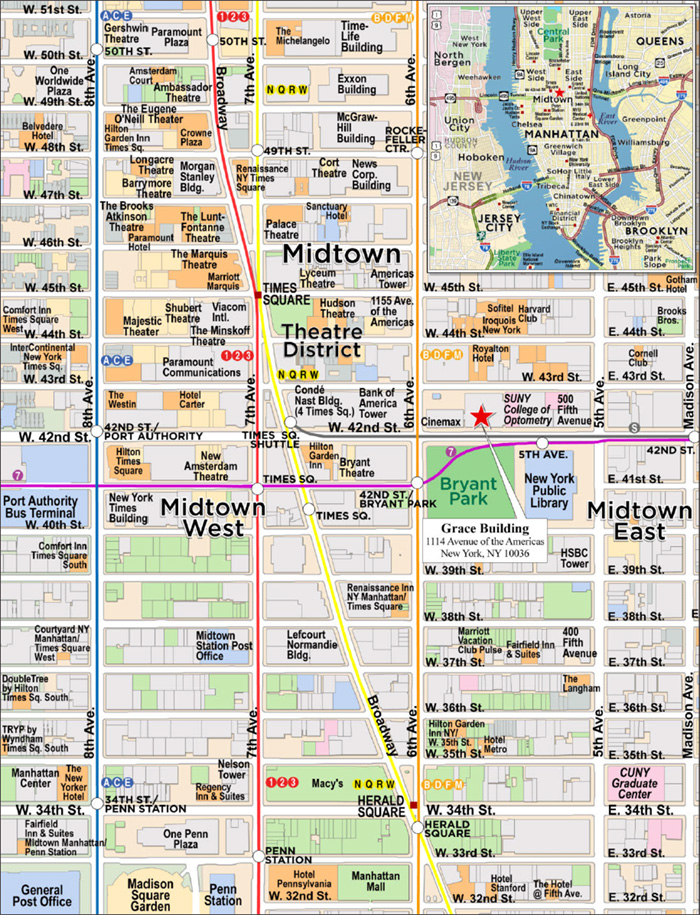
This is not a research report and was not prepared by any Underwriter’s research department. Please see additional important information and qualifications at the end of this Term Sheet.
67
| Mortgage Loan No. 4 – Grace Building |
| Mortgage Loan Information | Mortgaged Property Information | ||||||
| Mortgage Loan Seller: | BANA | Single Asset/Portfolio: | Single Asset | ||||
| Credit Assessment (DBRSM/Fitch/Moody’s) | A/A-sf*/Baa2 | Location: | New York, NY 10036 | ||||
| Original Balance(1): | $75,000,000 | General Property Type: | Office | ||||
| Cut-off Date Balance(1): | $75,000,000 | Detailed Property Type: | CBD | ||||
| % of Initial Pool Balance: | 8.6% | Title Vesting: | Fee | ||||
| Loan Purpose: | Refinance | Year Built/Renovated: | 1974/2018 | ||||
| Borrower Sponsor: | Brookfield Office Properties Inc. | Size: | 1,556,972 SF | ||||
| Guarantors: | BOP NYC OP LLC; Swig | Cut-off Date Balance per SF(1): | $567 | ||||
| Investment Company, LLC | Maturity Date Balance per SF(1): | $567 | |||||
| Mortgage Rate: | 2.6921% | Property Manager: | TRZ Holdings IV LLC; Brookfield | ||||
| Note Date: | 11/17/2020 | Properties (USA II) LLC (f/k/a | |||||
| First Payment Date(2): | 12/6/2020 | Brookfield Properties Management | |||||
| Maturity Date: | 12/6/2030 | LLC) (borrower-related) | |||||
| Original Term to Maturity(2): | 121 months | Underwriting and Financial Information(7) | |||||
| Original Amortization Term: | 0 months | UW NOI(8): | $104,293,717 | ||||
| IO Period(2): | 121 months | UW NOI Debt Yield(1): | 11.8% | ||||
| Seasoning: | 0 months | UW NOI Debt Yield at Maturity(1): | 11.8% | ||||
| Prepayment Provisions(2)(3): | LO (24); DEF/YM1 (90); O (7) | UW NCF DSCR(1): | 4.25x | ||||
| Lockbox/Cash Mgmt Status: | Hard/Springing | Most Recent NOI(8): | $46,272,539 (9/30/2020 TTM) | ||||
| Additional Debt Type(1)(4): | Pari Passu/B-Note | 2nd Most Recent NOI(8): | $52,538,193 (12/31/2019) | ||||
| Additional Debt Balance(1)(4): | $808,000,000/$367,000,000 | 3rd Most Recent NOI(8): | $73,206,665 (12/31/2018) | ||||
| Future Debt Permitted (Type)(5): | Yes (Mezzanine) | Most Recent Occupancy: | 94.8% (10/19/2020) | ||||
| Reserves(6) | 2nd Most Recent Occupancy: | 91.0% (12/31/2019) | |||||
| Type | Initial | Monthly | Cap | 3rd Most Recent Occupancy: | 97.6% (12/31/2018) | ||
| RE Tax: | $0 | Springing | N/A | Appraised Value (as of): | $2,150,000,000 (9/8/2020) | ||
| Insurance: | $0 | Springing | N/A | Appraised Value per SF: | $1,381 | ||
| Recurring Replacements: | $0 | Springing | N/A | Cut-off Date LTV Ratio(1): | 41.1% | ||
| TI/LC: | $56,172,399 | Springing | N/A | Maturity Date LTV Ratio(1): | 41.1% | ||
| Free Rent: | $25,964,570 | $0 | N/A | ||||
| Lobby/Elevator Work: | $5,970,240 | $0 | N/A | ||||
| Parking Rent Shortfall: | $1,608,940 | $0 | N/A | ||||
| Sources and Uses | ||||||
| Sources | Proceeds | % of Total | Uses | Proceeds | % of Total | |
| Whole Loan Amount(1): | $1,250,000,000 | 100.0% | Loan Payoff(9): | $905,439,802 | 72.4% | |
| Return of Equity: | $239,965,013 | 19.2% | ||||
| Reserves(10): | $89,716,149 | 7.2% | ||||
| Closing Costs: | $14,879,035 | 1.2% | ||||
| Total Sources: | $1,250,000,000 | 100.0% | Total Uses: | $1,250,000,000 | 100.0% | |
| (1) | The Grace Building Mortgage Loan (as defined below) is part of the Grace Building Whole Loan (as defined below) with an original principal balance of $1,250,000,000. The Cut-off Date Balance per SF, Maturity Date Balance per SF, UW NOI Debt Yield, UW NOI Debt Yield at Maturity, UW NCF DSCR, Cut-off Date LTV Ratio and Maturity Date LTV Ratio numbers presented above are based on the Grace Building Senior Loan (as defined below). The Cut-off Date Balance per SF and Maturity Date Balance per SF, UW NOI Debt Yield, UW NOI Debt Yield at Maturity, UW NCF DSCR, Cut-off Date LTV Ratio and Maturity Date LTV Ratio based upon the Grace Building Whole Loan are $803, $803, 8.3%, 8.3%, 3.00x, 58.1% and 58.1%, respectively. |
| (2) | The first payment date for the Grace Building Whole Loan is January 6, 2021. On the Closing Date of the BANK 2020-BNK29 securitization transaction, Bank of America, National Association will deposit sufficient funds to pay the amount of interest that would be due with respect to a December 6, 2020 payment. Original Term to Maturity, IO Period and Prepayment Provisions are inclusive of the additional December 6, 2020 interest-only payment to be funded by Bank of America, National Association on the Closing Date. |
| (3) | Defeasance or prepayment of the Grace Building Whole Loan is permitted at any time after the earlier to occur of (a) the end of the two-year period commencing on the closing date of the securitization of the last portion of the Grace Building Whole Loan to be securitized and (b) November 17, 2023. The assumed prepayment lockout period of 24 payments is based on the closing date of this transaction in November 2020. |
| (4) | See “Additional Secured Indebtedness (not including trade debts)” below for further discussion of additional debt. |
| (5) | See “Mezzanine Loan and Preferred Equity” below for further discussion of the permitted future mezzanine debt. |
| (6) | See “Escrows and Reserves” below for further discussion of reserve information. |
| (7) | The novel coronavirus pandemic is an evolving situation and could impact the Grace Building Whole Loan more severely than assumed in the underwriting of the Grace Building Whole Loan and could adversely affect the NOI, NCF and occupancy information, as well as the appraised value and the DSCR, LTV and Debt Yield metrics presented above and herein. See “Risk Factors-—Risks Related to Market Conditions and Other External Factors—The Coronavirus Pandemic Has Adversely Affected the Global Economy and Will Likely Adversely Affect the Performance of the Mortgage Loans” in the Preliminary Prospectus. |
| (8) | See “Operating History and Underwritten Net Cash Flow” below for an explanation of the volatility in historical NOI and the increase from Most Recent NOI to UW NOI. |
| (9) | Loan payoff includes defeasance costs for previously securitized debt in the GRACE 2014-GRCE trust. |
| (10) | Reserves include $56,172,399 of outstanding landlord obligations and $1,608,940 for parking rent shortfall which were not funded out of loan proceeds and are required to be deposited by the Grace Building Borrower (as defined below) to an account held by the lender by November 18, 2020. |
This is not a research report and was not prepared by any Underwriter’s research department. Please see additional important information and qualifications at the end of this Term Sheet.
| Office – CBD | Loan #4 | Cut-off Date Balance: | $75,000,000 | |
| 1114 Avenue of the Americas | Grace Building | Cut-off Date LTV: | 41.1% | |
| New York, NY 10036 | UW NCF DSCR: | 4.25x | ||
| UW NOI Debt Yield: | 11.8% |
The Mortgage Loan. The fourth largest mortgage loan (the “Grace Building Mortgage Loan”) is part of a whole loan (the “Grace Building Whole Loan”) that is evidenced by 20 pari passu senior promissory notes in the aggregate original principal amount of $883,000,000 (collectively, the “Grace Building Senior Loan”) and four pari passu subordinate promissory notes in the aggregate original principal amount of $367,000,000 (collectively, the “Grace Building Subordinate Companion Loan”). The Grace Building Whole Loan was co-originated by Bank of America, N.A. (“BANA”), JPMorgan Chase Bank, National Association (“JPM”), Column Financial, Inc. (“CS”) and DBR Investments Co. Limited (“DBRI”). The Grace Building Whole Loan is secured by a first priority fee mortgage encumbering a Class A office building located in New York, New York (the “Grace Building Property”). The Grace Building Mortgage Loan is evidenced by the non-controlling promissory Note A-1-2, being contributed by BANA, in the original principal amount of $75,000,000. As shown in the table below, eight promissory notes in the original aggregate principal amount of $750,000,000 are being contributed to the GRACE 2020-GRCE securitization trust. The Grace Building Whole Loan will be serviced pursuant to the trust and servicing agreement for the GRACE 2020-GRCE securitization trust. The Grace Building Senior Loan pari passu notes other than that evidencing the Grace Building Mortgage Loan are referred to herein as the “Grace Building Non-Serviced Pari Passu Companion Loans”. See “Description of the Mortgage Pool—The Whole Loans—The Grace Building Pari Passu-A/B Whole Loan” and “Pooling and Servicing Agreement—Servicing of the Non-Serviced Mortgage Loans” in the Preliminary Prospectus.
| Grace Building Whole Loan Summary | ||||
| Note | Original Balance | Cut-off Date Balance | Anticipated Note Holder | Controlling Piece |
| Grace Building Senior Loan | ||||
| A-1-1, A-2-1, A-3-1, A-4-1 | $383,000,000 | $383,000,000 | GRACE 2020-GRCE | Yes(1) |
| A-1-2 | $75,000,000 | $75,000,000 | BANK 2020-BNK29 | No |
| A-1-3 | $75,000,000 | $75,000,000 | BANA | No |
| A-2-2, A-2-3, A-2-4, A-2-5, A-2-6, A-2-7 | $150,000,000 | $150,000,000 | JPM | No |
| A-3-2, A-3-3, A-3-4, A-3-5 | $100,000,000 | $100,000,000 | CS | No |
| A-4-2, A-4-3, A-4-4, A-4-5 | $100,000,000 | $100,000,000 | DBRI | No |
| Total (Senior Loan) | $883,000,000 | $883,000,000 | ||
| Grace Building Subordinate Companion Loan | ||||
| B-1, B-2, B-3, B-4 | $367,000,000 | $367,000,000 | GRACE 2020-GRCE | Yes(1) |
| Total (Whole Loan) | $1,250,000,000 | $1,250,000,000 | ||
| (1) | Pursuant to the related co-lender agreement, the controlling holder will be the Grace Trust 2020-GRCE trust. See “Description of the Mortgage Pool—The Whole Loans—The Grace Building Pari Passu-A/B Whole Loan” in the Preliminary Prospectus. |
The Borrower and the Borrower Sponsor. The borrower is 1114 6th Avenue Owner LLC (the “Grace Building Borrower”), a Delaware limited liability company that is structured to be bankruptcy-remote with at least one independent director. The Grace Building Borrower is owned by a joint venture partnership between an affiliate of Swig Investment Company, LLC and 1114 6th Avenue Holdings LLC (controlled and majority indirectly owned by an affiliate of the borrower sponsor, Brookfield Office Properties Inc.)
The non-recourse carveout guarantors are BOP NYC OP LLC and Swig Investment Company, LLC. The full recourse obligations of the non-recourse carveout guarantors for bankruptcy related events are capped at 15% of the outstanding principal balance of the Grace Building Whole Loan.
BOP NYC OP LLC is a subsidiary of Brookfield Property Partners L.P., the public real estate vehicle of Brookfield Asset Management Inc. (NYSE: BAM) (“Brookfield Asset Management”). Brookfield Asset Management was founded in 1899 and is a global asset manager with a reported approximately $550 billion of assets under management, concentrated in property, infrastructure, renewable power, private equity and credit. Brookfield Asset Management has approximately 150,000 employees in over 100 offices in 30 different countries and is one of the largest real estate fund managers in the world. Brookfield Property Partners L.P. is a large global real estate company, with approximately $86 billion in total assets. Brookfield Property Partners L.P. owns and operates properties in the world’s major markets, with a global portfolio that includes office, retail, multifamily, logistics, hospitality, self-storage, triple-net lease, manufactured housing and student housing assets.
Swig Investment Company, LLC is a San Francisco-based private real estate investment company with an 80-year history of development, ownership and management of commercial real estate properties in major markets throughout the United States. The company’s diversified portfolio includes over 9 million SF of office buildings in markets such as New York, San Francisco, and Southern California.
The Property. The Grace Building Property is a 1.56 million SF, LEED Gold office tower located at Sixth Avenue and 42nd Street in Midtown Manhattan across from Bryant Park. The Grace Building Property was developed in 1974 by Swig Investment Company, LLC and designed by award-winning architect Skidmore, Owings & Merrill-partner Gordon Bunshaft. A notable aesthetic feature of the building is the concave vertical slopes of its north and south façades which are similar to the Solow Building at 9 West 57th Street, another Bunshaft creation. The Grace Building Property offers wide-open floor plates with walls of glass offering views of Bryant Park, the Hudson River and the city skyline. The Grace Building Property also includes a 188-space underground parking garage.
The Grace Building Property was 94.8% leased as of October 19, 2020 to a granular rent roll of over 35 tenants in a wide range of industries. Major tenants at the Grace Building Property include Bank of America, N.A., The Trade Desk and Israel Discount Bank. In addition to the office space, there is 30,877 SF (2.0% of NRA) of retail space, which is 95.0% occupied by two fine dining restaurants, STK and Gabriel Kruether, and two quick service restaurants, Sweetgreen and Joe & The Juice.
The Grace Building Property has maintained high occupancy levels with a 20-year physical occupancy average of approximately 94%. The Grace Building Property experienced significant tenant turnover from 2016-2018, as four of the five largest tenants, including HBO (Time Warner Inc.) and Cooley LLP (a
This is not a research report and was not prepared by any Underwriter’s research department. Please see additional important information and qualifications at the end of this Term Sheet.
69
| Office – CBD | Loan #4 | Cut-off Date Balance: | $75,000,000 | |
| 1114 Avenue of the Americas | Grace Building | Cut-off Date LTV: | 41.1% | |
| New York, NY 10036 | UW NCF DSCR: | 4.25x | ||
| UW NOI Debt Yield: | 11.8% |
large law firm), were replaced by other tenants on long-term leases. As a result of such replacement leases, the Grace Building Property has been able to stabilize at approximately 95% occupancy, in-line with its historical average.
The Grace Building Property has seen leasing momentum over the last five years, with over 950,000 SF of new and renewed leases having been signed at the Grace Building Property since 2016. As a result, less than 16.0% of tenants by NRA will have leases that expire in the next five years. Recent leasing activity includes 95,580 SF leased to The Trade Desk, 127,425 SF of expansion space leased to Bank of America, N.A., and 41,957 SF of renewal and expansion space leased to iStar Financial.
Major Tenants.
Bank of America, N.A. (155,270 SF, 10.0% of NRA, 9.0% of underwritten rent). Bank of America, N.A. (Moody’s/S&P/Fitch: A2/A-/A+) (NYSE: BAC) (“BANA”) is a multinational investment bank and financial services holding company headquartered in Charlotte, North Carolina, with central hubs in New York City, London, Hong Kong, Dallas and Toronto. BANA has expanded its footprint around Bryant Park with its New York headquarters at One Bryant Park and a recent expansion into 1100 Avenue of the Americas. BANA currently leases 155,270 SF of combined space on the 5th, 6th and 7th floors of the Grace Building Property, together with the building pavilion premises located on and beneath the plaza area of the 43rd Street side of the building through May 31, 2042. BANA has the option to renew its lease for up to four renewal terms for a maximum of 20 years, provided that BANA must occupy 100,000 SF in each of (i) the 5th, 6th and 7th floors and (ii) in the portion of the total premises (i.e. such floors plus the pavilion space) leased by it as to which BANA is exercising the renewal option. BANA is only permitted to exercise a renewal with respect to the pavilion premises if at least six full floors of office space under its lease at 1100 Avenue of the Americas is also simultaneously renewed. The lease does not provide any termination options.
BANA’s annual base rent for the 5th, 6th and 7th floors is currently $79.00 PSF and its annual base rent for the pavilion premises is currently $92.50 PSF.
BANA is currently in a free rent period, with a rent commencement date of February 1, 2021 for the 5th, 6th and 7th floors, and April 1, 2021 for the pavilion premises. All free rent, in the amount of $1,884,169, was fully reserved at loan closing. BANA is entitled to $8,840,109 for tenant improvements from the landlord, which amount was fully reserved at loan closing (see “Escrows and Reserves”).
The Trade Desk (154,558 SF, 9.9% of NRA, 14.4% of underwritten rent). The Trade Desk (Nasdaq: TTD) (“Trade Desk”) is a global technology company that markets a software platform used by digital advertising buyers to purchase data-driven digital advertising campaigns across various advertising formats and devices. Trade Desk currently has over 1,300 employees and a reported market capitalization of approximately $26.48 billion. Trade Desk currently leases a total of 154,558 SF on the 26th, 27th, 46th, 47th and 48th floors through August, 31 2030. The commencement date with respect to the 26th and 27th floors will occur upon the earlier of (i) substantial completion of the work to be performed by the landlord and (ii) the date Trade Desk first takes possession of the space. Trade Desk has one five-year renewal option so long as Trade Desk is not in default or in bankruptcy and Trade Desk and its affiliates physically occupy at least 79% of the space.
Trade Desk’s annual base rent for the 46th, 47th and 48th floors is $139.00 PSF from August 10, 2020 through August 31, 2025, and then $148.00 PSF from September 1, 2025 through August 31, 2030. Trade Desk’s annual base rent for the 26th and 27th floors is $118.00 initially, and then $128.00 PSF after the fifth anniversary of the lease commencement date through August 31, 2030.
Trade Desk is currently in a free rent period through September 30, 2021. All free rent, in the amount of $5,799,503, was fully reserved at loan closing. Trade Desk is entitled to $7,770,283 for tenant improvements and leasing costs from the landlord, which amount was fully reserved at loan closing (see “Escrows and Reserves”).
Trade Desk has the right to terminate the lease solely as to the 26th and 27th floors if the commencement date does not occur by May 31, 2021, as such date may be extended by force majeure (not to exceed 150 days in the aggregate). In addition, so long as Trade Desk is not in bankruptcy and no default is continuing, Trade Desk has a one-time right to terminate the lease with respect to one or both of the 26th and 27th floors, effective as of the last day of the month in which the seventh anniversary of the commencement date occurs. If Trade Desk has elected to terminate both the 26th and 27th floors, Trade Desk will owe $6,700,000 as a termination payment. If Trade Desk has elected to terminate one floor, Trade Desk will owe $3,350,000 as a termination payment. Notwithstanding the foregoing, no termination will be permitted if Trade Desk has exercised its right of first offer to lease certain additional space pursuant to its lease within the 24-month period immediately preceding the date on which Trade Desk sends a notice to effectuate such termination.
Israel Discount Bank (142,533 SF, 9.2% of NRA, 5.5% of underwritten rent). Israel Discount Bank of New York (S&P: BBB+) (“IDB”) is an American multinational private bank, commercial bank and financial services company headquartered in New York City with locations in the United States, Latin America and Israel. Chartered by the State of New York and a member of the Federal Deposit Insurance Corporation, IDB reported $9.23 billion in total assets in 2018. IDB currently leases 142,533 SF of combined space on the ground, 2nd, 8th, 9th and 10th floors through December 31, 2040. IDB’s commencement date is the earlier to occur of: (i) the date of substantial completion of the work to be performed by the Grace Building Borrower, but in no event earlier than January 1, 2021; and (ii) the date IBD first takes possession of the space. IDB has two five-year renewal options, with 21 months’ prior written notice, provided that IDB has not subleased more than 20% of its leased premises and IDB is leasing at least two full floors on the date it exercises the renewal option.
IDB’s annual base rent for the ground floor is $317.08 PSF, which steps to $352.08 PSF, $392.08 PSF and $442.08 PSF every five years. IDB’s annual base rent for the 2nd, 8th, 9th and 10th floors is $51.08 PSF, which steps to $58.08 PSF, $65.08 PSF and $72.08 PSF every five years.
IDB is currently in a free rent period, with an anticipated rent commencement date of January 1, 2021 and an anticipated commencement date for payment of operating expenses and real estate taxes of January 1, 2022. All free rent, in the amount of $5,546,495, was fully reserved at loan closing. IDB is entitled to $15,906,051 for tenant improvements and leasing commissions, which amount was fully reserved at loan closing (see “Escrows and Reserves”).
Subject to certain conditions set forth in the lease, IDB has (i) a one-time right to terminate its entire leased space, effective as of December 31, 2035, with 21 months’ prior written notice, and (ii) the right to terminate the lease with respect to the ground floor only, effective (at IDB’s option) on either the fifth anniversary or the tenth anniversary of the rent commencement date, with 15 months’ prior written notice.
This is not a research report and was not prepared by any Underwriter’s research department. Please see additional important information and qualifications at the end of this Term Sheet.
70
| Office – CBD | Loan #4 | Cut-off Date Balance: | $75,000,000 | |
| 1114 Avenue of the Americas | Grace Building | Cut-off Date LTV: | 41.1% | |
| New York, NY 10036 | UW NCF DSCR: | 4.25x | ||
| UW NOI Debt Yield: | 11.8% |
Bain & Company, Inc. (121,262 SF, 7.8% of NRA, 9.2% of underwritten rent). Bain & Company, Inc. (“Bain”) is an American global management consulting firm headquartered in Boston, Massachusetts. The firm provides advisory services to many large businesses, non-profit organizations and governments. Bain has 59 offices in 37 countries and more than 12,000 employees. Bain leases a portion of the 41st floor and the entire 42nd, 43rd and 44th floors through February 28, 2030. Bain has two five-year renewal options, with 18 months’ prior written notice; provided that Bain is not in default and is physically occupying at least the lesser of (x) two full floors of the building and (y) 66.66% of its space. The lease does not provide any termination options.
Bain’s annual base rent for the 41st floor will be $133.00 PSF commencing on January 1, 2021, increasing to $143.00 PSF on January 1, 2026. The annual base rent for the 42nd through 44th floors is currently $99.50 PSF, increasing to $106.00 PSF on March 1, 2025. Bain is currently in a free rent period through December 2020. All free rent, in the amount of $284,554, was fully reserved at loan closing. Bain is entitled to $2,439,030 for tenant improvements related to its 41st floor expansion, which amount was fully reserved at loan closing (see “Escrows and Reserves”).
The following table presents certain information relating to the major tenants at the Grace Building Property:
| Tenant Summary(1) | |||||||||
| Tenant Name |
Credit Rating (Moody’s/S&P/ Fitch)(2) | Tenant SF | Approx. % of Total SF | Annual UW Rent(3) | % of Total Annual UW Rent | Annual UW Rent PSF | Lease Expiration | Renewal Options | Termination Option (Y/N) |
| Office Tenants | |||||||||
| Bank of America, N.A. | A2/A-/A+ | 155,270 | 10.0% | $12,642,238 | 9.0% | $81.42 | 5/31/2042 | (4) | N |
| The Trade Desk | NR/NR/NR | 154,558 | 9.9% | $20,245,024 | 14.4% | $130.99 | 8/31/2030 | 1x5 yr | Y(5) |
| Israel Discount Bank | NR/BBB+/NR | 142,533 | 9.2% | $7,727,200 | 5.5% | $54.21 | 12/31/2040 | 2x5 yr | Y(6) |
| Bain & Company, Inc. | NR/NR/NR | 121,262 | 7.8% | $12,925,648 | 9.2% | $106.59 | 2/28/2030 | 2x5 yr | N |
| Insight Venture Management LLC | NR/NR/NR | 93,998 | 6.0% | $9,652,225 | 6.9% | $102.69 | 2/28/2030 | 1x5 yr | N |
| Subtotal/Wtd. Avg. | 667,621 | 42.9% | $63,192,334 | 45.0% | $94.65 | ||||
| Other Office and Storage | 779,378 | 50.1% | $73,217,128 | 52.1% | $93.94 | ||||
| Retail | 29,338 | 1.9% | $4,041,048 | 2.9% | $137.74 | ||||
| Vacant Office and Storage | 79,096 | 5.1% | $0 | 0.0% | $0.00 | ||||
| Vacant Retail | 1,539 | 0.1% | $0 | 0.0% | $0.00 | ||||
| Total/Wtd. Avg. | 1,556,972 | 100.0% | $140,450,510 | 100.0% | $95.13(7) | ||||
| (1) | Information is based on the underwritten rent roll. |
| (2) | Certain ratings are those of the parent entity whether or not the parent entity guarantees the lease. |
| (3) | As of the loan origination date, Bank of America, N.A., The Trade Desk, Bain & Company, Inc. and Insight Venture Management LLC are entitled to a total of $12,022,739 of free rent, which was fully reserved by the lender. |
| (4) | BANA has the option to renew its term for up to four renewal terms for a maximum of 20 years, provided that BANA must occupy 100,000 SF in each of (i) the 5th, 6th and 7th floors and (ii) in the portion of the total premises (i.e. such floors plus the pavilion space) leased by it as to which BANA is exercising the renewal option. BANA is only permitted to exercise a renewal with respect to the pavilion premises if at least six full floors of office space under its lease at 1100 Avenue of the Americas is also simultaneously renewed. |
| (5) | The Trade Desk has the right to terminate the lease solely as to the 26th and 27th floors effective as of the last day of the month in which the 7th anniversary of the commencement date occurs and with the payment of a termination fee. |
| (6) | Israel Discount Bank has (i) a one-time right to terminate its entire leased space, effective as of December 31, 2035, with 21 months’ prior written notice, and (ii) the right to terminate the lease with respect to the ground floor only, effective (at IDB’s option) on either the fifth anniversary or the tenth anniversary of the rent commencement date, with fifteen months’ prior written notice. |
| (7) | Wtd. Avg. Annual UW Rent PSF excludes Vacant Space. |
This is not a research report and was not prepared by any Underwriter’s research department. Please see additional important information and qualifications at the end of this Term Sheet.
71
| Office – CBD | Loan #4 | Cut-off Date Balance: | $75,000,000 | |
| 1114 Avenue of the Americas | Grace Building | Cut-off Date LTV: | 41.1% | |
| New York, NY 10036 | UW NCF DSCR: | 4.25x | ||
| UW NOI Debt Yield: | 11.8% |
The following table presents certain information relating to the lease rollover schedule at the Grace Building Property:
| Lease Rollover Schedule(1)(2) | ||||||||
| Year | # of Leases Rolling | SF Rolling | UW Rent PSF Rolling | Approx. % of Total SF Rolling | Approx. Cumulative % of SF Rolling | Total UW Rent Rolling | Approx. % of Total Rent Rolling | Approx. Cumulative % of Total Rent Rolling |
| 2020 | 0 | 0 | $0.00 | 0.0% | 0.0% | $0 | 0.0% | 0.0% |
| 2021 | 1 | 5,497 | $75.00 | 0.4% | 0.4% | $412,275 | 0.3% | 0.3% |
| 2022 | 1 | 600 | $0.00 | 0.0% | 0.4% | $0 | 0.0% | 0.3% |
| 2023 | 5 | 55,694 | $71.66 | 3.6% | 4.0% | $3,991,172 | 2.8% | 3.1% |
| 2024 | 10 | 143,459 | $99.34 | 9.2% | 13.2% | $14,251,502 | 10.1% | 13.3% |
| 2025 | 3 | 31,907 | $118.01 | 2.0% | 15.2% | $3,765,480 | 2.7% | 16.0% |
| 2026 | 9 | 121,137 | $102.21 | 7.8% | 23.0% | $12,381,404 | 8.8% | 24.8% |
| 2027 | 3 | 47,753 | $85.66 | 3.1% | 26.1% | $4,090,693 | 2.9% | 27.7% |
| 2028 | 4 | 97,651 | $81.05 | 6.3% | 32.4% | $7,914,676 | 5.6% | 33.3% |
| 2029 | 3 | 21,740 | $101.28 | 1.4% | 33.7% | $2,201,776 | 1.6% | 34.9% |
| 2030 | 24 | 459,310 | $113.21 | 29.5% | 63.2% | $51,997,764 | 37.0% | 71.9% |
| 2031 & Beyond | 25 | 491,589 | $80.24 | 31.6% | 94.8% | $39,443,769 | 28.1% | 100.0% |
| Vacant | 0 | 80,635 | $0.00 | 5.2% | 100.0% | $0 | 0.0% | 100.0% |
| Total/Wtd. Avg. | 88 | 1,556,972 | $95.13(3) | 100.0% | $140,450,510 | 100.0% | ||
| (1) | Information based on the underwritten rent roll. |
| (2) | Certain tenants may have lease termination options that were not taken into account in the Lease Rollover Schedule. |
| (3) | Wtd. Avg. UW Rent PSF Rolling excludes Vacant Space. |
COVID-19 Update. The first debt service payment on the Grace Building Whole Loan is due in January 2021 and, as of November 17, 2020, the Grace Building Whole Loan is not subject to any forbearance, modification or debt service relief request. The Grace Building Property is open and operating, with 98.0% of tenants by occupied NRA and 97.1% of tenants by underwritten base rent having paid their full October 2020 rent payments. Four retail tenants (2.0% of NRA, 2.9% of underwritten rent) have not made rent payments for the last few months. The Grace Building Borrower is in the process of negotiating rent deferrals with such retail tenants, with full rental payments anticipated to commence in late 2021 or early 2022. The parking tenant has not paid the required monthly rental payments since March 2020 and an event of default is continuing under its lease. The Grace Building Borrower is in the process of replacing the current parking operator and plans to employ a new operator under a management agreement. The Grace Building Borrower deposited with the lender $1,608,940 for anticipated parking rent shortfalls (see “Escrows and Reserves”).
The Market. The Grace Building Property is located on the north side of Bryant Park at the corner of 42nd Street and 6th Avenue in the Sixth Avenue/Rockefeller Center submarket of the Midtown Manhattan office market. The Grace Building Property offers commuters access to multiple major mass transit stations in Manhattan, connecting to points across the tristate area. The 1-2-3, N-R-Q-W, 7 and B-D-F-M subway lines all stop within a block of the Grace Building Property, providing access to commuters coming from Penn Station, the Upper West Side, and Queens. The S subway line provides a quick cross-town connection to Grand Central Station and the 4, 5, 6 subway line. Additionally, The Grace Building Property is three blocks from the Port Authority Bus terminal at 8th Avenue and 42nd Street.
The Sixth Avenue/Rockefeller Center area has recently experienced the signing of sizable new leases. Per a third-party market research report, in the second quarter of 2020, a large technology company signed a 232,000-SF lease at 151 West 42nd Street that was the largest new lease signed in the quarter. Other recent lease executions include Colliers relocating to the Grace Building Property for approximately 59,000 SF and TripleMint leasing 31,000 SF at 1500 Broadway. Following a wave of move-outs earlier in the annual cycle, relocations into the Sixth Avenue/Rockefeller Center submarket have pushed vacancies downward in recent years to around 4.4% at the end of the second quarter of 2020.
According to the appraisal, as of the second quarter of 2020, the Sixth Avenue/Rockefeller Center Class A office submarket had a vacancy rate of 4.4% and market rents of $87.02 PSF. The average in-place office rent at the Grace Building Property is currently approximately $94 PSF.
The following table presents certain information relating to the appraisal’s market rent conclusion for the Grace Building Property:
| Market Rent Summary | ||||||
| Office Floor 2-12 | Office Floor 14-19 | Office Floor 20-25 | Office Floor 26-37 | Office Floor 38-41 | Office Floor 42-48 | |
| Market Rent (PSF) | $85.00 | $90.00 | $100.00 | $115.00 | $125.00 | $140.00 |
| Lease Term (Years) | 15 | 15 | 15 | 15 | 15 | 15 |
| Rent Concession (New/Renewal) (Months) | 14 / 7 | 14 / 7 | 14 / 7 | 14 / 7 | 14 / 7 | 14 / 7 |
| Rent Increase Projection | $10.00 PSF every 5 years | $10.00 PSF every 5 years | $10.00 PSF every 5 years | $10.00 PSF every 5 years | $10.00 PSF every 5 years | $10.00 PSF every 5 years |
This is not a research report and was not prepared by any Underwriter’s research department. Please see additional important information and qualifications at the end of this Term Sheet.
72
| Office – CBD | Loan #4 | Cut-off Date Balance: | $75,000,000 | |
| 1114 Avenue of the Americas | Grace Building | Cut-off Date LTV: | 41.1% | |
| New York, NY 10036 | UW NCF DSCR: | 4.25x | ||
| UW NOI Debt Yield: | 11.8% |
The following table presents Class A office buildings which are direct competitors to the Grace Building Property:
| Comparable Office Properties | ||||||
| Property Name/Location | Construction Status | Occupancy | Size | Year Built/Completed | Office Rents Asking | Office Rents Taking |
Grace Building Property(1) New York, NY | Completed | 94.8% | 1,556,972 | 1974 / 2014 | $95.13 | N/A |
One Bryant Park New York, NY | Completed | 100.0% | 2,354,000 | 2009 | N/A | N/A |
Three Bryant Park New York, NY | Completed | 96.8% | 1,484,325 | 1972 / 2008 | $95.00 | $115.00 |
Seven Bryant Park New York, NY | Completed | 97.9% | 473,672 | 2015 | $120.00 | $150.00 |
| 1100 Avenue of the Americas New York, NY | Under Construction | 90.4% | 373,016 | 1906 / 2021 | N/A | N/A |
660 Fifth Avenue New York, NY | Under Construction | 66.0% | 1,436,839 | 1958 / 2021 | $90.00 | $150.00 |
1 Vanderbilt New York, NY | Completed | 65.0% | 1,732,955 | 2020 | $125.00 | $200.00 |
1 Manhattan West New York, NY | Completed | 86.0% | 2,100,000 | 2019 | $115.00 | $135.00 |
2 Manhattan West New York, NY | Under Construction | 25.3% | 1,900,000 | 2022 | $90.00 | $150.00 |
50 Hudson Yards New York, NY | Under Construction | 30.0% | 2,900,000 | 2022 | $110.00 | $200.00 |
55 Hudson Yards New York, NY | Completed | 98.0% | 1,434,038 | 2019 | $105.00 | $135.00 |
4 Times Square New York, NY | Completed | 94.1% | 1,800,000 | 1999 / 2018 | $80.00 | $100.00 |
Source: Appraisal.
| (1) | Information obtained from the underwritten rent roll. |
The following table presents comparable office sales to the Grace Building Property:
| Comparable Sales Summary | ||||||
| Property Name/Location | Rentable Area | Occupancy | Sale Date | Price | Price PSF | Cap Rate |
Grace Building Property(1) New York, NY | 1,556,972 | 95% | N/A | N/A | N/A | N/A |
One Madison Avenue New York, NY | 1,392,565 | 0% | Contract | $2,300,000,000 | $1,652 | 4.30% |
1633 Broadway New York, NY | 2,561,512 | 98% | May-20 | $2,400,000,000 | $937 | 4.38% |
330 Madison Avenue New York, NY | 854,664 | 96% | Feb-20 | $900,000,000 | $1,053 | 4.67% |
55 Hudson Yards New York, NY | 1,431,155 | 94% | Jan-20 | $2,500,000,000 | $1,747 | 4.16% |
150 East 42nd Street New York, NY | 1,698,603 | 97% | Oct-19 | $1,300,000,000 | $765 | 4.05% |
30 Hudson Yards New York, NY | 1,463,234 | 100% | Apr-19 | $2,155,000,000 | $1,473 | 4.96% |
640 Fifth Avenue New York, NY | 315,886 | 100% | Apr-19 | $975,000,000 | $3,087 | 4.68% |
3 Columbus Circle New York, NY | 753,405 | 100% | Nov-18 | $1,035,000,000 | $1,374 | 3.98% |
Source: Appraisal.
| (1) | Information obtained from the underwritten rent roll. |
This is not a research report and was not prepared by any Underwriter’s research department. Please see additional important information and qualifications at the end of this Term Sheet.
73
| Office – CBD | Loan #4 | Cut-off Date Balance: | $75,000,000 | |
| 1114 Avenue of the Americas | Grace Building | Cut-off Date LTV: | 41.1% | |
| New York, NY 10036 | UW NCF DSCR: | 4.25x | ||
| UW NOI Debt Yield: | 11.8% |
Operating History and Underwritten Net Cash Flow. The following table presents certain information relating to the historical operating performance and Underwritten Net Cash Flow at the Grace Building Property:
| Cash Flow Analysis(1) | |||||||||||||
| 2017 | 2018 | 2019 | 9/30/2020 TTM | UW | UW PSF | ||||||||
| Base Rental Income(2) | $99,833,553 | $107,014,493 | $91,119,452 | $87,976,996 | $140,450,510 | $90.21 | |||||||
| Expense Reimbursements | $10,212,232 | $12,529,407 | $8,566,979 | $6,267,900 | $12,766,325 | $8.20 | |||||||
| Straight-Lined Rent(3) | $0 | $0 | $0 | $0 | $1,439,207 | $0.92 | |||||||
| Vacancy(4) | $0 | $0 | $0 | $0 | $7,464,675 | $4.79 | |||||||
| Gross Potential Income | $110,045,785 | $119,543,900 | $99,686,431 | $94,244,896 | $162,120,717 | $104.13 | |||||||
| Other Income(5) | $3,209,878 | $3,195,652 | $3,230,812 | $2,759,133 | $2,956,947 | $1.90 | |||||||
| Vacancy(4) | $0 | $0 | $0 | $0 | ($7,464,675) | ($4.79) | |||||||
| Effective Gross Income | $113,255,664 | $122,739,552 | $102,917,243 | $97,004,029 | $157,612,989 | $101.23 | |||||||
| Taxes | $25,496,191 | $27,159,739 | $29,139,042 | $30,649,698 | $31,927,579 | $20.51 | |||||||
| Insurance | $1,019,973 | $1,226,645 | $1,134,711 | $1,220,279 | $1,455,626 | $0.93 | |||||||
| Other Operating Expenses | $19,579,826 | $21,146,504 | $20,105,297 | $18,861,512 | $19,936,067 | $12.80 | |||||||
| Total Operating Expenses | $46,095,990 | $49,532,888 | $50,379,050 | $50,731,490 | $53,319,272 | $34.25 | |||||||
| Net Operating Income | $67,159,674 | $73,206,665 | $52,538,193 | $46,272,539 | $104,293,717 | $66.98 | |||||||
| TI/LC | $0 | $0 | $0 | $0 | $1,556,972 | $1.00 | |||||||
| Capital Expenditures | $0 | $0 | $0 | $0 | $389,243 | $0.25 | |||||||
| Net Cash Flow | $67,159,674 | $73,206,665 | $52,538,193 | $46,272,539 | $102,347,502 | $65.73 | |||||||
| Occupancy% | 94.7% | 97.6% | 91.0% | 94.8%(6) | 95.4% | ||||||||
| NOI DSCR (7) | 2.79x | 3.04x | 2.18x | 1.92x | 4.33x | ||||||||
| NCF DSCR(7) | 2.79x | 3.04x | 2.18x | 1.92x | 4.25x | ||||||||
| NOI Debt Yield(7) | 7.6% | 8.3% | 5.9% | 5.2% | 11.8% | ||||||||
| NCF Debt Yield(7) | 7.6% | 8.3% | 5.9% | 5.2% | 11.6% | ||||||||
| (1) | The recent volatility in cash flow at the Grace Building Property is a result of the replacement of some larger legacy tenants (including 4 of the 5 largest tenants) between 2016 and 2018 and the signing of new and renewal leases with respect to 950,000 SF of space. The cash flow declines in 2019 and 9/30/2020 TTM and the projected increase in UW cash flows are the result of this rollover and the rent abatements associated with the new leases. All outstanding landlord obligations ($56,172,399) and rent abatements ($25,964,570) have been reserved at loan closing. |
| (2) | UW Base Rental Income includes contractual rent steps of $4,566,719 underwritten for various tenants through December 31, 2021. |
| (3) | Represents the straight line credit for investment grade tenants and tenants identified by a legal industry publication as among the 100 largest law firms through the lesser of the lease or loan term. |
| (4) | UW Vacancy represents an underwritten economic vacancy of 4.6%. The Grace Building Property is 94.8% occupied as of October 19, 2020. |
| (5) | Other Income consists of directly billed utilities and $1,608,941 of parking income. 1114 Sixth Parking LLC is the current tenant under a parking garage lease. The tenant has not paid the required monthly rental payments for several months and an event of default is continuing under its lease. The Grace Building Borrower is actively pursuing the termination of the lease and replacement arrangement with a new parking manager. At loan closing, the Grace Building Borrower deposited with the lender $1,608,940 for anticipated parking rent shortfalls. |
| (6) | Based on underwritten rent roll dated October 19, 2020. |
| (7) | Debt service coverage ratios and debt yields are based on the Grace Building Senior Loan and exclude the Grace Building Subordinate Companion Loan. |
Escrows and Reserves.
Real Estate Taxes – During a Trigger Period (as defined below), the Grace Building Borrower is required to deposit monthly 1/12 of the annual estimated real estate taxes.
Insurance – During a Trigger Period, the Grace Building Borrower is required to deposit monthly 1/12 of the annual estimated insurance premiums (unless the Grace Building Property is covered by a blanket policy).
Replacement Reserves – During a Trigger Period, the Grace Building Borrower is required to deposit monthly $25,950 ($0.20 PSF per annum) for capital expenditures.
TI/LC Reserves – The Grace Building Borrower deposited with the lender $56,172,399 for outstanding landlord tenant improvement and leasing commission obligations due to various tenants. During a Trigger Period, the Grace Building Borrower is required to deposit monthly $194,622 ($1.50 PSF per annum) for tenant improvements and leasing commissions.
Free Rent Reserve - The Grace Building Borrower deposited with the lender $25,964,570 for free rent owed to various tenants through June 2022 to be applied on each monthly payment date to simulate the payment of tenant rent.
Lobby/Elevator Work Reserve - The Grace Building Borrower deposited with the lender $5,970,240 for certain construction and improvement work related to the lobby and elevator cabs and systems.
Parking Rent Shortfall Reserve - The Grace Building Borrower deposited with the lender $1,608,940 for anticipated parking rent shortfalls from the loan origination date through November 2021, 1/12th of which reserve will be deposited into the lockbox account on each monthly payment for such period.
This is not a research report and was not prepared by any Underwriter’s research department. Please see additional important information and qualifications at the end of this Term Sheet.
74
| Office – CBD | Loan #4 | Cut-off Date Balance: | $75,000,000 | |
| 1114 Avenue of the Americas | Grace Building | Cut-off Date LTV: | 41.1% | |
| New York, NY 10036 | UW NCF DSCR: | 4.25x | ||
| UW NOI Debt Yield: | 11.8% |
A “Trigger Period” will exist:
| (i) | beginning upon the occurrence of an event of default under the Grace Building Whole Loan or, if a mezzanine loan is then outstanding under such mezzanine loan, and ending when the event of default has been cured; or |
| (ii) | beginning when the debt yield (including any mezzanine loan) (tested each fiscal quarter) is less than 6.00% for any two consecutive fiscal quarters, and ending when (x) the debt yield (including any mezzanine loan) (tested each fiscal quarter) is at least 6.00% for any two consecutive fiscal quarters or (y) the Grace Building Borrower has delivered cash or a letter of credit (the “Low Cash Flow Period Threshold Collateral”) in an amount which, when applied to the outstanding principal balance of the Grace Building Whole Loan (plus any mezzanine loan) would be sufficient to meet the debt yield requirement of 6.00%. |
Lockbox and Cash Management. The Grace Building Whole Loan is structured with a hard lockbox and springing cash management. Revenues from the Grace Building Property are required to be deposited into the lockbox account directly by the tenants and any funds received by the Grace Building Borrower and property manager within five business days of receipt. If no Trigger Period exists, funds in the lockbox account will be disbursed to the Grace Building Borrower. During a Trigger Period, funds in the lockbox account are required to be swept on each business day to the lender-controlled cash management account and disbursed according to the Grace Building Whole Loan documents, with excess cash held by the lender for so long as such Trigger Period continues, other than for disbursements to the Grace Building Borrower for (unless already paid) debt service due under the Grace Building Whole Loan or any mezzanine loan, shortfalls in the required reserve accounts, deposit of the Low Cash Flow Period Threshold Collateral, emergency and life safety expenses, approved operating expenses, and disbursements to the Grace Building Borrower to be distributed to its equity holders in an amount sufficient to satisfy the distribution requirements applicable to REITs.
Additional Secured Indebtedness (not including trade debts). The Grace Building Property also secures the Grace Building Non-Serviced Pari Passu Companion Loans, which have an aggregate Cut-off Date principal balance of $808,000,000 and the Grace Building Subordinate Companion Loan, which has an aggregate Cut-off Date principal balance of $367,000,000. The Grace Building Non-Serviced Pari Passu Companion Loans and the Grace Building Subordinate Companion Loan accrue interest at the same rate as the Grace Building Mortgage Loan. The Grace Building Mortgage Loan and the Grace Building Non-Serviced Pari Passu Companion Loans are each pari passu in right of payment and together are senior in right of payment to the Grace Building Subordinate Companion Loan. The holders of the Grace Building Mortgage Loan, the Grace Building Non-Serviced Pari Passu Companion Loans and the Grace Building Subordinate Companion Loan have entered into a co-lender agreement which sets forth the allocation of collections on the Grace Building Whole Loan. See “Description of the Mortgage Pool—The Whole Loans—The Grace Building Pari Passu-A/B Whole Loan”.
| Subordinate Note Summary | |||||||||
| B-Note Original Principal Balance | B-Note Interest Rate | Original Term (mos.) | Original Amort. Term (mos.) | Original IO Term (mos.) | Whole Loan UW NCF DSCR | Whole Loan UW NOI Debt Yield | Whole Loan Cut-off Date LTV | ||
| Grace Building Subordinate Companion Loan | $367,000,000 | 2.6921% | 121 | 0 | 121 | 3.00x | 8.3% | 58.1% | |
Mezzanine Loan and Preferred Equity. An affiliate of the Grace Building Borrower is permitted to incur future mezzanine debt (secured by a pledge of direct equity interests in the Grace Building Borrower), provided that among other conditions: (i) no event of default is continuing; (ii) the principal amount of the mezzanine loan may not exceed an amount which, when combined with the Grace Building Whole Loan, results in (a) a loan-to-value ratio greater than 58.14% or (b) a debt yield less than 8.35%; (iii) the mezzanine loan is co-terminous with the Grace Building Whole Loan or is freely prepayable after the maturity date of the Grace Building Whole Loan; (iv) the mezzanine loan is interest-only; (v) an intercreditor agreement is executed that is acceptable to the lender and the rating agencies; and (vi) a rating agency confirmation is delivered by each rating agency rating securities backed by the Grace Building Whole Loan.
Release of Property. Not permitted.
Right of First Offer/Right of First Refusal. None.
Ground Lease. None.
Letter of Credit. None.
Terrorism Insurance. The Grace Building Borrower is required to obtain and maintain “all risk” property insurance that covers perils of terrorism and acts of terrorism in an amount equal to the full replacement cost of the Grace Building Property and business interruption insurance for 36 months (24 months for terrorism) with a 12-month extended period of indemnity; provided that if the Terrorism Risk Insurance Program Reauthorization Act is no longer in effect, the Grace Building Borrower will not be obligated to pay annual insurance premiums for terrorism coverage in excess of two times the insurance premiums that would be payable under policies then obtained for all risk and business interruption insurance (excluding the terrorism and earthquake components of such property and business income insurance). See “Risk Factors—Risks Relating to the Mortgage Loans—Terrorism Insurance May Not Be Available for All Mortgaged Properties” in the Preliminary Prospectus.
This is not a research report and was not prepared by any Underwriter’s research department. Please see additional important information and qualifications at the end of this Term Sheet.
75
| Retail – Single Tenant | Loan #5 | Cut-off Date Balance: | $54,200,000 | |
| Property Addresses – Various | ExchangeRight Net Leased Portfolio #40 | Cut-off Date LTV: | 61.3% | |
| UW NCF DSCR: | 2.44x | |||
| UW NOI Debt Yield: | 8.8% |

This is not a research report and was not prepared by any Underwriter’s research department. Please see additional important information and qualifications at the end of this Term Sheet.
76
| Retail – Single Tenant | Loan #5 | Cut-off Date Balance: | $54,200,000 | |
| Property Addresses – Various | ExchangeRight Net Leased Portfolio #40 | Cut-off Date LTV: | 61.3% | |
| UW NCF DSCR: | 2.44x | |||
| UW NOI Debt Yield: | 8.8% |
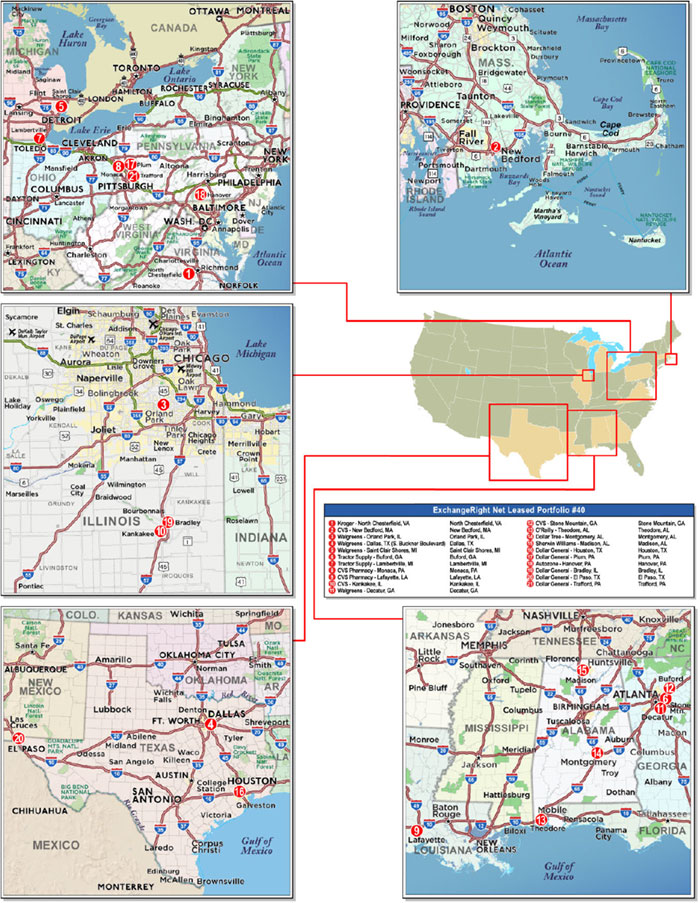
This is not a research report and was not prepared by any Underwriter’s research department. Please see additional important information and qualifications at the end of this Term Sheet.
77
| Mortgage Loan No. 5 – ExchangeRight Net Leased Portfolio #40 |
| Mortgage Loan Information | Property Information | ||||||
| Mortgage Loan Seller: | MSMCH | Single Asset/Portfolio: | Portfolio | ||||
| Credit Assessment (DBRSM/Fitch/Moody’s): | NR/NR/NR | Location(1): | Various | ||||
| Original Balance: | $54,200,000 | General Property Type: | Retail | ||||
| Cut-off Date Balance: | $54,200,000 | Detailed Property Type: | Single Tenant | ||||
| % of Initial Pool Balance: | 6.2% | Title Vesting: | Fee | ||||
| Loan Purpose: | Acquisition | Year Built/Renovated(1): | Various / Various | ||||
| Borrower Sponsor: | ExchangeRight Real Estate, LLC | Size: | 349,816 SF | ||||
| Guarantors: | Warren Thomas; David Fisher; Joshua | Cut-off Date Balance Per SF: | $155 | ||||
| Ungerecht; ExchangeRight Real Estate, | Maturity Date Balance Per SF: | $155 | |||||
| LLC | Property Manager: | NLP Management, LLC | |||||
| Mortgage Rate: | 3.4512% | ||||||
| Note Date: | 10/19/2020 | Underwriting and Financial Information(2) | |||||
| First Payment Date: | 12/1/2020 | UW NOI: | $4,780,784 | ||||
| Maturity Date: | 11/1/2030 | UW NOI Debt Yield: | 8.8% | ||||
| Original Term to Maturity: | 120 months | UW NOI Debt Yield at Maturity: | 8.8% | ||||
| Original Amortization Term: | 0 months | UW NCF DSCR: | 2.44x | ||||
| IO Period: | 120 months | Most Recent NOI(4): | N/A | ||||
| Seasoning: | 0 months | 2nd Most Recent NOI(4): | N/A | ||||
| Prepayment Provisions: | LO (24); DEF (92); O (4) | 3rd Most Recent NOI(4): | N/A | ||||
| Lockbox/Cash Mgmt Status: | Hard/Springing | Most Recent Occupancy: | 100.0% (11/1/2020) | ||||
| Additional Debt Type: | No | 2nd Most Recent Occupancy(4): | N/A | ||||
| Additional Debt Balance: | N/A | 3rd Most Recent Occupancy(4): | N/A | ||||
| Future Debt Permitted (Type): | No (N/A) | Appraised Value (as of)(5): | $88,466,000 (Various) | ||||
| Reserves(3) | Appraised Value per SF: | $253 | |||||
| Type | Initial | Monthly | Cap | Cut-off Date LTV Ratio: | 61.3% | ||
| RE Tax: | $273,729 | Springing | N/A | Maturity Date LTV Ratio: | 61.3% | ||
| Insurance: | $0 | Springing | N/A | ||||
| Capital Expenditures: | $0 | $2,804 | N/A | ||||
| Deferred Maintenance: | $188,269 | $0 | N/A | ||||
| TI/LC: | $500,000 | Springing | N/A | ||||
| Sources and Uses | ||||||
| Sources | Proceeds | % of Total | Uses | Proceeds | % of Total | |
| Loan Amount: | $54,200,000 | 60.5% | Purchase Price: | $87,426,109 | 97.6% | |
| Borrower Equity: | $35,387,653 | 39.5% | Closing Costs: | $1,199,546 | 1.3% | |
| Reserves: | $961,998 | 1.1% | ||||
| Total Sources: | $89,587,653 | 100.0% | Total Uses: | $89,587,653 | 100.0% | |
| (1) | See “The Properties” section below. |
| (2) | The novel coronavirus pandemic is an evolving situation and could impact the ExchangeRight Net Leased Portfolio #40 Mortgage Loan (as defined below) more severely than assumed in the underwriting of the ExchangeRight Net Leased Portfolio #40 Mortgage Loan and could adversely affect the NOI, NCF and occupancy information, as well as the appraised value and the DSCR, LTV and Debt Yield metrics presented above and herein. See “Risk Factors-—Risks Related to Market Conditions and Other External Factors—The Coronavirus Pandemic Has Adversely Affected the Global Economy and Will Likely Adversely Affect the Performance of the Mortgage Loans” in the Preliminary Prospectus. |
| (3) | See “Escrows and Reserves” section below. |
| (4) | Historical occupancy and NOI are unavailable because the ExchangeRight Properties (as defined below) were acquired by the borrower between March 17, 2020 and October 16, 2020. |
| (5) | The appraisals are as of September 7, 2020 and September 20, 2020. |
The Mortgage Loan. The fifth largest mortgage loan (the “ExchangeRight Net Leased Portfolio #40 Mortgage Loan”) is evidenced by a promissory note in the original principal amount of $54,200,000 and secured by the fee interests in 21 net leased, single-tenant retail properties located in nine states (the “ExchangeRight Properties”).
The Borrower and the Borrower Sponsor. The borrower for the ExchangeRight Net Leased Portfolio #40 Mortgage Loan is ExchangeRight Net Leased Portfolio 40 DST (the “ExchangeRight Net Leased Portfolio #40 Borrower”), a Delaware statutory trust. The borrower sponsor is ExchangeRight Real Estate, LLC. ExchangeRight Real Estate, LLC has more than 13 million SF of commercial properties under management. ExchangeRight Real Estate, LLC owns more than 700 investment-grade retail and Class B multifamily properties located in 38 states. ExchangeRight Real Estate, LLC and its three owners, David Fisher, Joshua Ungerecht and Warren Thomas (collectively, the “Individual Guarantors”), are the guarantors of certain non-recourse carveout liabilities under the ExchangeRight Net Leased Portfolio #40 Mortgage Loan. The guarantors of the ExchangeRight Net Leased Portfolio #40 Mortgage Loan are also the guarantors of the mortgage loan identified on Annex A-1 to the Preliminary Prospectus as ExchangeRight Net Leased Portfolio #39.
The ExchangeRight Net Leased Portfolio #40 Borrower has master leased the ExchangeRight Properties to a master tenant (the “ExchangeRight Net Leased Portfolio #40 Master Tenant”) owned by ExchangeRight Real Estate, LLC, which is in turn owned by the Individual Guarantors. The ExchangeRight
This is not a research report and was not prepared by any Underwriter’s research department. Please see additional important information and qualifications at the end of this Term Sheet.
78
| Retail – Single Tenant | Loan #5 | Cut-off Date Balance: | $54,200,000 | |
| Property Addresses – Various | ExchangeRight Net Leased Portfolio #40 | Cut-off Date LTV: | 61.3% | |
| UW NCF DSCR: | 2.44x | |||
| UW NOI Debt Yield: | 8.8% |
Net Leased Portfolio #40 Master Tenant is a Delaware limited liability company structured to be bankruptcy-remote, with one independent director. The master lease generally imposes responsibility on the ExchangeRight Net Leased Portfolio #40 Master Tenant for the operation, maintenance and management of the ExchangeRight Properties and payment of all expenses incurred in the maintenance and repair of the Exchange Right Properties, other than capital expenses. The ExchangeRight Net Leased Portfolio #40 Master Tenant’s interest in all tenant rents was assigned to the ExchangeRight Net Leased Portfolio #40 Borrower, which in turn collaterally assigned its interest to the lender. The master lease is subordinate to the ExchangeRight Net Leased Portfolio #40 Mortgage Loan and, upon an event of default under the ExchangeRight Net Leased Portfolio #40 Mortgage Loan, the lender has the right to cause the ExchangeRight Net Leased Portfolio #40 Borrower to terminate the master lease. A default under the master lease is an event of default under the ExchangeRight Net Leased Portfolio #40 Mortgage Loan and gives rise to recourse liability to the non-recourse carveout guarantors for losses, unless such default arises solely in connection with the failure of the ExchangeRight Net Leased Portfolio #40 Master Tenant to pay rent as a result of the ExchangeRight Properties not generating sufficient cash flow for the payment of such rent.
The lender has the right to require the ExchangeRight Net Leased Portfolio #40 Borrower to convert from a Delaware statutory trust to a limited liability company upon (i) an event of default or the lender’s good faith determination of imminent default under the ExchangeRight Net Leased Portfolio #40 Mortgage Loan, (ii) the lender’s good faith determination that the ExchangeRight Net Leased Portfolio #40 Borrower will be unable to make a material decision or take a material action required in connection with the operation and maintenance of any ExchangeRight Property, and (iii) 90 days prior to the maturity date of the ExchangeRight Net Leased Portfolio #40 Mortgage Loan, if an executed commitment from an institutional lender to refinance the ExchangeRight Net Leased Portfolio #40 Mortgage Loan is not delivered to the lender.
At any time after October 19, 2021, the borrower sponsor has the right to effect a one-time transfer of all (but not less than all) of the outstanding ownership interests in the ExchangeRight Net Leased Portfolio #40 Borrower to an Approved Transferee (as defined below) and to replace the non-recourse carveout guarantors as the person who controls the ExchangeRight Net Leased Portfolio #40 Borrower with such Approved Transferee; provided that certain conditions are satisfied, including among others: (i) no event of default is continuing, (ii) the Approved Transferee owns 100% of the beneficial ownership interests in, and controls, the ExchangeRight Net Leased Portfolio #40 Borrower and ExchangeRight Net Leased Portfolio #40 Master Tenant, (iii) the Approved Transferee executes a full payment guarantee and indemnity pursuant to which it agrees to be liable (from and after the transfer) for all indemnity obligations (including environmental liabilities and obligations) for which the existing non-recourse carveout guarantors are liable under the non-recourse carveout guaranty, (iv) the delivery of a REMIC opinion, a non-consolidation opinion and other opinions required by the lender and (v) the receipt of confirmation from each rating agency that such transfer and guarantor replacement will not result in a downgrade of the respective ratings assigned to the BANK 2020-BNK29 certificates (such a transfer and replacement, a “Qualified Transfer”). A Cash Management Period (as defined below) will be triggered if a Qualified Transfer does not occur by November 1, 2027 (36 months prior to the maturity date of the ExchangeRight Net Leased Portfolio #40 Mortgage Loan). See “Lockbox and Cash Management” below.
“Approved Transferee” means (A) a depository institution that satisfies certain ratings criteria and is wholly-owned and controlled by a bank, savings and loan association, investment bank, insurance company, trust company, real estate investment trust, commercial credit corporation, pension plan, pension fund or pension advisory firm, mutual fund, government entity or plan or institution similar to any of the foregoing or (B) any person that (1)(i) has never been indicted or convicted of, or pled guilty or no contest to a felony, (ii) has never been indicted or convicted of, or pled guilty or no contest to a Patriot Act offense and is not on any government watch list, (iii) has never been the subject of a voluntary or involuntary (to the extent the same has not been discharged) bankruptcy proceeding, (iv) has no material outstanding judgments, litigations or regulatory actions against it or its interests and (v) is not crowdfunded, (2) is regularly engaged in the business of owning or operating commercial properties, or interests therein, which are similar to the ExchangeRight Properties, (3) owns interests in, or operates, at least five retail properties with a minimum of 750,000 SF in the aggregate, (4) satisfies certain net worth or ratings criteria and (5) causes a conversion of the ExchangeRight Net Leased Portfolio #40 Borrower into a Delaware limited liability company.
The Properties. The ExchangeRight Properties are comprised of 21 single-tenant retail properties totaling 349,816 SF and located across nine states. The ExchangeRight Properties are located in Virginia (one property, 34.2% of NRA and 15.9% of underwritten rent), Georgia (three properties, 12.7% of NRA and 14.3% of underwritten rent), Pennsylvania (four properties, 10.5% of NRA and 10.7% of underwritten rent), Illinois (three properties, 9.7% of NRA and 15.0% of underwritten rent) and Michigan (two properties, 9.7% of NRA and 12.7% of underwritten rent), with the eight remaining ExchangeRight Properties located in Texas, Alabama, Massachusetts and Louisiana. Built between 1996 and 2020, with 10 of the 21 properties built between 2017 and 2020 (inclusive), the ExchangeRight Properties range in size from 5,000 SF to 119,473 SF.
The ExchangeRight Properties are leased to the following nine nationally recognized tenants operating in diverse retail segments: Walgreens, CVS, Kroger, Tractor Supply, Dollar General, Dollar Tree, O’Reilly, Sherwin Williams and Autozone. Eight of the nine tenants are subsidiaries of investment grade-rated entities (19 properties, 89.1% of NRA and 88.3% of underwritten base rent). The ExchangeRight Properties have a weighted average remaining lease term of approximately 13.8 years. Leases representing 86.8% of NRA and 81.0% of the underwritten base rent expire after the maturity date of the ExchangeRight Net Leased Portfolio #40 Mortgage Loan. For the purposes of the preceding two sentences, the Walgreens leases, which grant early termination rights to Walgreens, were assumed to expire on the date when the earliest termination right under the lease, if exercised, would be effective.
This is not a research report and was not prepared by any Underwriter’s research department. Please see additional important information and qualifications at the end of this Term Sheet.
79
| Retail – Single Tenant | Loan #5 | Cut-off Date Balance: | $54,200,000 | |
| Property Addresses – Various | ExchangeRight Net Leased Portfolio #40 | Cut-off Date LTV: | 61.3% | |
| UW NCF DSCR: | 2.44x | |||
| UW NOI Debt Yield: | 8.8% |
The following table presents certain information relating to the ExchangeRight Properties, which are presented in descending order of their Appraised Values.
| ExchangeRight Properties Summary | ||||||||||
Tenant Name City, State | Year Built/ Renovated | Tenant NRSF | %of Portfolio NRSF | Lease Expiration Date(1) | Appraised Value | % of Portfolio Appraised Value | Annual UW Base Rent | Annual UW Base Rent PSF | % of Annual UW Base Rent | Renewal Options(2) |
Kroger North Chesterfield, VA | 2012 / N/A | 119,473 | 34.2% | 9/30/2035 | $14,400,000 | 16.3% | $826,633 | $6.92 | 15.9% | None |
CVS New Bedford, MA | 2008 / N/A | 12,900 | 3.7% | 1/1/2041 | $7,900,000 | 8.9% | $412,630 | $31.99 | 8.0% | 5, 5-years |
Walgreens Orland Park, IL | 2001 / N/A | 15,120 | 4.3% | 9/30/2032 | $7,100,000 | 8.0% | $425,000 | $28.11 | 8.2% | None |
Walgreens Dallas, TX | 1998 / N/A | 15,120 | 4.3% | 7/31/2030 | $6,450,000 | 7.3% | $391,263 | $25.88 | 7.5% | None |
Walgreens Saint Clair Shores, MI | 2005 / N/A | 14,820 | 4.2% | 9/30/2030 | $5,620,000 | 6.4% | $365,000 | $24.63 | 7.0% | None |
Tractor Supply Buford, GA | 2020 / N/A | 19,097 | 5.5% | 8/31/2035 | $5,175,000 | 5.8% | $310,000 | $16.23 | 6.0% | 4, 5-years |
Tractor Supply Lambertville, MI | 2020 / N/A | 19,100 | 5.5% | 9/1/2035 | $4,960,000 | 5.6% | $295,000 | $15.45 | 5.7% | 4, 5-years |
CVS Monaca, PA | 2007 / N/A | 11,945 | 3.4% | 1/31/2033 | $4,675,000 | 5.3% | $268,404 | $22.47 | 5.2% | 10, 5-years |
CVS Lafayette, LA | 2006 / N/A | 11,945 | 3.4% | 1/31/2033 | $4,670,000 | 5.3% | $268,643 | $22.49 | 5.2% | 5, 5-years |
CVS Kankakee, IL | 1999 / N/A | 9,882 | 2.8% | 9/30/2039 | $4,600,000 | 5.2% | $254,100 | $25.71 | 4.9% | 6, 5-years |
Walgreens Decatur, GA | 2001 / N/A | 15,120 | 4.3% | 6/30/2031 | $3,810,000 | 4.3% | $240,000 | $15.87 | 4.6% | None |
CVS Stone Mountain, GA | 1996 / N/A | 10,125 | 2.9% | 8/19/2035 | $3,630,000 | 4.1% | $194,000 | $19.16 | 3.7% | 5, 5-years |
O’Reilly Theodore, AL | 2020 / N/A | 7,225 | 2.1% | 3/1/2035 | $1,975,000 | 2.2% | $111,719 | $15.46 | 2.2% | 5, 5-years |
Dollar Tree Montgomery, AL | 1999 / 2004, 2020 | 11,092 | 3.2% | 8/31/2030 | $1,850,000 | 2.1% | $124,785 | $11.25 | 2.4% | 5, 5-years |
Sherwin Williams Madison, AL | 2020 / N/A | 5,000 | 1.4% | 9/1/2030 | $1,850,000 | 2.1% | $107,000 | $21.40 | 2.1% | 6, 5-years |
Dollar General Houston, TX | 2019 / N/A | 9,026 | 2.6% | 9/30/2034 | $1,750,000 | 2.0% | $108,450 | $12.02 | 2.1% | 3, 5-years |
Dollar General Plum, PA | 2020 / N/A | 9,100 | 2.6% | 7/31/2035 | $1,675,000 | 1.9% | $105,276 | $11.57 | 2.0% | 3, 5-years |
Autozone Hanover, PA | 2017 / N/A | 6,500 | 1.9% | 7/21/2032 | $1,626,000 | 1.8% | $85,000 | $13.08 | 1.6% | 3, 5-years |
Dollar General Bradley, IL | 2020 / N/A | 9,100 | 2.6% | 2/28/2035 | $1,600,000 | 1.8% | $99,512 | $10.94 | 1.9% | 4, 5-years |
Dollar General El Paso, TX | 2019 / N/A | 9,026 | 2.6% | 9/30/2034 | $1,575,000 | 1.8% | $96,751 | $10.72 | 1.9% | 3, 5-years |
Dollar General Trafford, PA | 2020 / N/A | 9,100 | 2.6% | 2/28/2035 | $1,575,000 | 1.8% | $98,880 | $10.87 | 1.9% | 3, 5-years |
| Total/Weighted Average | 349,816 | 100.0% | $88,466,000 | 100.0% | $5,188,046 | $14.83 | 100.0% | |||
| (1) | For the purposes of the table and loan underwriting, the Walgreens leases, which each grant early termination rights to Walgreens, were assumed to expire on the date as of when the earliest termination right under each lease, if exercised, would be effective. |
| (2) | Where any termination right effective date has been assumed to be the lease expiration date, the Renewal Options as shown reflect periods between subsequent termination right effective dates. |
This is not a research report and was not prepared by any Underwriter’s research department. Please see additional important information and qualifications at the end of this Term Sheet.
80
| Retail – Single Tenant | Loan #5 | Cut-off Date Balance: | $54,200,000 | |
| Property Addresses – Various | ExchangeRight Net Leased Portfolio #40 | Cut-off Date LTV: | 61.3% | |
| UW NCF DSCR: | 2.44x | |||
| UW NOI Debt Yield: | 8.8% |
The following table presents a summary regarding the major tenants at the ExchangeRight Properties:
| Tenant Summary | |||||||
| Tenant Name | Credit Rating (S&P/ Moody’s/Fitch)(1) | No. of Properties | Tenant SF | Approx.% of SF | Annual UW Base Rent | Annual UW Base Rent PSF | App. % of Total Annual UW base Rent |
| Walgreens | BBB / Baa2 / BBB | 4 | 60,180 | 17.2% | $1,421,263 | $23.62 | 27.4% |
| CVS | BBB / Baa2 / NR | 5 | 56,797 | 16.2% | $1,397,777 | $24.61 | 26.9% |
| Kroger | BBB / Baa1 / NR | 1 | 119,473 | 34.2% | $826,633 | $6.92 | 15.9% |
| Tractor Supply | NR / NR / NR | 2 | 38,197 | 10.9% | $605,000 | $15.84 | 11.7% |
| Dollar General | BBB / Baa2 / NR | 5 | 45,352 | 13.0% | $508,869 | $11.22 | 9.8% |
| Dollar Tree | BBB- / Baa3 / NR | 1 | 11,092 | 3.2% | $124,785 | $11.25 | 2.4% |
| O’Reilly | BBB / Baa1 / NR | 1 | 7,225 | 2.1% | $111,719 | $15.46 | 2.2% |
| Sherwin Williams | BBB- / Baa2 / BBB | 1 | 5,000 | 1.4% | $107,000 | $21.40 | 2.1% |
| Autozone | BBB / Baa1 / BBB | 1 | 6,500 | 1.9% | $85,000 | $13.08 | 1.6% |
| Subtotal/Wtd. Avg. | 21 | 349,816 | 100.0% | $5,188,046 | $14.83 | 100.0% | |
| Vacant Space | 0 | 0 | 0.0% | $0 | $0.00 | 0.0% | |
| Total/Wtd. Avg. | 21 | 349,816 | 100.0% | $5,188,046 | $14.83 | 100.0% | |
| (1) | Certain ratings are those of the parent company whether or not the parent guarantees the lease. |
The following table presents certain information relating to the lease rollover at the ExchangeRight Properties:
| Lease Rollover Schedule(1)(2)(3) | ||||||||
| Year | # of Leases Rolling | SF Rolling | Annual UW Base Rent PSF Rolling | Approx. % of Total SF Rolling | Approx. Cumulative % of SF Rolling | Total UW Base Rent Rolling | Approx. % of Total UW Base Rent Rolling | Approx. Cumulative % of Total UW Base Rent Rolling |
| MTM | 0 | 0 | $0.00 | 0.0% | 0.0% | $0 | 0.0% | 0.0% |
| 2020 | 0 | 0 | $0.00 | 0.0% | 0.0% | $0 | 0.0% | 0.0% |
| 2021 | 0 | 0 | $0.00 | 0.0% | 0.0% | $0 | 0.0% | 0.0% |
| 2022 | 0 | 0 | $0.00 | 0.0% | 0.0% | $0 | 0.0% | 0.0% |
| 2023 | 0 | 0 | $0.00 | 0.0% | 0.0% | $0 | 0.0% | 0.0% |
| 2024 | 0 | 0 | $0.00 | 0.0% | 0.0% | $0 | 0.0% | 0.0% |
| 2025 | 0 | 0 | $0.00 | 0.0% | 0.0% | $0 | 0.0% | 0.0% |
| 2026 | 0 | 0 | $0.00 | 0.0% | 0.0% | $0 | 0.0% | 0.0% |
| 2027 | 0 | 0 | $0.00 | 0.0% | 0.0% | $0 | 0.0% | 0.0% |
| 2028 | 0 | 0 | $0.00 | 0.0% | 0.0% | $0 | 0.0% | 0.0% |
| 2029 | 0 | 0 | $0.00 | 0.0% | 0.0% | $0 | 0.0% | 0.0% |
| 2030 | 4 | 46,032 | $21.46 | 13.2% | 13.2% | $988,048 | 19.0% | 19.0% |
| 2031 & Beyond | 17 | 303,784 | $13.83 | 86.8% | 100.0% | $4,199,998 | 81.0% | 100.0% |
| Vacant | 0 | 0 | $0.00 | 0.0% | 100.0% | $0 | 0.0% | 100.0% |
| Total/Wtd. Avg. | 21 | 349,816 | $14.83 | 100.0% | $5,188,046 | 100.0% | ||
| (1) | Information is based on the underwritten rent roll. |
| (2) | Certain tenants may have lease termination options that are exercisable prior to the stated expiration date of the subject lease or leases which are not considered in the lease rollover schedule. |
| (3) | For the purposes of the table and loan underwriting, the Walgreens leases, which each grant early termination rights to Walgreens, were assumed to expire on the date as of when the earliest termination right under each lease, if exercised, would be effective. |
COVID-19 Update. As of November 16, 2020, the ExchangeRight Properties are open and operating, all 21 tenants have remained current on all rent and lease obligations, and no lease modification or rent relief requests have been received. The first debt service payment on the ExchangeRight Net Leased Portfolio #40 Mortgage Loan is due in December 2020 and, as of November 10, 2020, the ExchangeRight Net Leased Portfolio #40 Mortgage Loan is not subject to any forbearance, modification or debt service relief request.
This is not a research report and was not prepared by any Underwriter’s research department. Please see additional important information and qualifications at the end of this Term Sheet.
81
| Retail – Single Tenant | Loan #5 | Cut-off Date Balance: | $54,200,000 | |
| Property Addresses – Various | ExchangeRight Net Leased Portfolio #40 | Cut-off Date LTV: | 61.3% | |
| UW NCF DSCR: | 2.44x | |||
| UW NOI Debt Yield: | 8.8% |
Underwritten Net Cash Flow. The following table presents certain information relating to the Underwritten Net Cash Flow at the ExchangeRight Properties:
| Cash Flow Analysis(1)(2) | ||
| UW | UW PSF | |
| Gross Potential Rent | $5,188,046 | $14.83 |
| Total Recoveries | $0 | $0.00 |
| Other Income | $0 | $0.00 |
| Less Vacancy & Credit Loss | ($259,402) | ($0.74) |
| Effective Gross Income | $4,928,644 | $14.09 |
| Real Estate Taxes | $0 | $0.00 |
| Insurance | $0 | $0.00 |
| Other Expenses | $147,859 | $0.42 |
| Total Expenses(3) | $147,859 | $0.42 |
| Net Operating Income | $4,780,784 | $13.67 |
| Capital Expenditures | $52,472 | $0.15 |
| TI/LC | $143,605 | $0.41 |
| Other | $50,000 | $0.14 |
| Net Cash Flow | $4,634,707 | $13.25 |
| Occupancy %(4) | 95.0% | |
| NOI DSCR | 2.52x | |
| NCF DSCR | 2.44x | |
| NOI Debt Yield | 8.8% | |
| NCF Debt Yield | 8.6% | |
| (1) | For the avoidance of doubt, no COVID specific adjustments have been made to the lender underwriting. | |
| (2) | Historical financial information is not available because the ExchangeRight Properties were acquired by the borrower sponsor between March 17, 2020 and October 16, 2020. |
| (3) | Total Expenses consist of a 3.0% management fee. |
| (4) | Occupancy % represents economic occupancy at the ExchangeRight Properties. As of November 1, 2020, the ExchangeRight Properties were 100.0% occupied. |
Escrows and Reserves.
Taxes – The ExchangeRight Net Leased Portfolio #40 Mortgage Loan documents require upfront escrows in the amount of $273,729 for real estate taxes. Commencing in December 2022, the ExchangeRight Net Leased Portfolio #40 Borrower will be required to make monthly deposits in an amount equal to 1/12th of the real estate taxes that the lender estimates will be payable during the next 12 months, initially $9,776 per month, except that no deposits will be required on account of taxes with respect to the Direct Pay Tenants (as defined below for this purpose) for so long as (i) no event of default under the ExchangeRight Net Leased Portfolio #40 Mortgage Loan is continuing, (ii) the ExchangeRight Net Leased Portfolio #40 Borrower provides proof of payment by the tenant (or the ExchangeRight Net Leased Portfolio #40 Borrower) directly to the taxing authority on or before 15 days prior to the last date on which the taxes can be paid without the accrual of interest or penalties, (iii) the tenant’s lease is not subject to any default beyond any applicable grace or notice and cure period by either the ExchangeRight Net Leased Portfolio #40 Borrower or such tenant, and (iv) no material adverse change has (in the lender’s reasonable determination) occurred with respect to the applicable tenant such that its ability to timely pay the taxes has been materially jeopardized. For the purpose of real estate taxes, “Direct Pay Tenant” means any tenant that has the right or the obligation pursuant to its lease to pay taxes for the applicable ExchangeRight Property directly to the applicable taxing authority and is actually exercising such right or complying with such obligation, as applicable. The ExchangeRight Net Leased Portfolio #40 Mortgage Loan documents provide that the initial such Direct Pay Tenants are the tenants at the Kroger – North Chesterfield, VA, AutoZone – Hanover, PA, Walgreens – Saint Clair Shores, MI, Walgreens – Decatur, GA, Walgreens – Dallas, TX, Walgreens – Orland Park, IL, CVS – Kankakee, IL, CVS – Monaca, PA, CVS – Lafayette, LA, O’Reilly Auto Parts – Theodore, AL, Tractor Supply – Buford, GA, and Tractor Supply, Lambertville, MI properties.
Insurance – If the casualty and liability insurance with respect to the ExchangeRight Net Leased Portfolio #40 Properties are maintained under a lender-approved blanket policy and no event of default is continuing under the ExchangeRight Net Leased Portfolio #40 Mortgage Loan, the ExchangeRight Net Leased Portfolio #40 Borrower will not be required to make monthly deposits into an insurance reserve. If such conditions are not satisfied, the ExchangeRight Net Leased Portfolio #40 Borrower will be required to make deposits into an insurance reserve in an amount equal to 1/12th of the insurance premiums that the lender estimates will be payable for the renewal of the coverage afforded by the insurance policies upon the expiration thereof, except that no deposits will be required on account of insurance premiums with respect to the Direct Pay Tenants (as defined below for this purpose) for so long as (i) no event of default under the ExchangeRight Net Leased Portfolio #40 Mortgage Loan is continuing, (ii) the ExchangeRight Net Leased Portfolio #40 Borrower provides proof of payment by the tenant (or the ExchangeRight Net Leased Portfolio #40 Borrower) directly to the insurance company on or before 15 days prior to the due date for insurance premiums, (iii) the tenant’s lease is not subject to any default beyond any applicable grace or notice and cure period by either the ExchangeRight Net Leased Portfolio #40 Borrower or such tenant, and (iv) no material adverse change has (in the lender’s reasonable determination) occurred with respect to the applicable tenant such that its ability to timely pay the insurance premiums has
This is not a research report and was not prepared by any Underwriter’s research department. Please see additional important information and qualifications at the end of this Term Sheet.
82
| Retail – Single Tenant | Loan #5 | Cut-off Date Balance: | $54,200,000 | |
| Property Addresses – Various | ExchangeRight Net Leased Portfolio #40 | Cut-off Date LTV: | 61.3% | |
| UW NCF DSCR: | 2.44x | |||
| UW NOI Debt Yield: | 8.8% |
been materially jeopardized. For the purpose of insurance premiums, “Direct Pay Tenant” means any tenant that has the right or the obligation pursuant to its lease to maintain all or a portion of the insurance for the applicable ExchangeRight Property and to pay insurance premiums directly to the applicable insurance company and is actually exercising such right or complying with such obligation, as applicable. The ExchangeRight Net Leased Portfolio #40 Mortgage Loan documents provide that the initial such Direct Pay Tenants (which maintain property and terrorism insurance for the applicable property) are the tenants at the Dollar General – Trafford, PA, Dollar General – El Paso, TX, Dollar General – Houston, TX, Dollar General – Plum, PA, Dollar General – Bradley, IL, Walgreens – Saint Clair Shores, MI, Walgreens – Decatur, GA, Walgreens – Orland Park, IL, CVS – Kankakee, IL, CVS – Stone Mountain, GA, CVS – Lafayette, LA, O’Reilly Auto Parts – Theodore, AL, Tractor Supply – Buford, GA, and Tractor Supply, Lambertville, MI properties.
Recurring Replacements Reserve – The ExchangeRight Net Leased Portfolio #40 Mortgage Loan documents require monthly deposits into a replacement reserve in an amount equal to 1/12th of the product obtained by multiplying $0.15 by the aggregate number of rentable square feet of space at the ExchangeRight Properties, except that no such deposit need be made in respect of the aggregate number of rentable square feet at the CVS – Kankakee, IL, Dollar General – Bradley, IL, CVS – Lafayette, LA, Walgreens – Saint Clair Shores, MI, AutoZone – Hanover, PA, CVS – Monaca, PA, Dollar General – Plum, PA, Dollar General – Trafford, PA, Dollar General – El Paso, TX, and Dollar General – Houston, TX properties (with respect to which the ExchangeRight Net Leased Portfolio Mortgage Loan documents include an acknowledgement that the tenants are required to pay capital expenses under their leases) for so long as (i) no event of default is continuing, (ii) the ExchangeRight Net Leased Portfolio #40 Borrower provides proof of payment by all such tenants of the payment of all such capital expenses promptly following request by the lender, (iii) the leases with the applicable tenants are not subject to any default beyond any applicable grace or notice and cure period by either the ExchangeRight Net Leased Portfolio #40 Borrower or the tenant, and (iv) no material adverse change has occurred with respect to the applicable tenant such that the ability to timely pay the capital expenses for its respective premises pursuant to its lease has, in the lender’s reasonable determination, been materially jeopardized. The initial amount of the required monthly deposits into the replacement reserve is equal to $2,804 per month.
Tenant Improvements and Leasing Commissions Reserve – The ExchangeRight Net Leased Portfolio #40 Mortgage Loan documents require an upfront escrow in the amount of $500,000 for tenant improvements and leasing commissions. Upon an event of default, the ExchangeRight Net Leased Portfolio #40 Borrower will be required to make monthly deposits in an amount equal to 1/12 of the product obtained by multiplying $0.70 by the aggregate number of rentable square feet of space at the ExchangeRight Properties, initially $19,628 per month, for tenant improvements and leasing commissions.
Required Repair Reserve – The ExchangeRight Net Leased Portfolio #40 Mortgage Loan documents require an upfront reserve in the amount of $188,269 for specified repairs, including the replacement of the roof system at the Walgreens – Decatur, GA property (for which $155,490 was reserved). All of the specified repairs are required to be completed within 180 days following the origination date.
Lockbox and Cash Management. The ExchangeRight Net Leased Portfolio #40 Mortgage Loan is structured with a hard lockbox and springing cash management. The ExchangeRight Net Leased Portfolio #40 Borrower is required to (or to cause the ExchangeRight Net Leased Portfolio #40 Master Tenant or property manager to) cause all rents relating to the ExchangeRight Properties to be transmitted directly by the tenants of each property into the lockbox account and, to the extent that such rents are received by the ExchangeRight Net Leased Portfolio #40 Borrower (or ExchangeRight Net Leased Portfolio #40 Master Tenant or property manager), cause such amounts to be deposited into the lockbox account within two business days following receipt. The lockbox account bank is required to sweep such funds into the ExchangeRight Net Leased Portfolio #40 Master Tenant’s operating account on each business day other than during a Cash Management Period. Upon the delivery of notice by the lender of the commencement of the initial Cash Management Period, if any, the ExchangeRight Net Leased Portfolio #40 Borrower is required to establish a lender-controlled cash management account, into which account all funds in the lockbox account will be required to be deposited on each business day during a Cash Management Period. During a Cash Management Period, and provided no event of default is continuing, funds in the cash management account are required to be applied (i) to make the next monthly deposits (to the extent required) into the real estate taxes and insurance reserves as described above under “—Escrows and Reserves”, (ii) to reserve the next monthly debt service payment due on the ExchangeRight Net Leased Portfolio #40 Mortgage Loan, (iii) to make the next monthly deposits into the recurring replacements reserve and the tenant improvements and leasing commissions reserve as described above under “—Escrows and Reserves”, (iv) to pay operating expenses set forth in the annual budget (which is required to be reasonably approved by the lender during a Cash Management Period) and additional operating expenses reasonably approved by the lender and (v) to deposit any remainder into a cash collateral subaccount to be held as additional security for the ExchangeRight Net Leased Portfolio #40 Mortgage Loan during such Cash Management Period. Upon cessation of a Cash Management Period, all available amounts on deposit in the cash management account must be released to the ExchangeRight Net Leased Portfolio #40 Borrower or ExchangeRight Net Leased Portfolio #40 Master Tenant.
A “Cash Management Period” means a period:
| (i) | commencing upon the maturity date of the ExchangeRight Net Leased Portfolio #40 Mortgage Loan, |
| (ii) | commencing upon a default or an event of default under the ExchangeRight Net Leased Portfolio #40 Mortgage Loan and ending when such event of default has been cured (and no other event of default has occurred), |
| (iii) | commencing when the interest-only debt service coverage ratio (based on net operating income for the trailing 12 months) as of the end of any calendar quarter is less than 1.50x and ending when the interest-only debt service coverage ratio (based on net operating income for the trailing 12 months) is at least 1.55x as of the end of each of two consecutive calendar quarters, or |
| (iv) | commencing on November 1, 2027 (36 months before the maturity date of the ExchangeRight Net Leased Portfolio #40 Mortgage Loan), unless a Qualified Transfer has occurred as of such date (see “The Borrower and the Borrower Sponsor” above), and ending when a Qualified Transfer occurs. |
Additional Secured Indebtedness (not including trade debts). None.
Mezzanine Loan and Preferred Equity. Not permitted.
Release of Property. The ExchangeRight Net Leased Portfolio #40 Borrower has the right to obtain the release of a 0.819-acre unimproved release parcel at the Tractor Supply – Buford, GA Property, which is expected to be the subject of a road dedication, without any prepayment or defeasance, upon satisfaction of certain conditions, including but not limited to (i) the release parcel and remaining property are separate tax parcels, (ii) the consent of the
This is not a research report and was not prepared by any Underwriter’s research department. Please see additional important information and qualifications at the end of this Term Sheet.
83
| Retail – Single Tenant | Loan #5 | Cut-off Date Balance: | $54,200,000 | |
| Property Addresses – Various | ExchangeRight Net Leased Portfolio #40 | Cut-off Date LTV: | 61.3% | |
| UW NCF DSCR: | 2.44x | |||
| UW NOI Debt Yield: | 8.8% |
lender to any change in the proposed dimensions and legal description of the parcel, (iii) the partial release instrument being satisfactory to the lender, (iv) receipt of all required notices and consents of governmental authorities, (v) the release does not affect the lien or priority of the mortgage on the remaining Exchange Right Properties and (v) satisfaction of REMIC related conditions.
Real Estate Substitution. Not permitted.
Letter of Credit. None.
Rights of First Refusal. The related single tenant at each of seven ExchangeRight Properties: the Kroger – North Chesterfield, VA, Walgreens – Orland Park, IL, Walgreens – Dallas, TX, Tractor Supply – Buford, GA, Tractor Supply – Lambertville, MI, Walgreens – Decatur, GA and O’Reilly – Theodore AL properties has a right of first refusal (“ROFR”) to purchase the related ExchangeRight Property. With respect to the Kroger – North Chesterfield, VA property, the ROFR does not apply to any form of financing, foreclosure sale or deed-in-lieu of foreclosure so long as such actions are not designed to avoid complying with the terms of the ROFR, but will apply to subsequent transfers by any party acquiring title through a foreclosure sale or deed-in-lieu of foreclosure. The related subordination, non-disturbance and attornment agreement (“SNDA”) for each such ExchangeRight Property with Walgreens as the tenant provides that such right will not apply to the mortgagee or any other party that acquires title or right of possession of the leased premises through a foreclosure, deed-in-lieu of foreclosure or any other enforcement action under the mortgage; provided, however, that such right will apply to subsequent purchasers of the leased premises. The related SNDA for each such ExchangeRight Property with Tractor Supply as the tenant provides that the tenant’s ROFR is subordinate to the Mortgage. However, the ROFR would apply to any transfers subsequent to the lender taking title to the related ExchangeRight Property. No SNDA was entered into with respect to the O’Reilly – Theodore, AL property. The ExchangeRight Net Leased Portfolio #40 Mortgage Loan documents provide for recourse to the non-recourse carveout guarantors for losses resulting from any claim or demand that the tenant at the O’Reilly – Theodore, AL property is or was entitled to exercise a ROFR or other preferential purchase option to purchase such property pursuant to such tenant’s lease as a result of (or that such ROFR was otherwise triggered by) a foreclosure, deed-in-lieu of foreclosure or other exercise by the lender of its rights and/or remedies under the ExchangeRight Net Leased Portfolio #40 Mortgage Loan documents; provided, however, in no event will the ExchangeRight Net Leased Portfolio #40 Borrower’s liability for such losses exceed the sum of (i) $1,204,528.00 and (ii) the actual costs and expenses incurred by the lender arising out of or related to any such claim or demand. Such recourse terminates if the lender receives an SNDA expressly subordinating the applicable lease and stating that any ROFR therein will not apply to a foreclosure, deed-in-lieu of foreclosure or other exercise of such rights and remedies by the lender. See “Description of the Mortgage Pool—Tenant Leases—Purchase Options and Rights of First Refusal” in the Preliminary Prospectus.
Ground Lease. None.
Terrorism Insurance. The ExchangeRight Net Leased Portfolio #40 Mortgage Loan documents require that the property insurance policy required to be maintained by the ExchangeRight Net Leased Portfolio #40 Borrower provide coverage, if available, for perils and acts of terrorism in an amount equal to 100% of the full replacement cost of the ExchangeRight Properties plus loss of rents or business income for a period of not less than 18 months for the initial period of restoration. See “Risk Factors—Risks Relating to the Mortgage Loans—Terrorism Insurance May Not Be Available for All Mortgaged Properties” in the Preliminary Prospectus.
This is not a research report and was not prepared by any Underwriter’s research department. Please see additional important information and qualifications at the end of this Term Sheet.
84
(THIS PAGE INTENTIONALLY LEFT BLANK)
This is not a research report and was not prepared by any Underwriter’s research department. Please see additional important information and qualifications at the end of this Term Sheet.
85
| Office - CBD | Loan #6 | Cut-off Date Balance: | $50,000,000 | |
| 110 North Carpenter Street | McDonald’s Global HQ | Cut-off Date LTV: | 41.6% | |
| Chicago, IL 60607 | UW NCF DSCR: | 1.45x | ||
| UW NOI Debt Yield: | 11.8% |

This is not a research report and was not prepared by any Underwriter’s research department. Please see additional important information and qualifications at the end of this Term Sheet.
86
| Office - CBD | Loan #6 | Cut-off Date Balance: | $50,000,000 | |
| 110 North Carpenter Street | McDonald’s Global HQ | Cut-off Date LTV: | 41.6% | |
| Chicago, IL 60607 | UW NCF DSCR: | 1.45x | ||
| UW NOI Debt Yield: | 11.8% |
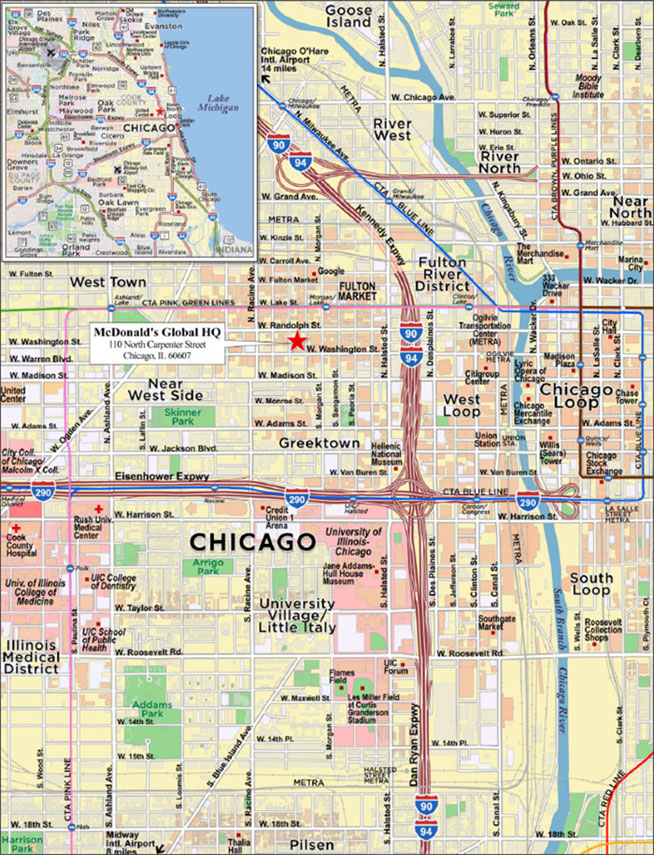
This is not a research report and was not prepared by any Underwriter’s research department. Please see additional important information and qualifications at the end of this Term Sheet.
87
| Mortgage Loan No. 6 – McDonald’s Global HQ |
| Mortgage Loan Information | Property Information | ||||||
| Mortgage Loan Seller: | BANA | Single Asset/Portfolio: | Single Asset | ||||
| Credit Assessment (DBRSM/Fitch/Moody’s): | A (low)/Asf*/Baa2 | Location: | Chicago, IL 60607 | ||||
| Original Balance(1): | $50,000,000 | General Property Type: | Office | ||||
| Cut-off Date Balance(1): | $50,000,000 | Detailed Property Type: | CBD | ||||
| % of Initial Pool Balance: | 5.7% | Title Vesting: | Fee | ||||
| Loan Purpose: | Acquisition | Year Built/Renovated: | 2018/N/A | ||||
| Borrower Sponsor: | Normandy Properties | Size: | 575,018 SF | ||||
| Guarantor: | William I. Snyder | Cut-off Date Balance per SF(1): | $296 | ||||
| Mortgage Rate: | 2.9350% | Maturity Date Balance per SF(1): | $122 | ||||
| Note Date: | 10/29/2020 | Property Manager: | Sterling Bay Property Management, LLC | ||||
| First Payment Date: | 12/1/2020 | ||||||
| Maturity Date: | 11/1/2030 | ||||||
| Original Term to Maturity: | 120 months | ||||||
| Original Amortization Term(2): | 270 months | Underwriting and Financial Information(6) | |||||
| IO Period: | 0 months | UW NOI(6): | $20,055,422 | ||||
| Seasoning: | 0 months | UW NOI Debt Yield(1): | 11.8% | ||||
| Prepayment Provisions(3): | LO (24); DEF (92); O (4) | UW NOI Debt Yield at Maturity(1): | 28.7% | ||||
| Lockbox/Cash Mgmt Status: | Hard/In Place | UW NCF DSCR(1): | 1.45x | ||||
| Additional Debt Type(1)(4): | Pari Passu/B-Note | Most Recent NOI: | $10,812,656 (8/31/2020 TTM) | ||||
| Additional Debt Balance(1)(4): | $120,000,000 / $110,000,000 | 2nd Most Recent NOI: | $7,895,362 (12/31/2019) | ||||
| Future Debt Permitted (Type): | No (N/A) | 3rd Most Recent NOI(7): | N/A | ||||
| Reserves(5) | Most Recent Occupancy: | 97.3% 11/4/2020 | |||||
| Type | Initial | Monthly | Cap | 2nd Most Recent Occupancy: | 96.4% (12/31/2019) | ||
| RE Tax: | $0 | Springing | N/A | 3rd Most Recent Occupancy: | 94.2% (12/31/2018) | ||
| Insurance: | $0 | Springing | N/A | Appraised Value (as of)(8): | $409,000,000 (9/28/2020) | ||
| Replacement Reserve: | $0 | Springing | N/A | Appraised Value per SF(8): | $711 | ||
| TI/LC Reserve: | $0 | Springing | N/A | Cut-off Date LTV Ratio(1)(8): | 41.6% | ||
| Free Rent Reserve: | $6,161,307 | $0 | N/A | Maturity Date LTV Ratio(1)(8): | 17.1% | ||
| Sources and Uses | ||||||
| Sources | Proceeds | % of Total | Uses | Proceeds | % of Total | |
| Whole Loan Amount(1): | $280,000,000 | 66.6% | Purchase Price: | $412,500,000 | 98.1% | |
| Borrower Equity: | $140,508,313 | 33.4% | Reserves: | $6,161,307 | 1.5% | |
| Closing Costs: | $1,847,006 | 0.4% | ||||
| Total Sources: | $420,508,313 | 100.0% | Total Uses: | $420,508,313 | 100.0% | |
| (1) | The McDonald’s Global HQ Mortgage Loan (as defined below) is part of the McDonald’s Global HQ Whole Loan (as defined below), which is comprised of six pari passu senior promissory notes and one subordinate note. The Cut-off Date Balance per SF, Maturity Date Balance per SF, UW NOI Debt Yield, UW NOI Debt Yield at Maturity, UW NCF DSCR, Cut-off Date LTV Ratio and Maturity Date LTV Ratio numbers presented above are based on the principal balance of the McDonald’s Global HQ Senior Loan (as defined below). The Cut-off Date Balance per SF, Maturity Date Balance per SF, UW NOI Debt Yield, UW NOI Debt Yield at Maturity, UW NCF DSCR, Cut-off Date LTV Ratio and Maturity Date LTV Ratio based on the principal balance of the McDonald’s Global HQ Whole Loan are $486.94, $313.01, 7.2%, 11.1%,1.17x, 68.5% and 44.0%, respectively. |
| (2) | The Original Amortization Term is shown for the McDonald’s Global HQ Whole Loan. The McDonald’s Global HQ Senior Loan amortizes in 186 months. See the amortization schedule for the McDonald’s Global HQ Mortgage Loan set forth on Annex A-4 in the Preliminary Prospectus. |
| (3) | Defeasance of the McDonald’s Global HQ Mortgage Loan is permitted at any time after the earlier to occur of (a) the end of the two-year period commencing on the closing date of the securitization of the last portion of the McDonald’s Global HQ Whole Loan to be securitized and (b) October 29, 2023. The assumed prepayment lockout period of 24 payments is based on the closing date of this transaction in November 2020. |
| (4) | See “Additional Secured Indebtedness (not including trade debts)” below for further discussion of additional debt. |
| (5) | See “Escrows and Reserves” below for further discussion of reserve information. |
| (6) | The novel coronavirus pandemic is an evolving situation and could impact the McDonald’s Global HQ Whole Loan more severely than assumed in the underwriting of the McDonald’s Global HQ Whole Loan and could adversely affect the NOI, NCF and occupancy information, as well as the appraised value and the DSCR, LTV and Debt Yield metrics presented above and herein. See “Risk Factors–Risks Related to Market Conditions and Other External Factors–The Coronavirus Pandemic Has Adversely Affected the Global Economy and Will Likely Adversely Affect the Performance of the Mortgage Loans” in the Preliminary Prospectus. |
| (7) | Further historical NOI is not available because the McDonald’s Global HQ Property was built in 2018. |
| (8) | The appraisal also provided a “Hypothetical As If Dark” value of $225,000,000 as of September 28, 2020, which value would result in an Appraised Value per SF, Cut-off Date LTV Ratio and Maturity Date LTV Ratio of $391.29, 75.6% and 48.6%, respectively, based on the principal balance of the McDonald’s Global HQ Senior Loan. |
The Mortgage Loan. The sixth largest mortgage loan (the “McDonald’s Global HQ Mortgage Loan”) is part of a whole loan (the “McDonald’s Global HQ Whole Loan”) evidenced by six pari passu senior promissory notes in the aggregate original principal amount of $170,000,000 (together, the “McDonald’s Global HQ Senior Loan”) and one note in the original principal amount of $110,000,000 (the “McDonald’s Global HQ Subordinate Companion Loan”) that is subordinate to the McDonald’s Global HQ Senior Loan. The McDonald’s Global HQ Whole Loan is secured by a first priority fee mortgage encumbering a 575,018 SF office building located in Chicago, Illinois (the “McDonald’s Global HQ Property”). The McDonald’s Global HQ Mortgage Loan is evidenced by the non-controlling Note A-3 with an original principal amount of $50,000,000. The remaining promissory notes comprising the McDonald’s Global HQ Whole Loan are summarized in the below table and are expected to be contributed to one or more future securitization transactions. The McDonald’s Global HQ Whole Loan is being serviced pursuant to the pooling and servicing agreement for the BANK 2020-BNK29 securitization trust until the
This is not a research report and was not prepared by any Underwriter’s research department. Please see additional important information and qualifications at the end of this Term Sheet.
88
| Office - CBD | Loan #6 | Cut-off Date Balance: | $50,000,000 | |
| 110 North Carpenter Street | McDonald’s Global HQ | Cut-off Date LTV: | 41.6% | |
| Chicago, IL 60607 | UW NCF DSCR: | 1.45x | ||
| UW NOI Debt Yield: | 11.8% |
securitization of Note A-2, at which time the McDonald’s Global HQ Whole Loan will be serviced pursuant to the pooling and servicing agreement for such related securitization trust. See “Description of the Mortgage Pool—The Whole Loans—The McDonald’s Global HQ Pari Passu-A/B Whole Loan” and “Pooling and Servicing Agreement—Servicing of the Servicing Shift Mortgage Loans” in the Preliminary Prospectus.
| McDonald’s Global HQ Whole Loan Summary | ||||
Note | Original Balance | Cut-off Date Balance | Note Holder | Controlling Piece |
| A-1 | $1,000,000 | $1,000,000 | Bank of America | No |
| A-2 | $60,000,000 | $60,000,000 | Bank of America | No |
| A-3 | $50,000,000 | $50,000,000 | BANK 2020-BNK29 | No(1) |
| A-4 | $25,000,000 | $25,000,000 | Bank of America | No |
| A-5 | $24,000,000 | $24,000,000 | Bank of America | No |
| A-6 | $10,000,000 | $10,000,000 | Bank of America | No |
| B | $110,000,000 | $110,000,000 | Bank of America | Yes(1) |
| Total (Whole Loan) | $280,000,000 | $280,000,000 | ||
| (1) | Pursuant to the related co-lender agreement, the holder of Note B is the controlling noteholder unless a “control appraisal period” has occurred and is continuing under the co-lender agreement, in which case Note A-2 will become the controlling noteholder; however, upon the closing of the BANK 2020-BNK29 securitization, the initial controlling noteholder will temporarily be the BANK 2020-BNK29 securitization trust until one of the following occurs (a) Note A-2 is securitized or otherwise transferred to a purchaser not affiliated with BANA, or (b) BANA transfers Note B to a purchaser not affiliated with BANA. |
The Borrower and the Borrower Sponsor. The borrower is 110 NC LLC (the “McDonald’s Global HQ Borrower”), a Delaware limited liability company structured to be bankruptcy-remote with at least two independent directors.
The borrower sponsor is Normandy Properties, a commercial real estate owner and operator owned by a family office controlled by the Snyder family. The Snyder family has continuously operated in the steel and precious metals industries since the 1800’s. William I. Snyder is the non-recourse carveout guarantor for the McDonald’s Global HQ Whole Loan.
The Property. The McDonald’s Global HQ Property is a 575,018 SF, 9-story, Class A, LEED Platinum office building with a ground floor multi-tenant retail component. The McDonald’s Global HQ Property was built in 2018 on a 1.99-acre site, occupying an entire city block in the Fulton Market District of downtown Chicago, Illinois. The McDonald’s Global HQ Property features floor plates between 56,393 and 80,233 rentable SF above a two-level subterranean garage that includes 320 parking spaces (0.56 space per 1,000 SF), bicycle storage and tenant storage. The sustainability features of the McDonald’s Global HQ Property include a green roof and terrace landscaping, three rooftop beehives, low-flow plumbing fixtures, and recycling and waste prevention efforts which have a goal of diverting 200,000 pounds of material away from the landfill annually.
The McDonald’s Global HQ Property was built-to-suit for McDonald’s Corporation (“McDonald’s”) for the relocation of its global headquarter operations from the western suburbs of Chicago, which move brought 2,500 jobs to downtown Chicago. McDonald’s occupies a total of 532,526 SF (92.6% of NRA), which includes a 9,765 SF retail restaurant, 6,040 SF of storage space, a dedicated 8,121 SF lobby featuring a two-story art installation using kitchen equipment from a McDonald’s restaurant, the entirety of the office space on floors 2 through 8, a double-height, column-free auditorium on the 6th floor, and a 23,644 SF amenity floor on the 9th floor with a tenant lounge/bar area, work café, professionally managed fitness center with locker rooms, and a rooftop deck that offers sweeping views of the Chicago skyline. The McDonald’s space also includes five other landscaped terraces located on building set-back points on floors 3, 6 and 8. McDonald’s leases 295 of 320 parking spaces in the garage.
The remaining rentable area at the McDonald’s Global HQ Property is comprised of 42,492 SF of retail space, currently leased to Walgreens, FedEx Retail, One Medical and Politan Row (a chef-driven upscale food hall), with 15,657 SF remaining to be leased. The retail tenants serve as amenities for the office users and for the surrounding neighborhood. The McDonald’s Global HQ Property was 97.3% leased, as of November 4, 2020.
Major Tenant.
McDonald’s (532,526 SF, 92.6% of NRA; 92.2% of underwritten base rent). McDonald’s (NYSE: MCD) (Moody’s/S&P: Baa1/BBB+) is a worldwide fast food brand with an equity market capitalization of approximately $160 billion. For its fiscal year 2019, McDonald’s is estimated to have served 70 million people daily across 100 countries in its 38,695 locations, reporting system-wide sales of $100.2 billion.
The McDonald’s 15-year triple-net lease commenced on August 1, 2018 and expires on July 31, 2033. The lease requires current average annual rent of $33.10 PSF, with 2.25% annual increases every August through the lease term. McDonald’s has four 5-year options to extend the lease at 95% of market rent with 20 months’ notice. McDonald’s has the option to contract up to one full floor, but not less than half of one floor, effective August 1, 2028, upon 12 months’ notice and a contraction fee equal to the sum of (x) tenant improvements credited by the landlord and brokerage commissions paid allocable to the contracted space and (y) any rent abatements received allocable to the contracted space plus interest, which sum is estimated to be approximately $5.8 million. McDonald’s has the option to terminate its lease effective July 31, 2030, upon 18 months’ notice and payment of a termination fee equal to the sum of (x) tenant improvements credited by the landlord and brokerage commissions paid and (y) any rent abatements received plus interest, which sum is estimated to be approximately $25.8 million. The exercise by McDonald’s of either its contraction or termination option would trigger a Cash Sweep Period (see “Escrows and Reserves” below).
McDonald’s received a tenant improvement allowance of $51,747,189, with no remaining amounts owed by the landlord, and reportedly invested an additional $114,682,118 toward the improvement of its office space and $3,152,925 toward its retail space. Pursuant to its lease, McDonald’s is entitled to a remaining amount of $4,979,640 of free rent owed through August 2021 and an $874,042 operating expense cap credit, which amounts have been fully reserved by the lender (see “Escrows and Reserves” below).
This is not a research report and was not prepared by any Underwriter’s research department. Please see additional important information and qualifications at the end of this Term Sheet.
89
| Office - CBD | Loan #6 | Cut-off Date Balance: | $50,000,000 | |
| 110 North Carpenter Street | McDonald’s Global HQ | Cut-off Date LTV: | 41.6% | |
| Chicago, IL 60607 | UW NCF DSCR: | 1.45x | ||
| UW NOI Debt Yield: | 11.8% |
The following table presents certain information relating to the tenants at the McDonald’s Global HQ Property:
| Tenant Summary(1) | |||||||||
| Tenant Name | Credit Rating (Fitch/Moody’s/ S&P)(2) | Tenant SF | Approx. % of Total SF | Annual UW Rent(3) | % of Total Annual UW Rent(3) | Annual UW Rent PSF(3) | Lease Expiration | Renewal Options | Termination Option (Y/N) |
| Office | |||||||||
| McDonald’s(4) | NR/Baa1/BBB+ | 522,761 | 90.9% | $17,458,413 | 89.7% | $33.40 | 7/31/2033 | 4x5 yr(5) | Y(6) |
| Retail | |||||||||
| Politan Row(7) | NR/NR/NR | 10,453 | 1.8% | $417,323 | 2.1% | $39.92 | 5/31/2029 | 1x5 yr(8) | N |
| McDonald’s | NR/Baa1/BBB+ | 9,765 | 1.7% | $496,218 | 2.5% | $50.82 | 7/31/2033 | 4x5 yr(5) | N |
| Walgreens | BBB-/Baa2/BBB | 9,369 | 1.6% | $515,295 | 2.6% | $55.00 | 9/30/2048 | N/A | Y(9) |
| One Medical(10) | NR/NR/NR | 4,889 | 0.9% | $425,979 | 2.2% | $87.13 | 12/31/2030 | 2x5 yr(11) | N |
| FedEx Retail | NR/Baa2/BBB | 2,124 | 0.4% | $159,300 | 0.8% | $75.00 | 12/31/2028 | 2x5 yr(12) | N |
| Vacant (Retail) | 15,657 | 2.7% | $0 | 0.0% | $0.00 | ||||
| Retail Subtotal | 52,257 | 9.1% | $2,014,114 | 10.3% | $55.03 | ||||
| Collateral Total | 575,018 | 100.0% | $19,472,527 | 100.0% | $34.81(13) | ||||
| (1) | Information based on the underwritten rent roll. |
| (2) | Certain ratings are those of the parent company whether or not the parent guarantees the lease. |
| (3) | The leases are on a net basis with the tenant responsible for a pro rata share of all operating expenses and real estate taxes, except for the lease to Politan Row, which is a full service gross lease. |
| (4) | McDonald’s is entitled to a remaining amount of $4,979,640 of free rent owed through August 2021, which amount has been fully reserved by the lender. |
| (5) | McDonald’s has four 5-year options to extend the lease at 95% of market rent with 20 months’ notice. |
| (6) | McDonald’s has a one-time right to contract one full floor, but not less than half of one floor, effective August 1, 2028, upon 12 months’ notice and payment of a contraction fee. McDonald’s has a one-time right to terminate its lease effective July 31, 2030, upon 18 months’ notice and payment of a termination fee. |
| (7) | Politan Row is in a rent abatement period through June 2021. $240,784, representing the rent owed between the loan origination date and the end of the tenant’s rent abatement period, has been fully reserved by the lender. |
| (8) | Politan Row has one 5-year option to extend the lease at fixed rent of a 2.5% increase over the last year of the current term with 18-24 months’ notice. |
| (9) | Walgreens has rights to terminate its lease effective September 30, 2033, September 30, 2038, or September 20, 2043, each with 12 months’ notice. |
| (10) | One Medical has a rent commencement date of February 1, 2021. $66,840, representing the rent owed between the loan origination date and the tenant’s rent commencement date, has been fully reserved by the lender. |
| (11) | One Medical has two 5-year options to extend the lease at fair market rent with 12 months’ notice. |
| (12) | FedEx Retail has two 5-year options to extend the lease at fair market rent with 12-18 months’ notice. |
| (13) | Annual UW Rent PSF excludes vacant space. |
The following table presents certain information relating to the lease rollover schedule at the McDonald’s Global HQ Property:
| Lease Rollover Schedule(1)(2) | ||||||||
| Year | # of Leases Rolling | SF Rolling | Approx. % of Total SF Rolling | Approx. Cumulative % of SF Rolling | UW Rent PSF Rolling | Total UW Rent Rolling | Approx. % of Total Rent Rolling | Approx. Cumulative % of Total Rent Rolling |
| 2020 | 0 | 0 | 0.0% | 0.0% | $0.00 | $0 | 0.0% | 0.0% |
| 2021 | 0 | 0 | 0.0% | 0.0% | $0.00 | $0 | 0.0% | 0.0% |
| 2022 | 0 | 0 | 0.0% | 0.0% | $0.00 | $0 | 0.0% | 0.0% |
| 2023 | 0 | 0 | 0.0% | 0.0% | $0.00 | $0 | 0.0% | 0.0% |
| 2024 | 0 | 0 | 0.0% | 0.0% | $0.00 | $0 | 0.0% | 0.0% |
| 2025 | 0 | 0 | 0.0% | 0.0% | $0.00 | $0 | 0.0% | 0.0% |
| 2026 | 0 | 0 | 0.0% | 0.0% | $0.00 | $0 | 0.0% | 0.0% |
| 2027 | 0 | 0 | 0.0% | 0.0% | $0.00 | $0 | 0.0% | 0.0% |
| 2028 | 1 | 2,124 | 0.4% | 0.4% | $75.00 | $159,300 | 0.8% | 0.8% |
| 2029 | 1 | 10,453 | 1.8% | 2.2% | $39.92 | $417,323 | 2.1% | 3.0% |
| 2030 | 1 | 4,889 | 0.9% | 3.0% | $87.13 | $425,979 | 2.2% | 5.1% |
| 2031 & Beyond | 3 | 541,895 | 94.2% | 97.3% | $34.08 | $18,469,925 | 94.9% | 100.0% |
| Vacant | 0 | 15,657 | 2.7% | 100.0% | $0.00 | $0 | 0.0% | 100.0% |
| Total/Wtd. Avg. | 6 | 575,018 | 100.0% | $34.81(3) | $19,472,527 | 100.0% | ||
| (1) | Information obtained from the underwritten rent roll. |
| (2) | Certain tenants may have lease termination options that are exercisable prior to the originally stated expiration date of the subject lease and that are not considered in this Lease Rollover Schedule. |
| (3) | Total/Wtd. Avg. UW Rent PSF Rolling excludes vacant space. |
This is not a research report and was not prepared by any Underwriter’s research department. Please see additional important information and qualifications at the end of this Term Sheet.
90
| Office - CBD | Loan #6 | Cut-off Date Balance: | $50,000,000 | |
| 110 North Carpenter Street | McDonald’s Global HQ | Cut-off Date LTV: | 41.6% | |
| Chicago, IL 60607 | UW NCF DSCR: | 1.45x | ||
| UW NOI Debt Yield: | 11.8% |
COVID-19 Update. The first debt service payment on the McDonald’s Global HQ Whole Loan is due in December 2020 and, as of November 12, 2020, the McDonald’s Global HQ Whole Loan is not subject to any forbearance, modification or debt service relief request. As of November 2, 2020, the borrower sponsor has reported that the McDonald’s Global HQ Property is open and operating; however, the food hall tenant, Politan Row, had closed from April to July due to Chicago’s city guidelines. After re-opening for outdoor dining in August, Politan Row has announced their plans to temporarily close and re-open in the spring of 2021. 100% of tenants by NRA and 100% of tenants by underwritten base rent have paid their full October 2020 rent payments.
The Market. The McDonald’s Global HQ Property is located at 110 North Carpenter Street, in Chicago’s Fulton Market district on the western border of the central business district. The Chicago-Naperville-Joliet Core Based Statistical Area (the “Chicago CBSA”) ranks second nationally in total office inventory behind New York, with nearly 239 million SF of office space. Historically, the Chicago CBSA has been considered the business center of the Midwest, as it is a transportation, banking and investment hub, and a research and educational center attracting various corporate headquarters and regional companies.
According to the appraisal, Fulton Market is evolving from a warehouse district historically to a fast-growing and increasingly diverse area of retail, residential, hospitality and office use. Large corporations, restaurateurs and retailers alike are locating to the area, including McDonald’s, Google, Inc., Uber, Rick Bayless, Soho House and Billy Reid. Fulton Market offers housing options, new and alternative office space, sweeping views of the Chicago skyline, work/live/play amenities including award-winning dining and entertainment, and an educated labor pool. Fulton Market features convenient access via Interstate-90/94 and Interstate-290, as well as a number of nearby public transportation options, including new Chicago Transit Authority Green and Pink line stops, Blue Line stations, three Union Pacific Metra routes from the Ogilvie Transportation Center, and commuter service and Amtrak service out of Chicago’s Union Station. In addition, multiple Divvy shared bike stations surround the Fulton Market area.
From 2016 to 2019, the Fulton Market office submarket Class A inventory increased from 550,000 SF to 1,829,352 SF, with 1,175,962 SF of positive absorption and an increase in average asking rate from $45.10 PSF to $49.00 PSF. From year-end 2019 to the end of the second quarter of 2020, Class A inventory increased by 49.6% to 2,736,850 SF, which meaningful addition of new supply in the short term has pushed direct vacancy to 18.5% and asking rent to $45.28 PSF. 450,922 SF of positive absorption occurred in the second quarter of 2020, with further leasing activity expected to stabilize the vacancy rate.
According to the appraisal, the estimated 2020 population within a one-, three- and five-mile radius was 45,852, 411,562 and 948,591, respectively, and the estimated 2020 average household income within the same radii was $152,747, $133,446 and $111,456, respectively. Within a one-mile radius, population and average household income have grown at a compound annual rate of 2.48% and 3.82%, respectively, from 2000 to 2020.
The following table presents recent sales data at comparable office properties with respect to the McDonald’s Global HQ Property:
| Comparable Sales Summary | ||||||||
Property Address | Submarket | Year Built/ Renovated | Property Size (SF) / Stories | Occupancy | Date of Sale | Sale Price / PSF | Cap Rate | |
McDonald’s Global HQ 110 North Carpenter Street | Fulton Market | 2018 / N/A | 575,018(1) / 9 | 97.3%(1) | Sept-20 | $412,500,000 / $717 | 4.86%(2) | |
Mondelez Headquarters 905 West Fulton Market | Fulton Market | 2019 / N/A | 98,000 / 5 | 97% | May-20 | $85,000,000 / $867 | 4.50% | |
| 500 West Monroe Street | West Loop | 1992 / 2018 | 966,924 / 44 | 99% | Oct-19 | $412,000,000 / $426 | 7.00% | |
Fulton West 1330 West Fulton Street | Fulton Market | 2017 / N/A | 289,287 / 9 | 98% | Sept-19 | $167,500,000 / $579 | 5.40% | |
811 West Fulton 811 West Fulton Market | Fulton Market | 2018 / N/A | 65,000 / 7 | 100% | Sept-19 | $50,300,000 / $774 | 5.00% | |
River Point 444 West Lake Street | West Loop | 2016 / N/A | 1,082,211 / 52 | 99% | Dec-18 | $865,361,600 / $800 | 4.30% | |
One South Dearborn 1 South Dearborn Street | Central Loop | 2005 / N/A | 828,538 / 40 | 95% | Jan-18 | $360,250,000 / $435 | 5.99% | |
Source: Appraisal.
| (1) | Information obtained from the underwritten rent roll. |
| (2) | Cap Rate calculated based on the lender’s underwritten NOI. |
This is not a research report and was not prepared by any Underwriter’s research department. Please see additional important information and qualifications at the end of this Term Sheet.
91
| Office - CBD | Loan #6 | Cut-off Date Balance: | $50,000,000 | |
| 110 North Carpenter Street | McDonald’s Global HQ | Cut-off Date LTV: | 41.6% | |
| Chicago, IL 60607 | UW NCF DSCR: | 1.45x | ||
| UW NOI Debt Yield: | 11.8% |
The following table presents recent leasing data at comparable office properties with respect to the McDonald’s Global HQ Property:
| Comparable Lease Summary | ||||||||
Property Address | Submarket | Year Built | Property Size (SF)/Stories | Tenant | Lease Date / Term (yrs) | Lease Size (SF) | Initial Rent PSF | Rent Steps per annum/TI PSF |
McDonald’s Global HQ 110 North Carpenter Street | Fulton Market | 2018 | 575,018(1) / 9 | McDonald’s | Aug-18 / 15.0 | 532,526(1) | $33.40(1) | 2.25% / $97.17 |
Salesforce Tower 333 West Wolf Point Plaza | River North | 2023 | 1,242,956 / 57 | Salesforce.com | Jun-23 / 17.0 | 525,059 | $41.10 | 2.25% / $110.00 |
BMO Tower 310 South Canal Street | West Loop | 2022 | 1,485,861 / 50 | BMO Harris Bank | Apr-22 / 17.0 | 214,710 | $34.50 | 2.50% / $50.00 |
| 625 West Adams Street | West Loop | 2018 | 441,616 / 20 | CDW | Jun-21 / 15.0 | 249,429 | $30.00 | 2.50% / $140.00 |
| 167 North Green Street | Fulton Market | 2020 | 600,000 / 17 | Duff & Phelps | Nov-20 / 15.0 | 46,000 | $36.50 | 2.50% / $125.00 |
| 333 North Green Street | Fulton Market | 2019 | 553,443 / 19 | WPP | Apr-20 / 15.0 | 265,108 | $32.00 | 2.50% / $195.00 |
| 333 North Green Street | Fulton Market | 2019 | 553,443 / 19 | Flexport | Apr-20 / 7.0 | 40,733 | $34.00 | 2.50% / $88.44 |
| 333 North Green Street | Fulton Market | 2019 | 553,443 / 19 | Convene | Dec-19 / 15.0 | 96,077 | $41.00 | 2.00% / $175.00 |
Mondelez Headquarters 905 West Fulton Market | Fulton Market | 2019 | 98,000 / 5 | Mondelez International | Jan-19 / 15.0 | 77,099 | $37.00 | 2.50% / $120.00 |
Source: Appraisal.
| (1) | Information obtained from the underwritten rent roll. Initial Rent PSF for the McDonald’s Global HQ Property is a straight line average incorporating the 2.25% annual increases. |
The following table presents certain information relating to the appraisal’s market rent conclusions for the McDonald’s Global HQ Property:
| Market Rent Summary | ||||
| Office | Retail (North) | Retail (Southeast) | Retail (Southwest) | |
| Market Rent (PSF) | $33 Net | $60 Modified | $50 Modified | $50 Net |
| Lease Term (Yrs.) | 10 | 10 | 10 | 10 |
| Rental Increase Projection | 2.5% per annum | 2.5% per annum | 2.5% per annum | 2.5% per annum |
Operating History and Underwritten Net Cash Flow. The following table presents certain information relating to the historical operating performance and Underwritten Net Cash Flow of the McDonald’s Global HQ Property:
| Cash Flow Analysis(1) | |||||||||
| 2019 | 8/31/2020 TTM | UW | UW PSF | ||||||
| Base Rent(2) | $18,248,384 | $19,124,507 | $21,927,087 | $38.13 | |||||
| Other Income(3) | $68,742 | $67,777 | $636,245 | $1.11 | |||||
| Expense Reimbursements(4) | $2,098,850 | $5,290,150 | $14,342,820 | $24.94 | |||||
| Vacancy | $0 | $0 | ($1,813,495) | ($3.15) | |||||
| Effective Gross Income | $20,415,976 | $24,482,435 | $35,092,657 | $61.03 | |||||
| Real Estate Taxes | $7,595,293 | $8,376,386 | $8,665,944 | $15.07 | |||||
| Insurance | $244,110 | $223,065 | $280,299 | $0.49 | |||||
| Other Operating Expenses | $4,681,212 | $5,070,327 | $6,090,992 | $10.59 | |||||
| Total Expenses | $12,520,615 | $13,669,779 | $15,037,235 | $26.15 | |||||
| Net Operating Income | $7,895,362 | $10,812,656 | $20,055,422 | $34.88 | |||||
| Capital Expenditures | $0 | $0 | $57,502 | $0.10 | |||||
| TI/LC | $0 | $0 | $50,254 | $0.09 | |||||
| Net Cash Flow | $7,895,362 | $10,812,656 | $19,947,666 | $34.69 | |||||
| Occupancy % | 96.4% | 97.3%(5) | 95.0% | ||||||
| NOI DSCR(6) | 0.57x | 0.79x | 1.46x | ||||||
| NCF DSCR(6) | 0.57x | 0.79x | 1.45x | ||||||
| NOI Debt Yield(6) | 4.6% | 6.4% | 11.8% | ||||||
| NCF Debt Yield(6) | 4.6% | 6.4% | 11.7% | ||||||
| (1) | Further historical information is not available because the McDonald’s Global HQ Property was built in 2018. |
| (2) | UW Base Rent includes vacant space at market rent ($782,850) and straight-line rent averaging for McDonald’s, Walgreens and FedEx Retail ($1,671,710). |
| (3) | UW Other Income includes of parking income of $586,445. The parking operator, Imperial Parking, pays minimum annual rent of $466,200 plus 40% of gross parking revenue in excess of $450,000 and 45% of gross parking revenue in excess of $600,000. |
| (4) | Expense Reimbursements on McDonald’s space were subject to a cap of $13.50 PSF in 2019 and $15.25 PSF in 2020, after which the cap is no longer in effect. As a result, historical reimbursements are not indicative of contractual obligations going forward. |
| (5) | Occupancy as of November 4, 2020. |
| (6) | Debt service coverage ratios and debt yields are based on the McDonald’s Global HQ Senior Loan and exclude the McDonald’s Global HQ Subordinate Companion Loan. |
This is not a research report and was not prepared by any Underwriter’s research department. Please see additional important information and qualifications at the end of this Term Sheet.
92
| Office - CBD | Loan #6 | Cut-off Date Balance: | $50,000,000 | |
| 110 North Carpenter Street | McDonald’s Global HQ | Cut-off Date LTV: | 41.6% | |
| Chicago, IL 60607 | UW NCF DSCR: | 1.45x | ||
| UW NOI Debt Yield: | 11.8% |
Escrows and Reserves.
Real Estate Taxes – During a Cash Sweep Period (as defined below), the McDonald’s Global HQ Borrower is required to deposit monthly 1/12 of the annual estimated real estate taxes, which reserve will be disbursed to the McDonald’s Global HQ Borrower when the Cash Sweep Period expires.
Insurance – During a Cash Sweep Period, the McDonald’s Global HQ Borrower is required to deposit monthly 1/12 of the annual estimated insurance premiums (unless the McDonald’s Global HQ Property is covered by a blanket policy), which will be disbursed to the McDonald’s Global HQ Borrower when the Cash Sweep Period expires.
Replacement Reserves – During a Cash Sweep Period, the McDonald’s Global HQ Borrower is required to deposit monthly $9,584 for replacements, which reserve will be disbursed to the McDonald’s Global HQ Borrower when the Cash Sweep Period expires.
TI/LC Reserves – The McDonald’s Global HQ Borrower is required to deposit any lease termination fees received in connection with any termination or modification, reduction of rents, shortening of term or surrender of space. The McDonald’s Global HQ Borrower is also required during a Cash Sweep Period to deposit monthly $95,836 for tenant improvements and leasing commissions, which amounts will be disbursed to the McDonald’s Global HQ Borrower when the Cash Sweep Period expires.
Free Rent Reserve – The McDonald’s Global HQ Borrower deposited at loan origination $6,161,307 for rent credits and an operating expense cap credit owed to McDonald’s ($5,853,682), rent credit to Politan Row ($240,784) and rent credit to One Medical ($66,840), which amounts are required to be disbursed to the McDonald’s Global HQ Borrower in installments through August 2021, to simulate tenant rent payments.
A “Cash Sweep Period” will occur during the existence of any of (a) an event of default until cured or waived by the lender, (b) a DSCR Sweep Period (as defined below) or (c) a Tenant Sweep Period (as defined below). During the continuance of a Cash Sweep Period, all excess cash is required to be held by the lender as additional collateral for the McDonald’s Global HQ Whole Loan. A Cash Sweep Period may be cured once during the McDonald’s Global HQ Whole Loan term; if occurring more than once, all excess cash will continue to be collected and held by the lender and the McDonald’s Global HQ Borrower will not be entitled to any disbursement of such excess cash until the repayment in full of the McDonald’s Global HQ Whole Loan.
A “DSCR Sweep Period” will commence when the trailing twelve month debt service coverage ratio is less than 1.05x, tested quarterly beginning with the calendar quarter ending December 31, 2021, and will end when the trailing twelve month debt service coverage ratio is at least 1.05x, tested quarterly for two consecutive quarters.
A “Tenant Sweep Period” will occur during the existence of any of:
(a) McDonald’s (or its replacement tenant) terminating its lease or surrendering all or any portion of its leased space (or giving notice of its intent to terminate its lease or surrender all or any portion of its leased space), until the earlier to occur of (x) McDonald’s revoking such notice(s), termination or surrender, and reaffirming its lease or (y) a replacement tenant acceptable to the lender entering into a replacement lease for the surrendered McDonald’s space and being open for business or in occupancy of more than 50% of the space and paying full, unabated rent pursuant to its replacement lease;
(b) McDonald’s (or its replacement tenant) failing to pay base rent or the occurrence of any other material monetary or non-monetary default under its lease beyond notice and cure periods, until such default is cured to the satisfaction of the lender;
(c) McDonald’s (or its replacement tenant or, if applicable, the lease guarantor of a replacement tenant) availing itself of any creditor’s rights laws, until (i) McDonald’s (or its replacement tenant or, if applicable, the lease guarantor of a replacement tenant) has assumed its lease without any material revisions and a court has affirmed such assumption of the lease pursuant to a final, non-appealable order, and (ii) McDonald’s (or its replacement tenant) is operating its business or is in occupancy of more than 50% of the space for at least 60 consecutive business days and is paying full rent as required under the lease; or
(d) McDonald’s (or its replacement tenant) experiences a downgrade in its long-term unsecured debt rating below “BBB-” by S&P or the equivalent by any rating agency rating a securities backed by the McDonald’s Global HQ Whole Loan, until its long-term unsecured debt rating is at least “BBB-” by S&P or the equivalent by any rating agency rating a securities backed by the McDonald’s Global HQ Whole Loan.
Lockbox and Cash Management. The McDonald’s Global HQ Whole Loan is structured with a hard lockbox and in place cash management. Revenues from the McDonald’s Global HQ Property are required to be deposited by tenants directly into the lockbox account, then transferred on each business day to the lender-controlled cash management account and disbursed according to the McDonald’s Global HQ Whole Loan documents. During a Cash Sweep Period, all excess cash is required to be held by the lender as additional security for the McDonald’s Global HQ Whole Loan; if no Cash Sweep Period is in effect, such excess cash is required to be paid to the McDonald’s Global HQ Borrower.
Additional Secured Indebtedness (not including trade debts). The McDonald’s Global HQ Property also secures five pari passu senior promissory notes (the “McDonald’s Global HQ Pari Passu Companion Loans”), which have an aggregate Cut-off Date principal balance of $120,000,000, and the McDonald’s Global HQ Subordinate Companion Loan, which has a Cut-off Date principal balance of $110,000,000. The McDonald’s Global HQ Pari Passu Companion Loans and the McDonald’s Global HQ Subordinate Companion Loan accrue interest at the same rate as the McDonald’s Global HQ Mortgage Loan. The McDonald’s Global HQ Mortgage Loan is entitled to payments of interest and principal on a pro rata and pari passu basis with the McDonald’s Global HQ Pari Passu Companion Loans, which payments are senior in right of payment to the McDonald’s Global HQ Subordinate Companion Loan. Payments of principal will amortize the McDonald’s Global HQ Senior Loan in 186 months, before the McDonald’s Global HQ Subordinate Companion Loan begins to amortize. See Annex A-4 (the amortization schedule for the McDonald’s Global HQ Mortgage Loan) in the Preliminary Prospectus. The holders of the promissory notes evidencing the McDonald’s Global HQ Whole Loan have entered into a co-lender agreement that sets forth the allocation of collections on the McDonald’s Global HQ Whole Loan. See “Description of the Mortgage Pool—The Whole Loans—The McDonald’s Global HQ Pari Passu-A/B Whole Loan” and “Pooling and Servicing Agreement—Servicing of the Servicing Shift Mortgage Loans” in the Preliminary Prospectus.
This is not a research report and was not prepared by any Underwriter’s research department. Please see additional important information and qualifications at the end of this Term Sheet.
93
| Office - CBD | Loan #6 | Cut-off Date Balance: | $50,000,000 | |
| 110 North Carpenter Street | McDonald’s Global HQ | Cut-off Date LTV: | 41.6% | |
| Chicago, IL 60607 | UW NCF DSCR: | 1.45x | ||
| UW NOI Debt Yield: | 11.8% |
Subordinate Note Summary | |||||||||
| B-Note Original Principal Balance | B-Note Interest Rate | Original Term (mos.) | Original Amort. Term (mos.) | Original IO Term (mos.) | Whole Loan UW NCF DSCR | Whole Loan UW NOI Debt Yield | Whole Loan Cut-off Date LTV | ||
| McDonald’s Global HQ Subordinate Companion Loan | $110,000,000 | 2.9350% | 120 | 0 | 120 | 1.17x | 7.2% | 68.5% | |
Mezzanine Loan and Preferred Equity. Not permitted.
Release of Property. Not permitted.
Right of First Offer/Right of First Refusal. None.
Ground Lease. None.
Letter of Credit. None.
Terrorism Insurance. The McDonald’s Global HQ Borrower is required to obtain and maintain property insurance that covers perils and acts of terrorism and is required to obtain and maintain business interruption insurance for 24 months plus a 12-month extended period of indemnity. See “Risk Factors—Risks Relating to the Mortgage Loans—Terrorism Insurance May Not Be Available for All Mortgaged Properties” in the Preliminary Prospectus.
This is not a research report and was not prepared by any Underwriter’s research department. Please see additional important information and qualifications at the end of this Term Sheet.
94
(THIS PAGE INTENTIONALLY LEFT BLANK)
This is not a research report and was not prepared by any Underwriter’s research department. Please see additional important information and qualifications at the end of this Term Sheet.
95
| Retail – Anchored | Loan #7 | Cut-off Date Balance: | $39,939,202 | |
| 3333 Pineville Matthews Road | The Arboretum | Cut-off Date LTV: | 58.7% | |
| Charlotte, NC 28226 | UW NCF DSCR: | 1.70x | ||
| UW NOI Debt Yield: | 9.6% |

This is not a research report and was not prepared by any Underwriter’s research department. Please see additional important information and qualifications at the end of this Term Sheet.
96
| Retail – Anchored | Loan #7 | Cut-off Date Balance: | $39,939,202 | |
| 3333 Pineville Matthews Road | The Arboretum | Cut-off Date LTV: | 58.7% | |
| Charlotte, NC 28226 | UW NCF DSCR: | 1.70x | ||
| UW NOI Debt Yield: | 9.6% |

This is not a research report and was not prepared by any Underwriter’s research department. Please see additional important information and qualifications at the end of this Term Sheet.
97
| Retail – Anchored | Loan #7 | Cut-off Date Balance: | $39,939,202 | |
| 3333 Pineville Matthews Road | The Arboretum | Cut-off Date LTV: | 58.7% | |
| Charlotte, NC 28226 | UW NCF DSCR: | 1.70x | ||
| UW NOI Debt Yield: | 9.6% |
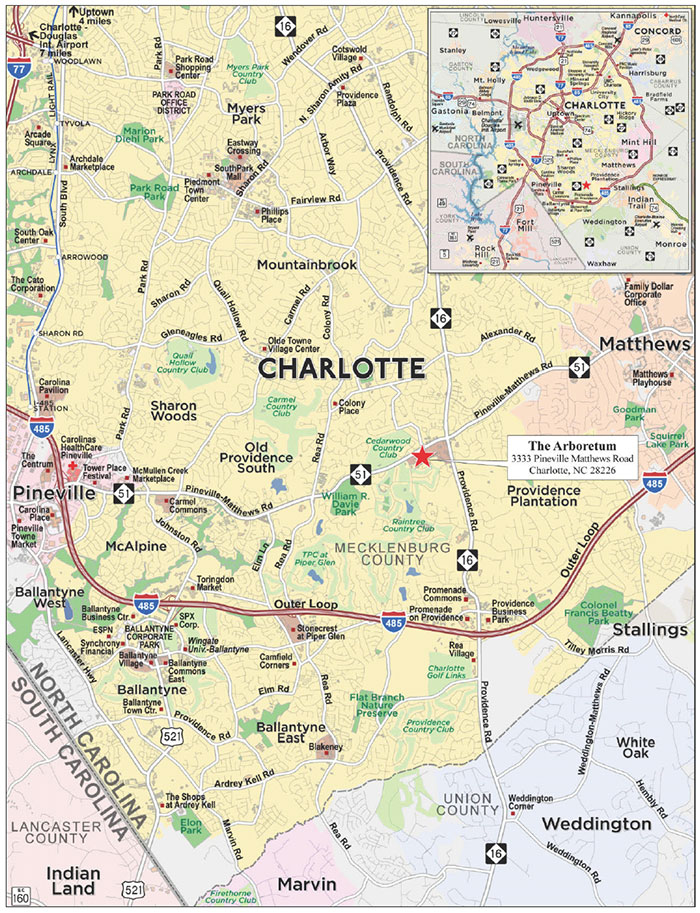
This is not a research report and was not prepared by any Underwriter’s research department. Please see additional important information and qualifications at the end of this Term Sheet.
98
| Mortgage Loan No. 7 – The Arboretum |
| Mortgage Loan Information | Mortgaged Property Information | ||||||
| Mortgage Loan Seller: | WFB | Single Asset/Portfolio: | Single Asset | ||||
| Credit Assessment (DBRSM/Fitch/Moody’s): | NR/NR/NR | Location: | Charlotte, NC 28226 | ||||
| Original Balance(1): | $40,000,000 | General Property Type: | Retail | ||||
| Cut-off Date Balance(1): | $39,939,202 | Detailed Property Type: | Anchored | ||||
| % of Initial Pool Balance: | 4.6% | Title Vesting: | Fee | ||||
| Loan Purpose: | Refinance | Year Built/Renovated: | 1985/2012 | ||||
| Borrower Sponsors: | Riprand Count Arco; AAC | Size: | 555,912 SF | ||||
| Consolidated Properties, LLC | Cut-off Date Balance per SF(1): | $180 | |||||
| Guarantor: | AAC Consolidated Properties, | Maturity Date Balance per SF(1): | $140 | ||||
| LLC | Property Manager: | American Asset Corporation | |||||
| Mortgage Rate: | 3.3580% | (borrower-related) | |||||
| Note Date: | 10/1/2020 | ||||||
| First Payment Date: | 11/11/2020 | ||||||
| Maturity Date: | 10/11/2030 | ||||||
| Original Term to Maturity: | 120 months | ||||||
| Original Amortization Term: | 360 months | ||||||
| IO Period: | 0 months | Underwriting and Financial Information(6) | |||||
| Seasoning: | 1 month | UW NOI: | $9,589,782 | ||||
| Prepayment Provisions(2): | LO (25); DEF (91); O (4) | UW NOI Debt Yield(1): | 9.6% | ||||
| Lockbox/Cash Mgmt Status: | Hard/In Place | UW NOI Debt Yield at Maturity(1): | 12.3% | ||||
| Additional Debt Type(1)(3): | Pari Passu | UW NCF DSCR(1): | 1.70x | ||||
| Additional Debt Balance(1)(3): | $59,908,803 | Most Recent NOI: | $9,808,538 (8/31/2020 TTM) | ||||
| Future Debt Permitted (Type)(4): | Yes (Mezzanine) | 2nd Most Recent NOI: | $10,526,955 (12/31/2019) | ||||
| Reserves(5) | 3rd Most Recent NOI: | $10,722,904 (12/31/2018) | |||||
| Type | Initial | Monthly | Cap | Most Recent Occupancy: | 91.9% (9/11/2020) | ||
| Debt Service Reserve | $3,970,402 | $0 | NAP | 2nd Most Recent Occupancy: | 99.0% (12/31/2019) | ||
| Leasing Reserve | $2,000,000 | $69,489(5) | $5,000,000(5) | 3rd Most Recent Occupancy: | 100.0% (12/31/2018) | ||
| RE Taxes | $124,209 | $124,207(5) | NAP | Appraised Value (as of): | $170,000,000 (8/8/2020) | ||
| Insurance | $0 | Springing | NAP | Appraised Value per SF: | $306 | ||
| Replacement Reserves | $0 | $17,604 | NAP | Cut-off Date LTV Ratio(1): | 58.7% | ||
| Deferred Maintenance | $112,500 | $0 | NAP | Maturity Date LTV Ratio(1): | 45.7% | ||
| Sources and Uses | ||||||
| Sources | Proceeds | % of Total | Uses | Proceeds | % of Total | |
| Whole Loan Amount: | $100,000,000 | 99.9% | Loan Payoff: | $92,388,311 | 92.3% | |
| Cash Equity Contribution | $52,629 | 0.1% | Upfront Reserves: | $6,207,111 | 6.2% | |
| Closing Costs: | $1,457,206 | 1.5% | ||||
| Total Sources: | $100,052,629 | 100.0% | Total Uses: | $100,052,629 | 100.0% | |
| (1) | The Arboretum Mortgage Loan (as defined below) is part of the Arboretum Whole Loan (as defined below), which is comprised of three pari passu promissory notes with an aggregate original principal balance of $100,000,000. The Cut-off Date Balance per SF, Maturity Date Balance per SF, UW NOI Debt Yield, UW NOI Debt Yield at Maturity, UW NCF DSCR, Cut-off Date LTV Ratio and Maturity Date LTV Ratio numbers presented above are based on the Arboretum Whole Loan. |
| (2) | At any time after the earlier of (i) November 11, 2024 and (ii) two years from the closing date of the securitization that includes the last pari passu note of the Arboretum Whole Loan to be securitized, the Arboretum Borrower (as defined below) has the right to defease the Arboretum Whole Loan in whole, but not in part until July 11, 2030. The assumed lockout period of 25 payments is based on the closing date of this transaction in November 2020. |
| (3) | See “The Mortgage Loan” and “Additional Secured Indebtedness (not including trade debts)” below for further discussion of additional debt. |
| (4) | See “Mezzanine Loan and Preferred Equity” below for further discussion of future permitted mezzanine debt. |
| (5) | See “Escrows and Reserves” below for further discussion of reserve requirements. |
| (6) | The novel coronavirus pandemic is an evolving situation and could impact the Arboretum Whole Loan more severely than assumed in the underwriting of the Arboretum Whole Loan and could adversely affect the NOI, NCF and occupancy information, as well as the appraised value and the DSCR, LTV and Debt Yield metrics presented above and herein. See “Risk Factors-—Risks Related to Market Conditions and Other External Factors—The Coronavirus Pandemic Has Adversely Affected the Global Economy and Will Likely Adversely Affect the Performance of the Mortgage Loans” in the Preliminary Prospectus. |
The Mortgage Loan. The seventh largest mortgage loan (the “Arboretum Mortgage Loan”) is part of a whole loan (the “Arboretum Whole Loan”) that is evidenced by three pari passu promissory notes in the aggregate original principal amount of $100,000,000. The Arboretum Whole Loan is secured by a first priority fee mortgage encumbering an anchored retail center located in Charlotte, North Carolina (the “Arboretum Property”). The Arboretum Mortgage Loan is evidenced by the controlling promissory Note A-1 in the original principal amount of $40,000,000. The non-controlling promissory Notes A-2 and A-3 in the aggregate original principal amount of $60,000,000 (the “Arboretum Serviced Pari Passu Companion Loans”) are currently held by Wells Fargo Bank, N.A. and are expected to be contributed to future securitization trusts. The Arboretum Whole Loan will be serviced pursuant to the pooling and servicing agreement for the BANK 2020-BNK29 securitization trust. See “Description of the Mortgage Pool—The Whole Loans—The Serviced Pari Passu
This is not a research report and was not prepared by any Underwriter’s research department. Please see additional important information and qualifications at the end of this Term Sheet.
99
| Retail – Anchored | Loan #7 | Cut-off Date Balance: | $39,939,202 | |
| 3333 Pineville Matthews Road | The Arboretum | Cut-off Date LTV: | 58.7% | |
| Charlotte, NC 28226 | UW NCF DSCR: | 1.70x | ||
| UW NOI Debt Yield: | 9.6% |
Whole Loans and “Pooling and Servicing Agreement” in the Preliminary Prospectus. The proceeds of the Arboretum Whole Loan, in addition to a cash equity contribution from the borrower sponsors, were used to pay off existing debt (previously securitized in WFRBS 2011-C2), pay closing costs and fund reserves.
| Arboretum Whole Loan Summary | ||||
| Note | Original Balance | Cut-off Date Balance | Note Holder | Controlling Piece |
| A-1 | $40,000,000 | $39,939,202 | BANK 2020-BNK29 | Yes |
| A-2 | $35,000,000 | $34,946,802 | Wells Fargo Bank, N.A. | No |
| A-3 | $25,000,000 | $24,962,001 | Wells Fargo Bank, N.A. | No |
| Total | $100,000,000 | $99,848,005 | ||
The Borrower and the Borrower Sponsors. The borrower is Arboretum Retail, LLC, a Delaware limited liability company and single purpose entity with one independent director (the “Arboretum Borrower”). Legal counsel to the Arboretum Borrower delivered a non-consolidation opinion in connection with the origination of the Arboretum Whole Loan. The Arboretum Borrower sponsors are Riprand Count Arco and AAC Consolidated Properties, LLC, and the non-recourse carveout guarantor is AAC Consolidated Properties, LLC.
Riprand Count Arco is the founder and chairman of American Asset Corporation (“AAC”), which is the parent company of AAC Consolidated Properties, LLC. AAC is a diversified real estate company specializing in development, construction management, leasing and brokerage, and asset and property management. Headquartered in New York with offices in Charlotte and Raleigh, North Carolina, AAC was founded in 1986 and has been involved in over 8.0 million SF of real estate projects, including development of over 6.0 million SF. AAC’s current portfolio comprises nearly 6 million SF of retail, office, and flex space.
The Property. The Arboretum Property is a 12-building Class A retail power center totaling 555,912 SF and located in Charlotte, North Carolina. Built in 1985 and most recently renovated in 2012, the property is situated on a 66.9-acre parcel and is anchored by Harris Teeter, Walmart, Bed Bath & Beyond and Barnes & Noble. Additional notable in-line tenants include Walgreens, JPMorgan Chase, Sephora, Michaels and Verizon, plus several dining options including McDonald’s, Panera Bread, Chop’t Salad, Five Guys Burgers and Fries, and Firehouse Subs. In addition, Regal Entertainment Group/Cinebarre (“Regal Cinemas”) movie theatre accounts for 6.5% of the NRA and is currently not operating due to COVID-19; however, the tenant was underwritten as vacant by the lender. There are four tenants totaling 8.7% of underwritten base rent that are ground lease tenants and own their improvements (McDonald’s, JPMorgan Chase, Shell and Panera Bread). Twenty-four tenants totaling 63.9% of the NRA and 46.3% of underwritten base rent have been in occupancy for at least 20 years, and all four anchor tenants have been in occupancy since at least 1997. The Arboretum Property contains 3,115 surface parking spaces, resulting in a parking ratio of approximately 5.6 spaces per 1,000 SF of rentable area. As of September 11, 2020, the Arboretum Property was 91.9% occupied by 87 tenants and has averaged 98.0% occupancy since 2016.
Major Tenants.
Walmart (120,405 SF; 21.7% of NRA; 5.8% of underwritten base rent). Walmart has been a tenant since February 1990 and reported gross sales of approximately $52.5 million ($436 PSF) for the trailing 12-month period ending January 31, 2020. Walmart has three, 5-year extension options remaining and does not have any termination options. Walmart’s current base rent is $5.15 PSF, which is flat through the remaining loan term as well as its three remaining 5-year extension options.
Harris Teeter (68,119 SF; 12.3% of NRA; 10.6% of underwritten base rent). Harris Teeter, a wholly-owned subsidiary of The Kroger Co., was co-founded in 1960 by North Carolina grocers W.T. Harris and Willis Teeter. Harris Teeter is headquartered in Matthews, North Carolina, and operates over 230 stores and 14 fuel centers in seven states and the District of Columbia. Harris Teeter has been a tenant at the Arboretum Property since June 1997 and reported gross sales of approximately $38.1 million ($560 PSF) for the trailing 12-month period ending June 30, 2020, which are up approximately 12.2% compared to 2019 sales. Harris Teeter has one, 5-year extension option remaining and does not have any termination options.
Bed Bath & Beyond (35,000 SF; 6.3% of NRA; 4.9% of underwritten base rent). Bed Bath & Beyond has been a tenant at the Arboretum Property since April 1997 and reported gross sales of approximately $7.1 million ($202 PSF) for 2019. Bed Bath & Beyond does not have any extension options or termination options. The Bed Bath & Beyond store at the Arboretum Property was not included on the list of stores released by the company in September 2020 that are expected to close by the end of 2020.
Barnes & Noble (24,994 SF; 4.5% of NRA; 3.3% of underwritten base rent). Barnes & Noble has been a tenant at the Arboretum Property since April 1997 and reported gross sales of approximately $4.4 million ($177 PSF) for the trailing 12-month period ending March 31, 2020. Barnes & Noble does not have any termination options. Barnes & Noble most recently exercised a 5-year renewal option effective May 1, 2020.
This is not a research report and was not prepared by any Underwriter’s research department. Please see additional important information and qualifications at the end of this Term Sheet.
100
| Retail – Anchored | Loan #7 | Cut-off Date Balance: | $39,939,202 | |
| 3333 Pineville Matthews Road | The Arboretum | Cut-off Date LTV: | 58.7% | |
| Charlotte, NC 28226 | UW NCF DSCR: | 1.70x | ||
| UW NOI Debt Yield: | 9.6% |
The following table presents certain information relating to the tenancy at the Arboretum Property:
| Tenant Summary | |||||||||
| Tenant Name | Credit Rating (Fitch/Moody’s/ S&P)(1) | Tenant SF | Approx. % of SF | Annual UW Rent(2) | % of Total Annual UW Rent | Annual UW Rent PSF(2) | Renewal Options | ||
| Termination Option (Y/N) | Lease Expiration | ||||||||
| Anchor Tenants | |||||||||
| Walmart | AA/Aa2/AA | 120,405 | 21.7% | $620,043 | 5.8% | $5.15 | N | 1/26/2025 | 3, 5-year |
| Harris Teeter | NR/Baa1/BBB | 68,119 | 12.3% | $1,130,775 | 10.6% | $16.60 | N | 6/17/2022 | 1, 5-year |
| Bed Bath & Beyond | NR/Ba3/B+ | 35,000 | 6.3% | $525,000 | 4.9% | $15.00 | N | 1/31/2023 | None |
| Barnes & Noble | NR/NR/NR | 24,994 | 4.5% | $349,916 | 3.3% | $14.00 | N | 6/30/2025 | None |
| Total/Wtd. Avg. | 248,518 | 44.7% | $2,625,735 | 24.6% | $10.57 | ||||
| Major Tenants(3) | |||||||||
| Michaels | NR/NR/B | 23,712 | 4.3% | $261,543 | 2.5% | $11.03 | N | 5/31/2023 | 2, 5-year |
| Walgreens | BBB-/Baa2/BBB | 12,500 | 2.2% | $250,000 | 2.3% | $20.00 | N | 3/31/2022 | None |
| Rack Room Shoes | NR/NR/NR | 9,068 | 1.6% | $312,846 | 2.9% | $34.50 | N | 1/31/2022 | 1, 5-year |
| McDonald’s | NR/Baa1/BBB+ | (4) | (4) | $288,951 | 2.7% | (4) | N | 10/17/2025 | 1, 5-year |
| Shell | AA-/Aa2/AA- | (4) | (4) | $240,792 | 2.3% | (4) | N | 10/19/2030 | 1, 5-year |
| JPMorgan Chase | AA-/A2/A- | (4) | (4) | $230,000 | 2.2% | (4) | N | 8/31/2040 | 4, 5-year |
| Total/Wtd. Avg. | 45,280 | 8.1% | $1,584,132 | 14.9% | $18.21(4) | ||||
| Non-Major Tenants | 216,845 | 39.0% | $6,442,320 | 60.5% | $28.95(4) | ||||
| Occupied Collateral Total | 510,643 | 91.9% | $10,652,187 | 100.0% | $19.05(4) | ||||
| Vacant Space | 45,269 | 8.1% | |||||||
| Total/Wtd. Avg. | 555,912 | 100.0% | |||||||
| (1) | Certain ratings are those of the parent company whether or not the parent guarantees the lease. |
| (2) | Annual UW Rent and Annual UW Rent PSF include contractual rent steps through October 2021 totaling $250,967. |
| (3) | Regal Cinemas currently occupies a 36,000 SF space (6.5% of NRA) and is currently closed due to COVID-19; however, the tenant was underwritten as vacant in terms of both occupancy and rent. |
| (4) | Four tenants totaling 8.7% of underwritten base rent (McDonald’s, Shell, JPMorgan Chase and Panera Bread) are ground lease tenants and own their improvements with no associated NRA. The weighted average Annual UW Rent PSF calculations exclude the underwritten base rent associated with these leased fee tenants. |
The following table presents a summary of sales and occupancy costs for certain tenants at the Arboretum Property.
| Historical In-Line Sales and Occupancy Cost Summary(1) | |||||||
| 2017 Sales (PSF) | 2018 Sales (PSF) | 2019 Sales (PSF) | TTM Sales (Gross) | TTM Sales (PSF) | TTM Period |
Occupancy Cost(2) | |
| Walmart(3) | $464 | $454 | $449 | $52,517,631 | $436 | Jan-2020 | 2.7% |
| Harris Teeter | $525 | $535 | $499 | $38,135,213 | $560 | Jun-2020 | 4.4% |
| Bed Bath & Beyond(4) | $244 | $233 | $202 | NAV | NAV | NAP | 10.3% |
| Barnes & Noble | $194 | $194 | $185 | $4,415,752 | $177 | Mar-2020 | 11.8% |
| Michaels | $158 | $156 | $156 | $3,477,766 | $147 | Apr-2020 | 11.5% |
| Walgreens | NAV | $377 | $351 | $5,488,480 | $439 | Mar-2020 | 6.1% |
| Rack Room Shoes | $256 | $255 | $223 | $1,572,036 | $173 | Aug-2020 | 23.8% |
| McDonald’s(5) | NAV | NAV | NAV | NAV | NAV | NAP | NAV |
| Shell(5) | NAV | NAV | NAV | NAV | NAV | NAP | NAV |
| JPMorgan Chase(5) | NAV | NAV | NAV | NAV | NAV | NAP | NAV |
| (1) | Information obtained from the Arboretum Borrower. |
| (2) | Occupancy Cost is based on underwritten base rent and reimbursements and most recently reported sales. |
| (3) | Walmart reports sales at the end of each January. The sales shown represent the trailing 12-month period ending January 31st of each year. |
| (4) | Bed Bath & Beyond reports sales at the end of each calendar year. |
| (5) | McDonald’s, Shell and JPMorgan Chase are not required to report sales. |
This is not a research report and was not prepared by any Underwriter’s research department. Please see additional important information and qualifications at the end of this Term Sheet.
101
| Retail – Anchored | Loan #7 | Cut-off Date Balance: | $39,939,202 | |
| 3333 Pineville Matthews Road | The Arboretum | Cut-off Date LTV: | 58.7% | |
| Charlotte, NC 28226 | UW NCF DSCR: | 1.70x | ||
| UW NOI Debt Yield: | 9.6% |
The following table presents certain information relating to the lease rollover schedule at the Arboretum Property:
| Lease Rollover Schedule(1)(2) | ||||||||
| Year | # of Leases Rolling | SF Rolling | UW Rent PSF Rolling(3) | Approx. % of Total SF Rolling | Approx. Cumulative % of SF Rolling | Total UW Rent Rolling | Approx. % of Total Rent Rolling | Approx. Cumulative % of Total Rent Rolling |
| MTM | 0 | 0 | $0.00 | 0.0% | 0.0% | $0 | 0.0% | 0.0% |
| 2020 | 2 | 7,000 | $27.10 | 1.3% | 1.3% | $189,710 | 1.8% | 1.8% |
| 2021 | 7 | 12,300 | $32.71 | 2.2% | 3.5% | $402,384 | 3.8% | 5.6% |
| 2022 | 14 | 113,508 | $22.47 | 20.4% | 23.9% | $2,550,238 | 23.9% | 29.5% |
| 2023 | 18 | 109,079 | $20.01 | 19.6% | 43.5% | $2,347,483 | 22.0% | 51.5% |
| 2024 | 13 | 36,282 | $30.90 | 6.5% | 50.0% | $1,121,262 | 10.5% | 62.1% |
| 2025 | 10 | 175,973 | $9.50 | 31.7% | 81.7% | $1,961,326 | 18.4% | 80.5% |
| 2026 | 8 | 19,547 | $35.91 | 3.5% | 85.2% | $701,836 | 6.6% | 87.1% |
| 2027 | 3 | 8,357 | $33.21 | 1.5% | 86.7% | $277,560 | 2.6% | 89.7% |
| 2028 | 1 | 3,000 | $37.95 | 0.5% | 87.3% | $113,850 | 1.1% | 90.7% |
| 2029 | 2 | 6,451 | $32.78 | 1.2% | 88.4% | $211,466 | 2.0% | 92.7% |
| 2030 | 4 | 9,398 | $32.38 | 1.7% | 90.1% | $545,071 | 5.1% | 97.8% |
| 2031 & Beyond | 5 | 9,748 | $23.59 | 1.8% | 91.9% | $230,000 | 2.2% | 100.0% |
| Vacant | 0 | 45,269 | $0.00 | 8.1% | 100.0% | $0 | 0.0% | 100.0% |
| Total/Wtd. Avg. | 87 | 555,912 | $19.05(3) | 100.0% | $10,652,187 | 100.0% | ||
| (1) | Information is based on the underwritten rent roll. |
| (2) | Certain tenants may have lease termination options that are exercisable prior to the originally stated expiration date of the related lease and are not considered in the rollover schedule. |
| (3) | Four tenants totaling 8.7% of underwritten base rent (McDonald’s, Shell, JPMorgan Chase and Panera Bread) are ground lease tenants and own their improvements with no associated net rentable area. Wtd. Avg. Annual UW Rent PSF Rolling excludes vacant space and underwritten base rent attributed to ground lease tenants. |
COVID-19 Update. As of November 13, 2020, the Arboretum Whole Loan is current as of the November debt service payment and is not subject to any forbearance, modification or debt service relief request. As of November 10, 2020, the borrower sponsor reported that all tenants were open and operating except for Regal Cinemas (6.5% of NRA; underwritten as vacant), Arboretum Cleaners (0.2% of NRA; underwritten as vacant), and Handpicked, Inc. (0.2% of NRA; underwritten as vacant). As of October 20, 2020, tenants representing approximately 91.7% of the occupied NRA and 89.1% of underwritten base rent made their full rent payment for October 2020, and approximately 90.9% of underwritten base rent was paid for October 2020. Thirty-one tenants, representing approximately 27.5% of underwritten base rent, were granted rent deferrals ranging from one to four months and each of the leases was extended by the number of months of deferred rent.
The Market. The Arboretum Property is located in the southeastern area of Charlotte, North Carolina, approximately 10.7 miles from the central business district. The property is situated at the signalized intersection of Pineville-Matthews Road (NC Highway 51) and Providence Road (NC Highway 16). Primary access to the area is provided by Interstates 485 and Highways 521, 74 and 21, with approximate driving times to the central business district and Charlotte Douglas International Airport of 25 minutes and 30 minutes, respectively. According to the appraisal, the surrounding area is primarily single-family residential homes with some retail development along main thoroughfares and is in close proximity to Interstates 77 and 485. Within a three- and five-mile radius of the Arboretum Property, the 2020 average household income was approximately $154,552 and $136,688, respectively; and within the same radii, the 2020 estimated population was 69,720 and 203,278, respectively. Since 2010, the population within a three-mile radius has increased by approximately 8.2% and the number of households has increased by approximately 8.5%. According to the appraisal, the top 5 employers in the surrounding area are Atrium Health, Wells Fargo & Co., Walmart Inc., Bank of America Corp., and Novant Health Inc.
According to a third-party market research report, the property is situated within the Outer Southeast submarket of the Charlotte retail market. As of the third quarter of 2020, the submarket reported total inventory of approximately 13.2 million SF with a 5.6% vacancy rate and average asking rents of $26.28 PSF. The appraisal identified five comparable properties that reported occupancy rates ranging from 93% to 97%. The appraisal concluded to market rents ranging from $5.50 PSF for big box anchor space to $35.00 PSF for in-line space (see table below).
The following table presents certain information relating to the appraisal’s market rent conclusion for the Arboretum Property:
| Market Rent Summary | ||||||
| In-line Space | Large In-line Space | Jr. Anchor Space | Grocery Anchor Space | Cinema Space | Big Box Anchor Space | |
| Market Rent (PSF) | $35.00 | $20.00 | $15.00 | $17.50 | $12.00 | $5.50 |
| Lease Term (Years) | 5 | 7 | 10 | 10 | 10 | 10 |
| Lease Type (Reimbursements) | NNN | NNN | NNN | NNN | NNN | NNN |
| Rent Increase Projection | 3%/year | 3%/year | 2%/year | 2%/year | 2%/year | 2%/year |
Source: Appraisal.
This is not a research report and was not prepared by any Underwriter’s research department. Please see additional important information and qualifications at the end of this Term Sheet.
102
| Retail – Anchored | Loan #7 | Cut-off Date Balance: | $39,939,202 | |
| 3333 Pineville Matthews Road | The Arboretum | Cut-off Date LTV: | 58.7% | |
| Charlotte, NC 28226 | UW NCF DSCR: | 1.70x | ||
| UW NOI Debt Yield: | 9.6% |
The table below presents certain information relating to comparable sales pertaining to the Arboretum Property identified by the appraiser:
| Comparable Sales | ||||
Property Name | Location | Rentable Area (SF) | Sale Date | Sale Price (PSF) |
| Mount Pleasant Towne Centre | Mount Pleasant, SC | 510,000 | Feb-2020 | $288 |
| Garden City Center | Cranston, RI | 530,629 | Jan-2020 | $341 |
| Free State Shopping Center | Bowie, MD | 264,152 | May-2019 | $273 |
| The Green at Lakewood Ranch | Lakewood Ranch, FL | 123,000 | Dec-2018 | $377 |
| Riverchase Village | Hoover, AL | 175,673 | Oct-2018 | $223 |
| Center of Winter Park | Winter Park, FL | 258,885 | Aug-2018 | $281 |
Source: Appraisal.
The following table reflects the competitive retail properties with respect to the Arboretum Property as identified in the appraisal:
| Property Name/Location | Year Built/Renovated | Size (SF) | Occupancy | Anchor Tenants | Distance to Subject (mi.) |
| The Arboretum Property (Subject) | 1985/2012 | 555,912 | 92% | Harris Teeter, Walmart, Bed Bath & Beyond, Barnes & Noble | -- |
Stonecrest at Piper Glen 7824 Rea Road Charlotte, NC | 1998/2003 | 294,495 | 95% | Harris Teeter, Regal Cinemas, ULTA, Michael’s, Target | 4.5 |
Blakeney Shopping Center 9856 Rea Road Charlotte, NC | 2005/NAV | 544,107 | 97% | HomeGoods, Marshalls, Harris Teeter, Target | 6.3 |
Plantation Market 3016 Weddington Road Charlotte, NC | 1990/NAV | 85,732 | 93% | Harris Teeter | 5.0 |
Brookdale Shopping Center 9601-9651 Brookdale Drive Charlotte, NC | 2004/NAV | 85,422 | 97% | Harris Teeter | 24.8 |
Ballantyne Corners 11318 North Community House Road Charlotte, NC | 2010/NAV | 60,146 | 97% | NAP (unanchored) | 5.7 |
Source: Appraisal; underwritten rent roll dated September 11, 2020.
This is not a research report and was not prepared by any Underwriter’s research department. Please see additional important information and qualifications at the end of this Term Sheet.
103
| Retail – Anchored | Loan #7 | Cut-off Date Balance: | $39,939,202 | |
| 3333 Pineville Matthews Road | The Arboretum | Cut-off Date LTV: | 58.7% | |
| Charlotte, NC 28226 | UW NCF DSCR: | 1.70x | ||
| UW NOI Debt Yield: | 9.6% |
Operating History and Underwritten Net Cash Flow. The following table presents certain information relating to the historical operating performance and Underwritten Net Cash Flow at the Arboretum Property:
| Cash Flow Analysis | ||||||
| 2017 | 2018 | 2019 | TTM 8/31/2020 | UW | UW PSF | |
| Base Rent | $11,048,141 | $11,466,264 | $11,546,621 | $10,414,887 | $10,652,187(1) | $19.16 |
| Grossed Up Vacant Space | 0 | 0 | 0 | 0 | 756,415 | 1.36 |
| Gross Potential Rent | $11,048,141 | $11,466,264 | $11,546,621 | $10,414,887 | $11,408,602 | $20.52 |
| Other Income | 7,447 | 22,954 | 19,699 | 11,101 | 11,101 | 0.02 |
| Percentage Rent | 206,883 | 211,271 | 171,749 | 250,347 | 225,960 | 0.41 |
| Total Recoveries | 2,581,317 | 2,602,734 | 2,523,542 | 2,725,692 | 2,459,557 | 4.42 |
| Net Rental Income | $13,843,788 | $14,303,223 | $14,261,611 | $13,402,026 | 14,105,219 | $25.37 |
| (Vacancy & Credit Loss) | 0 | 0 | 0 | 0 | (756,415)(2) | (1.36) |
| Effective Gross Income | $13,843,788 | $14,303,223 | $14,261,611 | $13,402,026 | $13,348,804 | $24.01 |
| Real Estate Taxes | 1,088,845 | 1,103,565 | 1,362,227 | 1,362,227 | 1,419,509 | 2.55 |
| Insurance | 74,232 | 76,404 | 78,211 | 79,400 | 82,886 | 0.15 |
| Management Fee | 563,525 | 564,567 | 581,324 | 532,515 | 533,952 | 0.96 |
| Other Operating Expenses | 1,552,797 | 1,835,783 | 1,712,894 | 1,619,346 | 1,722,674 | 3.10 |
| Total Operating Expenses | $3,279,399 | $3,580,319 | $3,734,656 | $3,593,488 | $3,759,022 | $6.76 |
| Net Operating Income | $10,564,389 | $10,722,904 | $10,526,955 | $9,808,538 | $9,589,782 | $17.25 |
| Replacement Reserves | 0 | 0 | 0 | 0 | 211,247 | 0.38 |
| TI/LC | 0 | 0 | 0 | 0 | 355,912 | 0.64 |
| Net Cash Flow | $10,564,389 | $10,722,904 | $10,526,955 | $9,808,538 | $9,022,624 | $16.23 |
| Occupancy % | 99.0% | 100.0% | 99.0% | 91.9%(3) | 91.9%(3) | |
| NOI DSCR(4) | 2.00x | 2.03x | 1.99x | 1.85x | 1.81x | |
| NCF DSCR(4) | 2.00x | 2.03x | 1.99x | 1.85x | 1.70x | |
| NOI Debt Yield(4) | 10.6% | 10.7% | 10.5% | 9.8% | 9.6% | |
| NCF Debt Yield(4) | 10.6% | 10.7% | 10.5% | 9.8% | 9.0% | |
| (1) | Underwritten base rent includes contractual rent steps through October 2021 totaling $250,967. |
| (2) | The underwritten economic vacancy is 6.6%. The Arboretum Property was 91.9% physically occupied and 93.4% economically occupied as of September 11, 2020. |
| (3) | Represents occupancy as of September 11, 2020. |
| (4) | The debt service coverage ratios and debt yields shown represent the Arboretum Whole Loan. |
Escrows and Reserves.
Debt Service Reserve – The loan documents require an upfront debt service reserve of $3,970,402 as additional collateral for the Arboretum Whole Loan. On and after the monthly payment date in February 2021, as long as no event of default is continuing, the lender is required to make monthly disbursements to the Arboretum Borrower in the amount of the monthly debt service payment as long as the Arboretum Borrower certifies to the lender that (i) both the physical and economic occupancy are at least 95%, and (ii) the net cash flow debt yield is equal to or greater than 9.1%, which amount will be used for the payment of monthly debt service; provided, however, that the insufficiency of the Debt Service Reserve funds available for disbursement will not relieve the Arboretum Borrower from its obligation to make any payment required by the loan documents.
Leasing Reserve – The loan documents require an upfront general tenant improvements and leasing commissions (“TI/LC”) reserve of $2,000,000 and ongoing monthly TI/LC reserves of (i) $69,489 for the monthly payment date in November 2020 through and including the monthly payment date in October 2021; (ii) $57,908 for the monthly payment date in November 2021 through and including the monthly payment date in October 2022; and (iii) $46,326 from and after the monthly payment date in November 2022. Deposits in the Leasing Reserve will be capped at $5,000,000 as long as (a) no event of default is continuing, and (b) the debt yield is greater than or equal to 7.5%.
Real Estate Taxes – The loan documents require an upfront real estate tax reserve of $124,209 and ongoing monthly real estate tax reserves in an amount equal to one-twelfth of the real estate taxes that the lender estimates will be payable during the next 12 months (initially $124,207); provided, however, that the Arboretum Borrower is not required to make the monthly tax deposit attributable to the Walmart parcel as long as (i) no event of default is continuing; (ii) Walmart is obligated to pay taxes directly and is actually making such payments; (iii) the Arboretum Borrower delivers timely evidence to the lender that the applicable taxes have been paid prior to delinquency; and (iv) Walmart’s lease is in full force and effect with neither the Arboretum Borrower nor the tenant being in default of any obligations beyond any applicable notice and cure periods.
Insurance – The loan documents do not require ongoing monthly insurance reserve deposits as long as (i) no event of default is continuing; (ii) the Arboretum Property is covered under a blanket or umbrella policy acceptable to the lender; (iii) the Arboretum Borrower provides the lender with evidence
This is not a research report and was not prepared by any Underwriter’s research department. Please see additional important information and qualifications at the end of this Term Sheet.
104
| Retail – Anchored | Loan #7 | Cut-off Date Balance: | $39,939,202 | |
| 3333 Pineville Matthews Road | The Arboretum | Cut-off Date LTV: | 58.7% | |
| Charlotte, NC 28226 | UW NCF DSCR: | 1.70x | ||
| UW NOI Debt Yield: | 9.6% |
of renewal of such policies; and (iv) the Arboretum Borrower provides the lender with paid receipts for payment of the insurance premiums by no later than five days prior to the policy expiration dates.
Replacement Reserve – The loan documents require ongoing monthly replacement reserve deposits of $17,604, which the lender may require the Arboretum Borrower to increase (not more than once per year) if the lender reasonably determines such increase is necessary to maintain the proper operation of the Arboretum Property.
Deferred Maintenance Reserve – The loan documents require an upfront reserve of $112,500 for deferred maintenance items, which are required to be completed within 180 days of origination.
Lockbox and Cash Management. The Arboretum Whole Loan is structured with an in-place hard lockbox, into which the Arboretum Borrower and property manager are required to cause all rents to be deposited directly by tenants. In the absence of a Cash Management Period (as defined below), all funds in the lockbox account are required to be distributed to the Arboretum Borrower’s operating account. During a Cash Management Period, (i) all funds in the lockbox account are required to be swept on each business day to a lender-controlled cash management account; (ii) so long as a Cash Trap Event Period (as defined below) is not in effect, all excess funds will be swept to the Arboretum Borrower’s operating account; and (iii) during a Cash Trap Event Period, all excess funds will be swept to an excess cash flow subaccount controlled by the lender and held for so long as such Cash Trap Event Period continues.
A “Cash Management Period” means (i) the period commencing on the origination date continuing until on or after October 1, 2021, the Arboretum Property achieves (a) 95% economic occupancy and physical occupancy and (b) a net cash flow debt yield equal to or greater than 9.1%; and/or (ii) a Cash Trap Event Period.
A “Cash Trap Event Period” will commence upon the earlier of the following:
| (iii) | the occurrence of an event of default; |
| (iv) | the net cash flow debt yield falling below 8.0% (tested quarterly); or |
| (ii) | a Major Tenant Event Period (as defined below). |
A Cash Trap Event Period will end upon the occurrence of the following:
| ● | with regard to clause (i), the cure of such event of default; |
| ● | with regard to clause (ii), the net cash flow debt yield being equal to or greater than 8.5% for two consecutive calendar months; or |
| ● | with regard to clause (iii), a Major Tenant Event Period Cure (as defined below). |
A “Major Tenant Event Period” will commence upon the earliest to occur of the following with respect to Harris Teeter and/or Walmart, as well as either tenant’s successors and assigns, and any replacement tenant for all or a portion of such tenant’s space (individually or collectively, as applicable, “Major Tenant”):
| (i) | a default under a Major Tenant’s lease (beyond any applicable notice and cure period); |
| (ii) | the date that a Major Tenant “goes dark”, remains closed to the public in its space, vacates, or otherwise fails to continuously occupy its space for a period of three or more consecutive months (or gives notice of its intent to commence any of the foregoing); |
| (iii) | a Major Tenant filing, or otherwise becoming involved as debtor in, a bankruptcy or similar insolvency proceeding; or |
| (iv) | a Major Tenant terminating or canceling its lease (or such lease failing or ceasing to be in full force and effect), or giving notice of any of the foregoing. |
A “Major Tenant Event Period Cure” will occur upon (a) the Arboretum Property (including any replacement leases for the Major Tenant space) having physical and economic occupancy equal to 95% or greater; (b) the net cash flow debt yield being equal to or greater than 8.5%; and (c):
| ● | with regard to clause (i) above, (x) a Major Tenant Re-Tenanting Event (as defined below) having occurred or (y) the applicable default having been cured and no other default under the related lease having occurred (beyond any notice and cure period) for a period of two consecutive calendar quarters; |
| ● | with regard to clause (ii) above, (x) a Major Tenant Re-Tenanting Event having occurred or (y) the applicable Major Tenant having resumed its normal business operations in its space and having been open during customary hours for a period of two consecutive calendar quarters; |
| ● | with regard to clause (iii) above, (x) a Major Tenant Re-Tenanting Event having occurred or (y) the bankruptcy or insolvency proceeding having been terminated in a manner satisfactory to the lender, the related lease having been affirmed, and the terms of such lease, as affirmed, being satisfactory to the lender; or |
| ● | with regard to clause (iv) above, a Major Tenant Re-Tenanting Event having occurred. |
A “Major Tenant Re-Tenanting Event” will occur upon the lender receiving satisfactory evidence (including, without limitation, a satisfactory estoppel) that (i) space at the Arboretum Property in an amount equal to at least 90% of the applicable Major Tenant space (or applicable portion thereof) has been leased to one or more satisfactory replacement tenants pursuant to a satisfactory replacement lease; (ii) each such tenant is in occupancy of its premises, is open for business and is paying full, unabated rent pursuant to the terms of its lease (or such abatement having been reserved); and (iii) all tenant improvement costs and leasing commissions provided in each such replacement lease have been paid (or sufficient funds have been deposited into the leasing reserve subaccount for payment of such amounts).
Additional Secured Indebtedness (not including trade debts). The Arboretum Property also secures the Arboretum Serviced Pari Passu Companion Loans, which have a Cut-off Date principal balance of $59,908,803. The Arboretum Serviced Pari Passu Companion Loans accrue interest at the same rate as the Arboretum Mortgage Loan. The Arboretum Mortgage Loan is entitled to payments of interest and principal on a pro rata and pari passu basis
This is not a research report and was not prepared by any Underwriter’s research department. Please see additional important information and qualifications at the end of this Term Sheet.
105
| Retail – Anchored | Loan #7 | Cut-off Date Balance: | $39,939,202 | |
| 3333 Pineville Matthews Road | The Arboretum | Cut-off Date LTV: | 58.7% | |
| Charlotte, NC 28226 | UW NCF DSCR: | 1.70x | ||
| UW NOI Debt Yield: | 9.6% |
with the Arboretum Serviced Pari Passu Companion Loans. The holders of the Arboretum Mortgage Loan and the Arboretum Serviced Pari Passu Companion Loans have entered into a co-lender agreement, which sets forth the allocation of collections on the Arboretum Whole Loan. See “Description of the Mortgage Pool—The Whole Loans—The Serviced Pari Passu Whole Loans” in the Preliminary Prospectus.
Mezzanine Loan and Preferred Equity. The holders of 100% of the equity interests in the Arboretum Borrower have the right to obtain mezzanine debt secured by a pledge of 100% of the ownership interests in the Arboretum Borrower in an amount that, together with the then-outstanding principal balance of the Arboretum Whole Loan, does not exceed $100,000,000 so long as, among other conditions pursuant to the Arboretum Whole Loan documents: (i) the combined debt service coverage ratio is equal to or greater than 1.50x (based on actual amortizing debt service payments, disregarding any interest-only periods); (ii) the combined loan-to-value ratio is less than or equal to 65%; (iii) the mezzanine lender is an institutional lender acceptable to the lender; (iv) the mezzanine lender executes and delivers an intercreditor and standstill agreement; (v) the maturity date of the mezzanine debt is co-terminous with the Arboretum Whole Loan; and (vi) rating agency confirmation is obtained from each applicable rating agency. See “Description of the Mortgage Pool—Additional Indebtedness—Mezzanine Indebtedness” in the Preliminary Prospectus.
Release of Property. Following the defeasance lockout release date, as long as no event of default exists, the Arboretum Borrower has the right to obtain the release of the Regal Cinemas parcel from the lien of the Arboretum Whole Loan subject to certain conditions, including but not limited to, (i) partial defeasance in an amount equal to the greatest of (a) $3,176,471 (120% of the allocated loan amount of the Regal Cinemas parcel of $2,647,059); (b) net sale proceeds of the Regal Cinemas parcel; (c) an amount that would result in the debt yield for the remaining property being no less than the greater of (1) the debt yield immediately prior to the release (including the Regal Cinemas parcel), and (2) 8.50%; and (d) an amount that would result in the loan-to-value ratio of the remaining property being no greater than the lesser of (I) the loan-to-value ratio immediately prior to the release (including the Regal Cinemas parcel), and (II) 60.4%; and (ii) rating agency confirmation is received from each applicable rating agency.
Letter of Credit. None
Right of First Offer/Right of First Refusal. None.
Ground Lease. None.
Terrorism Insurance. The loan documents require that the “all risk” insurance policy required to be maintained by the Arboretum Borrower provides coverage for terrorism in an amount equal to the full replacement cost of the Arboretum Property, as well as business interruption insurance covering no less than the 18-month period following the occurrence of a casualty event, together with a 6-month extended period of indemnity (provided that if TRIPRA or a similar statute is not in effect, the Arboretum Borrower will not be obligated to pay terrorism insurance premiums in excess of two times the premium for the casualty and business interruption coverage on a stand-alone basis). See “Risk Factors—Risks Relating to the Mortgage Loans—Terrorism Insurance May Not Be Available for All Mortgaged Properties” in the Preliminary Prospectus.
This is not a research report and was not prepared by any Underwriter’s research department. Please see additional important information and qualifications at the end of this Term Sheet.
106
(THIS PAGE INTENTIONALLY LEFT BLANK)
This is not a research report and was not prepared by any Underwriter’s research department. Please see additional important information and qualifications at the end of this Term Sheet.
107
| Industrial - Flex | Loan #8 | Cut-off Date Balance: | $34,190,000 | |
| 479 Trade Center Parkway | IFA Rotorion Building | Cut-off Date LTV: | 61.6% | |
| Summerville, SC 29483 | UW NCF DSCR: | 2.38x | ||
| UW NOI Debt Yield: | 9.3% |
This is not a research report and was not prepared by any Underwriter’s research department. Please see additional important information and qualifications at the end of this Term Sheet.
108
| Industrial - Flex | Loan #8 | Cut-off Date Balance: | $34,190,000 | |
| 479 Trade Center Parkway | IFA Rotorion Building | Cut-off Date LTV: | 61.6% | |
| Summerville, SC 29483 | UW NCF DSCR: | 2.38x | ||
| UW NOI Debt Yield: | 9.3% |

This is not a research report and was not prepared by any Underwriter’s research department. Please see additional important information and qualifications at the end of this Term Sheet.
109
Mortgage Loan No. 8 – IFA Rotorion Building |
| Mortgage Loan Information | Property Information | ||||||
| Mortgage Loan Seller: | WFB | Single Asset/Portfolio: | Single Asset | ||||
| Credit Assessment (DBRSM/Fitch/Moody’s): | NR/NR/NR | Location: | Summerville, SC 29483 | ||||
| Original Balance: | $34,190,000 | General Property Type: | Industrial | ||||
| Cut-off Date Balance: | $34,190,000 | Detailed Property Type: | Flex | ||||
| % of Initial Pool Balance: | 3.9% | Title Vesting: | Fee | ||||
| Loan Purpose: | Acquisition | Year Built/Renovated: | 2018-2020/N/A | ||||
| Borrower Sponsors: | Michael C. Baldwin 2010 Dynasty | Size: | 448,765 | ||||
| Trust; Laulima Capital Investors LLC | Cut-off Date Balance per SF: | $76 | |||||
| Guarantor: | Michael C. Baldwin 2010 Dynasty | Maturity Date Balance per SF: | $76 | ||||
| Trust | Property Manager: | Tenant-managed | |||||
| Mortgage Rate: | 3.5630% | ||||||
| Note Date: | 11/10/2020 | ||||||
| First Payment Date: | 12/1/2020 | ||||||
| Maturity Date: | 12/1/2030 | ||||||
| Original Term to Maturity(1): | 121 months | Underwriting and Financial Information(4) | |||||
| Original Amortization Term: | 0 months | UW NOI: | $3,165,709 | ||||
| IO Period(1): | 121 months | UW NOI Debt Yield: | 9.3% | ||||
| Seasoning: | 0 months | UW NOI Debt Yield at Maturity: | 9.3% | ||||
| Prepayment Provisions(1): | LO (24); DEF (93); O (4) | UW NCF DSCR: | 2.38x | ||||
| Lockbox/Cash Mgmt Status: | Hard/In Place | Most Recent NOI(5): | N/A | ||||
| Additional Debt Type: | No | 2nd Most Recent NOI(5): | N/A | ||||
| Additional Debt Balance: | N/A | 3rd Most Recent NOI(5): | N/A | ||||
| Future Debt Permitted (Type): | No (N/A) | Most Recent Occupancy: | 100.0% (11/1/2020) | ||||
| Reserves(2) | 2nd Most Recent Occupancy: | 100.0% (12/31/2019) | |||||
| Type | Initial | Monthly | Cap | 3rd Most Recent Occupancy: | 100.0% (12/31/2018) | ||
| RE Taxes: | $0 | $31,326 | N/A | Appraised Value (as of): | $55,470,000 (9/18/2020) | ||
| Insurance: | $0 | $10,346 | N/A | Appraised Value per SF: | $124 | ||
| Recurring Replacements: | $0 | $5,610 | $134,630 | Cut-off Date LTV Ratio: | 61.6% | ||
| TI/LC: | $1,000,000 | $62,500(3) | (3) | Maturity Date LTV Ratio: | 61.6% | ||
| Sources and Uses | ||||||
| Sources | Proceeds | % of Total | Uses | Proceeds | % of Total | |
| Loan Amount: | $34,190,000 | 59.4% | Purchase Price: | $55,000,000 | 95.6% | |
| Borrower Equity: | $23,344,355 | 40.6% | Reserves: | $1,000,000 | 1.7% | |
| Closing Costs: | $1,534,355 | 2.7% | ||||
| Total Sources: | $57,534,355 | 100.00% | Total Uses: | $57,534,355 | 100.00% | |
| (1) | The first payment date for the IFA Rotorion Mortgage Loan is January 1, 2021. On the Closing Date of the BANK 2020-BNK29 securitization transaction, Wells Fargo Bank, National Association will deposit sufficient funds to pay the amount of interest that would be due with respect to a December 1, 2020 payment. Original Term to Maturity, IO Period and Prepayment Provisions are inclusive of the additional December 1, 2020 interest-only payment funded by Wells Fargo Bank, National Association on the Closing Date. |
| (2) | See “Escrows and Reserves” below for further discussion of reserve requirements. |
| (3) | The monthly TI/LC reserves will be collected beginning January 1, 2021 through and including the monthly payment date on December 1, 2022, when the reserve balance is expected to total $2,500,000. Additionally, there is a springing TI/LC reserve as to which the cap would increase to $4,000,000. See “Escrows and Reserves” below for further discussion. |
| (4) | The novel coronavirus pandemic is an evolving situation and could impact the IFA Rotorion Building Mortgage Loan more severely than assumed in the underwriting of the IFA Rotorion Building Mortgage Loan and could adversely affect the NOI, NCF and occupancy information, as well as the appraised value and the DSCR, LTV and Debt Yield metrics presented above and herein. See “Risk Factors— Risks Related to Market Conditions and Other External Factors—Coronavirus Pandemic Has Adversely Affected the Global Economy and Will Likely Adversely Affect the Performance of the Mortgage Loans” in the Preliminary Prospectus. |
| (5) | Historical NOI figures are not available because the IFA Rotorion Building Property (as defined below) was originally built in 2018 and was acquired at loan origination. |
The Mortgage Loan. The eighth largest mortgage loan (the “IFA Rotorion Building Mortgage Loan”) is evidenced by a single promissory note in the original principal amount of $34,190,000 and secured by a first priority fee mortgage encumbering a 448,765 SF industrial building (the “IFA Rotorion Building Property”) located in Summerville, South Carolina.
The Borrower and the Borrower Sponsors. The borrower is LCI 479 Trade Center Parkway, LLC (the “IFA Rotorion Building Borrower”), a Delaware limited liability company and single purpose entity, with one independent director. Legal counsel to the IFA Rotorion Building Borrower delivered a non-consolidation opinion in connection with the origination of the IFA Rotorion Building Mortgage Loan. The borrower sponsors are Michael C. Baldwin 2010 Dynasty Trust and Laulima Capital Investors LLC and the non-recourse carveout guarantor is the Michael C. Baldwin 2010 Dynasty Trust. Founded in 2008, Laulima Capital Investors LLC is a private office located in Honolulu, Hawaii, with three company practice groups: tax advisory, trust and estate management and real estate management. The borrower sponsors and guarantor are also the borrower sponsors and guarantor, respectively, under the Triangle 54 Mortgage Loan.
The Property. The IFA Rotorion Building Property is a 448,765 SF, industrial building located in Summerville, South Carolina. Originally constructed in 2018 as a build to suit property for the current tenant, IFA Rotorion North America LLC (“IFA”), the facility was recently expanded by 211,267 SF in June 2020 to accommodate the tenant’s consolidation of other local operations. The NRA contains approximately 93.2% warehouse with 32’ clear heights, 22,
This is not a research report and was not prepared by any Underwriter’s research department. Please see additional important information and qualifications at the end of this Term Sheet.
| Industrial - Flex | Loan #8 | Cut-off Date Balance: | $34,190,000 | |
| 479 Trade Center Parkway | IFA Rotorion Building | Cut-off Date LTV: | 61.6% | |
| Summerville, SC 29483 | UW NCF DSCR: | 2.38x | ||
| UW NOI Debt Yield: | 9.3% |
9’ x 10’ dock height loading doors and 2, 16’x16’ and 2, 16’x20’ drive-in doors. The remaining 6.8% of the building is office space. The IFA Rotorion Building Property is situated on an approximately 32.9-acre site and includes 542 surface parking spaces (1.2 spaces per 1,000 SF).
As of November 1, 2020, the IFA Rotorion Building Property was 100.0% leased to IFA, which has approximately $120.0 million of equipment at this location.
Major Tenant.
IFA Rotorion North America LLC (448,765 SF, 100.0% of NRA, 100.0% of underwritten rent). IFA is a subsidiary of IFA Group, an automotive supplier whose core business is drive shafts and joints. IFA Group, which is headquartered in Haldensleben, Germany, was founded over 60 years ago and currently has over 3,000 employees in Europe, North America and China. The tenant signed a new 20-year lease in connection with the June 2020 expansion for the entirety of the building, which serves as its North American headquarters. IFA has four, five-year renewal options with 9-months’ notice and no active termination options. The obligations of IFA under its lease are guaranteed by IFA Rotorion – Holding GmbH (the “IFA Guarantor”), the parent of IFA.
The following table presents a summary regarding the major tenant at the IFA Rotorion Building Property:
| Tenant Summary (1) | |||||||||
| Tenant Name | Credit Rating (Fitch/Moody’s/S&P) | Tenant SF | Approx.% of SF | Annual UW Rent(2) | Annual UW Rent PSF(2) | ||||
| % of Total Annual UW Rent | Term. Option | Renewal Options | Lease Expiration | ||||||
| IFA | NR/NR/NR | 448,765 | 100.0% | $3,382,954 | $7.54 | 100.0% | N | 4 x 5 year | 5/31/2040 |
| Subtotal/Wtd. Avg. | 448,765 | 100.0% | $3,382,954 | $7.54 | 100.0% | ||||
| Vacant Space | 0 | 0.0% | $0 | $0.00 | 0.0% | ||||
| Total/Wtd. Avg. | 448,765 | 100.0% | $3,382,954 | $7.54 | 100.0% | ||||
| (1) | Information obtained from the underwritten rent roll as of November 1, 2020. |
| (2) | Annual UW Rent and Annual UW Rent PSF includes rent steps through June 2021 totaling $58,183. |
The following table presents certain information relating to the lease rollover at the IFA Rotorion Building Property:
| Lease Rollover Schedule(1) | ||||||||
| Year | # of Leases Rolling | SF Rolling | Annual UW Rent PSF Rolling | Approx. % of Total SF Rolling | Approx. Cumulative % of SF Rolling | Total UW Rent Rolling | Approx. % of Total Rent Rolling | Approx. Cumulative % of Total Rent Rolling |
| MTM | 0 | 0 | $0.00 | 0.0% | 0.0% | $0 | 0.0% | 0.0% |
| 2020 | 0 | 0 | $0.00 | 0.0% | 0.0% | $0 | 0.0% | 0.0% |
| 2021 | 0 | 0 | $0.00 | 0.0% | 0.0% | $0 | 0.0% | 0.0% |
| 2022 | 0 | 0 | $0.00 | 0.0% | 0.0% | $0 | 0.0% | 0.0% |
| 2023 | 0 | 0 | $0.00 | 0.0% | 0.0% | $0 | 0.0% | 0.0% |
| 2024 | 0 | 0 | $0.00 | 0.0% | 0.0% | $0 | 0.0% | 0.0% |
| 2025 | 0 | 0 | $0.00 | 0.0% | 0.0% | $0 | 0.0% | 0.0% |
| 2026 | 0 | 0 | $0.00 | 0.0% | 0.0% | $0 | 0.0% | 0.0% |
| 2027 | 0 | 0 | $0.00 | 0.0% | 0.0% | $0 | 0.0% | 0.0% |
| 2028 | 0 | 0 | $0.00 | 0.0% | 0.0% | $0 | 0.0% | 0.0% |
| 2029 | 0 | 0 | $0.00 | 0.0% | 0.0% | $0 | 0.0% | 0.0% |
| 2030 | 0 | 0 | $0.00 | 0.0% | 0.0% | $0 | 0.0% | 0.0% |
| 2031 & Beyond | 1 | 448,765 | $7.54 | 100.0% | 100.0% | $3,382,954 | 100.0% | 100.0% |
| Vacant | 0 | 0 | $0.00 | 0.0% | 100.0% | $0 | 0.0% | 100.0% |
| Total/Wtd. Avg. | 1 | 448,765 | $7.54 | 100.0% | $3,382,954 | 100.0% | ||
| (1) | Information is based on the underwritten rent roll as of November 1, 2020. |
COVID-19 Update. The first debt service payment on the IFA Rotorion Building Mortgage Loan is due on January 1, 2021. As of November 10, 2020, the IFA Rotorion Building Mortgage Loan is not subject to any forbearance, modification or debt service relief requests. As of November 2, 2020, the IFA Rotorion Borrower has reported that the IFA Rotorion Building Property is open and operating, with the tenant having made its full rent payments through November 2020. As of November 2, 2020, the tenant has not requested any lease modification or rent relief and the property remains 100.0% occupied.
The Market. The IFA Rotorion Building Property is located in the Charleston Trade Center industrial park, which is located off of Interstate 26 in Summerville, South Carolina. Charleston Trade Center is an industrial business park comprising 2.9 million SF that is within 30 miles of a number of economic drivers including the Port of Charleston, the new Volvo Plant, Daimler Van Assembly Plant, and the Boeing 787 Assembly Plant. The IFA Rotorion Building Property is 20 miles from the Charleston International Airport and 25 miles from the Charleston central business district.
This is not a research report and was not prepared by any Underwriter’s research department. Please see additional important information and qualifications at the end of this Term Sheet.
111
| Industrial - Flex | Loan #8 | Cut-off Date Balance: | $34,190,000 | |
| 479 Trade Center Parkway | IFA Rotorion Building | Cut-off Date LTV: | 61.6% | |
| Summerville, SC 29483 | UW NCF DSCR: | 2.38x | ||
| UW NOI Debt Yield: | 9.3% |
According to a third party market research report, the IFA Rotorion Building Property is situated within the Outlying Berkeley County submarket of the Charleston industrial market. As of September 29, 2020 the submarket reported a total inventory of 488 industrial buildings totaling approximately 30.7 million SF with a 7.8% vacancy rate and asking rents of $6.59 PSF. The appraisal identified 4 comparable industrial buildings totaling 1,350,800 SF, which reported an average occupancy rate of approximately 100% with an average rental rate of $7.33 PSF. The appraisal concluded to market rent for the IFA Rotorion Building Property of $7.50 PSF.
According to the appraisal, the 2020 estimated population within a one-, three- and five-mile radius of the IFA Rotorion Building Property was 6,157, 36,182, and 77,444, respectively. The 2020 estimated median household income within a one-, three- and five-mile radius of the IFA Rotorion Building Property was $75,391, $65,266 and $68,236, respectively.
The following table presents information relating to comparable office property sales for the IFA Rotorion Building Property:
| Comparable Property Sale Summary | ||||||||
| Property Name/Location | Sale Date | Year Built/ Renovated | Total NRA (SF) | Occupancy | Sale Price | Adjusted Sale Price(1) | Sale Price PSF | Appraiser’s Adjusted Sale Price PSF(1) |
IFA Rotorion Building (subject) 479 Trade Center Parkway Summerville, SC | Nov. 2020 | 2018-2020/N/A | 448,765 | 100% | $55,000,000 | $55,000,000 | $123 | $123 |
Industrial Portfolio 307, 319, 343 Oates Rd. Mooresville, NC | Jun. 2020 | 2003/2008-2009 | 560,453 | 91% | $75,500,601 | $71,726,775 | $135 | $128 |
Industrial 1301 Perimeter Rd. Greenville, SC | Dec. 2019 | 2019/N/A | 125,000 | 100% | $12,300,000 | $14,907,500 | $98 | $119 |
Industrial Building Manufacturers Blvd. Mooresville, NC | Jan. 2019 | 2018/N/A | 215,000 | 100% | $22,950,000 | $26,002,100 | $107 | $121 |
RPM Distribution Facility 544 Trade Center Pky. Summerville, SC | Nov. 2018 | 2016/N/A | 307,353 | 100% | $25,100,000 | $33,609,051 | $82 | $109 |
Industrial Warehouse - Hanahan 1023 North Pointe Industrial Blvd. Hanahan, SC | May 2018 | 2015/N/A | 350,856 | 100% | $30,500,000 | $38,429,258 | $87 | $110 |
Industrial 4062 Stirrup Creek Dr. Durham, NC | Nov. 2017 | 2017/N/A | 258,060 | 100% | $27,150,000 | $30,218,826 | $105 | $117 |
Source: Appraisal.
| (1) | Adjusted Sale Price was adjusted for location, size, age/condition, features/amenities and economic characteristics (as applicable). |
The following table presents recent leasing data at comparable office properties with respect to the IFA Rotorion Building Property:
| Comparable Leases Summary | ||||||||||
| Property Name/Location | Year Built/ Renovated | Total GLA (SF) | Occupancy | Distance from Subject | Tenant Name | Lease Date/Term | Lease Area (SF) | Annual Base Rent PSF | Lease Type | |
| IFA Rotorion Building (subject) | 2018-2020/N/A | 448,765 | 100% | N/A | IFA | May 2020/20 Yrs(1) | 448,765(1) | $7.41(1) | NNN(1) | |
739 Gaillard Rd. Moncks Corner, SC | 2020/N/A | 615,000 | 100% | 16.5 Miles | A&R Logistics, Inc. | Sep 2020/ 15 Yrs | 615,000 | $5.37 | NNN | |
365 Spectrum Dr. Knightdale, NC | 2020/N/A | 280,000 | NAV | 256 miles | Eby Brown | Jan 2020 / 10 Yrs | 180,000 | $6.97 | NNN | |
Manufacturers Blvd. Mooresville, NC | 2018/N/A | 215,000 | 100% | 215 miles | Tristone Flowtech USA Inc. | Nov 2018 / 10 Yrs | 215,000 | $6.59 | NNN | |
Confidential Confidential, SC | 2017/N/A | 240,800 | 100% | NAV | Confidential | Sep 2017 / 20 Yrs | 240,800 | $10.38 | Absolute Net | |
Source: Appraisal.
| (1) | Information obtained from the underwritten rent roll. |
This is not a research report and was not prepared by any Underwriter’s research department. Please see additional important information and qualifications at the end of this Term Sheet.
112
| Industrial - Flex | Loan #8 | Cut-off Date Balance: | $34,190,000 | |
| 479 Trade Center Parkway | IFA Rotorion Building | Cut-off Date LTV: | 61.6% | |
| Summerville, SC 29483 | UW NCF DSCR: | 2.38x | ||
| UW NOI Debt Yield: | 9.3% |
The following table presents certain information relating to the appraisal’s market rent conclusion for the IFA Rotorion Building Property:
| Market Rent Summary | |
| Industrial | |
| Market Rent (PSF) | $7.50 |
| Lease Term (Years) | 20 |
| Lease Type (Reimbursements) | Absolute Net |
| Rent Increase Projection | Fixed Percentage |
| Source: Appraisal. | ||
Underwritten Net Cash Flow. The following table presents certain information relating to the Underwritten Net Cash Flow at the IFA Rotorion Building Property:
| Cash Flow Analysis(1) | ||
| UW | UW PSF | |
| Gross Potential Base Rent(2) | $3,382,954 | $7.54 |
| Total Recoveries(3) | $912,014 | $2.03 |
| Less Vacancy & Credit Loss(4) | ($169,148) | ($0.38) |
| Effective Gross Income | $4,125,821 | $9.19 |
| Real Estate Taxes | $679,270 | $1.51 |
| Insurance | $112,191 | $0.25 |
| Other Operating Expenses | $168,651 | $0.38 |
| Total Expenses | $960,112 | $2.14 |
| Net Operating Income | $3,165,709 | $7.05 |
| Capital Expenditures | $67,315 | $0.15 |
| TI/LC | $159,248 | $0.35 |
| Net Cash Flow | $2,939,146 | $6.55 |
| Occupancy % | 100.0%(4) | |
| NOI DSCR | 2.56x | |
| NCF DSCR | 2.38x | |
| NOI Debt Yield | 9.3% | |
| NCF Debt Yield | 8.6% | |
| (1) | No historical cash flow information is available because the IFA Rotorion Building Property was originally constructed in 2018 and was acquired at loan origination. | |
| (2) | Gross Potential Base Rent includes rent steps through June 2021 totaling $58,183. |
| (3) | Recoveries are shown net of 5.0% vacancy allowance |
| (4) | As of November 1, 2020, the IFA Rotorion Building Property is 100% leased. Vacancy is underwritten to 5.0%. |
Escrows and Reserves.
Real Estate Taxes – The loan documents require ongoing monthly tax reserves in an amount equal to one-twelfth of the real estate taxes that the lender estimates will be payable during the next 12 months (initially $31,326).
Insurance – The loan documents require ongoing monthly insurance reserves in an amount equal to one-twelfth of the insurance premiums that the lender estimates will be payable for the renewal of coverage afforded by the policies upon the expiration thereof in order to accumulate sufficient funds to pay all such premiums at least 30 days prior to the expiration of such policies (initially $10,346).
Replacement Reserve – The loan documents require ongoing monthly replacement reserves of $5,610 ($0.15 PSF), which, provided no event of default is continuing, are capped at $134,630 (representing approximately two years of collections).
TI/LC Reserve – The loan documents require an upfront TI/LC reserve of $1,000,000 ($2.23 PSF) and ongoing monthly reserves of $62,500 ($1.67 PSF) beginning on January 1, 2021 through and including the monthly payment date on December 1, 2022.
Beginning with the IFA Guarantor’s fiscal year 2021, the loan documents require a springing monthly TI/LC reserve of $62,500 (in addition to the ongoing monthly TI/LC reserve referenced above), which, provided no event of default is continuing, is capped at $4,000,000 (inclusive of the TI/LC reserves referenced above), upon the IFA Guarantor having (i) an EBITDA of less than $0 for two consecutive fiscal years, (ii) a quick ratio (the then current assets divided by the then current liabilities) of less than 1.20x for any fiscal year, or (iii) a decline in annual top line revenue (as determined in accordance with
This is not a research report and was not prepared by any Underwriter’s research department. Please see additional important information and qualifications at the end of this Term Sheet.
113
| Industrial - Flex | Loan #8 | Cut-off Date Balance: | $34,190,000 | |
| 479 Trade Center Parkway | IFA Rotorion Building | Cut-off Date LTV: | 61.6% | |
| Summerville, SC 29483 | UW NCF DSCR: | 2.38x | ||
| UW NOI Debt Yield: | 9.3% |
GAAP or a generally accepted local standard of accounting) of more than 10% relative to its immediately preceding fiscal year, for two consecutive fiscal years.
The springing monthly deposit requirement will end upon the occurrence of the following:
| ● | with regard to clause (i), the IFA Guarantor having an EBITDA greater than $0 for one fiscal year; |
| ● | with regard to clause (ii), (a) the IFA Guarantor having a quick ratio of at least 1.20x for one fiscal year; or (b) the acquisition of 100% of the equity interests in IFA and/or IFA Guarantor by: (a) an entity with a long-term unsecured debt rating of at least “BBB-” from S&P, “Baa3” by Moody’s, and an equivalent rating from any rating agency rating certificates issued in connection with the BANK 2020-BNK29 securitization, (b) any of Ford Motor Company, Daimler AG, Bayerische Motoren Werke (BMW), General Motors (GM), Volkswagen Group (VW), or Fiat Chrysler Automobiles N.V. (FCA), or (c) a company with (i) a net worth (as determined in accordance with GAAP) of $1,000,000,000 or greater and (2) after giving consideration to such company’s acquisition of 100% of the equity interests in IFA or the IFA Guarantor, as applicable, EBITDA of greater than $0; or |
| ● | with regard to clause (iii), the IFA Guarantor having annual top line revenue (as determined in accordance with GAAP) equal to or greater than its immediately preceding fiscal year for at least one fiscal year. |
Lockbox and Cash Management. The IFA Rotorion Building Mortgage Loan is structured with a hard lockbox and in place cash management. The IFA Rotorion Building Borrower is required to direct the sole tenant to pay rent directly into such lockbox account. All amounts in the lockbox account are required to be swept periodically into the cash management account and disbursed by the lender in accordance with the IFA Rotorion Building Mortgage Loan documents on each monthly payment date. So long as no Cash Trap Event Period (as defined below) is in effect, all excess cash flow on deposit in the lockbox account after application of the cash flow waterfall will be disbursed to the IFA Rotorion Building Borrower. During a Cash Trap Event Period, all excess funds will be swept to an excess cash flow subaccount controlled by the lender and held as additional security for so long as the Cash Trap Period continues.
A “Cash Trap Event Period” will commence upon the earlier of the following:
| (i) | the occurrence of an event of default under the IFA Rotorion Building Mortgage Loan documents; |
| (ii) | IFA being in default, (beyond any applicable notice and cure and/or grace period) under its lease; |
| (iii) | IFA going dark or otherwise failing to be in actual, physical possession of at least 50% of its space, unless the tenant dark event has occurred solely due to reasons associated with the COVID-19 pandemic or another pandemic; or |
| (iv) | IFA being subject to a bankruptcy or any similar insolvency proceeding. |
A Cash Trap Event Period will end upon the occurrence of the following:
| ● | with regard to clauses (i) and (ii), the cure of such event of default; |
| ● | with regard to clause (iii), upon the date that IFA, is in actual, physical possession of at least 50% of its space and is open for business during customary hours or the IFA Rotorion Building Borrower has leased the entire IFA space to one or more replacement tenants on terms approved or deemed approved by lender pursuant to the loan documents, and the tenant is in physical occupancy of the space, open for business, and paying full rent due under such lease; |
| ● | with regard to clause (iv), upon the date that IFA is no longer insolvent or subject to any bankruptcy or insolvency proceedings and has affirmed the IFA lease pursuant to a final, non-appealable court order and the tenant is paying full, unabated rent. |
Additional Secured Indebtedness (not including trade debts). None.
Mezzanine Loan and Preferred Equity. Not permitted.
Release of Property. Not permitted.
Ground Lease. None.
Right of First Refusal/Right of First Offer. IFA has a right of first offer to purchase the IFA Rotorion Building Property if the IFA Rotorion Building Borrower elects to sell the IFA Rotorion Building Property (“ROFO”). The ROFO is not extinguished by foreclosure; however, the ROFO does not apply to foreclosure or deed-in-lieu thereof.
Terrorism Insurance. The IFA Rotorion Mortgage Loan documents require that the “all risk” insurance policy required to be maintained by the IFA Rotorion Building Borrower provide coverage for terrorism in an amount equal to the full replacement cost of the IFA Rotorion Building Property, as well as business interruption insurance covering no less than the 18-month period following the occurrence of a casualty event, together with a 6-month extended period of indemnity.
This is not a research report and was not prepared by any Underwriter’s research department. Please see additional important information and qualifications at the end of this Term Sheet.
114
(THIS PAGE INTENTIONALLY LEFT BLANK)
This is not a research report and was not prepared by any Underwriter’s research department. Please see additional important information and qualifications at the end of this Term Sheet.
115
| Office – Suburban | Loan #9 | Cut-off Date Balance: | $32,232,000 | |
| 86 T.W. Alexander Drive | Triangle 54 | Cut-off Date LTV: | 59.6% | |
| Durham, NC 27711 | U/W NCF DSCR: | 2.54x | ||
| U/W NOI Debt Yield: | 9.8% |

This is not a research report and was not prepared by any Underwriter’s research department. Please see additional important information and qualifications at the end of this Term Sheet.
116
| Office – Suburban | Loan #9 | Cut-off Date Balance: | $32,232,000 | |
| 86 T.W. Alexander Drive | Triangle 54 | Cut-off Date LTV: | 59.6% | |
| Durham, NC 27711 | U/W NCF DSCR: | 2.54x | ||
| U/W NOI Debt Yield: | 9.8% |
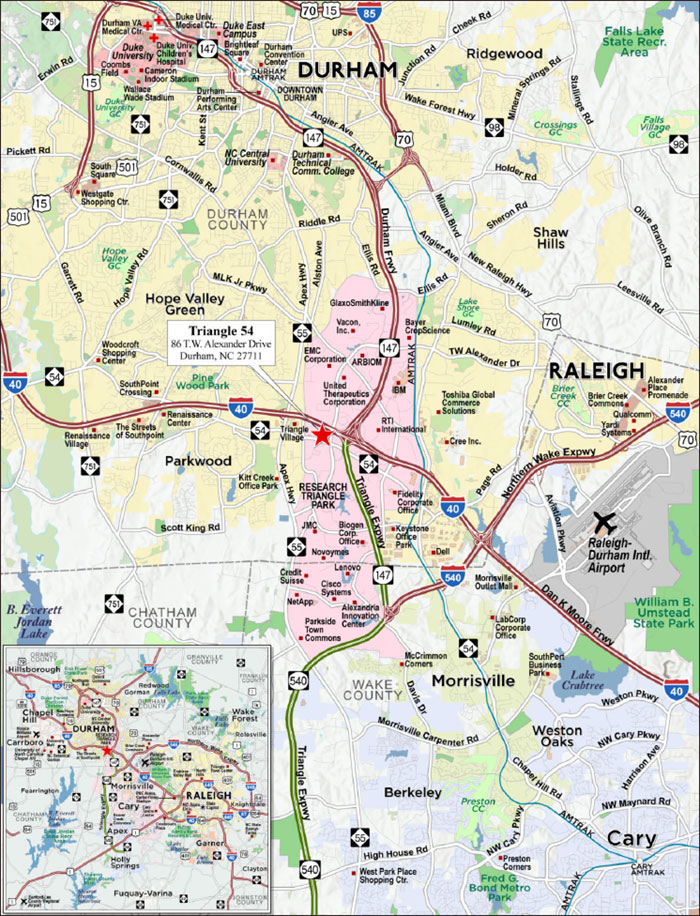
This is not a research report and was not prepared by any Underwriter’s research department. Please see additional important information and qualifications at the end of this Term Sheet.
117
| Mortgage Loan No. 9 – Triangle 54 |
| Mortgage Loan Information | Property Information | ||||||
| Mortgage Loan Seller: | WFB | Single Asset/Portfolio: | Single Asset | ||||
| Credit Assessment (DBRSM/Fitch/Moody’s): | NR/NR/NR | Location: | Durham, NC 27711 | ||||
| Original Balance: | $32,232,000 | General Property Type: | Office | ||||
| Cut-off Date Balance: | $32,232,000 | Detailed Property Type: | Suburban | ||||
| % of Initial Pool Balance: | 3.7% | Title Vesting: | Fee | ||||
| Loan Purpose: | Acquisition | Year Built/Renovated: | 2018/N/A | ||||
| Borrower Sponsors: | Michael C. Baldwin 2010 Dynasty | Size: | 151,164 SF | ||||
| Trust; Laulima Capital Investors LLC | Cut-off Date Balance per SF: | $213 | |||||
| Guarantors: | Michael C. Baldwin 2010 Dynasty | Maturity Date Balance per SF: | $213 | ||||
| Trust | Property Manager: | Self-Managed | |||||
| Mortgage Rate: | 3.3570% | ||||||
| Note Date: | 10/29/2020 | Underwriting and Financial Information(2) | |||||
| First Payment Date: | 12/1/2020 | UW NOI: | $3,147,485 | ||||
| Maturity Date: | 11/1/2030 | UW NOI Debt Yield: | 9.8% | ||||
| Original Term to Maturity: | 120 months | UW NOI Debt Yield at Maturity: | 9.8% | ||||
| Original Amortization Term: | 0 months | UW NCF DSCR: | 2.54x | ||||
| IO Period: | 120 months | Most Recent NOI(3): | N/A | ||||
| Seasoning: | 0 months | 2nd Most Recent NOI(3): | N/A | ||||
| Prepayment Provisions: | LO (24); DEF (92); O (4) | 3rd Most Recent NOI(3): | N/A | ||||
| Lockbox/Cash Mgmt Status: | Hard/In Place | Most Recent Occupancy: | 100.0% (11/1/2020) | ||||
| Additional Debt Type: | No | 2nd Most Recent Occupancy(3): | N/A | ||||
| Additional Debt Balance: | N/A | 3rd Most Recent Occupancy(3): | N/A | ||||
| Future Debt Permitted (Type): | No (N/A) | Appraised Value (as of) (4): | $54,120,000 (9/22/2020) | ||||
| Reserves(1) | Appraised Value per SF(4): | $358 | |||||
| Type | Initial | Monthly | Cap | Cut-off Date LTV Ratio: | 59.6% | ||
| RE Taxes: | $0 | $21,862 | N/A | Maturity Date LTV Ratio: | 59.6% | ||
| Insurance: | $0 | $2,986 | N/A | ||||
| Recurring Replacements: | $0 | $2,519 | $60,466 | ||||
| Sources and Uses | ||||||
| Sources | Proceeds | % of Total | Uses | Proceeds | % of Total | |
| Loan Amount: | $32,232,000 | 58.6% | Purchase Price: | $53,720,000 | 97.7% | |
| Equity | $22,778,150 | 41.4% | Closing Costs: | $1,290,150 | 2.3% | |
| Total Sources: | $55,010,150 | 100.0% | Total Uses: | $55,010,150 | 100.0% | |
| (1) | See “Escrows and Reserves” below for further discussion of reserve requirements. |
| (2) | The novel coronavirus pandemic is an evolving situation and could impact the Triangle 54 Mortgage Loan (as defined below) more severely than assumed in the underwriting of the Triangle 54 Mortgage Loan and could adversely affect the NOI, NCF and occupancy information, as well as the appraised value and the DSCR, LTV and Debt Yield metrics presented above and herein. See “Risk Factors-—Risks Related to Market Conditions and Other External Factors—The Coronavirus Pandemic Has Adversely Affected the Global Economy and Will Likely Adversely Affect the Performance of the Mortgage Loans” in the Preliminary Prospectus. |
| (3) | Historical NOI and occupancy figures are not available because the Triangle 54 Property (as defined below) was built in 2018 and was acquired at loan closing. |
| (4) | The appraisal for the Triangle 54 Property also included a “Hypothetical Go Dark Value”, as of September 22, 2020, of $41,390,000, representing a 77.9% loan-to-dark value ratio. |
The Mortgage Loan. The ninth largest mortgage loan (the “Triangle 54 Mortgage Loan”) is evidenced by a promissory note in the original principal amount of $32,232,000 and secured by a first priority fee mortgage encumbering a 151,164 SF Class A office building (the “Triangle 54 Property”) located in Durham, North Carolina.
The Borrower and the Borrower Sponsors. The borrower is LCI 86 TW Alexander, LLC (the “Triangle 54 Borrower”), a Delaware limited liability company and single purpose entity, with one independent director. In connection with the origination of the loan, counsel to the Triangle 54 Borrower delivered a non-consolidation opinion. The borrower sponsors are Michael C. Baldwin 2010 Dynasty Trust and Laulima Capital Investors LLC and the non-recourse carveout guarantor is the Michael C. Baldwin 2010 Dynasty Trust (the “Guarantor”). Laulima Capital Investors LLC is a private office located in Honolulu, Hawaii. Founded in 2008, the company has three practice groups: tax advisory, trust and estate management and real estate management. The borrower sponsors and non-recourse carveout guarantor are also the borrower sponsors and non-recourse carveout guarantor, respectively, under the IFA Rotorion Building Mortgage Loan.
The Property. The Triangle 54 Property is a 151,164 SF, 5-story, Class A, office building located in Durham, North Carolina. The Triangle 54 Property is situated on an approximately 12.48-acre site and includes 665 surface parking spaces (4.40 spaces per 1,000 SF), a patio deck with picnic tables and a barbeque, as well as digital keyless entry and charging stations for three electric vehicles. The Triangle 54 Property was constructed in 2018 as a build-to-suit for the current tenant for approximately $44.7 million, approximately $296 PSF. The Triangle 54 Property was 100.0% leased to RHO Inc. (“RHO” or the “Tenant”) as of November 1, 2020. The 5th floor of the building, approximately 20% of the NRA, is currently listed for sublease.
This is not a research report and was not prepared by any Underwriter’s research department. Please see additional important information and qualifications at the end of this Term Sheet.
118
| Office – Suburban | Loan #9 | Cut-off Date Balance: | $32,232,000 | |
| 86 T.W. Alexander Drive | Triangle 54 | Cut-off Date LTV: | 59.6% | |
| Durham, NC 27711 | U/W NCF DSCR: | 2.54x | ||
| U/W NOI Debt Yield: | 9.8% |
Condominium Regime. The Triangle 54 Property is the only improved unit in a three-unit land condominium. Each unit owner is solely responsible for maintenance of its respective building. The owners’ association has responsibility for maintaining project common areas, including roadways, parking areas, sidewalks and landscaping, among other things. The Triangle 54 Borrower has 34% of the rights in the owners’ association, and the right to appoint 2 members of the 6-member board; however, pursuant to its lease with RHO, the Triangle 54 Borrower has conferred one-half of its voting interest and the right to appoint one of its two board members to RHO. Amendments to the condominium regime require the vote of all unit owners and their respective eligible mortgage holders. The condominium declaration establishes cross-access easements between units, parking areas and common areas, which provide access to a public right of way. Parking areas are owned by the related unit owner, but are maintained by the condominium association subject to reimbursements by unit owner assessments.
Major Tenant.
RHO (151,164 SF, 100.0% of NRA, 100.0% of underwritten rent). The Triangle 54 Property was a build-to-suit for RHO, which leases the entire building. RHO signed a 15-year lease that expires on June 12, 2034. Founded in 1984, RHO is a privately held contract research organization in the pharmaceutical industry. RHO provides a range of drug development services from program strategy through clinical trials and marketing applications. RHO offers full end-to-end services for the drug development program from pre-trial regulatory guidance through testing, new drug application and filing of biologic license applications. In its 30-year history, RHO has more than 300 publications in over 96 journals. RHO derives significant income from contracts with government institutions such as the National Institute of Health. The Triangle 54 Property serves as RHO’s headquarters and is primarily comprised of office space. There is no lab space at the building. RHO has three, five-year renewal options with 12-months’ notice and no active termination options.
The following table presents a summary regarding the major tenant at the Triangle 54 Property:
| Tenant Summary(1) | |||||||||
| Tenant Name | Credit Rating (Fitch/Moody’s/S&P) | Tenant SF | Approx.% of SF | Annual UW Rent(2) | Annual UW Rent PSF | ||||
| % of Total Annual UW Rent | Term. Option | Renewal Options | Lease Expiration | ||||||
| RHO Inc | NR/NR/NR | 151,164 | 100.0% | $3,370,957 | $22.30 | 100.0% | N | 3x 5 year | 6/12/2034 |
| Subtotal/Wtd. Avg. | 151,164 | 100.0% | $3,370,957 | $22.30 | 100.0% | ||||
| Other Tenants | 0 | 0.0% | $0 | $0.00 | 0.0% | ||||
| Vacant Space | 0 | 0.0% | $0 | $0.00 | 0.0% | ||||
| Total/Wtd. Avg. | 151,164 | 100.0% | $3,370,957 | $22.30 | 100.0% | ||||
| (1) | Information is based on the underwritten rent roll as of November 1, 2020. |
| (2) | The Annual UW Rent and Annual UW Rent PSF shown above includes 1.7% annual contractual rent steps through November 1, 2021 totaling $56,816. |
The following table presents certain information relating to the lease rollover at the Triangle 54 Property:
| Lease Rollover Schedule(1) | ||||||||
| Year | # of Leases Rolling | SF Rolling | Annual UW Rent PSF Rolling | Approx. % of Total SF Rolling | Approx. Cumulative % of SF Rolling | Total UW Rent Rolling | Approx. % of Total Rent Rolling | Approx. Cumulative % of Total Rent Rolling |
| MTM | 0 | 0 | $0.00 | 0.0% | 0.0% | $0 | 0.0% | 0.0% |
| 2020 | 0 | 0 | $0.00 | 0.0% | 0.0% | $0 | 0.0% | 0.0% |
| 2021 | 0 | 0 | $0.00 | 0.0% | 0.0% | $0 | 0.0% | 0.0% |
| 2022 | 0 | 0 | $0.00 | 0.0% | 0.0% | $0 | 0.0% | 0.0% |
| 2023 | 0 | 0 | $0.00 | 0.0% | 0.0% | $0 | 0.0% | 0.0% |
| 2024 | 0 | 0 | $0.00 | 0.0% | 0.0% | $0 | 0.0% | 0.0% |
| 2025 | 0 | 0 | $0.00 | 0.0% | 0.0% | $0 | 0.0% | 0.0% |
| 2026 | 0 | 0 | $0.00 | 0.0% | 0.0% | $0 | 0.0% | 0.0% |
| 2027 | 0 | 0 | $0.00 | 0.0% | 0.0% | $0 | 0.0% | 0.0% |
| 2028 | 0 | 0 | $0.00 | 0.0% | 0.0% | $0 | 0.0% | 0.0% |
| 2029 | 0 | 0 | $0.00 | 0.0% | 0.0% | $0 | 0.0% | 0.0% |
| 2030 | 0 | 0 | $0.00 | 0.0% | 0.0% | $0 | 0.0% | 0.0% |
| 2031 & Beyond | 1 | 151,164 | $22.30 | 100.0% | 100.0% | $3,370,957 | 100.0% | 100.0% |
| Vacant | 0 | 0 | $0.00 | 0.0% | 100.0% | $0 | 0.0% | 100.0% |
| Total/Wtd. Avg. | 1 | 151,164 | $22.30 | 100.0% | $3,370,957 | 100.0% | ||
| (1) | Information is based on the underwritten rent roll as of November 1, 2020. |
COVID-19 Update. The first debt service payment on the Triangle 54 Mortgage Loan is due on December 1, 2020. As of November 12, 2020, the Triangle 54 Mortgage Loan is not subject to any forbearance, modification or debt service relief requests. As of November 3, 2020, RHO’s employees are primarily working from home due to COVID. As of November 13, 2020, RHO is current on November rent, has not requested any lease modification or rent relief and has indicated that it intends to fully occupy its space (except for the 5th floor space that is being marketed for sublease) when conditions permit.
This is not a research report and was not prepared by any Underwriter’s research department. Please see additional important information and qualifications at the end of this Term Sheet.
119
| Office – Suburban | Loan #9 | Cut-off Date Balance: | $32,232,000 | |
| 86 T.W. Alexander Drive | Triangle 54 | Cut-off Date LTV: | 59.6% | |
| Durham, NC 27711 | U/W NCF DSCR: | 2.54x | ||
| U/W NOI Debt Yield: | 9.8% |
The Market. The Triangle 54 Property is located in an area known as Research Triangle Park in Durham, North Carolina. Research Triangle Park is located at the center of three Tier-1 research universities and is the largest research park in the United States. It encompasses 7,000 acres, with more than 300 companies located in the park, in industries including science and technology, as well as government entities and academic institutions. The Triangle 54 Property is located directly off the I-40 interchange and is approximately 7.3 miles from downtown Durham and 8.9 miles from Duke University. Additionally, it is located approximately 7.8 miles from the Raleigh-Durham International Airport.
According to the appraisal, the Triangle 54 Property is located in the Research Triangle submarket within the greater Durham-NC metropolitan area office market. As of the third quarter of 2020, the Durham-NC office market reported approximately 34.5 million SF of office inventory with a 9.7% vacancy rate and average asking rent of $24.91 PSF, gross. For the same period, the Research Triangle Submarket reported an inventory of approximately 13.0 million SF with a 12.6% vacancy rate and average asking rent of $24.51 PSF, gross. The appraisal concluded to a market rent for the Triangle 54 Property of $22.00 PSF NNN.
According to the appraisal, the 2020 estimated population within a one-, three- and five-mile radius of the Triangle 54 Property was 655, 37,868 and 119,824, respectively. The 2020 estimated median household income within a one-, three- and five-mile radius of the Triangle 54 Property was $65,407, $83,084 and $87,292, respectively.
The following table presents information relating to comparable office property sales for the Triangle 54 Property:
| Comparable Property Sale Summary | ||||||||
| Property Name/Location | Sale Date | Year Built/ Renovated | Total NRA (SF) | Occupancy | Sale Price | Adjusted Sale Price(1) | Sale Price PSF | Appraiser’s Adjusted Sale Price PSF(1) |
Triangle 54 Property 86 T.W. Alexander Drive Durham, NC | Oct. 2020 | 2018 | 151,164 | 100% | $53,720,000 | N/A | $355 | N/A |
Office Building 4200 Corning Pl. Charlotte, NC | Apr. 2020 | 2019 | 182,169 | 100% | $58,500,000 | $64,349,378 | $321 | $353 |
Citrix Facility 120 S. West St. Raleigh, NC | Dec. 2019 | 1969/2014 | 185,853 | 100% | $84,750,000 | $68,477,538 | $456 | $368 |
CapTrust Tower 4208 Six Forks Rd. Raleigh, NC | Jul. 2019 | 2008 | 300,389 | 100% | $137,750,000 | $112,402,560 | $459 | $374 |
Legacy at Brier Creek 7751/7745/7741 Brier Creek Pky. Raleigh, NC | Feb. 2019 | 2016 | 121,956 | 100% | $34,100,000 | $43,904,160 | $280 | $360 |
Perimeter Five 1030 Sync St. Morrisville, NC | Nov. 2018 | 2017 | 273,348 | 100% | $74,217,000 | $92,623,970 | $272 | $339 |
Source: Appraisal.
| (1) | Adjusted sale price for location, size, age/condition, features/amenities and economic characteristics (as applicable). |
The following table presents recent leasing data at comparable office properties with respect to the Triangle 54 Property:
| Comparable Leases Summary | |||||||||
| Property Name/Location | Year Built/ Renovated | Total GLA (SF) | Occ. %(1) | Distance from Subject | Tenant Name | Lease Date/Term | Lease Area (SF) | Annual Base Rent PSF | Lease Type |
Triangle 54 Property 86 T.W. Alexander Drive Durham, NC | 2018 | 151,164 | 100% | N/A | RHO Inc | Jun. 2019 15.0 Yrs | 151,164 | $22.30 | NNN |
11000 Weston Pky. Cary, NC | 1997 | 178,300 | 84.7% | 8.0 Miles | Xerox | Dec 2019/ 10.4 Yrs | 97,626 | $28.00 | Full Service |
Regency Woods II Cary, NC | 2018 | 152,413 | 74% | 17.0 miles | Black & Veatch | Jul 2019 / 10.3 Yrs | 40,842 | $28.95 | Full Service |
Southern Gateway Durham, NC | 2018 | 330,274 | 87% | 8.5 miles | WeWork | Jun 2019 / 15.5 Yrs | 74,184 | $28.66 | Full Service |
8325 Six Forks Rd. Raleigh, NC | 2009 | 129,347 | 100% | 16.0 miles | Genworth Mortgage Insurance Corporation | Mar 2018 / 9.8 Yrs | 129,347 | $26.14 | Full Service |
2645 Silver Crescent Dr. Charlotte, NC | 2017 | 119,248 | 100% | 158.0 miles | Jeld-WEN | Feb 2018 / 17.0 Yrs | 119,248 | $22.68 | NNN |
Wade IV Raleigh, NC | 2017 | 104,022 | 86% | 12.4 miles | SageWorks, Inc. | Jan 2018 / 7.4 Yrs | 33,885 | $28.00 | Full Service |
Source: Appraisal.
This is not a research report and was not prepared by any Underwriter’s research department. Please see additional important information and qualifications at the end of this Term Sheet.
120
| Office – Suburban | Loan #9 | Cut-off Date Balance: | $32,232,000 | |
| 86 T.W. Alexander Drive | Triangle 54 | Cut-off Date LTV: | 59.6% | |
| Durham, NC 27711 | U/W NCF DSCR: | 2.54x | ||
| U/W NOI Debt Yield: | 9.8% |
The following table presents certain information relating to the appraiser’s market rent conclusion for the Triangle 54 Property:
| Market Rent Summary | |
| Office | |
| Market Rent (PSF) | $22.00 |
| Lease Term (Years) | 15 |
| Lease Type (Reimbursements) | NNN |
| Rent Increase Projection | Fixed Percentage |
| Source: Appraisal. |
Underwritten Net Cash Flow. The following table presents certain information relating to the Underwritten Net Cash Flow at the Triangle 54 Property:
| Cash Flow Analysis(1) | ||
| UW | UW PSF | |
| Gross Potential Base Rent(2) | $3,370,957 | $22.30 |
| Total Recoveries(3) | $1,043,552 | $6.90 |
| Less Vacancy & Credit Loss(4) | ($168,548) | ($1.12) |
| Effective Gross Income | $4,245,962 | $28.09 |
| Real Estate Taxes | $249,852 | $1.65 |
| Insurance | $19,099 | $0.13 |
| Other Operating Expenses | $829,526 | $5.49 |
| Total Expenses | $1,098,477 | $7.27 |
| Net Operating Income | $3,147,485 | $20.82 |
| Capital Expenditures | $30,233 | $0.20 |
| TI/LC | $330,595 | $2.19 |
| Net Cash Flow | $2,786,657 | $18.43 |
| Occupancy % | 100.0%(4) | |
| NOI DSCR | 2.87x | |
| NCF DSCR | 2.54x | |
| NOI Debt Yield | 9.8% | |
| NCF Debt Yield | 8.6% | |
| (1) | No historical cash flow information is available because the Triangle 54 Property was constructed in 2018 and was acquired at loan origination. |
| (2) | Gross Potential Base Rent is based on leases in-place with 1.7% annual rent escalations through November 1, 2021. |
| (3) | Recoveries are shown net of 5.0% vacancy allowance |
| (4) | The Triangle 54 Property is 100% leased as of November 1, 2020. Vacancy is underwritten to 5.0%. |
Escrows and Reserves.
Real Estate Taxes – The Triangle 54 Borrower is required to deposit ongoing monthly tax reserves in an amount equal to one-twelfth of the real estate taxes that the lender estimates will be payable during the next 12 months (initially $21,862).
Insurance – The Triangle 54 Borrower is generally required to make ongoing monthly insurance reserve deposits in an amount equal to one-twelfth of the estimated insurance premiums (initially $2,986). However, the Triangle 54 Borrower will not be required to make ongoing monthly payments for insurance reserves as long as (i) no event of default is continuing; (ii) the Triangle 54 Property is covered under a blanket or umbrella policy reasonably acceptable to the lender; (iii) the Triangle 54 Borrower provides the lender with evidence of renewal of such policies; and (iv) the Triangle 54 Borrower provides the lender with paid receipts for payment of the insurance premiums by no later than ten business days prior to the policy expiration dates.
Replacement Reserve – The Triangle 54 Borrower is required to make ongoing monthly replacement reserve deposits of $2,519 ($0.20 PSF annually), capped at $60,466 (representing approximately two years of collections).
Lockbox and Cash Management. The Triangle 54 Mortgage Loan is structured with an in-place hard lockbox and the Triangle 54 Borrower and property manager are required to direct all tenants to pay rent directly into such lockbox account, and to deposit any rents otherwise received in such account within one business day after receipt. All amounts in the lockbox account will be swept periodically into a lender-controlled cash management account and disbursed by the lender in accordance with the Triangle 54 Mortgage Loan documents on each monthly payment date. So long as no Cash Trap Event Period (as defined below) is in effect, all excess cash flow on deposit in the lockbox account after application of the cash flow waterfall will be disbursed to the Triangle 54 Borrower. During a Cash Trap Event Period, all excess funds (capped at $4,500,000, approximately $29.77 PSF, except during a Cash
This is not a research report and was not prepared by any Underwriter’s research department. Please see additional important information and qualifications at the end of this Term Sheet.
121
| Office – Suburban | Loan #9 | Cut-off Date Balance: | $32,232,000 | |
| 86 T.W. Alexander Drive | Triangle 54 | Cut-off Date LTV: | 59.6% | |
| Durham, NC 27711 | U/W NCF DSCR: | 2.54x | ||
| U/W NOI Debt Yield: | 9.8% |
Trap Event Period caused by an event of default) are required to be swept to an excess cash flow subaccount controlled by the lender and held as additional security for so long as the Cash Trap Event Period continues.
A “Cash Trap Event Period” will commence upon the earlier of the following:
| (5) | the occurrence of an event of default under the Triangle 54 Mortgage Loan documents; |
| (6) | RHO being in default, beyond any applicable notice and cure and/or grace period, under its lease; |
| (7) | RHO going dark or otherwise failing to be in actual, physical possession of at least 50% of its space (unless the tenant dark event has occurred solely due to reasons associated with the COVID-19 pandemic or another pandemic); or |
| (8) | RHO being subject to a bankruptcy or any similar insolvency proceeding. |
A Cash Trap Event Period will end upon the occurrence of the following:
| ● | with regard to clauses (i) and (ii), the cure of such default; |
| ● | with regard to clause (iii), upon the date that RHO is in actual, physical possession of at least 50% of its space and is open for business during customary hours or the Triangle 54 Borrower has leased the entire RHO space to one or more replacement tenants on terms approved or deemed approved by lender pursuant to the loan documents, and the tenant is in physical occupancy of the space, open for business, and paying full rent due under such lease; |
| ● | with regard to clause (iv), upon the date that RHO is no longer insolvent or subject to any bankruptcy or insolvency proceedings and has affirmed the RHO lease pursuant to a final, non-appealable court order and the tenant is paying full, unabated rent. |
Additional Secured Indebtedness (not including trade debts). None.
Mezzanine Loan and Preferred Equity. Not permitted.
Release of Property. Not permitted.
Ground Lease. None.
Right of First Refusal/Right of First Offer. Research Triangle Foundation of North Carolina, a prior owner of the Triangle 54 Property, has a right of first refusal (“ROFR”) to purchase the Triangle 54 Property if the Triangle 54 Borrower receives an offer that it is otherwise willing to accept. The ROFR is not extinguished by foreclosure; however, the ROFR does not apply to foreclosure or deed in lieu thereof.
Terrorism Insurance. The Triangle 54 Mortgage Loan documents require that the “all risk” insurance policy required to be maintained by the Triangle 54 Borrower provide coverage for terrorism in an amount equal to the full replacement cost of the Triangle 54 Property, as well as business interruption insurance covering no less than the 18-month period following the occurrence of a casualty event, together with a 6-month extended period of indemnity.
This is not a research report and was not prepared by any Underwriter’s research department. Please see additional important information and qualifications at the end of this Term Sheet.
122
(THIS PAGE INTENTIONALLY LEFT BLANK)
This is not a research report and was not prepared by any Underwriter’s research department. Please see additional important information and qualifications at the end of this Term Sheet.
123
| Retail - Anchored | Loan #10 | Cut-off Date Balance: | $30,000,000 | |
| 1335, 1401, 1501 & 1505 East Whitestone | 1890 Ranch | Cut-off Date LTV: | 66.2% | |
| Blvd and 1104 & 1005 C-Bar Ranch Trail | UW NCF DSCR: | 2.17x | ||
| Cedar Park, TX 78613 | UW NOI Debt Yield: | 12.0% |
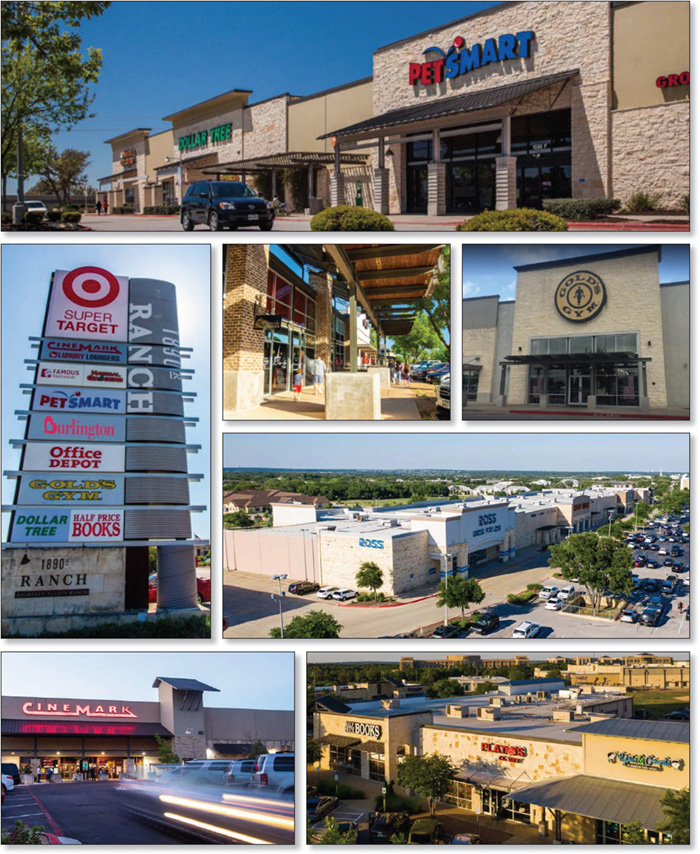
This is not a research report and was not prepared by any Underwriter’s research department. Please see additional important information and qualifications at the end of this Term Sheet.
124
| Retail - Anchored | Loan #10 | Cut-off Date Balance: | $30,000,000 | |
| 1335, 1401, 1501 & 1505 East Whitestone | 1890 Ranch | Cut-off Date LTV: | 66.2% | |
| Blvd and 1104 & 1005 C-Bar Ranch Trail | UW NCF DSCR: | 2.17x | ||
| Cedar Park, TX 78613 | UW NOI Debt Yield: | 12.0% |
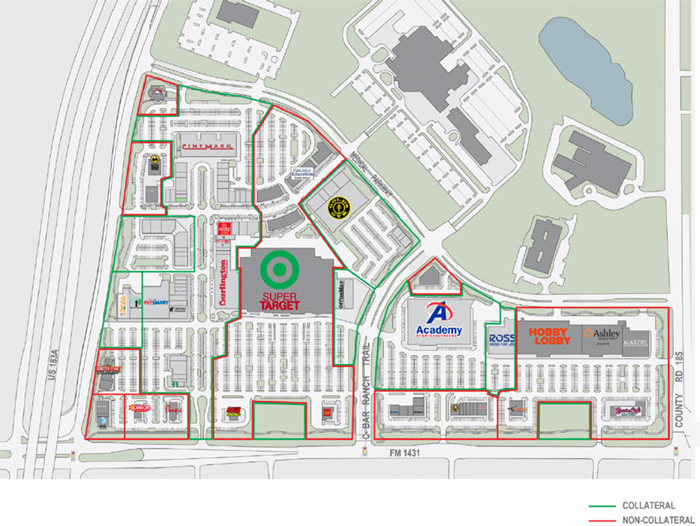
This is not a research report and was not prepared by any Underwriter’s research department. Please see additional important information and qualifications at the end of this Term Sheet.
125
| Retail - Anchored | Loan #10 | Cut-off Date Balance: | $30,000,000 | |
| 1335, 1401, 1501 & 1505 East Whitestone | 1890 Ranch | Cut-off Date LTV: | 66.2% | |
| Blvd and 1104 & 1005 C-Bar Ranch Trail | UW NCF DSCR: | 2.17x | ||
| Cedar Park, TX 78613 | UW NOI Debt Yield: | 12.0% |
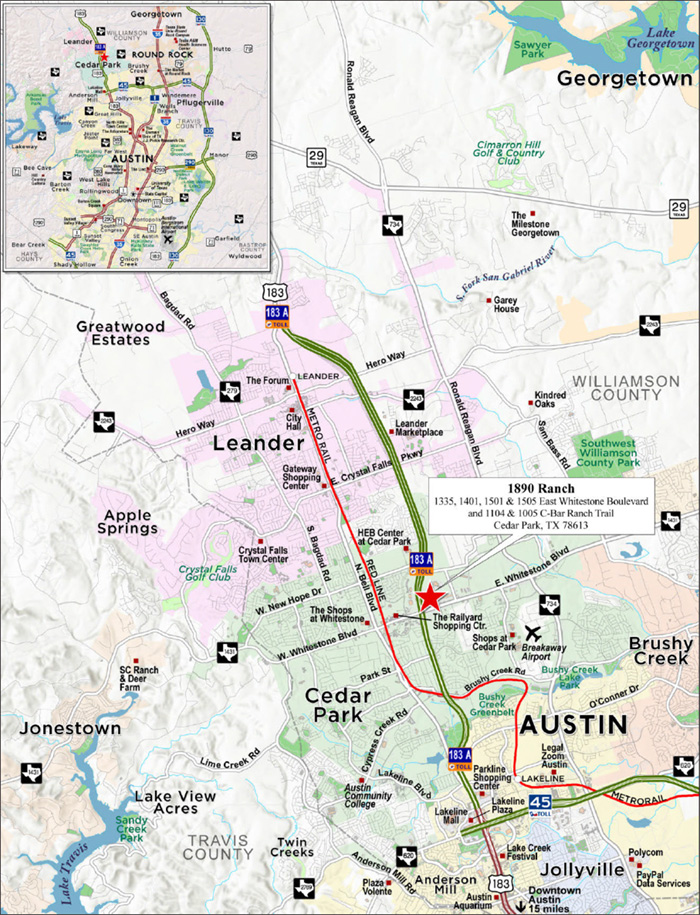
This is not a research report and was not prepared by any Underwriter’s research department. Please see additional important information and qualifications at the end of this Term Sheet.
126
| Mortgage Loan No. 10 – 1890 Ranch |
| Mortgage Loan Information | Property Information | ||||||
| Mortgage Loan Seller: | MSMCH | Single Asset/Portfolio: | Single Asset | ||||
| Credit Assessment (DBRSM/Fitch/Moody’s): | NR/NR/NR | Location: | Cedar Park, TX 78613 | ||||
| Original Balance(1): | $30,000,000 | General Property Type: | Retail | ||||
| Cut-off Date Balance(1): | $30,000,000 | Detailed Property Type: | Anchored | ||||
| % of Initial Pool Balance: | 3.4% | Title Vesting: | Fee | ||||
| Loan Purpose: | Acquisition | Year Built/Renovated: | 2008-2011/N/A | ||||
| Borrower Sponsor: | Endeavor Real Estate Group | Size: | 441,583 SF | ||||
| Guarantor: | CTE Holdings, LP | Cut-off Date Balance Per SF(1): | $115 | ||||
| Mortgage Rate: | 3.1900% | Maturity Date Balance Per SF(1): | $97 | ||||
| Note Date: | 3/6/2020 | Property Manager: | Endeavor Real Estate Group | ||||
| First Payment Date: | 5/1/2020 | (borrower-related) | |||||
| Maturity Date: | 4/1/2030 | ||||||
| Original Term to Maturity: | 120 months | Underwriting and Financial Information(3) | |||||
| Original Amortization Term: | 360 months | UW NOI: | $6,076,243 | ||||
| IO Period: | 36 months | UW NOI Debt Yield(1): | 12.0% | ||||
| Seasoning: | 7 months | UW NOI Debt Yield at Maturity(1): | 14.1% | ||||
| Prepayment Provisions: | LO (24); YM1 (89); O (7) | UW NCF DSCR(1): | 2.17x (P&I) 3.48x (IO) | ||||
| Lockbox/Cash Mgmt Status: | Hard/Springing | Most Recent NOI(4): | N/A | ||||
| Additional Debt Type(1)(2): | Pari Passu | 2nd Most Recent NOI(4): | N/A | ||||
| Additional Debt Balance(1)(2): | $20,610,000 | 3rd Most Recent NOI(4): | N/A | ||||
| Future Debt Permitted (Type): | No (N/A) | Most Recent Occupancy: | 92.4% (9/30/2020) | ||||
| Reserves(5) | 2nd Most Recent Occupancy(4): | N/A | |||||
| Type | Initial | Monthly | Cap | 3rd Most Recent Occupancy(4): | N/A | ||
| RE Tax: | $902,664 | $225,666 | N/A | Appraised Value (as of): | $76,400,000 (12/23/2019) | ||
| Insurance: | $29,364 | $13,682 | N/A | Appraised Value per SF: | $173 | ||
| Recurring Replacements: | $0 | $5,799 | N/A | Cut-off Date LTV Ratio(1): | 66.2% | ||
| TI/LC: | $0 | $47,838 | $1,435,145 | Maturity Date LTV Ratio(1): | 56.3% | ||
| Other(6): | $2,644,007 | $0 | N/A | ||||
| Sources and Uses | ||||||
| Sources | Proceeds | % of Total | Uses | Proceeds | % of Total | |
| Whole Loan Amount(1): | $50,610,000 | 69.3% | Purchase Price(7): | $68,600,149 | 93.9% | |
| Borrower Equity: | $22,448,654 | 30.7% | Reserves: | $3,576,035 | 4.9% | |
| Closing Costs: | $882,470 | 1.2% | ||||
| Total Sources: | $73,058,654 | 100.0% | Total Uses: | $73,058,654 | 100.0% | |
| (1) | The 1890 Ranch Mortgage Loan (as defined below) is a part of the 1890 Ranch Whole Loan (as defined below) with an original aggregate principal balance of $50,610,000. The Cut-off Date Balance per SF, Maturity Date Balance per SF, UW NOI Debt Yield, UW NOI Debt Yield at Maturity, UW NCF DSCR, Cut-off Date LTV Ratio and Maturity Date LTV Ratio numbers presented above are based on the aggregate principal balance of the promissory notes comprising the 1890 Ranch Whole Loan. |
| (2) | See “The Mortgage Loan” and “Additional Secured Indebtedness (not including trade debts)” below for further discussion of additional debt. |
| (3) | The appraised value was determined prior to the emergence of the novel coronavirus and the economic disruption resulting from measures to combat the coronavirus, and all LTV metrics were calculated based on such prior information. In addition, the pandemic is an evolving situation and could impact the 1890 Ranch Whole Loan more severely than assumed in the underwriting of the 1890 Ranch Whole Loan and could adversely affect the NOI, NCF and occupancy information, as well as the appraised value and the DSCR, LTV and Debt Yield metrics presented above and herein. See “Risk Factors-—Risks Related to Market Conditions and Other External Factors—The Coronavirus Pandemic Has Adversely Affected the Global Economy and Will Likely Adversely Affect the Performance of the Mortgage Loans” in the Preliminary Prospectus. |
| (4) | Historically, the 1890 Ranch Property (as defined below) was owned and managed along with several parcels that are not included in the loan collateral, without separate reporting for each parcel. As a result, no separate historical operating statements for the loan collateral are available. |
| (5) | See “Escrows and Reserves” section below. |
| (6) | As of November 10, 2020, the current balance of the Other Reserves is $469,712. The Free Rent Funds Reserve (as defined below) has been completely released and the Outstanding TI/LC Reserve has a balance of approximately $52,644. In addition, a Debt Service Reserve (as defined below) totaling $417,068 was funded at the end of the forbearance period. |
| (7) | In March 2020, the borrower sponsor entered a contract to purchase the 1890 Ranch Property and two adjacent outparcels, which are not collateral for the 1890 Ranch Mortgage Loan, for $96,500,000. The borrower sponsor sold the two adjacent outparcels to a third party buyer for $25,200,000, which resulted in a purchase price for the collateral of $71,300,000. The purchase price shown above is net of a seller credit of $2,699,851. |
The Mortgage Loan. The tenth largest mortgage loan (the “1890 Ranch Mortgage Loan”) is part of a whole loan (the “1890 Ranch Whole Loan”) evidenced by two pari passu promissory notes in the aggregate original principal amount of $50,610,000, both of which are secured by a first priority fee mortgage encumbering a retail property located in Cedar Park, Texas (the “1890 Ranch Property”). The controlling Note A-1, in the original principal amount of $30,000,000, represents the 1890 Ranch Mortgage Loan and will be included in the BANK 2020-BNK29 securitization trust. The non-controlling Note A-2, in the original principal amount of $20,610,000 (the “1890 Ranch Serviced Pari Passu Companion Loan”), is expected to be contributed to a future securitization transaction. The 1890 Ranch Whole Loan will be serviced pursuant to the pooling and servicing agreement for the BANK 2020-BNK29 securitization trust. See “Description of the Mortgage Pool—The Whole Loans—The Serviced Pari Passu Whole Loans” and “Pooling and Servicing Agreement” in the Prospectus.
This is not a research report and was not prepared by any Underwriter’s research department. Please see additional important information and qualifications at the end of this Term Sheet.
127
| Retail - Anchored | Loan #10 | Cut-off Date Balance: | $30,000,000 | |
| 1335, 1401, 1501 & 1505 East Whitestone | 1890 Ranch | Cut-off Date LTV: | 66.2% | |
| Blvd and 1104 & 1005 C-Bar Ranch Trail | UW NCF DSCR: | 2.17x | ||
| Cedar Park, TX 78613 | UW NOI Debt Yield: | 12.0% |
| 1890 Ranch Whole Loan Summary | |||||
| Note | Original Balance | Cut-off Date Balance | Note Holder | Controlling Piece | |
| A-1 | $30,000,000 | $30,000,000 | BANK 2020-BNK29 | Yes | |
| A-2 | $20,610,000 | $20,610,000 | MSBNA | No | |
| Total | $50,610,000 | $50,610,000 | |||
The Borrower and the Borrower Sponsor. The borrower for the 1890 Ranch Whole Loan is 1431 SC, LTD. (the “1890 Ranch Borrower”), a single-purpose Texas limited partnership with one independent director. The non-recourse carveout guarantor is CTE Holdings, LP and the borrower sponsor is Endeavor Real Estate Group. The non-recourse carveout guarantor is owned by Chris Ellis and Amy Ellis; the non-recourse carveout guarantor does not own an interest in the 1890 Ranch Borrower; however, Chris Ellis and Amy Ellis own interests in the 1890 Ranch Borrower. Mr. Ellis is a managing principal of Endeavor Real Estate Group (“Endeavor”). Founded in 1999, Endeavor is a full-service commercial real estate company headquartered in Austin, Texas that offers leasing, tenant representation, property acquisition, property disposition, land sales, development, and property management services. Since its inception, Endeavor has developed and/or acquired over 15.8 million SF of commercial real estate. Endeavor has 167 employees, 8 million SF of office, industrial and retail space under management and 3.4 million SF currently under construction.
The Property. The 1890 Ranch Property is a 441,583 SF anchored retail shopping center in Cedar Park, Texas. The 1890 Ranch Property was built between 2008 and 2011 and is situated on nine separate parcels, two of which contain retention ponds and are not improved. The loan structure provides for the partial release of five of the parcels, subject to certain conditions detailed in the “Release of Property” section below. The total site area for the 9 parcels is 41.56 acres with a net site area of 38.80 acres (net of the two retention ponds). The 1890 Ranch Property contains 2,058 parking spaces (4.7 spaces per 1,000 SF). The 1890 Ranch Property is anchored by Academy Sports + Outdoors, Gold’s Gym, Cinemark, Burlington and Ross Dress for Less. As of September 30, 2020, the 1890 Ranch Property was 92.4% leased to 49 diverse, regional and local tenants. The rent roll is granular, with no tenant accounting for more than 9.1% of SF, except for Academy Sports + Outdoors. The 1890 Ranch Property benefits from long term tenancy with a total of 20 tenants (64.3% of the NRA and 63.7% of UW rent) having been in occupancy for over 10 years and 35 tenants (76.5% of NRA and 81.0% of UW rent) having been in occupancy for over five years. The 1890 Ranch Property, together with several outparcels that are not part of the collateral, was originally developed by the borrower sponsor between 2008 and 2011, and sold by the borrower sponsor in 2011, prior to its recent acquisition in March 2020.
Major Tenants.
Academy Sports + Outdoors (80,352 SF, 18.2% of NRA, 9.1% of underwritten rent). Academy Sports + Outdoors is a sports, outdoor and lifestyle retailer with a broad assortment of hunting, fishing, and camping equipment and gear along with sports and leisure products, footwear, apparel and much more. The Texas-based company operates over 250 stores throughout the United States. Academy Sports + Outdoors has been a tenant at the 1890 Ranch Property since 2008, has a lease expiration of August 31, 2023 and has three, 5-year renewal options remaining.
Gold’s Gym (40,000 SF, 9.1% of NRA, 11.2% of underwritten rent). Gold’s Gym is an American chain of fitness centers. Gold’s Gym has expanded to over 700 locations, serving 3 million people across six continents each day. Gold’s Gym has been a tenant at the 1890 Ranch Property since 2008, has a lease expiration of September 30, 2023 and has three, 5-year renewal options remaining.
Cinemark (39,144 SF, 8.9% of NRA, 8.8% of underwritten rent). Cinemark is a chain of theatres that started in California, Texas, and Utah. It has grown to be the third largest theatre chain in the United States. Headquartered in Plano, Texas, Cinemark Holdings, Inc. operates 534 theatres and 5,977 screens in the United States and Latin America as of June 30, 2020. Cinemark has been a tenant at the 1890 Ranch Property since 2007, has a lease expiration of October 31, 2022 and has four, 5-year renewal options remaining.
Burlington (36,736 SF, 8.3% of NRA, 5.8% of underwritten rent). Burlington was founded in 1972 as an American national off-price department store and has grown to operate over 600 stores across 45 states, as well as Puerto Rico and has over 40,000 employees. Burlington signed a lease at the 1890 Ranch Property that began in September 2020, with a lease expiration of February 28, 2031 and has four, 5-year renewal options remaining.
PetSmart (27,880 SF, 6.3% of NRA, 7.3% of underwritten rent). PetSmart is a retail chain that offers pet products and in-store services, including grooming, training and pet adoption. Based in Arizona, PetSmart has approximately 56,000 employees and over 1,650 pet stores in the United States, Canada and Puerto Rico. PetSmart has been a tenant at the 1890 Ranch Property since 2008, has a lease expiration of January 31, 2023 and has four, 5-year renewal options remaining.
This is not a research report and was not prepared by any Underwriter’s research department. Please see additional important information and qualifications at the end of this Term Sheet.
128
| Retail - Anchored | Loan #10 | Cut-off Date Balance: | $30,000,000 | |
| 1335, 1401, 1501 & 1505 East Whitestone | 1890 Ranch | Cut-off Date LTV: | 66.2% | |
| Blvd and 1104 & 1005 C-Bar Ranch Trail | UW NCF DSCR: | 2.17x | ||
| Cedar Park, TX 78613 | UW NOI Debt Yield: | 12.0% |
The following table presents a summary of the major tenants at the 1890 Ranch Property:
| Tenant Summary(1) | ||||||||||||
| Tenant Name | Credit Rating (Fitch/ Moody’s/S&P)(2) | Tenant SF | Approx.% of SF | Annual UW Rent | Annual UW Rent PSF(3) | Most Recent Sales | ||||||
| App. % of Total Annual UW Rent | $ | PSF | Occ. Cost % | Term. Option | Renewal Options | Lease Expiration | ||||||
| Academy Sports + Outdoors | NR/NR/NR | 80,352 | 18.2% | $602,640 | $7.50 | 9.1% | NAV | NAV | NAV | N | 3 x 5 year | 8/31/2023 |
| Gold’s Gym | NR/NR/NR | 40,000 | 9.1% | $740,400 | $18.51 | 11.2% | NAV | NAV | NAV | N | 3 x 5 year | 9/30/2023 |
| Cinemark | BB-/NR/BB | 39,144 | 8.9% | $583,246 | $14.90 | 8.8% | NAV | NAV | NAV | N | 4 x 5 year | 10/31/2022 |
| Burlington | BB+/NR/BB+ | 36,736 | 8.3% | $385,445 | $10.49 | 5.8% | NAV | NAV | NAV | N | 4 x 5 year | 2/28/2031 |
| PetSmart | NR/Caa2/B- | 27,880 | 6.3% | $487,900 | $17.50 | 7.3% | NAV | NAV | NAV | N | 4 x 5 year | 1/31/2023 |
| Subtotal/Wtd. Avg. | 224,112 | 50.8% | $2,799,631 | $12.49 | 42.2% | |||||||
| Other Tenants | 183,694 | 41.6% | $3,838,672 | $20.90 | 57.8% | |||||||
| Vacant Space | 33,777 | 7.6% | $0 | $0.00 | 0.0% | |||||||
| Total/Wtd. Avg. | 441,583 | 100.0% | $6,638,303 | $16.28 | 100.0% | |||||||
| (1) | Information is based on the underwritten rent roll as of September 30, 2020. |
| (2) | Certain ratings are those of the parent company whether or not the parent guarantees the lease. |
| (3) | Wtd. Avg. Annual UW Rent PSF excludes vacant space. |
The following table presents certain information relating to the lease rollover at the 1890 Ranch Property:
| Lease Rollover Schedule(1)(2) | ||||||||
| Year | # of Leases Rolling | SF Rolling | Annual UW Rent PSF Rolling | Approx. % of Total SF Rolling | Approx. Cumulative % of SF Rolling | Total UW Rent Rolling | Approx. % of Total Rent Rolling | Approx. Cumulative % of Total Rent Rolling |
| MTM | 0 | 0 | $0.00 | 0.0% | 0.0% | $0 | 0.0% | 0.0% |
| 2020 | 0 | 0 | $0.00 | 0.0% | 0.0% | $0 | 0.0% | 0.0% |
| 2021 | 4 | 22,110 | $14.56 | 5.0% | 5.0% | $321,893 | 4.8% | 4.8% |
| 2022 | 6 | 56,884 | $18.32 | 12.9% | 17.9% | $1,042,397 | 15.7% | 20.6% |
| 2023 | 11 | 183,689 | $14.19 | 41.6% | 59.5% | $2,605,726 | 39.3% | 59.8% |
| 2024 | 6 | 17,281 | $21.52 | 3.9% | 63.4% | $371,843 | 5.6% | 65.4% |
| 2025 | 7 | 45,483 | $17.36 | 10.3% | 73.7% | $789,484 | 11.9% | 77.3% |
| 2026 | 4 | 22,073 | $18.27 | 5.0% | 78.7% | $403,243 | 6.1% | 83.4% |
| 2027 | 2 | 7,817 | $31.18 | 1.8% | 80.5% | $243,759 | 3.7% | 87.0% |
| 2028 | 1 | 1,496 | $27.00 | 0.3% | 80.8% | $40,392 | 0.6% | 87.7% |
| 2029 | 2 | 3,700 | $27.76 | 0.8% | 81.6% | $102,725 | 1.5% | 89.2% |
| 2030 | 1 | 2,100 | $28.00 | 0.5% | 82.1% | $58,800 | 0.9% | 90.1% |
| 2031 & Beyond | 5 | 45,173 | $14.57 | 10.2% | 92.4% | $658,041 | 9.9% | 100.0% |
| Vacant | 0 | 33,777 | $0.00 | 7.6% | 100.0% | $0 | 0.0% | 100.0% |
| Total/Wtd. Avg. (3) | 49 | 441,583 | $16.28 | 100.0% | $6,638,303 | 100.0% | ||
| (1) | Information is based on the underwritten rent roll as of September 30, 2020. |
| (2) | Certain tenants may have lease termination options that are exercisable prior to the stated expiration date of the subject lease or leases, which are not considered in the lease rollover schedule. |
| (3) | Total/Wtd. Avg. Annual UW Rent PSF Rolling excludes vacant space. |
COVID-19 Update. The 1890 Ranch Borrower entered into a forbearance agreement on May 29, 2020. The lender agreed to 3 months of forbearance of all interest payments and reserve fund payments due on the June, July and August 2020 payment dates. As of November 2, 2020, the 1890 Ranch Whole Loan is current as of the November debt service payment and is not subject to any forbearance, modification or debt service relief request. The 1890 Ranch Borrower has repaid all deferred interest, replenished reserve accounts, and established a 3-month debt service reserve. As of October 29, 2020, the 1890 Ranch Borrower has reported that the 1890 Ranch Property is open and operating with 88.2% of tenants by occupied NRA and 89.9% of tenants by underwritten base rent having paid their full October 2020 rent payments. As of October 29, 2020, the 1890 Ranch Borrower has reported that 23.5% of tenants by occupied NRA were granted some form of rent relief in past months and have returned to paying full rent and 9.9% of tenants by occupied NRA were granted some form of rent relief and are still paying abated rent.
The Market. The 1890 Ranch Property is located in Cedar Park, Texas within the Austin retail market and the Cedar Park submarket. Major employers in the area include Apple, Oracle and Toshiba. The neighborhood has significant concentrations of users in the technical/digital industries, including Dell Technologies. In addition to its strong employment base, the area is easily accessible to surrounding submarkets and Brushy Creek Lake Park: a 90-acre park that offers various recreational activities. Primary access to the 1890 Ranch Property is provided by U.S. Route 183, a major arterial that crosses the Austin area in a north and south direction. According to the appraisal, as of the third quarter of 2019, the Austin retail market had approximately 111.9 million SF of retail space inventory, overall vacancy in the market was approximately 4.1% and asking rent was $22.19 PSF. According to the appraisal,
This is not a research report and was not prepared by any Underwriter’s research department. Please see additional important information and qualifications at the end of this Term Sheet.
129
| Retail - Anchored | Loan #10 | Cut-off Date Balance: | $30,000,000 | |
| 1335, 1401, 1501 & 1505 East Whitestone | 1890 Ranch | Cut-off Date LTV: | 66.2% | |
| Blvd and 1104 & 1005 C-Bar Ranch Trail | UW NCF DSCR: | 2.17x | ||
| Cedar Park, TX 78613 | UW NOI Debt Yield: | 12.0% |
as of the third quarter of 2019, the Cedar Park submarket had approximately 6.9 million SF of retail space inventory, overall vacancy in the market was approximately 4.1% and asking rent was $21.48 PSF. According to the appraisal, the 2019 estimated population within a one-, three- and five-mile radius of the 1890 Ranch Property was 7,702, 74,852 and 196,793, respectively. The 2019 estimated average household income within a one-, three- and five-mile radius of the 1890 Ranch Property was $107,762, $112,586 and $118,601, respectively.
The following table presents recent leasing data for tenants at comparable retail properties with respect to the 1890 Ranch Property:
| Comparable Retail Property Summary (Anchor Tenants) | ||||||
Property Name/ City, State | Lease Type | Tenant Name | Lease Area (SF) | Lease Date | Lease Term (Mos.) | Rent PSF |
Parkline Shopping Center Cedar Park, TX | NNN | Pot Belly | 1,030 | Sept. 2018 | 60 | $30.00 |
Lakeline Plaza Cedar Park, TX | NNN | LBC Salon | 1,000 | Sept. 2018 | 60 | $49.25 |
The Parke Cedar Park, TX | NNN | Starbucks | 2,000 | August 2017 | 120 | $49.66 |
Boardwalk Shopping Round Rock, TX | NNN | Innovaslim | 2,058 | Nov. 2018 | 60 | $25.08 |
Cedar Park Town Cedar Park, TX | NNN | Cycle Bar | 2,134 | July 2018 | 60 | $36.00 |
Source: Appraisal.
The following table presents certain information relating to the appraisal’s market rent conclusion for the 1890 Ranch Property:
| Market Rent Summary | ||||
| Market Rent (PSF) | Lease Term (Months) | Lease Type (Reimbursements) | Rent Increase Projection | |
| Premium Space: | $45.00 | 60 | NNN | 2.50%/year |
| Good Space: | $38.00 | 60 | NNN | 2.50%/year |
| Average Space: | $30.00 | 60 | NNN | 2.50%/year |
| Typical In-Line Space: | $25.00 | 60 | NNN | 2.50%/year |
| Anchor Space: | $11.00 | 120 | NNN | 2.50%/year |
| Jr. Anchor Space: | $15.00 | 120 | NNN | 2.50%/year |
| Theater Space: | $15.00 | 120 | NNN | 2.50%/year |
| Fitness Space: | $13.50 | 120 | NNN | 2.50%/year |
Source: Appraisal.
This is not a research report and was not prepared by any Underwriter’s research department. Please see additional important information and qualifications at the end of this Term Sheet.
130
| Retail - Anchored | Loan #10 | Cut-off Date Balance: | $30,000,000 | |
| 1335, 1401, 1501 & 1505 East Whitestone | 1890 Ranch | Cut-off Date LTV: | 66.2% | |
| Blvd and 1104 & 1005 C-Bar Ranch Trail | UW NCF DSCR: | 2.17x | ||
| Cedar Park, TX 78613 | UW NOI Debt Yield: | 12.0% |
Underwritten Net Cash Flow. The following table presents certain information relating to the Underwritten Net Cash Flow at the 1890 Ranch Property:
| Cash Flow Analysis(1)(2) | |||||
| UW | UW Per SF | ||||
| Gross Potential Rent(3) | $7,538,243 | $17.07 | |||
| Total Recoveries | $3,988,687 | $9.03 | |||
| Other Income | $0 | $0.00 | |||
| Less Vacancy & Credit Loss | ($1,205,038) | ($2.73) | |||
| Effective Gross Income | $10,321,892 | $23.37 | |||
| Real Estate Taxes | $2,817,259 | $6.38 | |||
| Insurance | $170,547 | $0.39 | |||
| Other Expenses | $1,257,843 | $2.85 | |||
| Total Expenses | $4,245,649 | $9.61 | |||
| Net Operating Income | $6,076,243 | $13.76 | |||
| Capital Expenditures | $69,591 | $0.16 | |||
| TI/LC | $313,524 | $0.71 | |||
| Net Cash Flow | $5,693,128 | $12.89 | |||
| Occupancy % | 88.1%(4) | ||||
| NOI DSCR (IO)(5) | 3.71x | ||||
| NOI DSCR (P&I)(5) | 2.32x | ||||
| NCF DSCR (IO)(5) | 3.48x | ||||
| NCF DSCR (P&I)(5) | 2.17x | ||||
| NOI Debt Yield(5) | 12.0% | ||||
| NCF Debt Yield(5) | 11.2% | ||||
| (1) | For the avoidance of doubt, no COVID specific adjustments have been made to the lender underwriting. |
| (2) | Historically, the 1890 Ranch Property was owned and managed along with several parcels that are not included in the loan collateral, without separate reporting for each parcel. As a result, no separate historical operating statements for the loan collateral are available. |
| (3) | UW Gross Potential Rent is based on the underwritten rent roll dated September 30, 2020 and includes rent steps through October 31, 2021 totaling $72,423. |
| (4) | UW Occupancy % represents economic occupancy. Physical occupancy was 92.4% as of September 30, 2020. |
| (5) | Debt service coverage ratios and debt yields are based on the 1890 Ranch Whole Loan. |
Escrows and Reserves.
Taxes – The 1890 Ranch Whole Loan documents provide for an upfront reserve of $902,664 for real estate taxes and ongoing monthly deposits into a reserve for real estate taxes in an amount equal to 1/12 of the real estate taxes that the lender estimates will be payable during the next twelve months (less any taxes paid directly to the taxing authority by the tenant Academy Sports + Outdoors (“Academy”) pursuant to its lease).
Insurance – The 1890 Ranch Whole Loan documents provide for an upfront reserve of $29,364 for insurance premiums and ongoing monthly deposits into a reserve for insurance premiums in an amount equal to 1/12 of the insurance premiums that the lender estimates will be payable for the renewal of coverage upon the expiration of the insurance policies. However, no monthly deposits for insurance premiums are required to be collected with respect to the space leased by Academy so long as Academy provides insurance on its space that satisfies all of the requirements in the loan agreement and in its lease, and the 1890 Ranch Borrower provides evidence satisfactory to the lender of such insurance coverage. If the 1890 Ranch Borrower maintains a blanket policy of insurance that includes coverage for the 1890 Ranch Property, such monthly deposits for insurance premiums are not required, for so long as (i) the 1890 Ranch Borrower pays the associated premiums directly and provides to the lender, as coverages or premiums change but no less than once per calendar year, a letter from the insurance provider stating (a) that insurance coverage for the 1890 Ranch Property will not be cancelled, terminated or reduced because of any matter relating to any other covered property (other than the 1890 Ranch Property), and (b) the annual premium that would be required to maintain coverage for the 1890 Ranch Property in the event that the coverage under the blanket policy is cancelled, terminated or reduced, and (ii) the 1890 Ranch Borrower provides the lender with evidence of renewal or a new blanket policy, no later than 20 business days prior to the expiration of the current policy.
Recurring Replacements Reserve – The 1890 Ranch Whole Loan documents provide for monthly deposits of approximately $5,799 into a reserve for approved capital expenditures.
TI/LC Reserve – The 1890 Ranch Whole Loan documents provide for monthly deposits of approximately $47,838 for future tenant improvements and leasing commissions capped at $1,435,145.
This is not a research report and was not prepared by any Underwriter’s research department. Please see additional important information and qualifications at the end of this Term Sheet.
131
| Retail - Anchored | Loan #10 | Cut-off Date Balance: | $30,000,000 | |
| 1335, 1401, 1501 & 1505 East Whitestone | 1890 Ranch | Cut-off Date LTV: | 66.2% | |
| Blvd and 1104 & 1005 C-Bar Ranch Trail | UW NCF DSCR: | 2.17x | ||
| Cedar Park, TX 78613 | UW NOI Debt Yield: | 12.0% |
Outstanding TI/LC Reserve – The 1890 Ranch Whole Loan documents provide for an upfront reserve of $2,133,845 for unpaid tenant improvement allowances and leasing commissions incurred by the 1890 Ranch Borrower with respect to the leases for the tenants Burlington and TruRest.
Free Rent Funds Reserve – The 1890 Ranch Whole Loan documents provide for an upfront reserve of approximately $510,162 for free rent for the tenants Burlington and TruRest.
Debt Service Reserve – In connection with the prior loan forbearance, a debt service reserve was funded in the amount of three months of interest payments under the 1890 Ranch Whole Loan to be held until released as provided below. The debt service reserve is required to be released to the 1890 Ranch Borrower on the date that is 12 months after the Closing Date of the BANK 2020-BNK29 securitization, provided that (i) no event of default exists under the 1890 Ranch Whole Loan and (ii) the 1890 Ranch Borrower provides evidence satisfactory to the lender that the debt service coverage ratio (assuming that debt service payments are required based on a 30-year amortization schedule and using a trailing three months operating statement and current in-place rent roll, without submarket vacancy adjustment) is at least 1.60x.
Lockbox and Cash Management. The 1890 Ranch Whole Loan is structured with a hard lockbox and springing cash management. All rents and other revenues from the 1890 Ranch Property are required to be deposited directly into the lockbox account or, if received by the 1890 Ranch Borrower or the property manager, deposited into the lockbox account within one business day of receipt. During a Cash Sweep Period (as defined below), all funds in the lockbox account are required to be swept on each business day to a lender-controlled cash management account and disbursed according to the 1890 Ranch Whole Loan documents: (i) to make the monthly deposits into the real estate tax and insurance reserves as described above under “Escrows and Reserves,” (ii) to pay debt service on the 1890 Ranch Whole Loan, (iii) to make the monthly deposit into the recurring replacements reserve as described above under “Escrows and Reserves,” (iv) to make the monthly deposit into the TI/LC funds reserve as described above under “Escrows and Reserves,” (v) during a Cash Sweep Period that continues to exist other than as a result of an event of default, to pay monthly operating expenses as set forth in the annual budget (which is required to be approved by the lender), and (vi) to apply any remainder (x) if a Cash Sweep Period is continuing, to be deposited into an excess cash flow subaccount to be held as additional security for the 1890 Ranch Whole Loan during the continuance of such Cash Sweep Period: provided, however, that if the sole cause of a Cash Sweep Period is a Major Tenant Go Dark Event (defined below) and each Major Tenant (defined below) that is subject to the Major Tenant Go Dark Event is continuing to pay full unabated base rent under its lease, then the excess cash flow will only be deposited into the excess cash flow subaccount in an amount such that the aggregate total of such deposits from and after the date of such Major Tenant Go Dark Event is equal to $2,000,000 (the “Major Tenant Go Dark Cash Flow Cap”) and all available funds remaining after the Major Tenant Go Dark Cash Flow Cap has been reached are required to be disbursed to the 1890 Ranch Borrower and (y) if no Cash Sweep Period is continuing, to be disbursed to the 1890 Ranch Borrower.
“Cash Sweep Period” means a period:
| (i) | Commencing upon an event of default under the 1890 Ranch Whole Loan documents and ending upon the cure, if applicable, of such event of default, or |
| (ii) | Commencing upon the date the lender determines the debt service coverage ratio (assuming that debt service payments are required based on a 30 year amortization schedule and using a trailing six months operating statement and current in-place rent roll) has fallen below 1.20x as of the end of any calendar quarter, and ending on the date that the 1890 Ranch Borrower provides evidence satisfactory to the lender that the debt service coverage ratio has been at least 1.20x for the immediately preceding two consecutive calendar quarters, |
| (iii) | Commencing upon the occurrence of a Major Tenant Vacancy Event (as defined below) and ending upon a Major Tenant Vacancy Event Cure (as defined below), or |
| (iv) | Commencing upon the occurrence of a Target Vacancy Event (as defined below) and ending upon a Target Vacancy Cure (as defined below). |
“Major Tenant Vacancy Event” means, the date on which any of the following events occurs with respect to any two Major Tenants: (i) such Major Tenant or its parent company becomes subject to voluntary or involuntary bankruptcy or insolvency proceedings (a “Major Tenant Bankruptcy Event”), (ii) such Major Tenant gives notice that it is not renewing its lease (a “Major Tenant Non-Renewal Event”), (iii) the date which is six months prior to the then-applicable expiration date of the lease of such Major Tenant without the lease of such Major Tenant having been renewed (a “Major Tenant Expiration Event”), (iv) such Major Tenant gives notice that it is ceasing operations at the 1890 Ranch Property or ceases operations without notice even though it is continuing to pay full unabated base rent (a “Major Tenant Go Dark Event”) or (v) such Major Tenant vacates its demised premises under its lease (a “Major Tenant Departure Event”).
“Major Tenant” means any of Academy, OfficeMax and Ross Dress for Less.
“Major Tenant Vacancy Cure” means with respect to the two Major Tenants that have become the subject of a Major Tenant Vacancy Event, that any of the following applicable events has occurred with respect to one of such Major Tenants (i) in the case of a Major Tenant Bankruptcy Event, a reaffirmation of the subject lease has been effected by the debtor-in-possession or trustee in the applicable bankruptcy proceeding and the subject tenant is open for business and in occupancy of all of its demised space at the 1890 Ranch Property or such space has been re-leased under Approved Lease Terms (as defined below), (ii) in the case of a Major Tenant Non-Renewal Event, such Major Tenant has nevertheless renewed its lease with the 1890 Ranch Borrower under Approved Lease Terms, (iii) in the case of a Major Tenant Expiration Event, the applicable Major Tenant or a replacement tenant has renewed or entered into a lease with the 1890 Ranch Borrower under Approved Lease Terms, and (iv) in the case of a Major Tenant Go Dark Event or Major Tenant Departure Event, such Major Tenant or a replacement tenant has occupied the applicable space and is operating its business under, with respect to a replacement tenant, Approved Lease Terms.
“Approved Lease Terms” means that (i) a lease (or lease renewal, as the case may be) has been entered into that (A) has a term (or renewal term) of at least five years, (B) would, after giving effect to the base rental payable thereunder, cause the debt service coverage ratio of the 1890 Ranch Property to be at least 1.20x, and (C) has been approved by the lender, which approval may not be unreasonably withheld; (ii) the tenant has been approved by the lender, which approval may not be unreasonably withheld; (iii) the tenant has taken occupancy of the applicable space and the tenant is operating its business therein; and (iv) the tenant is paying its full unabated base monthly rent.
This is not a research report and was not prepared by any Underwriter’s research department. Please see additional important information and qualifications at the end of this Term Sheet.
132
| Retail - Anchored | Loan #10 | Cut-off Date Balance: | $30,000,000 | |
| 1335, 1401, 1501 & 1505 East Whitestone | 1890 Ranch | Cut-off Date LTV: | 66.2% | |
| Blvd and 1104 & 1005 C-Bar Ranch Trail | UW NCF DSCR: | 2.17x | ||
| Cedar Park, TX 78613 | UW NOI Debt Yield: | 12.0% |
“Target Vacancy Event” means the date on which any of the following events occurs with respect to the Target store (as defined below): (i) Target ceases operations in the Target store (the “Target Store”) located on land adjacent to the 1890 Ranch Property (a “Target Go Dark Event”), or (ii) Target vacates the Target Store (a “Target Departure Event”).
“Target Vacancy Cure” means in the case of a Target Go Dark Event or Target Departure Event, that Target has re-occupied and is operating its business in the Target Store.
Additional Secured Indebtedness (not including trade debts). The 1890 Ranch Property also secures the 1890 Ranch Serviced Pari Passu Companion Loan, which has a Cut-off Date principal balance of $20,610,000. The 1890 Ranch Serviced Pari Passu Companion Loan accrues interest at the same rate as the 1890 Ranch Mortgage Loan. The 1890 Ranch Mortgage Loan is entitled to payments of interest on a pro rata and pari passu basis with the 1890 Ranch Serviced Pari Passu Companion Loan. The holders of the 1890 Ranch Mortgage Loan and the 1890 Ranch Serviced Pari Passu Companion Loan have entered into a co-lender agreement which sets forth the allocation of collections on the 1890 Ranch Whole Loan. See “Description of the Mortgage Pool—The Whole Loans—The Serviced Pari Passu Whole Loans” in the Preliminary Prospectus.
Mezzanine Loan and Preferred Equity. Not permitted.
Release of Property. After April 1, 2022, the 1890 Ranch Borrower has a right to obtain a release of any one or more of five release parcels constituting income-producing portions of the 1890 Ranch Property, provided no event of default is continuing and subject to the conditions set forth in the 1890 Ranch Whole Loan documents, including, among others, (1) prepayment of the 1890 Ranch Whole Loan in a principal amount equal to (A) 110% of the allocated loan amount for the applicable release parcel (the “Release Amount”), if after giving effect to the partial release, the debt yield with respect to the remaining parcels of the 1890 Ranch Property is not less than 11.5%, or (B) the greater of (i) the Release Amount for the applicable release parcel and (ii) the net settlement proceeds from the sale of such release parcel, if after giving effect to the partial release, the debt yield with respect to the remaining parcels of the 1890 Ranch Property is less than 11.5%, and in the case of each of (A) and (B), payment of the yield maintenance premium on the amount prepaid (if prior to the open period), (2) if any release parcel is transferred to an affiliate of the 1890 Ranch Borrower, such affiliate must agree in writing that it will not (a) develop or construct any improvements on the release parcel for purposes of leasing any or all of such improvements to any current or then-existing tenant of the 1890 Ranch Property (excluding the release parcel proposed to be released), and (b) provide any incentives to any current or then-existing tenant of the 1890 Ranch Property (without taking into account the release parcel proposed to be released) to (or designed to incentivize such tenant to), or otherwise solicit or encourage any such tenant to, relocate from the 1890 Ranch Property to the release parcel, (3) delivery of a copy of any amendment to the reciprocal easement agreement to be executed on or prior to the release date, which may contain cross-easements for the benefit of the release parcel and the remainder of the 1890 Ranch Property and would be acceptable to a prudent lender subordinating its mortgage to such an amendment, (4) after giving effect to the partial release, the debt yield of the remaining 1890 Ranch Property is greater than the debt yield immediately prior to the partial release, and (5) certain REMIC-related conditions are satisfied.
The table below contains information regarding the release parcels.
| Description of Release Parcel | Appraised Value | Release Amount (110% of Allocated Loan Amount) |
| Parcel 1 (Office Depot) | $2,950,000 | $1,960,200 |
| Parcel 5 (Academy Sports + Outdoors) | $6,650,000 | $4,417,600 |
| Parcel 7 (Gold’s Gym and 22,759 SF of inline space) | $17,200,000 | $11,426,800 |
| Parcel 8 (Ross Dress for Less) | $3,540,000 | $2,351,800 |
| Parcel 9 (26,971 SF of inline space) | $7,990,000 | $5,307,500 |
| Total | $38,330,000 | $25,463,900 |
Letter of Credit. None.
Right of First Offer / Right of First Refusal. None
Ground Lease. None
Terrorism Insurance. The 1890 Ranch Borrower is required to obtain and maintain an “all risk” property insurance policy that covers perils of terrorism and acts of terrorism in an amount equal to the “full replacement cost” of the 1890 Ranch Property, together with business income insurance covering not less than the 18-month period commencing at the time of loss plus an extended period of indemnity endorsement of up to six months. Notwithstanding the foregoing, for so long as the Terrorism Risk Insurance Act of 2002, as extended and modified by the Terrorism Risk Insurance Program Reauthorization Act of 2015 (“TRIPRA”), is in effect (including any extensions thereof or if another federal governmental program is in effect relating to “acts of terrorism” which provides substantially similar protections as TRIPRA), the lender is required to accept terrorism insurance which covers against “covered acts” as defined by TRIPRA (or such other program) as full compliance with the loan documents, but only in the event that TRIPRA (or such other program) continues to cover both domestic and foreign acts of terrorism. See “Risk Factors—Risks Relating to the Mortgage Loans—Terrorism Insurance May Not Be Available for All Mortgaged Properties” in the Preliminary Prospectus.
This is not a research report and was not prepared by any Underwriter’s research department. Please see additional important information and qualifications at the end of this Term Sheet.
133
| Mortgage Loan No. 11 – 2100 River |
| Mortgage Loan Information | Property Information | ||||||
| Mortgage Loan Seller: | WFB | Single Asset/Portfolio: | Single Asset | ||||
| Credit Assessment (DBRSM/Fitch/Moody’s): | NR/NR/NR | Location: | Portland, OR 97201 | ||||
| Original Balance: | $28,000,000 | General Property Type: | Office | ||||
| Cut-off Date Balance: | $28,000,000 | Detailed Property Type: | CBD | ||||
| % of Initial Pool Balance: | 3.2% | Title Vesting: | Fee | ||||
| Loan Purpose: | Refinance | Year Built/Renovated: | 1995/2019 | ||||
| Sponsor: | Walter C. Bowen | Size: | 96,249 SF | ||||
| Guarantor: | Walter C. Bowen | Cut-off Date Balance per SF: | $291 | ||||
| Mortgage Rate: | 3.4000% | Maturity Balance per SF: | $291 | ||||
| Note Date: | 10/16/2020 | Property Manager: | Bowen Property Management Co. | ||||
| First Payment Date: | 12/11/2020 | (borrower-related) | |||||
| Maturity Date: | 11/11/2030 | Underwriting and Financial Information(4) | |||||
| Original Term to Maturity: | 120 months | UW NOI: | $2,568,214 | ||||
| Original Amortization Term: | 0 months | UW NOI Debt Yield: | 9.2% | ||||
| IO Period: | 120 months | UW NOI Debt Yield at Maturity: | 9.2% | ||||
| Seasoning: | 0 months | UW NCF DSCR: | 2.49x | ||||
| Prepayment Provisions: | LO (24); DEF (92); O (4) | Most Recent NOI: | $2,074,734 (6/30/2020 TTM) | ||||
| Lockbox/Cash Mgmt Status: | Soft/Springing | 2nd Most Recent NOI: | $2,274,220 (12/31/2019) | ||||
| Additional Debt Type: | No | 3rd Most Recent NOI: | $2,591,598 (12/31/2018) | ||||
| Additional Debt Balance: | N/A | Most Recent Occupancy: | 100.0% (10/1/2020) | ||||
| Future Debt Permitted (Type): | No (N/A) | 2nd Most Recent Occupancy: | 100.0% (12/31/2019) | ||||
| Reserves | 3rd Most Recent Occupancy: | 100.0% (12/31/2018) | |||||
| Type | Initial | Monthly | Cap | Appraised Value (as of)(5): | $43,400,000 (11/1/2020) | ||
| Real Estate Taxes: | $47,657 | $47,657 | N/A | Appraised Value per SF(5): | $451 | ||
| Insurance: | $0 | Springing(1) | N/A | Cut-off Date LTV Ratio(5): | 64.5% | ||
| Recurring Replacements: | $0 | $2,005(2) | $72,187 | Maturity Date LTV Ratio(5): | 64.5% | ||
| TI/LC: | $0 | $12,031 | N/A | ||||
| Tenant Specific TI/LC Reserve: | $2,463,300(3) | $0 | N/A | ||||
| Sources and Uses | ||||||
| Sources | Proceeds | % of Total | Uses | Proceeds | % of Total | |
| Loan Amount: | $28,000,000 | 100.0% | Loan Payoff: | $21,580,002 | 77.1% | |
| Upfront Reserves: | $2,510,957 | 9.0% | ||||
| Closing Costs: | $1,076,332 | 3.8% | ||||
| Return of Equity: | $2,832,709 | 10.1% | ||||
| Total Sources: | $28,000,000 | 100.0% | Total Uses: | $28,000,000 | 100.0% | |
| (1) | The 2100 River Mortgage Loan (as defined below) documents do not require ongoing monthly escrows for insurance premiums as long as (i) no event of default is continuing, (ii) the 2100 River Property (as defined below) is covered under a blanket policy acceptable to the lender, and (iii) the borrower provides proof of renewal and receipts of payment no later than 10 business days prior to policy expiration. If said conditions are not met, the loan documents require an ongoing monthly escrow of 1/12th of the lender’s estimated insurance premiums estimated for the renewal of coverage at least 30 days’ prior to expiration. |
| (2) | The 2100 River Mortgage Loan documents require ongoing monthly escrows for recurring replacements beyond the cap upon (i) an event of default or (ii) the lender determines the borrower is not properly maintaining the property. |
| (3) | The 2100 River Mortgage Loan documents require an upfront deposit equal to $2,463,300 for tenant improvement costs owed to David Evans & Associates ($2,136,690) and Oregon International Air Freight ($326,610). |
| (4) | The novel coronavirus pandemic is an evolving situation and could impact the 2100 River Mortgage Loan more severely than assumed in the underwriting of the 2100 River Mortgage Loan and could adversely affect the NOI, NCF and occupancy information, as well as the appraised value and the DSCR, LTV and Debt Yield metrics presented above and herein. See “Risk Factors— Risks Related to Market Conditions and Other External Factors—Coronavirus Pandemic Has Adversely Affected the Global Economy and Will Likely Adversely Affect the Performance of the Mortgage Loans” in the Preliminary Prospectus. |
| (5) | The Appraised Value shown reflects a “Prospective Market Value at Stabilization” assuming free rent has burned off and tenant improvement allowances have been paid out (or reserved at loan closing). The 2100 River Borrower (as defined below) escrowed $2,463,300 for outstanding tenant improvements and leasing commissions. The appraiser also concluded to an “As-Is” appraised value of $40,900,000 as of September 17, 2020, which results in a Cut-off Date LTV Ratio and LTV Ratio at Maturity of 68.5% for the 2100 River Mortgage Loan. |
The Mortgage Loan. The eleventh largest mortgage loan (the “2100 River Mortgage Loan”) is evidenced by a single promissory note in the original principal amount of $28,000,000 and secured by a first priority fee mortgage encumbering a 96,249 SF office building (the “2100 River Property”) located in Portland, Oregon.
The Borrower and the Borrower Sponsor. The borrower is BDC/2100 Portland, LLC (the “2100 River Borrower”), a Delaware limited liability company and single purpose entity. The borrower sponsor and non-recourse carveout guarantor is Walter C. Bowen (the “Guarantor”), who founded BPM Real Estate Group (“BPM”) in 1977 for the purpose of acquiring, developing, owning and operating real estate throughout the United States. Mr. Bowen is the Chief Executive Officer of BPM, which is headquartered in Portland and has constructed and acquired more than 4,400 multifamily apartment units, 44 senior living communities, and over 1 million SF of office, hotel, and other real estate classes.
This is not a research report and was not prepared by any Underwriter’s research department. Please see additional important information and qualifications at the end of this Term Sheet.
134
| Office – CBD | Loan #11 | Cut-off Date Balance: | $28,000,000 | |
| 2100 South River Parkway | 2100 River | Cut-off Date LTV: | 64.5% | |
| Portland, OR 97201 | UW NCF DSCR: | 2.49x | ||
| UW NOI Debt Yield: | 9.2% |
The Property. The 2100 River Property is an 8-story, 96,249 SF, Class A-/B+ office building located in Portland, Oregon. Constructed in 1995 and renovated in 2019, the 2100 River Property was 100.0% occupied as of October 1, 2020 by two tenants. The 2100 River Borrower purchased the property in 2015 and has invested $1.7 million in capital improvements, $1.5 million of which is required to be repaid by the tenants pursuant to their leases, including a cooling tower steel overhaul, lobby desk removal, parking garage repairs, restroom renovations, and chiller and building management system replacements. In addition, the 2100 River Borrower has spent approximately $2.5 million on tenant improvements in connection with the renewal of both tenants’ leases in 2018 and 2019.
The 2100 River Property is situated on an approximately 1.21-acre site and includes a 176 space parking garage (1.83 spaces per 1,000 SF) on floors 2 and 3 and a portion of the first floor. Additionally, the sponsor leases 60 surface parking spaces in a nearby lot, all of which are allocated to David Evans & Associates (“DEA”), from the Oregon Department of Transportation (“ODOT”) for $4,267 per month, with 3% annual increases. The lease commenced in 1995, was recently extended in April 2020 for 5 years, and has two, 5-year extension options. ODOT may terminate the lease with 30 days’ notice, if the spaces are needed for public purposes or if ODOT determines it is in the public’s best interest. If the ODOT lease is terminated, DEA may reduce its rent by $9,000 per month ($150/ space).
Major Tenants.
David Evans & Associates (63,588 SF, 66.1% of NRA, 68.5% of underwritten gross potential rent). David Evans & Associates (“DEA”) occupies four floors and has been a tenant at the 2100 River Property, which serves as its headquarters, since 2002. In 2018, DEA extended their lease for an additional twelve years through January 2030. Founded in 1976, DEA designs and manages complex transportation, land development, water resources and energy projects nationwide. DEA does not have any termination options and has two, 5-year renewal options with 9 months’ notice at a fair market rental rate.
Oregon International Air Freight (32,661 SF, 33.9% of NRA, 31.5% of underwritten gross potential rent). Oregon International Air Freight (“OIAF”) occupies two floors and has been a tenant at the 2100 River Property, which serves as its headquarters, since 2013. Founded in 1988, OIAF is a supply chain management company that offers global logistics and packaging services with 58 offices across 26 countries. OIAF has one, 5-year renewal option at the fair market rental rate exercisable by providing written notice by October 31, 2028.
The following table presents certain information relating to the major tenants at the 2100 River Property:
| Tenant Summary(1) | |||||||||
| Tenant Name | Credit Rating (Fitch/Moody’s/S&P) | Tenant SF | Approx.% of Total SF | Annual UW Rent(2)(3) | % of Total Annual UW Rent | Annual UW Rent PSF(2)(3) | Lease Expiration | Renewal Options | Termination Option (Y/N) |
| David Evans & Associates | NR/NR/NR | 63,588 | 66.1% | $1,775,205 | 68.5% | $27.92 | 1/31/2030 | 2x5 yr | N |
| Oregon International Air Freight | NR/NR/NR | 32,661 | 33.9% | $817,305 | 31.5% | $25.02 | 10/31/2029 | 1x5 yr | N |
| Total/Wtd. Avg. | 96,249 | 100.0% | $2,592,510 | 100.0% | 26.94 | ||||
| (1) | Information is based on the underwritten rent roll as of October 1, 2020. |
| (2) | Annual UW Rent and Annual UW Rent PSF shown above include rent steps through November 2021 totaling $71,533. |
| (3) | Annual UW Rent and Annual UW Rent PSF include a $1.42 PSF reimbursement for amortized capital expenditures, which began in February 2020 and will be paid off in January 2030 ($0.31 PSF) and January 2040 ($1.11 PSF). Excluding the reimbursement, DEA’s base rent is $26.50 PSF and OIAF’s base rent is $23.60 PSF. |
The following table presents certain information relating to the lease rollover schedule at the 2100 River Property:
| Lease Rollover Schedule(1) | ||||||||
| Year | # of Leases Rolling | SF Rolling | Annual UW Rent PSF Rolling | Approx. % of Total SF Rolling | Approx. Cumulative % of SF Rolling | Total UW Rent Rolling | Approx. % of Total Rent Rolling | Approx. Cumulative % of Total Rent Rolling |
| MTM | 0 | 0 | $0.00 | 0.0% | 0.0% | $0 | 0.0% | 0.0% |
| 2020 | 0 | 0 | $0.00 | 0.0% | 0.0% | $0 | 0.0% | 0.0% |
| 2021 | 0 | 0 | $0.00 | 0.0% | 0.0% | $0 | 0.0% | 0.0% |
| 2022 | 0 | 0 | $0.00 | 0.0% | 0.0% | $0 | 0.0% | 0.0% |
| 2023 | 0 | 0 | $0.00 | 0.0% | 0.0% | $0 | 0.0% | 0.0% |
| 2024 | 0 | 0 | $0.00 | 0.0% | 0.0% | $0 | 0.0% | 0.0% |
| 2025 | 0 | 0 | $0.00 | 0.0% | 0.0% | $0 | 0.0% | 0.0% |
| 2026 | 0 | 0 | $0.00 | 0.0% | 0.0% | $0 | 0.0% | 0.0% |
| 2027 | 0 | 0 | $0.00 | 0.0% | 0.0% | $0 | 0.0% | 0.0% |
| 2028 | 0 | 0 | $0.00 | 0.0% | 0.0% | $0 | 0.0% | 0.0% |
| 2029 | 1 | 32,661 | $25.02 | 33.9% | 33.9% | $817,305 | 31.5% | 31.5% |
| 2030 | 1 | 63,588 | $27.92 | 66.1% | 100.0% | $1,775,205 | 68.5% | 100.0% |
| 2031 & Beyond | 0 | 0 | $0.00 | 0.0% | 100.0% | $0 | 0.0% | 100.0% |
| Vacant | 0 | 0 | $0.00 | 0.0% | 100.0% | $0 | 0.0% | 100.0% |
| Total/Wtd. Avg. | 2 | 96,249 | $26.94 | 100.0% | $2,592,510 | 100.0% | ||
| (1) | Information is based on the underwritten rent roll. |
This is not a research report and was not prepared by any Underwriter’s research department. Please see additional important information and qualifications at the end of this Term Sheet.
135
| Office – CBD | Loan #11 | Cut-off Date Balance: | $28,000,000 | |
| 2100 South River Parkway | 2100 River | Cut-off Date LTV: | 64.5% | |
| Portland, OR 97201 | UW NCF DSCR: | 2.49x | ||
| UW NOI Debt Yield: | 9.2% |
COVID-19 Update. As of November 3, 2020, the 2100 River Mortgage Loan is not subject to any forbearance, modification or debt service relief requests. The first debt service payment is due on December 11, 2020. As of November 3, 2020, the borrower sponsor has reported that the 2100 River Property is open and operating, with 100.0% of tenants by NRA and 100.0% of tenants by underwritten base rent having paid their full November 2020 rent payments and neither tenant has requested a lease modification or rent relief. The 2100 River Property remains 100.0% occupied as of October 1, 2020. In response to the COVID-19 pandemic, the State of Oregon implemented a moratorium on foreclosures of commercial properties through December 31, 2020. See “Risk Factors–Risks Related to Market Conditions and Other External Factors–The Coronavirus Pandemic Has Adversely Affected the Global Economy and Will Likely Adversely Affect the Performance of the Mortgage Loans” in the Preliminary Prospectus for additional information.
The Market. The 2100 River Property is located on the southern edge of the Portland central business district (“CBD”) along the Willamette River in close proximity to Interstates 5 and 405. There are a number of recent and approved developments in the property’s immediate area including RiverPlace Redevelopment, a master planned redevelopment sitting on an 8-acre site that will include at least 2,000 apartments, Knight Cancer Institute Research Building, a 320,000 SF research facility; Fourth & Montgomery, a 175,000 SF mixed use project that will include office, classroom space, and ground floor retail; and Acqua Apartments, a 100-unit apartment complex that was delivered in February 2020. According to a third party market research report, the property is located in the CBD office submarket within the greater Portland office market. As of August 2020, the submarket reported an inventory of approximately 28.2 million SF, with a 13.8% vacancy rate and average asking rent of $33.20 PSF, gross. The appraisal concluded to a market rent for the 2100 River Property of $22.50 PSF for floors 1 and 4 through 6 and $23.50 PSF for floors 7 and 8.
According to the appraisal, the 2020 estimated population within a one-, three- and five-mile radius of the 2100 River Property was 22,361, 192,803 and 450,518, respectively. The 2020 estimated average household income within a one-, three- and five-mile radius of the property was $94,344, $115,826 and $115,215, respectively.
The following table presents recent leasing data at comparable office properties with respect to the 2100 River Property:
| Comparable Office Lease Summary | |||||||||
| Property Name/Location | Year Built/ Renovated | Total GLA (SF) | Occupancy | Distance from Subject | Tenant Name | Lease Date/Term | Lease Area (SF) | Annual Base Rent PSF | Lease Type |
2100 River (Subject)(1) Portland, OR | 1995/2019 | 96,249 | 100% | N/A | DEA | Aug 2018 / 11.5 Yrs | 63,588 | $27.92 | NNN |
| OIAF | Nov 2019 / 10.0 Yrs. | 32,661 | $25.02 | NNN | |||||
First & Main Building Portland, OR | 2010/NAP | 364,735 | 93% | 1.0 mile | GSA | Sep 2020 / 10.0 Yrs | 63,649 | $25.56 | Full Service |
| Datto | Feb 2020 / 5.0 Yrs | 12,523 | $19.50 | Full Service | |||||
Block 300 Portland, OR | 1991/2014 | 361,805 | 97% | 1.2 miles | Cvent | May 2020 / 5.5 Yrs | 14,143 | $37.29 | Full Service |
| Hewlett Packard | Oct 2018 / 7.3 Yrs | 39,681 | $38.25 | Full Service | |||||
Wells Fargo Center Portland, OR | 1972/1999 | 726,425 | 82% | 0.9 miles | Campbell Global | Jun 2020 / 11.8 Yrs. | 17,520 | $105.00 | Full Service |
| Gordon & Rees | Apr 2020 / 10.8 Yrs | 10,068 | $110.00 | Full Service | |||||
Umpqua Bank Plaza Portland, OR | 1974/2018 | 284,416 | 77% | 0.7 miles | Old Republic | Jul 2020 / 5.4 Yrs. | 5,846 | $20.00 | Full Service |
| Brownstein Rask | May 2020 / 10.6 Yrs. | 12,618 | $90.00 | Full Service | |||||
| Bullivant Houser Bailey | Mar 2020 / 10.3 Yrs. | 17,776 | $102.50 | Full Service | |||||
Fremont Place I & II Portland, OR | 1987/2021 | 121,593 | 52% | 2.4 miles | Orchestra Software | Sep 2019 / 7.0 Yrs. | 15,829 | $75.00 | Full Service |
The Reserve Office Portland, OR | 1950/2008 | 62,728 | 57% | 1.6 miles | Confidential | Jan 2021 / 7.3 Yrs | 23,346 | $85.00 | Full Service |
Lloyd 700 Building Portland, OR | 1971/2011 | 260,608 | 100% | 2.4 miles | Northwest Energy Efficiency Alliance | Jan 2021 / 10.0 Yrs. | 16,288 | $75.00 | Full Service |
River Forum I & II Portland, OR | 1985/2004 | 195,637 | 90% | 1.4 miles | Trillium | Oct 2019 / 6.2 Yrs | 6,990 | $26.50 | Full Service |
| American Heart Assoc. | Jan 2019 / 5.2 Yrs | 3,800 | $10.00 | Full Service | |||||
Source: Appraisal.
| (1) | Information obtained from the underwritten rent roll. |
The following table presents certain information relating to the appraisal market rent conclusion for the 2100 River Property:
| Market Rent Summary | ||
| Office (Floors 1, 4-6) | Office (Floors 7-8) | |
| Market Rent (PSF) | $22.50 | $23.50 |
| Lease Term (Years) | 7 | 7 |
| Concessions (New / Renew) | 5 / 3 months | 5 / 3 months |
| Lease Type (Reimbursements) | NNN | NNN |
| Rent Increase Projection | 3.0% per annum | 3.0% per annum |
This is not a research report and was not prepared by any Underwriter’s research department. Please see additional important information and qualifications at the end of this Term Sheet.
136
| Office – CBD | Loan #11 | Cut-off Date Balance: | $28,000,000 | |
| 2100 South River Parkway | 2100 River | Cut-off Date LTV: | 64.5% | |
| Portland, OR 97201 | UW NCF DSCR: | 2.49x | ||
| UW NOI Debt Yield: | 9.2% |
Operating History and Underwritten Net Cash Flow. The following table presents certain information relating to the historical operating performance and Underwritten Net Cash Flow at the 2100 River Property:
| Cash Flow Analysis | ||||||
| 2017 | 2018 | 2019 | 6/30/2020 TTM | UW(1) | UW PSF | |
| Gross Potential Base Rent | $2,590,826 | $2,477,579 | $2,229,836 | $2,315,396 | $2,592,510(2)(3) | $26.94(2)(3) |
| Total Recoveries | $1,314,744 | $1,356,804 | $1,452,616 | $1,530,270 | $1,384,377(4) | $14.38 |
| Parking Income(5) | $168,281 | $159,874 | $164,957 | $172,118 | $172,118 | $1.79 |
| Other Income | $11,365 | $6,857 | $5,796 | $6,074 | $6,074 | $0.06 |
| Less Free Rent Adjustment | $0 | $0 | ($124,751) | ($499,004) | $0 | $0.00 |
| Less Vacancy & Credit Loss | $0 | $0 | $0 | $0 | ($129,625)(6) | ($1.35) |
| Effective Gross Income | $4,085,216 | $4,001,114 | $3,728,454 | $3,524,854 | $4,025,453 | $41.82 |
| Real Estate Taxes | $485,126 | $517,628 | $536,633 | $544,644 | $544,644 | $5.66 |
| Insurance | $38,868 | $55,771 | $62,033 | $63,965 | $51,052 | $0.53 |
| Other Operating Expenses | $785,915 | $836,117 | $855,568 | $841,511 | $861,542 | $8.95 |
| Total Expenses | $1,309,909 | $1,409,516 | $1,454,234 | $1,450,120 | $1,457,239 | $15.14 |
| Net Operating Income | $2,775,307 | $2,591,598(7) | $2,274,220(7) | $2,074,734(8) | $2,568,214(8) | $26.68 |
| Capital Expenditures | $0 | $0 | $0 | $0 | $24,062 | $0.25 |
| TI/LC | $0 | $0 | $0 | $0 | $144,374 | $1.50 |
| Net Cash Flow | $2,775,307 | $2,591,598 | $2,274,220 | $2,074,734 | $2,399,779 | $24.93 |
| Occupancy % | 100.0% | 100.0% | 100.0% | 100.0% | 95.0% | |
| NOI DSCR | 2.88x | 2.68x | 2.36x | 2.15x | 2.66x | |
| NCF DSCR | 2.88x | 2.68x | 2.36x | 2.15x | 2.49x | |
| NOI Debt Yield | 9.9% | 9.3% | 8.1% | 7.4% | 9.2% | |
| NCF Debt Yield | 9.9% | 9.3% | 8.1% | 7.4% | 8.6% | |
| (1) | For the avoidance of doubt, no COVID-19 specific adjustments have been incorporated in the lender UW. |
| (2) | UW Gross Potential Base Rent above includes rent steps through November 2021 totaling $71,533. |
| (3) | UW Gross Potential Base Rent includes a $1.42 PSF reimbursement for amortized capital expenditures, which began in February 2020 and will be paid off in January 2030 ($0.31 PSF) and January 2040 ($1.11 PSF). Excluding the reimbursement, DEA’s base rent is $26.50 PSF and OIAF’s base rent is $23.60 PSF. |
| (4) | Total Recoveries are net of the 5.0% underwritten vacancy. |
| (5) | Parking Income includes the contractual parking rent under the OIAF lease. |
| (6) | The underwritten vacancy is 5.0%. The actual physical vacancy is 0.0%. |
| (7) | The decrease in Net Operating Income from 2018 to 2019 was primarily attributable to (i) DEA’s base rent decreasing from $29.40 PSF to $24.92 PSF, and (ii) OIAF receiving 12 months of free rent with its lease renewal in November 2019 through October 2020. |
| (8) | The increase in Net Operating Income from 6/30/2020 TTM to UW is primarily attributable to (i) a $1.42 PSF reimbursement for amortized capital expenditures, which began in February 2020 and is included in Gross Potential Base Rent, (ii) rent steps through November 2021, totaling $71,533, which were included in the Gross Potential Base Rent, and (iii) OIAF receiving 12 months of free rent with its lease renewal in November 2019 through October 2020. |
This is not a research report and was not prepared by any Underwriter’s research department. Please see additional important information and qualifications at the end of this Term Sheet.
137
| Mortgage Loan No. 12 – 711 Fifth Avenue |
| Mortgage Loan Information | Property Information | ||||||
| Mortgage Loan Seller: | BANA | Single Asset/Portfolio: | Single Asset | ||||
| Credit Assessment (DBRSM/Fitch/Moody’s): | NR/NR/NR | Location: | New York, NY 10022 | ||||
| Original Balance(1): | $25,500,000 | General Property Type: | Mixed Use | ||||
| Cut-off Date Balance(1): | $25,500,000 | Detailed Property Type: | Office/Retail | ||||
| % of Initial Pool Balance: | 2.9% | Title Vesting: | Fee | ||||
| Loan Purpose: | Refinance | Year Built/Renovated: | 1927/2013-2019 | ||||
| Borrower Sponsors: | Bayerische Versorgungskammer; | Size: | 340,024 SF | ||||
| Deutsche Finance America LLC; DF | Cut-off Date Balance per SF(1): | $1,603 | |||||
| Deutsche Finance Holding AG; | Maturity Date Balance per SF(1): | $1,603 | |||||
| Hessen | Property Manager: | SHVO Property Management, | |||||
| Lawyers Pension Fund | LLC (borrower-related); Jones | ||||||
| Guarantor(2): | 711 Fifth Ave Principal Owner LLC | Lang LaSalle Americas, Inc. | |||||
| Mortgage Rate: | 3.1600% | ||||||
| Note Date: | 3/6/2020 | ||||||
| First Payment Date: | 4/6/2020 | Underwriting and Financial Information(7) | |||||
| Maturity Date: | 3/6/2030 | UW NOI: | $51,304,783 | ||||
| Original Term to Maturity: | 120 months | UW NOI Debt Yield(1): | 9.4% | ||||
| Original Amortization Term: | 0 months | UW NOI Debt Yield at Maturity(1): | 9.4% | ||||
| IO Period: | 120 months | UW NCF DSCR(1): | 2.90x | ||||
| Seasoning: | 8 months | Most Recent NOI: | $47,288,255 (3/31/2020 TTM) | ||||
| Prepayment Provisions(3): | LO (32); DEF (81); O (7) | 2nd Most Recent NOI: | $48,596,349 (12/31/2019) | ||||
| Lockbox/Cash Mgmt Status: | Hard/Springing | 3rd Most Recent NOI: | $44,088,566 (12/31/2018) | ||||
| Additional Debt Type(1): | Pari Passu | Most Recent Occupancy: | 76.5% (1/31/2020) | ||||
| Additional Debt Balance(1): | $519,500,000 | 2nd Most Recent Occupancy: | 67.4% (12/31/2018) | ||||
| Future Debt Permitted (Type): | Yes (Mezzanine) | 3rd Most Recent Occupancy: | 73.7% (12/31/2017) | ||||
| Reserves | Appraised Value (as of)(5): | $1,000,000,000 (1/23/2020) | |||||
| Type | Initial | Monthly | Cap | Appraised Value per SF: | $2,941 | ||
| RE Tax: | $0 | Springing | N/A | Cut-off Date LTV Ratio(1): | 54.5% | ||
| Insurance: | $0 | Springing | N/A | Maturity Date LTV Ratio(1): | 54.5% | ||
| Recurring Replacements: | $0 | Springing | $170,012 | ||||
| TI/LC: | $0 | Springing | $1,020,027 | ||||
| Unfunded Obligations: | $1,048,024 | $0 | N/A | ||||
| Sources and Uses | ||||||
| Sources | Proceeds | % of Total | Uses | Proceeds | % of Total | |
| Whole Loan Amount(1): | $545,000,000 | 90.0% | Loan Payoff(6): | $598,153,683 | 98.8% | |
| Borrower Equity: | $60,294,721 | 10.0% | Closing Costs: | $4,093,014 | 0.7% | |
| Reserves(7): | $3,048,024 | 0.5% | ||||
| Total Sources: | $605,294,721 | 100.0% | Total Uses: | $605,294,721 | 100.0% | |
| (1) | The 711 Fifth Avenue Mortgage Loan (as defined below) is part of the 711 Fifth Avenue Whole Loan (as defined below), which is comprised of 24 pari passu promissory notes in the aggregate original principal amount of $545,000,000. The Cut-off Date Balance per SF, Maturity Date Balance per SF, UW NOI Debt Yield, UW NOI Debt Yield at Maturity, UW NCF DSCR, Cut-off Date LTV Ratio and Maturity Date LTV Ratio numbers presented above are based on the aggregate principal balance of the promissory notes comprising the 711 Fifth Avenue Whole Loan. |
| (2) | 711 Fifth Ave Principal Owner LLC is the single purpose entity borrower. There is no separate non-recourse carveout guarantor or environmental indemnitor for the 711 Fifth Avenue Whole Loan. |
| (3) | Defeasance of the 711 Fifth Avenue Whole Loan is permitted at any time after the earlier to occur of (a) the end of the two-year period commencing on the closing date of the securitization of the last portion of the 711 Fifth Avenue Whole Loan to be securitized and (b) March 6, 2023. The assumed prepayment lockout period of 32 payments is based on the closing date of this transaction in November 2020. |
| (4) | All NOI, NCF and occupancy information, as well as the appraised value, were determined prior to the emergence of the novel coronavirus, and the economic disruption resulting from measures to combat the coronavirus, and all DSCR, LTV and Debt Yield metrics were calculated, and the 711 Fifth Avenue Whole Loan was underwritten, based on such prior information. See ” Risk Factors—Risks Related to Market Conditions and Other External Factors—Coronavirus Pandemic Has Adversely Affected the Global Economy and Will Likely Adversely Affect the Performance of the Mortgage Loans” in the Preliminary Prospectus. |
| (5) | The Appraised Value represents the “As-Is” Value, which includes the appraiser’s extraordinary assumption that the 711 Fifth Avenue Whole Loan sponsors have invested approximately $13.5 million in renovation costs for upgrades to the office lobby entrance, building mechanical systems, elevator cabs and general base building work for the vacant office space within the 711 Fifth Avenue Property (as defined below). |
| (6) | The 711 Fifth Avenue Property was purchased by the 711 Fifth Avenue Whole Loan borrower sponsors in September 2019 for approximately $955 million. |
| (7) | Reserves include a $2,000,000 reserve that was taken at loan origination pending the issuance of the 711 Fifth Avenue Property’s temporary certificate of occupancy. The 711 Fifth Avenue Borrower (as defined below) obtained a new temporary certificate of occupancy in April 2020, and the $2,000,000 has been disbursed to the 711 Fifth Avenue Borrower. |
This is not a research report and was not prepared by any Underwriter’s research department. Please see additional important information and qualifications at the end of this Term Sheet.
138
| Mixed Use – Office/Retail | Loan #12 | Cut-off Date Balance: | $25,500,000 | |
| 711 Fifth Avenue | 711 Fifth Avenue | Cut-off Date LTV: | 54.5% | |
| New York, NY 10022 | U/W NCF DSCR: | 2.90x | ||
| U/W NOI Debt Yield: | 9.4% |
The Mortgage Loan. The twelfth largest mortgage loan (the “711 Fifth Avenue Mortgage Loan”) is part of a whole loan (the “711 Fifth Avenue Whole Loan”) co-originated by Bank of America, National Association and Goldman Sachs Bank USA (“GSBI”) and evidenced by 24 pari passu promissory notes in the aggregate original principal amount of $545,000,000. The 711 Fifth Avenue Whole Loan is secured by a first priority fee mortgage encumbering a 340,024 SF mixed use building located in New York, New York (the “711 Fifth Avenue Property”). The 711 Fifth Avenue Mortgage Loan is evidenced by the non-controlling Note A-2-3-1 with an original principal amount of $25,500,000. The remaining promissory notes comprising the 711 Fifth Avenue Whole Loan are summarized in the below table and either have been or are expected to be contributed to future securitization transactions. The 711 Fifth Avenue Whole Loan is being serviced pursuant to the pooling and servicing agreement for the GSMS 2020-GC47 securitization trust. See “Description of the Mortgage Pool—The Whole Loans—The Non-Serviced Pari Passu Whole Loans” and “Pooling and Servicing Agreement—Servicing of the Non-Serviced Mortgage Loans” in the Preliminary Prospectus.
| 711 Fifth Avenue Whole Loan Summary | ||||
| Note | Original Balance | Cut-off Date Balance | Note Holder | Controlling Piece |
| A-1-1 | $50,000,000 | $50,000,000 | GSMS 2020-GC47 | Yes |
| A-1-2 | $60,000,000 | $60,000,000 | GSBI | No |
| A-1-3 | $50,000,000 | $50,000,000 | GSBI | No |
| A-1-4 | $40,000,000 | $40,000,000 | GSBI | No |
| A-1-5-A | $25,000,000 | $25,000,000 | GSBI | No |
| A-1-5-B | $15,000,000 | $15,000,000 | Benchmark 2020-B20 | No |
| A-1-5-C | $5,000,000 | $5,000,000 | GSBI | No |
| A-1-6 | $20,000,000 | $20,000,000 | JPMDB 2020-COR7 | No |
| A-1-7 | $20,000,000 | $20,000,000 | JPMDB 2020-COR7 | No |
| A-1-8 | $20,000,000 | $20,000,000 | Benchmark 2020-B18 | No |
| A-1-9 | $20,000,000 | $20,000,000 | Benchmark 2020-B18 | No |
| A-1-10 | $12,500,000 | $12,500,000 | GSMS 2020-GC47 | No |
| A-1-11 | $10,000,000 | $10,000,000 | DBJPM 2020-C9 | No |
| A-1-12 | $10,000,000 | $10,000,000 | DBJPM 2020-C9 | No |
| A-1-13 | $5,000,000 | $5,000,000 | Benchmark 2020-B18 | No |
| A-1-14 | $5,000,000 | $5,000,000 | DBJPM 2020-C9 | No |
| A-1-15 | $10,000,000 | $10,000,000 | Benchmark 2020-B19 | No |
| A-1-16 | $2,500,000 | $2,500,000 | GSBI | No |
| A-1-17 | $1,500,000 | $1,500,000 | GSBI | No |
| A-2-1 | $60,000,000 | $60,000,000 | BANK 2020-BNK28 | No |
| A-2-2 | $43,000,000 | $43,000,000 | BANK 2020-BNK27 | No |
| A-2-3-1 | $25,500,000 | $25,500,000 | BANK 2020-BNK29 | No |
| A-2-3-2 | $15,000,000 | $15,000,000 | BANA | No |
| A-2-4 | $20,000,000 | $20,000,000 | BBCMS 2020-C8 | No |
| Total (Whole Loan) | $545,000,000 | $545,000,000 | ||
The Borrower and the Borrower Sponsors. The borrower is 711 Fifth Ave Principal Owner LLC, a Delaware limited liability company that is structured to be bankruptcy-remote with at least two independent directors (the “711 Fifth Avenue Borrower”). There is no non-recourse carveout guarantor or separate environmental indemnitor with respect to the 711 Fifth Avenue Whole Loan.
As of the 711 Fifth Avenue Whole Loan origination date, the borrower sponsors are one or more of (a) Bayerische Versorgungskammer (“BVK”), (b) Deutsche Finance America LLC and/or DF Deutsche Finance Holding AG (together, “DFA”) and/or (c) Hessen Lawyers Pension Fund. These entities collectively have acquired five other assets located in major cities. BVK, a public-law pension group in Germany, managed 12 independent professional and municipal pension funds with a total of 2.3 million policyholders and pension recipients, €4.8 billion in annual contributions and reimbursement income, and approximately €3.4 billion in annual pension payments as of December 31, 2018. BVK managed a total investment volume of €77 billion by book value as of December 31, 2018. DFA, the American private equity arm of Deutsche Finance Group, was established in 2018 and has acquired 11 properties with a total capitalization of over $3.1 billion as of April 21, 2020. Hessen Lawyers Pension Fund is the pension fund for the German state of Hessen, with approximately €4.12 billion assets under management as of February 29, 2020.
The Property. The 711 Fifth Avenue Property is an 18-story, 340,024 SF mixed use building with an office component (levels 4 – 18; 286,226 SF) and a retail component (levels B – 3; 53,798 SF) located in Midtown Manhattan on the corner of Fifth Avenue and East 55th Street. The 711 Fifth Avenue Property was originally constructed in 1927 and has undergone approximately $26.6 million of various capital improvements from 2013 through mid-2019. Major capital improvements include a 6th floor corridor upgrade, 14th floor roof replacement, main roof replacement, 4th and 9th floor renovations, and elevator modernization. Based on the underwritten rent roll dated January 31, 2020, the 711 Fifth Avenue Property is currently 76.5% leased to a diverse tenant roster including banking (SunTrust Banks), fashion (Ralph Lauren Retail Inc. (“Ralph Lauren”) and The Swatch Group (U.S.) Inc. (“The Swatch Group”)), and luxury goods (Loro Piana USA), as well as finance (Allen & Company).
Office (84.4% of NRA; 21.5% of underwritten base rent)
The Class A office space at the 711 Fifth Avenue Property is currently 72.3% occupied by five tenants that collectively contribute 21.5% of underwritten base rent. The three largest office tenants are SunTrust Banks, Allen & Company and Loro Piana USA.
This is not a research report and was not prepared by any Underwriter’s research department. Please see additional important information and qualifications at the end of this Term Sheet.
139
| Mixed Use – Office/Retail | Loan #12 | Cut-off Date Balance: | $25,500,000 | |
| 711 Fifth Avenue | 711 Fifth Avenue | Cut-off Date LTV: | 54.5% | |
| New York, NY 10022 | U/W NCF DSCR: | 2.90x | ||
| U/W NOI Debt Yield: | 9.4% |
SunTrust Banks (84,516 SF, 24.9% of NRA, 8.9% of underwritten rent). SunTrust Banks’ (A+ / A3 by Fitch/Moody’s) primary businesses include deposits, lending, credit cards, and trust and investment services. Through its various subsidiaries, the bank provides corporate and investment banking, capital market services, mortgage banking, and wealth management. SunTrust Banks has been a tenant at the 711 Fifth Avenue Property since 2004 and has expanded several times. The lease requires annual rent of $5,923,390, expires April 30, 2024 and includes one five-year renewal option.
Allen & Company (70,972 SF, 20.9% of NRA, 7.4% of underwritten rent). The 711 Fifth Avenue Property serves as Allen & Company LLC’s headquarters. Allen & Company LLC is a privately held boutique investment bank, which specializes in real estate, technology, media and entertainment. Allen & Company has been a tenant at the 711 Fifth Avenue Property since 1985 and has expanded several times. The lease requires annual rent of $4,948,540, expires September 30, 2033 and includes one five-year renewal option.
Loro Piana USA (24,388 SF, 7.2% of NRA, 2.6% of underwritten rent). Loro Piana USA is an Italian fabrics and clothing company specializing in high-end, luxury cashmere and wool products. Loro Piana has been a tenant at the 711 Fifth Avenue Property since 2005. The lease requires annual rent of $1,740,900, expires August 31, 2025 and includes one five-year renewal option. Loro Piana USA is entitled to the return of an unused tenant improvement allowance in the amount of $541,071 as of the loan origination date, which has been fully reserved by the lender.
Retail (15.6% of NRA; 78.5% of underwritten base rent)
The 52,912 SF of multi-level retail space at the 711 Fifth Avenue Property is currently leased by Ralph Lauren and The Swatch Group that collectively contribute 78.5% of underwritten base rent. The 711 Fifth Avenue Whole Loan is structured with a cash flow sweep if either Ralph Lauren or The Swatch Group terminates its lease, vacates or provides notice of its intent to vacate, fails to renew its lease at least 36 months prior to its lease expiration date, if Ralph Lauren Corporation fails to maintain its investment grade rating, or if The Swatch Group goes dark. See Lockbox and Cash Management below.
Ralph Lauren (38,638 SF, 11.4% of NRA, 41.1% of underwritten rent). The 711 Fifth Avenue Property served as Ralph Lauren’s former flagship; however, since April 2017 the majority of its space has been dark and is available for sublease. Ralph Lauren continues to operate the Polo Bar restaurant (7,436 SF of the total Ralph Lauren 38,638 SF) at this location and continues to be obligated to pay rent for its entire leased space. The lease requires annual rent of $27,500,000 plus a rent increase to $30,000,000 in April 2024, expires June 30, 2029 and includes two five-year renewal options. The lease is guaranteed by Ralph Lauren Corporation (A3 / A- by Moody’s/S&P).
The Swatch Group (U.S.) Inc. (14,274 SF, 4.2% of NRA, 37.3% of underwritten rent). The Swatch Group engages in the design, manufacture, and sale of finished watches, jewelry as well as watch movements and components. It operates through two segments including, Watches and Jewelry, and Electronic Systems. The Watches and Jewelry segment designs, produces, and markets watches and jewelry. The Electronic Systems segment develops, manufactures, and sells electronic components and sports timing activities. The Swatch Group has occupied space in the 711 Fifth Avenue Property since 2011, and brands that are currently represented at the 711 Fifth Avenue Property include Omega and Jaquet Droz. The lease requires annual rent of $23,343,746, and expires December 31, 2029 and includes one five-year renewal option.
The following table presents certain information relating to the major tenants at the 711 Fifth Avenue Property:
| Tenant Summary(1) | |||||||||
| Tenant Name | Credit Rating (Moody’s/S&P | Tenant SF | Approx. % of Total SF | Annual UW Rent | % of Total Annual UW Rent | Annual UW Rent PSF | Lease Expiration | Renewal Options | Termination Option (Y/N) |
| Major Office Tenants | |||||||||
| SunTrust Banks | A3/NR/A+ | 84,516 | 24.9% | $5,923,390 | 8.9% | $70.09 | 4/30/2024 | 1x5 yr | N |
| Allen & Company | NR/NR/NR | 70,972 | 20.9% | $4,948,540 | 7.4% | $69.73 | 9/30/2033 | 1x5 yr | N |
| Loro Piana USA(3) | NR/NR/NR | 24,388 | 7.2% | $1,740,900 | 2.6% | $71.38 | 8/31/2025 | 1x5 yr | N |
| Major Office Subtotal/Wtd. Avg. | 179,876 | 52.9% | $12,612,830 | 18.9% | $70.12 | ||||
| Retail Tenants | |||||||||
| Ralph Lauren (4) | A3/A-/NR | 38,638 | 11.4% | $27,523,994 | 41.1% | $712.36 | 6/30/2029 | 2x5 yr | N |
| The Swatch Group | NR/NR/NR | 14,274 | 4.2% | $24,976,738 | 37.3% | $1,749.81 | 12/31/2029 | 1x5 yr | N |
| Retail Subtotal/Wtd. Avg. | 52,912 | 15.6% | $52,500,732 | 78.5% | $992.23 | ||||
| Other Office Tenants(5) | 27,169 | 8.0% | $1,783,202 | 2.7% | $65.63 | ||||
| Vacant Space | 80,067 | 23.5% | $0 | 0.0% | $0.00 | ||||
| Total/Wtd. Avg. | 340,024 | 100.0% | $66,896,764 | 100.0% | $257.34(6) | ||||
| (1) | Information is based on the underwritten rent roll. |
| (2) | Certain ratings are those of the parent entity whether or not the parent entity guarantees the lease. |
| (3) | Loro Piana USA is entitled to the return of an unused tenant improvement allowance in the amount of $541,071 as of the loan origination date, which has been fully reserved by the lender. |
| (4) | Currently, the Ralph Lauren spaces totaling 31,202 SF are dark and available for sublease. The tenant continues to be obligated to pay rent on its entire leased space (38,638 SF) and continues to operate the Polo Bar space of 7,436 SF at the 711 Fifth Avenue Property. |
| (5) | Includes non-revenue spaces of 2,330 SF attributable to the property management office, 1,042 SF, attributable to the building security office and 563 SF attributable to the porter locker room. |
| (6) | Wtd. Avg. Annual UW Rent PSF excludes Vacant Space. |
This is not a research report and was not prepared by any Underwriter’s research department. Please see additional important information and qualifications at the end of this Term Sheet.
140
| Mixed Use – Office/Retail | Loan #12 | Cut-off Date Balance: | $25,500,000 | |
| 711 Fifth Avenue | 711 Fifth Avenue | Cut-off Date LTV: | 54.5% | |
| New York, NY 10022 | U/W NCF DSCR: | 2.90x | ||
| U/W NOI Debt Yield: | 9.4% |
The following table presents certain information relating to the lease rollover schedule at the 711 Fifth Avenue Property:
| Lease Rollover Schedule(1)(2) | ||||||||
| Year | # of Leases Rolling | SF Rolling | Approx. % of Total SF Rolling | Approx. Cumulative % of SF Rolling | UW Rent PSF Rolling | Total UW Rent Rolling | Approx. % of Total Rent Rolling | Approx. Cumulative % of Total Rent Rolling |
| 2020 | 0 | 0 | 0.0% | 0.0% | $0.00 | $0 | 0.0% | 0.0% |
| 2021 | 0 | 0 | 0.0% | 0.0% | $0.00 | $0 | 0.0% | 0.0% |
| 2022 | 0 | 0 | 0.0% | 0.0% | $0.00 | $0 | 0.0% | 0.0% |
| 2023 | 1 | 6,034 | 1.8% | 1.8% | $67.00 | $404,278 | 0.6% | 0.6% |
| 2024 | 6 | 84,516 | 24.9% | 26.6% | $70.09 | $5,923,390 | 8.9% | 9.5% |
| 2025 | 2 | 24,388 | 7.2% | 33.8% | $71.38 | $1,740,900 | 2.6% | 12.1% |
| 2026 | 0 | 0 | 0.0% | 33.8% | $0.00 | $0 | 0.0% | 12.1% |
| 2027 | 1 | 17,200 | 5.1% | 38.9% | $80.17 | $1,378,924 | 2.1% | 14.1% |
| 2028 | 0 | 0 | 0.0% | 38.9% | $0.00 | $0 | 0.0% | 14.1% |
| 2029 | 12 | 52,912 | 15.6% | 54.4% | $992.23 | $52,500,732 | 78.5% | 92.6% |
| 2030 | 0 | 0 | 0.0% | 54.4% | $0.00 | $0 | 0.0% | 92.6% |
| 2031 & Beyond(3) | 8 | 74,907 | 22.0% | 76.5% | $66.06 | $4,948,540 | 7.4% | 100.0% |
| Vacant | 0 | 80,067 | 23.5% | 100.0% | $0.00 | $0 | 0.0% | 100.0% |
| Total/Wtd. Avg. | 30 | 340,024 | 100.0% | $257.34(4) | $66,896,764 | 100.0% | ||
| (1) | Information based on the underwritten rent roll. |
| (2) | Certain tenants may have lease termination options that were not taken into account in the Lease Rollover Schedule. |
| (3) | Includes non-revenue spaces of 2,330 SF attributable to the property management office, 1,042 SF attributable to the building security office and 563 SF attributable to the porter locker room. |
| (4) | Wtd. Avg. UW Rent PSF Rolling excludes Vacant Space. |
COVID-19 Update. The 711 Fifth Avenue Whole Loan is current as of the November debt service payment and as of November 4, 2020 is not subject to any forbearance, modification or debt service relief request. As of November 4, 2020, the 711 Fifth Avenue Property is open and operating. The lender approved a lease amendment for The Swatch Group, which provided for a 50% base rent reduction for the months of April, May and June 2020, which deferred rent is required to be repaid half by December 31, 2020 and the other half by March 31, 2021. The Swatch Group has paid rent due through June 2020 in accordance with the lease amendment and is current with full rental payments for September and October 2020.
The Market. The 711 Fifth Avenue Property is located along the northeast corner of West 55th Street within the Plaza District office submarket of Midtown and the Upper Fifth Avenue retail submarket. The Plaza District office submarket is bounded by 65th Street to the north, the East River to the east, 47th Street to the south, and Avenue of the Americas to the west. The Plaza District is proximate to Central Park and has access to the country’s premier shopping along Fifth and Madison Avenues. The Plaza District office submarket is home to numerous national and multinational corporations and is dominated by financial (with hedge funds clustered along Madison Avenue) and legal tenants, with some media and fashion firms. According to the appraisal, as of the fourth quarter of 2019, the Plaza District office submarket has an inventory of 26.7 million SF with a vacancy rate of 8.7% and an average asking rent of $114.07 PSF. The Upper Fifth Avenue retail submarket is located between 42nd and 57th Streets, and this portion of Fifth Avenue is the most expensive area for retail space rents in Manhattan. The Upper Fifth Avenue retail submarket draws international travelers and occupants of nearby luxury hotels and condos. According to the appraisal, as of the fourth quarter of 2019, the Upper Fifth Avenue retail submarket has an average asking rent of $1,775.00 PSF with an availability rate of 24.3%.
This is not a research report and was not prepared by any Underwriter’s research department. Please see additional important information and qualifications at the end of this Term Sheet.
141
| Mixed Use – Office/Retail | Loan #12 | Cut-off Date Balance: | $25,500,000 | |
| 711 Fifth Avenue | 711 Fifth Avenue | Cut-off Date LTV: | 54.5% | |
| New York, NY 10022 | U/W NCF DSCR: | 2.90x | ||
| U/W NOI Debt Yield: | 9.4% |
The following table presents recent leasing data with respect to comparable office properties to the 711 Fifth Avenue Property:
| Comparable Office Lease Summary | ||||||
| Property Name/Location | Year Built | Stories | Tenant Name | Lease Date/Term | Lease Area (SF) | Annual Base Rent PSF |
711 Fifth Avenue Property New York, NY | 1927 | 18 | SunTrust Banks | Mar. 2016 /8.2 Yrs(1) | 22,832(1) | $75.50(1) |
623 Fifth Avenue New York, NY | 1989 | 36 | NWI Management | Nov. 2019 /3.3 Yrs | 8,400 | $80.00 |
510 Madison Avenue New York, NY | 2009/2012 | 30 | Castlelake, L.P. | Nov. 2019 /7.3 Yrs | 6,903 | $124.00 |
745 Fifth Avenue New York, NY | 1929/1989 | 35 | Fremont Macanta | Jun. 2019 /6.8 Yrs | 7,067 | $103.00 |
640 Fifth Avenue New York, NY | 1940/2003 | 31 | Hamlin Capital Management | Mar. 2019 /10.0 Yrs | 23,616 | $75.17 |
640 Fifth Avenue New York, NY | 1940/2003 | 31 | Avolon Aerospace | Jan. 2019 /10.0 Yrs | 10,295 | $92.99 |
645 Madison Avenue New York, NY | 1971/2005 | 22 | Rothman Orthopaedic Institute | Jan. 2019 /10.9 Yrs | 21,461 | $88.00 |
725 Fifth Avenue New York, NY | 1983 | 58 | S.S. Steiner, Inc. | Jan. 2019 /7.5 Yrs | 6,875 | $82.00 |
510 Madison Avenue New York, NY | 2009/2012 | 30 | Christian Dior, Inc. and Christian Dior Perfumes,LLC | Jan. 2019 /5.0 Yrs | 70,055 | $74.50 |
712 Fifth Avenue New York, NY | 1990 | 52 | Wargo & Co. | Oct. 2018 / 7.7 Yrs | 2,074 | $105.00 |
725 Fifth Avenue New York, NY | 1983 | 58 | Marc Fisher | Jul. 2018 /10.0 Yrs | 9,924 | $89.00 |
640 Fifth Avenue New York, NY | 1940/2003 | 31 | Klein Group | Jul. 2018 /10.0 Yrs | 9,458 | $92.00 |
535 Madison Avenue New York, NY | 1982 | 37 | Walker & Dunlop, LLC | Jul. 2018 /3.0 Yrs | 5,450 | $80.00 |
535 Madison Avenue New York, NY | 1982 | 37 | Melvin Capital | May 2018 /10.6 Yrs | 14,765 | $104.00 |
Source: Appraisal.
| (1) | Based on underwritten rent roll as of January 31, 2020 for Suite 1200 for SunTrust Banks. |
The following table presents recent leasing data with respect to comparable retail properties to the 711 Fifth Avenue Property:
| Comparable Retail Lease Summary | ||||
| Property Name/Location | Tenant Name | Lease Date/Term | Lease Area (SF) | Annual Base Rent PSF |
711 Fifth Avenue Property New York, NY | The Swatch Group | May 2011 /18.7 Yrs(1) | 14,274(1) | $1,749.81(1) |
767 Fifth Avenue New York, NY | Christian Dior | April. 2019 /4.0 Yrs | 11,847 | $666.84 |
730 Fifth Avenue New York, NY | Mikimoto | Feb. 2019 /10.0 Yrs | 4,505 | $1,109.88 |
760 Madison Avenue New York, NY | Giorgio Armani | Jan. 2019 /15.0 Yrs | 19,780 | $1,066.23 |
706 Madison Avenue New York, NY | Hermès | Jan. 2019 /10.0 Yrs | 47,000 | $329.79 |
609 Fifth Avenue New York, NY | Puma | Feb. 2018 /16.0 Yrs | 23,917 | $372.12 |
650 Fifth Avenue New York, NY | Nike | Mar. 2017 /15.5 Yrs | 69,214 | $479.53 |
640 Fifth Avenue New York, NY | Dyson | Mar. 2017 /10.0 Yrs | 3,097 | $2,660.64 |
640 Fifth Avenue New York, NY | Victoria’s Secret | Apr. 2016 / 16.0 Yrs | 63,779 | $516.90 |
645 Fifth Avenue New York, NY | Longchamp | Feb. 2016 /10.0 Yrs | 2,000 | $2,850.00 |
767 Fifth Avenue New York, NY | Under Armour | Feb. 2016 /15.0 Yrs | 53,500 | $560.75 |
685 Fifth Avenue New York, NY | Stuart Weitzman | Feb. 2016 /15.0 Yrs | 3,481 | $1,436.37 |
685 Fifth Avenue New York, NY | Coach | Jan. 2016 /15.0 Yrs | 24,541 | $814.96 |
Source: Appraisal.
| (1) | Based on underwritten rent roll as of January 31, 2020. |
This is not a research report and was not prepared by any Underwriter’s research department. Please see additional important information and qualifications at the end of this Term Sheet.
142
| Mixed Use – Office/Retail | Loan #12 | Cut-off Date Balance: | $25,500,000 | |
| 711 Fifth Avenue | 711 Fifth Avenue | Cut-off Date LTV: | 54.5% | |
| New York, NY 10022 | U/W NCF DSCR: | 2.90x | ||
| U/W NOI Debt Yield: | 9.4% |
Operating History and Underwritten Net Cash Flow. The following table presents certain information relating to the historical operating performance and Underwritten Net Cash Flow at the 711 Fifth Avenue Property:
| Cash Flow Analysis | ||||||
| 2017 | 2018 | 2019 | 3/31/2020 TTM | UW(1) | UW Per SF | |
| Gross Potential Rent(2) | $62,203,861 | $62,674,468 | $69,173,907 | $68,676,500 | $81,502,159 | $239.70 |
| Other Income | $519,693 | $364,227 | $389,683 | $383,754 | $371,484 | $1.09 |
| Vacancy(3) | $0 | $0 | $0 | $0 | ($7,680,090) | ($22.59) |
| Effective Gross Income | $62,723,555 | $63,038,695 | $69,563,590 | $69,060,254 | $74,193,553 | $218.20 |
| Taxes | $10,681,050 | $12,447,809 | $14,418,934 | $15,002,663 | $15,276,427 | $44.93 |
| Insurance | $471,957 | $661,832 | $663,547 | $681,765 | $738,333 | $2.17 |
| Other Operating Expenses | $6,205,030 | $5,840,488 | $5,884,759 | $6,087,571 | $6,874,009 | $20.22 |
| Total Operating Expenses | $17,358,037 | $18,950,129 | $20,967,241 | $21,771,999 | $22,888,769 | $67.32 |
| Net Operating Income | $45,365,518 | $44,088,566 | $48,596,349 | $47,288,255 | $51,304,783 | $150.89 |
| TI/LC | $0 | $0 | $0 | $0 | $544,350 | $1.60 |
| Capital Expenditures | $0 | $0 | $0 | $0 | $85,006 | $0.25 |
| Net Cash Flow | $45,365,518 | $44,088,566 | $48,596,349 | $47,288,255 | $50,675,427 | $149.03 |
| Occupancy% | 73.7% | 67.4% | 66.9% | 66.9% | 76.5% | |
| NOI DSCR (4) | 2.60x | 2.52x | 2.78x | 2.71x | 2.94x | |
| NCF DSCR(4) | 2.60x | 2.52x | 2.78x | 2.71x | 2.90x | |
| NOI Debt Yield(4) | 8.3% | 8.1% | 8.9% | 8.7% | 9.4% | |
| NCF Debt Yield(4) | 8.3% | 8.1% | 8.9% | 8.7% | 9.3% | |
| (1) | For the avoidance of doubt, no COVID-19 specific adjustments have been made to the lender underwriting. |
| (2) | UW Gross Potential Rent includes contractual rent steps of $1,962,475 underwritten for various tenants through January 31, 2021. For investment grade tenants, the present value of the incremental rent steps over the lease term is applied using a discount rate of 7.0%. |
| (3) | UW Vacancy & Credit Loss Represents an underwritten economic vacancy of 9.4%. |
| (4) | Debt service coverage ratios and debt yields are based on the 711 Fifth Avenue Whole Loan. |
This is not a research report and was not prepared by any Underwriter’s research department. Please see additional important information and qualifications at the end of this Term Sheet.
143
| Mortgage Loan No. 13 – Turner Towers |
| Mortgage Loan Information | Property Information | ||||||
| Mortgage Loan Seller: | MSMCH | Single Asset/Portfolio: | Single Asset | ||||
| Credit Assessment (DBRSM/Fitch/Moody’s): | AAA/AAAsf*/Aaa | Location: | Brooklyn, NY 11238 | ||||
| Original Balance: | $25,000,000 | General Property Type: | Multifamily | ||||
| Cut-off Date Balance: | $25,000,000 | Detailed Property Type: | Cooperative | ||||
| % of Initial Pool Balance: | 2.9% | Title Vesting: | Fee | ||||
| Loan Purpose: | Refinance | Year Built/Renovated: | 1926/N/A | ||||
| Borrower Sponsor(1): | N/A | Size: | 187 Units | ||||
| Guarantor(1): | N/A | Cut-off Date Balance per Unit: | $133,690 | ||||
| Mortgage Rate: | 2.3900% | Maturity Date Balance per Unit: | $100,021 | ||||
| Note Date: | 10/29/2020 | Property Manager: | FirstService Residential | ||||
| First Payment Date: | 12/1/2020 | New York, Inc. | |||||
| Maturity Date: | 11/1/2030 | Underwriting and Financial Information(4) | |||||
| Original Term to Maturity: | 120 months | UW NOI(5): | $6,599,987 | ||||
| Original Amortization Term: | 360 months | UW NOI Debt Yield(5): | 26.4% | ||||
| IO Period: | 0 months | UW NOI Debt Yield at Maturity(5): | 35.3% | ||||
| Seasoning: | 0 months | UW NCF DSCR(5): | 5.61x | ||||
| Prepayment Provisions: | LO (24); DEF (91); O (5) | Most Recent NOI(6): | N/A | ||||
| Lockbox/Cash Mgmt Status: | None | 2nd Most Recent NOI(6): | N/A | ||||
| Additional Debt Type: | N/A | 3rd Most Recent NOI(6): | N/A | ||||
| Additional Debt Balance: | N/A | Most Recent Occupancy(7): | N/A | ||||
| Future Debt Permitted (Type)(2): | Yes (Subordinate Secured) | 2nd Most Recent Occupancy(7): | N/A | ||||
| 3rd Most Recent Occupancy(7): | N/A | ||||||
| Reserves | Appraised Value (as of)(8): | $264,000,000 (9/17/2020) | |||||
| Type | Initial | Monthly | Cap | Appraised Value per Unit(8): | $1,411,765 | ||
| RE Tax: | $0 | $110,375 | N/A | Cut-off Date LTV Ratio(8): | 9.5% | ||
| Insurance: | $0 | Springing(3) | N/A | Maturity Date LTV Ratio(8): | 7.1% | ||
| Coop-Rental Value(9): | $150,000,000 (9/17/2020) | ||||||
| Coop-LTV as Rental(9): | 16.7% | ||||||
| Sources and Uses | ||||||
| Sources | Proceeds | % of Total | Uses | Proceeds | % of Total | |
| Loan Amount: | $25,000,000 | 100.0% | Loan Payoff: | $22,048,316 | 88.2% | |
| Return of Equity: | $2,578,620 | 10.3% | ||||
| Closing Costs: | $373,064 | 1.5% | ||||
| Total Sources: | $25,000,000 | 100.0% | Total Uses: | $25,000,000 | 100.0% | |
| (1) | The Turner Towers Property (as defined below) is owned by the Turner Towers Borrower (as defined below), which is a cooperative housing corporation. No individual or entity (other than the Turner Towers Borrower) has recourse obligations with respect to the Turner Towers Mortgage Loan (as defined below), including pursuant to any guaranty or environmental indemnity. |
| (2) | The Turner Towers Borrower is permitted to incur subordinate debt (including, without limitation, a revolving or term line of credit) secured by the Turner Towers Property, subject to the lender’s consent (not to be unreasonably withheld, conditioned or delayed) and provided that (i) such additional financing must be in a maximum principal amount not exceeding the lesser of (A) $3,000,000 and (B) an amount which will not result in an aggregate loan to value ratio of the Turner Towers Mortgage Loan and such subordinate debt in excess of 30% and (ii) the subordinate lender enters into a subordination and standstill agreement reasonably acceptable to the mortgage lender. |
| (3) | Monthly Insurance reserves are springing upon either: (i) an event of default or (ii) a blanket policy reasonably satisfactory to lender is no longer in place. |
| (4) | The novel coronavirus pandemic is an evolving situation and could impact the Turner Towers Mortgage Loan more severely than assumed in the underwriting of the Turner Towers Mortgage Loan and could adversely affect the NOI, NCF and occupancy information, as well as the appraised value and the DSCR, LTV and Debt Yield metrics presented above and herein. See “Risk Factors-—Risks Related to Market Conditions and Other External Factors—The Coronavirus Pandemic Has Adversely Affected the Global Economy and Will Likely Adversely Affect the Performance of the Mortgage Loans” in the Preliminary Prospectus. |
| (5) | See “Underwritten Net Cash Flow” section below. |
| (6) | Most Recent NOI, 2nd Most Recent NOI and 3rd Most Recent NOI are not available. Residential cooperatives are not-for-profit entities that set maintenance fees to cover current expenses and plan for future capital needs. A residential cooperative can increase or decrease maintenance fees according to its anticipated expenses and level of cash reserves. The historical NOI figures are not representative of the cash flow generated by the Turner Towers Property if it were operated as a multifamily rental property. |
| (7) | Occupancy is not reported as all residential units are owned by tenant-shareholders. |
| (8) | For purposes of determining the Appraised Value, the Cut-off Date LTV Ratio and the Maturity Date LTV Ratio, the value estimate reflected in the appraisal of the Turner Towers Property is determined as if such residential cooperative property is operated as a residential cooperative and, in general, such value equals the gross sellout value of all residential cooperative units in such residential cooperative property, based in part on various comparable sales of cooperative apartment units in the market, together with the gross sellout value of the office units, plus the principal amount of the prior mortgage loan of $18,376,811, less ongoing capital expenditures of $6,000,000. Such value does not represent a market value. |
| (9) | The Coop-Rental Value and the Coop-LTV as Rental assumes the Turner Towers Property is operated as a multifamily rental property. |
The Mortgage Loan. The thirteenth largest mortgage loan (the “Turner Towers Mortgage Loan”) is evidenced by a promissory note in the original principal amount of $25,000,000 and secured by a first priority fee mortgage encumbering a cooperative apartment complex comprising 187 units in one, 16-story building, located in Brooklyn, New York (the “Turner Towers Property”). The proceeds of the Turner Towers Mortgage Loan were used to refinance existing debt, return equity to the Turner Towers Borrower and pay closing costs.
This is not a research report and was not prepared by any Underwriter’s research department. Please see additional important information and qualifications at the end of this Term Sheet.
144
| Multifamily – Cooperative | Loan #13 | Cut-off Date Balance: | $25,000,000 | |
| 135 Eastern Parkway | Turner Towers | Cut-off Date LTV: | 9.5% | |
| Brooklyn, NY 11238 | U/W NCF DSCR: | 5.61x | ||
| U/W NOI Debt Yield: | 26.4% |
The Borrower. The borrower is Turner Towers Tenants Corp., a cooperative housing corporation organized under the laws of the State of New York (the “Turner Towers Borrower”). The Turner Towers Property is owned in fee simple by the Turner Towers Borrower. No individual or entity (other than the Turner Towers Borrower) has recourse obligations with respect to the Turner Towers Mortgage Loan, including pursuant to any guaranty or environmental indemnity. The Turner Towers Borrower is subject to litigation with a contractor, as described under “Description of the Mortgage Pool—Litigation and Other Considerations” in the Preliminary Prospectus.
The Property. The Turner Towers Property is a cooperative apartment complex with 187 residential units and 2 professional office suites, situated within a 16-story building in Brooklyn, New York. The 187 rentable residential units consist of 187,085 SF of total NRA and the professional office suites consist of 3,000 SF of total NRA. The 187 residential units are 100.0% owned by tenant shareholders. Two additional units, the superintendent’s residential unit and the superintendent’s office unit, are held off-line. Amenities at the Turner Towers Property include a 24-hour attended lobby, common courtyard, fitness center, community room, laundry room, storage lockers and bicycle storage. Historical capital expenditures since 2010 totaled approximately $10.8 million and include a $1.76 million electrical upgrade completed in 2015, façade restoration and reconstruction of the penthouses completed between 2010 and 2015, and basement improvements and Local 11 façade and exterior work completed between 2015 and 2020. A major plumbing infrastructure replacement project is presently underway, which includes vertical hot water, cold water, gas and waste lines and horizontal branch lines. The project is anticipated to be completed in 10 years at a total additional cost of approximately $12.8 million. The loan documents require that the project be completed in phases within time frames set forth in the loan documents. The costs of such plumbing project have not been reserved for.
The table below shows the residential apartment unit mix at the Turner Towers Property:
| Unit Mix | ||||
| Unit Type | Units | % of Total Units | Average SF per Unit | Total SF |
| 2.5 Rooms | 5 | 2.7% | 425 | 2,125 |
| 3.0 Rooms | 3 | 1.6% | 510 | 1,530 |
| 3.5 Rooms | 33 | 17.6% | 595 | 19,635 |
| 4.0 Rooms | 1 | 0.5% | 680 | 680 |
| 4.5 Rooms | 32 | 17.1% | 765 | 24,480 |
| 5.5 Rooms | 18 | 9.6% | 935 | 16,830 |
| 6.5 Rooms | 14 | 7.5% | 1,105 | 15,470 |
| 7.0 Rooms | 30 | 16.0% | 1,190 | 35,700 |
| 7.5 Rooms | 20 | 10.7% | 1,275 | 25,500 |
| 8.0 Rooms | 16 | 8.6% | 1,360 | 21,760 |
| 8.5 Rooms | 3 | 1.6% | 1,445 | 4,335 |
| 9.0 Rooms | 9 | 4.8% | 1,530 | 13,770 |
| 9.5 Rooms | 1 | 0.5% | 1,615 | 1,615 |
| 10.5 Rooms | 1 | 0.5% | 1,785 | 1,785 |
| 11.0 Rooms | 1 | 0.5% | 1,870 | 1,870 |
| Total/Wtd. Avg. | 187 | 100.0% | 1,000 | 187,085 |
Source: Appraisal
COVID-19 Update. The first debt service payment due date is in December 2020. As of October 29, 2020, the Turner Towers Mortgage Loan is not subject to any forbearance, modification or debt service relief request. As of October 6, 2020, the borrower has reported that 98.0% of units have paid their October 2020 maintenance payments, and as of October 21, 2020, one of the professional office units inquired about rent relief; however, such rent relief was not granted.
The Market. The Turner Towers Property is located on the north side of Eastern Parkway between Underhill Avenue and Washington Avenue in the Prospect Heights neighborhood of Brooklyn. The Turner Towers Property can also be accessed on Eastern Parkway, Atlantic Avenue, Utica Avenue, Ralph Avenue, Bedford Avenue and Nostrand Avenue. The Turner Towers Property is located two blocks north of the Eastern Parkway-Brooklyn Museum subway station, which provides access to the 2, 3, and 4 trains. According to the appraisal, the Turner Towers Property is located within the Kings County submarket of the New York City apartment market. According to the appraisal, as of the second quarter of 2020, the Kings County submarket had an inventory of 267 multifamily rental buildings totaling 45,501 units, a vacancy rate of 5.0% and average asking rent per month of $2,552. According to the appraisal, as of the second quarter of 2020, the New York City apartment market had an inventory of 1,081 multifamily rental buildings totaling 224,957 units, a vacancy rate of 4.2% and average asking rent per month of $3,737.
This is not a research report and was not prepared by any Underwriter’s research department. Please see additional important information and qualifications at the end of this Term Sheet.
145
| Multifamily – Cooperative | Loan #13 | Cut-off Date Balance: | $25,000,000 | |
| 135 Eastern Parkway | Turner Towers | Cut-off Date LTV: | 9.5% | |
| Brooklyn, NY 11238 | U/W NCF DSCR: | 5.61x | ||
| U/W NOI Debt Yield: | 26.4% |
The following table presents certain information relating to multifamily rental properties comparable to the Turner Towers Property:
| Comparable Rental Properties(1) | ||||||
| Property | Year Built | # Units | Occupancy | Average SF per Unit | Average Monthly Rent per Unit | Average Monthly Rent PSF |
| Turner Towers | 1926 | 187 | 94.9%(2) | 1,000 | $5,016(3) | $5.02(3) |
| 409 Eastern Parkway | 2019 | 133 | 100.0% | 612 | $3,231 | $4.98 |
| 1511 Bedford Avenue | 2019 | 114 | 100% | 550 | $3,277 | $5.78 |
| 525 Clinton Avenue | 2012 | 30 | 93.3% | 964 | $4,819 | $4.83 |
| The Dean | 2017 | 120 | 100% | 708 | $3,396 | $4.61 |
| 859 President Street | 1920 | 23 | 95.7% | 775 | $3,935 | $4.99 |
| The Brooklyn Zinc | 2017 | 75 | 100% | 737 | $4,219 | $5.32 |
| 800 Union Street | 2018 | 28 | 100% | 1,394 | $8,234 | $5.40 |
Source: Appraisal.
| (1) | The comparable properties are not rent restricted. |
| (2) | Occupancy reported reflects the vacancy assumption in the related appraisal for purposes of determining the appraised value of the Turner Towers Property as a multifamily rental property. |
| (3) | The average rent for the Turner Towers Property is based on estimated market rents as determined by the appraisal. However, approximately 27.3% of the residential cooperative units at the Turner Towers Property were rent restricted prior to the cooperative conversion and accordingly would again be subject to rent restrictions if the Turner Towers Property were operated as a multifamily rental property. See “Risk Factors—Risks Relating to the Mortgage Loans—Residential Cooperative Properties Have Special Risks” in the Preliminary Prospectus. |
Underwritten Net Cash Flow. The following table presents certain information relating to the Underwritten Net Cash Flow at the Turner Towers Property:
| Cash Flow Analysis(1)(2) | ||
| UW | UW Unit | |
| Gross Potential Rent | $11,403,906 | $60,983.45 |
| Other Income | $0 | $0.00 |
| Less Vacancy & Credit Loss(3) | ($577,591) | ($3,088.72) |
| Effective Gross Income | $10,826,315 | $57,894.73 |
| Real Estate Taxes | $1,665,289 | $8,905.29 |
| Insurance | $132,000 | $705.88 |
| Other Expenses | $2,429,039 | $12,989.52 |
| Total Expenses | $4,226,328 | $22,600.69 |
| Net Operating Income | $6,599,987 | $35,294.05 |
| Capital Expenditures | $50,005 | $267.41 |
| Net Cash Flow | $6,549,982 | $35,026.64 |
| Occupancy %(3) | 94.9% | |
| NOI DSCR | 5.65x | |
| NCF DSCR | 5.61x | |
| NOI Debt Yield | 26.4% | |
| NCF Debt Yield | 26.2% | |
| (1) | For the avoidance of doubt, no COVID-19 specific adjustments have been incorporated in the lender underwriting. |
| (2) | Residential cooperatives are generally organized and operated as not-for-profit entities that set maintenance fees to cover current expenses and plan for future capital needs. The UW Net Operating Income and the UW Net Cash Flow for The Turner Towers Property are the projected net operating income and the projected net cash flow, respectively, reflected in the appraisal. The projected net operating income, in general, equals projected effective gross income at the Turner Towers Property assuming that it is operated as a multifamily rental property with rents and other income set at the prevailing market rates, reduced by underwritten property operating expenses and a market-rate vacancy assumption, in each case as determined by the appraiser. While such projected net operating income assumes the Turner Towers Property is rented at market rates, approximately 27.3% of the residential cooperative units at the Turner Towers Property were rent restricted prior to the cooperative conversion and accordingly would again be subject to rent restrictions if the Turner Towers Property were operated as a multifamily rental property. The projected net cash flow equals the projected net operating income reduced by the projected replacement reserves as determined by the appraiser. The projected rental income used in such determinations differs materially from the scheduled monthly maintenance payments from the tenant-shareholders at the Turner Towers Property. See “Risk Factors—Risks Relating to the Mortgage Loans—Residential Cooperative Properties Have Special Risks.” |
| (3) | Occupancy % and Vacancy & Credit Loss reported reflect the vacancy assumption in the related appraisal for purposes of determining the appraised value of the Turner Towers Property as a multifamily rental property. |
This is not a research report and was not prepared by any Underwriter’s research department. Please see additional important information and qualifications at the end of this Term Sheet.
146
(THIS PAGE INTENTIONALLY LEFT BLANK)
This is not a research report and was not prepared by any Underwriter’s research department. Please see additional important information and qualifications at the end of this Term Sheet.
147
| Mortgage Loan No. 14 – 114 Mulberry Street |
| Mortgage Loan Information | Property Information | ||||||
| Mortgage Loan Seller: | MSMCH | Single Asset/Portfolio: | Single Asset | ||||
| Credit Assessment (DBRSM/Fitch/Moody’s): | NR/NR/NR | Location: | New York, NY 10013 | ||||
| Original Balance: | $17,300,000 | General Property Type: | Mixed Use | ||||
| Cut-off Date Balance: | $17,300,000 | Detailed Property Type: | Multifamily/Retail | ||||
| % of Initial Pool Balance: | 2.0% | Title Vesting: | Leasehold | ||||
| Loan Purpose: | Refinance | Year Built/Renovated: | 2019/N/A | ||||
| Borrower Sponsors: | Eric Brody; Joseph Klaynberg | Size: | 24 Units | ||||
| Guarantors: | Eric Brody; Joseph Klaynberg | Cut-off Date Balance Per Unit: | $720,833 | ||||
| Mortgage Rate: | 3.9500% | Maturity Date Balance Per Unit: | $720,833 | ||||
| Note Date: | 11/2/2020 | Property Manager: | Lone Peak LLC | ||||
| First Payment Date: | 12/1/2020 | (borrower-related) | |||||
| Maturity Date: | 12/1/2030 | Underwriting and Financial Information(3) | |||||
| Original Term to Maturity: | 121 months | UW NOI: | $1,179,412 | ||||
| Original Amortization Term: | 0 months | UW NOI Debt Yield: | 6.8% | ||||
| IO Period: | 121 months | UW NOI Debt Yield at Maturity: | 6.8% | ||||
| Seasoning: | 0 months | UW NCF DSCR: | 1.69x | ||||
| Prepayment Provisions: | LO (24); DEF (90); O (7) | Most Recent NOI: | $791,884 (8/31/2020 TTM) | ||||
| Lockbox/Cash Mgmt Status: | Springing/Springing | 2nd Most Recent NOI(4): | N/A | ||||
| Additional Debt Type: | None | 3rd Most Recent NOI(4): | N/A | ||||
| Additional Debt Balance: | N/A | Most Recent Occupancy: | 91.7% (11/1/2020) | ||||
| Future Debt Permitted (Type): | No (N/A) | 2nd Most Recent Occupancy(4): | N/A | ||||
| Reserves | 3rd Most Recent Occupancy(4): | N/A | |||||
| Type | Initial | Monthly | Cap | Appraised Value (as of): | $29,500,000 (9/21/2020) | ||
| RE Tax: | $153,632 | $26,803 | N/A | Appraised Value per Unit: | $1,229,167 | ||
| Insurance: | $0 | Springing(1) | N/A | Cut-off Date LTV Ratio: | 58.6% | ||
| Recurring Replacements: | $0 | $596 | N/A | Maturity Date LTV Ratio: | 58.6% | ||
| TI/LC: | $0 | Springing(2) | N/A | ||||
| Rent Concession: | $40,000 | $0 | N/A | ||||
| Sources and Uses | ||||||
| Sources | Proceeds | % of Total | Uses | Proceeds | % of Total | |
| Loan Amount: | $17,300,000 | 98.9% | Loan Payoff: | $17,008,422 | 97.3% | |
| Borrower Equity: | $184,344 | 1.1% | Closing Costs: | $282,290 | 1.6% | |
| Reserves: | $193,632 | 1.1% | ||||
| Total Sources: | $17,484,344 | 100.0% | Total Uses: | $17,484,344 | 100.0% | |
| (1) | Monthly deposits for insurance are suspended for the 114 Mulberry Street Property (as defined below) as long as (i) no event of default has occurred and is continuing, (ii) the 114 Mulberry Street Property is covered under a blanket policy acceptable to the lender, (iii) the 114 Mulberry Street Borrower (as defined below) delivers evidence to the lender of renewal and (iv) the 114 Mulberry Street Borrower delivers evidence to the lender of payment within 10 business days prior to expiration. If said conditions are not met, the loan documents require an ongoing monthly escrow of 1/12th of the lender’s estimated insurance premiums for the renewal of coverage at least 30 days’ prior to expiration. |
| (2) | Commencing with the payment date occurring in December 2025, the 114 Mulberry Street Borrower is required to deposit with the lender on each payment date $4,167 for tenant improvements and leasing commissions that may be incurred. |
| (3) | The novel coronavirus pandemic is an evolving situation and could impact the 114 Mulberry Street Mortgage Loan (as defined below) more severely than assumed in the underwriting of the 114 Mulberry Street Mortgage Loan and could adversely affect the NOI, NCF and occupancy information, as well as the appraised value and the DSCR, LTV and Debt Yield metrics presented above and herein. See “Risk Factors—Risks Related to Market Conditions and Other External Factors—The Coronavirus Pandemic Has Adversely Affected the Global Economy and Will Likely Adversely Affect the Performance of the Mortgage Loans” in the Preliminary Prospectus. |
| (4) | Historical operating information is not available because the 114 Mulberry Street Property (as defined below) was built in 2019. For an explanation of the increase from Most Recent NOI to UW NOI, see “Operating History and Underwritten Net Cash Flow” below. |
The Mortgage Loan. The fourteenth largest mortgage loan (the “114 Mulberry Street Mortgage Loan”) is evidenced by a promissory note in the original principal amount of $17,300,000 and secured by a leasehold mortgage encumbering a mixed use multifamily and retail building located in New York, New York (the “114 Mulberry Street Property”).
The Borrower and the Borrower Sponsors. The borrower is 114 MS Owner, LLC (the “114 Mulberry Street Borrower”), a single-purpose New York limited liability company with no independent director. Joseph Klaynberg and Eric Brody are the borrower sponsors and non-recourse carveout guarantors. Joseph Klaynberg and Eric Brody are the Chief Executive Officer and Chief Operating Officer of New York City based Wonderworks Construction Corp. (“Wonderworks”), a private development and construction firm that offers pre-construction planning, design and development, and construction management services. Wonderworks was founded in 1987, has approximately 72 employees and a portfolio of approximately 25 developed buildings and 388 completed projects.
The Property. The 114 Mulberry Street Property is a newly constructed seven-story mixed use multifamily and retail property, totaling 24 units, situated on a 0.115-acre site in New York, New York. The 114 Mulberry Street Property was built in 2019 and is comprised of 23 apartment units and a 6,993 square foot ground flood commercial unit that stretches across the ground floor, mezzanine and cellar levels. The apartment unit mix is comprised of 22, one-bedroom units and one, two-bedroom unit. As of November 1, 2020, the 114 Mulberry Street Property was 91.7% occupied based on number of
This is not a research report and was not prepared by any Underwriter’s research department. Please see additional important information and qualifications at the end of this Term Sheet.
148
| Mixed Use – Multifamily/Retail | Loan #14 | Cut-off Date Balance: | $17,300,000 | |
| 114 Mulberry Street | 114 Mulberry Street | Cut-off Date LTV: | 58.6% | |
| New York, NY 10013 | U/W NCF DSCR: | 1.69x | ||
| U/W NOI Debt Yield: | 6.8% |
units. The commercial unit is fully occupied by Wonderworks Construction Corp. (“Wonderworks”), a borrower affiliated tenant, with a lease expiration date of August 31, 2035. Wonderworks’ rent for the commercial unit represents approximately 29.4% of underwritten effective gross income.Wonderworks utilizes its space at the 114 Mulberry Street Property as showroom and office space. The borrower sponsors guaranteed the Wonderworks lease until November 1, 2022. Wonderworks has the right to terminate its lease at any time upon 120 days’ notice. The 114 Mulberry Mortgage Loan documents provide that a termination of the Wonderworks lease is an event of default. Amenities at the 114 Mulberry Street Property include a rooftop terrace with grilling stations, laundry room and bicycle and tenant storage. The 114 Mulberry Street Property consists of a leasehold interest under a 99-year ground lease, which commenced in September 2016 and expires in September 2115. The 114 Mulberry Street Borrower prepaid the base rent under the ground lease for the remainder of the ground lease term. The ground lease is triple net and the 114 Mulberry Street Borrower is responsible for all property expenses as additional rent.
The table below shows the residential apartment unit mix at the 114 Mulberry Street Property:
| Apartment Unit Mix | |||||||||||||||||
| Unit Mix / Type | Total Units | Occupied Units | % Occupied | Average SF per Unit | Monthly Average Rent per Unit | Monthly Average Rent per SF | |||||||||||
| One Bedroom | 22 | 20 | 90.9% | 619 | $4,362 | $6.88 | |||||||||||
| Two Bedroom | 1 |
| 1 |
| 100.0% |
| 1,099 |
| $7,400 |
| $6.73 |
| |||||
| Total/Average | 23 | 21 | 91.3% | 640 | $4,506 | $6.87 | |||||||||||
Source: Borrower rent roll dated November 1, 2020.
COVID-19 Update. The first due date is in December 2020. As of November 6, 2020, the 114 Mulberry Street Mortgage Loan is not subject to any forbearance, modification or debt service relief request. As of October 20, 2020, 100.0% of tenants paid their full October 2020 rent payments and no tenants have requested lease modification or rent relief.
The Market. The 114 Mulberry Street Property is located in New York, New York along the east side of Mulberry Street between Canal and Hester Street. The 114 Mulberry Street Property can be accessed by the J, Z, 4, 6, N, Q, R and W subway lines, which are accessible along Canal Street. In addition, six blocks northeast of the 114 Mulberry Street Property is the B and D subway station on Grand Street and Chrystie Street. The 114 Mulberry Street Property is located in the Lower Manhattan multifamily submarket of the New York City multifamily market. According to a third party report, as of the third quarter of 2020, the vacancy rate in the Lower Manhattan multifamily submarket was approximately 5.1%, with average asking rents of $3,362 per unit and inventory of approximately 7,735 units. According to a third party report, as of the third quarter of 2020, the vacancy rate in the New York City multifamily market was approximately 4.2%, with average asking rents of $2,710 per unit and inventory of approximately 1,404,668 units.
The following table presents certain information relating to comparable multifamily rental properties to the 114 Mulberry Street Property:
| Property | Year Built | # of Stories | # Units | Unit Mix | Average SF per Unit(1) | Average Rent per Unit | Average Rent per SF(2) |
128 Mulberry Street New York | 2007 | 7 | 5 | Studio 1BR 2BR 3BR | N/A 599 776 N/A | N/A $3,880 $5,375 N/A | N/A $6.48 $6.93 N/A |
298 Mulberry Street New York | 1986 | 8 | 96 | Studio 1BR 2BR 3BR | 414 596 845 N/A | $3,814 $5,477 $7,858 N/A | $9.21 $9.19 $9.30 N/A |
309 Canal Street New York | 1915 | 5 | 18 | Studio 1BR 2BR 3BR | N/A 969 1,248 N/A | N/A $6,315 $8,237 N/A | N/A $6.52 $6.60 N/A |
151-155 Prince Street New York | 1841 | 3 | 5 | Studio 1BR 2BR 3BR | 654 655 N/A N/A | $4,550 $4,675 N/A N/A | $6.96 $7.14 N/A N/A |
55 Thompson Street New York | 2010 | 9 | 39 | Studio 1BR 2BR 3BR | N/A 941 1,519 1,936 | N/A $7,684 $12,340 $16,313 | N/A $8.17 $8.12 $8.43 |
52 Ludlow Street New York | 1910 | 5 | 10 | Studio 1BR 2BR 3BR | 450 475 1,150 N/A | $3,125 $3,425 $8,250 N/A | $6.94 $7.21 $7.17 N/A |
227 Mulberry Street New York | 2001 | 7 | 62 | Studio 1BR 2BR 3BR | 500 650 N/A 1,000 | $3,504 $5,187 N/A $5,989 | $7.01 $7.98 N/A $5.99 |
138 Bowery Street(1) New York | 2020 | 9 | 27 | Studio 1BR 2BR 3BR | N/A N/A N/A N/A | $2,700 $3,845 N/A N/A | N/A N/A N/A N/A |
Source: Appraisal.
| (1) | Average SF per unit not available for 138 Bowery Street. |
| (2) | Appraisal concludes market rent of $7.08 per square foot. |
This is not a research report and was not prepared by any Underwriter’s research department. Please see additional important information and qualifications at the end of this Term Sheet.
149
| Mixed Use – Multifamily/Retail | Loan #14 | Cut-off Date Balance: | $17,300,000 | |
| 114 Mulberry Street | 114 Mulberry Street | Cut-off Date LTV: | 58.6% | |
| New York, NY 10013 | U/W NCF DSCR: | 1.69x | ||
| U/W NOI Debt Yield: | 6.8% |
The following table presents certain information relating to comparable retail properties to the retail portion of the 114 Mulberry Street Property:
| Comparable Retail Rental Properties | |||||
| Property | Tenant | Total SF | Term Lease (Years) | Blended Rent (PSF) | Lease Type |
| 205 Mulberry Street | Veja | 2,500 | 10 | $134 | Modified Gross |
| 201 Mulberry Street | O. N. S. | 4,500 | N/A | $122 | Modified Gross |
| 167 Mott Street | Hemp Garden | 700 | 15 | $127 | Modified Gross |
| 317 Grand Street | GoGo Bikes | 430 | N/A | $60 | Modified Gross |
| 251 Mulberry Street | D.S. & Durga | 600 | 10 | $240 | Modified Gross |
| 166 Mott Street | Polusud | 445 | N/A | $152 | Modified Gross |
| 251 Mulberry Street | Mulberry Market | 5,564 | 12 | $49 | Modified Gross |
Source: Appraisal.
Operating History and Underwritten Net Cash Flow. The following table presents certain information relating to the historical operating performance and Underwritten Net Cash Flow at the 114 Mulberry Street Property:
| Cash Flow Analysis(1)(2) | |||
| 8/31/2020 TTM | UW | UW per Unit(5) | |
| Gross Potential Rent(3)(4) | $1,157,683 | $1,710,090 | $71,253.75 |
| Other Income | $6,020 | $7,300 | $304.17 |
| Less Vacancy & Credit Loss | $0 | ($85,505) | ($3,562.69) |
| Effective Gross Income | $1,163,703 | 1,631,886 | $67,995.23 |
| Real Estate Taxes | $252,158 | $306,280 | $12,761.67 |
| Insurance | $20,133 | $20,133 | $838.88 |
| Other Expenses | $99,528 | $126,061 | $5,252.52 |
| Total Expenses | $371,819 | $452,474 | $18,853.07 |
| Net Operating Income | $791,884 | $1,179,412 | $49,142.16 |
| Capital Expenditures | $0 | $7,149 | $297.86 |
| Net Cash Flow | $791,884 | $1,172,263 | $48,844.30 |
| Occupancy % | 91.7% | 95.0% | |
| NOI DSCR | 1.14x | 1.70x | |
| NCF DSCR | 1.14x | 1.69x | |
| NOI Debt Yield | 4.6% | 6.8% | |
| NCF Debt Yield | 4.6% | 6.8% | |
| (1) | For the avoidance of doubt, no COVID-specific adjustments have been made to the lender underwriting. |
| (2) | Historical operating information is not available because the 114 Mulberry Street Property was built in 2019. |
| (3) | The increase in Gross Potential Rent and Net Operating Income from 8/31/2020 TTM to UW is due to recent leasing of the commercial space to Wonderworks, a borrower affiliate ($480,000 of Gross Potential Rent). |
| (4) | Includes approximately $1,226,100 of rent from residential apartment units and $480,000 of rent from the commercial unit leased to Wonderworks, a borrower affiliate. |
| (5) | Assumes a total of 24 units, 23 multifamily units and 1 commercial unit. |
This is not a research report and was not prepared by any Underwriter’s research department. Please see additional important information and qualifications at the end of this Term Sheet.
150
(THIS PAGE INTENTIONALLY LEFT BLANK)
This is not a research report and was not prepared by any Underwriter’s research department. Please see additional important information and qualifications at the end of this Term Sheet.
151
| Mortgage Loan No. 15 – Chasewood Technology Park |
| Mortgage Loan Information | Property Information | ||||||
| Mortgage Loan Seller: | MSMCH | Single Asset/Portfolio: | Single Asset | ||||
| Credit Assessment (DBRSM/Fitch/Moody’s): | NR/NR/NR | Location: | Houston, TX 77070 | ||||
| Original Balance(1): | $16,000,000 | General Property Type: | Office | ||||
| Cut-off Date Balance(1): | $16,000,000 | Detailed Property Type: | Suburban | ||||
| % of Initial Pool Balance: | 1.8% | Title Vesting: | Fee | ||||
| Loan Purpose: | Acquisition | Year Built/Renovated: | Various/2002 | ||||
| Borrower Sponsor: | Nitya Capital | Size: | 463,969 SF | ||||
| Guarantor: | Swapnil Agarwal | Cut-off Date Balance Per SF(1): | $99 | ||||
| Mortgage Rate: | 3.9140% | Maturity Date Balance Per SF(1): | $81 | ||||
| Note Date: | 8/28/2020 | Property Manager: | KPM Commercial, LLC | ||||
| First Payment Date: | 10/1/2020 | (borrower-related) | |||||
| Maturity Date: | 9/1/2030 | ||||||
| Original Term to Maturity: | 120 months | ||||||
| Original Amortization Term: | 360 months | Underwriting and Financial Information(2) | |||||
| IO Period: | 12 months | UW NOI: | $5,267,633 | ||||
| Seasoning: | 2 months | UW NOI Debt Yield(1): | 11.5% | ||||
| Prepayment Provisions: | LO (23); YM1 (92); O (5) | UW NOI Debt Yield at Maturity(1): | 14.0% | ||||
| Lockbox/Cash Mgmt Status: | Springing/Springing | UW NCF DSCR(1): | 1.73x (P&I) 2.47x (IO) | ||||
| Additional Debt Type(1): | Pari Passu | Most Recent NOI: | $5,964,876 (12/31/2019) | ||||
| Additional Debt Balance(1): | $30,000,000 | 2nd Most Recent NOI: | $5,503,042 (12/31/2018) | ||||
| Future Debt Permitted (Type): | No (N/A) | 3rd Most Recent NOI: | $5,318,458 (12/31/2017) | ||||
| Reserves | Most Recent Occupancy(3): | 75.8% (6/20/2020) | |||||
| Type | Initial | Monthly | Cap | 2nd Most Recent Occupancy: | 91.8% (12/31/2019) | ||
| RE Tax: | $1,513,116 | $168,124 | N/A | 3rd Most Recent Occupancy: | 89.5% (12/31/2018) | ||
| Insurance: | $33,778 | $33,778 | N/A | Appraised Value (as of): | $70,433,459 (7/21/2020) | ||
| Recurring Replacements: | $0 | $9,666 | N/A | Appraised Value per SF: | $152 | ||
| TI/LC: | $1,000,000 | $67,662 | $4,059,729 | Cut-off Date LTV Ratio(1): | 65.3% | ||
| Deferred Maintenance: | $3,813 | $0 | N/A | Maturity Date LTV Ratio(1): | 53.5% | ||
| Other(4): | $548,585 | $0 | N/A | ||||
| Sources and Uses | ||||||
| Sources | Proceeds | % of Total | Uses | Proceeds | % of Total | |
| Whole Loan Amount(1): | $46,000,000 | 62.0% | Purchase Price: | $69,750,000 | 94.1% | |
| Borrower Equity: | $28,145,878 | 38.0% | Reserves: | $3,099,292 | 4.2% | |
| Closing Costs: | $1,296,586 | 1.7% | ||||
| Total Sources: | $74,145,878 | 100.0% | Total Uses: | $74,145,878 | 100.0% | |
| (1) | The Chasewood Technology Park Mortgage Loan (as defined below) is a part of the Chasewood Technology Park Whole Loan (as defined below) with an original aggregate principal balance of $46,000,000. The Cut-off Date Balance Per SF, Maturity Date Balance Per SF, UW NOI Debt Yield, UW NOI Debt Yield at Maturity, UW NCF DSCR, Cut-off Date LTV Ratio and Maturity Date LTV Ratio numbers presented above are based on the aggregate principal balance of the promissory notes comprising the Chasewood Technology Park Whole Loan. |
| (2) | Certain NOI and NCF information were determined prior to the emergence of the novel coronavirus, and prior to the economic disruption resulting from measures to combat the coronavirus, and certain DSCR, LTV and Debt Yield metrics were calculated, and the Chasewood Technology Park Whole Loan was underwritten, based on such prior information. See “Risk Factors—Risks Related to Market Conditions and Other External Factors—The Coronavirus Pandemic Has Adversely Affected the Global Economy and Will Likely Adversely Affect the Performance of the Mortgage Loans” in the Preliminary Prospectus. |
| (3) | Most Recent Occupancy is inclusive of 2,348 SF relating to an executed lease for a new tenant at the Chasewood Technology Park Property (as defined below). Rent for this tenant has not been underwritten. |
| (4) | Other Reserves are comprised of outstanding TI/LC ($455,829) and rent concessions ($92,756). |
The Mortgage Loan. The fifteenth largest mortgage loan (the “Chasewood Technology Park Mortgage Loan”) is part of a whole loan (the “Chasewood Technology Park Whole Loan”) evidenced by two pari passu promissory notes in the aggregate original principal amount of $46,000,000, both of which are secured by a first priority fee mortgage encumbering an office property located in Houston, Texas (the “Chasewood Technology Park Property”). The non-controlling Note A-2, in the original principal amount of $16,000,000, represents the Chasewood Technology Park Mortgage Loan and will be included in the BANK 2020-BNK29 securitization trust. The controlling Note A-1, in the original principal amount of $30,000,000, was contributed to the BANK 2020-BNK28 securitization transaction. The Chasewood Technology Park Whole Loan will be serviced pursuant to the pooling and servicing agreement for the BANK 2020-BNK28 securitization trust. See “Description of the Mortgage Pool—The Whole Loans—The Non-Serviced Pari Passu Whole Loans” and “Pooling and Servicing Agreement—Servicing of the Non-Serviced Mortgage Loan” in the Preliminary Prospectus.
This is not a research report and was not prepared by any Underwriter’s research department. Please see additional important information and qualifications at the end of this Term Sheet.
152
| Office – Suburban | Loan #15 | Cut-off Date Balance: | $16,000,000 | |
| 20329, 20333, 20405, and | Chasewood Technology Park | Cut-off Date LTV: | 65.3% | |
| 20445 State Highway 249 | UW NCF DSCR: | 1.73x | ||
| Houston, TX 77070 | UW NOI Debt Yield: | 11.5% |
| Chasewood Technology Park Whole Loan Summary | |||||
| Note | Original Balance | Cut-off Date Balance | Note Holder | Controlling Piece | |
| A-1 | $30,000,000 | $30,000,000 | BANK 2020-BNK28 | Yes | |
| A-2 | $16,000,000 | $16,000,000 | BANK 2020-BNK29 | No | |
| Total | $46,000,000 | $46,000,000 | |||
The Borrower and the Borrower Sponsor. The borrower is Chasewood TP, LLC (the “Chasewood Technology Park Borrower”), a single purpose Delaware limited liability company, structured with one independent director. Legal counsel to the Chasewood Technology Park Borrower delivered a non-consolidation opinion in connection with the origination of the Chasewood Technology Park Whole Loan. The borrower sponsor is Nitya Capital and the non-recourse carveout guarantor is Swapnil Agarwal, the founder and managing principal of Nitya Capital. Nitya Capital is a privately held real estate investment firm that focuses on the acquisition and management of multifamily properties. Since inception, Nitya Capital has acquired over 20,000 multifamily units and over 1,000,000 square feet of commercial office space throughout Texas.
The Property. The Chasewood Technology Park Property is a four-building Class A office property totaling 463,969 square feet, on an approximately 10.4-acre site located in Houston, Texas. The Chasewood Technology Park Property consists of four separate buildings. One Chasewood is a six-story, 107,968 square foot building that was constructed in 1983 and underwent renovation in 2002. Two Chasewood is an eight-story, 153,226 square foot building that was constructed in 1985 and underwent renovation in 2002. Three Chasewood is a four-story, 97,552 square foot building built in 1999 and Four Chasewood is a five-story, 105,223 square foot building built in 2008. The Chasewood Technology Park Property is situated in a park-like setting with an on-site deli. The Chasewood Technology Park Property has undergone approximately $5.7 million of various capital improvements from 2017 through 2019. Major capital improvements include a new fitness center, tenant lounge, conference center and flood prevention infrastructure. The Chasewood Technology Park Property includes a total of 1,450 parking spaces, with 244 surface spaces and 1,206 spaces within two parking garages. The Chasewood Technology Park Property was 75.8% leased as of June 20, 2020 to 59 tenants. Other than the two largest tenants, no tenant accounts for more than 3.8% of the NRA or 5.2% of the underwritten base rent.
Major Tenants.
Branch Banking & Trust (44,153 square feet, 9.5% of NRA, 11.6% of underwritten rent). Branch Banking & Trust is a financial services holding company. Branch Banking & Trust offers retail and commercial banking, securities brokerage, insurance, wealth management, asset management, corporate banking, capital markets and specialized lending. Branch Banking & Trust is based in Winston-Salem, North Carolina and operates more than 1,700 branches in 15 states and Washington, D.C. Branch Banking & Trust has been a tenant at the Chasewood Technology Park Property since 2002 and expanded by 6,521 square feet in 2019. Branch Banking & Trust has a lease expiration of October 31, 2024 and has two, five-year renewal options remaining.
Asset Risk Management (43,142 square feet, 9.3% of NRA, 14.0% of underwritten rent). The Chasewood Technology Park Property serves as the headquarters for Asset Risk Management. Asset Risk Management is a services firm that provides energy risk management to oil and gas producers including hedge strategy development and implementation services, as well as physical commodity and natural gas market, supply management, and transportation services. Asset Risk Management has been a tenant at the Chasewood Technology Park Property since 2010. Asset Risk Management has a lease expiration date of March 31, 2030, with no renewal options remaining.
RPS Group, Inc. (17,765 square feet, 3.8% of NRA, 5.2% of underwritten rent). RPS Group, Inc. is a global professional services firm that provides consulting services across property, energy, transport, water, resources, and defense. Founded in 1970, RPS Group, Inc. has approximately 5,000 employees in 125 countries across six continents. RPS Group, Inc. has been a tenant at the Chasewood Technology Park Property since 2017 and expanded by 7,441 square feet in 2018. RPS Group, Inc. has a lease expiration of June 30, 2023 and has one, five-year renewal option remaining.
VLK Architects (14,339 square feet, 3.1% of NRA, 4.3% of underwritten rent). VLK Architects is an architectural firm founded in 1984, which provides architecture, planning, and interior design services to K-12, higher education, corporate and institutional clients. VLK Architects has been a tenant at the Chasewood Technology Park Property since 2014 and expanded by 3,134 square feet in 2020. VLK Architects has a lease expiration of October 16, 2026 and has one, five-year renewal option remaining.
Chasewood State Bank (11,839 square feet, 2.6% of NRA, 2.9% of underwritten rent). Chasewood State Bank was founded in 1983 and is currently headquartered at the Chasewood Technology Park Property. Chasewood State Bank has approximately 21 employees and two bank locations. Chasewood State Bank has been a tenant at the Chasewood Technology Park Property since 2002, has a lease expiration of January 31, 2023 and has one, ten-year renewal option remaining.
This is not a research report and was not prepared by any Underwriter’s research department. Please see additional important information and qualifications at the end of this Term Sheet.
153
| Office – Suburban | Loan #15 | Cut-off Date Balance: | $16,000,000 | |
| 20329, 20333, 20405, and | Chasewood Technology Park | Cut-off Date LTV: | 65.3% | |
| 20445 State Highway 249 | UW NCF DSCR: | 1.73x | ||
| Houston, TX 77070 | UW NOI Debt Yield: | 11.5% |
The following table presents a summary regarding the major tenants at the Chasewood Technology Park Property:
| Tenant Summary(1) | ||||||||||
| Tenant Name | Credit Rating (Fitch/ Moody’s/S&P)(2) | Tenant SF | Approx.% of SF | Annual UW Rent | Annual UW Rent PSF(3) | |||||
| App. % of Total Annual UW Rent | Term. Option | Renewal Options | Lease Expiration | |||||||
| Branch Banking & Trust | A/A3/A- | 44,153 | 9.5% | $1,170,055 | $26.50 | 11.6% | N | 2 x 5 year | 10/31/2024 | |
| Asset Risk Management | NR/NR/NR | 43,142 | 9.3% | $1,412,900 | $32.75 | 14.0% | N | None | 3/31/2030 | |
| RPS Group, Inc. | NR/NR/NR | 17,765 | 3.8% | $524,068 | $29.50 | 5.2% | N | 1 x 5 year | 6/30/2023 | |
| VLK Architects | NR/NR/NR | 14,339 | 3.1% | $432,034 | $30.13 | 4.3% | N | 1 x 5 year | 10/16/2026 | |
| Chasewood State Bank | NR/NR/NR | 11,839 | 2.6% | $291,239 | $24.60 | 2.9% | N | 1 x 10 year | 1/31/2023 | |
| Subtotal/Wtd. Avg. | 131,238 | 28.3% | $3,830,296 | $29.19 | 37.9% | |||||
| Other Tenants(4) | 217,937 | 47.0% | $6,270,749 | $28.77 | 62.1% | |||||
| Vacant Space | 114,794 | 24.7% | $0 | $0.00 | 0.0% | |||||
| Total/Wtd. Avg. | 463,969 | 100.0% | $10,101,044 | $28.93 | 100.0% | |||||
| (1) | Information is based on the underwritten rent roll as of June 20, 2020. |
| (2) | Certain ratings are those of the parent company whether or not the parent guarantees the lease. |
| (3) | Wtd. Avg. Annual UW Rent PSF excludes vacant space. |
| (4) | Other Tenants include non-revenue generating space for the tenant lounge/gym/conference center. |
The following table presents certain information relating to the lease rollover at the Chasewood Technology Park Property:
| Lease Rollover Schedule(1)(2) | ||||||||
| Year | # of Leases Rolling | SF Rolling | Annual UW Rent PSF Rolling | Approx. % of Total SF Rolling | Approx. Cumulative % of SF Rolling | Total UW Rent Rolling | Approx. % of Total Rent Rolling | Approx. Cumulative % of Total Rent Rolling |
| MTM | 0 | 0 | $0.00 | 0.0% | 0.0% | $0 | 0.0% | 0.0% |
| 2020 | 1 | 2,907 | $30.00 | 0.6% | .6% | $87,210 | 0.9% | 0.9% |
| 2021 | 11 | 30,183 | $30.39 | 6.5% | 7.1% | $917,365 | 9.1% | 9.9% |
| 2022 | 7 | 16,237 | $28.91 | 3.5% | 10.6% | $469,490 | 4.6% | 14.6% |
| 2023 | 15 | 80,139 | $28.52 | 17.3% | 27.9% | $2,285,912 | 22.6% | 37.2% |
| 2024 | 12 | 102,275 | $29.15 | 22.0% | 49.9% | $2,980,986 | 29.5% | 66.7% |
| 2025 | 5 | 23,395 | $29.36 | 5.0% | 55.0% | $686,815 | 6.8% | 73.5% |
| 2026 | 3 | 29,203 | $29.29 | 6.3% | 61.3% | $855,409 | 8.5% | 82.0% |
| 2027 | 1 | 10,324 | $27.50 | 2.2% | 63.5% | $283,910 | 2.8% | 84.8% |
| 2028 | 0 | 0 | $0.00 | 0.0% | 63.5% | $0 | 0.0% | 84.8% |
| 2029 | 0 | 0 | $0.00 | 0.0% | 63.5% | $0 | 0.0% | 84.8% |
| 2030 | 2 | 47,436 | $32.34 | 10.2% | 73.7% | $1,533,948 | 15.2% | 100.0% |
| 2031 & Beyond(3) | 1 | 7,076 | $0.00 | 1.5% | 75.3% | $0 | 0.0% | 100.0% |
| Vacant | 0 | 114,794 | $0.00 | 24.7% | 100.0% | $0 | 0.0% | 100.0% |
| Total/Wtd. Avg. (4) | 58 | 463,969 | $28.93 | 100.0% | $10,101,044 | 100.0% | ||
| (1) | Information is based on the underwritten rent roll as of June 20, 2020. |
| (2) | Certain tenants may have lease termination options that are exercisable prior to the stated expiration date of the subject lease or leases which are not considered in the lease rollover schedule. |
| (3) | 2031 & Beyond include non-revenue generating space for the tenant lounge/gym/conference center. |
| (4) | Total/Wtd. Avg. Annual UW Rent PSF Rolling excludes vacant space. |
COVID-19 Update. As of November 5, 2020, the Chasewood Technology Park Whole Loan is current as of the November debt service payment and is not subject to any forbearance, modification or debt service relief request. As of November 5, 2020, the borrower has reported that the Chasewood Technology Park Property is open and operating with 98.7% of tenants by occupied NRA and 98.7% of tenants by underwritten base rent having paid their full October 2020 rent payments. One tenant, Scardello & Associates (0.5% of NRA) requested and received rent relief of approximately 50% rent from May through August 2020. In exchange, the tenant extended its lease one month.
The Market. The Chasewood Technology Park Property is located in Houston, Texas, within the Houston – TX office market and FM 1960/Hwy 249 submarket. Major developments in the immediate area include Willowbrook Mall and Vintage Park. According to the appraisal, Willowbrook Mall is a 1,449,632 square foot mall which has approximately 19 million shoppers per year. National tenants at the Willowbrook Mall include Macy’s, Dillard’s, Dick’s Sporting Goods and Nordstrom Rack. Vintage Park, located directly across the highway, is an upscale mixed-use development that includes 537,000 square feet of retail and office space, over 1,600 residences, a Westin hotel, and the St. Luke’s and Kelsey Seybold medical campus. Primary access to the Chasewood Technology Park Property is provided by State Highway 249, the Sam Houston Parkway and the Grand Parkway. The Chasewood Technology Park Property is approximately a 15 minute drive to the George Bush Intercontinental Airport and a 35 minute drive to the Houston Central
This is not a research report and was not prepared by any Underwriter’s research department. Please see additional important information and qualifications at the end of this Term Sheet.
154
| Office – Suburban | Loan #15 | Cut-off Date Balance: | $16,000,000 | |
| 20329, 20333, 20405, and | Chasewood Technology Park | Cut-off Date LTV: | 65.3% | |
| 20445 State Highway 249 | UW NCF DSCR: | 1.73x | ||
| Houston, TX 77070 | UW NOI Debt Yield: | 11.5% |
Business District. According to a third-party market research report, as of the second quarter of 2020, the vacancy rate in the Houston – TX office market was approximately 17.7%, with average asking rent of $28.22 per square foot and inventory of approximately 335 million square feet. According to a third-party market research report, as of the second quarter of 2020 the vacancy rate in the FM 1960/Hwy 249 submarket was approximately 16.7%, with average asking rent of $25.21 per square foot and inventory of approximately 9.7 million square feet. According to the appraisal, the 2020 population within a one-, three- and five-mile radius of the Chasewood Technology Park Property was 7,024, 106,366 and 273,393, respectively. The 2020 average household income within a one-, three- and five-mile radius was $104,174, $109,985 and $110,971, respectively.
The following table presents certain information relating to the appraisal’s market rent conclusion for the Chasewood Technology Park Property:
| Market Rent Summary | ||||
| One Chasewood | Two Chasewood | Three Chasewood | Four Chasewood | |
| Escalations | 3.0% | 3.0% | 3.0% | 3.0% |
| Leasing Commissions (Renewals) | 3.0% | 3.0% | 3.0% | 3.0% |
| Leasing Commissions (New Tenants) | 6.0% | 6.0% | 6.0% | 6.0% |
| Concessions (New Tenants) | 3 months | 3 months | 3 months | 3 months |
| Tenant Improvements (Renewals) | $10.00 | $10.00 | $10.00 | $10.00 |
| Average Lease Term | 5 years | 5 years | 5 years | 5 years |
| Tenant Improvements (New Tenants) | $25.00 | $25.00 | $25.00 | $25.00 |
| Market Rent ($/SF/Yr.) | $30.00 | $30.00 | $34.00 | $34.00 |
| Net Rentable Area (SF) | 107,968 | 153,226 | 97,552 | 105,223 |
| Reimbursements | Base Year | Base Year | Base Year | Base Year |
Source: Appraisal.
The following table presents comparable office leases with respect to the Chasewood Technology Park Property:
| Comparable Office Lease Summary | |||||||
| Property/Location | NRA (SF) | Tenant Name | Size (SF) | Term (Mo.) | Start Date | Reimbs. | Annual Base Rate PSF(1) |
Chasewood Crossing I & II 19450 - 19500 State Highway 249 Houston, TX 77070 | 312,000 | AFGlobal Crescent Pass Energy Hartford Fire Insurance | 7,542 1,223 13,074 | 64 30 65 | May 2020 Mar 2020 Apr 2019 | NNN NNN NNN | $17.50 $17.00 $19.75 |
| 10720 W Sam Houston Parkway N Houston, TX 77064 | 206,808 | Asurion | 129,966 | N/A | Feb 2019 | NNN | $17.50 |
Remington Square 10603 - 10713 West Sam Houston Parkway North Houston, TX 77064 | 396,982 | Acclara | 96,821 | 36 | Sep 2018 | NNN | $21.50 |
The Centre at Cypress Creek 20500 SH 249 Houston, TX 77070 | 229,326 | Spirit Environmental Seagate Independence Contract Drilling | 8,915 5,436 19,831 | 36 12 66 | Nov 2020 Jan 2020 Aug 2018 | NNN N/A NNN | $16.00 $16.50 $16.50 |
Source: Appraisal.
| (1) | The Annual Base Rent PSF shown are the quoted rental rate per square foot with a NNN expense structure, provided by the comparable building. In determining the market rent set forth in the Market Rent Summary above, the appraiser made an upward adjustment to the comparable rents for expense structure to conclude a base year equivalent rent. |
This is not a research report and was not prepared by any Underwriter’s research department. Please see additional important information and qualifications at the end of this Term Sheet.
155
| Office – Suburban | Loan #15 | Cut-off Date Balance: | $16,000,000 | |
| 20329, 20333, 20405, and | Chasewood Technology Park | Cut-off Date LTV: | 65.3% | |
| 20445 State Highway 249 | UW NCF DSCR: | 1.73x | ||
| Houston, TX 77070 | UW NOI Debt Yield: | 11.5% |
Operating History and Underwritten Net Cash Flow. The following table presents certain information relating to the historical operating performance and Underwritten Net Cash Flow at the Chasewood Technology Park Property:
| Cash Flow Analysis | |||||||
| 12/31/2016 | 12/31/2017 | 12/31/2018 | 12/31/2019 | UW(1) | UW Per SF | ||
| Gross Potential Rent(2) | $9,769,164 | $9,220,272 | $9,453,417 | $9,576,006 | $13,726,422 | $29.58 | |
| Total Recoveries | $820,062 | $577,306 | $664,047 | $553,237 | $352,915 | $0.76 | |
| Other Income | $1,013,678 | $937,336 | $761,593 | $791,106 | $689,909 | $1.49 | |
| Less Vacancy & Credit Loss | $0 | $0 | $0 | $0 | ($3,625,379) | ($7.81) | |
| Effective Gross Income | $11,602,904 | $10,734,914 | $10,879,058 | $10,920,349 | $11,143,868 | $24.02 | |
| Real Estate Taxes | $1,978,989 | $1,905,650 | $1,699,903 | $1,498,701 | $2,017,480 | $4.35 | |
| Insurance | $189,468 | $288,224 | $384,644 | $482,197 | $393,553 | $0.85 | |
| Other Expenses | $2,899,486 | $3,222,582 | $3,291,469 | $2,974,574 | $3,465,203 | $7.47 | |
| Total Expenses | $5,067,942 | $5,416,456 | $5,376,016 | $4,955,473 | $5,876,236 | $12.67 | |
| Net Operating Income | $6,534,962 | $5,318,458 | $5,503,042 | $5,964,876 | $5,267,633 | $11.35 | |
| Capital Expenditures | $0 | $0 | $0 | $0 | $92,794 | $0.20 | |
| TI/LC | $0 | $0 | $0 | $0 | $665,549 | $1.43 | |
| Net Cash Flow | $6,534,962 | $5,318,458 | $5,503,042 | $5,964,876 | $4,509,290 | $9.72 | |
| Occupancy %(3) | 84.3% | 89.2% | 89.5% | 91.8% | 73.6% | ||
| NOI DSCR (P&I)(4) | 2.51x | 2.04x | 2.11x | 2.29x | 2.02x | ||
| NOI DSCR (IO) (4) | 3.58x | 2.91x | 3.01x | 3.27x | 2.89x | ||
| NCF DSCR (P&I)(4) | 2.51x | 2.04x | 2.11x | 2.29x | 1.73x | ||
| NCF DSCR (IO)(4) | 3.58x | 2.91x | 3.01x | 3.27x | 2.47x | ||
| NOI Debt Yield(4) | 14.2% | 11.6% | 12.0% | 13.0% | 11.5% | ||
| NCF Debt Yield(4) | 14.2% | 11.6% | 12.0% | 13.0% | 9.8% | ||
| (1) | For the avoidance of doubt, no COVID-specific adjustments have been made to the lender underwriting. |
| (2) | The increase between 12/31/2019 Gross Potential Rent and UW Gross Potential Rent is mainly due to a number of tenants expanding and taking occupancy in mid to late 2019 including Asset Risk Management (approximately 21,571 SF and approximately $695,665 of base rent), Branch Banking & Trust (approximately 6,521 SF and approximately $169,546 of base rent) and Devoted Health (approximately 6,201 SF and approximately $167,427 of base rent). |
| (3) | UW Occupancy % represents economic occupancy. Physical occupancy was 75.8% as of June 20, 2020. |
| (4) | The debt service coverage ratios and debt yields shown are based on the Chasewood Technology Park Whole Loan. |
This is not a research report and was not prepared by any Underwriter’s research department. Please see additional important information and qualifications at the end of this Term Sheet.
156
| BANK 2020-BNK29 |
This material was prepared by sales, trading, banking or other non-research personnel of one of the following: Morgan Stanley & Co. LLC, Morgan Stanley & Co. International Limited, Morgan Stanley Japan Limited and/or Morgan Stanley Dean Witter Asia Limited (together with their affiliates, hereinafter “Morgan Stanley”), Wells Fargo Securities, LLC (together with its affiliates, “Wells Fargo”), BofA Securities, Inc. (together with its affiliates, “BofA Securities”), Academy Securities, Inc. (together with its affiliates, “Academy”) and Drexel Hamilton, LLC (together with its affiliates, “Drexel” and, collectively with Morgan Stanley, Wells Fargo, BofA Securities and Academy, the “Underwriters”). This material was not produced by an Underwriter’s research analyst, although it may refer to an Underwriter’s research analyst or research report. Unless otherwise indicated, these views (if any) are the author’s and may differ from those of the fixed income or equity research departments of the Underwriters or others in those firms.
This material may have been prepared by or in conjunction with the respective trading desks of the Underwriters that may deal as principal in or own or act as market maker or liquidity provider for the securities/instruments (or related derivatives) mentioned herein. The trading desk may have accumulated a position in the subject securities/instruments based on the information contained herein. Trading desk materials are not independent of the proprietary interests of the Underwriters, which may conflict with your interests. Each of the Underwriters may also perform or seek to perform investment banking services for the issuers of the securities and instruments mentioned herein.
The information contained in this material is preliminary as of the date hereof. This material is subject to change, completion or amendment from time to time. The information in this material supersedes information in any other communication relating to the securities referred to in this material; provided, that the information in this material will be superseded by similar information delivered to you as part of a preliminary prospectus. This material is not a solicitation to participate in any trading strategy, and is not an offer to sell any security or instrument or a solicitation of an offer to buy or sell any security or instrument in any jurisdiction where an offer, solicitation or sale is not permitted. Unless otherwise set forth in this material, any securities referred to in this material may not have been registered under the U.S. Securities Act of 1933, as amended, and, if not, may not be offered or sold absent an exemption therefrom. Recipients are required to comply with any legal or contractual restrictions on their purchase, holding, sale, exercise of rights or performance of obligations under any securities/instruments transaction.
The securities/instruments discussed in this material may not be suitable for all investors. This material has been prepared and issued by the Underwriters for intended distribution to market professionals and institutional investor clients. Other recipients should seek independent investment advice prior to making any investment decision based on this material. This material does not provide individually tailored investment advice or offer tax, regulatory, accounting or legal advice. Prior to entering into any proposed transaction, recipients should determine, in consultation with their own investment, legal, tax, regulatory and accounting advisors, the economic risks and merits, as well as the legal, tax, regulatory and accounting characteristics and consequences, of the transaction. You should consider this material as only a single factor in making an investment decision.
The value of and income from investments may vary because of changes in interest rates, foreign exchange rates, default rates, prepayment rates, securities/instruments prices, market indexes, operational or financial conditions of companies or other factors. There may be time limitations on the exercise of options or other rights in securities/instruments transactions. Past performance is not necessarily a guide to future performance. Estimates of future performance are based on assumptions that may not be realized. Actual events may differ from those assumed and changes to any assumptions may have a material impact on any projections or estimates. Other events not taken into account may occur and may significantly affect the projections or estimates. Certain assumptions may have been made for modeling purposes only to simplify the presentation and/or calculation of any projections or estimates, and the Underwriters do not represent that any such assumptions will reflect actual future events. Accordingly, there can be no assurance that estimated returns or projections will be realized or that actual returns or performance results will not materially differ from those estimated herein. Some of the information contained in this document may be aggregated data of transactions in securities or other financial instruments executed by an Underwriter that has been compiled so as not to identify the underlying transactions of any particular customer.
Notwithstanding anything herein to the contrary, the Underwriters and each recipient hereof (and their employees, representatives, and other agents) may disclose to any and all persons, without limitation of any kind from the commencement of discussions, the U.S. federal and state income tax treatment and tax structure of the transaction and all materials of any kind (including opinions or other tax analyses) that are provided to it relating to the tax treatment and tax structure (as such terms are defined in Treasury Regulation 1.6011-4). For this purpose, “tax structure” is limited to facts relevant to the U.S. federal and state income tax treatment of the transaction and does not include information relating to the identity of the parties, their affiliates, agents or advisors. This authorization of tax disclosure is retroactively effective to the commencement of discussions with prospective investors regarding the transactions contemplated herein.
THE DISTRIBUTION OF THIS MATERIAL (A) IF MADE BY A PERSON WHO IS NOT AN AUTHORIZED PERSON UNDER THE FINANCIAL SERVICES AND MARKETS ACT 2000 (“FSMA”), IS BEING MADE ONLY TO, OR DIRECTED ONLY AT, PERSONS WHO (I) ARE OUTSIDE THE UNITED KINGDOM, OR (II) HAVE PROFESSIONAL EXPERIENCE IN MATTERS RELATING TO INVESTMENTS AND QUALIFY AS INVESTMENT PROFESSIONALS IN ACCORDANCE WITH ARTICLE 19(5) OF THE FINANCIAL SERVICES AND MARKETS ACT 2000 (FINANCIAL PROMOTION) ORDER 2005 (AS AMENDED, THE “FINANCIAL PROMOTION ORDER”), OR (III) ARE PERSONS FALLING WITHIN ARTICLE 49(2)(A) THROUGH (D) (“HIGH NET WORTH COMPANIES, UNINCORPORATED ASSOCIATIONS, ETC.”) OF THE FINANCIAL PROMOTION ORDER OR, (IV) ARE PERSONS TO WHICH THIS MATERIAL MAY OTHERWISE LAWFULLY BE COMMUNICATED OR DIRECTED; AND (B) IF MADE BY A PERSON WHO IS AN AUTHORIZED PERSON UNDER THE FSMA, IS BEING MADE ONLY TO, OR DIRECTED ONLY AT, PERSONS WHO (I) ARE OUTSIDE THE UNITED KINGDOM, OR (II) HAVE PROFESSIONAL EXPERIENCE OF PARTICIPATING IN UNREGULATED SCHEMES (AS DEFINED FOR PURPOSES OF THE FINANCIAL SERVICES AND MARKETS ACT 2000 (PROMOTION OF COLLECTIVE INVESTMENT SCHEMES) (EXEMPTIONS) ORDER 2001 (AS AMENDED, THE “PROMOTION OF COLLECTIVE INVESTMENT SCHEMES EXEMPTIONS ORDER”)) AND QUALIFY AS INVESTMENT PROFESSIONALS IN ACCORDANCE WITH ARTICLE 14(5) OF THE PROMOTION OF COLLECTIVE INVESTMENT SCHEMES EXEMPTIONS ORDER, OR (III) ARE PERSONS FALLING WITHIN ARTICLE 22(2)(A) THROUGH (D) (“HIGH NET WORTH COMPANIES, UNINCORPORATED ASSOCIATIONS, ETC.”) OF THE PROMOTION OF COLLECTIVE INVESTMENT SCHEMES EXEMPTIONS ORDER, OR (IV) ARE PERSONS TO WHOM THE ISSUING ENTITY MAY LAWFULLY BE PROMOTED IN ACCORDANCE WITH SECTION 4.12 OF THE UK FINANCIAL CONDUCT AUTHORITY’S CONDUCT OF BUSINESS SOURCEBOOK.
THE OFFERED CERTIFICATES HAVE NOT BEEN AND WILL NOT BE REGISTERED UNDER THE FINANCIAL INSTRUMENTS AND EXCHANGE LAW OF JAPAN, AS AMENDED (THE “FIEL”), AND DISCLOSURE UNDER THE FIEL HAS NOT BEEN AND WILL NOT BE MADE WITH RESPECT TO THE OFFERED CERTIFICATES. ACCORDINGLY, EACH OF MORGAN STANLEY & CO. LLC, WELLS FARGO SECURITIES, LLC, BOFA SECURITIES, INC., ACADEMY SECURITIES, INC. AND DREXEL HAMILTON, LLC HAS REPRESENTED AND AGREED THAT IT HAS NOT, DIRECTLY OR INDIRECTLY, OFFERED OR SOLD AND WILL NOT, DIRECTLY OR INDIRECTLY, OFFER OR SELL ANY OFFERED CERTIFICATES IN JAPAN OR TO, OR FOR THE BENEFIT OF, ANY RESIDENT OF JAPAN (WHICH TERM AS USED IN THIS MATERIAL MEANS ANY PERSON RESIDENT IN JAPAN, INCLUDING ANY CORPORATION OR OTHER ENTITY ORGANIZED UNDER THE LAWS OF JAPAN) OR TO OTHERS FOR REOFFERING OR RE SALE, DIRECTLY OR INDIRECTLY, IN JAPAN OR TO, OR FOR THE BENEFIT OF, ANY RESIDENT OF JAPAN EXCEPT PURSUANT TO AN EXEMPTION FROM THE REGISTRATION REQUIREMENTS OF, AND OTHERWISE IN COMPLIANCE WITH, THE FIEL AND OTHER RELEVANT LAWS, REGULATIONS AND MINISTERIAL GUIDELINES OF JAPAN. AS PART OF THIS OFFERING OF THE OFFERED CERTIFICATES, THE UNDERWRITERS MAY OFFER THE OFFERED CERTIFICATES IN JAPAN TO UP TO 49 OFFEREES IN ACCORDANCE WITH THE ABOVE PROVISIONS.
This is not a research report and was not prepared by any Underwriter’s research department. Please see additional important information and qualifications at the end of this Term Sheet.
157