As filed with the Securities and Exchange Commission on August 30, 2021
Registration
No. 333-
UNITED STATES
SECURITIES AND EXCHANGE COMMISSION
WASHINGTON, D.C. 20549
FORM S-1
REGISTRATION STATEMENT
UNDER
THE SECURITIES ACT OF 1933
agilon health, inc.
(Exact Name of Registrant as Specified in its Charter)
Delaware | 8090 | 37-1915147 | ||
(State or Other Jurisdiction of Incorporation or Organization) | (Primary Standard Industrial Classification Code Number) | (I.R.S. Employer Identification Number) |
1 World Trade Center, Suite 2000
Long Beach, CA 90831
(562)
256-3800
(Address, including zip code, and telephone number, including area code, of registrant’s principal executive offices)
Steven J. Sell
Chief Executive Officer
agilon health, inc.
1 World Trade Center, Suite 2000
Long Beach, CA 90831
(562)
256-3800
(Name, address, including zip code, and telephone number, including area code, of agent for service)
Copies to:
Paul M. Rodel, Esq. Debevoise & Plimpton LLP 919 Third Avenue New York, New York 10022 (212) 909-6000 | William V. Fogg, Esq. Michael E. Mariani, Esq. Cravath, Swaine & Moore LLP 825 Eighth Avenue New York, New York 10019 (212) 474-1000 |
Approximate date of commencement of proposed sale to the public:
If any of the securities being registered on this Form are to be offered on a delayed or continuous basis pursuant to Rule 415 under the Securities Act of 1933, check the following box. ☐
If this Form is filed to register additional securities for an offering pursuant to Rule 462(b) under the Securities Act, please check the following box and list the Securities Act registration statement number of the earlier effective registration statement for the same offering. ☐
If this Form is a post-effective amendment filed pursuant to Rule 462(c) under the Securities Act, check the following box and list the Securities Act registration statement number of the earlier effective registration statement for the same offering. ☐
If this Form is a post-effective amendment filed pursuant to Rule 462(d) under the Securities Act, check the following box and list the Securities Act registration statement number of the earlier effective registration statement for the same offering. ☐
Indicate by check mark whether the registrant is a large accelerated filer, an accelerated filer, a
non-accelerated
filer, a smaller reporting company, or an emerging growth company. See the definitions of “large accelerated filer,” “accelerated filer,” “smaller reporting company” and “emerging growth company” in Rule12b-2
of the Exchange Act.| Large accelerated filer | ☐ | Accelerated filer | ☐ | |||
| Non-accelerated filer | ☒ | Smaller reporting company | ☐ | |||
| Emerging growth company | ☐ | |||||
If an emerging growth company, indicate by check mark if the registrant has elected not to use the extended transition period for complying with any new or revised financial accounting standards provided pursuant to Section 7(a)(2)(B) of the Securities Act. ☐
CALCULATION OF REGISTRATION FEE
Title of Each Class of Securities to be Registered | Proposed Maximum Aggregate Offering Price(1)(2) | Amount of Registration Fee | ||
Common Stock, par value $0.01 per share | $100,000,000 | $10,910 | ||
| (1) | Estimated solely for the purpose of calculating the registration fee in accordance with Rule 457(o) of the Securities Act of 1933, as amended. |
| (2) | Includes shares of common stock subject to the underwriters’ option to purchase additional shares. |
The registrant hereby amends this registration statement on such date or dates as may be necessary to delay its effective date until the registrant shall file a further amendment which specifically states that this registration statement shall thereafter become effective in accordance with Section 8(a) of the Securities Act of 1933 or until the registration statement shall become effective on such date as the U.S. Securities and Exchange Commission, acting pursuant to said Section 8(a), may determine.
The information in this preliminary prospectus is not complete and may be changed. We may not sell these securities until the U.S. Securities and Exchange Commission declares our registration statement effective. This preliminary prospectus is not an offer to sell these securities and we are not soliciting offers to buy these securities in any state or jurisdiction where the offer or sale is not permitted.
SUBJECT TO COMPLETION, DATED , 2021
Shares

agilon health, inc.
Common Stock
The selling stockholders identified in this prospectus are offering shares of common stock of agilon health, inc. (“agilon health”). We will not receive any of the proceeds of the sale of our common stock being sold in this offering, including any shares the selling stockholders may sell pursuant to the underwriters’ option to purchase additional shares of our common stock.
Our common stock is listed on the New York Stock Exchange (the “NYSE”) under the symbol “AGL”. The last reported sale price of our common stock on , 2021 was $ per share.
After the completion of this offering, we expect to continue to be a “controlled company” within the meaning of the corporate governance standards of the NYSE.
Investing in our common stock involves risks. See “Risk Factors” beginning on page 22 of this prospectus to read about factors you should consider before buying shares of our common stock.
Per Share | Total | |||||||
Public offering price | $ | $ | ||||||
Underwriting discounts and commissions (1) | $ | $ | ||||||
Proceeds, before expenses, to the selling stockholders | $ | $ | ||||||
| (1) | See “Underwriting” for a description of the compensation payable to the underwriters. |
The underwriters also may purchase up to additional shares from the selling stockholders at the public offering price less the underwriting discounts and commissions, within 30 days from the date of this prospectus.
Neither the U.S. Securities and Exchange Commission nor any state securities commission has approved or disapproved the securities described herein or determined if this prospectus is truthful or complete. Any representation to the contrary is a criminal offense.
The underwriters expect to deliver the shares to purchasers on or about , 2021.
J.P. Morgan | Goldman Sachs & Co. LLC |
Prospectus dated , 2021


TABLE OF CONTENTS
| 1 | ||||
| 22 | ||||
| 66 | ||||
| 69 | ||||
| 70 | ||||
| 71 | ||||
| 72 | ||||
| 74 | ||||
| 106 | ||||
| 146 | ||||
| 153 | ||||
| 166 | ||||
| 168 | ||||
| 171 | ||||
| 177 | ||||
| 180 | ||||
| 183 | ||||
| 187 | ||||
| 197 | ||||
| 197 | ||||
| 197 | ||||
F-1 |
You should rely only on the information contained in this prospectus and any free writing prospectus we may authorize to be delivered to you. We have not, and the selling stockholders and the underwriters have not, authorized anyone to provide you with information different from, or in addition to, that contained in this prospectus and any related free writing prospectus. We, the selling stockholders and the underwriters take no responsibility for, and can provide no assurances as to the reliability of, any information that others may give you. This prospectus is an offer to sell only the shares offered hereby, but only under circumstances and in jurisdictions where it is lawful to do so. The information contained in this prospectus is only accurate as of the date of this prospectus, regardless of the time of delivery of this prospectus and any sale of shares of our common stock.
| i |
Certain Important Terms
| • | “We,” “us,” “our,” “agilon” and the “Company” mean agilon health, inc., a Delaware corporation and its consolidated subsidiaries, unless the context refers only to agilon health, inc., as a corporate entity (which we refer to as “agilon health”). |
| • | ���Anchor geography” means the geographies in which our anchor physician groups operate. |
| • | “Anchor physician groups” means the physician groups with which we have long-term contractual arrangements, typically including joint governance, operations and leadership, and surplus sharing, and does not include physicians in our Hawaii geography. |
| • | “Capitation” means a payment arrangement in which a set amount for each enrolled beneficiary is paid to a provider or entity during an agreed upon period, regardless of whether or not such beneficiary seeks medical services or treatment. |
| • | “CMS” means the Centers for Medicare & Medicaid Services. |
| • | “CMS Innovation Center” means the Center for Medicare & Medicaid Innovation. |
| • | “DCE” means a Direct Contracting Entity participating in the CMS Innovation Center Direct Contracting Model. |
| • | “FFS” means fee-for-service. |
| • | “Independent physicians” means physicians not employed by health systems or insurance providers. |
| • | “Live,” when referring to a physician partner or a geography, means implementation of our platform with the physician partner or in the geography is complete, and we are generating revenue and assuming financial risk pursuant to agreements with payors. |
| • | “MA” means Medicare Advantage. |
| • | “Members” means the MA patients who are attributed to our PCPs (as defined below) by our payors (as defined below). |
| • | “Payors” means health insurance providers. |
| • | “Our PCPs” means PCPs contracted by our anchor physician groups and our network of contracted physicians. |
| • | “PCP” means primary care physician. |
| • | “Physician partners” means our anchor physician groups and all other physicians with whom we have contractual arrangements. |
| • | “PMPM” means per member per month. |
| • | “RBE” means a risk-bearing entity. |
| • | “STAR rating” means annual ratings awarded by CMS to health plans which measure the quality of health services received by beneficiaries enrolled in MA based on various calculated quality metrics. |
| • | “Total Care Model” means a PCP-led global capitation reimbursement model in which physicians receive a monthly payment from health plans to manage the total healthcare needs of their attributed patients. |
Market and Industry Data
This prospectus includes estimates regarding market and industry data and forecasts, which are based on publicly available information, industry publications and surveys, reports from government agencies, reports by market research firms and our own estimates based on our management’s knowledge of, and experience in, the
| ii |
healthcare industry. Third-party industry publications and forecasts generally state that the information contained therein has been obtained from sources generally believed to be reliable.
Throughout this prospectus, all references to “net promoter score” or “NPS” are to a measure of satisfaction widely used in the healthcare industry. We calculate patient and provider net promoter score based on responses to patient and provider surveys, administered as electronic surveys annually, that ask the patient or provider to rank, on a scale of 0 to 10, how likely they are to recommend their (or their provider’s) practice to a friend or family member. We assign the designation of “Promoter” to respondents who provide a score of 9 or 10, the designation of “Passive” to respondents who provide a score of 7 or 8, and the designation of “Detractor” to respondents who provide a score of 0 to 6. We then subtract the percentage of Detractors from Promoters to determine our overall net promoter score. We believe that this method of calculation aligns with industry standards and that this metric is meaningful for investors because of the correlation that we believe exists between net promoter score and patient and provider satisfaction.
Our estimates involve risks and uncertainties and are subject to change based on various factors, including those discussed under the captions “Risk Factors,” “Special Note Regarding Forward-Looking Statements and Information” and “Management’s Discussion and Analysis of Financial Condition and Results of Operations.”
Service Marks, Trademarks and Trade Names
We hold various service marks, trademarks and trade names, such as “agilon health,” “agilon” and our logo design, that we deem particularly important to the advertising activities conducted by each of our businesses. This prospectus also contains trademarks, service marks and trade names of other companies which are the property of their respective holders. We do not intend our use or display of such names or marks to imply relationships with, or endorsements of us by, any other company.
Basis of Presentation
During 2020, we implemented a plan to divest all of our California operations, which includes the entirety of our Medicaid line of business, via three separate transactions with different parties. In February 2021, we completed the divestiture of our California operations. As a result of the divestiture of all of our California operations, our financial statements included in this prospectus reflect discontinued operations presentation for all California operations. Financial and operating information contained in this prospectus is presented without California operations data unless expressly stated otherwise. See “Management’s Discussion and Analysis of Financial Condition and Results of Operations—California Operations” for additional information.
| iii |
PROSPECTUS SUMMARY
The following summary highlights selected information contained elsewhere in this prospectus. Because this is only a summary, it does not contain all of the information you should consider before investing in our common stock. You should carefully read the entire prospectus, including the sections entitled “Risk Factors” and “Management’s Discussion and Analysis of Financial Condition and Results of Operations,” as well as our consolidated financial statements included elsewhere in this prospectus, before making an investment decision.
Overview
Our business is transforming healthcare by empowering the primary care physician (“PCP”) to be the agent for change in the communities they serve. We believe that PCPs, with their intimate patient-physician relationships, are best positioned to drive meaningful change in quality, cost and patient experience when provided with the right infrastructure and payment model. Through our combination of the agilon platform, a long-term partnership model with existing physician groups and a growing network of like-minded physicians, we are poised to revolutionize healthcare for seniors across communities throughout the United States. Our purpose-built model provides the necessary capabilities, capital and business model for existing physician groups to create a Medicare-centric, globally capitated line of business. Our model operates by forming risk-bearing entities (each, an “RBE”) within local geographies, that enter into arrangements with payors providing for monthly payments to manage the total healthcare needs of our physician partners’ attributed patients (or, global capitation arrangements), contract with agilon to perform certain functions and enter into long-term professional service agreements with one or more anchor physician groups pursuant to which the anchor physician groups receive a base compensation rate and share in the savings from successfully improving quality of care and reducing costs.
Our company was formed in 2016, and we established our inaugural partnership with an anchor physician group in 2017. Our ability to rapidly build scaled positions in local communities has allowed us to grow to 16 anchor physician groups and 17 geographies in fewer than five years. Our platform has enabled us to grow our total membership by 45% and revenue by 53% from December 31, 2019 to December 31, 2020. As of June 30, 2021, the PCPs on our platform serve approximately 230,700 patients enrolled in Medicare Advantage (“MA”), which includes approximately 49,000 patients with physician groups contracted to(“FFS”) beneficiaries through our five currently approved Direct Contracting Entities (“DCEs”). For the year ended December 31, 2020, our DCEs did not contribute to our revenue.
go-live
on January 1, 2022 (we refer to these patients as the “members on our platform”). In addition, through our participation in the Center for Medicare & Medicaid Innovation (“CMS Innovation Center”) Direct Contracting Model, our PCPs serve over 50,000 Medicarefee-for-service
1
Empower PCPs to Transform Care in Their Communities

The current state of the U.S. healthcare system is defined by the following key factors:
| • | Unsustainably high and rising costs characterized by waste, unnecessary variation in care and poor patient experience and health outcomes; |
| • | FFS reimbursement model focused on units of service rather than a coordinated approach to meet the unique needs of individual patients; |
| • | The Medicare population is projected to grow from approximately 62 million in 2020 to more than 70 million individuals in 2025 with a total spend of approximately $1.25 trillion, and MA enrollment is projected to comprise 47% of total Medicare enrollment (which we refer to as the “MA penetration rate”); and |
| • | PCPs are positioned—but not currently empowered or incentivized—to act as the quarterback for healthcare delivery, with their decisions estimated to influence up to 90% of total healthcare spending according to a 2017 study. |
We believe that failing to empower PCPs has fostered waste, needless variability in care and unsustainable growth in healthcare costs. According to a 2019 article entitled “Waste in the US Health Care System: Estimated Costs and Potential for Savings” published in the Journal of the American Medical Association, failure of care delivery, failure of care coordination and overtreatment or low-value care were estimated to represent $205.3 billion to $345.1 billion of waste annually in the U.S. healthcare system. While there is broad recognition of the need to move beyond a volume-based, FFS reimbursement model, structural hurdles have impeded rapid adoption of a
PCP-led
global capitation reimbursement model in which physicians receive a monthly payment from health plans to manage the total healthcare needs of their attributed patients, which we refer to as a Total Care Model. In this prospectus, we refer to “capitation” as a payment arrangement in which a set amount for each enrolled beneficiary is paid to a provider or entity during an agreed upon period, regardless of whether or not such beneficiary seeks medical services or treatment.To overcome these hurdles and achieve our mission of being the trusted long-term partner to community-based physicians, we have developed what we believe is aTotal Care Model for community-based physicians that focuses exclusively on Medicare and manages subscription-like per member per month (“PMPM”) arrangements with health plans or directly with the government. The agilon Total Care Model is powered by our platform, enabled through a long-term partnership model and reinforced via our growing national
first-of-its-kind
2
network of like-minded physicians. Our position as innovators is demonstrated by a series of transformative accomplishments since the formation of the company in July 2016, and our first partnership in 2017, many of which we believe to be industry-firsts:
| • | Implemented the first MA multi-payor, globally capitated risk model with a community-based physician group in all of our diverse geographies in which our anchor physician groups operate (“anchor geographies”); |
| • | Exported the Total Care Model from one to 17 geographies ranging from communities as small as Zanesville, Ohio to large and rapidly growing communities such as Austin, Texas; |
| • | Grew from approximately 24,000 patients attributed to our PCPs by our payors (“members”) to approximately 230,700 MA members on our platform; |
| • | Expanded from two payors to 15 payors on our platform; and |
| • | Began participating in the Direct Contracting Model, with over 50,000 Medicare FFS beneficiaries served by our existing PCPs contracted through our five currently approved DCEs. |
Our business model is differentiated by its focus on existing community-based physician groups and is built
around three key elements:
| • | agilon’s platform, which is holistic in enabling the rapid transformation to risk, is comprised of an integrated set of capabilities designed to continuously improve, and is delivered to our anchor physician groups through an aligned long-term partnership model; |
| • | agilon’s long-term physician partnership approach with community-based physician groups, which is designed to move healthcare closer to the physician, be outcome-centric and optimize the long-term sticky relationship between a patient and their existing physician; and |
| • | agilon’s network of leading community-based physician partners, functioning as a collaborative group which can share best practices, influence the development of the platform, compare notes on the transition to a Total Care Model and learn from one another. |
With our model, our goal is to remove the barriers that prevent community-based physicians from evolving to a Total Care Model, where the physician is empowered to manage health outcomes and the total healthcare needs of their attributed Medicare patients. The combination of subscription-like PMPM agreements with payors, the sticky patient-physician relationship and our long-term partnership model, which is typically 20 years in duration, results in a growing and recurring revenue stream and provides significant visibility into the near-term and long-term financial trajectory for both agilon and our anchor physician groups. In January of each year, we typically have visibility into greater than 90% of that year’s projected revenue.
The result is PCPs transforming their historical transaction-based model to a long-term, holistic membership-based model that is reflective of the intimate and trusted relationship between physician and patient. Despite our history of net losses, we believe this membership-based model results in a recurring revenue stream and provides our anchor physician groups with access to an incremental profit margin opportunity based on delivering high-quality care and health outcomes. Freed from the constraints of the transactional FFS reimbursement model, our PCPs are empowered to practice team-based, coordinated care when addressing individual patient needs and transition to a sustainable long-term business model for their senior patients. We believe enabling PCPs to unlock the value of a Medicare-centric, globally capitated line of business while remaining independent can transform the community-based physician business model.
In this prospectus, when referring to a physician partner or a geography, “live” means implementation of our platform with the physician partner or in the geography is complete, and we are generating revenue and assuming
3
financial risk pursuant to agreements with health insurance providers (“payors”). In addition, “anchor physician groups” means the physician groups with which we have long-term contractual arrangements, typically including joint governance, operations and leadership, and surplus sharing, and does not include physicians in our Hawaii geography. We refer to our anchor physician groups and the other physicians with whom we have contracted arrangements as our “physician partners.” Finally, “our PCPs” means PCPs contracted by our anchor physician groups and our network of contracted physicians.
The agilon Flywheel Effect
:
Our platform, partnership and network model enable our physician partners to be the quarterback for healthcare delivery in their community, and successfully operate a Medicare-centric, globally capitated line of business. This generates improving quality and cost outcomes, growing membership and increasing medical margin per member, which we share with our physician partners pursuant to our long-term partnership model. We believe this continuous improvement in patient and physician engagement and experience leads to more PCPs joining our platform and ultimately improves the success of each physician partner on the platform. As our platform grows, we believe we will be able to leverage our scale to drive additional investment in our geographies to accelerate this flywheel for the benefit of our physician partners and their patients. The power of the agilon flywheel is highlighted by our total membership growth of 45%, of which 42% was driven by same geography membership growth and 58% was driven by entry into new geographies from December 31, 2019 to December 31, 2020, and general and administrative expenses per member contracted by 23% over the same period. Our general and administrative expenses per member contracted by 18% from December 31, 2018 to December 31, 2019. For the years ended December 31, 2020, 2019, and 2018 we had revenue of $1.2 billion, $794.4 million, and $474.8 million, respectively, and net loss of $60.1 million, $282.7 million, and $146.5 million, respectively. For the six months ended June 30, 2021, we had revenue of $912.1 million and net loss of $314.1 million.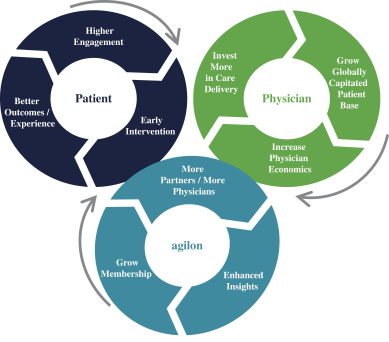
Our Market
In 2020, approximately 62 million Americans were enrolled in Medicare nationally, of which we estimate approximately 27 million to be affiliated with independent physicians. We define independent physicians as
4
physicians not employed by health systems or insurance providers. We consider our current addressable market to be the estimated 17.5 million Medicare beneficiaries affiliated with independent PCPs in states in which we already have a physician partner or a signed letter of intent with a physician group as of January 2021, and those in which we have identified near-term prioritized geographies. Based on 2021 estimated average annual revenue per Medicare member to us of approximately $10,000, we estimate that this represents a total addressable market (“TAM”) size of approximately $175 billion in 2020. We believe this addressable market will increase to nearly 20 million Medicare beneficiaries and $253 billion by 2025, based on the Centers for Medicare & Medicaid Services’ (“CMS”) projected Medicare enrollment and spending per beneficiary growth rates.
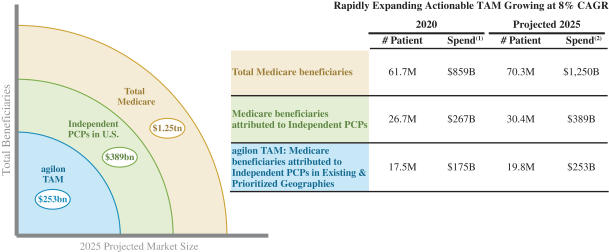
| (1) | 2020 Medicare spend for total Medicare beneficiaries is based on CMS spend per beneficiary. |
| (2) | 2025 Medicare spend for total Medicare beneficiaries, beneficiaries attributed to independent PCPs and agilon total addressable market is based on CMS projected Medicare enrollment and spending per beneficiary growth rates. |
Of our estimated 2020 addressable market, $80 billion is concentrated in states in which we currently have a physician partner or a signed letter of intent with a physician group as of January 2021, and $24 billion is based in counties in which we currently have a physician partner or a signed letter of intent with a physician group as of January 2021. In addition to the MA members our physician partners currently serve, we estimate our physician partners also serve approximately 375,000 patients that are addressable, which includes all Medicare FFS beneficiaries and commercial patients expected to age into Medicare over the next five years. This represents a 2020 market size of approximately $3.8 billion, using the same assumed annual revenue per Medicare member to us.
In addition, we see an additional opportunity for growth of our addressable market in physicians currently affiliated with health systems or insurance providers who become increasingly dissatisfied with those models. In considering our total addressable market, please also see “Risk Factors—Risks Related to Our Business.”
Industry Challenges and Our Opportunity
We believe there is a significant opportunity to impact growth in U.S. healthcare costs and change the trajectory of the primary care business model through a platform, such as ours, in which PCPs are empowered to manage health outcomes and the total healthcare needs of their attributed Medicare patients and share in the financial surplus created to the extent premiums received exceed the cost of medical care.
5
Unsustainably high and rising U.S. healthcare costs
According to CMS, U.S. national healthcare expenditures are expected to increase from $3.81 trillion in 2019 to $4.27 trillion in 2021. CMS projects that by 2028, healthcare expenditures will reach $6.20 trillion and will account for 19.7% of the U.S. GDP, up from 17.7% in 2018.
Patients are dissatisfied with the fragmented and uncoordinated healthcare experience
In the current FFS model, reimbursement is focused on units of service rather than a coordinated approach to meet the unique needs of individual patients. As a result, care delivery is often uncoordinated, leaving patients frustrated and responsible to navigate their own way through a fragmented and complex healthcare system.
PCPs are well-positioned to be agents of change
According to Oregon’s Patient-Centered Primary Care Home Program, every $1 spent on primary care services can save $13 of future healthcare costs. Across the U.S., there are more than 486,000 active PCPs who serve as patients’ first and most frequent point of contact for their healthcare experience.
The trajectory of the current independent primary care business model is unsustainable
In the current FFS reimbursement model, as average reimbursement rates decline, PCPs must increase the number of patients they see to sustain their practice. This volume-based model perpetuates physician burnout and jeopardizes the long-term sustainability of the independent primary care business model. According to a 2019 report, more than 50% of family physicians show symptoms of burnout, driven in part the FFS reimbursement model and increasing administrative burden. We believe this has been exacerbated by the effects of
COVID-19.
Growth of the complex and costly Medicare population is accelerating pressure on primary care
The Medicare population is expected to grow from approximately 62 million individuals in 2020 to approximately 70 million individuals by 2025. As the medically complex Medicare population disproportionately drives utilization and cost, and is typically reimbursed at a lower rate than the commercial population, the primary care delivery system and the overall healthcare system are further strained.
Structural Hurdles to Adoption of a Total Care Model
We believe that all key stakeholders—patients, physicians and payors—benefit significantly from an environment where PCPs are empowered to manage health outcomes and the total healthcare needs of their attributed Medicare patients versus operating in the current FFS reimbursement model that primarily rewards units of service. However, over time, the existing FFS system has created structural hurdles that now impede rapid and broad adoption of a
PCP-led
Total Care Model.| • | PCPs lack the incentive structure to reorganize the healthcare delivery system. |
| • | PCPs lack the infrastructure to participate in a multi-payor model. |
| • | PCPs lack the breadth of capabilities and resources necessary to transition to a Total Care Model. |
| • | PCP groups are highly fragmented and lack the benefits of scale. |
| • | Limited long-term, deep collaboration between payors and physicians. |
Our Answer
We have created a Total Care Model for community-based physicians that focuses exclusively on Medicare and manages the comprehensive healthcare needs of our members through subscription-like PMPM arrangements with health plans or directly with CMS—powered by the agilon platform, enabled through a long-term partnership model and reinforced via a growing national network.
6
The agilon Platform:
co-developed
and has been continuously refined with our physician partners since the formation of the company. The agilon platform comprises an integrated set of capabilities, delivered as a unified platform to enable successful partnerships at the community level, create a national network of PCPs and physician groups and empower our PCPs to improve health outcomes for their patients.Our platform capabilities include:
| • | Payor Engagement |
| • | Direct Contracting Model |
| • | Data Integration and Management |
| • | Clinical Programs and Product Development |
| • | Quality (Clinical and Experience) |
| • | Growth 60-64 year-old patients, to enable their patients to make educated healthcare choices. These patients represent an embedded growth opportunity. |
| • | Performance Management Analytics peer-to-peer |
| • | Financial Management |
| • | National Policy |
7
agilon’s Long-term Physician Partner Model
Physician Relationships
We built the agilon platform to be deployed through an aligned long-term partnership model with community-based physician groups to address the need to move healthcare closer to the physician, be outcome-centric and optimize the long-term sticky relationship between a patient and their existing physician. Our anchor physician group relationships have the following characteristics:
| • | Long-term partnership model that allows both agilon and physicians to take the long-term view and benefit from the maturity of a growing number of members on the platform; |
| • | Shared governance and co-location of staff to manage our local partnerships; |
| • | Local dyad leadership structure that includes a medical director from the local anchor physician group; |
| • | Local brand which reflects the local anchor physician group or geography; |
| • | Capital from agilon to support value-based care infrastructure supporting the delivery of high-quality healthcare, and 100% downside protection, which removes a major obstacle to physicians making the leap to a Total Care Model; |
| • | Operating leverage created by amortizing centralized investments in the platform infrastructure across a growing number of physician partners; and |
| • | Surplus dollars generated locally due to improvements in quality of care and healthcare costs are shared with the local anchor physician group. |
Under the Total Care Model, we typically operate by RBE’s within local geographies. These wholly-owned RBEs enter into risk-bearing, global capitation agreements with payors, contract with agilon to perform certain functions and enter into long-term professional service agreements with one or more anchor physician groups. Individual MA members whose care is provided by PCPs employed or affiliated with our anchor physician groups are attributed to the RBE, which bears financial responsibility for the associated medical costs of such members. Through incentive compensation arrangements, we share with our anchor physician groups a portion of the RBE’s savings from successfully improving the quality of care and reducing costs. Typically, our anchor physician groups receive a FFS base compensation rate for services rendered which is paid directly by health plan payors to our anchor physician groups or, in certain arrangements, paid from the health plan payor to the applicable RBE, who pays the compensation received to our anchor physician groups. In certain cases, our anchor physician groups may be entitled to a guaranteed minimum FFS base compensation rate from the RBE in the event that the FFS base compensation rate paid by the health plan payor does not meet the negotiated base compensation rate as agreed between the RBE and the anchor physician group, or if the FFS base compensation rate paid by the health plan payor falls below what the anchor physician group had received prior to joining our platform. Historically, the base compensation rates paid directly by the health plan payors to our anchor physician groups have met or exceeded applicable guaranteed minimum FFS base compensation rates. Most of our contracts with our anchor physician groups contain exclusivity provisions, as well as termination rights that are triggered upon certain events.
Payor Relationships
In each of our geographies, we enter into subscription-like PMPM agreements with payors to manage the total healthcare costs of our attributed members. Through this partnership model, we believe we:
| • | empower PCPs to act as the quarterback for healthcare delivery; |
| • | enable PCPs to define a tailored patient experience across multiple payors; |
8
| • | create an operating partnership and economic model built around improved health outcomes instead of a transaction-based model; and |
| • | align the physician business model with the strength of their long-term patient relationships enabling the long-term growth of independent, community-based physician groups. |
Under a typical agreement, we are entitled to monthly PMPM fees, which are typically based on a defined percentage of the corresponding premium which payors receive from CMS. We generally accept full financial risk for members attributed to us through our contracted PCPs and, therefore, are responsible for the cost of all healthcare services required by those members, which generally includes healthcare costs which CMS considers Part A and B costs. Our agreements with payors may delegate claims payment to us, or such responsibility may be retained by the payor, as is the case today in the majority of our payor agreements. The majority of our agreements are for terms ranging from one to three years and contain automatic annual renewal provisions as well as various termination rights. We also typically agree to indemnify our payors against certain third-party claims. As we continue to expand the agilon platform and enter into additional long-term partnerships, we will negotiate payor agreements in new geographies, including with Humana, Aetna and United Healthcare.
The power of our local partnership model is defined by the scale, breadth and local brand of our physician partners. On average, our anchor physician groups have been serving their communities for more than 40 years, have a PCP tenure of approximately 13 years, and receive exceptionally strong NPS from their PCPs and patients in live geographies of 73 and 83, respectively. We believe this gives us the ability to influence the local healthcare delivery system at scale. We expect our physician partner patient panels to systematically migrate to MA as the patient population ages and our partnerships mature. We estimate that the number of Medicare FFS patients, Medicare-eligible patients and patients expected to age into Medicare over the next five years in our existing physician partner patient populations is approximately 375,000.
The table below presents an overview of our anchor physician groups:

9
In addition to our anchor physician groups in the table above, we have broadly contracted with PCPs across the state of Hawaii and have developed select deeper primary care relationships within that network.
Our Network
We believe the agilon network creates significant value for our patients, our physician partners, our payors and our organization. The ability to share best practices, compare notes on the transition to a Total Care Model and learn from one another represents a valuable opportunity for physicians who intentionally choose an independent path rather than joining a health system or insurance provider. Our physician partners are both collaborative and constructively competitive in service of their patients. We believe the power of a like-minded group of community-based physicians, many of whom are leaders in their community, will enhance innovation, growth, quality of care and patient experience, and ultimately strengthen the power of the independent physician business model in local communities across the country.
Value Proposition to Stakeholders
Our Total Care Model empowers community-based physician groups to lead local healthcare transformation and ensure the long-term sustainability of the community-based physician model.
We believe the benefits of this differentiated model to community-based physician groups and the patients they serve include:
| • | Rapid creation of a Medicare Total Care Model that enables our PCPs to take a long-term view of their relationships with their patients and allocate resources to meet individual member health needs. |
| • | Sustainable long-term business model alongside commercial and Medicare FFS. |
| • | Provides access to network of like-minded partners. |
| • | Improved economics. |
| • | Improving the physician experience. |
| • | Improving the patient experience. |
| • | Supporting superior health outcomes. |
We have also become an important strategic partner for our payors, as we are a material portion of their membership base, delivery network and annual membership growth in many of the geographies we serve. Through our subscription-like agreements, we ensure a consistent gross margin on a growing membership base. The strength of our relationships with payors has resulted in our establishment of national joint-operating committees with five national health plans through which we develop, execute and monitor a strategy for growth and performance as part of their Medicare delivery network.
Our Strengths
Local and National Leadership and First-Mover Dynamics
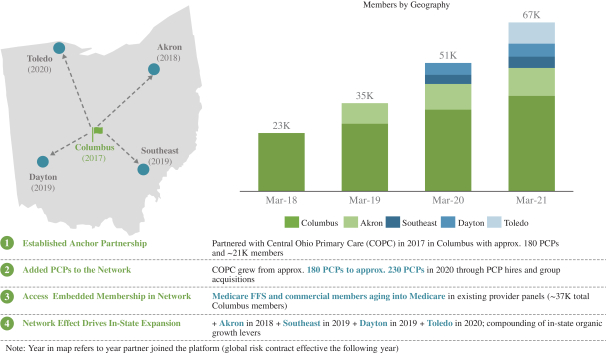
Core to our model is partnering in local geographies with leading physician groups that have already built significant scale and strong brands in the communities they serve. Our local leadership is highlighted by our position in Columbus, Ohio, where we have more than 200 PCPs on our platform, whose patient panels include approximately 50% of total MA lives among independent PCPs.
10
We believe we are pioneers in providing a full-risk, multi-payor Total Care Model within our local geographies, our growing regional hubs and the country. We believe we are the only MA multi-payor, globally capitated risk vehicle available for independent physician groups to access a Total Care Model in our local geographies. The sustainability of this local leadership position is also enhanced by our long-term partnerships with our anchor physician groups.
We’ve established a strong local leadership position in 17 geographies creating what we believe to be the first national platform for a Medicare-centric, globally capitated line of business. We believe our position as a first-mover creates a competitive advantage, resulting in other independent physician groups viewing us as an established and trusted partner.
Long-Term Economic Model
We believe our membership and
per-member
profitability will grow over time due to structural characteristics inherent to our long-term partnerships, durable and growing MA membership within our physician partners and the nature of the MA economic model. The key strengths of our economic model include:| • | We believe we have the ability to generate significant, recurring and growing medical margin in concert with our physician partners over the course of our long-term partnerships and the inherently sticky physician-patient relationship. |
| • | Our physician partnerships are typically 20 years. |
| • | Average physician tenure within our anchor physician groups is 13 years. |
| • | Patients 65 years of age and older remain with their PCP for an average of 10 years, according to a 2004 study. |
| • | Embedded same-geography, long-term organic membership growth resulting from our physician partners’ existing patients who age into Medicare and elect to enroll in MA or who elect to convert from Medicare FFS to MA over the life of our long-term partnership. |
Although we have incurred net losses since our formation in 2016, we believe that the combination of a growing membership base and improving medical margin over the life of our long-term partnerships creates a significant lifetime value (“LTV”) for the geographies we enter. We are able to access this attractive LTV through what we believe to be a low-cost and increasingly cost-efficient model. We believe this low-cost and increasingly cost-efficient growth model represents a significant advantage supporting our rapid scaling to new geographies and sustainable existing geography growth.
Model for Long-Term Sustainable Growth
We have created a multi-pronged growth strategy that has powerful tailwinds for our physician partners and our business by leveraging existing physician capacity in local geographies, establishing long-term partnerships with significant embedded growth opportunities and expanding through multiple regional levels. The “flywheel” nature of our model has allowed us to expand from one geography to 17 in fewer than five years and has resulted in an additional approximately 186,000 MA lives being attributed to our platform over the same time period.
Purpose-Built, Exportable, Scalable Platform
The creation of the agilon platform and an aligned physician partnership approach has enabled the consistent deployment of a Medicare-centric, globally capitated line of business across 17 heterogeneous geographies, 16 anchor physician groups and multiple payors. The components of our Total Care Model (including data, payor
11
engagement, clinical programs and growth) are discrete but are delivered as a unified platform through a highly-aligned model with physicians to optimize success. Our platform has enabled us to grow revenue 53% year-over-year for the year ended December 31, 2020, while operating costs to support live geographies and enterprise functions grew 12% over the same period. Our revenue grew 67% year-over-year for the year ended December 31, 2019, while operating costs to support live geographies and enterprise functions grew 42% over the same period. Our net loss for the year ended December 31, 2020 was $60.1 million, a 79% decline from losses of $282.7 million in the year ended December 31, 2019. Our net loss for the year ended December 31, 2019 was $282.7 million, a 93% increase from losses of $146.5 million for the year ended December 31, 2018. Our net loss for the six months ended June 30, 2021 was $314.1 million compared to losses of $24.0 million in the six months ended June 30, 2020.
Network Feedback Loop
We believe our growing network of community-based physicians at the national, regional and local level drives continuous improvement of our platform, enables best practices sharing and innovation and accelerates the growth of independent physicians joining the agilon network. Many of our physician partners and individual physicians have joined our platform based on references from existing like-minded physician partners, and the credibility and quality of our physician partners is consistently cited as a deciding factor for joining the platform.
Differentiated Physician and Patient Experience
We designed our platform, partnership and network approach with the goal of delivering a superior and continuously improving experience to our physician partners and their patients. We believe our model enables PCPs to unlock the value in a Medicare-centric, globally capitated line of business while remaining independent. Subsequent to joining our platform, our PCPs have increased their average annual income by successfully managing healthcare costs and improving health outcomes. We believe that our PCPs’ engagement is manifested through deeper relationships with patients and results in a greater opportunity to improve our members’ health. For example, in 2019, 78% of our members attributed to our live anchor physician groups attended their wellness visits, compared to the FFS national average CMS Annual Wellness Visit completion rate of 35% in 2019.
Mission-Driven Team and Culture
We have a world-class management team, which is differentiated by its breadth and depth of expertise in healthcare. Our senior management team has an average of more than 15 years of experience in the healthcare industry and has significant exposure across all components of the payment and delivery continuum. We believe our management team’s collective robust, diverse and complementary exposure to different facets of the healthcare industry positions our team to navigate and enable the shift to a physician-driven Total Care Model.
Our team is united by our mission of being the trusted long-term partner to community-based physicians and driven by our vision of transforming healthcare at the community level through exceptional patient-physician relationships.
12
Our Growth Strategy
We intend to utilize our competitive strengths and capitalize on favorable industry trends to increase the number of regional hubs, local markets within those hubs and ultimately physicians and members we serve. The key elements of our growth include:
The power of our model at work: Case study of Ohio expansion
Establish New Regional Hubs across the Country
We believe we are well-positioned to expand the number of our physician partners nationally across a diverse set of geographies. We have developed sophisticated business development capabilities and have established a robust pipeline with an array of physician groups across the country. We are also benefitting from the network effect of our growing network of like-minded physician partners.
Access the Large and Embedded Membership Opportunity within Our Existing Networks
We estimate that the number of Medicare FFS patients, Medicare-eligible patients and patients expected to age into Medicare over the next five years in our existing physician partner patient populations is approximately 375,000. As these patients enroll in MA through our payors, they become attributed to our platform with little incremental cost to us.
Facilitate and Capitalize on the Growth of Our Physician Partners
As the PCP base of our physician partners grows, our physician partners are better positioned to serve a growing Medicare population.
13
Expand into Adjacent Geographies
Once we establish a presence in a geography, we have the opportunity to accelerate the addition of new physician partnerships in the region. We leverage our multi-payor MA risk platform and regional infrastructure to efficiently grow into adjacent geographies. Of our estimated 2020 addressable market, $80 billion is concentrated in states in which we currently have a physician partner or a signed letter of intent with a physician group as of January 2021.
Increase Quality and Improve Health Outcomes to Drive Profitability
We believe our Total Care Model drives increased profitability per member over time through increasing quality and improving health outcomes. As members and physicians mature on our platform, we increasingly recognize the benefits of improved quality of care and effectively managed healthcare costs. We believe there is significant opportunity to improve profitability per member over the course of our long-term partnerships by improving healthcare outcomes and effectively managing costs, with 70% of our MA members as of December 31, 2020 on our platform for fewer than three years.
Demonstrate Operating Leverage
We expect to drive increasing profitability by leveraging both our market-level operating costs and centralized infrastructure, as we manage increased MA and DCE membership on our platform that has maturing medical margin over time.
Capitalize on Emerging Value-Based Care Opportunities
We believe we are positioned to capitalize on the shift from FFS towards a Total Care Model across the broader healthcare system. Through five currently approved DCEs, which encompass more than 500 of our existing PCPs, we provide care to over 50,000 traditional Medicare members in seven geographies. For the year ended December 31, 2020, our DCEs did not contribute to our revenue.
Impact of
COVID-19
Pandemic on Our BusinessCommencing in March 2020, we implemented various measures to protect the health and safety of our employees, physicians and members in connection with the
COVID-19
pandemic. These measures included relocating employees to home-based work settings, coordinating with physician partners to accelerate telehealth activity and coordinating daily huddles for physicians and team members on clinical and operational impacts of COVID, which included participation by nationally-recognized experts in infectious disease and epidemiology. Despite the challenges and uncertainties created by theCOVID-19
pandemic, we believe that our response to the pandemic has reinforced the value of our platform, long-term partnership model and network.Throughout most of 2020, our members incurred lower healthcare costs than we would have otherwise expected, which resulted in lower medical services expenses incurred. These costs may be incurred at future points in time and it is possible that the deferral of healthcare services could cause additional health problems in our existing members, which could increase our costs in the future. Additionally, our members’ risk adjustment factors, which are reflective of documented clinical conditions during 2020 and which impact our 2021 revenues, may be lower than would have occurred without the impact of the
COVID-19
pandemic, resulting from members’ avoidance or deferral of care during 2020. We cannot accurately estimate the net ultimate impact, positive or negative, to revenue or medical services expense at this time.Also see “Risk Factors—Risks Related to Our Business— The spread of, and response to, the novel coronavirus, or
COVID-19,
underscores certain risks we face and the rapid development and fluidity of this14
situation precludes any prediction as to the ultimate adverse impact to us of COVID-19,” “Management’s Discussion and Analysis of Financial Condition and Results of Operations—Impact of COVID-19” and “Business—Impact of COVID-19 Pandemic on Our Business.”
Company History
The Company is ultimately controlled by an investment fund associated with Clayton Dubilier & Rice, LLC (“CD&R”), a private equity firm headquartered in New York, NY. Our business was formed in 2016 through the completion of two acquisitions by CD&R: In July 2016, Primary Provider Management Company, Inc. (“PPMC”) was acquired, which, together with its affiliated independent practice associations (“California IPAs”), operated in Southern California. Also in July 2016,
Cyber-Pro
Systems, Inc. (“CPS”) was acquired, which, together with its subsidiaries and affiliates, operates a network of contracted physicians in Hawaii and provides software and medical billing solutions to independent healthcare organizations. During 2020, we implemented a plan to divest all of our California operations, which includes the entirety of our Medicaid line of business, via three separate transactions with different parties. In February 2021, we completed the divestiture of our California operations. However, we will continue to be responsible for any liabilities arising from certain of the divested businesses which were incurred prior to the applicable closing date. See “Management’s Discussion and Analysis of Financial Condition and Results of Operations—California Operations” for additional information.agilon health, inc., the issuer in this offering, was incorporated in the State of Delaware in April 2017 in connection with our entry into a physician partnership with Central Ohio Primary Care Physicians, Inc. (“COPC”), a physician-owned medical group, to establish a Medicare-centric, globally capitated line of business in the Columbus, Ohio region. Since that time, we have expanded and entered into new partnerships in Austin, Akron, Pittsburgh, North Carolina, Hartford, Buffalo, Toledo, Dayton and Southeast Ohio. In March 2021, we changed our name from Agilon Health Topco, Inc. to agilon health, inc., and changed the name of our subsidiary, agilon health, inc., to agilon health management, inc. On April 19, 2021, we completed the initial public offering (“IPO”) of 53,590,000 shares of common stock at a price of $23.00 per share. The net proceeds of the offering were approximately $1.2 billion, after underwriting fees and other offering expenses.
Our Majority Shareholder and Organizational Structure
Clayton, Dubilier
& Rice, LLC.
After the completion of this offering, we expect that CD&R Vector Holdings, L.P. (the “CD&R Investor”), which is owned by investment funds managed by, or affiliated with, CD&R, will hold approximately % of our common stock (or approximately % if the underwriters exercise in full their option to purchase additional shares). As a result, we expect to continue to be a “controlled company” within the meaning of the NYSE rules following the completion of this offering. This election will allow us to continue to rely on exemptions from certain corporate governance requirements otherwise applicable to NYSE-listed companies. See “Management—Corporate Governance.”
15
The following chart presents an overview of our ownership and organizational structure, after giving effect to this offering. For additional information with respect to our ownership structure, see “Principal Stockholders”:
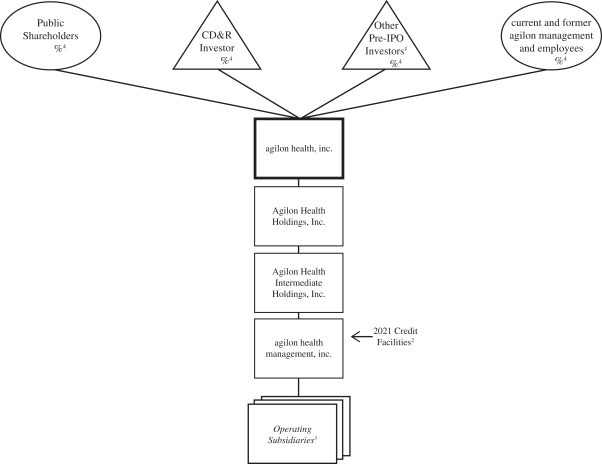
| 1 | Includes COPC, certain private investment funds and our physician partners with whom we have physician partner group equity agreements. |
| 2 | Includes indebtedness related to the 2021 Credit Facilities (as defined herein), including term loan indebtedness, revolver indebtedness and letters of credit. On February 18, 2021, we, through agilon health management, inc. (“agilon management”), entered in the 2021 Secured Credit Agreement (as defined herein) to refinance our outstanding indebtedness under the Credit Facilities (as defined herein). See “Description of Certain Indebtedness.” |
| 3 | Operating subsidiaries include wholly-owned RBEs, independent practice associations and other immaterial subsidiaries, which have been omitted from this chart for convenience. |
| 4 | Ownership percentages assume no exercise of the underwriters option to purchase up to additional shares of common stock in the offering, and are determined as described in “—The Offering.” |
Our Corporate Information
agilon health, inc. is a Delaware corporation. Our principal executive offices are located at 1 World Trade Center, Suite 2000, Long Beach, CA 90831, and our telephone number is (562). None of the information contained on, or that may be accessed through, our website or
256-3800.
Our website iswww.agilonhealth.com
16
any other website identified herein is part of, or incorporated into, this prospectus, and you should not rely on any such information in connection with your decision to invest in our common stock.
Summary Risk Factors
Our business is subject to a number of risks, including risks that may prevent us from achieving our business objectives or may adversely affect our business, financial condition, cash flows and results of operations that you should consider before making a decision to invest in our common stock. These risks are discussed more fully under the caption “Risk Factors.” These risks include, but are not limited to, the following:
| • | our history of net losses and the expectation that our expenses will increase in the future; |
| • | failure to identify and develop successful new geographies, physician partners and payors or execute upon our growth initiatives; |
| • | success in executing our operating strategies or achieving results consistent with our historical performance; |
| • | significant reductions in membership; |
| • | challenges for our physician partners in the transition to a Total Care Model; |
| • | inaccuracies in the estimates and assumptions we use to project the size, revenue or medical expense amounts of our target geographies, our members’ risk adjustment factors, medical services expense, incurred but not reported claims and earnings pursuant to payor contracts; |
| • | the spread of, and response to, the novel coronavirus, or COVID-19, and the inability to predict the ultimate impact on us; |
| • | dependence on a limited number of key payors, including for membership attribution and assignment, data and reporting accuracy and claims payment; |
| • | dependence on physician partners and other providers to effectively manage the quality and cost of care and perform obligations under payor contracts, which contracts generally provide that if the cost of care exceeds the corresponding capitation revenue we receive from payors in respect of attributed members we may realize operating deficits, which are typically not capped, and could lead to substantial losses; |
| • | dependence on physician partners to accurately, timely and sufficiently document their services and potential False Claims Act or other liability if any diagnosis information or encounter data are inaccurate or incorrect; |
| • | reductions in reimbursement rates or methodology applied to derive reimbursement from, or discontinuation of, federal government healthcare programs, from which we drive substantially all of our total revenue; |
| • | statutory or regulatory changes, administrative rulings, interpretations of policy and determinations by intermediaries and governmental funding restrictions, and any impact on government funding, program coverage and reimbursements; |
| • | the impact on our revenue of CMS modifying the methodology used to determine the revenue associated with MA members; |
| • | ability to comply with federal, state and local regulations and laws we are subject to, or to adapt to changes in or new regulations or laws, including as such regulations and laws that relate to our physician alignment strategies with our physician partners or the corporate practice of medicine; |
| • | our physician partners’ compliance with federal and state healthcare fraud and abuse laws and regulations; and |
| • | the influence of the CD&R Investor and our status as a “controlled company.” |
17
THE OFFERING
Common stock offered by the selling stockholders | shares. |
Common stock to be outstanding after this offering | 390,882,560 shares. |
Option to purchase additional shares | The underwriters also may purchase up to additional shares from the selling stockholders at the initial offering price less the underwriting discounts and commissions, within 30 days from the date of this prospectus. |
IPO lock-up release; new lock-up agreement
Use of proceeds | We will not receive any of the proceeds from the sale of our common stock by the selling stockholders in this offering, including any shares the selling stockholders may sell pursuant to the underwriters’ option to purchase additional shares of our common stock. |
Dividend policy | We do not currently anticipate paying dividends on our common stock for the foreseeable future. Any future determination to pay dividends on our common stock will be subject to the discretion of our board of directors and depend upon various factors. See “Dividend Policy.” |
Risk Factors | Our business is subject to a number of risks that you should consider before making a decision to invest in our common stock. See “Risk Factors.” |
NYSE symbol | “AGL”. |
18
The number of shares of our common stock to be outstanding immediately following this offering is based on 390,882,560 shares outstanding as of June 30, 2021, and excludes:
| • | 41,197,388 shares of common stock issuable upon exercise of options outstanding as of June 30, 2021 at a weighted average exercise price of $4.40 per share; |
| • | 28,453,653 shares of common stock reserved for future issuance under our Omnibus Incentive Plan and ESPP; and |
| • | 1,112,131 shares of our common stock subject to outstanding unvested RSUs granted to directors and employees. |
Unless otherwise indicated, all information in this prospectus assumes no exercise by the underwriters of their option to purchase additional shares.
19
SUMMARY HISTORICAL CONSOLIDATED FINANCIAL DATA
The following tables set forth our summary historical consolidated financial data derived from our consolidated financial statements as of the dates and for each of the periods indicated. The summary historical consolidated financial data as of and for the years ended December 31, 2020, 2019, and 2018 are derived from our audited consolidated financial statements included elsewhere in this prospectus. The summary historical consolidated financial data as of and for the three and six months ended June 30, 2021 and 2020 are derived from our unaudited interim condensed consolidated financial statements included elsewhere in this prospectus. Our historical results are not necessarily indicative of the results to be expected for any future period.
You should read this summary historical consolidated financial data in conjunction with “Management’s Discussion and Analysis of Financial Condition and Results of Operations” and our consolidated financial statements included elsewhere in this prospectus.
Six Months Ended June 30, | Three Months Ended June 30, | Year Ended December 31, | ||||||||||||||||||||||||||
| ( dollars in thousands | 2021 | 2020 | 2021 | 2020 | 2020 | 2019 | 2018 | |||||||||||||||||||||
Consolidated Statement of Operations Data: | ||||||||||||||||||||||||||||
Revenues: | ||||||||||||||||||||||||||||
Medical services revenue | $ | 910,090 | $ | 582,309 | $ | 497,678 | $ | 292,495 | $ | 1,214,270 | $ | 788,566 | $ | 466,612 | ||||||||||||||
Other operating revenue | 1,970 | 2,333 | 1,278 | 1,099 | 4,063 | 5,845 | 8,215 | |||||||||||||||||||||
Total revenues | 912,060 | 584,642 | 498,956 | 293,594 | 1,218,333 | 794,411 | 474,827 | |||||||||||||||||||||
Expenses: | ||||||||||||||||||||||||||||
Medical services expense | 802,837 | 468,016 | 442,483 | 220,363 | 1,021,877 | 725,374 | 412,669 | |||||||||||||||||||||
Other medical expenses | 57,355 | 53,187 | 33,694 | 34,761 | 102,306 | 40,526 | 34,092 | |||||||||||||||||||||
General and administrative | 79,318 | 60,832 | 43,013 | 34,248 | 137,292 | 122,832 | 88,745 | |||||||||||||||||||||
Stock-based compensation expense (1) | 276,020 | 3,176 | 274,548 | 2,155 | ||||||||||||||||||||||||
Depreciation and amortization | 7,008 | 6,517 | 3,581 | 3,319 | 13,531 | 12,253 | 11,385 | |||||||||||||||||||||
Total expenses | 1,222,538 | 591,728 | 797,319 | 294,846 | 1,275,006 | 900,985 | 546,891 | |||||||||||||||||||||
Income (loss) from operations | (310,478 | ) | (7,086 | ) | (298,363 | ) | (1,252 | ) | (56,673 | ) | (106,574 | ) | (72,064 | ) | ||||||||||||||
Other income (expense): | ||||||||||||||||||||||||||||
Other income (expense), net | 4,303 | 48 | 2,967 | (74 | ) | 2,465 | 955 | 611 | ||||||||||||||||||||
Interest expense | (4,439 | ) | (4,229 | ) | (1,498 | ) | (2,080 | ) | (8,135 | ) | (9,068 | ) | (9,839 | ) | ||||||||||||||
Income (loss) before income taxes | (310,614 | ) | (11,267 | ) | (296,894 | ) | (3,406 | ) | (62,343 | ) | (114,687 | ) | (81,292 | ) | ||||||||||||||
Income tax benefit (expense) | (451 | ) | (39 | ) | (435 | ) | (39 | ) | (865 | ) | 232 | 113 | ||||||||||||||||
Income (loss) from continuing operations | (311,065 | ) | (11,306 | ) | (297,329 | ) | (3,445 | ) | (63,208 | ) | (114,455 | ) | (81,179 | ) | ||||||||||||||
Discontinued operations: | ||||||||||||||||||||||||||||
Income (loss) before impairments, gain (loss) on sales and income taxes | (2,898 | ) | (12,429 | ) | (1,547 | ) | (4,340 | ) | (20,049 | ) | (86,108 | ) | (32,132 | ) | ||||||||||||||
Impairments | — | — | — | — | — | (98,343 | ) | (40,794 | ) | |||||||||||||||||||
Gain (loss) on sales of assets, net | — | — | — | — | 20,401 | — | — | |||||||||||||||||||||
Income tax benefit (expense) | (129 | ) | (275 | ) | (65 | ) | (126 | ) | 2,804 | 16,166 | 7,588 | |||||||||||||||||
Total discontinued operations | (3,027 | ) | (12,704 | ) | (1,612 | ) | (4,466 | ) | 3,156 | (168,285 | ) | (65,338 | ) | |||||||||||||||
Net income (loss) | (314,092 | ) | (24,010 | ) | (298,941 | ) | (7,911 | ) | (60,052 | ) | (282,740 | ) | (146,517 | ) | ||||||||||||||
Noncontrolling interests’ share in (earnings) loss | 169 | — | 96 | — | — | 152 | (409 | ) | ||||||||||||||||||||
Net income (loss) attributable to common shares | $ | (313,923 | ) | $ | (24,010 | ) | $ | (298,845 | ) | $ | (7,911 | ) | $ | (60,052 | ) | $ | (282,588 | ) | $ | (146,926 | ) | |||||||
| (1) | For annual periods prior to 2021, stock-based compensation expense is included in general and administrative expenses. |
20
June 30, 2021 | December 31, 2020 | December 31, 2019 | ||||||||||
Consolidated Balance Sheet Data (at period end): | ||||||||||||
Cash and cash equivalents | $ | 1,109,372 | $ | 106,795 | $ | 123,633 | ||||||
Total assets | 1,701,734 | 446,361 | 402,794 | |||||||||
Total liabilities | 551,456 | 421,591 | 353,822 | |||||||||
Contingently redeemable common stock | — | 309,500 | 281,000 | |||||||||
Total stockholders’ equity (deficit) | 1,150,278 | (284,730 | ) | (232,028 | ) | |||||||
Six Months Ended June 30, | Year Ended December 31, | |||||||||||||||||||
| ( dollars in thousands | 2021 | 2020 | 2020 | 2019 | 2018 | |||||||||||||||
Consolidated Statement of Cash Flows Data: | ||||||||||||||||||||
Cash flows from: | ||||||||||||||||||||
Operating activities | $ | (80,119 | ) | $ | (35,498 | ) | $ | (53,204 | ) | $ | (103,861 | ) | $ | (67,531 | ) | |||||
Investing activities | (76,338 | ) | (2,351 | ) | $ | 22,066 | $ | (5,060 | ) | $ | (7,970 | ) | ||||||||
Financing activities | 1,143,077 | 31,522 | $ | 24,621 | $ | 176,298 | $ | 84,743 | ||||||||||||
Six Months Ended June 30, | Three Months Ended June 30, | Year Ended December 31, | ||||||||||||||||||||||||||
| ( dollars in thousands | 2021 | 2020 | 2021 | 2020 | 2020 | 2019 | 2018 | |||||||||||||||||||||
Other Financial Data: | ||||||||||||||||||||||||||||
Medical margin (1) | $ | 107,253 | $ | 114,293 | $ | 55,195 | $ | 72,132 | $ | 192,393 | $ | 63,192 | $ | 53,943 | ||||||||||||||
Network contribution (2) | 54,436 | 63,250 | 24,294 | 38,510 | 99,016 | 25,598 | 22,083 | |||||||||||||||||||||
Adjusted EBITDA (3) | 2,088 | 16,888 | (1,674 | ) | 14,311 | 5,827 | (56,711 | ) | (32,240 | ) | ||||||||||||||||||
| (1) | Medical margin represents medical services revenue after deducting medical services expense. |
| (2) | Network contribution is a non-GAAP financial measure. Network contribution represents medical services revenue less the sum of: (i) medical services expense and (ii) other medical expenses excluding costs incurred in implementing geographies. Income (loss) from operations is the most directly comparable U.S. generally accepted accounting principles (“GAAP”) measure to network contribution. See “Management’s Discussion and Analysis of Financial Condition and Results of Operations—Non-GAAP Financial Measures” for more information regarding network contribution and a reconciliation to income (loss) from operations. |
| (3) | Adjusted EBITDA is a non-GAAP financial measure. We define Adjusted EBITDA as net income (loss) adjusted to exclude: (i) income (loss) from discontinued operations, net of income taxes, (ii) interest expense, (iii) income tax expense (benefit), (iv) depreciation and amortization expense, (v) geography entry costs, (vi) share-based compensation expense, (vii) severance and related costs and (viii) certain other items that are not considered by us in the evaluation of ongoing operating performance. Net income (loss) is the most directly comparable GAAP measure to Adjusted EBITDA. See “Management’s Discussion and Analysis of Financial Condition and Results of Operations—Non-GAAP Financial Measures” for more information regarding Adjusted EBITDA and a reconciliation to net income (loss). |
21
RISK FACTORS
Risks Related to Our Business
We have a history of net losses, we anticipate increasing expenses in the future and we may not achieve or maintain profitability.
We have incurred significant net losses in the past, including net losses (including discontinued operations) of $314.1 million for the six months ended June 30, 2021, $60.1 million for the year ended December 31, 2020, $282.7 million for the year ended December 31, 2019, and $146.5 million for the year ended December 31, 2018. As a result of these losses, we had accumulated deficits of $865.1 million as of June 30, 2021, $551.2 million as of December 31, 2020 and $491.1 million as of December 31, 2019. We expect that our expenses will increase substantially in the foreseeable future and our losses will continue, including for the year ended December 31, 2021, in part as we invest in growing our business, expanding our management team, building relationships with physician partners and payors, developing new services and complying with the requirements associated with being a public company. These expenses may prove to be more significant than we currently anticipate, and we may encounter unforeseen expenses, difficulties, complications, delays and other unknown factors that may adversely affect our business. We may not succeed in sufficiently increasing our revenue to offset these expenses. Consequently, we may not be able to achieve and maintain profitability for the current or any future fiscal year. Our prior losses and potential for future losses have had and will continue to have an adverse effect on our stockholders’ equity and working capital.
Any failure by us to identify and develop successful new geographies, physician partners and payors and to successfully execute upon our growth initiatives may have a material adverse effect on our business, financial condition, cash flows and results of operations.
Our business depends on our ability to identify and develop successful geographies and relationships with physician partners and payors, and to successfully execute upon our growth initiatives to increase the profitability of our physician partners. In order to pursue our strategy successfully, we must effectively implement our platform, partnership and network model, including identifying suitable candidates and successfully building relationships with and managing integration of new physician partners and payors. We contract with a limited number of physician partners and rely on physician partners within each geography. Our growth initiatives in our existing geographies depend, in part, on our physician partners’ ability to grow their practices through the addition of PCPs to increase their capacity to service Medicare patients, and to effectively meet increased patient demand. Our physician partners may encounter difficulties in recruiting additional PCPs to their practices due to many factors, including significant competition in their geographies. Accordingly, the loss or dissatisfaction of any physician partners, our inability to recruit and integrate physician partners into our model, or the failure of our physician partners to recruit additional PCPs or manage and scale capacity to timely meet patient demand, could substantially harm our brand and reputation, impact our competitiveness, inhibit widespread adoption of our platform, partnership and network model and impair our ability to attract new physician partners and maintain existing physician partnerships, both in new geographies and in geographies in which we currently operate, which could have a material adverse effect on our business, financial condition, cash flows and results of operations.
Further, our growth strategy depends, in part, on securing and integrating new high-caliber physician partners and expanding into new geographies in which we have little or no operating experience. Integration and other risks can be more pronounced for larger and more complicated relationships or relationships outside of our core business space, or if multiple relationships are pursued simultaneously. Additionally, new geographies may be characterized by stakeholder preferences for, and experience with, a Total Care Model, rates of MA enrollment, MA reimbursement rates, payor concentration and rates of unnecessary variability in and utilization of medical care that differ from those in the geographies where our existing operations are located. Likewise, new geographies into which we seek to expand may have laws and regulations that differ from those applicable to our current operations. As an immature and rapidly growing company, we may be unfamiliar with the
22
regulatory requirements in each geography that we enter, and we may be forced to incur significant expenditures to ensure compliance with requirements to which we are subject. If we are unable or unwilling to incur such costs, our growth in new geographies may be less successful than in our current geographies.
Further, our growth to date has increased the significant demands on our management, operational and financial systems, infrastructure and other resources. We must continue to improve our existing systems for operational and financial management, including our reporting systems, procedures and controls. These improvements could require significant capital expenditures and place increasing demands on our management. We may not be successful in managing or expanding our operations or in maintaining adequate financial and operating systems and controls. If we do not successfully manage these processes, our business, financial condition, cash flows and results of operations could be harmed.
We may be unsuccessful in executing our operating strategies, or we may not achieve results consistent with our historical performance.
Our success is dependent on our ability to successfully execute upon defined operating strategies in our existing and future geographies. Such strategies include successfully growing our geographies through the addition of PCPs and our physician partners’ capacity to serve new members, providing medical services for our members at appropriate levels of utilization and cost, and generating medical services revenue through appropriate and effective contracting strategies with our MA payors. We may not be successful in executing upon these strategies, or we may fail to implement such strategies in future markets as effectively as with our initial markets. The failure to successfully execute upon such strategies or to produce results consistent with our historical results or the financial and operational models used in the analysis of our potential relationships may result in an inability to grow our business; may cause ongoing operating losses, asset write-offs, restructuring costs or other expenses; and may have a material adverse effect on our business, financial condition, cash flows and results of operations.
Further, as a rapidly growing and relatively immature company with a limited operating history, it is uncertain whether our platform, partnership and network model will achieve and sustain high levels of demand, physician and payor acceptance and market adoption. Due to our limited operating history, it is also difficult for us to evaluate our business compared to prior periods. If we do not develop, if we develop more slowly than we expect, if we encounter negative publicity or if our value propositions for physician partners, patients and payors do not drive sufficient member growth, the growth of our business will be harmed. Our success will depend to a substantial extent on our ability to demonstrate the value of our platform, partnership and network model to physicians and payors. Our ability to replicate the success of our model also enables us to attract and retain skilled physician partners. Accordingly, if we are unable to effectively manage our growth and replicate the success of our platform, partnership and network model in new geographies and with new partners, our business, financial condition, cash flows and results of operations could be harmed.
Amounts of medical expenses which are incurred on behalf of our members may exceed the amount of medical revenues we receive to provide care for such members.
Under our agreements with our payors, we receive a PMPM-based capitation payment, and we assume financial risk for the expense of providing medical services on behalf of our physician partners. To the extent that utilization of medical services or the cost of providing such services increases beyond our expectations, the total cost to provide medical services to our members may exceed the corresponding amount of revenue we receive, which may result in losses and adversely impact our business, financial condition, cash flows and results of operations.
Additionally, factors which impact medical costs incurred by our members, and medical expenses we incur, may be subject to fluctuations which we may not be able to control. Such factors include the following:
| • | Changes to the Medicare fee schedule or other rate schedules which serve as the basis for payments issued to hospitals, specialty and ancillary physicians and other providers; |
23
| • | Contractual rates paid to hospitals, specialty and ancillary physicians and other providers; |
| • | The utilization rates of healthcare services, including inpatient hospitalization, by our members; |
| • | Changes to member benefit levels established annually by payors; and |
| • | The utilization rate and cost of pharmaceuticals or specialty drugs utilized by our members. |
Fluctuations in the magnitude of the hospital and physician network, including the discontinuation of a hospital or specialty or ancillary physician’s participation in our MA payors’ provider network, could adversely impact our business, financial condition, cash flows and results of operations.
As we expand into new geographies, we may be unable to secure contracts with MA payors, or such contracts may be established at less favorable financial terms than are necessary to meet our financial targets.
As we enter into new geographies, potential physician partners will typically provide care to members affiliated with one or more MA payors, in a structure other than a Total Care Model. Our ability to successfully operate in a market is dependent upon our ability to enter into contractual relationships with MA payors which have an existing presence in that market under a global risk structure. MA payors may take the position that it is not in their strategic or financial interests to enter into a contract with us, or they may have already established exclusive relationships with other value-based care providers or affiliates in a geography and ,therefore, elect to not enter into a similar arrangement with us. Therefore, we may be unsuccessful in executing contractual relationships with MA payors, or such contracts may be established at financial terms which result in lower revenues or higher costs than we project or which are necessary to generate profits in a given geography. To the extent we are unsuccessful in establishing contractual relationships with MA payors in new geographies, or such relationships are established at less favorable terms than we project, we may not be able to successfully launch into a given geography, or the membership or revenue levels we are able to attain will be lower than our projections.
We incur startup costs during the initial stages of development of our physician partner relationships and program initiatives, and if we are unable to maintain and grow these physician partner relationships or program initiatives over time, we may not recover these costs.
We devote resources to the establishment of new physician partner relationships, including costs relating to physician recruiting to enhance access and support growth of the network, physician incentives to support the transition to a Total Care Model and operational support. Our startup investment in new physician partners can be significant and the associated revenue must be earned and sustained over time in order for us to recoup these costs. As a result, as our business grows, our physician partnership startup costs could outpace our buildup of recurring revenue if we do not achieve economies of scale, and we may be unable to achieve profitability until our revenues associated with new partnerships are more mature. We may never recoup our startup costs in a physician partner relationship, including as a result of such physician partner’s difficulty transitioning to a Total Care Model. If we fail to achieve appropriate economies of scale, if we fail to manage or anticipate the evolution of the Total Care Model or if we fail to raise necessary capital to fund our startup costs, our business, financial condition, cash flows and results of operations could be materially adversely affected.
We also devote resources to establishing program initiatives to ensure a successful transition to a Total Care Model for members, physician partners and payors. Establishment of these program initiatives requires investments that may not be recouped. For example, investment in preventive care and incentivizing physician partners to complete annual wellness visits may increase our total medical services expense, particularly in the short term, and may fail to generate expected cost savings in the long term. If we fail to realize quality of care outcomes and projected revenues or cost savings due to effectively managed healthcare costs with these program initiatives, our business, financial condition, cash flows and results of operations could be materially adversely affected.
24
We may require substantial additional capital to support our business in the future, and this capital might not be available on acceptable terms, or at all.
Our operations have consumed substantial amounts of cash since inception, and we expect to spend substantial amounts of cash for the foreseeable future. As of June 30, 2021, December 31, 2020 and December 31, 2019, our cash and cash equivalents were $1,109.4 million, $106.8 million and $123.6 million, respectively. On April 19, 2021, we completed our initial public offering and received net proceeds of approximately $1.2 billion, after underwriting discounts and commissions and other offering expenses. If our cash and cash equivalents and any cash generated from operations are not sufficient to meet our future cash requirements, we will need to access additional capital to fund our operations and our continued growth and expansion.
We may seek to raise capital by, among other things, issuing additional shares of our common stock or other equity securities, issuing debt securities or borrowing funds under a credit facility. In the past, the securities and credit markets have experienced extreme volatility and disruption, which has increased due to the effects of COVID-19. The availability of credit, from virtually all types of lenders, has at times been limited. In the event we need access to additional capital to pay our operating expenses, fund subsidiary surplus requirements, make payments on or refinance our indebtedness, pay capital expenditures, or fund acquisitions, our ability to obtain such capital may be limited and the cost of any such capital may be significant, particularly if we are unable to access our Credit Facilities.
Our access to additional financing will depend on a variety of factors such as prevailing economic and credit market conditions, the general availability of credit, the overall availability of credit to our industry, our credit ratings and credit capacity and perceptions of our financial prospects. Similarly, our access to funds may be impaired if regulatory authorities or rating agencies take negative actions against us. If one or any combination of these factors were to occur, our internal sources of liquidity may prove to be insufficient, and in such case, we may not be able to successfully obtain sufficient additional financing on favorable terms, within an acceptable time, or at all. Financings, if available, may be on terms that restrict our operational flexibility, dilute the economic or voting rights of our stockholders or reduce the market price of our common stock. If we require new sources of financing but they are insufficient or unavailable, we would be required to modify our operating plans to take into account the limitations of available funding, which would harm our ability to maintain or grow our business.
Significant reduction in our membership could have an adverse effect on our business, financial condition, cash flows and results of operations.
A significant reduction in membership could adversely affect our business, financial conditioncash flows and results of operations because our payor contracts compensate us on a
,
per-member
basis. Many factors that could cause such a reduction are outside our control.Factors that could contribute to a reduction in membership include:
| • | failure to obtain new physician partners or members or to retain existing physician partners or members; |
| • | decision by a payor to not renew the existing contractual agreement upon termination of such contract; |
| • | low quality of care by our physician partners, including as a result of our failure to provide tools and information to deliver high-quality care; |
| • | alternative care opportunities that are more attractive than those provided by our physician partners; |
| • | premium increases, benefit revisions or other similar changes, which cause our current payor relationships to be less attractive to members than other alternatives, including traditional Medicare or MA plans with which we do not maintain a relationship; |
25
| • | negative publicity, through social media, news coverage or otherwise, related to us, our physician partners, payors or MA; |
| • | failure of our payors to maintain their annual ratings awarded by CMS to health plans which measure the quality of health services received by beneficiaries enrolled in MA based on various calculated quality metrics (“STAR ratings”), which leads to members disenrolling from such payors; and |
| • | federal and state regulatory changes. |
We contract with a limited number of payors, and our membership is dependent on such payors attracting and retaining members. In addition, if a payor fails to renew its contract with us or members disenroll from such payor, the members such payor attributes to our platform could transition to another payor which is not on our platform, which could have a material adverse effect on our business, financial condition, cash flows and results of operations. We may also fail to address factors within our control that could contribute to a reduction in enrollment, including providing our physician partners the tools and information to provide high-quality care.
The transition to a Total Care Model may be challenging for physician partners.
The transition to a Total Care Model may be challenging for our physician partners, and fully capitated or other provider-risk arrangements have had a history of financial challenges for physicians. It may take time for physician partners to acclimate to a capitation model, and some physician partners may not be successful at transitioning to a Total Care Model. If we are not able to attract or retain physician partners who are successful at transitioning to a Total Care Model, our business, financial condition, cash flows and results of operations could be materially adversely affected.
If the estimates and assumptions we use to project the size, revenue or medical expense amounts of our target geographies are inaccurate, our future growth rate may be impacted and we may generate losses in such markets, or we may fail to attain financial performance targets.
We often do not have access to reliable historical data regarding the size, revenue or medical expense levels of our target geographies or potential physician partners. As a result, our market opportunity estimates and financial forecasts developed as we enter into a new geography are subject to significant uncertainty and are based on assumptions and estimates that may not prove to be accurate. The estimates and forecasts in this prospectus relating to the size and expected growth of the market for our services and the estimates of our market opportunity may prove to be inaccurate.
Principal assumptions relating to our market opportunity include estimates of the total number and average length of relationships between MA patients and their physicians, historical MA patient growth rates, amount of revenue and medical expenses associated with MA members expected to be attributed to our physician partners and historical experience that physician partners have with a Total Care Model. Our opportunity is based on the assumption that our platform, partnership and network model will be more attractive to potential physician partners than competing options. However, potential physician partners may elect to pursue a different strategic option.
The spread of, and response to, the novel coronavirus, or
COVID-19,
underscores certain risks we face and the rapid development and fluidity of this situation precludes any prediction as to the ultimate adverse impact to us ofCOVID-19.
COVID-19
continues to spread in the United States and throughout the world.COVID-19
and the efforts to contain the outbreak have led to significant economic disruption, including extreme volatility in financial markets, reduced economic activity and a sharp increase in unemployment claims, as well as disruption in some of our physician partners’ businesses. The spread ofCOVID-19
underscores certain risks we face in our business described herein.26
Governmental andand physical distancing orders and other restrictions on movement and economic activity intended to reduce the spread of
non-governmental
organizations may not effectively combat the spread and severity ofCOVID-19,
increasing the potential for harm for our members. If the spread ofCOVID-19
is not contained, the medical services revenue we receive may prove to be insufficient to cover the cost of healthcare services delivered to our enrolled members, which could increase significantly as a result of higher utilization rates of medical facilities and services and other increases in associated medical claims and related costs. Over time, we may also experience increased costs or decreased revenues if, as a result of our enrolled members being unable to see their PCPs due to actions taken to mitigate the spread ofCOVID-19,
we are unable to implement clinical initiatives to manage healthcare costs and chronic conditions of our enrolled members and appropriately document their risk profiles. In addition, the clinical disease burdens of our members may increase over time to the extent that members have received reduced preventative care to manage their existing clinical conditions, and the amount of medical care which has been deferred during the pandemic may exceed our expectations. Furthermore, we may experience reduced revenues as a result of changes to future capitation payment rates if Medicare members use fewer services due toCOVID-19.
For example, restrictions imposed as a result ofCOVID-19
may continue to decrease utilization of preventative ornon-emergency
healthcare, significantly decreasing provider costs. Should CMS adjust reimbursement rates based on margins during the pendency ofCOVID-19,
our revenues in future periods and financial results may be materially adversely affected. Such measures and any further steps taken by us, or governmental action, to expand or otherwise modify the services delivered to our enrolled members, provide relief for the healthcare provider community, or in connection with the relaxation ofstay-at-home
COVID-19,
including enhanced measures to implement widespread testing as a component of lifting these measures, could adversely impact our business, financial condition, cash flows and results of operations.The spread of
COVID-19,
or actions taken to mitigate this spread, including the efficacy, ability to administer or extent of adoption of COVID-19 vaccines, could have material and adverse effects on our ability to operate effectively, including as a result of the complete or partial closure of facilities or labor shortages. Disruptions in public and private infrastructure, including communications, financial services and supply chains, could materially and adversely disrupt our normal business operations. We have transitioned a significant subset of our employee population to a remote work environment in an effort to mitigate the spread ofCOVID-19,
which could exacerbate certain risks to our business, including an increased demand for information technology resources, increased risk of phishing and other cybersecurity attacks as well as other risks to the privacy and confidentiality of data, and increased risk of unauthorized dissemination of sensitive personal information or proprietary or confidential information about us or our members or other third parties. We have taken, and may take, further actions that alter our business operations as may be required by local, state, or federal authorities or that we determine are in the best interests of our employees. Such measures could negatively affect our ability to provide care to members, relationship with physician partners, marketing efforts, employee productivity, or customer retention, any of which could harm our business, financial condition, cash flows and results of operations.Further, due to the
COVID-19
pandemic, physician partners may not be able to complete the required annual wellness visits necessary to assess and document the health conditions of our members as comprehensively as we have in the past. Medicare pays capitation using a “risk adjustment model,” which compensates providers based on the health status (acuity) of each individual patient, based on each patient’s documented clinical diagnoses activity in the preceding calendar year. Medicare requires that a patient’s health issues be clinically assessed and sufficiently documented annually regardless of the permanence of the underlying clinical conditions. Historically, this clinical assessment and documentation was required to be completed during anin-person
visit with a patient. As part of the Coronavirus Aid, Relief and Economic Security Act, or “CARES Act,” Medicare is allowing documentation for conditions identified during video visits with patients. However, given the disruption caused byCOVID-19,
it is unclear whether our physician partners will be able to conduct patient interactions to clinically assess and accurately and sufficiently document the health conditions of our members, which could adversely impact our revenue in 2021 and beyond.27
In response to COVID-19, the United States Congress, CMS and other federal agencies with oversight of care delivery requirements made several changes to the manner in which Medicare will pay for telemedicine visits, many of which relax previous requirements, including site requirements for both providers and members, telemedicine modality requirements and others. State laws and regulations applicable to telemedicine, particularly licensure requirements, also were relaxed in many jurisdictions as a result of the COVID-19 pandemic. These relaxed regulations have allowed our physician partners to keep operating and deliver care to members predominantly through telemedicine modalities. Nearly all of the Federal measures will expire at the end of the Public Health Emergency declaration, which the Biden administration has indicated will last through the end of 2021. Many State law and regulatory changes have already expired while others have continued. It is unclear which, if any, of these changes will remain in place permanently and which will be rolled-back following the COVID-19 pandemic, although there have been a number of state law and regulatory changes over the past year that clarify requirements or remove impediments. If regulations change to restrict the ability to deliver care or receive reimbursement for care delivered through telemedicine modalities, our financial condition and results of operations may be adversely affected.
The rapid development and fluidity of this situation precludes any prediction as to the ultimate impact on us of
COVID-19.
We are continuing to monitor the spread ofCOVID-19,
changes to our payors’ benefit coverages, the ongoing costs and business impacts of dealing withCOVID-19,
including the potential costs associated with lifting restrictions on movement and economic activity and with administering vaccines, and related risks, as well as potential costs associated with provision of care to our members suffering fromCOVID-19.
The magnitude and duration of the pandemic and its ultimate impact on us is uncertain as this continues to evolve globally, but such impacts could be material to our business, financial condition, cash flows and results of operations.Our estimates of our members’ risk adjustment factors, medical services expense, incurred but not reported claims and earnings pursuant to payor contracts could be inaccurate.
Medical services revenue related to our members is based on clinical disease conditions identified and documented by physicians during patient visits during the preceding calendar year, as well as other factors such as the age and gender of the member, which is summarized in a risk-adjustment factor assigned to each member. To estimate the related amount of revenue that will ultimately be realized for the periods presented, we estimate our members’ risk adjustment factors based on our knowledge of members’ health status, which is in turn based on physicians’ clinical assessment and documentation of members’ health status, existing risk adjustment factors and applicable Medicare guidelines. These factors may not be predictive of our members’ risk adjustment factors, or we may otherwise fail to accurately estimate such score, which could cause our revenue estimates for the relevant period to be inaccurate.
We establish liabilities on our balance sheet for the amount of medical services which have been incurred but not reported (“IBNR”) or paid as of the given balance sheet date. IBNR estimates are developed using actuarial methods and are based on many variables, including the utilization of healthcare services, historical payment patterns, cost trends, product mix, seasonality, changes in membership and other factors. These estimation methods and the resulting reserves are periodically reviewed and updated.
COVID-19
has also resulted in fluctuations in our medical expenses and increased challenges in accurately estimating the amount of medical expenses which have been incurred by our members.Given the numerous uncertainties inherent in such estimates, our actual medical claims liabilities for a particular quarter or other period could differ significantly from the amounts estimated and reserved for that quarter or period. Our actual medical claims liabilities have varied and will continue to vary from our estimates, particularly in times of significant changes in utilization, medical cost trends and populations and geographies served. If our actual liability for claims payments is higher than previously estimated, our earnings in any particular quarter or annual period could be negatively affected. Our estimates of IBNR liabilities may be inadequate in the future, which would negatively affect our results of operations for the relevant time period. Furthermore, if we are unable to accurately estimate adequate IBNR levels, our ability to take timely corrective actions may be limited, further exacerbating the extent of the negative impact on our results.
28
When we enter into a new physician partner relationship or when we prepare operating and financial forecasts, we and our payors estimate medical services expense. Our medical services expense may exceed our or our payors’ estimates, which may result in our establishing unfavorable financial terms in our contractual agreements with our payors, or may result in our payors’ actuarial projections submitted to CMS being inaccurate. In either case, we may incur higher medical expenses than we anticipated or in excess of the revenues we receive, which could in turn have a material adverse effect on our business, financial condition, cash flows and results of operations. Additionally, we cannot be certain that the stop-loss coverage we maintain to protect us against certain severe or catastrophic medical claims currently is or will be adequate or available to us in the future or that the cost of such stop-loss coverage will not limit our ability to obtain it.
Restrictive clauses in some of our contracts with physician partners may prohibit us from establishing new RBEs within certain geographies in the future, and as a result may limit our growth.
Most of our contracts with our physician partners include restrictive provisions that, among other things, preclude us from establishing new RBEs within certain geographies in the future. These restrictive provisions typically preclude us or our RBEs from contracting to provide a Total Care Model in specific geographic areas other than through the relevant RBE, and in certain circumstances may limit the providers with which the RBE may contract. Any contracts with restrictive provisions may limit our ability to conduct business with certain potential partners, including partnering with or providing services to other physicians or purchasing services from other physicians within certain time periods, and in certain regions. Accordingly, these restrictive provisions may limit growth and prevent us from entering into long-term relationships with potential partners and could cause our business, financial condition, cash flows and results of operations to be harmed.
Exclusivity provisions in some of our agreements with physician partners could subject us to investigations or litigation.
Most of our contracts with our physician partners contain restrictive provisions that preclude our physician partners from providing specified services for the duration of our contracts. Such provisions could be the subject of investigations and enforcement actions by regulatory authorities and litigation by payors or physicians operating in the geographic areas where such contracts exist. Any such investigations, enforcement actions or litigation could require us to take actions which would adversely affect our business, financial condition, cash flows and results of operations or could require us to pay substantial amounts of money. Additionally, defending against these lawsuits and proceedings may involve significant expense and diversion of management’s attention and resources from other matters.
We rely on our management team and key employees and our business, financial condition, cash flows and results of operations could be harmed if we are unable to retain qualified personnel.
Our success depends, in part, on the skills, working relationships and continued services of our senior management team and other key personnel. All of our employees are
“at-will”
employees or have offer letters or employment agreements that allow their employment to be terminated by us or them at any time, for any reason and without notice, subject, in certain cases, to severance payment rights. Prior to this offering, in order to retain and motivate valuable employees, in addition to salary and cash incentives, we provided stock options that either vest over time or are based on the equity return realized by our controlling stockholder. The value to employees of these stock options is significantly affected by movements in our stock price that are outside our control. The compensation and benefits we provide to our employees, together with the value of stock options that we have granted, may at any time be insufficient to counteract offers from other organizations. The departure of key personnel could adversely affect the conduct of our business, financial condition, cash flows and results of operations. In such event, we would be required to hire other personnel to manage and operate our business, and we may not be able to employ a suitable replacement for the departing individual at favorable terms, or at all. Following the offering, we intend to continue to use equity awards as part of our executive compensation29
program, and volatility or lack of performance in our stock price may also affect our ability to attract any replacements or retain these employees.
Competition for qualified personnel in our field is intense due to the limited number of individuals who possess the skills and experience required by our industry, particularly with respect to a Total Care Model. As a result, as we enter new geographies, it may be difficult for us to hire additional qualified personnel with the necessary skills to work in such geographies. If our hiring efforts in new or existing geographies are not successful, our business will be harmed. In addition, we have experienced employee turnover and expect to continue to experience employee turnover in the future. New hires require significant training and, in most cases, take significant time before they achieve full productivity. New employees may not become as productive as we expect, and we may be unable to hire or retain sufficient numbers of qualified individuals. If our retention efforts are not successful or our employee turnover rate increases in the future, our business, financial condition, cash flows and results of operations will be harmed.
We may never realize the full value of our intangible assets, which could cause us to record impairments that may negatively affect our financial condition and results of operations.
We have a significant amount of intangible assets on our balance sheet, and we may never realize the full value of such assets. As of June 30, 2021, December 31, 2020 and December 31, 2019, respectively, we had $100.2 million, $102.0 million, and $112.7 million of net intangible assets, including $41.5 million of goodwill. In addition to our annual goodwill impairment test in the fourth quarter, our intangible assets, including goodwill, are subject to impairment tests when events or circumstances indicate that the carrying value of the asset, or related group of assets, may not be recoverable. There are several factors that may be considered a change in circumstances indicating that the carrying value of our intangible assets, including goodwill may not be recoverable, including macroeconomic conditions, industry considerations, our overall financial performance (including an analysis of our current and projected cash flows), revenue and earnings, a sustained decrease in our share price and other relevant entity-specific events (including changes in strategy, physicians, members or litigation). Where the carrying value of the asset, or related group of assets, is not recoverable, we would record an impairment charge that may negatively impact our financial condition and results of operations. A detailed discussion of our impairment testing is included in “Management’s Discussion and Analysis of Financial Condition and Results of Operations—Critical Accounting Estimates.”
Due to the continued deterioration in the performance of our California reporting unit, in the fourth quarter of 2019, we initiated a process to evaluate strategic alternatives for our California operations, including a sale or abandonment of all or substantially all of such operations. We therefore performed an assessment of the long-lived assets in the California reporting unit for impairment and determined that the carrying value of certain of those assets was not recoverable. Accordingly, we wrote-down such assets to fair value, resulting in the recognition of a $98.3 million impairment charge included in discontinued operations in the audited consolidated statement of operations for the year ended December 31, 2019. See “Note 19. Discontinued Operations” in our consolidated financial statements included elsewhere in this prospectus.
Any future impairments could be significant and have a material adverse effect on our business, financial condition, cash flows and results of operations.
Adverse determinations of tax matters could adversely affect our business, financial condition, cash flows and results of operations.
We are subject to tax laws in the various jurisdictions in which we operate, and the application of these laws to us may be unclear. Some interpretations adopted by us could be challenged by the relevant tax authorities. A successful challenge could result in adverse consequences for us, including potentially the payment of taxes, penalties or interest in amounts that may be material. See “Note 11. Commitments and Contingencies” and “Note 14. Income Taxes” in our audited consolidated financial statements for the year ended December 31, 2020 included elsewhere in this prospectus.
30
Security breaches, loss of data and other disruptions to our data platforms could compromise sensitive information related to our business and expose us to liability, which could adversely affect our operations, financial condition, cash flows and results of operation.
In the ordinary course of our business, we collect, store, use and disclose sensitive data, including what the law defines as protected health information (“PHI”) and other types of personal or identifying information. Our member information is encrypted but not always
de-identified.
We manage and maintain our business and data through a combination of data center systems and cloud-based computing center systems.We are highly dependent on information technology networks and systems, including the internet, to securely process, transmit and store this information. We utilize third-party service providers for important aspects of the collection, storage and transmission of PHI and other sensitive information and, therefore, we may be unable to control the use of such information or the security protections employed by such third parties. The security of our technology platform and other aspects of our services, including those provided or facilitated by our third-party service providers, is important to our operations and business strategy because of the sensitivity of the PHI and other confidential information we and our providers collect, store, process and transmit. Our information technology and infrastructure, and that of our third-party service providers, may be vulnerable to various forms of attacks by hackers or to viruses, other technical failures or breaches due to third-party action, or due to employee and contractor negligence, error or malfeasance. We may also experience cybersecurity and other breach incidents that may remain undetected for an extended period of time. Because the techniques used to obtain unauthorized access or to otherwise disrupt computer systems change frequently and generally are not identified until they are launched against a target, we or our third-party service providers may be unable to implement adequate preventative measures or effectively respond to breaches in a timely fashion. Examples of currently known data security threats facing us and our third-party service providers include ransomware, phishing, business email compromise and credential stuffing.
We have experienced cybersecurity incidents in the past and may experience them in the future. Such breaches of our infrastructure or information, or that of our third-party providers, whether as a result of physical
break-ins,
computer viruses, cyberattacks, or employee or contractor error, negligence or malfeasance, can create system disruptions, shutdowns or unauthorized disclosure or modification of sensitive information, including PHI. As a result, such data security breaches could result in the loss of data or inappropriate use of information. Any interruption in access to member information, unauthorized access to information, improper disclosure or other loss of information could also result in federal or state government investigations and liability under laws and regulations that protect the privacy of member information, such as the Health Insurance Portability and Accountability Act of 1996 (“HIPAA”), potentially resulting in damages and regulatory penalties. See “Business—Healthcare and Other Applicable Regulatory Matters—Federal and State Privacy and Security Requirements.” Sustained or repeated system failures could damage our reputation and reduce the attractiveness of our platform, partnership and network model to members and physician partners, possibly resulting in contract terminations and reductions in revenue. Additionally, the detection, prevention and remediation of known or unknown security vulnerabilities, including those arising from third-party hardware or software, may result in additional material direct or indirect costs.Any or all of these issues could adversely affect our ability to attract new physician partners and members, cause existing physician partners to fail to renew their agreements with us, cause existing members to disenroll or switch their coverage to
non-contracted
payors and result in reputational damage. Our general liability or data security insurance policies may not be adequate to cover all potential claims to which we are exposed and may not be adequate to indemnify us for the liability that may be imposed or the losses associated with such events, and in any case, such insurance may not cover all of the specific costs, expenses and losses we could incur in responding to and remediating a security breach.31
We rely on third-party internet infrastructure and bandwidth providers for our operations, and any failure or interruption in the services provided by these third parties could negatively impact our ability to operate and our relationships with members and physician partners and adversely affect our business, financial condition, cash flows and results of operations.
Our ability to aggregate and evaluate member, physician partner, payor and other relevant data to facilitate our operations, including to process and adjudicate claims payments, provide data analytics and store data, depends on the development and maintenance by third parties of the internet infrastructure we use to operate our business. We rely on internal systems as well as third-party bandwidth and telecommunications equipment providers and other service providers to maintain and operate our internet-based services. This includes maintenance of a reliable network backbone with the necessary speed, data capacity, bandwidth capacity and security. Our services are designed to operate without interruption. However, we may experience future interruptions and delays in services and availability from time to time. In the event of an interruption or a catastrophic event with respect to one or more of the systems we use, we may experience an extended period of system unavailability, which could negatively impact our relationship with members, physician partners and payors. To operate without interruption, both we and our service providers must guard against:
| • | damage from fire, power loss, natural disasters and other events outside our control; |
| • | communications failures; |
| • | software and hardware errors, failures and crashes; |
| • | data security breaches, ransomware attacks, computer viruses, hacking, denial-of-service |
| • | other potential interruptions. |
If any of the foregoing occur, our reputation, operations and financial results may be materially adversely impacted. Further, any failure of or by the systems we use to handle the volume of use, either by us or others on such systems, or any increased volume of use, could significantly harm our business. We have limited control over our third-party internet infrastructure and bandwidth providers, and, as a result, limited ability to independently address problems with services they provide. Any errors, failures, interruptions or delays experienced in connection with these providers’ services could negatively impact our relationships with members, physician partners or payors.
If we are unable to protect the confidentiality of our
know-how
and other proprietary and internally developed information, our operations could be adversely affected.Our business depends on internally developed information, including our databases, confidential information and
know-how,
the protection of which is crucial to the success of our business. We may not be able to protect ourknow-how
and other internally developed information, including clinical and analytical outcomes generated from data we collect from physician partners, payors and other relevant sources. Our physician partners, employees, consultants and other parties (including independent contractors and companies with which we conduct business) may unintentionally or willfully disclose our information to competitors. Enforcing a claim that a third party illegally disclosed or obtained and is using any of our internally developed information is difficult, expensive and time-consuming, and the outcome is unpredictable. In addition, courts outside the United States are sometimes less willing to protectknow-how
and other proprietary information. We rely, in part, onnon-disclosure
or confidentiality agreements with our physician partners, independent contractors, consultants and companies with which we conduct business to protect ourknow-how
and internally developed information. These agreements may not be self-executing, or they may be breached and we may not have adequate remedies for such breach. Moreover, third parties may independently develop similar or equivalent proprietary information or otherwise gain access to ourknow-how
and other internally developed information. Our failure to protect the confidentiality of ourknow-how
and other proprietary and internally developed information could have a material adverse effect on our business, financial condition, cash flows and results of operations.32
We could be required to devote significant attention and resources to the provision of certain transition services in connection with the disposition of our California Operations.
In February 2021, we completed the divestiture of our California Operations. See “Management’s Discussion and Analysis of Financial Condition and Results of Operations” and the notes in our financial statements included elsewhere in this prospectus.
In connection with the divestiture, we have agreed to continue to provide administrative support and transition services for a specified period of time. The transition services to be provided by us could require significant management attention and resources which could negatively affect our ongoing business. Additionally, we could experience operational difficulties and increased costs that exceed our estimates to provide the transition services if we are unable to perform such services with our existing resources at an acceptable level, or at all, or obtain them from a third party on reasonable terms.
For the Southern California and Fresno divestiture transactions, we will continue to be responsible for any liabilities arising from the business which were incurred prior to the closing date of each transaction, including the payment of claims for medical services incurred prior to the effective date of each transaction, a liability for unrecognized tax benefits for which we are indemnified and other contingent liabilities that we currently believe are remote. See “Note 8. Medical Claims and Related Payables,” “Note 14. Income Taxes” and “Note 19. Discontinued Operations” in our audited consolidated financial statements included elsewhere in this prospectus. We may not be successful in managing the risks associated with the divestiture of our California operations.
Our subsidiaries’ lack of performance or ability to fund their operations could require us to fund such losses.
If our subsidiaries suffer losses due to their lack of performance, our physician partners’ failure to perform under their contracts or other reasons, we may be required to fund such losses or our subsidiaries may breach their payor contracts or incur regulatory consequences. We have in the past chosen to or been required to, and may in the future choose to or be required to, fund our subsidiaries’ losses. If unfunded, such losses have in the past, and could in the future, result in substantial doubt related to such subsidiary’s ability to continue operating as a going concern, and the contractual and regulatory consequences of such failure could have a material adverse effect on our business, financial condition, cash flows and results of operations.
Risks Related to Our Reliance on Third Parties
We are economically dependent on maintaining our contracts with a limited number of key payors.
We contract with a limited number of key payors, and we are economically dependent on maintaining our contracts with such payors. See “Note 3. Concentration of Credit Risk” in our audited consolidated financial statements included elsewhere in this prospectus. As a result, our key payors may have increased bargaining power, and we may be required to accept less favorable contractual terms with them. Because we rely on a limited number of payors for a significant portion of our revenue, we depend on their creditworthiness. Our payors are subject to a number of risks including reductions in payment rates from governmental programs, higher than expected healthcare costs and lack of predictability of financial results when entering into new lines of business, particularly with high-risk populations. If the financial condition of our payors declines, our credit risk could increase. Should one or more of our significant payors declare bankruptcy, be declared insolvent or otherwise be restricted by state or federal laws or regulation from continuing in some or all of their operations, such payor may be unable to reimburse us for expenses incurred in managing patient care, and the members such payor attributes to our platform could transition to another payor who is not on our platform, which could have a material adverse effect on our business, financial condition, cash flows and results of operations. Future consolidation of payors in the healthcare industry could reduce the number of payors even further, increasing these risks.
33
Our contracts with our payors are for limited terms, and may not be renewed upon their expiration.
Our contracts with payors generally have terms of one to three years and are typically renewed for
one-year
periods unless terminated in accordance with the terms of such agreements. In the ordinary course of business, we engage in active discussions and renegotiations with our payors in respect of the services we collectively provide and the terms of our payor agreements. As our payors’ businesses respond to market dynamics and financial pressures, and as our payors make strategic business decisions in respect of the lines of business they pursue and programs in which they participate, certain of our payors have sought, and we expect that in the future additional payors will, from time to time, seek to renegotiate or terminate their contracts with us. These negotiations could result in reductions to the economic terms and changes to the scope of services contemplated by our existing payor contracts and consequently could negatively impact our revenues, business and prospects and render our assumptions, estimates and reserves inaccurate. If any of our contracts with our payors is terminated, we may experience a reduction in the number of members attributed to our platform, which may result in a reduction of our revenues and may have a material adverse effect on our business. We have in the past, with respect to certain of our discontinued operations, and may in the future, recognize impairment charges for such terminations.If a payor does terminate or elects not to renew its relationship with us, our ability to retain members associated with that payor is limited. We and our physician partners must comply with the CMS Medicare Marketing Guidelines regarding communication and information provided to members, which limits the types of permissible communications that may be made to members. In addition, in Ohio, we are contractually prohibited from forming our own health plan, which effectively prohibits us from directly marketing to members in accordance with the CMS Medicare Marketing Guidelines.
Additionally, if a payor with which we contract for these services loses its Medicare contract or CMS decides to discontinue its MA or commercial plans, decides to contract with another company to provide capitated care services to its members or decides to directly provide care, our contract with that payor could be at risk and we could lose revenue. Additionally, payors with whom we currently contract in a particular geography may not maintain their government-awarded contracts in future years. For example, a group contract through which certain of our members in our Texas geography receive care was awarded to a new payor with whom we were not contracted at the time to attribute members for 2021. Moreover, our inability to maintain our agreements with payors, in particular with key payors such as Humana, Aetna and United Healthcare, with respect to their MA members or to negotiate favorable terms for those agreements in the future, could result in the loss of patients and could have a material adverse effect on our business, financial condition, cash flows and results of operations.
We rely on our payors for membership attribution and assignment, data and reporting accuracy and claims payment.
We rely on our payors for membership attribution and assignment, data and reporting accuracy and claims payment, and if our payors do not adequately fulfill these functions, fewer members may be attributed to our platform or we may not receive complete and accurate information necessary to effectively manage our business. We receive payments from payors based on the number of assigned or attributed members participating in Medicare, which can be based upon complex attribution algorithms provided by our payors that may not be accurate. Additionally, payors may choose to assign specific member populations to specialty risk-bearing organizations, which would decrease the number of members attributed to us. We may not be reimbursed for members that payors fail to assign or attribute to us, which could result in lost margin and disruption to member care. Such a failure could materially reduce our revenues and have a material adverse effect on our business, financial condition, cash flows and results of operations.
Payors also regularly provide us an array of data associated with patients attributed to our physician partners, including information related to revenue and risk adjustment factors for our members, and details associated with amounts paid by payors for medical services rendered to our members. To the extent a payor does not provide us with complete or accurate data sets related to our members, or if we are unable to effectively
34
ingest the information which payors provide to us, we and our physician partners may not be able to effectively ensure our members disease burdens are identified and may not be able to effective operate our business.
In addition, we are exposed to various risks related to our incentive programs with our payors, including those in which the payor typically has not delegated claims payment services to us. If our payors do not timely and accurately process claims and reimburse us for all covered members, are unable to contract with providers at market-based rates, change their utilization management methodologies, or are unable to secure an adequate network of specialists, our business, financial condition, cash flows and results of operations could be adversely impacted.
We are dependent on physician partners and other providers to effectively manage the quality and cost of care and perform obligations under payor contracts.
Our success depends upon our continued ability to collaborate with and expand a network of high-caliber physician partners who can provide high quality of care, improve clinical outcomes and effectively manage healthcare costs, which are key drivers of our profitability. While the precise terms of each relationship vary, we do not directly employ our physician partners. Accordingly, our physician partners could demand an increased payment arrangement or take other actions, or fail to take actions, that could result in higher medical costs, lower quality of care for our members, harm to our reputation or create difficulty meeting regulatory or other requirements. Likewise, our physician partners could take actions contrary to our instructions, requests, policies or objectives or applicable law, or could have economic or business interests or goals that are or become inconsistent with our own. Further, our physician partners may not engage with our platform to assist in improving overall quality of care and management of healthcare costs, which could produce results that are inconsistent with our estimates and financial models and negatively impact our growth.
In addition to receiving care from our physician partners, our members also receive care from an array of hospitals, specialists and ancillary providers who typically contract directly with our payors. Similar to our physician partner relationships, we do not directly employ providers from whom our members receive care. As such, we cannot guarantee the quality and efficiency of services from such providers, over which we have no control. Members who receive poor quality healthcare from such providers may be dissatisfied with our physician partners, which would have a negative impact on member satisfaction and retention. Any of these consequences could adversely impact our business, financial condition and results of operations.
We could also experience significant losses if the expenses incurred to deliver healthcare services to our attributed members exceed revenues we receive from payors in respect of our attributed members. Under a capitation contract, a payor typically prospectively pays periodic capitation payments representing a prospective budget from which our physician partnerships manage healthcare expenses on behalf of the population enrolled with that physician partnership. To manage total medical services expense, we rely on our physician partners’ ability to improve clinical outcomes, implement clinical initiatives to provide a better healthcare experience for our members and accurately and sufficiently document the risk profile of our members. While our contracts vary, generally, if the cost of medical care provided exceeds the corresponding capitation revenue we receive we may realize operating deficits, which are typically not capped, and could lead to substantial losses.
Difficulties in obtaining accurate and complete diagnosis data could have adverse consequences.
The accurate and complete coding and documentation of diagnosis data underlying our members’ existing disease conditions is important because our contracts with payors require the submission of complete and correct encounter data. Such data includes members’ medical information, as documented by physicians, other medical professionals and hospitals, and is used by payors to attribute membership and reimburse healthcare providers for the services rendered. The accurate and complete coding and documentation of diagnosis is also important because the CMS risk adjustment model adjusts reimbursement for members with existing qualifying diagnoses. Additionally, in geographies in which payors adjudicate claim payments to the provider network, we rely on
35
providers to submit accurate diagnosis information and other encounter data to payors. To the extent we or providers in our network fail to submit diagnosis data underlying our members’ existing disease condition, we may receive less medical services revenue than is necessary to provide healthcare services for such members. Furthermore, we project our medical services revenue in part based upon the data submitted and expected to be submitted to CMS. Failure by us or our provider network to submit complete and accurate diagnosis information or encounter data may result in inaccuracies in our projections of medical services revenue, or in other estimation processes. We may be held liable for inaccuracies or deficiencies in the submitted encounter data and potentially could be subject to financial penalties imposed by government authorities and breach of contract claims by payors. We have experienced, and may in the future experience, challenges in obtaining complete and accurate encounter data due to difficulties with our internal compliance and monitoring systems receiving and processing data from multiple systems, with physicians and third-party vendors submitting claims in a timely fashion and in the proper format, and with payors properly recording and coordinating such submissions. We may not be successful in collecting accurate and complete encounter data, correcting inaccurate or incomplete encounter data and developing systems that allow us to receive and process data from multiple systems. Further, it may be prohibitively expensive or impossible for us to collect or reconstruct historical encounter data.
We depend on physician partners to accurately, timely and sufficiently document their services, and their failure to do so could result in nonpayment for services rendered or allegations of fraud. If any diagnosis information or encounter data are inaccurate or incorrect, claims or encounter data submissions to payors may not be compliant, resulting in potential overpayments, possible recoupments and liability under the federal False Claims Act or through RADV audits.
Our revenue will be negatively impacted if our physician partners or our network providers, including hospitals and specialist physicians, fail to accurately, timely and sufficiently document their services or if our internal compliance and monitoring programs fail to ensure that documentation is complete, timely and accurate. We rely upon physician partners to accurately, timely and sufficiently complete medical record documentation and assign appropriate reimbursement codes for their services. We also rely on our internal compliance and monitoring systems to ensure that documentation is complete, timely and accurate. However, we do not directly employ or control our physician partners, and accordingly any adverse effects on us regarding their noncompliance with documentation requirements are uncertain and unpredictable. Reimbursement is conditioned upon, in part, physician partners providing the correct procedure and diagnosis codes and properly documenting the services themselves, including the level of service provided and the medical necessity for the services. If our affiliated physicians have provided incorrect or incomplete documentation or selected inaccurate reimbursement codes, or if our internal compliance and monitoring procedures to ensure complete, timely and accurate submission of data are ineffective, this could result in nonpayment for services rendered or lead to allegations of billing fraud. See “Business—Healthcare and Other Applicable Regulatory Matters—Health Care Fraud Statute.”
In addition, CMS and the U.S. Department of Health and Human Services (“HHS”) Office of Inspector General perform audits of selected MA contracts related to risk adjustment diagnosis data. In these Risk-Adjustment Data Validation Audits (“RADV audits”), the government reviews medical records to determine whether physician medical record documentation and coding practices are compliant, which can result in the recovery of payments from managed care organizations if errors are identified and influence the calculation of premium payments by CMS to MA plans. Disclosure of any adverse investigation or audit results or sanctions could negatively affect our reputation and make it more difficult to attract members, physician partners and payors. Additionally, exception rates of existing documentation identified through a RADV audit may be extrapolated to an overall population of members attributed to a payor, which may result in a reduction of our revenues.
In recent years, the U.S. Department of Justice has brought a number of investigations and actions under the federal False Claims Act against both physicians and payors for alleged upcoding or improper coding of diagnosis codes under the risk-adjustment methodology. The Medicare Risk Adjustment Factor (“RAF”) scores attributable to members determine, in part, the revenue to which health plans and, in turn, we are entitled for the provision of medical care to such members. The data submitted to CMS by each health plan is based, in part, on
36
medical charts and diagnosis codes submitted to health plans. Each health plan generally relies on us and our physician partners to maintain accurate medical records and appropriately document clinical diagnoses associated with medical services provided to members. If our physician partners have provided incorrect or incomplete documentation or selected inaccurate reimbursement codes, or if our internal compliance and monitoring systems fail to ensure that documentation is complete and accurate, we could be subject to potential civil and criminal penalties, including exclusion from government healthcare programs, such as Medicare, that constitute a substantial percentage of our total revenues.
A health plan may seek repayment from us should CMS make any payment adjustments as a result of its audits or hold us liable for any penalties owed to CMS for inaccurate or unsupportable RAF scores provided by us or our affiliated physicians. We could, further, be liable for penalties to the government under the FCA that range from $11,803 to $23,607 (adjusted for inflation) for each false claim, plus up to three times the amount of damages caused by each false claim, which can be as much as the amounts received directly or indirectly from the government for each such false claim.
In addition, payors may disallow, in whole or in part, requests for reimbursement based on determinations that certain amounts are not covered, services provided were not medically necessary, or supporting documentation was not adequate. Retroactive adjustments may change amounts realized from payors and result in recoupments or refund demands, affecting revenue already received.
Any of these consequences of inaccurate data recordation could have a material adverse effect on our business, financial condition cash flows and results of operations. Furthermore, a health plan may be randomly selected or targeted for review by CMS and the outcome of such a review may result in a material adjustment in our revenue and profitability, even if the information we submitted to the plan is accurate and supportable.
We rely on third-party software and data to operate our business and provide services to our members and physician partners, and any restrictions on our use of, or ability to license, such third-party resources could adversely affect our business, financial condition, cash flows and results of operations.
We rely on software licensed from third parties, as well as data received from third parties, including government agencies, in order to operate our business. These licenses are generally commercially available on varying terms. It is possible that the licenses and rights necessary to use the software and data necessary for the provision of our services may not continue to be available on commercially reasonable terms, or at all, or that our use of such software or data may be restricted. Our suppliers of data may increase restrictions on our use of such data, fail to adhere to our quality-control standards or otherwise satisfactorily perform services or otherwise change the terms upon which we can access such data. Any loss of the right to use or receive any of this software or data could significantly increase our expenses and otherwise result in delays in the provision of our services until supplemental data is able to be obtained, or equivalent technology is either developed by us, or, if available from another source, is identified, obtained and integrated. In the future, we may need to obtain additional licenses from third parties in connection with our growth into new geographies or provision of new or supplemental services, and such additional licenses may not be available on commercially reasonable terms, or at all.
Furthermore, our use of additional or alternative third-party software or data requires us to enter into license agreements with third parties, and integration of new third-party software may require significant work and require substantial investment of our time and resources. Also, the software we license is complex and may contain errors or failures that are not detected until after the software is introduced or updated and new versions are released. In addition, it is possible that hardware failures or errors in the third-party software we use could result in data loss or corruption or cause the information to be incomplete or contain inaccuracies. Any undetected errors, defects or corruption in third-party software or data could prevent the deployment or impair the functionality of our software, delay new updates or enhancements to our services, result in a failure of our services and injure our reputation. We have limited control over such third-party providers, and these third parties may not continue to invest the appropriate levels of resources to maintain and enhance the capabilities of
37
their software, continue to collect and disseminate relevant data, or even remain in business. Integration of software provided by various third parties is also less reliable than an owned, fully integrated network, which we do not have. Any failure or interruption in the services provided by these third parties could negatively impact our ability to operate, relationships with members and physician partners and adversely affect our business, financial condition, cash flows and results of operations.
Risks Related to Our Industry and Government Programs
Consolidation in the healthcare industry could have a material adverse effect on our business, financial condition, cash flows and results of operations.
Many healthcare industry participants, including physician groups and payors, are consolidating to create larger and more integrated healthcare delivery systems with greater bargaining power, given their market share. We expect regulatory and economic conditions to result in additional consolidation. Physician groups or payors that have consolidated and are not already part of our network may try to use their increased bargaining power to negotiate better terms upon which to join our network. Consolidation may also result in the acquisition or future development by our partners or unaffiliated third parties of products and services that compete with us. Finally, consolidation may result in physician groups merging with, or being acquired by, each other or by health plans or other types of providers such as hospitals, and such groups may not have a need for our services which could reduce our market opportunity. Any of these potential results of consolidation could have a material adverse effect on our business, financial condition, cash flows and results of operations.
Substantially all of our total revenues relate to federal government healthcare programs, and reductions in their reimbursement rate or methodology applied to derive reimbursement, or discontinuation of such healthcare programs, would adversely affect our business, financial condition, cash flows and results of operations.
Substantially all of our total revenues relate to federal government healthcare coverage programs. The MA program accounted for approximately 100%, 99%, and 98% of our total revenues for the years ended December 31, 2020, 2019, and 2018, respectively. See “Note 3. Concentration of Credit Risk” in our audited consolidated financial statements included elsewhere in this prospectus. Additionally, we are participating in the Direct Contracting Model and our first performance period began on April 1, 2021. While the DCE’s are not consolidated, they still have an impact on our profitability. The policies and decisions made by the federal government regarding these programs have a substantial impact on our profitability. We cannot predict changes to these programs, and we may be unable to adapt our business to such changes, either at all or in relation to our competitors.
On an annual basis, CMS issues a final rule to establish the MA county-level benchmark payment rates for the following calendar year. Rates we receive from payors may be reduced as a result of annual reimbursement changes, changes to the risk-adjustment methodology (including revisions to the FFS normalization rate, coding intensity adjustment or other elements of the methodology) for the services we provide or other changes to the CMS reimbursement model. Any reductions in rates that we receive from payors could have a significant adverse impact on our revenue and financial results. We cannot predict the nature of future changes. The final impact of the MA rates can vary from any estimate we may have and may be further impacted by the relative growth of our MA patient volumes across markets as well as by the benefit plan designs submitted by the health plans. It is possible that we may underestimate the impact of the changes in MA rates on our business, which could have a material adverse effect on our business, financial condition, cash flows and results of operations. In addition, our MA revenues may continue to be volatile in the future, which could have a material adverse impact on our business, financial condition, cash flows and results of operations. The rates we or our payors pay to physician partners are generally based on the Medicare FFS schedule, which is subject to change and outside our control. Increases in the Medicare FFS schedule could cause us or our payors to modify our physician partner reimbursement methodology in ways that we cannot predict, which would result in increases to our medical services expenses.
38
There are sometimes wide variations in the established reimbursement rates per member as a result of, among other things, members’ risk status, acuity levels and age, plan benefit design and geography. As the composition of our membership base changes, due to programmatic, competitive, regulatory, benefit design, economic or other changes, there is a corresponding change to our premium revenue, costs and margins, which could have a material adverse effect on our business, financial condition, cash flows and results of operations.
The financial aspects of the Direct Contracting Model are set forth in an agreement between the DCE and CMS. CMS has the right to amend the agreement without the consent of the DCE for good cause or as necessary to comply with applicable federal or state law, regulatory requirements, accreditation standards or licensing guidelines or rules. We cannot predict whether CMS will amend such agreements and, if CMS amends such agreements, the impact such amendments may have on the financial aspects of our participation in the model, including, but not limited to, risk adjustment models used to set benchmarks, the rate book, capitation payment mechanisms and the calculation of shared savings and losses. Furthermore, changes to Medicare (including the Direct Contracting Model) or MA, such as if CMS were to scale back these programs or discontinue MA, could have a significant adverse impact on our membership levels, revenue and financial results. Changes in individual plan dynamics, such as changes in benefits provided by the payors, premiums charged by the payors or our payors’ STAR ratings, could also adversely impact us. Additionally, on August 10, 2021, the U.S. Senate passed the bipartisan Infrastructure Investment and Jobs Act, a $1.2 trillion infrastructure package. Although the Senate-passed infrastructure bill has now been sent to the House, it is not expected to be voted on in the House until later this year; the House is not expected to vote on the infrastructure bill until the Senate also passes the $3.5 trillion budget reconciliation bill. If enacted, the two bills are anticipated to have consequences for the healthcare industry, which could have a material adverse effect on our business, financial condition, cash flows and results of operations. The infrastructure and reconciliation bills are expected, for example, to expand Medicare coverage and lower the program’s eligibility age, increase the Medicare Advantage coding intensity adjustment and subject Medicare payments to a 2% sequestration reduction through 2031.
Uncertain or adverse economic conditions, including a downturn or decrease in government expenditures, could have a material adverse effect on our business, financial condition, cash flows and results of operations.
Historically, government budget limitations have resulted in reduced spending. The existing federal deficit and continued deficit spending by the federal government and significant economic pressure on state budgets have the potential to lead to reduced government expenditures, including for government-funded programs in which we participate such as Medicare. Any sustained failure to identify and respond to these trends could have a material adverse effect on our business, financial condition, cash flows and results of operations.
Unfavorable economic conditions could also impact enrollment in MA plans with our payors, cause our payors to change the benefits structure that is offered to our members or weaken our ability to raise additional capital on acceptable terms. For example, unfavorable economic conditions could cause our payors to reduce the benefits that are offered to our members and could result in the cancellation by certain members of our payors’ products and services, which would reduce our overall membership, premiums and fee revenues. Any reduction in membership, premiums or fee revenues would, in turn, adversely affect the financial position of physician practice groups.
We operate in a competitive industry, and if we are not able to compete effectively, our business, financial condition, cash flows and results of operations will be harmed.
Our industry is competitive and we expect it to attract increased competition, which could make it difficult for us to succeed. We currently face competition in various aspects of our business, including in offering a favorable reimbursement structure for physician partners and potential physician partners and attracting payors and physician partners who are not contracted with us, from a range of companies that provide a Total Care
39
Model under different care models that could attract patients, providers and payors, including hospitals, managed service organizations and provider networks and data analysis consultants. Further, individual physicians who are contracted within our network may affiliate with our competitors. Competition from hospitals, managed service organizations and provider networks and data analysis consultants, payors and other parties could result in payors changing the benefit structure that is offered to our members, which could negatively impact our profitability and market share.
Our primary competitors include ChenMed, Oak Street Health, Optum and VillageMD, in addition to numerous local provider networks, hospitals and health systems. Moreover, large, well-financed payors have in some cases developed their own managed services tools and may provide these services to their physicians and patients at discounted prices, or may seek to expand their relationships with additional competing physicians or physician networks, including in geographic areas we serve. This may result in a more competitive environment and increased challenges to grow at the rates we have projected. We expect that competition will continue to increase as a result of consolidation in the healthcare industry and increased demand for a Total Care Model.
Some of our competitors may have greater name recognition, particularly in local geographies, longer operating histories, superior products or services and significantly greater resources than we do. Further, our current or potential competitors may be acquired by or partner with third parties with greater available resources than we have. As a result, our competitors may be able to respond more quickly and effectively than we can to new or changing opportunities, technologies, standards or customer requirements and may have the ability to initiate or withstand substantial benefits structure and premium competition. In addition, current and potential competitors have established, and may in the future establish, cooperative relationships with providers of complementary services, technologies or services to increase the attractiveness of their services.
Accordingly, new competitors or alliances may emerge that have greater market share, a larger customer base, better data aggregation systems, greater marketing expertise, greater financial resources and larger marketing teams than we have, which could put us at a competitive disadvantage. Our competitors could also be better positioned to serve certain segments of the healthcare delivery industry, which could create additional pressure on the premiums that our payors are able to charge. If we are unable to successfully compete, our business, financial condition, cash flows and results of operations could be materially adversely affected.
Our compensation and reputation are dependent on government performance standards and benchmarks, some of which depend on factors outside our control.
We contract with payors that participate in government healthcare programs and, as a result, are required to satisfy certain conditions, performance standards and benchmarks which we may not be able to control. For example, as part of the Patient Protection and Affordable Care Act (the “ACA”), the level of reimbursement each MA plan receives from CMS is dependent, in part, upon the quality rating of the plan. Such ratings impact the percentage of any cost savings rebate and any bonuses earned by such health plan. The CMS STAR rating system considers various measures, including, among others, quality of care, preventive services, chronic illness management and customer satisfaction. Agreements with certain of our payors may condition amounts paid to us based upon improvements to contracted payors’ STAR ratings. If we are not eligible for quality bonuses or if we contract with payors who experience a reduction in their STAR ratings, we may experience a negative impact on our revenues, which could materially and adversely affect the marketability of our platform, partnership and network model to physicians, our membership levels and our business, financial condition, cash flows and results of operations. Further, our payors’ STAR ratings are based on the services they provide to their overall contracted attributed membership in a defined geography. As a result, even if we effectively engage and manage our membership, changes in such payors’ STAR ratings are outside our control. Furthermore, CMS has terminated MA plans that have had a low quality rating for three consecutive years. Low quality ratings can potentially lead to the termination of certain plans with which we contract, or a shifting of beneficiaries to alternative plans with higher STAR ratings, which could in turn have a material adverse effect on our business, financial condition, cash flows and results of operations.
40
Government funding for healthcare programs is subject to statutory and regulatory changes, administrative rulings, interpretations of policy and determinations by intermediaries and governmental funding restrictions, all of which could materially impact program coverage and reimbursements for both institutional and professional services.
The healthcare industry in the United States is undergoing significant structural change and is rapidly evolving. Such changes could ultimately result in substantial changes in Medicare coverage and reimbursement, as well as changes in coverage or amounts paid by private payors, which could have an adverse impact on our revenues from those sources. The frequent enactment of, changes to or interpretations of laws and regulations relating to healthcare could, among other things: force us to restructure our relationships with payors and physician partners within our network; require us to implement additional or different programs and systems; restrict revenue and member growth; increase our medical and administrative costs; impose additional capital and surplus requirements; increase or change our liability to members in the event of malpractice by our physician partners and potentially increase, or add new, criminal, civil and administrative penalties that could be imposed on us in the event our operations were found to be
non-compliant
with new or existing laws and regulations. In addition, changes in political party or administrations at the state or federal level may change the attitude towards healthcare programs and result in changes to the existing legislative or regulatory environment.Government funding for healthcare programs is subject to statutory and regulatory changes, administrative rulings, interpretations of policy and determinations by intermediaries and governmental funding restrictions, all of which could materially impact program coverage and reimbursement levels. Various legislative, judicial and executive efforts have made the status of federal healthcare program funding and many other aspects of the U.S. healthcare system, particularly the status of reforms implemented under the ACA, unclear. Budget pressures often lead the federal government to reduce or impose limitations on reimbursement rates, which has in the past and could in the future result in substantial reductions in our revenue and operating margins. For example, since the passage of the Sequestration Transparency Act of 2012, Medicare payments have been subject to a 2% sequestration reduction; these cuts were the result of a congressional deal to address the debt ceiling crisis. The CARES Act temporarily suspended the 2% sequestration payment adjustment on Medicare payments from May 1, 2020 through December 31, 2020, which was extended through December 31, 2021 by the Act to Prevent Across-the-Board Direct Spending Cuts, and for Other Purposes, signed on April 14, 2021. However, passage of the Infrastructure Investment and Jobs Act and budget reconciliation bill is expected to effectuate a mandatory sequestration reduction, through 2031. Further, the passage of the Improving Medicare Post-Acute Care Transformation (“IMPACT”) Act imposes a stringent timeline for implementing benchmark quality measures and data metrics across post-acute care providers. CMS has promulgated, and may continue to promulgate, regulations to implement provisions of the IMPACT Act. The costs of implementation could be significant, particularly with respect to the design of a unified payment methodology for post-acute providers. Failure to meet implementation requirements could expose providers to payment reductions and penalties.
There is also uncertainty regarding both MA payment rates and beneficiary enrollment, which, if reduced, would adversely affect our overall revenues and net income. Each year, CMS issues a final rule to establish the MA benchmark payment rates for the following calendar year. Any reduction to such benchmark rates may have a material adverse effect on our business, financial condition, cash flows and results of operations. We may be further impacted by the relative growth of our MA patient volumes across geographies. However, MA enrollment may not continue to grow at the same rate it has over the last decade. Passage of the Infrastructure Investment and Jobs Act and budget reconciliation bill is expected to expand traditional Medicare coverage, likely to vision, dental and hearing coverage, and lower the program’s eligibility age; such changes may increase competition between traditional Medicare and MA, which could have a material adverse effect on our business, financial condition, cash flows and results of operations. Further, we may not capture a material portion of enrollments, particularly since MA enrollment is increasingly concentrated amongst a small group of payors. Uncertainty over MA payment rates and enrollment presents a continuing risk to our business.
We are unable to determine how any future federal spending cuts or other industry changes and reform will affect Medicare reimbursement and, accordingly, our business. There likely will continue to be legislative and
41
regulatory proposals at the federal level directed at containing or lowering the cost of healthcare that, if adopted, could have a material adverse effect on our business, financial condition, cash flows and results of operations. Our inability to keep pace with changes in government regulations and the healthcare industry could constrain our ability to grow and could have a material adverse effect on our business, financial condition, cash flows and results of operations.
Regulatory proposals directed at containing or lowering the cost of healthcare, including the Direct Contracting Model, and our participation, voluntary or otherwise, in such proposed models, could impact our business, financial condition, cash flows and operations.
The CMS Innovation Center continues to test an array of alternative payment models that could impact our business, financial condition, cash flows and operations. For example, the CMS Innovation Center has created the Direct Contracting Model to allow a variety of different organizations called DCEs to negotiate directly with the government to manage traditional Medicare beneficiaries and share in the savings and losses generated from managing such beneficiaries. We, in conjunction with some of our physician partners, began participating in the Direct Contracting Model in certain geographies on April 1, 2021. The Direct Contracting Model’s economic structure, including risk adjustment methodologies, quality reporting and model timelines, has been built upon CMS’ experience with other programs, including MA and the Medicare Shared Savings Program, but also has new elements, such as a risk adjustment model developed specifically for use in the Direct Contracting Model. Likewise, the Direct Contracting Model rate book is based on the same methodology used for the MA rate book but has been modified in light of the characteristics of the Direct Contracting Model. Because the Direct Contracting Model is a new and evolving program, we are unable to determine how the Direct Contracting Model, or other alternative payment models promulgated by the CMS Innovation Center, will affect Medicare reimbursement and capitation benchmarks. For example, if the CMS Innovation Center fails to ensure the long-term predictability of revenue under the Direct Contracting Model, such reimbursement instability could adversely impact our business, financial condition, cash flows and operations. Additionally, if the CMS Innovation Center fails to streamline incentive program requirements for physicians across payment models, such conflicting requirements may impose additional compliance burdens on our affiliated physician partners’ practices, which may have a material adverse effect on process, quality and efficiency. Further, the future of the Direct Contracting Model under the Biden administration is unclear. On March 1, 2021, the CMS Innovation Center announced that the Geographic Population-Based Payment (“Geographic PBP”) model is under review and will no longer begin on January 1, 2022. On April 1, 2021, the CMS Innovation Center announced it would no longer be accepting applications from organizations interested in participating in the Global Professional Direct Contracting Model and will not solicit applications for a second round of participants to start the model on January 1, 2022 (subsequently, participation was opened to participants in the Next Generation ACO Model). The overall effect of these programmatic changes on the Direct Contracting Model is unknown.
Additionally, we are unable to predict how states will regulate DCEs and our participation in the Direct Contracting Model. For example, certain states in which we operate may require DCEs to obtain specific licensure to participate in the Direct Contracting Model and assume risk directly from CMS, which may require us to maintain certain levels of tangible net equity, meet working capital requirements, or expend significant resources on operational development. There likely will continue to be regulatory proposals directed at containing or lowering the cost of healthcare that, if adopted, could have a material adverse effect on our business, financial condition, cash flows and results of operations, including with respect to our contractual relationships with providers and payors.
We, as well as our physician partners and affiliates, have in the past, and could in the future, be subject to federal and state investigations, audits and enforcement actions.
Expansion of federal, state and payor enforcement activity could adversely affect our business, financial conditioncash flows and results of operations. Due to our payors’ participation in government and private healthcare programs, we are from time to time involved in inquiries, reviews, audits and investigations by
,
42
governmental agencies and private payors of our business practices, including assessments of our compliance with coding, billing and documentation requirements and compliance with rules governing delegation of insurance functions, ranging from claims management to utilization review. In this regard, both federal and state government agencies have active civil and criminal enforcement efforts against healthcare companies and their executives and managers. These investigations could also be initiated by private whistleblowers.
Responding to audit and investigative activities can be costly and disruptive to our business, even when the allegations are without merit. If we are subject to an audit or investigation, a finding could be made that we have violated relevant state or federal legal standards in our operations or in how we have structured our arrangements and relationships or that we or our affiliates have erroneously billed or were incorrectly reimbursed. At the conclusion of such audits or investigations, we may be required to repay such agencies or payors, and may be subjected to
pre-payment
reviews, which can be time-consuming and result innon-payment
or delayed payments for the services we or our affiliates provide. We may also be subject to financial sanctions or required to modify our operations.Investigations, audits or enforcement actions with respect to our physician partners could have an adverse effect on us. We do not directly employ or control our physician partners, and accordingly any adverse effects on us regarding such government activities are outside our control and are uncertain and unpredictable.
We have in the past, and may in the future, be subject to regulatory inquiries and CAPs imposed by our payors.
We have in the past been, and may in the future be, subject to regulatory inquiries and corrective action plans (“CAPs”) imposed by our payors, and the status of certain state regulatory and payor inquiries is uncertain. For example, in February 2018, our subsidiary, PPMC, self-disclosed to the California Department of Managed Health Care (“DMHC”), the California Department of Health Care Services, and our affected payors certain noncompliant practices in our claims and utilization management. We submitted various reports in May, June and August of 2018 and coordinated with the DMHC and certain of our payors to remediate noncompliant claims and utilization management practices and implement improvements through various CAPs. On December 17, 2019, we completed substantial remediation of all known deficiencies identified by the DMHC’s audit findings. In February 2021, we divested all of our California operations. On March 9, 2021, we received a set of investigative interrogatories from the DMHC pursuant to its investigation of conduct and matters described in our various reports. The interrogatories sought information concerning certain claims data and authorizations denied due to lack of medical necessity, including information regarding the health plans affected thereby. We responded timely to such interrogatories and provided requested information. Any adverse review, audit or investigation could result in, among other things: refunding of amounts we have been paid pursuant to our contracts; or the imposition of fines, penalties and other sanctions on us, or certain of our payors. While we do not expect the amount to be material, we are unable to predict the potential dollar value of recoupments or fines, penalties or other sanctions that may be imposed on us or the impacted payors related to the DMHC’s audit findings, if any. Per publicly available information, five out of the nine impacted payors have entered into letters of agreement with the DMHC whereby each of the payors have agreed to pay an administrative penalty related to the deficiencies. These penalties equal $122,500 in the aggregate. The DMHC has imposed an administrative penalty on at least one of the remaining impacted payors. At least one payor has formally sought indemnification from us in the amount of $80,000 for penalties related to the DMHC audit findings. We are unable to predict the potential dollar value of claims or demands that could be asserted in the future, if any. While we have divested all of our California operations as of February 2021, for the Southern California and Fresno divestiture transactions we will continue to be responsible for any liabilities arising from the business which were incurred prior to the closing date of each transaction, including any fines, penalties and other sanctions relating to the DMHC matter described above, the payment of claims for medical services incurred prior to the effective date of each transaction, a liability for unrecognized tax benefits for which we are indemnified and other contingent liabilities that we currently believe are remote. See “Note 8. Medical Claims and Related Payables,” “Note 14. Income Taxes” and “Note 19. Discontinued Operations” in our audited consolidated financial statements included elsewhere in this prospectus.
43
Further, we may be audited by payors and regulatory bodies, and we have been required to engage in and respond to payor corrective action plans and regulatory inquiries in the past. In some cases, payors and regulatory bodies have required us to contribute a material amount of risk-bearing capital to our local operating subsidiaries in the form of letters of credit or restricted deposits, and we expect that payors and regulatory bodies will continue to require us to contribute risk-bearing capital going forward. As of June 30, 2021 and December 31, 2020, risk-bearing capital required across our geographies and payors totaled $57.8 million and $38.8 million, respectively. There is also a risk that such amounts may be increased in the future as a result of regulatory changes, changes in performance by our local operating subsidiaries and physician partners and expansion of our business.
Repayment obligations arising out of payor audits, such as CMS RADV audits, can be significant and adversely impact reimbursement rates.
Our payors are subject to audit by government health plans, including, but not limited to, CMS, in connection with the MA program. CMS and the HHS Office of Inspector General perform RADV audits, which can result in the recovery of payments from managed care organizations if errors are identified and influence the calculation of premium payments by CMS to MA plans. In addition, certain of our payor contracts incorporate language that enables payors to recoup funding from us in the event that CMS requires payment under an RADV audit. As a result of such audits and contracts, our payors may demand recoupments or adjustments from us, bring recovery proceedings against us, require us to submit and implement corrective action plans, or terminate agreements with our physician partners. The results of RADV audits could also adversely impact the compensation we receive from payors, which could have a material adverse effect on our revenue. Disclosure of any adverse audit results could also negatively affect our reputation and make it more difficult to attract members, physician partners and payors.
CMS may modify the methodology utilized to determine revenue associated with MA members, including but not limited to the CMS Risk Adjustment Processing System for calculating risk adjustment factors, which could adversely impact us.
Changes to how CMS calculates revenues associated with MA members, as well as members’ risk adjustment factors under the MA program, could adversely impact our revenues or understate risk adjustment factors for our members, causing us to be underpaid relative to expenses incurred, especially for members with severe or chronic medical conditions. CMS is currently phasing in the process of calculating risk adjustment factors using diagnosis data from the Encounter Data System (“EDS”) rather than using diagnosis data from the CMS Risk Adjustment Processing System (“RAPS”). The RAPS process requires MA plans to apply a filter logic based on CMS guidelines and only submit diagnoses that satisfy those guidelines. Conversely, the EDS process requires MA plans to submit all encounter data, and CMS will apply the risk adjustment filtering logic to determine the risk adjustment factors. For 2020 and 2019, respectively, 50% and 25% of our MA members’ risk adjustment factor was calculated from claims data submitted through EDS. CMS increased that percentage to 75% in 2021 and will increase that percentage to 100% in 2022. The
phase-in
from RAPS to EDS could result in different risk adjustment factors from each dataset as a result of plan processing issues, CMS processing issues and filtering logic differences between RAPS and EDS. Such changes in risk adjustment factors could have a material adverse effect on our business, financial condition, cash flows and results of operations.CMS may annually adjust other components of the methodology utilized to determine revenues associated with MA members, including but not limited to the fee for service normalization factor, coding intensity adjustment or corridors utilized to determine calculations contributing to rebate amounts or STAR ratings. Such revisions could result in a reduction of our revenues. Our revenues could be further reduced by passage of the Infrastructure Investment and Jobs Act and budget reconciliation bill, which are expected to increase the MA coding intensity adjustment.
44
Negative publicity regarding the managed healthcare industry generally could adversely affect our results of operations or business.
Negative publicity regarding the managed healthcare industry generally, or the MA program in particular, may result in increased regulation and legislative review of industry practices that further increase our costs of doing business and adversely affect our results of operations or business by:
| • | requiring us to change our platform and services; |
| • | increasing the regulatory, including compliance, burdens under which we operate, which, in turn, may negatively impact the manner in which we provide services and increase our costs; |
| • | adversely affecting our ability to market our services through the imposition of further regulatory restrictions regarding the manner in which plans market to MA enrollees; or |
| • | adversely affecting our ability to attract and retain physician partners and have patients attributed to those physician partners. |
Legal and Regulatory Risks
The healthcare industry is intensely regulated at the federal, state and local levels and government authorities may determine that we fail to comply with applicable laws or regulations and take actions against us.
As a company involved in the healthcare industry with substantially all of our revenue derived from government programs, our business activities are subject to substantial governmental regulation. There are significant costs involved in complying with these laws and regulations. If we are found to have violated any applicable laws or regulations, we could be subject to civil or criminal damages, fines, sanctions or penalties, including exclusion from participation in government healthcare programs, such as Medicare, and we may be required to change our method of operations and business strategy. These consequences could be the result of our current conduct or even conduct that occurred a number of years ago, including prior to the acquisition of our subsidiary, PPMC, and prior to existing physician partners joining our network. We have in the past incurred, and may in the future incur, significant costs to defend ourselves if we become the subject of an investigation or legal proceeding alleging a violation of these laws and regulations. A federal, state or local government could determine that we are not operating in accordance with the law, or whether, when or how the laws, or the interpretation thereof, will change in the future and impact our business, financial condition, cash flows and results of operations.
In addition, some of the governmental and regulatory bodies that regulate us may consider enhanced or new regulatory requirements or may seek to exercise their supervisory or enforcement authority in new or more robust ways. Any of these possibilities, if they occur, could adversely affect us.
Our operations are subject to extensive federal, state and local government laws and regulations, such as:
| • | Federal and state laws, and related regulations, including the False Claims Act and the Civil Monetary Penalties Law (“CMPL”), which impose civil and criminal liability on individuals or entities that knowingly submit false or fraudulent claims for payment, or knowingly make, or cause to be made, a false statement in order to have a false claim paid, including qui tam |
| • | Federal and state anti-kickback laws, and related regulations, which generally prohibit transactions intended to induce or reward referrals for items or services reimbursable by a federal healthcare program; |
| • | Federal and state physician self-referral prohibition statutes, and related regulations, which generally prohibit physicians from referring a patient to an entity providing designated health services (“DHS”) if the physician (or his/her immediate family member) has a financial relationship with that entity; |
45
| • | Provisions of, and regulations enacted pursuant to, HIPAA, as amended by the Health Information Technology for Economic and Clinical Health Act of 2009 (the “HITECH Act”) and the American Recovery and Reinvestment Act of 2009, as well as similar or more stringent state laws, regarding the collection, use and disclosure of health information; |
| • | Provisions of, and regulations enacted pursuant to, the 21 st Century Cures Act, regarding interoperability and prohibitions against information blocking; |
| • | Federal laws and regulations that require providers to enroll in the Medicare program before submitting any claims for services, to promptly report certain changes in operations to the agencies that administer these programs, and to re-enroll in these programs when changes in direct or indirect ownership occur or in response to revalidation requests from Medicare; |
| • | Federal and state laws that govern managed care organizations, such as our payors, and downstream contracted entities, such as our RBEs, including laws governing timely payment of claims, quality assurance, utilization review, credentialing, financial solvency, downstream transfers of risk and payor-provider contractual relationships; |
| • | State laws that govern the activities of third-party administrators and utilization review agents; and |
| • | State laws that prohibit general business entities from practicing medicine, controlling physicians’ medical decisions or engaging in certain practices, such as splitting fees with physicians. |
These and other healthcare laws and regulations that may affect us are further described in “Business—Healthcare and Other Applicable Regulatory Matters.”
The laws and regulations applicable to our business are complex, changing and often subject to varying interpretations. As a result, we may not be able to adhere to all applicable laws and regulations. Any violation or alleged violation of any of these laws or regulations by us or our affiliates, or our physician partners or payors, could have a material adverse effect on our business, financial condition, cash flows and results of operations. We have been and may be a party to various lawsuits, demands, claims,suits, government investigations and audits, of which any could result in, among other things, substantial financial penalties or awards against us, reputational harm, termination of relationships or contracts related to our business, mandated refunds, substantial payments made by us, required changes to our business practices, exclusion from future participation in Medicare and other healthcare programs and possible criminal penalties.
qui tam
If we are found in violation of applicable laws or regulations, we could suffer severe consequences that would have a material adverse effect on our business, results of operations, financial condition, cash flows, reputation and stock price, including:
| • | suspension or termination of our participation in federal healthcare programs; |
| • | criminal or civil liability, fines, damages or monetary penalties for violations of healthcare fraud and abuse laws, including the federal False Claims Act, CMPL, Anti-Kickback Statute and Stark Law; |
| • | enforcement actions by governmental agencies or claims for monetary damages by patients under federal or state patient privacy laws, including HIPAA; |
| • | enforcement actions by governmental agencies or monetary penalties for violations of the 21 st Century Cures Act; |
| • | repayment of amounts received in violation of law or applicable payment program requirements, and related monetary penalties; |
| • | mandated changes to our practices or procedures that materially increase operating expenses; |
| • | imposition of corporate integrity agreements that could subject us to ongoing audits and reporting requirements as well as increased scrutiny of our billing and business practices; |
46
| • | termination of various relationships or contracts related to our business; and |
| • | harm to our reputation which could negatively affect our business relationships, decrease our ability to attract or retain patients and physicians, decrease access to new business opportunities and impact our ability to obtain financing, among other things. |
Responding to lawsuits and other proceedings as well as defending ourselves in such matters will continue to require management’s attention and cause us to incur significant legal expense. It is also possible that criminal proceedings may be initiated against us or individuals in our business in connection with investigations by the federal government.
We rely on our physician partners to comply with certain laws or regulations, including licensure and certification requirements to provide healthcare services, operate facilities or administer pharmaceuticals in the states in which we conduct business, and billing and coding compliance with respect to the provision of services. Although we provide some high-level training, and, if needed, supplemented clinical or coding staff as appropriate, to ensure that all health conditions are assessed and sufficiently documented by our physician partners and network providers, and we perform audits on this process, we do not as a general matter supervise or control our physician partners or network providers; accordingly any adverse effects on us regarding their noncompliance are uncertain and unpredictable.
The healthcare industry is subject to antitrust scrutiny, and if it is found that we violate antitrust laws, we could be subject to enforcement actions that could have a material adverse effect on our business, financial condition, cash flows and results of operations.
The healthcare industry is subject to antitrust scrutiny. The federal government and most states have enacted antitrust laws that prohibit certain types of conduct deemed to be anti-competitive. The Federal Trade Commission (the “FTC”), the Antitrust Division of the Department of Justice (“DOJ”) and state Attorneys General actively review and, in some cases, take enforcement action against business conduct and acquisitions in the healthcare industry. Private parties harmed by alleged anti-competitive conduct can also bring antitrust suits. Violations of antitrust laws may be punishable by substantial penalties, including significant monetary fines and treble damages, civil penalties, criminal sanctions and consent decrees and injunctions prohibiting certain activities or requiring divestiture or discontinuance of business operations. If antitrust enforcement authorities conclude that we violate any antitrust laws, we could be subject to enforcement actions that could have a material adverse effect on our business, financial condition, cash flows and results of operations.
If we are unable to effectively adapt to changes in the healthcare industry, including changes to laws and regulations regarding or affecting the U.S. healthcare reform, our business may be harmed.
Due to the importance of the healthcare industry in the lives of all Americans, federal, state and local legislative bodies frequently pass legislation and promulgate regulations relating to healthcare reform or that affect the healthcare industry. As has been the trend in recent years, it is reasonable to assume that there will continue to be increased government oversight and regulation of the healthcare industry in the future. We cannot predict the ultimate content, timing or effect of any new healthcare legislation or regulations, nor is it possible at this time to estimate the impact of potential new legislation or regulations on our business. It is possible that future legislation enacted by Congress or state legislatures, or regulations promulgated by regulatory authorities at the federal or state level, could adversely affect our business or could change the operating environment of our primary care centers. It is also possible that the changes to federal healthcare program reimbursements may serve as precedent to possible changes in other payors’ reimbursement policies in a manner adverse to us. Similarly, changes in private payor reimbursements could lead to adverse changes in federal healthcare programs, which could have a material adverse effect on our business, financial condition, cash flows and results of operations.
There can be no assurance that we will be able to successfully address changes in the current regulatory environment. Some of the healthcare laws and regulations applicable to us are subject to limited or evolving
47
interpretations, and a review of our business or operations by a court, law enforcement or a regulatory authority might result in a determination that could have a material adverse effect on us. Furthermore, the healthcare laws and regulations applicable to us may be amended or interpreted in a manner that could have a material adverse effect on our business, financial condition, cash flows and results of operations.
If our physician alignment strategies with our physician partners—including the formation of risk and shared savings pools, making downstream payments and joint venture arrangements—are not in compliance with the state and federal fraud and abuse laws, including physician incentive plan laws and regulations, we could be subject to penalties.
A central component of our clinical and operational strategy is to encourage alignment with our physician partners so as to incentivize them to (i) increase the quality of care while appropriately managing overall costs and (ii) participate in various care management and care coordination programs. Such alignment is often achieved through the design of risk or other incentive pools, with gating quality metrics that participating physicians must first satisfy before being allowed to share in cost savings. In other instances, we may support the delivery of care through a number of means, such as the provision of additional capital to improve and enhance the delivery of quality of care and improve access to quality care or by entering into a joint venture with a physician partner and other healthcare entities.
All such arrangements can implicate, and must be structured to be in compliance with, all applicable federal and state fraud and abuse laws including the federal Anti-Kickback Statute and the Stark Law. See “Business—Healthcare and Other Applicable Regulatory Matters—Federal and State Anti-Kickback Statutes” and “Business—Healthcare and Other Applicable Regulatory Matters—Stark Law.”
The laws and regulations, however, are complex, and we may not be successful in structuring our arrangements in compliance with them. Should government regulatory or enforcement authorities find any arrangement to be out of compliance with such laws or regulations, then criminal, civil and administrative penalties could be imposed on us or on our physician partners and affiliated entities.
In addition, all such arrangements can implicate, and must be structured in compliance with, state and federal laws and regulations that prohibit payors and their downstream entities from linking physician incentives to reducing or limiting necessary medical services to patients. Violation of such laws or regulations can subject payors to significant civil monetary penalties, as well as possible sanctions, such as suspension of the payor’s enrollment of patients, suspension of communication activities to potential patients and exclusion from government healthcare programs. Our failure to comply with these laws could cause us to be in breach of our agreements with payors, which could lead to significant financial penalties or termination of our contracts with payors, all of which could materially and adversely affect our business, financial condition, cash flows and results of operations.
Our business development and member engagement activities may implicate laws and regulations regarding marketing, beneficiary inducements, telemarketing and use of protected health information.
Medicare product marketing and sales activities are regulated by CMS and the states in which we operate. Medicare Managed Care marketing requirements are outlined in the Medicare Marketing Guidelines, a
sub-regulatory
guidance document updated annually. CMS has oversight over all MA marketing materials and outreach activities. To maintain appropriate beneficiary safeguards while not impeding the physician-patient relationship, the Medicare Marketing Guidelines set forth acceptable activities in the healthcare setting. For example, payors may not allow contracted physicians to accept/collect scope of appointment forms, but may allow contracted physicians to make available communication materials regarding MA plans in areas where care is being delivered. In addition, through our participation in the CMS Innovation Center Direct Contracting Model, we (either as a DCE or as a service provider to our physician partners who are participating in the model) must comply with provisions in the participation agreements with CMS regarding marketing and outreach48
activities. For example, DCEs must have their plans for marketing activities approved by CMS and are prohibited from engaging in some forms of marketing activities such as door-to-door solicitation. Similarly, state laws governing managed care organizations also address allowable marketing and enrollee communication practices.
Marketing and outreach activities undertaken in the healthcare industry—whether undertaken by or on behalf of providers and payors—are subject to a complex web of laws and regulations designed to prevent fraud and abuse. See “Business—Healthcare and Other Applicable Regulatory Matters—Federal and State Anti-Kickback Statutes” and “Business—Healthcare and Other Applicable Regulatory Matters—Civil Monetary Penalties Statute.” Our physician partners and the payors with which we contract risk running afoul of applicable state and federal fraud and abuse laws—including the Anti-Kickback Statute and CMPL—and laws governing marketing and member outreach (, the Medicare Marketing Guidelines). Failure to comply with such laws can lead to severe penalties, including sanctions, fees, civil monetary penalties, imprisonment and exclusion from participation in federal healthcare programs. The imposition of such penalties against our physician partners or the payors with which we contract, could have a material adverse effect on our business, financial condition, cash flows and results of operations.
e.g.
Our business development and member engagement activities may implicate the federal Telephone Consumer Protection Act (“TCPA”), related Federal Communication Commission (“FCC”) orders and analogous state laws which impose significant restrictions on the ability to utilize telephone calls and text messages to mobile telephone numbers as a means of communication, when the prior consent of the person being contacted has not been obtained. See “Business—Healthcare and Other Applicable Regulatory Matters—Consumer Protection Laws.” A determination that we, one of our affiliates, one of our vendors or one of our physician partners violated the TCPA or other communications-based statutes could expose us to significant damage awards that could, individually or in the aggregate, materially harm our business, financial condition, cash flows and results of operations.
Certain failures by our physician partners to comply with these laws could have an adverse effect on us. We do not directly employ or control our physician partners, and accordingly any adverse effects on us regarding their noncompliance are uncertain and unpredictable.
These activities also implicate privacy laws, such as HIPAA and analogous state laws, which limit how we and our affiliates can use an individual’s protected health information in connection with marketing activities and member outreach activities. A violation of such laws could subject us to significant penalties.
Our physician partners are subject to federal and state healthcare fraud and abuse laws and regulations.
Our physician partners are
subject to various federal and state laws pertaining to healthcare fraud and abuse, including, among others, the federal Anti-Kickback Statute, Stark Law and False Claims Act and analogous state laws. See “Business—Healthcare and Other Applicable Regulatory Matters.” Violations of these laws can occur under many different circumstances, including, for example, if a physician partner is engaging in prohibited financial and referral relationships with other physicians or providers; is improperly documenting and coding for services; is making prohibited internal referrals for certain services covered by the Stark Law or analogous state laws or is providing benefits to induce patients to self-refer. Depending on the circumstances, violations of these laws can be punishable by criminal and civil sanctions, including exclusion from participation in federal and state healthcare programs. Should government authorities find that our physician partners have violated applicable law or regulations, our physician partners could be subject to criminal and civil penalties that could adversely affect our reputation and have a material adverse effect on our business, financial condition, cash flows and results of operations.
In addition, our physician partners are subject to federal, state and local licensing regulations relating to, among other things, professional credentialing, the ability to practice medicine, professional ethics and prescribing medication and controlled substances. See “Business—Healthcare and Other Applicable Regulatory
49
Matters—Other Laws and Regulations.” If our physician partners fail to obtain and maintain all necessary licenses, certifications, accreditations and other approvals and operate in compliance with applicable healthcare and other laws, their ability to provide medical services to members would be impaired.
Given our reliance on anchor physician practices in some geographies, such noncompliance could materially and adversely affect our business, financial condition, cash flows and results of operations. We do not directly employ or control our physician partners, and accordingly any adverse effects on us regarding their noncompliance with laws and regulations are uncertain and unpredictable.
Our use, disclosure and processing of personally identifiable information, protected health information and de-identified data is subject to HIPAA and state patient confidentiality laws, and our failure to comply with those regulations or to adequately secure the information we hold could result in significant liability or reputational harm and, in turn, cause a material adverse effect on our members and revenue.
Numerous state and federal laws and regulations govern the collection, dissemination, use, privacy, confidentiality, security, availability, integrity and other processing of PHI and, more broadly, personally identifiable information whether or not related to healthcare. These laws and regulations include HIPAA, as amended by the HITECH Act. HIPAA establishes a set of national privacy and security standards for the protection of PHI by health plans, healthcare clearinghouses and certain healthcare providers, referred to as covered entities, and the business associates with which such covered entities contract for services. Components of our business are considered “covered entities” under HIPAA and others are considered “business associates” of our healthcare partners and payors.
HIPAA requires covered entities and business associates to develop and maintain policies and procedures with respect to PHI that is used or disclosed, including the adoption of administrative, physical and technical safeguards to protect such information. HIPAA also implemented the use of standard transaction code sets and standard identifiers that covered entities must use when submitting or receiving certain electronic healthcare transactions, including activities associated with the billing and collection of healthcare claims.
In addition to federal regulations issued under HIPAA, some states have enacted their own data privacy and security statutes or regulations that govern the use and disclosure of a person’s health information or records. Such state laws, if more stringent than HIPAA requirements, are not preempted by the federal requirements, and we are required to comply with them. See “Business—Healthcare and Other Applicable Regulatory Matters—Federal and State Privacy and Security Requirements.” These and other laws and regulations affecting data security and data privacy are often uncertain, contradictory and subject to changing interpretations, and we expect new laws, rules and regulations regarding data privacy and information security to be proposed and enacted in the future. This complex, dynamic legal landscape creates significant compliance issues and potentially exposes us to expense, adverse publicity and liability. The regulatory framework for data privacy and security issues worldwide is evolving and is likely to remain in flux for the foreseeable future, so it is unclear how regulatory changes could impact our business or the costs of compliance, though the impacts and costs seem likely to increase. The general legal trend in the data privacy and security area is toward the broader adoption of more stringent laws and toward more aggressive enforcement.
The data privacy and security measures we have implemented may not adequately protect us from the risks associated with the storage and transmission of customer information and PHI. The security measures that we, and our third-party vendors and subcontractors, have in place to promote compliance with data privacy and data security laws may not protect our facilities and systems from data security breaches, acts of vandalism or theft, computer viruses, misplaced or lost data, programming and human errors, or other similar events. In the event that new data security laws are implemented, we may not be able to timely comply with such requirements, or such requirements may not be compatible with our current safeguards. Changing our safeguards could be time-consuming and expensive, and failure to timely implement required changes could subject us to liability for
non-compliance.
Under HIPAA, certain of our entities are directly liable for any data privacy and data security50
breaches that occur in our capacity as a covered entity. Under the HITECH Act, as business associates, our RBEs may also be directly liable under certain circumstances for data privacy and data security breaches and failures of our subcontractors. We from time to time experience security and privacy issues that require assessment of our duties and obligations under HIPAA, and we cannot guarantee that we will not face security or privacy breaches in the future. Additionally, the investigation and remediation of privacy breaches may result in additional material direct or indirect costs.
We incur substantial costs related to ordinary-course compliance with HIPAA and the HITECH Act. Such compliance could also require us to change our practices in a manner adverse to our business. Failure to comply with any applicable standards regarding patient privacy, or data privacy and data security more generally, may subject us to penalties, including significant civil monetary penalties and, in some circumstances, criminal penalties. In addition, any such failures may injure our reputation and adversely affect our ability to retain customers and attract new customers. Even an unsuccessful challenge by regulatory authorities could result in adverse publicity and could require a costly response. Any of the foregoing consequences could have a material adverse impact on our business, financial condition, cash flows and results of operations.
Certain failures or, through the loss of protected health information or failure to provide timely access to health records), or otherwise implicates our data processing or billing operations, we could suffer reputational harm or a material adverse effect on our business, financial condition, cash flows and results of operations.
non-compliance
by our physician partners under these laws could result in their being required as covered entities to report to governmental authorities and patients, implement expensive corrections and pay civil penalties. For example, we note that in 2019, the Office for Civil Rights (OCR) announced the creation of its Right of Access Initiative, intended to support individuals’ right of timely access to their health records. Since the creation of the Right of Access Initiative, there has been substantial enforcement activity related to covered entities’ alleged failures to provide individuals with timely access to their health records. To the extent the physician partners’non-compliance
impacts members who are attributed to our RBEs (e.g.
Failure to obtain or maintain an insurance license, a certificate of authority or an equivalent authorization allowing our participation in downstream risk-sharing arrangements with payors could subject us to significant penalties and adversely impact our operations.
Regulation of downstream risk-sharing arrangements, including, but not limited to, global risk and other value-based arrangements, varies significantly from state to state. See “Business—Healthcare and Other Applicable Regulatory Matters—Federal and State Insurance and Managed Care Laws.” We therefore expect significant uncertainty regarding whether our operations fall within the scope of certain laws or regulations.
If a state in which we currently operate, or a new geography, views our participation in risk-sharing arrangements as the assumption of insurance risk, the arrangement may fall within the purview of state insurance or managed care laws. If so, in connection with our continued operations or our expansion into new geographies, we may be required to obtain a state insurance or managed care license (or some other type of registration) and comply with the state’s insurance or managed care laws and regulations. Such laws and regulations may subject us to significant oversight by state regulators in the form of periodic reporting and audits, required financial reserves and refraining from taking certain actions without prior regulatory approval. The majority of states do not explicitly address whether and in what manner the state regulates the transfer of risk by a payor to a downstream entity, and in such states, regulators may nonetheless interpret statutes and regulations to regulate such activity. If downstream risk-sharing arrangements are not regulated directly in a particular state, the state regulatory agency may nonetheless require oversight by the licensed payor as the party to such a downstream risk-sharing arrangement. Such oversight is accomplished via contract and may include the imposition of reserve requirements and reporting obligations. Failure to comply with these direct and indirect oversight laws can result in significant monetary penalties, administrative fines, fraud or misrepresentation charges, denial of future insurer applications or loss of membership or suspension of membership growth.
51
Laws regulating the corporate practice of medicine could restrict the manner in which we are permitted to conduct our business, and the failure to comply with such laws, or any changes to such laws or regulations or similar laws or regulations could subject us to penalties and restructuring, or have a material adverse effect on our consolidation of the accounts of our majority-owned subsidiaries.
Some of the states in which we operate limit the practice of medicine to licensed individuals or professional organizations comprising licensed individuals, and lay business corporations generally may not exercise control over the medical decisions of physicians. Certain state regulatory bodies have taken the position that an arrangement that confers too much control over a physician practice to a lay entity may violate the corporate practice of medicine doctrine. See “Business—Healthcare and Other Applicable Regulatory Matters—Corporate Practice of Medicine.” A violation of the corporate practice of medicine doctrine constitutes the unlawful practice of medicine, which is subject to fines and other legal consequences. Penalties for violating
fee-splitting
statutes or regulations may include medical license revocation, suspension, probation or other disciplinary actions.It is possible that a state regulatory agency or a court could determine that under applicable rules governing the corporate practice of medicine, we are violating the corporate practice of medicine doctrine or that our arrangements constitute unlawful fee splitting. As a result, our arrangements could be deemed invalid, potentially resulting in a loss of revenues and an adverse effect on results of operations derived from such arrangements. We could be subject to civil or other legal consequences, and our agreements and the accompanying governance structures and arrangements could be found legally unenforceable (in whole or in part). Such a determination could force a restructuring of the arrangements with our RBEs and physician partners. Such a restructuring may not be feasible or may not be accomplished within a reasonable time frame or on reasonable terms, any of which could have a material adverse effect on our business, financial condition, cash flows and results of operations. We have been the subject of regulatory inquiries regarding our compliance with the corporate practice of medicine doctrine, and we cannot guarantee that we will not be subject to such inquiries in the future.
Further, our financial statements are consolidated in accordance with applicable accounting standards and include the accounts of our majority-owned subsidiaries, including RBEs, classified as variable interest entities. Such consolidation for accounting or tax purposes does not, is not intended to, and should not be deemed to, imply or provide us any control over the medical or clinical affairs of such practices. In the event of a change in accounting standards promulgated by the Financial Accounting Standards Board (“FASB”) or in interpretation of its standards, or if there is an adverse determination by a regulatory agency or a court, or a change in state or federal law relating to the ability to maintain such agreements or arrangements, we may not be permitted to continue to consolidate the revenues, expenses, assets and liabilities of our majority-owned subsidiaries classified as variable interest entities, which could have a material adverse effect on our business, financial condition, cash flows and results of operations.
If we or our physician partners inadvertently employ or contract with an excluded person, we may face government sanctions.
Individuals and entities can be excluded from participating in the Medicare program for violating certain laws and regulations, or for other reasons such as the loss of a license in any state, even if the person retains other licensure. This means that the excluded person or entity is prohibited from receiving payments for such person’s or entity’s services rendered to Medicare or MA beneficiaries, and if the excluded person is a physician, all services ordered (not just provided) by such physician are also
non-covered
andnon-payable.
Entities that employ or contract with excluded individuals are prohibited from billing the Medicare program for the excluded individual’s services and are subject to civil penalties if they do. We might inadvertently contract or do business with an excluded person or entity, such as a physician partner, contracted or employed physician, or any other contracted party, or with an excluded person which could become excluded in the future without our knowledge. If this occurs, we or our physician partnerships may be subject to substantial repayments and civil penalties. Physician partners are also expected to comply with these requirements. We do not directly control our physician partners, and accordingly any adverse effects on us regarding their noncompliance with these laws are uncertain and unpredictable.52
We may face lawsuits not covered by insurance and related expenses may be material. Our failure to avoid, defend and accrue for claims and litigation could negatively impact our business, financial condition, cash flows and results of operations.
We are exposed to, and may become involved in, various litigation matters arising out of our business, including from time to time, actual or threatened lawsuits. Lawsuits for tort liabilities associated with managed care activities that we conduct in our managed care business are common in the healthcare industry. Common liability exposures we face include performance of utilization review, performance of credentialing and peer review, provider network contracting determinations, and vicarious liability for the conduct of affiliated providers. Liability exposures in the managed care industry in which we operate vary greatly by state. The status of tort reform, availability of
non-economic
damages or the presence or absence of other statutes, such as elder abuse or vulnerable adult statutes, influence the incidence and severity of managed care litigation. We may also be subject to other types of lawsuits, inquiries, audits, investigations or other proceedings, such as those initiated by our competitors, stockholders, employees, service providers, contractors or by government agencies, including when we terminate relationships with them, which could involve large claims and significant defense costs. Furthermore, lawsuits for tort liabilities arising out of business activities, including the acquisition of other businesses or physician groups, also are common. Common liability exposures we face include interference with contract, interference with prospective economic advantage, violation of the Voidable Transactions Act, successor liability, and antitrust and unfair competition.The results of any such lawsuits, inquiries, audits, investigations or other proceedings cannot be predicted, and determining reserves for pending litigation or other matters requires significant judgment. Further, the defense of litigation, including fees of legal counsel, expert witnesses and related costs, is expensive and difficult to forecast accurately. Such costs may be unrecoverable even if we ultimately prevail in litigation, and could consume a significant portion of our limited capital resources. To defend lawsuits or participate in other proceedings, it may also be necessary for us to divert officers and other employees from our normal business functions to gather evidence, give testimony and otherwise support litigation efforts. If any such proceeding is not resolved in our favor, we could face material judgments or awards against us. An unfavorable resolution of one or more of the proceedings in which we are involved now or in the future could have a material adverse effect on our business, financial condition, cash flows and results of operations. We may also in the future find it necessary to file lawsuits to recover damages or protect our interests. The cost of such litigation could also be significant and unrecoverable, which could also deter us from aggressively pursuing even legitimate claims. All of our physician partners are required to carry medical malpractice insurance. We also currently maintain managed care errors and omissions insurance. We cannot be certain that our insurance coverage will be adequate to cover liabilities arising out of claims asserted against us, our affiliated professional organizations or our affiliated physicians. Liabilities incurred by us or our affiliates in excess of our insurance coverage, including coverage for professional liability and other claims, could have a material adverse effect on our business, financial condition, cash flows and results of operations. Our insurance coverages generally must be renewed annually and may not continue to be available to us in future years at acceptable costs and on favorable terms, which could increase our exposure to litigation. Further, such coverage typically has substantial deductibles for which we would be responsible.
Risks Related to Our Indebtedness
We have substantial indebtedness and may incur additional indebtedness, which could adversely affect our financial health and our ability to obtain financing in the future, react to changes in our business or satisfy our obligations.
As of December 31, 2020 we, through our wholly-owned subsidiary agilon health management, inc., had approximately $68.6 million of total long-term consolidated indebtedness outstanding under our secured credit agreement, dated as of July 1, 2016 (as amended from time to time, the “Secured Credit Agreement”) governing the term loan and revolving credit facility (the “Secured Credit Facility”), and our unsecured credit agreement, dated as of December 22, 2017 (the “Unsecured Credit Agreement”), governing our unsecured term loan facility
53
(the “Unsecured Term Loan Facility” and, together with the Secured Credit Facility, the “Credit Facilities”). As of such date, we also had $41.5 million of additional borrowings available under our revolving credit facility after taking into account $18.5 million of letters of credit outstanding. On February 18, 2021, we, through our wholly-owned subsidiary agilon health management, inc., entered into the credit agreement, dated as of February 18, 2021 (the “2021 Credit Agreement”) governing our term loan and revolving credit facility (as amended by the First Amendment to Credit Agreement, dated as of March 1, 2021, the “2021 Secured Credit Facilities”) by and among agilon health management, inc., Agilon Health Intermediate Holdings, Inc. (“Intermediate Holdings”), the Lenders party thereto, the Issuers party thereto (each as defined therein), JPMorgan Chase Bank, N.A., as administrative agent and as collateral agent, and JPMorgan Chase Bank, N.A. Bank of America, N.A., Wells Fargo Securities, LLC, Deutsche Bank Securities Inc. and Nomura Securities International, Inc., as joint lead arrangers and joint bookrunners to refinance our outstanding indebtedness under the Credit Facilities, consisting of (i) a senior secured term loan facility in an aggregate principal amount of $100.0 million and (ii) a senior secured revolving credit facility in an aggregate principal amount of $100.0 million. In connection with our IPO, on April 26, 2021 we made a mandatory prepayment of $50.0 million of the 2021 Secured Term Loan Facility as a result of the gross proceeds from the IPO exceeding $1.0 billion. Following the mandatory prepayment, we had $50.0 million outstanding under our Secured Term Loan Facility.
See “Description of Certain Indebtedness.” In addition, we may incur additional indebtedness in the future, subject to the limitations contained in the agreements governing our indebtedness. Our substantial indebtedness could have important consequences to you. Because of our substantial indebtedness:
| • | our ability to obtain additional financing for working capital, capital expenditures, acquisitions, debt service requirements, pay dividends and make other distributions or to purchase, redeem or retire capital stock or for general corporate purposes and our ability to satisfy our obligations with respect to our indebtedness may be impaired in the future; |
| • | a large portion of our cash flow from operations must be dedicated to the payment of principal and interest on our indebtedness, thereby reducing the funds available to us for other purposes; |
| • | we are exposed to the risk of increased interest rates because a significant portion of our borrowings are at variable rates of interest; |
| • | it may be more difficult for us to satisfy our obligations to our creditors, resulting in possible defaults on, and acceleration of, such indebtedness; |
| • | we may be more vulnerable to general adverse economic and industry conditions; |
| • | we may be at a competitive disadvantage compared to our competitors with proportionately less indebtedness or with comparable indebtedness on more favorable terms and, as a result, they may be better positioned to withstand economic downturns; |
| • | our ability to refinance indebtedness may be limited or the associated costs may increase; |
| • | our flexibility to adjust to changing market conditions and ability to withstand competitive pressures could be limited; |
| • | our ability to pay dividends and make other distributions or to purchase, redeem or retire capital stock may be limited; and |
| • | we may be prevented from carrying out capital spending and restructurings that are necessary or important to our growth strategy and efforts to improve our operating margins. |
Despite our indebtedness levels, we and our subsidiaries may incur substantially more indebtedness, which could increase the risks created by our indebtedness.
We and our subsidiaries may incur substantial additional indebtedness in the future. The terms of the 2021 Credit Agreement do not fully prohibit our subsidiaries from incurring additional debt. If our subsidiaries are in
54
compliance with certain coverage ratios set forth in the agreements governing the 2021 Secured Credit Facilities, they may be able to incur substantial additional indebtedness, which could increase the risks created by our current indebtedness. In addition, subject to certain conditions and without the consent of the then-existing lenders, the loans under the 2021 Secured Credit Facilities may be expanded (or new term loan facilities, revolving credit facilities or letter of credit facilities added) by up to $50.0 million plus an additional amount equal to the aggregate amount of certain prepayments, repayments and redemptions of term loans and/or permanent reduction in the revolving credit facilities.
Increases in interest rates would increase the cost of servicing our indebtedness and could reduce our profitability.
A significant portion of our outstanding indebtedness bears interest at variable rates, including $48.6 million of outstanding borrowings and $41.5 million of additional borrowings available under our Secured Credit Facility after taking into account $18.5 million of letters of credit outstanding, as of December 31, 2020. As adjusted for the entry into the 2021 Credit Facilities, as of June 30, 2021, we had $50.0 million of outstanding borrowings and $64.4 million of additional borrowings available under the 2021 Credit Facilities, after taking into account outstanding letters of credit totaling $35.6 million, of which $14.0 million is related to DCEs. As a result, increases in interest rates would increase the cost of servicing our indebtedness and could materially and adversely affect our business, financial condition, cash flows and results of operations. As of December 31, 2020, assuming the London Interbank Offered Rate (“LIBOR”) exceeded 1.00%, each one percentage point change in interest rates would have resulted in a change of approximately $0.5 million in the annual interest expense on our Secured Credit Facility. As of December 31, 2020, assuming availability was fully utilized, each one percentage point change in interest rates would have resulted in a change of approximately $1.1 million in annual interest expense on the Secured Credit Facility. The impact of increases in interest rates could be more significant for us than it would be for some other companies because of our indebtedness, thereby affecting our profitability.
Furthermore, uncertainty about the continuing availability of LIBOR may adversely affect our business, financial condition, cash flows and results of operations. On July 27, 2017, the United Kingdom’s Financial Conduct Authority, which regulates LIBOR, announced that after December 31, 2021, it would no longer compel banks to submit the rates required to calculate LIBOR. On March 5, 2021, the current administrator of LIBOR, ICE Benchmark Administration, announced that it would cease publication of certain tenors of U.S. dollar LIBOR on June 30, 2023. With this announcement, there is uncertainty about the continued availability of LIBOR after 2021 or, in certain circumstances, 2023. If LIBOR ceases to be available or the methods of calculating LIBOR change from the current methods, financial products with interest rates tied to LIBOR may be adversely affected. Even if LIBOR remains available, it is uncertain whether it will continue to be viewed as an acceptable market benchmark, what rate or rates may become accepted alternatives to LIBOR or what the effect of any such changes in views or alternatives may be on the markets for LIBOR-indexed financial instruments. As of December 31, 2020, adjusted to reflect the entry into the 2021 Secured Credit Facilities, all of our aggregate consolidated indebtedness was indexed to LIBOR. If any of the foregoing were to occur, the interest rates on such indebtedness may be adversely affected.
The agreements and instruments governing our indebtedness contain restrictions and limitations that could significantly impact our ability to operate our business.
Our 2021 Secured Credit Facilities contain covenants that, among other things, restrict the ability of agilon management and its subsidiaries to:
| • | incur additional indebtedness and create liens; |
| • | pay dividends and make other distributions or to purchase, redeem or retire capital stock; |
| • | purchase, redeem or retire certain junior indebtedness; |
| • | make loans and investments; |
55
| • | enter into agreements that limit agilon management’s or its subsidiaries’ ability to pledge assets or to make distributions or loans to us or transfer assets to us; |
| • | sell assets; |
| • | enter into certain types of transactions with affiliates; |
| • | consolidate, merge or sell substantially all assets; |
| • | make voluntary payments or modifications of junior indebtedness; and |
| • | enter into lines of business. |
agilon management and its subsidiaries accounted for 100% of our total assets and 100% of our total liabilities as of December 31, 2020. Consequently, the restrictions in the 2021 Secured Credit Facilities may prevent us from taking actions that we believe would be in the best interest of our business and may make it difficult for us to execute our business strategy successfully or effectively compete with companies that are not similarly restricted. We may also incur future debt obligations that might subject us to additional restrictive covenants that could affect our financial and operational flexibility. We may be unable to refinance our indebtedness, at maturity or otherwise, on terms acceptable to us or at all.
The ability of agilon management to comply with the covenants and restrictions contained in the 2021 Secured Credit Facilities may be affected by economic, financial and industry conditions outside our control including credit or capital market disruptions. The breach of any of these covenants or restrictions could result in a default that would permit the applicable lenders to declare all amounts outstanding thereunder to be due and payable, together with accrued and unpaid interest. If we are unable to repay indebtedness, lenders having secured obligations, such as the lenders under the 2021 Secured Credit Facilities, could proceed against the collateral securing the indebtedness. All obligations under the 2021 Secured Credit Facilities are guaranteed by Intermediate Holdings and each domestic subsidiary of agilon management other than certain excluded subsidiaries. All obligations of agilon management and each guarantor are secured by a perfected security interest in substantially all tangible and intangible assets of agilon management and each such guarantor, including the capital stock of each domestic subsidiary of agilon management and each such guarantor, and 65% of each series of capital stock of any non U.S. subsidiary held directly by agilon management or any guarantor, subject to certain exceptions. In any such case, we may be unable to borrow under the 2021 Secured Credit Facilities and may not be able to repay the amounts due under such facilities. This could materially and adversely affect our business, financial condition, cash flows and results of operations, and could cause us to become bankrupt or insolvent.
Our ability to generate the significant amount of cash needed to pay interest and principal on our indebtedness and our ability to refinance all or a portion of our indebtedness or obtain additional financing depends on many factors outside our control.
agilon management, the borrower under the 2021 Secured Credit Facilities, is a holding company, and as such it has no independent operations or material assets other than ownership of equity interests in its subsidiaries. agilon management depends on its subsidiaries to distribute funds to it so that it may pay obligations and expenses, including satisfying obligations with respect to indebtedness. Our ability to make scheduled payments on, or to refinance our obligations under, our indebtedness depends on the financial and operating performance of the subsidiaries of agilon management and their ability to make distributions and dividends to it, which, in turn, depends on their results of operations, cash flows, cash requirements, financial position and general business conditions and any legal and regulatory restrictions on the payment of dividends to which they may be subject, many of which could be outside our control.
We may be unable to maintain a level of cash flows from operating activities sufficient to permit us to pay the principal and interest on our indebtedness. If our cash flow and capital resources are insufficient to fund our
56
debt service obligations, we may be forced to reduce or delay capital expenditures, sell assets, seek to obtain additional equity capital or restructure our indebtedness. In the future, our cash flow and capital resources may not be sufficient for payments of interest on and principal of our indebtedness, and such alternative measures may not be successful and may not permit us to meet our scheduled debt service obligations.
The final maturity date of the 2021 Secured Term Loan Facility and the 2021 Secured Revolving Facility is February 18, 2026. We may be unable to refinance any of our indebtedness or obtain additional financing, particularly because of our substantial indebtedness. Market disruptions, such as those experienced in 2008, 2009 and March 2020, as well as our indebtedness levels, may increase our cost of borrowing or adversely affect our ability to refinance our obligations as they become due. We may be unable to refinance our indebtedness, at maturity or otherwise, on terms acceptable to us or at all. If we are unable to refinance our indebtedness or access additional credit, or if short-term or long-term borrowing costs dramatically increase, our ability to finance current operations and meet our short-term and long-term obligations could be adversely affected.
If agilon management cannot make scheduled payments on its indebtedness, it will be in default and the lenders under the 2021 Secured Credit Facilities could terminate their commitments to loan money or, in the case of lenders under the 2021 Secured Credit Facilities, foreclose against the assets securing their borrowings, and we could be forced into bankruptcy or liquidation. Any of these actions could have a material adverse effect on our business, financial condition, cash flows and results of operations.
Risks Related to Our Common Stock and This Offering
agilon health is a holding company with no operations of its own, and it depends on its subsidiaries for cash to fund all of its operations and expenses, including to make future dividend payments, if any.
Our operations are conducted entirely through our subsidiaries, and our ability to generate cash to fund our operations and expenses, to pay dividends or to meet debt service obligations is highly dependent on the earnings and the receipt of funds from our subsidiaries through dividends or intercompany loans. Deterioration in the financial condition, earnings or cash flow of agilon management and its subsidiaries for any reason could limit or impair their ability to pay such distributions. Many of these subsidiaries are subject to regulatory, contractual or other legal restrictions that may restrict such subsidiaries’ ability to pay dividends to us. See “Management’s Discussion and Analysis of Financial Condition and Results of Operations.” To the extent our subsidiaries are restricted from making such distributions under applicable law or regulation or under the terms of our financing arrangements, or are otherwise unable to provide funds to the extent of our needs, there could be a material adverse effect on our business, financial condition, cash flows and results of operations.
For example, we are currently contractually required, and may in the future be required by state laws or regulations, to maintain specific prescribed minimum amounts of capital in certain subsidiaries. When we enter into a new payor contract, we are typically required by the payor to contribute risk-bearing capital to the local operating subsidiary. This typically takes the form of letters of credit or restricted deposits, or the payor may retain a percentage of the capitation payments due under the applicable contract. Risk-bearing capital required by payors varies by payor and geography and ranged from $50,000 to $10.0 million, or $38.8 million to $57.8 million in the aggregate across all of our geographies and payors, as of December 31, 2020 and June 30, 2021, respectively. In addition, the agreements governing the Credit Facilities significantly restrict the ability of our subsidiaries to pay dividends, make loans or otherwise transfer assets to us. Furthermore, our subsidiaries are permitted under the terms of the Credit Facilities to incur additional indebtedness that may restrict or prohibit the making of distributions, the payment of dividends or the making of loans by such subsidiaries to us. If we are unable to obtain sufficient funds from our subsidiaries to fund our obligations, our results of business, financial condition, cash flows and results of operations could be materially and adversely affected.
57
The market price of our common stock may be volatile and could decline after this offering.
Volatility in the market price of our common stock may prevent you from being able to sell your shares at or above the price you paid for your shares. The market price of our common stock may fluctuate significantly. Among the factors that could affect our stock price are:
| • | industry, regulatory or general market conditions; |
| • | domestic and international economic factors unrelated to our performance; |
| • | changes in our physician partners’ or their patients’ preferences; |
| • | new regulatory pronouncements and changes in regulatory guidelines; |
| • | lawsuits, enforcement actions and other claims by third parties or governmental authorities; |
| • | actual or anticipated fluctuations in our quarterly operating results; |
| • | lack of research coverage and reports by industry analysts or changes in any securities analysts’ estimates of our financial performance; |
| • | action by institutional stockholders or other large stockholders, including future sales of our common stock; |
| • | failure to meet any guidance given by us or any change in any guidance given by us, or changes by us in our guidance practices; |
| • | announcements by us of significant impairment charges; |
| • | speculation in the press or investment community; |
| • | investor perception of us and our industry; |
| • | changes in market valuations or earnings of similar companies; |
| • | the impact of short selling or the impact of a potential “short squeeze” resulting from a sudden increase in demand for our common stock; |
| • | announcements by us or our competitors of significant contracts, acquisitions, dispositions or strategic partnerships; |
| • | war, terrorist acts and epidemic disease, including COVID-19; |
| • | any future sales of our common stock or other securities; |
| • | additions or departures of key personnel; and |
| • | misconduct or other improper actions of our employees. |
In particular, we cannot assure you that you will be able to resell your shares at or above the public offering price. Stock markets have experienced extreme volatility in recent years that has been unrelated to the operating performance of particular companies. These broad market fluctuations may adversely affect the trading price of our common stock. In the past, following periods of volatility in the market price of a company’s securities, class action litigation has often been instituted against the affected company. Any litigation of this type brought against us could result in substantial costs and a diversion of our management’s attention and resources, which could materially and adversely affect our business, financial condition, cash flows and results of operations.
An active, liquid trading market for our common stock may not be sustained.
Although our common stock is currently listed on the NYSE under the symbol “AGL,” an active trading market for our shares may not be sustained. Accordingly, if an active trading market for our common stock is not maintained, the liquidity of our common stock, your ability to sell your shares of our common stock when desired and the prices that you may obtain for your shares of common stock will be adversely affected.
58
Future sales of shares by us or our existing stockholders could cause our stock price to decline.
Sales of substantial amounts of our common stock in the public market following this offering, or the perception that these sales could occur, could cause the market price of our common stock to decline. These sales, or the possibility that these sales may occur, also might make it more difficult for us to sell equity securities in the future at a time and at a price that we deem appropriate.
As of June 30, 2021, adjusted to give effect to this offering, we had 390,882,560 outstanding shares of common stock. Of these shares, all of the 53,590,000 shares sold in our IPO are, and the shares to be sold in this offering will be, immediately tradable without restriction under the Securities Act of 1933, as amended (the “Securities Act”), except for any shares held by “affiliates,” as that term is defined in Rule 144 under the Securities Act (“Rule 144”). On April 14, 2021, we filed a registration statement on Form
S-8
under the Securities Act to register the shares of common stock to be issued under our equity compensation plans and, as a result, all shares of common stock acquired upon exercise of stock options granted under our plan will also be freely tradable under the Securities Act, subject to the terms of thelock-up
agreements, unless purchased by our affiliates. As of June 30, 2021, there were stock options outstanding to purchase a total of 41,197,388 shares of our common stock. See “Management’s Discussion and Analysis of Financial Condition and Results of Operations—Critical Accounting Estimates—Stock-based Compensation” for additional information.The remaining shares of common stock outstanding as of June 30, 2021 are restricted securities within the meaning of Rule 144 under the Securities Act, but will be eligible for resale subject to applicable volume, means of sale, holding period and other limitations of Rule 144 under the Securities Act or pursuant to an exemption from registration under Rule 701 under the Securities Act, or “Rule 701,” subject to the
lock-up
agreements to be entered into by us, the CD&R Investor, certain of our stockholders and our executive officers and directors.In connection with our IPO, the CD&R Investor, certain of our stockholders and our executive officers and directors entered into lock-up agreements for a period of 180 days after the date of the prospectus for our IPO. In connection with this offering, J.P. Morgan Securities LLC and Goldman Sachs & Co. LLC, as representatives of the several underwriters in our IPO, have agreed to waive the prior lock-up agreements with respect to up to shares (or up to shares including the underwriters’ option to purchase additional shares) of our common stock for the sale by the selling stockholders in this offering, which includes shares beneficially owned by certain of our officers and directors, provided that the waiver is limited to the shares actually sold in this offering. Additionally, in connection with this offering, the CD&R Investor, certain of our stockholders, including certain of the selling stockholders, and our executive officers and directors have entered into
lock-up
agreements under which we and they have agreed not to, among other things and subject to certain exceptions, offer, sell, contract to sell, pledge, sell any option or contract to purchase, purchase any option or contract to sell, grant any option, right or warrant to purchase, engage in any hedging or similar transaction or arrangement, lend or otherwise transfer or dispose of, directly or indirectly, any of our securities that are substantially similar to the securities offered hereby, without the prior written consent of J.P. Morgan Securities LLC and Goldman Sachs & Co. LLC for a period of 90 days after the date of this prospectus. See “Underwriting.” Following the expiration of this90-day
lock-up
period, shares of our common stock will be eligible for future sale, subject to the applicable volume, manner of sale, holding period and other limitations of Rule 144 or pursuant to an exemption from registration under Rule 701. See “Shares Available for Future Sale” for a discussion of the shares of common stock that may be sold into the public market in the future. In addition, our significant stockholders may distribute shares that they hold to their investors who themselves may then sell into the public market following the expiration of thelock-up
period. Such sales may not be subject to the volume, manner of sale, holding period and other limitations of Rule 144. Furthermore, the CD&R Investor and other significant stockholders have the right to require us to register shares of common stock for resale in certain circumstances. As resale restrictions end, the market price of our common stock could decline if the holders of those shares sell them or are perceived by the market as intending to sell them.59
In the future, we may issue additional shares of common stock or other equity or debt securities convertible into or exercisable or exchangeable for shares of our common stock in connection with a financing, strategic investment, litigation settlement or employee arrangement or otherwise. Any of these issuances could result in substantial dilution to our existing stockholders and could cause the trading price of our common stock to decline.
If securities or industry analysts do not publish research or publish misleading or unfavorable research about our business, our stock price and trading volume could decline.
The trading market for our common stock depends in part on the research and reports that securities or industry analysts may publish about us or our business. If one or more of the analysts that covers our common stock downgrades our stock or publishes misleading or unfavorable research about our business, our stock price would likely decline. If one or more of the analysts ceases coverage of our common stock or fails to publish reports on us regularly, demand for our common stock could decrease, which could cause our common stock price or trading volume to decline.
Fulfilling our obligations incident to being a public company, including compliance with the Exchange Act and the requirements of the Sarbanes-Oxley Act and the Dodd-Frank Act, will be expensive and time-consuming, and any delays or difficulties in satisfying these obligations could have a material adverse effect on our future results of operations and our stock price.
In connection with the completion of our IPO on April 19, 2021, we became a public company. As a public company, we are subject to the reporting, accounting and corporate governance requirements of the NYSE, the Securities Exchange Act of 1934, as amended (the “Exchange Act”), the Sarbanes-Oxley Act and Section 619 of the Dodd-Frank Wall Street Reform and Consumer Protection Act (the “Dodd-Frank Act”) that apply to issuers of listed equity, which impose certain significant compliance requirements, costs and obligations upon us. The changes necessitated by being a publicly listed company and ongoing compliance with these rules and regulations require a significant commitment of additional resources and management oversight, which increases our operating costs and could divert our management and personnel from other business concerns, particularly since we are no longer an emerging growth company. Further, to continue to comply with the requirements of being a public company, we may need to undertake various actions, such as implementing new internal controls and procedures and hiring additional accounting or internal audit staff.
The Sarbanes-Oxley Act requires us, among other things, to maintain effective disclosure controls and procedures and internal control over financial reporting. In order to maintain and improve the effectiveness of our disclosure controls and procedures and internal control over financial reporting, we have expended, and anticipate that we will continue to expend, significant resources, including accounting-related costs and significant management oversight.
In addition, our internal resources and personnel may in the future be insufficient to avoid accounting errors, and our auditors may identify deficiencies, significant deficiencies or material weaknesses in our internal control environment in the future. Any failure to develop or maintain effective controls or any difficulties encountered implementing required new or improved controls could harm our operating results or cause us to fail to meet our reporting obligations and may result in a restatement of our financial statements for prior periods. Any failure to implement and maintain effective internal control over financial reporting also could adversely affect the results of periodic management evaluations and annual independent registered public accounting firm attestation reports regarding the effectiveness of our internal control over financial reporting that we will eventually be required to include in our periodic reports that will be filed with the U.S. Securities and Exchange Commission (the “SEC”). Ineffective disclosure controls and procedures and internal control over financial reporting could also cause investors to lose confidence in our reported financial and other information, which would likely have a negative effect on the trading price of our common stock. In addition, if we are unable to continue to meet these requirements, we may not be able to remain listed on the NYSE. As a public company, we are required to comply with the SEC rules that implement Section 404 of the Sarbanes-Oxley Act and are therefore required to make a
60
formal assessment of the effectiveness of our internal control over financial reporting for that purpose, but we are not required to provide an annual management report on the effectiveness of our internal control over financial reporting until our second Annual Report on
Form 10-K.
Our independent registered public accounting firm has identified material weaknesses in the past, and the measures we implemented to remediate such weaknesses may be insufficient to identify or prevent material weaknesses in the future. These material weaknesses have been remediated. However, the measures we implemented may be insufficient to identify or prevent future material weaknesses.Our independent registered public accounting firm is not required to formally attest to the effectiveness of our internal control over financial reporting until we cease to be an emerging growth company or a
non-accelerated
filer. We ceased to be an emerging growth company on December 31, 2020, and we do not expect to be anon-accelerated
filer beginning as of December 31, 2022. As such, we will be required to provide an annual management report on the effectiveness of our internal control over financial reporting in our 2022 Annual Report onForm 10-K.
At such time, our independent registered public accounting firm may issue a report that is adverse in the event it is not satisfied with the level at which our internal control over financial reporting is documented, designed or operating. Any failure to maintain effective disclosure controls and internal control over financial reporting could have an adverse effect on our business, financial condition, cash flows and results of operations.The expenses associated with being a public company include increases in auditing, accounting and legal fees and expenses, investor relations expenses, increased directors’ fees and director and officer liability insurance costs, registrar and transfer agent fees and listing fees, as well as other expenses. As a public company, we are required, among other things, to define and expand the roles and the duties of our board of directors and its committees and institute more comprehensive compliance and investor relations functions. Most members of our management team have limited experience managing a publicly traded company, interacting with public company investors and complying with the increasingly complex laws pertaining to public companies. Our management team may not successfully or efficiently manage us as a public company that is subject to significant regulatory oversight and reporting obligations under the federal securities laws and the continuous scrutiny of securities analysts and investors. These new obligations and constituents require significant attention from our senior management and could divert their attention away from themanagement of our business, which could adversely affect our business, financial condition, cash flows and results of operation. Failure to comply with the requirements of being a public company could potentially subject us to sanctions or investigations by the SEC or other regulatory authorities.
day-to-day
In addition, changing laws, regulations and standards relating to corporate governance and public disclosure are creating uncertainty for public companies, increasing legal and financial compliance costs and making some activities more time consuming. We intend to invest resources to comply with evolving laws, regulations and standards, and this investment may result in increased general and administrative expenses. If our efforts to comply with new laws, regulations and standards differ from the activities intended by regulatory or governing bodies due to ambiguities related to their application and practice, regulatory authorities may initiate legal proceedings against us, and there could be a material adverse effect on our business, financial condition, cash flows and results of operations.
Following the completion of this offering, the CD&R Investor will continue to control us and may have conflicts of interest with other stockholders.
Following the completion of this offering, the CD&R Investor will own approximately % of the outstanding shares of our common stock (or approximately % if the underwriters exercise in full their option to purchase additional shares). As a result, the CD&R Investor will have sufficient voting power without the consent of our other stockholders to be able to control all matters requiring stockholder approval, including the election of directors and approval of significant corporate transactions, which could reduce the market price of our common stock.
Because the CD&R Investor’s interests may differ from your interests, actions the CD&R Investor takes as our controlling stockholder may not be favorable to you. For example, the concentration of ownership held by the
61
CD&R Investor could delay, defer or prevent a change of control of us, impede a merger, takeover or other business combination that another stockholder may otherwise view favorably or cause us to enter into transactions or agreements that are not in the best interests of all stockholders. Other potential conflicts could arise, for example, over matters such as employee retention or recruiting, or our dividend policy.
Furthermore, as long as the CD&R Investor continues to beneficially own at least 40% of our outstanding common stock, the CD&R Investor will be able to determine the outcome of corporate actions requiring stockholder approval, including the election of the members of our board of directors and the approval of significant corporate transactions, such as mergers and the sale of substantially all of our assets. Even after the CD&R Investor reduces its beneficial ownership below 40% of our outstanding common stock, it will likely still be able to assert significant influence over our board of directors and certain corporate actions. Following the completion of this offering, the CD&R Investor will continue to have the right to designate for nomination for election at least a majority of our directors as long as the CD&R Investor beneficially owns at least 50% of our common stock and to designate our Chairman of the board of directors so long as it beneficially owns at least 25% of our common stock.
Under our Certificate of Incorporation, the CD&R Investor and its affiliates and, in some circumstances, each of our directors and officers who is also a director, officer, employee, member or partner of the CD&R Investor and its affiliates, have no obligation to offer us corporate opportunities.
The policies relating to corporate opportunities and transactions with the CD&R Investor set forth in our Certificate of Incorporation address potential conflicts of interest between agilon health, on the one hand, and the CD&R Investor and its officers, directors, employees, members or partners who are directors or officers of our company, on the other hand. In accordance with those policies, the CD&R Investor may pursue corporate opportunities, including acquisition opportunities that may be complementary to our business, without offering those opportunities to us. By becoming a stockholder in agilon health, you will be deemed to have notice of and have consented to these provisions of our Certificate of Incorporation. Although these provisions are designed to resolve conflicts between us and the CD&R Investor and its affiliates fairly, conflicts may not be resolved in our favor or be resolved at all.
Future offerings of debt or equity securities which would rank senior to our common stock may adversely affect the market price of our common stock.
If, in the future, we decide to issue debt or equity securities that rank senior to our common stock, it is likely that such securities will be governed by an indenture or other instrument containing covenants restricting our operating flexibility. Issuing additional shares of our common stock or other equity securities or securities convertible into equity may dilute the economic and voting rights of our stockholders or reduce the market price of our common stock. Additionally, any convertible or exchangeable securities that we issue in the future may have rights, preferences and privileges more favorable than those of our common stock and may result in dilution to owners of our common stock. We and, indirectly, our stockholders, will bear the cost of issuing and servicing such securities. Because our decision to issue debt or equity securities in any future offering will depend on market conditions and other factors outside our control, we cannot predict or estimate the amount, timing or nature of our future offerings. Thus, holders of our common stock will bear the risk of our future offerings, reducing the market price of our common stock or diluting the value of their stock holdings in us.
Anti-takeover provisions in our Certificate of Incorporation and
By-laws
could discourage, delay or prevent a change of control of our company and may affect the trading price of our common stock.Our Certificate of Incorporation and our
By-laws
include a number of provisions that may discourage, delay or prevent a change in our management or control over us that stockholders may consider favorable. For example, our Certificate of Incorporation andBy-laws
collectively:| • | authorize the issuance of “blank check” preferred stock that could be issued by our board of directors to thwart a takeover attempt; |
62
| • | provide for a classified board of directors, which divides our board of directors into three classes, with members of each class serving staggered three-year terms, which prevents stockholders from electing an entirely new board of directors at an annual meeting; |
| • | limit the ability of stockholders to remove directors if the CD&R Investor ceases to beneficially own at least 40% of the outstanding shares of our common stock; |
| • | provide that vacancies on our board of directors, including vacancies resulting from an enlargement of our board of directors, may be filled only by a majority vote of directors then in office; |
| • | prohibit stockholders from calling special meetings of stockholders if the CD&R Investor ceases to beneficially own at least 40% of the outstanding shares of our common stock; |
| • | prohibit stockholder action by written consent, thereby requiring all actions to be taken at a meeting of the stockholders, if the CD&R Investor ceases to beneficially own at least 40% of the outstanding shares of our common stock; |
| • | opt out of Section 203 of the DGCL, which prohibits a publicly-held Delaware corporation from engaging in a “business combination” with an “interested stockholder” for a period of three years following the time the person became an interested stockholder, until the CD&R Investor ceases to beneficially own at least 5% of the outstanding shares of our common stock; |
| • | establish advance notice requirements for nominations of candidates for election as directors or to bring other business before an annual meeting of our stockholders; and |
| • | require the approval of holders of at least 66 2/3% of the outstanding shares of our common stock to amend our By-laws and certain provisions of our Certificate of Incorporation if the CD&R Investor ceases to beneficially own at least 40% of the outstanding shares of our common stock. |
These provisions may prevent our stockholders from receiving the benefit from any premium to the market price of our common stock offered by a bidder in a takeover context or from changing our management and board of directors. Even in the absence of a takeover attempt, the existence of these provisions may adversely affect the prevailing market price of our common stock if the provisions are viewed as discouraging takeover attempts in the future. See “Description of Capital Stock—Anti-Takeover Effects of Our Certificate of Incorporation and
By-Laws.”
Our Certificate of Incorporation and
By-laws
may also make it difficult for stockholders to replace or remove our management. Furthermore, the existence of the foregoing provisions, as well as the significant amount of common stock that the CD&R Investor will continue to own following this offering, could limit the price that investors might be willing to pay in the future for shares of our common stock. These provisions may facilitate management entrenchment that may delay, deter, render more difficult or prevent a change in our control, which may not be in the best interests of our stockholders.We could be the subject of securities class action litigation due to future stock price volatility, which could divert management’s attention and materially and adversely affect our business, financial condition, cash flows and results of operations.
The stock market in general, and market prices for the securities of companies like ours in particular, have from time to time experienced volatility that often has been unrelated to the operating performance of the underlying companies. A certain degree of stock price volatility can be attributed to being a newly public company. These broad market and industry fluctuations may adversely affect the market price of our common stock, regardless of our operating performance. In certain situations in which the market price of a stock has been volatile, holders of that stock have instituted securities class action litigation against the company that issued the stock. If any of our stockholders were to bring a similar lawsuit against us, the defense and disposition of the lawsuit could be costly and divert the time and attention of our management and could materially and adversely affect our business, financial condition, cash flows and results of operations.
63
We do not intend to pay dividends on our common stock for the foreseeable future and, consequently, your ability to achieve a return on your investment depends on appreciation in the price of our common stock.
We do not intend to declare and pay dividends on our common stock for the foreseeable future. We currently intend to use our future earnings, if any, to repay debt, to fund our growth, to develop our business, for working capital needs and for general corporate purposes. Therefore, you are not likely to receive any dividends on your common stock for the foreseeable future, and the success of an investment in shares of our common stock depends upon any future appreciation in their value. There is no guarantee that shares of our common stock will appreciate in value or even maintain the price at which our stockholders have purchased their shares. Payments of dividends, if any, are at the sole discretion of our board of directors after taking into account various factors, including general and economic conditions, our financial condition and operating results, our available cash and current and anticipated cash needs, capital requirements, contractual, legal, tax and regulatory restrictions and implications of the payment of dividends by us to our stockholders or by our subsidiaries to us, and such other factors as our board of directors may deem relevant. In addition, our operations are conducted almost entirely through our subsidiaries. As such, to the extent that we determine in the future to pay dividends on our common stock, none of our subsidiaries will be obligated to make funds available to us for the payment of dividends. Further, the agreements governing the Credit Facilities significantly restrict the ability of our subsidiaries to pay dividends or otherwise transfer assets to us, and we may enter into other credit agreements or borrowing arrangements in the future that restrict or limit our ability to pay cash dividends on our common stock. In addition, Delaware law imposes additional requirements that may restrict our ability to pay dividends to holders of our common stock.
We expect to continue to be a “controlled company” within the meaning of rules and, as a result, we will qualify for, and currently intend to rely on, exemptions from certain corporate governance requirements. You will not have the same protections afforded to stockholders of companies that are subject to such requirements.
After the completion of this offering, the CD&R Investor will continue to control a majority of the voting power of our outstanding common stock. Accordingly, we expect to continue to be a “controlled company” within the meaning of corporate governance standards. Under the NYSE rules, a company of which more than 50% of the voting power is held by an individual, group or another company is a “controlled company” and may elect not to comply with certain corporate governance standards, including:
| • | the requirement that a majority of the board of directors consist of independent directors; |
| • | the requirement that our Nominating and Governance Committee be composed entirely of independent directors with a written charter addressing the committee’s purpose and responsibilities; |
| • | the requirement that we have a Compensation Committee that is composed entirely of independent directors with a written charter addressing the committee’s purpose and responsibilities; and |
| • | the requirement for an annual performance evaluation of the Nominating and Governance and Compensation Committees. |
Following this offering, we intend to continue to utilize these exemptions. As a result, we do not have a majority of independent directors, our Nominating and Governance Committee and Compensation Committees do not consist entirely of independent directors and such committees may not be subject to annual performance evaluations. Consequently, you will not have the same protections afforded to stockholders of companies that are subject to all of the NYSE corporate governance rules and requirements. Our status as a controlled company could make our common stock less attractive to some investors or otherwise harm our stock price.
64
At such time as the CD&R Investor no longer controls a majority of the voting power of our outstanding common stock, we will no longer be a “controlled company” within the meaning of rules. However, we may continue to rely on exemptions from certain corporate governance requirements during a
one-year
transition period.At such time as the CD&R Investor no longer controls a majority of the voting power of our outstanding common stock, we will no longer be a “controlled company” within the meaning of the NYSE corporate governance standards. The NYSE rules require that we (i) have a majority of independent directors on our board of directors within one year of the date we no longer qualify as a “controlled company,” (ii) have at least one independent director on each of the Compensation and Nominating and Governance Committees on the date we no longer qualify as a “controlled company,” at least a majority of independent directors on each of the Compensation and Nominating and Governance Committees within 90 days of such date and the Compensation and Nominating and Governance Committees composed entirely of independent directors within one year of such date and (iii) perform an annual performance evaluation of the Nominating and Governance and Compensation Committees. During this transition period, we may continue to utilize the available exemptions from certain corporate governance requirements as permitted by the NYSE rules. Accordingly, during the transition period, you will not have the same protections afforded to stockholders of companies that are subject to all of the corporate governance requirements of the NYSE. Furthermore, a change in our board of directors and committee membership may result in a change in corporate strategy and operation philosophies, and may result in deviations from our current strategy.
Our Certificate of Incorporation designates the Court of Chancery of the State of Delaware as the sole and exclusive forum for certain litigation that may be initiated by our stockholders, which could limit our stockholders’ ability to obtain a favorable judicial forum for disputes with us or our directors, officers or stockholders.
Our Certificate of Incorporation provides that, unless we consent in writing to the selection of an alternative forum, the Court of Chancery of the State of Delaware will, to the fullest extent permitted by law, be the sole and exclusive forum for (i) any derivative action or proceeding brought on our behalf, (ii) any action or proceeding asserting a claim of breach of a fiduciary duty owed to us or our stockholders by any of our directors, officers, other employees, agents or stockholders, (iii) any action or proceeding asserting a claim arising out of or pursuant to or seeking to enforce any right, obligation or remedy under the Delaware General Corporation Law (the “DGCL”), or as to which the DGCL confers jurisdiction on the Court of Chancery of the State of Delaware (including, without limitation, any action asserting a claim arising out of or pursuant to our Certificate of Incorporation or our
By-laws)
or (iv) any action or proceeding asserting a claim that is governed by the internal affairs doctrine, in each case subject to such Court of Chancery of the State of Delaware having personal jurisdiction over the indispensable parties named as defendants. It is possible that a court could find that the exclusive forum provisions described above are inapplicable for a particular claim or action or that such provision is unenforceable, and our stockholders will not be deemed to have waived our compliance with the federal securities laws and the rules and regulations thereunder. As permitted by Delaware law, our Certificate of Incorporation provides that, unless we consent in writing to the election of an alternative forum, the federal district courts of the United States of America will, to the fullest extent permitted by law, be the sole and exclusive forum for the resolution of any complaint asserting a cause of action arising under the Securities Act, the Exchange Act, and the rules and regulations thereunder. To the fullest extent permitted by law, by becoming a stockholder in our company, you will be deemed to have notice of and have consented to the provisions of our Certificate of Incorporation related to choice of forum. The choice of forum provision in our Certificate of Incorporation may limit our stockholders’ ability to obtain a favorable judicial forum for disputes with us or any of our directors, officers, other employees, agents or stockholders, which could discourage lawsuits with respect to such claims. Additionally, a court could determine that the exclusive forum provision is unenforceable, and our stockholders will not be deemed to have waived our compliance with the federal securities laws and the rules and regulations thereunder. If a court were to find these provisions of our Certificate of Incorporation inapplicable to, or unenforceable in respect of, one or more of the specified types of actions or proceedings, we may incur additional costs associated with resolving such matters in other jurisdictions, which could adversely affect our business, financial condition, cash flows and results of operations.65
SPECIAL NOTE REGARDING FORWARD-LOOKING STATEMENTS AND INFORMATION
This prospectus contains forward-looking statements and cautionary statements. Some of the forward-looking statements can be identified by the use of forward-looking terms such as “believes,” “expects,” “may,” “will,” “shall,” “should,” “would,” “could,” “seeks,” “aims,” “projects,” “is optimistic,” “intends,” “plans,” “estimates,” “anticipates” or the negative versions of these words or other comparable terms. Forward-looking statements include, without limitation, all matters that are not historical facts. They appear in a number of places throughout this prospectus and include, without limitation, statements regarding our intentions, beliefs, assumptions or current expectations concerning, among other things, our financial position, results of operations, cash flows, prospects and growth strategies.
Forward-looking statements are subject to known and unknown risks and uncertainties, many of which may be outside our control. We caution you that forward-looking statements are not guarantees of future performance or outcomes and that actual performance and outcomes, including, without limitation, our actual results of operations, financial condition and liquidity, and the development of the market in which we operate, may differ materially from those made in or suggested by the forward-looking statements contained in this prospectus. In addition, even if our results of operations, financial condition and cash flows, and the development of the market in which we operate, are consistent with the forward-looking statements contained in this prospectus, those results or developments may not be indicative of results or developments in subsequent periods. A number of important factors, including, without limitation, the risks and uncertainties discussed under the captions “Risk Factors” and “Management’s Discussion and Analysis of Financial Condition and Results of Operations” in this prospectus, could cause actual results and outcomes to differ materially from those reflected in the forward-looking statements. Furthermore, new risks and uncertainties emerge from time to time, and it is not possible for us to predict all risks and uncertainties that could have an impact on the forward-looking statements contained in this prospectus. Factors that could cause actual results and outcomes to differ from those reflected in forward-looking statements include, without limitation:
| • | our history of net losses, and our ability to achieve or maintain profitability in an environment of increasing expenses; |
| • | our ability to identify and develop successful new geographies, physician partners and payors, or to execute upon our growth initiatives; |
| • | our ability to execute our operation strategies or to achieve results consistent with our historical performance; |
| • | our expectation that our expenses will increase in the future and the risk that medical expenses incurred on behalf of members may exceed the amount of medical revenues we receive; |
| • | our ability to secure contracts with MA payors or to secure MA at favorable financial terms; |
| • | our ability to recover startup costs incurred during the initial stages of development of our physician partner relationships and program initiatives; |
| • | our ability to obtain additional capital needed to support our business; |
| • | significant reductions in our membership; |
| • | challenges for our physician partners in the transition to a Total Care Model; |
| • | inaccuracies in the estimates and assumptions we use to project the size, revenue or medical expense amounts of our target market; |
| • | the spread of, and response to, the novel coronavirus, or COVID-19, and the inability to predict the ultimate impact on us; |
| • | inaccuracies in the estimates and assumptions we use to project our members’ risk adjustment factors, medical services expense, incurred but not reported claims and earnings pursuant to payor contracts; |
66
| • | the impact of restrictive or exclusivity clauses in some of our contracts with physician partners that may prohibit us from establishing new RBEs within certain geographies in the future; |
| • | the impact of restrictive or exclusivity clauses in some of our contracts with physician partners that may subject us to investigations or litigation; |
| • | our ability to retain our management team and key employees or attract qualified personnel in the future; |
| • | our ability to realize the full value of our intangible assets and any impairment charges we have or may record; |
| • | adverse determinations of tax matters; |
| • | security breaches, loss of data or other disruptions to our data platforms; |
| • | our reliance on third parties for internet infrastructure and bandwidth to operate our business and provide services to our members and physician partners; |
| • | our ability to protect the confidentiality of our know-how and other proprietary and internally developed information; |
| • | the impact of devoting significant attention and resources to the provision of certain transition services in connection with the disposition of our California operations; |
| • | our subsidiaries’ lack of performance or ability to fund their operations, which could require us to fund such losses; |
| • | our dependence on a limited number of key payors; |
| • | the limited terms of our contracts with payors and that they may not be renewed upon their expiration; |
| • | our reliance on our payors for membership attribution and assignment, data and reporting accuracy and claims payment; |
| • | our dependence on physician partners and other providers to effectively manage the quality and cost of care and perform obligations under payor contracts; |
| • | difficulties in obtaining accurate and complete diagnosis data; |
| • | our dependence on physician partners to accurately, timely and sufficiently document their services and potential False Claims Act or other liability if any diagnosis information or encounter data are inaccurate or incorrect; |
| • | our reliance on third-party software and data to operate our business and provide services to our members and physician partners; |
| • | the impact of consolidation in the healthcare industry; |
| • | reductions in reimbursement rates or methodology applied to derive reimbursement from, or discontinuation of, federal government healthcare programs, from which we derive substantially all of our total revenue; |
| • | uncertain or adverse economic conditions, including a downturn or decrease in government expenditures; |
| • | our ability to compete in our competitive industry; |
| • | the impact of government performance standards and benchmarks on our compensation and reputation; |
| • | statutory or regulatory changes, administrative rulings, interpretations of policy and determinations by intermediaries and governmental funding restrictions, and their impact on government funding, program coverage and reimbursements; |
67
| • | regulatory proposals directed at containing or lowering the cost of healthcare and our participation in such proposed models; |
| • | we, our physician partners or affiliates being subject to federal or state investigations, audits and enforcement actions; |
| • | regulatory inquiries and corrective action plans imposed by our payors; |
| • | repayment obligations arising out of payor audits; |
| • | the impact on our revenue of CMS modifying the methodology used to determine the revenue associated with MA members; |
| • | negative publicity regarding the managed healthcare industry; |
| • | the extensive regulation of the healthcare industry at the federal, state and local levels; |
| • | our substantial indebtedness and the potential that we may incur additional indebtedness; |
| • | our ability to sustain an active, liquid trading market for our common stock; |
| • | the significant influence the CD&R Investor has over us; and |
| • | risks related to other factors discussed under “Risk Factors” in this prospectus. |
You should read this prospectus completely and with the understanding that actual future results may be materially different from expectations. All forward-looking statements made in this prospectus are qualified by these cautionary statements. These forward-looking statements are made only as of the date of this prospectus, and we do not undertake any obligation, other than as may be required by law, to update or revise any forward-looking or cautionary statements to reflect changes in assumptions, the occurrence of events, unanticipated or otherwise, and changes in future operating results over time or otherwise.
68
USE OF PROCEEDS
The selling stockholders are selling all of the common stock being sold in this offering, including any shares of common stock sold upon the exercise of the underwriters’ option to purchase additional shares. Accordingly, we will not receive any proceeds from the sale of shares of our common stock being sold in this offering. We will bear the costs associated with the sale of the shares in this offering by the selling stockholders, other than underwriting discounts and commissions. See “Principal and Selling Stockholders.”
69
DIVIDEND POLICY
We do not intend to declare or pay dividends on our common stock for the foreseeable future. We currently intend to use our future earnings, if any, to repay debt, to fund our growth, to develop our business and for working capital needs and general corporate purposes. Our ability to pay dividends to holders of our common stock is significantly limited as a practical matter by the 2021 Secured Credit Facilities insofar as we may seek to pay dividends out of funds made available to us by agilon management or its subsidiaries, because the 2021 Secured Credit Facilities restrict agilon management’s ability to pay dividends or make loans to us. See “Description of Certain Indebtedness” for a description of restrictions on our ability to pay dividends under the 2021 Secured Credit Facilities. Any future determination to pay dividends on our common stock will be subject to the discretion of our board of directors and depend upon various factors, including our results of operations, financial condition, liquidity requirements, capital requirements, level of indebtedness, contractual restrictions with respect to payment of dividends, restrictions imposed by Delaware law, general business conditions and other factors that our board of directors may deem relevant.
70
CAPITALIZATION
The following table sets forth our cash and cash equivalents and capitalization on a consolidated basis as of June 30, 2021.
You should read this table in conjunction with “Summary Historical Consolidated Financial Data,” “Management’s Discussion and Analysis of Financial Condition and Results of Operations,” “Description of Certain Indebtedness” and our consolidated financial statements included elsewhere in this prospectus.
June 30, 2021 | ||||
(dollars in thousands, except share and per share amounts) | ||||
Cash and cash equivalents (1) | $ | 1,109,372 | ||
Long-term debt (1)(2) | 49,612 | |||
Mezzanine and Stockholders’ Equity: | ||||
Common stock, $0.01 par value (3) | 3,909 | |||
Additional paid-in capital (3) | 2,011,651 | |||
Accumulated deficit | (865,113 | ) | ||
Noncontrolling interests | (169 | ) | ||
Total stockholders’ equity (deficit) | 1,150,278 | |||
Total capitalization | $ | 1,199,890 | ||
| (1) | In connection with our IPO, on April 26, 2021 we made a mandatory prepayment of $50.0 million of the 2021 Secured Term Loan Facility as a result of the gross proceeds from the IPO exceeding $1.0 billion. |
| (2) | As of June 30, 2021, we had availability under the 2021 Secured Revolving Facility totaling $64.4 million and outstanding letters of credit totaling $35.6 million, of which $14.0 million was for the DCEs. See “Description of Certain Indebtedness” included elsewhere in this prospectus. |
| (3) | As of June 30, 2021, we had 390,882,560 shares of common stock issued and outstanding. The shares of common stock outstanding exclude: |
| • | 41,197,388 shares of common stock issuable upon exercise of options outstanding as of June 30, 2021 at a weighted average exercise price of $4.40 per share; |
| • | 28,453,653 shares of common stock reserved for future issuance under our Omnibus Incentive Plan and ESPP; and |
| • | 1,112,131 shares of our common stock subject to outstanding unvested RSUs granted to directors and employees. |
71
DILUTION
All shares of our common stock being sold in this offering were issued and outstanding prior to the offering. As a result, this offering will not have a dilutive effect on our shareholders. Dilution results from the fact that the per share offering price of the common stock exceeds the book value per share attributable to the shares of common stock held by existing stockholders.
Our net tangible book value as of June 30, 2021 was $ million or $ per share. Net tangible book value per share before the offering has been determined by dividing net tangible book value, which is equal to total book value of tangible assets (excluding deferred offering costs), less total liabilities, by the number of shares of common stock outstanding as of June 30, 2021.
We will not receive any proceeds from the sale of common stock by the selling stockholders in this offering. Consequently, this offering will not result in any change to our net tangible deficit per share, prior to giving effect to the payment of estimated fees and expenses in connection with this offering. The following table illustrates this per share dilution to new investors:
Per Share | ||||
Assumed public offering price per share (1) | $ | |||
Net tangible book value per share as of June 30, 2021 | ||||
Dilution of net tangible book value per share to new investors | $ | |||
| (1) | Based upon the last reported sale price of our common stock on , 2021 of $ per share on the NYSE. |
The following table summarizes, as of June 30, 2021, the total number of shares of common stock purchased from us, the total consideration paid to us and the average price per share paid by the existing stockholders and by new investors purchasing shares in this offering, based upon the last reported sale price of our common stock on , 2021 of $ per share on the NYSE (amounts in thousands, except percentages and per share data):
Shares Purchased | Total Consideration | Average Price Per Share | ||||||||||||||||||
Number | Percent | Amount | Percent | |||||||||||||||||
Existing stockholders | % | $ | % | $ | ||||||||||||||||
New investors | % | $ | % | $ | ||||||||||||||||
Total | % | $ | % | $ | ||||||||||||||||
The foregoing table does not reflect stock options outstanding under our stock incentive plans or stock options to be granted after this offering. As of June 30, 2021, there were 41,197,388 shares of common stock issuable upon exercise of options outstanding at a weighted average exercise price of $4.40 per share.
The sale by the selling stockholders of shares of common stock in this offering will reduce the number of shares held by existing holders to , or % of the total number of shares of common stock after this offering, and as a result, new investors will hold shares, or % of the total number of shares of common stock after this offering. If the underwriters exercise their option to purchase additional shares in full, the number of shares held by new investors will increase to , or % of the total number of shares of common stock after this offering, and the percentage of shares held by existing stockholders will decrease to % of the total shares outstanding.
72
To the extent that any of these stock options are exercised, there may be further dilution to new investors. See “Executive Compensation” and “Note 13. Stock Incentive Plan” in our audited consolidated financial statements included elsewhere in this prospectus.
In addition, we may choose to raise additional capital due to market conditions or strategic considerations even if we believe we have sufficient funds for our current or future operating plans. To the extent that additional capital is raised through the sale of equity or convertible debt securities, the issuance of such securities could result in further dilution to our stockholders.
73
MANAGEMENT’S DISCUSSION AND ANALYSIS OF FINANCIAL CONDITION
AND RESULTS OF OPERATIONS
The following information should be read in conjunction with the consolidated financial statements included elsewhere in this prospectus and “Prospectus Summary—Summary Historical Consolidated Financial Data.” The following discussion may contain forward-looking statements that reflect our plans, estimates and beliefs. Our actual results could differ materially from those discussed below and elsewhere in this prospectus, particularly under the captions “Risk Factors” and “Special Note Regarding Forward-Looking Statements and Information.”
Company Overview
Our business is transforming healthcare by empowering the PCP to be the agent for change in the communities they serve. We believe that PCPs, with their intimate patient-physician relationships, are best positioned to drive meaningful change in quality, cost and patient experience when provided with the right infrastructure and payment model. Through our combination of the agilon platform, a long-term partnership model with existing physician groups and a growing network of like-minded physicians, we are poised to revolutionize healthcare for seniors across communities throughout the United States. Our purpose-built model provides the necessary capabilities, capital and business model for existing physician groups to create a Medicare-centric, globally capitated line of business. Our model operates by forming RBEs within local geographies, that enter into arrangements with payors providing for monthly payments to manage the total healthcare needs of our physician partners’ attributed patients (or, global capitation arrangements), contract with agilon to perform certain functions and enter into long-term professional service agreements with one or more anchor physician groups pursuant to which the anchor physician groups receive a base compensation rate and share in the savings from successfully improving quality of care and reducing costs.
Our company was formed in 2016, and we established our inaugural partnership with an anchor physician group in 2017. Our ability to rapidly build scaled positions in local communities has allowed us to grow to 16 anchor physician groups and 17 geographies in fewer than five years. Our platform has enabled us to grow our total membership by 45% and revenue by 53% from December 31, 2019 to December 31, 2020. As of June 30, 2021, the PCPs on our platform serve approximately 230,700 MA members on our platform. In addition, through our participation in the CMS Innovation Center Direct Contracting Model, our PCPs serve over 50,000 Medicare FFS beneficiaries through our five currently approved DCEs. For the year ended December 31, 2020, our DCEs did not contribute to our revenue.
Our business model is differentiated by its focus on existing community-based physician groups and is built around three key elements: (1) agilon’s platform; (2) agilon’s long-term physician partnership approach; and (3) agilon’s network. With our model, our goal is to remove the barriers that prevent community-based physicians from evolving to a Total Care Model, where the physician is empowered to manage health outcomes and the total healthcare needs of their attributed Medicare patients.
Our platform, partnership and network model enable our physician partners to be the quarterback for healthcare delivery in their community, and successfully operate a Medicare-centric, globally capitated line of business. This generates improving quality and cost outcomes, growing membership and increasing medical margin per member, which we share with our physician partners pursuant to our long-term partnership model. We believe this continuous improvement in patient and physician engagement and experience leads to more PCPs joining our platform and ultimately improves the success of each physician partner on the platform. As our platform grows, we believe we will be able to leverage our scale to drive additional investment in our geographies to accelerate this flywheel for the benefit of our physician partners and their patients.
Impact of Medicare Advantage and Traditional Medicare on the Business
MA is a federal program that provides eligible persons age 65 years of age and over and some disabled persons with a variety of hospital, medical insurance and prescription drug benefits. In 2020, approximately
74
62 million Americans were enrolled in Medicare nationally, of which nearly 25 million, or 40%, were enrolled in MA. Medicare beneficiaries may enroll in an MA plan, under which payors contract with CMS to provide a defined range of healthcare services that are comparable to Medicare FFS (which is also referred to as “traditional Medicare”).
The Direct Contracting Model is a voluntary payment model option aimed at reducing expenditures and preserving or enhancing quality of care for beneficiaries in Medicare established by the CMS Innovation Center that began in April 2021. A key aspect of the Direct Contracting Model is providing new opportunities for us to participate in value-based care arrangements directly with our existing physician partners for their current Medicare members. In each community we serve, our Total Care Model can be extended to our physician partners’ patients enrolled in traditional Medicare through the Direct Contracting Model. In collaboration with seven of our physician group partners, we are participating in the program through five currently approved DCEs that serve over 50,000 Medicare FFS beneficiaries through the Direct Contracting Model.
Under MA, CMS issues a fixed PMPM premium, or capitation payment, to payors in exchange for providing defined healthcare benefits to attributed MA members. Under the typical capitation arrangement, we are entitled to monthly PMPM fees from payors to provide a defined range of healthcare services for MA health plan members attributed to our PCPs. These PMPM fees comprise our medical services revenue and are determined as a percent of the premium payors receive from CMS for these members. The amount of the monthly premium payment varies based on the county in which a member resides, adjusted for demographic and health risk factors. CMS assigns to each member a “risk adjustment factor,” which is based on, among other things, the member’s age, gender and diagnosed disease conditions, and is utilized by CMS to determine the amount of monthly premium payment paid to payors. MA revenue received by us is subject to federal government reviews and audits which can result, and have resulted, in retroactive and prospective revenue adjustments.
Key Factors Affecting Our Performance
Growing Medicare Advantage Membership on Our Platform
Membership and revenue are tied to the number of members attributed to our physician partners by our payors. We believe we have multiple avenues to serve additional members, including through:
| • | Adding new physician partnerships through the expansion into new geographies, |
| • | Growth in membership in existing geographies as a result of: |
| • | Patients who are attributed to our physician partners who (a) age into Medicare and elect to enroll in MA or (b) elect to convert from Medicare FFS to MA, and |
| • | Growth in the number of PCPs at existing physician partners, expanding our physician partners’ capacity to care for a greater membership population. |
The retention of existing members is also important to our membership and revenue growth. We believe we are well-positioned to continue our relationships with existing members due to the sticky patient-physician relationship,
13-year
average physician tenure at our anchor physician groups and long-term agreements with anchor physician groups that are typically20-years
in duration.The strength of our multi-pronged growth strategy is evident by our growth from 2017 to 2020. At December 31, 2020, we managed global risk for 131,000 members on our platform as compared to 28,900 members at December 31, 2017, representing a compound annual growth rate (“CAGR”) of 65% over this period. Additionally, we have approximately 49,000 additional MA members with physician groups contracted to
go-live
on January 1, 2022.75
The chart and table below illustrate membership growth since 2017:

MA Membership | ||||||||||||||||||||
Geography Go-Live | December 31, 2017 | December 31, 2018 | December 31, 2019 | December 31 2020 | CAGR | |||||||||||||||
2017 & Prior | 28,900 | 31,400 | 33,700 | 36,700 | 8 | % | ||||||||||||||
2018 | — | 25,100 | 29,700 | 35,500 | 19 | % | ||||||||||||||
2019 | — | — | 26,800 | 33,000 | 23 | % | ||||||||||||||
2020 | — | — | — | 25,800 | ||||||||||||||||
| 28,900 | 56,500 | 90,200 | 131,000 | 65 | % | |||||||||||||||
Expanding into New Geographies
The proven exportability of our platform, partnership and network model positions us to expand into new geographies by establishing new regional hubs across the country. We have historically demonstrated success in effectively establishing new geographies. We have entered into 17 geographies within eight states, which includes three geographies that became operational in January 2021 and six geographies that will become operational in January 2022. We believe growth in the MA market overall will further increase our market opportunity. We consider our current addressable market to be the estimated 17.5 million Medicare beneficiaries affiliated with independent PCPs in states in which we already have a physician partner or a signed letter of intent with a physician group as of January 2021, and those in which we have identified near-term prioritized geographies. Based on 2021 estimated average annual revenue per Medicare member to us of approximately $10,000, we estimate that this represents a total addressable market size of approximately $175 billion in 2020.
Our business development team maintains an active pipeline of new partnership opportunities. These potential opportunities are developed through significant inbound interest through the powerful network effect we have seen from our highly engaged existing physician partners, our proactive assessment of the independent provider market landscape and opportunities identified through our strategic relationships with national payors. With partnership dialogue and implementation planning often commencing 12 months prior to standing up operations in a given geography, we have significant forward visibility into new membership and associated revenue coming onto the platform. We currently have approximately 49,000 MA members with physician groups for which we are contracted to go live on January 1, 2022. Furthermore, in January of each year we typically have visibility into greater than 90% of that year’s projected revenue.
76
Growing Members in Existing Geographies
Within our existing geographies, our attributed membership grows through:
| • | Patients who are attributed to our physician partners who age-in to Medicare and elect to enroll in MA or otherwise transition to MA. |
| • | Growth in the number of PCPs at existing physician partners, expanding our physician partners’ capacity to care for a greater membership population. |
We have three anchor geographies on the platform that have been live for two or three years that have grown at an average CAGR of 18% over the course of their time on our platform. Our anchor geography that went live January 1, 2018 has grown at a CAGR of 17% over the last three years and the two anchor geographies that went live January 1, 2019 have grown at an average CAGR of 24% over the last two years.
Patients who are attributed to our physician partners who
age-in
or transition to MAWe have embedded growth opportunity within our existing PCP base. Our physician partners’ patient panels include individuals anticipated to reach Medicare eligibility in the next five years who may elect to enroll in MA and existing Medicare FFS patients who may elect to transition to MA. Across our current physician partners, we estimate this opportunity to be approximately 375,000 members. These existing patients represent a large, growing and durable source of potential attributed member growth. As these patients enroll in MA through our payors, they become attributed to our platform with little incremental cost to us. We expect this embedded opportunity will continue to grow as we enter new geographies and add PCPs to our network who serve
under-65
commercially insured patients and Medicare FFS patients.Growth in the number of PCPs in our local geographies
We seek to increase the number of PCPs on our platform in local geographies and, through that, increase capacity to serve the approximately two million Medicare lives in our existing communities through:
| • | Affiliated physician groups recruiting new PCPs. |
| • | Affiliated physician groups acquiring other physician groups. |
| • | Contract with additional local physicians and physician groups by leveraging our local infrastructure and existing subscription-like PMPM agreements with payors. |
Growing Medical Services Revenue
We expect to have significant visibility to our future revenue as our partnerships with our anchor physician groups are typically structured as
20-year
partnerships for the MA line of business. Based on a 2004 study, patients 65 years of age and older remain with their PCP for an average of 10 years, and this sticky patient-physician relationship is further reinforced by a13-year
average physician tenure at our anchor physician groups. These relationships, when combined with the fixed monthly payment dynamics of the MA reimbursement model, create an extremely powerful long-term subscription-like revenue model.Our medical services revenue consists of capitation revenue under contracts with various payors. Under the typical capitation arrangement, we are entitled to monthly PMPM fees to provide a defined range of healthcare services for MA health plan members through our contracted physician partners and affiliated PCPs. Such fees are typically based on a defined percentage of corresponding premium which payors receive from CMS. We generally accept full financial risk for members attributed to us through our contracted PCPs and, therefore, are responsible for the cost of all healthcare services required by those members. We recognize capitation revenue over the period eligible members are entitled to receive healthcare services. We expect that our PMPM revenue will continue to improve the longer our members are on our platform as we better understand and assess their health status (acuity) and coordinate their medical care.
77
We have been able to increase our revenue by growing our network in existing geographies, expanding into new geographies, and attracting new PCPs to join our existing physician partners on our platform in existing geographies. During the year ended December 31, 2020, we generated medical services revenue of $1.2 billion compared to $196.5 million for the year ended December 31, 2017.
Growing Medical Margin
Medical margin represents the amount earned from medical services revenue after medical services expenses are deducted. Our profitability depends to a significant degree on our ability to accurately predict and effectively manage our medical margin, through improving healthcare quality and effectively managing costs. We believe our membership and
per-member
profitability will grow over time due to structural characteristics inherent to our long-term partnerships, durable and growing MA membership within our physician partners and the nature of the MA economic model.Through our platform, partnership and network model, we enter a geography by creating a long-term partnership with an existing physician group. After we enter a geography, our local network in that geography grows through our low cost and increasingly cost-efficient multi-pronged growth strategy. We also seek to grow medical margin over the course of our partnerships through this growth in our local networks and through improvement of per member medical margin, through improving healthcare quality and effectively managing costs. Medical margin and the pace of medical margin growth is influenced by the historical performance of our anchor physician groups in population health, regional variance in MA premium and healthcare utilization, the rate of member growth in the geography, per member revenue growth, and medical expenses associated with a member’s healthcare delivery. As our membership matures and our physician partners become more adept at effectively managing the continuum of care of our members under a Total Care Model, we have observed that the profitability (measured by medical margin PMPM) of our live geographies typically increases over time.
Two critical factors that enhance our ability to improve medical margin over a long period of time that we believe are unique to our model are (i) our anchor physician groups are critical components of their local healthcare delivery system, having operated in their local geographies for more than 40 years, developing relationships with specialists, hospitals and post-acute facilities, enhancing their ability to coordinate care and (ii) our ability to deliver actionable insight at the patient and physician level through our aligned partnership model withphysician feedback driving accountability and accelerating the pace of change to a Total Care Model.
peer-to-peer
The power of our model is reflected in the relative performance of our network when compared to local FFS benchmarks. For example, in 2019, our members’ ER utilization was 42% lower than the local FFS benchmark, inpatient acute utilization was 47% lower than the local FFS benchmark and hospital
re-admission
rate was 26% lower than the local FFS benchmark.This has resulted in improving year-over-year performance in our anchor physician groups and acceleration of performance in our geographies that are newer to our platform versus markets that joined the platform previously. This ongoing improvement has occurred while membership during that same period in such geographies grew.
78
The information below illustrates average membership and medical margin PMPM growth for our anchor physician groups that have been operational for more than two years as of December 31, 2021. The medical margin PMPM data presented below reflect the ongoing dilutive impact of new members in any year. Medical margin profiles of cohorts of members grouped by enrollment year have historically improved over their duration on our platform.
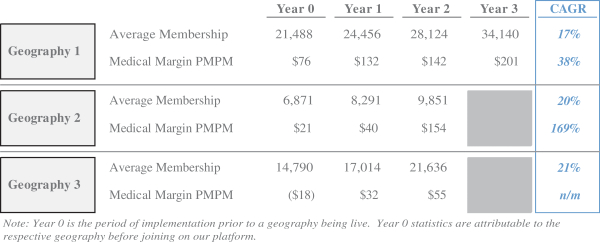
The following table incorporates all live geographies on our platform regardless of time on the platform. We have also included Hawaii in our year 3+ geographies, which is different than our traditional anchor physician group model because Hawaii is not a single partner structure, but is a network of contracted physicians and accepts delegation of certain traditional health plan functions from our contracted payors, such as utilization review, provider network development and claims adjudication. The information below illustrates the medical margin maturity in our live geographies inclusive of the geographies that went live in 2020 and are considered to be in year 1 of their maturity cycle. We believe medical margin rates within any geography will continue to increase over the course of our long-term partnerships, as cohorts of members within the geography are on our platform for longer periods of time. With 70% of our members on our platform for fewer than three years, we believe that we are well-positioned to benefit from significant embedded margin growth from our long-term economic model by improving healthcare outcomes and effectively managing costs.
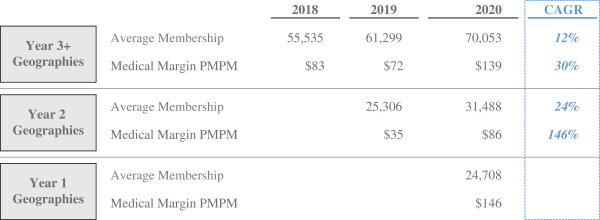
Medical margin and the pace of medical margin growth is influenced by the historical performance of our anchor physician groups in population health, regional variance in MA premium and healthcare utilization, the rate of member growth in the geography, per member revenue growth, and medical expenses associated with a
79
member’s healthcare delivery. For this reason, in future periods, we expect to have geographies with different medical margin PMPM starting points and trajectories. While we believe the data reflected in the preceding tables accurately reflects the directional margin maturity trends in our geographies, the most recent year includes the impact of utilization avoidance resulting from
COVID-19.
We cannot accurately estimate the net ultimate impact to medical services expense at this time. See “—Impact ofCOVID-19.”
Achieving Operating Efficiencies
As a result of our aligned partnership model and ability to grow our platform through our low cost and increasingly cost-efficient model, we generate operating efficiencies at both the geography and enterprise level. Our geography operating expenses, which include regionally-based support personnel and other operating costs to support our geographies, are expected to decrease over time as a percentage of revenue as our physician partners add members and our revenue grows. Our operating expenses at the enterprise level include resources and technology to support payor contracting, clinical program development, quality, data management, finance and legal functions. We continue to enhance existing service offerings by designing and developing technology and clinical solutions that can be leveraged by the entire platform across all geographies. While we expect our absolute investment in our enterprise resources to increase over time, we expect it will decrease as a percentage of revenue when we are able to scale this investment across a broader group of physician partners and our attributed membership. We expect our general and administrative expenses to increase in absolute dollars in the future as we continue to invest to support growth of our business, as well as due to the costs required to operate as a public company, including resulting from increased cost of insurance coverage, investments in internal audit, investor relations and financial reporting functions, fees paid to the exchange on which we list our securities and increased legal and audit fees. The operating efficiencies we are able to achieve with our aligned partnership model have enabled us to grow operating costs to support live geographies and enterprise functions by 12% year-over-year for the year ended December 31, 2020, while revenue grew 53% over the same period. Our revenue grew 67% year-over-year for the year ended December 31, 2019, while operating costs to support live geographies and enterprise functions grew 42% over the same period.
The table below illustrates our live geographies and enterprise level operating expenses since 2018 (dollars in thousands):
Year Ended | Three Months Ended June 30 | Six Months Ended June 30, | ||||||||||||||||||||||||||
2018 | 2019 | 2020 | 2020 | 2021 | 2020 | 2021 | ||||||||||||||||||||||
Platform support costs | $ | 62,739 | $ | 89,266 | $ | 99,943 | $ | 25,233 | $ | 30,667 | $ | 48,743 | $ | 59,075 | ||||||||||||||
% of Revenue | 13 | % | 11 | % | 8 | % | 9 | % | 6 | % | 8 | % | 6 | % | ||||||||||||||
Note: Represents costs to support our live geographies and enterprise functions, which are included in general and administrative expenses. | ||||||||||||||||||||||||||||
Investing in Growth
We expect to continue to focus on long-term growth through investments in onboarding new geographies onto our platform and supporting the continued growth of physicians in our existing geographies. Our new geography investments include establishing local market infrastructure and investments to drive the improvement in cost and quality ahead of a geography becoming live. Following the launch of our foundational partnership with COPC in 2017, the average total launch cost, including both implementation year costs and initial losses (if applicable), for subsequent partnerships has been $4.2 million.
We intend to continue to invest in improving the agilon platform and our technology to drive medical margin growth and enable further reinvestment in local care delivery. We also intend to continue to invest in growing our existing geographies by attracting new PCPs to join our local physician partners. In support of that,
80
we may provide capital support to accelerate the recruitment of new PCPs to our anchor partners. Accordingly, in the short term, we expect our operating expenses to increase. However, in the long term, we anticipate that these investments will positively impact our results of operations.
Impact of Seasonality
Our business is influenced by seasonality in the following primary manners:
| • | Growth in New Membership—While new members are attributed to our platform throughout the year, our largest amount of growth typically occurs in January of each year. Operations in our new geographies generally begin on January 1, at which time our MA payors attribute members from our new physician partners to our platform as our agreements with those payors in those geographies become effective. This coincides with the beginning of the Medicare program year. Similarly, our same market growth within a given year is typically greatest in January, as a result of the outcome of the Medicare Open Enrollment Period (sometimes called Annual Election Period or AEP), which runs each year from October 15 to December 7. |
| • | Per Member Revenue—Our revenue is a function of the percent of premium we have negotiated with our payors as well as our ability to accurately and appropriately document the acuity of a member’s total health status. We experience an element of seasonality with respect to our average per member revenue as it generally declines over the course of a given year. This results from the monthly cycle of (i) attributed members aging into Medicare, who typically have lower acuity profiles (and, therefore, lower average per member revenue rates) and (ii) older members with more severe acuity profiles (and, therefore, higher per member revenue rates) expiring. Additionally, in January of each year, CMS resets county-level benchmark rates, the risk adjustment factor for each member based upon health conditions documented in the prior year, and other components of premium revenue. The collective impact of these revisions has historically led to an increase in our average per member revenue. |
| • | Medical Expense—Medical expense is driven by utilization of healthcare services by attributed membership. There are seasonal factors that can influence healthcare utilization, such as the flu season or the number of calendar or working days in a given period. |
Impact of
COVID-19
Since March 2020, we have implemented precautionary measures to protect the health and safety of our employees, physicians and members in connection with the
COVID-19
pandemic. BecauseCOVID-19
infections have been reported throughout the United States, certain national, provincial, state and local governmental authorities have issued proclamations and/or directives aimed at minimizing the spread ofCOVID-19.
Additional, more restrictive proclamations and/or directives may be issued in the future.The ultimate impact of the
COVID-19
pandemic on our operations is unknown and will depend on future developments, which are highly uncertain and cannot be predicted with confidence, including the duration of theCOVID-19
outbreak, new information which may emerge concerning the severity of theCOVID-19
pandemic and any additional preventative and protective actions that governments, or we, may direct, which may result in an extended period of continued business disruption. The ultimate impact of these matters to us and our financial condition cannot be reasonably estimated at this time.Throughout most of 2020, our members incurred lower healthcare costs than otherwise would have been expected, which resulted in lower medical services expenses incurred. Average medical services expense per member declined 3% relative to 2019. This reduction was impacted by the temporary deferral of non-essential care amid the COVID-19 pandemic and improved medical cost management, among other factors. These costs may be incurred at future points in time, and it is possible that the deferral of healthcare services, or the impact of our members (who are seniors typically with chronic conditions) being diagnosed with
COVID-19,
could cause additional health problems in our existing members, which could increase our costs in the future. We cannot accurately estimate the net ultimate impact, positive or negative, to medical services expense at this time.81
Given the disruption caused by
COVID-19,
it is unclear whether our physicians will be able to document the health conditions of our members as comprehensively as they did in historical periods. Because risk adjustment factors in the current period are based on the preceding year’s diagnosed disease conditions, our revenue in future periods may be adversely impacted.On March 27, 2020, the Coronavirus Aid, Relief and Economic Security Act (“CARES Act”) was enacted to provide economic relief to individuals and businesses facing economic hardship as a result of the
COVID-19
public health emergency. The CARES Act includes, among other things, provisions relating to payroll tax credits and deferrals, net operating loss carryback periods, alternative minimum tax credits refunds, modifications to the net interest deduction limitations and technical corrections to tax depreciation methods for qualified improvement property. The changes in tax law did not have a material impact on our results of operations for the year ended December 31, 2020 or the three or six months ended June 30, 2021. We will continue to monitor possible future impacts of changes in tax legislation.See “Risk Factors—Risks Related to Our Business—The spread of, and response to, the novel coronavirus, or
COVID-19,
underscores certain risks we face and the rapid development and fluidity of this situation precludes any prediction as to the ultimate adverse impact to us ofCOVID-19.”
Key Financial and Operating Metrics
All of our key metrics exclude historical results from our California operations, which are included as discontinued operations in our consolidated financial statements. See “—California Operations.”
We monitor the following key financial and operating metrics to help us evaluate our business, identify trends affecting our business, formulate business plans and make strategic decisions. We believe the following key metrics are useful in evaluating our business (dollars in thousands):
As of and For the Three Months Ended June 30, | As of and For the Six Months Ended June 30, | As of and for the Year Ended December 31, | ||||||||||||||||||||||||||||||
2021 | 2020 | % Change | 2021 | 2020 | 2020 | 2019 | 2018 | |||||||||||||||||||||||||
MA members | 181,700 | 125,400 | 45 | % | 181,700 | 125,400 | 131,000 | 90,200 | 56,500 | |||||||||||||||||||||||
Medical services revenue | $ | 497,678 | $ | 292,495 | 70 | % | $ | 910,090 | $ | 582,309 | $ | 1,214,270 | $ | 788,566 | $ | 466,612 | ||||||||||||||||
Medical margin | $ | 55,195 | $ | 72,132 | (23 | )% | $ | 107,253 | $ | 114,293 | $ | 192,393 | $ | 63,192 | $ | 53,943 | ||||||||||||||||
Platform support costs | $ | 30,667 | $ | 25,223 | 22 | % | $ | 59,075 | $ | 48,743 | $ | 99,943 | $ | 89,266 | $ | 62,739 | | |||||||||||||||
Network contribution (1) | $ | 24,294 | $ | 38,510 | (37 | )% | $ | 54,436 | $ | 63,250 | $ | 99,016 | $ | 25,598 | $ | 22,083 | ||||||||||||||||
Adjusted EBITDA (1) | $ | (1,674 | ) | $ | 14,311 | (112 | )% | $ | 2,088 | $ | 16,888 | $ | 5,827 | $ | (56,711 | ) | $ | (32,240 | ) | |||||||||||||
| (1) | Network contribution and Adjusted EBITDA are non-GAAP financial measures. See“—Non-GAAP Financial Measures” for additional information, including reconciliations to the most directly comparable GAAP measures. |
Medicare Advantage Members
Our MA members include all individuals enrolled in an MA plan that are attributed to the PCPs on our platform at the end of a given period.
Medical Services Revenue
Our medical services revenue consists of capitation revenue under contracts with various payors. Under the typical capitation arrangement, we are entitled to PMPM fees to provide a defined range of healthcare services
82
for MA health plan members through our contracted physician partners and affiliated PCPs. Such fees are typically based on a defined percentage of corresponding premium that payors receive from CMS. We recognize capitation revenue over the period eligible members are entitled to receive healthcare services.
Medical Margin
Medical margin represents the amount earned from medical services revenue after medical services expenses are deducted. Medical services expense represents costs incurred for medical services provided to our members. As our platform matures over time, we expect medical margin to increase in absolute dollars. However, medical margin PMPM may vary as the percentage of new members brought onto our platform fluctuates. New membership added to the platform is typically dilutive to medical margin PMPM. Furthermore, in light of
COVID-19,
we continue to evaluate the ultimate impact of the pandemic on medical margin.The following table presents our medical margin (dollars in thousands):
Three Months Ended June 30, | Six Months Ended June 30, | Year Ended December 31, | ||||||||||||||||||||||||||
2021 | 2020 | 2021 | 2020 | 2020 | 2019 | 2018 | ||||||||||||||||||||||
Medical services revenue | $ | 497,678 | $ | 292,495 | $ | 910,090 | $ | 582,309 | $ | 1,214,270 | $ | 788,566 | $ | 466,612 | ||||||||||||||
Medical services expense | (442,483 | ) | (220,363 | ) | (802,837 | ) | (468,016 | ) | (1,021,877 | ) | (725,374 | ) | (412,669 | ) | ||||||||||||||
Medical margin | $ | 55,195 | $ | 72,132 | $ | 107,253 | $ | 114,293 | $ | 192,393 | $ | 63,192 | $ | 53,943 | ||||||||||||||
Network Contribution
We define network contribution as medical services revenue less the sum of: (i) medical services expense and (ii) other medical expenses excluding costs incurred in implementing geographies. Other medical expenses consist of physician incentive expense related to surplus sharing and other direct medical expenses incurred to improve care for our members. We believe this metric provides insight into the economics of our Total Care Model as it includes all medical services expense associated with our members’ care as well as partner incentive and additional medical costs we incur as part of our aligned partnership model. Other medical expenses are largely variable and proportionate to the level of surplus in each respective geography.
The following table presents our network contribution (dollars in thousands):
Three Months Ended June 30, | Six Months Ended June 30, | Year Ended December 31, | ||||||||||||||||||||||||||
2021 | 2020 | 2021 | 2020 | 2020 | 2019 | 2018 | ||||||||||||||||||||||
Medical services revenue | $ | 497,678 | $ | 292,495 | $ | 910,090 | $ | 582,309 | $ | 1,214,270 | $ | 788,566 | $ | 466,612 | ||||||||||||||
Medical services expense | (442,483 | ) | (220,363 | ) | (802,837 | ) | (468,016 | ) | (1,021,877 | ) | (725,374 | ) | (412,669 | ) | ||||||||||||||
Other medical expenses—live geographies (1) | (30,901 | ) | (33,622 | ) | (52,817 | ) | (51,043 | ) | (93,377 | ) | (37,594 | ) | (31,860 | ) | ||||||||||||||
Network contribution | $ | 24,294 | $ | 38,510 | $ | 54,436 | $ | 63,250 | $ | 99,016 | $ | 25,598 | $ | 22,083 | ||||||||||||||
| (1) | Represents physician incentive expense related to surplus sharing and other direct medical expenses incurred to improve care for our members in our live geographies. Excludes costs in geographies that are in implementation and are not yet generating revenue. For the three months ended June 30, 2021 and 2020, costs incurred in implementing geographies were $2.8 million and $1.1 million, respectively. For the years ended December 31, 2020, 2019, and 2018, costs incurred in implementing geographies were $8.9 million, $2.9 million and $2.2 million, respectively. |
See
“—Non-GAAP
Financial Measures” for information regarding our use of network contribution and a reconciliation of income (loss) from operations to network contribution.83
Platform Support Costs
Our platform support costs, which include regionally-based support personnel and other operating costs to support our geographies, are expected to decrease over time as a percentage of revenue as our physician partners add members and our revenue grows. Our operating expenses at the enterprise level include resources and technology to support payor contracting, clinical program development, quality, data management, finance and legal functions.
Adjusted EBITDA
We define Adjusted EBITDA as net income (loss) adjusted to exclude: (i) income (loss) from discontinued operations, net of income taxes, (ii) interest expense, (iii) income tax expense (benefit), (iv) depreciation and amortization costs, (v) geography entry costs, (vi) share-based compensation expense, (vii) severance and related expense and (viii) certain other items that are not considered by us in the evaluation of ongoing operating performance. Net income (loss) is the most directly comparable GAAP measure to Adjusted EBITDA.
See
“—Non-GAAP
Financial Measures” for information regarding our use of Adjusted EBITDA and a reconciliation of net income (loss) to Adjusted EBITDA.California Operations
During 2020, we implemented a plan to divest all of our California operations, which includes the entirety of our Medicaid line of business, via three separate transactions with different parties. In August 2020, we disposed of our Southern California operations for a gross sales price of $2.5 million and recognized a gain on sale of $1.3 million. In October 2020, we disposed of our Fresno, California operations for a gross sales price of $26.0 million and recognized a gain on sale of approximately $19.1 million. In December 2020, we signed a definitive agreement to sell our remaining California operations for a gross sales price of $1.0 million. The sale closed in February 2021. For the Southern California and Fresno divestiture transactions, we will continue to be responsible for any liabilities arising from the business which were incurred prior to the closing date of each transaction, including any fines, penalties and other sanctions relating to the DMHC matter described elsewhere in this prospectus, the payment of claims for medical services incurred prior to the effective date of each transaction, a liability for unrecognized tax benefits for which we are indemnified and other contingent liabilities that we currently believe are remote. See “Note 8. Medical Claims and Related Payables,” “Note 14. Income Taxes” and “Note 19. Discontinued Operations” in our audited consolidated financial statements included elsewhere in this prospectus. Our California operations are reflected in the consolidated financial statements as discontinued operations. Income (loss) from discontinued operations for the year ended December 31, 2020 includes $3.7 million of severance related to the disposition of our California operations.
Key Components of Our Results of Operations
Revenues
Medical Services Revenue
Our medical services revenue consists of capitation revenue under contracts with various payors. Under the typical capitation arrangement, we are entitled to PMPM fees to provide a defined range of healthcare services for MA health plan members through our contracted physician partners and affiliated PCPs. Such fees are typically based on a defined percentage of corresponding premium which payors receive from CMS. We recognize capitation revenue over the period eligible members are entitled to receive healthcare services.
Medical services revenue constitutes substantially all of our total revenue, accounting for 100%, 99%, and 98% of our total revenues for the years ended December 31, 2020, 2019, and 2018, respectively.
For additional discussion related to our revenue, see “—Critical Accounting Estimates—Revenue Recognition” and Note 2 to our audited consolidated financial statements included elsewhere in this prospectus.
84
Operating Expenses
Medical Services Expense
In each of our geographies, a network of physicians, hospitals and other healthcare providers provide care to our members. Medical services expense represents costs incurred for medical services provided to our members. Our medical services expense trends primarily relate to changes in per visit costs incurred by our members, along with changes in health system and provider utilization of services. Medical services expenses are recognized in the period in which services are provided and include estimates of our obligations for medical services that have been rendered by third parties, but for which claims have either not yet been received, processed or paid.
For additional discussion related to our medical services expense, see “—Critical Accounting Estimates— Medical Services Expense and Related Payables” and Note 2 to our audited consolidated financial statements included elsewhere in this prospectus.
Other Medical Expenses
Other medical expenses include: (i) partner physician incentive expense and (ii) other provider costs. Partner physician incentive expense represents incentive obligations to our physician partners corresponding to a portion of the surplus generated in our geographies, which is a function of medical services revenues less the sum of medical services expenses, other provider costs and market operating costs, for the respective geography. Physician payment amounts payable are reconciled quarterly, and settlement payments are typically issued to providers on an annual basis in arrears, with interim payments issued periodically. Other provider costs include payments for additional incentives support physician-patient engagement, certain other medical costs, and other care management expenses that help to create medical cost efficiency. Other provider costs include costs incurred for payments for geographies that are in implementation and are not yet generating revenue.
General and Administrative
General and administrative expenses consist of market-based support personnel and other operating costs to support our geographies, personnel and other operating costs to support our enterprise functions, and investments to support development and expansion of our physician partners. Our enterprise functions include salaries and related expenses, operational support expenses, technology infrastructure, finance, legal, as well as other costs associated with the continued growth of our platform. For the purposes of calculating physician partner incentive expense, we allocate a portion of our enterprise general and administrative expenses to our geographies.
General and administrative expenses also include severance, investments to support the development and expansion of our physician partners, management fees paid to our majority shareholder prior to our IPO and accruals for unasserted claims. For annual periods prior to 2021, stock-based compensation expense is included in general and administrative expenses.
Depreciation and Amortization
Depreciation and amortization expenses are associated with our property and equipment and acquired intangible assets. Depreciation includes expenses associated with buildings, computer and network equipment, furniture and fixtures, and leasehold improvements. Amortization primarily includes expenses associated with acquired intangible assets.
85
Other Income (Expense)
Other Income (Expense), Net
Other income (expense), net includes the following items:
| • | Interest income, which consists primarily of interest earned on our cash and cash equivalents and restricted cash and cash equivalents; and |
| • | Equity income (loss) from unconsolidated joint ventures. |
Interest Expense
Interest expense consists primarily of interest expense associated with our outstanding debt, including amortization of debt discounts and costs.
Income Tax Benefit (Expense)
We are subject to corporate U.S. federal, state and local income taxation. Deferred tax assets are reduced by a valuation allowance to the extent management believes it is not more likely than not to be realized. The ultimate realization of deferred tax assets is dependent upon the generation of future taxable income. Management makes estimates and judgments about future taxable income based on assumptions that are consistent with our plans and estimates.
Total Discontinued Operations
Total discontinued operations consist of the results of our California operations, which includes the entirety of our Medicaid line of business.
Results of Operations
Three Months Ended June 30, | Six Months Ended June 30, | Year Ended December 31, | ||||||||||||||||||||||||||
2021 | 2020 | 2021 | 2020 | 2020 | 2019 | 2018 | ||||||||||||||||||||||
(dollars in thousands) | ||||||||||||||||||||||||||||
Revenues: | ||||||||||||||||||||||||||||
Medical services revenue | $ | 497,678 | $ | 292,495 | $ | 910,090 | $ | 582,309 | $ | 1,214,270 | $ | 788,566 | $ | 466,612 | ||||||||||||||
Other operating revenue | 1,278 | 1,099 | 1,970 | 2,333 | 4,063 | 5,845 | 8,215 | |||||||||||||||||||||
Total revenues | 498,956 | 293,594 | 912,060 | 584,642 | 1,218,333 | 794,411 | 474,827 | |||||||||||||||||||||
Expenses: | ||||||||||||||||||||||||||||
Medical services expense | 442,483 | 220,363 | 802,837 | 468,016 | 1,021,877 | 725,374 | 412,669 | |||||||||||||||||||||
Other medical expenses | 33,694 | 34,761 | 57,355 | 53,187 | 102,306 | 40,526 | 34,092 | |||||||||||||||||||||
General and administrative | 43,013 | 34,248 | 79,318 | 60,832 | 137,292 | 122,832 | 88,745 | |||||||||||||||||||||
Stock-based compensation expense (1) | 274,548 | 2,155 | 276,020 | 3,176 | ||||||||||||||||||||||||
Depreciation and amortization | 3,581 | 3,319 | 7,008 | 6,517 | 13,531 | 12,253 | 11,385 | |||||||||||||||||||||
Total expenses | 797,319 | 294,846 | 1,222,538 | 591,728 | 1,275,006 | 900,985 | 546,891 | |||||||||||||||||||||
| (1) | For annual periods prior to 2021, stock-based compensation expense is included in general and administrative expenses. |
86
Three Months Ended June 30, | Six Months Ended June 30, | Year Ended December 31, | ||||||||||||||||||||||||||
2021 | 2020 | 2021 | 2020 | 2020 | 2019 | 2018 | ||||||||||||||||||||||
(dollars in thousands) | ||||||||||||||||||||||||||||
Income (loss) from operations | (298,363 | ) | (1,252 | ) | (310,478 | ) | (7,086 | ) | (56,673 | ) | (106,574 | ) | (72,064 | ) | ||||||||||||||
Other income (expense): | ||||||||||||||||||||||||||||
Other income (expense), net | 2,967 | (74 | ) | 4,303 | 48 | 2,465 | 955 | 611 | ||||||||||||||||||||
Interest expense | (1,498 | ) | (2,080 | ) | (4,439 | ) | (4,229 | ) | (8,135 | ) | (9,068 | ) | (9,839 | ) | ||||||||||||||
Income (loss) before income taxes | (296,894 | ) | (3,406 | ) | (310,614 | ) | (11,267 | ) | (62,343 | ) | (114,687 | ) | (81,292 | ) | ||||||||||||||
Income tax benefit (expense) | (435 | ) | (39 | ) | (451 | ) | (39 | ) | (865 | ) | 232 | 113 | ||||||||||||||||
Income (loss) from continuing operations | (297,329 | ) | (3,445 | ) | (311,065 | ) | (11,306 | ) | (63,208 | ) | (114,455 | ) | (81,179 | ) | ||||||||||||||
Discontinued operations: | ||||||||||||||||||||||||||||
Income (loss) before impairments, gain (loss) on sales and income taxes | (1,547 | ) | (4,340 | ) | (2,898 | ) | (12,429 | ) | (20,049 | ) | (86,108 | ) | (32,132 | ) | ||||||||||||||
Impairments | — | (98,343 | ) | (40,794 | ) | |||||||||||||||||||||||
Gain (loss) on sales of assets, net | — | — | — | — | 20,401 | — | — | |||||||||||||||||||||
Income tax benefit (expense) | (65 | ) | (126 | ) | (129 | ) | (275 | ) | 2,804 | 16,166 | 7,588 | |||||||||||||||||
Total discontinued operations | (1,612 | ) | (4,466 | ) | (3,027 | ) | (12,704 | ) | 3,156 | (168,285 | ) | (65,338 | ) | |||||||||||||||
Net income (loss) | (298,941 | ) | (7,911 | ) | (314,092 | ) | (24,010 | ) | (60,052 | ) | (282,740 | ) | (146,517 | ) | ||||||||||||||
Noncontrolling interests’ share in (earnings) loss | 96 | — | 169 | — | — | 152 | (409 | ) | ||||||||||||||||||||
Net income (loss) attributable to common shares | $ | (298,845 | ) | $ | (7,911 | ) | $ | (313,923 | ) | $ | (24,010 | ) | $ | (60,052 | ) | $ | (282,588 | ) | $ | (146,926 | ) | |||||||
The following table presents our results of operations as a percentage of total revenues:
Three Months Ended June 30, | Six Months Ended June 30, | Year Ended December 31, | ||||||||||||||||||||||||||
2021 | 2020 | 2021 | 2020 | 2020 | 2019 | 2018 | ||||||||||||||||||||||
Revenues: | ||||||||||||||||||||||||||||
Medical services revenue | 100 | % | 100 | % | 100 | % | 100 | % | 100 | % | 99 | % | 98 | % | ||||||||||||||
Other operating revenue | — | — | — | — | — | 1 | 2 | |||||||||||||||||||||
Total revenues | 100 | 100 | 100 | 100 | 100 | 100 | 100 | % | ||||||||||||||||||||
Expenses: | ||||||||||||||||||||||||||||
Medical services expense | 89 | 75 | 88 | 80 | 84 | 91 | 87 | |||||||||||||||||||||
Other medical expenses | 7 | 12 | 6 | 9 | 8 | 5 | 7 | |||||||||||||||||||||
General and administrative | 9 | 12 | 9 | 10 | 11 | 15 | 19 | |||||||||||||||||||||
Stock-based compensation expense (1) | 55 | 1 | 30 | 1 | ||||||||||||||||||||||||
Depreciation and amortization | 1 | 1 | 1 | 1 | 1 | 2 | 2 | |||||||||||||||||||||
Total expenses | 160 | 100 | 134 | 101 | 105 | 113 | 115 | |||||||||||||||||||||
| (1) | For annual periods prior to 2021, stock-based compensation expense is included in general and administrative expenses. |
87
Three Months Ended June 30, | Six Months Ended June 30, | Year Ended December 31, | ||||||||||||||||||||||||||
2021 | 2020 | 2021 | 2020 | 2020 | 2019 | 2018 | ||||||||||||||||||||||
Income (loss) from operations | (60 | ) | — | (34 | ) | (1 | ) | (5 | ) | (13 | ) | (15 | ) | |||||||||||||||
Other income (expense): | ||||||||||||||||||||||||||||
Other income (expense), net | 1 | — | — | — | — | — | — | |||||||||||||||||||||
Interest expense | — | (1 | ) | — | (1 | ) | (1 | ) | (1 | ) | (2 | ) | ||||||||||||||||
Income (loss) before income taxes | (60 | ) | (1 | ) | (34 | ) | (2 | ) | (5 | ) | (14 | ) | (17 | ) | ||||||||||||||
Income tax benefit (expense) | — | — | — | — | — | — | — | |||||||||||||||||||||
Income (loss) from continuing operations | (60 | ) | (1 | ) | (34 | ) | (2 | ) | (5 | ) | (14 | ) | (17 | ) | ||||||||||||||
Discontinued operations: | ||||||||||||||||||||||||||||
Income (loss) before impairments, gain (loss) on sales and income taxes | — | (1 | ) | — | (2 | ) | (2 | ) | (11 | ) | (7 | ) | ||||||||||||||||
Impairments | — | (12 | ) | (9 | ) | |||||||||||||||||||||||
Gain (loss) on sales of assets, net | — | — | — | — | 2 | — | — | |||||||||||||||||||||
Income tax benefit (expense) | — | — | — | — | — | 2 | 2 | |||||||||||||||||||||
Total discontinued operations | — | (2 | ) | — | (2 | ) | — | (21 | ) | (14 | ) | |||||||||||||||||
Net income (loss) | (60 | ) | (3 | ) | (34 | ) | (4 | ) | (5 | ) | (36 | ) | (31 | ) | ||||||||||||||
Noncontrolling interests’ share in (earnings) loss | — | — | — | — | — | — | — | |||||||||||||||||||||
Net income (loss) attributable to common shares | (60 | )% | (3 | )% | (34 | )% | (4 | )% | (5 | )% | (36 | )% | (31 | )% | ||||||||||||||
Comparison of the Three and Six Months Ended June 30, 2021 to the Three and Six Months Ended June 30, 2020
Medical Services Revenue
Three Months Ended June 30, | Change | Six Months Ended June 30, | Change | |||||||||||||||||||||||||||||
(dollars in thousands) | 2021 | 2020 | $ | % | 2021 | 2020 | $ | % | ||||||||||||||||||||||||
Medical services revenue | $ | 497,678 | $ | 292,495 | $ | 205,183 | 70 | % | $ | 910,090 | $ | 582,309 | $ | 327,781 | 56 | % | ||||||||||||||||
% of total revenues | 100 | % | 100 | % | 100 | % | 100 | % | ||||||||||||||||||||||||
Medical services revenue increased for the three and six months ended June 30, 2021 due primarily to average membership growth of 57% and 46%, respectively, which was attributable to three new geographies that began to generate revenue in 2021 and growth in our existing geographies. The increase in medical services revenue for the three and six months ended June 30, 2021 was also driven, to a lesser extent, by an increase in PMPM capitation rates of 8% and 7%, respectively.
Medical Services Expense
Three Months Ended June 30, | Change | Six Months Ended June 30, | Change | |||||||||||||||||||||||||||||
(dollars in thousands) | 2021 | 2020 | $ | % | 2021 | 2020 | $ | % | ||||||||||||||||||||||||
Medical services expense | $ | 442,483 | $ | 220,363 | $ | 222,120 | 101 | % | $ | 802,837 | $ | 468,016 | $ | 334,821 | 72 | % | ||||||||||||||||
% of total revenues | 89 | % | 75 | % | 88 | % | 80 | % | ||||||||||||||||||||||||
88
Medical services expense increased for the three and six months ended June 30, 2021 due primarily to average membership growth of 57% and 46%, respectively, which was attributable to three new geographies that became operational in 2021 and growth in our existing geographies. The increase in medical services expense for the three and six months ended June 30, 2021 was also driven, to a lesser extent, by an increase in average medical services expense per member of 28% and 17%, respectively. The increase in average medical services expense reflects, in part, the impact from COVID-19 on healthcare utilization in the prior year periods.
Other Medical Expenses
Three Months Ended June 30, | Change | Six Months Ended June 30, | Change | |||||||||||||||||||||||||||||
(dollars in thousands) | 2021 | 2020 | $ | % | 2021 | 2020 | $ | % | ||||||||||||||||||||||||
Other medical expenses | $ | 33,694 | $ | 34,761 | $ | (1,067 | ) | (3 | )% | $ | 57,355 | $ | 53,187 | $ | 4,168 | 8 | % | |||||||||||||||
% of total revenues | 7 | % | 12 | % | 6 | % | 9 | % | ||||||||||||||||||||||||
Other medical expenses decreased for the three months ended June 30, 2021 compared to 2020. Partner physician incentive expense declined by $8.3 million to $17.4 million in 2021 compared to $25.7 million in 2020. Other provider costs increased by $7.2 million to $16.2 million in 2021 compared to $9.0 million in 2020, resulting from the increase in the number of geographies and members on our platform. Other provider costs for the three months ended June 30, 2021 include $2.8 million of costs related to geographies that will become operational in January 2022, while other provider costs for the three months ended June 30, 2020 include $1.1 million of costs related to geographies that became operational in 2021.
Other medical expenses increased by $4.2 million, or 8%, for the six months ended June 30, 2021 compared to 2020. Partner physician incentive expense declined by $8.9 million to $28.5 million in 2021 compared to $37.4 million in 2020. Other provider costs increased by $13.1 million to $28.9 million in 2021 compared to $15.8 million in 2020, resulting from the increase in the number of geographies and members on our platform. Other provider costs for the six months ended June 30, 2021 include $4.5 million of costs related to geographies that will become operational in January 2022, while other provider costs for the six months ended June 30, 2020 include $2.1 million of costs related to geographies that became operational in 2021.
General and Administrative
Three Months Ended June 30, | Change | Six Months Ended June 30, | Change | |||||||||||||||||||||||||||||
(dollars in thousands) | 2021 | 2020 | $ | % | 2021 | 2020 | $ | % | ||||||||||||||||||||||||
General and administrative | $ | 43,013 | $ | 34,248 | $ | 8,765 | 26 | % | $ | 79,318 | $ | 60,832 | $ | 18,486 | 30 | % | ||||||||||||||||
% of total revenues | 9 | % | 12 | % | 9 | % | 10 | % | ||||||||||||||||||||||||
General and administrative expenses increased $8.8 million, or 26%, for the three months ended June 30, 2021 compared to 2020. Operating costs to support our live geographies and enterprise functions increased by $5.5 million to $30.7 million in 2021 compared to $25.2 million in 2020 due primarily to growth in operating costs incurred to support geographies that became operational in 2021, along with additional costs related to our operations as a public company. Operating costs to support our live geographies and enterprise functions as a percentage of revenue decreased to 6% for the three months ended June 30, 2021 compared to 9% for the same period in 2020. Investments to support geography entry increased to $6.8 million in 2021, compared to $3.7 million in 2020 due to increased costs associated with our geographies that become operational in the following calendar year. In aggregate, costs incurred for severance and fees paid to our majority shareholder remained relatively flat at $5.6 million in 2021 compared to $5.3 million in 2020.
General and administrative expenses increased $18.5 million, or 30%, for the six months ended June 30, 2021 compared to 2020. Operating costs to support our live geographies and enterprise functions increased by
89
$10.4 million to $59.1 million in 2021 compared to $48.7 million in 2020 due primarily to growth in operating costs incurred to support geographies that became operational in 2021, along with additional costs related to our operations as a public company. Operating costs to support our live geographies and enterprise functions as a percentage of revenue decreased to 6% for the six months ended June 30, 2021 compared to 8% for the same period in 2020. Investments to support geography entry increased to $10.0 million in 2021, compared to $4.4 million in 2020 due to increased costs associated with our geographies that become operational in the following calendar year. In aggregate, costs incurred for severance, fees paid to our majority shareholder, and accruals for unasserted claims and contingent liabilities increased to $10.2 million in 2021, compared to $7.7 million in 2020.
Stock-based compensation expense
Three Months Ended June 30, | Change | Six Months Ended June 30, | Change | |||||||||||||||||||||||||||||
(dollars in thousands) | 2021 | 2020 | $ | % | 2021 | 2020 | $ | % | ||||||||||||||||||||||||
Stock-based compensation expense | $ | 274,548 | $ | 2,155 | $ | 272,393 | 12640 | % | $ | 276,020 | $ | 3,176 | $ | 272,844 | 8591 | % | ||||||||||||||||
% of total revenues | 55 | % | 1 | % | 30 | % | 1 | % | ||||||||||||||||||||||||
Total stock-based compensation expense for the three months ended June 30, 2021 was $274.5 million compared to $2.2 million in 2020. Total stock-based compensation expense for the six months ended June 30, 2021 was $276.0 million compared to $3.2 million in 2020. Substantially all of the increase in 2021 relates to shares issued under partner physician group equity agreements in connection with our IPO in April 2021.
Total Discontinued Operations
Three Months Ended June 30, | Change | Six Months Ended June 30, | Change | |||||||||||||||||||||||||||||
(dollars in thousands) | 2021 | 2020 | $ | % | 2021 | 2020 | $ | % | ||||||||||||||||||||||||
Total discontinued operations | $ | (1,612 | ) | $ | (4,466 | ) | $ | 2,854 | 64 | % | $ | (3,027 | ) | $ | (12,704 | ) | $ | 9,677 | 76 | % | ||||||||||||
% of total revenues | (0 | )% | (2 | )% | (0 | )% | (2 | )% | ||||||||||||||||||||||||
Total discontinued operations for the three months ended June 30, 2021 generated losses of $1.6 million compared to losses of $4.5 million in 2020. Total discontinued operations for the six months ended June 30, 2021 generated losses of $3.0 million compared to losses of $12.7 million in 2020. As we completed the dispositions of our Southern California, Fresno and remaining California operations in August 2020, October 2020, and February 2021, respectively, medical margin and general and administrative expenses related to discontinued operations declined during 2021. For additional discussion related to discontinued operations, see Note 11 to our Consolidated Financial Statements.
Comparison of Year Ended December 31, 2020 and 2019
Medical Services Revenue
Year Ended December 31, | Change | |||||||||||||||
2020 | 2019 | $ | % | |||||||||||||
(dollars in thousands) | ||||||||||||||||
Medical services revenue | $ | 1,214,270 | $ | 788,566 | $ | 425,704 | 54 | % | ||||||||
% of total revenues | 100 | % | 99 | % | ||||||||||||
Medical services revenue increased by 54%, due primarily to growth in average membership of 46% which was attributable to four new geographies that began to generate revenue in 2020 and growth in our existing geographies. The increase in medical services revenue was also driven, to a lesser extent, by a 6% increase in PMPM capitation rates.
90
Medical Services Expense
Year Ended December 31, | Change | |||||||||||||||
2020 | 2019 | $ | % | |||||||||||||
(dollars in thousands) | ||||||||||||||||
Medical services expense | $ | 1,021,877 | $ | 725,374 | $ | 296,503 | 41 | % | ||||||||
% of total revenues | 84 | % | 91 | % | ||||||||||||
Medical services expense increased by 41% due to average membership growth of 46%, partially offset by a decrease in average medical services expense per member of 3%, which was impacted by the temporary deferral of
non-essential
care amid theCOVID-19
pandemic and improved medical cost management.Other Medical Expenses
Year Ended December 31, | Change | |||||||||||||||
2020 | 2019 | $ | % | |||||||||||||
(dollars in thousands) | ||||||||||||||||
Other medical expenses | $ | 102,306 | $ | 40,526 | $ | 61,780 | 152 | % | ||||||||
% of total revenues | 8 | % | 5 | % | ||||||||||||
Other medical expenses increased by $61.8 million, or 152%, for the year ended December 31, 2020 compared to 2019. Partner physician incentive expense increased by $45.9 million to $65.3 million in 2020 compared to $19.4 million in 2019, which is a result of improvements in medical margin and expenses incurred for geographies that became operational in 2020. Other provider costs increased by $16.0 million to $37.0 million in 2020 compared to $21.0 million in 2019, resulting from the increase in the number of geographies and members on our platform. Other provider costs for the year ended December 31, 2020 include $8.9 million of costs related to geographies that became operational in January 2021. In addition, for a geography in which we commenced implementation and became operational in 2020 we incurred $2.1 million of other provider costs. Other provider costs for the year ended December 31, 2019 include $2.9 million of costs related to geographies that became operational in 2020.
General and Administrative
Year Ended December 31, | Change | |||||||||||||||
2020 | 2019 | $ | % | |||||||||||||
(dollars in thousands) | ||||||||||||||||
General and administrative | $ | 137,292 | $ | 122,832 | $ | 14,460 | 12 | % | ||||||||
% of total revenues | 11 | % | 15 | % | ||||||||||||
General and administrative expenses increased $14.5 million, or 12%, for the year ended December 31, 2020 compared to 2019. Operating costs to support our live geographies and enterprise functions increased by $10.9 million to $100.0 million in 2020 compared to $89.1 million in 2019 due primarily to growth in operating costs incurred to support geographies that became operational in 2020, including $1.4 million of cost to support a geography in which we commenced implementation and became operational in 2020. Operating costs to support our live geographies and enterprise functions as a percentage of revenue decreased from 11% to 8% during the years ended December 31, 2019 and 2020, respectively. Investments to support geography entry increased to $17.9 million in 2020, compared to $6.9 million in 2019 due to increased costs associated with our geographies that become operational in the following calendar year. In aggregate, costs incurred for severance, stock-based compensation and fees paid to our majority shareholder increased to $12.0 million in 2020, compared to $10.0 million in 2019, while accruals for unasserted claims decreased by $9.4 million to $7.4 million in 2020 compared to $16.8 million in 2019.
91
Total Discontinued Operations
Year Ended December 31, | Change | |||||||||||||||
2020 | 2019 | $ | % | |||||||||||||
(dollars in thousands) | ||||||||||||||||
Total discontinued operations | $ | 3,156 | $ | (168,285 | ) | $ | 171,441 | 102 | % | |||||||
% of total revenues | 0 | % | (21 | )% | ||||||||||||
Total discontinued operations for the year ended December 31, 2020 generated income of $3.2 million compared to losses of $168.3 million in 2019. During 2020, we completed the dispositions of our Southern California and Fresno operations, recognizing aggregate gain on sales of $20.4 million. The year ended December 31, 2019 included: (i) intangible asset impairments of $98.3 million and (ii) $21.4 million of accelerated amortization expense on an abandoned intangible asset. Additionally, medical margin and general and administrative expenses related to discontinued operations declined during 2020 as a result of our planned disposition of California operations. For additional discussion related to discontinued operations, see Note 19 to our audited consolidated financial statements included elsewhere in this prospectus.
Comparison of Year Ended December 31, 2019 and 2018
Medical Services Revenue
Year Ended December 31, | Change | |||||||||||||||
2019 | 2018 | $ | % | |||||||||||||
(dollars in thousands) | ||||||||||||||||
Medical services revenue | $ | 788,566 | $ | 466,612 | $ | 321,954 | 69 | % | ||||||||
% of total revenues | 99 | % | 98 | % | ||||||||||||
Medical services revenue increased by 69% due primarily to growth in average membership of 56% which was attributable to two new geographies that began to generate revenue in 2019 and growth in our existing geographies. The increase in medical services revenue was also driven, to a lesser extent, by an 8% increase in PMPM capitation rates.
Medical Services Expense
Year Ended December 31, | Change | |||||||||||||||
2019 | 2018 | $ | % | |||||||||||||
(dollars in thousands) | ||||||||||||||||
Medical services expense | $ | 725,374 | $ | 412,669 | $ | 312,705 | 76 | % | ||||||||
% of total revenues | 91 | % | 87 | % | ||||||||||||
Medical services expense increased by 76% due to average membership growth of 56%. The increase in medical services expense for the year ended December 31, 2019 was also driven, to a lesser extent, by an increase in average medical services expense per member of 13%.
Other Medical Expenses
Year Ended December 31, | Change | |||||||||||||||
2019 | 2018 | $ | % | |||||||||||||
(dollars in thousands) | ||||||||||||||||
Other medical expenses | $ | 40,526 | $ | 34,092 | $ | 6,434 | 19 | % | ||||||||
% of total revenues | 5 | % | 7 | % | ||||||||||||
92
Other medical expenses increased by $6.4 million, or 19%, for the year ended December 31, 2019 compared to 2018. Partner physician incentive expense decreased by $1.6 million to $19.4 million in 2019 compared to $21.0 million in 2018. Other provider costs increased by $7.9 million to $21.0 million in 2019 compared to $13.1 million in 2018, resulting from the increase in the number of geographies and members on our platform. Other provider costs for the year ended December 31, 2019 include $2.9 million of costs related to geographies that became operational in January 2020. Other provider costs for the year ended December 31, 2018 include $2.2 million of costs related to geographies that became operational in 2019.
General and Administrative
Year Ended December 31, | Change | |||||||||||||||
2019 | 2018 | $ | % | |||||||||||||
(dollars in thousands) | ||||||||||||||||
General and administrative $ | 122,832 | $ | 88,745 | $ | 34,087 | 38 | % | |||||||||
% of total revenues | 15 | % | 19 | % | ||||||||||||
General and administrative expenses increased $34.1 million, or 38%, for the year ended December 31, 2019 compared to 2018. Operating costs to support our live geographies and enterprise functions increased by $26.4 million to $89.1 million in 2019 compared to $62.7 million in 2018 due primarily to growth in operating costs incurred to support geographies that became operational in 2019. Operating costs to support our live geographies and enterprise functions as a percentage of revenue decreased from 13% to 11% during the years ended December 31, 2018 and 2019, respectively. Investments to support geography entry increased to $6.9 million in 2019, compared to $2.7 million in 2018 due to increased costs associated with our geographies that become operational in the following calendar year. In aggregate, costs incurred for severance, stock-based compensation, fees paid to our Significant Shareholder, and accruals for unasserted claims increased to $26.8 million in 2019, compared to $23.4 million in 2018.
Total Discontinued Operations
Year Ended December 31, | Change | |||||||||||||||
2019 | 2018 | $ | % | |||||||||||||
(dollars in thousands) | ||||||||||||||||
Total discontinued operations | $ | (168,285 | ) | $ | (65,338 | ) | $ | (102,947 | ) | 158 | % | |||||
% of total revenues | (21 | )% | (14 | )% | ||||||||||||
Losses from discontinued operations increased $102.9 million, or 158%, for the year ended December 31, 2019 compared to 2018. The year ended December 31, 2019 included: (i) intangible asset impairments of $98.3 million and (ii) $21.4 million of accelerated amortization expense on an abandoned intangible asset. The year ended December 31, 2018 included impairments of $40.8 million. Additionally, losses from discontinued operations increased as a result of the reduction of income from the termination of a payor contract in August 2018.
Non-GAAP
Financial MeasuresIn addition to providing results that are determined in accordance with GAAP, we present network contribution and Adjusted EBITDA, which are
non-GAAP
financial measures.We define network contribution as medical services revenue less the sum of: (i) medical services expense and (ii) other medical expenses excluding costs incurred in implementing geographies. Other medical expenses consist of physician incentive expense related to surplus sharing and other direct medical expenses incurred to improve care for our members. We believe this metric provides insight into the economics of our Total Care
93
Model as it includes all medical services expense associated with our members’ care as well as partner incentive and additional medical costs we incur as part of our aligned partnership model. Other medical expenses are largely variable and proportionate to the level of surplus in each respective geography.
We define Adjusted EBITDA as net income (loss) adjusted to exclude: (i) income (loss) from discontinued operations, net of income taxes, (ii) interest expense, (iii) income tax expense (benefit), (iv) depreciation and amortization expense, (v) geography entry costs, (vi) share-based compensation expense, (vii) severance and related costs and (viii) certain other items that are not considered by us in the evaluation of ongoing operating performance.
Income (loss) from operations is the most directly comparable GAAP measure to network contribution. Net income (loss) is the most directly comparable GAAP measure to Adjusted EBITDA.
We believe network contribution and Adjusted EBITDA help identify underlying trends in our business and facilitate evaluation ofoperating performance of our live geographies by eliminating items that are variable in nature and not considered by us in the evaluation of ongoing operating performance, allowing comparison of our recurring core business operating results over multiple periods. We also believe network contribution and Adjusted EBITDA provide useful information about our operating results, enhance the overall understanding of our past performance and future prospects, and allow for greater transparency with respect to key metrics we use for financial and operational decision-making. We believe network contribution and Adjusted EBITDA or similarly titled
period-to-period
non-GAAP
measures are widely used by investors, securities analysts, ratings agencies, and other parties in evaluating companies in our industry as a measure of financial performance. Other companies may calculate network contribution and Adjusted EBITDA or similarly-titlednon-GAAP
measures differently from the way we calculate these metrics. As a result, our presentation of network contribution and Adjusted EBITDA may not be comparable to similarly titled measures of other companies, limiting their usefulness as comparative measures.Adjusted EBITDA is not considered a measure of financial performance under GAAP, and the items excluded therefrom are significant components in understanding and assessing our financial performance. Adjusted EBITDA has limitations as an analytical tool and should not be considered in isolation or as an alternative to such GAAP measures as net income (loss), cash flows provided by or used in operating, investing or financing activities or other financial statement data presented in our consolidated financial statements as an indicator of financial performance or liquidity. Some of these limitations are:
| • | Adjusted EBITDA does not reflect changes in, or cash requirements for, working capital needs; |
| • | Adjusted EBITDA does not reflect interest expense, or the requirements necessary to service interest or principal payments on debt; |
| • | Adjusted EBITDA does not reflect income tax expense (benefit) or the cash requirements to pay taxes; |
| • | Adjusted EBITDA does not reflect historical cash expenditures or future requirements for capital expenditures or contractual commitments; |
| • | Although depreciation and amortization charges are non-cash charges, the assets being depreciated and amortized will often have to be replaced in the future, and Adjusted EBITDA does not reflect any cash requirements for such replacements; and |
| • | The expenses and other items that we exclude in our calculation of Adjusted EBITDA may differ from the expenses and other items, if any, that other companies may exclude from similarly titled non-GAAP financial measures. |
94
The following table sets forth a reconciliation of income (loss) from operations to network contribution using data derived from our consolidated financial statements for the periods indicated (dollars in thousands):
Three Months Ended June 30, | Six Months Ended June 30, | Year Ended December 31, | ||||||||||||||||||||||||||
2021 | 2020 | 2021 | 2020 | 2020 | 2019 | 2018 | ||||||||||||||||||||||
Income (loss) from operations | $ | (298,363 | ) | $ | (1,252 | ) | $ | (310,478 | ) | $ | (7,086 | ) | $ | (56,673 | ) | $ | (106,574 | ) | $ | (72,064 | ) | |||||||
Other operating revenue | (1,278 | ) | (1,099 | ) | (1,970 | ) | (2,333 | ) | (4,063 | ) | (5,845 | ) | (8,215 | ) | ||||||||||||||
Other medical expenses | 33,694 | 34,761 | 57,355 | 53,187 | 102,306 | 40,526 | 34,092 | |||||||||||||||||||||
Other medical expenses (live geographies) (1) | (30,901 | ) | (33,622 | ) | (52,817 | ) | (51,043 | ) | (93,377 | ) | (37,594 | ) | (31,860 | ) | ||||||||||||||
General and administrative | 43,013 | 34,248 | 79,318 | 60,832 | 137,292 | 122,832 | 88,745 | |||||||||||||||||||||
Stock-based compensation expense (2) | 274,548 | 2,155 | 276,020 | 3,176 | ||||||||||||||||||||||||
Depreciation and amortization | 3,581 | 3,319 | 7,008 | 6,517 | 13,531 | 12,253 | 11,385 | |||||||||||||||||||||
Network contribution | $ | 24,294 | $ | 38,510 | $ | 54,436 | $ | 63,250 | $ | 99,016 | $ | 25,598 | $ | 22,083 | ||||||||||||||
| (1) | Represents physician incentive expense related to surplus sharing and other direct medical expenses incurred to improve care for our members in our live geographies. Excludes costs in geographies that are in implementation and are not yet generating revenue. For the three months ended June 30, 2021 and 2020, costs incurred in implementing geographies were $2.8 million and $1.1 million, respectively. For the six months ended June 30, 2021 and 2020, costs incurred in implementing geographies were $4.5 million and $2.1 million, respectively. For the years ended December 31, 2020, 2019, and 2018, costs incurred in implementing geographies were $8.9 million, $2.9 million and $2.2 million, respectively. |
| (2) | For annual periods prior to 2021, stock-based compensation expense is included in general and administrative expenses. |
The following table sets forth a reconciliation of net income (loss) to Adjusted EBITDA using data derived from our condensed consolidated financial statements for the periods indicated (dollars in thousands):
Three Months Ended June 30, | Six Months Ended June 30, | Year Ended December 31, | ||||||||||||||||||||||||||
2021 | 2020 | 2021 | 2020 | 2020 | 2019 | 2018 | ||||||||||||||||||||||
Net income (loss) | $ | (298,941 | ) | $ | (7,911 | ) | $ | (314,092 | ) | $ | (24,010 | ) | $ | (60,052 | ) | $ | (282,588 | ) | $ | (146,926 | ) | |||||||
(Income) loss from discontinued operations, net of income taxes | 1,612 | 4,466 | 3,027 | 12,704 | (3,156 | ) | 168,285 | 65,338 | ||||||||||||||||||||
Interest expense | 1,498 | 2,080 | 4,439 | 4,229 | 8,135 | 9,068 | 9,839 | |||||||||||||||||||||
Income tax expense (benefit) | 435 | 39 | 451 | 39 | 865 | (232 | ) | (113 | ) | |||||||||||||||||||
Depreciation and amortization | 3,581 | 3,319 | 7,008 | 6,517 | 13,531 | 12,253 | 11,385 | |||||||||||||||||||||
Geography entry costs (1) | 9,578 | 4,865 | 14,545 | 6,523 | 27,100 | 9,787 | 4,918 | |||||||||||||||||||||
Severance and related costs | 3,788 | 2,689 | 4,242 | 2,691 | 4,009 | 3,675 | 3.036 | |||||||||||||||||||||
Management fees (2) | 58 | 353 | 433 | 683 | 1,530 | 1,885 | 1,755 | |||||||||||||||||||||
Stock-based compensation expense | 274,548 | 2,155 | 276,020 | 3,176 | 6,472 | 4,399 | 2,950 | |||||||||||||||||||||
EBITDA adjustment related to equity method investments | 652 | — | 652 | — | — | — | ||||||||||||||||||||||
Other (3) | 1,517 | 2,256 | 5,363 | 4,336 | 7,393 | 16,757 | 15,578 | |||||||||||||||||||||
Adjusted EBITDA | $ | (1,674 | ) | $ | 14,311 | $ | 2,088 | $ | 16,888 | $ | 5,827 | $ | (56,711 | ) | $ | (32,240 | ) | |||||||||||
95
| (1) | Represents direct geography entry costs, including investments to develop and expand our platform, physician incentive expense, employee-related expenses and marketing. For the three months ended June 30, 2021 and 2020, (i) $2.8 million and $1.1 million, respectively, are included in other medical expenses and (ii) $6.8 million and $3.7 million, respectively, are included in general and administrative expenses. For the six months ended June 30, 2021 and 2020, (i) $4.5 million and $2.1 million, respectively, are included in other medical expenses and (ii) $10.0 million and $4.4 million, respectively, are included in general and administrative expenses. For the years ended December 31, 2020, 2019, and 2018, (i) $8.9 million, $2.9 million and $2.2 million, respectively, are included in other medical expenses and (ii) $17.9 million, $6.9 million, and $2.7 million, respectively, are included in general and administrative expenses. |
| (2) | Represents management fees and other expenses paid to CD&R. In connection with our IPO, we terminated our consulting agreement with CD&R, effective April 16, 2021. We were not charged a fee in connection with the termination of this agreement. |
| (3) | Includes changes in non-cash accruals for unasserted claims and contingent liabilities. |
Liquidity and Capital Resources
Overview
We have historically financed our operations primarily through funds generated from our capitation arrangements with payors, issuances of equity securities and borrowings under the Credit Facilities. We generally invest any excess cash in money market accounts, which are classified as cash and cash equivalents. As of June 30, 2021, we had cash and cash equivalents of $1.1 billion.
On April 19, 2021, we completed the initial public offering of 53,590,000 shares of common stock at the public offering price of $23.00 per share. The net proceeds of the offering were approximately $1.2 billion, after underwriting fees and other offering expenses.
We expect to continue to incur operating losses and generate negative cash flows from operations for the foreseeable future due to the investments we intend to continue to make in expanding our business and additional general and administrative costs we expect to incur to operate as a public company. As a result, we may require additional capital resources to execute strategic initiatives to grow our business.
Our primary uses of cash include payments for medical claims and other medical expenses, administrative expenses, costs associated with the development of new geographies and expansion of existing geographies, debt service and capital expenditures. Final reconciliation and receipt of amounts due from payors are typically settled in arrears, following completion of the contractual program year.
Our investment strategies are designed to provide safety and preservation of capital, sufficient liquidity to meet the cash flow needs of our business operations and attainment of a competitive return.
Based on our planned operations, we believe that our existing cash and cash equivalents, as well as available borrowing capacity under the 2021 Credit Facilities, will be sufficient to meet our working capital and capital expenditure needs over at least the next 12 months, though we may require additional capital resources in the future. We have based these estimates on assumptions that may prove to be wrong, and we could utilize our available capital resources sooner than we expect.
We may require additional financing to fund working capital and pay our obligations. We may seek to raise any necessary additional capital through a combination of public or private equity offerings and/or debt financings. There can be no assurance that we will be successful in acquiring additional funding at levels sufficient to fund our operations or on terms favorable to us, if at all. If adequate funds are not available on acceptable terms when needed, we may be required to significantly reduce operating expenses, which may have a
96
material adverse effect on our business, financial condition, cash flows and results of operations. If we do raise additional capital through public or private equity or debt financings, the ownership interest of our existing stockholders will be diluted, and the terms of these securities may include liquidation or other preferences that adversely affect our existing stockholders’ rights. If we raise additional capital through debt financing, we may be subject to covenants limiting or restricting our ability to take specific actions, such as incurring additional debt, making capital expenditures or declaring dividends.
Our ability to pay dividends to holders of our common stock is significantly limited as a practical matter by our growth plans as well as the 2021 Credit Facilities insofar as we may seek to pay dividends out of funds made available to us by agilon health management, inc. (“agilon management”) or its subsidiaries, because the 2021 Credit Facilities restrict agilon management’s ability to pay dividends or make loans to us. The borrower on the 2021 Credit Facilities is agilon management, a wholly-owned subsidiary. The 2021 Credit Facilities are guaranteed by certain of our subsidiaries, including those identified as VIEs, and contain customary covenants including, among other things, limitations on restricted payments including: (i) dividends and distributions from restricted subsidiaries, (ii) requirements of minimum financial ratios, and (iii) limitation on additional borrowings based on certain financial ratios.
Cash Flows
The following summary discussion of our cash flows is based on the consolidated statements of cash flows. The following table sets forth changes in cash flows (dollars in thousands):
Six Months Ended June 30, | Year Ended December 31, | |||||||||||||||||||||||
2021 | 2020 | Change | 2020 | 2019 | 2018 | |||||||||||||||||||
Net cash provided by (used in) operating activities | $ | (80,119 | ) | $ | (35,498 | ) | $ | (44,621 | ) | $ | (53,204 | ) | $ | (103,861 | ) | $ | (67,531 | ) | ||||||
Net cash provided by (used in) investing activities | (76,338 | ) | (2,351 | ) | (73,987 | ) | $ | 22,066 | $ | (5,060 | ) | (7,970 | ) | |||||||||||
Net cash provided by (used in) financing activities | 1,143,077 | 31,522 | 1,111,555 | $ | 24,621 | $ | 176,298 | 84,743 | ||||||||||||||||
Net Cash Provided by (Used in) Operating Activities
Net cash used in operating activities was $80.1 million for the six months ended June 30, 2021 compared to $35.5 million for the six months ended June 30, 2020. The increase in net cash used in operating activities was primarily a result of: (i) the transition of claims payment services back to the health plan for one of our capitation contracts effective January 1, 2021, (ii) higher geography entry costs, and (iii) an increase in general and administrative expenses, including prepayments related to public company insurance, partially offset by lower cash used in our California operations. Additionally, 2020 benefitted from lower claims payments due to reduced utilization as a result of the impact of COVID-19.
Net cash used in operating activities was $53.2 million for the year ended December 31, 2020 compared to $103.9 million for the year ended December 31, 2019. The improvement in net cash used in operating activities was primarily a result of an increase in medical margin, partially offset by higher physician incentive payments.
Net cash used in operating activities was $103.9 million for the year ended December 31, 2019 compared to $67.5 million for the year ended December 31, 2018. The increase in net cash used in operating activities was primarily a result of the termination of our largest payor in California in August 2018.
Our cash flow from operations is dependent upon the number of members on our platform, the timing of settlements with payors and the level of operating and general and administrative expenses necessary to operate and grow our business, among other factors.
97
Net Cash Provided by (Used in) Investing Activities
Net cash used in investing activities was $76.3 million for the six months ended June 30, 2021 compared to $2.4 million for the six months ended June 30, 2020. The increase in net cash used in investing activities was primarily a result of providing net loans to our physician partner groups in connection with taxes payable on shares distributed to them upon completion of the IPO under the partner physician group equity agreements of $67.8 million.
Net cash provided by investing activities was $22.1 million for the year ended December 31, 2020 compared to net cash used in investing activities of $5.1 million for the year ended December 31, 2019. The increase in net cash from investing activities was primarily a result of proceeds received of: (i) $26.2 million from the disposition of our Southern California and Fresno operations; and (ii) $2.0 million from the partial repayment of a loan receivable.
Net cash used in investing activities was $5.1 million for the year ended December 31, 2019 compared to $8.0 million for the year ended December 31, 2018. The decrease in net cash used in investing activities was primarily a result of declines in the acquisition of intangible assets and loan funding.
Net Cash Provided by (Used in) Financing Activities
Net cash provided by financing activities was $1.1 billion for the six months ended June 30, 2021 compared to $31.5 million for the six months ended June 30, 2020. In February 2021, we refinanced our existing debt with a $100.0 million term loan, receiving net proceeds of $30.1 million. In April 2021, we received net proceeds of approximately $1.2 billion upon the completion of our IPO, after deducting underwriting discounts and commissions and offering costs. Upon completion of our IPO in April 2021, we repaid $50.0 million of the term loan as required under the terms of our credit facility. During the six months ended June 30, 2020, we raised net proceeds of $32.7 million from private sales of our common stock.
Net cash provided by financing activities was $24.6 million for the year ended December 31, 2020 compared to $176.3 million for the year ended December 31, 2019. The decline in net cash provided by financing activities was primarily a result of higher capital raised from private sales of our common stock in 2019 compared to 2020, as well as the repurchase of common stock in 2020.
Net cash provided by financing activities was $176.3 million for the year ended December 31, 2019 compared to $84.7 million for the year ended December 31, 2018. The increase in net cash provided by financing activities was primarily a result of higher capital raised from private sales of our common stock in 2019 compared to 2018, along with higher net debt repayments during 2018.
Debt Obligations
Secured Credit Facility
As of December 31, 2020, our Secured Credit Facility includes the Secured Term Loan Facility of up to $60.0 million and the Secured Revolving Facility of up to $60.0 million, subject to a $10.0 million limitation on cash holdings and the capacity to issue standby letters of credit in certain circumstances up to a maximum of $40.0 million. The Secured Revolving Facility is scheduled to mature on July 1, 2021, and the Secured Term Loan Facility is scheduled to mature on July 1, 2022. As of December 31, 2020, we had $48.6 million outstanding under the Secured Term Loan Facility, and availability under the Secured Revolving Facility was $41.5 million as we had outstanding letters of credit under our Secured Revolving Facility totaling $18.5 million. No amounts have been drawn on the outstanding letters of credit as of December 31, 2020. Our wholly-owned subsidiary, agilon health management, inc. is the borrower under the Secured Credit Facility.
98
The Secured Credit Facility contains customary covenants including, among other things, limitations on restricted payments including: (i) dividends and distributions from restricted subsidiaries, (ii) requirements of minimum financial ratios and (iii) limitation on additional borrowings based on certain financial ratios. Failure to meet any of these covenants could result in an event of default under the agreement. If an event of default occurs, the lenders could elect to declare all amounts outstanding under the agreement to be immediately due and payable. As of December 31, 2020, we were in compliance with all covenants under the Secured Credit Facility.
Unsecured Debt
As of December 31, 2020, we have a $20.0 million Unsecured Credit Facility with a lender affiliated with the CD&R Investor (the “unsecured debt”). The unsecured debt’s interest rate is fixed at 11.50% and matures in December 2023. Our wholly-owned subsidiary, agilon health management, inc. is the borrower under the unsecured debt.
2021 Secured Credit Facilities
On February 18, 2021, we executed a credit facility agreement (as amended by the First Amendment to Credit Agreement, dated as of March 1, 2021, the “2021 Credit Facilities”). The 2021 Credit Facilities include: (i) a $100.0 million senior secured term loan (the “2021 Secured Term Loan Facility”) and (ii) a $100.0 million senior secured revolving credit facility (the “2021 Secured Revolving Facility”) with a capacity to issue standby letters of credit in certain circumstances up to a maximum of $80.0 million. Subject to specified conditions and receipt of commitments, the 2021 Secured Term Loan Facility may be expanded (or a new term loan facility, revolving credit facility or letter of credit facility added) by up to (i) $50.0 million plus (ii) an additional amount determined in accordance with a formula tied to repayment of certain of our indebtedness. The 2021 Secured Term Loan Facility required, among other things, a mandatory prepayment of $50.0 million if gross proceeds from the IPO exceed $1.0 billion. On April 26, 2021, we repaid $50.0 million of the 2021 Secured Term Loan Facility. The maturity date of the 2021 Credit Facilities was extended to February 18, 2026, with mandatory periodic payments.
As of June 30, 2021, the Company had $50.0 million outstanding under the 2021 Secured Term Loan Facility and availability under the 2021 Secured Revolving Facility was $64.4 million as the Company had outstanding letters of credit totaling $35.6 million, of which $14.0 million was for the Company’s DCE investments. The standby letters of credit are automatically extended without amendment for one-year periods, unless the Company notifies the institution in advance of the expiration date that the letter will be terminated. No amounts have been drawn on the outstanding letters of credit as of June 30, 2021.
The proceeds from the 2021 Secured Term Loan Facility were used to refinance our outstanding indebtedness under the prior term loan and unsecured debt, with the remaining $30.1 million used for working capital and other general corporate purposes. At our option, borrowings under the 2021 Secured Credit Facilities, as defined in the credit agreement, can be either: (i) LIBO Rate Loans or (ii) Base Rate Loans. LIBO Rate Loans bear interest at a rate equal to the sum of 4.00% (stepping down to 3.50% on and following October 1, 2023) and the higher of (a) LIBO, as defined in the credit agreement, and (b) 0%. Base Rate Loans bear interest at a rate equal to the sum of 3.00% (stepping down to 2.50% on and following October 1, 2023) and the highest of: (a) 0.50% in excess of the overnight federal funds rate, (b) the prime rate established by the administrative agent from time to time, (c) the one-month LIBO rate (adjusted for maximum reserves) plus 1.00% and (d) 0%. Additionally, we pay a commitment fee on the unfunded 2021 Revolving Credit Facility amount of 0.50% (stepping down to 0.375% on and following October 1, 2023). We must also pay customary letter of credit fees.
The 2021 Secured Credit Facilities contain customary covenants including, among other things, limitations on restricted payments including: (i) dividends and distributions from restricted subsidiaries, (ii) requirements of minimum financial ratios, and (iii) limitation on additional borrowings based on certain financial ratios.
99
For additional discussion on our debt obligations, see Note 10 to our audited consolidated financial statements and Notes 7 and 14 to our unaudited interim condensed consolidated financial statements included elsewhere in this prospectus and “Description of Certain Indebtedness.”
Equity
As of June 30, 2021, we had 390.9 million shares of common stock outstanding. On April 19, 2021, we completed the initial public offering of 53,590,000 shares of common stock at the public offering price of $23.00 per share. The net proceeds of the offering were approximately $1.2 billion, after underwriting fees and other offering expenses.
Contractual Obligations and Commitments
Our capital commitments to physician partners to support physician partner expansion and related purposes increased by $23.2 million, to $41.9 million at June 30, 2021 when compared to December 31, 2020. There have been no other material changes, outside of the ordinary course of business and indebtedness, to our commitments during the six months ended June 30, 2021.
For additional discussion on our operating leases, other liabilities and capital commitments, see Notes 7 and 8, respectively, to our unaudited interim condensed consolidated financial statements included elsewhere in this prospectus. For additional discussion on our operating leases, other liabilities and capital commitments, see Notes 5, 9 and 11, respectively, to our audited consolidated financial statements included elsewhere in this prospectus.
Off-Balance
Sheet ArrangementsWe had no material
off-balance
sheet arrangements as of June 30, 2021.Critical Accounting Estimates
Management’s discussion and analysis of our financial condition and results of operations is based on our financial statements, which have been prepared in accordance with GAAP. The preparation of financial statements in conformity with GAAP requires us to use judgment in the application of accounting policies, including making estimates and assumptions. We base estimates on the best information available to us at the time, our historical experience, known trends and events and various other assumptions that we believe are reasonable under the circumstances. These estimates affect the reported amounts of assets and liabilities, disclosure of contingent assets and liabilities at the date of the financial statements and the reported amounts of revenue and expenses during the reporting periods. If our judgment or interpretation of the facts and circumstances relating to various transactions or other matters had been different, it is possible that different accounting would have been applied, resulting in a different presentation of our consolidated financial statements. From time to time, we re-evaluate our estimates and assumptions. In the event estimates or assumptions prove to be different from actual results, adjustments are made in subsequent periods to reflect more current estimates and assumptions about matters that are inherently uncertain. For a more detailed discussion of our significant accounting policies, see Note 2 to our audited consolidated financial statements included elsewhere in this prospectus. Below is a discussion of accounting policies that we consider critical in that they may require complex judgment in their application or require estimates about matters that are inherently uncertain.
Principles of Consolidation
The consolidated financial statements include the accounts of agilon health, our wholly-owned subsidiaries and entities that we control, through voting rights or other means. We consolidate investments in variable interest entities (“VIEs”) when we are the primary beneficiary of the VIE. A variable interest holder is considered to be
100
the primary beneficiary of a VIE if it has the power to direct the activities that most significantly impact the VIE’s economic performance and has the obligation to absorb losses, or the right to receive benefits, that could potentially be significant to the VIE.
We make judgments about which entities are VIEs based on an assessment of whether: (i) the equity investment at risk is insufficient to finance that entity’s activities without additional subordinated financial support, (ii) substantially all of an entity’s activities either involve or are conducted on behalf of an investor that has disproportionately few voting rights, or (iii) the equity investors as a group lack any of the following: (a) the power through voting or similar rights to direct the activities of an entity that most significantly impact the entity’s economic performance, (b) the obligation to absorb the expected losses of an entity or (c) the right to receive the expected residual returns of an entity.
We also make judgments with respect to our level of influence or control over an entity and whether we are (or are not) the primary beneficiary of a VIE. Consideration of various factors includes, but is not limited to:
| • | which activities most significantly impact the entity’s economic performance, and our ability to direct those activities; |
| • | our form of ownership interest; |
| • | our representation on the entity’s governing body; |
| • | the size and seniority of our investment; |
| • | our ability to manage our ownership interest relative to other interest holders; |
| • | our ability and the rights of other parties to participate in policy making decisions; and |
| • | our ability to liquidate the entity. |
Our ability to correctly assess our influence or control over a VIE when determining the primary beneficiary affects the presentation of these VIEs in our consolidated financial statements. When we perform a reassessment of the primary beneficiary at a date other than at inception of the VIE, our assumptions may be different and may result in the identification of a different primary beneficiary. If we determine that we are the primary beneficiary of a VIE, our consolidated financial statements include the operating results of the VIE.
Revenue Recognition
We recognize revenue in accordance with Accounting Standards Update (“ASU”) 2014-09,(“ASC 606”), which we adopted as of January 1, 2019 using the modified retrospective transition method. The adoption of ASC 606 had no impact on our revenue recognition, as revenue from our contracts with customers continues to be recognized over time as services are rendered, and therefore, no cumulative effect adjustment was recorded. Medical services revenue consists of capitation fees under contracts with various payors. Under the typical capitation arrangement, we are entitled to monthly PMPM fees to provide a defined range of healthcare services for MA health plan members attributed to our contracted physicians. PMPM fees are determined as a percent of the premium payors receive from CMS for these members. We generally accept full financial risk for members attributed to our contracted physicians, which means we are responsible for the cost of all healthcare services required by them. Contracts with payors are generally multi-year arrangements and have a single performance obligation that constitutes a series, as defined by ASC 606, to stand ready on a monthly basis to provide all aspects of necessary medical care to members for the contracted period. We recognize revenue in the month in which eligible members are entitled to receive healthcare benefits during the contract term.
Revenue from Contracts with Customers (Topic 606)
The transaction price for our MA capitation contracts is variable as the PMPM fees to which we are entitled are subject to periodic adjustment under CMS’s risk adjustment payment methodology. CMS deploys a risk
101
adjustment model that determines premiums paid to all payors according to each member’s health status and certain demographic factors. Under this risk adjustment methodology, CMS calculates the risk adjusted premium payment using diagnosis data from various settings. We and our healthcare providers collect and submit the necessary and available diagnosis data to payors and we utilize such data to estimate risk adjustment payments to be received in subsequent periods. Risk adjustment-related revenues are estimated using the most likely amount methodology and amounts are only included in revenue to the extent that it is probable that a significant reversal of cumulative revenue will not occur once any uncertainty is resolved. PMPM fees are also subject to adjustment for incentives or penalties based on the achievement of certain quality metrics defined in our contracts with payors. We recognize incentive revenue as earned using the most likely amount methodology and only to the extent that it is probable that a significant reversal of cumulative revenue will not occur once any uncertainty is resolved.
The determination of these estimates is subject to significant judgment. If these assessments were to change, the timing and amount of our revenue recognized would be impacted, which may be material to our consolidated financial statements.
Medical Services Expense and Related Payables
Medical services expense represents costs incurred for medical services provided to members by physicians, hospitals and other ancillary providers for which we are financially responsible, and which are paid either directly by us or by payors with whom we have contracted. Medical services expenses are recognized in the period in which services are provided and include estimates of our obligations for medical services that have been rendered by third parties, but for which claims have either not yet been received, processed or paid.
Such estimates are based on many variables, including utilization trends and historical and statistical lag analysis, among other factors. The assumptions for making such estimates and establishing liabilities are continually reviewed and updated, and any adjustments resulting therein are reflected in current period earnings. These estimates may differ from actual results, which could be material to our consolidated financial statements. The difference between the estimated liability and the related actual settlement of claims is recognized in the period the claims are settled.
If it is determined that our assumptions in estimating such liabilities are significantly different than actual results, our results of operations and financial position could be impacted in future periods. Adjustments of prior period estimates may result in additional medical care expense or a reduction of medical care expense in the period an adjustment is made. Further, due to the considerable variability of healthcare costs, adjustments to claim liabilities occur each period and may be significant as compared to the net income (loss) recorded in that period.
The estimate of medical costs payable represents our best estimate of our liability for unpaid medical costs.
Impairment of Long-Lived Assets
Amortizable intangible assets include health plan contracts, trade names, provider networks, developed software, physician rosters and noncompete enforcement agreements. Amortization expense is computed using the straight-line method over the estimated useful life of these assets. We consider the period of expected cash flows and related underlying data used to measure the fair value of the intangible assets (or the length of time for a noncompete agreement) when selecting a useful life.
Intangible assets are subject to impairment tests when events or circumstances indicate that the carrying value of the asset, or related group of assets, may not be recoverable. In such circumstances, we compare the carrying value of an amortizable intangible asset to the estimated future undiscounted cash flows generated by the asset or asset group. The estimated future undiscounted cash flows are calculated using the lowest level of identifiable cash flows that are largely independent of the cash flows of other assets and liabilities.
102
The impairment tests are based on financial projections prepared by us that incorporate anticipated results from programs and initiatives being implemented. If projections are not met, or if negative trends occur that impact the outlook, the value of the intangible assets may be impaired.
Goodwill represents the acquired fair value of a business in excess of the fair values of tangible and identifiable intangible assets acquired. We test goodwill for impairment annually and on an interim basis if an event occurs or if circumstances change that would indicate the carrying amount may not be recoverable. When testing goodwill for impairment, we may first assess qualitative factors to determine if it is more likely than not that the carrying value of a reporting unit exceeds its estimated fair value. If the qualitative assessment indicates that it is more likely than not that the carrying value of a reporting unit exceeds its estimated fair value, we perform the quantitative assessment. In the quantitative assessment, an estimate of the fair value of the reporting unit is determined primarily by an income approach, utilizing discounted cash flows and a market approach which considers comparable public companies and related transactions.
In August 2018, our largest payor in California terminated its relationship with us, causing a triggering event to test goodwill for impairment. We performed a fair value assessment of the related reporting unit and determined that the carrying amount of the reporting unit exceeded its fair value and the reporting unit’s goodwill was impaired. Our fair value calculation is based on an income approach and relies on historical and forecasted revenue and Adjusted EBITDA, as well as market data. As a result of the assessment, we recognized a $37.8 million impairment charge in the consolidated statements of operations and comprehensive income (loss), which represented the entire goodwill balance of our California reporting unit during the year ended December 31, 2018.
Due to the continued deterioration in the performance of our reporting unit, in the fourth quarter of 2019, we initiated a process to evaluate strategic alternatives for our California operations, including a sale or abandonment of all or substantially all of such operations. We therefore performed an assessment of the long-lived assets in the California reporting unit for impairment and determined that the carrying value of certain of those assets was not recoverable. Accordingly, we wrote-down such assets to fair value, resulting in the recognition of a $98.3 million impairment charge in the consolidated statements of operations for the year ended December 31, 2019. Our California operations, including the impairment charge, are presented as discontinued operations.
The determination of the fair value of intangible assets and goodwill involves significant judgment. This judgment is based on our analysis and estimates of fair value of intangible assets and goodwill, future operating results and resulting cash flows, and the period over which we will hold each asset. Our ability to accurately predict future operating results and resulting cash flows, and estimate fair values, impacts the timing and recognition of impairments. While we believe our assumptions are reasonable, changes in these assumptions may have a material impact on our consolidated financial statements.
Stock-based Compensation
Stock-based compensation cost is measured at grant date, based on the fair value of the award, and is recognized (i) on a straight-line basis over the requisite service period for awards subject only to service-based vesting conditions or (ii) upon the achievement of the underlying performance condition for awards subject to such conditions. We determine the fair value of stock-based option awards subject to a service condition on the date of grant using the Black-Scholes option pricing model, unless the awards are also subject to a market condition, in which case we use a Monte Carlo simulation valuation model. The Black-Scholes option pricing model and the Monte Carlo simulation model require the use of several highly subjective and complex assumptions to determine the fair value of stock-based awards. These variables include the following:
| • | Expected Term |
103
| • | Expected Volatility |
| • | Risk-Free Interest Rate |
| • | Expected Dividend |
Certain of our arrangements provide for the vesting of share-based awards to third parties at the time of an initial public offering or sale of a controlling interest (“Change of Control Event”). Such share-based instruments granted to third parties are accounted for as non-employee awards for which compensation cost will be recognized upon the achievement of the underlying performance condition of a Change of Control Event. As the instruments are liability-classified, the amount of shares ultimately issued and related compensation cost were measured at the vesting date in April 2021, as a Change of Control Event was not deemed probable until consummated. Upon our initial public offering, we recognized stock-based compensation cost relating to these share-based instruments of $268.5 million.
We continue to use judgment in evaluating the expected volatility and expected term utilized in our stock-based compensation expense calculation on a prospective basis. As we continue to accumulate additional data related to our common stock, we may refine our estimates of expected volatility and expected term, which could materially impact our future stock-based compensation expense.
Common Stock Valuation
Prior to our initial public offering in April 2021, as our common stock had never been previously publicly traded, the estimated fair value of our shares has been determined by our board of directors as of the date of each grant of a share-based award, with input from management, considering the most recently available third-party valuations of our common stock and our board of directors’ assessment of additional objective and subjective factors that we believed were relevant and which may have changed from the date of the most recent valuation through the date of the grant. Our board of directors intends all options granted to be exercisable at a price per share not less than the per share fair value of our common stock underlying those options on the date of grant. We use both the income and market approach valuation methods, in addition to giving consideration to recent secondary sales of our common stock. The income approach estimates value based on the expectation of future cash flows that a company will generate. These future cash flows are discounted to their present values using a discount rate based on our weighted-average cost of capital, which is adjusted to reflect the risks inherent in our cash flows. The market approach estimates value based on a comparison of the subject company to comparable public companies in a similar line of business. From the comparable companies, a representative market value multiple is determined and then applied to the subject company’s financial forecasts to estimate the value of the subject company.
The fair value of our common stock was determined at each valuation date in accordance with the guidelines outlined in the American Institute of Certified Public Accountants Accounting and Valuation Guide, Valuation of Privately-Held Company Equity Securities Issued as Compensation. The factors considered in determining the fair value include, but are not limited to, the following:
| • | valuations of our common stock completed on a regular basis; |
| • | our historical financial results and estimated trends and projections for our future operating and financial performance; |
| • | likelihood of achieving a liquidity event, such as an initial public offering or sale of our company, given prevailing market conditions; |
104
| • | the market performance of comparable, publicly-traded companies; and |
| • | the overall economic and industry conditions and outlook. |
Applying these valuation and allocation approaches involves the use of estimates, judgments and assumptions that are highly complex and subjective, such as those regarding our expected future revenue, expenses and cash flows, discount rates, valuation multiples, the selection of comparable public companies and the probability of future events. Changes in any or all of these estimates and assumptions, or the relationships between these assumptions, impact our valuation as of each valuation date and may have a material impact on the valuation of our common stock.
After our initial public offering in April 2021, we no longer apply these valuation and allocation approaches to determine the fair value of our stock because our common stock is traded in the public market. We will continue to use the Black-Scholes and Monte Carlo models for option pricing.
Recent Accounting Pronouncements
For the impact of new accounting standards, see Note 2 to the unaudited interim condensed consolidated financial statements and audited consolidated financial statements included elsewhere in this prospectus.
Quantitative and Qualitative Disclosures about Market Risks
We are exposed to various market risks, including the potential loss arising from adverse changes in interest rates. We do not use derivative financial instruments in the normal course of business or for speculative or trading purposes.
Our exposures to market risk for changes in interest expense relate primarily to the 2021 Credit Facilities. Indebtedness under the 2021 Credit Facilities is floating rate debt and is carried at amortized cost. Therefore, fluctuations in interest rates will impact our consolidated financial statements. A rising interest rate environment will increase the amount of interest paid on this debt. A hypothetical 100 basis point change in interest rates would impact our interest expense by less than $1.0 million for the six months ended June 30, 2021.
We held cash, cash equivalents and restricted cash equivalents of $1.1 billion as of June 30, 2021, consisting of bank deposits, certificates of deposits, and money market funds. Such interest-earning instruments carry a degree of interest rate risk. The goals of our investment policy are liquidity and capital preservation. We believe that we do not have any material exposure to changes in the fair value of these assets as a result of changes in interest rates due to the short-term nature of our cash, cash equivalents and restricted cash equivalents.
Emerging Growth Company Status
We ceased to be an emerging growth company on December 31, 2020 because our annual gross revenues exceeded $1.07 billion for the year ended December 31, 2020.
105
BUSINESS
Overview
Our business is transforming healthcare by empowering the PCP to be the agent for change in the communities they serve. We believe that PCPs, with their intimate patient-physician relationships, are best positioned to drive meaningful change in quality, cost and patient experience when provided with the right infrastructure and payment model. Through our combination of the agilon platform, a long-term partnership model with existing physician groups and a growing network of like-minded physicians, we are poised to revolutionize healthcare for seniors across communities throughout the United States. Our purpose-built model provides the necessary capabilities, capital and business model for existing physician groups to create a Medicare-centric, globally capitated line of business. Our model operates by forming RBEs within local geographies, that enter into arrangements with payors providing for monthly payments to manage the total healthcare needs of our physician partners’ attributed patients (or global capitation arrangements), contract with agilon to perform certain functions and enter into long-term professional service agreements with one or more anchor physician groups pursuant to which the anchor physician groups receive a base compensation rate and share in the savings from successfully improving quality of care and reducing costs.
Our company was formed in 2016, and we established our inaugural partnership with an anchor physician group in 2017. Our ability to rapidly build scaled positions in local communities has allowed us to grow to 16 anchor physician groups and 17 geographies in fewer than five years. Our platform has enabled us to grow our total membership by 45% and revenue by 53% from December 31, 2019 to December 31, 2020. As of June 30, 2021, the PCPs on our platform serve approximately 230,700 MA members on our platform, which includes approximately 49,000 MA patients with physician groups contracted to go-live on January 1, 2022. In addition, through our participation in the CMS Innovation Center Direct Contracting Model, our PCPs serve over 50,000 Medicare FFS beneficiaries through our five currently approved DCEs. For the year ended December 31, 2020, our DCEs did not contribute to our revenue.
Empower PCPs to Transform Care in Their Communities
The current state of the U.S. healthcare system is defined by:
| • | Unsustainably high and rising costs characterized by waste, unnecessary variation in care and poor patient experience and health outcomes; |
| • | FFS reimbursement model focused on units of service rather than a coordinated approach to meet the unique needs of individual patients; |
106
| • | High incidence of physician burnout driven by growing administrative burden and the FFS reimbursement model; |
| • | An aging U.S. population, with the over 65 population projected to grow from approximately 49 million in 2016 to approximately 77 million in 2034, driving Medicare growth and pressuring the healthcare system as average reimbursement fails to keep pace with the rise in average patient complexity; |
| • | Rapid patient adoption of MA plans, private health plans administering Medicare benefits, as seniors increasingly value supplemental benefits and low monthly premiums; |
| • | The Medicare population is projected to grow from approximately 62 million in 2020 to more than 70 million individuals in 2025 with a total spend of approximately $1.25 trillion, and MA enrollment comprised 37% of total Medicare enrollment in 2019 and is projected to comprise 47% of total Medicare enrollment in 2025; |
| • | PCPs are positioned—but not currently empowered or incentivized—to act as the quarterback for healthcare delivery, with their decisions estimated to influence up to 90% of total healthcare spending according to a 2017 study; and |
| • | The United States spends only 5% to 7% of its total healthcare dollars on primary care in contrast to 14% among OECD nations on average. |
We believe that failing to empower PCPs has fostered waste, needless variability in care and unsustainable growth in healthcare costs. According to a 2019 article entitled “Waste in the US Health Care System: Estimated Costs and Potential for Savings” published in the Journal of the American Medical Association, failure of care delivery, failure of care coordination and overtreatment or low-value care were estimated to represent $205.3 billion to $345.1 billion of waste annually in the U.S. healthcare system. While there is broad recognition of the need to move beyond a volume-based, FFS reimbursement model, structural hurdles have impeded rapid adoption of a
PCP-led
Total Care Model.To overcome these hurdles and achieve our mission of being the trusted long-term partner to community-based physicians, we have developed what we believe is aTotal Care Model for community-based physicians that focuses exclusively on Medicare and manages subscription-like PMPM arrangements with health plans or directly with the government. The agilon Total Care Model is powered by our platform, enabled through a long-term partnership model and reinforced via our growing national network of like-minded physicians. Our position as innovators is demonstrated by a series of transformative accomplishments since the formation of the company in July 2016, and our first partnership in 2017, many of which we believe to be industry-firsts:
first-of-its-kind
| • | Implemented the first MA multi-payor, globally capitated risk model with a community-based physician group in all of our diverse anchor geographies; |
| • | Exported the Total Care Model from one to 17 geographies ranging from communities as small as Zanesville, Ohio to large and rapidly growing communities such as Austin, Texas; |
| • | Built strong local positions with established community-based physician group leaders who have intimate and trusted relationships with patients in their communities, such as Austin Regional Clinic in Austin, Texas, Buffalo Medical Group in Buffalo, New York, Central Ohio Primary Care in Columbus, Ohio, Preferred Primary Care Physicians in Pittsburgh, Pennsylvania and Wilmington Health in Wilmington, North Carolina; |
| • | Grew from approximately 24,000 MA members to approximately 230,700 MA members on our platform; |
| • | Expanded from two payors to 15 payors on our platform; and |
| • | Began participating in the Direct Contracting Model, with over 50,000 Medicare FFS beneficiaries served by our existing PCPs contracted through our five currently approved DCEs. |
107
Our business model is differentiated by its focus on existing community-based physician groups and is built around three key elements: (1) agilon’s platform; (2) agilon’s long-term physician partnership approach; and (3) agilon’s network. With our model, our goal is to remove the barriers that prevent community-based physicians from evolving to a Total Care Model, where the physician is empowered to manage health outcomes and the total healthcare needs of their attributed Medicare patients.
The result is PCPs transforming their historical transaction-based model to a long-term, holistic membership-based model that is reflective of the intimate and trusted relationship between physician and patient. Despite our history of net losses, we believe this membership-based model results in a recurring revenue stream and provides our anchor physician groups with access to an incremental profit margin opportunity based on delivering high-quality care and health outcomes. Freed from the constraints of the transactional FFS reimbursement model, our PCPs are empowered to practice team-based, coordinated care when addressing individual patient needs and transition to a sustainable long-term business model for their senior patients. We believe enabling PCPs to unlock the value of a Medicare-centric, globally capitated line of business while remaining independent can transform the community-based physician business model.
The agilon Platform
| • | Payor Engagement |
| • | Direct Contracting Model |
| • | Data Integration and Management |
| • | Clinical Programs and Product Development |
| • | Quality (Clinical and Experience) |
| • | Growth 60-64 year old patients, to enable their patients to make educated healthcare choices. These existing patients represent a large, growing and durable source of potential attributed member growth. |
| • | Performance Management Analytics |
108
| • | Financial Management |
| • | National Policy |
agilon’s Long-term Physician Partner Model
The power of our local partnership model is defined by the scale, breadth and local brand of our physician partners. On average, our anchor physician groups have been serving their communities for more than 40 years, have a PCP tenure of approximately 13 years and receive exceptionally strong NPS from their PCPs and patients in live geographies of 73 and 83, respectively. We believe this gives us the ability to influence the local healthcare delivery system at scale. We expect our physician partner patient panels to systematically migrate to MA as the patient population ages and our partnerships mature. We estimate that the number of Medicare FFS patients, Medicare-eligible patients and patients expected to age into Medicare over the next five years in our existing physician partner patient populations is approximately 375,000.
agilon’s Network
The agilon Flywheel Effect
109
from December 31, 2019 to December 31, 2020. Our general and administrative expenses per member contracted by 18% from December 31, 2018 to December 31, 2019. For the years ended December 31, 2020, 2019, and 2018 we had revenue of $1.2 billion, $794.4 million, and $474.8 million, respectively, and net loss of $60.1 million, $282.7 million, and $146.5 million, respectively. For the six months ended June 30, 2021, we had revenue of $912.1 million and net loss of $314.1 million.
Our Market
In 2020, approximately 62 million Americans were enrolled in Medicare nationally, of which we estimate approximately 27 million to be affiliated with independent physicians. We consider near-term growth opportunities to be geographies with independent physician groups and further refine our prioritized geographies based on criteria to identify physician groups that are well-positioned to succeed in a Total Care Model and would benefit from joining the agilon platform.
We consider our current addressable market to be the estimated 17.5 million Medicare beneficiaries affiliated with independent PCPs in states in which we already have a physician partner or a signed letter of intent with a physician group as of January 2021, and those in which we have identified near-term prioritized geographies. Based on 2021 estimated average annual revenue per Medicare member to us of approximately $10,000, we estimate that this represents a total addressable market size of approximately $175 billion in 2020. We believe this addressable market will increase to nearly 20 million Medicare beneficiaries and $253 billion by 2025, based on CMS projected Medicare enrollment and spending per beneficiary growth rates.
110
| (1) | 2020 Medicare spend for total Medicare beneficiaries is based on CMS spend per beneficiary. |
| (2) | 2025 Medicare spend for total Medicare beneficiaries, beneficiaries attributed to independent PCPs and agilon total addressable market is based on CMS projected Medicare enrollment and spending per beneficiary growth rates. |
Of our estimated 2020 addressable market, $80 billion is concentrated in states in which we currently have a physician partner or a signed letter of intent with a physician group as of January 2021, and $24 billion is based in counties in which we currently have a physician partner or a signed letter of intent with a physician group as of January 2021. In addition to the MA members our physician partners currently serve, we estimate our physician partners also serve approximately 375,000 patients that are addressable, which includes all Medicare FFS beneficiaries and commercial patients expected to age into Medicare over the next five years. This represents a 2020 market size of approximately $3.8 billion, using the same assumed annual revenue per Medicare member to us.
In addition, we see an additional opportunity for growth of our addressable market in physicians currently affiliated with health systems or insurance providers who become increasingly dissatisfied with those models. In considering our total addressable market, please also see “Risk Factors—Risks Related to Our Business.”
We have experienced substantial membership and revenue growth in our live geographies, as highlighted in the below graph. Membership in our live geographies has grown at a CAGR of approximately 65% from December 31, 2017 to December 31, 2020. Our revenue has grown at a CAGR of approximately 83% over the same period. Our membership on the platform as of December 31, 2020 represents less than 1% of total MA lives in our current addressable market. We have a history of net losses, we expect our expenses will increase as our membership and revenue grow, and we may not be able to achieve or maintain profitability.
111
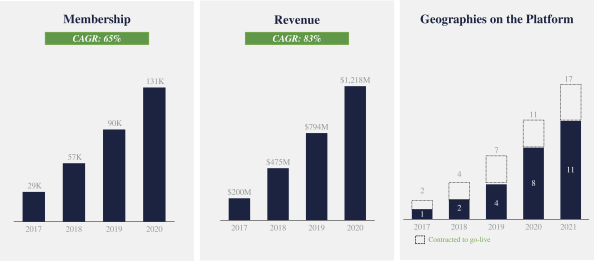
Total membership has increased 45% from 90,200 at December 31, 2019 to 131,000 at December 31, 2020. Total revenues increased 53% from $794.4 million in the year ended December 31, 2019 to $1.2 billion in the year ended December 31, 2020. For the years ended December 31, 2018, 2019 and 2020, respectively, our net loss was $146.5 million, $282.7 million, and $60.1 million and our Adjusted EBITDA was $(32.2) million, $(56.7) million, and $5.8 million. See “Management’s Discussion and Analysis of Financial Condition and Results of
Operations—Non-GAAP
Financial Measures” for more information as to how we define and calculate Adjusted EBITDA and for a reconciliation of net loss, the most comparable GAAP measure, to Adjusted EBITDA.Industry Challenges and Our Opportunity
We believe that failing to empower PCPs to drive meaningful change in quality, cost and patient experience has fostered waste, unnecessary variability in care and poor patient experience and health outcomes. The pressure to see more patients under the current FFS reimbursement model coupled with increasing administrative burden has resulted in physician dissatisfaction. Despite their proximity to patients, PCPs often do not have the capabilities or incentive to more effectively control delivery of care or to improve patient experience and health outcomes. We believe there is a significant opportunity to impact growth in U.S. healthcare costs and change the trajectory of the primary care business model through a platform, such as ours, in which PCPs are empowered to manage health outcomes and the total healthcare needs of their attributed Medicare patients and share in the financial surplus created to the extent premiums received exceed the cost of medical care.
Unsustainably high and rising U.S. healthcare costs
The U.S. healthcare industry is the largest in the world. According to CMS, U.S. national healthcare expenditures are expected to increase from $3.81 trillion in 2019 to $4.27 trillion in 2021. CMS projects that by 2028, healthcare expenditures will reach $6.20 trillion and will account for 19.7% of the U.S. GDP, up from 17.7% in 2018. Despite this level of spending, U.S. healthcare outcomes remain inferior relative to those of other OECD countries. According to a 2018 report, the U.S. ranked 54
th
in overall healthcare efficiency based on a weighted average of life expectancy, relative cost per capita and absolute cost per capita of healthcare. In addition to these inefficiencies, industry dynamics have led to significant variability in the quality and cost of healthcare services. A study by the NIH found a 36% difference in price between high priced and low priced physician practices for the most commonly billed PCP services. Moreover, the quality of healthcare services can vary dramatically across providers. According to the CMS, the predicted risk-adjusted30-day
readmission rate for hospitals across the country ranges from 2% to 30% with a median of 17%.112
Patients are dissatisfied with the fragmented and uncoordinated healthcare experience
In the current FFS model, reimbursement is focused on units of service rather than a coordinated approach to meet the unique needs of individual patients. As a result, care delivery is often uncoordinated, leaving patients frustrated and responsible to navigate their own way through a fragmented and complex healthcare system.
PCPs are well-positioned to be agents of change
According to Oregon’s Patient-Centered Primary Care Home Program, every $1 spent on primary care services can save $13 of future healthcare costs. Across the U.S., there are more than 486,000 active PCPs who serve as patients’ first and most frequent point of contact for their healthcare experience. This trusted position enables PCPs to act as the quarterback for the long-term health of their patients through the identification of individual health needs and implementation of high-value interventions. We believe that PCPs operating in this capacity represent the key to transforming the healthcare system.
The trajectory of the current independent primary care business model is unsustainable
In the current FFS reimbursement model, as average reimbursement rates decline, PCPs must increase the number of patients they see to sustain their practice. This volume-based model perpetuates physician burnout and jeopardizes the long-term sustainability of the independent primary care business model. According to a 2019 report, more than 50% of family physicians show symptoms of burnout, driven in part the FFS reimbursement model and increasing administrative burden. We believe this has been exacerbated by the effects of
COVID-19.
Physician dissatisfaction coupled with inadequate physician compensation is having a significant negative impact on the primary care landscape. Medscape’s 2020 Physician Compensation Report shows that more than 50% of PCPs do not feel fairly compensated, and 23% of all physicians would not choose medicine as their career today.
Growth of the complex and costly Medicare population is accelerating pressure on primary care
The Medicare population is expected to grow from approximately 62 million individuals in 2020 to approximately 70 million individuals by 2025. As Medicare patients increasingly represent a larger portion of the patient population, we believe the pressure on the strained primary care delivery system and overall healthcare system will accelerate. The Health Resources and Services Administration has found that approximately 81 million Americans live in areas designated as having a shortage of PCPs, with a current PCP shortage of approximately 15,000. The estimated shortage of PCPs is expected to grow over the next several years, projected to reach approximately 20,000 to 50,000 in the 2030’s. Further, the Medicare population is medically complex and disproportionately drives utilization of healthcare services. For example, more than
two-thirds
of Medicare members suffer from two or more chronic illnesses, and Medicare members accounted for 31% of hospital admissions in 2017 despite representing only 18% of the U.S. population at that time. In addition, average Medicare FFS reimbursement is significantly lower than average commercial reimbursement, compensating PCPs less for complex and resource-intensive patients. We believe the imbalance between the needs of the Medicare population and a health system not rewarding PCPs, its most impactful care coordinators, is unsustainable.We believe the healthcare industry has reached an inflection point and is ripe for a bold, disruptive approach. The state of primary care, increasing pressures from an aging population and an FFS reimbursement model that is not aligned with efforts to improve healthcare quality, cost and patient experience is creating an inflection point for physicians, payors and patients.
Structural Hurdles to Adoption of a Total Care Model
We believe that all key stakeholders—patients, physicians and payors—benefit significantly from an environment where PCPs are empowered to manage health outcomes and the total healthcare needs of their
113
attributed Medicare patients versus operating in the current FFS reimbursement model that primarily rewards units of service. However, over time, the existing FFS system has created structural hurdles that now impede rapid and broad adoption of a
PCP-led
Total Care Model.PCPs lack the incentive structure to reorganize the healthcare delivery system.
The FFS reimbursement model forces PCPs to narrowly focus on the unit of care. Rather than rewarding PCPs for influencing health behaviors, improving the quality of care and effectively managing healthcare costs, the current incentive structure fosters waste and inefficiencies. We believe this creates significant opportunity for a platform that can change the payment model for PCPs.
PCPs lack the infrastructure to participate in a multi-payor model.
PCPs typically contract with multiple payors, each with a unique care delivery and quality framework. Accordingly, PCPs are required to organize services, deliver care and measure quality based on the specific insurance of each individual patient, resulting in administrative burden and a fragmented patient experience. We believe this creates significant opportunity for a platform that can create a unified experience for physicians across multiple payors.
PCPs lack the breadth of capabilities and resources necessary to transition to a Total Care Model.
Participation in a Total Care Model, in which a PCP assumes financial responsibility for their patients, requires technology, people, process and capital. For example, PCPs require technology to capture data and risk-stratify populations to better manage clinical outcomes, processes to improve quality of care and manage healthcare costs, and an ability to engage with payors to support different forms of payment. PCPs today do not have the time or the access to expertise and capital necessary to buy, build or implement these capabilities. Further, we believe that approximately two-thirds of physicians perceive that current value-based care models will negatively impact their practice. We believe this creates significant opportunity for a platform that can unify a broad set of capabilities and deliver them in a model that allows them to be utilized in an integrated and outcome-centric manner.
PCP groups are highly fragmented and lack the benefits of scale.
PCP groups are highly localized and fragmented. Fragmentation has exacerbated the challenge of moving towards a Total Care Model as scale supports the ability to take on financial risk, access new and different infrastructure and develop comprehensive models for managing the total care of a population. We believe this creates significant opportunity for a platform that allows physicians to remain independent but access necessary financial resources, infrastructure and a collaborative network of like-minded partners.
Limited long-term, deep collaboration between payors and physicians.
We believe that payors generally recognize that PCPs are critical in directing and managing the total cost of care. Payors have attempted to increase their proximity to PCPs through acquisitions and investments in clinical delivery and technologies. However, a payor’s ability to impact physician workflow continues to be structurally limited by the multi-payor nature of most physician practices. This makes it challenging for any single payor to achieve the level of integration we believe is needed to improve clinical engagement and effectively manage healthcare costs. We believe this creates significant opportunity for a platform that can create alignment between payors and physicians while supporting the need to have access to multiple payors.
Our Answer
We have created a Total Care Model for community-based physicians that focuses exclusively on Medicare and manages the comprehensive healthcare needs of our members through subscription-like PMPM arrangements with health plans or directly with CMS—powered by the agilon platform, enabled through a long-term partnership model and reinforced via a growing national network.
114
Our business model is differentiated by its focus on existing community-based physician groups and is built around three key elements: (1) agilon’s platform; (2) agilon’s long-term physician partnership approach; and (3) agilon’s network. With our model, our goal is to remove the barriers that prevent community-based physicians from evolving to a Total Care Model, where the physician is empowered to manage health outcomes and the total healthcare needs of their attributed Medicare patients. The result is PCPs transforming their historical transaction-based model to a long-term, holistic membership-based model that is reflective of the intimate and trusted relationship between physician and patient.
The agilon Platform:
co-developed
and has been continuously refined with our physician partners since the formation of the company. This enables the platform to meet the specific needs of community-based physicians, who continuously accrue knowledge and benefit from a growing network of physician partners. As of June 30, 2021, the platform is deployed across 17 diverse geographies in conjunction with 15 different payors, serving 230,700 MA members on our platform. The platform’s scalability is reflected in both the number of members onboarded and the diverse nature of our physician partners and our geographies. Our anchor physician group partners range from groups with approximately 15,000 commercial patients, Medicare FFS patients and MA patients to approximately 375,000. We serve communities that range in total population from approximately 225,000 to 3.2 million and adult population from approximately 137,000 to 2.5 million and as of 2020, MA penetration rates that range from 27% to 64% and five-year CAGR growth rates that range from 2% to 16%. The proportion of MA members that in 2020 selected a PPO insurance product as a percentage of total MA membership in our geographies ranges from 25% to 78%. In 2020, our anchor physician groups serve from approximately 6% to 59% of MA lives in their respective primary service areas.The agilon platform comprises an integrated set of capabilities, delivered as a unified platform to enable successful partnerships at the community level, create a national network of PCPs and physician groups and empower our PCPs to improve health outcomes for their patients.
Purpose-Built Full Stack Platform

We deliver a unified platform of integrated, constantly improving capabilities to our physician partners through a long-term partnership model:
Platform Capabilities
| • | Payor Engagement |
115
program management and financial management. Under our multi-year contracts with payors, agilon receives a percentage of total premiums and is responsible for managing the cost of the total healthcare needs of patients attributed to our PCPs. In 2021, we anticipate working with 15 payors, nine of which were live in 2020 and five of which went live in 2021, across a total of approximately 40 local contracts. Five of our payors are national, and our relationships with them across geographies support the portability of the agilon platform. |
| • | Direct Contracting Model |
| • | Data Integration and Management |
| • | Clinical Programs and Product Development co-developed with our physicians and can be deployed and seamlessly integrated across our network to drive improved health outcomes. Combining insights from evidence-based medicine and patient-level data, our medical leadership and local physician leaders develop high-value actionable playbooks for partner physicians to deliver quality care, which include operational plans, analytics and tracking metrics. |
Recently developed clinical products include our referral management product, which leverages our unique dataset, clinical analytics and technology-driven workflows to provide PCPs with evidence-based resources to identify top-performing, high-quality specialists in their service area. Performance evaluations are developed through several data sources as well as evidence-based care pathways, quality metrics and comparative analytics. These performance evaluations, along with EMR integration and an end-to-end referral management platform, enables a referrals process that we believe can reduce variability in quality of patient care and improve care coordination between PCPs and specialists. We believe that variation in specialty care contributes to lower quality of care and increased healthcare costs, and providing PCPs with access to better data and tools to effectively manage referrals provides an opportunity to reduce this waste.
116
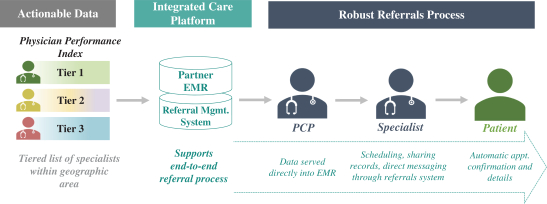
| • | Quality (Clinical and Experience) 4-STAR-rated or higher plans, compared to 77% of MA members nationally. More than 90% of our providers surveyed in our live anchor physician groups believed that the quality of care programs developed through the agilon network enabled our physician partners to provide better care to their patients. Based on data from most of our anchor partners, approximately 50% of total medical costs are driven by specialists, with the potential for wide variability in costs depending on the quality of the specialist providing care. |
| • | Growth 60-64 year-old patients, to enable their patients to make educated healthcare choices. These existing patients represent a large, growing and durable source of potential attributed member growth. We believe many of these patients will enroll in MA plans and fuel our local attributed member growth over the coming years. During the year ended December 31, 2020, individuals whoaged-in to MA or transitioned to MA from traditional Medicare were the primary driver of our 17% same-geography growth in existing geographies. |
| • | Performance Management Analytics peer-to-peer |
| • | Financial Management |
| • | National Policy |
117
and MA payment. We regularly meet with policymakers and policy shapers in Washington, D.C. to help inform the national dialogue and future policies governing these critical issues. |
agilon’s Long-term Physician Partner Model
We built the agilon platform to be deployed through an aligned long-term partnership model with community-based physician groups to address the need to move healthcare closer to the physician, be outcome-centric and optimize the long-term sticky relationship between a patient and their existing physician. This model allows agilon to make significant early investments that enable our physician partners to rapidly transition to a Total Care Model and grow a Medicare-centric, globally capitated line of business. The ability to deliver actionable insight at the patient and physician level delivered through our aligned partnership model withphysician feedback drives accountability and accelerates the pace of change. Our anchor physician group relationships have the following characteristics:
peer-to-peer
| • | Long-term partnership model that allows both agilon and physicians to take the long-term view and benefit from the maturity of a growing number of members on the platform; |
| • | Shared governance and co-location of staff to manage our local partnerships; |
| • | Local dyad leadership structure that includes a medical director from the local anchor physician group; |
| • | Local brand which reflects the local anchor physician group or geography; |
| • | Capital from agilon to support value-based care infrastructure supporting the delivery of high-quality healthcare, and 100% downside protection, which removes a major obstacle to physicians making the leap to a Total Care Model; |
| • | Operating leverage created by amortizing centralized investments in the platform infrastructure across a growing number of physician partners; and |
| • | Surplus dollars generated locally due to improvements in quality of care and healthcare costs are shared with the local anchor physician group. We believe this will allow physicians to unlock the value in their practices by moving to a membership-based model that is better aligned with the long-term physician-Medicare patient relationship. |
In each of our geographies, we enter into subscription-like PMPM agreements with payors to manage the total healthcare costs of our attributed members. Through this partnership model, we believe we:
| • | empower PCPs to act as the quarterback for healthcare delivery; |
| • | enable PCPs to define a tailored patient experience across multiple payors; |
| • | create an operating partnership and economic model built around improved health outcomes instead of a transaction-based model; and |
| • | align the physician business model with the strength of their long-term patient relationships enabling the long-term growth of independent, community-based physician groups. |
The power of our local partnership model is defined by the scale, breadth and local brand of our physician partners. On average, our anchor physician groups have been serving their communities for more than 40 years, have a PCP tenure of approximately 13 years, and receive exceptionally strong NPS from their PCPs and patients in live geographies of 73 and 83, respectively. We believe this gives us the ability to influence the local healthcare delivery system at scale. We expect our physician partner patient panels to systematically migrate to MA as the patient population ages and our partnerships mature. We estimate that the number of Medicare FFS patients, Medicare-eligible patients and patients expected to age into Medicare over the next five years in our existing physician partner patient populations is approximately 375,000.
118
The table below presents an overview of our anchor physician groups:
In addition to our anchor physician groups in the table above, we have broadly contracted with PCPs across the state of Hawaii and have developed select deeper primary care relationships within that network.
Our Network
We believe the agilon network creates significant value for our patients, our physician partners, our payors and our organization. The ability to share best practices, compare notes on the transition to a Total Care Model and learn from one another represents a valuable opportunity for physicians who intentionally choose an independent path rather than joining a health system or insurance provider. Our physician partners are both collaborative and constructively competitive in service of their patients. We believe the power of a like-minded group of community-based physicians, many of whom are leaders in their community, will enhance innovation, growth, quality of care and patient experience, and ultimately strengthen the power of the independent physician business model in local communities across the country.
Through our scaled and growing network, we continue to rapidly develop and improve a suite of clinical programs and processes for use by our physician partners. Our clinical product development, designed to support our physician partners in their delivery of high-quality care, is performed in full partnership with our physician partners and engages national experts in the requisite specialty area tocomparison of efficiency and clinical metrics at the physician, population and network levels.
co-develop
cutting-edge programs that support our physician partners in meeting or exceeding national benchmarks. We believe the quality and savings opportunities from such innovations are tremendous. As an example of shared learning and collaboration which we have helped facilitate, our physician partners have led the development of high-value clinical pathways for specific disease states, including osteoarthritis, CHF and coronary artery disease that have been adopted across our network. Additionally, outcomes from these clinical programs are enhanced by the application of performance management analytic capabilities andpeer-to-peer
119
As a result of
COVID-19,
we have taken a number of steps to continue to support and strengthen our network. This was highlighted by physicians from across the country coming together for daily huddles at the outset of the pandemic on clinical and operational impacts ofCOVID-19,
as well as regular conference calls with recognized national experts in which up to 200 physicians and team members across our network participated. Through these interactions, physicians were able to gain insight into best practices, share knowledge and develop programs to influence appropriate and innovative care delivery for their patients.Value Proposition to Stakeholders
Our Total Care Model empowers community-based physician groups to lead local healthcare transformation and ensure the long-term sustainability of the community-based physician model.
We believe the benefits of this differentiated model to community-based physician groups and the patients they serve include:
• | Rapid creation of a Medicare Total Care Model . |
• | Sustainable long-term business model alongside commercial and Medicare FFS . |
• | Provides access to network of like-minded partners . know-how and best practices encourages success in a Total Care Model. |
• | Improved economics . |
• | Improving the physician experience. |
• | Improving the patient experience . |
120
• | Supporting superior health outcomes. know-how and best practices to be able to identify and close CMS quality of care gaps and improve their patients’ experience. Further, we believe our Total Care Model provides greater stability and predictability for CMS, the Medicare program and its beneficiaries in the communities our physician partners serve. For example, in 2019, 78% of our members attributed to our live anchor physician groups attended their wellness visits, compared to the FFS national average CMS Annual Wellness Visit completion rate of 35% in 2019, enabling our PCPs to comprehensively assess members’ overall health condition and appropriately manage their care. Additionally, in 2019, our members’ ER utilization was 42% lower than the local FFS benchmark, inpatient acute utilization was 47% lower than the local FFS benchmark, and hospitalre-admission rate was 26% lower than the local FFS benchmark. In 2020, approximately 90% of our members in live geographies are currently enrolled in4- and5-STAR-rated plans compared to 77% of the MA population nationally. |
We have also become an important strategic partner for our payors, as we are a material portion of their membership base, delivery network and annual membership growth in many of the geographies we serve. Through our subscription-like agreements, we ensure a consistent gross margin on a growing membership base. The strength of our relationships with payors has resulted in our establishment of national joint-operating committees with five national health plans through which we develop, execute and monitor a strategy for growth and performance as part of their Medicare delivery network.
Our Strengths
Local and National Leadership and First-Mover Dynamics
Core to our model is partnering in local geographies with leading physician groups that have already built significant scale and strong brands in the communities they serve. Our local leadership is highlighted by the fact that in multiple geographies in 2020, our anchor physician groups serve more than 15% of the total adult population in the counties they serve. We believe our anchor physician groups are a critical component of their local healthcare delivery system. On average, our anchor physician groups have been serving their communities for more than 40 years, have a PCP tenure of approximately 13 years and receive exceptionally strong NPS from their PCPs and patients in our live geographies of 73 and 83, respectively.
We believe we are pioneers in providing a full-risk, multi-payor Total Care Model within our local geographies, our growing regional hubs and the country. We believe we are the only MA multi-payor, globally capitated risk vehicle available for independent physician groups to access a Total Care Model in our local geographies. These multi-payor relationships coupled with theplatform we provide to our anchor physician groups enables them to often be the first Medicare-centric, globally capitated network in their geography, enhancing their already established leadership position. We believe this ultimately leads to more physicians joining our physician partners. The sustainability of this local leadership position is also enhanced by our long-term partnerships with our anchor physician groups.
end-to-end
We’ve established a strong local leadership position in 17 geographies creating what we believe to be the first national platform for a Medicare-centric, globally capitated line of business. We believe our position as a first-mover creates a competitive advantage, resulting in other independent physician groups viewing us as an established and trusted partner. Our leadership position has translated to 230,700 total MA members on our platform. Because of the size and scale of our network, we also added over 50,000 Medicare FFS lives to our platform in 2021 through the Direct Contracting Model.
121
Long-Term Economic Model
We believe our membership and
per-member
profitability will grow over time due to structural characteristics inherent to our long-term partnerships, durable and growing MA membership within our physician partners and the nature of the MA economic model. The key strengths of our economic model include:| • | We believe we have the ability to generate significant, recurring and growing medical margin in concert with our physician partners over the course of our long-term partnerships and the inherently sticky physician-patient relationship. These durable relationships allow physician partners to invest time and resources to support our members’ long-term health outcomes through preventative services and increased coordination across the entire care continuum. |
| • | Our partnerships with our anchor physician groups are structured as long-term contractual relationships, typically for 20 years. |
| • | Average physician tenure within our anchor physician groups is 13 years. |
| • | Patients 65 years of age and older remain with their PCP for an average of 10 years, according to a 2004 study. |
| • | Embedded same-geography, long-term organic membership growth resulting from our physician partners’ existing patients who age into Medicare and elect to enroll in MA or who elect to convert from Medicare FFS to MA over the life of our long-term partnership. Expanding this model to include patients enrolled in traditional Medicare through the Direct Contracting Model further increases the value of our long-term partnerships. |
Although we have incurred net losses since our formation in 2016, we believe that the combination of a growing membership base and improving medical margin over the life of our long-term partnerships creates a significant LTV for the geographies we enter. As our members age and our physician partners become more adept at effectively managing the continuum of care of our members under a Total Care Model, we have observed that the profitability (measured by medical margin PMPM) of our live geographies, or a cohort of members within a live geography, typically increases over time. The below data illustrates how select live geographies at different maturities have grown and performed since joining the platform, including results for the year ended December 31, 2020. The medical margin PMPM data presented below reflect the ongoing dilutive impact of new members in any year. Since we commenced operations in 2017, medical margin profiles of cohorts of members grouped by enrollment year have historically improved over their duration on our platform. In future periods, we expect to have geographies with different medical margin PMPM starting points and trajectories.
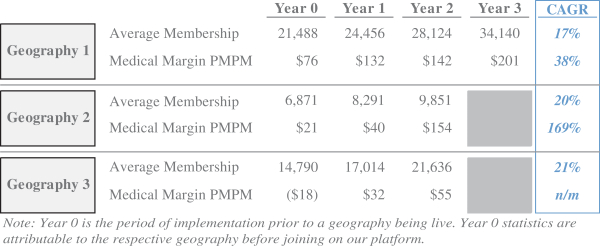
122
With over 375,000 embedded non-MA patients in our existing geographies, and 70% of our members as of December 31, 2020 on our platform for fewer than three years, we believe that we are well positioned to benefit from significant embedded margin growth from our long-term economic model by improving healthcare outcomes and effectively managing costs. While we believe this data accurately reflects the directional margin maturity trends in our geographies, the most recent year includes the impact of utilization avoidance resulting from
COVID-19.
We cannot accurately estimate the net ultimate impact to medical services expense at this time. See “—Impact ofCOVID-19
Pandemic on Our Business” and “Risk Factors—Risks Related to Our Business—The spread of, and response to, the novel coronavirus, orCOVID-19,
underscores certain risks we face and the rapid development and fluidity of this situation precludes any prediction as to the ultimate adverse impact to us ofCOVID-19.”
We are able to access this attractive LTV through what we believe to be a low-cost and increasingly cost-efficient model. Our cost to launch a new physician partnership represents the most significant cash outlay in our model. In the implementation year, we incur
stand-up
costs related to developing local operational infrastructure and dedicated resources, including hiring local teams and establishing clinical programs prior to commencement of operations. We also provide 100% downside protection to our partners by funding losses, including losses that may occur in the early years of a physician partner’s transition to the Total Care Model. Following the launch of our foundational partnership with COPC in 2017, the average total launch cost, including both implementation year costs and initial losses (if applicable), for subsequent partnerships has been $4.2 million, with a range of implementation costs across our geographies of $1.5 million to $8.7 million. After a partnership has been launched, we drive same-market organic growth with little incremental cost. From December 31, 2019 to December 31, 2020, same-geography membership increased by 17% across our existing geographies. Over the same period, we had local sales and marketing costs of $2.1 million and investments to support existing physician partners’ growth of $13.7 million across all geographies in the aggregate, collectively representing approximately 1% of medical services revenue for the year ended December 31, 2020. We believe this low-cost and increasingly cost-efficient growth model represents a significant advantage supporting our rapid scaling to new geographies and sustainable existing geography growth.Model for Long-Term Sustainable Growth
We have created a multi-pronged growth strategy that has powerful tailwinds for our physician partners and our business. Our first priority is to leverage existing physician capacity in local geographies across the country by establishing an anchor partnership with a leading physician group in a geography. Our long-term partnership with our anchor physician groups creates the potential for cost-efficient organic growth over time in the number of members on our platform as existing patients of our PCPs age into Medicare and as existing Medicare-eligible patients choose to convert from FFS to MA. The success of the partnership enables our anchor physician groups to add PCPs to their own practices and agilon to expand to adjacent geographies, adding multiple levels of regional capacity to grow our attributed membership. As we partner with additional physician groups, we believe our ability to share best practices and drive improved medical outcomes and financial performance across our platform will increase, further enhancing our ability to add new physician groups. This “flywheel” nature of our model has allowed us to expand from one geography to 17 in fewer than five years and has resulted in an additional approximately 186,000 MA lives being attributed to our platform over the same time period.
Purpose-Built, Exportable, Scalable Platform
The creation of the agilon platform and an aligned physician partnership approach has enabled the consistent deployment of a Medicare-centric, globally capitated line of business across 17 heterogeneous geographies, 16 anchor physician groups and multiple payors. This consistent approach has enabled us to increase the number and breadth of geographies, physician partners and payors we have brought onto the platform in any given year. The components of our Total Care Model (including, data, payor engagement, clinical programs and growth) are discrete but are delivered as a unified platform through a highly-aligned model with physicians to optimize
123
success. Our ability to deploy these components consistently through a partnership structure across geographies has:
| • | allowed us to optimize the physician capacity already deeply integrated in local communities; |
| • | increased our speed to scale, as reflected in our rapid expansion of geographies and physician partners on our platform; and |
| • | allowed us to deploy our model across heterogeneous physician partners and geographies: |
| • | our geographies range in total population from approximately 225,000 to approximately 3.2 million and total MA lives from approximately 20,000 to approximately 364,000; |
| • | in 2020 our geographies range in MA penetration rate from 27% to 64% and five-year CAGR growth rate of 2% to 16%; |
| • | the proportion of MA members that in 2020 selected a PPO insurance product as a percentage of total MA membership in our geographies ranges from 25% to 78%; and |
| • | our anchor physician groups comprise both primary care and multi-specialty groups and in 2020 range in size from fewer than 25 to more than 200 PCPs. |
Our platform has enabled us to grow revenue 53% year-over-year for the year ended December 31, 2020, while operating costs to support live geographies and enterprise functions grew 12% over the same period. Our revenue grew 67% year-over-year for the year ended December 31, 2019, while operating costs to support live geographies and enterprise functions grew 42% over the same period. Our net loss for the year ended December 31, 2020 was $60.1 million, a 79% decline from losses of $282.7 million in the year ended December 31, 2019. Our net loss for the year ended December 31, 2019 was $282.7 million, a 93% increase from losses of $146.5 million for the year ended December 31, 2018. Our net loss for the six months ended June 30, 2021 was $314.1 million compared to a net loss of $24.0 million in the six months ended June 30, 2020.
Network Feedback Loop
We believe our growing network of community-based physicians at the national, regional and local level drives continuous improvement of our platform, enables best practices sharing and innovation and accelerates the growth of independent physicians joining the agilon network. By entering new local geographies through a partnership with leading practices and
top-quality
physicians, we further reinforce the growing power of our network of physician leaders at the local, regional and national level. Many of our physician partners and individual physicians have joined our platform based on references from existing like-minded physician partners, and the credibility and quality of our physician partners is consistently cited as a deciding factor for joining the platform. In addition, our ability to compare efficiencies and clinical performance across geographies or across physicians groups within existing geographies also serves as a constant feedback mechanism, driving faster implementation of clinical programs and quality improvements across the network. Additionally, we have established peer groups among our physician partners to facilitate such partners sharing and identifying best practices in order to improve performance and reduce variability across the network. Our network includes established community-based physician group leaders, such as Austin Regional Clinic in Austin, Texas, Buffalo Medical Group in Buffalo, New York, Central Ohio Primary Care in Columbus, Ohio, Preferred Primary Care Physicians in Pittsburgh Pennsylvania and Wilmington Health in Wilmington, North Carolina. Additionally, our network includes leading physicians, such as Dr. Bill Wulf, who is the incoming Chairman of America’s Physician Groups (a leading professional association representing more than 300 medical groups, independent practice associations and integrated healthcare systems across the country) and is also a member of our board of directors.124
Differentiated Physician and Patient Experience
We designed our platform, partnership and network approach with the goal of delivering a superior and continuously improving experience to our physician partners and their patients.
| • | Physician partners: |
| • | Members: |
Mission-Driven Team and Culture
We have a world-class management team, which is differentiated by its breadth and depth of expertise in healthcare. Our senior management team has an average of more than 15 years of experience in the healthcare industry and has significant exposure across all components of the payment and delivery continuum. These years of experience have fostered strong relationships in the managed care, provider and payor segments of the healthcare landscape and deep understanding of physicians, patients, technology, payments and branding. We believe our management team’s collective robust, diverse and complementary exposure to different facets of the healthcare industry positions our team to navigate and enable the shift to a physician-driven Total Care Model.
Our team is united by our mission of being the trusted long-term partner to community-based physicians and driven by our vision of transforming healthcare at the community level through exceptional patient-physician relationships.
Our Growth Strategy
We believe we are at an inflection point with multiple tailwinds supporting our mission to transform the role PCPs play in impacting the health of their senior patients. Our leadership position has translated to 230,700 MA members on our platform as of June 30, 2021. However, this represents less than 1% of total MA lives in our current addressable market, highlighting our large addressable market opportunity. We intend to utilize our competitive strengths and capitalize on favorable industry trends to increase the number of regional hubs, local markets within those hubs and ultimately physicians and members we serve.
125
The power of our model at work: Case study of Ohio expansion
Establish New Regional Hubs across the Country
We believe we are well-positioned to expand the number of our physician partners nationally across a diverse set of geographies. During 2020, we commenced operations with physician groups in two new regional hubs, Western Pennsylvania and North Carolina, and began implementation with physician groups in additional regional hubs in Western New York and Central Connecticut, which commenced operations in 2021. In addition, we recently established a new regional hub in Michigan that will go live in 2022. We have developed sophisticated business development capabilities and have established a robust pipeline with an array of physician groups across the country. We believe the extension of a globally capitated business model to patients enrolled in traditional Medicare through the Direct Contracting Model expands the number of potential regional hubs we can consider for entry.
Many of our physician partners, including Central Ohio Primary Care, Austin Regional Clinic and Buffalo Medical Group are considered among the most well-regarded physician groups in the country. We believe the exceptional quality and reputation of our physician partners represents a competitive advantage, and increases the attractiveness of our model relative to that of our competitors, which will help facilitate our growth and expansion. Many of our new physician partners and local physicians have joined our platform based on references from existing physician partners. The credibility and quality of our physician partners is consistently cited as a deciding factor for new physicians joining the platform.
Access the Large and Embedded Membership Opportunity within Our Existing Networks
We estimate that the number of Medicare FFS patients, Medicare-eligible patients and patients expected to age into Medicare over the next five years in our existing physician partner patient populations is approximately. These existing patients represent a large, growing and durable source of potential attributed member growth. As these patients enroll in MA through our payors, they become attributed to our platform with little incremental cost to us. As the number of Medicare-eligible patients and MA penetration rates increase, we expect to be
126
favorably positioned to benefit from this source of growth, bolstered by the sticky physician-patient relationship and our platform’s ability to assist our physician partners in more effectively managing healthcare quality, patient experience and cost. We believe this represents a significant source of growth for our geographies that have lower MA penetration rates, such as Wilmington, NC and Hartford, CT, where MA penetration rates are 31% and 48%, respectively, and forecasted MA growth is 16% and 13% respectively.
Facilitate and Capitalize on the Growth of Our Physician Partners
As the PCP base of our physician partners grows, our physician partners are better positioned to serve a growing Medicare population. Many of our physician partners, including organizations such as COPC and Austin Regional Clinic, are the leaders in their local geographies with high physician satisfaction rates, generally making them attractive places to practice for local physicians. In addition, our Total Care Model and comprehensive platform capabilities further enhance this value proposition as MA members with newly affiliated practices are
on-boarded
onto our platform. To capitalize on this opportunity, as of April 2021, our physician partners are planning to expand provider capacity in existing geographies by approximately 9% over the following 18 months, adding capacity to serve a growing Medicare population. Many of our physician partners have well-established strategies to increase their PCP base through physician recruitment or acquisitions of established practices. Additionally, for several of our physician partners, we facilitate the recruitment of additional PCPs through capital support payments intended to ensure stable and high-quality networks to serve our growing MA membership.Expand into Adjacent Geographies
We believe that we provide a compelling answer for independent physicians looking to access a Medicare-centric, globally capitated line of business while remaining independent. Once we establish a presence in a geography, we have the opportunity to accelerate the addition of new physician partnerships in the region. We are also able to leverage our regional infrastructure and our relationships with payors as we expand into adjacent geographies. For example, establishment of our initial partnership in Columbus, Ohio with Central Ohio Primary Care in 2017 helped lead to partnerships with Pioneer Physicians in Akron in 2018, PriMed Physicians in Dayton and Physicians Group of Southeast Ohio in 2019, and The Toledo Clinic in 2020. Our presence in a geography enables us to more efficiently identify and interact with potential physician partners in adjacent geographies, whose physicians are often colleagues of physicians with our existing physician partners. We believe this network feedback loop helps to efficiently expand our network of like-minded community-based physicians, and that we are poised to execute on similar expansions in other geographies. We have recently executed on similar regional hub expansions in Western New York, North Carolina, Texas and Michigan, with the addition of new physician partnerships contracted to go-live on January 1, 2022 within each of these hubs. Of our estimated 2020 addressable market, $80 billion is concentrated in states in which we currently have a physician partner or a signed letter of intent with a physician group as of January 2021.
Increase Quality and Improve Health Outcomes to Drive Profitability
We believe our Total Care Model drives increased profitability per member over time through increasing quality and improving health outcomes. As members and physicians mature on our platform, we increasingly recognize the benefits of improved quality of care and effectively managed healthcare costs. We believe there is significant opportunity to improve profitability per member over the course of our long-term partnerships by improving healthcare outcomes and effectively managing costs, with 70% of our MA members as of December 31, 2020 on our platform for fewer than three years. The nature of our long-term partnership model aligns with the long-term sticky relationship between a physician and their senior patients while increasing quality and improving health outcomes over the lifetime of a patient.
Demonstrate Operating Leverage
We expect to drive increasing profitability by leveraging both our market-level operating costs and centralized infrastructure, as we manage increased MA and DCE membership on our platform that has a
127
maturing medical margin over time. The operating efficiencies we are able to achieve with our aligned partnership model have enabled us to grow operating costs to support live geographies and enterprise functions by 12% year-over-year for the year ended December 31, 2020, while revenue grew 53% and general and administrative expenses per member contracted by 23% over the same period. We believe the operating leverage inherent in our model is powerful because of the scalability of our regional hub model, and because we require very limited incremental investment to increase our capacity to serve the membership growth opportunity embedded in our physician partner practices.
Capitalize on Emerging Value-Based Care Opportunities
We believe we are positioned to capitalize on the shift from FFS towards a Total Care Model across the broader healthcare system. In each community we serve, our Total Care Model can now be extended to patients enrolled in traditional Medicare through the CMS Innovation Center Direct Contracting Model. Through five currently approved DCEs, which encompass more than 500 of our existing PCPs, we provide care to over 50,000 traditional Medicare members in seven geographies. For the year ended December 31, 2020, our DCEs did not contribute to our revenue. We believe the Direct Contracting Model has the potential to expand our addressable market by approximately 15.9 million individuals, 4.5 million of which are located in states in which we currently have a physician partner or a signed letter of intent with a physician group as of January 2021 and are associated with independent PCPs. However, Medicare is not the only program seeking to integrate delivery and payment of services as a lever to control costs and improve health outcomes. As commercial plans,
at-risk
employers, hospital-aligned groups and others test the waters of a Total Care Model, we expect there could be opportunities to expand our platform beyond Medicare.Impact of
COVID-19
Pandemic on Our BusinessCommencing in March 2020, we implemented the following measures to protect the health and safety of our employees, physicians and members in connection with the
COVID-19
pandemic:| • | Implement a cross-functional work team of management, physicians and staff to evaluate risks and ensure communication to all impacted stakeholders; |
| • | Relocated the vast majority of our employees to home-based work settings; |
| • | Discontinued employee travel unless supporting critical business needs; |
| • | Coordinated with our physician partners to accelerate telehealth visit activity, increase the availability of same-day appointments and coordinateparking-lot clinic visits, in order to enable members to avoid emergency room or similar settings fornon-emergent conditions; |
| • | Deployed usage of personal protective equipment to employees returning to a workplace setting, and to our physician partners; |
| • | Coordinated daily huddles for physicians and team members on clinical and operational impacts of COVID-19, which included participation and clinical education by nationally-recognized experts in infectious disease and epidemiology, and enabled physician partners across the country to engage with one another on best practices; |
| • | Sent more than 800,000 communications to members to ensure they were well informed regarding best practices for staying safe, and aware of available support resources during the pandemic; and |
| • | Facilitated the conversion to mail-order prescriptions and mail-in screening tests for patients |
Despite the challenges and uncertainties created by the
COVID-19
pandemic, we believe that our response to the pandemic has reinforced the value of our platform, long-term partnership model and network.Throughout most of 2020, our members incurred lower healthcare costs than we would have otherwise expected, which resulted in lower medical services expenses incurred. Average medical services expense per
128
member declined 3% relative to 2019. This reduction was impacted by the temporary deferral of non-essential care amid the COVID-19 pandemic and improved medical cost management, among other factors. These costs may be incurred at future points in time, and it is possible that the deferral of healthcare services could cause additional health problems in our existing members, which could increase our costs in the future. Additionally, our members’ risk adjustment factors, which are reflective of documented clinical conditions during 2020 and which impact our 2021 revenues, may be lower than would have occurred without the impact of the
COVID-19
pandemic, resulting from members’ avoidance or deferral of care during 2020. We cannot accurately estimate the net ultimate impact, positive or negative, to revenue or medical services expense at this time.Also see “Risk Factors—Risks Related to Our Business—The spread of, and response to, the novel coronavirus, or
COVID-19,
underscores certain risks we face and the rapid development and fluidity of this situation precludes any prediction as to the ultimate adverse impact to us ofCOVID-19.”
Company History
The Company is ultimately controlled by an investment fund associated with CD&R, a private equity firm headquartered in New York, NY. Our business was formed in 2016 through the completion of two acquisitions by CD&R: In July 2016, PPMC was acquired, which, together with the California IPAs, operated in Southern California. Also in July 2016, CPS was acquired, which, together with its subsidiaries and affiliates, operates a network of contracted physicians in Hawaii and provides software and medical billing solutions to independent healthcare organizations. During 2020, we implemented a plan to divest all of our California operations, which includes the entirety of our Medicaid line of business, via three separate transactions with different parties. In February 2021, we completed the divestiture of our California operations. See “Management’s Discussion and Analysis of Financial Condition and Results of Operations—California
Operations” for additional information.
agilon health, inc. was incorporated in the State of Delaware in April 2017 in connection with our entry into a physician partnership with COPC, a physician-owned medical group, to establish a Medicare-centric, globally capitated line of business in the Columbus, Ohio region. Since that time, we have focused on collaborating with leading community-based physician groups to establish Medicare-centric, globally capitated lines of business for their existing practices in their local geography. The Company has expanded and entered into new partnerships in Austin, Akron, Pittsburgh, North Carolina, Hartford, Buffalo, Toledo, Dayton and Southeast Ohio. In March 2021, we changed our name from Agilon Health Topco, Inc. to agilon health, inc., and changed the name of our subsidiary, agilon health, inc., to agilon health management, inc. On April 19, 2021, we completed the initial public offering of 53,590,000 shares of common stock at a price of $23.00 per share. The net proceeds of the offering were approximately $1.2 billion, after underwriting fees and other offering expenses.
Reimbursement Model and Organization
Under a traditional FFS reimbursement model, physicians are paid a fixed amount for services provided during a patient visit, regardless of a patient’s medical need or health outcome. As a result, physician reimbursement is solely related to the volume of patient visits and procedures performed, thereby offering limited financial incentive to focus on preventative care and cost containment. Value-based care models offer alternative reimbursement models, which typically incentivize physicians for improving the cost and quality of healthcare provided for an attributed patient population. Various types of value-based care reimbursement models exist, including capitation, bundled payments, or payments for attainment of improved quality metrics or medical cost efficiency.
Under our Total Care Model, which is a type of value-based care reimbursement model, we are responsible for managing the medical costs associated with our attributed members. This structure empowers physicians to focus on the improvement of the quality of care provided, and to share in the financial surplus created to the
129
extent premiums received exceed the cost of medical care. Under such a structure, physicians are incentivized to improve the quality and efficiency of care as well as health outcomes for their patients.
Physician and Payor Contractual Relationships
Physicians
Our business model combines the agilon platform, a network of like-minded physicians and a long-term partnership model in order to provide physician groups with the necessary capabilities, capital and business model to create a Medicare-centric, globally capitated line of business. We believe that failing to empower PCPs to drive meaningful change in quality, cost and patient experience has fostered waste, unnecessary variability in care and poor patient experience and health outcomes. We seek to partner with leading community-based physician groups under a Total Care Model. We have formed long-term partnerships with diverse leading community-based physician groups in geographies such as Columbus, Austin, Pittsburgh, North Carolina, Hartford and Buffalo. By providing technology, people, process and capital, we aim to improve the quality and cost of healthcare and drive long-term growth while creating a sustainable business model for our physician partners.
Under the Total Care Model, we typically operate by forming risk-bearing entities (each, an “RBE”) within local geographies. These wholly-owned RBEs enter into risk-bearing, global capitation agreements with payors, contract with agilon to perform certain functions and enter into long-term professional service agreements with one or more partner primary care or multi-specialty physician groups. We refer to these groups as our “anchor physician groups.” Individual MA members whose care is provided by PCPs employed or affiliated with our anchor physician groups are attributed to the RBE, which bears financial responsibility for the associated medical costs of such members. As of December 31, 2020, we had entered into long-term professional services agreements with 16 anchor physician groups, which typically have a contractual duration of 20 years. In accordance with relevant accounting guidance, each of these RBEs is determined to be a variable interest entity consolidated by agilon, as we have: (i) the ability, through the management services and governance arrangements, to direct the activities (excluding clinical decisions) that most significantly affect the RBE’s economic performance; and (ii) the obligation to absorb losses of or the right to receive benefits that could be potentially significant to the RBE.
Through incentive compensation arrangements, we share a portion of the RBE’s savings from successfully improving the quality of care and reducing costs with our anchor physician groups. Typically, our anchor physician groups receive a FFS base compensation rate for services rendered which is paid directly by health plan payors to our anchor physician groups or, in certain arrangements, paid from the health plan payor to the applicable RBE, who pays the compensation received to our anchor physician groups. In certain cases, our anchor physician groups may be entitled to a guaranteed minimum FFS base compensation rate from the RBE in the event that the FFS base compensation rate paid by the health plan payor does not meet the negotiated base compensation rate as agreed between the RBE and the anchor physician group, or if the FFS base compensation rate paid by the health plan payor falls below what the anchor physician group had received prior to joining our platform. Historically, the base compensation rates paid directly by the health plan payors to our anchor physician groups have met or exceeded applicable guaranteed minimum FFS base compensation rates. This base compensation is initially negotiated with the RBE for the first ten years of each agreement, subject to annual increases based on current market rates and other agreed upon adjustment factors, after which it is subject to renegotiation. Although our RBEs are wholly-owned subsidiaries of agilon, our anchor physician groups participate in each RBE’s governance, with individuals designated or nominated by the applicable anchor physician groups having representation on each RBE’s board of directors. Most of our contracts with our anchor physician groups contain exclusivity or other provisions intended to promote interconnectedness with our physician partners for applicable lines of business in order to facilitate the longevity and stability of the partnership. Typically, these contracts provide for termination rights that are triggered upon certain events, subject to applicable cure periods, including bankruptcy or insolvency events, exclusion, suspension or
130
debarment from state or federal government programs and the occurrence of government action that can be reasonably expected to negatively influence our business. We have historically issued certain stock-based instruments, which we refer to as “partner physician group equity agreements,” to our anchor physician groups pursuant to which they are entitled to receive equity of their local RBE or agilon health, respectively, in the future only upon the occurrence of certain events deemed a “change of control” of the RBE, or a “change of control” of agilon health, if such event occurs before a “change of control” of the RBE.
In addition, in Hawaii we operate under a risk-bearing independent practice association model through which we have broadly contracted with physicians across the state and have developed select deeper primary care relationships within the network. PCPs in our Hawaii network are typically compensated on an FFS basis based on applicable Medicare fee schedules.
In addition to our contractual arrangements with our physician partners, we also maintain relationships with other providers who care for our members, including hospitals, specialists and ancillary providers. Such providers typically contract directly with payors. We and our physician partners maintain effective working relationships with the majority of the higher-volume providers in our geographies in order to retain insight into the provision of care to our members and ensure care is rendered effectively and in a manner which supports the achievement of appropriate clinical outcomes.
Payors
We enter into contractual agreements with payors in each of our geographies, under which we are financially responsible for our physician partners’ provision of a defined spectrum of healthcare services to our members, in exchange for a defined PMPM fee for each of our members (which is also referred to as “global capitation”). The healthcare services for which we are responsible under such arrangements generally include all healthcare costs which CMS considers as Part A and B costs, including hospitalization and facility costs, primary and specialty care provider costs, and ancillary services cost. In certain of our payor arrangements, we are also financially responsible for Part D pharmaceutical costs for prescriptions rendered to our members. Through these payor agreements, we help to create access for our physician partners to value-based care reimbursement structures through our Total Care Model, which allow our physician partners to focus on the improvement of the quality of care provided to their patients, and to share in the financial surplus created to the extent premiums received exceed the cost of medical care.
The global capitation fees we are entitled to receive from our payor contracts are typically based on a defined percentage of the corresponding monthly premium payments which the payor receives from CMS for members attributed to our PCPs and covered under such contracts. The premium payments to payors are based on county-level benchmark rates established by CMS and payors’ annual bid of amounts necessary to cover the cost of a standard MA patient, and are influenced by several factors, including, but not limited to, the applicable MA plan’s STAR rating and CMS’ risk-adjustment model, which compensates payors based on the health status (acuity) of each individual patient in the preceding calendar year. For agreements where we are delegated for claims payment, we utilize amounts received under the applicable agreement on a monthly basis to pay such claims for medical services rendered to our members. For agreements where the payor retains responsibility for paying claims on our behalf, as is the case today in the majority of our payor agreements, funding under the applicable agreement is utilized by the payor to pay such claims, and we receive surplus distributions on a monthly or quarterly basis. In these arrangements, the payor maintains the responsibility for entering into contractual agreements with network hospitals, network specialty physicians, and ancillary or other providers. Additionally, certain of our contracts with payors incorporate provisions in which we are eligible to earn additional payments on top of our capitation payments based upon the attainment of defined quality performance criteria correlated to applicable STAR ratings criteria. Premiums received may be subject to future adjustment. See “Risk Factors—Risks Related to Our Industry and Government Programs—Repayment obligations arising out of payor audits, such as CMS RADV audits, can be significant and adversely impact reimbursement rates.”
131
We have developed local contracts across multiple payors, along with national form contracts with certain key payors, which provide a consistency of
non-financial
contract terms, data sharing, operational processes and governance structures and support portability of the agilon platform.We typically maintain various contracts with a single national payor in order to reflect varying economic terms across our geographies, and to provide for distinct subsidiary entities of our company and a national payor as parties to these contracts. As of December 31, 2020, we have relationships with 15 payors across 17 geographies. Payors with which we contract include large national health plans as well as smaller local and regional insurers. We believe our ability to offer multiple MA plans and products to our physician partners in each geography creates significant value for our physician partners and the members that they serve. Members are able to select the plan and benefit design that meets their individual needs while our platform enables a seamless experience regardless of plan or product for all patients and physician groups. For the year ended December 31, 2020, Humana represented approximately 38% of our total revenue, and Humana, Aetna and United Healthcare collectively represented approximately 69% of our total revenue.The agreements with our payors outline the range of healthcare services for which we are financially responsible and at risk, the services for which we are contracted to perform on the payor’s behalf and the key financial terms. The majority of our contracts are for terms ranging from one to three years and contain automatic annual renewal provisions. When we enter into a new payor contract, we are typically required by the payor to contribute risk-bearing capital to the local operating subsidiary. This typically takes the form of letters of credit or restricted deposits, or the payor may retain a percentage of the capitation payments due under the applicable contract. Risk-bearing capital required by payors varies by payor and geography, but typically averages between
1.5-2.0%
of projected annual gross revenue attributable to the corresponding agreement, and ranged from $50,000 to $10.0 million as of December 31, 2020.Our payor agreements also typically incorporate various termination rights, which are negotiated based on the scope of the market-facing solutions that the payor has adopted and the duration of the contract. Most of our contracts include cure periods during which time we may attempt to resolve any issues that would trigger a payor’s ability to terminate the contract. However, certain of our contracts are also terminable immediately upon the occurrence of certain events. For example, some of our contracts may be terminated immediately by the payor if we lose applicable licenses, go bankrupt, lose our liability insurance or receive an exclusion, suspension or debarment from state or federal government authorities.
The contracts with our payors impose other obligations on us. For example, we typically agree that all services provided under our contract and all employees providing such services will comply with such payor’s policies and procedures. We also typically agree to indemnify our payors against certain third-party claims.
Direct Contracting Model
On April 1, 2021, we, in conjunction with some of our physician partners, began participating in the Direct Contracting Model (currently referred to as the Global and Professional Direct Contracting (GPDC) Model) in certain geographies, through five currently approved DCEs which encompass more than 500 of our existing PCPs and serve over 50,000 Medicare FFS beneficiaries. The Direct Contracting Model is a voluntary payment model option aimed at reducing expenditures and preserving or enhancing quality of care for beneficiaries in traditional Medicare FFS established by the CMS Innovation Center.
Under the Direct Contracting Model, CMS contracts directly with each of the DCEs pursuant to participation agreements, in which such DCE selects risk-sharing and fee payment options. The participation agreements include various terms and conditions each DCE must comply with, including meeting certain operational requirements. Each of the DCEs has selected the Global risk-sharing option, in which the DCE assumes accountability for the total cost of care of the FFS beneficiaries aligned to such DCEs. In addition, each of our DCEs has selected the Primary Care Capitation Payment (the “PCC”) option. The participation agreements between our DCEs and CMS expire two years after the “Model Performance Period” established by CMS, which
132
lasts from April 1, 2021 through December 31, 2026. The DCE may terminate its participation agreement with CMS at any time upon advance written notice. CMS has certain additional termination rights, including in connection with the termination of the Direct Contracting Model or non-compliance of the DCE. Additionally, CMS has the right to amend a participation agreement without the consent of the DCE for good cause, or as necessary to comply with applicable federal or state law, regulatory requirements, accreditation standards or licensing guidelines or rules.
In addition, the DCEs operate in partnership pursuant to participating medical group agreements with one or more of our physician partners in certain geographies. Our contracted physician partners provide Medicare services to their aligned beneficiaries, and bill CMS on a FFS basis for such services. In turn, in accordance with the PCC option, CMS compensates each physician partner for a portion of their billed services based on the applicable rate, and the remaining portion is paid to each DCE on a per Medicare beneficiary per month (“PBPM”) basis based on a prospective estimate of such remaining portion of billed services. In five years, CMS will no longer pay any portion to such physician partner based on FFS compensation rates, and will transition to compensating physician partners through their applicable DCE on a PBPM basis. Finally, each DCE then remits payment out of the PBPM payments from CMS to its contracted physician partners on a monthly or quarterly basis pursuant to the applicable participating medical group agreement, which agreement also includes incentive compensation tied to the DCE’s net profits received for aligned beneficiaries. In addition, certain participating medical group agreements also allow the relevant physician partner to choose an adjustment to the applicable incentive compensation to receive a portion of such compensation in equity of agilon. Our DCEs’ participating medical group agreements provide for mutual indemnification rights, and have an initial term through December 31, 2026, unless earlier terminated.
Marketing and Distribution
In accordance with Medicare marketing guidelines, payors are responsible for marketing directly to patients. Our focus is on outreach to existing community-based physician groups to join our platform, establishing and maintaining our local branding and strategies to support education for our Medicare-eligible members in evaluating their Medicare options.
Through our long-term partnership model, we partner with leading community-based physician groups in our existing geographies, and aim to expand our geographic reach by partnering with community-based physician groups in new geographies, across the United States. Our growth strategy is supported by a dedicated business development team that works closely with physician groups, senior management and key stakeholders to identify potential physician groups to partner with and integrate onto our platform and into our network. Additionally, we believe our network of like-minded physician partners also attracts new physicians to join, as access to cross-market
know-how
and best practices encourages success in a Total Care Model.Our enterprise marketing team develops branding strategies and identities in our geographies and supports the development of marketing and branding materials to support the local growth of our physician partners and their Medicare patient population. This begins with our entry into a new geography. We create a local brand that embodies the value of the Total Care Model for patients as well as the history and culture of our physician partner. Each geography has its own customized brand, which includes “Senior Care Advantage” as part of the naming convention to help reinforce the value of our national network to payors, policy makers and other industry constituents. To empower patients to make informed decisions about their coverage options, educational opportunities and materials are offered throughout the year, including educational physician presentations, monthly “Medicare 101” sessions across every geography,
on-line
resources,in-office
materials that explain the difference between traditional Medicare and MA, and patient communications that highlight Medicare election coverage windows.133
Competition
The healthcare industry is highly competitive and fragmented. We currently face competition in every aspect of our business, including in offering a favorable reimbursement structure for existing physician partners and attracting payors and physician partners who are not contracted with us, from a range of companies that provide care under a variety of models that could attract patients, providers and payors. Our primary competitors include ChenMed, Oak Street Health, Optum and VillageMD, in addition to numerous local provider networks, hospitals and health systems. Moreover, large, well-financed payors have in some cases developed their own managed services tools and may provide these services to their physicians and patients at discounted prices, or may seek to expand their relationships with additional competing physicians or physician networks. Other organizations may also seek to apply specialized services or programs, including providing data analytics or disease-based programs, designed to enable physicians or payors to operate successfully under value-based care arrangements. Although some of our competitors utilize elements of our MA multi-payor, globally capitated risk model deployed with community-based physician groups, including in certain of the geographies we serve, we do not believe any of our competitors offer a model that captures all elements of the agilon model. Our competitors typically vary by geography, and we may also encounter competition in the future from other new entrants. Our growth strategy and our business could be adversely affected if we are not able to continue to access existing geographies, successfully expand into new geographies or maintain or establish new relationships with payors and physician partners. See “Risk Factors—Risks Related to Our Industry and Government Programs— We operate in a competitive industry, and if we are not able to compete effectively, our business, financial condition, cash flows and results of operations will be harmed”
The principal competitive factors in our business include the nature and caliber of relationships with physicians; patient healthcare quality, outcomes and cost; the strength of relationships with payors; the quality of the physician experience; local geography leadership position; and the strength of the underlying economic model. We believe ourplatform, partnership and network model enables us to compete favorably.
first-of-its-kind
Intellectual Property
We rely on a combination of trademark laws in the U.S. as well as confidentiality procedures and contractual provisions to protect our trade secrets, including proprietary technology, databases and our brand.
We have registered “agilon” and our logo as trademarks in the U.S. We also have filed other trademark applications that are meaningful to our business in the U.S. across various states and local jurisdictions, including for the use of the local brand created within each of our geographies, and will pursue additional trademark registrations to the extent we believe it would be beneficial and cost-effective.
We are the registered holder of a variety of domain names that include “agilon” and similar variations.
We have developed proprietary technology and processes that support our operational programs and clinical insights, including our “CORE” technology platform and HCC Manager risk adjustment software application, both of which are proprietary systems that aid in the aggregation and analysis of third-party data we collect. Our internally developed technology is continuously refined to support the needs of our platform and partners. Although we do not currently hold a patent for CORE or HCC Manager, we continually assess the most appropriate methods of protecting our intellectual property and may decide to pursue available protections in the future.
We maintain our intellectual property and confidential business information in a number of ways. For instance, we have a policy of requiring all employees and consultants to execute confidentiality agreements upon the commencement of an employment or consulting relationship with us. Our employee agreements also require relevant employees to assign to us all rights to any inventions made or conceived during their employment with us in accordance with applicable law. In addition, we have a policy of requiring individuals and entities with which we discuss potential business relationships to sign
non-disclosure
agreements. Lastly, our agreements with customers include confidentiality andnon-disclosure
provisions.134
We may be unable to obtain, maintain and enforce our intellectual property rights, and assertions by third parties that we violate their intellectual property rights could have a material adverse effect on our business, financial condition and results of operations.
Human Capital
People join agilon because of our vision: To transform the future of healthcare in communities across the country by empowering exceptional patient-physician relationship. Together with our employees and physician partners, we have defined our company values and commitments to guide our everyday actions in executing our mission:
| • | Partnership and Collaboration: We are One Team. We collaborate deeply. We embrace diversity. Together with our physician partners, we empower the care that our families and friends deserve. |
| • | Innovation: We rapidly adapt to our changing world and embrace the creativity of our physician partners and each other. |
| • | Quality and Service Excellence: We value results, not activity. We serve others with passion and humility. |
| • | Continuous Improvement: We are agile and move fast. We actively seek out and share feedback. We learn and improve every day. |
| • | Expertise: We are curious. We aspire to be experts and share our knowledge. |
| • | Accountability and Integrity: We celebrate our successes. We take ownership in everything we do. |
Our human capital efforts are supported by our dedicated human resources team. This team supports the business in identifying and recruiting top talent, supporting the onboarding and orientation of new hires through a comprehensive new employee orientation, a manager’s toolkit and resources to support onboarding, goal setting, and
in-year
management, as well as a comprehensive semi-annual review process that ties to our company values and supports continuous learning and improvement. Our efforts to promote a positive employee experience and build culture are further supported and enhanced by local and nationalin-person
and virtual events, including town halls,in-office
celebrations, employee activity committees and most-valuable-player awards, meant to champion our employees and create a sense of community. We conduct annual employee engagement surveys to solicit feedback and help guide annual planning on efforts and initiatives to support our team members. We have also developed a taskforce that seeks to drive focused and targeted diversity and inclusion efforts, including employee focus groups and participation up and down the organization to ensure all voices are heard.As of June 30, 2021, agilon and its subsidiaries had 570 employees, of whom 564 were full-time and six were part-time. None of our employees is a member of a labor union, and we have not experienced a work stoppage. Our employees do not include our physician partners, whom we do not directly employ. We believe we enjoy a good working relationship with our employees.
Our Business Model and Environmental, Social and Governance Considerations
We were built to transform healthcare in communities across the country by addressing the structural hurdles driving poor outcomes and unsustainable costs in the U.S. healthcare system. We do this by revolutionizing care delivery for the medically complex Medicare population through the community-based physicians that are critical components of their local healthcare delivery system. Our model empowers community-based physicians to reorganize the care delivery system in order to improve outcomes and experience for seniors in their local communities and across the nation.
Healthcare and Other Applicable Regulatory Matters
The healthcare industry is highly regulated under both state and federal laws and regulations. Our operations and relationships with healthcare plans and providers are subject to extensive and increasing regulation by
135
numerous federal, state, and local government agencies including the Office of Inspector General (“OIG”), the DOJ, the CMS, the Office of Civil Rights, and various state authorities.
Corporate Practice of Medicine
Some states in which we operate have laws prohibiting the corporate practice of medicine; such laws generally prohibit business entities with
non-physician
owners, such as agilon and certain of its subsidiaries, from practicing medicine. States that have corporate practice of medicine laws limit the practice of medicine to licensed individuals or professional organizations comprising licensed individuals; therefore, lay entities are prohibited from employing or contracting with physicians (unless the entity satisfies a limited exception), exercising control over medical decisions, or engaging in certain arrangements with other physicians, such asfee-splitting.
These laws vary widely from state to state. A violation of the corporate practice of medicine prohibition constitutes the unlawful practice of medicine, which is a public offense punishable by fines or criminal penalties. In addition, any physician who participates in a scheme that violates the state’s corporate practice of medicine prohibition may be subject to disciplinary action or potentially forfeiture of revenues from payors for services rendered, or may be punished for aiding and abetting a lay entity in the unlawful practice of medicine. We typically operate by forming RBEs which contract with payors on the one hand and provide professional services through contractual relationships with PCPs on the other hand. While we believe that our practices are in substantial compliance with the corporate practice of medicine laws to which we are subject, if a state determines that we are not in compliance that may result in a material adverse effect on our business, results of operations or financial condition. See “Risk Factors—Legal and Regulatory Risks—Laws regulating the corporate practice of medicine could restrict the manner in which we are permitted to conduct our business, and the failure to comply with such laws, or any changes to such laws or regulations or similar laws or regulations could subject us to penalties and restructuring, or have a material adverse effect on our consolidation of the accounts of our majority-owned subsidiaries.”Fee-Splitting
ProhibitionsThe laws of some states prohibit physicians from splitting with anyone, other than providers who are part of the same group practice, any professional fee, commission, rebate or other form of compensation for any services not actually and personally rendered.
Fee-splitting
laws and their interpretations vary from state to state and are enforced by state courts and regulatory authorities that have broad discretion in their enforcement. Courts in some states have interpretedfee-splitting
statutes as prohibiting all percentage of gross revenue and percentage of net profit fee arrangements, despite the performance of legitimate services. In addition, courts have refused to enforce contracts found to violate statefee-splitting
prohibitions. Further,fee-splitting
arrangements could implicate other laws applicable to our business, such as anti-kickback and corporate practice of medicine laws and regulations.While we believe we are in substantial compliance with
fee-splitting
laws in the states in which we operate, if we are found to benon-compliant,
penalties for violatingfee-splitting
statutes or regulations may include medical license revocation, suspension, probation or other disciplinary action against our affiliated providers.False Claims Acts
We are subject to numerous federal and state laws that prohibit the presentation of false information, or the failure to disclose information, in connection with the submission and payment of medical claims for reimbursement.
The federal civil and criminal false claims laws and civil monetary penalties laws, such as the federal False Claims Act, 31 U.S.C. §§ 3729—3733, impose civil liability on individuals or entities that submit false or fraudulent claims for payment to the federal government. The False Claims Act provides, in part, that the federal government may bring a lawsuit against any person whom it believes has knowingly or recklessly: presented, or caused to be presented, a false or fraudulent claim for payment or approval to the federal government; made, used or caused to be made or used a false statement or a false record to get a claim for payment approved,
136
including a false or fraudulent claim; concealed, or knowingly and improperly avoided or decreased, an obligation to pay or transmit money or property to the federal government; or conspired to commit any of the foregoing. The government may deem entities to have “caused” the submission of false or fraudulent claims by, for example, providing inaccurate billing or coding information, billing for services not rendered, billing services at a higher payment rate than appropriate and billing for care that is not considered medically necessary.
The federal government has used the False Claims Act to prosecute a wide variety of alleged false claims and fraud allegedly perpetrated against Medicare and state healthcare programs. The federal government, including as a result of the passage of the ACA, and a number of courts have taken the position that claims presented in violation of certain other statutes, including the federal Anti-Kickback Statute (“AKS”) or the federal physician referral law, 42 U.S.C. 1395nn (the “Stark Law”), can also be considered a violation of the False Claims Act. Some government healthcare programs, including, but not limited to, the MA program, use a risk-adjustment model that adjusts premiums paid to contracted payors to reflect the specific characteristics of each enrolled member (including demographics, government program eligibility and health status). Many payors and government healthcare programs have set forth specific documentation rules that must be followed in compliantly selecting allowable codes. We rely on physician partners to follow the CMS documentation rules and code their claim submissions with accurate and substantially documented diagnoses, which we send to the payors, some of whom, in turn, submit the data to government healthcare agencies including CMS. In recent years, the DOJ has brought a number of investigations and actions under the federal False Claims Act against both payors and providers for alleged upcoding or improper coding of diagnosis coding under the risk-adjustment methodology. Further, amendments to the federal False Claims Act and Social Security Act impose severe penalties for the knowing and improper retention of overpayments collected from government payors.
A number of states have enacted laws that are similar to the federal False Claims Act. Under Section 6031 of the Deficit Reduction Act of 2005, as amended, if a state enacts a false claims act that is at least as stringent as the federal statute and that also meets certain other requirements, the state will be eligible to receive a greater share of any monetary recovery obtained pursuant to certain actions brought under the state’s false claims act. As a result, more states are expected to enact laws that are similar to the federal False Claims Act in the future along with a corresponding increase in state false claims enforcement efforts. Violations of federal and state fraud and abuse laws may be punishable by criminal and/or civil sanctions, including significant penalties, fines, disgorgement, additional reporting requirements and oversight under a corporate integrity agreement or similar agreement to resolve allegations of noncompliance with these laws, and/or exclusion or suspension from federal healthcare programs, such as Medicare, and debarment from contracting with the U.S. government. Penalties for False Claims Act violations include fines ranging from $11,803 to $23,607 for each false claim, plus up to three times the amount of damages sustained by the government. In addition to the provisions of the False Claims Act, which provide for civil enforcement, the federal government also can use several criminal statutes to prosecute persons who are alleged to have submitted false or fraudulent claims to the government for payments. Additionally, private parties may initiatewhistleblower lawsuits against any person or entity under the False Claims Act in the name of the federal government, as well as under the false claims laws of several states, and may share in the proceeds of a successful suit. Generally, federal and state governments have made investigating and prosecuting healthcare fraud and abuse a priority.
qui tam
Federal and State Anti-Kickback Statutes
The AKS, set forth in Section 1128B of the Social Security Act, prohibits the knowing and willful offer, payment, solicitation or receipt of any form of remuneration in return for, or to induce, (i) the referral of a person for items or services reimbursable under federal healthcare programs, (ii) the furnishing or arranging for the furnishing of items or services reimbursable under federal healthcare programs or (iii) the purchase, lease or order or arranging or recommending purchasing, leasing or ordering of any item or service reimbursable under federal healthcare programs. The core of a violation of the AKS is an “inducement” to refer patients for services or items that are reimbursed under a federal healthcare program, such as Medicare, Medicaid, or Tricare (which covers military personnel). The ACA amended the AKS to make it clear that a person need not have actual knowledge of the statute, or specific intent to violate the statute, as a predicate for a violation. Court cases have
137
resulted in the interpretation that a violation may occur where even one purpose of the remuneration is to induce or reward referrals, and the OIG, which has the authority to impose administrative sanctions for violation of the statute, has adopted a similar standard.
There are certain AKS “safe harbors” which, if the respective requirements are met, would afford protection from the AKS. Failure to meet all requirements of an AKS safe harbor does not necessarily mean the arrangement violates the AKS, but it may be subject to scrutiny by legal authorities, in light of the parties’ intent and arrangements. In other words, if an arrangement does not fit within a safe harbor, it does not necessarily mean that the arrangement isillegal—only that it is not shielded from regulatory scrutiny. The federal AKS provides criminal penalties for individuals or entities that knowingly and willfully solicit or receive any remuneration. A violation of the AKS is punishable by imprisonment of up to ten years, fines of up to $100,000 per offense, or both. Violation can also give rise to federal healthcare program exclusion, liability under the False Claims Act and civil penalties, which may include monetary penalties of up to $100,000 per offense, repayments of up to three times the total payments between the parties to the arrangement and suspension from future participation in Medicare and Medicaid.
per se
We have endeavored to structure our business arrangements to fit within applicable federal AKS safe harbors and to otherwise operate in material compliance with the AKS. Federal courts in the U.S., for instance, have recognized that a referring party’s provision of legitimate services to a referral recipient may not constitute prohibited remuneration for AKS purposes when the referral recipient pays fair market value in return for what it receives. Many of our arrangements are structured to provide for compensation that is fair market value for services actually rendered and in a manner that does not reflect the volume or value of referrals generated between the parties. In structuring our relationships with providers, including our physician partners, and other healthcare entities, we are careful to try to ensure wherever possible that we are in compliance with all of the regulatory requirements of such safe harbors and exceptions. In particular, a key managed care safe harbor under the AKS upon which we regularly rely allows for payments to providers for “healthcare services and items,” but does not allow incentive payments for marketing or to encourage member enrollment. We therefore carefully analyze all payment structures to ensure that they constitute “services and items” that fall within this safe harbor or are otherwise in compliance with the AKS.
Additionally, some states have enacted statutes and regulations similar to the AKS, but which may be applicable regardless of the payor source for the patient. These state laws may contain exceptions and safe harbors that are different from and/or more limited than those of federal law and that may vary from state to state.
To help accelerate the U.S. healthcare system’s transition from an FFS to a value-based system, HHS launched the “Regulatory Sprint to Coordinated Care” initiative (“Regulatory Sprint”) in 2018, which aims to change the manner in which the healthcare regulatory framework has traditionally been applied to stakeholder arrangements. In connection with the Regulatory Sprint, the OIG issued final rules amending the AKS by adding new safe harbors and modifying existing safe harbors that protect certain payment practices and business arrangements from sanctions under the AKS in order to remove potential barriers to more effective coordination and management of patient care and delivery of value-based care. Among other changes, the new regulations contain safe harbors for value-based arrangements centering around value-based enterprises, which are enterprises composed of participants collaborating to achieve one or more value-based purposes, including coordinating and managing the care of a target patient population and coordinating and managing the care of a target population. These new final rules provide additional protections to our payment models with providers.
We have also endeavored to structure our participation in the Direct Contracting Model to comply with waivers of the AKS issued by the Secretary of HHS. The conditions of such waivers are to ensure that protected arrangements: (i) are consistent with the quality, care coordination, and cost-reduction goals of the Direct Contracting Model, (ii) are subject to safeguards designed to mitigate the risk of fraud and abuse; and (iii) can be readily monitored and audited.
138
Stark Law
The Stark Law generally prohibits a physician from referring Medicare and Medicaid patients to an entity providing DHS if such physician, or a member of the physician’s immediate family, has a financial relationship with the entity, unless a specific exception applies. DHS is defined to mean any of the following enumerated items or services; clinical laboratory services; physical therapy services; occupational therapy services; radiology services, including magnetic resonance imaging, computerized axial tomography scans and ultrasound services; radiation therapy services and supplies; durable medical equipment and supplies; parenteral and enteral nutrients, equipment and supplies; prosthetics, orthotics and prosthetic devices and supplies; home health services; outpatient prescription drugs; inpatient and outpatient hospital services; and outpatient speech-language pathology services. The types of financial arrangements between the referring physician and an entity providing DHS that trigger the Stark Law are broad, including direct and indirect ownership and investment interests, and compensation arrangements. The Stark Law also prohibits any entity providing DHS and receiving a prohibited referral from presenting, or causing to be presented, a claim or billing for the services arising out of the prohibited referral. Similarly, the Stark Law prohibits an entity from “furnishing” a DHS to another entity in which it has a financial relationship when that entity bills for the service. The Stark Law also prohibits self-referrals within an organization by its own physicians, although broad exceptions exist that cover employed physicians and those referring DHS that are ancillary to the physician’s practice to the physician group. The prohibition applies regardless of the reasons for the financial relationship and the referral; intent to induce referrals is not required. Like the federal AKS, the federal Stark Law contains statutory and regulatory exceptions intended to protect certain types of transactions and arrangements. If the Stark Law is implicated, the financial relationship must fully satisfy a Stark Law exception; if an exception is not satisfied, then the parties to the arrangement could be subject to sanctions. Sanctions for violation of the Stark Law include denial of payment for claims for services provided in violation of the prohibition, refunds of amounts collected in violation of the prohibition, a civil penalty of up to $15,000 for each service arising out of the prohibited referral, a civil penalty of up to $100,000 against parties that enter into a scheme to circumvent the Stark Law prohibition, civil assessment of up to three times the amount claimed, and potential exclusion from the federal healthcare programs, including Medicare and Medicaid. Amounts collected on claims related to prohibited referrals must be reported and refunded generally within sixty (60) days after the date on which the overpayment was identified. Furthermore, Stark Law violations and failure to return overpayments in a timely manner can form the basis for False Claims Act liability, as further discussed herein. Additionally, several states have enacted physician self-referral laws.
Notably, compensation pursuant to a risk-sharing arrangement between a managed care organization or an independent practice association and a physician (either directly or indirectly through a contractor) for services provided to enrollees of a health plan (an MA plan, for example) does not constitute a financial arrangement for Stark purposes. Further, physician incentive plans (“PIPs”) are allowable provided that (i) the compensation is not determined in any manner (withhold, capitation, bonus, or otherwise) that takes into account, directly or indirectly, volume or value of referrals and (ii) the PIP does not induce the reduction of medically necessary care to individual patients and does not place the physician at substantial financial risk for services not provided by the physician.
As part of the Regulatory Sprint, CMS also issued a sweeping set of regulations that introduce significant new value-based terminology and exceptions to the Stark Law. CMS has implemented new exceptions for certain remuneration exchanged between or among eligible participants in value-based arrangements. These exceptions and their various requirements apply based on the level of risk assumed by the arrangement’s participants. These new regulations purport to ease the compliance burden for healthcare providers across the industry while maintaining strong safeguards to protect patients and programs from fraud and abuse. These or other changes may change the parameters of the Stark Law exceptions that we rely upon and impact our business, results of operations and financial condition.
Section 1876 of the Social Security Act
Section 1876 of the Social Security Act prohibits MA plans and their downstream entities from entering into compensation arrangements with physicians that may directly or indirectly have an effect of reducing or limiting services to individual members. We have sought to structure our compensation arrangements with physicians to ensure compliance with this requirement.
139
Health Care Fraud Statute
The Health Care Fraud Statute, 18 U.S.C. § 1347, prohibits any person from knowingly and willfully executing, or attempting to execute, a scheme to defraud any healthcare benefit program, which can be either a government or private payor plan. Violation of this statute, even in the absence of actual knowledge of or specific intent to violate the statute, may be charged as a felony offense and may result in fines, imprisonment or both. The Health Care False Statement Statute, 18 U.S.C. § 1035, prohibits, in any matter involving a federal healthcare program, anyone from knowingly and willfully falsifying, concealing or covering up, by any trick, scheme or device, a material fact, or making any materially false, fictitious, or fraudulent statement or representation, or making or using any materially false writing or document knowing that it contains a materially false or fraudulent statement. A violation of this statute may be charged as a felony offense and may result in fines, imprisonment, or both.
Civil Monetary Penalties Statute
The CMPL, 42 U.S.C. §
1320a-7a,
authorizes the imposition of civil monetary penalties, assessments, and exclusions against an individual or entity based on a variety of prohibited conduct, including, but not limited to: (i) presenting, or causing to be presented, claims for payment to Medicare, Medicaid, or other third-party payors that the individual or entity knows or should know are for an item or service that was not provided as claimed or is false or fraudulent; (ii) offering remuneration to a federal healthcare program beneficiary that the individual or entity knows or should know is likely to influence the beneficiary to order or receive healthcare items or services from a particular provider; (iii) arranging contracts with an entity or individual excluded from participation in a federal healthcare program; (iv) violating the federal AKS; (v) making, using, or causing to be made or used, a false record or statement material to a false or fraudulent claim for payment for items and services furnished under a federal healthcare program; (vi) making, using, or causing to be made any false statement, omission, or misrepresentation of a material fact in any application, bid, or contract to participate or enroll as a provider of services or a supplier under a federal healthcare program; and (vii) failing to report and return an overpayment owed to the federal government. We could be exposed to a wide range of allegations to which the federal CMPL would apply. We perform monthly checks on our employees, affiliated providers and certain affiliates and vendors using government databases to confirm that these individuals have not been excluded from federal programs. However, should an individual become excluded and we fail to detect it, a federal agency could require us to refund amounts attributable to all claims or services performed or sufficiently linked to an excluded individual. Thus, we cannot foreclose the possibility that we will face allegations subject to the CMPL with the potential for a material adverse impact on our business, results of operations and financial condition. Substantial civil monetary penalties may be imposed under the federal Civil Monetary Penalty Statute and may vary, depending on the underlying violation. In addition, an assessment of not more than three (3) times the total amount claimed for each item or service may also apply, and a violator may be subject to exclusion from federal and state healthcare programs.Federal and State Insurance and Managed Care Laws
Regulation of downstream risk-sharing arrangements, including, but not limited to, global risk and other value-based arrangements, varies significantly from state to state. Some states require downstream entities and RBEs to obtain an insurance license, a certificate of authority, or an equivalent authorization, in order to participate in downstream risk-sharing arrangements with payors. In some states, statutes, regulations and/or formal guidance explicitly address whether and in what manner the state regulates the transfer of risk by a payor to a downstream entity. However, the majority of states do not explicitly address the issue, and in such states, regulators may nonetheless interpret statutes and regulations to regulate such activity. If downstream risk-sharing arrangements are not regulated directly in a particular state, the state regulatory agency may nonetheless require oversight by the licensed payor as the party to such a downstream risk-sharing arrangement. Such oversight is accomplished via contract and may include the imposition of reserve requirements, as well as reporting obligations. Further, state regulatory stances regarding downstream risk-sharing arrangements can change rapidly and codified provisions may not keep pace with evolving risk-sharing mechanisms.
140
Healthcare Reform
In March 2010, the Patient Protection and Affordable Care Act and the accompanying Health Care and Education Affordability Reconciliation Act, collectively referred to as the ACA, were enacted. The ACA includes a variety of healthcare reform provisions and requirements, which continue to be implemented and substantially changed the way healthcare is financed by both governmental and private insurers.
However, as a result of the election of Former President Trump, the Republican control of the Senate, and the former Republican control of the House, several changes have been made to the provisions of the ACA since 2010, including reduced funding. Looking forward, the future of the ACA and its underlying programs are subject to continuing and substantial uncertainty, making long-term business planning exceedingly difficult. However, it is expected that a Biden administration will work to strengthen the law and build upon it.
The prior administration and Congress were seeking legislative and regulatory changes to healthcare laws and regulations, including repeal and replacement of certain provisions of the ACA. To date, Congressional efforts to completely repeal and replace the ACA have been unsuccessful. However, the individual mandate was repealed by Congress as part of the Tax Cuts and Jobs Act that was signed into law on December 22, 2017. In December 2018, in a case brought by the state of Texas and nineteen other states, a federal judge in Texas struck down the ACA based on his determination that the ACA’s individual mandate is unconstitutional and, since that mandate cannot be separated from the rest of the ACA, the judge ruled that the rest of the ACA is also unconstitutional. The decision was appealed to the United States Supreme Court, which ruled on June 17, 2021 that the plaintiff states did not have standing to challenge the law’s individual mandate. The United States Supreme Court, however, did not decide on the main issue in the case; whether the entirety of the ACA was rendered unconstitutional when Congress eliminated the penalty for failing to obtain health insurance.
Because of the continued uncertainty about the implementation of the ACA, including the timing of and potential for further legal challenges, repeal or amendment of that legislation and future of the health insurance exchanges, we cannot quantify or predict with any certainty the likely impact of the ACA on our business, financial condition, operating results and prospects.
Additionally, the CMS Innovation Center continues to test an array of alternative payment models, including the Direct Contracting Model to allow DCEs to negotiate directly with the government to manage traditional Medicare beneficiaries and share in the savings and losses generated from managing such beneficiaries. State regulation of DCEs will likely be variable. For example, certain states may require DCEs to obtain specific licensure to participate in the Direct Contracting Model and assume risk directly from CMS. There likely will continue to be regulatory proposals directed at containing or lowering the cost of healthcare. Further, CMS also routinely adjusts the risk adjustment factor which is central to payment under the MA program. The monetary “coefficient” values associated with diseases that we manage in our population are subject to change by CMS. Such changes could have a material adverse effect on our financial condition.
Federal and State Privacy and Security Requirements
We are subject to various federal, state and local laws and rules regarding the use, security and disclosure of protected health information, personally identifiable information, de-identified data and other categories of confidential or legally protected data that our businesses may handle. Such laws and rules include, without limitation, HIPAA, the Federal Trade Commission Act, 15 U.S.C. § 45 (“FTC Act”) and state privacy and security laws. Privacy and security laws and regulations often change due to new or amended legislation, regulations or administrative interpretation. We are highly dependent on information technology networks and systems, including the internet, to securely process, transmit and store this information. We also utilize third-party service providers for important aspects of the collection, storage and transmission of such sensitive information.
Congress enacted HIPAA, in part, to combat healthcare fraud and to protect the privacy and security of patients’ individually identifiable healthcare information. Among other things, HIPAA requires healthcare
141
providers and their business associates to maintain the privacy and security of individually identifiable PHI. The HIPAA Security Rule requires both covered entities and business associates to develop and maintain policies and procedures with respect to PHI, including adherence to HIPAA’s security standards through the implementation of administrative, physical and technical safeguards to protect PHI. Additionally, the Privacy Rule contains requirements with respect to the use and disclosure of individuals’ PHI, including a prohibition on a covered entity or business associate using or disclosing an individual’s PHI unless the use or disclosure is authorized by the individual or is specifically required or permitted under the Privacy Rule. The HITECH Act of 2009 dramatically expanded, among other things, (1) the scope of HIPAA to now apply directly to “business associates,” or independent contractors who receive or obtain PHI in connection with providing a service to a covered entity or another business associate, (2) substantive security and privacy obligations, including a new federal security breach notification requirement that unauthorized acquisitions, access, use or disclosure of PHI be reported to, depending on the number of people affected and their location, affected individuals, the Department of Health and Human Services and local media outlets, (3) restrictions on marketing communications, a prohibition on business associates from receiving remuneration in exchange for PHI, and a prohibition on covered entities from receiving remuneration in exchange for PHI without express patient authorization and (4) the civil and criminal penalties that may be imposed for HIPAA violations. Pursuant to HIPAA, as amended by HITECH, we are required to report breaches of unsecured PHI to our covered entity clients, such as our physician group partners, within 60 days of discovery of the breach, and notify certain agencies and potentially the media in accordance with clause (2) above. We have experienced cybersecurity incidents in the past and may experience them in the future. Any interruption in access to member information, unauthorized access to information, improper disclosure or other loss of information could result in, among other things, federal or state government investigations and liability under laws and regulations that protect the privacy of member information, such as HIPAA, potentially resulting in damages and regulatory penalties.
HIPAA mandates that the Secretary of HHS conduct periodic audits of covered entities and business associates for compliance with the HIPAA Privacy and Security Rules. HIPAA imposes penalties for certain violations, subject to a cap of $1.5 million for violations of the same standard in a single calendar year. A single data privacy or data security incident can, in the view of HHS, result in violations of multiple standards. HIPAA, as amended by the HITECH Act, also authorizes state attorneys general to file suit on behalf of their states’ residents. While HIPAA does not create a private right of action allowing individuals to sue us in federal court for violations of HIPAA, its standards have been used as a basis for establishing a duty of care in
state-law
civil suits alleging negligence or recklessness for the misuse of PHI. A finding of liability under HIPAA could have a material adverse effect on our business, financial condition and results of operations. In order to ensure compliance, we encrypt and back up data, maintain company-wide security awareness training, enter into business associate agreements with our partners, as well as ensure our partners have implemented physical security and safeguards at the data centers where our data is stored and conduct regular internal and external security audits. Although we employ administrative, physical and technological safeguards to help protect confidential and other sensitive information from unauthorized access or disclosure, our information technology and infrastructure, and that of our third-party service providers, may be vulnerable to attacks by hackers or viruses, failures or breaches due to third-party action and employee (including contractor) negligence, error or malfeasance.Additionally, many states also enacted laws that protect the privacy and security of confidential, personal and health information, which may be even more stringent than HIPAA and may add additional compliance costs and legal risks to our operations. Some of these state laws may impose fines and penalties on violators and may afford private rights of action to individuals who believe their personal information has been misused.
We are also subject to a provision of the federal 21st Century Cures Act that is intended to facilitate the appropriate exchange of health information. In May 2020, the United States Department of Health and Human Services Office of the National Coordinator for Health Information Technology and CMS issued complementary new rules that are intended to clarify provisions of the 21st Century Cures Act. The rules, intended to enhance interoperability and prevent information blocking, create significant new requirements for healthcare industry
142
participants, including requirements to (i) provide patients with convenient access to health care information, (ii) support electronic exchange of data for transitions of care and (iii) require participation in trust networks to improve interoperability. The 21
st
Century Cures Act authorizes civil monetary penalties up to $1 million per information blocking “violation.” It is unclear at this time what the costs of compliance with the new rules will be, and what additional risks there may be to our business. Various other federal and state laws may apply that restrict the use and protect the privacy and security of individually identifiable information, as well as employee personal information, including certain state laws modeled to some extent on the European Union’s General Data Protection Regulation. Federal and state consumer protection laws, including laws that do not on their face specifically address data privacy or security, have been applied to data privacy and security matters by a range of government agencies and courts.Consumer Protection Laws
Healthcare providers are also subject to the Telephone Consumer Protection Act (“TCPA”), which regulates the manner in which a business may advertise its products and services to consumers by phone, text and fax. The TCPA was enacted by Congress to combat aggressive telemarketing and fax advertising practices believed to invade consumer privacy. The TCPA also regulates the use of automated equipment to deliver calls or text messages to mobile phones without prior express consent. Congress empowered the FCC to interpret the TCPA through rules, regulations and declaratory rulings. A 2015 order from the FCC clarified that calls or text messages that have an express healthcare-related purpose—such as treatment
follow-up,
appointment confirmations and reminders orpre-operative
instructions—are exempt from the TCPA. In these instances, providers are not required to receive prior express consent from patients before reaching out by phone or text. As healthcare companies, such as ourselves, increasingly rely on mobile delivery platforms and other technologies to communicate with patients about appointments, billing and other issues, the potential for legal exposure under the TCPA also increases. Each call or text made in violation of the TCPA can cost up to $1,500 per instance in fines and damages. Because there is no cap on statutory damages, violations can result in millions of dollars in penalties.Competition and Antitrust Laws
We are subject to numerous statutes that govern competition in our industry, including the Sherman Act, the FTC Act and the Clayton Act. The Sherman Act, 15 U.S.C. §§
1-7,
outlaws “every contract, combination, or conspiracy in restraint of trade,” and any “monopolization, attempted monopolization, or conspiracy or combination to monopolize.” The penalties for violating the Sherman Act can be severe. Most enforcement actions are civil, but individuals and businesses that violate the Sherman Act may be prosecuted criminally by the DOJ. Criminal prosecutions are typically limited to clear violations, such as when competitors fix prices, allocate markets or rig bids. The Sherman Act imposes criminal penalties of up to $100 million for a corporation and $1 million for an individual, along with up to 10 years in prison. Under federal law, the maximum fine may be increased to twice the amount the conspirators gained from the illegal acts or twice the money lost by the victims of the crime, if either of those amounts is more than $100 million.The FTC Act, 15 U.S.C. §§
41-58,
bans “unfair methods of competition” and “unfair or deceptive acts or practices.” The Supreme Court has said that all violations of the Sherman Act also violate the FTC Act. Thus, although the FTC does not technically enforce the Sherman Act, it can bring cases under the FTC Act against the same kinds of activities that violate the Sherman Act. The FTC Act also reaches other practices that harm competition, but that may not fit neatly into categories of conduct formally prohibited by the Sherman Act. Only the FTC brings cases under the FTC Act.The Clayton Act, 15 U.S.C. §§
12-27,
addresses specific practices that the Sherman Act does not clearly prohibit, such as mergers and interlocking directorates (that is, the same person serving as an officer or director of two competing companies). Section 7 of the Clayton Act prohibits mergers and acquisitions where the effect “may be substantially to lessen competition, or to tend to create a monopoly.” As amended by the Robinson-143
Patman Act of 1936, 15 U.S.C. § 13, the Clayton Act also bans certain discriminatory prices, services and allowances in dealings between merchants. The Clayton Act was amended again in 1976 by the Hart-Scott-Rodino Antitrust Improvements Act, 15 U.S.C. § 18a, to require companies planning large mergers or acquisitions to notify the government of their plans in advance. The Clayton Act also authorizes private parties to sue for treble damages when they have been harmed by conduct that violates either the Sherman or Clayton Act and to obtain a court order prohibiting the anticompetitive practice in the future.
In addition to these federal statutes, most states have antitrust laws that are enforced by state attorneys general or private plaintiffs. Many of state statutory provisions are based on federal antitrust law, namely, Sections 1 and 2 of the Sherman Act, and Sections 3 and 7 of the Clayton Act.
As the healthcare industry has continued to evolve in response to consumer demand and competition in the marketplace, the effect of the antitrust laws in healthcare is also changing. We have expanded our operations significantly since our inception, organically as well as through acquisitions. Such growth, and our long-term contracts with physician partners, could expose us to risks related to antitrust investigations. Competition and antitrust law inquiries often continue for several years and, if violations are found, can result in substantial fines.
Other Laws and Regulations
Some states in which we operate require licensing or registration for operations related to, among others, utilization review on behalf of payors, including reviewing medical necessity and appropriateness of healthcare services, or processing claims in connection with insurance or managed care products. Such laws vary from state to state, and our operations may be subject to exemption in certain states.
Additionally, our physician partners are subject to numerous federal, state and local licensing laws and regulations, relating to, among other things, professional credentialing and professional ethics. Our physician partners, as well as their nurse practitioners, must satisfy and maintain their individual professional licensing in each state where they practice medicine.
Further, organizations that receive reimbursement from a federal or state government payor are expected by the federal government to have a compliance program. For those organizations that do not receive reimbursement from any federal or state government payors, a compliance program is not mandatory but is considered best practice. As a result, we maintain a program to monitor compliance with federal and state laws and regulations applicable to healthcare entities. We have a compliance department that is charged with implementing and supervising our compliance program, which includes the adoption of (i) a Code of Conduct for our employees and affiliates and (ii) a process that specifies how employees, affiliates and others may report regulatory or ethical concerns to our compliance officer. We believe that our compliance program meets the relevant standards provided by the OIG of the Department of Health and Human Services. An important part of our compliance program consists of conducting periodic audits of various aspects of our operations. We also conduct mandatory educational programs designed to familiarize our employees with the regulatory requirements and specific elements of our compliance program.
We are also impacted by federal and state laws and policies that require providers to enroll in the Medicare program before submitting any claims for services, to promptly report certain changes in its operations to the agencies that administer these programs, and to
re-enroll
in these programs when changes in direct or indirect ownership occur or in response to revalidation requests from Medicare.Properties
Our principal executive office is located in Long Beach, CA, where we occupy facilities totaling approximately 18,350 square feet under a lease that expires in 2022. We use this facility for principal corporate activities. We also lease additional office space around the U.S.
144
Legal Proceedings
We are not currently a party to any material litigation proceedings. From time to time, however, we may be a party to litigation and subject to claims incident to the ordinary course of business. Regardless of the outcome, litigation can have an adverse impact on us because of defense and settlement costs, diversion of management resources and other factors. See “Note 11. Commitments and Contingencies” in our audited consolidated financial statements included elsewhere in this prospectus.
145
MANAGEMENT
The following table sets forth certain information concerning our executive officers and directors. The respective age of each individual in the table below is as of August 1, 2021.
Name | Age | Position | ||
Ron Williams | 71 | Chairman of the Board | ||
Ravi Sachdev | 45 | Vice Chairman of the Board | ||
Steven J. Sell | 54 | Director, Chief Executive Officer and President | ||
Michelle A. Gourdine, M.D. | 58 | Director | ||
Sharad Mansukani, M.D. | 52 | Director | ||
Clay Richards | 47 | Director | ||
Richard J. Schnall | 52 | Director | ||
Michael Smith | 73 | Director | ||
Derek L. Strum | 43 | Director | ||
William Wulf, M.D. | 61 | Director | ||
Karen McLoughlin | 56 | Director | ||
Timothy S. Bensley | 62 | Chief Financial Officer | ||
Theodore Halkias | 54 | Chief Business Officer | ||
Veeral Desai | 40 | Chief Strategy and Development Officer | ||
Lisa Dombro | 53 | Chief Experience & Innovation Officer | ||
Benjamin Kornitzer, M.D. | 43 | Chief Medical and Quality Officer | ||
Joan Danieley | 60 | Chief Administrative Officer | ||
Ben Shaker | 38 | Chief Markets Officer | ||
Girish Venkatachaliah | 48 | Chief Technology Officer |
Executive Officers
Steven J. Sell
Timothy S. Bensley
Theodore Halkias
146
Veeral Desai
Lisa Dombro
Benjamin Kornitzer
,
M.D.
Joan Danieley
Ben Shaker
Girish Venkatachaliah
Directors
Ron Williams
147
and the Peterson Institute for International Economics. Mr. Williams received his B.A. from Roosevelt University and holds an M.S. in Management from MIT Sloan School of Management. We believe Mr. Williams is a valuable member of our board because of his experience as an executive at a large healthcare company and because of his experience on other healthcare companies’ boards.
Ravi Sachdev
and Co-Head of
Healthcare Services at J.P. Morgan Chase & Co. Prior to November 2010, Mr. Sachdev held the positions of Managing Director at Deutsche Bank Securities, Inc. from January 2009 until November 2010 and Director at Deutsche Bank AG from January 2007 until January 2009. Prior to joining Deutsche Bank AG in 2006 as a Vice President, Mr. Sachdev served as a Vice President at Peter J. Solomon Company, an investment banking firm, specializing in mergers and acquisitions in the healthcare sector, from 1998 to 2006. Mr. Sachdev received his B.A. from the University of Michigan. Mr. Sachdev possesses knowledge of finance and the financial analytics used to measure business performance. We believe Mr. Sachdev is a valuable member of our board because of his experience in investment banking and private equity, including in the healthcare industry.Mr. Sell can be found above under “—Executive Officers.”
Michelle A. Gourdine, M.D.
Karen McLoughlin
Sharad Mansukani, M.D.
148
and Human Services; Senior Advisor to the Administrator of the Centers for Medicare and Medicaid Services; and senior vice president and chief medical officer at Health Partners. Dr. Mansukani completed a residency and fellowship in ophthalmology at the University of Pennsylvania School of Medicine and a fellowship in quality management and managed care at the Wharton School of the University of Pennsylvania. He is a graduate of the Managed Care Executive Program at the Kellogg School of Business. We believe Dr. Mansukani is a valuable member of our board because of his experience as a medical professional, including in his positions working for government agencies, and his experience on or as an advisor to other healthcare companies’ boards.
Clay Richards
Richard J. Schnall
co-President
of CD&R and on the board of directors of SmileDirectClub, Inc., as well as on the board of directors of Carestream Dental LLC, DeVilbiss Healthcare LLC and Healogics, Inc. Mr. Schall previously served on the board of directors of US Foods and Envision Healthcare. Mr. Schnall worked in the investment banking divisions of Smith Barney & Co. and Donaldson, Lufkin & Jenrette from 1992 to 1996. Mr. Schnall is a graduate of the University of Pennsylvania’s Wharton School and holds an MBA from Harvard Business School. We believe Mr. Schnall is a valuable member of our board because of his extensive experience with health-related and other companies, as well as his strong financial and investing experience.Michael Smith
co-founder
and Senior Advisor of Cardinal Equity Fund. Mr. Smith also served as Executive Vice President and CFO of Anthem, Inc. from January 1999 until his retirement in January 2005. Mr. Smith joined Anthem in April 1996 as Chief Financial and Chief Operating Officer of Anthem’s subsidiary American Health Network. Mr. Smith has served as an advisor to or director for several public and private companies, including Vectren Corporation, Envision Health Care and HH Gregg. For each of the foregoing companies, Mr. Smith served as both a director and chair of the audit committee. Mr. Smith received a degree in Economics from DePauw University. He has also served as the Chair of Indiana Commission for Higher Education and is currently serving as chair of Governor Holcomb’s Commission for Next Level Teacher Pay. We believe Mr. Smith is a valuable member of our board because of his experience as an executive at a large healthcare company and his financial and investing experience.Derek L. Strum
William Wulf, M.D.
149
Corporate Governance
Board Composition and Director Independence
Our board of directors is currently composed of eleven directors. Our Certificate of Incorporation will provide for a classified board of directors, with members of each class serving staggered three-year terms as follows:
| • | Our Class I directors will be Richard J. Schnall, Sharad Mansukani, M.D., Michael Smith and Clay Richards, and their terms will expire at the annual meeting of stockholders to be held in 2022. |
| • | Our Class II directors will be Derek L. Strum, Michelle A. Gourdine, M.D., Karen McLoughlin and Ron Williams, and their terms will expire at the annual meeting of stockholders to be held in 2023. |
| • | Our Class III directors will be Ravi Sachdev, Steven J. Sell and William Wulf, M.D., and their terms will expire at the annual meeting of stockholders to be held in 2024. |
Any additional directorships resulting from an increase in the number of directors will be distributed among the three classes so that, as nearly as possible, each class will consist of
one-third
of the directors. See “Description of Capital Stock—Anti-Takeover Effects of Our Certificate of Incorporation andBy-laws—Classified
Board of Directors.”In connection with our IPO, we and the CD&R Investor entered into a stockholders agreement (the “CD&R Stockholder Agreement”) pursuant to which, among other matters, the CD&R Investor has the right to designate nominees for our board of directors (the “CD&R Designees”), subject to the maintenance of specified ownership requirements. See “Certain Relationships and Related Party Transactions—Stockholders Agreements.”
Our board of directors is led by our
non-executive
Chairman, Mr. Ron Williams, a CD&R Designee. The CD&R Stockholder Agreement provides that a CD&R Designee will serve as our Chairman of the board of directors as long as the CD&R Investor holds at least 25% of the outstanding shares of our common stock.The number of members on our board of directors may be fixed by resolution adopted from time to time by the board of directors. Subject to the CD&R Stockholder Agreement, any vacancies or newly created directorships may be filled only by the affirmative vote of a majority of directors then in office, even if less than a quorum, or by a sole remaining director. Each director shall hold office until his or her successor has been duly elected and qualified, or until his or her earlier death, resignation or removal.
With respect to any vacancy of a CD&R Designee, the CD&R Investor will have the right to designate a new director for election by a majority of the remaining directors then in office.
Our board of directors has determined that Michelle A. Gourdine, M.D., Sharad Mansukani, M.D., Clay Richards, Michael Smith and Karen McLoughlin are “independent” as defined under the NYSE and the Exchange Act rules and regulations.
Controlled Company
After the completion of this offering, the CD&R Investor will continue to control a majority of the voting power of our outstanding common stock. The CD&R Investor will own approximately % of our common stock after the completion of this offering (or approximately % if the underwriters exercise in full their option to purchase additional shares). Accordingly, we expect to continue to be a “controlled company” within the meaning of the NYSE corporate governance standards. Under the NYSE rules, a company of which more than 50% of the voting power is held by an individual, group or another company is a “controlled company” and may elect not to comply with certain corporate governance standards, including:
| • | the requirement that a majority of the board of directors consist of independent directors; |
150
| • | the requirement that our Nominating and Governance Committee be composed entirely of independent directors with a written charter addressing the committee’s purpose and responsibilities; |
| • | the requirement that we have a Compensation Committee that is composed entirely of independent directors with a written charter addressing the committee’s purpose and responsibilities; and |
| • | the requirement for an annual performance evaluation of the Nominating and Governance and Compensation Committees. |
Following this offering, we intend to continue to utilize these exemptions. Accordingly, you may not have the same protections afforded to stockholders of companies that are subject to all of the NYSE corporate governance rules and requirements. The “controlled company” exception does not modify audit committee independence requirements of Rule
10A-3
under the Exchange Act and the NYSE rules.Board Committees
Our board of directors maintains an Audit Committee, a Compensation Committee, a Nominating and Governance Committee and a Compliance & Quality Committee. We also maintain a Disclosure Committee as a management committee. Under the NYSE rules, we are required to have one independent director on our Audit Committee during the
90-day
period beginning on the date of effectiveness of the registration statement filed with the SEC in connection with our IPO. After such90-day
period and until one year from the date of effectiveness of such registration statement, we are required to have a majority of independent directors on our Audit Committee. Thereafter, our Audit Committee is required to be composed entirely of independent directors. As a controlled company, we are not required to have independent Compensation or Nominating and Governance Committees. The following is a brief description of our committees.Audit Committee
Our Audit Committee is responsible, among its other duties and responsibilities, for overseeing our accounting and financial reporting processes, the audits of our financial statements, the qualifications and independence of our independent registered public accounting firm, the effectiveness of our internal control over financial reporting and the performance of our internal audit function and independent registered public accounting firm. Our Audit Committee is responsible for reviewing and assessing the qualitative aspects of our financial reporting, our processes to manage business and financial risks, and our compliance with significant applicable legal, ethical and regulatory requirements. Our Audit Committee is directly responsible for the appointment, compensation, retention and oversight of our independent registered public accounting firm. The charter of our Audit Committee is available without charge on the investor relations portion of our website.
The members of our Audit Committee are Michael Smith (Chairperson), Karen McLoughlin, Clay Richards and Derek Strum. Our board of directors has designated Michael Smith and Karen McLoughlin as “audit committee financial experts,” and each of the four members has been determined to be “financially literate” under the NYSE rules. Our board of directors has also determined that Karen McLoughlin, Clay Richards and Michael Smith are “independent” as defined under the NYSE and Exchange Act rules and regulations.
Compensation Committee
Our Compensation Committee is responsible, among its other duties and responsibilities, for reviewing and approving all forms of compensation to be provided to, and employment agreements with, the executive officers and directors of our company and its subsidiaries (including the Chief Executive Officer), establishing the general compensation policies of our company and its subsidiaries and reviewing, approving and overseeing the administration of the employee benefits plans of our company and its subsidiaries. Our Compensation Committee will also periodically review management development and succession plans. The charter of our Compensation Committee is available without charge on the investor relations portion of our website.
151
The members of our Compensation Committee are Ravi Sachdev (Chairperson), Ron Williams, Sharad Masukani, M.D. and William Wulf, M.D. In light of our status as a “controlled company” within the meaning of the corporate governance standards of the NYSE following this offering, we are exempt from the requirement that our Compensation Committee be composed entirely of independent directors under listing standards applicable to membership on the Compensation Committee, with a written charter addressing the committee’s purpose and responsibilities and the requirement that there be an annual performance evaluation of the Compensation Committee.
Nominating and Governance Committee
Our Nominating and Governance Committee is responsible, among its other duties and responsibilities, for identifying and recommending candidates to the board of directors for election to our board of directors, reviewing the composition of the board of directors and its committees, developing and recommending to the board of directors corporate governance guidelines that are applicable to us, and overseeing board of directors evaluations. The charter of our Nominating and Governance Committee is available without charge on the investor relations portion of our website.
The members of our Nominating and Governance Committee are Ron Williams (Chairperson), Michelle A. Gourdine, M.D., Clay Richards and Derek Strum. In light of our status as a “controlled company” within the meaning of the corporate governance standards of the NYSE following this offering, we are exempt from the requirement that our Nominating and Governance Committee be composed entirely of independent directors, with a written charter addressing the committee’s purpose and responsibilities and the requirement that there be an annual performance evaluation of the Nominating and Governance Committee.
Compliance and Quality Committee
The Compliance and Quality Committee is responsible, among its other duties and responsibilities, for assisting the board of directors in fulfilling its fiduciary responsibilities relating to compliance with the laws, rules and regulations applicable to our business and recommending adoption and implementation of, and changes to, our compliance programs, subject in all cases to the oversight and approval authority of the board of directors. The members of our Compliance and Quality Committee are Michelle A. Gourdine, M.D. (Chairperson), Sharad Mansukani, M.D., Steven J. Sell and William Wulf, M.D.
Disclosure Committee
The Disclosure Committee is a management committee, responsible, among its other duties and responsibilities, for assisting the Chief Executive Officer and Chief Financial Officer in fulfilling their responsibility for oversight of the accuracy and timeliness of the disclosures made by the Company.
Compensation Committee Interlocks and Insider Participation
Prior to our IPO, our Compensation Committee consisted of Ravi Sachdev (Chairperson), Ron Williams and Sharad Mansukani, M.D. None of our executive officers has served as a member of a compensation committee (or if no committee performs that function, the board of directors) of any other entity that has an executive officer serving as a member of our board of directors.
Code of Conduct and Financial Code of Ethics
We have a Code of Conduct that applies to all of our officers, employees and directors and a “Financial Code of Ethics” that applies to our Chief Executive Officer, Chief Financial Officer and corporate officers with financial and accounting responsibilities, including the Controller/Chief Accounting Officer, Treasurer and any other person performing similar tasks or functions. The Financial Code of Ethics and the Code of Conduct each address matters such as conflicts of interest, confidentiality, business practices and compliance with laws and regulations. The Financial Code of Ethics and the Code of Conduct are available without charge on the investor relations portion of our website.
152
EXECUTIVE COMPENSATION
Compensation Discussion and Analysis
Overview
This compensation discussion and analysis provides information about the material elements of compensation that are paid or awarded to, or earned by, our “named executive officers”, also referred to as the “NEOs”, for the 2020 Fiscal Year as follows:
| • | Steven J. Sell, Chief Executive Officer and President (beginning June 1, 2020) |
| • | Theodore Halkias, Chief Financial Officer |
| • | Joan Danieley, Chief Administrative Officer |
| • | Lisa Dombro, Chief Experience & Innovation Officer |
| • | Benjamin Kornitzer, M.D., Chief Medical and Quality Officer |
| • | Ronald Kuerbitz, Former Chief Executive Officer (until June 1, 2020) |
Effective January 11, 2021, Mr. Halkias was appointed as the Company’s Chief Business Officer and Timothy Bensley was appointed as the Company’s Chief Financial Officer.
Compensation Philosophy and Objectives
We seek to provide compensation and benefit programs that support our business strategies and objectives by attracting, retaining and developing individuals with necessary expertise and experience. Our incentive programs are designed to encourage performance and results that will create value for us and our stockholders while avoiding unnecessary risks.
Our executive compensation programs are intended to create a performance culture geared toward exceptional support for our physician partners, value and retention. In particular, our executive compensation programs have the following objectives:
| • | To reward our executives commensurate with their performance, experience and capabilities. |
| • | To cause our executives to have equity in the Company in order to align their interests with the interests of our owners and allow our executives to share in our owners’ success. |
| • | To enable us to attract and retain top executive talent. |
Determination of Executive Compensation
The following describes the primary roles and responsibilities of those involved in the determination of executive compensation levels, plan designs, and policies.
Compensation Committee
The Compensation Committee is responsible for reviewing and approving the compensation and benefits of our employees, directors and consultants, administering our employee benefit plans, authorizing and ratifying stock incentive compensation and other incentive arrangements, and authorizing employment and related agreements. The Compensation Committee consists of Messrs. Ron Williams, Sharad Mansukani, William Wulf and Ravi Sachdev, with Mr. Sachdev serving as a Chair.
Independent Consultant
In connection with our initial public offering, the Compensation Committee engaged Semler Brossy Consulting Group, LLC (“Semler Brossy”) as its independent consultant. Semler Brossy reports to and is directed
153
by the Compensation Committee, and provides no other services to the Company. During 2020, Semler Brossy provided competitive market data and advice to the Compensation Committee on various aspects of the executive and
non-employee
director compensation programs in anticipation of our initial public offering. In performing these services, Semler Brossy interacted with executive management and attended Compensation Committee meetings.Executive Management
Certain members of executive management are involved in the executive compensation determination process. For example, our Chief Executive Officer and Chief Human Resources Officer make specific recommendations for compensation levels and program designs for executives other than themselves.
Elements of Our Executive Compensation Program
During our 2020 Fiscal Year, the compensation program for our named executive officers consisted of salary, short-term incentive compensation, long-term incentive compensation and certain benefits. Set forth below is a chart outlining each element of our 2020 compensation program, the reason that we provided each element, and how that element fit into our overall compensation philosophy at that time (i.e., prior to our initial public offering).
Pay Component | Objective of Pay Component | Key Measure | ||
Base Salary | • Provide competitive pay and reflect individual contributions | • Current compensation relative to competitive rates for similar roles • Individual performance | ||
Annual Cash Incentives | • Reward achievement of short-term business objectives and results | • Adjusted EBITDA goal • Operational goals | ||
Equity Awards | • Stock options to align executive and stockholder interests • Stock purchase opportunities to create “buy in” and immediate stock ownership • Create “ownership culture” • Provide retention incentives | • Stock price appreciation • Continuation of employment | ||
Benefits | • Health, disability and life insurance, 401(k) retirement plan and other employee benefits provide a safety net of protection in the case of illness, disability, death or retirement. | • Generally, competitive benefits relative to market | ||
Base Salary
Base salaries are set to attract, retain and reward executive talent. The determination of any particular executive’s base salary is based on personal performance, experience in the role, competitive rates of pay for comparable roles, significance of the role to the Company and the availability of such executives. None of our NEOs received a salary increase in 2020. The salary paid to each of our NEOs in our 2020 Fiscal Year is shown in the “Summary Compensation Table” following this Compensation Discussion and Analysis.
154
Annual Cash Incentives
Our annual cash incentives are designed to focus our NEOs on achieving planned results against key financial metrics for the Company as a whole and reward them for the achievement of specific individual performance criteria that the Compensation Committee subjectively determines based on its assessment of the executive’s performance during the year. By conditioning a significant portion of our NEOs’ potential total cash compensation on the Company’s achievement of annual financial performance, we reinforce our focus on achieving profitable growth.
All of our NEOs were eligible in the 2020 Fiscal Year to receive cash incentive bonuses based on achievement of
pre-established
annual financial and individual performance targets that were approved by the Board.For the 2020 Fiscal Year, each NEO had a target incentive opportunity expressed as a percentage of his or her salary for the year (75% for all NEOs, except that Ms. Danieley’s bonus target was 67% of her salary).
For the 2020 Fiscal Year, the Company performance goals included Adjusted EBITDA, and certain operational goals relating to exit enrollment, annual wellness visits and net promoter scores. The weight allocated to the Adjusted EBITDA criteria for each NEO was 45%, and the weight allocated to each of the exit enrollment, annual wellness visit and net promoter score operational goals was 15%. In addition, the weight allocated to individual performance goals for each NEO was 10%.
For purposes of calculating the payouts under the 2020 annual cash incentive plan, Adjusted EBITDA was determined without regard to any losses incurred in respect of the Company’s first year operating in a new market.
The Adjusted EBITDA goals established by our Compensation Committee in the beginning of the year, as adjusted, consisted of a threshold Adjusted EBITDA of -$21.5 million (which achievement below this threshold would result in no bonus being earned with respect to this metric, but, if achieved, would result in a multiple of 50% in respect of this metric), a target Adjusted EBITDA of -$14.1 million (which, if achieved, would result in a multiple of 100% in respect of this metric), and a “stretch” Adjusted EBITDA of -$4.3 million (which, if achieved, would result in multiple of 150% in respect of this metric). The Adjusted EBITDA weighted performance multiplier was to be determined by interpolating the percentage achievement between the threshold, target and stretch levels. Though we achieved Adjusted EBITDA in excess of the “stretch” performance goal, our Compensation Committee determined that our results were materially impacted by extraordinary circumstances resulting from the
COVID-19
pandemic. As a result, the Adjusted EBITDA multiple was adjusted downwards to 100% for purposes of the 2020 annual cash incentive plan.The exit enrollment goals established by our Compensation Committee in the beginning of the year, as adjusted, consisted of a threshold of 155,733 individuals enrolled in a Medicare Advantage (“MA”) plan attributed to the primary care physicians (“PCPs”) on our platform (which achievement below this threshold would result in no bonus being earned with respect to this metric, but, if achieved, would result in a multiple of 50% in respect of this metric), a target of 163,929 individuals enrolled in an MA plan attributed to the PCPs on our platform (which, if achieved, would result in a multiple of 100% in respect of this metric), and a “stretch” of 172,125 individuals enrolled in an MA plan attributed to the PCPs on our platform (which, if achieved, would result in a multiple of 150% in respect of this metric). The exit enrollment weighted performance multiplier was determined by interpolating the percentage achievement between the threshold, target and stretch levels. For purposes of the 2020 annual cash incentive plan, the number of individuals enrolled in an MA plan that are attributed to the PCPs on our platform grew to 165,348 individuals for the 2020 Fiscal Year, resulting in an exit enrollment multiple of 108.7%.
The annual wellness visit goals established by our Compensation Committee in the beginning of the year, as adjusted, consisted of a threshold annual wellness visit completion rate of our members of 76% (which
155
achievement below this threshold would result in no bonus being earned with respect to this metric, but, if achieved, would result in a multiple of 50% in respect of this metric), a target annual wellness visit completion rate of our members of 80% (which, if achieved, would result in a multiple of 100% in respect of this metric), and a “stretch” annual wellness visit completion rate of our members of 84% (which, if achieved, would result in a multiple of 150% in respect of this metric). The annual wellness visit performance multiplier was determined by interpolating the percentage achievement between the threshold, target and stretch levels. For purposes of the 2020 annual cash incentive plan, the annual wellness visit completion rate of our members was 70% for the 2020 Fiscal Year, for an annual wellness visit multiple of 0%.
The net promoter score goals established by our Compensation Committee in the beginning of the year, as adjusted, consisted of our markets achieving certain “pass” thresholds in regards to NPS surveys related to patient and provider experience. To achieve a bonus payout, two of three markets must have met the “pass” threshold for patient surveys and five of seven of our markets must have met the “pass” threshold for provider surveys. Based on prior year performance, top tier practices simply needed to maintain top tier performance to meet “pass” threshold, while middle and bottom tier practices need to improve by 3 and 5 points respectively to meet “pass” threshold. The net promoter score performance was determined across the markets and the number of markets achieving “pass” scores tabulated. For purposes of the 2020 annual cash incentive plan, both the patient and provider thresholds were met based on the number of markets achieving a “pass” for the 2020 Fiscal Year, resulting in a net promoter score multiple of 100%.
The Compensation Committee determined that the overall company bonus pool payout would be at 100% of the target and the Mr. Sell would receive 100% of his target bonus. Mr. Sell, as Chief Executive Officer, was given the discretion to apply the following multiples reflecting the individual performance goals for each NEO based on their performance during the 2020 Fiscal Year: 95% with respect to the individual performance goals applicable to Mr. Halkias, 92% with respect to the individual performance goals applicable to Ms. Danieley, 105% with respect to the individual performance goals applicable to Ms. Dombro and 100% with respect to the individual performance goals applicable to Dr. Kornitzer.
These determinations, taken together, resulted in the following
short-term
incentive cash bonus payments for the 2020 Fiscal Year for each NEO: $328,893 to Mr. Sell, $284,000 to Mr. Halkias, $225,001 to Ms. Danieley, $275,625 to Ms. Dombro and $366,803 to Dr. Kornitzer. Mr. Kuerbitz did not receive a bonus payment for the 2020 Fiscal Year due to the termination of his employment.The 2020
short-term
incentive bonus paid to each of our NEOs is shown in the “Summary Compensation Table” following this Compensation Discussion and Analysis under the“Non-Equity
Incentive Plan Compensation” column.Long-Term Equity Incentives
Stock Incentive Plan
Prior to the IPO, we sponsored the agilon health, inc. Stock Incentive Plan (the “Stock Incentive Plan”). See “Note 13. Stock Incentive Plan” in our consolidated financial statements included elsewhere in this prospectus. The Stock Incentive Plan was designed to ensure that senior management, including our NEOs, maximize their focus on increasing stockholder value through long-term growth, and stock options constitute a meaningful part of our NEOs’ compensation. The Stock Incentive Plan was administered by our Compensation Committee, which has discretion, within the parameters of the Stock Incentive Plan, to determine the recipients, amounts and terms of awards. The Stock Incentive Plan was replaced by the agilon health, inc. 2021 Omnibus Equity Incentive Plan in connection with the IPO.
Each of our NEOs holds nonqualified stock options to purchase shares of our common stock under the Stock Incentive Plan. The stock options granted to our NEOs consist of the following: (a) the “Base Options,” which,
156
for Mr. Halkias, Ms. Danieley, Ms. Dombro and Dr. Kornitzer, vest in four equal annual installments, and for Mr. Sell, vest in five equal annual installments; (b) the “Upside Options,” which, for Mr. Halkias, Ms. Danieley, Ms. Dombro and Dr. Kornitzer, vest on the date the CD&R Investor realizes a return of at least three times its initial investment in the Company from sales of its shares and extraordinary cash dividends (the “Performance Condition”), and for Mr. Sell, vest in five equal annual installments but only if as of such date (or a later date prior to the option’s termination), the Performance Condition has been achieved; and (c) for Mr. Sell only, the “IPO Options,” which vested upon the completion of the IPO. Vesting of the outstanding stock options is subject to the NEO’s continuous employment on the applicable vesting date, except as described below. The exercise price of each outstanding stock option is set forth in the “Option Exercise Price” column of the “Outstanding Equity Awards at Fiscal Year End 2020” table. All stock options expire ten years after the date of grant.
If we experience a “change in control” (as defined in the Stock Incentive Plan), Base Options will generally accelerate and, along with vested Upside Options, will be canceled in exchange for a payment equal to the price per share offered in the “change in control” minus the stock option’s exercise price, unless our board of directors elects to allow alternative awards in lieu of payment.
In connection with Mr. Kuerbitz’s separation from the Company, Mr. Kuerbitz forfeited all of his outstanding Upside Options, and his vested Base Options will remain exercisable until the tenth anniversary of the grant date. For additional information regarding the treatment of Mr. Kuerbitz’s options in connection with his separation, see “Narrative disclosure to summary compensation table and grant plan based awards table —Ronald Kuerbitz Separation Agreement” below.
Retirement Benefits
We maintain a 401(k) plan for the benefit of our eligible employees, including our NEOs, under which participants are permitted to contribute a percentage of their compensation on a
pre-tax
basis, subject to U.S. Internal Revenue Code limits. We make matching contributions under the 401(k) plan, subject to vesting conditions. Our NEOs are eligible to participate in the 401(k) plan on the same basis as our other employees.We do not maintain any retirement plans other than the 401(k) plan.
Summary Compensation Table
The following table sets forth the compensation of our NEOs.
Name and Principal Position | Fiscal Year | Salary ($) | Option Awards ($) (2) | Non-Equity Incentive Plan Compensation ($) (3) | All Other Compensation ($) (4) | Total ($) | ||||||||||||||||||
Steven J. Sell, Chief Executive Officer and President (1) | 2020 | 432,692 | 5,277,000 | 328,893 | — | 6,038,585 | ||||||||||||||||||
Theodore Halkias, Chief Financial Officer | 2020 | 400,000 | — | 284,000 | 13,000 | 697,000 | ||||||||||||||||||
Joan Danieley, Chief Administrative Officer | 2020 | 365,000 | 255,690 | 225,001 | 26,000 | 871,691 | ||||||||||||||||||
Lisa Dombro, Chief Experience & Innovation Officer | 2020 | 350,000 | 519,140 | 275,625 | 7,947 | 1,152,712 | ||||||||||||||||||
Benjamin Kornitzer, M.D., Chief Medical and Quality Officer | 2020 | 481,731 | 1,400,465 | 366,803 | 9,615 | 2,258,614 | ||||||||||||||||||
Ronald Kuerbitz, Former Chief Executive Officer | 2020 | 372,115 | 762,555 | — | 2,670,987 | 3,805,657 | ||||||||||||||||||
| (1) | Mr. Sell commenced his employment with the Company as of June 1, 2020, and amounts reported for Mr. Sell in this table reflect that his annual base salary and non-equity incentive plan compensation were prorated for the 2020 calendar year. |
157
| (2) | Option Awards |
| (3) | Non-Equity Incentive Plan Compensationpre-established annual financial and individual performance goals. Pursuant to the terms of his separation agreement, Mr. Kuerbitz was not eligible for an annual cash incentive bonus in respect of the 2020 Fiscal Year. See “Elements of Our Executive Compensation Program— Annual Cash Incentives” above for more information. |
| (4) | All Other Compensation |
Name | 401(k) Contributions | Severance Benefits | Other | |||||||||
Steven J. Sell | — | — | — | |||||||||
Theodore Halkias | 13,000 | — | — | |||||||||
Joan Danieley | 26,000 | — | — | |||||||||
Lisa Dombro | 7,947 | — | — | |||||||||
Benjamin Kornitzer, M.D. | 9,615 | — | — | |||||||||
Ronald Kuerbitz | 9,987 | 2,661,000 | — | |||||||||
158
Grants of Plan-Based Awards for Fiscal Year 2020
The following table provides information concerning awards granted to the NEOs in the 2020 Fiscal Year under any plan.
Grant Date | Estimated Possible Payouts Under Non-Equity Incentive PlanAwards | Estimated Possible Payouts Under Equity Incentive Plan Awards | All Other Option Awards: Number of Securities Underlying Options (#) | Exercise or Base Price of Option Awards ($) | Grant Date Fair Value of Stock and Option Awards ($) (3) | |||||||||||||||||||||||||||
Name | Threshold $ | Target $ | Maximum $ | Target (#) (2) | ||||||||||||||||||||||||||||
Steven J. Sell | — | 562,500 | 843,750 | |||||||||||||||||||||||||||||
| 5/22/2020 | 2,000,000 | $ | 4.49 | 5,277,000 | ||||||||||||||||||||||||||||
| 5/22/2020 | 2,500,000 | $ | 10.11 | — | ||||||||||||||||||||||||||||
| 5/22/2020 | 1,000,000 | $ | 4.49 | — | ||||||||||||||||||||||||||||
Theodore Halkias | — | 300,000 | 450,000 | |||||||||||||||||||||||||||||
Joan Danieley | — | 244,550 | 366,825 | |||||||||||||||||||||||||||||
| 1/31/2020 | 100,000 | $ | 4.45 | 255,690 | ||||||||||||||||||||||||||||
| 1/31/2020 | 100,000 | $ | 8.90 | — | ||||||||||||||||||||||||||||
Lisa Dombro | — | 262,500 | 393,750 | |||||||||||||||||||||||||||||
| 7/29/2020 | 200,000 | $ | 4.49 | 519,140 | ||||||||||||||||||||||||||||
Benjamin Kornitzer, M.D. | — | 375,000 | 562,500 | |||||||||||||||||||||||||||||
| 1/31/2020 | 550,000 | $ | 4.49 | 1,400,465 | ||||||||||||||||||||||||||||
| 1/31/2020 | 250,000 | $ | 8.99 | — | ||||||||||||||||||||||||||||
Ronald Kuerbitz (1) | 6/1/2020 | 5,100,000 | $ | 1.00 | 762,555 | |||||||||||||||||||||||||||
| (1) | For Mr. Kuerbitz, the amounts reported in this column represent the incremental fair value, calculated as of the modification date in accordance with FASB ASC Topic 718, resulting from the extension and acceleration of the post-termination exercise period of Mr. Kuerbitz’s vested time-based option awards in connection with his separation as described below under the heading “—Ronald Kuerbitz Separation Agreement.” |
| (2) | Amounts reported in this column represent the number of stock options that were eligible to be earned upon the achievement of certain performance conditions. In the event the applicable performance conditions are not achieved, none of these options will vest. |
| (3) | Amounts reported in this column represent the aggregate grant date fair value of stock options, computed in accordance with FASB ASC Topic 718. See “Management’s Discussion and Analysis of Financial Condition and Results of Operations—Critical Accounting Estimates—Stock-based Compensation” for a discussion of the relevant assumptions used to calculate these amounts. With respect to stock options that vest subject to a performance condition, the grant date fair value is calculated based upon the probable outcome of the performance condition being achieved, consistent with the estimate of aggregate compensation cost to be recognized over the service period determined as of the grant date, excluding the effect of estimated forfeitures. |
Narrative disclosure to summary compensation table and grant plan based awards table
Employment Agreements
Steven J. Sell Employment Agreement
Mr. Sell’s employment agreement does not provide a fixed term and may be terminated at any time by either party. Under his agreement, Mr. Sell is entitled to an annual base salary of $750,000 and is eligible for payment of an annual cash bonus, with a target amount equal to 75% of his base salary. For additional information regarding Mr. Sell’s annual bonus opportunity, see “Elements of Our Executive Compensation Program—Annual Cash Incentives” above. In addition, Mr. Sell’s agreement provides that he was awarded options pursuant to the Stock Incentive Plan, which vest based on the achievement of certain time and/or
159
performance conditions. For additional information regarding the options awarded to Mr. Sell under the Stock Incentive Plan, see “Elements of Our Executive Compensation Program—Long-Term Equity Incentives—Stock Incentive Plan” above. Pursuant to his employment agreement, Mr. Sell was also entitled to purchase shares of the Company’s common stock at their then current fair market value.
The employment agreement provides for certain severance benefits. If Mr. Sell’s employment is terminated without “cause” or if he resigns his employment for “good reason” (as such terms are defined in his employment agreement), he is entitled to receive (i) a continuing base salary for 18 months, payable on the Company’s normal payroll dates, (ii) a cash payment equal to his target annual bonus, payable in equal monthly installments over 12 months on the Company’s normal payroll dates, (iii) any earned but unpaid annual bonus for the fiscal year prior to the year in which Mr. Sell’s employment terminates and (iv) continued medical, dental and vision insurance coverage for 12 months at active employee rates. Any severance payments are conditioned, among other things, upon Mr. Sell’s execution and
non-revocation
of a release of claims and his continued compliance with applicable restrictive covenants, which include nondisclosure and nondisparagement restrictions for an indefinite time period and restrictions relating to soliciting the Company’s customers and employees for 2 years following a termination of Mr. Sell’s employment with the Company.Theodore Halkias Employment Agreement
Mr. Halkias’s employment agreement does not provide a fixed term and may be terminated at any time by either party. Under his agreement, Mr. Halkias is entitled to an annual base salary of $400,000 and is eligible for payment of an annual cash bonus, with a target amount equal to 75% of his base salary. For additional information regarding Mr. Halkias’s annual bonus opportunity, see “Elements of Our Executive Compensation Program—Annual Cash Incentives” above. In addition, Mr. Halkias’s agreement provides that he was awarded options pursuant to the Stock Incentive Plan, which vest based on the achievement of certain time and/or performance conditions. For additional information regarding the options awarded to Mr. Halkias under the Stock Incentive Plan, see “Elements of Our Executive Compensation Program—Long-Term Equity Incentives—Stock Incentive Plan” above. Pursuant to his employment agreement, Mr. Halkias was also entitled to purchase shares of the Company’s common stock at their then current fair market value.
The employment agreement provides for certain severance benefits. If Mr. Halkias’s employment is terminated without “cause” or if he resigns his employment for “good reason” (as such terms are defined in his employment agreement), he is entitled to receive a cash payment of two times the sum of his base salary and target bonus, payable in equal monthly installments over 24 months, and continued medical, dental and vision insurance coverage for 18 months at active employee rates. Any severance payments are conditioned, among other things, upon Mr. Halkias’s execution and
non-revocation
of a release of claims and his continued compliance with applicable restrictive covenants, which include nondisclosure and nondisparagement restrictions for an indefinite time period and restrictions relating to soliciting the Company’s customers and employees for 2 years following a termination of Mr. Halkias’s employment with the Company.Joan Danieley Employment Agreement
Ms. Danieley’s employment agreement does not provide a fixed term and may be terminated at any time by either party. Under her agreement, Ms. Danieley is entitled to an annual base salary of $365,000 and is eligible for payment of an annual cash bonus, with a target amount equal to 67% of her base salary. For additional information regarding Ms. Danieley’s annual bonus opportunity, see “Elements of Our Executive Compensation Program—Annual Cash Incentives” above.
The employment agreement provides for certain severance benefits. If Ms. Danieley’s employment is terminated without “cause” (as such term is defined in her employment agreement), she is entitled to receive a cash payment of two times the sum of her base salary, payable in equal monthly installments over 24 months. Any severance payments are conditioned, among other things, upon Ms. Danieley’s execution and
non-revocation
of a release of claims and her continued compliance with applicable restrictive covenants, which160
include nondisclosure and nondisparagement restrictions for an indefinite time period and restrictions relating to soliciting the Company’s customers and employees for 2 years following a termination of Ms. Danieley’s employment with the Company.
Lisa Dombro Employment Agreement
Ms. Dombro’s employment agreement does not provide a fixed term and may be terminated at any time by either party. Under her agreement, Ms. Dombro is entitled to an annual base salary of $300,000, which has been increased to $350,000, and is eligible for payment of an annual cash bonus, with a target amount equal to 75% of her base salary. For additional information regarding Ms. Dombro’s annual bonus opportunity, see “Elements of Our Executive Compensation Program—Annual Cash Incentives” above. In addition, Ms. Dombro’s agreement provides that she was awarded options pursuant to the Stock Incentive Plan, which vest based on the achievement of certain time and/or performance conditions. For additional information regarding the options awarded to Ms. Dombro under the Stock Incentive Plan, see “Elements of Our Executive Compensation Program—Long-Term Equity Incentives—Stock Incentive Plan” above. Pursuant to her employment agreement, Ms. Dumbro was also entitled to purchase shares of the Company’s common stock at their then current fair market value.
The employment agreement provides for certain severance benefits if Ms. Dombro’s employment is terminated without “cause” or if she resigns for “good reason” (as such terms are defined in her employment agreement), she is entitled to receive a cash payment of two times the sum of her base salary and target bonus, payable in equal monthly installments over 24 months, and continued medical, dental and vision insurance coverage for 18 months at active employee rates. Any severance payments are conditioned, among other things, upon Ms. Dombro’s execution and
non-revocation
of a release of claims and her continued compliance with applicable restrictive covenants, which include nondisclosure and nondisparagement restrictions for an indefinite time period and restrictions relating to soliciting the Company’s customers and employees for 2 years following a termination of Ms. Dombro’s employment with the Company.Benjamin Kornitzer Employment Agreement
Dr. Kornitzer’s employment agreement does not provide a fixed term and may be terminated at any time by either party. Under his agreement, Dr. Kornitzer is entitled to an annual base salary of $500,000 and is eligible for payment of an annual cash bonus, with a target amount equal to 75% of his base salary. For additional information regarding Dr. Kornitzer’s annual bonus opportunity, see “Elements of Our Executive Compensation Program—Annual Cash Incentives” above. In addition, Dr. Kornitzer’s agreement provides that he was awarded options pursuant to the Stock Incentive Plan, which vest based on the achievement of certain time and/or performance conditions and is entitled to participate in subsequent grants of equity-based compensation. For additional information regarding the options awarded to Dr. Kornitzer under the Stock Incentive Plan, see “Elements of Our Executive Compensation Program—Long-Term Equity Incentives—Stock Incentive Plan” above.
The employment agreement provides for certain severance benefits if Dr. Kornitzer’s employment is terminated without “cause” (as such terms is defined in his employment agreement), he is entitled to receive a continuing base salary for 24 months, payable on the Company’s normal payroll dates. Any severance payments are conditioned, among other things, upon Dr. Kornitzer’s execution and
non-revocation
of a release of claims and his continued compliance with applicable restrictive covenants, which include nondisclosure and nondisparagement restrictions for an indefinite time period and restrictions relating to soliciting the Company’s customers and employees for 2 years following a termination of Dr. Kornitzer’s employment with the Company.Ronald Kuerbitz Separation Agreement
Mr. Kuerbitz was employed pursuant to an employment agreement, which provided for an annual base salary of $750,000. In connection with his separation from the Company on June 1, 2020, we entered into a separation agreement with Mr. Kuerbitz, which replaces and supersedes his employment agreement.
161
Under his separation agreement, Mr. Kuerbitz executed a general release of claims and is entitled to receive the following benefits in connection with the termination of his employment, so long as he complies with provisions related to
non-competition,
non-solicitation
of employees and customers,non-disparagement
and other applicable covenants: (i) a continued base salary and target bonus for 24 months, payable on the Company’s normal payroll dates; (ii) continued medical, dental and vision insurance coverage for 18 months following his termination date at active employee rates or, if earlier, the date on which he obtains medical coverage through alternative employment; (iii) a repurchase of all shares of the Company’s common stock held by Mr. Kuerbitz; (iv) his vested Base Options will remain exercisable, on a cashless basis, until the tenth anniversary of the grant date; and (v) upon the consummation of a public offering with aggregate gross cash proceeds meeting or exceeding the threshold set forth in the separation agreement or a change in control occurring on or prior to December 31, 2021, payment of a special cash bonus in recognition of the value he created at the Company and his significant contributions to the Company leading to a public offering. All of Mr. Kuerbitz’s Upside Options were forfeited in connection with his separation, and Mr. Kuerbitz forfeited his entitlement to an annual bonus for the 2020 fiscal year pursuant to the terms of the separation agreement. Following the termination of his employment, Mr. Kuerbitz is also subject to a12-month
non-compete
and certainnon-solicitation,
non-disparagement
and confidentiality obligations.Outstanding Equity Awards at Fiscal Year End 2020
Name | Number of Securities Underlying Unexercised Options (#) Exercisable(1) | Number of Securities Underlying Unexercised Options (#) Unexercisable | Equity Incentive Plan Awards Number of Securities Underlying Unexercised Unearned Options (#) | Option Exercise Price ($) | Option Expiration Date | |||||||||||||||
Steven J. Sell | — | 2,000,000 | (2) | — | 4.49 | 5/22/2030 | ||||||||||||||
| — | — | 2,500,000 | (6) | 10.11 | 5/22/2030 | |||||||||||||||
| — | — | 1,000,000 | (7) | 4.49 | 5/22/2030 | |||||||||||||||
Theodore Halkias | 1,350,000 | 450,000 | (3) | — | 1.00 | 4/27/2027 | ||||||||||||||
| — | — | 1,700,000 | (6) | 3.00 | 4/27/2027 | |||||||||||||||
Joan Danieley | 375,000 | 125,000 | (2) | — | 1.00 | 11/15/2027 | ||||||||||||||
| — | — | 500,000 | (6) | 3.00 | 11/15/2027 | |||||||||||||||
| 25,000 | 75,000 | (4) | — | 4.45 | 01/31/2030 | |||||||||||||||
| — | — | 100,000 | (6) | 8.90 | 01/31/2030 | |||||||||||||||
Lisa Dombro | 375,000 | 125,000 | (3) | — | 1.00 | 4/27/2027 | ||||||||||||||
| — | — | 750,000 | (6) | 3.00 | 4/27/2027 | |||||||||||||||
| 125,000 | 125,000 | (5) | — | 1.00 | 1/24/2028 | |||||||||||||||
| — | 200,000 | (2) | — | 4.49 | 7/29/2030 | |||||||||||||||
Benjamin Kornitzer, M.D. | — | 550,000 | (2) | — | 4.49 | 1/31/2030 | ||||||||||||||
| — | — | 250,000 | (6) | 8.99 | 1/31/2030 | |||||||||||||||
Ronald Kuerbitz | 4,250,000 | — | — | 1.00 | 12/30/2026 | |||||||||||||||
| 850,000 | — | — | 1.00 | 4/27/2027 | ||||||||||||||||
| (1) | The awards in this column consist of nonqualified stock options granted under our Stock Incentive Plan that have previously vested. |
| (2) | These awards consist of nonqualified stock options granted under our Stock Incentive Plan that will vest (a) for Mr. Sell, 20% on each anniversary of June 1, 2020, (b) for Ms. Danieley, in full on September 15, 2021, (c) for Ms. Dombro, 25% on each anniversary of July 29, 2020 and (d) for Dr. Kornitzer, 25% on each anniversary of January 9, 2020, in each case subject to that NEO’s continued employment through each applicable vesting date, except as described above under “Narrative Disclosure to Summary Compensation Table—Equity Compensation Plan.” |
| (3) | These awards consist of nonqualified stock options granted under our Stock Incentive Plan, which vested (a) for Mr. Halkias, on May 15, 2021, and (b) for Ms. Dombro, on March 1, 2021. |
162
| (4) | These awards consist of nonqualified stock options granted under our Stock Incentive Plan that will vest in three equal installments on each anniversary of August 14, 2019, subject to Ms. Danieley’s continued service through such date. |
| (5) | These awards consist of nonqualified stock options granted under our Stock Incentive Plan, of which half vested on January 24, 2021 and the remaining half will vest on January 24, 2022, subject to Ms. Dombro’s continued service through such dates. |
| (6) | These awards consist of nonqualified stock options granted under our Stock Incentive Plan, which vest (a) for Mr. Sell, 20% on each anniversary of June 1, 2020, but only if as of such date or a later date prior to the option’s termination, the Performance Condition has been achieved, and (b) for Mr. Halkias, Ms. Danieley, Ms. Dombro and Dr. Kornitzer, on the date the Performance Condition is achieved, in each case subject to that NEO’s continued employment through each applicable vesting date, except as described above under “Elements of Our Executive Compensation Program—Long-Term Equity Incentives—Stock Incentive Plan.” |
| (7) | These awards consist of nonqualified stock options granted under our Stock Incentive Plan, which vested upon the completion of the IPO on April 19, 2021. |
Potential Payments Upon Termination or
Change-in-Control
Severance Payments
The information below describes and quantifies compensation that would have become payable to each of our NEOs, other than Ronald Kuerbitz, per the terms of their employment agreements if their employment had been terminated on December 31, 2020 by the Company without “cause” or if they resigned for “good reason”. See “Narrative disclosure to summary compensation table and grant plan based awards table—Employment Agreements” above for a description of the NEOs’ respective employment agreements.
Name | Salary ($) | Target Bonus ($) | Earned and Unpaid Bonus ($) | COBRA Benefit Payment ($) | Total ($) | |||||||||||||||
Steven J. Sell | 1,125,000 | 562,500 | 328,893 | 22,622 | 2,039,015 | |||||||||||||||
Theodore Halkias | 800,000 | 600,000 | N/A | 33,934 | 1,433,934 | |||||||||||||||
Joan Danieley | 730,000 | N/A | N/A | N/A | 730,000 | |||||||||||||||
Lisa Dombro | 700,000 | 525,000 | N/A | 33,934 | 1,258,934 | |||||||||||||||
Benjamin Kornitzer, M.D. | 1,000,000 | N/A | N/A | N/A | 1,000,000 | |||||||||||||||
Accelerated Vesting of Options on a Change in Control
If we experience a “change in control” (as defined below), the vesting of Base Options will generally accelerate and, along with vested Upside Options, be canceled in exchange for a payment equal to the price per share offered in the “change in control” minus the stock option’s exercise price, unless the Board elects to allow alternative awards in lieu of payment. Under the Stock Incentive Plan, a “change in control” is generally defined as the first to occur of the following events:
| • | the acquisition by any person, entity or “group” (as defined in Section 13(d) of the Exchange Act) of more than 50% of the combined voting power of the Company’s then outstanding voting securities, other than any such acquisition by the Company, any of the subsidiaries, any employee benefit plan of the Company or any of the subsidiaries, or by the CD&R Investors, or any affiliates of any of the foregoing; |
| • | the merger, consolidation or other similar transaction involving the Company, as a result of which both ( x ) persons who were stockholders of the Company immediately prior to such merger, consolidation, or other similar transaction do not, immediately thereafter, own, directly or indirectly, more than 50% of the combined voting power entitled to vote generally in the election of directors of the merged or consolidated company, and (y ) the CD&R Investors (individually or collectively) do not, immediately thereafter, own, directly or indirectly, more than 50% of the combined voting power entitled to vote generally in the election of directors of the merged or consolidated company; |
| • | within any 12-month period, the persons who were directors of the Company at the beginning of such period (the “Incumbent Directors”) shall cease to constitute at least a majority of the Board, provided that |
163
any director elected or nominated for election to the Board by a majority of the Incumbent Directors then still in office shall be deemed to be an Incumbent Director for purposes of this clause (iii); or |
| • | the sale, transfer or other disposition of all or substantially all of the assets of the Company to one or more persons or entities that are not, immediately prior to such sale, transfer or other disposition, affiliates of the Company. |
A public offering of the Company’s common stock does not constitute a change in control.
As described above, had a change in control of the Company occurred on December 31, 2020, our NEOs, other than Ronald Kuerbitz, would have received benefits from the accelerated vesting of unvested options in the following amounts:
Name | Acceleration of Options ($)(1) | |||
Steven J. Sell | 13,336,200 | |||
Theodore Halkias | 13,671,000 | |||
Joan Danieley | 4,079,245 | |||
Lisa Dombro | 7,329,080 | |||
Benjamin Kornitzer, M.D. | 2,444,970 | |||
| (1) | Fair market value as of December 31, 2020 of $8.94 per share was determined in accordance with the terms of the Stock Incentive Plan. |
Stock Ownership Guidelines
Our board of directors has established stock ownership guidelines in order to further align the long term interests of our executive officers and
non-employee
directors with those of our stockholders. Our stock ownership guidelines require that our executive officers own shares of the Company’s common stock having an aggregate value equal to a multiple of the executive officer’s annual base salary ornon-employee
director’s annual board cash retainer as follows:Position | Multiple | |||
Chief Executive Officer | 6x Annual Base Salary | |||
All Other Executive Officers | 2x Annual Base Salary | |||
Non-Employee Directors* | 5x Annual Board Cash Retainer | |||
| * | Excludes CD&R affiliated directors |
Executives are required to hold 50% of shares acquired as a result of exercise or settlement of compensatory awards (net of any shares withheld for taxes) until these ownership guidelines have been met.
Compensation of Directors
The following table sets forth information regarding compensation for each of our
non-employee
directors during our fiscal year ended December 31, 2020. Mr. Sell’s compensation for fiscal year 2020 is reported in the Summary Compensation table above.Name | Fees earned or paid in cash ($) | Stock awards ($) (1) | Option awards ($) (2) | All other compensation ($) | Total ($) | |||||||||||||||
Ronald A. Williams | — | — | — | — | — | |||||||||||||||
Ravi Sachdev | — | — | — | — | — | |||||||||||||||
Richard J. Schnall | — | — | — | — | — | |||||||||||||||
Derek L. Strum | — | — | — | — | — | |||||||||||||||
Sharad Mansukani, M.D. | 215,000 | — | — | — | 215,000 | |||||||||||||||
William A. Sanger (3) | 50,000 | 50,000 | — | — | 100,000 | |||||||||||||||
Michael L. Smith | 75,000 | 50,000 | — | — | 125,000 | |||||||||||||||
J. William Wulf, M.D. | 50,000 | 50,000 | 527,700 | — | 627,700 | |||||||||||||||
164
| (1) | The amount in this column represents the grant date fair value of restricted stock units issued to Messrs. Sanger, Smith and Wulf in the 2020 Fiscal Year, computed in accordance with FASB ASC Topic 718. The restricted stock units vest in three equal annual installments, subject to each director’s continued service as a member of our board of directors through such date. As of December 31, 2020, Messrs. Sanger, Smith and Wulf each held 36,500 outstanding restricted stock units. |
| (2) | Amounts reported in this column represent the aggregate grant date fair value of stock options granted to Dr. Wulf in the 2020 Fiscal Year, computed in accordance with FASB ASC Topic 718. As of December 31, 2020, Messrs. Mansukani, Williams and Wulf held 800,000, 1,100,000 and 500,000 outstanding stock options awards, respectively. With respect to stock options that vest subject to a performance condition, the grant date fair value is calculated based upon the probable outcome of the performance condition being achieved, consistent with the estimate of aggregate compensation cost to be recognized over the service period determined as of the grant date, excluding the effect of estimated forfeitures. Assuming the applicable performance conditions are achieved, the value of the performance-based vesting option awards at the grant date would be $435,240 for Dr. Wulf. See “Management’s Discussion and Analysis of Financial Condition and Results of Operations—Critical Accounting Estimates—Stock-based Compensation” for a discussion of the relevant assumptions used to calculate these amounts. |
| (3) | Messr. Sanger retired as a director effective as of January 4, 2021. |
In the 2020 Fiscal Year, no director who is a CD&R partner ( Messrs. Sachdev, Schnall and Strum) was compensated by us for services as a director.
i.e.
Three of our
non-employee
directors, Messrs. Sanger, Smith and Wulf, were paid an annual retainer fee of $100,000 in the 2020 Fiscal Year, consisting of 50% cash paid in quarterly installments in arrears and 50% in restricted stock units based on the grant date value. These restricted stock units vest in three equal annual installments. Also, Mr. Smith received an additional fee of $25,000 in respect of his service as chair of our Audit Committee. In the 2020 Fiscal Year, Dr. Mansukani was paid an annual retainer fee of $215,000 in cash.In the 2020 Fiscal Year, Dr. Wulf also received a
one-time
stock option grant, consisting of (i) “Base Options,” which vest in five annual installments, and (ii) “Upside Options,” which vest in five annual installments but only if as of such date (or a later date prior to the option’s termination), the Performance Condition (as defined above) has been achieved, in each case subject to Dr. Wulf’s continuous service as a director on the applicable vesting date. The stock options expire ten years after the date of grant.Compensation Committee Interlocks and Insider Participation
The Compensation Committee for the Company currently consists of Messrs. Ron Williams, Sharad Mansukani, William Wulf and Ravi Sachdev, with Mr. Sachdev serving as a chair. There are no members of the Compensation Committee who serve as an officer or employee of the Company or any of its subsidiaries.
Compensation Risk Assessment
The Compensation Committee assessed the risks associated with our compensation and practices to evaluate whether they create risks that are likely to have a material adverse effect on us. Based on its assessment, the Compensation Committee concluded that our compensation policies and practices do not create incentives to take risks that are likely to have a material adverse effect on us. We believe we have allocated our compensation among base salary, short term incentives and long-term equity in such a way as to not encourage excessive risk taking.
165
PRINCIPAL AND SELLING STOCKHOLDERS
The following table sets forth information as of June 30, 2021 with respect to the ownership of our common stock by:
| • | the selling stockholders and each person known to own beneficially more than five percent of our common stock; |
| • | each of our directors; |
| • | each of our named executive officers; and |
| • | all of our current executive officers and directors as a group. |
The amounts and percentages of shares beneficially owned are reported on the basis of regulations of the SEC governing the determination of beneficial ownership of securities. Under SEC rules, a person is deemed to be a “beneficial owner” of a security if that person has or shares voting power or investment power, which includes the power to dispose of or to direct the disposition of such security. A person is also deemed to be a beneficial owner of any securities of which that person has a right to acquire beneficial ownership within 60 days. Securities that can be so acquired are deemed to be outstanding for purposes of computing such person’s ownership percentage, but not for purposes of computing any other person’s percentage. Under these rules, more than one person may be deemed to be a beneficial owner of the same securities, and a person may be deemed to be a beneficial owner of securities as to which such person has no economic interest.
Percentage computations are based on approximately 390,882,560 shares of our common stock outstanding as of June 30, 2021, and 390,882,560 shares outstanding following the completion of this offering.
Except as otherwise indicated in the footnotes to the table, each of the beneficial owners listed has, to our knowledge, sole voting and investment power with respect to the indicated shares of common stock. Unless otherwise set forth in the footnotes to the table, the address for each listed stockholder is 1 World Trade Center, Suite 2000, Long Beach, CA 90831.
Shares Beneficially Owned Before the Offering and After the Offering Assuming the Underwriters’ Option Is Not Exercised (1) | Shares Beneficially Owned After the Offering Assuming the Underwriters’ Option Is Exercised in Full | |||||||||||||||||||||||
Name and Address of Beneficial Owner | Number of Shares Owned | Percent of Class Before the Offering (%) | Percent of Class After the Offering (%) | Shares Being Offered by Selling Stockholder | Number of Shares Owned | Percent of Class After the Offering (%) | ||||||||||||||||||
5% Stockholders | ||||||||||||||||||||||||
CD&R Vector Holdings, L.P. (2) (3) | 224,718,177 | 57.5 | % | % | % | |||||||||||||||||||
Morgan Stanley Investor (4) | 26,444,000 | 8.1 | % | % | 26,444,000 | % | ||||||||||||||||||
Capital World Investor (5) | 21,946,500 | 5.6 | % | % | 21,946,500 | % | ||||||||||||||||||
Directors and Named Executive Officers | ||||||||||||||||||||||||
Ron Williams | 3,394,900 | * | * | 3,394,900 | * | |||||||||||||||||||
Michelle A. Gourdine, M.D. | — | * | * | — | * | |||||||||||||||||||
Sharad Mansukani, M.D. | 1,872,400 | * | * | * | ||||||||||||||||||||
Clay Richards | — | * | * | — | * | |||||||||||||||||||
Michael Smith (6) | 270,800 | * | * | 270,800 | * | |||||||||||||||||||
William Wulf, M.D. (7) | 171,350 | * | * | 171,350 | * | |||||||||||||||||||
Karen McLoughlin | — | * | * | — | * | |||||||||||||||||||
Ravi Sachdev | — | * | * | — | * | |||||||||||||||||||
Richard J. Schnall | — | * | * | — | * | |||||||||||||||||||
Derek L. Strum | — | * | * | — | * | |||||||||||||||||||
Steven J. Sell (8) | 1,400,000 | * | * | 1,400,000 | * | |||||||||||||||||||
Lisa Dombro | 687,500 | * | * | 687,500 | * | |||||||||||||||||||
Benjamin Kornitzer, M.D. | 137,500 | * | * | 137,500 | * | |||||||||||||||||||
All current directors and executive officers as a group (19 persons) (9) | 12,559,450 | 3.2 | % | % | 12,559,450 | % | ||||||||||||||||||
166
Shares Beneficially Owned Before the Offering and After the Offering Assuming the Underwriters’ Option Is Not Exercised (1) | Shares Beneficially Owned After the Offering Assuming the Underwriters’ Option Is Exercised in Full | |||||||||||||||||||||||
Name and Address of Beneficial Owner | Number of Shares Owned | Percent of Class Before the Offering (%) | Percent of Class After the Offering (%) | Shares Being Offered by Selling Stockholder | Number of Shares Owned | Percent of Class After the Offering (%) | ||||||||||||||||||
Ronald Kuerbitz (10) | 5,100,000 | 1.3 | % | 13 | % | — | | 5,100,000 | | 1.3 | % | |||||||||||||
| * | Less than one percent. |
| (1) | The selling stockholders have granted the underwriters an option to purchase up to an additional shares. |
| (2) | CD&R Investment Associates IX, Ltd. (“CD&R Holdings GP”), as the general partner of the CD&R Investor, may be deemed to beneficially own the shares of common stock in which the CD&R Investor has beneficial ownership. CD&R Holdings GP expressly disclaims beneficial ownership of the shares of common stock in which the CD&R Investor has beneficial ownership. Investment and voting decisions with respect to the shares of common stock held by the CD&R Investor are made by an investment committee of limited partners of CD&R Associates IX, L.P., currently consisting of more than ten individuals, each of whom is also an investment professional of CD&R (the “Investment Committee”). All members of the Investment Committee disclaim beneficial ownership of the shares shown as beneficially owned by the CD&R Investor. CD&R Holdings GP is managed by a two-person board of directors. Donald J. Gogel and Nathan K. Sleeper, as the directors of CD&R Holdings GP, may be deemed to share beneficial ownership of the shares of common stock directly held by the CD&R Investor. Such persons expressly disclaim such beneficial ownership. The principal office of the CD&R Investor is c/o Clayton, Dubilier & Rice, LLC, 375 Park Avenue, New York, New York, 10152. |
| (3) | Certain CD&R investment professionals may make a contribution of shares to one or more charities prior to this offering. In that event, a recipient charity, if it chooses to participate in this offering, will be the selling stockholder with respect to the donated shares. |
| (4) | Includes 26,444,000 shares owned by Morgan Stanley Investment Management Inc. on behalf of certain funds and accounts (such entities collectively, the “Morgan Stanley Investor”). The mailing address for each of the foregoing entities is c/o Morgan Stanley Investment Management Inc., 522 Fifth Avenue, New York, New York 10036. The amounts in the table above do not take into account the shares of our common stock, if any, that Counterpoint Global (Morgan Stanley Investment Management) may purchase in this offering as a cornerstone investor. |
| (5) | Includes 8,832,200 shares owned by The New Economy Fund and 13,114,300 shares owned by SMALLCAP World Fund, Inc. (such entities together, the “Capital World Investor”). The mailing address of each of the foregoing entities is c/o Capital Research and Management Company, 333 South Hope Street, 55th Floor, Los Angeles, CA 90071. The amounts in the table above do not take into account the shares of our common stock, if any, that Capital World Investors may purchase in this offering as a cornerstone investor. |
| (6) | Includes 120,800 shares of our common stock subject to outstanding vested RSUs. |
| (7) | Includes 85,200 shares of our common stock subject to outstanding vested RSUs. |
| (8) | Excludes 556,200 shares held by the Sell Family Trust and the Sell Children’s Trust, each an irrevocable trust of which Mr. Sell is neither the trustee nor a beneficiary. |
| (9) | Includes an aggregate amount of 8,040,000 shares which the current executive officers and directors have the right to acquire prior to September 24, 2021 through the exercise of stock options and 206,000 shares of our common stock subject to outstanding vested RSUs granted to directors. |
| (10) | Includes 5,100,000 shares which Mr. Kuerbitz has the right to acquire through the exercise of stock options. |
167
CERTAIN RELATIONSHIPS AND RELATED PARTY TRANSACTIONS
Policies and Procedures for Related Person Transactions
Our board of directors has approved policies and procedures with respect to the review and approval of certain transactions between us and a Related Person (as defined herein) or a Related Person Transaction (as defined herein) (the “Related Person Transaction Policy”). Pursuant to the terms of the Related Person Transaction Policy, our board of directors, acting through our Audit Committee, must review and decide whether to approve any Related Person Transaction. Any Related Person Transaction is required to be reported to our legal department, which will then determine whether it should be submitted to our Audit Committee for consideration. The Audit Committee must then review and decide whether to approve any Related Person Transaction.
For the purposes of the Related Person Transaction Policy, a “Related Person Transaction” means a transaction, arrangement or relationship (or any series of similar transactions, arrangements or relationships) in which we (including any of our subsidiaries) were, are or will be a participant and in which any Related Person had, has or will have a direct or indirect interest; and a “Related Person” means any person who is, or at any time since the beginning of our last fiscal year was, a director or executive officer of agilon health or a nominee to become a director of agilon health; any person who is the beneficial owner of more than five percent of our common stock; any immediate family member of any of the foregoing persons, including any child, stepchild, parent, stepparent, spouse, sibling,orof the director, executive officer, nominee or more than five percent beneficial owner, and any person (other than a tenant or employee) sharing the household of such director, executive officer, nominee or more than five percent beneficial owner; and “spouse” includes an individual married to a person of the same sex if the couple is lawfully married under state law, regardless of the individual’s domicile; and any firm, corporation or other entity in which any of the foregoing persons is a general partner or, for other ownership interests, a limited partner or other owner in which such person has a beneficial ownership interest of ten percent or more.
mother-in-law,
father-in-law,
son-in-law,
daughter-in-law,
brother-in-law,
sister-in-law
Stockholders Agreements
CD&R Stockholder Agreement
In connection with our IPO, we entered into a stockholders agreement with the CD&R Investor. The stockholders agreement granted to the CD&R Investor the right to designate for nomination for election to our board of directors a number of CD&R Designees equal to:
| • | at least a majority of the total number of directors comprising our board of directors at such time as long as the CD&R Investor beneficially owns at least 50% of the outstanding shares of our common stock; |
| • | at least 40% of the total number of directors comprising our board of directors at such time as long as the CD&R Investor beneficially owns at least 40% but less than 50% of the outstanding shares of our common stock; |
| • | at least 30% of the total number of directors comprising our board of directors at such time as long as the CD&R Investor beneficially owns at least 30% but less than 40% of the outstanding shares of our common stock; |
| • | at least 20% of the total number of directors comprising our board of directors at such time as long as the CD&R Investor beneficially owns at least 20% but less than 30% of the outstanding shares of our common stock; and |
| • | at least 5% of the total number of directors comprising our board of directors at such time as long as the CD&R Investor beneficially owns at least 5% but less than 20% of the outstanding shares of our common stock. |
168
For purposes of calculating the number of CD&R Designees that the CD&R Investor is entitled to nominate pursuant to the formula outlined above, any fractional amounts would be rounded up to the nearest whole number and the calculation would be made on a pro forma basis after taking into account any increase in the size of our board of directors. If the CD&R Investor beneficially owns less than 5% of the outstanding shares of common stock, the CD&R Investor will no longer be entitled to designate any designees for nomination by the board of directors.
With respect to any vacancy of a CD&R-designated director, the CD&R Investor will have the right to designate a new director for election by a majority of the remaining directors then in office.
The stockholders agreement provides that a CD&R Designee will serve as the Chairman of our board of directors as long as the CD&R Investor beneficially owns at least 25% of the outstanding shares of our common stock.
The stockholders agreement also grants to the CD&R Investor certain other rights, including specified information and access rights.
Existing Stockholders’ Agreement
Prior to our IPO, we were a party to an Amended and Restated Stockholders’ Agreement, dated as of November 29, 2019 (as amended or otherwise modified, the “Existing Stockholders Agreement”), by and among agilon health, and our existing stockholders, including the CD&R Investor, the Morgan Stanley Investor and the Capital World Investor. Other than a 180-day
lock-up
provision in the event of an IPO, the Existing Stockholders Agreement terminated upon the completion of our IPO.Registration Rights Agreements
In connection with our IPO, we entered into a registration rights agreement with the CD&R Investor. The registration rights agreement grants to the CD&R Investor and its permitted assigns customary Form
S-1
and FormS-3
demand registration rights and piggyback registration rights, in each case subject to customary terms and conditions.We are a party to registration rights agreements with each of our pre-IPO stockholders, including the Morgan Stanley Investor and the Capital World Investor. The registration rights agreements grant to the existing stockholders and each of their respective permitted assigns, customary Form
S-3
demand registration rights and piggyback registration rights, in each case subject to customary terms and conditions.Investment Agreements
We are a party to an Investment Agreement, dated as of November 7, 2018, as amended by the first amendment, dated as of October 21, 2020 (as may be further amended or restated, the “Morgan Stanley Investment Agreement”), with the Morgan Stanley Investor, pursuant to which the Morgan Stanley Investor purchased the shares of our common stock that it owns. All put rights and information rights provided pursuant to the Morgan Stanley Investment Agreement terminated automatically upon the consummation of our IPO.
We are also party to an Investment Agreement, dated as of January 4, 2019, as amended by the first amendment, dated as of October 5, 2020, and an Investment Agreement, dated as of March 4, 2020 (as may be amended or restated, together, the “Capital World Investment Agreements”), with the Capital World Investor, pursuant to which the Capital World Investor purchased the shares of our common stock that it owns. All rights provided in the Capital World Investment Agreement that were substantially the same as the put rights and information rights provided under the Morgan Stanley Investment Agreement, as well as certain consent rights, terminated automatically upon the consummation of our IPO.
169
We are also party to Investment Agreements with our other pre-IPO stockholders, which contain substantially similar rights as described above for the Morgan Stanley Investment Agreement and the Capital World Investment Agreements. All such rights terminated automatically upon the consummation of the IPO.
Consulting Agreement
Prior to our IPO, we were a party to a consulting agreement with CD&R, dated as of July 1, 2016. For each of the years ended December 31, 2020, 2019 and 2018, we paid $1.5 million to CD&R in advisory consulting fees, in addition to certain expense reimbursements. The consulting agreement with CD&R was terminated in connection with our IPO. No additional fee was paid in connection with the termination.
Indemnification Agreements
We are a party to an indemnification agreement (the “Indemnification Agreement”) with the CD&R Investor, Clayton, Dubilier & Rice Fund IX, L.P., Clayton, Dubilier & Rice Fund
IX-A,
L.P., CD&R Advisor Fund IX, L.P. (together, the “CD&R Funds”) and CD&R, pursuant to which we indemnify the CD&R Investor, the CD&R Funds and CD&R and each of their respective affiliates, successors, assigns, directors, officers, partners, members, employees, agents, advisors, consultants, representatives and controlling persons, against certain liabilities arising out of performance of the consulting agreements and any transaction fee agreements and certain other claims and liabilities, including liabilities arising out of financing arrangements and securities offerings. Our indemnification obligations under the Indemnification Agreements are primary to any similar rights to which any indemnitee may be entitled under any other agreement or document.We are a party to indemnification agreements with our directors. The indemnification agreements provide the directors with contractual rights to indemnification and expense advancement. See “Description of Capital Stock—Limitations on Liability and Indemnification.”
Transactions with Other Related Parties
We were a party to the Unsecured Credit Facility with Arawak IX, L.P., an affiliate of the CD&R Investor. The Unsecured Credit Facility was repaid in full in connection with the entry into the 2021 Secured Credit Agreement. See “Description of Certain Indebtedness.”
170
DESCRIPTION OF CAPITAL STOCK
The following description of our capital stock is a summary of the material terms of our Certificate of Incorporation and
By-laws.
Reference is made to the more detailed provisions of, and the descriptions are qualified in their entirety by reference to, these documents, which are incorporated by reference to this registration statement.General
Our authorized capital stock consists of 2,000,000,000 shares of common stock, par value $0.01 per share and 100,000,000 shares of undesignated preferred stock, par value $1.00 per share. Immediately following this offering, we expect to have 390,882,560 shares of our common stock issued and outstanding, as further described under “Prospectus Summary—The Offering.”
Common Stock
Holders of common stock are entitled:
| • | to cast one vote for each share held of record on all matters submitted to a vote of the stockholders; |
| • | to receive, on a pro rata basis, dividends and distributions, if any, that our board of directors may declare out of legally available funds, subject to preferences that may be applicable to preferred stock, if any, then outstanding; and |
| • | upon our liquidation, dissolution or winding-up, to share equally and ratably in any assets remaining after the payment of all debt and other liabilities, subject to the prior rights, if any, of holders of any outstanding shares of preferred stock. |
Our ability to pay dividends on our common stock is subject to our subsidiaries’ ability to pay dividends to us, which is in turn subject to the restrictions set forth in the Credit Facilities. See “Dividend Policy.”
The holders of our common stock do not have any preemptive, cumulative voting, subscription, conversion, redemption or sinking fund rights. The common stock is not subject to future calls or assessments by us. The rights and privileges of holders of our common stock are subject to any series of preferred stock that we may issue in the future, as described below.
Our common stock is listed on the NYSE under the symbol “AGL”.
As of June 30, 2021, we had 390,882,560 shares of common stock outstanding and 58 holders of record of common stock.
Preferred Stock
Under our Certificate of Incorporation, our board of directors has the authority, without further action by our stockholders, to issue up to 100,000,000 shares of preferred stock in one or more series and to fix the voting powers, designations, preferences and the relative participating, optional or other special rights and qualifications, limitations and restrictions of each series, including, without limitation, dividend rights, dividend rates, conversion rights, voting rights, terms of redemption, liquidation preferences and the number of shares constituting any series. No shares of our authorized preferred stock are currently outstanding. Because the board of directors will have the power to establish the preferences and rights of the shares of any additional series of preferred stock, it may afford holders of any preferred stock preferences, powers and rights, including voting and dividend rights, senior to the rights of holders of our common stock, which could adversely affect the holders of the common stock and could delay, discourage or prevent a takeover of us even if a change of control of our company would be beneficial to the interests of our stockholders.
171
Annual Stockholders Meeting
Our
By-laws
provide that annual stockholders meetings will be held at a date, time and place, if any, as exclusively selected by our board of directors. To the extent permitted under applicable law, we may conduct meetings by remote communications, including by webcast.Voting
The affirmative vote of a plurality of the shares of our common stock present, in person or by proxy, at the meeting and entitled to vote on the election of directors will decide the election of any directors, and the affirmative vote of a majority of the shares of our common stock present, in person or by proxy, at the meeting and entitled to vote at any annual or special meeting of stockholders will decide all other matters voted on by stockholders, unless the question is one upon which, by express provision of law, under our Certificate of Incorporation, or under our
By-laws,
a different vote is required, in which case such provision will control. Stockholders do not have the right to cumulate their votes for the election of directors.Board Designation Rights
Pursuant to the stockholder agreement, the CD&R Investor has specified board designation and other rights. See “Certain Relationships and Related Party Transactions—Stockholders Agreements.”
Anti-Takeover Effects of Our Certificate of Incorporation and
By-Laws
The provisions of our Certificate of Incorporation and
By-laws
summarized below may have an anti-takeover effect and may delay, defer or prevent a tender offer or takeover attempt that you might consider in your best interest, including an attempt that might result in your receipt of a premium over the market price for your shares. These provisions are also designed, in part, to encourage persons seeking to acquire control of us to first negotiate with our board of directors, which could result in an improvement of their terms.Authorized But Unissued Shares of Common Stock
Authorized But Unissued Shares of Preferred Stock
Classified Board of Directors
172
event may the number of directors be fewer than one. Any additional directorships resulting from an increase in the number of directors will be distributed among the three classes so that, as nearly as possible, each class will consist of
one-third
of the directors. Our Certificate of Incorporation will also provide that any vacancy on our board of directors, including a vacancy resulting from an enlargement of our board of directors, may be filled only by the affirmative vote of a majority of our directorsthen in office, even if less than a quorum, or by a sole remaining director, subject to the CD&R Stockholder Agreement with respect to the director designation rights of the CD&R Investor. Any director elected to fill a vacancy will hold office until such director’s successor shall have been duly elected and qualified or until such director’s earlier death, resignation or removal. Our classified board of directors could have the effect of delaying or discouraging an acquisition of us or a change in our management.
Removal of Directors
Special Meetings of Stockholders
Stockholder Advance Notice Procedure
By-laws
establish an advance notice procedure for stockholders to make nominations of candidates for election as directors or to bring other business before an annual meeting of our stockholders. TheBy-laws
provide that any stockholder wishing to nominate persons for election as directors at, or bring other business before, an annual meeting must deliver to our corporate secretary a written notice of the stockholder’s intention to do so. These provisions may have the effect of precluding the conduct of certain business at a meeting if the proper procedures are not followed. We expect that these provisions may also discourage or deter a potential acquirer from conducting a solicitation of proxies to elect the acquirer’s own slate of directors or otherwise attempting to obtain control of our company. To be timely, the stockholder’s notice must be delivered to our corporate secretary at our principal executive offices not fewer than 90 days nor more than 120 days before the first anniversary date of the annual meeting for the preceding year; provided, however, that in the event that the annual meeting is set for a date that is more than 30 days before or delayed by more than 70 days after the first anniversary date of the preceding year’s annual meeting, a stockholder’s notice must be delivered to our corporate secretary not later than the later of (x) the close of business on the 90th day prior to the meeting or (y) the close of business on the 10th day following the day on which a public announcement of the date of the meeting is first made by us.No Stockholder Action by Written Consent
.
Amendments to Certificate of Incorporation and
By-Laws
173
our Certificate of Incorporation may not be amended, altered or repealed unless the amendment is approved by the affirmative vote of the holders of at least 66 2/3% of the outstanding shares of our common stock then entitled to vote at any annual or special meeting of stockholders, including, but not limited to, the provisions governing:
| • | liability and indemnification of directors; |
| • | corporate opportunities; |
| • | elimination of stockholder action by written consent if the CD&R Investor ceases to beneficially own at least 40% of the outstanding shares of our common stock; |
| • | prohibition on the rights of stockholders to call a special meeting if the CD&R Investor ceases to beneficially own at least 40% of the outstanding shares of our common stock; |
| • | removal of directors for cause if the CD&R Investor ceases to own at least 40% of our outstanding common stock; |
| • | classified board of directors; and |
| • | required approval of the holders of at least 66 2/3% of the outstanding shares of our common stock to amend our By-laws and certain provisions of our Certificate of Incorporation if the CD&R Investor ceases to beneficially own at least 40% of the outstanding shares of our common stock. |
In addition, our
By-laws
may be amended, altered or repealed, or newby-laws
may be adopted, by the affirmative vote of a majority of the board of directors, or by the affirmative vote of the holders of (x) as long as the CD&R Investor beneficially owns at least 40% of the outstanding shares of our common stock, at least a majority, and (y) thereafter, at least 66 2/3%, of the outstanding shares of our common stock then entitled to vote at any annual or special meeting of stockholders.These provisions make it more difficult for any person to remove or amend any provisions in our Certificate of Incorporation and
By-laws
which may have an anti-takeover effect.Delaware Anti-Takeover Law
.
Limitations on Liability and Indemnification
Our Certificate of Incorporation contains provisions relating to the liability of directors. These provisions will eliminate a director’s personal liability for monetary damages resulting from a breach of fiduciary duty, except in circumstances involving:
| • | any breach of the director’s duty of loyalty; |
| • | acts or omissions not in good faith or which involve intentional misconduct or a knowing violation of the law; |
174
| • | unlawful payments of dividends or unlawful stock repurchases, redemptions or other distributions; or |
| • | any transaction from which the director derives an improper personal benefit. |
The principal effect of the limitation on liability provision is that a stockholder will be unable to prosecute an action for monetary damages against a director unless the stockholder can demonstrate a basis for liability for which indemnification is not available under the DGCL. These provisions, however, should not limit or eliminate our rights or any stockholder’s rights to seek
non-monetary
relief, such as an injunction or rescission, in the event of a breach of director’s fiduciary duty. These provisions will not alter a director’s liability under federal securities laws. The inclusion of this provision in our Certificate of Incorporation may discourage or deter stockholders or management from bringing a lawsuit against directors for a breach of their fiduciary duties, even though such an action, if successful, might otherwise have benefited us and our stockholders. In addition, your investment may be adversely affected to the extent we pay costs of settlement and damage awards against directors and officers pursuant to these indemnification provisions.Our Certificate of Incorporation and our
By-laws
require us to indemnify and advance expenses to our directors and officers to the fullest extent not prohibited by the DGCL and other applicable law, except in the case of a proceeding instituted by the director without the approval of our board of directors. Our Certificate of Incorporation and ourBy-laws
provide that we are required to indemnify our directors and executive officers, to the fullest extent permitted by law, for all judgments, fines, settlements, legal fees and other expenses incurred in connection with pending or threatened legal proceedings because of the director’s or officer’s positions with us or another entity that the director or officer serves at our request, subject to various conditions, and to advance funds to our directors and officers to enable them to defend against such proceedings. To receive indemnification, the director or officer must have been successful in the legal proceeding or have acted in good faith and in what was reasonably believed to be a lawful manner in our best interest and, with respect to any criminal proceeding, have had no reasonable cause to believe his or her conduct was unlawful.We are a party to indemnification agreements with our directors. The indemnification agreements provide the directors with contractual rights to indemnification and expense advancement.
Corporate Opportunities
Our Certificate of Incorporation provides that we, on our behalf and on behalf of our subsidiaries, renounce and waive any interest or expectancy in, or in being offered an opportunity to participate in, potential transactions, matters or business opportunities (each, a “corporate opportunity”), that are from time to time presented to the CD&R Investor or any of their officers, directors, employees, agents, stockholders, members, partners, affiliates or subsidiaries (other than us and our subsidiaries), even if the transaction, matter or opportunity is one that we or our subsidiaries might reasonably be deemed to have pursued or had the ability or desire to pursue if granted the opportunity to do so. None of the CD&R Investor or any of their officers, directors, employees, agents, stockholders, members, partners, affiliates or subsidiaries will be liable to us or any of our subsidiaries for breach of any fiduciary or other duty, as a director or otherwise, by reason of the fact that such person pursues, acquires or participates in such corporate opportunity, directs such corporate opportunity to another person or fails to present such corporate opportunity, or information regarding such corporate opportunity, to us or our subsidiaries unless, in the case of any such person who is a director or officer of agilon health, such corporate opportunity is expressly offered to such director or officer in writing solely in his or her capacity as a director or officer of agilon health. To the fullest extent permitted by law, by becoming a stockholder in our company, stockholders will be deemed to have notice of and consented to this provision of our Certificate of Incorporation.
Choice of Forum
Our Certificate of Incorporation provides that, unless we consent in writing to the selection of an alternative forum, the Court of Chancery of the State of Delaware will, to the fullest extent permitted by law, be the sole and
175
exclusive forum for: (i) any derivative action or proceeding brought on our behalf; (ii) any action or proceeding asserting a claim of breach of a fiduciary duty owed to us or our stockholders by any of our directors, officers, other employees, agents or stockholders; (iii) any action or proceeding asserting a claim arising out of or pursuant to or seeking to enforce any right, obligation or remedy under the DGCL or as to which the DGCL confers jurisdiction on the Court of Chancery of the State of Delaware (including, without limitation, any action asserting a claim arising out of or pursuant to our Certificate of Incorporation or our
By-laws);
or (iv) any action or proceeding asserting a claim that is governed by the internal affairs doctrine, in each case subject to such Court of Chancery of the State of Delaware having personal jurisdiction over the indispensable parties named as defendants. Although our Certificate of Incorporation contains the choice of forum provisions described above, it is possible that a court could find that such provision is inapplicable for a particular claim or action or that such provision is unenforceable, and our stockholders will not be deemed to have waived our compliance with the federal securities laws and the rules and regulations thereunder. As permitted by Delaware law, our Certificate of Incorporation provides that, unless we consent in writing to the selection of an alternative forum, the federal district courts of the United States of America will, to the fullest extent permitted by law, be the sole and exclusive forum for the resolution of any complaint asserting a cause of action arising under the Securities Act, the Exchange Act, and the rules and regulations thereunder. To the fullest extent permitted by law, by becoming a stockholder in our company, you will be deemed to have notice of and have consented to the provisions of our Certificate of Incorporation related to choice of forum.Market Listing
Our common stock is listed on the NYSE under the symbol “AGL”.
Transfer Agent and Registrar
The transfer agent and registrar for our common stock is Computershare Trust Company, N.A.
176
SHARES AVAILABLE FOR FUTURE SALE
Our common stock is listed on the NYSE under the symbol “AGL”. Sales of substantial amounts of our common stock in the public market could adversely affect prevailing market prices of our common stock. Some shares of our common stock will not be available for sale for a certain period of time after this offering because they are subject to contractual and legal restrictions on resale, some of which are described below. Sales of substantial amounts of common stock in the public market after these restrictions lapse, or the perception that these sales could occur, could adversely affect the prevailing market price and our ability to raise equity capital in the future.
Sales of Restricted Securities
As of June 30, 2021, adjusted to give effect to this offering, we had 390,882,560 shares of common stock outstanding. Of these shares, all of the 53,590,000 shares sold in our IPO are, and the shares to be sold in this offering will be, immediately tradable without restriction under the Securities Act except for any shares held by “affiliates,” as that term is defined in Rule 144. On April 14, 2021, we filed a registration statement on Form
S-8
under the Securities Act to register the shares of common stock to be issued under our equity compensation plans and, as a result, all shares of common stock acquired upon exercise of stock options granted under our plans are also freely tradable under the Securities Act, subject to the terms of thelock-up
agreements, unless purchased by our affiliates. As of June 30, 2021, there were stock options outstanding to purchase a total of 41,197,388 shares of our common stock. Additionally, 1,112,131 shares of our common stock are issuable pursuant to director and employee RSUs. As of June 30, 2021, 28,453,653 shares of our common stock were reserved for future issuance under our Omnibus Incentive Plan and ESPP. shares of our common stock outstanding as of June 30, 2021, are “restricted securities” within the meaning of Rule 144. Restricted securities may be sold in the public market only if they are registered under the Securities Act or are sold pursuant to an exemption from registration under Rule 144 or Rule 701, which are summarized below. Subject to the
lock-up
agreements described below, shares held by our affiliates that are not restricted securities or that have been owned for more than one year may be sold subject to compliance with Rule 144 without regard to the prescribedone-year
holding period under Rule 144.Stock Options
On April 14, 2021, we filed a registration statement on Form S-8 under the Securities Act to register the shares of common stock to be issued under our stock option plans and, as a result, all shares of common stock acquired upon exercise of stock options and other equity-based awards granted under these plans will, subject to a
180-day
lock-up
period, also be freely tradable under the Securities Act unless purchased by our affiliates. A total of 41,197,388 shares of common stock are subject to outstanding stock options previously granted under our stock incentive plan as of June 30, 2021, and an additional 28,453,653 shares of common stock are available for grants of additional equity awards under stock incentive plans adopted in connection with our IPO.Lock-up
AgreementsIn connection with our IPO, the CD&R Investor, certain of our stockholders and our executive officers and directors entered into lock-up agreements for a period of 180 days after the date of the prospectus for our IPO. In connection with this offering, J.P. Morgan Securities LLC and Goldman Sachs & Co. LLC, as representatives of the several underwriters in our IPO, have agreed to waive the prior lock-up agreements with respect to up to shares (or up to shares including the underwriters’ option to purchase additional shares) of our common stock for the sale by the selling stockholders in this offering, which includes shares beneficially owned by certain of our officers and directors, provided that the waiver is limited to the shares actually sold in this offering. Additionally, in connection with this offering, we and our directors and executive officers and certain stockholders, including certain of the selling stockholders, have entered into
lock-up
agreements, under which we and they have agreed not to, among other things, offer, sell, contract to sell, pledge, sell any option or contract to purchase, purchase any option or contract to sell, grant any option, right or warrant to purchase,177
engage in any hedging or similar transaction or arrangement, lend or otherwise transfer or dispose of, directly or indirectly, any of our securities that are substantially similar to the securities offered hereby, without the prior written consent of J.P. Morgan Securities LLC and Goldman Sachs & Co. LLC, subject to certain exceptions and except as described in the underwriting agreement for a period of 90 days after the date of this prospectus. These agreements are described below under “Underwriting.”
Registration Rights Agreement
The CD&R Investor and its permitted assigns have the right to require us to register shares of common stock for resale in some circumstances. See “Certain Relationships and Related Party Transactions—Registration Rights Agreements.”
Certain other significant stockholders have the right to require us to register shares of common stock for resale in some circumstances. See “Certain Relationships and Related Party Transactions—Registration Rights Agreements.”
Rule 144
In general, under Rule 144, as currently in effect, a person (or persons whose shares are aggregated) who is not deemed to be or have been one of our affiliates for purposes of the Securities Act at any time during 90 days preceding a sale and who has beneficially owned the shares proposed to be sold for at least six months, including the holding period of any prior owner other than an affiliate, is entitled to sell such shares without registration, subject to compliance with the public information requirements of Rule 144. If such a person has beneficially owned the shares proposed to be sold for at least one year, including the holding period of a prior owner other than an affiliate, then such person is entitled to sell such shares without complying with any of the requirements of Rule 144.
In general, under Rule 144, as currently in effect, our affiliates or persons selling shares on behalf of our affiliates, who have met the
six-month
holding period for beneficial ownership of “restricted shares” of our common stock, are entitled to sell within any three-month period, a number of shares that does not exceed the greater of:| • | 1% of the number of shares of our common stock then outstanding, which will equal approximately 3,908,825 shares immediately after this offering; and |
| • | the average reported weekly trading volume of our common stock on the NYSE during the four calendar weeks preceding the date of filing a Notice of Proposed Sale of Securities Pursuant to Rule 144 with respect to the sale. |
Sales under Rule 144 by our affiliates or persons selling shares on behalf of our affiliates are also subject to certain manner of sale provisions and notice requirements and to the availability of current public information about us. The sale of these shares, or the perception that sales will be made, could adversely affect the price of our common stock after this offering because a great supply of shares would be, or would be perceived to be, available for sale in the public market.
Rule 701
Any of our employees, officers or directors who acquired shares under a written compensatory plan or contract may be entitled to sell them in reliance on Rule 701. Rule 701 permits affiliates to sell their Rule 701 shares under Rule 144 without complying with the holding period requirements of Rule 144. Rule 701 further provides that
non-affiliates
may sell these shares in reliance on Rule 144 without complying with the holding period, public information, volume limitation or notice provisions of Rule 144.178
Partner Physician Group Equity Agreements
In connection with our entry into arrangements with anchor physician groups, we have historically entered into partner physician group equity agreements pursuant to which such anchor physician groups are entitled to receive equity in their local RBE or agilon health if certain conditions are satisfied. See “Business—Reimbursement Model and Organization” and “Management’s Discussion and Analysis of Financial Condition and Results of Operations—Critical Accounting Estimates—Stock-based Compensation” for additional information.
179
DESCRIPTION OF CERTAIN INDEBTEDNESS
Secured Credit Facilities
On February 18, 2021, agilon health management, inc. entered into a credit agreement by and among agilon health management, inc., Intermediate Holdings, the Lenders party thereto, the Issuers party thereto, JPMorgan Chase Bank, N.A., as administrative agent and as collateral agent, and JPMorgan Chase Bank, N.A., and Bank of America, N.A., Wells Fargo Securities, LLC, Deutsche Bank Securities Inc., and Nomura Securities International, Inc., as joint lead arrangers and joint bookrunners (as amended by First Amendment to Credit Agreement, dated as of March 1, 2021, the “2021 Secured Credit Agreement”) governing agilon health management, inc.’s 2021 Secured Credit Facilities. The 2021 Secured Credit Agreement refinanced our indebtedness under the Credit Facilities, and the Secured Credit Agreement and Unsecured Credit Agreement were terminated.
The borrower under the 2021 Secured Credit Facilities is agilon health management, inc. The 2021 Secured Credit Facilities consist of (i) a senior secured term loan facility (the “2021 Secured Term Loan Facility”) in an aggregate principal amount of $100.0 million and (ii) a senior secured revolving credit facility (the “2021 Secured Revolving Facility”) in an aggregate principal amount of $100.0 million. As of February 18, 2021, $100.0 million was outstanding under the 2021 Secured Term Loan Facility and availability under the 2021 Secured Revolving Facility was $81.5 million. The final maturity date of the Secured Term Loan Facility and the Secured Revolving Facility is February 18, 2026. In addition, however, each of the 2021 Secured Term Loan Facility and the 2021 Secured Revolving Facility allows individual lenders to extend the maturity date of their loans upon the request of the Borrower and without the consent of any other lender, subject to specified conditions.
Subject to specified conditions and receipt of commitments, the 2021 Secured Term Loan Facility may be expanded (or a new term loan facility, revolving credit facility or letter of credit facility added) by up to (i) $50.0 million plus (ii) an additional amount determined in accordance with a formula tied to repayment of certain indebtedness of the Company.
Interest Rates and Fees
At our option, borrowings under the 2021 Secured Credit Facilities, as defined in the credit agreement, can be either: (i) LIBO Rate Loans or (ii) Base Rate Loans. LIBO Rate Loans bear interest at a rate equal to the sum of 4.00% (stepping down to 3.50% on and following October 1, 2023) and the higher of (a) LIBO, as defined in the credit agreement, and (b) 0%. Base Rate Loans bear interest at a rate equal to the sum of 3.00% (stepping down to 2.50% on and following October 1, 2023) and the highest of: (a) 0.50% in excess of the overnight federal funds rate, (b) the prime rate established by the administrative agent from time to time, (c) the one-month LIBO rate (adjusted for maximum reserves) plus 1.00% and (d) 0%. Additionally, we pay a commitment fee on the unfunded 2021 Revolving Credit Facility amount of 0.50% (stepping down to 0.375% on and following October 1, 2023). We must also pay customary letter of credit fees.
Prepayments
The 2021 Secured Term Loan Facility is subject to mandatory prepayment and reduction in an amount equal to (a) because our IPO generated total gross proceeds in excess of $1.0 billion, an amount equal to $50.0 million (b) 50% of agilon management’s excess cash flow (as defined in the 2021 Secured Credit Agreement), with a reduction to 0% based upon achievement of a leverage ratio of less than 2.50:1.00, (c) 100% of the net cash proceeds received from the incurrence of indebtedness by agilon management or any of its restricted subsidiaries (other than indebtedness permitted under the 2021 Secured Credit Facilities) and (d) 100% of the net cash proceeds of all
non-ordinary
course asset sales or other dispositions of property by agilon management and its restricted subsidiaries (including certain insurance and condemnation proceeds) in excess of a certain amount180
and subject to the right of agilon management and its restricted subsidiaries to reinvest such proceeds within a specified period of time, and certain other exceptions. The 2021 Secured Revolving Facility is also subject to mandatory prepayment and to the extent that the aggregate amount of any outstanding revolving loans and letter of credit obligations exceed the aggregate amount of the commitments under the 2021 Secured Revolving Facility, subject to certain qualifications. On April 19, 2021, we completed our initial public offering. As the gross proceeds from the offering exceeded $1.0 billion, we repaid $50.0 million of the 2021 Secured Term Loan Facility on April 26, 2021.
Voluntary prepayments of borrowings under the 2021 Secured Term Loan Facility and 2021 Secured Revolving Facility are permitted at any time, subject to minimum principal amount requirements. Voluntary prepayments of borrowings under the 2021 Secured Term Loan Facility are also subject to reimbursement of the lenders’ redeployment costs actually incurred in the case of a prepayment of LIBOR rate borrowings other than on the last day of the relevant interest period.
Guarantee; Security
All obligations under the 2021 Secured Credit Facilities are guaranteed by each domestic subsidiary of agilon management other than certain excluded subsidiaries, as well as by Intermediate Holdings. All obligations of agilon management and each guarantor are secured by a perfected security interest in substantially all tangible and intangible assets of agilon management and each such guarantor, including the capital stock of each domestic subsidiary of agilon management and each such guarantor, and 65% of each series of capital stock of any non U.S. subsidiary held directly by agilon management or any guarantor, subject to certain exceptions.
Covenants, Representations and Warranties
The 2021 Secured Credit Agreement contains certain representations and warranties and certain affirmative and negative covenants. The negative covenants contain certain limitations, including with respect to the following: the incurrence of additional indebtedness; payment of dividends on, redemption or repurchase of stock or making of other distributions in respect of capital stock; making investments; repurchase, prepayment or redemption of subordinated indebtedness; agreeing to payment restrictions affecting the ability of agilon management’s restricted subsidiaries to pay dividends to agilon management or make other intercompany transfers; incurrence of additional liens; transfer or sale of assets; consolidation, merger, sale or other disposition of all or substantially all of our assets; entering into certain transactions with affiliates; designation of any subsidiary as an unrestricted subsidiary; modifying the existing tax sharing agreement; changing the nature of agilon management’s business and making of negative pledges. The negative covenants are subject to certain customary exceptions.
The 2021 Secured Credit Agreement also contains certain financial covenants, requiring agilon health management, inc. to (a) not permit its leverage ratio (i) for the fiscal quarter ending March 31, 2021 and until (and including) the fiscal quarter ending September 30, 2022, to exceed 4.00:1.00, (ii) for the fiscal quarter ending December 31, 2022 and until (and including) the fiscal quarter ending September 30, 2023, to exceed 3.00:1.00, (iii) for the fiscal quarter ending December 31, 2023 and until (and including) the fiscal quarter ending September 30, 2024, to exceed 5.00:1.00, (iv) for the fiscal quarter ending December 31, 2024 and until (and including) the fiscal quarter ending September 30, 2024, to exceed 4.25:1.00 and (v) for the fiscal quarter ending December 31, 2025 and all subsequent fiscal quarters thereafter, to exceed 3.50:1.00 and (b) commencing with the fiscal quarter ending March 31, 2021 and until the consummation of this offering (so long as this offering generates total gross proceeds in excess of $500.0 million) (but excluding any fiscal quarter ending thereafter), a minimum liquidity amount of $50 million and a minimum availability under the 2021 Secured Revolving Facility of $10 million.
181
Events of Default
Events of default under the 2021 Secured Credit Agreement are limited to nonpayment of principal when due, nonpayment of interest, fees or other amounts, inaccuracy of representations or warranties in any material respect, violation of other covenants, cross default to other material debt, certain bankruptcy or insolvency events, certain U.S. Employee Retirement Income Security Act of 1974, as amended (“ERISA”) events, certain material judgments, actual or asserted invalidity of material guarantees or security interests, asserted invalidity or contest of the validity of any intercreditor agreement or pledge and security agreement, and change of control, in each case subject to certain thresholds, notice and grace period provisions.
182
CERTAIN U.S. FEDERAL INCOME TAX CONSIDERATIONS FOR
NON-U.S.
HOLDERSThe following is a discussion of certain U.S. federal income tax considerations relating to the purchase, ownership and disposition of our common stock by
Non-U.S.
Holders (as defined below) that purchase our common stock pursuant to this offering and hold such common stock as a capital asset. This discussion is based on the U.S. Internal Revenue Code of 1986, as amended (the “Code”), U.S. Treasury regulations promulgated or proposed thereunder, and administrative and judicial interpretations thereof, all as in effect on the date hereof and all of which are subject to change, possibly with retroactive effect, or to different interpretation. This discussion does not address all of the U.S. federal income tax considerations that may be relevant to specificNon-U.S.
Holders in light of their particular circumstances or toNon-U.S.
Holders subject to special treatment under U.S. federal income tax law (such as banks, insurance companies, dealers in securities or otherNon-U.S.
Holders that generally mark their securities to market for U.S. federal income tax purposes, foreign governments, international organizations,tax-exempt
entities, certain former citizens or residents of the United States, orNon-U.S.
Holders that hold our common stock as part of a straddle, hedge, conversion or other integrated transaction). This discussion does not address any U.S. state or local ornon-U.S.
tax considerations or any U.S. federal gift or alternative minimum tax considerations.As used in this discussion, the term
“Non-U.S.
Holder” means a beneficial owner of our common stock that, for U.S. federal income tax purposes, is:| • | an individual who is neither a citizen nor a resident of the United States; |
| • | a corporation that is not created or organized in or under the laws of the United States, any state thereof or the District of Columbia; |
| • | an estate that is not subject to U.S. federal income tax on income from non-U.S. sources that is not effectively connected with the conduct of a trade or business in the United States; or |
| • | a trust unless (i) a court within the United States is able to exercise primary supervision over its administration and one or more U.S. persons have the authority to control all of its substantial decisions or (ii) it has in effect a valid election under applicable U.S. Treasury regulations to be treated as a U.S. person. |
If an entity treated as a partnership for U.S. federal income tax purposes invests in our common stock, the U.S. federal income tax considerations relating to such investment will depend in part upon the status and activities of such entity and the particular partner. Any such entity should consult its own tax advisor regarding the U.S. federal income tax considerations applicable to it and its partners relating to the purchase, ownership and disposition of our common stock.
PERSONS CONSIDERING AN INVESTMENT IN OUR COMMON STOCK SHOULD CONSULT THEIR OWN TAX ADVISORS REGARDING THE U.S. FEDERAL, STATE AND LOCAL AND
NON-U.S.
INCOME, ESTATE AND OTHER TAX CONSIDERATIONS RELATING TO THE PURCHASE, OWNERSHIP AND DISPOSITION OF OUR COMMON STOCK IN LIGHT OF THEIR PARTICULAR CIRCUMSTANCES.Distributions on Common Stock
If we make a distribution of cash or other property (other than certain pro rata distributions of our common stock or rights to acquire our common stock) with respect to a share of our common stock, the distribution generally will be treated as a dividend to the extent it is paid from our current or accumulated earnings and profits (as determined under U.S. federal income tax principles). If the amount of such distribution exceeds our current and accumulated earnings and profits, such excess generally will be treated first as a
tax-free
return of capital to the extent of theNon-U.S.
Holder’s adjusted tax basis in such share of our common stock, and then as capital gain (which will be treated in the manner described below under “—Sale, Exchange or Other Disposition183
of Common Stock”). Distributions treated as dividends on our common stock that are paid to or for the account of arequired to claim benefits under such tax treaty to the applicable withholding agent. Even if our current or accumulated earnings and profits are less than the amount of the distribution, the applicable withholding agent may elect to treat the entire distribution as a dividend for U.S. federal withholding tax purposes. Each
Non-U.S.
Holder generally will be subject to U.S. federal withholding tax at a rate of 30%, or at a lower rate if provided by an applicable tax treaty and theNon-U.S.
Holder provides the documentation (generally, Internal Revenue Service (“IRS”) FormW-8BEN
orW-8BEN-E)
Non-U.S.
Holder should consult its own tax advisor regarding U.S. federal withholding tax on distributions, including suchNon-U.S.
Holder’s eligibility for a lower rate and the availability of a refund of any excess U.S. federal tax withheld.If, however, a dividend is effectively connected with the conduct of a trade or business in the United States by a
Non-U.S.
Holder, such dividend generally will not be subject to the 30% U.S. federal withholding tax if suchNon-U.S.
Holder provides the appropriate documentation (generally, IRS FormW-8ECI)
to the applicable withholding agent. Instead, suchNon-U.S.
Holder generally will be subject to U.S. federal income tax on such dividend in substantially the same manner as a U.S. person (except as provided by an applicable tax treaty). In addition, aNon-U.S.
Holder that is treated as a corporation for U.S. federal income tax purposes may be subject to a branch profits tax at a rate of 30% (or a lower rate if provided by an applicable tax treaty) on its effectively connected income for the taxable year, subject to certain adjustments.The foregoing discussion is subject to the discussion below under “—FATCA Withholding” and “—Information Reporting and Backup Withholding.”
Sale, Exchange or Other Disposition of Common Stock
A
Non-U.S.
Holder generally will not be subject to U.S. federal income tax on any gain recognized on the sale, exchange or other disposition of our common stock unless:(i) such gain is effectively connected with the conduct of a trade or business in the United States by such
Non-U.S.
Holder, in which event suchNon-U.S.
Holder generally will be subject to U.S. federal income tax on such gain in substantially the same manner as a U.S. person (except as provided by an applicable tax treaty) and, if it is treated as a corporation for U.S. federal income tax purposes, may also be subject to a branch profits tax at a rate of 30% (or a lower rate if provided by an applicable tax treaty), subject to certain adjustments;(ii) such
Non-U.S.
Holder is an individual who is present in the United States for 183 days or more during the taxable year of such sale, exchange or other disposition and certain other conditions are met, in which event such gain (net of certain U.S. source losses) generally will be subject to U.S. federal income tax at a rate of 30% (except as provided by an applicable tax treaty); or(iii) we are or have been a “United States real property holding corporation” for U.S. federal income tax purposes at any time during the shorter of (x) the five-year period ending on the date of such sale, exchange or other disposition and (y) such
Non-U.S.
Holder’s holding period with respect to such common stock, and certain other conditions are met.Generally, a corporation is a “United States real property holding corporation” if the fair market value of its United States real property interests equals or exceeds 50% of the sum of the fair market value of its worldwide real property interests and its other assets used or held for use in a trade or business (all as determined for U.S. federal income tax purposes). We believe that we presently are not, and we do not presently anticipate that we will become, a United States real property holding corporation. However, because this determination is made from time to time and is dependent upon a number of factors, some of which are outside our control, including the value of our assets, there can be no assurance that we will not become a United States real property holding corporation. If we were a United States real property holding corporation during the period described in clause (iii) above, gain recognized by a
Non-U.S.
Holder generally would be treated as income effectively connected184
with the conduct of a trade or business in the United States by such
Non-U.S.
Holder, with the consequences described in clause (i) above (except that the branch profits tax would not apply), unless suchNon-U.S.
Holder owned (directly and constructively) five percent or less of our common stock throughout such period and our common stock is treated as “regularly traded on an established securities market” at any time during the calendar year of such sale, exchange or other disposition.The foregoing discussion is subject to the discussion below under “—FATCA Withholding” and “—Information Reporting and Backup Withholding.”
FATCA Withholding
Under the Foreign Account Tax Compliance Act provisions of the Code and related U.S. Treasury guidance (“FATCA”) a withholding tax of 30% will be imposed in certain circumstances on payments of dividends on our common stock. In the case of payments made to a “foreign financial institution” (such as a bank, a broker, an investment fund or, in certain cases, a holding company), as a beneficial owner or as an intermediary, this tax generally will be imposed, subject to certain exceptions, unless such institution (i) has agreed to (and does) comply with the requirements of an agreement with the United States (an “FFI Agreement”) or (ii) is required by (and does comply with) applicable foreign law enacted in connection with an intergovernmental agreement between the United States and a foreign jurisdiction (an “IGA”) to, among other things, collect and provide to the U.S. tax authorities or other relevant tax authorities certain information regarding U.S. account holders of such institution and, in either case, such institution provides the withholding agent with a certification as to its FATCA status. In the case of payments made to a foreign entity that is not a financial institution (as a beneficial owner), the tax generally will be imposed, subject to certain exceptions, unless such entity provides the withholding agent with a certification as to its FATCA status and, in certain cases, identifies any “substantial” U.S. owner (generally, any specified U.S. person that directly or indirectly owns more than a specified percentage of such entity). If our common stock is held through a foreign financial institution that has agreed to comply with the requirements of an FFI Agreement or is subject to similar requirements under applicable foreign law enacted in connection with an IGA, such foreign financial institution (or, in certain cases, a person paying amounts to such foreign financial institution) generally will be required, subject to certain exceptions, to withhold tax on payments made to (i) a person (including an individual) that fails to provide any required information or documentation or (ii) a foreign financial institution that has not agreed to comply with the requirements of an FFI Agreement and is not subject to similar requirements under applicable foreign law enacted in connection with an IGA. Each
Non-U.S.
Holder should consult its own tax advisor regarding the application of FATCA to our common stock.Information Reporting and Backup Withholding
Distributions on our common stock made to a
Non-U.S.
Holder and the amount of any U.S. federal tax withheld from such distributions generally will be reported annually to the IRS and to suchNon-U.S.
Holder by the applicable withholding agent.The information reporting and backup withholding rules that apply to payments of dividends to certain U.S. persons generally will not apply to payments of dividends on our common stock to ato the applicable withholding agent) or otherwise establishes an exemption.
Non-U.S.
Holder if suchNon-U.S.
Holder certifies under penalties of perjury that it is not a U.S. person (generally by providing an IRS FormW-8BEN
orW-8BEN-E
Proceeds from the sale, exchange or other disposition of our common stock by a
Non-U.S.
Holder effected outside the United States through anon-U.S.
office of anon-U.S.
broker generally will not be subject to the information reporting and backup withholding rules that apply to payments to certain U.S. persons, provided that the proceeds are paid to theNon-U.S.
Holder outside the United States. However, proceeds from the sale, exchange or other disposition of our common stock by aNon-U.S.
Holder effected through anon-U.S.
office of anon-U.S.
broker with certain specified U.S. connections or of a U.S. broker generally will be subject to these185
information reporting rules (but generally not to these backup withholding rules), even if the proceeds are paid to suchto the applicable withholding agent) or otherwise establishes an exemption. Proceeds from the sale, exchange or other disposition of our common stock by ato the applicable withholding agent) or otherwise establishes an exemption.
Non-U.S.
Holder outside the United States, unless suchNon-U.S.
Holder certifies under penalties of perjury that it is not a U.S. person (generally by providing an IRS FormW-8BEN
orW-8BEN-E
Non-U.S.
Holder effected through a U.S. office of a broker generally will be subject to these information reporting and backup withholding rules unless suchNon-U.S.
Holder certifies under penalties of perjury that it is not a U.S. person (generally by providing an IRS FormW-8BEN
orW-8BEN-E
Backup withholding is not an additional tax. Any amounts withheld under the backup withholding rules generally will be allowed as a refund or a credit against a
Non-U.S.
Holder’s U.S. federal income tax liability if the required information is furnished by suchNon-U.S.
Holder on a timely basis to the IRS.U.S. Federal Estate Tax
Shares of our common stock owned or treated as owned by an individual
Non-U.S.
Holder at the time of suchNon-U.S.
Holder’s death will be included in suchNon-U.S.
Holder’s gross estate for U.S. federal estate tax purposes and may be subject to U.S. federal estate tax unless an applicable estate tax treaty provides otherwise.186
UNDERWRITING
The selling stockholders are offering the shares of common stock described in this prospectus through a number of underwriters. J.P. Morgan Securities LLC and Goldman Sachs & Co. LLC are acting as bookrunning managers of the offering and representatives of the underwriters. The selling stockholders will enter into an underwriting agreement with the underwriters. Subject to the terms and conditions of the underwriting agreement, the selling stockholders have agreed to sell to the underwriters, and each underwriter has severally agreed to purchase, at the public offering price less the underwriting discounts and commissions set forth on the cover page of this prospectus, the number of shares of common stock listed next to its name in the following table:
Underwriter | Number of Shares | |||
J.P. Morgan Securities LLC | ||||
Goldman Sachs & Co. LLC | ||||
Total | ||||
The underwriters are committed to purchase all the common shares offered by the selling stockholders if they purchase any shares, other than those shares covered by the underwriters’ option to purchase additional shares described below. The underwriting agreement also provides that if an underwriter defaults, the purchase commitments of
non-defaulting
underwriters may also be increased or the offering may be terminated.The underwriters have an option to buy on a pro rata basis up to additional shares of common stock from the selling stockholders at the public offering price less the underwriting discounts and commissions to cover sales of shares by the underwriters which exceed the number of shares specified in the table above. The underwriters have 30 days from the date of this prospectus to exercise this option. If any additional shares of common stock are purchased, the underwriters will offer the additional shares on the same terms as those on which the shares are being offered.
The underwriters propose to offer the common shares directly to the public at the public offering price set forth on the cover page of this prospectus and to certain dealers at that price less a concession not in excess of $ per share. After the public offering of the shares, the offering price and other selling terms may be changed by the underwriters. The offering of the shares by the underwriters is subject to receipt and acceptance and subject to the underwriters’ right to reject any order in whole or in part. The underwriters may offer and sell the shares through certain of their affiliates or other registered broker-dealers or selling agents. Sales of shares made outside of the United States may be made by affiliates of the underwriters.
The underwriting fee is the difference between the public offering price and the amount the underwriters pay the selling stockholders for the shares of common stock. The underwriting fee is $ per share. The following table summarizes the per share and total underwriting discounts and commissions the selling stockholders will pay to the underwriters. These amounts are shown assuming both no exercise and full exercise of the underwriters’ option to purchase additional shares of common stock from the selling stockholders.
Per Share | Total | |||||||||||||||
No Exercise | Full Exercise | No Exercise | Full Exercise | |||||||||||||
Public offering price | $ | $ | $ | $ | ||||||||||||
Underwriting discounts and commissions borne by the selling stockholders | $ | $ | $ | $ | ||||||||||||
We estimate that the total expenses of this offering, including registration, filing and listing fees, printing fees and legal and accounting expenses, but excluding the underwriting discounts and commissions, are approximately $ million. The selling stockholders will bear the underwriting commissions and discounts attributable to their sale of our common stock.
187
A prospectus in electronic format may be made available on the websites maintained by one or more underwriters, or selling group members, if any, participating in the offering. The underwriters may agree to allocate a number of shares to underwriters and selling group members for sale to their online brokerage account holders. Internet distributions will be allocated by the representative to underwriters and selling group members that may make internet distributions on the same basis as other allocations.
We have agreed that we will not (i) offer, sell, contract to sell, pledge, sell any option or contract to purchase, purchase any option or contract to sell, grant any option, right or warrant to purchase, engage in hedging or similar transaction or arrangement, lend or otherwise transfer or dispose of, directly or indirectly, except as provided in the underwriting agreement, any of our securities that are substantially similar to the securities offered hereby, including but not limited to any options or warrants to purchase shares of our common stock or any securities that are convertible into or exchangeable for, or that represent the right to receive, shares of our common stock or any such substantially similar securities, or (ii) enter into any swap or other agreement that transfers, in whole or in part, any of the economic consequences of ownership of our common stock or any such other securities (regardless of whether any of these transactions are to be settled by the delivery of our common stock or such other securities, in cash or otherwise), in each case without the prior written consent of J.P. Morgan Securities LLC and Goldman Sachs & Co. LLC for a period of 90 days after the date of this prospectus, subject to certain limited exceptions set forth in the underwriting agreement.
Our directors, executive officers and certain stockholders, including certain of the selling stockholders have entered into
lock-up
agreements with the underwriters prior to the commencement of this offering pursuant to which each of these persons or entities, for a period of 90 days after the date of this prospectus, may not, without the prior written consent of J.P. Morgan Securities LLC and Goldman Sachs & Co. LLC, offer, sell, contract to sell, pledge, sell any option or contract to purchase, purchase any option or contract to sell, grant any option, right or warrant to purchase, engage in hedging or similar transaction or arrangement, lend or otherwise transfer or dispose of, directly or indirectly, any of our securities that are substantially similar to the securities offered hereby, including but not limited to any options or warrants to purchase shares of our common stock or any securities that are convertible into or exchangeable for, or that represent the right to receive, shares of our common stock or any such substantially similar securities, subject to certain exceptions.We and the selling stockholders have agreed to indemnify the several underwriters against certain liabilities, including liabilities under the Securities Act, or contribute payments that the underwriters may be required to make in that respect.
Our common stock is listed on the NYSE under the symbol “AGL”.
The underwriters have advised us and the selling stockholders that, in connection with this offering, the underwriters may engage in stabilizing transactions, which involves making bids for, purchasing and selling shares of common stock in the open market for the purpose of preventing or retarding a decline in the market price of the common stock while this offering is in progress. These stabilizing transactions may include making short sales of the common stock, which involves the sale by the underwriters of a greater number of shares of common stock than they are required to purchase in this offering, and purchasing shares of common stock on the open market to cover positions created by short sales. Short sales may be “covered” shorts, which are short positions in an amount not greater than the underwriters’ option to purchase additional shares referred to above, or may be “naked” shorts, which are short positions in excess of that amount. The underwriters may close out any covered short position either by exercising their option to purchase additional shares, in whole or in part, or by purchasing shares in the open market. In making this determination, the underwriters will consider, among other things, the price of shares available for purchase in the open market compared to the price at which the underwriters may purchase shares through the option to purchase additional shares. A naked short position is more likely to be created if the underwriters are concerned that there may be downward pressure on the price of the common stock in the open market that could adversely affect investors who purchase in this offering. To the extent that the underwriters create a naked short position, they will purchase shares in the open market to cover the position.
188
The underwriters have advised us that, pursuant to Regulation M of the Securities Act, they may also engage in other activities that stabilize, maintain or otherwise affect the price of the common stock, including the imposition of penalty bids. This means that if the representative of the underwriters purchases common stock in the open market in stabilizing transactions or to cover short sales, the representative can require the underwriters that sold those shares as part of this offering to repay the underwriting discount received by them.
These activities may have the effect of raising or maintaining the market price of the common stock or preventing or retarding a decline in the market price of the common stock, and, as a result, the price of the common stock may be higher than the price that otherwise might exist in the open market. If the underwriters commence these activities, they may discontinue them at any time. The underwriters may carry out these transactions on the NYSE, in themarket or otherwise.
over-the-counter
Selling Restrictions
General
Other than in the United States, no action has been taken by us, the selling stockholders or the underwriters that would permit a public offering of the securities offered by this prospectus in any jurisdiction where action for that purpose is required. The securities offered by this prospectus may not be offered or sold, directly or indirectly, nor may this prospectus or any other offering material or advertisements in connection with the offer and sale of any such securities be distributed or published in any jurisdiction, except under circumstances that will result in compliance with the applicable rules and regulations of that jurisdiction. Persons into whose possession this prospectus comes are advised to inform themselves about and to observe any restrictions relating to the offering and the distribution of this prospectus. This prospectus does not constitute an offer to sell or a solicitation of an offer to buy any securities offered by this prospectus in any jurisdiction in which such an offer or a solicitation is unlawful.
Notice to Prospective Investors in the European Economic Area
In relation to each Member State of the European Economic Area (each a “Member State”), no shares have been offered or will be offered pursuant to the offering to the public in that Member State prior to the publication of a prospectus in relation to the shares which has been approved by the competent authority in that Member State or, where appropriate, approved in another Member State and notified to the competent authority in that Member State, all in accordance with the Prospectus Regulation, except that offers of shares may be made to the public in that Member State at any time under the following exemptions under the Prospectus Regulation:
(a) to any legal entity which is a qualified investor as defined under the Prospectus Regulation;
(b) to fewer than 150 natural or legal persons (other than qualified investors as defined under the Prospectus Regulation), subject to obtaining the prior consent of the underwriters; or
(c) in any other circumstances falling within Article 1(4) of the Prospectus Regulation,
provided
non-discretionary
basis on behalf of, nor have they been acquired with a view to their offer or resale to, persons in circumstances which may give rise to an offer of any shares to the public other than their offer or resale in a Member State to qualified investors as so defined or in circumstances in which the prior consent of the underwriters has been obtained to each such proposed offer or resale.189
For the purposes of this provision, the expression an “offer to the public” in relation to shares in any Member State means the communication in any form and by any means of sufficient information on the terms of the offer and any shares to be offered so as to enable an investor to decide to purchase or subscribe for any shares, and the expression “Prospectus Regulation” means Regulation (EU) 2017/1129.
Notice to Prospective Investors in the United Kingdom
In relation to the United Kingdom, no shares have been offered or will be offered pursuant to the offering to the public in the United Kingdom prior to the publication of a prospectus in relation to the shares that has been approved by the Financial Conduct Authority in accordance with the transitional provisions in Regulation 74 of the Prospectus (Amendment etc.) (EU exit) Regulations 2019, except that offers of shares may be made to public in the United Kingdom at any time under the following exemptions under Regulation (EU) 2017/1129, as amended, as it forms part of domestic law by virtue of the European Union (Withdrawal) Act 2018 (the “UK Prospectus Regulation”):
(a) to any legal entity which is a qualified investor as defined under the UK Prospectus Regulation;
(b) to fewer than 150 natural or legal persons (other than qualified investors as defined under the UK Prospectus Regulation), subject to obtaining the prior consent of the underwriters; or
(c) in any other circumstances falling within section 86 of the Financial Services and Markets Act 2000 (as amended, the “FSMA”)
provided
For the purposes of this provision, the expression an “offer to the public” in relation to shares in the United Kingdom means the communication in any form and by any means of sufficient information on the terms of the offer and any shares to be offered so as to enable an investor to decide to purchase or subscribe for any shares.
In the United Kingdom, this document is being distributed only to, and is directed only at, and any offer subsequently made may only be directed at persons who are “qualified investors” (as defined in the UK Prospectus Regulation) (i) who have professional experience in matters relating to investments falling within Article 19(5) of the Financial Services and Markets Act 2000 (Financial Promotion) Order 2005, as amended (the “Order”) and/or (ii) who are high net worth companies (or persons to whom it may otherwise be lawfully communicated) falling within Article 49(2)(a) to (d) of the Order (all such persons together being referred to as “relevant persons”) or otherwise in circumstances which have not resulted and will not result in an offer to the public of the shares in the United Kingdom within the meaning of the FSMA.
Any person in the United Kingdom that is not a relevant person should not act or rely on the information included in this document or use it as basis for taking any action. In the United Kingdom, any investment or investment activity that this document relates to may be made or taken exclusively by relevant persons.
Notice to Prospective Investors in Canada
The shares may be sold only to purchasers purchasing, or deemed to be purchasing, as principal that are accredited investors, as defined in National Instrument
45-106
Prospectus Exemptions or subsection 73.3(1) of the Securities Act (Ontario), and are permitted clients, as defined in National Instrument31-103
Registration Requirements, Exemptions and Ongoing Registrant Obligations. Any resale of the shares must be made in accordance with an exemption from, or in a transaction not subject to, the prospectus requirements of applicable securities laws.Securities legislation in certain provinces or territories of Canada may provide a purchaser with remedies for rescission or damages if this prospectus (including any amendment thereto) contains a misrepresentation,
190
provided that the remedies for rescission or damages are exercised by the purchaser within the time limit prescribed by the securities legislation of the purchaser’s province or territory. The purchaser should refer to any applicable provisions of the securities legislation of the purchaser’s province or territory for particulars of these rights or consult with a legal advisor.
Pursuant to section 3A.3 of National Instrument
33-105
Underwriting Conflicts (NI33-105),
the underwriters are not required to comply with the disclosure requirements of NI33-105
regarding underwriter conflicts of interest in connection with this offering.Notice to Prospective Investors in Switzerland
The shares may not be publicly offered in Switzerland and will not be listed on the SIX Swiss Exchange (“SIX”) or on any other stock exchange or regulated trading facility in Switzerland. This document does not constitute a prospectus within the meaning of, and has been prepared without regard to the disclosure standards for issuance prospectuses under art. 652a or art. 1156 of the Swiss Code of Obligations or the disclosure standards for listing prospectuses under art. 27 ff. of the SIX Listing Rules or the listing rules of any other stock exchange or regulated trading facility in Switzerland. Neither this document nor any other offering or marketing material relating to the shares or the offering may be publicly distributed or otherwise made publicly available in Switzerland.
Neither this document nor any other offering or marketing material relating to the offering, the Company or the shares has been or will be filed with or approved by any Swiss regulatory authority. In particular, this document will not be filed with, and the offer of shares will not be supervised by, the Swiss Financial Market Supervisory Authority FINMA, and the offer of shares has not been and will not be authorized under the Swiss Federal Act on Collective Investment Schemes (“CISA”). The investor protection afforded to acquirers of interests in collective investment schemes under the CISA does not extend to acquirers of shares.
Notice to Prospective Investors in the Dubai International Financial Centre (“DIFC”)
This document relates to an Exempt Offer in accordance with the Markets Rules 2012 of the Dubai Financial Services Authority (“DFSA”). This document is intended for distribution only to persons of a type specified in the Markets Rules 2012 of the DFSA. It must not be delivered to, or relied on by, any other person. The DFSA has no responsibility for reviewing or verifying any documents in connection with Exempt Offers. The DFSA has not approved this prospectus supplement nor taken steps to verify the information set forth herein and has no responsibility for this document. The securities to which this document relates may be illiquid and/or subject to restrictions on their resale. Prospective purchasers of the securities offered should conduct their own due diligence on the securities. If you do not understand the contents of this document you should consult an authorized financial advisor.
In relation to its use in the DIFC, this document is strictly private and confidential and is being distributed to a limited number of investors and must not be provided to any person other than the original recipient, and may not be reproduced or used for any other purpose. The interests in the securities may not be offered or sold directly or indirectly to the public in the DIFC.
Notice to Prospective Investors in the United Arab Emirates
The shares have not been, and are not being, publicly offered, sold, promoted or advertised in the United Arab Emirates (including the Dubai International Financial Centre) other than in compliance with the laws of the United Arab Emirates (and the Dubai International Financial Centre) governing the issue, offering and sale of securities. Further, this prospectus does not constitute a public offer of securities in the United Arab Emirates (including the Dubai International Financial Centre) and is not intended to be a public offer. This prospectus has not been approved by or filed with the Central Bank of the United Arab Emirates, the Securities and Commodities Authority or the Dubai Financial Services Authority.
191
Notice to Prospective Investors in Australia
This prospectus:
| • | does not constitute a disclosure document or a prospectus under Chapter 6D.2 of the Corporations Act 2001 (Cth) (the “Corporations Act”); |
| • | has not been, and will not be, lodged with the Australian Securities and Investments Commission (“ASIC”), as a disclosure document for the purposes of the Corporations Act and does not purport to include the information required of a disclosure document for the purposes of the Corporations Act; and |
| • | may only be provided in Australia to select investors who are able to demonstrate that they fall within one or more of the categories of investors, available under section 708 of the Corporations Act (“Exempt Investors”). |
The shares may not be directly or indirectly offered for subscription or purchased or sold, and no invitations to subscribe for or buy the shares may be issued, and no draft or definitive offering memorandum, advertisement or other offering material relating to any shares may be distributed in Australia, except where disclosure to investors is not required under Chapter 6D of the Corporations Act or is otherwise in compliance with all applicable Australian laws and regulations. By submitting an application for the shares, you represent and warrant to us that you are an Exempt Investor.
As any offer of shares under this document will be made without disclosure in Australia under Chapter 6D.2 of the Corporations Act, the offer of those securities for resale in Australia within 12 months may, under section 707 of the Corporations Act, require disclosure to investors under Chapter 6D.2 if none of the exemptions in section 708 applies to that resale. By applying for the shares you undertake to us that you will not, for a period of 12 months from the date of issue and sale of the shares, offer, transfer, assign or otherwise alienate those shares to investors in Australia except in circumstances where disclosure to investors is not required under Chapter 6D.2 of the Corporations Act or where a compliant disclosure document is prepared and lodged with ASIC.
Notice to Prospective Investors in Japan
The shares have not been and will not be registered pursuant to Article 4, Paragraph 1 of the Financial Instruments and Exchange Act. Accordingly, none of the shares nor any interest therein may be offered or sold, directly or indirectly, in Japan or to, or for the benefit of, any “resident” of Japan (which term as used herein means any person resident in Japan, including any corporation or other entity organized under the laws of Japan), or to others for
re-offering
or resale, directly or indirectly, in Japan or to or for the benefit of a resident of Japan, except pursuant to an exemption from the registration requirements of, and otherwise in compliance with, the Financial Instruments and Exchange Act and any other applicable laws, regulations and ministerial guidelines of Japan in effect at the relevant time.Notice to Prospective Investors in Hong Kong
The shares have not been offered or sold and will not be offered or sold in Hong Kong, by means of any document, other than (a) to “professional investors” as defined in the Securities and Futures Ordinance (Cap. 571 of the Laws of Hong Kong) (the “SFO”) of Hong Kong and any rules made thereunder; or (b) in other circumstances which do not result in the document being a “prospectus” as defined in the Companies (Winding Up and Miscellaneous Provisions) Ordinance (Cap. 32) of Hong Kong) (the “CO”) or which do not constitute an offer to the public within the meaning of the CO. No advertisement, invitation or document relating to the shares has been or may be issued or has been or may be in the possession of any person for the purposes of issue, whether in Hong Kong or elsewhere, which is directed at, or the contents of which are likely to be accessed or read by, the public of Hong Kong (except if permitted to do so under the securities laws of Hong Kong) other than with respect to shares which are or are intended to be disposed of only to persons outside Hong Kong or only to “professional investors” as defined in the SFO and any rules made thereunder.
192
The contents of this document have not been reviewed by any regulatory authority in Hong Kong. You are advised to exercise caution in relation to the offer. If you are in any doubt about any of the contents of this document, you should obtain independent professional advice.
Notice to Prospective Investors in Singapore
Each underwriter has acknowledged that this prospectus has not been registered as a prospectus with the Monetary Authority of Singapore. Accordingly, each underwriter has represented and agreed that it has not offered or sold any shares or caused the shares to be made the subject of an invitation for subscription or purchase and will not offer or sell any shares or cause the shares to be made the subject of an invitation for subscription or purchase, and has not circulated or distributed, nor will it circulate or distribute, this prospectus or any other document or material in connection with the offer or sale, or invitation for subscription or purchase, of the shares, whether directly or indirectly, to any person in Singapore other than:
(a) to an institutional investor (as defined in Section 4A of the Securities and Futures Act (Chapter 289) of Singapore, as modified or amended from time to time (the “SFA”)) pursuant to Section 274 of the SFA;
(b) to a relevant person (as defined in Section 275(2) of the SFA) pursuant to Section 275(1) of the SFA, or any person pursuant to Section 275(1A) of the SFA, and in accordance with the conditions specified in Section 275 of the SFA; or
(c) otherwise pursuant to, and in accordance with the conditions of, any other applicable provision of the SFA.
Where the shares are subscribed or purchased under Section 275 of the SFA by a relevant person which is:
(d) a corporation (which is not an accredited investor (as defined in Section 4A of the SFA)) the sole business of which is to hold investments and the entire share capital of which is owned by one or more individuals, each of whom is an accredited investor; or
(e) a trust (where the trustee is not an accredited investor) whose sole purpose is to hold investments and each beneficiary of the trust is an individual who is an accredited investor,
securities or securities-based derivatives contracts (each term as defined in Section 2(1) of the SFA) of that corporation or the beneficiaries’ rights and interest (howsoever described) in that trust shall not be transferred within six months after that corporation or that trust has acquired the shares pursuant to an offer made under Section 275 of the SFA except:
(i) to an institutional investor or to a relevant person, or to any person arising from an offer referred to in Section 275(1A) orSection 276(4)(i)(B) of the SFA;
(ii) where no consideration is or will be given for the transfer;
(iii) where the transfer is by operation of law;
(iv) as specified in Section 276(7) of the SFA; or
(v) as specified in Regulation 37A of the Securities and Futures (Offers of Investments) (Securities and Securities-based Derivatives Contracts) Regulations 2018.
Notice to Prospective Investors in Bermuda
Shares may be offered or sold in Bermuda only in compliance with the provisions of the Investment Business Act of 2003 of Bermuda which regulates the sale of securities in Bermuda. Additionally,
non-Bermudian
persons (including companies) may not carry on or engage in any trade or business in Bermuda unless such persons are permitted to do so under applicable Bermuda legislation.193
Notice to Prospective Investors in Saudi Arabia
This document may not be distributed in the Kingdom of Saudi Arabia except to such persons as are permitted under the Offers of Securities Regulations as issued by the board of the Saudi Arabian Capital Market Authority (“CMA”) pursuant to resolution numberdated 4 October 2004 as amended by resolution numberas amended. The CMA does not make any representation as to the accuracy or completeness of this document and expressly disclaims any liability whatsoever for any loss arising from, or incurred in reliance upon, any part of this document. Prospective purchasers of the securities offered hereby should conduct their own due diligence on the accuracy of the information relating to the securities. If you do not understand the contents of this document, you should consult an authorized financial adviser.
2-11-2004
1-28-2008,
Notice to Prospective Investors in the British Virgin Islands
The shares are not being, and may not be offered to the public or to any person in the British Virgin Islands for purchase or subscription by or on behalf of the Company. The shares may be offered to companies incorporated under the BVI Business Companies Act, 2004 (British Virgin Islands) (“BVI Companies”), but only where the offer will be made to, and received by, the relevant BVI Company entirely outside of the British Virgin Islands.
Notice to Prospective Investors in China
This prospectus will not be circulated or distributed in the People’s Republic of China (“PRC”) and the shares will not be offered or sold, and will not be offered or sold to any person for
re-offering
or resale directly or indirectly to any residents of the PRC except pursuant to any applicable laws and regulations of the PRC. Neither this prospectus nor any advertisement or other offering material may be distributed or published in the PRC, except under circumstances that will result in compliance with applicable laws and regulations.Notice to Prospective Investors in Korea
The shares have not been and will not be registered under the Financial Investments Services and Capital Markets Act of Korea and the decrees and regulations thereunder (the “FSCMA”), and the shares have been and will be offered in Korea as a private placement under the FSCMA. None of the shares may be offered, sold or delivered directly or indirectly, or offered or sold to any person for
re-offering
or resale, directly or indirectly, in Korea or to any resident of Korea except pursuant to the applicable laws and regulations of Korea, including the FSCMA and the Foreign Exchange Transaction Law of Korea and the decrees and regulations thereunder (the “FETL”). The shares have not been listed on any of securities exchanges in the world including, without limitation, the Korea Exchange in Korea. Furthermore, the purchaser of the shares shall comply with all applicable regulatory requirements (including but not limited to requirements under the FETL) in connection with the purchase of the shares. By the purchase of the shares, the relevant holder thereof will be deemed to represent and warrant that if it is in Korea or is a resident of Korea, it purchased the shares pursuant to the applicable laws and regulations of Korea.Notice to Prospective Investors in Malaysia
No prospectus or other offering material or document in connection with the offer and sale of the shares has been or will be registered with the Securities Commission of Malaysia (“Commission”) for the Commission’s approval pursuant to the Capital Markets and Services Act 2007. Accordingly, this prospectus and any other document or material in connection with the offer or sale, or invitation for subscription or purchase, of the shares may not be circulated or distributed, nor may the shares be offered or sold, or be made the subject of an invitation for subscription or purchase, whether directly or indirectly, to persons in Malaysia other than (i) a closed end fund approved by the Commission; (ii) a holder of a Capital Markets Services Licence; (iii) a person who acquires the shares, as principal, if the offer is on terms that the shares may only be acquired at a consideration of
194
not less than RM250,000 (or its equivalent in foreign currencies) for each transaction; (iv) an individual whose total net personal assets or total net joint assets with his or her spouse exceeds RM3 million (or its equivalent in foreign currencies), excluding the value of the primary residence of the individual; (v) an individual who has a gross annual income exceeding RM300,000 (or its equivalent in foreign currencies) per annum in the preceding twelve months; (vi) an individual who, jointly with his or her spouse, has a gross annual income of RM400,000 (or its equivalent in foreign currencies), per annum in the preceding twelve months; (vii) a corporation with total net assets exceeding RM10 million (or its equivalent in a foreign currencies) based on the last audited accounts; (viii) a partnership with total net assets exceeding RM10 million (or its equivalent in foreign currencies); (ix) a bank licensee or insurance licensee as defined in the Labuan Financial Services and Securities Act 2010; (x) an Islamic bank licensee or takaful licensee as defined in the Labuan Financial Services and Securities Act 2010; and (xi) any other person as may be specified by the Commission; provided that, in the each of the preceding categories (i) to (xi), the distribution of the shares is made by a holder of a Capital Markets Services Licence who carries on the business of dealing in securities. The distribution in Malaysia of this prospectus is subject to Malaysian laws. This prospectus does not constitute and may not be used for the purpose of public offering or an issue, offer for subscription or purchase, invitation to subscribe for or purchase any securities requiring the registration of a prospectus with the Commission under the Capital Markets and Services Act 2007.
Notice to Prospective Investors in Taiwan
The shares have not been and will not be registered with the Financial Supervisory Commission of Taiwan pursuant to relevant securities laws and regulations and may not be sold, issued or offered within Taiwan through a public offering or in circumstances which constitutes an offer within the meaning of the Securities and Exchange Act of Taiwan that requires a registration or approval of the Financial Supervisory Commission of Taiwan. No person or entity in Taiwan has been authorized to offer, sell, give advice regarding or otherwise intermediate the offering and sale of the shares in Taiwan.
Notice to Prospective Investors in South Africa
Due to restrictions under the securities laws of South Africa, no “offer to the public” (as such term is defined in the South African Companies Act, No. 71 of 2008 (as amended or
re-enacted)
(the “South African Companies Act”)) is being made in connection with the issue of the shares in South Africa. Accordingly, this document does not, nor is it intended to, constitute a “registered prospectus” (as that term is defined in the South African Companies Act) prepared and registered under the South African Companies Act and has not been approved by, and/or filed with, the South African Companies and Intellectual Property Commission or any other regulatory authority in South Africa. The shares are not offered, and the offer shall not be transferred, sold, renounced or delivered, in South Africa or to a person with an address in South Africa, unless one or other of the following exemptions stipulated in section 96 (1) applies:| Section 96 (1) (a) | the offer, transfer, sale, renunciation or delivery is to: (i) persons whose ordinary business, or part of whose ordinary business, is to deal in securities, as principal or agent; (ii) the South African Public Investment Corporation; (iii) persons or entities regulated by the Reserve Bank of South Africa; (iv) authorised financial service providers under South African law; (v) financial institutions recognised as such under South African law; |
195
(vi) a wholly-owned subsidiary of any person or entity contemplated in (c), (d) or (e), acting as agent in the capacity of an authorised portfolio manager for a pension fund, or as manager for a collective investment scheme (in each case duly registered as such under South African law); or (vii) any combination of the person in (i) to (vi); or | ||
| Section 96 (1) (b) | the total contemplated acquisition cost of the securities, for any single addressee acting as principal is equal to or greater than ZAR1,000,000 or such higher amount as may be promulgated by notice in the Government Gazette of South Africa pursuant to section 96(2)(a) of the South African Companies Act. |
Information made available in this prospectus should not be considered as “advice” as defined in the South African Financial Advisory and Intermediary Services Act, 2002.
Other Relationships
The underwriters and their respective affiliates are full service financial institutions engaged in various activities, which may include sales and trading, commercial and investment banking, advisory, investment management, investment research, principal investment, hedging, market making, brokerage and other financial and
non-financial
activities and services. Certain of the underwriters and their respective affiliates have provided, and may in the future provide, a variety of these services to the issuer and to persons and entities with relationships with the issuer, for which they received or will receive customary fees and expenses.In the ordinary course of their various business activities, the underwriters and their respective affiliates, officers, directors and employees may purchase, sell or hold a broad array of investments and actively trade securities, derivatives, loans, commodities, currencies, credit default swaps and other financial instruments for their own account and for the accounts of their customers, and such investment and trading activities may involve or relate to assets, securities and/or instruments of the issuer (directly, as collateral securing other obligations or otherwise) and/or persons and entities with relationships with the issuer. If the underwriters or their affiliates have a lending relationship with us, certain of those underwriters or their affiliates may hedge their credit exposure to us consistent with their customary risk management policies. Typically, the underwriters and their affiliates would hedge such exposure by entering into transactions which consist of either the purchase of credit default swaps or the creation of short positions in our securities, including potentially the shares of our common stock offered hereby. Any such credit default swaps or short positions could adversely affect future trading prices of the shares of our common stock offered hereby. The underwriters and their respective affiliates may also communicate independent investment recommendations, market color or trading ideas and/or publish or express independent research views in respect of such assets, securities or instruments and may at any time hold, or recommend to clients that they should acquire, long and/or short positions in such assets, securities and instruments.
196
VALIDITY OF COMMON STOCK
The validity of the shares of our common stock offered hereby will be passed upon for us by Debevoise & Plimpton LLP, New York, New York. Certain legal matters related to this offering will be passed upon for the underwriters by Cravath, Swaine & Moore LLP, New York, New York.
EXPERTS
Ernst & Young LLP, independent registered public accounting firm, has audited our consolidated financial statements at December 31, 2020 and 2019, and for each of the three years in the period ended December 31, 2020, as set forth in their report. We’ve included our financial statements in the prospectus and elsewhere in the registration statement in reliance on Ernst & Young LLP’s report, given on their authority as experts in accounting and auditing.
WHERE YOU CAN FIND MORE INFORMATION
We have filed with the SEC a registration statement on Form S-1 with respect to the shares of our common stock being sold in this offering. This prospectus, which constitutes part of the registration statement, does not contain all of the information set forth in the registration statement and the exhibits thereto because some parts have been omitted in accordance with the rules and regulations of the SEC. You will find additional information about us and the common stock being sold in this offering in the registration statement and the exhibits thereto. For further information with respect to agilon health and the common stock being sold in this offering, reference is made to the registration statement and the exhibits filed therewith. Statements contained in this prospectus as to the contents of any contract or other document referred to are not necessarily complete and in each instance, if such contract or document is filed as an exhibit, reference is made to the copy of such contract or other document filed as an exhibit to the registration statement, each statement being qualified in all respects by such reference. The SEC maintains an internet site (), from which interested persons can electronically access the registration statement, including the exhibits and any schedules thereto.
http://www.sec.gov
We are subject to the informational requirements of the Exchange Act and, accordingly, file with the SEC annual reports containing financial statements audited by an independent registered public accounting firm, quarterly reports containing unaudited financial statements, current reports, proxy statements and other information. You can access these reports, proxy statements and other information without charge at the SEC’s website, which is listed above. You can also access, free of charge, our reports filed with the SEC (for example, our Annual Reports on Form). Reports filed with or furnished to the SEC will be available as soon as reasonably practicable after they are filed with or furnished to the SEC. None of the information contained on, or that may be accessed through our website or any other website identified herein is part of, or incorporated into, this prospectus, and you should not rely on any such information in connection with your decision to invest in our common stock. All website addresses in this prospectus are intended to be inactive textual references only.
10-K,
our Quarterly Reports on Form10-Q
and our Current Reports on Form8-K
and any amendments to those forms) through our website (http://www.agilonhealth.com
197
INDEX TO CONSOLIDATED FINANCIAL STATEMENTS
Unaudited Interim Condensed Consolidated Financial Statements
| F-2 | ||||
| F-3 | ||||
| F-4 | ||||
| F-6 | ||||
| F-7 | ||||
| F-22 |
Audited Consolidated Financial Statements
| F-25 | ||||
| F-27 | ||||
| F-28 | ||||
| F-29 | ||||
| F-30 | ||||
| F-31 | ||||
| F-63 |
F-1
agilon health, inc.
CONDENSED CONSOLIDATED BALANCE SHEETS
(in thousands, except per share data)
June 30, 2021 | December 31, 2020 | |||||||
(unaudited) | ||||||||
ASSETS | ||||||||
Current assets: | ||||||||
Cash and cash equivalents | $ | 1,109,372 | $ | 106,795 | ||||
Restricted cash and equivalents | 16,343 | 28,383 | ||||||
Receivables, net | 338,359 | 144,555 | ||||||
Prepaid expenses and other current assets, net | 15,740 | 9,639 | ||||||
Current assets held for sale and discontinued operations, net | — | 4,825 | ||||||
Total current assets | 1,479,814 | 294,197 | ||||||
Property and equipment, net | 4,589 | 6,456 | ||||||
Intangible assets, net | 58,663 | 60,468 | ||||||
Goodwill | 41,540 | 41,540 | ||||||
Other assets, net | 117,128 | 43,700 | ||||||
Total assets | $ | 1,701,734 | $ | 446,361 | ||||
LIABILITIES, CONTINGENTLY REDEEMABLE COMMON STOCK AND STOCKHOLDERS’ EQUITY (DEFICIT) | ||||||||
Current liabilities: | ||||||||
Medical claims and related payables | $ | 300,981 | $ | 162,868 | ||||
Accounts payable and accrued expenses | 107,599 | 97,244 | ||||||
Current portion of long-term debt | 3,750 | 3,041 | ||||||
Current liabilities held for sale and discontinued operations | — | 3,682 | ||||||
Total current liabilities | 412,330 | 266,835 | ||||||
Long-term debt, net of current portion | 45,862 | 64,665 | ||||||
Other liabilities | 93,264 | 90,091 | ||||||
Total liabilities | 551,456 | 421,591 | ||||||
Commitments and contingencies | 0 | 0 | ||||||
Contingently redeemable common stock, $00.01 par value: 0076,201 shares issued and outstanding at December 31, 2020 | — | 309,500 | ||||||
Stockholders’ equity (deficit): | ||||||||
Common stock, $0.01 par value: 2,000,000 shares authorized; 390,883 and 249,374 shares issued and outstanding, respectively | 3,909 | 2,494 | ||||||
Additional paid-in capital | 2,011,651 | 263,966 | ||||||
Accumulated deficit | (865,113 | ) | (551,190 | ) | ||||
Total agilon health, inc. stockholders’ equity (deficit) | 1,150,447 | (284,730 | ) | |||||
Noncontrolling interests | (169 | ) | — | |||||
Total stockholders’ equity (deficit) | 1,150,278 | (284,730 | ) | |||||
Total liabilities, contingently redeemable common stock and stockholders’ equity (deficit) | $ | 1,701,734 | $ | 446,361 | ||||
The condensed consolidated balance sheets include assets and liabilities of consolidated variable interest entities (“VIEs”) as agilon health, inc., together with its consolidated subsidiaries and variable interest entities (the “Company”), is the primary beneficiary of these VIEs. The condensed consolidated balance sheets include total assets that can only be used to settle obligations of the Company or the Company’s consolidated VIEs totaling $455.9 million and $287.9 million as of June 30, 2021 and December 31, 2020, respectively, and total liabilities of the Company’s consolidated VIEs for which creditors do not have recourse to the general credit of the primary beneficiary of $330.6 million and $174.0 million as of June 30, 2021 and December 31, 2020, respectively. See Note 13 for additional details.
See accompanying Notes to the Condensed Consolidated Financial Statements.
F-2
agilon health, inc.
CONDENSED CONSOLIDATED STATEMENTS OF OPERATIONS
(in thousands, except per share data)
(unaudited)
Three Months Ended June 30, | Six Months Ended June 30, | |||||||||||||||
2021 | 2020 | 2021 | 2020 | |||||||||||||
Revenues: | ||||||||||||||||
Medical services revenue | $ | 497,678 | $ | 292,495 | $ | 910,090 | $ | 582,309 | ||||||||
Other operating revenue | 1,278 | 1,099 | 1,970 | 2,333 | ||||||||||||
Total revenues | 498,956 | 293,594 | 912,060 | 584,642 | ||||||||||||
Expenses: | ||||||||||||||||
Medical services expense | 442,483 | 220,363 | 802,837 | 468,016 | ||||||||||||
Other medical expenses | 33,694 | 34,761 | 57,355 | 53,187 | ||||||||||||
General and administrative | 43,013 | 34,248 | 79,318 | 60,832 | ||||||||||||
Stock-based compensation expense | 274,548 | 2,155 | 276,020 | 3,176 | ||||||||||||
Depreciation and amortization | 3,581 | 3,319 | 7,008 | 6,517 | ||||||||||||
Total expenses | 797,319 | 294,846 | 1,222,538 | 591,728 | ||||||||||||
Income (loss) from operations | (298,363 | ) | (1,252 | ) | (310,478 | ) | (7,086 | ) | ||||||||
Other income (expense): | ||||||||||||||||
Other income (expense), net | 2,967 | (74 | ) | 4,303 | 48 | |||||||||||
Interest expense | (1,498 | ) | (2,080 | ) | (4,439 | ) | (4,229 | ) | ||||||||
Income (loss) before income taxes | (296,894 | ) | (3,406 | ) | (310,614 | ) | (11,267 | ) | ||||||||
Income tax benefit (expense) | (435 | ) | (39 | ) | (451 | ) | (39 | ) | ||||||||
Income (loss) from continuing operations | (297,329 | ) | (3,445 | ) | (311,065 | ) | (11,306 | ) | ||||||||
Discontinued operations: | ||||||||||||||||
Income (loss) before income taxes | (1,547 | ) | (4,340 | ) | (2,898 | ) | (12,429 | ) | ||||||||
Income tax benefit (expense) | (65 | ) | (126 | ) | (129 | ) | (275 | ) | ||||||||
Total discontinued operations | (1,612 | ) | (4,466 | ) | (3,027 | ) | (12,704 | ) | ||||||||
Net income (loss) | (298,941 | ) | (7,911 | ) | (314,092 | ) | (24,010 | ) | ||||||||
Noncontrolling interests’ share in (earnings) loss | 96 | — | 169 | — | ||||||||||||
Net income (loss) attributable to common shares | $ | (298,845 | ) | $ | (7,911 | ) | $ | (313,923 | ) | $ | (24,010 | ) | ||||
Net income (loss) per common share, basic and diluted | ||||||||||||||||
Continuing operations | $ | (0.79 | ) | $ | (0.01 | ) | $ | (0.88 | ) | $ | (0.03 | ) | ||||
Discontinued operations | $ | — | $ | (0.01 | ) | $ | (0.01 | ) | $ | (0.04 | ) | |||||
Weighted average shares outstanding, basic and diluted | 377,445 | 323,702 | 351,695 | 321,827 | ||||||||||||
See accompanying Notes to the Condensed Consolidated Financial Statements.
F-3
agilon health, inc.
CONDENSED CONSOLIDATED STATEMENTS OF CONTINGENTLY REDEEMABLE COMMON STOCK AND STOCKHOLDERS’ EQUITY (DEFICIT)
(in thousands)
(unaudited)
For the three month
s
ended June 30, 2021:Contingently Redeemable Common Stock | Total Stockholders’ Equity | |||||||||||||||||||||||||||||||||||
Common Stock | Additional Paid-In Capital | Accumulated Deficit | Noncontrolling Interest | Total Stockholders’ Equity (Deficit) | ||||||||||||||||||||||||||||||||
Shares | Amount | Shares | Amount | |||||||||||||||||||||||||||||||||
April 1, 2021 | 76,201 | $ | 309,500 | 249,474 | $ | 2,494 | $ | 265,603 | $ | (566,268 | ) | $ | (73 | ) | $ | (298,244 | ) | |||||||||||||||||||
Net income (loss) | — | — | — | — | — | (298,845 | ) | (96 | ) | (298,941 | ) | |||||||||||||||||||||||||
Reclassification of contingently redeemable common stock in connection with initial public offering (“IPO”) | (76,201 | ) | (309,500 | ) | 76,201 | 762 | 308,738 | — | — | 309,500 | ||||||||||||||||||||||||||
Issuance of common stock in connection with IPO, net of offering costs | — | — | 53,590 | 536 | 1,162,493 | — | — | 1,163,029 | ||||||||||||||||||||||||||||
Issuance of common stock under partner physician group equity agreements upon IPO | — | — | 11,672 | 117 | 268,350 | �� | — | — | 268,467 | |||||||||||||||||||||||||||
Exercise of stock options and other, net | — | — | (54 | ) | — | 386 | — | — | 386 | |||||||||||||||||||||||||||
Stock-based compensation expense | — | — | — | — | 6,081 | — | — | 6,081 | ||||||||||||||||||||||||||||
June 30, 2021 | — | $ | — | 390,883 | $ | 3,909 | $ | 2,011,651 | $ | (865,113 | ) | $ | (169 | ) | $ | 1,150,278 | ||||||||||||||||||||
For the six months ended June 30, 2021:
Contingently Redeemable Common Stock | Total Stockholders’ Equity | |||||||||||||||||||||||||||||||||||
Common Stock | Additional Paid-In Capital | Accumulated Deficit | Noncontrolling Interest | Total Stockholders’ Equity (Deficit) | ||||||||||||||||||||||||||||||||
Shares | Amount | Shares | Amount | |||||||||||||||||||||||||||||||||
January 1, 2021 | 76,201 | $ | 309,500 | 249,374 | $ | 2,494 | $ | 263,966 | $ | (551,190 | ) | $ | — | $ | (284,730 | ) | ||||||||||||||||||||
Net income (loss) | — | — | — | — | — | (313,923 | ) | (169 | ) | (314,092 | ) | |||||||||||||||||||||||||
Reclassification of contingently redeemable common stock in connection with IPO | (76,201 | ) | (309,500 | ) | 76,201 | 762 | 308,738 | — | — | 309,500 | ||||||||||||||||||||||||||
Issuance of common stock in connection with IPO, net of offering costs | — | — | 53,590 | 536 | 1,162,493 | — | — | 1,163,029 | ||||||||||||||||||||||||||||
Issuance of common stock under partner physician group equity agreements upon IPO | — | — | 11,672 | 117 | 268,350 | — | — | 268,467 | ||||||||||||||||||||||||||||
Exercise of stock options and other, net | — | — | 46 | — | 551 | — | — | 551 | ||||||||||||||||||||||||||||
Stock-based compensation expense | — | — | �� | — | — | 7,553 | — | — | 7,553 | |||||||||||||||||||||||||||
June 30, 2021 | — | $ | — | 390,883 | $ | 3,909 | $ | 2,011,651 | $ | (865,113 | ) | $ | (169 | ) | $ | 1,150,278 | ||||||||||||||||||||
F-4
agilon health, inc.
CONDENSED CONSOLIDATED STATEMENTS OF CONTINGENTLY REDEEMABLE COMMON STOCK AND STOCKHOLDERS’ EQUITY (DEFICIT)
(in thousands)
(unaudited)
For the three months ended June 30, 2020:
Contingently Redeemable Common Stock | Total Stockholders’ Equity | |||||||||||||||||||||||||||||||
Common Stock | Additional Paid-In Capital | Accumulated Deficit | Total Stockholders’ Equity (Deficit) | |||||||||||||||||||||||||||||
Shares | Amount | Shares | Amount | |||||||||||||||||||||||||||||
April 1, 2020 | 76,201 | $ | 309,500 | 246,924 | $ | 2,469 | $ | 257,254 | $ | (507,237 | ) | $ | (247,514 | ) | ||||||||||||||||||
Net income (loss) | — | — | — | — | — | (7,911 | ) | (7,911 | ) | |||||||||||||||||||||||
Issuance of common stock, net | — | — | 1,023 | 10 | 4,591 | — | 4,601 | |||||||||||||||||||||||||
Exercise of stock options and other, net | — | — | 335 | 3 | 310 | — | 313 | |||||||||||||||||||||||||
Stock-based compensation expense | — | — | — | — | 2,231 | — | 2,231 | |||||||||||||||||||||||||
June 30, 2020 | 76,201 | $ | 309,500 | 248,282 | $ | 2,482 | $ | 264,386 | $ | (515,148 | ) | $ | (248,280 | ) | ||||||||||||||||||
For the six months ended June 30, 2020:
Contingently Redeemable Common Stock | Total Stockholders’ Equity | |||||||||||||||||||||||||||||||
Common Stock | Additional Paid-In Capital | Accumulated Deficit | Total Stockholders’ Equity (Deficit) | |||||||||||||||||||||||||||||
Shares | Amount | Shares | Amount | |||||||||||||||||||||||||||||
January 1, 2020 | 69,860 | $ | 281,000 | 246,743 | $ | 2,467 | $ | 256,643 | $ | (491,138 | ) | $ | (232,028 | ) | ||||||||||||||||||
Net income (loss) | — | — | — | — | — | (24,010 | ) | (24,010 | ) | |||||||||||||||||||||||
Issuance of contingently redeemable common stock | 6,341 | 28,500 | — | — | (460 | ) | — | (460 | ) | |||||||||||||||||||||||
Issuance of common stock, net | — | — | 1,023 | 10 | 4,591 | — | 4,601 | |||||||||||||||||||||||||
Exercise of stock options and other, net | — | — | 516 | 5 | 310 | — | 315 | |||||||||||||||||||||||||
Stock-based compensation expense | — | — | — | — | 3,302 | — | 3,302 | |||||||||||||||||||||||||
June 30, 2020 | 76,201 | $ | 309,500 | 248,282 | $ | 2,482 | $ | 264,386 | $ | (515,148 | ) | $ | (248,280 | ) | ||||||||||||||||||
See accompanying Notes to the Condensed Consolidated Financial Statements.
F-5
agilon health, inc.
CONDENSED CONSOLIDATED STATEMENTS OF CASH FLOWS
(in thousands)
(unaudited)
Six Months Ended June 30, | ||||||||
2021 | 2020 | |||||||
Cash flows from operating activities: | ||||||||
Net income (loss) | $ | (314,092 | ) | $ | (24,010 | ) | ||
Adjustments to reconcile net loss to net cash used in operating activities: | ||||||||
Depreciation and amortization | 7,095 | 6,845 | ||||||
Stock-based compensation expense | 276,020 | 3,302 | ||||||
Loss on debt extinguishment | 1,590 | — | ||||||
Loss (income) from equity method investments | (2,532 | ) | (380 | ) | ||||
Other noncash items | 2,011 | 520 | ||||||
Changes in operating assets and liabilities | (50,211 | ) | (21,775 | ) | ||||
Net cash provided by (used in) operating activities | (80,119 | ) | (35,498 | ) | ||||
Cash flows from investing activities: | ||||||||
Purchase of property and equipment, net | (646 | ) | (941 | ) | ||||
Purchase of intangible assets | (4,018 | ) | (306 | ) | ||||
Investment in loans receivable and other | (70,307 | ) | (2,166 | ) | ||||
Proceeds from repayment of loans receivable | 1,277 | 1,062 | ||||||
Proceeds from sale of business and property, net of cash divested | (2,644 | ) | — | |||||
Net cash provided by (used in) investing activities | (76,338 | ) | (2,351 | ) | ||||
Cash flows from financing activities: | ||||||||
Proceeds from initial public offering | 1,170,942 | — | ||||||
Proceeds from other equity issuances, net | — | 32,727 | ||||||
Proceeds from exercise of stock options | 551 | 315 | ||||||
Proceeds from the issuance of long-term debt | 100,000 | — | ||||||
Equity and debt issuance costs and other | (9,768 | ) | — | |||||
Repayments of long-term borrowings and other | (118,648 | ) | (1,520 | ) | ||||
Net cash provided by (used in) financing activities | 1,143,077 | 31,522 | ||||||
Net increase (decrease) in cash, cash equivalents and restricted cash and equivalents | 986,620 | (6,327 | ) | |||||
Cash, cash equivalents and restricted cash and equivalents from continuing operations, beginning of period | 135,178 | 139,152 | ||||||
Cash, cash equivalents and restricted cash and equivalents from discontinued operations, beginning of period | 3,917 | 6,460 | ||||||
Cash, cash equivalents and restricted cash and equivalents, beginning of period | 139,095 | 145,612 | ||||||
Cash, cash equivalents and restricted cash and equivalents from continuing operations, end of period | 1,125,715 | 134,552 | ||||||
Cash, cash equivalents and restricted cash and equivalents from discontinued operations, end of period | — | 4,733 | ||||||
Cash, cash equivalents and restricted cash and equivalents, end of period | $ | 1,125,715 | $ | 139,285 | ||||
See accompanying Notes to the Condensed Consolidated Financial Statements.
F-6
agilon health, inc.
NOTES TO THE CONDENSED CONSOLIDATED FINANCIAL STATEMENTS
(Unaudited)
NOTE 1. Business
Description of Business
agilon health, inc., through its partnerships and platform, provides the necessary capabilities, capital, and business model for existing physician groups to create a Medicare-centric, globally capitated line of business. As of June 30, 2021, the Company, through its contracted physician networks, provided care to approximately
Medicare Advantage members enrolled with private health plans.
| • | During 2020, the Company entered into strategic partnerships to further expand its operations beginning January 1, 2021 into: (i) Buffalo, New York; (ii) Toledo, Ohio; and (iii) Hartford, Connecticut. In December 2020, the Company entered into a strategic partnership to further expand its operations beginning January 1, 2022 into Syracuse, New York. |
| • | During 2021, the Company entered into strategic partnerships to further expand its operations beginning January 1, 2022 into: (i) Grand Rapids and Traverse City, Michigan; (ii) Pinehurst, North Carolina; and (iii) Longview and Texarkana, Texas, along with additional partnerships in the Company’s existing Ohio and Texas markets. |
| • | On April 1, 2021, the Company launched 5 Direct Contracting Entities (“DCE”) that, in collaboration with 7 of its physician group partners, are participating in the Center for Medicare & Medicaid Innovation’s Direct Contracting Model. |
See Note 13 for additional discussions related to the Company’s involvement with VIEs.
The Company is ultimately controlled by an investment fund associated with Clayton Dubilier & Rice, LLC (“CD&R”), a private equity firm headquartered in New York, New York. All funds affiliated with CD&R are considered related parties.
Initial Public Offering
On April 19, 2021, the Company completed its initial public offering (“IPO”) in which it issued and sold an aggregate 53,590,000 shares of common stock at $23.00 per share. The Company received net proceeds of approximately $1.2 billion after deducting underwriting discounts and commissions and before deducting offering costs of $7.9 million.
Upon the completion of the IPO, the Company issued 11.7 million shares of common stock under partner physician group equity agreements and recognized stock-based compensation expense of $268.5 million in April 2021. Additionally, as of June 30, 2021, the Company provided $67.8 million in financing to physician partner groups in connection with taxes payable on shares distributed to them upon completion of the IPO. Such amounts are included in other assets, net in the condensed consolidated balance sheets. See Note 4.
The Company also recognized $2.6 million of expense related to stock options that vested upon the completion of the IPO and $3.7 million of expense related to a severance payment to its former chief executive officer contingent upon the completion of the IPO.
In connection with the IPO, the Company’s Board of Directors approved the agilon health, inc. 2021 Omnibus Equity Incentive Plan, or the “Omnibus Incentive Plan.” The equity awards approved by the compensation committee for grants to employees in connection with the completion of the IPO represent 1.9 million shares of common stock issuable upon the exercise or vesting of such awards.
F-7
In connection with the completion of the IPO, the management agreement with CD&R was terminated pursuant to a termination agreement, dated as of April 16, 2021. The Company was not charged a fee in connection with th
e
termination of this agreement.NOTE 2. Summary of Significant Accounting Policies
Basis of Presentation
The accompanying condensed consolidated financial statements have been prepared by management in accordance with accounting principles generally accepted in the United States of America (“U.S. GAAP”) for interim financial information.
The condensed consolidated financial statements include the accounts of agilon health, inc., its wholly-owned subsidiaries, and both joint ventures and VIEs that it controls through voting rights or other means. Intercompany transactions and balances have been eliminated upon consolidation. All adjustments (consisting of normal recurring adjustments unless otherwise indicated), which the Company considers necessary to present fairly its financial position, results of operations and cash flows, have been included. Operating results for the three and six months ended June 30, 2021, including the impact
of COVID-19,
are not necessarily indicative of the results that may be expected for the year ending December 31, 2021. The accompanying condensed consolidated financial information should be read in conjunction with the consolidated financial statements and notes thereto for the year ended December 31, 2020 included in the Company’s prospectus (FileNo. 333-254435)
dated April 14, 2021 filed with the Securities and Exchange Commission (“SEC”) pursuant to Rule 424(b) under the Securities Exchange Act of 1934, as amended, on April 16, 2021 (the “Prospectus”).Use of Estimates
Management is required to make estimates and assumptions in the preparation of financial statements. These estimates and assumptions affect the reported amounts of assets and liabilities and the disclosure of contingent assets and liabilities at the date of the condensed consolidated financial statements and the reported amounts of revenues and expenses during the reporting period. Significant estimates can include, among other things, those used to determine revenues and related receivables from risk adjustments, medical services expense and related payables (including the reserve for incurred but not reported (“IBNR”) claims), and the valuation and related recognition of impairments of long-lived assets, including goodwill. Management’s estimates for revenue recognition, medical services expense and other estimates, judgments, and assumptions, may be materially and adversely different from actual results as a result of the
COVID-19
pandemic, among other things. See Note 9 for additional discussion on the impact of the COVID-19 pandemic. These estimates are based on knowledge of current events and anticipated future events, and accordingly, actual results may ultimately differ materially from those estimates.Goodwill and Amortizable Intangible Assets
As of both June 30, 2021 and December 31, 2020, goodwill of $39.0 million was allocated to the Company’s Hawaii reporting unit, which had a negative carrying value.
As of June 30, 2021 and December 31, 2020, the Company’s gross carrying amount of amortizable intangible assets was $105.8 million and $101.9 million, with accumulated amortization of $47.2 million and $41.4 million, respectively. For the three months ended June 30, 2021 and 2020, the Company recognized $3.0 million and $2.8 million, respectively, in amortization expense, which is included in depreciation and amortization expense in the condensed consolidated statement of operations. For the six months ended June 30, 2021 and 2020, the Company recognized $5.8 million and $5.5 million, respectively, in amortization expense, which is included in depreciation and amortization expense in the condensed consolidated statement of operations.
F-8
Property and Equipment
As of June 30, 2021 and December 31, 2020, the Company’s gross carrying amount of property and equipment was $12.6 million and $13.7 million, with accumulated depreciation of $8.0 million and $7.3 million, respectively. For the three months ended June 30, 2021 and 2020, the Company recognized $0.6 million and $0.5 million, respectively, in depreciation expense, which is included in depreciation and amortization expense in the condensed consolidated statement of operations. For the six months ended June 30, 2021 and 2020, the Company recognized $1.2 million and $1.0 million, respectively, in depreciation expense, which is included in depreciation and amortization expense in the condensed consolidated statement of operations. In June 2021, the Company completed the sale of a building and related land for $1.1 million.
Income Taxes
The Company determined the income tax provision for interim periods using an estimate of the Company’s annual effective tax rate, applied toresults, adjusted for discrete items arising in that quarter. In each quarter, the Company updates its estimated annual effective tax rate, and if the estimated annual effective tax rate changes, a cumulative
year-to-date
catch-up
adjustment is recorded in that quarter. The Company applied the intra-period tax allocation rules to allocate income taxes between continuing operations and discontinued operations as prescribed in U.S. GAAP, where the tax effect of income (loss) before income taxes from continuing operations is computed without regard to the tax effects of income (loss) before income taxes from the other categories.The Company’s income taxes from continuing operations for the three and six months ended June 30, 2021 and 2020 were not material. The Company’s annual estimated effective tax rate differs from the statutory rate primarily as a result of changes in the valuation allowance.
Recent Accounting Pronouncements
Adopted
Credit Losses.
Accounting
Standards Update (“ASU”)2016-13,
Measurement of Credit Losses on Financial Instruments
2016-13”).
ASU2016-13
is intended to improve financial reporting by requiring timelier recognition of credit losses on loans and other financial instruments held at amortized cost. The amendments in ASU2016-13
eliminate the “probable” initial threshold for recognition of credit losses in current accounting guidance and, instead, reflect an entity’s current estimate of all expected credit losses over the life of the financial instrument. When credit losses were measured under prior accounting guidance, an entity generally only considered past events and current conditions in measuring the incurred loss. The amendments in ASU2016-13
broaden the information that an entity must consider in developing its expected credit loss estimate for assets measured either collectively or individually. The use of forecasted information incorporates more timely information in the estimate of expected credit loss. A reporting entity is required to apply the amendments in ASU2016-13
using a modified retrospective approach by recording a cumulative-effect adjustment to equity as of the beginning of the fiscal year of adoption. Upon adoption of ASU2016-13,
the Company is required to reassess its financial assets measured at amortized costs andoff-balance
sheet credit exposures, including loan commitments. In November 2019, the FASB issued ASU2019-10,
Financial Instruments—Credit Losses (Topic 326), Derivatives and Hedging (Topic 815), and Leases (Topic 842): Effective Dates
2019-10”).
ASU2019-10
amended the effective date for ASU2016-13.
ASU2016-13
is effective for fiscal years, and interim periods within, beginning after December 15, 2019 for public companies, unless they qualify for an “emerging growth company.” The Company qualified as an emerging growth company prior to the completion of its IPO and elected to use the extended transition period for complying with this accounting standard through fiscal years beginning after December 15, 2022. However, as the Company ceased to be an emerging growth company as of January 1, 2021, the Company adopted ASU2016-13
effective January 1, 2021. The adoption of ASU2016-13
did not have an impact on the Company’s condensed consolidated financial statements.F-9
NOTE 3. Revenue, Receivables, and Concentration of Credit Risk
Medical Services Revenue
Medical services revenue consists of capitation fees under contracts with various Medicare Advantage payors (“payors”). Under the typical capitation arrangement, the Company is entitled to monthly, to stand ready on a monthly basis to provide all aspects of necessary medical care to members for the contracted period. The Company recognizes revenue in the month in which eligible members are entitled to receive healthcare benefits during the contract term.
per-member,
per-month
(“PMPM”) fees to provide a defined range of healthcare services for Medicare Advantage health plan members (“members”) attributed to the Company’s contracted primary care physicians. PMPM fees are determined as a percentage of the premium payors receive from the Centers for Medicare & Medicaid Services (“CMS”) for these members. The Company generally accepts full financial risk for members attributed to its contracted primary care physicians and, therefore, is responsible for the cost of all healthcare services required by those members. Fees are recorded gross in revenue because the Company is acting as a principal in coordinating and controlling the range of services provided (other than clinical decisions) under its capitation contracts with payors. Capitation contracts with payors are generally multi-year arrangements and have a single performance obligation that constitutes a series, as defined by Accounting Standards Codification 606,Revenue From Contracts With Customers
The transaction price for the Company’s capitation contracts is variable, as the PMPM fees to which the Company is entitled are subject to periodic adjustment under CMS’s risk adjustment payment methodology. CMS deploys a risk adjustment model that determines premiums paid to all payors according to each member’s health status and certain demographic factors. Under this risk adjustment methodology, CMS calculates the risk adjusted premium payment using diagnosis data from various settings. The Company and healthcare providers collect and submit the accurate diagnosis data to payors and such data is utilized by the Company to estimate risk adjustment payments to be received in subsequent periods. Risk adjustment-related revenues are estimated using the most likely amount methodology and amounts are only included in revenue to the extent that it is probable that a significant reversal of cumulative revenue will not occur once any uncertainty is resolved. PMPM fees are also subject to adjustment for incentives or penalties based on the achievement of certain quality metrics defined in the Company’s contracts with payors. The Company recognizes incentive revenue as earned using the most likely amount methodology and only to the extent that it is probable that a significant reversal of cumulative revenue will not occur once any uncertainty is resolved.
Neither the Company nor any of its affiliates is a registered insurance company because state law in the states in which it operates does not require such registration for risk bearing providers.
Receivables
Receivables primarily consist of amounts due under capitation contracts with various payors. Receivables due under capitation contracts are recorded monthly based on reports received from payors and management’s estimate of risk adjustment payments to be received in subsequent periods for open performance years. Receivables are recorded and stated at the amount expected to be collected.
Concentration
The Company is economically dependent on maintaining a base of primary care and specialty care physicians as well as capitation contracts with payors. The loss of certain of those contracts could have a material adverse effect on the Company’s financial position, results of operations, or cash flows.
The Company contracts with various payors whereby the Company is entitled to monthly PMPM fees to provide a defined range of healthcare services for members attributed to its contracted primary care physicians. The Company generally accepts full financial risk for such members and, therefore, is responsible for the cost of all healthcare services required by them. Substantially all of the Company’s receivable balances are from a small number of payors.
F-10
Revenue from Medicare Advantage constitutes substantially all of the Company’s total revenue, accounting for nearly 100% of the Company’s total revenues for the three and six months ended June 30, 2021 and 2020.
The following table provides the Company’s revenue concentration with respect to major payors as a percentage of the Company’s total revenues:
Three Months Ended June 30, | Six Months Ended June 30, | |||||||||||||||
2021 | 2020 | 2021 | 2020 | |||||||||||||
Payor A | 24 | % | 38 | % | 26 | % | 38 | % | ||||||||
Payor B | 19 | % | 20 | % | 20 | % | 20 | % | ||||||||
Payor C | 20 | % | 12 | % | 17 | % | 12 | % | ||||||||
Payor D | 11 | % | * | 10 | % | * | ||||||||||
| * | Less than 10% of total revenues. |
The following table provides the Company’s concentration of credit risk with respect to major payors as a percentage of receivables, net:
June 30, 2021 | December 31, 2020 | |||||||
Payor A | 18 | % | 38 | % | ||||
Payor B | 24 | % | 27 | % | ||||
Payor C | 13 | % | * | |||||
Payor D | 14 | % | * | |||||
| * | Less than 10% of total receivables. |
NOTE 4. Other Assets, net
The following table summarizes the Company’s other assets (in thousands):
June 30, 2021 | December 31, 2020 | |||||||
Loans to physician partners | $ | 67,828 | $ | 0 | ||||
Indemnification assets | 10,137 | 10,009 | ||||||
Health plan deposits | 11,523 | 11,523 | ||||||
Equity method investments | 11,997 | 8,502 | ||||||
Right-of-use | 9,208 | 9,585 | ||||||
Other | 6,435 | 4,081 | ||||||
| $ | 117,128 | $ | 43,700 | |||||
Loans to Physician Partners
T
he Company provided loans to its physician partners in connection with taxes payable on shares distributed to them in connection with the IPO. See Note 1. These loans mature between 2026 and 2030 with nominal interest compounding annually and no prepayment penalties. Such loans are stated at the amount expected to be collected.Indemnification Assets
I
pre-closing
liabilities for which the prior owners of some of the Company’s California subsidiaries are obligated to indemnify the Company. The Company deems the amounts receivable under the indemnification agreements to be fully collectible should indemnification claims arise and, as such, a valuation allowance is not deemed necessary.F-11
Equity Method Investments
On April 1, 2021, the Company launched 5 wholly-owned DCEs in collaboration with 7 of its physician group partners. As of June 30, 2021, the Company had 7 equity method investments that were deemed to be VIEs. The following table summarizes the Company’s equity method investments (in thousands):
June 30, 2021 | December 31, 2020 | |||||||
Direct contracting entities | $ | 2,603 | $ | 0 | ||||
Other | 9,394 | 8,502 | ||||||
| $ | 11,997 | $ | 8,502 | |||||
For the Company’s equity method investments, it has determined that it is not the primary beneficiary of and, therefore, does not consolidate the VIEs because it does not have the ability to control activities that most significantly impact their economic performance. See Note 13.
The combined summarized operating results of the Company’s DCEs for the three and six months ended June 30, 2021 are as follows (in thousands):
Total | ||||
Medical services revenue | $ | 163,984 | ||
Medical services expens e | (152,154 | ) | ||
Other medical expenses (1) | (7,156 | ) | ||
Net income | 1,840 | |||
| (1) | Includes physician incentive expenses of $3.6 million. |
NOTE 5. Medical Claims and Related Payables
Medical services expense represents costs incurred for medical services provided to members by physicians, hospitals and other ancillary providers for which the Company is financially responsible and that are paid either directly by the Company or by payors with whom the Company has contracted. Medical services expenses are recognized in the period in which services are provided and include estimates of claims that have been incurred but have either not yet been received, processed, or paid
and as such, not reported.
Such estimates are developed using actuarial methods commonly used by health insurance actuaries that include a number of factors and assumptions including medical service utilization trends, changes in membership, observed medical cost trends, historical claim payment patterns and other factors. Generally, for the most recent months, the Company estimates claim costs incurred by applying observed medical cost trend factors to the average PMPM medical costs incurred in prior months for which more complete claims data are available.
Each period, the Company
re-examines
previously established medical claims payable estimates based on actual claim submissions and other changes in facts and circumstances. As more complete claims information becomes available, the Company adjusts its estimates and recognizes those changes in estimates in the period in which the change is identified. The difference between the estimated liability and the actual settlements of claims is recognized in the period in which the claims are settled. The Company’s medical claims payable balance represents management’s best estimate of its liability for unpaid medical costs as of June 30, 2021 and December 31, 2020. The Company uses judgment to determine the appropriate assumptions for developing the required estimates.F-12
The following table presents the components of changes in medical claims and related payables (in thousands):
June 30, 2021 | December 31, 2020 | |||||||
Medical claims and related payables, beginning of the year | $ | 164,161 | $ | 121,779 | ||||
Components of incurred costs related to: | ||||||||
Current year | 803,711 | 1,026,940 | ||||||
Prior years | (874 | ) | (5,063 | ) | ||||
Discontinued operations—current year | 1,234 | 85,732 | ||||||
Discontinued operations—prior year s | (1,862 | ) | (1,543 | ) | ||||
| 802,209 | 1,106,066 | |||||||
Claims paid related to: | ||||||||
Current year | (517,368 | ) | (870,979 | ) | ||||
Prior years | (144,260 | ) | (94,868 | ) | ||||
Discontinued operations—current year | (298 | ) | (80,754 | ) | ||||
Discontinued operations—prior year (1) | (3,463 | ) | (17,083 | ) | ||||
| (665,389 | ) | (1,063,684 | ) | |||||
Medical claims and related payables, end of the period | $ | 300,981 | $ | 164,161 | ||||
| (1) | Includes $1.5 million that was disposed in February 2021. |
Beginning and ending balances of medical claims and related payables disclosed above for December 31, 2020, include $1.1 million and $1.3 million, respectively, of claims liabilities that are presented as current liabilities held for sale and discontinued operations. As of June 30, 2021 and December 31, 2020, medical claims and related payables also include $1.0 million and $4.1 million, respectively, of claims liabilities associated with certain divested California businesses for which the Company has retained the liability for claims incurred prior to the date of divestiture.
NOTE 6. Other Liabilities
The following table summarizes the Company’s other liabilities (in thousands):
June 30, 2021 | December 31, 2020 | |||||||
Other long-term contingencies | $ | 74,808 | $ | 71,693 | ||||
Reserve for uncertain tax positions | 10,137 | 10,009 | ||||||
Lease liabilities, long-term | 5,345 | 5,508 | ||||||
Other | 2,974 | 2,881 | ||||||
| $ | 93,264 | $ | 90,091 | |||||
As of June 30, 2021 and December 31, 2020, the Company had contingent liabilities of $74.8 million and $71.7 million, respectively, related to unasserted claims. While the Company intends to vigorously defend its position, the Company has established a liability for the potential exposure, including interest and penalties. Additionally, the Company estimated the range of reasonably possible losses in excess of reserves accrued on the condensed consolidated balance sheets to be $0 to $23.3 million as of June 30, 2021.
NOTE 7. Debt
On February 18, 2021, the Company executed a credit facility agreement (as amended by the First Amendment to Credit Agreement, dated as of March 1, 2021, the “2021 Credit Facilities”). The 2021 Credit
F-13
Facilities include: (i) a $100.0 million secured term loan (the “2021 Secured Term Loan Facility”) and (ii) a $100.0 million senior secured revolving credit facility (the “2021 Secured Revolving Facility”) with a capacity to issue standby letters of credit in certain circumstances up to a maximum of $80.0 million. Subject to specified conditions and receipt of commitments, the 2021 Secured Term Loan Facility may be expanded (or a new term loan facility, revolving credit facility or letter of credit facility added) by up to (i) $50.0 million plus (ii) an additional amount determined in accordance with a formula tied to repayment of certain of the Company’s indebtedness. The proceeds from the 2021 Secured Term Loan Facility were used to refinance an aggregate of $68.6 million of outstanding indebtedness under the prior credit facility and unsecured debt, with the remaining $30.1 million of net proceeds used for working capital and other general corporate purposes. The maturity date of the 2021 Credit Facilities was February 18, 2024 or, following the completion of an IPO, February 18, 2026 with mandated periodic payments. In connection with the refinance of the existing debt, the Company recognized $1.1 million of additional interest expense for the
write-off
of the related debt issuance costs. The 2021 Secured Term Loan Facility required, among other things, a mandatory prepayment of $50.0 million if gross proceeds from the IPO exceeded $1.0 billion. On April 26, 2021, the Company repaid $50.0 million of the 2021 Secured Term Loan Facility. The maturity date of the 2021 Credit Facilities was extended to February 18, 2026, with mandatory periodic payments.As of June 30, 2021, the Company had $50.0 million outstanding under the 2021 Secured Term Loan Facility and availability under the 2021 Secured Revolving Facility was $64.4 million as the Company had outstanding letters of credit totaling $35.6 million, of which $14.0 million was for the Company’s DCE investments. The standby letters of credit are automatically extended without amendment for
one-year
periods, unless the Company notifies the institution in advance of the expiration date that the letter will be terminated. NaN amounts have been drawn on the outstanding letters of credit as of June 30, 2021.At the Company’s option, borrowings under the 2021 Credit Facilities, as defined in the credit agreement, can be either: (i) LIBO Rate Loans or (ii) Base Rate Loans. LIBO Rate Loans bear interest at a rate equal to the sum of 4.00% (stepping down to 3.50% on and following October 1, 2023) and the higher of (a) LIBO, as defined in the credit agreement, and (b) 0%. Base Rate Loans bear interest at a rate equal to the sum of 3.00% (stepping down to 2.50% on and following October 1, 2023) and the highest of: (a) 0.50% in excess of the overnight federal funds rate, (b) the prime rate established by the administrative agent from time to time, (c) the
one-month
LIBO rate (adjusted for maximum reserves) plus 1.00% and (d) 0%. Additionally, the Company pays a commitment fee on the unfunded 2021 Secured Revolving Facility amount of 0.50% (stepping down to 0.375% on and following October 1, 2023). The Company must also pay customary letter of credit fees. As of June 30, 2021, the weighted average effective interest rate on the 2021 Secured Term Loan Facility was 4.46%.The 2021 Credit Facilities are guaranteed by certain of the Company’s subsidiaries, including those identified as VIEs, and contain customary covenants including, among other things, limitations on restricted payments including: (i) dividends and distributions from restricted subsidiaries, (ii) requirements of minimum financial ratios, and (iii) limitation on additional borrowings based on certain financial ratios. Failure to meet any of these covenants could result in an event of default under the agreement. If an event of default occurs, the lenders could elect to declare all amounts outstanding under the agreement to be immediately due and payable. As of June 30, 2021, the Company was in compliance with all covenants under the 2021 Credit Facilities.
NOTE 8. Commitments and Contingencies
Legal Proceedings
From time to time, the Company is a party to, or has a significant relationship to, legal proceedings, lawsuits, and other claims. Except as described below, the Company is not aware of any legal proceedings or claims that it believes may have, individually or taken together, a material adverse effect on the Company’s financial condition, results of operations or cash flows. The Company’s policy is to expense legal costs as they are incurred.
F-14
COVID-19
The Company continues to monitor and assess the estimated operating and financial impact of the
COVID-19
pandemic, and as it evolves, the Company continues to process, assemble, and assess member utilization information. Throughout most of 2020, the Company’s members incurred lower healthcare costs than would have otherwise been expected, which resulted in lower medical services expenses incurred. This reduction was impacted by the temporary deferral of non-essential care amid the COVID-19 pandemic and improved medical cost management, among other factors. These costs may be incurred at future points in time, and it is possible that the deferral of healthcare services, or the impact of the Company’s members (who are seniors typically with chronic conditions) being diagnosed with COVID-19, could cause additional health problems in its existing members, which could increase costs in the future. The Company cannot accurately estimate the net ultimate impact, positive or negative, to medical services expense at this time.Given the disruption caused by COVID-19, it is unclear whether the Company’s physicians will be able to document the health conditions of members as comprehensively as they did in historical periods. Because risk adjustment factors in the current period are based on the preceding year’s diagnosed disease conditions, the Company’s revenue in future periods may be adversely impacted.
The ultimate impact of the COVID-19 pandemic on the Company’s operations is unknown and will depend on future developments, which are highly uncertain and cannot be predicted with confidence, including the duration of the COVID-19 outbreak, new information which may emerge concerning the severity of the
COVID-19
pandemic, and any additional preventative and protective actions that governments, or the Company, may direct, which may result in an extended period of continued business disruption. The ultimate impact of these matters to the Company and its financial condition cannot be reasonably estimated at this time.T
he Company believes that its cash resources, funds from the IPO in April 2021, borrowing capacity available under the 2021 Secured Revolving Facility, and cash flow generated from operations will continue to be sufficient to withstand the financial impact of the pandemic, and will enable the Company to continue to support its operations, regulatory requirements, debt repayment obligations, and geography expansion for the foreseeable future.Regulatory Matters
The healthcare industry is subject to numerous laws and regulations of federal, state, and local governments. Violations of these laws and regulations could result in expulsion from government healthcare programs, together with the imposition of significant fines and penalties. Compliance with such laws and regulations can be subject to future government review and interpretation, as well as regulatory actions unknown or unasserted at this time.
The healthcare regulatory landscape is constantly changing. It is difficult to predict which final rules may be adopted and implemented by federal and state authorities, and if such final rules would result in any material adverse effect on the Company’s business, consolidated financial condition, results of operations or cash flows. Management is unable to determine how any future government spending cuts will affect Medicare reimbursement. There likely will continue to be legislative and regulatory proposals at the federal and state levels directed at containing or lowering the cost of healthcare that, if adopted, could have a material adverse effect on the Company’s condensed consolidated financial statements.
Compliance Requirements
In February 2018, the Company self-disclosed to the California Department of Managed Health Care (“DMHC”), the California Department of Health Care Services, and its affected payors certain noncompliant practices in the Company’s claims and utilization management. The Company submitted various reports in
May,
F-15
June, and August of 2018 and coordinated with the DMHC and certain of its payors to remediate noncompliant claims and utilization management practices and implement improvements through various corrective action plan (“CAPs”). On December 17, 2019, the Company completed substantial remediation of all known deficiencies identified by the DMHC’s audit findings. In February 2021, the Company completed divesting all of its California operations. On March 9, 2021, the Company received a set of investigative interrogatories from the DMHC pursuant to its investigation of conduct and matters described in the Company’s various reports. The interrogatories sought information concerning certain claims data and authorizations denied due to lack of medical necessity, including information regarding the health plans affected thereby. The Company responded timely to such interrogatories and provided requested information. Any adverse review, audit or investigation could result in, among other things: refunding of amounts the Company have been paid pursuant to its contracts; or the imposition of fines, penalties and other sanctions on the Company, or certain of its payors. While the Company does not expect the amount to be material, it is unable to predict the potential dollar value of recoupments or fines, penalties or other sanctions that may be imposed on the Company or the impacted payors related to the DMHC’s audit findings, if any. Per publicly available information,5 (5) out of the 9 (9) impacted payors have entered into letters of agreement with the DMHC whereby each of the payors have agreed to pay an administrative penalty related to the deficiencies. These penalties equal $122,500 in the aggregate. The DMHC has imposed an administrative penalty on at least one of the remaining impacted
p
ayors
. At least one payor has formally sought indemnification from the Company in the amount of $80,000 for penalties related to the DMHC audit findings. The Company is unable to predict the potential dollar value of claims or demands that could be asserted in the future, if any. While the Company has divested all of its California operations as of February 2021, for the Southern California and Fresno divestiture transactions the Company will continue to be responsible for any liabilities arising from the business which were incurred prior to the closing date of each transaction, including any fines, penalties and other sanctions relating to the DMHC matter described above, the payment of claims for medical services incurred prior to the effective date of each transaction, a liability for unrecognized tax benefits for which the Company is indemnified and other contingent liabilities that the Company currently believes are remote.Contractual Obligations
The Company’s capital commitments to physician partners to support physician partner expansion and related purposes increased by $23.2 million, to $41.9 million at June 30, 2021 when compared to December 31, 2020. There have been no other material changes, outside of the ordinary course of business and indebtedness (see Note 7), to the Company’s commitments during the six months ended June 30, 2021.
NOTE 9. Common Stock
Common Stock
As of June 30, 2021, the Company’s authorized capital stock consisted of 2.0 billion shares of common stock, par value $0.01 per share.
2021
On April 14, 2021, the Company priced the IPO of its common stock at an offering price of $23.00 per share for 46,600,000 shares, pursuant to the Prospectus. On April 15, 2021, the underwriters exercised their option to purchase an additional 6,990,000 shares of common stock. On April 19, 2021, the Company’s sale of an aggregate of 53,590,000 shares of common stock was completed, see Note 1.
Upon the completion of the IPO, the Company issued 11.7 million shares of common stock under partner physician group equity agreements and recognized stock-based compensation expense of $268.5 million in April 2021, see
Note 1.
F-16
2020.
Contingently Redeemable Common Stock
2020.
The private placements of contingently redeemable common stock had a redemption feature that required the Company, in certain limited circumstances, to repurchase stock. Because the redemption feature was outside the control of the Company, the related capital contribution did not qualify as permanent equity and was classified as temporary equity in the mezzanine section of the condensed consolidated balance sheet. The redemption feature terminated upon the completion of an initial public offering of the Company’s common stock. The common stock classified as temporary equity was recorded at an initial carrying value equal to the gross proceeds received, which represented their fair value at the date of issuance.
The redemption feature of the Company’s contingently redeemable common stock terminated upon the completion of the IPO in April 2021. Accordingly, such common stock was reclassified from temporary equity in the mezzanine section of the condensed consolidated balance sheet to permanent equity, see Note 1.
NOTE 10. Net Income (Loss) Per Common Share
Basic net income (loss) per common share (“EPS”) is computed based upon the weighted average number of common shares outstanding. Diluted net income (loss) per common share is computed based upon the weighted average number of common shares outstanding plus the impact of common shares issuable from the assumed conversion of stock options, certain performance restricted stock units and unvested restricted stock units. Only those instruments having a dilutive impact on basic loss per share are included in diluted loss per share during the periods presented.
The following table illustrates the computation of basic and diluted EPS (in thousands, except per share amounts):
Three Months Ended June 30, | Six Months Ended June 30, | |||||||||||||||
2021 | 2020 | 2021 | 2020 | |||||||||||||
Numerator | ||||||||||||||||
Income (loss) from continuing operations | $ | (297,329 | ) | $ | (3,445 | ) | $ | (311,065 | ) | $ | (11,306 | ) | ||||
Income (loss) from discontinued operations | (1,612 | ) | (4,466 | ) | (3,027 | ) | (12,704 | ) | ||||||||
Noncontrolling interests’ share in (earnings) loss | 96 | 0 | 169 | 0 | ||||||||||||
Net income (loss) attributable to common stockholders | $ | (298,845 | ) | $ | (7,911 | ) | $ | (313,923 | ) | $ | (24,010 | ) | ||||
Denominator | ||||||||||||||||
Weighted average shares outstanding, basic and diluted | 377,445 | 323,702 | 351,695 | 321,827 | ||||||||||||
Net income (loss) per share attributable to common stockholders | ||||||||||||||||
Net income (loss) per common share from continuing operations, basic and diluted | $ | (0.79 | ) | $ | (0.01 | ) | $ | (0.88 | ) | $ | (0.03 | ) | ||||
Net income (loss) per common share from discontinued operations, basic and diluted | $ | 0 | $ | (0.01 | ) | $ | (0.01 | ) | $ | (0.04 | ) | |||||
F-17
Basic net income (loss) per share is the same as diluted net income (loss) per share for each period presented, as the inclusion of all potential common shares outstanding would have been antidilutive. The following table provides the weighted-average potential shares of common stock that were excluded from the calculation of diluted net income (loss) per share attributable to common stockholders because their effect would have been anti-dilutive (in thousands):
Six Months Ended June 30, | ||||||||
2021 | 2020 | |||||||
Stock options—service only condition | 24,542 | 26,620 | ||||||
Stock options—market and/or performance condition | 16,655 | 18,315 | ||||||
Restricted stock units | 881 | 138 | ||||||
NOTE 11. Discontinued Operations
Discontinued operations are a component of an entity that has either been disposed of or is deemedand, (i) the operations and cash flows of the component have been or will be eliminated from ongoing operations as a result of the disposal transaction, and (ii) the entity will not have any significant continuing involvement in the operations of the component after the disposal transaction.
held-for-sale
During 2020, the Company implemented a plan to divest its California operations, which included the entirety of its Medicaid line of business, via three separate transactions with different parties. In August 2020, the Company disposed of its Southern California operations for a gross sale price of $2.5 million and recognized a
gain on sale of $1.3 million. In October 2020, the Company disposed of its Fresno, California operations for a gross sales price of $26.0 million and recognized a gain on sale of approximately $19.0 million. The Company retained the working capital of both disposal groups and, therefore, such working capital accounts are not presented as assets and liabilities related to discontinued operations in the condensed consolidated balance sheets. In November 2020, the Company signed a letter of intent to sell its remaining California operations for a gross sales price of $1.0 million. The sale closed in February 2021.
The Company’s decision to exit California and the Medicaid line of business represents a strategic shift that will have a major effect on its operations and financial results. As such, the Company’s California operations are reflected in the condensed consolidated financial statements as discontinued operations.
See Note 8 for additional details on the Company’s investigative interrogatories from the DMHC.
F-18
The results of discontinued operations are as follows (in thousands):
Three Months Ended June 30, | Six Months Ended June 30, | |||||||||||||||
2021 | 2020 | 2021 | 2020 | |||||||||||||
Revenues: | ||||||||||||||||
Medical services revenu e | $ | (534 | ) | $ | 51,757 | $ | 3,313 | $ | 101,941 | |||||||
Other operating revenue | 0 | 56 | 23 | 111 | ||||||||||||
Total revenues | (534 | ) | 51,813 | 3,336 | 102,052 | |||||||||||
Expenses: | ||||||||||||||||
Medical services expense | (1,266 | ) | 28,981 | (628 | ) | 57,421 | ||||||||||
Other medical expenses | 11 | 18,741 | 2,491 | 37,863 | ||||||||||||
General and administrative | 2,154 | 8,351 | 4,742 | 19,030 | ||||||||||||
Depreciation and amortization | 33 | 163 | 87 | 328 | ||||||||||||
Income (loss) from operations | (1,466 | ) | (4,423 | ) | (3,356 | ) | (12,590 | ) | ||||||||
Other income (expense), net | (81 | ) | 154 | (33 | ) | 336 | ||||||||||
Gain (loss) on sale of assets | 0 | 0 | 491 | 0 | ||||||||||||
Interest expense | 0 | (71 | ) | 0 | (175 | ) | ||||||||||
Income (loss) before income taxes | (1,547 | ) | (4,340 | ) | (2,898 | ) | (12,429 | ) | ||||||||
Income tax benefit (expense) | (65 | ) | (126 | ) | (129 | ) | (275 | ) | ||||||||
Net income (loss) from discontinued operations | $ | (1,612 | ) | $ | (4,466 | ) | $ | (3,027 | ) | $ | (12,704 | ) | ||||
The following table provides significant
non-cash
operating items for discontinued operations that are included in the condensed consolidated statements of cash flows (in thousands):Six Months Ended June 30, | ||||||||
2021 | 2020 | |||||||
Non-cash operating activities from discontinued operations: | ||||||||
Depreciation and amortization | $ | 87 | $ | 328 | ||||
Stock-based compensation expense | 0 | 127 | ||||||
NOTE 12. Supplemental Cash Flow Information
The following table provides supplemental cash flow information (in thousands):
Six Months Ended June 30, | ||||||||
2021 | 2020 | |||||||
Supplemental cash flow information: | ||||||||
Interest paid | $ | 2,907 | $ | 4,055 | ||||
Income taxes paid | 1,653 | — | ||||||
Supplemental disclosure of non-cash investing and financing activities | ||||||||
Right-of-use | 861 | — | ||||||
Reclassification of contingently redeemable common stock in connection with IPO | 309,500 | — | ||||||
Issuance of common stock under partner physician group equity agreements upon IPO | 268,467 | — | ||||||
Deferred offering costs accrued at end of period | 558 | — �� | ||||||
Non-cash investment in unconsolidated subsidiaries | 763 | — | ||||||
F-19
The following table summarizes cash, cash equivalents and restricted cash equivalents from continuing operations (in thousands):
June 30, 2021 | December 31, 2020 | |||||||
Cash and cash equivalents | $ | 1,109,372 | $ | 106,795 | ||||
Restricted cash and equivalents (1) | 16,343 | 28,383 | ||||||
Cash, cash equivalents and restricted cash equivalents | $ | 1,125,715 | $ | 135,178 | ||||
| (1) | Restricted cash and equivalents primarily consist of amounts used as collateral to secure letters of credit that the Company is required to maintain pursuant to contracts with payors. |
NOTE 13. Variable Interest Entities
Consolidated Variable Interest Entities
agilon health, inc.’s consolidated assets and liabilities as of June 30, 2021 and December 31, 2020 include certain assets of VIEs that can only be used to settle the liabilities of the related VIE. The VIE creditors do not have recourse to agilon health, inc.
agilon health, inc.’s consolidated assets and liabilities include VIE assets and liabilities as follows (in thousands):
June 30, 2021 | December 31, 2020 | |||||||
Assets (1) | ||||||||
Cash and cash equivalents | $ | 93,835 | $ | 93,053 | ||||
Restricted cash equivalents | 14,202 | 25,032 | ||||||
Receivables, net | 319,178 | 136,636 | ||||||
Prepaid expenses and other current assets, net | 2,106 | 5,986 | ||||||
Property and equipment, net | 735 | 797 | ||||||
Intangible assets, net | 8,469 | 8,208 | ||||||
Other assets, net | 17,382 | 13,343 | ||||||
Assets held for sale and discontinued operations, net | — | 4,825 | ||||||
Liabilities (1) | ||||||||
Medical claims and related payables | 244,014 | 97,146 | ||||||
Accounts payable and accrued expenses | 74,941 | 62,294 | ||||||
Other liabilities | 11,635 | 10,926 | ||||||
Liabilities held for sale and discontinued operations | — | 3,682 | ||||||
| (1) | Assets and liabilities of VIEs presented above include the assets and liabilities of the Company’s Independent Practice Associations in California, which are consolidated VIEs and whose operations are reflected in the condensed consolidated financial statements as discontinued operations. |
Risk-bearing Entities.
wholly-owned risk-bearing entities (“RBEs”) for the purpose of entering into risk-bearing contracts with payors. Each RBE’s equity at risk is considered insufficient to finance its activities without additional support, and,
therefore, each RBE is considered a VIE. The Company consolidates the RBEs as it has determined that it is the primary beneficiary because it has: (i)
the ability to control the activities that most significantly impact the RBEs’ economic performance; and (ii) the obligation to absorb losses or right to receive benefits that could potentially be significant to the RBEs. Specifically, the Company has the unilateral ability and authority, through the RBE governance and management
F-20
a
greements, to make significant decisions about strategic and operating activities of the RBEs, including negotiating and entering into risk-bearing contracts with payors and approving the RBEs’ annual operating budgets. The Company also has the obligation to fund losses of the RBEs and the right to receive a significant percentage of any financial surplus generated by the RBEs. The assets of the RBEs primarily consist of cash and cash equivalents, receivables, net, intangible assets, net, and other assets, net; its obligations primarily consist of medical claims and related payables as well as operating expenses of the RBEs (accounts payable and accrued expenses), including incentive obligations to the Company’s physician partners. On February 18, 2021, the Company executed the 2021 Credit Facilities, which are guaranteed by certain of the Company’s VIEs. Assets generated by the RBEs (primarily from medical services revenues) may be used, in certain limited circumstances, to settle the Company’s contractual debt obligations.U
nconsolidated Variable Interest EntitiesA
s of June 30, 2021, the Companyhad
7 equity method investments that were deemed to be VIEs. The Company has determined that it is not the primary beneficiary of and therefore does not consolidate the VIEs because it does not have the ability to control the activities that most significantly impact their economic performance. As of June 30, 2021 and December 31, 2020, the carrying amounts of the investments of the VIEs were $12.0 million and $8.5
million, respectively. The Company’s maximum loss exposure as a result of the Company’s involvement with the VIEs cannot be quantified. See Note 4.
F-2
1
SCHEDULE I – CONDENSED FINANCIAL INFORMATION OF REGISTRANT
agilon health, inc.
CONDENSED BALANCE SHEETS
(in thousands, except per share data)
June 30, 2021 | December 31, 2020 | |||||||
(unaudited) | ||||||||
ASSETS | ||||||||
Prepaid expenses and other current assets, net | $ | 110 | $ | — | ||||
Total current assets | 110 | — | ||||||
Investment in wholly owned subsidiary | 1,083,272 | 24,770 | ||||||
Loans receivable | 67,828 | — | ||||||
Total assets | $ | 1,151,210 | $ | 24,770 | ||||
LIABILITIES, CONTINGENTLY REDEEMABLE COMMON STOCK AND STOCKHOLDERS’ EQUITY (DEFICIT) | ||||||||
Other liabilities | $ | 763 | $ | — | ||||
Contingently redeemable common stock, $0.01 par value: 76,201 shares issued and outstanding at December 31, 2020 | — | 309,500 | ||||||
Stockholders’ equity (deficit): | ||||||||
Common stock, $0.01 par value: 2,000,000 shares authorized; 390,883 and 249,374 shares issued and outstanding, respectively | 3,909 | 2,494 | ||||||
Additional paid-in capital | 2,011,651 | 263,966 | ||||||
Accumulated deficit | (865,113 | ) | (551,190 | ) | ||||
Total stockholders’ equity (deficit) | 1,150,447 | (284,730 | ) | |||||
Total liabilities, contingently redeemable common stock and stockholders’ equity (deficit) | $ | 1,151,210 | $ | 24,770 | ||||
See accompanying Notes to the Condensed Financial Statements.
F-22
agilon health, inc.
(Parent Company Only)
CONDENSED STATEMENT OF OPERATIONS
(in thousands)
(unaudited)
Three Months Ended June 30, | Six Months Ended June 30, | |||||||||||||||
2021 | 2020 | 2021 | 2020 | |||||||||||||
Equity in net income (loss) of subsidiary | $ | (298,955 | ) | $ | (7,911 | ) | $ | (314,033 | ) | $ | (24,010 | ) | ||||
Interest income | 110 | 0 | 110 | 0 | ||||||||||||
Net income (loss) attributable to common shares | $ | (298,845 | ) | $ | (7,911 | ) | $ | (313,923 | ) | $ | (24,010 | ) | ||||
See accompanying Notes to the Condensed Financial Statements.
F-23
agilon health, inc.
(Parent Company Only)
NOTES TO CONDENSED FINANCIAL STATEMENTS
(Unaudited)
NOTE 1. Description of Agilon Health Topco, Inc.
agilon health, inc. (“Parent”) was incorporated in Delaware and indirectly owns 100% of the equity interest in agilon health management, inc. (“agilon”). Parent has no significant operations or assets other than its indirect ownership of the equity of agilon. Accordingly, Parent is dependent upon distributions from agilon to fund its obligations. However, under the terms of the agreements governing agilon’s borrowings, agilon’s ability to pay dividends or lend to Parent is restricted. While certain exceptions to the paying of dividends or lending funds restrictions exist, these restrictions have resulted in the restricted net assets (as defined in Rule
4-08(e)(3)
of RegulationS-X)
of Parent’s subsidiaries exceeding 25% of the consolidated net assets of Parent and its subsidiaries. agilon has no obligation to pay dividends to Parent.A condensed statement of cash flows has not been presented, as agilon health, inc. did not have any cash as of, or for the six months ended June 30, 2021 and 2020, see Note 3 to the for issuances of common stock.
NOTE 2. Basis of Presentation
The accompanying condensed Parent-only financial statements include the amounts of Parent and its investment in agilon under the equity method, and do not present the financial statements of Parent and agilon on a consolidated basis. Under the equity method, Parent’s investment in agilon is stated at cost plus contributions and equity in undistributed income (loss) of agilon less distributions received since the date of acquisition.
These condensed Parent-only financial statements have been prepared using the same accounting principles and policies described in the notes to the agilon health, inc. consolidated financial statements, with the only exception being that Parent accounts for its subsidiaries using the equity method. These condensed Parent-only financial statements should be read in conjunction with the agilon health, inc. consolidated financial statements and their accompanying notes.
NOTE 3. Equity
A discussion of Parent’s contingently redeemable common stock and stockholders’ equity activities for the three and six months ended June 30, 2021 and 2020 can be found in Note 9 in “Notes to the Condensed Consolidated Financial Statements” of the condensed interim consolidated financial statements of agilon health, inc.
There were 0 cash dividends paid to Parent from agilon’s consolidated subsidiaries for the six months ended June 30, 2021 and 2020.
F-24
REPORT OF INDEPENDENT REGISTERED PUBLIC ACCOUNTING FIRM
To the Board of Directors and Stockholders of agilon health, inc.
Opinion on the Financial Statements
We have audited the accompanying consolidated balance sheets of agilon health, inc. (the Company) as of December 31, 2020 and 2019, the related consolidated statements of operations, contingently redeemable common stock and stockholders’ equity (deficit), and cash flows for each of the three years in the period ended December 31, 2020, and the related notes and the financial statement schedules in Item 16 (collectively referred to as the “consolidated financial statements”). In our opinion, the consolidated financial statements present fairly, in all material respects, the financial position of the Company at December 31, 2020 and 2019, and the results of its operations and its cash flows for each of the three years in the period ended December 31, 2020, in conformity with U.S. generally accepted accounting principles.
Basis for Opinion
These financial statements are the responsibility of the Company’s management. Our responsibility is to express an opinion on the Company’s financial statements based on our audits. We are a public accounting firm registered with the Public Company Accounting Oversight Board (United States) (PCAOB) and are required to be independent with respect to the Company in accordance with the U.S. federal securities laws and the applicable rules and regulations of the Securities and Exchange Commission and the PCAOB.
We conducted our audits in accordance with the standards of the PCAOB. Those standards require that we plan and perform the audit to obtain reasonable assurance about whether the financial statements are free of material misstatement, whether due to error or fraud. The Company is not required to have, nor were we engaged to perform, an audit of its internal control over financial reporting. As part of our audits we are required to obtain an understanding of internal control over financial reporting but not for the purpose of expressing an opinion on the effectiveness of the Company’s internal control over financial reporting. Accordingly, we express no such opinion.
Our audits included performing procedures to assess the risks of material misstatement of the financial statements, whether due to error or fraud, and performing procedures that respond to those risks. Such procedures included examining, on a test basis, evidence regarding the amounts and disclosures in the financial statements. Our audits also included evaluating the accounting principles used and significant estimates made by management, as well as evaluating the overall presentation of the financial statements. We believe that our audits provide a reasonable basis for our opinion.
Critical Audit Matter
The critical audit matter communicated below is a matter arising from the current period audit of the financial statements that was communicated or required to be communicated to the audit committee and that: (1) relates to accounts or disclosures that are material to the financial statements and (2) involved our especially challenging, subjective or complex judgments. The communication of the critical audit matter does not alter in any way our opinion on the consolidated financial statements, taken as a whole, and we are not, by communicating the critical audit matter below, providing a separate opinion on the critical audit matter or on the accounts or disclosures to which it relates.
F-25
Valuation of incurred but not reported claims | ||
Description of the Matter | As of December 31, 2020, the Company’s medical claims and related payables totaled $164.2 million, substantially all of which related to the Company’s estimate for claims that have been incurred but have either not yet been received, processed, or paid and as such, not reported (“IBNR”). As discussed in Note 2 of the consolidated financial statements, management develops its IBNR liability estimate using actuarial methods commonly used by health insurance actuaries that include a number of factors and assumptions, including medical service utilization trends, historical claims payment patterns, changes in membership, observed medical cost trends and other factors. Auditing management’s estimate of the IBNR liability was complex and required the involvement of actuarial specialists due to the highly judgmental nature of the factors and assumptions used in the measurement process. These assumptions have a significant effect on the valuation of the IBNR liability. | |
How We Addressed the Matter in Our Audit | To test the IBNR liability, our audit procedures included, among others, testing the completeness and accuracy of data used in the Company’s models by testing reconciliations of underlying claims and membership data recorded in source systems to the actuarial reserve models, and comparing claims to source documentation. With the assistance of our actuarial specialists, we compared methods and assumptions used by management with historical experience, consistency with generally accepted actuarial methodologies used within the industry, and observable healthcare trend levels within the industry the Company operates. With the assistance of our actuarial specialists, we used the Company’s underlying claims and membership data to develop an independent range of IBNR estimates and compared management’s recorded IBNR liability to our range. Additionally, we performed a review of prior period estimates using subsequent claims development, and we evaluated management’s IBNR disclosures. | |
/s/ Ernst & Young LLP
We have served as the Company’s auditor since 2017.
Los Angeles, California
August 30, 2021
F-26
agilon health, inc.
CONSOLIDATED BALANCE SHEETS
(in thousands, except per share data)
December 31, | ||||||||
2020 | 2019 | |||||||
ASSETS | ||||||||
Current assets: | ||||||||
Cash and cash equivalents | $ | 106,795 | $ | 123,633 | ||||
Restricted cash and equivalents | 28,383 | 15,519 | ||||||
Receivables, net | 144,555 | 93,254 | ||||||
Prepaid expenses and other current assets, net | 9,639 | 4,312 | ||||||
Current assets held for sale and discontinued operations, net | 4,825 | 8,810 | ||||||
Total current assets | 294,197 | 245,528 | ||||||
Property and equipment, net | 6,456 | 7,152 | ||||||
Intangible assets, net | 60,468 | 71,146 | ||||||
Goodwill | 41,540 | 41,540 | ||||||
Other assets, net | 43,700 | 33,284 | ||||||
Non-current assets held for sale and discontinued operations, net | — | 4,144 | ||||||
Total assets | $ | 446,361 | $ | 402,794 | ||||
LIABILITIES, CONTINGENTLY REDEEMABLE COMMON STOCK AND STOCKHOLDERS’ EQUITY (DEFICIT) | ||||||||
Current liabilities: | ||||||||
Medical claims and related payables | $ | 162,868 | $ | 120,705 | ||||
Accounts payable and accrued expenses | 97,244 | 67,555 | ||||||
Current portion of long-term debt | 3,041 | 3,041 | ||||||
Current liabilities held for sale and discontinued operations | 3,682 | 8,309 | ||||||
Total current liabilities | 266,835 | 199,610 | ||||||
Long-term debt, net of current portion | 64,665 | 67,143 | ||||||
Other liabilities | 90,091 | 86,949 | ||||||
Non-current liabilities held for sale and discontinued operations | — | 120 | ||||||
Total liabilities | 421,591 | 353,822 | ||||||
Commitments and contingencies | 0 | 0 | ||||||
Contingently redeemable common stock, 76,201 and 69,860 shares issued and outstanding, respectively | 309,500 | 281,000 | ||||||
Stockholders’ equity (deficit): | ||||||||
Common stock, $0.01 par value: 500,000 shares authorized; 249,374 and 246,743 shares issued and outstanding, respectively | 2,494 | 2,467 | ||||||
Additional paid-in capital | 263,966 | 256,643 | ||||||
Accumulated deficit | (551,190 | ) | (491,138 | ) | ||||
Total stockholders’ equity (deficit) | (284,730 | ) | (232,028 | ) | ||||
Total liabilities, contingently redeemable common stock and stockholders’ equity (deficit) | $ | 446,361 | $ | 402,794 | ||||
The consolidated balance sheets include assets and liabilities of consolidated variable interest entities (“VIEs”), as the Company is the primary beneficiary of these VIEs. The consolidated balance sheets include total assets that can be used only to settle obligations of the Company’s consolidated VIEs totaling $287.9 million and $160.0 million as of December 31, 2020 and 2019, respectively, and total liabilities of the Company’s consolidated VIEs for which creditors do not have recourse to the general credit of the primary beneficiary of $174.0 million and $116.6 million as of December 31, 2020 and 2019, respectively. See Note 17 for additional details.
See accompanying Notes to the Consolidated Financial Statements.
F-27
agilon health, inc.
CONSOLIDATED STATEMENTS OF OPERATIONS
(in thousands, except per share data)
Year Ended December 31, | ||||||||||||
2020 | 2019 | 2018 | ||||||||||
Revenues: | ||||||||||||
Medical services revenue | $ | 1,214,270 | $ | 788,566 | $ | |||||||
Other operating revenue | 4,063 | 5,845 | 8,215 | |||||||||
Total revenues | 1,218,333 | 794,411 | 474,827 | |||||||||
Expenses: | ||||||||||||
Medical services expense | 1,021,877 | 725,374 | 412,669 | |||||||||
Other medical expenses | 102,306 | 40,526 | 34,092 | |||||||||
General and administrative | 137,292 | 122,832 | 88,745 | |||||||||
Depreciation and amortization | 13,531 | 12,253 | 11,385 | |||||||||
Total expenses | 1,275,006 | 900,985 | 546,891 | |||||||||
Income (loss) from operations | (56,673 | ) | (106,574 | ) | (72,064 | ) | ||||||
Other income (expense): | ||||||||||||
Other income (expense), net | 2,465 | 955 | 611 | |||||||||
Interest expense | (8,135 | ) | (9,068 | ) | (9,839 | ) | ||||||
Income (loss) before income taxes | (62,343 | ) | (114,687 | ) | (81,292 | ) | ||||||
Income tax benefit (expense) | (865 | ) | 232 | 113 | ||||||||
Income (loss) from continuing operations | (63,208 | ) | (114,455 | ) | (81,179 | ) | ||||||
Discontinued operations: | ||||||||||||
Income (loss) before impairments, gain (loss) on sales and income taxes | (20,049 | ) | (86,108 | ) | (32,132 | ) | ||||||
Impairments | — | (98,343 | ) | (40,794 | ) | |||||||
Gain (loss) on sales of assets, net | 20,401 | — | 0 | |||||||||
Income tax benefit (expense) | 2,804 | 16,166 | 7,588 | |||||||||
Total discontinued operations | 3,156 | (168,285 | ) | (65,338 | ) | |||||||
Net income (loss) | (60,052 | ) | (282,740 | ) | (146,517 | ) | ||||||
Noncontrolling interests’ share in discontinued operations | — | 152 | (409 | ) | ||||||||
Net income (loss) attributable to common shares | $ | (60,052 | ) | $ | (282,588 | ) | $ | (146,926 | ) | |||
Net income (loss) per common share, basic and diluted | ||||||||||||
Continuing operations | $ | (0.20 | ) | $ | (0.39 | ) | $ | (0.33 | ) | |||
Discontinued operations | $ | 0.01 | $ | (0.57 | ) | $ | (0.26 | ) | ||||
Weighted average shares outstanding, basic and diluted | 323,462 | 294,738 | 250,783 | |||||||||
See accompanying Notes to the Consolidated Financial Statements.
F-28
agilon health, inc.
CONSOLIDATED STATEMENTS OF CONTINGENTLY REDEEMABLE COMMON STOCK AND STOCKHOLDERS’ EQUITY (DEFICIT)
(in thousands)
Contingently Redeemable Common Stock | Total Stockholders’ Equity (Deficit) | |||||||||||||||||||||||||||||||||||
Common Stock | Additional Paid-In Capital | Accumulated Deficit | Noncontrolling Interests | Total Stockholders’ Equity (Deficit) | ||||||||||||||||||||||||||||||||
Shares | Amount | Shares | Amount | |||||||||||||||||||||||||||||||||
January 1, 2018 | 0 | $ | 0 | 247,246 | $ | 2,472 | $ | 245,392 | $ | (61,624 | ) | $ | 46 | $ | 186,286 | |||||||||||||||||||||
Net income (loss) | — | — | — | — | — | (146,926 | ) | 409 | (146,517 | ) | ||||||||||||||||||||||||||
Issuance of contingently redeemable common stock | 26,444 | 100,000 | — | — | — | — | — | — | ||||||||||||||||||||||||||||
Repurchase of common stock, net | — | — | (1,825 | ) | (18 | ) | (1,806 | ) | — | — | (1,824 | ) | ||||||||||||||||||||||||
Stock-based compensation expense | — | — | — | — | 3,651 | — | — | 3,651 | ||||||||||||||||||||||||||||
January 1, 2019 | 26,444 | $ | 100,000 | 245,421 | $ | 2,454 | $ | 247,237 | $ | (208,550 | ) | $ | 455 | $ | 41,596 | |||||||||||||||||||||
Net income (loss) | — | — | — | — | — | (282,588 | ) | (152 | ) | (282,740 | ) | |||||||||||||||||||||||||
Issuance of contingently redeemable common stock | 43,416 | 181,000 | — | — | (806 | ) | — | — | (806 | ) | ||||||||||||||||||||||||||
Settlement of stock-based liabilities | — | — | 1,322 | 13 | 4,987 | — | — | 5,000 | ||||||||||||||||||||||||||||
Stock-based compensation expense | — | — | — | — | 5,225 | — | — | 5,225 | ||||||||||||||||||||||||||||
Distribution to noncontrolling interests | — | — | — | — | — | — | (303 | ) | (303 | ) | ||||||||||||||||||||||||||
January 1, 2020 | 69,860 | $ | 281,000 | 246,743 | $ | 2,467 | $ | 256,643 | $ | (491,138 | ) | $ | — | $ | (232,028 | ) | ||||||||||||||||||||
Net income (loss) | — | — | — | — | — | (60,052 | ) | — | (60,052 | ) | ||||||||||||||||||||||||||
Issuance of contingently redeemable common stock | 6,341 | 28,500 | — | — | (460 | ) | — | — | (460 | ) | ||||||||||||||||||||||||||
Issuance of common stock | — | — | 1,235 | 13 | 5,537 | — | — | 5,550 | ||||||||||||||||||||||||||||
Repurchase of common stock | — | — | (1,500 | ) | (15 | ) | (6,727 | ) | — | — | (6,742 | ) | ||||||||||||||||||||||||
Exercises and vesting of stock-based awards | — | — | 2,562 | 26 | 788 | — | — | 814 | ||||||||||||||||||||||||||||
Settlement of stock-based liabilities | — | — | 334 | 3 | 1,497 | — | — | 1,500 | ||||||||||||||||||||||||||||
Stock-based compensation expense | — | — | — | — | 6,688 | — | — | 6,688 | ||||||||||||||||||||||||||||
December 31, 2020 | 76,201 | $ | 309,500 | 249,374 | $ | 2,494 | $ | 263,966 | $ | (551,190 | ) | $ | — | $ | (284,730 | ) | ||||||||||||||||||||
agilon health, inc.
CONSOLIDATED STATEMENTS OF CASH FLOWS
(in thousands)
Year Ended December 31, | ||||||||||||
2020 | 2019 | 2018 | ||||||||||
Cash flows from operating activities: | ||||||||||||
Net income (loss) | $ | (60,052 | ) | $ | (282,740 | ) | $ | (146,517 | ) | |||
Adjustments to reconcile net loss to net cash used in operating activities: | ||||||||||||
Depreciation and amortization | 14,099 | 41,413 | 21,179 | |||||||||
Stock-based compensation expense | 6,688 | 5,225 | 3,651 | |||||||||
Deferred income taxes and uncertain tax positions | (2,809 | ) | (16,177 | ) | (8,012 | ) | ||||||
Release of indemnification assets | 3,475 | 19,219 | 7,330 | |||||||||
Impairments | — | 98,343 | 40,794 | |||||||||
(Gain) loss on sale of assets, net | (20,401 | ) | — | — | ||||||||
Other non-cash items | (676 | ) | (2,321 | ) | 6,448 | |||||||
Changes in operating assets and liabilities: | ||||||||||||
Receivables, net | (59,381 | ) | (23,280 | ) | (40,628 | ) | ||||||
Prepaid expense and other current assets | (5,085 | ) | (565 | ) | 142 | |||||||
Other assets | (1,977 | ) | 2,425 | (17 | ) | |||||||
Medical claims and related payables | 42,383 | 19,810 | 12,169 | |||||||||
Accounts payable and accrued expenses | 24,922 | 18,451 | 20,332 | |||||||||
Other liabilities | 5,610 | 16,336 | 15,598 | |||||||||
Net cash provided by (used in) operating activities | (53,204 | ) | (103,861 | ) | (67,531 | ) | ||||||
Cash flows from investing activities: | ||||||||||||
Purchase of property and equipment, net | (1,775 | ) | (2,892 | ) | (2,101 | ) | ||||||
Purchase of intangible assets, net | (575 | ) | (1,014 | ) | (3,000 | ) | ||||||
Investments in loans receivable and other | (3,847 | ) | (1,154 | ) | (2,869 | ) | ||||||
Proceeds from repayment of loans receivable | 2,058 | — | — | |||||||||
Proceeds from sale of business | 26,205 | — | — | |||||||||
Net cash provided by (used in) investing activities | 22,066 | (5,060 | ) | (7,970 | ) | |||||||
Cash flows from financing activities: | ||||||||||||
Proceeds from equity issuances, net | 33,590 | 180,193 | 100,000 | |||||||||
Proceeds from exercise of stock options | 814 | — | — | |||||||||
Repurchase of shares, net | (6,742 | ) | — | (1,824 | ) | |||||||
| Proceeds from the issuance of long-term debt | — | — | 35,000 | |||||||||
Repayments of long-term borrowings | (3,041 | ) | (3,592 | ) | (47,792 | ) | ||||||
| Debt issuance costs | — | — | (641 | ) | ||||||||
Distribution to noncontrolling interests | — | (303 | ) | — | ||||||||
Net cash provided by (used in) financing activities | 24,621 | 176,298 | 84,743 | |||||||||
Net increase (decrease) in cash, cash equivalents and restricted cash and equivalents | (6,517 | ) | 67,377 | 9,242 | ||||||||
Cash, cash equivalents and restricted cash and equivalents from continuing operations, beginning of year | 139,152 | 76,414 | 66,567 | |||||||||
Cash, cash equivalents and restricted cash and equivalents from discontinued operations, beginning of year | 6,460 | 1,821 | 2,426 | |||||||||
Cash, cash equivalents and restricted cash and equivalents, beginning of year | 145,612 | 78,235 | 68,993 | |||||||||
Cash, cash equivalents and restricted cash and equivalents from continuing operations, end of year | 135,178 | 139,152 | 76,414 | |||||||||
Cash, cash equivalents and restricted cash and equivalents from discontinued operations, end of year | 3,917 | 6,460 | 1,821 | |||||||||
Cash, cash equivalents and restricted cash and equivalents, end of year | $ | 139,095 | $ | 145,612 | $ | 78,235 | ||||||
See accompanying Notes to the Consolidated Financial Statements.
F-30
agilon health, inc.
NOTES TO THE CONSOLIDATED FINANCIAL STATEMENTS
NOTE 1. Business
Description of Business
agilon health, inc. (formerly Agilon Health Topco, Inc.), together with its consolidated subsidiaries and variable interest entities (the “Company”), through its purpose-built model provides the necessary capabilities, capital, and business model for existing physician groups to create a Medicare-centric, globally capitated line of business. As of December 31, 2020, the Company, through its contracted physician networks, provided care to approximately
2017.
In March 2021, the Company’s board of directors and the stockholders of the Company approved a 100-for-1 forward stock split of the Company’s common stock, which became effective on April 1, 2021. The authorized number of common stock was proportionally increased in accordance with the 100-for-1 stock split and the par value of each class of Capital Stock was not adjusted as a result of this forward stock split. All common stock, contingently redeemable common stock, stock options, RSUs, and per share information presented within these consolidated financial statements has been adjusted to reflect this forward stock split on a retroactive basis for all periods presented
The following provides information regarding the Company’s strategic partnerships to deliver healthcare services:
| • | The Company operates an independent practice association (“IPA”) in Hawaii. |
| • | During 2017, the Company entered into a strategic partnership to expand its operations beginning January 1, 2018 into Columbus, Ohio. |
| • | During 2018, the Company entered into strategic partnerships to further expand its operations beginning January 1, 2019 into the Greater Akron/Canton area of Ohio and Austin, Texas. |
| • | During 2019, the Company entered into strategic partnerships to expand its operations beginning January 1, 2020 into: (i) Dayton, Ohio; (ii) Southeast Ohio; and (iii) Pittsburgh, Pennsylvania. |
| • | During 2020, the Company entered into a strategic partnership to further expand its operations beginning April 1, 2020 into Wilmington, North Carolina. Additionally, during 2020, the Company entered into strategic partnerships to further expand its operations beginning January 1, 2021 into: (i) Buffalo, New York; (ii) Toledo, Ohio; and (iii) Hartford, Connecticut. In December 2020, the Company entered into a strategic partnership to further expand its operations beginning January 1, 2022 into Syracuse, New York. |
| • | During 2021, the Company entered into strategic partnerships to further expand its operations beginning January 1, 2022 into: (i) Grand Rapids, Michigan; (ii) Pinehurst, North Carolina; and (iii) Longview, Texas, along with additional partnerships in the Company’s existing Ohio and Texas markets. |
| • | On April 1, 2021, the Company launched five Direct Contracting Entities that, in collaboration with seven of its physician group partners, are participating in the Center for Medicare & Medicaid Innovation’s Direct Contracting Model. |
See Note 17 for additional discussions related to the Company’s involvement with variable interest entities.
The Company is ultimately controlled by an investment fund associated with Clayton Dubilier & Rice, LLC (“CD&R”), a private equity firm headquartered in New York, New York. All funds affiliated with CD&R are considered related parties.
F-31
NOTE 2. Summary of Significant Accounting Policies
Disposition of California Operations
During 2020, the Company implemented a plan to divest its California operations, which included the entirety of its Medicaid line of business, via three separate transactions with different parties. In August 2020, the Company disposed of its Southern California operations for a gross sales price of $2.5 million and recognized a gain on sale of $1.3 million. In October 2020, the Company disposed of its Fresno, California operations for a gross sales price of $26.0 million and recognized a gain on sale of approximately $19.1 million. In December 2020, the Company signed a definitive agreement to sell its remaining California operations for a gross sales price of $1.0 million. The sale closed in February 2021. The Company’s decision to exit California and the Medicaid line of business represents a strategic shift that will have a major effect on its operations and financial results. As such, the Company’s California operations are reflected in the consolidated financial statements as discontinued operations. See Note 19 f
o
r additional information.Basis of Presentation
The accompanying consolidated financial statements have been prepared by management in accordance with accounting principles generally accepted in the United States of America (“U.S. GAAP”).
Principles of Consolidation
The consolidated financial statements include the accounts of agilon health, inc., its wholly-owned subsidiaries and VIEs that it controls through voting rights or other means. Intercompany transactions and balances have been eliminated in consolidation.
The Company is required to continually evaluate its VIE relationships and consolidate these entities when it is determined to be the primary beneficiary of their operations. A VIE is broadly defined as an entity that has any of the following three characteristics:
| i. | the equity investment at risk is insufficient to finance the entity’s activities without additional subordinated financial support; |
| ii. | substantially all of the entity’s activities either involve or are conducted on behalf of an investor that has disproportionately few voting rights; or |
| iii. | the equity investors as a group lack any of the following: |
| • | the power through voting or similar rights to direct the activities of the entity that most significantly impact the entity’s economic performance; |
| • | the obligation to absorb the expected losses of the entity; or |
| • | the right to receive the expected residual returns of the entity. |
The designation of an entity as a VIE should be reassessed upon certain events, including, but not limited to:
| i. | a change to the terms or in the ability of a party to exercise its kick-out rights; |
| ii. | a change in the capital structure of the entity; or |
| iii. | acquisitions or sales of interests that constitute a change in control. |
A variable interest holder is considered to be the primary beneficiary of a VIE if it has the power to direct the activities of a VIE that most significantly impact the entity’s economic performance and has the obligation to absorb losses or the right to receive benefits that could potentially be significant to the VIE. The Company continuously assesses whether it is (or is not) the primary beneficiary of a VIE. That assessment involves the consideration of various factors, including, but not limited to, the form of the Company’s ownership interest, its representation on the VIE’s governing body, the size and seniority of its investment, its ability and the
rights
ofF-32
other variable interest holders to participate in policy making decisions, its ability to manage its ownership interest relative to the other variable interest holders, and its ability to liquidate the entity.
Use of Estimates
Management is required to make estimates and assumptions in the preparation of financial statements. These estimates and assumptions affect the reported amounts of assets and liabilities and the disclosure of contingent assets and liabilities at the date of the consolidated financial statements and the reported amounts of revenues and expenses during the reporting period. Significant estimates can include, among other things, those used to determine revenues and related receivables from risk adjustment, medical services expense and related payables (including the reserve for incurred but not reported (“IBNR”) claims), and the valuation and related recognition of impairments of long-lived assets, including goodwill. Management’s estimates for revenue recognition, medical services expense and other estimates, judgments, and assumptions, may be materially and adversely different from actual results as a result of the
COVID-19
pandemic, among other things. These estimates are based on knowledge of current events and anticipated future events, and accordingly, actual results may ultimately differ materially from those estimates.Revenue Recognition and Receivables
Medical Services Revenue
Medical services revenue consists of capitation fees under contracts with various Medicare Advantage payors (“payors”). Under the typical capitation arrangement, the Company is entitled to monthly(“ASC 606”), to stand ready on a monthly basis to provide all aspects of necessary medical care to members for the contracted period. The Company recognizes revenue in the month in which eligible members are entitled to receive healthcare benefits during the contract term.
per-member,
per-month
(“PMPM”) fees to provide a defined range of healthcare services for Medicare Advantage health plan members (“members”) attributed to the Company’s contracted primary care physicians. PMPM fees are determined as a percent of the premium payors receive from the Centers for Medicare & Medicaid Services’ (“CMS”) for these members. The Company generally accepts full financial risk for members attributed to its contracted primary care physicians and therefore is responsible for the cost of all healthcare services required by those members. Fees are recorded gross in revenue because the Company is acting as a principal in coordinating and controlling the range of services provided (other than clinical decisions) under its capitation contracts with payors. Capitation contracts with payors are generally multi-year arrangements and have a single performance obligation that constitutes a series, as defined by Accounting Standards Codification (“ASC”) 606,Revenue From Contracts With Customers
The transaction price for the Company’s capitation contracts is variable, as the PMPM fees to which the Company is entitled are subject to periodic adjustment under CMS’s risk adjustment payment methodology. CMS deploys a risk adjustment model that determines premiums paid to all payors according to each member’s health status and certain demographic factors. Under this risk adjustment methodology, CMS calculates the risk adjusted premium payment using diagnosis data from various settings. The Company and healthcare providers collect and submit the necessary and available diagnosis data to payors and such data is utilized by the Company to estimate risk adjustment payments to be received in subsequent periods. Risk adjustment-related revenues are estimated using the most likely amount methodology and amounts are only included in revenue to the extent that it is probable that a significant reversal of cumulative revenue will not occur once any uncertainty is resolved. PMPM fees are also subject to adjustment for incentives or penalties based on the achievement of certain quality metrics defined in the Company’s contracts with payors. The Company recognizes incentive revenue as earned using the most likely amount methodology and only to the extent that it is probable that a significant reversal of cumulative revenue will not occur once any uncertainty is resolved.
Neither the Company nor any of its affiliates is a registered insurance company because state law in the states in which it operates does not require such registration for risk-bearing providers.
F-33
Receivables
Receivables primarily consist of amounts due under capitation contracts with various payors. Receivables due under capitation contracts are recorded monthly based on reports received from payors and management’s estimate of risk adjustment payments to be received in subsequent periods for open performance years. Receivables are recorded and stated at the amount expected to be collected.
Medical Services Expenses and Related Payables
Medical Services Expense
Medical services expense represents costs incurred for medical services provided to members by physicians, hospitals and other ancillary providers for which the Company is financially responsible and which are paid either directly by the Company or by payors with whom the Company has contracted. Medical services expenses are recognized in the period in which services are provided and include estimates of claims that have been incurred but have either not yet been received, processed, or paid and as such, not reported.
Such estimates are developed using actuarial methods commonly used by health insurance actuaries that include a number of factors and assumptions including medical service utilization trends, changes in membership, observed medical cost trends, historical claim payment patterns and other factors. Generally, for the most recent months, the Company estimates claim costs incurred by applying observed medical cost trend factors to the average PMPM medical costs incurred in prior months for which more complete claims data are available.
Each period, the Company
re-examines
previously established medical claims payable estimates based on actual claim submissions and other changes in facts and circumstances. As more complete claims information becomes available, the Company adjusts its estimates and recognizes those changes in estimates in the period in which the change is identified. The difference between the estimated liability and the actual settlements of claims is recognized in the period the claims are settled. The Company’s medical claims payable balance represents management’s best estimate of its liability for unpaid medical costs as of December 31, 2020 and 2019. The Company uses judgment to determine the appropriate assumptions for developing the required estimates.The Company assesses the profitability of its managed care capitation arrangement to identify contracts where current operating results or forecasts indicate probable future losses. If anticipated future variable costs exceed anticipated future revenues, a premium deficiency reserve is recognized. Premium deficiency reserves as of December 31, 2020 and 2019 were immaterial.
Other Medical Expenses
Other medical expenses include: (i) partner physician incentive expense and (ii) other provider costs. Partner physician incentive expense relates to incentive obligations to the Company’s physician partners. Other provider costs include payments for additional incentives to support physician-patient engagement and other care management expenses.
Goodwill and Amortizable Intangible Assets
Goodwill represents the excess purchase price consideration over the estimated fair value of net assets acquired in a business combination. The Company tests goodwill for impairment annually in the fourth quarter, and on an interim basis when events or changes in circumstances indicate that the carrying value may not be recoverable. The Company first assesses qualitative factors to determine whether it is more likely than not that the carrying value of a reporting unit exceeds its fair value. Qualitative analysis involves assessing situations and developments that could affect key drivers used to evaluate whether the value of goodwill is impaired. The
F-34
Company’s procedures include assessing its financial performance, macroeconomic conditions, industry and market considerations, various asset-specific factors, and entity-specific events. The Company may also elect to skip the qualitative testing and proceed directly to the quantitative testing.
In the quantitative assessment, the fair value of the reporting unit is determined primarily by an income approach, utilizing discounted cash flows and a market approach looking at comparable companies and related transactions. An impairment is recognized only to the extent that the carrying value of a reporting unit exceeds its fair value. If the fair value exceeds the carrying amount, goodwill is not considered impaired.
Amortizable intangible assets primarily relate to health plan contracts, trade names, provider networks and noncompete enforcement agreements. Amortizable intangible assets are amortized using the straight-line method over the useful life of these assets, generally between four and 30 years. The Company considers the period of expected cash flows and related underlying data used to measure the fair value of the intangible assets (or the length of time for a noncompete agreement) when selecting a useful life.
Amortizable intangible assets are subject to impairment tests when events or circumstances indicate that the carrying value of the asset, or related asset group, may not be recoverable. The Company compares the carrying value of an amortizable intangible asset (or asset group) to the future undiscounted cash flows generated by the asset (or asset group). The expected future undiscounted cash flows are calculated using the lowest level of identifiable cash flows that are largely independent of the cash flows of other assets and liabilities. When the carrying value of an intangible asset (or asset group) exceeds its expected future undiscounted cash flows, an impairment charge is recognized to the extent that the carrying value of the asset (or asset group) exceeds its fair value.
The impairment tests are based on financial projections prepared by management that incorporate anticipated results from programs and initiatives being implemented. If projections are not met, or if negative trends occur that impact the outlook, the intangible assets may be impaired.
Cash, Cash Equivalents, and Restricted Cash Equivalents
Cash and cash equivalents consist of cash on hand and highly liquid financial instruments with maturities of three months or less when purchased. The Company maintains its cash in bank deposit accounts which, at times, may exceed federally insured limits. Restricted cash equivalents primarily consist of amounts used as collateral to secure letters of credit which the Company is required to maintain pursuant to contracts with payors. Such amounts are generally maintained in certificates of deposit to satisfy these obligations and are presented as restricted cash equivalents in the consolidated balance sheets. As of December 31, 2020 and 2019, certificates of deposit totaled $21.6 million and $15.5 million, respectively.
Property and Equipment
Property and equipment are recorded at cost less accumulated depreciation. If acquired through a business combination, property and equipment are recorded at fair value at the date of acquisition. Costs incurred that significantly extend the useful life of the related assets are capitalized, while repairs and maintenance costs are expensed as incurred. Depreciation is computed using the straight-line method over the estimated useful lives of the assets, except for land, which is not depreciated.
The following represents the estimated useful lives for property and equipment:
Years | ||
Computer equipment and software | 3 – 5 | |
Furniture and fixtures | 5 – 7 | |
Building | 39 |
F-35
Leasehold improvements are depreciated over the shorter of the assets’ estimated useful life or term of the lease.
Leases
The Company determines whether a contract contains a lease based on whether it has the right to obtain substantially all of the economic benefits from the use of an identified asset that the Company does not own and whether it has the right to direct the use of that identified asset in exchange for consideration. The Company determines whether an arrangement constitutes a lease at inception. The Company’s operating leases consist primarily of long-term leases for office space. The Company’s leases do not contain any material residual value guarantees or material restrictive covenants. Right of use (“ROU”) assets represent the Company’s right to use an underlying asset for the lease term and lease liabilities represent the Company’s obligation to make lease payments arising from the lease. Most leases include one or more options to renew, with renewal terms that can extend the lease. The exercise of renewal options is at the sole discretion of the Company. ROU assets are recognized as the lease liability, adjusted for initial direct costs incurred and tenant lease incentives received. Lease liabilities are recognized as the present value of the future minimum lease payments at the lease commencement date. Since none of the Company’s leases provide an implicit rate, the Company uses its incremental borrowing rate based on the information available at the lease commencement date in determining the present value of future payments. The incremental borrowing rate is a hypothetical rate based on the Company’s understanding of what its credit rating would be to borrow and based on the resulting interest the Company would pay to borrow an amount equal to the lease payments in a similar economic environment over the lease term on a collateralized basis. The Company’s lease terms may include options to extend or terminate the lease when it is reasonably certain that the Company will exercise that option. Lease expense for minimum lease payments is recognized on a straight-line basis over the lease term.
Lease payments may be fixed or variable, however, only fixed payments or
in-substance
fixed payments are included in the Company’s lease liability calculation. Variable lease payments are recognized in operating expenses in the period in which the obligation for those payments is incurred. Short-term leases (those with terms of 12 months or less) are not recorded as ROU assets or liabilities in the consolidated balance sheets. For short-term leases, the Company recognizes rent expense in the consolidated statements of operations on a straight-line basis over the lease term.Operating leases are included in other assets, net, accounts payable and accrued expenses, and other liabilities on the Company’s consolidated balance sheets. See Note 5 for additional information.
Issuance Costs
Debt issuance costs related to debt instruments (excluding line of credit arrangements) are deferred, recorded as a reduction of the related debt liability, and amortized to interest expense over the remaining term of the related debt liability utilizing the effective interest method. Debt issuance costs related to line of credit arrangements are deferred, included in other assets, and amortized to interest expense on a straight-line basis over the remaining term of the related line of credit arrangement. Costs incurred in connection with the issuance of common shares are recorded as a reduction of additional
paid-in
capital.Contingently Redeemable Common Stock
Pursuant to the Company’s investment agreements with third-party investors, in certain limited circumstances, the Company could be required to repurchase shares. As the redemption feature is outside the control of the Company, the related capital contributions do not qualify as permanent equity and have been classified as temporary equity in the mezzanine section of the consolidated balance sheets.
F-36
Net Income (Loss) Per Share
Basic net income (loss) per common share is computed by dividing net income (loss) attributable to common shares by the weighted average number of shares of common stock outstanding during the period. Diluted net income (loss) per common share is calculated by including the effect of dilutive securities, including outstanding employee stock options, using the treasury stock method. The treasury stock method assumes a hypothetical issuance of shares to settle stock-based awards, with the assumed proceeds used to purchase common stock at the average market price for the period. Assumed proceeds include the amount the employee must pay upon exercise and the average unrecognized compensation cost. The difference between the number of shares assumed issued and number of shares assumed purchased represents the dilutive shares. Basic net loss per share is the same as diluted net loss per share for the periods presented, as the inclusion of all potential common shares outstanding would have been anti-dilutive.
Stock-based Compensation
Stock-based compensation expense for common stock options is recognized based on the fair value of the award as determined on the grant date using the Black-Scholes option pricing model. Stock-based compensation expense is recorded in general and administrative expense, with a corresponding increase in additional
paid-in
capital and is generally recognized on a straight-line basis over the vesting period. Compensation cost for options that vest based on performance conditions in addition to the employee’s continued service is recognized when the related performance condition is deemed to be probable of achievement. The fair value of awards with market conditions are valued using the Monte Carlo simulation model. Forfeitures of stock-based awards are recognized as they occur. See Note 13 for additional discussion on restricted stock units,non-employee
awards, and incentive compensation.Income Taxes
Current tax liabilities and assets are recognized for the estimated taxes payable or refundable, respectively, on the tax returns for the current year. Deferred tax assets and liabilities are recognized for the future tax consequences attributable to differences between the financial statement carrying amounts of existing assets and liabilities and their respective tax bases. Deferred tax assets and liabilities are measured using enacted tax rates expected to apply to taxable income in the year in which those temporary differences are expected to be recovered or settled. The carrying value of the Company’s net deferred tax assets is based on whether it is more likely than not that the Company will generate sufficient future taxable income to realize the deferred tax assets. A valuation allowance is established for deferred tax assets, which the Company does not believe meet the “more likely than not” threshold. The Company’s judgments regarding future taxable income may change over time due to changes in market conditions, changes in tax laws, tax planning strategies, or other factors. If the Company’s assumptions and, consequently, its estimates, change in the future, the valuation allowance may materially increase or decrease, resulting in a decrease or increase, respectively, in income tax benefit and the related impact on the Company’s reported net income (loss).
The Company utilizes a
two-step
approach to recognizing and measuring uncertain tax positions. The first step is to evaluate the tax position for recognition by determining whether the weight of available evidence indicates it is more likely than not that the position will be sustained on audit, including resolution of related appeals or litigation processes, if any. The second step is to measure the tax benefit as the largest amount which is more than likely of being realized and effectively settled. The Company considers many factors when evaluating and estimating its tax positions and tax benefits, which may require periodic adjustments, and that may not accurately forecast actual outcomes. The Company recognizes interest and penalties accrued related to unrecognized tax benefits as additional income taxes.Fair Value Measurement
The Company’s financial instruments consist of cash and cash equivalents, restricted cash equivalents, receivables, other liabilities, accounts payable, certain accrued expenses, a term loan (see Note 10), a revolving
F-37
credit facility (see Note
10), and unsecured debt (see Note
10). The carrying values of the financial instruments classified as current in the consolidated balance sheets approximate their fair values due to their short-term maturities. The carrying values of the term loan, revolving credit facility, and unsecured debt are a reasonable estimate of fair value because the interest rates on such borrowings approximate market rates as of the reporting date. Such borrowings are classified within Level
2of the fair value hierarchy. During the years ended December
31,
2020and
2019, there were
0material transfers of financial assets or liabilities within the fair value hierarchy.
The Company measures and discloses the fair value of nonfinancial and financial assets and liabilities utilizing a hierarchy of valuation techniques based on whether the inputs to a fair value measurement are considered to be observable or unobservable in a marketplace. Observable inputs reflect market data obtained from independent sources, while unobservable inputs reflect the Company’s market assumptions. This hierarchy requires the use of observable market data when available. These inputs have created the following fair value hierarchy:
| • | Level 1—quoted prices for identical instruments in active markets; |
| • | Level 2—quoted prices for similar instruments in active markets; quoted prices for identical or similar instruments in markets that are not active; and model-derived valuations in which significant inputs and significant value drivers are observable in active markets; and |
| • | Level 3—fair value measurements derived from valuation techniques in which one or more significant inputs or significant value drivers are unobservable. |
The Company is responsible for determining fair value, as well as for assigning the appropriate level within the fair value hierarchy, based on the significance of unobservable inputs. The Company reviews methodologies, processes and controls of third-party pricing services and performs ongoing analyses of both prices received from third-party pricing services and those developed internally to determine whether they represent appropriate estimates of fair value.
Segment Reporting
The Company is organized as a single operating and reportable segment based on the manner in which the Chief Executive Officer, who is the chief operating decision maker, evaluates performance and makes decisions about how to allocate resources.
Recent Accounting Pronouncements
2020 Adoption
Stock Compensation.
2018-07,
Compensation—Stock Compensation (Topic 718) – Improvements to Nonemployee Share-Based Payment Accounting
2018-07”).
The update expands the scope of ASC Topic 718,Compensation—Stock Compensation
2018-07
specifies that ASC 718 applies to all share-based payment transactions in which a grantor acquires goods or services to be used or consumed in a grantor’s own operations by issuing share-based payment awards. The amendments in the update also clarify that ASC 718 does not apply to share-based payments used to effectively provide: (i) financing to the issuer or (ii) awards granted in conjunction with selling goods or services to customers as part of a contract accounted for under ASC 606. The update is effective for fiscal years beginning after December 15, 2019, and interim periods within fiscal years beginning after December 15, 2020. Early adoption is permitted, but no earlier than an entity’s adoption date of ASC 606. The Company adopted ASU2018-07
effective January 1, 2020. The adoption of ASU2018-07
did not have a material impact on the Company’s consolidated financial statements.F-38
Income Taxes.
2019-12,
Income Taxes (Topic 740): Simplifying the Accounting for Income Taxes
2019-12”).
The amendments in this ASU2019-12
simplify the accounting for income taxes by eliminating certain exceptions to the general principles in Topic 740 related to the approach for intraperiod tax allocations. The amendments also improve consistent application of and simplify U.S. GAAP for other areas of Topic 740 by clarifying and amending existing guidance. The update is effective for fiscal years beginning after December 15, 2021, and interim periods within fiscal years beginning after December 15, 2022. Early adoption is permitted. The Company early adopted ASU2019-12
effective January 1, 2020. As a result of the ASU2019-12
adoption, the exception to the intraperiod tax allocation rules due to a loss from continuing operations and income or a gain from discontinued operation was eliminated and the Company followed the general intraperiod allocation to determine total tax expense. See Note 14 for additional information.Not Yet Adopted
Credit Losses.
2016-13,
Measurement of Credit Losses on Financial Instruments
2016-13”).
ASU2016-13
is intended to improve financial reporting by requiring timelier recognition of credit losses on loans and other financial instruments held at amortized cost. The amendments in ASU2016-13
eliminate the “probable” initial threshold for recognition of credit losses in current accounting guidance and, instead, reflect an entity’s current estimate of all expected credit losses over the life of the financial instrument. Currently, when credit losses are measured under current accounting guidance, an entity generally only considers past events and current conditions in measuring the incurred loss. The amendments in ASU2016-13
broaden the information that an entity must consider in developing its expected credit loss estimate for assets measured either collectively or individually. The use of forecasted information incorporates more timely information in the estimate of expected credit loss. In November 2019, the FASB issued ASU2019-10,
Financial Instruments—Credit Losses (Topic 326), Derivatives and Hedging (Topic 815), and Leases (Topic 842): Effective Dates
2019-10”).
ASU2019-10
amended the effective date for ASU2016-13.
ASU2016-13
is effective for fiscal years, and interim periods within, beginning after December 15, 2022. Early adoption is permitted for fiscal years, and interim periods within, beginning after December 15, 2018. A reporting entity is required to apply the amendments in ASU2016-13
using a modified retrospective approach by recording a cumulative-effect adjustment to equity as of the beginning of the fiscal year of adoption. Upon adoption of ASU2016-13,
the Company is required to reassess its financing receivables, including loans receivable, and expects that application of ASU2016-13
may result in the Company recognizing credit losses at an earlier date than would otherwise be recognized under current accounting guidance. The Company is evaluating the impact of the adoption of ASU2016-13
on its consolidated financial statements.NOTE 3. Concentration of Credit Risk
The Company is economically dependent on maintaining a base of primary care and specialty care physicians as well as capitation contracts with payors. The loss of certain of those contracts could have a material adverse effect on the Company’s financial position, results of operations, or cash flows.
The Company contracts with various payors whereby the Company is entitled to monthly PMPM fees to provide a defined range of healthcare services for members attributed to its contracted primary care physicians. The Company generally accepts full financial risk for such members and therefore is responsible for the cost of all healthcare services required by them. Substantially all of the Company’s receivable balances are from a small number of payors.
Revenue from Medicare Advantage payors constitutes substantially all of the Company’s total revenue, accounting for nearly 100%, 99%, and 98% of the Company’s total revenues for years ended December 31, 2020, 2019, and 2018, respectively.
F-39
The following table provides the Company’s revenue concentrations with respect to major payors as a percentage of the Company’s total revenues:
Year Ended December 31, | ||||||||||||
2020 | 2019 | 2018 | ||||||||||
Payor A | 38 | % | 44 | % | 35 | % | ||||||
Payor B | 20 | % | 19 | % | 17 | % | ||||||
Payor C | 11 | % | 14 | % | 23 | % | ||||||
Payor D | * | 11 | % | 17 | % | |||||||
| * | Less than 10% of total revenue. |
The following table provides the Company’s concentrations of credit risk with respect to major payors as a percentage of receivables, net:
December 31, | ||||||||
2020 | 2019 | |||||||
Payor A | 38 | % | 31 | % | ||||
Payor B | 27 | % | 20 | % | ||||
Payor C | * | 11 | % | |||||
Payor D | * | 19 | % | |||||
| * | Less than 10% of total receivables. |
NOTE 4. Property and Equipment, Net
The following table summarizes the Company’s property and equipment (in thousands):
December 31, | ||||||||
2020 | 2019 | |||||||
Computer equipment and software | $ | 8,135 | $ | 6,553 | ||||
Furniture and fixtures | 2,856 | 2,745 | ||||||
Building and leasehold improvements | 2,740 | 2,704 | ||||||
| 13,731 | 12,002 | |||||||
Less: accumulated depreciation | (7,275 | ) | (4,850 | ) | ||||
| Property and equipment, net | $ | 6,456 | $ | 7,152 | ||||
For the years ended December 31, 2020, 2019, and 2018, the Company recognized $
million, $
1.6 million, and $1.0 million, respectively, in
depreciation expense, which is included in depreciation and am
o
rtization expense in the consolidated statements of operations.F-40
NOTE 5. Leases
The Company has operating leases for corporate offices and certain equipment. The following tables provide information regarding the Company’s operating leases for which it is the lessee (in thousands):
December 31, | ||||||||
2020 | 2019 | |||||||
ROU asset: | ||||||||
Other assets, net | $ | 9,585 | $ | 11,684 | ||||
Lease liabilities: | ||||||||
Accounts payable and accrued expenses | $ | 3,377 | $ | 3,366 | ||||
Other liabilities | 5,508 | 7,737 | ||||||
Total operating lease liabilities | $ | 8,885 | $ | 11,103 | ||||
Year Ended December 31, | ||||||||||||
2020 | 2019 | 2018 | ||||||||||
Operating lease costs | $ | 4,152 | $ | 3,349 | $ | 3,198 | ||||||
Short-term lease costs | 29 | 8 | 14 | |||||||||
Variable lease costs | 949 | 436 | 661 | |||||||||
Total lease costs | $ | 5,130 | $ | 3,793 | $ | 3,873 | ||||||
Year Ended December 31, | ||||||||||||
Supplemental Cash Flow Information | 2020 | 2019 | 2018 | |||||||||
Cash paid for amounts included in the measurement of lease liability: | ||||||||||||
Operating cash flows from operating leases | $ | 4,495 | $ | 4,434 | $ | 3,131 | ||||||
ROU asset obtained in exchange for new lease liability: | ||||||||||||
Operating leases | $ | 363 | $ | 1,111 | $ | — | ||||||
December 31, | ||||||||
Weighted Average Lease Term and Discount Rate | 2020 | 2019 | ||||||
Weighted average remaining lease term (years): | ||||||||
Operating leases | 5 | 6 | ||||||
Weighted average discount rate: | ||||||||
Operating leases | 9.78 | % | 9.79 | % | ||||
The following table summarizes future minimum lease obligations under
non-cancelable
operating leases as of December 31, 2020 (in thousands):Year | Amount | |||
2021 | $ | 3,554 | ||
2022 | 2,515 | |||
2023 | 2,044 | |||
2024 | 665 | |||
2025 | 536 | |||
Thereafter | 1,954 | |||
Undiscounted minimum lease payments payable | 11,268 | |||
Less: imputed interest | (2,383 | ) | ||
Present value of lease liability | $ | 8,885 | ||
F-41
NOTE 6. Goodwill and Amortizable Intangible Assets
Goodwill
As of December 31, 2020 and 2019, goodwill of $39.0 million was allocated to the Company’s Hawaii reporting unit, which has a negative carrying amount of net assets as of December 31, 2020 and 2019. The Company completed the required annual goodwill impairment test during the fourth quarters of 2020 and 2019, and 0 impairment was recognized.
Contingent Consideration
Total liabilities for contingent consideration to fulfill expected remaining obligations related to prior acquisitions were $2.5 million as of December 31, 2020 and 2019, and are reflected in accounts payable and accrued expenses in the consolidated balance sheets.
Amortizable Intangible Assets
The following table summarizes the Company’s amortizable intangible assets as of December 31, 2020 (dollars in thousands):
Useful Life (Years) | Gross Carrying Amount | Accumulated Amortization | Net Carrying Value | |||||||||||||
Health plan contracts | 15 | $ | 39,700 | $ | (11,689 | ) | $ | 28,011 | ||||||||
Trade names | 15-30 | 20,300 | (2,989 | ) | 17,311 | |||||||||||
Provider networks | 10-15 | 8,400 | (2,473 | ) | 5,927 | |||||||||||
Noncompete enforcement agreements | 4-5 | 30,787 | (22,705 | ) | 8,082 | |||||||||||
Other | 4-15 | 2,700 | (1,563 | ) | 1,137 | |||||||||||
| $ | 101,887 | $ | (41,419 | ) | $ | 60,468 | ||||||||||
The following table summarizes the Company’s amortizable intangible assets as of December 31, 2019 (dollars in thousands):
Useful Life (Years) | Gross Carrying Amount | Accumulated Amortization | Net Carrying Value | |||||||||||||
Health plan contracts | 15 | $ | 39,700 | $ | (9,043 | ) | $ | 30,657 | ||||||||
Trade names | 15-30 | 45,200 | (27,212 | ) | 17,988 | |||||||||||
Provider networks | 10-15 | 8,400 | (1,913 | ) | 6,487 | |||||||||||
Noncompete enforcement agreements | 4-5 | 30,377 | (15,944 | ) | 14,433 | |||||||||||
Other | 4-15 | 2,700 | (1,119 | ) | 1,581 | |||||||||||
| $ | 126,377 | $ | (55,231 | ) | $ | 71,146 | ||||||||||
For the years ended December 31, 2020, 2019, and 2018, the Company recognized $11.4 million, $10.7 million, and $10.4 million, respectively, in amortization expense which is included in depreciation and amortization expense in the consolidated statements of operations
.
F-42
The following table summarizes the estimated annual amortization for each of the five succeeding fiscal years and thereafter as of December 31, 2020 (in thousands):
Year | Amount | |||
2021 | $ | 10,332 | ||
2022 | 5,970 | |||
2023 | 4,012 | |||
2024 | 3,957 | |||
2025 | 3,957 | |||
Thereafter | 32,240 | |||
| $ | 60,468 | |||
NOTE 7. Other Assets
The following table summarizes the Company’s other assets (in thousands):
December 31, | ||||||||
2020 | 2019 | |||||||
Indemnification assets | $ | 10,009 | $ | 13,484 | ||||
Health plan deposits | 11,523 | — | ||||||
Right of use asset | 9,585 | 11,684 | ||||||
Other | 12,583 | 8,116 | ||||||
| $ | 43,700 | $ | 33,284 | |||||
Indemnification assets have been established to offset certain
pre-closing
liabilities for which the prior owners of some of the Company’s California subsidiaries are obligated to indemnify the Company. The Company deems the amounts receivable under the indemnification agreements to be fully collectible should indemnification claims arise and, as such, a valuation allowance is not deemed necessary.NOTE 8. Medical Claims and Related Payables
Medical claims and related payables include estimates for amounts owed for claims incurred for services provided to members by various providers. Changes in amounts reported for medical claims related to prior years result from claims being paid at amounts different than originally estimated. Liabilities are continually reviewed and
re-estimated
as information regarding actual claim payments becomes known. This information is compared to the originally established liability at year end. The following table presents thecomponents
of changes in medical claims and related payables (in thousands):December 31, | ||||||||||||
2020 | 2019 | 2018 | ||||||||||
Medical claims and related payables, beginning of the year | $ | 121,779 | $ | 101,967 | $ | 89,799 | ||||||
Components of incurred costs related to: | ||||||||||||
Current yea r | 1,026,940 | 728,610 | 415,074 | |||||||||
Prior years | (5,063 | ) | (3,236 | ) | (2,405 | ) | ||||||
Discontinued operations—current year | 85,732 | 125,795 | 165,358 | |||||||||
Discontinued operations—prior years | (1,543 | ) | (1,945 | ) | 3,196 | |||||||
| 1,106,066 | 849,224 | 581,223 | ||||||||||
F-43
December 31, | ||||||||||||
2020 | 2019 | 2018 | ||||||||||
Claims paid related to: | ||||||||||||
Current year | (870,979 | ) | (627,422 | ) | (335,795 | ) | ||||||
Prior year s | (94,868 | ) | (76,049 | ) | (55,001 | ) | ||||||
Discontinued operations—current year | (80,754 | ) | (108,531 | ) | (142,242 | ) | ||||||
Discontinued operations—prior years | (17,083 | ) | (17,410 | ) | (36,017 | ) | ||||||
| (1,063,684 | ) | (829,412 | ) | (569,055 | ) | |||||||
Medical claims and related payables, end of the year | $ | 164,161 | $ | 121,779 | $ | 101,967 | ||||||
Beginning and ending balances of medical claims and related payables disclosed above for December 31, 2020, include $1.1 million and $1.3 million, respectively, that are presented as current liabilities held for sale and discontinued operations. Beginning and ending balances of medical claims and related payables disclosed above for December 31, 2019, include $1.8 million and $1.1
million, respectively, of claims liabilities that are presented as current liabilities held for sale and discontinued operations. Beginning and ending balances of medical claims and related payables disclosed above for December 31, 2018, include $1.5 million and $1.8 million, respectively, of claims liabilities that are presented as current liabilities held for sale and discontinued operations. As of December 31, 2020, 2019, and 2018, medical claims and related payables also include $
4.1 million, $
18.0 million, and $19.4 million, respectively, of claims liabilities associated with certain divested California businesses for which the Company has retained the liability for claims incurred prior to the date of divestiture.
NOTE 9. Other Liabilities
The following table summarizes the Company’s other liabilities (in thousands):
December 31, | ||||||||
2020 | 2019 | |||||||
Other long-term contingencies | $ | 71,693 | $ | 64,489 | ||||
Reserve for uncertain tax positions | 10,009 | 12,818 | ||||||
Lease liabilities, long-term | 5,508 | 7,737 | ||||||
Other | 2,881 | 1,905 | ||||||
| $ | 90,091 | $ | 86,949 | |||||
As of December 31, 2020 and 2019, the Company had contingent liabilities of $71.7 million and $64.5 million, respectively, related to unasserted claims. While the Company intends to vigorously defend its position in the event of any assertion of such claims, it has established a liability for the potential exposure, including interest and penalties. Additionally, the Company estimated the range of reasonably possible losses in excess of reserves accrued on the consolidated balance sheet as of December 31, 2020 to be $0 to $14.4 million.
See Note 14 for additional discussions related to reserve for uncertain tax positions.
NOTE 10. Debt
Credit Facility
As of December 31, 2020, the Company’s credit facility (the “Credit Facility”) includes a term loan of up to $60.0 million (the “Term Loan”) and a revolver of up to $60.0 million, subject to a $10.0 million limitation on cash holdings and the capacity to issue standby letters of credit in certain circumstances up to a maximum of $40.0 million (the “Revolver”). The Revolver is scheduled to mature on July 1, 2021, and the term loan is scheduled to mature on July 1, 2022. As of December 31, 2020, the Company had $48.6 million outstanding
F-44
under the Term Loan and availability under the revolver was $
million as the Company had outstanding letters of credit totaling $
18.5 million. The standby letters of credit are automatically extended without amendment for
one-year
periods, unless the Company notifies the institution in advance of the expiration date that the letter will be terminated. No amounts have been drawn on the outstanding letters of credit as of December 31, 2020 or 2019.
At the Company’s option, borrowings under the Credit Facility accrue interest at either: (i) the London Interbank Offered Rate (“LIBOR”) plus a margin ranging from 5.50% to 6.00% or (ii) a base rate, as defined in the credit agreement, plus a margin ranging from 4.50% to 5.00%. Additionally, the Company pays a commitment fee on the unfunded revolver amount that ranges from 0.25% to 0.50%, depending on the leverage ratio. The Company must also pay customary letter of credit fees. As of December 31, 2020, the weighted average effective interest rate on the Term Loan was 8.28%.
The borrower on the Credit Facility is agilon health management, inc. (formerly agilon health, inc.), a wholly-owned subsidiary. The Credit Facility is guaranteed by certain of the Company’s subsidiaries, a pledge of the Company’s equity interest in agilon health management, inc., and a pledge of all the assets of agilon health management, inc. (all subject to customary exceptions). Under the terms of the Credit Facility, agilon health management, inc.’s ability to pay dividends or lend to the Company is restricted.
The Term Loan may be subject to mandatory prepayments of the original principal amount. If the consolidated financial results of the Company indicate that it has excess cash flow (as defined in the Credit Facility), the Credit Facility requires that 50% of that excess cash flow be used as a prepayment of the term loan. The lenders have the right to waive the excess cash flow prepayment at their sole option. Outstanding Revolver balances
are not subject to mandatory prepayment other than in circumstances arising from other provisions in
the credit agreement. The Credit Facility is subject to mandatory prepayments if the outstanding loans and letters of credit exceed either the aggregate commitments or the current borrowing base.
The Credit Facility contains customary covenants including, among other things, limitations on restricted payments including: (i) dividends and distributions from restricted subsidiaries, (ii) requirements of minimum financial ratios, and (iii) limitation on additional borrowings based on certain financial ratios. Failure to meet any of these covenants could result in an event of default under the agreement. If an event of default occurs, the lenders could elect to declare all amounts outstanding under the agreement to be immediately due and payable. As of December 31, 2020 and 2019, the Company was in compliance with all covenants under the Credit Facility.
Unsecured Debt
As of December 31, 2020 and 2019, the Company had a $20.0 million unsecured credit agreement with a lender affiliated with CD&R (the “unsecured debt”). The unsecured debt’s interest rate is fixed at 11.50% and matures in December 2023. The loan is guaranteed by a subsidiary of the Company and certain affiliates.
Debt Maturities
The following table summarizes the Company’s stated debt maturities and scheduled principal repayments as of December 31, 2020 (in thousands):
Year | Term Loan | Unsecured Debt | Total | |||||||||
2021 | $ | 3,041 | $ | — | $ | 3,041 | ||||||
2022 | 45,608 | — | 45,608 | |||||||||
2023 | 0 | 20,000 | 20,000 | |||||||||
| 48,649 | 20,000 | 68,649 | ||||||||||
(Discounts), premiums and (debt costs), net | (745 | ) | (198 | ) | (943 | ) | ||||||
| $ | 47,904 | $ | 19,802 | $ | 67,706 | |||||||
F-45
On February 18, 2021, the Company executed a credit facility agreement (as amended by the First Amendment to Credit Agreement, dated as of March 1, 2021, the “2021 Credit Facilities”). The 2021 Credit Facilities include: (i) a $100.0 million secured term loan (the “2021 Secured Term Loan Facility”) and (ii) a $100.0 million senior secured revolving credit facility (the “2021 Secured Revolving Facility”) with a capacity to issue standby letters of credit in certain circumstances up to a maximum of $80.0 million. Subject to specified conditions and receipt of commitments, the 2021 Secured Term Loan Facility may be expanded (or a new term loan facility, revolving credit facility or letter of credit facility added) by up to (i) $50.0 million plus (ii) an additional amount determined in accordance with a formula tied to repayment of certain of the Company’s indebtedness. The proceeds from the 2021 Secured Term Loan Facility were used to refinance the outstanding indebtedness under the Credit Facility and unsecured debt, with the remaining $30.1 million used for working capital and other general corporate purposes. The maturity date of the 2021 Credit Facilities is February 18, 2024 or, following the consummation of an initial public offering (subject to certain proceeds amounts), February 18, 2026.
At the Company’s option, borrowings under the 2021 Credit Facility, as defined in the credit agreement, can be either: (i) LIBO Rate Loans or (ii) Base Rate Loans. LIBO Rate Loans bear interest at a rate equal to the sum of 4.00% (stepping down to 3.50% on and following October 1, 2023) and the higher of (a) LIBO, as defined in the credit agreement, and (b) 0%. Base Rate Loans bear interest at a rate equal to the sum of 3.00% (stepping down to 2.50% on and following October 1, 2023) and the highest of: (a) 0.50% in excess of the overnight federal funds rate, (b) the prime rate established by the administrative agent from time to time, (c) the
one-month
LIBO rate (adjusted for maximum reserves)plus1.00% and (d) 0
%. Additionally, the Company pays a commitment fee on the unfunded 2021 Secured Revolving Facility amount of 0.50% (stepping down to 0.375% on and following October1, 2023). The Company must also pay customary letter of credit fees.
The 2021 Credit Facilities are guaranteed by certain of the Company’s subsidiaries, including those identified as VIEs, and contain customary covenants including, among other things, limitations on restricted payments including: (i) dividends and distributions from restricted subsidiaries, (ii) requirements of minimum financial ratios, and (iii) limitation on additional borrowings based on certain financial ratios.
NOTE 11. Commitments and Contingencies
Legal Proceedings
From time to time, the Company is a party to, or has a significant relationship to, legal proceedings, lawsuits, and other claims. Except as described below, the Company is not aware of any legal proceedings or claims that it believes may have, individually or taken together, a material adverse effect on the Company’s financial condition, results of operations or cash flows. The Company’s policy is to expense legal costs as they are incurred.
Regulatory Matters
The healthcare industry is subject to numerous laws and regulations of federal, state, and local governments. Violations of these laws and regulations could result in expulsion from government healthcare programs, together with the imposition of significant fines and penalties. Compliance with such laws and regulations can be subject to future government review and interpretation, as well as regulatory actions unknown or unasserted at this time.
The healthcare regulatory landscape is constantly changing. It is difficult to predict which final rules may be adopted and implemented by federal and state authorities, and if such final rules would result in any material adverse effect on the Company’s business, consolidated financial condition, results of operations or cash flows. Management is unable to determine how any future government spending cuts will affect Medicare reimbursement. There likely will continue to be legislative and regulatory proposals at the federal and state levels directed at containing or lowering the cost of healthcare that, if adopted, could have a material adverse effect on the Company’s consolidated financial statements.
F-46
Contractual Obligations
The following table summarizes the Company’s contractual obligations, excluding operating leases (see Note 5) and debt service obligations (see Note 10), as of December 31, 2020 (in thousands):
Total | 2021 | 2022-2023 | 2023-2025 | More than Five Years | ||||||||||||||||
Capital commitments (1) | $ | 18,662 | $ | 16,412 | $ | 2,250 | $ | — | $ | — | ||||||||||
| (1) | Represents capital commitments to physician partners to support physician partner expansion and related purposes. |
NOTE 12. Common Stock
Common Stock
As of December 31, 2020 and 2019, the Company’s authorized capital stock consisted of 500.0 million shares of common stock, par value $0.01 per share. As of December 31, 2020, there were 325.6 million shares of the Company’s common stock issued and outstanding, not including: (i) 41.3 million shares of common stock issuable upon exercise of outstanding stock options and (ii) 109,700 shares of common stock subject to outstanding RSUs. Every holder of record of common shares entitled to vote at a meeting of stockholders is entitled to one vote for each share outstanding.
2020.
In August 2020, the Company issued approximately 333,800 shares of common stock to settle provider incentive liabilities of $1.5 million.
Also in 2020, the Company repurchased 1.5 million shares of common stock for $6.7 million and issued approximately 2,340,000 shares of common stock in connection with exercises and vesting of stock-based awards.
2019
2018
million shares of common stock for $
1.8million.
Contingently Redeemable Common Stock
2020.
2019
n.
I
n the fourth quarter of 2019, the Company closed private placements to third-party investors in which it issued and sold 23.6 million shares of contingently redeemable common stock at a purchase price of $4.49 per share and received aggregate proceeds of $106.0 million.
F-47
2018
The private placements of contingently redeemable common stock have a redemption feature that may require the Company, in certain limited circumstances, to repurchase stock. Because the redemption feature is outside the control of the Company, the related capital contribution does not qualify as permanent equity and has been classified as temporary equity in the mezzanine section of the consolidated balance sheets. The redemption feature will terminate upon the completion of an initial public offering of the Company’s common stock. The common stock classified as temporary equity was recorded at an initial carrying value equal to the gross proceeds received, which represented their fair value at the date of issuance. As the events requiring redemption are not probable of occurring, it is not probable that the common stock will become redeemable and therefore no subsequent remeasurement has been required.
NOTE 13. Stock Incentive Plan
The Company offers certain employees the ability to purchase common shares of the Company and/or receive common stock options under its Amended and Restated Stock Incentive Plan (the “Plan”) that was approved by the stockholders. The Company is authorized to grant 46,250,000 shares related to employee stock options, of which 1,970,000 shares remain available for grant as of December 31, 2020. Shares granted are not transferrable, except upon the employee’s death, repurchase by the Company, or with the Company’s consent. The Company recognizes compensation expense related to the Plan in its consolidated statements of operations, with a corresponding increase to additional
paid-in
capital for any employees who are granted stock options in exchange for services to the Company.The stock options granted under the Plan consist of: (i) stock options that vest in four equal annual installments, subject to the employee’s continued service until the applicable vesting date (the “Base Options”), and (ii) stock options that vest if, upon a sale of its interest in the Company, CD&R realizes a certain return on its investment, subject to the employee’s continuous employment through such date (the “Upside Options”). Both the Base Options and Upside Options expire 10 years after the date of grant.
Compensation cost for the Base Options is recognized on a straight-line basis over the requisite vesting period of four years. The fair value of each Base Option was estimated on the date of grant using the Black-Scholes option pricing model. Expected volatilities are based on the historical equity volatility of comparable publicly traded companies. The expected term of Base Options is calculated via the simplified method and reflects the midpoint between the vesting date and the end of the contractual term. The risk-free rates utilized for periods throughout the contractual life of the Base Options are based on U.S. Treasury security yields at the time of grant.
Compensation cost for the Upside Options has not been recorded, as it is not considered probable that the performance target will be achieved. Compensation cost for the Upside Options will be recognized when the performance condition is considered probable, which will not be until the sale event and achievement of the performance target, as defined in the option agreement, occur. The fair value of the Upside Options was estimated on the date of grant using the Monte Carlo simulation model.
Because there is no public market for the Company’s common stock, the Company determined the fair value of those shares at the gr.
a
nt dates by considering several objective and subjective factors, including the price paid by investors for common stock, actual and forecasted operating and financial performance, market conditions and performance of comparable publicly traded companies, developments and milestones in the Company, the likelihood of achieving a liquidity event, and transactions involving its common stock. The fair value of the Company’s common stock has been determined in accordance with applicable elements of the practice aid issued by the American Institute of Certified Public Accountants,Valuation of Privately Held Company Equity Securities Issued as
Compensation
F-48
The assumptions used for the Black-Scholes option pricing model to determine the fair value of the Base Options granted are as follows:
December 31, | ||||||||||
2020 | 2019 | 2018 | ||||||||
Risk-free interest rate | 0.43% - 1.68% | 2.39% - 2.53% | 2.57% - 2.97% | |||||||
Expected dividends | $0 | $0 | $ 0 | |||||||
Expected volatility | 59.39% - 63.47% | 55.38% - 55.47% | 55.83% - 58.34% | |||||||
Expected term (in years) | 6.25 | 6.25 | 6.25 | |||||||
The Company’s outstanding Base Options consisted of the following (shares in thousands):
Shares | Weighted- Average Exercise Price | Weighted- Average Remaining Contractual Term (in years) | Aggregate Intrinsic Value (in thousands) | |||||||||||||
Stock options outstanding as of January 1, 2020 | 23,080 | $ | 1.41 | 7.5 | ||||||||||||
Granted | 6,430 | 4.65 | 9.4 | |||||||||||||
Exercised | (2,783 | ) | 1.00 | 5.7 | ||||||||||||
Expired or forfeited | (2,081 | ) | 2.54 | 7.5 | ||||||||||||
Stock options outstanding as of December 31, 2020 | 24,646 | $ | 2.21 | 7.2 | $ | 165,866 | ||||||||||
Expected to vest as of December 31, 2020 | 9,663 | $ | 3.74 | 8.5 | $ | 50,245 | ||||||||||
Exercisable as of December 31, 2020 | 14,983 | $ | 1.22 | 6.3 | $ | 115,671 | ||||||||||
The weighted-average grant-date fair value of the Base Options granted during the year ended December 31, 2020, 2019, and 2018 was
,
$2.11, and
respectively, per option. During the year ended December 31, 2020, the total stock-based compensation expense related to the stock options was
recorded in income (loss) from discontinued operations in the consolidated statements of operations.
During the year ended December 31, 2018, the
total stock-based compensation expense related to the stock options was $3.6 million, of which $2.9 million is recorded in general and administrative expense and $0.7 million is recorded in income (loss) from discontinued operations in the consolidated statements of operations
Forfeiture of awards is recognized as it occurs.total stock-based compensation expense related to the stock options was $3.6 million, of which $2.9 million is recorded in general and administrative expense and $0.7 million is recorded in income (loss) from discontinued operations in the consolidated statements of operations
.
As of December 31, 2020, the Company had $17.5 million of total unrecognized compensation cost related to
non-vested
Base Options. The compensation cost for the Base Options as of December 31, 2020 is expected to be recognized over a weighted-average period of approximately 3 years.F-49
The Company’s outstanding Upside Options consisted of the following (shares in thousands):
Shares | Weighted- Average Exercise Price | Weighted- Average Remaining Contractual Term (in years) | ||||||||||
Stock options outstanding as of January 1, 2020 | 15,090 | $ | 3.52 | 7.5 | ||||||||
Granted | 6,175 | 9.89 | 9.4 | |||||||||
Exercised | 0 | 0 | — | |||||||||
Expired or forfeited | (4,590 | ) | 3.77 | 6.5 | ||||||||
Stock options outstanding as of December 31, 2020 | 16,675 | $ | 5.81 | 7.6 | ||||||||
Expected to vest as of December 31, 2020 | 0 | $ | 0 | — | ||||||||
Exercisable as of December 31, 2020 | 0 | $ | 0 | — | ||||||||
The weighted-average grant-date fair value of the Upside Options granted during the years ended December 31, 2020, 2019, and 2018 was
and $0.55,
respectively, per option. During the years ended December 31, 2020, 2019, and 2018, the Company did
0t recognize any stock-based compensation expense related to the Upside Options as achievement of the underlying performance condition is not probable. Forfeiture of awards is recognized as it occurs. As of December 31, 2020, the Company had $13.2 million of total unrecognized compensation cost related tonon-vested
Upside Options.Restricted Stock Units
The Company has agreements with certain members of its board of directors that permit a portion of board compensation to be delivered in the form of equity awards. These issuances are in the form of restricted stock units. For the years ended December 31, 2020
,
2019, and 2018,
the Company recognized $0.2 million, $0.2 million, and $0.1 million, respectively,
of stock-based compensation expense related to these contracts, which is recorded in general and administrative expense in the consolidated statements of operations.Non-Employee Awards
Various of the Company’s agreements provide for the vesting of certain stock-based instruments to third parties at the time of an initial public offering or sale of a controlling interest in the Company (“Change of Control Event”). The stock-based instruments granted to third parties are accounted for as
non-employee
awards for which compensation cost will be recognized upon achievement of the underlying performance condition of a Change of Control Event. As the instruments are liability-classified, the amount of shares ultimately issued and related compensation cost will be measured on the vesting date. A Change of Control Event is not deemed probable until consummated.The Company has also issued equity-based instruments to third parties for incentive compensation. The equity instruments granted to third parties are accounted for as non-employee awards and are recognized to the extent that achievement of the financial performance threshold is probable. For the years ended December 31, 2019 and 2018, the Company recognized
$
1.5million and $5.0 million, respectively, in expenses as the related performance conditions were satisfied. The Company recorded the amount in other medical expenses in the consolidated statements of operations and recognized a liability in accounts payable and accrued expenses as of December 31, 2019. In August 2020, the Company recognized
$
1.5 million in additional
paid-in
capital for the issuance of common stock to settle
5.02019
incentives. In April 2019, the Company recognized $ million in additional
paid-in
capital for the issuance of common stock to settle 2018 incentives
.
F-50
NOTE 14. Income Taxes
The Company applied the intra-period tax allocation rules to allocate income taxes between continuing operations and discontinued operations as prescribed by U.S. GAAP, where the tax effect of income (loss) before income taxes is computed without regard to the tax effects of income (loss) before income taxes from the other categories. Income tax expense (benefit) from continuing operations consisted of the following (in thousands):
Year Ended December 31, | ||||||||||||
2020 | 2019 | 2018 | ||||||||||
Current: | ||||||||||||
Federal | $ | 0— | $ | 0— | $ | 0 | ||||||
State | 856 | 1 | 41 | |||||||||
| 856 | 1 | 41 | ||||||||||
Deferred: | ||||||||||||
Federal | 38 | (179 | ) | (9 | ) | |||||||
Stat e | (29 | ) | (54 | ) | (145 | ) | ||||||
| 9 | (233 | ) | (154 | ) | ||||||||
Income tax expense (benefit) | $ | 865 | $ | (232 | ) | $ | (113 | ) | ||||
The principal items accounting for the difference between taxes compute
d
at the U.S. statutory rate and taxes recorded consisted of the following (in thousands):Year Ended December 31, | ||||||||||||
2020 | 2019 | 2018 | ||||||||||
Computed tax at US federal statutory rate of 21% | $ | (13,129 | ) | $ | (24,052 | ) | $ | (17,071 | ) | |||
Increase (decrease) in taxes resulting from: | ||||||||||||
State taxes, net of federal impact | 840 | (47 | ) | 628 | ||||||||
Unrecognized tax benefit | (71 | ) | 224 | (35 | ) | |||||||
Permanent differences | 850 | 1,287 | 1,538 | |||||||||
Valuation allowance | 12,443 | 22,530 | 15,386 | |||||||||
Other, net | (68 | ) | (174 | ) | (559 | ) | ||||||
Income tax expense (benefit) | $ | 865 | $ | (232 | ) | $ | (113 | ) | ||||
F-51
The net deferred tax liability comprises the tax effect of temporary differences between U.S. GAAP and tax reporting related to the recognition of income and expenses. The net deferred income tax liabilities are included in other liabilities in the consolidated balance sheets. Components of the net deferred tax liability consisted of the following (in thousands):
December 31, | ||||||||
2020 | 2019 | |||||||
Deferred income tax assets: | ||||||||
Net operating losses | $ | 80,316 | $ | 66,644 | ||||
State taxes | 56 | 60 | ||||||
Contingent consideration | 776 | 857 | ||||||
Accrued expenses | 20,708 | 17,441 | ||||||
Transaction costs | 1,006 | 1,097 | ||||||
Stock-based compensation | 3,530 | 2,332 | ||||||
Lease liabilities | 2,237 | 2,850 | ||||||
Interest limitation | 5,635 | 3,870 | ||||||
Goodwill | 2,480 | 1,051 | ||||||
Intangible assets | 23,166 | 7,870 | ||||||
Partnership outside basis | 0 | 128 | ||||||
Other, net | 333 | 287 | ||||||
Total deferred income tax assets | $ | 140,243 | $ | 104,487 | ||||
Deferred income tax liabilities: | ||||||||
Property and equipment | $ | (411 | ) | $ | (483 | ) | ||
ROU assets | (2,412 | ) | (2,998 | ) | ||||
Intangible assets | (9,191 | ) | (14,398 | ) | ||||
Partnership outside basis | (1,465 | ) | (1,562 | ) | ||||
Investment | (411 | ) | (423 | ) | ||||
Total deferred income tax liabilities | $ | (13,890 | ) | $ | (19,864 | ) | ||
Valuation allowance | (126,927 | ) | (85,186 | ) | ||||
Net deferred income tax liabilities | $ | (574 | ) | $ | (563 | ) | ||
The Company regularly reviews its deferred tax assets for recoverability and establishes a valuation allowance when it is more likely than not that some portion, or all, of the deferred tax assets will not be realized. In making this assessment, the Company is required to consider all available positive and negative evidence to determine whether, based on such evidence, it is more likely than not that some portion or all of the net deferred tax assets will not be realized in future periods. As of December 31, 2020 and 2019, the Company believed that it is more likely than not that its deferred tax assets in excess of deferred tax liabilities will not be realized. Accordingly, the Company has provided a valuation allowance of $126.9 million and $85.2 million on the Company’s deferred tax assets as of December 31, 2020 and 2019, respectively, with a net change of $41.7 million recorded in current year activities. The net deferred tax liability as of December 31, 2020 principally relates to deferred tax liabilities associated with long-term partnership investments and long-lived intangible assets which are expected to reverse against net operating losses which can only offset 80% of taxable income
.
As of December 31, 2020, the Company has federal and state net operating losses of $310.7 million and $246.3 million, respectively. As of December 31, 2019, the Company has federal and state net operating losses of $258.1 million and $215.7 million, respectively.
As of December 31, 2018, the Company has federal and state net operating losses of $136.2 million and $145.2 million, respectively
As of December 31, 2020, $233.8 million of the total federal net operating losses are carried forward as indefinite-lived net operating losses. The remaining.
F-52
net operating losses are carried forward and will expire beginning in 2027 if unutilized. Utilization of these operating loss
carryforwards may be subject to an annual limitation based on changes in ownership, as defined by Section
382of the Internal Revenue Code of
1986, as amended. $
32.3 million and $
32.7 million of the Company’s federal and state net operating loss carryforward, respectively, are attributable to prior acquisition transactions and are subject to Section
382limitations. The Company’s preliminary analysis indicates that none of the acquired net operating loss carryforwards will expire unutilized solely as a result of the Section
382limitation
s.
U
nrecognized Tax Benefits
As of December 31, 2020, the Company had unrecognized tax benefits of $8.9 million, $7.1 million of
which
, if recognized, would impact its effective tax rate. As of December 31, 2019, the Company had unrecognized tax benefits of $10.8 million, $9.4 million of which, if recognized, would impact its effective tax rate. As of December 31, 2018, the Company had unrecognized tax benefits of $23.2 million, $20.7 million of which, if recognized, would impact its effective tax rate
.
The following table summarizes the activity related to the Company’s unrecognized tax benefits (in thousands):
December 31, | ||||||||||||
2020 | 2019 | 2018 | ||||||||||
Balance at beginning of the year | $ | 10,839 | $ | 23,219 | $ | 29,509 | ||||||
Additions related to current year | 384 | 242 | 145 | |||||||||
Additions related to prior years | 565 | — | — | |||||||||
Reductions related to the lapse of applicable statute of limitation s | (2,874 | ) | (12,622 | ) | (6,435 | ) | ||||||
Balance at end of the year | $ | 8,914 | $ | 10,839 | $ | 23,219 | ||||||
As of December 31, 2020, the Company recorded a liability for unrecognized tax benefit of $
10.0 million, inclusive of
$2.9 million of accrued interest and penalties. As of December 31, 2019, the Company recorded a liability for unrecognized tax benefit of $12.8 million, inclusive of $3.4 million of accrued interest and penalties. As of December 31, 2018, the Company recorded a liability for unrecognized tax benefit of $29.0 million, inclusive of $6.9 million of accrued interest and penalties.
During the year ended December 31, 2018, due to expiration of the 2015 U.S. federal and 2014 state statute of limitations, the Company reversed $6.4 million of tax liability, $0.7 million of accrued interest and $1.3 million of accrued penalties on unrecognized tax benefits and realized a tax benefit of $8.4 million attributable to discontinued
operations
.
F-53
The amount of
income
taxes the Company pays is subject to ongoing audits. The estimate of the potential outcome of any uncertain tax issue is subject to management’s assessment of the relevant risks, facts, and circumstances existing at the time. However, future results of operations may include favorable or unfavorable adjustments to the estimated tax liabilities in the period the assessments are made or resolved. As of December 31, 2020, the tax years 2016 to 2020 are subject to examination by the Internal Revenue Service (“IRS”) and the tax years 2016 to 2020 are subject to examination by state taxing jurisdictions in which the Company is subject. Currently, the Company’s subsidiary VMG Vantage Medical Group, Inc. (“Vantage”) is being examined by the IRS for the 2016 tax year. The outcome of the 2016 tax examination of Vantage is stilluncertain. Management believes it has adequate reserves for potential tax exposures associated with all open tax years including the
2016year currently under examination. It is reasonably possible that during the next
12months the Company may realize a $
10.0 million decrease in its liability for uncertain tax positions, inclusive of $
2.9 million related to the reversal of interest and penalties on uncertain tax positions, as a result of closing of the tax years or the resolution of the IRS examination
.
For additional discussion regarding income taxes and unrecognized tax benefits related to discontinued operations, see Note 19.
On March 27, 2020, the Coronavirus Aid, Relief and Economic Security Act (“CARES Act”) was enacted to provide economic relief to individuals and businesses facing economic hardship as a result of the
COVID-19
public health emergency. The CARES Act includes, among other things, provisions relating to payroll tax credits and deferrals, net operating loss carryback periods, alternative minimum tax credit refunds, modifications to the net interest deduction limitations, and technical corrections to tax depreciation methods for qualified improvement property. On June 29, 2020, the California Assembly Bill 85 (California AB 85) was enacted, which suspends the usage of NOLs for taxable years 2020, 2021, and 2022 for taxpayers with taxable income of $1.0 million or more and limits the amount of tax that can be offset by business credits to $5.0 million for tax years 2020, 2021, and 2022. The carryover period for NOL deductions and business credit limitation disallowed by this provision will be extended. On December 27, 2020, the Consolidated Appropriations Act, 2021 was enacted to provide furtherCOVID-19
relief. These changes in tax laws did not have a material impact on the Company’s results of operations for the year ended December 31, 2020. The Company will continue to monitor possible future impact of changes in tax legis
lation.
NOTE 15. Net Income (Loss) Per Common Share
Basic net income (loss) per common share (“EPS”) is computed based upon the weighted average number of common shares outstanding. Diluted net income (loss) per common share is computed based upon the weighted average number of common shares outstanding plus the impact of common shares issuable from the assumed conversion of stock options, certain performance restricted stock units and unvested restricted stock units. Only those instruments having a dilutive impact on basic loss per share are included in diluted loss per share during the periods presented.
F-54
The following table illustrates the
computation
of basic and diluted EPS (in thousands, except per share amounts):Year Ended December 31, | ||||||||||||
2020 | 2019 | 2018 | ||||||||||
Numerator | ||||||||||||
Income (loss) from continuing operations | $ | (63,208 | ) | $ | (114,455 | ) | $ | (81,179 | ) | |||
Income (loss) from discontinued operations | 3,156 | (168,285 | ) | (65,338 | ) | |||||||
Noncontrolling interests’ share in discontinued operations | 0 | 152 | (409 | ) | ||||||||
Net income (loss) attributable to common stockholder s | $ | (60,052 | ) | $ | (282,588 | ) | $ | (146,926 | ) | |||
Denominator | ||||||||||||
Weighted average shares outstanding, basic and diluted | 323,462 | 294,738 | 250,783 | |||||||||
Net income (loss) per share attributable to common stockholders | ||||||||||||
Net income (loss) per common share from continuing operations, basic and diluted | $ | (0.20 | ) | $ | (0.39 | ) | $ | (0.33 | ) | |||
Net income (loss) per common share from discontinued operations, basic and diluted | $ | 0.01 | $ | (0.57 | ) | $ | (0.26 | ) | ||||
Basic net income (loss) per share is the same as diluted net income (loss) per share for the years ended December 31, 2020, 2019, and 2018 as the inclusion of all potential common shares outstanding would have been anti-dilutive.
The following table provides the weighted-average potential shares of common stock that were excluded from the calculation of diluted net income (loss) per share attributable to common stockholders because their effect would have been anti-dilutive (in thousands):December 31, | ||||||||||
2020 | 2019 | 2018 | ||||||||
Stock options—service only condition | 23,646 | 23,080 | 20,005 | |||||||
Stock options—market and performance condition | 17,675 | 15,090 | 16,470 | |||||||
Restricted stock units | 110 | 185 | 254 | |||||||
NOTE 16. Supplemental Cash Flow Information
The following table provides supplemental cash flow information (in thousands):
Year Ended December 31, | ||||||||||||
2020 | 2019 | 2018 | ||||||||||
Supplemental cash flow information: | ||||||||||||
Interest paid | $ | 7,086 | $ | 8,038 | $ | 8,894 | ||||||
Income taxes paid (refunded), net | 2 | 26 | 17 | |||||||||
Supplemental disclosure of non-cash financing activities: | ||||||||||||
Settlement of stock-based liabilities | 1,500 | 5,000 | — | |||||||||
Settlement of loans receivable with services provided | 2,047 | 0— | — | |||||||||
F-55
The following table summarizes cash, cash equivalents and restricted cash equivalents from continuing operations (in thousands):
December 31, | ||||||||
2020 | 2019 | |||||||
Cash and cash equivalents | $ | 106,795 | $ | 123,633 | ||||
Restricted cash and equivalents | 28,383 | 15,519 | ||||||
Cash, cash equivalents and restricted cash equivalents | $ | 135,178 | $ | 139,152 | ||||
NOTE 17. Variable Interest Entities
Consolidated Variable Interest Entities
agilon health,
inc.’s
consolidated assets and liabilities as of December 31, 2020 and 2019 include certain assets of VIEs that can only be used to settle the liabilities of the related VIE. The VIE creditors do not have recourse to agilon health, inc.
agilon health,
inc.’s
December 31, | ||||||||
2020 | 2019 | |||||||
Assets (1) | ||||||||
Cash and cash equivalents | $ | 93,053 | $ | 23,441 | ||||
Restricted cash equivalents | 25,032 | 15,519 | ||||||
Receivables, net | 136,636 | 76,442 | ||||||
Prepaid expenses and other current assets, net | 5,986 | 1,708 | ||||||
Property and equipment, net | 797 | 687 | ||||||
Intangible assets, net | 8,208 | 18,388 | ||||||
Other assets, net | 13,343 | 15,188 | ||||||
Assets held for sale and discontinued operations, net | 4,825 | 8,672 | ||||||
Liabilities (1) | ||||||||
Medical claims and related payables | 97,146 | 58,221 | ||||||
Accounts payable and accrued expenses | 62,294 | 36,362 | ||||||
Other liabilities | 10,926 | 13,813 | ||||||
Liabilities held for sale and discontinued operations | 3,682 | 8,219 | ||||||
| (1) | Assets and liabilities of VIEs presented above include the assets and liabilities of the Company’s independent practice associations in California, which are consolidated VIEs and whose operations are reflected in the consolidated financial statements as discontinued operations. |
Risk-Bearing Entities
The Company operates 11 wholly-owned risk-bearing entities (“RBEs”) for the purpose of entering into risk-bearing contracts with payors. Each RBE’s equity at risk is considered insufficient to finance its activities without additional support, and, therefore, each RBE is considered a VIE. The Company consolidates the RBEs as it has determined that it is the primary beneficiary because it has: (i) the ability to control the activities that most significantly impact the VIEs’ economic performance; and (ii) the obligation to absorb losses or right to receive benefits that could potentially be significant to the RBEs. Specifically, the Company has the unilateral ability and authority, through the RBE governance and management agreements, to make significant decisions about strategic and operating activities of the RBEs, including negotiating and entering into risk-bearing
F-56
contracts with payors and approving the RBEs’ annual operating budget. The Company also has the obligation to fund losses of the RBEs and the right to receive a significant percentage of any financial surplus generated by the RBEs. The assets of the RBEs primarily consist of cash and cash equivalents, receivables, net, intangibles, net, and other assets; its obligations primarily consist of medical claims and related payables as well as operating expenses of the RBEs (accounts payable and accrued expenses), including incentive obligations to the Company’s physician partners. Assets generated by the RBEs (primarily from medical services revenues) may only be used to settle their contractual obligations (primarily from medical expenses).
Subsequent Events
On February 18, 2021, the Company executed the 2021 Credit Facilities, which are guaranteed by certain of the Company’s subsidiaries, including those identified as VIEs (see Note 10).
Unconsolidated Variable Interest Entities
As of December 31, 2020 and 2019, the Company had two equity method investments which were deemed to be VIEs. The Company has determined that it is not the primary beneficiary of and therefore does not
consolidate the VIEs because it does not have the abi
lityto control the
activities that most significantly impact their economic performance. As of December 31, 2020 and 2019, the carrying amount of the investments of the VIEs was $
8.5 million and $
6.2 million, which approximates the maximum loss exposure as a result of the Company’s involvement with the VIEs.
NOTE 18. Related Party Transactions
Significant Stockholders
The Company maintains a consulting agreement with CD&R, for which it pays advisory consulting fees on a quarterly basis. For the years ended December 31, 2020, 2019, and 2018
, the Company paid $1.5 million to CD&R in advisory consulting fees, in addition to certain expense reimbursements. These are recorded in general and administrative expense in the accompanying consolidated statements of operations. As of December 31, 2020 and 2019, the Company had an outstanding payable to CD&R of $0.4 million and $0.1 million, respectively.Morgan Stanley Investment Management, Inc. and Capital Research and Management Company advise funds that own in aggregate five percent or greater of the Company’s common stock. All funds affiliated with Morgan Stanley Investment Management, Inc. and Capital Research and Management Company are considered related parties. See Note 12 for details on the issuances of contingently redeemable common stock.
Unsecured Debt
See Note 10 for details on the issuance of unsecured debt to a fund affiliated with CD&R
.
Equity Method Investment
For the years ended December 31, 2020
,
2019, and 2018,
the Company incurred expenses of $6.7 million,
$5.7 million, and $3.9 million,
respectively for provider services delivered by Population Health, LLC, which is accounted for under the equity method based on 49% equity ownership interest held by the Company. As of both December 31, 2020 and 2019, the Company had an outstanding payable to Population Health, LLC of $1.1 million.F-57
NOTE 19. Discontinued Operations
Discontinued operations is a component of an entity that has either been disposed of or is deemedand, (i) the operations and cash flows of the component have been or will be eliminated from ongoing operations as a result of the disposal transaction, and (ii) the entity will not have any significant continuing involvement in the operations of the component after the disposal transaction.
held-for-sale
During 2020, the Company implemented a plan to divest its California operations, which included the entirety of its Medicaid line of business, via three separate transactions with different parties. In August 2020, the Company disposed of its Southern California operations for a gross sales price of $2.5 million and recognized a gain on sale of $1.3 million. In October 2020, the Company disposed of its Fresno, California operations for a gross sales price of $26.0 million and recognized a gain on sale of approximately $19.1 million. The Company retained the working capital of both disposal groups and therefore such working capital accounts are not presented as assets and liabilities related to discontinued operations in the consolidated balance sheets. In December 2020, the Company signed a definitive agreement to sell its remaining California operations for a gross sales price of $1.0 million. The sale closed in February 2021.
The Company’s decision to exit California and the Medicaid line of business represents a strategic shift that will have a major effect on its operations and financial results. As such, the Company’s California operations are reflected in the consolidated financial statements as discontinued operations. Net income (loss) from discontinued operations for the year ended December 31, 2020 includes $3.7 million of severance related to the sale of the Company’s California operations.
The following is a summary of the assets and liabilities related to discontinued operations (in thousands):
December 31, | ||||||||
2020 | 2019 | |||||||
ASSETS | ||||||||
Current assets: | ||||||||
Cash and cash equivalents | $ | 3,917 | $ | 6,460 | ||||
Receivables | 908 | 2,350 | ||||||
Total current assets | 4,825 | 8,810 | ||||||
Intangible assets, net | — | 3,930 | ||||||
Other assets, net | — | 214 | ||||||
Total assets | $ | 4,825 | $ | 12,954 | ||||
LIABILITIES | ||||||||
Current liabilities: | ||||||||
Medical claims and related payables | $ | 1,293 | $ | 1,073 | ||||
Accounts payable and accrued expenses | 2,389 | 7,236 | ||||||
Total current liabilities | 3,682 | 8,309 | ||||||
Noncurrent liabilities | — | 120 | ||||||
Total liabilities | 3,682 | 8,429 | ||||||
Net assets | $ | 1,143 | $ | 4,525 | ||||
F-58
The results of discontinued operations are as follows (in thousands):
Year Ended | ||||||||||||
2020 | 2019 | 2018 | ||||||||||
Revenues: | ||||||||||||
Medical services revenue | $ | 155,108 | $ | 209,799 | $ 311,744 | |||||||
Other operating revenue | 188 | 127 | 63 | |||||||||
Total revenues | 155,296 | 209,926 | 311,807 | |||||||||
Expenses: | ||||||||||||
Medical services expense | 84,189 | 123,850 | 168,554 | |||||||||
Other medical expenses | 57,546 | 79,423 | 108,358 | |||||||||
General and administrative | 30,341 | 47,413 | 49,874 | |||||||||
Depreciation and amortization | 568 | 29,160 | 9,794 | |||||||||
Impairments (recoveries) | — | 98,343 | 40,794 | |||||||||
Income (loss) from operations | (17,348 | ) | (168,263 | ) | (65,567 ) | |||||||
Other income (expense), ne t | (2,351 | ) | (15,177 | ) | (7,330 ) | |||||||
Gain (loss) on sales of assets, net | 20,401 | — | — | |||||||||
Interest expense | (350 | ) | (1,011 | ) | (29 ) | |||||||
Income (loss) before income taxes and noncontrolling interests | 352 | (184,451 | ) | (72,926 ) | ||||||||
Income tax benefit (expense) | 2,804 | 16,166 | 7,588 | |||||||||
Net income (loss) from discontinued operations | 3,156 | (168,285 | ) | (65,338 ) | ||||||||
Noncontrolling interests’ share of earnings | — | 152 | (409 ) | |||||||||
Net income (loss) from discontinued operations attributable to common shares | $ | 3,156 | $ | (168,133 | ) | $ (65,747 ) | ||||||
The following table provides significant
non-cash
operating items for discontinued operations that are included in the consolidated statements of cash flows (in thousands):Year Ended | ||||||||||||
2020 | 2019 | 2018 | ||||||||||
Non-cash operating activities from discontinued operations: | ||||||||||||
Depreciation and amortization | $ | 568 | $ | 29,160 | $ | 9,794 | ||||||
Stock-based compensation expense | 217 | 829 | 701 | |||||||||
Deferred income taxes and uncertain tax positions | (2,809 | ) | (16,177 | ) | (8,012 | ) | ||||||
Release of indemnification asset s | 3,475 | 19,219 | 7,330 | |||||||||
Impairments | — | 98,343 | 40,794 | |||||||||
Other non-cash items | (1,212 | ) | (4,042 | ) | — | |||||||
Goodwill
In August 2018, the Company’s largest payor in California terminated its relationship with the Company, causing a triggering event to test goodwill for impairment. The Company performed a fair value assessment of the related reporting unit and determined that the carrying amount of the reporting unit exceeded its fair value
F-59
and the reporting unit’s goodwill wa
s
impaired. The Company’s fair value calculation is based on an income approach and relies on historical and forecasted revenue and Adjusted EBITDA, as well as market data. All assumptions are considered to be Level 3 measurements within the fair value hierarchy. As a result of the assessment, the Company recognized a $37.8 million impairment charge, included in impairments in the consolidated statements of operations and comprehensive income (loss), which represented the entire goodwill balance of its California reporting unit during the year ended December 31, 2018.Intangible Assets
Due to the
continued deterioration in the performance of the California reporting unit, in the fourth quarter of 2019, the Company initiated a process to evaluate strategic alternatives for its California operations, including a sale or abandonment of all or substantially all of such operations. The Company therefore performed an assessment of the long-lived assets in the California reporting unit for impairment and determined that the carrying value of certain of those assets was not recoverable. Accordingly, the Company wrote-down such assets to fair value, resulting in the recognition of a $98.3 million impairment charge in discontinued operations for the year ended December 31, 2019.To estimate the fair value, the Company considered both an orderly liquidation approach and an income approach. An orderly liquidation value is the amount that could be realized from a liquidation sale, given a reasonable period of time to find a purchaser (or purchasers), selling the asset in the existing condition where it is located, and assuming the highest and best use of the asset by market participants. The Company’s valuation includes inputs that are unobservable and are therefore considered Level 3 inputs in the fair value hierarchy
.
Included in amortization expense for the year ended December 31, 2019 is additional amortization of $21.4 million due to a reduction in the useful life of an intangible asset that the Company ceased using in 2019.
Indemnification Assets
Indemnification assets have been established to offset certain pre-closing liabilities for which the prior owners of some of the Company’s California subsidiaries are obligated to indemnify the Company. The Company deems the amounts receivable under the indemnification agreements to be fully collectible should indemnification claims arise and, as such, a valuation allowance is not deemed necessary. During the years ended December 31, 2020, 2019 and 2018, the Company released $2.8 million,
$19.2 million,
and $7.3 million, respectively, of indemnification assets in discontinued operations in the consolidated statements of operations as the correspondingpre-closing
liabilities were released as a result of closing certain tax years (see below).Unrecognized Tax Benefits
As of December 31, 2020, the Company has recorded a liability for unrecognized tax benefits of $10.0 million, inclusive of accrued interest and penalties on unrecognized tax benefits. The liability, if reversed, would result in a tax benefit attributable to continuing operations. During the year ended December 31, 2020, due to expiration of the 2015 state statute of limitations, the Company reversed $2.9 million of tax liability, $0.6 million of accrued interest and $0.6 million of accrued penalties on unrecognized tax benefits and realized a tax benefit of $4.1 million attributable to discontinued operations. The tax benefit from the statute expiration was
offset by $0.6 million, $0.6 million, and $0.1 million of additional accruals for taxes, interest, and penalties, respectively, on uncertain tax positions during 2020 resulting in a net tax benefit of $2.8 million.
As of December 31, 2019, the Company has recorded a liability for unrecognized tax benefits of $12.8 million, inclusive of accrued interest and penalties on unrecognized tax benefits. The liability, if reversed, would result in a tax benefit attributable to discontinued operations. During the year ended December 31, 2019, due to expiration of the 2015 U.S. federal and 2014 state statute of limitations, the Company reversed $12.6 million of tax liability, $1.0 million of accrued interest and $2.5 million of accrued penalties on unrecognized tax benefits and realized a tax benefit of $16.2 million attributable to discontinued
operations
.
F-60
As of December 31, 2018, the Company has recorded a liability for unrecognized tax benefits of $
29.0 million, inclusive of accrued interest and penalties on unrecognized tax benefits. The liability, if reversed, would result in a tax benefit attributable to discontinued operations. During the year ended December 31, 2018, due to expiration of the 2014 U.S. federal statute of limitations, the Company reversed $6.4 million of tax liability, $0.7 million of accrued interest and $1.3 million of accrued penalties on unrecognized tax benefits and realized a tax benefit of $8.4 million attributable to discontinued operations.Compliance Requirements
In February 2018, the Company voluntarily disclosed to the California Department of Managed Health Care (“DMHC”) and its contracting payors, certain noncompliant practices in the Company’s claims and utilization management operations. Commencing in early 2018, the Company took action to remediate all identified exceptions in order to bring such operations into full compliance with the requirements of the DMHC and its payors. On December 10, 2019, the DMHC, Office of Financial Review, corresponded with the Company’s Claims and Compliance departments seeking an acknowledgement letter from the Company’s California affiliated independent practice associations (“California IPAs”) regarding certain audit deficiencies covering the period December 1, 2018 through February 28, 2019. On December 17, 2019, the Company responded to the request stating that it did not materially dispute the DMHC’s findings. It further stated, among other things, that the California IPAs had implemented corrective action to remediate substantially all known deficiencies identified by the DMHC’s audit findings. On March 9, 2021, the Company received a set of investigative interrogatories from the DMHC pursuant to its investigation of the Company’s claims and utilization management practices, including information regarding the payors affected thereby. The Company is cooperating with the DMHC to provide all requested information. While the Company has divested all of its California operations as of February 2021, the Company retains certain liabilities stemming therefrom. The Company is unable to predict the outcome of this matter or reasonably estimate the amount of any adverse impact on the Company’s consolidated financial position, operations, or cash flows resulting from the DMHC’s audit findings, if any.
NOTE 20. Subsequent Events
The Company has evaluated subsequent events through August 30, 2021, the date on which these consolidated financial statements were issued.
Initial Public Offering
On April 14, 2021, the Company priced the IPO of its common stock at an offering price of $23.00 per share for 46,600,000 shares, pursuant to the Prospectus. On April 15, 2021, the underwriters exercised their option to purchase an additional 6,990,000 shares of common stock. On April 19, 2021, the Company’s sale of an aggregate of 53,590,000 shares of common stock was completed.
Contingently Redeemable Common Stock
The redemption feature of the Company’s contingently redeemable common stock terminated upon the completion of the IPO in April 2021. Accordingly, such common stock will be reclassified from temporary equity in the mezzanine section of the condensed consolidated balance sheet to permanent equity.
Stock-based Compensation
Upon the completion of the IPO, the Company issued 11.7 million shares of common stock under partner physician group equity agreements and recognized stock-based compensation expense of $268.5 million in April 2021. Additionally, as of May 26, 2021, the Company provided financing to the physician partner groups in connection with taxes payable on shares distributed to them upon completion of the IPO under the partner physician group equity agreements, in an aggregate amount of $59.6 million.
F-61
The Company also recognized $2.6 million of expense related to stock options that vested upon the completion of the IPO and $3.7 million of expense related to a severance payment to its former chief executive officer under contingent upon the completion of the IPO.
2021 Omnibus Equity Incentive Plan
In connection with the IPO, the Company’s Board of Directors approved the agilon health, inc. 2021 Omnibus Equity Incentive Plan, or the “Omnibus Incentive Plan.” The equity awards approved by the compensation committee for grants to employees in connection with the completion of the IPO represent 1.9 million shares of common stock issuable upon the exercise or vesting of such awards.
Debt Repayment
The 2021 Secured Term Loan Facility requires, among other things, a mandatory prepayment of $50.0 million if gross proceeds from the IPO exceed $1.0 billion. On April 26, 2021, the Company repaid $50.0 million of the 2021 Secured Term Loan Facility. The maturity date of the 2021 Credit Facilities was extended to February 18, 2026, with mandatory periodic payments.
Management Agreement Termination
In connection with the completion of the IPO, the management agreement with CD&R was terminated pursuant to a termination agreement, dated as of April 16, 2021. The Company was not charged a fee in connection with the termination of this agreement.
F-62
SCHEDULE I – CONDENSED FINANCIAL INFORMATION OF REGISTRANT
agilon health, inc.
(Parent Company Only)
CONDENSED BALANCE SHEETS
(in thousands, except per share data)
December 31, | ||||||||
2020 | 2019 | |||||||
ASSETS | ||||||||
Investment in wholly owned subsidiary | $ | 24,770 | $ | 50,472 | ||||
Total assets | $ | 24,770 | $ | 50,472 | ||||
LIABILITIES, CONTINGENTLY REDEEMABLE COMMON STOCK AND STOCKHOLDERS’ EQUITY (DEFICIT) | ||||||||
Accounts payable and accrued expenses | $ | — | $ | 1,500 | ||||
Total liabilities | — | 1,500 | ||||||
Contingently redeemable common stock, 76,201 and 69,860 shares issued and outstanding, respectively | 309,500 | 281,000 | ||||||
Stockholders’ equity (deficit): | ||||||||
Common stock, $0.01 par value: 500,000 shares authorized; 249,374 and 246,743 shares issued and outstanding, respectively | 2,494 | 2,467 | ||||||
Additional paid-in capital | 263,966 | 256,643 | ||||||
Accumulated defici t | (551,190 | ) | (491,138 | ) | ||||
Total stockholders’ equity (deficit) | (284,730 | ) | (232,028 | ) | ||||
Total liabilities, contingently redeemable common stock and stockholders’ equity (deficit) | $ | 24,770 | $ | 50,472 | ||||
See accompanying Notes to the Condensed Financial Statements.
F-63
agilon health, inc.
(Parent Company Only)
CONDENSED STATEMENTS OF OPERATIONS
(in thousands)
Year Ended December 31, | ||||||||||||
2020 | 2019 | 2018 | ||||||||||
Equity in net income (loss) of subsidiary | $ | (60,052 | ) | $ | (282,588 | ) | $ | (146,926 | ) | |||
Net income (loss) attributable to common shares | $ | (60,052 | ) | $ | (282,588 | ) | $ | (146,926 | ) | |||
See accompanying Notes to the Condensed Financial Statements.
F-64
agilon health, inc.
(Parent Company Only)
NOTES TO CONDENSED FINANCIAL STATEMENTS
NOTE 1. Description of agilon health, inc.
agilon health, inc., formerly Agilon Health Topco, Inc., (“Parent”) was incorporated in Delaware and indirectly owns
% of the equity interest in agilon health management, inc. (“agilon”). Parent has no significant operations or assets other than its indirect ownership of the equity of agilon. Accordingly, Parent is dependent upon distributions from agilon to fund its obligations. However, under the terms of the agreements governing agilon’s borrowings, agilon’s ability to pay dividends or lend to Parent is restricted. While certain exceptions to the paying of dividends or lending funds restrictions exist, these restrictions have resulted in the restricted net assets (as defined in Rule
4-08(e)(3)
of Regulation
S-X)
of Parent’s subsidiaries exceeding
25% of the consolidated net assets of Parent and its subsidiaries. agilon has no obligation to pay dividends to Parent.
Condensed statements of cash flows have not been presented, as agilon health, inc. did not have any cash as of, or for the years ended December 31, 2020, 2019, and 2018; see Note 3 for issuance of common stock.
NOTE 2. Basis of Presentation
The accompanying condensed Parent-only financial statements include the amounts of Parent and its investment in agilon under the equity method, and do not present the financial statements of Parent and agilon on a consolidated basis. Under the equity method, Parent’s investment in agilon is stated at cost plus contributions and equity in undistributed income (loss) of agilon less distributions received since the date of acquisition.
These condensed Parent-only financial statements have been prepared using the same accounting principles and policies described in the notes to the agilon health, inc. consolidated financial statements, with the only exception being that Parent accounts for its subsidiaries using the equity method. These condensed Parent-only financial statements should be read in conjunction with the agilon health, inc. consolidated financial statements and their accompanying notes.
NOTE 3. Equity
A discussion of Parent’s contingently redeemable common stock and stockholders’ equity activities for the years ended December 31, 2020, 2019, and 2018 can be found in Note 12 in “Notes to the Consolidated Financial Statements” of the consolidated financial statements of agilon health, inc.
There were 0
cash dividends paid to Parent from agilon’s consolidated subsidiaries for the years ended December 31, 2020, 2019, and 2018.
Supplemental Cash Flow Information
In August 2020, $1.5 million in Parent’s common stock was used to settle incentive compensation obligations from 2019. In April 2019, $5.0 million in Parent’s common stock was used to settle incentive compensation obligations from 2018. As of December 31, 2019, the incentive compensation was recorded in accounts payable and accrued expenses.
NOTE 4. Stock Incentive Plan
A discussion of Parent’s Stock Incentive Plan for the years ended December 31, 2020, 2019 and 2018 can be found in Note 13 in the section, “Notes to the Consolidated Financial Statements” of the consolidated financial statements of agilon health, inc.
F-65
Shares
agilon health, inc.
Common Stock
J.P. Morgan
Goldman Sachs & Co. LLC
, 2021
PART II
INFORMATION NOT REQUIRED IN PROSPECTUS
Item 13. | Other Expenses of Issuance and Distribution. |
The following table sets forth the estimated expenses payable by us in connection with the sale and distribution of the securities registered hereby, other than underwriting discounts or commissions. All amounts are estimates except for the SEC registration fee and the FINRA filing fee.
SEC Registration Fee | $ | |||
FINRA Filing Fee | ||||
Printing Fees and Expenses | ||||
Accounting Fees and Expenses | ||||
Legal Fees and Expenses | ||||
Transfer Agent Fees and Expenses | ||||
Total | $ | |||
Item 14. | Indemnification of Directors and Officers. |
Indemnification Agreements
We are a party to the Indemnification Agreement with the CD&R Investor, the CD&R Funds and CD&R, pursuant to which we indemnify the CD&R Investor, the CD&R Funds and CD&R and each of their respective affiliates, successors, assigns, directors, officers, partners, members, employees, agents, advisors, consultants, representatives and controlling persons, against certain liabilities arising out of performance of the consulting agreements and any transaction fee agreements and certain other claims and liabilities, including liabilities arising out of financing arrangements and securities offerings. Our indemnification obligations under the Indemnification Agreement are primary to any similar rights to which any indemnitee may be entitled under any other agreement or document.
We are a party to indemnification agreements with our directors. The indemnification agreements provide the directors with contractual rights to indemnification and expense advancement.
Directors’ and Officers’ Liability Insurance
We have directors’ and officers’ liability insurance which insures against certain liabilities that our directors and officers and the directors and officers of our subsidiaries may, in such capacities, incur.
Item 15. | Recent Sales of Unregistered Securities. |
The following sets forth information regarding all unregistered securities sold within the past three years adjusted to give effect to astock split effected on April 1, 2021.
100-for-1
Sales of Common Stock
In November 2018 and January 2019, we sold an aggregate of 46,276,900 shares of Common Stock to accredited investors at a purchase price per share of $3.78 for an aggregate price of $175,000,725.04. In April 2019, we issued an aggregate of 1,322,200 shares of Common Stock to an accredited investor partner to settle provider incentive liabilities, which stock was valued at a price per share of $3.78 for an aggregate price of $5,000,032. In November and December 2019, and January, February and March 2020, we sold an aggregate of 29,924,400 shares of Common Stock to accredited investors at a purchase price per share of $4.49 for an aggregate price of $134,498,208.24. In August 2020, we issued an aggregate of 333,800 shares of Common
II-1
Stock to an accredited investor partner to settle provider incentive liabilities, which stock was valued at a price per share of $4.49 for an aggregate price of $1,500,297. Between March 2018 and February 2021, we entered into partner physician group equity agreements pursuant to which our anchor physician partners were entitled to receive shares of Common Stock conditioned on completion of our IPO with a total value of $268.5 million. On April 19, 2021, such anchor physician partners received 11,682,473 shares of Common Stock pursuant to our partner physician group equity agreements for a total of $268.5 million.
The offers, sales and issuances of the securities described above were deemed to be exempt from registration under the Securities Act in reliance on Section 4(a)(2) of the Securities Act (“Section 4(a)(2)”) as transactions by an issuer not involving a public offering. The recipients of securities in each of these transactions acquired the securities for investment only and not with a view to or for sale in connection with any distribution thereof. Each of the recipients of securities in these transactions was an accredited investor within the meaning of Rule 501 of Regulation D under the Securities Act.
Plan-Related Issuances
In December 2017, March 2018, and May, June and September 2020 and January and March 2021 we issued an aggregate of 2,514,200 shares of Common Stock, primarily through the exercise of stock options, to our officers, directors and other employees in connection with our Stock Incentive Plan at a purchase price per share of $1.00 for an aggregate price of $2,514,200. For stock option exercises, the purchase price is a
pre-
determined grant date strike price. In June and July 2020 and March 2021 we sold an aggregate of 1,253,300 shares of Common Stock to our officers and directors in connection with our Stock Incentive Plan at a purchase price per share of $4.49 for an aggregate price of $5,633,082. In September 2020, we issued 336,800 shares in respect of a cashless net exercise of stock options under the Stock Incentive Plan for no proceeds. In April 2021 we issued an aggregate of 2,000 shares of Common Stock, pursuant to exercises of stock options, to our officers, directors and other employees in connection with our Stock Incentive Plan at a purchase price per share of $4.45 for an aggregate price of $8,897. In addition in April 2021, we issued an aggregate of 50,000 shares of Common Stock pursuant to exercises of stock options, to our officers, directors and other employees in connection with our Stock Incentive Plan at a purchase price per share of $3.78 for an aggregate price of $189,080.The offers, sales and issuances of the securities described above were deemed to be exempt from registration either under the Securities Act, in that the transactions were under compensatory benefit plans and contracts relating to compensation, or under Section 4(a)(2) in that the transactions were between an issuer and members of its senior executive management and did not involve any public offering within the meaning of Section 4(a)(2). The recipients of such securities were our officers, employees and directors and received the securities under our equity incentive plans.
Item 16. | Exhibits and Financial Statement Schedules. |
(a) Exhibits.
Note Regarding Reliance on Statements in Our Contracts
S-1,
please remember that they are included to provide you with information regarding their terms and are not intended to provide any other factual or disclosure information about agilon health, its subsidiaries or affiliates, or the other parties to the agreements. The agreements contain representations and warranties by each of the parties to the applicable agreement. These representations and warranties have been made solely for the benefit of the other parties to the applicable agreement and (i) should not in all instances be treated as categorical statements of fact, but rather as a way of allocating the risk to one of the parties if those statements prove to be inaccurate; (ii) have been qualified by disclosures that were made to the other party in connection with the negotiation of the applicable agreement, which disclosures are not necessarily reflected in the agreement; (iii) may apply standards of materiality in a way that is different from what may be viewed as material to investors; and (iv) were made only as of the date of the applicable agreementII-2
or such other date or dates as may be specified in the agreement and are subject to more recent developments. Accordingly, these representations and warranties may not describe the actual state of affairs as of the date they were made or at any other time. Additional information about agilon health, its subsidiaries and affiliates may be found elsewhere in this Registration Statement on Form
S-1.
II-3
II-4
II-5
| * | Filed herewith. |
| ** | To be filed by amendment. |
| † | Identifies each management contract or compensatory plan or arrangement. |
| + | Certain portions of this exhibit have been redacted pursuant to Item 601(b)(10)(iv) of Regulation S-K. |
(b) Financial Statement Schedules:
Schedule I—Condensed Financial Information of Registrant is included in the Registration Statement beginning on
page F-22.
Schedule I—Condensed Financial Information of Registrant is included in the Registration Statement beginning on page F-62.
II-6
Item 17. | Undertakings. |
| (a) | Insofar as indemnification for liabilities arising under the Securities Act of 1933 may be permitted to directors, officers and controlling persons of the registrant pursuant to the foregoing provisions, or otherwise, the registrant has been advised that in the opinion of the Securities and Exchange Commission such indemnification is against public policy as expressed in the Act and is, therefore, unenforceable. In the event that a claim for indemnification against such liabilities (other than the payment by the registrant of expenses incurred or paid by a director, officer or controlling person of the registrant in the successful defense of any action, suit or proceeding) is asserted by such director, officer or controlling person in connection with the securities being registered, the registrant will, unless in the opinion of its counsel the matter has been settled by controlling precedent, submit to a court of appropriate jurisdiction the question whether such indemnification by it is against public policy as expressed in the Act and will be governed by the final adjudication of such issue. |
| (b) | The undersigned registrant hereby undertakes that: |
| (1) | For purposes of determining any liability under the Securities Act of 1933, the information omitted from the form of prospectus filed as part of this registration statement in reliance upon Rule 430A and contained in a form of prospectus filed by the registrant pursuant to Rule 424(b) (1) or (4) or 497(h) under the Securities Act shall be deemed to be part of this registration statement as of the time it was declared effective. |
| (2) | For the purpose of determining any liability under the Securities Act of 1933, each post-effective amendment that contains a form of prospectus shall be deemed to be a new registration statement relating to the securities offered therein, and the offering of such securities at that time shall be deemed to be the initial bona fide offering thereof. |
II-7
SIGNATURES
Pursuant to the requirements of the Securities Act of 1933, as amended, the registrant has duly caused this registration statement to be signed on its behalf by the undersigned, thereunto duly authorized, in the City of Long Beach, State of California on August 30, 2021.
| agilon health, inc. | ||
| By: | /s/ Steven J. Sell | |
| Name: | Steven J. Sell | |
| Title: | Chief Executive Officer and President | |
KNOW ALL PERSONS BY THESE PRESENTS, that each person whose signature appears below constitutes and appoints Steven J. Sell, Timothy S. Bensley and Theodore Halkias, and each of them, his or her true and lawfuland agent, acting alone, with full power of substitution and resubstitution, for him or her and in his or her name, place and stead, in any and all capacities, to sign any or all amendments to this Registration Statement, including post-effective amendments and registration statements filed pursuant to Rule 462(b) and otherwise, and to file the same, with all exhibits thereto, and other documents in connection therewith, with the U.S. Securities and Exchange Commission, granting unto saidfull power and authority to do and perform each and every act and thing requisite or necessary to be done in and about the premises, as such person, hereby ratifying and confirming all that saidand agent, or his or her substitute or substitutes, may lawfully do or cause to be done by virtue hereof.
attorney-in-fact
attorney-in-fact
attorney-in-fact
Pursuant to the requirements of the Securities Act of 1933, as amended, this registration statement has been signed on August 30, 2021 by the following persons in the capacities indicated.
Signature | Title | |
/s/ Steven J. Sell | Chief Executive Officer, President, Director | |
| Steven J. Sell | (Principal Executive Officer) | |
/s/ Timothy S. Bensley | Chief Financial Officer | |
| Timothy S. Bensley | (Principal Financial Officer) | |
/s/ Glenn Sobotka | Chief Accounting Officer | |
| Glenn Sobotka | (Principal Accounting Officer) | |
/s/ Michelle A. Gourdine | Director | |
| Michelle A. Gourdine, M.D. | ||
/s/ Sharad Mansukani | Director | |
| Sharad Mansukani, M.D. | ||
/s/ Clay Richards | Director | |
| Clay Richards | ||
/s/ Ravi Sachdev | Director | |
| Ravi Sachdev | ||
/s/ Richard J. Schnall | Director | |
| Richard J. Schnall | ||
/s/ Michael Smith | Director | |
| Michael Smith | ||
II-8
Signature | Title | |
/s/ Derek L. Strum | Director | |
| Derek L. Strum | ||
/s/ Ron Williams | Director | |
| Ron Williams | ||
/s/ William Wulf | Director | |
| William Wulf, M.D. | ||
/s/ Karen McLoughlin | Director | |
| Karen McLoughlin | ||
II-9