September 30, 2020 Compared to December 31, 2019
Assets
Cash and Cash Equivalents. Cash and cash equivalents were $637.5 million as of September 30, 2020, as compared to $73.3 million as of December 31, 2019, representing an increase of $564.2 million or 769.7%. The increase between periods was primarily the result of net income generated in the nine months ended September 30, 2020 from increased loan origination and sale volumes and net proceeds from warehouse borrowing and other lines of credit and debt obligations, partially offset by the redemption of Class I Common Units, dividends, and distributions.
Restricted Cash. Restricted cash was $70.4 million as of September 30, 2020, as compared to $44.2 million as of December 31, 2019 representing an increase of $26.2 million or 59.3%. The increase between periods was primarily the result of increases in restricted cash pledged as collateral for our Warehouse Lines.
Accounts Receivable, Net. Accounts receivable, net, was $118.4 million as of September 30, 2020, as compared to $121.0 million as of December 31, 2019, representing a decrease of $2.6 million or 2.2%. The decrease between periods was primarily the result of a decrease in receivables as a result of decreases in loan principal and interest receivable from loan sales due to reduced holding periods on our LHFS, partially offset by an increase in receivables from hedging activities.
Loans Held for Sale, at Fair Value. Loans held for sale, at fair value, were $4.9 billion as of September 30, 2020, as compared to $3.7 billion as of December 31, 2019, representing an increase of $1.2 billion or 32.8%. The increase during the nine months ended September 30, 2020 was primarily the result of originations of loans totaling $63.4 billion, offset by $62.2 billion in sales. At September 30, 2020, loans held for sale included valuation gains of $190.6 million compared to $76.4 million at December 31, 2019.
Derivative Assets, at Fair Value. Derivative assets, at fair value, were $722.1 million as of September 30, 2020, as compared to $131.2 million as of December 31, 2019, representing an increase of $590.9 million or 450.3%. The increase between periods was primarily the result of a $592.2 million increase in IRLCs, offset by a $1.3 million decrease in Hedging Instruments entered into as a result of increased loan commitments associated with the growth in our lending operation. At September 30, 2020, derivative assets included IRLCs with fair values and notional amounts of $722.1 million and $30.3 billion, respectively, compared to $129.9 million and $8.5 billion, respectively, at December 31, 2019.
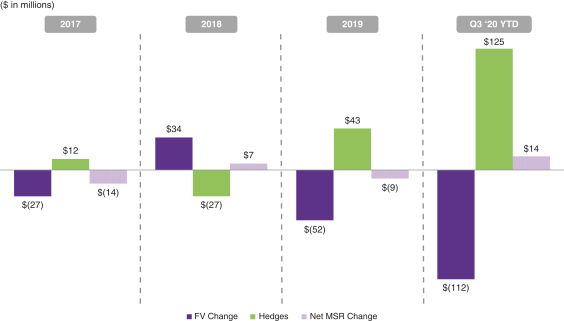
Servicing Rights, at Fair Value. Servicing rights, at fair value, were $780.5 million as of September 30, 2020, as compared to $447.5 million as of December 31, 2019, representing an increase of $333.0 million or 74.4%. The increase between periods was primarily the result of $574.8 million in capitalized servicing rights from the sale of loans on a servicing retained basis, partially offset by a $112.1 million decrease in estimated fair value due to the decreasing interest rate environment, a $9.6 million decrease in servicing rights from the sale of $194.0 million in UPB of servicing rights, and a $120.5 million decrease due to principal amortization and prepayments during the nine months ended September 30, 2020.
Property and Equipment, Net. Property and equipment, net, was $76.3 million as of September 30, 2020, as compared to $80.9 million as of December 31, 2019, representing a decrease of $4.6 million or 5.7%. The decrease between periods was primarily the result of depreciation of $26.7 million, partially offset by additions of $19.6 million consisting primarily of internally developed software cost associated with the expansion of our proprietary technology, capital expenditures associated with the growth of our company and additional property and equipment.
Operating lease right-of-use assets. Operating lease right-of-use assets were $56.4 million as of September 30, 2020, as compared to $61.7 million as of December 31, 2019, representing a decrease of $5.2 million or 8.5%. The decrease between periods was related to amortization of $19.2 million, offset by operating lease right-of-use assets obtained in exchange for operating lease liabilities totaling $14.0 million.
125


