UNITED STATES
SECURITIES AND EXCHANGE COMMISSION
Washington, D.C. 20549
_____________________
FORM 6-K
Report of Foreign Private Issuer Pursuant to Rule 13a-16 or
15d-16 of the Securities Exchange Act of 1934
For the month of February 2023
Commission File Number: 001-39928
_____________________
Sendas Distribuidora S.A.
(Exact Name as Specified in its Charter)
Sendas Distributor S.A.
(Translation of registrant’s name into English)
Avenida Ayrton Senna, No. 6,000, Lote 2, Pal 48959, Anexo A
Jacarepaguá
22775-005 Rio de Janeiro, RJ, Brazil
(Address of principal executive offices)
(Indicate by check mark whether the registrant files or will file annual reports under cover of Form 20-F or Form 40-F.)
Form 20-F: ý Form 40-F: o
(Indicate by check mark if the registrant is submitting the Form 6-K in paper as permitted by Regulation S-T Rule 101(b)(1)):
Yes: o No: ý
(Indicate by check mark if the registrant is submitting the Form 6-K in paper as permitted by Regulation S-T Rule 101(b)(7)):
Yes: o No: ý
(FREE TRANSLATION INTO ENGLISH FROM THE ORIGINAL PREVIOUSLY ISSUED IN PORTUGUESE) Standard Financial Statement – December 31,2022 – SENDAS DISTRIBUIDORA S.A. |  |
| Index | |
| Independent Auditor's Report on Financial Statements | 1 |
| Earnings Release | 7 |
| Financial Statements | |
| Balance Sheet | 24 |
| Statements of Operations | 26 |
| Statements of Comprehensive Income | 27 |
| Statements of Changes in Shareholders’ Equity | 28 |
| Statements of Cash Flows | 29 |
| Notes to the financial statements | 30 |
| Opinion of Auditing Board or an Equivalent Body | 65 |
| Summary Report of Audit Committee (statutory, prescribed in a specific provision of CVM) | 66 |
| Management Statement on the Financial Statements and Independent Auditor's Report | 67 |
(Convenience Translation into English from the |
Sendas Distribuidora S.A. Financial Statements
Deloitte Touche Tohmatsu Auditores Independentes Ltda. |
| 1 |
 | Deloitte Touche Tohmatsu Dr. Chucri Zaidan Avenue, 1.240 - 4th to 12th floors - Golden Tower 04711-130 - São Paulo - SP Brazil
Tel.: + 55 (11) 5186-1000 Fax: + 55 (11) 5181-2911 www.deloitte.com.br |
(Convenience Translation into English from the Original Previously Issued in Portuguese)
INDEPENDENT AUDITOR’S REPORT ON THE FINANCIAL STATEMENTS
To the Shareholders and Board of Directors of
Sendas Distribuidora S.A.
Opinion
We have audited the accompanying financial statements of Sendas Distribuidora S.A. (“Company”), which comprise the balance sheet as at December 31, 2022, and the related statements of income, of comprehensive income, of changes in equity and of cash flows for the year then ended, and notes to the financial statements, including a summary of significant accounting policies.
In our opinion, the financial statements referred to above present fairly, in all material respects, the financial position of Sendas Distribuidora S.A. as at December 31, 2022, and its financial performance and its cash flows for the year then ended, in accordance with accounting practices adopted in Brazil and International Financial Reporting Standards - IFRSs, issued by the International Accounting Standards Board - IASB.
Basis for opinion
We conducted our audit in accordance with Brazilian and International Standards on Auditing. Our responsibilities under those standards are further described in the “Auditor’s responsibilities for the audit of the financial statements” section of our report. We are independent of the Company in accordance with the relevant ethical requirements set out in the Code of Ethics for Professional Accountants and the professional standards issued by the Brazilian Federal Accounting Council (“CFC”), and we have fulfilled our other ethical responsibilities in accordance with these requirements. We believe that the audit evidence we have obtained is sufficient and appropriate to provide a basis for our audit opinion.
Key audit matters
Key audit matters are those matters that, in our professional judgment, were of most significance in our audit of the current year. These matters were addressed in the context of our audit of the financial statements as a whole, and in forming our opinion thereon, and, therefore, we do not provide a separate opinion on these matters.
Recoverability of ICMS and PIS/COFINS tax credits
Why it is a KAM
As described in note 9 to the financial statements, at December 31, 2022, the Company had recoverable ICMS tax credits amounting to R$1,210 million and PIS/COFINS tax credits amounting to R$587 million, whose recoverability depends on the generation of sufficient amounts of suitable taxes payable in the future. In assessing the recoverability of these tax credits, Management uses projections of revenues, costs and expenses, as well as other information used in estimating the timing and nature of the future amounts of taxes payable, which are based on estimates and assumptions as to future business performance and market conditions, as well as expectations as to applicable tax regulations.
Auditing the recoverability of these tax credits was considered especially challenging due to: (i) the magnitude of amounts involved; and (ii) the high degree of complexity involved in the Brazilian indirect tax legislation (both State and Federal) and in Management’s assessment process, which requires significant judgment by Management and includes significant assumptions in the estimation of the timing and amounts of future taxes payable that could be affected by future market or economic conditions and events.
Deloitte refers to one or more of Deloitte Touche Tohmatsu Limited (“DTTL”), its global network of member firms, and their related entities (collectively, the “Deloitte organization”). DTTL (also referred to as “Deloitte Global”) and each of its member firms and related entities are legally separate and independent entities, which cannot obligate or bind each other in respect of third parties. DTTL and each DTTL member firm and related entity is liable only for its own acts and omissions, and not those of each other. DTTL does not provide services to clients. Please see www.deloitte.com/about to learn more.
Deloitte is a leading global provider of audit and assurance, consulting, financial advisory, risk advisory, tax and related services. Our global network of member firms and related entities in more than 150 countries and territories (collectively, the “Deloitte organization”) serves four out of five Fortune Global 500® companies. Learn how Deloitte’s approximately 345,000 people make an impact that matters at www.deloitte.com.
© 2023. For information, contact Deloitte Global. |
| 2 |

How the matter was addressed in our audit
Our audit procedures included, among others:
| • | We obtained an understanding, evaluated the design and implementation and tested the operating effectiveness of relevant internal controls over Management’s assessment of the recoverability of these tax credits, including relevant internal controls over projections prepared by Management and approved by those charged with governance, used in the recoverability assessment. |
| • | We evaluated the significant assumptions used by Management in its recoverability assessment and tested the completeness and accuracy of the underlying data supporting the significant assumptions. |
| • | With the assistance of our tax specialists, we evaluated the application of tax laws and special tax regimes used in the recoverability assessment. |
| • | We tested the data used by Management in determining the recorded amounts for recoverable tax credits, comparing inputs to internal data and testing the accuracy and completeness of calculations. |
| • | We evaluated the related disclosures in the financial statements. |
Based on the evidence obtained through our audit procedures described above, we consider that the recoverability of these tax credits and related disclosures in the notes to the financial statements are acceptable in the context of the financial statements taken as a whole.
Provisions and Tax contingencies
Why it is a KAM
As described in note 16 to the financial statements, the Company is party to a significant number of administrative and legal proceedings arising from various tax claims and assessments. Based on the opinions and with the support of its internal and external legal counsel, Management assesses the likelihood of loss related to these tax claims and assessments, and records provisions when the likelihood of loss is assessed as probable and the amounts can be estimated. As of December 31, 2022, Management has recorded provisions in the amount of R$55 million. Additional claims and assessments of R$2,443 million were outstanding as of December 31, 2022, for which no provision was recorded. Management uses significant judgment in evaluating the merits of each claim and assessment and in evaluating the likelihood and potential amounts of loss, considering the complexity of the Brazilian tax environment and legislation, including existence and interpretation of applicable jurisprudence and case law.
Auditing Management’s assessment of the likelihood of loss on tax claims was considered especially challenging due to: (i) the complexity involved in the evaluation and interpretation of applicable tax legislation, case law, and applicable jurisprudence, which requires a high degree of judgment applied by Management and the assistance of the Company’s external counsel; (ii) the amounts involved and the significant estimate uncertainty related to the ultimate outcome and timing of court decisions; and (iii) the additional audit efforts, which include the involvement of our tax specialists.
© 2023. For information, contact Deloitte Global.
| 3 |
|
How the matter was addressed in our audit
Our audit procedures included, among others:
| • | We obtained an understanding, evaluated the design and implementation, and tested the operating effectiveness of relevant internal controls over the identification and evaluation of tax claims and assessments, including the assumptions and technical merits of tax positions used in the evaluation of the likelihood of loss, as well as the processes to measure, record and disclose the amounts related to tax contingencies. |
| • | We tested the completeness of the tax contingencies subject to evaluation by the Company. |
| • | With the assistance of our tax specialists, we evaluated Management’s assessment of the likelihood and estimate of loss for a sample of material tax contingencies, which included: |
| - | Obtaining an understanding and evaluating Management’s judgments, the technical merits and documentation supporting Management’s assessment, including reading and evaluating tax opinions or other third-party tax advice obtained from the Company’s external tax and legal counsel. |
| - | Inspecting and evaluating the responses to external confirmations sent to key external tax and legal advisers of the Company. |
| - | Challenging Management’s assessment using our knowledge of, and experience with, the application of tax laws and developments in the applicable regulatory and tax environments. |
| - | Testing the assumptions, underlying data and accuracy of the calculation of the amounts related to recorded tax provisions and disclosed tax contingencies. |
| - | Obtaining written representations from executives of the Company. |
| • | We also evaluated the related disclosures in the financial statements. |
Based on the evidence obtained through our audit procedures described above, we consider that Management’s assessment of the likelihood of loss on tax claims and related disclosures in the notes to the financial statements are acceptable in the context of the financial statements taken as a whole.
Other matters
Statements of value added
The statements of value added (“DVAs”) for the year ended December 31, 2022, prepared under the responsibility of the Company’s Management and presented as supplemental information for purposes of the IFRSs, were subject to audit procedures performed together with the audit of the Company’s financial statements. In forming our opinion, we assess whether these statements are reconciled with the other financial statements and accounting records, as applicable, and whether their form and content are in accordance with the criteria set out in technical pronouncement CPC 09 - Statement of Value Added. In our opinion, these statements of value added were appropriately prepared, in all material respects, in accordance with the criteria set out in such technical pronouncement and are consistent in relation to the financial statements taken as a whole.
Audit of the financial statements for the year ended December 31, 2021
The financial statements for the year ended December 31, 2021 were audited by another auditor, who issued a report dated February 21, 2022, containing an unmodified opinion on these financial statements.
© 2023. For information, contact Deloitte Global.
| 4 |
|
Other information accompanying the financial statements and the independent auditor’s report
Management is responsible for the other information. Such other information comprises the Management Report.
Our opinion on the financial statements does not cover the Management Report, and we do not express any form of audit conclusion thereon.
In connection with our audit of the financial statements, our responsibility is to read the Management Report and, in doing so, consider whether this report is materially inconsistent with the financial statements, or our knowledge obtained in the audit or otherwise appears to be materially misstated. If, based on the work we have performed, we conclude that there is a material misstatement in the Management Report, we are required to report that fact. We have nothing to report in this regard.
Responsibilities of Management and those charged with governance for the financial statements
Management is responsible for the preparation and fair presentation of the financial statements in accordance with accounting practices adopted in Brazil and the IFRSs, issued by the IASB, and for such internal control as Management determines is necessary to enable the preparation of financial statements that are free from material misstatement, whether due to fraud or error.
In preparing the financial statements, Management is responsible for assessing the Company’s ability to continue as a going concern, disclosing, as applicable, matters related to going concern and using the going concern basis of accounting unless Management either intends to liquidate the Company or to cease operations, or has no realistic alternative but to do so.
Those charged with governance are responsible for overseeing the Company’s financial reporting process.
Auditor’s responsibilities for the audit of the financial statements
Our objectives are to obtain reasonable assurance about whether the financial statements as a whole are free from material misstatement, whether due to fraud or error, and to issue an auditor’s report that includes our opinion. Reasonable assurance is a high level of assurance, but is not a guarantee that an audit conducted in accordance with Brazilian and International Standards on Auditing will always detect a material misstatement when it exists. Misstatements can arise from fraud or error and are considered material if, individually or in the aggregate, they could reasonably be expected to influence the economic decisions of users taken on the basis of these financial statements.
As part of an audit in accordance with Brazilian and International Standards on Auditing, we exercise professional judgment and maintain professional skepticism throughout the audit. We also:
| · | Identify and assess the risks of material misstatement of the financial statements, whether due to fraud or error, design and perform audit procedures responsive to those risks, and obtain audit evidence that is sufficient and appropriate to provide a basis for our opinion. The risk of not detecting a material misstatement resulting from fraud is higher than for one resulting from error, as fraud may involve collusion, forgery, intentional omissions, misrepresentations, or the override of internal control. |
| · | Obtain an understanding of internal control relevant to the audit in order to design audit procedures that are appropriate in the circumstances, but not for the purpose of expressing an opinion on the effectiveness of the Company’s internal control. |
| · | Evaluate the appropriateness of accounting policies used and the reasonableness of accounting estimates and related disclosures made by Management. |
| · | Conclude on the appropriateness of Management’s use of the going concern basis of accounting and, based on the audit evidence obtained, whether a material uncertainty exists related to events or conditions that may cast significant doubt on the ability of the Company to continue as a going concern. If we conclude that a material uncertainty exists, we are required to draw attention in our auditor’s report to the related disclosures in the financial statements or, if such disclosures are inadequate, to modify our opinion. Our conclusions are based on the audit evidence obtained up to the date of our auditor’s report. However, future events or conditions may cause the Company to cease to continue as a going concern. |
© 2023. For information, contact Deloitte Global.
| 5 |
|
| · | Evaluate the overall presentation, structure and content of the financial statements, including the disclosures, and whether the financial statements represent the underlying transactions and events in a manner that achieves fair presentation. |
We communicate with those charged with governance regarding, among other matters, the planned scope and timing of the audit and significant audit findings, including any significant deficiencies in internal control that we identify during our audit.
We also provide to those charged with governance a statement that we have complied with the relevant ethical requirements, including independence requirements, and communicate all relationships or matters that could considerably affect our independence, including, when applicable, the related safeguards.
From the matters communicated with those charged with governance, we determine those matters that were of most significance in the audit of the financial statements of the current year and are therefore the key audit matters. We describe these matters in our auditor’s report unless law or regulation precludes public disclosure about the matter or when, in extremely rare circumstances, we determine that a matter should not be communicated in our report because the adverse consequences of doing so would reasonably be expected to outweigh the public interest benefits of such communication.
The accompanying financial statements have been translated into English for the convenience of readers outside Brazil.
São Paulo, February 15, 2023
DELOITTE TOUCHE TOHMATSU | Eduardo Franco Tenório |
Auditores Independentes Ltda. | Engagement Partner |
© 2023. For information, contact Deloitte Global.
| 6 |

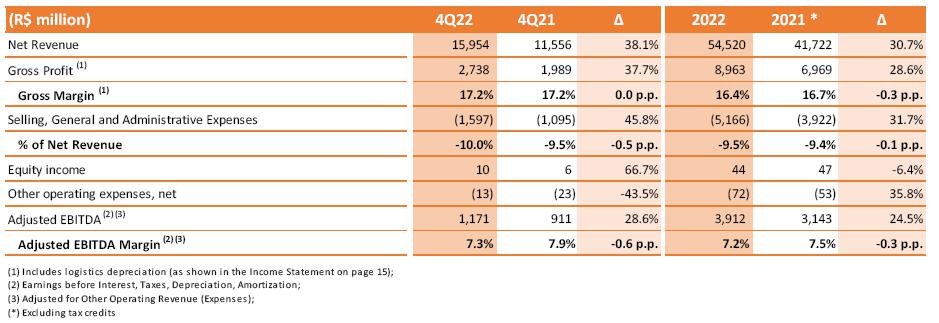
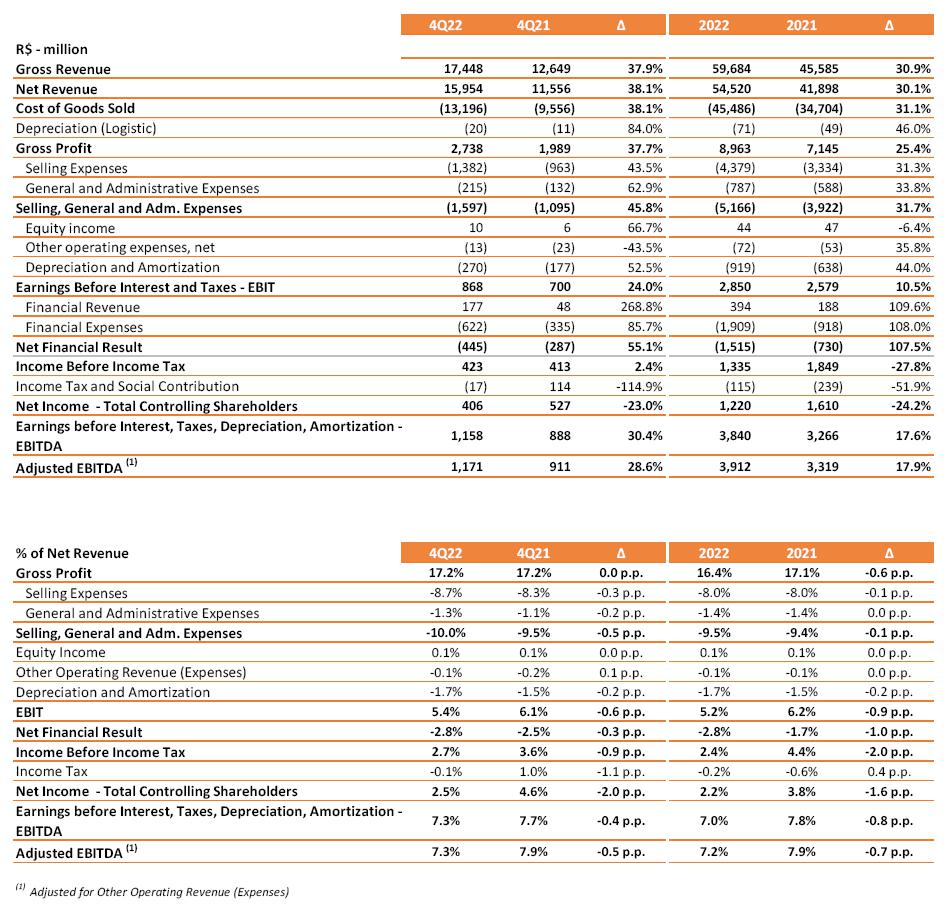
São Paulo, February 15, 2023 - Assaí Atacadista announces its results for the fourth quarter of 2022. All comments on adjusted EBITDA exclude other operating expenses and income in the periods. Figures also include the effects of IFRS 16/CPC 06 (R2) – Leases, which eliminates the distinction between operating and financial leases, except where stated otherwise.
OPENING RECORD OF 60 STORES IN 2022, REACHING 263 STORES IN OPERATION: +36% IN SALES AREA ROBUST SALES GROWTH WITH INCREASING MARKET SHARE GAINS THROUGHOUT THE YEAR HIGHER-THAN-EXPECTED PROFITABILITY: EBITDA MARGIN OF 7.2% IN 2022 |
2022 |
| · | Gross Sales amounted R$59.7 billion, up R$14.1 billion on 2021, which represents a significant growth of +31%, while ‘same-store’ sales increased more than +10%; |
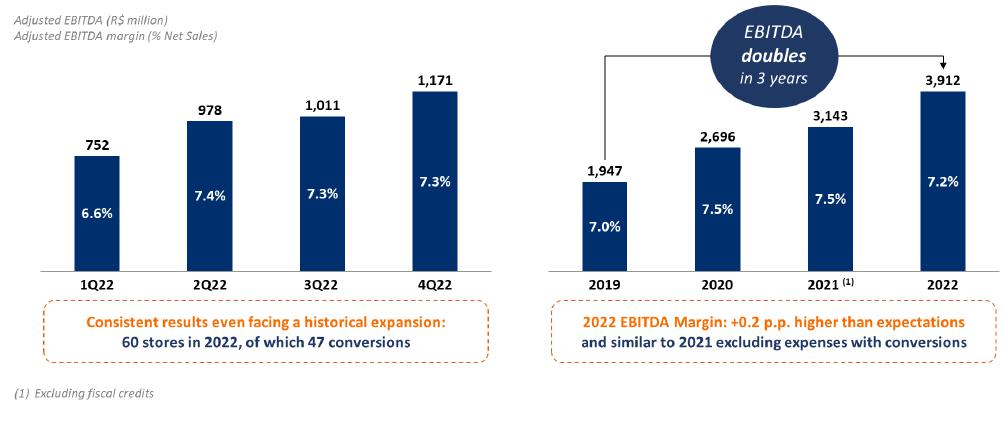
| · | Adjusted EBITDA of R$3.9 billion, up +25%¹, with margin of 7.2%, 0.2 p.p. above expectations, and expenses stable even with the business model evolution and opening of 60 stores in the year, surpassing the initial guidance of 52 stores; |
| · | Net income attained R$1.2 billion, consistent level and in line² with 2021, even considering investments to implement the hypermarket conversion project and the high interest rates; |
| · | Investments reached R$ 4.5 billion, a historic level, with significant job creation, consolidating the Company as one of the 6th largest private employers in the Brazil; |
| · | Record cash generation of R$ 4.2 billion in the last 12 months, which represents an increase of R$ 1.8 billion on the prior-year period, driven by the Company's strong growth and efficient working capital management; |
4Q22 |
| · | Gross sales reached R$17.4 billion, a significant increase of +38% on 4Q21, mainly driven by the great performance of new stores, especially hypermarket conversions, and by the resilient same-store sales growth of 10.5%; |
| · | Gross margin of 17.2%, stable in comparison to 4Q21, supported by initial performance of converted stores and by a commercial strategy that suits to the competitive environment, which resulted in the yearly highest market share gain on both total-store and same-store basis; |
| · | Record Adjusted EBITDA of R$ 1.2 billion, up +29% on 4Q21, with margin of 7.3%, driven by the more resilient stores portfolio, with the rapid maturation of converted stores; |
| · | Net income of R$ 406 million in 4Q22, +7.3%² compared to 4Q21, confirming the success of the business model even facing a scenario of higher interest rates and strong Company’s expansion; |
EXPANSION & CONVERSIONS |
| · | Store openings beat guidance: 60 new stores in the year, of which 47 conversions and 13 organic, reaching 1.3 million sqm of sales area; |
| - | 37 store openings in 4Q22: 33 conversions and 4 organics |
| · | Stores converted in 2022 are among the top performers: |
| - | Rapid maturation of sales in line with expectations: with an average of around 2 months of operation, converted stores sales are between 2x and 2.5x higher than the hypermarket format; |
| - | High attractiveness of stores with intense customer traffic leveraged by the brand strength, differentials of Assaí business model and exceptional location of commercial points; |
2023 PERSPECTIVES |
| · | Conclusion of hypermarket conversion project and continuity of the organic expansion, with around 40 stores in 2023; |
| · | Focus on the deleveraging process supported by continuous cash generation, with the objective of a Net Debt/Adjusted EBITDA ratio nearly 2x by the end of 2023 and around 1.5x in 2024. |
1Excluding Fiscal Credits (as detailed on page 4)
2For comparison purposes, variation considers only recurring effects of investment subsidies for the periods and excludes fiscal credits effects (as detailed on page 4).
| 8 |
MESSAGE FROM MANAGEMENT
2022 was a historic year for Assaí, with record gross sales and market share gains in important regions, while beating the expectations for profitability even facing the challenges imposed by the macroeconomic scenario.
With an investment of R$ 4.5 billion in 2022, the highest level in Company’s history, Assaí inaugurated 60 stores, of which 13 are organic and 47 are conversions of hypermarkets, beating its initial guidance of 52 new stores for the year and setting a new record for openings not only for the Company, but also for the national retail and wholesale food segment. We ended the year with 263 stores in operation in 23 states and the Federal District, with total sales area of over 1.3 million square meters, a 36% growth compared to 2021. Additionally, investments in the period were aimed at enhancing the shopping experience, with the improvement of the product assortment (such as Wine Cellars) and the implementation of services (Cold Cuts Emporiums and Butcheries, for example), allowing us to conquer new customers and generate incremental sales.
We created 16,000 new jobs, placing Assaí among the six largest private employers in Brazil. This robust growth was accompanied by advances in the ESG agenda: we donated 1,800 tons of produce to the partner organizations of the program Destino Certo (+44% more than in 2021) and increased the number of Blacks in executive positions by 45%, maintaining our permanent commitment to diversity and inclusion.
Reflecting these actions, the Company was included in leading stock indexes focusing on sustainability: Corporate Sustainability Index of B3 (ISE B3); Carbon Efficient Index (ICO2); Great Place to Work Index (IGPTW B3), that recognizes companies as an excellent place to work; and the Bloomberg Gender Equality Index. Also, we made progress in corporate governance with the approval of changes in the Bylaws, which established limits for related parties transactions.
The consistent performance of expansion combined with the successful commercial strategy resulted in gross sales growth of 31%, reaching nearly R$ 60 billion in 2022. EBITDA margin reached 7.2%, even after the inauguration of more stores than expected initially, attesting once again to the exceptional operational and commercial efficiency of Assaí. Net income amounted R$ 1.2 billion even in the context of higher interest rates and large investments.
The phygital strategy continues to advance rapidly, offering customers greater convenience through the strengthening of last milers partnerships and the "Meu Assaí" app, which is in rollout across the country.
Over the coming months, we will deliver the remaining conversions and will continue with the organic expansion, opening around 40 new stores in 2023. On the innovation agenda, we will continue improving and investing in digital initiatives and other growth avenues.
In closing, we once again thank our employees, investors, suppliers and other stakeholders for their trust and dedication during 2022 and remain firm in our purpose of offering a transformational experience to our customers.
The Management.
| 9 |
INCOME STATEMENT
For comparison purposes, all figures and comments below exclude the following effects from tax credits:
| (i) | R$ 216 million in the net income of 4th quarter of 2021, related to investments subsidies in prior periods; |
| (ii) | R$ 372 million in the net income of 2021 fiscal year, which are related to: |
| a. | exclusion of ICMS from the PIS and COFINS tax calculation base in 2021, which amounted to R$ 175 million in net sales and R$ 115 million in net income; |
| b. | unconstitutionality of the levying of Corporate Income Tax (IRPJ) and Social Contribution on Net Income (CSLL) on the income pegged to the SELIC rate received by the taxpayer on the repetition of undue tax payments in the total amount of R$ 81 million (affecting the income tax and social contribution and net income lines) |
| c. | inflation adjustments of the aforementioned tax credits in the amount of R$ 45 million in financial result and R$30 million in net income; and |
| d. | investments subsidies related to periods prior to fiscal year, which impacted net income in 2021 in the amount of R$ 146 million. |
| (iii) | R$ 72 million in net income for the 4th quarter of 2022 and fiscal year 2022, referring to inflation adjustments, in the amount of R$ 109 million, related to the reimbursement of ICMS-ST. |
| 10 |
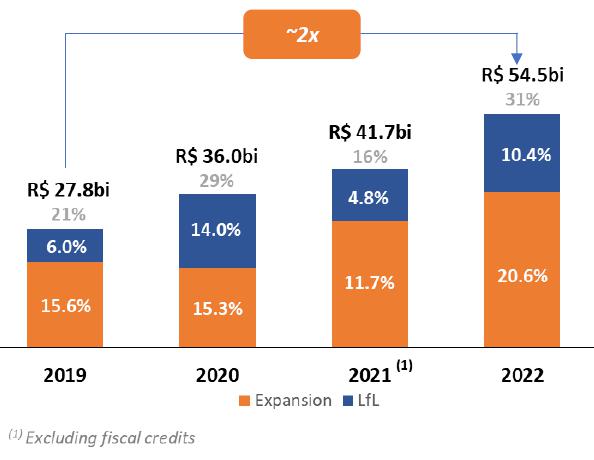
STRONG COMPANY’S EXPANSION RESULTS IN RECORD SALES
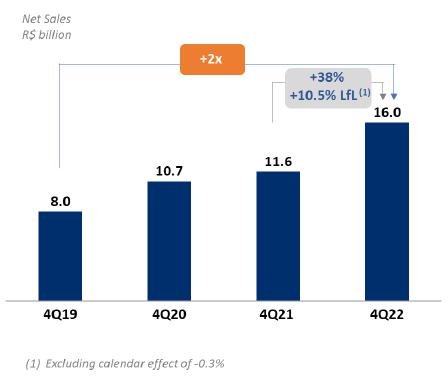
Net sales in the quarter reached R$16.0 billion, a quarterly record, representing a growth of +38.1% and an increase of R$ 4.4 billion on 4Q21. The solid performance is mainly due to:
| (i) | the strong contribution from the expansion project (+27.8%), especially the conversions of hypermarkets, whose performance is in line with expectations; |
| (ii) | the resilient “same-store” sales performance (+10.5%), which confirms the high attractiveness of the business model, even in a scenario of high inflation that continues to pressure consumer purchasing power; |
| (iii) | the effective commercial strategy, which drove high customer traffic and market share gains; and |
| (iv) | the constant enhancements to the shopping experience, with fast adaptation of assortment and services. |
In 2022, net sales came to R$ 54.5 billion, increasing +30.7% and R$ 12.8 billion in relation to 2021, demonstrating once again the Company's top notch operational management and execution capacity.
| 11 |
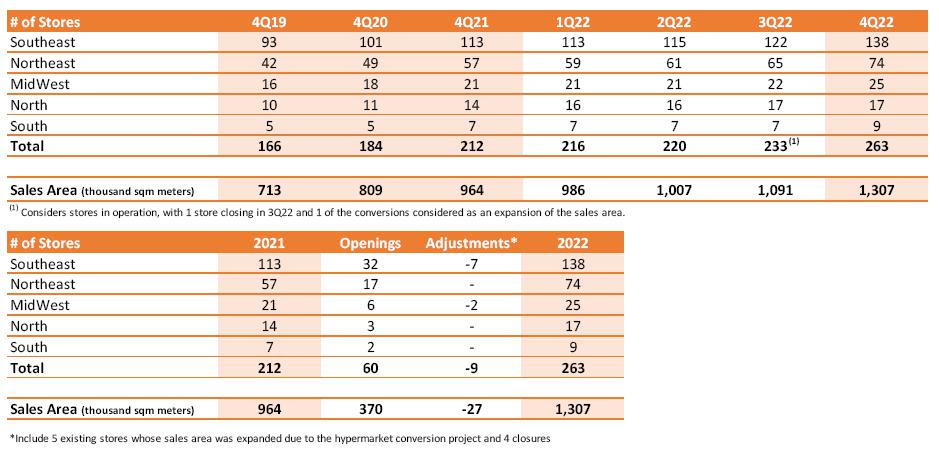
60 NEW STORES IN 2022, WITH CONVERSIONS MATURING RAPIDLY
Assaí ended 2022 with 263 stores in operation, with total a sales area of 1.3 million square meters and an increase of 36% in comparison to 2021. The Company’s expansion in 2022 surpassed the initial opening guidance of 52 new stores and set a new opening record for a single year, increasing the built-up area by around 1 million square meters.
The expansion in the period was driven by the intense acceleration in the hypermarket conversion calendar, with 47 stores opened in the second half of 2022, which added to the store network around 300,000 square meters in sales area and 30,000 new parking spaces.
In addition, 13 organic stores were opened in 8 states, further helping to strengthen and consolidate the Assaí brand nationwide.
Another highlight was the performance of converted stores, with an average of 2 months of operation, already are among the Company's top performers in sales and customer traffic, reflecting mainly the highly attractive business model of Assaí, the brand's strength and the exceptional locations of commercial points. Converted stores delivered between 2x to 2.5x the sales of the hypermarket format, reinforcing the expectations of the conversion project.
STRENGTHENING PARTNERSHIPS WITH LAST MILERS
AND ROLLOUT OF THE APP “MEU ASSAÍ”
Assaí continues advancing in the Phygital environment, offering greater convenience and a better shopping experience for customers through partnerships with last-mile operators, which currently is available in 60 cities and over 160 stores. Online sales continue to evolve and increase sequentially boosted mainly by the Company’s presence in more central regions, with the opening of converted stores.
Additionally, the rollout of "Meu Assaí" app, with new features that include exclusive and personalized offers, is being implemented in 6 Brazilian states, improving the customer's shopping journey by combining the experience of the physical world with the online one.
| 12 |
OPERATIONAL PERFORMANCE ABOVE EXPECTATIONS
DUE TO ACCELERATED EXPANSION
Quarterly gross profit amounted to R$ 2.7 billion, with margin of 17.2%, stable in relation to 4Q21. The result was driven mainly by the excellent commercial dynamics and initial performance of converted stores, which present fast maturation. The solid market share gains in the quarter on both a total-store and same-store basis demonstrate once again the Company's operational efficiency and the consistency of Assaí's business model, which, through investments in the modernization of its store network, continues to offer continuous improvement in the shopping experience and conquering new customers. In 2022, gross profit was R$ 9.0 billion, with margin of 16.4% (vs. 16.7% in 2021) mainly due to the effective commercial strategy amid increased competition and the historic Company’s expansion.
Selling, general and administrative expenses corresponded to 10.0% of net sales in the quarter mainly reflecting the effects of the pre-operating expenses related to the expansion project, with the historic opening of 37 stores in the period. In 2022, selling, general and administrative expenses corresponded to 9.5% of sales, similar to 2021, chiefly due to strict expenses control carried out throughout the year in a context of strong expansion.
Equity income came to R$ 10 million in the quarter and R$ 44 million in the year and reflects Assaí's interest of approximately 18% in the capital of FIC. The Passaí card surpassed 2.2 million cards issued and enjoys excellent growth potential given the advances in the expansion project.
Other operating expenses amounted to R$ 13 million in 4Q22 and refers mainly to asset write-offs related to the conclusion of the sale of assets announced in a material fact published in July 2021. In 2022, other operating expenses totaled R$ 72 million and include, mainly, the provision for the write-off of assets from closed stores due to the hypermarket conversion project.
Adjusted EBITDA in the quarter was a record R$ 1.2 billion with margin of 7.3%. In 2022, adjusted EBITDA was R$ 3.9 billion, with margin of 7.2%. The result beat expectations, even after the higher number of stores opened in 2022, confirming once again the Company's excellent execution capacity and commitment to meeting results.
| 13 |
FINANCIAL RESULT AFFECTED BY HIGHER INTEREST RATES
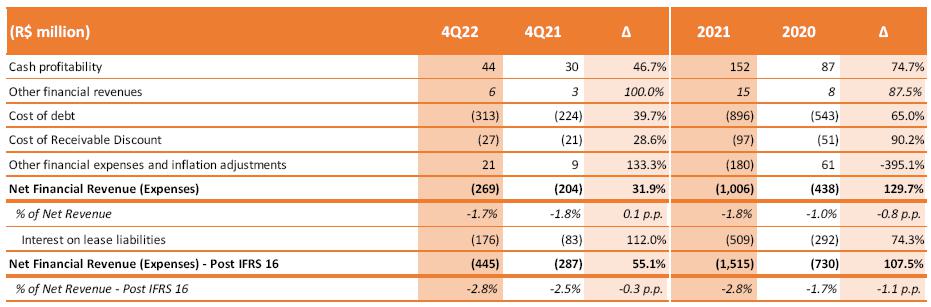
In the quarter, the net financial expense post-IFRS16 stood at R$ 445 million, representing 2.8% of net sales. Excluding the effect from interest on lease liabilities, the net financial expense was R$ 269 million, equivalent to 1.7% of net sales, similar to 4Q21. Excluding effects of inflation adjustments related to the reimbursement of ICMS-ST recognized in 2022 (as detailed on page 4), net financial expenses represents 2.4% of net sales. The result was affected by high interest rates, with the CDI 1.7x higher than 4Q21, increasing from 1.9% to 3.2%, and the higher gross debt balance related to the record investments in Company’s expansion.
In the year, the net financial expense post-IFRS16 amounted to R$ 1.5 billion, representing 2.8% of net sales. Net financial expenses pre-IFRS16, excluding interest on lease liabilities, came to R$1.0 billion, corresponding to 1.8% of net sales (vs. 1.0% in 2021), mainly reflecting the strong increase in interest rates.
NET INCOME HIGHER THAN R$ 1 BILLION IN A YEAR OF STRONG EXPANSION
Net income in the quarter was R$ 406 million, +7.3% in comparison to 4Q21, when considering only the comparable fiscal credit effects of each period (as detailed on page 4), with margin of 2.5%.
In 2022, net income totaled R$ 1.2 billion, with a margin of 2.2%. Excluding effects of tax credits detailed on page 4, the net income in 2022 (R$ 1.1 billion) remains similar to 2021 level (R$ 1.2 billion), which confirms the resilience of the business model even with the efforts to implement the hypermarket conversion project and the challenging scenario marked by higher interest rates.
| 14 |
HIGH LEVEL OF INVESTMENTS REFLECTS ACCELERATED EXPANSION
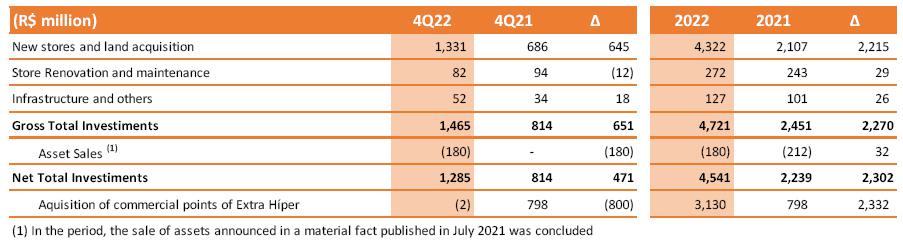
Investments in 4Q22 amounted to R$1.3 billion, 58% higher than in 4Q21, reflecting the record expansion in the period, with 37 store openings, as well as the other stores under construction that will be opened in 2023.
In 2022, investments reached R$ 4.5 billion, an amount twice as high as in 2021, mainly as a result of the opening of 60 stores in 2022, a number more than twice the expansion of 2021. Assaí continues to invest in modernizing its store network and improving customers' shopping experience by expanding services, such butcheries and cold cuts emporiums.
EFFICIENT FINANCIAL MANAGEMENT GIVEN THE HIGH INVESTMENTS CONTEXT
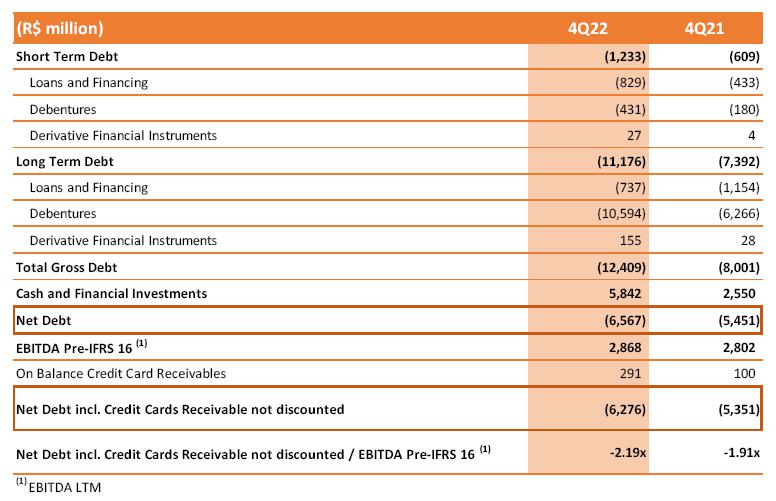
The Company ended the quarter with a net debt/Adjusted EBITDA ratio of 2.19x. This leverage ratio is in accordance with expectations given the intense investments in expansions with (i) the acquisition of hypermarket commercial points, (ii) the 60 new stores opened in 2022 and (iii) the continuation of the conversion project, with around 20 conversions planned for 2023.
In 4Q22, the Company placed a R$ 400 million issue of commercial notes to refinance a portion of liabilities coming due in 2023, which amounts to gross debt of R$ 12.4 billion. The issue's cost, whose spread in relation to the CDI is less than 1%, is below the average cost of the Company's debt, which currently stands at CDI+1.45%, with an average term of 3.5 years.
| 15 |
DIVIDENDS AND INTEREST ON EQUITY
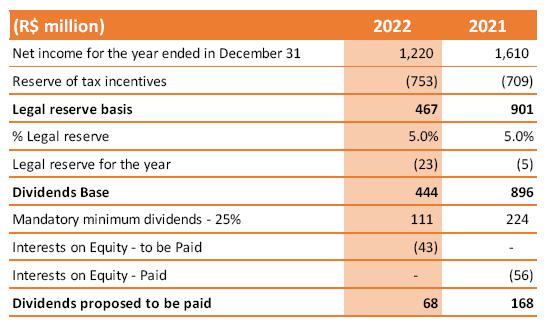
Management proposed the distribution of dividends for the year ended December 31, 2022, in the amount of R$ 111 million, equivalent to 25% of the balance available for the distribution of dividends, which excludes the tax incentive reserve related to the credits from investment subsidies and legal reserve of 5%. Also, during the year, the payment of interest on equity was approved in the net amount of R$ 43 million to be paid on February 17, 2023, as per the Notice to Shareholders dated January 13th, 2023. Therefore, the amount referring to the remaining portion of dividends is R$ 68 million, calculated as follows.
The proposal for the distribution of dividends for fiscal year 2022 will be submitted to the Annual Shareholders Meeting, to be held on April 27th, 2023. Shareholders of record on April 27th, 2023 will be entitled to the dividends. As of April 28th, 2023, the shares will trade ex-dividends. The dividends will be paid by June 26th, 2023, i.e., 60 days as from the date of the Annual Shareholders Meeting.
For the American Depositary Receipts (ADRs) traded on the NYSE, payment will be made via the depositary bank JPMorgan Chase Bank. ADR holders can find information on dividends at the website https://adr.com.
| 16 |
EFFICIENCY ON WORKING CAPITAL MANAGEMENT
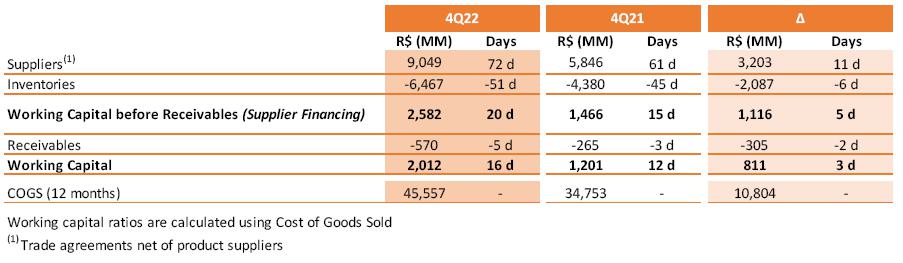
Company's working capital before receivables amounted to R$ 2.6 billion, equivalent to a term of 20 days, which represents an improvement of 5 days compared to 2021. This result was mainly driven by the expansion, which generated scale gains. Days of receivables are not significant due to the nature of Assaí's business model, with mostly cash sales.
CASH GENERATION OF R$ 4.2 BILLION, R$ 1.8 BILLION HIGHER
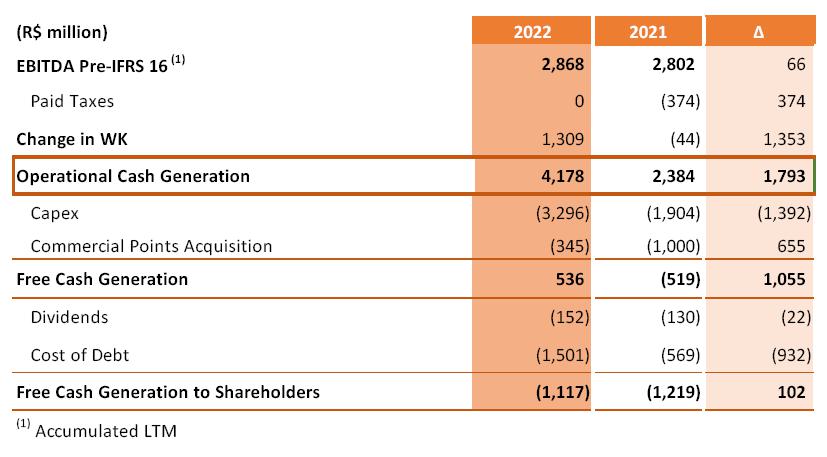
The Company's accelerated expansion contributed to significant gains in Working Capital management in the year, resulting in a 75% increase in operating cash generation, to R$ 4.2 billion in 2022.
The efficient cash management, given the context of high interest rates, large investments and the converted stores in the early phase of their maturation curve, resulted in free cash generation in line with expectations for the period.
| 17 |
CONTINUOUS PROGRESS IN ESG LEAD TO INCLUSION IN
IMPORTANT STOCK INDEXES
Assaí, as an inherent part of its business model, implements initiatives to foster a more responsible and inclusive society based on five strategic pillars:
1. Combating Climate Change: innovating and enhancing environmental management;
2. Integrated Management and Transparency: improving ESG practices through ethical and transparent relationships;
3. Transforming the Value Chain: co-building value chains committed to the environment and people;
4. Engaging with Society: acting as an agent of change to promote fair and inclusive opportunities;
5. Valuing Our People: being a reference in fostering diversity, inclusion and sustainability through our employees.
ESG highlights in 4Q22 include:
| · | Inclusion in ISE B3 (Corporate Sustainability Index), effective in January, 2023. This is the first time the Company has been included in the index since its listing registration. The Company also was included in the ICO2 B3 – Carbon Efficient Index and the IGPTW B3 Index, which includes companies recognized as an excellent place to work, as recognized and certified by the Great Place to Work (GPTW). Also, in January 2023, the Company became part of the Bloomberg Gender Equality Index. |
| · | Improvement in the CDP evaluation, one of the main measurement and disclosure programs for efficient management of carbon emissions and climate change risks. |
| · | Ongoing efforts to promote and increase diversity in the work environment: |
| o | Training on diversity administered to over 49,000 employees, 4% more than in 2021 |
| o | 45% increase vs. 2021 in the number of Blacks in executive positions and adherence to the Business Initiative for Racial Equality. |
| · | Through the Assaí Institute, the Company's social arm launched in 2022, the ‘’Food is for Sharing’’ campaign collected 378 tons of food donated by customers, which represents 750,000 meals for families in situations of vulnerability (+31% vs. 2021). |
| · | Advances in the treatment of solid waste through composting and reducing food waste. Through the Right Destination program, Assaí donated 1,800 tons of fresh produce (not proper for sale but adequate for consumption) to partner organizations, an increase of +44% compared to 2021. Consequently, the amount of waste sent to landfills avoided enabled the reduction of gas emissions, such as methane, by approximately 31,490 tons of carbon equivalent. |
| · | Decrease of 12% in scope 1(1) and 2(2) emissions compared to 2021, in line with the strategy to fight climate change and the target to reduce emissions by 38% by 2030 (base: 2015). |
(1) Company's own emissions.
(2) Emissions from electricity consumption
| 18 |
ABOUT SENDAS S.A.
Assaí is a cash and carry wholesaler serving small and midsized merchants as well as consumers in general seeking unit items as well as large volumes. With gross sales of around R$ 60 billion in 2022, Assaí operates more than 260 stores in all 23 states of Brazil, as well as the Federal District. Assaí has over 76,000 employees and welcomes 30 million customers to its stores every month.
In 2022, Assaí was elected the best wholesaler in two surveys conducted by Instituto Datafolha: “Best of São Paulo - Services” (for the seventh straight year); and “Best of the Internet in Brazil." Assaí also was named Best Retailer by “Valor 1000,” the yearbook compiled by Valor Econômico, and received certification from Great Place to Work. Assaí is one of the 15th most valuable brands in Brazil according to the annual ranking compiled by Brand Finance.
INVESTOR RELATIONS CONTACTS
Gabrielle Castelo Branco Helú
Investor Relations Officer
Ana Carolina Silva
Beatris Atilio
Daniel Magalhães
E-mail: ri.assai@assai.com.br
Website: www.ri.assai.com.br
| 19 |
APPENDICES
OPERATIONAL INFORMATION
I – Number of stores and sales area
| 20 |
FINANCIAL INFORMATION
II - Income Statement
| 21 |
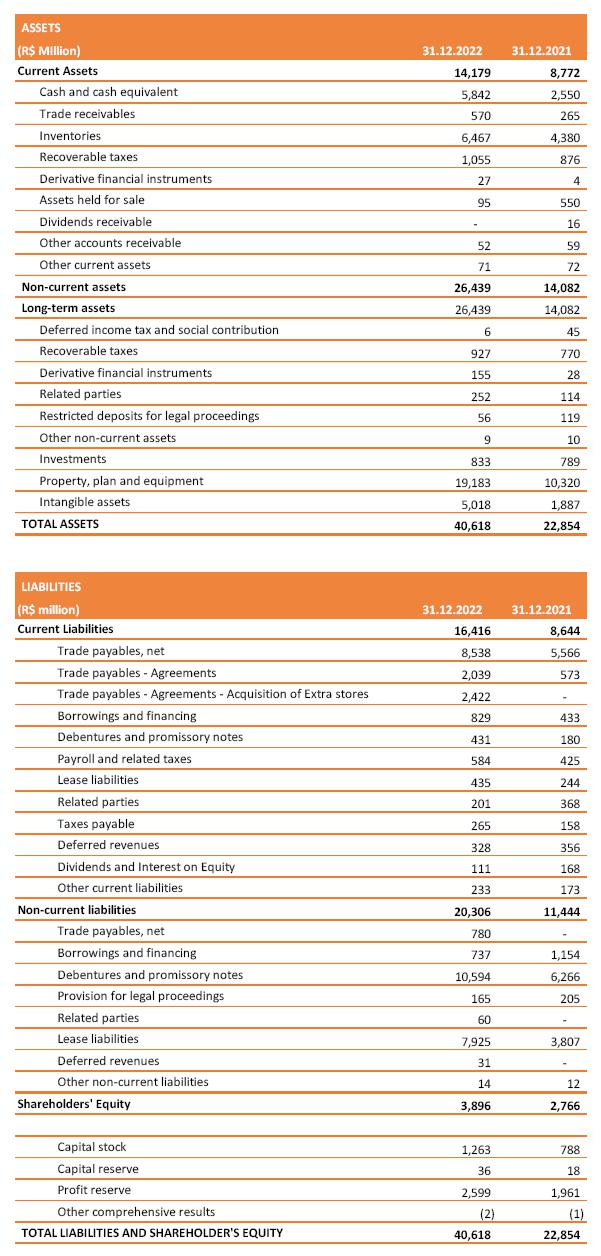
III - Balance Sheet
| 22 |
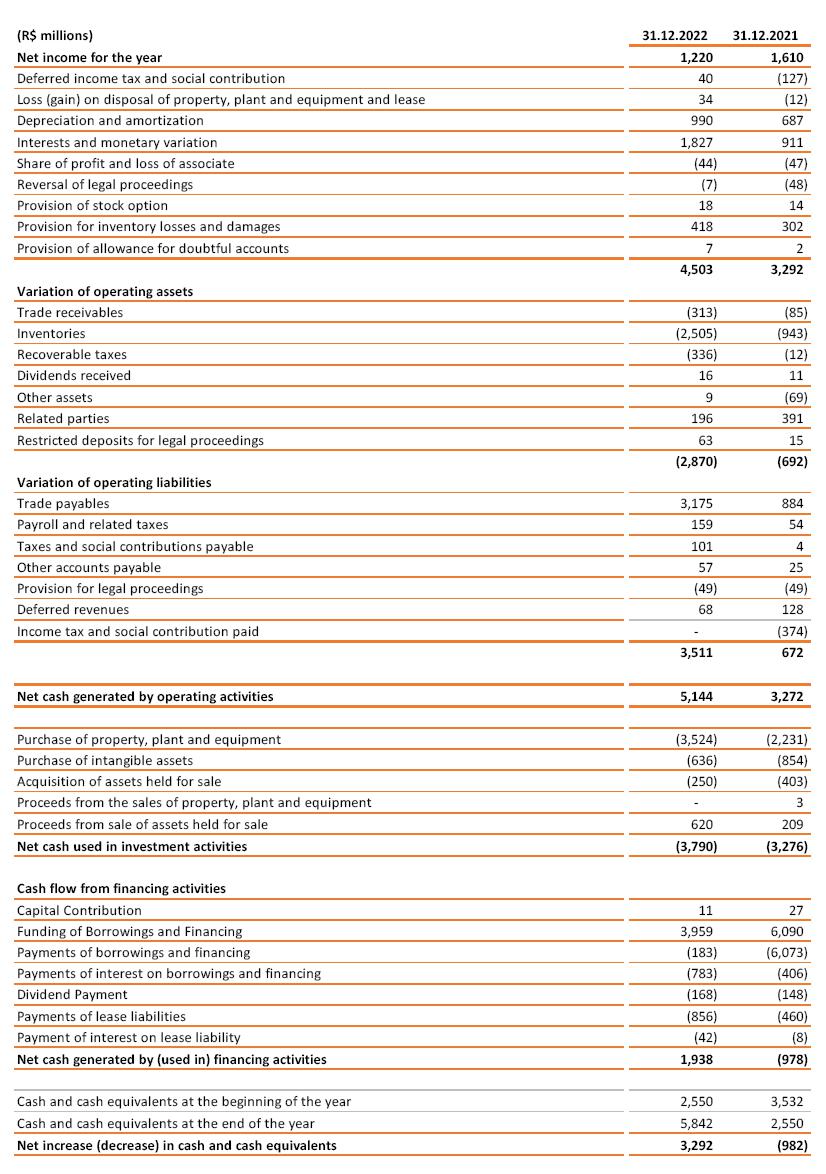
IV - Cash Flow
| 23 |
| Sendas Distribuidora S.A. | |
| Balance Sheet | |
| As of December 31, 2022 | |
| (In millions of Brazilian Reais) |
| Marc 31, 2022 | December 31, 2021 | ||||
| ASSETS | Note | 12/31/2022 | 12/31/2021 | ||
| Current assets | |||||
| Cash and cash equivalents | 6 | 5,842 | 2,550 | ||
| Trade receivables | 7 | 570 | 265 | ||
| Inventories | 8 | 6,467 | 4,380 | ||
| Recoverable taxes | 9 | 1,055 | 876 | ||
| Derivative financial investments | 15.11 | 27 | 4 | ||
| Dividends receivable | - | 16 | |||
| Other accounts receivable | . | . | 52 | 59 | |
| Other current assets | . | . | 71 | 72 | |
| . | . | . | 14,084 | 8,222 | |
| . | . | . | |||
| Assets held for sale | 27 | . | 95 | 550 | |
| . | . | . | |||
| Total current assets | . | 14,179 | 8,772 | ||
| . | |||||
| Non-current assets | . | ||||
| Recoverable taxes | 9 | . | 927 | 770 | |
| Deferred income tax and social contribution | 19.2 | . | 6 | 45 | |
| Derivative financial investments | 15.11 | . | 155 | 28 | |
| Related parties | 10.1 | . | 252 | 114 | |
| Restricted deposits for legal proceedings | 16.6 | . | 56 | 119 | |
| Other non-current assets | . | . | 9 | 10 | |
| . | . | . | 1,405 | 1,086 | |
| . | . | . | |||
| Investments | 11 | 833 | 789 | ||
| Property, plant and equipment | 12.2 | 19,183 | 10,320 | ||
| Intangible assets | 13 | 5,018 | 1,887 | ||
| 25,034 | 12,996 | ||||
| Total non-current assets | 26,439 | 14,082 | |||
| TOTAL ASSETS | 40,618 | 22,854 | |||
The accompanying notes are integral part of these financial statements.
| |||||
| 24 |
| Sendas Distribuidora S.A. | |
| Balance Sheet | |
| As of December 31, 2022 | |
| (In millions of Brazilian Reais) |
| LIABILITIES | Note | 12/31/2022 | 12/31/2021 | ||
| Current liabilities | |||||
| Trade payables, net | 14 | 8,538 | 5,566 | ||
| Trade payables - Agreements | 14 | 2,039 | 573 | ||
| Trade payables - Agreement - Acquisition of Extra stores | 14 | 2,422 | - | ||
| Borrowings and financing | 15.11 | 829 | 433 | ||
| Debentures and promissory notes | 15.11 | 431 | 180 | ||
| Payroll and related taxes | 584 | 425 | |||
| Lease liabilities | 17.2 | 435 | 244 | ||
| Related parties | 10.1 | 201 | 368 | ||
| Taxes payable | 265 | 158 | |||
| Deferred revenues | 18 | 328 | 356 | ||
| Dividends and interest on own equity | 20.2 | 111 | 168 | ||
| Other current liabilities | . | 233 | 173 | ||
| Total current liabilities | 16,416 | 8,644 | |||
| Non-current liabilities | |||||
| Trade payables - Agreement - Acquisition of Extra stores | 14 | 780 | - | ||
| Borrowings and financing | 15.11 | 737 | 1,154 | ||
| Debentures and promissory notes | 15.11 | 10,594 | 6,266 | ||
| Provision for legal proceedings | 16 | ��165 | 205 | ||
| Related parties | 10.1 | 60 | - | ||
| Lease liabilities | 17.2 | 7,925 | 3,807 | ||
| Deferred revenues | 18 | 31 | - | ||
| Other non-current liabilities | . | . | 14 | 12 | |
| Total non-current liabilities | . | 20,306 | 11,444 | ||
| . | |||||
| SHAREHOLDERS´ EQUITY | . | ||||
| Share capital | 20.1 | 1,263 | 788 | ||
| Capital reserves | 36 | 18 | |||
| Earnings reserves | 2,599 | 1,961 | |||
| Other comprehensive income | (2) | (1) | |||
| Total shareholders' equity | 3,896 | 2,766 | |||
| TOTAL LIABILITIES AND SHAREHOLDERS' EQUITY | 40,618 | 22,854 | |||
| The accompanying notes are integral part of these financial statements. | |||||
| 25 |
| Sendas Distribuidora S.A. | |
| Statement of Operations | |
| For the year ended December 31, 2022 | |
| (In millions of Brazilian Reais, unless otherwise stated) |
| Note | 12/31/2022 | 12/31/2021 | |||
| Net operating revenue | 21 | 54,520 | 41,898 | ||
| Cost of sales | 22 | (45,557) | (34,753) | ||
| Gross profit | 8,963 | 7,145 | |||
| Operating expenses, net | |||||
| Selling expenses | 22 | (4,379) | (3,334) | ||
| General and administrative expenses | 22 | (787) | (588) | ||
| Depreciation and amortization | (919) | (638) | |||
| Share of profit of associates | 11 | 44 | 47 | ||
| Other operating expenses, net | 23 | (72) | (53) | ||
| (6,113) | (4,566) | ||||
| Operating profit before financial result and taxes | 2,850 | 2,579 | |||
| Financial revenues | 24 | 394 | 188 | ||
| Financial expenses | 24 | (1,909) | (918) | ||
| Net financial result | (1,515) | (730) | |||
| Income before income taxes | 1,335 | 1,849 | |||
| Income tax and social contribution | 19.1 | (115) | (239) | ||
| Net income for the year | 1,220 | 1,610 | |||
| Basic earnings per millions shares in Brazilian reais | |||||
| (weighted average for the year - R$) | |||||
| Common shares | 25 | 0.905322 | 1.198020 | ||
| Diluted earnings per millions shares in Brazilian reais | |||||
| (weighted average for the year - R$) | |||||
| Common shares | 25 | 0.901589 | 1.188520 | ||
| The accompanying notes are integral part of these financial statements. | |||||
| 26 |
| Sendas Distribuidora S.A. | |
| Statements of Comprehensive Income | |
| For the year ended December 31, 2022 | |
| (In millions of Brazilian Reais) |
| 12/31/2022 | 12/31/2021 | ||||
| Net income for the year | 1,220 | 1,610 | |||
| Items that may be subsequently reclassified into the statement of operations | |||||
| Fair value of receivables | (2) | (1) | |||
| Income tax effect | 1 | - | |||
| Total comprehensive income for the year | 1,219 | 1,609 | |||
| The accompanying notes are integral part of these financial statements. | |||||
| 27 |
| Sendas Distribuidora S.A. | |
| Statements of Changes in Shareholders' Equity | |
| For the year ended December 31, 2022 | |
| (In millions of Brazilian Reais) |
| Earnings reserves | ||||||||||||||||||
| Share capital | Capital reserve | Legal reserve | Expansion reserve | Tax incentive reserve | Profit Reserve | Retained earnings | Other comprehensive income | Total | ||||||||||
| As of January 1, 2021 | 761 | 4 | 152 | - | - | 430 | - | - | 1,347 | |||||||||
| Other comprehensive income | ||||||||||||||||||
| Net income for the year | - | - | - | - | - | - | 1,610 | - | 1,610 | |||||||||
| Fair value of receivables | - | - | - | - | - | - | - | (1) | (1) | |||||||||
| Comprehensive income for the year | - | - | - | - | - | - | 1,610 | (1) | 1,609 | |||||||||
| Capital contribution | 27 | - | - | - | - | - | - | - | 27 | |||||||||
| Stock options granted | - | 14 | - | - | - | - | - | - | 14 | |||||||||
| Interest on own capital | - | - | - | - | - | - | (63) | - | (63) | |||||||||
| Dividends | - | - | - | - | - | - | (168) | - | (168) | |||||||||
| Tax incetive reserve | - | - | - | - | 709 | (430) | (279) | - | - | |||||||||
| Legal reserve | - | - | 5 | - | - | - | (5) | - | - | |||||||||
| Profit reserve | - | - | - | - | - | 1,095 | (1,095) | - | - | |||||||||
| As of December 31, 2021 | 788 | 18 | 157 | - | 709 | 1,095 | - | (1) | 2,766 | |||||||||
| Other comprehensive income | ||||||||||||||||||
| Net income for the year | - | - | - | - | - | - | 1,220 | - | 1,220 | |||||||||
| Fair value of receivables | - | - | - | - | - | - | - | (2) | (2) | |||||||||
| Income tax effect | - | - | - | - | - | - | - | 1 | 1 | |||||||||
| Comprehensive income for the year | - | - | - | - | - | - | 1,220 | (1) | 1,219 | |||||||||
| Capital contribution (note 20.1) | 11 | - | - | - | - | - | - | - | 11 | |||||||||
| Capital contribution - reserve capitalization (note 20.1) | 464 | - | - | - | - | (464) | - | - | - | |||||||||
| Stock options granted | - | 18 | - | - | - | - | - | - | 18 | |||||||||
| Interest on own capital (note 20.2) | - | - | - | - | - | - | (50) | - | (50) | |||||||||
| Dividends (note 20.2) | - | - | - | - | - | - | (68) | - | (68) | |||||||||
| Tax incentive reserve (note 20.5) | - | - | - | - | 753 | - | (753) | - | - | |||||||||
| Expansion reserve (note 20.4) | - | - | - | 632 | - | (632) | - | - | - | |||||||||
| Legal reserve (note 20.3) | - | - | 23 | - | - | - | (23) | - | - | |||||||||
| Profit reserve | - | - | - | - | - | 326 | (326) | - | - | |||||||||
| As of December 31, 2022 | 1,263 | 36 | 180 | 632 | 1,462 | 325 | - | (2) | 3,896 | |||||||||
| The accompanying notes are integral part of these financial statements. | ||||||||||||||||||
| 28 |
| Sendas Distribuidora S.A. | |
| Statements of Cash Flows | |
| For the year ended December 31, 2022 | |
| (In millions of Brazilian Reais) |
| 12/31/2022 | 12/31/2021 | |||
| Cash flow from operating activities | ||||
| Net income for the year | 1,220 | 1,610 | ||
| Adjustment for reconciliation of net income for the year | ||||
| Deferred income tax and social contribution | 40 | (127) | ||
| Loss (gain) of disposal of property, plant and equipment and leasing write-off | 34 | (12) | ||
| Depreciation and amortization | 990 | 687 | ||
| Financial charges | 1,827 | 911 | ||
| Share of profit of associate | (44) | (47) | ||
| Reversal of provision for legal proceedings | (7) | (48) | ||
| Provision for stock option | 18 | 14 | ||
| Provision for allowance for inventory losses and damages | 418 | 302 | ||
| Expected credit loss for doubtful accounts | 7 | 2 | ||
| 4,503 | 3,292 | |||
| Variations in operating assets and liabilities | ||||
| Trade receivables | (313) | (85) | ||
| Inventories | (2,505) | (943) | ||
| Recoverable taxes | (336) | (12) | ||
| Restricted deposits for legal proceedings | 63 | 15 | ||
| Other assets | 9 | (69) | ||
| Trade payables | 3,175 | 884 | ||
| Payroll and related taxes | 159 | 54 | ||
| Related parties | 196 | 391 | ||
| Provision for legal proceedings | (49) | (49) | ||
| Taxes and social contributions payable | 101 | 4 | ||
| Deferred revenue | 68 | 128 | ||
| Dividends received | 16 | 11 | ||
| Other liabilities | 57 | 25 | ||
| Income tax and social contribution, paid | - | (374) | ||
| 641 | (20) | |||
| Net cash generated by operating activities | 5,144 | 3,272 | ||
| Cash flow from investiment activities | ||||
| Purchase of property, plant and equipment | (3,524) | (2,231) | ||
| Purchase of intangible assets | (636) | (854) | ||
| Aquisition of assets held for sale | (250) | (403) | ||
| Proceeds from sale of property, plant and equipment | - | 3 | ||
| Proceeds from sale of assets held for sale | 620 | 209 | ||
| Net cash used in investment activities | (3,790) | (3,276) | ||
| Cash flow from financing activities | ||||
| Capital contribution | 11 | 27 | ||
| Proceeds from borrowings and financing | 3,959 | 6,090 | ||
| Payment of borrowings and financing | (183) | (6,073) | ||
| Payment of interest on borrowings and financing | (783) | (406) | ||
| Dividends and interest on own equity paid | (168) | (148) | ||
| Payment of lease liabilities | (856) | (460) | ||
| Payment of interest on lease liabilities | (42) | (8) | ||
| Net cash generated by (used in) financing activities | 1,938 | (978) | ||
| Net increase (decrease) in cash and cash equivalents | 3,292 | (982) | ||
| Cash and cash equivalents at the beginning of the year | 2,550 | 3,532 | ||
| Cash and cash equivalents at the end of the year | 5,842 | 2,550 | ||
| The accompanying notes are integral part of these financial statements. | ||||
| 29 |
| 1 | CORPORATE INFORMATION | ||||||||||||||||||||||||
| Sendas Distribuidora S.A. (“Company” or “Sendas”) is a publicly held company listed in the Novo Mercado segment of B3 S.A. - Brasil, Bolsa, Balcão (B3), under ticker symbol "ASAI3" and on the New York Stock Exchange (NYSE), under ticker symbol "ASAI". The Company is primarily engaged in the retail and wholesale of food products, bazar items and other products through its chain of stores, operated under “ASSAÍ” brand. The Company's registered office is at Avenida Ayrton Senna, 6.000, Lote 2 - Anexo A, Jacarepaguá, in the Statte of Rio de Janeiro. As of December 31, 2022, the Company operated 263 stores and 12 distribution centers in the five regions of the country, with operations in 23 states and in the Federal District. | |||||||||||||||||||||||||
| The Company is a direct subsidiary of Wilkes Participações S.A. (“Wilkes”) and indirect subsidiary of Casino Guichard Perrachon. | |||||||||||||||||||||||||
| 1.1 | Conversion of Extra Hiper stores into Assaí | ||||||||||||||||||||||||
| On October 14, 2021, the Board of Directors of the Company and of Grupo Pão de Açúcar ("GPA") approved the transaction for the conversion of Extra Hiper stores, operated by GPA, into cash & carry stores, operated by the Company under the ASSAÍ brand (the “Transaction”). | |||||||||||||||||||||||||
| On December 16, 2021, the Company and GPA signed the “Agreement for Onerous Assignment of Exploration Rights of Commercial Points and Other Agreements” (the “Agreement”), governing the transfer to the Company the exploitation rights of up to 70 commercial points located in several federative units of Brazil, 17 properties owned by GPA and 53 properties owned by third parties, currently operated by GPA for a total amount of up to R$3,973, to be paid by the Company, in installments between December 2021 and January 2024, adjusted by CDI + 1.2% per year, which may also involve the acquisition by the Company of some store equipment. | |||||||||||||||||||||||||
| On December 29, 2021, following the completion of the necessary conditions precedent, the Company and GPA signed an agreement for the purchase and sale of 20 commercial rights (6 properties owned by GPA and 14 properties owned by third parties) and property, plant and equipment (lands and buildings) of 6 properties owned by GPA in the total amount of R$1,201, located in the states of Paraná, São Paulo, Rio de Janeiro, Minas Gerais, Bahia, Pernambuco and the Federal District, (see notes 10.1 and 14). At the same date the Company paid the amount of R$1,000 to GPA related to these acquisitions. The 6 properties owned by GPA were classified as held for sale, for an amount of R$403 (see note 27). | |||||||||||||||||||||||||
| On February 25, 2022, GPA and the Company sold the 17 owned properties (11 owned by GPA and 6 properties acquired by the Company) with a total sale price of up to R$1,200, to a real estate fund ("Fund") with the intervention and guarantee of the Company. | |||||||||||||||||||||||||
| On April 13, 2022, the Brazilian antitrust agency (“CADE”) issued a favorable opinion without restrictions on the sale of the 17 properties owned by GPA to the real estate investment fund Barzel Properties ("Fund"). | |||||||||||||||||||||||||
| The closing of the Transaction was subject to the fulfillment of certain conditions, including, but not limited to, obtaining the consent of the property owners from third parties and demobilization of the stores by GPA. This transaction is not subject to the approval by the antitrust authorities. | |||||||||||||||||||||||||
| On August 17, 2022, the Board of Directors of the GPA approved the conclusion of credit assignment agreements with a financial institution, with the company's consent, in anticipation of the installments between 2023 and 2024 due by the Company, see note 14.3. | |||||||||||||||||||||||||
| On December 23, 2022, the Board of Directors of the Company and GPA approved the postponement of the installment that would be paid on December 29, 2022, to GPA in the amount of R$956 to October 23, 2023. This postponement occurred for operational reasons, as the payment schedule of the installment to GPA considered the delivery of stores on certain dates and compliance with certain preconditions, such as obtaining consent from property owners and demobilization of stores by GPA. For this installment, a new credit assignment agreement with a financial institution was entered into by GPA, with the same characteristics as the previously entered into agreement and with the Company's consent, see note 14.3. | |||||||||||||||||||||||||
| On December 26, 2022, the Board of Directors of the Company and GPA confirmed that 4 properties were not the subject of the Transaction, so in the conclusion the company received the assignment of the 66 properties, with adjustment in the purchase price from R$3,973 to R$3,928. | |||||||||||||||||||||||||
| As of December 31, 2022, the Company and GPA completed the transfer of 46 commercial points in the amount of R$3,130 (20 commercial points as of December 31, 2021 in the amount of R$798) totaling 66 properties, including the 17 properties owned by GPA in the amount of R$1,200, located in the Southeast, North, Northeast and Midwest regions and in the Federal District, which had fulfilled the previous conditions, see notes 10, 13 and 14. The Company made the total payment of R$1,850 (R$850 as of March 31, 2022 and R$1,000 as of December 31, 2021) to GPA related to these acquisitions. Of the 17 properties owned by GPA that were recorded under “Assets held for sale”, 16 properties were sold to the Fund. The remaining balance related to 1 property is R$95 (R$403 as of December 31, 2021), see note 27. | |||||||||||||||||||||||||
| The Company incurred expenses with legal fees, appraisal reports and due diligence, related to the operation, and these expenses were recorded in "Other operating income and expenses, net" in the statement of operations, see note 23. | |||||||||||||||||||||||||
| 30 |
| 1.2 | Sale and Leaseback | |||||||||||||||||||||||
| On July 19, 2021, the Company entered into the “Private Instrument of Commitment of Real Estate Investment, Commitment of Purchase and Sale of Real Estate and Incorporation of Real Right of Surface, Under Suspensive Conditions and Other Covenants” with an investment fund administered by BRL Trust Distribuidora de Títulos e Valores Mobiliários S.A. and managed by TRX Gestora de Recursos Ltda. The purpose of the Instrument is the sale, development and lease of 5 properties of the Company located in the States of São Paulo, Rio de Janeiro and Rondônia. | ||||||||||||||||||||||||
| The transaction covers the sale of five properties, over which shall be carried out construction and real estate development project. The total sale amount to be received by the Company is R$364, thus, so the sale amount and cost amount of the construction of the properties will be base for defining the final amount of the properties' monthly rents. The assets transferred to "assets held for sale" was in amount of R$17 as of December 31,2022 (R$349 as of December 31, 2021), see note 12.2. | ||||||||||||||||||||||||
| The Company concluded the sale of three of these properties during 2021 in the amount of R$209. In December, 2022, was concluded the sale of the remaining properties in the amount of R$165, see note 27. | ||||||||||||||||||||||||
| 1.3 | Going concern analysis | |||||||||||||||||||||||
| The management has assessed the Company’s ability to continue operating in a foreseeable future and concluded that Company has ability to maintain its operations and systems working regularly. Therefore, the management is not aware of any material uncertainty that could indicates significant doubts about its ability to continue operating. The financial statements has been prepared based on the assumption of business continuity. | ||||||||||||||||||||||||
| 2 | BASIS OF PREPARATION AND DISCLOSURE OF THE FINANCIAL STATEMENTS | |||||||||||||||||||||||
| The financial statements have been prepared in accordance with International Financial Reporting Standards (“IFRS”) as issued by the International Accounting Standard Board (“IASB”) and accounting practices adopted in Brazil law 6,404/76 and accounting pronouncements issued by Comitê de Pronunciamentos Contábeis (“CPC”) and approved by the Brazilian Securities and Exchange Commission (“CVM”). | ||||||||||||||||||||||||
| The financial statements have been prepared on the historical cost basis, except for (i) certain financial instruments; and (ii) assets and liabilities arising from business combinations measured at their fair values, where applicable. All significant information related to the financial statements, is being disclosed and is consistent with the information used by Management in managing the Company's activities. | ||||||||||||||||||||||||
| The financial statements are presented in millions of Brazilian Reais (R$), which is the Company's functional currency. | ||||||||||||||||||||||||
| The financial statements for the year ended December 31, 2022, were approved by the Board of Directors on February 15, 2023. | ||||||||||||||||||||||||
| 3 | SIGNIFICANT ACCOUNTING POLICIES | |||||||||||||||||||||||
| The main accounting policies and practices are described in each corresponding explanatory note, except for those below that are related to more than one explanatory note. Accounting policies and practices have been consistently applied to the years presented. | ||||||||||||||||||||||||
| 3.1 | Foreign currency transactions | |||||||||||||||||||||||
| Assets and liabilities denominated in foreign currencies are translated into Brazilian Reais, using the spot exchange rate at the end of each reporting period. Gains or losses on changes in exchange rate variations are recognized as financial revenues or expense. | ||||||||||||||||||||||||
| 3.2 | Classification of assets and liabilities as current and non-current | |||||||||||||||||||||||
| Assets (with the exception of deferred income tax and social contribution) that are expected to be realized or that are intended to be sold or consumed within twelve months, as of the financial position dates, are classified as current assets. Liabilities (with the exception of deferred income tax and social contribution) expected to be settled within twelve months from the financial position dates are classified as current. All other assets and liabilities (including deferred tax taxes) are classified as "non-current". | ||||||||||||||||||||||||
| Long-term assets and liabilities are not adjusted to present value at initial recognition as their effects are immaterial. | ||||||||||||||||||||||||
| Deferred tax assets and liabilities are classified as “non-current”, net by legal entity, as provided for in accounting pronouncement CPC 32 / IAS 12 - Income Taxes. | ||||||||||||||||||||||||
| 31 |
| 3.3 | Joint Venture | |||||||||||||||||||||||
| A joint venture is a joint arrangement whereby the parties that have joint control of the arrangement have rights to the assets of the arrangement and have obligations for the liabilities related to the business. Those parties are called joint venturers. Joint control is the contractually agreed sharing of business control, which exists only when decisions about the relevant activities require the unanimous consent of the parties who share control. | ||||||||||||||||||||||||
| Jointly-controlled subsidiarie is accounted in the equity method, see note 11. | ||||||||||||||||||||||||
| 3.4 | Investment grants | |||||||||||||||||||||||
| Investment grants are recognized when there is reasonable assurance that the entity will comply with all conditions established and related to the grant and that the grant will be received. When the benefit relates to an expense item, it is recognized as revenue over the period of the benefit systematically in relation to the respective expenses for whose benefit it is intended to offset. When the benefit relates to an asset, it is recognized as deferred revenue in liabilities and on a systematic and rational basis over the useful life of the asset. | ||||||||||||||||||||||||
| 3.5 | Dividends | |||||||||||||||||||||||
| The distribution of dividends to the Company's shareholders is recognized as a liability at the end of the year, based on the minimum mandatory dividends defined in the bylaws. Any amounts exceeding this minimum are recorded only on the date on which such additional dividends are approved by the Company's shareholders, see note 20.2. | ||||||||||||||||||||||||
| 3.6 | Cash flow, interest payments | |||||||||||||||||||||||
| The interest payments on borrowing and finance and lease settled by the Company are being disclosed in the financing activities in conjunction with payments on related borrowing and finance and lease, in accordance with CPC 03 (R2) / IAS7 – Statement of Cash Flows. | ||||||||||||||||||||||||
| 3.7 | Statement of value added | |||||||||||||||||||||||
| The statement of value added intend to evidence the wealth created by the Company and its distribution in a given year and is presented as required by Brazilian Corporation Law as part of its financial statements, as it is neither mandatory nor established by IFRS. | ||||||||||||||||||||||||
| This statement was prepared based on information obtained from accounting records which provide the basis for the preparation of the financial statements, additional records, and in accordance with technical pronouncement CPC 09 – Statement of Value Added, The first part presents the wealth created by the Company, represented by revenue (gross sale revenue, including taxes, other revenue and the effects of the allowance for doubtful accounts), inputs acquired from third parties (cost of sales and acquisition of materials, energy and outsourced services, including taxes at the time of acquisition, the effects of losses and the recovery of assets, and depreciation and amortization) and value added received from third parties (equity in the earnings of subsidiaries, financial revenues and other revenues). The second part of the statement presents the distribution of wealth among personnel, taxes, fees and contributions; and value distributed to third party creditors and shareholders. | ||||||||||||||||||||||||
| 4 | ADOPTION OF NEW PROCEDURES, AMENDMENTS TO AND INTERPRETATIONS OF EXISTING STANDARDS ISSUED BY THE IASB AND CPC AND PUBLISHED STANDARDS EFFECTIVE FROM 2022 | |||||||||||||||||||||||
| 4.1 | Amendments to IFRSs and new interpretations of mandatory application starting at the current year | |||||||||||||||||||||||
| In 2022, the Company evaluated the amendments and new interpretations to the CPCs and IFRSs issued by the CPC and IASB, respectively, which are effective for accounting periods beginning on or after January 1, 2022. The main changes are: | ||||||||||||||||||||||||
| Statement | Description | |||||||||||||||||||||||
| Changes to CPC 27 / IAS 16: Property - Resources Before Intended Use | The amendments prohibit deducting from the cost of an item of property, plant and equipment any proceeds from the sale of items produced before the asset is available for use, i.e., funds to bring the asset to the location and condition necessary for it to be capable of operating. in the manner intended by the management. Consequently, the entity recognizes these proceeds from the sale and related costs in the stagment of operations. | |||||||||||||||||||||||
| Improvements to CPC 48 / IFRS 9: Financial Instruments | The amendments clarify the rates that an entity includes when assessing whether the terms of a new or modified financial liability are materially different from the terms of the original financial liability. These fees include only fees paid or received between the borrower and the lender, including fees paid or received by the borrower or the lender on behalf of the other. | |||||||||||||||||||||||
| Improvements to CPC 06 (R2) / IFRS 16: Leasing | The amendments exclude the concept of reimbursement for improvements in third-party properties. | |||||||||||||||||||||||
| The adoption of these standards did not result in a material impact on the Company's financial statements. | ||||||||||||||||||||||||
| 32 |
| 4.2 | New standards, amendments and interpretations issued but not yet effective | |||||||||||||||||||||||
| The Company evaluated all new and revised CPCs and IFRSs, already issued and not yet effective, however did not adopt them in advance, the main are: | ||||||||||||||||||||||||
| Accounting pronouncement | Description | Effective for annual periods beginning on or after | ||||||||||||||||||||||
| Amendments to CPC 26 (R1) and IAS 1: - Classification of liabilities as current and non-current - Disclosure of accounting policies | Specify the requirements for classifying the liability as current or non-current. The amendments clarify: which means a right to postpone liquidation; that the right to postpone must exist on the base date of the report; that this classification is not affected by the likelihood that an entity will exercise its right to postpone; and that only if a derivative embedded in a convertible liability is itself an equity instrument would the terms of a liability not affect its classification. - The amendments are to help entities disclose accounting policies that are more useful by replacing the requirement for disclosure of significant accounting policies for material accounting policies. | 1/1/2023 | ||||||||||||||||||||||
| Amendments to CPC 23 (R1) and IAS 8: Definition of accounting estimates | Introduce the definition of 'accounting estimate'. The amendments clarify the distinction between changes in accounting estimates and changes in accounting policies and correction of errors. In addition, they clarify how entities use measurement and input techniques to develop accounting estimates. | 1/1/2023 | ||||||||||||||||||||||
| It is not expected that the adoption of these changes have a significant impact on the financial statements. | ||||||||||||||||||||||||
| 5 | SIGNIFICANT ACCOUNTING JUDGMENTS, ESTIMATES, AND ASSUMPTIONS | |||||||||||||||||||||||
| The preparation of the financial statements requires Management to makes judgments and estimates and adopt assumptions that affect the reported amounts of revenues, expenses, assets and liabilities, and the disclosure of contingent liabilities at the end of the reporting period, however, the uncertainties about these assumptions and estimates may generate results that require substantial adjustments to the carrying amount of the asset or liability in future periods. | ||||||||||||||||||||||||
| In the process of applying the Company’s accounting policies, Management has made the following judgments, which have the most significant impact on the amounts recognized in the financial statements, as disclosed in the following notes to these financial statements: | ||||||||||||||||||||||||
| • Impairment: notes 7.3,12.1,13.1 and 13.2. | ||||||||||||||||||||||||
| • Inventories: inventory allowance, note 8. | ||||||||||||||||||||||||
| • Recoverable taxes: Expected realization of tax credits, note 9. | ||||||||||||||||||||||||
| • Fair value of derivatives and other financial instruments: Measurement of fair value of derivatives, note 15.10. | ||||||||||||||||||||||||
| • Provision for legal proceedings: Record of provision for claims with likelihood assessed as probable loss, estimated with a certain degree of reasonability, note 16. | ||||||||||||||||||||||||
| • Leasing operations: determination of the lease term, and incremental interest rate, note 17. | ||||||||||||||||||||||||
| • Income tax: Provisions based on reasonable estimates, note 19. | ||||||||||||||||||||||||
| • Share-based payments: Estimate of fair value of operations based on a valuation model, note 20.6. | ||||||||||||||||||||||||
| 6 | CASH AND CASH EQUIVALENTS | |||||||||||||||||||||||
| Cash and equivalents comprise the bank accounts, short-term, highly liquid investments, immediately convertible into known cash amounts, and subject to an insignificant risk of change in value, with intention and possibility to be redeemed in the short term, within 90 days, as of the date of investment, without losing income. | ||||||||||||||||||||||||
| 12/31/2022 | 12/31/2021 | |||||||||||||||||||||||
| Cash and bank accounts | 213 | 74 | ||||||||||||||||||||||
| Cash and bank accounts - Abroad (i) | 24 | 25 | ||||||||||||||||||||||
| Financial investments (ii) | 5,605 | 2,451 | ||||||||||||||||||||||
| 5,842 | 2,550 | |||||||||||||||||||||||
| (i) As of December 31, 2022, the Company had funds held abroad, of which R$24 in US dollars (R$25 in US dollars as of December 31, 2021). | ||||||||||||||||||||||||
| (ii) As of December 31, 2022, the financial investments refer to the repurchase and resale agreements and Bank Deposit Certificates - CDB, with a weighted average interest rate of 92.80% of the CDI - Interbank Deposit Certificate (109.64% of the CDI as of December 31, 2021). | ||||||||||||||||||||||||
| 7 | TRADE RECEIVABLES | |||||||||||||||||||||||
| Trade receivables are initially recorded at the transaction amount, which corresponds to the sale value, and are subsequently measured according to the portfolio: (i) fair value through other comprehensive income, in the case of receivables from credit card companies and (ii) amortized cost, for other customer portfolio. | ||||||||||||||||||||||||
| 33 |
| Note | 12/31/2022 | 12/31/2021 | ||||||||||||||||||||||
| From sales with: | ||||||||||||||||||||||||
| Credit card operators | 7.1 | 241 | 75 | |||||||||||||||||||||
| Credit card operators with related parties | 10.1 | 49 | 24 | |||||||||||||||||||||
| Sales ticket and payment slips | 7.2 | 249 | 118 | |||||||||||||||||||||
| Trade receivables with related parties | 10.1 | 24 | 31 | |||||||||||||||||||||
| Trade receivables with suppliers/payment slips | 18 | 23 | ||||||||||||||||||||||
| 581 | 271 | |||||||||||||||||||||||
| Provision for expected credit losses | 7.3 | (11) | (6) | |||||||||||||||||||||
| 570 | 265 | |||||||||||||||||||||||
| The breakdown of trade receivables by their gross amount by maturity period is presented below: | ||||||||||||||||||||||||
| Overdue | ||||||||||||||||||||||||
| Total | Due | Less than 30 days | > 90 days | |||||||||||||||||||||
| 12/31/2022 | 581 | 576 | 4 | 1 | ||||||||||||||||||||
| 12/31/2021 | 271 | 269 | 1 | 1 | ||||||||||||||||||||
| 7.1 | Credit card operators | |||||||||||||||||||||||
| The Company, through a cash management strategy, advances receivables from credit card operators, without any right of recourse or related obligation and derecognizes the balance of trade receivables. | ||||||||||||||||||||||||
| 7.2 | Sales ticket and payment slips | |||||||||||||||||||||||
| Refers to amounts derived from transactions through receipts: (i) tickets and meal vouchers R$134 (R$56 as of December 31, 2021); and (ii) payment slips R$115 (R$62 as of December 31, 2021). | ||||||||||||||||||||||||
| 7.3 | Provision for expected credit losses | |||||||||||||||||||||||
| All portfolios consider estimated losses, which are recorded based on quantitative and qualitative analysis, the track record of effective losses in the last 24 months, the credit assessment, and considering information on assumptions and projections relating to macroeconomic events, such as unemployment index and consumer confidence index, as well as the volume of credits overdue of trade receivable portfolio. The Company opted for measuring provisions for trade receivable losses by an amount equal to the expected credit loss for the entire life, by adopting a matrix of losses for each level of maturity. | ||||||||||||||||||||||||
| The provision for expected losses from trade receivables measured at amortized cost is stated as a reducer of its accounting balance. | ||||||||||||||||||||||||
| 12/31/2022 | 12/31/2021 | |||||||||||||||||||||||
| At the beginning of the year | (6) | (4) | ||||||||||||||||||||||
| Additions | (36) | (15) | ||||||||||||||||||||||
| Reversals | 31 | 13 | ||||||||||||||||||||||
| At the end of the year | (11) | (6) | ||||||||||||||||||||||
| 8 | INVENTORIES | |||||||||||||||||||||||
| Inventories are accounted for at cost or net realizable value, whichever is the lowest. Inventories acquired are recorded by average cost, including the storage and handling costs, to the extent these costs are necessary to bring inventories to their sale condition at stores, less bonuses received from suppliers. | ||||||||||||||||||||||||
| Net realizable value is the selling price in the ordinary course of business, less the estimated costs necessary to make the sale, such as (i) taxes levied on sales; (ii) personnel expenses directly linked to sales; (iii) cost of sales; and (iv) other costs required to make goods available for sale. | ||||||||||||||||||||||||
| Note | 12/31/2022 | 12/31/2021 | ||||||||||||||||||||||
| Stores | 5,914 | 3,955 | ||||||||||||||||||||||
| Distribution centers | 1,139 | 878 | ||||||||||||||||||||||
| Commercial agreements | 8.1 | (518) | (416) | |||||||||||||||||||||
| Allowance for loss on inventory obsolescence and damages | 8.2 | (68) | (37) | |||||||||||||||||||||
| 6,467 | 4,380 | |||||||||||||||||||||||
| 8.1 | Commercial agreements | |||||||||||||||||||||||
| As of December 31, 2022, the amount of unrealized commercial agreements, presented as a reduction of inventory balance, totaled R$518 (R$416 as of December 31, 2021). | ||||||||||||||||||||||||
| 8.2 | Allowance for loss on inventory obsolescence and damages | |||||||||||||||||||||||
| Inventories are reduced to their recoverable value through estimated losses, breakage, scrapping, slow goods turnover, and estimated losses for goods to be sold with negative gross margin, which is regularly analyzed and assessed as to their adequacy. | ||||||||||||||||||||||||
| 12/31/2022 | 12/31/2021 | |||||||||||||||||||||||
| At the beginning of the year | (37) | (51) | ||||||||||||||||||||||
| Additions | (435) | (315) | ||||||||||||||||||||||
| Reversals | 17 | 13 | ||||||||||||||||||||||
| Write-offs | 387 | 316 | ||||||||||||||||||||||
| At the end of the year | (68) | (37) | ||||||||||||||||||||||
| 34 |
| 9 | RECOVERABLE TAXES | |||||||||||||||||||||||
| The Company records tax credit incurred in the operation and when obtains internal and external factors as legal and market interpretations to conclude that it is entitled to these credits, including realization of the tax credit ICMS (Imposto Sobre Circulação de Mercadorias e Serviços) (State VAT) is recognized in cost of sale in the statement of operations. PIS (Programa de Integração Social) and COFINS (Contribuição para o Financiamento da Seguridade Social) (federal taxes on gross revenues) is recognized as a credit in the same account on which the credits are calculated. | ||||||||||||||||||||||||
| During 2022, the Company recorded monetary correction credits in the amount of R$109, resulting from the existence of a judicial discussion regarding the Reimbursement of ICMS-ST. | ||||||||||||||||||||||||
| The future realization of these taxes is based on a feasibility study, on the expectation of future growth and the expected offset against tax debts from its operations. | ||||||||||||||||||||||||
| Note | 12/31/2022 | 12/31/2021 | ||||||||||||||||||||||
| State VAT tax credits - ICMS | 9.1 | 1,210 | 1,153 | |||||||||||||||||||||
| Social Integration Program and Contribution for Social Security Financing - PIS/COFINS | 9.2 | 587 | 370 | |||||||||||||||||||||
| Social Security Contribution - INSS | 90 | 54 | ||||||||||||||||||||||
| Income tax and social contribution | 74 | 61 | ||||||||||||||||||||||
| Others | 21 | 8 | ||||||||||||||||||||||
| Total | 1,982 | 1,646 | ||||||||||||||||||||||
| Current | 1,055 | 876 | ||||||||||||||||||||||
| Non-current | 927 | 770 | ||||||||||||||||||||||
| 9.1 | State VAT tax credits - ICMS | |||||||||||||||||||||||
| Since 2008, the Brazilian States have been substantially amending their local laws aiming at implementing and broadening the ICMS tax replacement system. This system entails the prepayment of ICMS of the whole commercial chain, upon goods outflow from an industrial establishment or importer or their inflow into each State. The expansion of this system to an increasingly wider range of products sold in the retail generates the prepayment of the tax and consequently a refund in certain operations. | ||||||||||||||||||||||||
| The refund process requires evidence through tax documents and digital files of the transactions carried out that generated the right to refund for the Company. Only after its ratification by state tax authorities and/or the compliance with specific ancillary obligations aiming to support such evidence that credits can be used by the Company, which occur in periods after their generation. | ||||||||||||||||||||||||
| As the number of items sold in the retail subject to tax replacement has increased continuously, the tax credit to be refunded by the Company has also increased. The Company has realized these credits with authorization for immediate offset in view of its operation, by obtaining a special regime and also by means of other procedures regulated by state rules. | ||||||||||||||||||||||||
| With respect to credits that cannot yet be immediately offset, the Company's management, according to a technical recovery study, based on the future expectation of growth and consequent offset against taxes payable from its operations, believes that its future offset is viable. The mentioned studies are prepared and periodically reviewed based on information obtained from the strategic planning previously approved by the Company's Board of Directors. For the financial statements as of December 31, 2022, the Company's management has monitoring controls over the adherence to the annually established plan, reassessing and including new elements that contribute to the realization of the recoverable ICMS balance, as shown in the table below: | ||||||||||||||||||||||||
| Year | Amount | |||||||||||||||||||||||
| Within 1 year | 543 | |||||||||||||||||||||||
| From 1 to 2 years | 298 | |||||||||||||||||||||||
| From 2 to 3 years | 93 | |||||||||||||||||||||||
| From 3 to 4 years | 77 | |||||||||||||||||||||||
| From 4 to 5 years | 61 | |||||||||||||||||||||||
| More than 5 years | 138 | |||||||||||||||||||||||
| Total | 1,210 | |||||||||||||||||||||||
| 9.2 | PIS and COFINS credit | |||||||||||||||||||||||
| On March 15, 2017, the Federal Supreme Court (“STF”) recognized, the unconstitutionality of the inclusion of ICMS in the PIS and COFINS calculation base. On May 13, 2021, the STF judged the Declaration Embargoes in relation to the amount to be excluded from the calculation basis of the contributions, which should only be the ICMS paid, or if the entire ICMS, as shown in the respective invoices. The STF rendered a favorable decision to the taxpayers, concluding that all ICMS highlighted should be excluded from the calculation basis. | ||||||||||||||||||||||||
| The STF decided to modulate the effects of the decision, providing that taxpayers who distributed lawsuits before March 15, 2017 or who had administrative proceedings in progress before that same date, would be have right to take advantage of the past period. As the decision was rendered in a process with recognized general repercussions, the understanding reached is binding on all judges and courts. The Company filed a lawsuit on October 31, 2013, having obtained a favorable decision and a final and unappealable decision on July 16, 2021, thus allowing the recognition of the credit for the period covered by the lawsuit. | ||||||||||||||||||||||||
| Currently the Company, with the favorable judgment of the Supreme Court, has recognized the exclusion of ICMS from the PIS and COFINS calculation basis, based on the same assumptions above. | ||||||||||||||||||||||||
| 35 |
| • Expected realization of PIS and COFINS credits | ||||||||||||||||||||||||
| In related to the recoverable PIS and COFINS credits, the Company's management, based on a technical recovery study, considering future growth expectations and consequent offset against debts from its operations, projects its future realization. The mentioned studies are prepared and periodically reviewed based on information obtained from the strategic planning previously approved by the Company's Board of Directors. For the financial statements as of December 31, 2022, the Company's management has monitoring controls over the adherence to the annually established plan, reassessing and including new elements that contribute to the realization of the recoverable PIS and COFINS balance, as shown in the table below: | ||||||||||||||||||||||||
| Year | Amount | |||||||||||||||||||||||
| Within 1 year | 366 | |||||||||||||||||||||||
| From 1 to 2 years | 221 | |||||||||||||||||||||||
| Total | 587 | |||||||||||||||||||||||
| 36 |
| 10 | RELATED PARTIES | |||||||||||||||||||||||||
| 10.1 | Balances and related party transactions | |||||||||||||||||||||||||
| Assets | Liabilities | Transactions | ||||||||||||||||||||||||
| Clients | Other assets | Suppliers | Other liabilities | Revenue (expenses) | ||||||||||||||||||||||
| 12/31/2022 | 12/31/2021 | 12/31/2022 | 12/31/2021 | 12/31/2022 | 12/31/2021 | 12/31/2022 | 12/31/2021 | 12/31/2022 | 12/31/2021 | |||||||||||||||||
| Controlling shareholders | ||||||||||||||||||||||||||
| Wilkes Participações S.A. (i) | - | - | - | - | - | - | 2 | 2 | (8) | (6) | ||||||||||||||||
| Euris (ii) | - | - | - | - | - | - | 1 | 1 | (3) | (1) | ||||||||||||||||
| Casino Guichard Perrachon (iii) | - | 13 | - | - | - | - | 21 | - | (60) | (35) | ||||||||||||||||
| - | 13 | - | - | - | - | 24 | 3 | (71) | (42) | |||||||||||||||||
| Other related parties | ||||||||||||||||||||||||||
| GPA (iv) | 24 | 18 | 234 | 100 | 8 | 8 | 237 | 365 | (310) | (137) | ||||||||||||||||
| Compre Bem | - | - | - | - | - | - | - | - | - | (1) | ||||||||||||||||
| Greenyellow (v) | - | - | - | - | - | - | - | - | (33) | (26) | ||||||||||||||||
| Joint venture | ||||||||||||||||||||||||||
| Financeira Itaú CBD S.A. Crédito, Financiamento e Investimento (“FIC”) (vi) | 49 | 24 | 18 | 14 | 25 | 14 | - | - | 25 | 15 | ||||||||||||||||
| 73 | 42 | 252 | 114 | 33 | 22 | 237 | 365 | (318) | (149) | |||||||||||||||||
| Total | 73 | 55 | 252 | 114 | 33 | 22 | 261 | 368 | (389) | (191) | ||||||||||||||||
| Current | 73 | 55 | - | - | 33 | 22 | 201 | 368 | ||||||||||||||||||
| Non-current | - | - | 252 | 114 | - | - | 60 | - | ||||||||||||||||||
| 37 |
| The related-party transactions are represented by operations carried out according to prices, terms and conditions agreed upon the parties and are measured substantially at market value, namely: | |||||||||||||||||||||||||
| (i) Wilkes Participações S.A.: reimbursement of personnel expenses, equipment rental and maintenance. | |||||||||||||||||||||||||
| (ii) Euris: reimbursement of expenses according to cost sharing contracts (expenses with personnel, expatriates, maintenance, marketing and rent). | |||||||||||||||||||||||||
| (iii) Casino: (a) Agency agreement: entered into between GPA, the Company and Groupe Casino Limited on July 25, 2016, as amended, to regulate the rendering of global sourcing services (global suppliers prospecting and purchasing intermediation) by Casino and reimbursed by Groupe Casino Limited to the Company to recover the reduced gain margins due to Company´s promotions at its stores; (b) Agency agreement: entered into between GPA, the Company and Casino International S.A. on December 20, 2004, as amended, for the Company´s representation in the business negotiation of products to be acquired by the Company with international suppliers; (c) Cost sharing: entered into between Casino Guichard Perrachon S.A, Euris, Helicco, Wilkes, GPA, Casino Service and the Company, on August 1, 2014, as amended, to reimburse costs incurred by Casino Group companies in activities of its personnel involving the transfer of know-how; and (d) Cyber risk agreement: entered on February 1, 2022 to provide insurance services against cyber risks. | |||||||||||||||||||||||||
| (iv) GPA: (a) Separation agreement: entered into between the Company and GPA on December 14, 2020, in which the companies undertake to indemnify each other for events that may arise as a result of the corporate reorganization; (b) contract for assignment of rights to exploit commercial points: entered into between the Company and GPA on December 16, 2021, for the acquisition of commercial rights; (c) Non-residential lease agreements: entered on January 31, 2022, due to the acquisition of the Extra Hiper stores; (d) Purchase and sale of real estate: entered into between GPA and Barzel Retail Fundo de Investimento Imobiliário, on February 23, 2022, for the sale of up to 17 properties owned by GPA to the real estate fund, with the intervention of the Company; and (e) Advertising agreement: entered into between GPA, Editora Globo and the Company, on February 14, 2022, to provide advertising services by Editora Globo by providing Multicash Cards for the acquisition of various goods in the establishments of the advertisers (Company and GPA). | |||||||||||||||||||||||||
| As of December 31, 2022, the amount recorded in other assets is substantially composed by R$150 referring to the balance receivable from the sale of 16 Extra Hiper stores and R$82 referring to the indemnification process signed in the separation agreement between the companies that occurred on December 14, 2020. The amount recorded in other liabilities is substantially composed by R$187 referring to the indemnification process and refunds signed in the separation agreement between the parties. | |||||||||||||||||||||||||
| (v) Greenyellow: agreement with the Company to set the rules for the lease and maintenance of photovoltaic system equipment by Greenyellow at Assaí stores and contracts with the Company for the purchase of energy sold on the free market. | |||||||||||||||||||||||||
| (vi) FIC: execution of business agreements to regulate the rules that promote and sell financial services offered by FIC at the Company's stores to implement the financial partnership between the Company and Itaú Unibanco Holding SA (“Itaú”) in the partnership agreement, namely: (a) banking correspondent services in Brazil; (b) indemnity agreement in which FIC undertook to keep the Company harmless from losses incurred as a result of the services; and the FIC and the Company have agreed, among themselves, to indemnify each other for contingencies of their responsibilities; and (c) agreement to provide by the Company to FIC, and vice versa, of information and access to systems for the provision of services. | |||||||||||||||||||||||||
| 10.2 | Management compensation | ||||||||||||||||||||||||
| Expenses referring to the executive board compensation recorded in the Company’s statement of operations in the periods as follows (amounts expressed in thousands reais): | |||||||||||||||||||||||||
| Base salary | Variable compensation | Stock option plan | Total | ||||||||||||||||||||||
| 2022 | 2021 | 2022 | 2021 | 2022 | 2021 | 2022 | 2021 | ||||||||||||||||||
| Board of director | 31,971 | 25,533 | - | - | 7,103 | 7,111 | 39,074 | 32,644 | |||||||||||||||||
| Directors and Executive officers | 56,241 | 20,241 | 26,310 | 14,485 | 19,785 | 7,632 | 102,337 | 42,358 | |||||||||||||||||
| Fiscal council | 584 | 331 | - | - | - | - | 584 | 331 | |||||||||||||||||
| 88,796 | 46,105 | 26,310 | 14,485 | 26,888 | 14,743 | 141,995 | 75,333 | ||||||||||||||||||
| The stock option plan, fully in shares, refers to the Company's and this plan has been trated in the Company's statement of operations. The corresponding expenses are allocated to the Company and recorded in statement of operations against capital reserve - stock options in shareholders' equity. There are no other short-term or long-term benefits granted to members of the Company's management. | |||||||||||||||||||||||||
| 38 |
| 11 | INVESTMENTS | ||||||||||||||||||||||||
| The details of the Company's investments at the end of the year are as follow: | |||||||||||||||||||||||||
| Participation in investments - % | |||||||||||||||||||||||||
| Direct participation | |||||||||||||||||||||||||
| Investment type | Company | Country | 12/31/2022 | 12/31/2021 | |||||||||||||||||||||
| Joint venture | Bellamar Empreendimento e Participações S.A. | Brazil | 50.00 | 50.00 | |||||||||||||||||||||
| Summary of financial information of Joint Venture | |||||||||||||||||||||||||
| 12/31/2022 | 12/31/2021 | ||||||||||||||||||||||||
| Current assets | 1 | 33 | |||||||||||||||||||||||
| Non-current assets | 519 | 433 | |||||||||||||||||||||||
| Current liabilities | - | 33 | |||||||||||||||||||||||
| Shareholders´ equity | 520 | 433 | |||||||||||||||||||||||
| Net income for the year | 86 | 95 | |||||||||||||||||||||||
| Investments composition and breakdown | |||||||||||||||||||||||||
| Bellamar | |||||||||||||||||||||||||
| As of December 31, 2020 | 769 | ||||||||||||||||||||||||
| Share of profit of associates | 47 | ||||||||||||||||||||||||
| Dividends received | (11) | ||||||||||||||||||||||||
| Dividends receivable | (16) | ||||||||||||||||||||||||
| As of December 31, 2021 | 789 | ||||||||||||||||||||||||
| As of December 31, 2021 | 789 | ||||||||||||||||||||||||
| Share of profit of associates | 44 | ||||||||||||||||||||||||
| As of December 31, 2022 | 833 | ||||||||||||||||||||||||
| 11.1 | Join venture | ||||||||||||||||||||||||
| Bellamar is a company that owns 35.76% of the share capital of FIC (Financeiro do Banco Itaú). With this operation, the Company indirectly holds a 17.88% stake in FIC. The purpose of FIC is to carry out all operations permitted, in the legal and regulated provisions, to credit, financing and investment companies, the issuance and management of credit cards, own or third-party, as well as the performance and performance of functions of correspondents in the country. FIC's operations are conducted by Itaú Unibanco Holding S.A. | |||||||||||||||||||||||||
| The investment is recognized as a joint venture and is recorded through the equity method, in accordance with account standard CPC 18 (R2) / IAS 28 – Investments in associates and joint ventures. Based on equity method, the investment in a joint venture should be recognized by the cost, on the beginning. The account value of investment is adjusted for variation recognition purposes related to Company’s participation on shareholders’ equity of joint venture after the acquisition date. | |||||||||||||||||||||||||
| The joint venture’s financial statements is prepared on the same period basis of disclosure that the Company. | |||||||||||||||||||||||||
| After the method equity is applied, the Company determines if it is necessary recognize additional loss of recuperable value over investments related to the joint venture. The Company will determine, on each annual closing date of balance sheet, if exists objective evidence that means the investment on joint venture suffered loss due to the reduction of recuperable value. In case of such loss is identified, the Company calculates the value of loss due to the reduction of recuperable value as a difference between the joint venture’s recuperable value and the carrying amount and recognizes the loss on its statement of operations. As of December 31, 2022, the Company performed the analysis to verify whether the investment in its Joint Venture might not be recoverable, there was no need to recognize a loss. | |||||||||||||||||||||||||
| 12 | PROPERTY, PLANT AND EQUIPMENT | ||||||||||||||||||||||||
| Property, plant and equipment is stated at cost, net of accumulated depreciation and/or impairment losses, if any. The cost includes the acquisition amount of equipment and borrowing costs for long-term construction projects if recognition criteria are observed. When significant components of property, plant and equipment are replaced, these components are recognized as individual assets, with specific useful lives and depreciation. Likewise, when a major replacement is performed, its cost is recognized as the carrying amount of the equipment as a replacement, if the recognition criteria are met. All other repair and maintenance costs are recognized in the statement of operations for the year as incurred. | |||||||||||||||||||||||||
| Asset category | Average annual depreciation rate in % | ||||||||||||||||||||||||
| Buildings | 2.78 | ||||||||||||||||||||||||
| Improvements | 6.42 | ||||||||||||||||||||||||
| Machiney and equipments | 14.29 | ||||||||||||||||||||||||
| Facilities | 6.64 | ||||||||||||||||||||||||
| Furniture and appliances | 10.72 | ||||||||||||||||||||||||
| Others | 20.00 | ||||||||||||||||||||||||
| 39 |
| Property, plant and equipment items and eventual significant amounts are written-off upon sale or when there is no expectation of future economic benefits deriving from their use or sale. Any gains or losses resulting from disposals of assets are included in the statement of operations for the year. | |||||||||||||||||||||||||
| The residual value, the useful life of assets and methods of depreciation are reviewed at the end of each fiscal year, and adjusted prospectively, where applicable. The Company reviewed the useful life of property, plant and equipment in 2022 and no significant changes were deemed necessary. | |||||||||||||||||||||||||
| Interest on borrowings and financing directly attributable to the acquisition, construction of an assets, that requires a substantial period of time to be completed for its intended use or sale (qualifying asset), are capitalized as part of the cost of respective assets during its construction phase. From the date that the asset is placed in operation, capitalized costs are depreciated over the estimated useful life of the asset. | |||||||||||||||||||||||||
| 12.1 | Impairment of non-financial assets | ||||||||||||||||||||||||
| The impairment test is intended to present the actual net realization value of an asset. The realization can be directly or indirectly, through sale or through the generation of cash from the use of the asset in the Company's activities. | |||||||||||||||||||||||||
| The Company tests its non-financial assets for impairment annually or whenever there is internal or external evidence that they may be impaired. | |||||||||||||||||||||||||
| An assets or cash-generating unit´s ("CGU") recoverable amount is defined as the asset’s fair value less cost to sell or its value in use, whichever is higher. | |||||||||||||||||||||||||
| If the carrying amount of an asset or cash-generating units exceeds its recoverable value, the asset is considered impaired and an impairment loss is recorded to adjust the carrying amount of the asset or cash-generating unit to its recoverable value. When assessing the recoverable value, the estimated future cash flow is discounted to the present value, using a nominal pre-tax rate, which represents the Company’s weighted average cost of capital to reflect current market valuations as to the time value of money and asset’s specific risks. The impairment test of intangible assets’ useful life including goodwill is described in note 13.1 and 13.2. | |||||||||||||||||||||||||
| Impairment losses are recognized in the statement of operations in categories of expenses consistent with the function of the respective impaired asset. The impairment loss previously recognized is only reversed if there has been a changed in the assumptions used to determine the recoverable amount since the last impairment loss was recognized, except in the case of goodwill that cannot be reversed in future years. | |||||||||||||||||||||||||
| 12.1.1 | Impairment test of stores operating assets | ||||||||||||||||||||||||
| The procedure for verifying non-realization consisted of grouping operational and intangible assets (such as commercial rights) directly attributable to stores. The test steps were as follows: | |||||||||||||||||||||||||
| • Step 1: the carrying amount of properties in rented stores was compared to a sales multiple (35%) representing transactions between retail companies. Stores for which the multiple of sales was lower than their carrying amount and owned stores, a more detailed test is made, as described in Step 2 below. | |||||||||||||||||||||||||
| • Step 2: The Company considered the highest value between the discounted cash flows of stores using sales growth average of 4.40% (6.60% in 2021) for period exceeding the next five years and a discount rate of 12.20% (10.40% in 2021) appraisal reports drawn up by independent experts for own stores. | |||||||||||||||||||||||||
| The Company performed a test to verify the operating assets of the stores that might not be recoverable in the year ended December 31, 2022. Based on the tests performed, there was no need to recognize a loss. | |||||||||||||||||||||||||
| 40 |
| 12.2 | Property, plant and equipment breakdown | ||||||||||||||||||||||||
| As of December 31, 2021 | Additions (i) | Lease modification | Write-off | Depreciation | Transfers and others (ii) | As of December 31, 2022 | |||||||||||||||||||
| Lands | 570 | 48 | - | (18) | - | - | 600 | ||||||||||||||||||
| Buildings | 656 | 117 | - | - | (17) | (26) | 730 | ||||||||||||||||||
| Improvements | 3,596 | 3,451 | - | (27) | (284) | 129 | 6,865 | ||||||||||||||||||
| Machinery and equipments | 828 | 708 | - | (4) | (184) | 92 | 1,440 | ||||||||||||||||||
| Facilities | 362 | 258 | - | (7) | (35) | 7 | 585 | ||||||||||||||||||
| Furnitures and appliances | 416 | 279 | - | (2) | (70) | 132 | 755 | ||||||||||||||||||
| Constructions in progress | 235 | 582 | - | (1) | - | (273) | 543 | ||||||||||||||||||
| Others | 37 | 24 | - | - | (16) | 19 | 64 | ||||||||||||||||||
| Subtotal | 6,700 | 5,467 | - | (59) | (606) | 80 | 11,582 | ||||||||||||||||||
| Lease - right of use: | |||||||||||||||||||||||||
| Buildings | 3,604 | 3,810 | 695 | (70) | (351) | (95) | 7,593 | ||||||||||||||||||
| Equipments | 16 | - | - | - | (6) | (2) | 8 | ||||||||||||||||||
| Subtotal | 3,620 | 3,810 | 695 | (70) | (357) | (97) | 7,601 | ||||||||||||||||||
| Total | 10,320 | 9,277 | 695 | (129) | (963) | (17) | 19,183 | ||||||||||||||||||
| As of December 31, 2020 | Additions (i) | Lease modification | Write-off | Depreciation | Transfers and others (ii) | As of December 31, 2021 | |||||||||||||||||||
| Lands | 481 | 207 | - | (2) | - | (116) | 570 | ||||||||||||||||||
| Buildings | 609 | 258 | - | (4) | (15) | (192) | 656 | ||||||||||||||||||
| Improvements | 2,598 | 1,161 | - | (1) | (182) | 20 | 3,596 | ||||||||||||||||||
| Machinery and equipments | 635 | 307 | - | (1) | (128) | 15 | 828 | ||||||||||||||||||
| Facilities | 269 | 118 | - | (1) | (25) | 1 | 362 | ||||||||||||||||||
| Furnitures and appliances | 340 | 110 | - | (2) | (53) | 21 | 416 | ||||||||||||||||||
| Constructions in progress | 78 | 266 | - | - | - | (109) | 235 | ||||||||||||||||||
| Others | 37 | 6 | - | - | (14) | 8 | 37 | ||||||||||||||||||
| Subtotal | 5,047 | 2,433 | - | (11) | (417) | (352) | 6,700 | ||||||||||||||||||
| Lease - right of use: | |||||||||||||||||||||||||
| Buildings | 2,423 | 885 | 628 | (92) | (244) | 4 | 3,604 | ||||||||||||||||||
| Equipments | 6 | 16 | - | - | (5) | (1) | 16 | ||||||||||||||||||
| Subtotal | 2,429 | 901 | 628 | (92) | (249) | 3 | 3,620 | ||||||||||||||||||
| Total | 7,476 | 3,334 | 628 | (103) | (666) | (349) | 10,320 | ||||||||||||||||||
| (i) Include the borring capitalization in the amount of R$774 (R$38 as of December, 2021), see note 12.4. | |||||||||||||||||||||||||
| (ii) Include the transfers between property, plant and equipment to "assets held for sale", in the amount of R$17 (R$349 as of December 31, 2021), see note 1.2. | |||||||||||||||||||||||||
| 41 |
| 12.3 | Composition of Property, plant and equipment | ||||||||||||||||||||||||
| 12/31/2022 | 12/31/2021 | ||||||||||||||||||||||||
| Historical cost | Accumulated depreciation | Net amount | Historical cost | Accumulated depreciation | Net amount | ||||||||||||||||||||
| Lands | 600 | - | 600 | 570 | - | 570 | |||||||||||||||||||
| Buildings | 859 | (129) | 730 | 767 | (111) | 656 | |||||||||||||||||||
| Improvements | 7,933 | (1,068) | 6,865 | 4,387 | (791) | 3,596 | |||||||||||||||||||
| Machinery and equipments | 2,160 | (720) | 1,440 | 1,373 | (545) | 828 | |||||||||||||||||||
| Facilities | 729 | (144) | 585 | 472 | (110) | 362 | |||||||||||||||||||
| Furnitures and appliances | 1,043 | (288) | 755 | 635 | (219) | 416 | |||||||||||||||||||
| Constructions in progress | 543 | - | 543 | 235 | - | 235 | |||||||||||||||||||
| Others | 157 | (93) | 64 | 115 | (78) | 37 | |||||||||||||||||||
| Subtotal | 14,024 | (2,442) | 11,582 | 8,554 | (1,854) | 6,700 | |||||||||||||||||||
| Lease - right of use: | |||||||||||||||||||||||||
| Buildings | 8,924 | (1,331) | 7,593 | 4,566 | (962) | 3,604 | |||||||||||||||||||
| Equipments | 57 | (49) | 8 | 61 | (45) | 16 | |||||||||||||||||||
| Subtotal | 8,981 | (1,380) | 7,601 | 4,627 | (1,007) | 3,620 | |||||||||||||||||||
| Total property, plant and equipment | 23,005 | (3,822) | 19,183 | 13,181 | (2,861) | 10,320 | |||||||||||||||||||
| 42 |
| 12.4 | Capitalized borrowing costs and lease | ||||||||||||||||||||||||
| The value of capitalized borrowing costs and lease directly attributable to the reform, construction and acquisition of property, plant and equipment and intangible assets within the scope of CPC 20 (R1) / IAS 23 - Borrowings Costs and the amount of depreciation and interest on lease liabilities incorporated into the value of the property, plant and equipment and/or intangible assets, for the period in which the assets are not yet in their intended use in accordance with CPC 06 (R2) / IFRS 16 - Leases, amounted to R$774 (R$38 as of December 31, 2021). The rate used to calculate the borrowing costs eligible for capitalization was 112.16% (117.70% at December 31, 2021) of CDI, corresponding to the effective interest rate of loans taken by the Company. | |||||||||||||||||||||||||
| 12.5 | Additions to property, plant and equipment for cash flow presentation purpose | ||||||||||||||||||||||||
| 12/31/2022 | 12/31/2021 | ||||||||||||||||||||||||
| Additions | 9,277 | 3,334 | |||||||||||||||||||||||
| Leases | (3,810) | (901) | |||||||||||||||||||||||
| Capitalized borrowing costs | (774) | (38) | |||||||||||||||||||||||
| Financing of property, plant and equipment - Additions | (5,080) | (2,284) | |||||||||||||||||||||||
| Financing of property, plant and equipment - Payments | 3,911 | 2,120 | |||||||||||||||||||||||
| Total | 3,524 | 2,231 | |||||||||||||||||||||||
| Additions related to the purchase of operating assets, purchase of land and buildings to expansion activities, building of new stores, improvements of existing distribution centers and stores and investments in equipment and information technology. | |||||||||||||||||||||||||
| The additions and payments of property, plant and equipment above are presented to reconcile the acquisitions during the year with the amounts presented in the statement of cash flows net of items that did not impact cash flow. | |||||||||||||||||||||||||
| 12.6 | Other informations | ||||||||||||||||||||||||
| As of December 31, 2022, the Company recorded in the cost of sales and services the amount of R$71 (R$49 as of December 31, 2021), relating to the depreciation of machinery, building and facilities of distribution centers. | |||||||||||||||||||||||||
| 13 | INTANGIBLE ASSETS | ||||||||||||||||||||||||
| Intangible assets acquired separately are measured at cost upon initial recognition, less amortization, and eventual impairment losses, if any. Internally generated intangible assets, excluding capitalized software development costs, are recognized as expenses when incurred. | |||||||||||||||||||||||||
| Intangible assets mainly consist of goodwill, software acquired from third parties and software developed for internal use and commercial rights (stores rights of use), customer list and brands. | |||||||||||||||||||||||||
| Intangible assets with definite useful lives are amortized using the straight-line method. The amortization period and method are reviewed, at least, at the end of each reporting period. Changes in the expected useful life or the expected pattern of consumption of future economic benefits embodied in the asset are accounted for by changing the amortization period or method, as appropriate, and are treated as changes in accounting estimates. | |||||||||||||||||||||||||
| Software development costs recognized as assets are amortized over their defined useful life (5 to 10 years). The weighted average rate is 14.04% a year, and amortization starts when they become operational. | |||||||||||||||||||||||||
| Intangible assets with indefinite useful lives are not amortized but tested for impairment at the end of each reporting period or whenever there are indications that their carrying amount may be impaired either individually or at the level of the cash-generating unit. The assessment is reviewed annually to determine whether the indefinite life assumption remains appropriate. Otherwise, the useful life is changed prospectively from indefinite to definite. | |||||||||||||||||||||||||
| When applicable, gains or losses arising from the derecognition of an intangible asset are measured as the difference between the net proceeds from the sale of the asset and its carrying amount, any gain or loss is recognized in the statement of operations in the year the asset is derecognized. | |||||||||||||||||||||||||
| As of 12/31/2021 | Additions | Lease modification | Amortization | As of 12/31/2022 | �� | ||||||||||||||||||||
| Goodwill | 618 | - | - | - | 618 | ||||||||||||||||||||
| Softwares | 75 | 18 | - | (17) | 76 | ||||||||||||||||||||
| Commercial rights (i) | 1,136 | 3,139 | - | (8) | 4,267 | ||||||||||||||||||||
| Trade name | 39 | - | - | - | 39 | ||||||||||||||||||||
| Subtotal | 1,868 | 3,157 | - | (25) | 5,000 | ||||||||||||||||||||
| Lease - right of use: | |||||||||||||||||||||||||
| Assets and rights | 19 | - | 1 | (2) | 18 | ||||||||||||||||||||
| Subtotal | 19 | - | 1 | (2) | 18 | ||||||||||||||||||||
| Total | 1,887 | 3,157 | 1 | (27) | 5,018 | ||||||||||||||||||||
| 43 |
| As of 12/31/2020 | Additions | Amortization | Write-off | Transfers | As of 12/31/2021 | ||||||||||||||||||||
| Goodwill | 618 | - | - | - | - | 618 | |||||||||||||||||||
| Softwares | 70 | 21 | (14) | (1) | (1) | 75 | |||||||||||||||||||
| Commercial rights | 310 | 833 | (7) | - | - | 1,136 | |||||||||||||||||||
| Trade name | 39 | - | - | - | - | 39 | |||||||||||||||||||
| Subtotal | 1,037 | 854 | (21) | (1) | (1) | 1,868 | |||||||||||||||||||
| Lease - right of use: | |||||||||||||||||||||||||
| Assets and rights | - | 18 | - | - | 1 | 19 | |||||||||||||||||||
| Subtotal | - | 18 | - | - | 1 | 19 | |||||||||||||||||||
| Total | 1,037 | 872 | (21) | (1) | - | 1,887 | |||||||||||||||||||
| (i) In the year ended December 31, 2022, in the Additions column, are presented the amounts related to the acquisition of the 46 commercial points from Extra Hiper stores, in the amount of R$3.130 see note 1.1. | |||||||||||||||||||||||||
| 12/31/2022 | 12/31/2021 | ||||||||||||||||||||||||
| Historical cost | Accumulated amortization | Net amount | Historical cost | Accumulated amortization | Net amount | ||||||||||||||||||||
| Goodwill | 871 | (253) | 618 | 871 | (253) | 618 | |||||||||||||||||||
| Softwares | 151 | (75) | 76 | 133 | (58) | 75 | |||||||||||||||||||
| Commercial rights | 4,299 | (32) | 4,267 | 1,160 | (24) | 1,136 | |||||||||||||||||||
| Trade name | 39 | - | 39 | 39 | - | 39 | |||||||||||||||||||
| 5,360 | (360) | 5,000 | 2,203 | (335) | 1,868 | ||||||||||||||||||||
| Lease - right of use: | |||||||||||||||||||||||||
| Assets and rights | 29 | (11) | 18 | 28 | (9) | 19 | |||||||||||||||||||
| Total of intangible assets | 5,389 | (371) | 5,018 | 2,231 | (344) | 1,887 | |||||||||||||||||||
| 13.1 | Impairment test of intangible assets with an indefinite useful life, including goodwill | ||||||||||||||||||||||||
| The impairment test of intangible assets uses the same practices described in note 12.1. | |||||||||||||||||||||||||
| The Company revised the plan used to assess impairment for operations in Brazil. The recoverable amount is determined by means of a calculation based on the value in use, based on cash projections from financial budgets, which were reviewed and approved by management for the next three years, considering the premises updated for December 31, 2022. The discount rate applied for cash flow projections is 12.20% at December 31, 2022 (10.40% at December 31, 2021), and cash flows that exceed the three year period are extrapolated using a growth rate of 4.40% at December 31, 2022 (6.60% at December 31, 2021). As a result of this analysis, there was no need to record a provision for impairment of these assets. | |||||||||||||||||||||||||
| 13.2 | Commercial rights | ||||||||||||||||||||||||
| Commercial rights are the right to operate stores, which refers to the rights acquired or allocated in business combinations. | |||||||||||||||||||||||||
| According to the Management’s understanding, commercial rights are considered recoverable, either through the expected cash flows of the related store or the sale to third parties. | |||||||||||||||||||||||||
| Commercial rights is tested following the assumptions described in note 12.1.1. | |||||||||||||||||||||||||
| The amount of commercial rights recorded in 2022 is mainly related to the acquisition of Extra Hiper stores. The Company used a single CGU for the impairment test with all the stores acquired, considering the maturation period of the stores (2 years). | |||||||||||||||||||||||||
| 13.3 | Additions to intangible assets for cash flow presentation purpose | ||||||||||||||||||||||||
| 12/31/2022 | 12/31/2021 | ||||||||||||||||||||||||
| Additions | 3,157 | 872 | |||||||||||||||||||||||
| Leases | - | (18) | |||||||||||||||||||||||
| Financing of intangible assets - Additions | (3,130) | - | |||||||||||||||||||||||
| Financing of intangible assets - Payments | 609 | - | |||||||||||||||||||||||
| Total | 636 | 854 | |||||||||||||||||||||||
| 14 | TRADE PAYABLES AND TRADE PAYABLES - AGREEMENTS | ||||||||||||||||||||||||
| Note | 12/31/2022 | 12/31/2021 | |||||||||||||||||||||||
| Trade Payables | |||||||||||||||||||||||||
| Product suppliers | 9,196 | 5,849 | |||||||||||||||||||||||
| Supliers - Acquisition of propert, plant and equipament | 140 | 197 | |||||||||||||||||||||||
| Service providers | 129 | 74 | |||||||||||||||||||||||
| Service providers - related parties | 10.1 | 33 | 22 | ||||||||||||||||||||||
| Bonuses from suppliers | 14.2 | (960) | (576) | ||||||||||||||||||||||
| Total Suppliers | 8,538 | 5,566 | |||||||||||||||||||||||
| Trade Payables - Agreement | |||||||||||||||||||||||||
| Product suppliers | 14.1 | 813 | 573 | ||||||||||||||||||||||
| Supliers - Acquisition of propert, plant and equipament | 14.1 | 1,226 | - | ||||||||||||||||||||||
| Supliers - Agreement - Acquisition of Extra Stores | 14.3 | 3,202 | - | ||||||||||||||||||||||
| Total Suppliers - Agreements | 5,241 | 573 | |||||||||||||||||||||||
| Total | 13,779 | 6,139 | |||||||||||||||||||||||
| Current | 12,999 | 6,139 | |||||||||||||||||||||||
| Non-current | 780 | - | |||||||||||||||||||||||
| 44 |
| 14.1 | Agreements among suppliers, the Company and banks | ||||||||||||||||||||||||
| The Company maintains agreements signed with financial institutions, through which, suppliers of products, capital goods and services, have the possibility of structuring operations of anticipation receivables securities related to commercial operations between the parties. | |||||||||||||||||||||||||
| Management assessed that the economic substance of the transaction is operational, considering that the anticipation is a exclusive decision of the supplier and, for the Company, there are no changes in the original term negotiated with the supplier, nor changes in the contracted amounts . Management evaluated the potential effects of adjusting these operations to present value and concluded that the effects are immaterial for measurement and disclosure. | |||||||||||||||||||||||||
| Additionally, there is no exposure to any financial institution individually related to these operations and these liabilities are not considered net debt and do not have restrictive covenants (financial or non-financial) related. | |||||||||||||||||||||||||
| These balances are classified as "suppliers - agreement" and payments are made to financial institutions under the same conditions as those originally agreed with the supplier. As a result, all cash flow from these operations is presented as operating in the statement of cash flows. | |||||||||||||||||||||||||
| As of December 31, 2022, the balance payable related to these operations is R$2,039 (R$573 as of December 31, 2021). | |||||||||||||||||||||||||
| 14.2 | Bonuses from suppliers | ||||||||||||||||||||||||
| These include commercial agreements and discounts obtained from suppliers. These amounts are defined in agreements and include discounts for purchase volume, joint marketing programs, freight reimbursements, and other similar programs. The receipt occurs by deducting trade notes payable to suppliers, according to conditions established in the supply agreements, so that the financial settlements occur for the net amount. | |||||||||||||||||||||||||
| 14.3 | Suppliers - Agreements - Purchase of Extra Stores | ||||||||||||||||||||||||
| As mentioned in note 1.1, on September and December, 2022, the GPA realized the assignment of its receivables on the sale of Extra stores to the Company with a financial institution corresponding to the installments due between 2023 and 2024. The Company's management, as the consenting party of the operation, evaluated the contractual terms of the assignment of receivables and in accordance with CPC 26 (R1) / IAS 1 - Presentation of financial statements, concluded that there was no modification in the conditions originally contracted with the GPA, maintaining the characteristic of the terms and the payments of the installments will be made directly by the Company to the financial institution, maintaining the same due dates and interest previously agreed with GPA. Therefore, Management concluded that the characteristic of the operation was maintained as an accounts payable for the acquisition of the commercial points of the Extra Hiper stores. | |||||||||||||||||||||||||
| As of December 31, 2022, the balance is R$3,202 (there is no amount recorded as of December 31, 2021). | |||||||||||||||||||||||||
| 15 | FINANCIAL INSTRUMENTS | ||||||||||||||||||||||||
| 15.1 | Classification and measurement of financial assets and liabilities | ||||||||||||||||||||||||
| Pursuant to CPC 48 / IFRS 9, on initial recognition, a financial asset is classified as measured: at amortized cost, at fair value through other comprehensive income or at fair value through income. The classification of financial assets is usually based on the business model in which a financial asset is managed and its contractual cash flow characteristics. Embedded derivatives in which the main contract is a financial asset within the scope of the standard are never split. Instead, the hybrid financial instrument is assessed for classification as a whole. | |||||||||||||||||||||||||
| A financial asset is measured at amortized cost if it meets both of the following conditions and is not designated as measured at fair value through income: | |||||||||||||||||||||||||
| • It is maintained in a business model whose objective is to keep financial assets to receive contractual cash flows; and | |||||||||||||||||||||||||
| • It is contractual terms generate, on specific dates, cash flows related to the payment of principal and interest on the outstanding principal amount. | |||||||||||||||||||||||||
| A debt instrument is measured at fair value through other comprehensive income, if it meets both of the following conditions and is not designated as measured at fair value through income: | |||||||||||||||||||||||||
| • It is maintained in a business model whose objective is achieved both by receipt of contractual cash flows and sale of financial assets; and | |||||||||||||||||||||||||
| • Its contractual terms generate, on specific dates, cash flows related to the payment of principal and interest on the outstanding principal amount. | |||||||||||||||||||||||||
| All financial assets not classified as measured at amortized cost or at fair value through other comprehensive income, as described above, are classified as fair value through income. This includes all derivative financial assets. At initial recognition, the Company may irrevocably designate a financial asset that otherwise meets the requirements to be measured at amortized cost, at fair value through other comprehensive income or fair value through income if this significantly eliminates or reduces an accounting mismatch that otherwise would arise (option of fair value available in CPC 48 / IFRS 9). | |||||||||||||||||||||||||
| A financial asset (unless these are trade receivables without a significant financing component which is firstly measured by the price of the transaction) is initially measured by fair value, accrued, for an item not measured at fair value through income of transaction costs which are directly attributable to its acquisition. | |||||||||||||||||||||||||
| 45 |
| • Financial assets measured at fair value through income: These assets are subsequently measured at fair value. The net result, including interest rates or dividend income, is recognized in the statement of operations. | |||||||||||||||||||||||||
| • Financial assets at amortized cost: These assets are subsequently measured at amortized cost applying the effective interest rate method. The amortized cost is reduced by impairment losses. Interest income, exchange gains, and losses are recognized in the statement of operations. Any gain or loss in derecognition is recognized in the statement of operations. | |||||||||||||||||||||||||
| • Financial assets at fair value through other comprehensive income: These assets are subsequently measured at fair value. Interest income calculated adopting the effective interest rate method, exchange gains, and losses and impairment losses are recognized in the statement of operations. Other net results are recognized in other comprehensive income. In derecognition, the result accumulated in other comprehensive income is reclassified to the statement of operations. | |||||||||||||||||||||||||
| Financial liabilities are recognized when the Company assume contractual liabilities for settlement in cash or assumption of third-party obligations through a contract to which it is a party. The financial liabilities are initially recognized at fair value and derecognized when settled, extinguished, or expired. | |||||||||||||||||||||||||
| The measurement of financial liabilities depends on their classification, as described below: | |||||||||||||||||||||||||
| • Financial liabilities at fair value through income: Include financial liabilities for trading and financial liabilities designated on initial recognition at fair value through income. Gains or losses on trading liabilities are recognized in the statement of operations. | |||||||||||||||||||||||||
| • Financial liabilities at amortized cost: After initial recognition, borrowings and financing subject to interest are subsequently measured at amortized cost, using the effective interest rate method. Gains and losses are recognized in the statement of operations when liabilities are written off, as well as through the amortization process at the effective interest rate. | |||||||||||||||||||||||||
| 15.2 | Derecognition of financial assets and liabilities | ||||||||||||||||||||||||
| A financial asset (or, where applicable, part of a financial asset or part of a group of similar financial assets) is derecognized when: | |||||||||||||||||||||||||
| • The rights of cash flows receivables expire; and | |||||||||||||||||||||||||
| • The Company transfers its rights to receive cash flows from an asset or assume an obligation of fully paying the cash flows received to a third party, under the terms of a transfer agreement; and (a) the Company substantially transferred all the risks and benefits related to the asset; or (b) the Company neither transferred nor substantially retained all the risks and benefits relating to the asset, but transferred its control. | |||||||||||||||||||||||||
| When the Company assigns its rights to receive cash flows from an asset or enters into a transfer agreement without having substantially transferred or retained all of the risks and benefits relating to the asset nor transferred the asset control, the asset is maintained and the related liability is recognized. The asset transferred and related liability are measured to reflect the rights and obligations retained by the Company. | |||||||||||||||||||||||||
| A financial liability is derecognized when the liability underlying obligation is settled, canceled, or expired. | |||||||||||||||||||||||||
| Purchases or sales of financial assets requiring delivery of assets within a term defined by regulation or agreement in the market (negotiations under normal conditions) are recognized on the trade date, i.e., on the date the Company undertakes to buy or sell the asset. | |||||||||||||||||||||||||
| When a financial liability is replaced by another of the same creditor, through substantially different terms, or terms of an existing liability are substantially modified, this replacement or modification is treated as the derecognition of original liability and recognition of a new liability, and the difference between respective carrying amounts is recognized in the statement of operations. | |||||||||||||||||||||||||
| 15.3 | Offset of financial instruments | ||||||||||||||||||||||||
| The financial assets and liabilities are offset and reported net in financial statements, if, and only if, amounts recognized can be offset and with the intention of settlement on a net basis, or realize assets and settle liabilities, simultaneously. | |||||||||||||||||||||||||
| 15.4 | Derivative financial instruments | ||||||||||||||||||||||||
| The Company uses derivative financial instruments to limit the exposure to variation unrelated to the local market, such as interest rate swaps and exchange rate variation swaps. These derivative financial instruments are initially recognized at fair value on the date on which the derivative contract is executed and subsequently re-measured at fair value at the end of the reporting period. Derivatives are recorded as financial assets when the fair value is positive and as financial liabilities when the fair value is negative. Gains or losses resulting from changes in the fair value of derivatives are directly recorded in the statement of operations. | |||||||||||||||||||||||||
| At the inception of a hedge relationship, the Company formally designates and documents the hedge relationship to which it intends to apply hedge accounting and its objective and risk management strategy for contracting the hedge. The documentation includes identification of the hedging instrument, the hedged item or transaction, the nature of the risk being hedged and how the Company will assess the effectiveness of the changes in the hedging instrument’s fair value in offsetting the exposure to changes in the fair value of the hedged item or cash flow attributable to the hedged risk. These hedges are expected to be highly effective in offsetting changes in the fair value or cash flow and are assessed on an ongoing basis to determine if they have been highly effective throughout the periods for which they were designated. | |||||||||||||||||||||||||
| 46 |
| The following are recognized as fair value hedges: | ||||||||||||||||||||||||
| • The change in the fair value of a derivative financial instrument classified as fair value hedging is recognized as financial result. The change in the fair value of the hedged item is recorded as a part of the carrying amount of the hedged item and is recognized in the statement of operations; and | ||||||||||||||||||||||||
| • In order to calculate the fair value, debts and swaps are measured through rates available in the financial market and projected up to their maturity date. The discount rate used in the calculation by the interpolation method for borrowings denominated in foreign currency is developed through CDI curves, free coupon and DI, indexes disclosed by the B3 S.A., whereas for borrowings denominated in Reais, the Company uses the DI curve, an index published by the CETIP (Securities Custodial and Clearing Center) and calculated through the exponential interpolation method. | ||||||||||||||||||||||||
| The Company uses financial instruments only to hedge identified, risks limited to 100% of the value of these risks. Derivative instruments transactions are exclusively used to reducing the exposure to the risk of changes in interest rates and foreign currency fluctuation and maintaining a balanced capital structure. | ||||||||||||||||||||||||
| 15.5 | Impairment of financial assets | |||||||||||||||||||||||
| The impairment loss model applies to financial assets measured at amortized cost, contractual assets and debt instruments measured at fair value through other comprehensive income, but does not apply to investments in equity instruments (shares) or financial assets measured at fair value through income. | ||||||||||||||||||||||||
| Pursuant to CPC 48 / IFRS 9, provisions for losses are measured at one of the following bases: | ||||||||||||||||||||||||
| • Loan losses expected for 12 months (general model): these are loan losses resulting from possible default events within 12 months after the end of the reporting period, and subsequently, in case of a deterioration of credit risk for the entire life of the instrument. | ||||||||||||||||||||||||
| • Loan losses expected for entire life (simplified model): these are loan losses resulting from all possible default events over the expected life of a financial instrument. | ||||||||||||||||||||||||
| • Practical expedient: these are loan losses expected and consistent with reasonable and sustainable information available, at the end of the reporting period on past events, current conditions, and estimates of future economic conditions that allow verifying probable future loss based on the historical loan loss occurred in accordance with instruments maturity. | ||||||||||||||||||||||||
| The Company measures provisions for trade receivable losses and other receivables and contractual assets through an amount corresponding to the loan loss expected for the entire life, and for trade receivables, whose receivables portfolio is fragmented, rents receivable, the practical expedient is applied by adopting a matrix of losses for each maturity level. | ||||||||||||||||||||||||
| When determining whether the credit risk of a financial asset significantly increased from initial recognition, and when estimating the expected loan losses, the Company considers reasonable and sustainable information which is relevant and available without cost or excessive effort. This includes qualitative and quantitative information and analyses, based on the Company’s historical experience, the assessment of credit, and considering projection information. | ||||||||||||||||||||||||
| The Company assumes that the credit risk in a financial asset significantly increased if it is more than 90 days overdue. | ||||||||||||||||||||||||
| The Company considers a financial asset in default when: | ||||||||||||||||||||||||
| • It is unlikely that the debtor will fully pay its loan obligations to the Company, without resorting to collateral (if any); or | ||||||||||||||||||||||||
| • The financial asset is more than 90 days overdue. | ||||||||||||||||||||||||
| The Company determines the credit risk of a debt instrument by analyzing the payment history, financial, and current macroeconomic conditions of counterparty and assessment of rating agencies, where applicable, thereby evaluating each instrument, individually. | ||||||||||||||||||||||||
| The maximum period considered in the estimate of expected receivable loss is the maximum contractual period during which the Company is exposed to the credit risk. | ||||||||||||||||||||||||
| • Measurement of expected loan losses: Expected loan losses are estimated weighted by the probability of loan losses based on historical losses and related assumptions projections. The loan losses are measured at present value based on all cash shortfalls (i.e., the difference between cash flows owed to the Company according to the contract and cash flows that the Company expects to receive). | ||||||||||||||||||||||||
| Expected credit losses are discounted by the effective interest rate of a financial asset. | ||||||||||||||||||||||||
| • Financial assets with credit recovery problems: On each reporting date, the Company assesses if financial assets recorded by amortized cost and debt instruments measured at fair value through other comprehensive income shows signs of impairment. A financial asset shows signs of impairment when one or more events occur with a negative impact on the financial asset’s estimated future cash flows. | ||||||||||||||||||||||||
| • Reporting of impairment loss: Provision for financial assets losses measured at amortized cost are deducted from an assets’ gross carrying amount. | ||||||||||||||||||||||||
| For financial instruments measured at fair value through other comprehensive income, the provision for losses is recognized in other comprehensive income, instead of reducing the asset’s carrying amount. | ||||||||||||||||||||||||
| 47 |
| Impairment losses related to trade receivables and other receivables, including contractual assets, are reported separately in the statement of operations and other comprehensive income. Losses of recoverable amounts from other financial assets are stated under "selling expenses”. | |||||||||||||||||||||||||
| • Trade receivables and contractual assets: The Company considers the model and a few of the assumptions applied in the calculation of these expected loan losses as the main sources of an uncertain estimate. | |||||||||||||||||||||||||
| Positions within each group were segmented based on common characteristics of credit risk, such as: | |||||||||||||||||||||||||
| • Level of credit risk and loss history for wholesale clients and property lease; and | |||||||||||||||||||||||||
| • Status of default risk and loss history for credit card companies and other clients. | |||||||||||||||||||||||||
| Financial instruments | |||||||||||||||||||||||||
| The main financial instruments and their amount recorded in the financial statements, by category, are as follows: | |||||||||||||||||||||||||
| Note | 12/31/2022 | 12/31/2021 | |||||||||||||||||||||||
| Financial assets | |||||||||||||||||||||||||
| Amortized cost | |||||||||||||||||||||||||
| Cash and cash equivalents | 6 | 5,842 | 2,550 | ||||||||||||||||||||||
| Related parties - assets | 10.1 | 252 | 114 | ||||||||||||||||||||||
| Trade receivables and other accounts receivable | 198 | 169 | |||||||||||||||||||||||
| Fair value through income | |||||||||||||||||||||||||
| Gain of financial instruments at fair value | 15.11.1 | 182 | 32 | ||||||||||||||||||||||
| Fair value through other comprehensive income | |||||||||||||||||||||||||
| Trade receivables with credit card companies and sales tickets | 424 | 155 | |||||||||||||||||||||||
| Financial liabilities | |||||||||||||||||||||||||
| Other financial liabilities - amortized cost | |||||||||||||||||||||||||
| Related parties - liabilities | 10.1 | (261) | (368) | ||||||||||||||||||||||
| Trade payables - Agreements | 14 | (13,779) | (6,139) | ||||||||||||||||||||||
| Borrowings and financing | 15.11.1 | (1,217) | (1,210) | ||||||||||||||||||||||
| Debenture and promissory notes | 15.12 | (11,025) | (6,446) | ||||||||||||||||||||||
| Lease liabilities | 17.2 | (8,360) | (4,051) | ||||||||||||||||||||||
| Fair value through income | |||||||||||||||||||||||||
| Borrowings and financing, including derivatives | 15.11.1 | (313) | (341) | ||||||||||||||||||||||
| Loss of financial instruments at fair value | 15.11.1 | (36) | (36) | ||||||||||||||||||||||
| Net exposure | (28,093) | (15,571) | |||||||||||||||||||||||
| The fair value of other financial instruments detailed in the table above approximates the carrying amount based on the existing payment terms and conditions. The financial instruments measured at amortized cost, the fair values of wich differ from the carrying amounts are disclosed in note 15.9. | |||||||||||||||||||||||||
| 15.6 | Considerations on risk factors that may affect the business of the Company | ||||||||||||||||||||||||
| 15.6.1 | Credit Risk | ||||||||||||||||||||||||
| • Cash and cash equivalents | |||||||||||||||||||||||||
| In order to minimize the credit risk, the investiment policies adopted establish in financial institutions approved by the Company’s Financial Committee, considering the monetary limits and evaluations of financial instituions, which are regularly updated. | |||||||||||||||||||||||||
| • Trade receivables | |||||||||||||||||||||||||
| The credit risk related to trade receivables is minimized by the fact that a large part of installment sales are made with credit cards. These receivables may be advanced at any time, without right of recource, with banks or credit card companies, for the porpuse of providing working capital, generating the derecognition of the accounts receivable. In addition the main acquirers used by the Company are related to first-tier financial institutions with low credit risk. Additionally, mainly for trade receivables collected in installments, the Company monitors the risk for the grating of credit and for the periodic analysis of the expected loss balances. | |||||||||||||||||||||||||
| The Company also incurs counterparty risk related to derivative instruments, this risk is mitigated by the policy of carrying out transactions, according to policies approved by governance bodies. | |||||||||||||||||||||||||
| There are no amounts receivable that individually, account for more than 5% of the accounts receivable or revenues. | |||||||||||||||||||||||||
| 15.6.2 | Interest rate risk | ||||||||||||||||||||||||
| The Company obtains borrowings and financing with major financial institutions in order to meet cash requirements for investments. Accordingly, the Company is mainly exposed to the risk of significant fluctuations in the interest rate, especially the rate related to derivative liabilities (foreign currency exposure hedge) and indexed to CDI. The balance of cash and cash equivalents, indexed to CDI, partially offsets the risk of flutuations in the interest rates. | |||||||||||||||||||||||||
| 15.6.3 | Foreign currency exchange rate risk | ||||||||||||||||||||||||
| The fluctuations in the exchange rates may increase the balances of borrowings foreign currency and for this reason the Company uses derivative financial instruments such as swaps to mitigate the foreign exchange rate risk, converting the cost of debt into domestic currency and interest rates. | |||||||||||||||||||||||||
| 48 |
| 15.6.4 | Capital risk management | ||||||||||||||||||||||||
| The main objective of the Company’s capital management is to ensure that the Company maintains its credit rating and a well-balanced equity ratio, in order to support businesses and maximize shareholder value. The Company manages the capital structure and makes adjustments considering the changes in the economic conditions. | |||||||||||||||||||||||||
| The capital structure is as follows: | |||||||||||||||||||||||||
| 12/31/2022 | 12/31/2021 | ||||||||||||||||||||||||
| Borrowings, financing, debentures and promissory notes | (12,591) | (8,033) | |||||||||||||||||||||||
| (-) Cash and cash equivalents | 5,842 | 2,550 | |||||||||||||||||||||||
| (-) Derivative financial instruments | 182 | 32 | |||||||||||||||||||||||
| Net debt | (6,567) | (5,451) | |||||||||||||||||||||||
| Shareholders’ equity | 3,896 | 2,766 | |||||||||||||||||||||||
| % Net debt over Shareholders’ equity | 169% | 197% | |||||||||||||||||||||||
| 15.6.5 | Liquidity risk management | ||||||||||||||||||||||||
| The Company manages liquidity risk through daily monitoring of cash flows and control of maturities of financial assets and liabilities. | |||||||||||||||||||||||||
| The table below summarizes the aging profile of the Company’s financial liabilities as of December 31, 2022. | |||||||||||||||||||||||||
| Less than 1 year | 1 to 5 years | More than 5 years | Total | ||||||||||||||||||||||
| Borrowings and financing | 948 | 835 | - | 1,783 | |||||||||||||||||||||
| Debenture and promissory notes | 1,142 | 11,362 | 3,671 | 16,175 | |||||||||||||||||||||
| Derivative financial instruments | 214 | 219 | (1,081) | (648) | |||||||||||||||||||||
| Lease liabilities | 1,356 | 5,828 | 13,494 | 20,678 | |||||||||||||||||||||
| Trade payables | 8,538 | - | - | 8,538 | |||||||||||||||||||||
| Trade Payables - Agreements | 2,039 | - | - | 2,039 | |||||||||||||||||||||
| Trade payables - Agreements - Acquisition of Extra Stores | 2,422 | 780 | - | 3,202 | |||||||||||||||||||||
| Total | 12,198 | 18,244 | 16,084 | 46,526 | |||||||||||||||||||||
| The information was prepared considering the undiscounted cash flows of financial liabilities based on the earliest date the Company may be required to make the payment or be eligible to receive the payment. To the extent that interest rates are floating, the undiscounted amount is obtained based on interest rate curves for the year ended December 31, 2022. Therefore, certain balances presented do not agree with the balances represented in the balance sheets. | |||||||||||||||||||||||||
| 15.7 | Derivative financial instruments | ||||||||||||||||||||||||
| Some swap transactions are designated as fair value hedges, with the objective to hedge the exposure to changes in foreign exchange rates and fixed interest rates (U.S. dollars), converting the debt into domestic interest rates and currency. | |||||||||||||||||||||||||
| As of December 31, 2022, the notional amount of these contracts was R$2,360 (R$1.888 as of December 31, 2021). These transactions are usually contracted under the same term of amounts and carried out with a financial institution of the same economic group, observing the limits set by Management. | |||||||||||||||||||||||||
| According to the Company’s treasury policies, swaps cannot be contracted with restrictions (“caps”), margins, as well as return clauses, double index, flexible options or any other types of transactions different from traditional swap and forwards transactions to hedge against debts. | |||||||||||||||||||||||||
| The Company’s internal controls environment were designed to ensure that transactions executed conform to the treasury policy. | |||||||||||||||||||||||||
| The Company calculates the effectiveness of hedge transactions at the inception date and on a continuing basis. Hedge transactions contracted in the year ended December 31, 2022 were effective in relation to the covered risk. For derivative transactions that qualify as hedge accounting, in accordance with CPC 48 / IFRS 9, the debt which is the hedged item, is also adjusted at fair value. | |||||||||||||||||||||||||
| Notional value | Fair value | ||||||||||||||||||||||||
| 12/31/2022 | 12/31/2021 | 12/31/2022 | 12/31/2021 | ||||||||||||||||||||||
| Swap of hedge | |||||||||||||||||||||||||
| Hedge purpose (debt) | 2,360 | 1,888 | 2,542 | 1,869 | |||||||||||||||||||||
| Long Position | |||||||||||||||||||||||||
| Fixed rate | 106 | 106 | 109 | 60 | |||||||||||||||||||||
| USD + Fixed | 282 | 282 | 282 | 281 | |||||||||||||||||||||
| Hedge - CRI | 1,972 | 1,500 | 2,151 | 1,528 | |||||||||||||||||||||
| Short Position | (2,360) | (1,888) | (2,396) | (1,873) | |||||||||||||||||||||
| Net hedge position | - | - | 146 | (4) | |||||||||||||||||||||
| 49 |
| Realized and unrealized gains and losses on these contracts during the year ended December 31, 2022, are recorded as financial revenues or expenses, net and the balance receivable at fair value is R$146 (balance payable of R$4 as of December 31, 2021). The assets are recorded as “derivate financial instruments” and the liability as “borrowings and financing”. | |||||||||||||||||||||||||
| The effects of the hedge at fair value through income for the year ended December 31, 2022, resulted in a gain of R$29 (loss of R$4 as of December 31, 2021), recorded under cost of debt, see note 24. | |||||||||||||||||||||||||
| �� | |||||||||||||||||||||||||
| 15.7.1 | Fair values of derivative financial instruments | ||||||||||||||||||||||||
| Fair value is the amount for which an asset could be exchanged, or a liability settled, between knowledgeable, willing parties in an arm’s length transaction. | |||||||||||||||||||||||||
| The fair values are calculated based on projected future cash flow, using the future CDI curves released by B3, plus the operation spreads, and discounting them to present value using the same CDI curves by B3. | |||||||||||||||||||||||||
| The fair values of exchange coupon swaps versus CDI rate were obtained using the exchange rates effective at the reporting date and the rates projected by the market based on the currency coupon curves. | |||||||||||||||||||||||||
| In order to calculate the coupon of foreign currency indexed-positions, the straight-line convention - 360 consecutive days was adopted and to calculate the coupon of CDI indexed-positions, the exponential convention - 252 business days was adopted. | |||||||||||||||||||||||||
| 15.8 | Sensitivity analysis of financial instruments | ||||||||||||||||||||||||
| According to Management's assessment, the most probable scenario considered was, on the maturity date of each transaction, the market curves (currencies and interest) of B3. | |||||||||||||||||||||||||
| Therefore, in the probable scenario (I) there is no impact on the fair value of financial instruments. For scenarios (II) and (III), for the exclusive effect of sensitivity analysis, a deterioration of 5% and 10%, respectively, in the risk variables was considered, up to one year of financial instruments. | |||||||||||||||||||||||||
| For a probable scenario, the weighted interest rate was 12.95% per year. | |||||||||||||||||||||||||
| In the case of derivative financial instruments (aiming at hedging the financial debt), the variations of the scenarios are accompanied by the respective hedges, indicating that the effects are not significant. | |||||||||||||||||||||||||
| The Company disclosed the net exposure of the derivative financial instruments, the corresponding financial instruments and certain financial instruments in the sensitivity analysis table below, for each of the mentioned scenarios: | |||||||||||||||||||||||||
| Market projections | |||||||||||||||||||||||||
| Transactions | Note | Risk (CDI Increase) | As of 12/31/2022 | Scenario (I) | Scenario (II) | Scenario (III) | |||||||||||||||||||
| Borrowings and financing | 15.11.1 | CDI + 1.55% per year | (1,223) | (170) | (178) | (187) | |||||||||||||||||||
| Borrowings and financing (fixed rate) | 15.11.1 | TR + 9.80% | (48) | (58) | (62) | (67) | |||||||||||||||||||
| Borrowings and financing (foreign currency) | 15.11.1 | USD + 1.06% per year | (262) | (6) | (20) | (33) | |||||||||||||||||||
| Debenture and promissory notes | 15.11.1 | CDI + 1.44% per year | (11,123) | (1,534) | (1,611) | (1,688) | |||||||||||||||||||
| Total net effect (loss) | (12,656) | (1,768) | (1,871) | (1,975) | |||||||||||||||||||||
| Cash equivalents | 6 | 92.80% | 5,605 | 734 | 771 | 808 | |||||||||||||||||||
| Net exposure loss | (7,051) | (1,034) | (1,100) | (1,167) | |||||||||||||||||||||
| 15.9 | Fair values measurement | ||||||||||||||||||||||||
| The Company discloses the fair value of financial instruments measured at fair values and of financial instruments measured at amortized cost, the fair value of which differ from the carrying amounts, pursuant to CPC 46/IFRS 13, which address the concepts of measurement and disclosure requirements. The fair value hierarchy levels are defined below: | |||||||||||||||||||||||||
| Level 1: fair value measurement at the balance sheet date using quoted prices (unadjusted) in active markets for identical assets or liabilities to which entity may have access at the measurement date. | |||||||||||||||||||||||||
| Level 2: fair value measurement at the balance sheet date using other significant observable assumptions for the asset or liability, either directly or indirectly, except quoted prices included in Level 1. | |||||||||||||||||||||||||
| Level 3: fair value measurement at the balance sheet date using non-observable data for the asset or liability. | |||||||||||||||||||||||||
| The data used in fair value models are obtained, whenever possible, from observable markets or from information in comparable transactions in the market, the benchmarking of the fair value of similar financial instruments, the analysis of discounted cash flows or other valuation models. Judgment is used in the determination of assumptions in relation to liquidity risk, credit risk and volatility. Changes in assumptions may affect the reported fair value of financial instruments. | |||||||||||||||||||||||||
| In the case of financial instruments not actively negotiated, the fair value is based on valuation techniques defined by the Company and compatible with usual practices of the market. These techniques include the use of recent market operations between independent parties, the benchmarking of similar financial instruments’ fair value, the analysis of discounted cash flows, or other valuation models. | |||||||||||||||||||||||||
| The fair values of cash and cash equivalents, trade receivables and trade payables approximate their carrying amounts. | |||||||||||||||||||||||||
| The table below sets forth the fair value hierarchy of financial assets and liabilities measured at fair value of financial instruments measured at amortized cost, for which the fair value has been disclosed in the financial statements: | |||||||||||||||||||||||||
| 50 |
| Carrying amount | Fair value | ||||||||||||||||||||||||
| 12/31/2022 | 12/31/2021 | 12/31/2022 | 12/31/2021 | Level | |||||||||||||||||||||
| Trade receivables with credit cards companies and sales tickets | 424 | 155 | 424 | 155 | 2 | ||||||||||||||||||||
| Interest rate swaps between currencies | (36) | (11) | (36) | (11) | 2 | ||||||||||||||||||||
| Interest rate swaps | 2 | 4 | 2 | 4 | 2 | ||||||||||||||||||||
| Interest rate swaps - CRI | 180 | 3 | 180 | 3 | 2 | ||||||||||||||||||||
| Borrowings and financing (fair value) | (313) | (341) | (313) | (341) | 2 | ||||||||||||||||||||
| Borrowings and financing (amortized cost) | (12,242) | (7,656) | (12,096) | (7,372) | 2 | ||||||||||||||||||||
| (11,985) | (7,846) | (11,839) | (7,562) | ||||||||||||||||||||||
| There were no changes between fair value measurement hierarchy levels during the year ended December 31, 2022. | |||||||||||||||||||||||||
| Interest rate swaps, cross-currency and borrowings and financing are classified in level 2 since the fair value of such financial instruments was determined based on readily observable inputs, such as expected interest rate and current and future foreign exchange rate. | |||||||||||||||||||||||||
| 15.10 | Operations with derivative financial instruments | ||||||||||||||||||||||||
| The Company has derivative contracts with the following financial institutions: Itaú BBA, Scotiabank, BR Partners, Santander and Banco XP. | |||||||||||||||||||||||||
| The outstanding derivative financial instruments are presented in the table below: | |||||||||||||||||||||||||
| Description | Notional value | Due date | 12/31/2022 | 12/31/2021 | |||||||||||||||||||||
| Debt | |||||||||||||||||||||||||
| USD - BRL | USD50 | 2023 | (36) | (11) | |||||||||||||||||||||
| Debt | |||||||||||||||||||||||||
| IPCA - BRL | R$1,972 | 2028, 2029 and 2031 | 180 | 3 | |||||||||||||||||||||
| Interest rate swaps registered at CETIP | |||||||||||||||||||||||||
| Pre-fixed rate x CDI | R$54 | 2027 | 1 | 2 | |||||||||||||||||||||
| Pre-fixed rate x CDI | R$52 | 2027 | 1 | 2 | |||||||||||||||||||||
| Derivatives - Fair value hedge - Brazil | 146 | (4) | |||||||||||||||||||||||
| 15.11 | Borrowings and financing | ||||||||||||||||||||||||
| 15.11.1 | Debt breakdown | ||||||||||||||||||||||||
| Weighted average | 12/31/2022 | 12/31/2021 | |||||||||||||||||||||||
| Current | |||||||||||||||||||||||||
| Debenture and promissory notes | CDI + 1.46 per year | 454 | 194 | ||||||||||||||||||||||
| Borrowing costs | (23) | (14) | |||||||||||||||||||||||
| Total debenture and promissory notes | 431 | 180 | |||||||||||||||||||||||
| ' | |||||||||||||||||||||||||
| Borrowings and financing | |||||||||||||||||||||||||
| In domestic currency | |||||||||||||||||||||||||
| Working capital | TR + 9.80% | 12 | 14 | ||||||||||||||||||||||
| Working capital | CDI + 1.15% per year. | 523 | 419 | ||||||||||||||||||||||
| Borrowing costs | (4) | (4) | |||||||||||||||||||||||
| Total domestic currency | 531 | 429 | |||||||||||||||||||||||
| In foreign currency | |||||||||||||||||||||||||
| Working capital | USD + 1.06% per year | 262 | 1 | ||||||||||||||||||||||
| Total in foreign currency | 262 | 1 | |||||||||||||||||||||||
| Total of borrowings and financing | 793 | 430 | |||||||||||||||||||||||
| Derivative financial instruments | |||||||||||||||||||||||||
| Swap contracts | CDI + 0.84% per year | (27) | (4) | ||||||||||||||||||||||
| Swap contracts | CDI + 1.35% per year | 36 | 3 | ||||||||||||||||||||||
| Total derivative financial instruments | 9 | (1) | |||||||||||||||||||||||
| Total current | 1,233 | 609 | |||||||||||||||||||||||
| 51 |
| Weighted average | 12/31/2022 | 12/31/2021 | |||||||||||||||||||||||
| Non-current | |||||||||||||||||||||||||
| Debenture and promissory notes | CDI + 1.44% per year | 10,669 | 6,329 | ||||||||||||||||||||||
| Borrowing costs | (75) | (63) | |||||||||||||||||||||||
| Total debenture and promissory notes | 10,594 | 6,266 | |||||||||||||||||||||||
| Borrowings and financing | |||||||||||||||||||||||||
| In domestic currency | |||||||||||||||||||||||||
| Working capital | TR + 9.80% | 39 | 47 | ||||||||||||||||||||||
| Working capital | CDI + 1.84% per year | 700 | 800 | ||||||||||||||||||||||
| Borrowing costs | (2) | (5) | |||||||||||||||||||||||
| Total of domestic currrency | 737 | 842 | |||||||||||||||||||||||
| In foreign currency | |||||||||||||||||||||||||
| Working capital | USD + 1.06% per year | - | 279 | ||||||||||||||||||||||
| Total of foreign currency | - | 279 | |||||||||||||||||||||||
| Total of borrowings and financing | 737 | 1,121 | |||||||||||||||||||||||
| Derivative financial instruments | |||||||||||||||||||||||||
| Swap contracts | CDI + 0.84% per year | (155) | (28) | ||||||||||||||||||||||
| Swap contracts | CDI + 1.35% per year | - | 33 | ||||||||||||||||||||||
| Total derivative financial instruments | (155) | 5 | |||||||||||||||||||||||
| Total of non-current | 11,176 | 7,392 | |||||||||||||||||||||||
| Total | 12,409 | 8,001 | |||||||||||||||||||||||
| Current asset | 27 | 4 | |||||||||||||||||||||||
| Non-current asset | 155 | 28 | |||||||||||||||||||||||
| Current liabilities | 1,260 | 613 | |||||||||||||||||||||||
| Non-current liabilities | 11,331 | 7,420 | |||||||||||||||||||||||
| 15.11.2 | Rollforward of borrowings and financing | ||||||||||||||||||||||||
| Value | |||||||||||||||||||||||||
| Balance as of December 31, 2020 | 7,763 | ||||||||||||||||||||||||
| Funding | 6,090 | ||||||||||||||||||||||||
| Interest provision | 559 | ||||||||||||||||||||||||
| Swap contracts | 39 | ||||||||||||||||||||||||
| Mark-to-market | 31 | ||||||||||||||||||||||||
| Exchange rate and monetary variation | 5 | ||||||||||||||||||||||||
| Debt modification impact IFRS 9 | (71) | ||||||||||||||||||||||||
| Borrowing costs | 64 | ||||||||||||||||||||||||
| Interest amortization | (406) | ||||||||||||||||||||||||
| Principal amortization | (6,075) | ||||||||||||||||||||||||
| Swap amortization | 2 | ||||||||||||||||||||||||
| Balance as of December 31, 2021 | 8,001 | ||||||||||||||||||||||||
| Value | |||||||||||||||||||||||||
| Balance as of December 31, 2021 | 8,001 | ||||||||||||||||||||||||
| Funding | 3,959 | ||||||||||||||||||||||||
| Interest provision | 1,436 | ||||||||||||||||||||||||
| Swap contracts | 82 | ||||||||||||||||||||||||
| Mark-to-market | (111) | ||||||||||||||||||||||||
| Exchange rate and monetary variation | (18) | ||||||||||||||||||||||||
| Borrowing costs | 26 | ||||||||||||||||||||||||
| Interest amortization | (783) | ||||||||||||||||||||||||
| Principal amortization | (61) | ||||||||||||||||||||||||
| Swap amortization | (122) | ||||||||||||||||||||||||
| Balance as of December 31, 2022 | 12,409 | ||||||||||||||||||||||||
| 15.11.3 | Schedule of non-current maturities | ||||||||||||||||||||||||
| Maturity | Value | ||||||||||||||||||||||||
| From 1 to 2 years | 2,150 | ||||||||||||||||||||||||
| From 2 to 3 years | 3,872 | ||||||||||||||||||||||||
| From 3 to 4 years | 548 | ||||||||||||||||||||||||
| From 4 to 5 years | 2,389 | ||||||||||||||||||||||||
| More than 5 years | 2,294 | ||||||||||||||||||||||||
| Total | 11,253 | ||||||||||||||||||||||||
| Borrowing cost | (77) | ||||||||||||||||||||||||
| Total | 11,176 | ||||||||||||||||||||||||
| 52 |
| 15.12 | Debenture and promissory notes | ||||||||||||||||||||||||
| Date | |||||||||||||||||||||||||
| Type | Issue amount (in thousands) | Outstanding debentures (units) | Issue | Maturity | Annual financial charges | Unit price (in Reais) | 12/31/2022 | 12/31/2021 | |||||||||||||||||
| First Issue of Promissory Notes - 3rd series | Non-preemptive right | 50 | 1 | 7/4/2019 | 7/4/2022 | CDI + 0,72% per year | - | - | 57 | ||||||||||||||||
| First Issue of Promissory Notes - 4th series | Non-preemptive right | 250 | 5 | 7/4/2019 | 7/4/2023 | CDI + 0.72% per year | 63,479,473 | 317 | 281 | ||||||||||||||||
| First Issue of Promissory Notes - 5th series | Non-preemptive right | 200 | 4 | 7/4/2019 | 7/4/2024 | CDI + 0.72% per year | 63,479,473 | 254 | 225 | ||||||||||||||||
| First Issue of Promissory Notes - 6th series | Non-preemptive right | 200 | 4 | 7/4/2019 | 7/4/2025 | CDI + 0.72% per year | 63,479,473 | 254 | 225 | ||||||||||||||||
| Second Issue of Debentures - 1st series | Non-preemptive right | 940,000 | 940,000 | 6/1/2021 | 5/20/2026 | CDI + 1.70% per year | 1,017 | 957 | 951 | ||||||||||||||||
| Second Issue of Debentures - 2nd series | Non-preemptive right | 660,000 | 660,000 | 6/1/2021 | 5/22/2028 | CDI + 1.95% per year | 1,017 | 672 | 668 | ||||||||||||||||
| Second Issue of Promissory Notes - 1st series | Non-preemptive right | 1,250,000 | 1,250,000 | 8/27/2021 | 8/27/2024 | CDI + 1.47% per year | 1,173 | 1,467 | 1,285 | ||||||||||||||||
| Second Issue of Promissory Notes - 2nd series | Non-preemptive right | 1,250,000 | 1,250,000 | 8/27/2021 | 2/27/2025 | CDI + 1.53% per year | 1,173 | 1,468 | 1,286 | ||||||||||||||||
| Third Issue of Debentures - 1st series - CRI | Non-preemptive right | 982,526 | 982,526 | 10/15/2021 | 10/16/2028 | IPCA + 5.15% per year | 1,091 | 1,072 | 1,012 | ||||||||||||||||
| Third Issue of Debentures - 2nd series - CRI | Non-preemptive right | 517,474 | 517,474 | 10/15/2021 | 10/15/2031 | IPCA + 5.27% per year | 1,092 | 565 | 533 | ||||||||||||||||
| Fourth Issue of Debentures - single series | Non-preemptive right | 2,000,000 | 2,000,000 | 1/7/2022 | 11/26/2027 | CDI + 1.75% per year | 1,014 | 2,028 | - | ||||||||||||||||
| First Issue of Commercial Paper Notes - single series | Non-preemptive right | 750,000 | 750,000 | 2/10/2022 | 2/9/2025 | CDI + 1.70% per year | 1,058 | 793 | - | ||||||||||||||||
| Fifth Issue of Debentures - single series - CRI | Non-preemptive right | 250,000 | 250,000 | 4/5/2022 | 3/28/2025 | CDI + 0.75% per year | 1,034 | 258 | - | ||||||||||||||||
| Sixth Issue of Debentures - 1st series - CRI | Non-preemptive right | 72,962 | 72,962 | 9/28/2022 | 9/11/2026 | CDI + 0.60% per year | 1,035 | 75 | - | ||||||||||||||||
| Sixth Issue of Debentures - 2nd series - CRI | Non-preemptive right | 55,245 | 55,245 | 9/28/2022 | 9/13/2027 | CDI + 0.70% per year | 1,035 | 57 | - | ||||||||||||||||
| Sixth Issue of Debentures - 3rd series - CRI | Non-preemptive right | 471,793 | 471,793 | 9/28/2022 | 9/13/2029 | IPCA + 6.70% per year | 1,027 | 485 | - | ||||||||||||||||
| Second Issue of Commercial Paper Notes - single series | Non-preemptive right | 400,000 | 400,000 | 12/26/2022 | 12/26/2025 | CDI + 0.93% per year | 1,002 | 401 | - | ||||||||||||||||
| Borrowing cost | (98) | (77) | |||||||||||||||||||||||
| 11,025 | 6,446 | ||||||||||||||||||||||||
| Current | 431 | 180 | |||||||||||||||||||||||
| Non-current | 10,594 | 6,266 | |||||||||||||||||||||||
| The Company issues debentures to strengthen its working capital, maintain its cash strategy, lengthen its debt and investment profile. The debentures issued are non-convertible into shares, do not have renegotiation clauses and do not have guarantee. | |||||||||||||||||||||||||
| 15.13 | Borrowings in foreign currencies | ||||||||||||||||||||||||
| As of December 31, 2022, the Company has borrowings in foreign currency (US dollar) to strengthen its working capital, maintain its cash strategy, and lengthen its debt and investment profile. | |||||||||||||||||||||||||
| 15.14 | Guarantees | ||||||||||||||||||||||||
| The Company has signed a promissory note for a borrowing agreement with Scotiabank in the amount of USD50 million, which can be executed after maturity and non-payment of the borrowing. | |||||||||||||||||||||||||
| 15.15 | Swap contracts | ||||||||||||||||||||||||
| The Company uses swap operations for 100% of its borrowings denominated in US dollars, fixed interest rates and IPCA, exchanging these liabilities for Real pegged to the CDI (floating) interest rates. The annual average rate of the CDI at December 31, 2022 was 12.43% (4.40% at December 31, 2021). | |||||||||||||||||||||||||
| 15.16 | Financial covenants | ||||||||||||||||||||||||
| In connection with the debentures and promissory notes issued and part of borrowing operations in foreign currency, the Company is required to maintain certain financial ratios. These ratios are calculated quarterly based on the Company’s interim financial information prepared in accordance with the accounting practices adopted in Brazil, as follows: (i) consolidated net debt / equity less than or equal to 3.00 not exceeding equity; and (ii) consolidated net debt/EBITDA ratio should be lower than or equal to 3.00. | |||||||||||||||||||||||||
| As of December 31, 2022, the Company was fulfilled all contractual obligations and in compliant with these ratios. | |||||||||||||||||||||||||
| 16 | PROVISION FOR LEGAL PROCEEDINGS | ||||||||||||||||||||||||
| Provisions are recognized when the Company has a present obligation (legal or not formalized) as a result of a past event, it is probable that an outflow of resources will be required to settle the obligation, and the obligation can be reliably estimated. The expense related to any provision is recognized in statement of operations for the year, net of any reimbursement. The Company's policy is to provide for fees on success. In the explanatory notes, the amounts involved are disclosed for cases not yet concluded and considered as possible success. | |||||||||||||||||||||||||
| In order to assess the outcome’s probability the Company considers available evidence, the hierarchy of laws, prior court decisions in similar cases and their legal significance, as well as the legal counsel’s opinion. | |||||||||||||||||||||||||
| 53 |
| The provision for legal proceedings is estimated by the Company and supported by its legal counsel and was established in an amount considered sufficient. | |||||||||||||||||||||||||
| Tax claims | Social security and labor | Civil | Total | ||||||||||||||||||||||
| Balance as of December 31, 2020 | 169 | 64 | 49 | 282 | |||||||||||||||||||||
| Additions | 39 | 44 | 8 | 91 | |||||||||||||||||||||
| Reversal | (106) | (23) | (10) | (139) | |||||||||||||||||||||
| Payments | - | (21) | (28) | (49) | |||||||||||||||||||||
| Monetary correction | 7 | 5 | 8 | 20 | |||||||||||||||||||||
| Balance as of December 31, 2021 | 109 | 69 | 27 | 205 | |||||||||||||||||||||
| Restricted deposits for legal proceedings | (65) | (45) | (2) | (112) | |||||||||||||||||||||
| Net provision of judicial deposits | 44 | 24 | 25 | 93 | |||||||||||||||||||||
| Tax claims | Social security and labor | Civil | Total | ||||||||||||||||||||||
| Balance as of December 31, 2021 | 109 | 69 | 27 | 205 | |||||||||||||||||||||
| Additions | 14 | 74 | 13 | 101 | |||||||||||||||||||||
| Reversal | (73) | (31) | (4) | (108) | |||||||||||||||||||||
| Payments | - | (33) | (16) | (49) | |||||||||||||||||||||
| Monetary correction | 5 | 7 | 4 | 16 | |||||||||||||||||||||
| Balance as of December 31, 2022 | 55 | 86 | 24 | 165 | |||||||||||||||||||||
| Restricted deposits for legal proceedings | (7) | (29) | (8) | (44) | |||||||||||||||||||||
| Net provision of judicial deposits | 48 | 57 | 16 | 121 | |||||||||||||||||||||
| 16.1 | Tax claims | ||||||||||||||||||||||||
| Tax claims are subject by law to monthly monetary adjustment, which refers to an adjustment to the provision based on indexing rates adopted by each tax jurisdiction. Both interest charges and fines, where applicable, were calculated and provisioned with respect to unpaid amounts. | |||||||||||||||||||||||||
| The Company has other tax claims, which according to its legal counsels’ analysis, were provisioned, namely: (i) discussions on the non-application of the Accident Prevention Factor (FAP); (ii) discussions with State tax authorities on ICMS tax rate calculated in electricity bills; (iii) IPI in the resale of imported products; and (iv) other matters. | |||||||||||||||||||||||||
| The amount provisioned for these matters as of December 31, 2022, is R$55 (R$109 as of December 31, 2021). | |||||||||||||||||||||||||
| 16.2 | Social security and labor | ||||||||||||||||||||||||
| The Company is a party to various labor proceedings, especially due to dismissals in the regular course of business. As of December 31, 2022, the Company recorded a provision of R$86 (R$69 as of December 31, 2021), referring to a potential risk of loss relating to labor claims. Management, with the assistance of its legal counsels, assesses these claims and records provisions for losses when reasonably estimated, considering previous experiences in relation to amounts claimed. | |||||||||||||||||||||||||
| 16.3 | Civil | ||||||||||||||||||||||||
| The Company is party to civil proceedings (indemnifications, collections, among others) that are in different procedural phases and various central courts. Management records provisions in amounts considered sufficient to cover unfavorable court decisions when its internal and external legal counsel assess the losses to be probable. | |||||||||||||||||||||||||
| Among these proceedings, we highlight the following: | |||||||||||||||||||||||||
| The Company is party to various lawsuits requesting the renewal of rental agreements and the review of the current rent paid. The Company records a provision for the difference between the amount originally paid by stores and the amounts claimed by the adverse party in the lawsuit when internal and external legal counsels consider the probability of changing the lease amount paid by the entity. As of December 31, 2022, the amount of the provision for these lawsuits is R$19 (R$21 as of December 31, 2021), for which there are no judicial deposits for legal proceedings. | |||||||||||||||||||||||||
| The Company is party to certain lawsuits relating to the fines applied by inspection bodies of direct and indirect administration of the federal government, states, and municipalities, including consumer defense bodies (PROCONs, INMETRO, and local governments). The Company, with thw assistence of its legal counsel, assesses these claims recording provisions for probable cash disbursements, according to the estimate of loss. As of December 31, 2022, the amount of provision for these lawsuits is R$5 (R$6 as of December 31, 2021). | |||||||||||||||||||||||||
| The Company’s total civil, regulatory and property claims as of December 31, 2022, is R$24 (R$27 as of December 31, 2021). | |||||||||||||||||||||||||
| 16.4 | Contingent liabilities note accrued | ||||||||||||||||||||||||
| The Company is a party to other litigations for which the risk of loss was classified by its legal counsel to be possible, therefore, not accrued, totaling an updated amount of R$2,443 as of December 31, 2022 (R$2,346 as of December 31, 2021), which are mainly related to: | |||||||||||||||||||||||||
| 54 |
| IRPJ (corporate income tax), IRRF (withholding income tax), CSLL (social contribution on net income) – The Company received several tax assessment notices relating to tax offsetting proceedings, goodwill tax amortization disallowance, disagreements regarding payments and overpayments, fines for non-compliance with ancillary obligation, among other less relevant issues. The amount involved corresponds to R$612 as of December 31, 2022 (R$478 as of December 31, 2021). | |||||||||||||||||||||||||
| COFINS and PIS (federal taxes on gross revenues) – The Company has been questioned about discrepancies in payments and overpayments; fine for non-compliance with ancillary obligation, disallowance of COFINS and PIS credits, among other issues. These proceedings are pending judgment at the administrative and judicial levels. The amount involved in these tax assessments is R$650 as of December 31, 2022 (R$609 as of December 31, 2021). | |||||||||||||||||||||||||
| ICMS (State VAT) – The Company received tax assessment notices from State tax authorities in connection with credits from: (i) purchases from suppliers considered unqualified by the registry of the State Revenue Service, and (ii) among others matters. These tax assessments amount to R$1,084 as of December 31, 2022 (R$1,128 as of December 31, 2021). These proceedings are pending final judgment at the administrative and judicial levels. | |||||||||||||||||||||||||
| ISS (services tax), IPTU (urban property tax), Fees and other – The Company has received tax assessments relating to discrepancies in payments of IPTU, fines for non-compliance with ancillary obligations, ISS – refund of advertising expenses and various fees, totaling R$16 as of December 31, 2022 (R$13 as of December 31, 2021). These proceedings are pending judgment at the administrative and judicial levels. | |||||||||||||||||||||||||
| INSS (national institute of social security) – The Company was assessed for divergences in the FGTS and Social Security form (GFIP), offsets not approved, among other matters, with possible losses of R$23 as of December 31, 2022 (R$56 as of December 31, 2021). Proceedings have been discussed in the administrative and judicial level. | |||||||||||||||||||||||||
| Other litigation – These proceedings refer to real estate lawsuits in which the Company claims the renewal of lease agreements and rents according to market prices. These lawsuits involve proceedings in civil court, as well as administrative proceedings filed by inspection bodies, such as the consumer defense body (PROCONs), the National Institute of Metrology, Standardization and Industrial Quality – INMETRO, the National Agency of Sanitary Surveillance – ANVISA, among others, totaling R$44 as of December 31, 2022 (R$47 as of December 31, 2021). | |||||||||||||||||||||||||
| Three collective proceedings were opened due to an approach to a customer, in August 2021 at the store in Limeira - SP, in which claim supposed racial issues. All were duly answered. One of them has already been extinguished by the judiciary without major effects. As of December 31, 2022, there are still two lawsuits in progress and, given the subjectivity of the matter, it is still not possible to reasonably estimate the amounts involved. A significant impact on the financial statements is not yet expected. | |||||||||||||||||||||||||
| The Company engages external legal counsel to represent it in tax matters, whose fees are contingent on the final outcome of the lawsuits. Percentages may vary according to qualitative and quantitative factors of each proceeding, as of December 31, 2022, the estimated amount, in case of success of all lawsuits, was approximately R$14 (R$15 as of December 31, 2021). | |||||||||||||||||||||||||
| 16.5 | Guarantees | ||||||||||||||||||||||||
| The Company provided bank guarantees and insurance guarantees for judicial proceedings of a civil, tax and labor nature, described below: | |||||||||||||||||||||||||
| Lawsuits | Letter of guarantees | ||||||||||||||||||||||||
| Tax | 700 | ||||||||||||||||||||||||
| Social security and labor | 91 | ||||||||||||||||||||||||
| Civil and others | 505 | ||||||||||||||||||||||||
| Total | 1,296 | ||||||||||||||||||||||||
| The cost of guarantees is aproximately 0.29% per year of the amount of the lawsuits and is recorded as a financial expense. | |||||||||||||||||||||||||
| 16.6 | Restricted deposits for legal proceedings | ||||||||||||||||||||||||
| The Company is challenging the payment of certain taxes, contributions, and labor liabilities and made judicial deposits in amounts equivalent to the final court decisions, as well as judicial deposits related to the provision for legal claims. | |||||||||||||||||||||||||
| The Company recorded amounts referring to judicial deposits in its assets as follows. | |||||||||||||||||||||||||
| Lawsuits | 12/31/2022 | 12/31/2021 | |||||||||||||||||||||||
| Tax | 12 | 65 | |||||||||||||||||||||||
| Social security and labor | 34 | 50 | |||||||||||||||||||||||
| Civil and others | 10 | 4 | |||||||||||||||||||||||
| Total | 56 | 119 | |||||||||||||||||||||||
| 17 | LEASE LIABILITIES | ||||||||||||||||||||||||
| 17.1 | Lease obligations | ||||||||||||||||||||||||
| When entering into a contract, the Company assesses whether the contract is, or contains a lease. The contract is or contains a lease if it transfers the right to control the use of the identified assets for a specified period in exchange for consideration. | |||||||||||||||||||||||||
| The Company leases equipment and commercial spaces, including stores and distribution centers, under cancellable and non-cancellable lease agreements. The terms of the contracts vary substantially between 5 and 25 years. | |||||||||||||||||||||||||
| 55 |
| The Company as lessors | |||||||||||||||||||||||||
| The Company evaluates its lease agreements in order to identify lease terms for a right to use, using the exemptions provided for contracts with a term of less than twelve months and an individual asset value below US$5 thousand (equivalent to R$26 thousand as of December, 31, 2022). | |||||||||||||||||||||||||
| The contracts are then recorded, when the lease begins, as a lease liability against right of use (notes 12 and 13), both at the present value of minimum lease payments, using the interest rate implicit in the contract, if this can be used, or an incremental borrowing rate considering loans obtained by the Company. | |||||||||||||||||||||||||
| The lease term used in the measurement corresponds to the term that the lessee is reasonably certain of exercising the option to extend the lease or not exercise the option to terminate the lease. | |||||||||||||||||||||||||
| Subsequently, payments made are segregated between financial charges and reduction of the lease liability, in order to obtain a constant interest rate on the liability balance. Financial charges are recognized as financial expense for the year. | |||||||||||||||||||||||||
| Right-of-use assets are amortized over the lease term. Capitalizations for improvements and renovations carried out in stores are amortized over their estimated useful life or the expected term of use of the assets, limited if there is evidence that the lease will not be extended. | |||||||||||||||||||||||||
| Variable rents are recognized as expenses in the years in which they are incurred. | |||||||||||||||||||||||||
| The Company as lessor | |||||||||||||||||||||||||
| Leases in which the Company does not substantially transfer all the risks and benefits of ownership of the asset are classified as operating leases. The initial direct initial costs of negotiating operating leases are added to the carrying amount of the leased asset and recognized over the term of the contractual, on the same basis as rental income. | |||||||||||||||||||||||||
| Variable rentals are recognized as income in the years in which they are earned. | |||||||||||||||||||||||||
| 17.2 | Minimum future payments and potential right of PIS and COFINS | ||||||||||||||||||||||||
| Lease contracts totaled R$8,360 as of December 31, 2022 (R$4,051 as of December 31, 2021). The minimum future payments, according to lease agreements, with the present value of minimum lease payments, are as follows: | |||||||||||||||||||||||||
| 12/31/2022 | 12/31/2021 | ||||||||||||||||||||||||
| Lease liabilities - minimum payments | |||||||||||||||||||||||||
| Less than 1 year | 435 | 244 | |||||||||||||||||||||||
| 1 to 5 years | 1,646 | 1,231 | |||||||||||||||||||||||
| More than 5 years | 6,279 | 2,576 | |||||||||||||||||||||||
| Present value of lease liabilities | 8,360 | 4,051 | |||||||||||||||||||||||
| Current | 435 | 244 | |||||||||||||||||||||||
| Non-current | 7,925 | 3,807 | |||||||||||||||||||||||
| Future financing charges | 12,318 | 4,042 | |||||||||||||||||||||||
| Gross amount of financial lease agreements | 20,678 | 8,093 | |||||||||||||||||||||||
| PIS and COFINS embedded in the present value of lease agreements | 508 | 246 | |||||||||||||||||||||||
| PIS and COFINS embedded in the gross value of lease agreements | 1,257 | 492 | |||||||||||||||||||||||
| Lease liabilities interest expense is stated in note 24. The Company´s incremental interest rate at the agreement signing date was 12.20% per year in the year ended December 31, 2022 (10.53% at December 31, 2021). | |||||||||||||||||||||||||
| If the Company adopts the projection of inflation embedded in the nominal incremental rate and converting to a present value as a calculation method, the average percentage of inflation to be project for year would be approximately 8.74% (4.42% at December 31, 2021). The average term of the agreements analyzed is 19.41 years. | |||||||||||||||||||||||||
| 17.3 | Lease liability rollforward | ||||||||||||||||||||||||
| Amount | |||||||||||||||||||||||||
| As of December 31, 2020 | 2,776 | ||||||||||||||||||||||||
| Addition - Lease | 919 | ||||||||||||||||||||||||
| Lease modification | 628 | ||||||||||||||||||||||||
| Interest provision | 302 | ||||||||||||||||||||||||
| Principal amortizations | (460) | ||||||||||||||||||||||||
| Interest amortization | (8) | ||||||||||||||||||||||||
| Write-off due to early termination of agreement | (106) | ||||||||||||||||||||||||
| As of December 31, 2021 | 4,051 | ||||||||||||||||||||||||
| Amount | |||||||||||||||||||||||||
| As of December 31, 2021 | 4,051 | ||||||||||||||||||||||||
| Addition - Lease | 3,810 | ||||||||||||||||||||||||
| Lease modification | 696 | ||||||||||||||||||||||||
| Interest provision | 781 | ||||||||||||||||||||||||
| Principal amortizations | (856) | ||||||||||||||||||||||||
| Interest amortization | (42) | ||||||||||||||||||||||||
| Write-off due to early termination of agreement | (80) | ||||||||||||||||||||||||
| As of December 31, 2022 | 8,360 | ||||||||||||||||||||||||
| 17.4 | Lease expense on variable rents, low-value, and short-term assets | ||||||||||||||||||||||||
| 12/31/2022 | 12/31/2021 | ||||||||||||||||||||||||
| (Expenses) revenues of the exercise: | |||||||||||||||||||||||||
| Variables (1% to 2% of sales) | (31) | (6) | |||||||||||||||||||||||
| Subleases (i) | 55 | 31 | |||||||||||||||||||||||
| (i) Refers mainly to the revenue from lease agreements receivable from commercial galleries. | |||||||||||||||||||||||||
| 56 |
| 18 | DEFERRED REVENUES | ||||||||||||||||||||||||
| Recognized by the Company as a liability due to anticipation of amounts received from business partners. These are recognized in the statement of operations in the exercise when the services are rendered to these business partners. | |||||||||||||||||||||||||
| 12/31/2022 | 12/31/2021 | ||||||||||||||||||||||||
| Sale and Leaseback | 3 | 68 | |||||||||||||||||||||||
| Rental of spaces in stores (i) | 259 | 233 | |||||||||||||||||||||||
| Checkstand (ii) | 45 | 41 | |||||||||||||||||||||||
| Commercial agreement - payroll (iii) | 39 | - | |||||||||||||||||||||||
| Marketing and others | 13 | 14 | |||||||||||||||||||||||
| Total | 359 | 356 | |||||||||||||||||||||||
| Current | 328 | 356 | |||||||||||||||||||||||
| Non-current | 31 | - | |||||||||||||||||||||||
| (i) Rental of backlight panels. | |||||||||||||||||||||||||
| (ii) Supplier product exhibition modules, or check stands, rental of POS displays, and front-fee anticipation with credit card operators. | |||||||||||||||||||||||||
| (iii) Commercial agreement with a financial institution for exclusivity in payroll processing. | |||||||||||||||||||||||||
| 19 | INCOME TAX AND SOCIAL CONTRIBUTION | ||||||||||||||||||||||||
| Current income tax and social contribution | |||||||||||||||||||||||||
| Current income tax and social contribution assets and liabilities are measured by the amount expected to be refunded or paid to the tax authorities. The tax rates and laws adopted to calculate tax are those effective or substantially effective, at the years ended. | |||||||||||||||||||||||||
| Income taxes in Brazil consist of Corporate Income Tax (“IRPJ”) and Social Contribution on Net Income (“CSLL”), calculated based on taxable income, at the statutory rates set forth in the legislation in force: 15% on taxable income plus an additional 10% on annual taxable income exceeding R$240 for IRPJ, and 9% for CSLL. | |||||||||||||||||||||||||
| Deferred income tax and social contribution | |||||||||||||||||||||||||
| Deferred income tax and social contribution are generated by temporary differences, at the end of the reporting exercise, between the tax bases of assets and liabilities, carrying amounts and all unused tax losses, to the extent it is probable that taxable income will occur from which temporary differences and unused tax losses can be deducted; except when deferred income tax and social contribution referring to the deductible temporary difference results from the initial recognition of an asset or liability in an operation which is not a business combination and, at the moment of operation, neither affects the accounting profit nor the tax income or loss. | |||||||||||||||||||||||||
| The carrying amount of deferred income tax and social contribution assets is reviewed at the end of each reporting period and reduced since it is no longer probable that taxable income will be sufficient to allow the use of total or part of deferred income tax and social contribution. Non-recognized deferred income tax and social contribution assets are re-assessed at the end of the reporting period and again recognized, since it is probable that future taxable income will allow the recovery of these assets. | |||||||||||||||||||||||||
| Accumulated loss carryforwards from deferred income tax and social contribution do not expire no limitation period, but their utilization, as provided for by laws, is restricted to 30% of taxable income of each year for Brazilian legal entities, and refer to their subsidiaries which have tax planning to use these balances. | |||||||||||||||||||||||||
| Deferred taxes relating to items directly recognized in shareholders’ equity are also recognized in shareholders’ equity, and not in the statement of operations. | |||||||||||||||||||||||||
| Deferred income tax and social contribution assets and liabilities are offset if there is any legal or contractual right to offset the tax assets against the income tax liabilities, and deferred assets refer to the same taxpayer entity and the same tax authority. | |||||||||||||||||||||||||
| Due to the nature and complexity of the Company’s business, differences between effective results and assumptions adopted or future alterations of these assumptions may result in future adjustments to tax revenue and expenses already recorded. The Company set up provisions, based on reasonable estimates for taxes due. The value of these provisions is based on several factors, such as the experience of previous inspections and different interpretation of tax regulation by taxpayer entity and related tax authority. These different interpretations can refer to a wide variety of issues, depending on the conditions in force at the home of the respective entity. | |||||||||||||||||||||||||
| 57 |
| 19.1 | Reconciliation of income tax and social contribution expense | ||||||||||||||||||||||||
| 12/31/2022 | 12/31/2021 | ||||||||||||||||||||||||
| Earnings before income tax and social contribution | 1,335 | 1,849 | |||||||||||||||||||||||
| Expense of income tax and social contribution, for nominal rate (34%) | (454) | (629) | |||||||||||||||||||||||
| Adjustments to reflect the effective rate | |||||||||||||||||||||||||
| Tax fines | (2) | (1) | |||||||||||||||||||||||
| Share of profits | 15 | 16 | |||||||||||||||||||||||
| Interest on equity | 17 | 22 | |||||||||||||||||||||||
| ICMS subsidy - tax incentives (i) | 248 | 241 | |||||||||||||||||||||||
| Interest selic credits | - | 81 | |||||||||||||||||||||||
| Current year credit | 64 | 11 | |||||||||||||||||||||||
| Others | (3) | 20 | |||||||||||||||||||||||
| Effective income tax | (115) | (239) | |||||||||||||||||||||||
| Income tax and social contribution for the period | |||||||||||||||||||||||||
| Current | (75) | (366) | |||||||||||||||||||||||
| Deferred | (40) | 127 | |||||||||||||||||||||||
| Income tax and social contribution expenses | (115) | (239) | |||||||||||||||||||||||
| Effective rate | 8.6% | 12.9% | |||||||||||||||||||||||
| (i) The Company has tax benefits that are characterized as investment subsidies as provided for in Complementary Law n°160/17 and Law n°12,973/14. In the year ended December 31, 2022, the Company excluded the IRPJ and CSLL calculation bases from the amount constituted in the tax incentive reserve, see note 20.5. | |||||||||||||||||||||||||
| 19.2 | Breakdown of deferred income tax and social contribution | ||||||||||||||||||||||||
| The main components of deferred income tax and social contribution in the balance sheets are the following: | |||||||||||||||||||||||||
| 12/31/2022 | 12/31/2021 | ||||||||||||||||||||||||
| Assets | Liabilities | Net | Assets | Liabilities | Net | ||||||||||||||||||||
| Deferred income tax and social contribution | |||||||||||||||||||||||||
| Tax losses | 213 | - | 213 | 167 | - | 167 | |||||||||||||||||||
| Provision for legal proceedings | 44 | - | 44 | 59 | - | 59 | |||||||||||||||||||
| Exchange rate variation | - | (28) | (28) | - | (7) | (7) | |||||||||||||||||||
| Goodwill tax amortization | - | (317) | (317) | - | (317) | (317) | |||||||||||||||||||
| Fair value adjustment | - | (29) | (29) | 1 | - | 1 | |||||||||||||||||||
| Property, plant and equipment and intangible assets | 30 | - | 30 | 33 | - | 33 | |||||||||||||||||||
| Loss with tax credits | - | (6) | (6) | - | (28) | (28) | |||||||||||||||||||
| Provision for restructuring | 12 | - | 12 | - | - | - | |||||||||||||||||||
| Provision of inventory | 26 | - | 26 | 15 | - | 15 | |||||||||||||||||||
| Borrowing costs | - | (35) | (35) | - | (30) | (30) | |||||||||||||||||||
| Lease net of right of use | 101 | - | 101 | 150 | - | 150 | |||||||||||||||||||
| Others | - | (5) | (5) | 2 | - | 2 | |||||||||||||||||||
| Gross deferred income tax and social contribution assets (liabilities) | 426 | (420) | 6 | 427 | (382) | 45 | |||||||||||||||||||
| Compensation | (420) | 420 | - | (382) | 382 | - | |||||||||||||||||||
| Net deferred income tax and social contribution assets (liabilities), net | 6 | - | 6 | 45 | - | 45 | |||||||||||||||||||
| Management has assessed the future realization of deferred tax assets, considering the projections of future taxable income, in the context of the main variables of its businesses. This assessment was based on information from the strategic planning report approved by the Company´s Board of Directors. | |||||||||||||||||||||||||
| The Company estimates the recovery of the deferred tax assets as of December 31, 2022 as follows: | |||||||||||||||||||||||||
| Years | Amounts | ||||||||||||||||||||||||
| Up to 1 year | 47 | ||||||||||||||||||||||||
| From 1 year to 2 years | 44 | ||||||||||||||||||||||||
| From 2 years to 3 years | 213 | ||||||||||||||||||||||||
| From 4 years to 5 years | 5 | ||||||||||||||||||||||||
| More than 5 years | 117 | ||||||||||||||||||||||||
| 426 | |||||||||||||||||||||||||
| 19.3 | Rollfoward of deferred income tax and social contribution | ||||||||||||||||||||||||
| 12/31/2022 | 12/31/2021 | ||||||||||||||||||||||||
| At the beginning of the year | 45 | (82) | |||||||||||||||||||||||
| Benefits in the year | (40) | 127 | |||||||||||||||||||||||
| Income tax effect | 1 | - | |||||||||||||||||||||||
| At the end of the year | 6 | 45 | |||||||||||||||||||||||
| 20 | SHAREHOLDERS’ EQUITY | ||||||||||||||||||||||||
| 20.1 | Capital stock and stock rights | ||||||||||||||||||||||||
| The capital stock, fully subscribed and paid-up as of December 31, 2022, is R$1,263 (R$788 as of December 31, 2021), represented by 1,349,165,394 common shares (1,346,674,477 as of December 31, 2021), all registered and without par value. According to the Company's bylaws, the Company’s authorized capital may be increased up to 2 billion common shares. | |||||||||||||||||||||||||
| 58 |
| On February 21, 2022, the Board of Directors approved a capital contribution in the amount of R$1, through the issuance of 239,755 common shares. | |||||||||||||||||||||||||
| At the Extraordinary General Meeting held on April 28, 2022, the Company approved, observing the authorized capital limit, a capital contribution in the amount R$464 through the capitalization of profit reserves, without issuance new shares. | |||||||||||||||||||||||||
| On May 9, 2022, the Board of Directors approved a capital contribution in the amount of R$2, through the issuance of 298,919 common shares. | |||||||||||||||||||||||||
| On July 27, 2022, the Board of Directors approved a capital contribution in the amount of R$3, through the issuance of 1,119,515 common shares. | |||||||||||||||||||||||||
| On October 20, 2022, the Board of Directors approved a capital contribution in the amount of R$3, through the issuance of 650,808 common shares. | |||||||||||||||||||||||||
| On December 6, 2022, the Board of Directors approved a capital contribution in the amount of R$2, through the issuance of 181,920 common shares. | |||||||||||||||||||||||||
| The Company's shareholding structure is as follows: | |||||||||||||||||||||||||
| 12/31/2022 | 12/31/2021 | ||||||||||||||||||||||||
| Number of shares | Participation | Number of shares | Participation | ||||||||||||||||||||||
| Controlling shareholders | 411,582,865 | 30.51% | 557,857,105 | 41.42% | |||||||||||||||||||||
| Outstanding shares | 937,582,529 | 69.49% | 788,817,372 | 58.58% | |||||||||||||||||||||
| Total | 1,349,165,394 | 100.00% | 1,346,674,477 | 100.00% | |||||||||||||||||||||
| 20.2 | Distribution of dividends and interest on equity | ||||||||||||||||||||||||
| Management proposed dividends to be distributed, considering the anticipation of interest on own equity to its shareholders, calculated as follows: | |||||||||||||||||||||||||
| 12/31/2022 | 12/31/2021 | ||||||||||||||||||||||||
| Net income for the year | 1,220 | 1,610 | |||||||||||||||||||||||
| Tax incentive reserve (note 20.5) | 753 | 709 | |||||||||||||||||||||||
| Base for legal reserve | 467 | 901 | |||||||||||||||||||||||
| % Legal reserve | 5% | 5% | |||||||||||||||||||||||
| Legal reserve for the year (note 20.3) | 23 | 5 | |||||||||||||||||||||||
| Base for dividends | 444 | 896 | |||||||||||||||||||||||
| Minimum mandatory dividends - 25% | 111 | 224 | |||||||||||||||||||||||
| Interest on own equity payble – net (i) | (43) | - | |||||||||||||||||||||||
| Interest on own equity payment – net | - | (56) | |||||||||||||||||||||||
| Dividends proposed | 68 | 168 | |||||||||||||||||||||||
| (i) At a meeting of the Board of Directors held on December 23, 2022, the advance payment of interest on equity in the gross amount of R$50 was approved, on which the withholding tax was deducted in the amount of R$7, corresponding to the net amount of R$43 (R$56 as of December, 2021). The effective payment will take place on February 17, 2023. | |||||||||||||||||||||||||
| Shareholders are entitled to receive a mandatory minimum annual dividend equivalent to 25% of the net income for each social year, adjusted in accordance with the law, offsetting in annual dividends interest on own capital and dividends distributed in the year. | |||||||||||||||||||||||||
| The net profits or losses will be allocated by the shareholders, and their distribution, if any, will be made in the proportion established by them at the time. | |||||||||||||||||||||||||
| 20.3 | Profit reserve | ||||||||||||||||||||||||
| Legal reserve: this is recorded by appropriating 5% of the net income of each fiscal year, observing the 20% limit of capital. As of December 31, 2022, the amount is R$180 (R$157 as of December 31, 2021). | |||||||||||||||||||||||||
| The legal reserve in the amount of R$23 as of December 31, 2022 (R$5 as of December 31, 2021) was constituted respecting the limit of 20% of the Company's capital stock, as established by article 193 of Law n°6,404/76. | |||||||||||||||||||||||||
| 59 |
| 12/31/2022 | 12/31/2021 | ||||||||||||||||||||||||
| Net income for the year | 1,220 | 1,610 | |||||||||||||||||||||||
| Tax incentive reserve | 753 | 709 | |||||||||||||||||||||||
| Base for legal reserve | 467 | 901 | |||||||||||||||||||||||
| % Legal reserve | 5% | 5% | |||||||||||||||||||||||
| Legal reserve for the year | 23 | 5 | |||||||||||||||||||||||
| 20.4 | Expansion Reserve | ||||||||||||||||||||||||
| At the AGM held on April 28, 2022 the constitution of the expansion reserve in the amount of R$632 was approved, against the profit reserve of the year 2021. | |||||||||||||||||||||||||
| 20.5 | Tax incentive granted | ||||||||||||||||||||||||
| Tax incentives granted by the States are considered investment subsidies, which are deductible for the calculation of income tax and social contributions. Therefore, for the year ended of December 31, 2022, the Company allocated the amount of R$753 (R$709 as of December 31,2021) to the tax incentive reserve. | |||||||||||||||||||||||||
| As provided for in article 30 of Law n°12,973/14, the tax incentive reserve may be used to absorb losses, provided that the other profit reserves have already been fully absorbed, except for the legal reserve, or for capital increase. Within the same legal provision, the tax incentive reserve and the legal reserve are not part of the calculation basis for the minimum mandatory dividend, and the Company must subject it to taxation in case of distribution. | |||||||||||||||||||||||||
| 20.6 | Share-based payment | ||||||||||||||||||||||||
| 20.6.1 | Recognized Options Granted | ||||||||||||||||||||||||
| The expenses associated to the Company’s executives’ share-based payments in accordance with CPC 10 (R1) / IFRS 2 – Share-based payment, are regognized "Stock options granted". | |||||||||||||||||||||||||
| The Company's employees and executives or of entities of their economic group may receive payment based on shares, when employees provide services in exchange for equity instruments (“transactions settled with shares”). | |||||||||||||||||||||||||
| The Company measures the transaction costs of employees eligible for share based compensation, based on the fair value of equity instruments on the grant date. Estimating the fair value of share-based payment transactions requires a definition of the most appropriate valuation model, which depends on the terms and conditions of the grant. This estimate also requires a definition of the most appropriate information for the valuation model, including the stock option life expectancy, volatility and dividend return, as well as the preparation of corresponding assumptions. | |||||||||||||||||||||||||
| The cost of operations settled with shares is recognized as an expense for the year, together with a corresponding increase in shareholders' equity, during the year in which the performance and / or service provision conditions are met. Accumulated expenses recognized in relation to equity instruments on each base date, up to the acquisition date, reflect the extent to which the acquisition period has expired and the best estimate of the Company of the number of equity instruments that will be acquired. | |||||||||||||||||||||||||
| The expense or reversal of expenses for each year represents the movement in accumulated expenses recognized at the beginning and end of the year. Expenses related to services that have not completed their acquisition period are not recognized, except in the case of operations settled with shares in which the acquisition depends on a market condition or non-acquisition of rights, which are treated as acquired, regardless of whether the market condition or non-acquisition of rights is satisfied or not, provided that all other performance and / or service provision conditions are met. | |||||||||||||||||||||||||
| When an equity instrument is modified, the minimum expense recognized is the expense that would have been incurred if the terms had not been modified. An additional expense is recognized in the event of a change the total fair value of the share-based payment transaction or that otherwise benefits the employee, as measured on the date of the change. | |||||||||||||||||||||||||
| In case of cancellation of an equity instrument, it is treated as if it were fully acquired on the date of cancellation, and any expenses not yet recognized, referring to the premium, are recognized immediately in the income for the year. This includes any premium whose conditions of non-acquisition under the control of the Company or the employee are not met. However, if the canceled plan is replaced by a new plan and substitute grants are generated, on the date it is granted, the canceled grant and the new plan will be treated as if they were a modification of the original grant, as described in the previous paragraph. All cancellations for transactions settled with shares are treated in the same way. | |||||||||||||||||||||||||
| The dilutive effect of outstanding options is reflected as an additional dilution of shares in the calculation of diluted earnings per share. | |||||||||||||||||||||||||
| The following describes the stock option plan as of December 31, 2022. | |||||||||||||||||||||||||
| 60 |
| Company's compensation plan | |||||||||||||||||||||||||
| The Company's compensation plan ("Compensation Plan") is managed by Company Board of Directors, which delegated to the Human Resources Committee the attributions of granting options and advising on the management of the Compensation Plan (“Committee”). | |||||||||||||||||||||||||
| The members of the Committee will meet to grant the granting of options from the compensation plan series and whenever there are questions raised regarding the compensation plan. Each series of the granting of stock options will receive the letter "B" followed by a number. For the period ended December 31, 2022, the options granted in series B8 and B9 of the compensation plan were in effect. | |||||||||||||||||||||||||
| The options granted to a participant will not be exercisable for a period of 36 (thirty six) months from the date of grant ("grace period"), except with formal authorization by the Company, and may only be exercised in the period beginning on the first day of the 37 (thirty-seven) month from the date of grant, and ends on the last day of the 42 (forty-second) month from the date of grant ("exercise period"). | |||||||||||||||||||||||||
| The participants may exercise their total purchase options or in part, in one or more times, if for each year, the option exercise term is submitted during the exercise period. | |||||||||||||||||||||||||
| The exercise price of each stock option granted under the Compensation Plan should correspond to R$0.01 ("exercise price"). | |||||||||||||||||||||||||
| The exercise price of the options shall be paid in full local currency by check or wire transfer available to the bank account held by the Company, in the tenth (10th) day preceding the date of acquisition of the shares. | |||||||||||||||||||||||||
| The Company withhold any applicable tax under Brazilian tax law, less the number of shares delivered to the participant amount equivalent to taxes withheld. | |||||||||||||||||||||||||
| Company's option plan | |||||||||||||||||||||||||
| The Company's option plan ("Option Plan") will be managed by Company Board of Directors, which delegated to the Committee the functions of granting options and advising on the administration of the Option Plan. | |||||||||||||||||||||||||
| The members of the Committee will meet for the granting of the granting of the options of the option plan series and whenever there are questions raised regarding the option plan. Each series of call option grants will receive the letter “C” followed by a number. For the year ended December 31, 2022, options granted in series C8 and C9 o the option plan were in effect. | |||||||||||||||||||||||||
| For each serie of stock options granted under the option plan, the exercise price of each stock option shall be equivalent to 80% of the closing price of the average of the Company's preferred shares traded in the prior twenty (20) days in B3 prior to the date of the Committee meeting that decides upon the granting of the options that series ("exercise price"). | |||||||||||||||||||||||||
| Options granted to a participant shall be exercisable for a period of 36 (thirty six) months from the date of grant ("grace period"), and may only be exercised in the period beginning on the first day of the 37 (thirty-seventh) months as from the grant date, and ends on the last day of the 42 (forty-second) month as of the grant date ("exercise period"), provided the exceptions included in the compensation plan. | |||||||||||||||||||||||||
| The participant may exercise their total purchase options or in part, in one or more times, if for each year the option exercise agreement is submitted during the exercise period. | |||||||||||||||||||||||||
| The exercise price of the options shall be paid in full local currency by check or wire transfer available to the bank account held by the Company, provided that the payment deadline will always be the tenth (10th) day preceding the date to acquire the shares. | |||||||||||||||||||||||||
| Information relating to the Company's option plan and compensation plan is summarized below: | |||||||||||||||||||||||||
| 12/31/2022 | |||||||||||||||||||||||||
| Number of shares (in thousands) | |||||||||||||||||||||||||
| Granted series | Grant date | 1st exercise date | Strike price on the grant date (in reais) | Grantees | Exercised | Cancelled | Current | ||||||||||||||||||
| B8 | 5/31/2021 | 6/1/2024 | 0.01 | 363 | (20) | (29) | 314 | ||||||||||||||||||
| C8 | 5/31/2021 | 6/1/2024 | 13.39 | 363 | (20) | (29) | 314 | ||||||||||||||||||
| B9 | 5/31/2022 | 6/1/2025 | 0.01 | 2,163 | (32) | - | 2,131 | ||||||||||||||||||
| C9 | 5/31/2022 | 6/1/2025 | 12.53 | 1,924 | (32) | - | 1,892 | ||||||||||||||||||
| 4,813 | (104) | (58) | 4,651 | ||||||||||||||||||||||
| 61 |
| 20.6.2 | Consolidated information of Company's share-based payment plans | ||||||||||||||||||||||||
| According to the terms of the series plans, each option offers its beneficiary the right to buy a share of the Company. In both plans, the grace period is 36 months, always measured from the date on which the Board of Directors approved the issue of the respective series of options. The stock options may be exercised by their beneficiaries within 6 months after the end of the grace period of the respective grant date. The condition for the options to be exercisable (vested) is for the beneficiary to remain as an employee of the Company. The plans differ exclusively in the exercise price of the options and in the existence or not of a restriction period for the sale of the shares acquired in the exercise of the option. | |||||||||||||||||||||||||
| According to the plans, the options granted in each of the series may represent a maximum of 2% of the total shares issued by the Company. | |||||||||||||||||||||||||
| The table below shows the maximum percentage of dilution to which current shareholders could eventually be subject to in the event that all options granted are exercised until December 31, 2022: | |||||||||||||||||||||||||
| 12/31/2022 | |||||||||||||||||||||||||
| (in thousands) | |||||||||||||||||||||||||
| Number of shares | 1,349,165 | ||||||||||||||||||||||||
| Balance of effective stock options granted | 4,651 | ||||||||||||||||||||||||
| Maximum percentage of dilution | 0.34% | ||||||||||||||||||||||||
| The fair value of each option granted is estimated on the grant date, by using the options pricing model “Black&Scholes” taking into account the following assumptions for B8, C8, B9 and C9 series: (a) expectation of dividends of 1.28% (series 8) and 1.20% (series 9); (b) expectation of volatility nearly 37.06% (series 8) and 37.29% (series 9); (c) the weighted average interest rate without risk of 7.66% (series 8) and 12.18% (series 9), and (d) exit rate of approximately 8.00% in both series. | |||||||||||||||||||||||||
| The expectation of remaining average life of the series outstanding as of December 31, 2022, is 17 months (series 8) and 29 months (series 9). The weighted average fair value of options granted as of December 31, 2022 was R$17.21 and R$7.69 (B8 and C8 respectively), and R$15.27 and R$7.35 (B9 and C9 respectively). | |||||||||||||||||||||||||
| Shares | Weighted average of exercise price | Weighted average of remaining contractual term | |||||||||||||||||||||||
| in thousands | R$ | ||||||||||||||||||||||||
| At December 31, 2021 | 668 | 6.70 | 2.42 | ||||||||||||||||||||||
| At December 31, 2022 | |||||||||||||||||||||||||
| Granted during the year | 4,087 | 5.90 | |||||||||||||||||||||||
| Exercised during the year | (104) | 6.01 | |||||||||||||||||||||||
| Outstanding at the end of the year | 4,651 | 6.01 | 2.28 | ||||||||||||||||||||||
| Total to be exercised December 31, 2022 | 4,651 | 6.01 | 2.28 | ||||||||||||||||||||||
| The amount recorded in the statement of operations for the year December 31, 2022 were R$14 (R$2 as of December 31, 2021). | |||||||||||||||||||||||||
| 21 | NET OPERATING REVENUE | ||||||||||||||||||||||||
| CPC 47 / IFRS 15 establishes a comprehensive framework to determine when and for how much revenue form contracts with customers should be recognized. | |||||||||||||||||||||||||
| Revenue | |||||||||||||||||||||||||
| a) Sale of goods | |||||||||||||||||||||||||
| Revenues from the sale of goods are recognized at their fair value when control over the products is transferred to the customer, the Company no longer has control or responsibility for the goods sold and the economic benefits generated for the Company are probable, which occurs substantially upon delivery of products to customers in stores, when the Company's performance obligation is satisfied. Revenues are not recognized if their realization is uncertain. | |||||||||||||||||||||||||
| b) Revenue from services rendered | |||||||||||||||||||||||||
| The revenues earned are stated on a net basis and recognized in the statement of operations when it is probable that economic benefits will flow to the Company, and their amounts can be reliably measured. | |||||||||||||||||||||||||
| 12/31/2022 | 12/31/2021 | ||||||||||||||||||||||||
| Gross operating revenue | |||||||||||||||||||||||||
| Goods | 59,510 | 45,550 | |||||||||||||||||||||||
| Services rendered and others | 174 | 111 | |||||||||||||||||||||||
| 59,684 | 45,661 | ||||||||||||||||||||||||
| (-) Revenue deductions | |||||||||||||||||||||||||
| Returns and sales cancellation | (109) | (76) | |||||||||||||||||||||||
| Taxes | (5,055) | (3,687) | |||||||||||||||||||||||
| (5,164) | (3,763) | ||||||||||||||||||||||||
| Net operating revenue | 54,520 | 41,898 | |||||||||||||||||||||||
| 62 |
| 22 | EXPENSES BY NATURE | ||||||||||||||||||||||||
| Cost of sales | |||||||||||||||||||||||||
| Comprise the acquisition cost of inventory net of discounts and considerations received from suppliers and logistics costs. | |||||||||||||||||||||||||
| Commercial agreement received from suppliers is measured based on contracts and agreements signed between the parties. | |||||||||||||||||||||||||
| The cost of sales includes the cost of logistics operations managed or outsourced by the Company, comprising the storage costs, handling and freight incurred until good is available for sale. Transportation costs are included in the acquisition costs. | |||||||||||||||||||||||||
| Selling expenses | |||||||||||||||||||||||||
| Comprises all stores expenses, such as payroll, marketing, occupation, maintenance, and expenses related to credit card companies, among others. | |||||||||||||||||||||||||
| Marketing expenses refer to advertising campaigns. The Company’s principal means of communication are: radio, television, newspapers, and magazines, and the amounts of its commercial agreement are recognized in the statement of operations upon realization. | |||||||||||||||||||||||||
| General and administrative expenses | |||||||||||||||||||||||||
| Corresponds to indirect expenses and the cost of corporate units, including procurement and supplies, information technology, and financial activities. | |||||||||||||||||||||||||
| 12/31/2022 | 12/31/2021 | ||||||||||||||||||||||||
| Inventory cost | (44,809) | (34,163) | |||||||||||||||||||||||
| Personnel expenses | (3,358) | (2,512) | |||||||||||||||||||||||
| Outsourced services | (264) | (251) | |||||||||||||||||||||||
| Selling expenses | (875) | (646) | |||||||||||||||||||||||
| Functional expenses | (883) | (664) | |||||||||||||||||||||||
| Other expenses | (534) | (439) | |||||||||||||||||||||||
| (50,723) | (38,675) | ||||||||||||||||||||||||
| Cost of sales | (45,557) | (34,753) | |||||||||||||||||||||||
| Selling expenses | (4,379) | (3,334) | |||||||||||||||||||||||
| General and administrative expenses | (787) | (588) | |||||||||||||||||||||||
| (50,723) | (38,675) | ||||||||||||||||||||||||
| 23 | OTHER OPERATING EXPENSES, NET | ||||||||||||||||||||||||
| Other operating revenue and expenses correspond to the effects of significant or non-recurring events during the fiscal year not classified into the definition of other items of the statement of operations. | |||||||||||||||||||||||||
| 12/31/2022 | 12/31/2021 | ||||||||||||||||||||||||
| Result with property, plant and equipment and lease | (34) | 12 | |||||||||||||||||||||||
| (Provision) reversal for legal proceedings | (19) | 9 | |||||||||||||||||||||||
| Reestructuring expenses and others | (33) | (74) | |||||||||||||||||||||||
| Indemnity assest | 14 | - | |||||||||||||||||||||||
| Total | (72) | (53) | |||||||||||||||||||||||
| 24 | NET FINANCIAL RESULT | ||||||||||||||||||||||||
| Financial revenues includes income generated by cash and cash equivalents, court deposits, and gains relating to the measurement of derivatives by fair value. | |||||||||||||||||||||||||
| Interest income is recorded for all financial assets measured by amortized cost, adopting the effective interest rate, which corresponds to the discount rate of payments or future cash receivables over the estimated useful life of financial instrument – or shorter period, where applicable – to the net carrying amount of financial asset or liability. | |||||||||||||||||||||||||
| Financial expenses substantially include all expenses generated by net debt and cost of sales of receivables during the fiscal year, the losses relating to the measurement of derivatives by fair value, the losses with sales of financial assets, financial charges over litigations, taxes, and interest expenses over financial leasing. | |||||||||||||||||||||||||
| 12/31/2022 | 12/31/2021 | ||||||||||||||||||||||||
| Financial revenues | |||||||||||||||||||||||||
| Cash and cash equivalents interest | 152 | 87 | |||||||||||||||||||||||
| Monetary correction (assets) | 227 | 93 | |||||||||||||||||||||||
| Other financial revenues | 15 | 8 | |||||||||||||||||||||||
| Total financial revenues | 394 | 188 | |||||||||||||||||||||||
| Financial expenses | |||||||||||||||||||||||||
| Cost of debt | (896) | (543) | |||||||||||||||||||||||
| Cost and discount of receivables | (97) | (51) | |||||||||||||||||||||||
| Monetary correction (liabilities) | (401) | (13) | |||||||||||||||||||||||
| Interest on leasing liabilities | (509) | (292) | |||||||||||||||||||||||
| Other financial expenses | (6) | (19) | |||||||||||||||||||||||
| Total financial expenses | (1,909) | (918) | |||||||||||||||||||||||
| Total | (1,515) | (730) | |||||||||||||||||||||||
| 63 |
| 25 | Earnings per share | ||||||||||||||||||||||||
| The Company calculates earnings per share by dividing the net income for the exercise, relating to each class of shares, by the total number of common shares outstanding in the exercise. | |||||||||||||||||||||||||
| Diluted earnings per share are calculated by dividing the net income attributed to holders of common shares (after adjusting for interest on preferred shares and on convertible securities, in both cases net of taxes) by the weighted average amount of common shares available during the year plus the weighted average number of common shares that would be issued upon conversion of all potential diluted common shares into common shares. | |||||||||||||||||||||||||
| The table below presents the determination of the net income for the exercise available to holders of common shares outstanding to calculate the basic earnings and diluted earnings per share in each exercise presented: | |||||||||||||||||||||||||
| 12/31/2022 | 12/31/2021 | ||||||||||||||||||||||||
| Basic number: | |||||||||||||||||||||||||
| Allocated basic earnings and not distributed | 1,220 | 1,610 | |||||||||||||||||||||||
| Net income allocated available to common shareholders | 1,220 | 1,610 | |||||||||||||||||||||||
| Basic denominator (millions of shares) | |||||||||||||||||||||||||
| Weighted average of the number of shares | 1,348 | 1,344 | |||||||||||||||||||||||
| Basic earnings per million shares (R$) | 0.905322 | 1.19802 | |||||||||||||||||||||||
| 12/31/2022 | 12/31/2021 | ||||||||||||||||||||||||
| Diluted number: | |||||||||||||||||||||||||
| Allocated diluted earnings and not distributed | 1,220 | 1,610 | |||||||||||||||||||||||
| Net income allocated available to common shareholders | 1,220 | 1,610 | |||||||||||||||||||||||
| Diluted denominator (millions of shares) | |||||||||||||||||||||||||
| Weighted average of the number of shares | 1,348 | 1,344 | |||||||||||||||||||||||
| Weighted average of stock options plan | 6 | 11 | |||||||||||||||||||||||
| Diluted weighted average of shares | 1,353 | 1,355 | |||||||||||||||||||||||
| Diluted earnings per million shares (R$) | 0.901589 | 1.18852 | |||||||||||||||||||||||
| 26 | Non-cash transactions | ||||||||||||||||||||||||
| The Company had transactions that did not represent cash disbursements, and, therefore, these were not presented in the Statement of Cash Flows, as folows: | |||||||||||||||||||||||||
| • Acquisition of intangibles with related parties and suppliers, in notes 10.1, 13.3 and 14.3; | |||||||||||||||||||||||||
| • Acquisition of property, plant and equipment not yet paid, in note 12.5; | |||||||||||||||||||||||||
| • Advance related to the sale of properties, recorded in assets held for sale,in note 18; | |||||||||||||||||||||||||
| • Decision about interest on own equity to its shareholders, as in note 20.2; and | |||||||||||||||||||||||||
| • Acquisition of assets held for sale with related parties, in note 27.1. | |||||||||||||||||||||||||
| 27 | ASSETS HELD FOR SALE | ||||||||||||||||||||||||
| Non-current assets and groups of assets are classified as held for sale if the carrying amount will be recovered through a sale transaction, rather than continued use. This condition is considered to be met only when the asset is available for immediate sale in its present condition, subject only to terms that are customary for sales of such assets and their sale is highly probable. Management must be committed to effecting the sale, and the estimated time for the sale to be completed must be within one year. | |||||||||||||||||||||||||
| Non-current assets classified as held for sale are measured at the lower of carrying amount and market value less cost of sale. | |||||||||||||||||||||||||
| 12/31/2022 | 12/31/2021 | ||||||||||||||||||||||||
| Sale and leaseback | - | 147 | |||||||||||||||||||||||
| Extra Hiper stores (i) | 95 | 403 | |||||||||||||||||||||||
| 95 | 150 | ||||||||||||||||||||||||
| (i) As of December 31, 2022, corresponds to 1 property owned by GPA, which is sold to the real estate investment fund Barzel Properties, see note 1.1. | |||||||||||||||||||||||||
| 27.1 | Additions to assets held for sale for cash flow presentation purpose | ||||||||||||||||||||||||
| 12/31/2022 | |||||||||||||||||||||||||
| Additions | 797 | ||||||||||||||||||||||||
Financial of assets - Additions | (797) | ||||||||||||||||||||||||
| Financial of assets - Payments | 250 | ||||||||||||||||||||||||
| Total | 250 | ||||||||||||||||||||||||
| 28 | SUBSEQUENT EVENTS | ||||||||||||||||||||||||
| 28.1 | Capital contribution | ||||||||||||||||||||||||
| At the meeting of the Board of Directors held on February 15, 2023, the Company approved, observing the authorized capital limit, the capital contribution in the amount of R$1 through the issuance of 59,870 common shares. | |||||||||||||||||||||||||
| 64 |
(FREE TRANSLATION INTO ENGLISH FROM THE ORIGINAL PREVIOUSLY ISSUED IN PORTUGUESE) Standard Financial Statement – December 31,2022 – SENDAS DISTRIBUIDORA S.A.
|
Opinions and Statements / Opinion of the Audit Committee or Equivalent Body
The Company's Fiscal Council, complying with statutory and legal duties, examined the Financial Statements for the fiscal year ended December 31, 2022 and issued a favorable opinion for its approval by the Company's Board of Directors.
Rio de Janeiro, February 15th, 2023
Tufi Daher – Chairman
Rafael Morsch – Member
Marcílio Amato - Member
| 65 |
(FREE TRANSLATION INTO ENGLISH FROM THE ORIGINAL PREVIOUSLY ISSUED IN PORTUGUESE) Standard Financial Statement – December 31,2022 – SENDAS DISTRIBUIDORA S.A.
|
AUDIT COMMITTEE REPORT - 2022
The Audit Committee (COAUD) of Sendas Distribuidora SA (Company) is a permanent body, established, in compliance with the provisions of the Company's Bylaws.
COAUD reports to the Board of Directors, with autonomy and independence in the exercise of its functions, acting as an auxiliary, consultative and advisory body, without decision-making power or executive attributions. The functions and responsibilities of the COAUD are carried out in compliance with the applicable regulatory and statutory attributions defined in its Internal Rules of Procedure.
It is incumbent upon COAUD, basically, to assess the quality and integrity of the Company's financial statements, compliance with legal and regulatory requirements, the performance, independence and quality of the work of the independent audit, supervise internal audit activities and assess the effectiveness of internal controls and of the Company's risk management, as well as the other activities provided for in the CVM regulation and in its Regulations. The assessments and performance of COAUD are based on its own analysis and on information received from the Company and its auditors, Deloitte Touche Tohmatsu (Deloitte).
COAUD directed its work in reviewing the quarterly information and annual financial statements, and discussed, with management and DTT, the most relevant topics, such as the main audit matters and internal control systems.
The COAUD monitored, analyzed and evaluated, as main themes, the Company's work regarding: (i) implementation and effectiveness of internal control practices and compliance with the main requirements of .the Sarbanes Oxley Act; (ii) risk assessment and provisioning or disclosure of tax and other contingencies, and respective guarantees and escrow deposits; (iii) Internal Audit work program and reports; (iv) performance of the Company's Risk Management practices; and (v) Compliance practices.
Conclusion
COAUD, observing the scope of its activities, and considering the unqualified report of the independent auditors, understands that the Management Report and Financial Statements for the year ended December 31, 2022 are in a position to be approved by the Board of Directors of Sendas Distribuidora SA.
São Paulo, February 15th 2023
L. Nelson Carvalho Coordenador
| José Flávio Ramos
| ||
| Heraldo Oliveira | Christophe Hidalgo | Philipe Alarcon | |
| 66 |
(FREE TRANSLATION INTO ENGLISH FROM THE ORIGINAL PREVIOUSLY ISSUED IN PORTUGUESE) Standard Financial Statement – December 31,2022 – SENDAS DISTRIBUIDORA S.A.
|
MANAGEMENT STATEMENT
By means of this instrument, the officers below of SENDAS DISTRIBUIDORA S.A., enrolled with the CNPJ/ME under No. 06.057.223/0001-71, with head offices at Avenida Ayrton Senna, No. 6.000, Lote 2, Pal 48959, Anexo A, Jacarepaguá, CEP 22775-005, in the City of Rio de Janeiro, State of Rio de Janeiro (the “Company”), state that they:
| (i) | have reviewed, discussed and agreed with the Independent Registered Public Accounting Firm Report over the Company’s financial statements for the year ended December 31st, 2022; and |
| (ii) | have reviewed, discussed and agreed with the Company’s financial statements related to the year ended December 31st, 2022. |
Rio de Janeiro, February 15th, 2023.
Belmiro de Figueiredo Gomes
Chief Executive Officer
Daniela Sabbag Papa
Chief Financial and Administrative Officer
Gabrielle Castelo Branco Helú
Chief Investor Relations Officer
| 67 |
SIGNATURES
Pursuant to the requirements of the Securities Exchange Act of 1934, the registrant has duly caused this report to be signed on its behalf by the undersigned, thereunto duly authorized.
Date: February 15, 2023
Sendas Distribuidora S.A.
By: /s/ Daniela Sabbag Papa
Name: Daniela Sabbag Papa
Title: Chief Financial Officer
By: /s/ Gabrielle Helú
Name: Gabrielle Helú
Title: Investor Relations Officer
FORWARD-LOOKING STATEMENTS
This press release may contain forward-looking statements. These statements are statements that are not historical facts, and are based on management's current view and estimates of future economic circumstances, industry conditions, company performance and financial results. The words "anticipates", "believes", "estimates", "expects", "plans" and similar expressions, as they relate to the company, are intended to identify forward-looking statements. Statements regarding the declaration or payment of dividends, the implementation of principal operating and financing strategies and capital expenditure plans, the direction of future operations and the factors or trends affecting financial condition, liquidity or results of operations are examples of forward-looking statements. Such statements reflect the current views of management and are subject to a number of risks and uncertainties. There is no guarantee that the expected events, trends or results will actually occur. The statements are based on many assumptions and factors, including general economic and market conditions, industry conditions, and operating factors. Any changes in such assumptions or factors could cause actual results to differ materially from current expectations.