
© 2021 MERIDIANLINK, INC. ALL RIGHTS RESERVED. CONFIDENTIAL Transforming financial services for the better. © 2021 MERIDIANLINK, INC. ALL RIGHTS RESERVED. 2021 Third Quarter Review November 2021 Exhibit 99.3
© 2021 MERIDIANLINK, INC. ALL RIGHTS RESERVED. 2 Disclaimer Information in this presentation and the accompanying oral presentation, including any statements regarding MeridianLink’s customer data and other metrics, is based on data and analyses from various sources as of December 31, 2020, unless otherwise indicated. Information in this presentation and the accompanying oral presentation contain forward-looking statements within the meaning of the federal securities laws, which statements involve substantial risks and uncertainties. Forward- looking statements generally relate to future events or our future financial or operating performance. All statements other than statements of historical fact included in this presentation and the accompanying oral presentation, including statements regarding, and guidance with respect to, our strategy, future operations, financial position, projected costs, projected long-term operating model, our preliminary and unaudited operating results for the three months ended September 30, 2021, prospects, market size and growth opportunities, competitive position, strategic initiatives, development or delivery of new or enhanced solutions, technological capabilities, plans and objectives of management are forward-looking statements. In some cases, you can identify forward-looking statements because they contain words such as “may,” “should,” “expects,” “plans,” “anticipates,” “could,” “intends,” “target,” “projects,” “contemplates,” “believes,” “estimates,” “predicts,” “potential” or “continue” or the negative of these words or other similar terms or expressions that concern our expectations, strategy, plans or intentions. These forward-looking statements are based on management’s current beliefs, based on currently available information, as to the outcome and timing of future events and are subject to risks and uncertainties that could cause actual performance or results to differ materially from those expressed in or suggested by the forward-looking statements. In light of these risks and uncertainties, the forward-looking events and circumstances discussed in this presentation may not occur and actual results could differ materially from those anticipated or implied in the forward-looking statements. These risks and uncertainties include our ability to obtain, retain and expand our customers; our ability to attract new customers; our future financial performance, including trends in revenue, costs of revenue, gross profit or gross margin, operating expenses, and number of customers; our ability to achieve or maintain profitability; the demand for our products or for our solutions; our ability to compete successfully in competitive markets; our ability to respond to rapid technological changes; and our ability to continue to innovate and develop new products; as well as those set forth under the caption “Risk Factors” in our final prospectus filed on July 28, 2021, and our other SEC filings. Additional information will also be set forth in Item 1A. Risk Factors, or elsewhere, in our Quarterly Report on Form 10-Q for the quarter ended September 30, 2021. We undertake no obligation to update any forward-looking statements made in this presentation to reflect events or circumstances after the date of this presentation or to reflect new information or the occurrence of unanticipated events, except as required by law. We may not actually achieve the plans, intentions or expectations disclosed in our forward-looking statements, and you should not place undue reliance on our forward-looking statements. This presentation contains statistical data, estimates and forecasts that are based on independent industry publications or other publicly available information, as well as other information based on our internal sources. This information involves many assumptions and limitations, and you are cautioned not to give undue weight to these estimates. We have not independently verified the accuracy or completeness of the data contained in these industry publications and other publicly available information. Accordingly, we make no representations as to the accuracy or completeness of that data nor do we undertake to update such data after the date of this presentation. The trademarks included herein are the property of the owners thereof and are used for reference purposes only. Such use should not be construed as an endorsement of the platform and products of MeridianLink or this proposed offering.
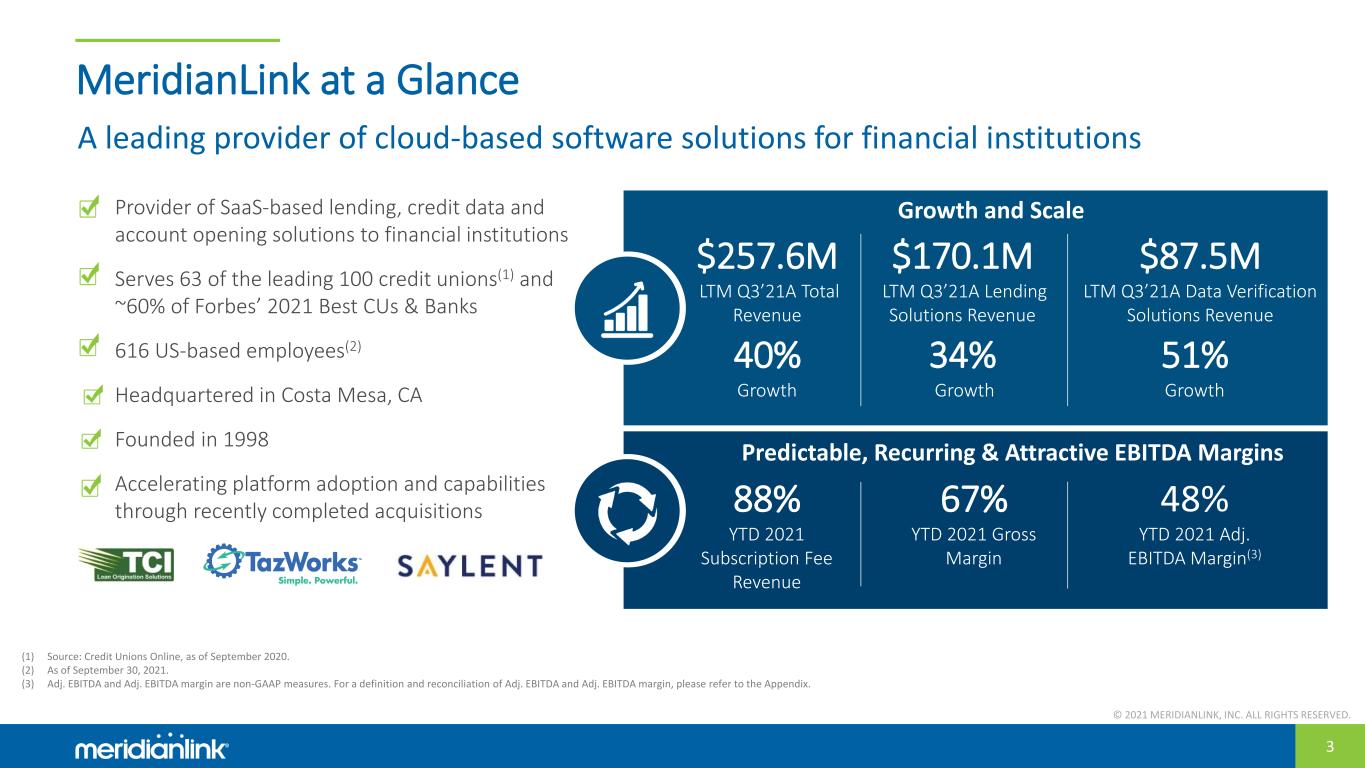
© 2021 MERIDIANLINK, INC. ALL RIGHTS RESERVED. 3 $87.5M LTM Q3’21A Data Verification Solutions Revenue $170.1M LTM Q3’21A Lending Solutions Revenue MeridianLink at a Glance Growth and Scale Predictable, Recurring & Attractive EBITDA Margins A leading provider of cloud-based software solutions for financial institutions $257.6M LTM Q3’21A Total Revenue 88% YTD 2021 Subscription Fee Revenue 67% YTD 2021 Gross Margin 48% YTD 2021 Adj. EBITDA Margin(3) • Provider of SaaS-based lending, credit data and account opening solutions to financial institutions • Serves 63 of the leading 100 credit unions(1) and ~60% of Forbes’ 2021 Best CUs & Banks • 616 US-based employees(2) • Headquartered in Costa Mesa, CA • Founded in 1998 • Accelerating platform adoption and capabilities through recently completed acquisitions (1) Source: Credit Unions Online, as of September 2020. (2) As of September 30, 2021. (3) Adj. EBITDA and Adj. EBITDA margin are non-GAAP measures. For a definition and reconciliation of Adj. EBITDA and Adj. EBITDA margin, please refer to the Appendix. 51% Growth 34% Growth 40% Growth

© 2021 MERIDIANLINK, INC. ALL RIGHTS RESERVED. 4 Our Story 1998 – 2005 Early Years 2006 – 2008 Growth During Recession 2009 – 2018 Organic Growth 2018-2020 Accelerated Growth 2021+ Future Growth Founded in 1998 Released Mortgage Credit LinkTM Launched MeridianLink Consumer and MeridianLink Mortgage Continued volume growth through increased deposits and new product Launched MeridianLink Opening Addition of new clients and increasing volumes Established foundation for Partner Marketplace Thoma Bravo acquisition and CRIF US merger Establish a scalable strategy to improve revenue growth and client retention Strong revenue and Adj. EBITDA growth during COVID-19 Launched MeridianLink Portal, MeridianLink Insight and MeridianLink Collect Launched Platform to further distance from competition Successfully launched Initial Public Offering on July 28, 2021 Drive accelerated platform adoption and capabilities through recent key strategic acquisitions, including TCI, TazWorks, and Saylent Accelerate Go To Market and strategic partnerships to drive incremental revenue and client cross-sell growth Pursue full cloud migration to drive enhanced capacity, flexibility and security Successfully expanded solutions offerings and client base, achieving a strong track record of growth throughout our operating history
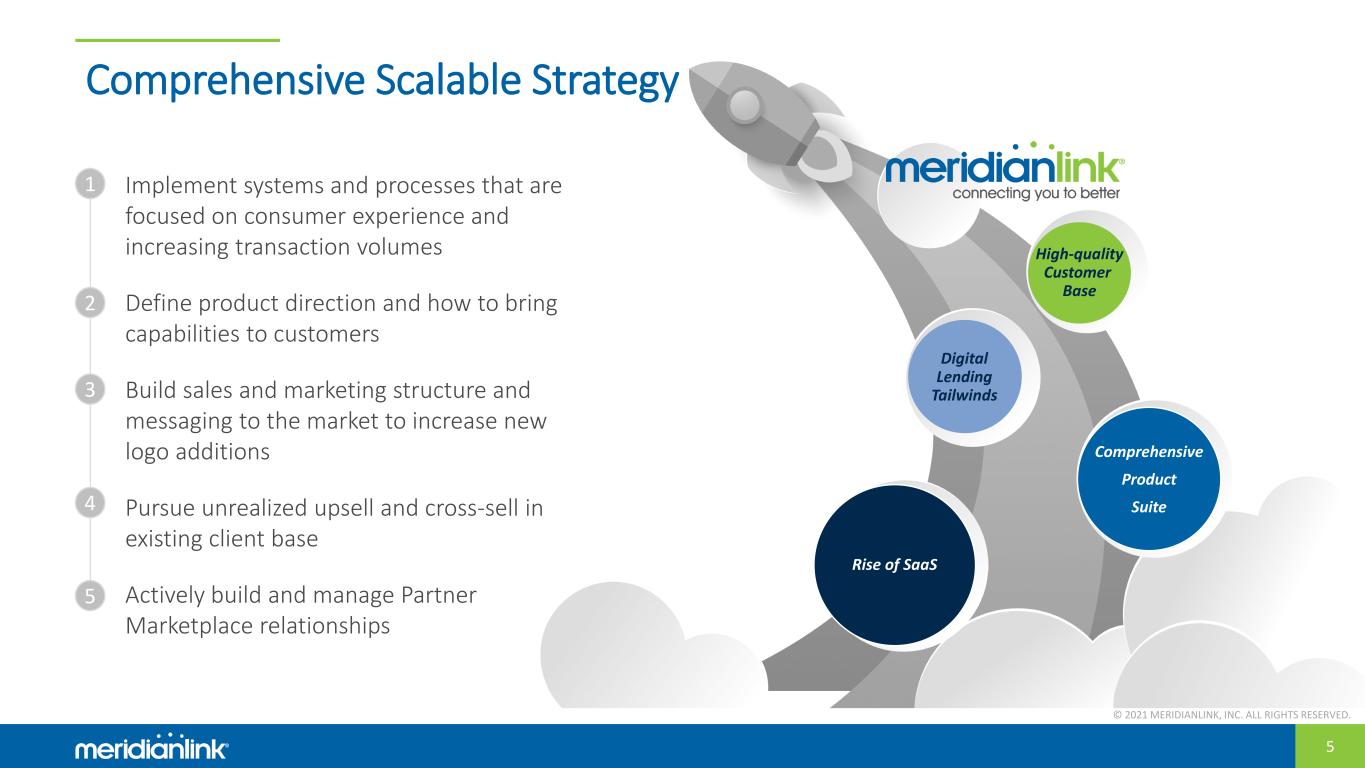
© 2021 MERIDIANLINK, INC. ALL RIGHTS RESERVED. 5 • Implement systems and processes that are focused on consumer experience and increasing transaction volumes • Define product direction and how to bring capabilities to customers • Build sales and marketing structure and messaging to the market to increase new logo additions • Pursue unrealized upsell and cross-sell in existing client base • Actively build and manage Partner Marketplace relationships Comprehensive Scalable Strategy Rise of SaaS High-quality Customer Base Comprehensive Product Suite 1 2 4 3 5 Digital Lending Tailwinds

© 2021 MERIDIANLINK, INC. ALL RIGHTS RESERVED. 6 Experienced Team of Software Executives Senior management team with a proven ability to execute Chad Martin Chief Financial Officer 25+ 25+ years of experience years of experience Nicolaas Vlok Chief Executive Officer Charlie Lee Chief Marketing Officer 25+ years of experience Monica Kim Chief HR Officer 10+ years of experience Chris Maloof Chief Product Officer 15+ years of experience Tim Nguyen Chief Strategy Officer & Co-Founder 20+ years of experience Alan Arnold Chief Operating Officer 25+ years of experience Nathaniel Barnes Chief Technology Officer 15+ years of experience
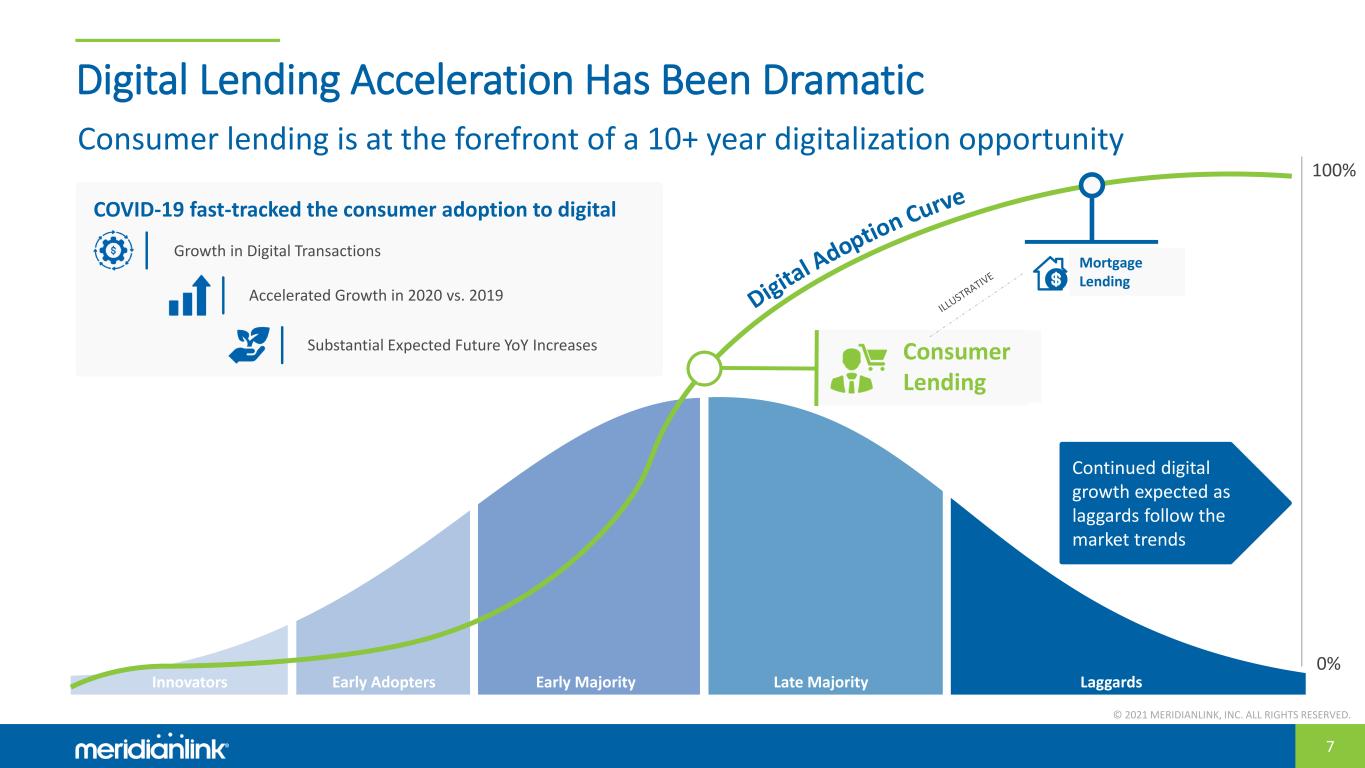
© 2021 MERIDIANLINK, INC. ALL RIGHTS RESERVED. 7 Digital Lending Acceleration Has Been Dramatic Late Majority LaggardsInnovators Early Adopters Early Majority 0% 100% COVID-19 fast-tracked the consumer adoption to digital Growth in Digital Transactions Accelerated Growth in 2020 vs. 2019 Substantial Expected Future YoY Increases Continued digital growth expected as laggards follow the market trends Consumer Lending 20 20 Mortgage Lending Consumer lending is at the forefront of a 10+ year digitalization opportunity
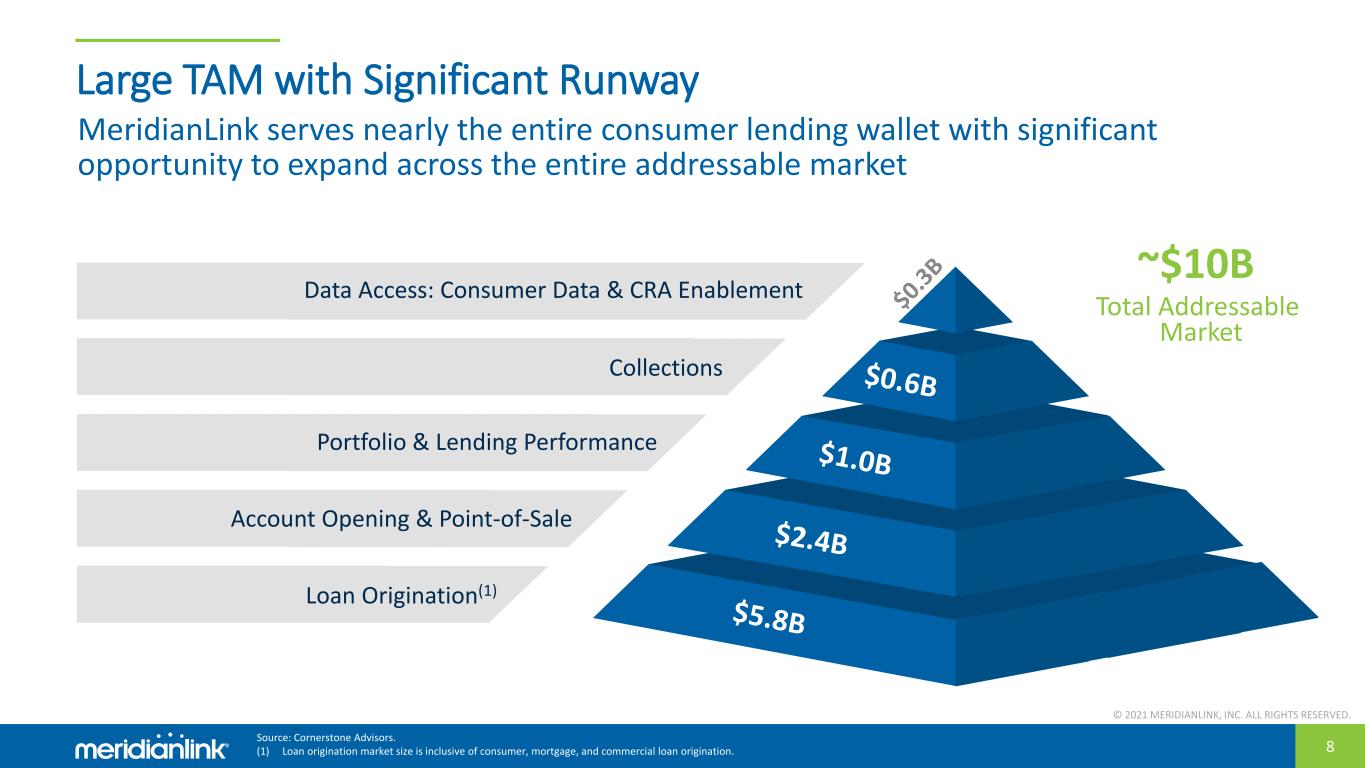
© 2021 MERIDIANLINK, INC. ALL RIGHTS RESERVED. 8 Large TAM with Significant Runway LEVEL 01 LEVEL 02 LEVEL 03 LEVEL 04 LEVEL 05 ~$10B Total Addressable Market MeridianLink serves nearly the entire consumer lending wallet with significant opportunity to expand across the entire addressable market Loan Origination(1) Portfolio & Lending Performance Account Opening & Point-of-Sale Collections Data Access: Consumer Data & CRA Enablement Source: Cornerstone Advisors. (1) Loan origination market size is inclusive of consumer, mortgage, and commercial loan origination.
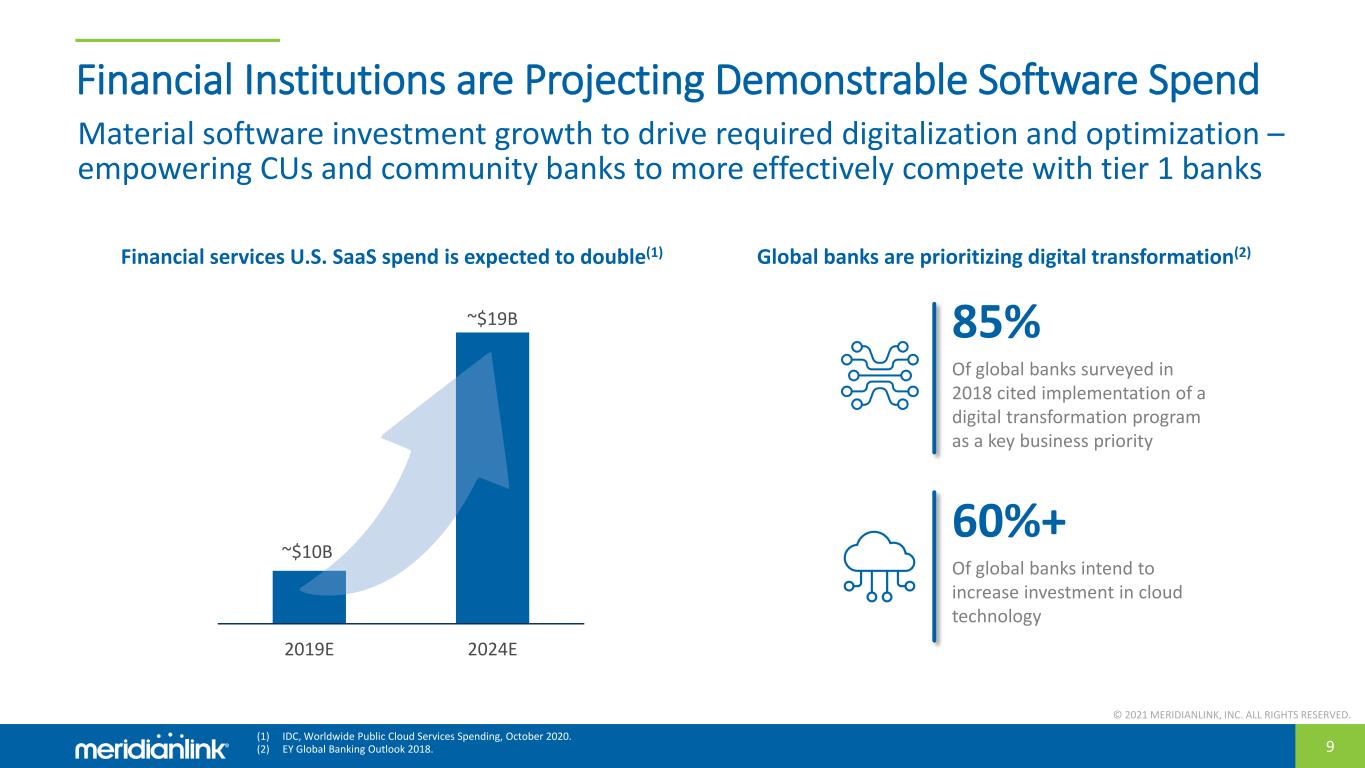
© 2021 MERIDIANLINK, INC. ALL RIGHTS RESERVED. 9 Financial Institutions are Projecting Demonstrable Software Spend (1) IDC, Worldwide Public Cloud Services Spending, October 2020. (2) EY Global Banking Outlook 2018. Material software investment growth to drive required digitalization and optimization – empowering CUs and community banks to more effectively compete with tier 1 banks ~$10B ~$19B $8.0 $10.0 $12.0 $14.0 $16.0 $18.0 $20.0 2019E 2024E Financial services U.S. SaaS spend is expected to double(1) Global banks are prioritizing digital transformation(2) 85% Of global banks surveyed in 2018 cited implementation of a digital transformation program as a key business priority 60%+ Of global banks intend to increase investment in cloud technology
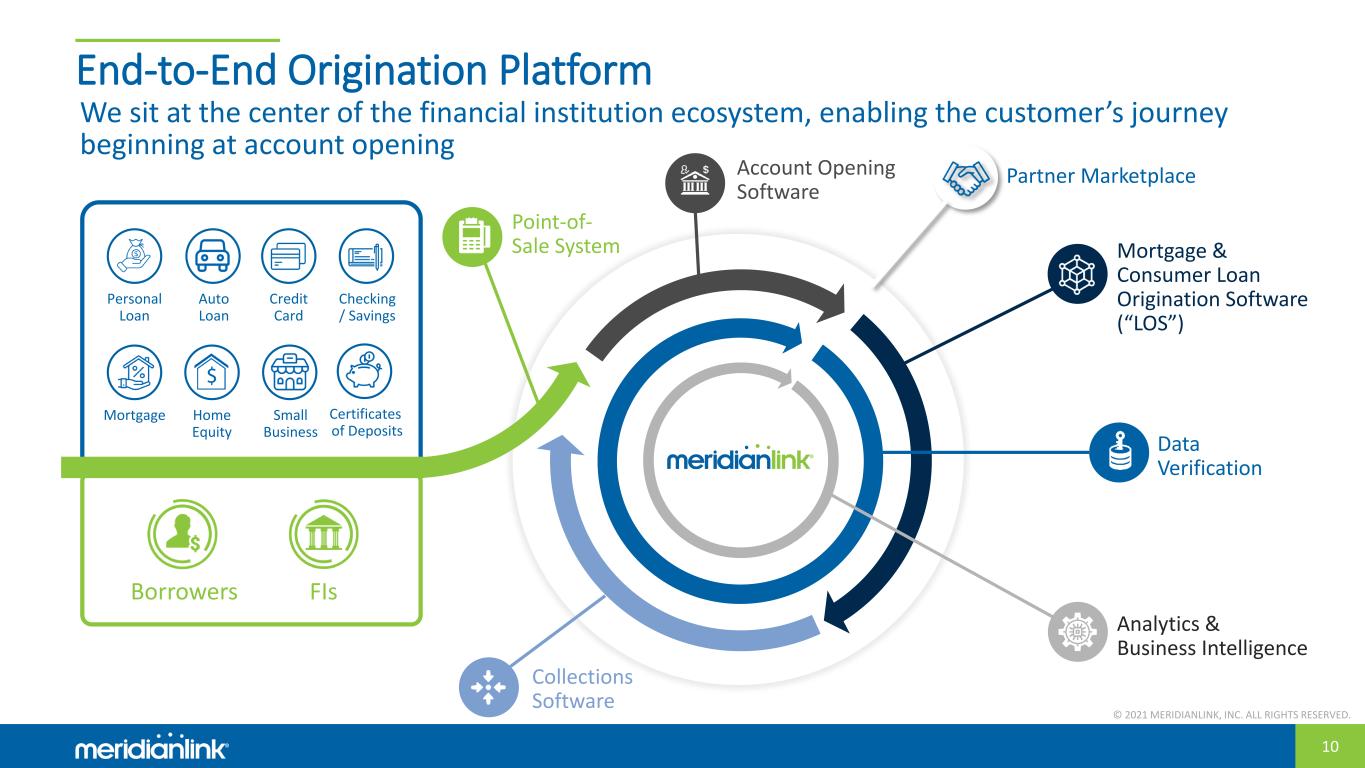
© 2021 MERIDIANLINK, INC. ALL RIGHTS RESERVED. 10 End-to-End Origination Platform Account Opening Software Collections Software Data Verification Point-of- Sale System Analytics & Business Intelligence FIsBorrowers Personal Loan Credit Card Checking / Savings Mortgage Home Equity Small Business Auto Loan Mortgage & Consumer Loan Origination Software (“LOS”) Certificates of Deposits Partner Marketplace We sit at the center of the financial institution ecosystem, enabling the customer’s journey beginning at account opening
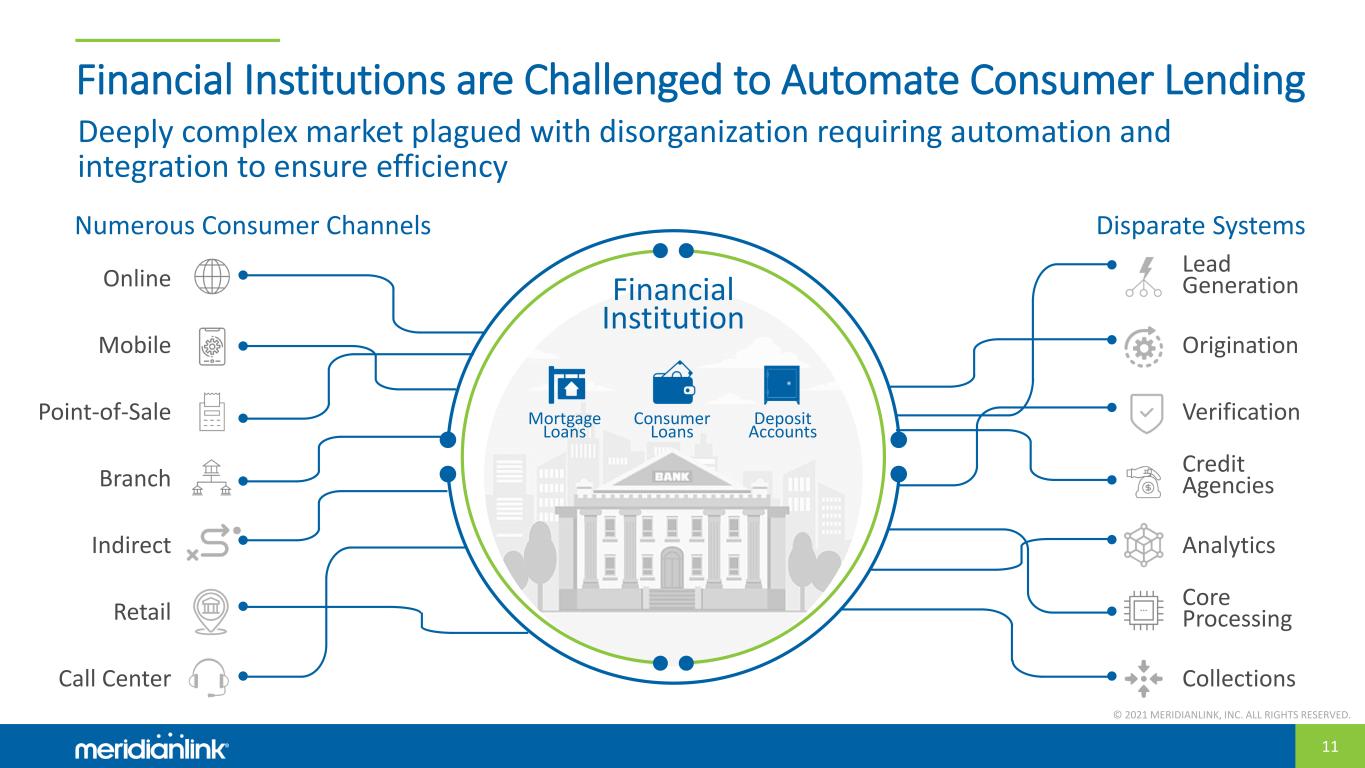
© 2021 MERIDIANLINK, INC. ALL RIGHTS RESERVED. 11 Financial Institutions are Challenged to Automate Consumer Lending Numerous Consumer Channels Disparate Systems Financial Institution Online Point-of-Sale Mobile Branch Indirect Retail Call Center Lead Generation Verification Origination Credit Agencies Analytics Core Processing Collections Consumer Loans Mortgage Loans Deposit Accounts Deeply complex market plagued with disorganization requiring automation and integration to ensure efficiency

© 2021 MERIDIANLINK, INC. ALL RIGHTS RESERVED. 12 The Consumer Lending Platform Complete Omni- Channel Experience Streamlines & Automates Mission-Critical Systems Online Point-of-Sale Mobile Branch Indirect Retail Call Center Lead Generation Verification Origination Credit Agencies Analytics Core Processing Collections Captures consumer wallet Accelerates loan process Drives financial institution revenue Financial Institution MeridianLink has built a comprehensive suite of mission-critical solutions for financial institutions to optimize complexity
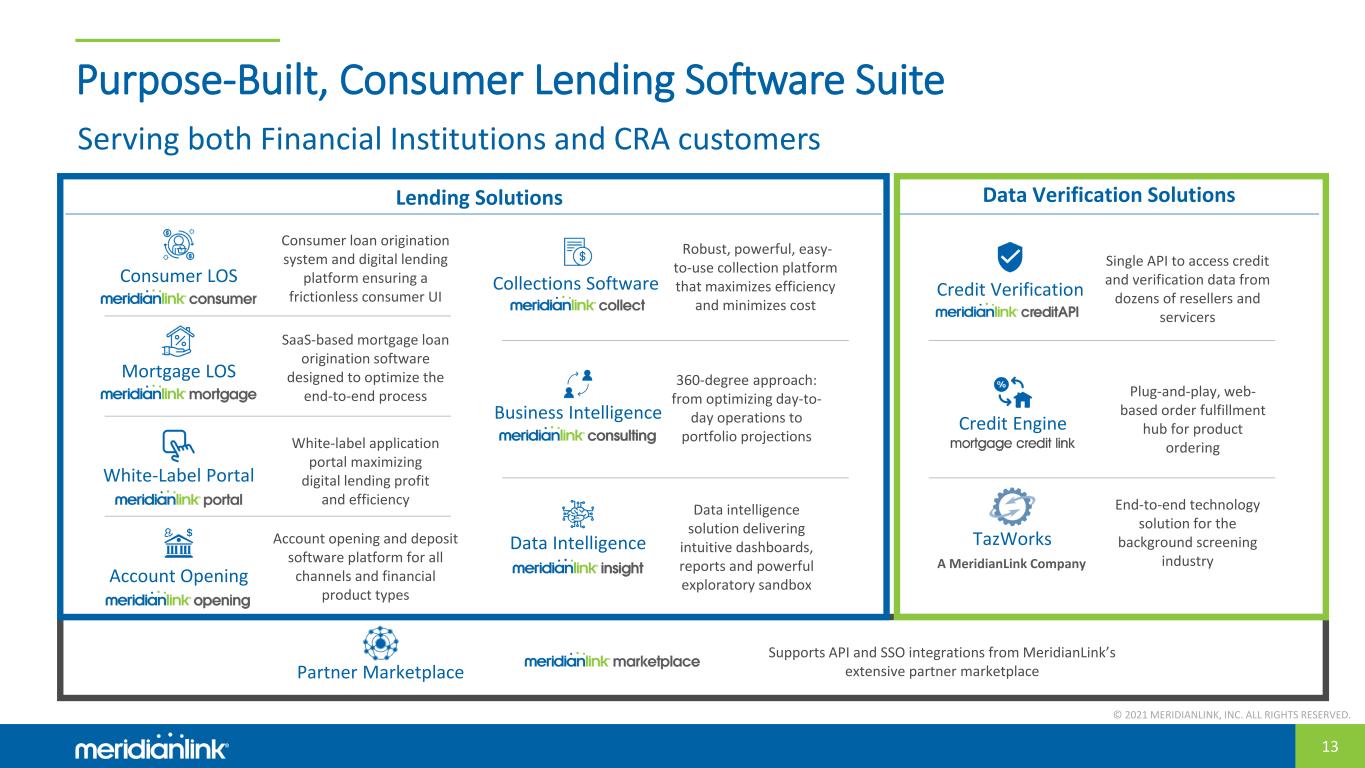
© 2021 MERIDIANLINK, INC. ALL RIGHTS RESERVED. 13 Purpose-Built, Consumer Lending Software Suite Consumer LOS Consumer loan origination system and digital lending platform ensuring a frictionless consumer UI Plug-and-play, web- based order fulfillment hub for product ordering Data Verification SolutionsLending Solutions Serving both Financial Institutions and CRA customers TazWorks End-to-end technology solution for the background screening industryA MeridianLink Company Mortgage LOS SaaS-based mortgage loan origination software designed to optimize the end-to-end process White-Label Portal White-label application portal maximizing digital lending profit and efficiency Account Opening Account opening and deposit software platform for all channels and financial product types Partner Marketplace Supports API and SSO integrations from MeridianLink’s extensive partner marketplace Collections Software Robust, powerful, easy- to-use collection platform that maximizes efficiency and minimizes cost Business Intelligence 360-degree approach: from optimizing day-to- day operations to portfolio projections Data Intelligence Data intelligence solution delivering intuitive dashboards, reports and powerful exploratory sandbox Single API to access credit and verification data from dozens of resellers and servicers Credit Verification Credit Engine
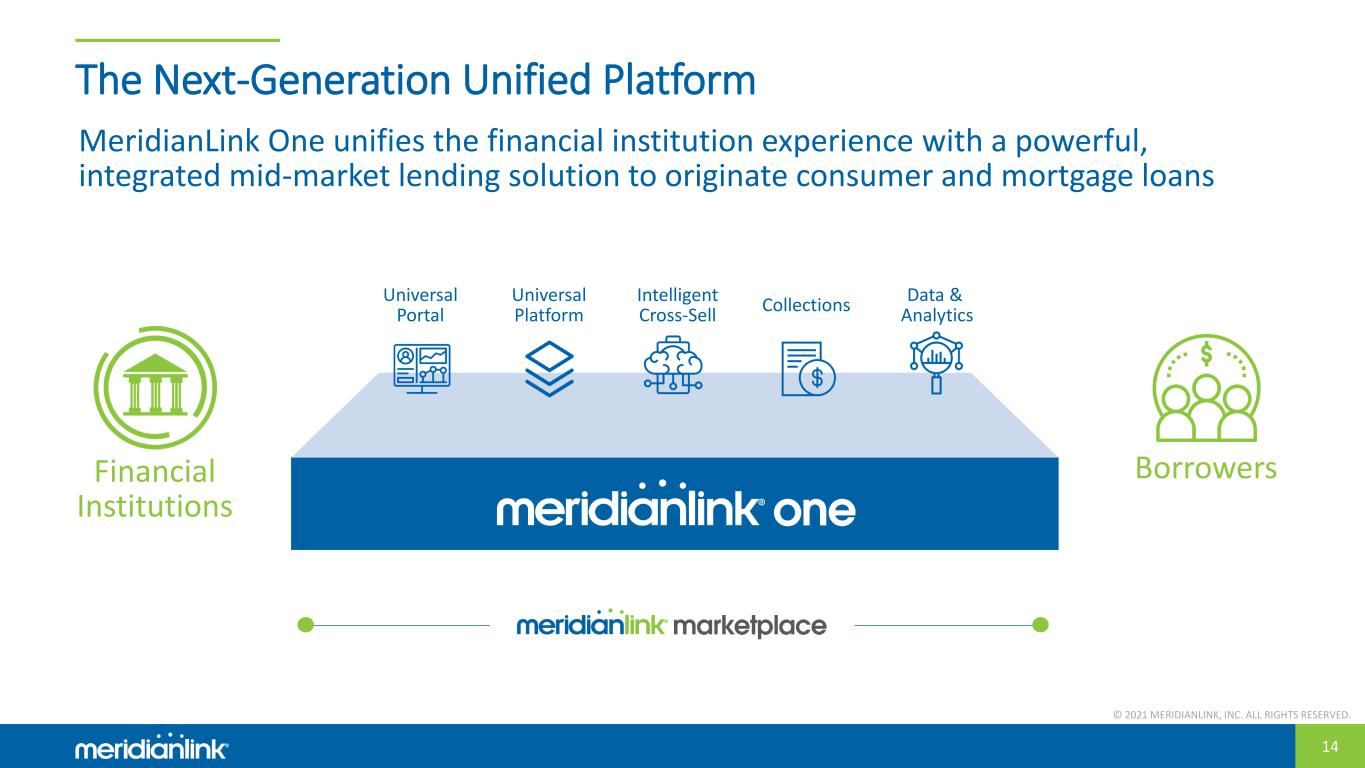
© 2021 MERIDIANLINK, INC. ALL RIGHTS RESERVED. 14 The Next-Generation Unified Platform MeridianLink One unifies the financial institution experience with a powerful, integrated mid-market lending solution to originate consumer and mortgage loans Financial Institutions Borrowers Universal Platform Intelligent Cross-Sell CollectionsUniversal Portal Data & Analytics
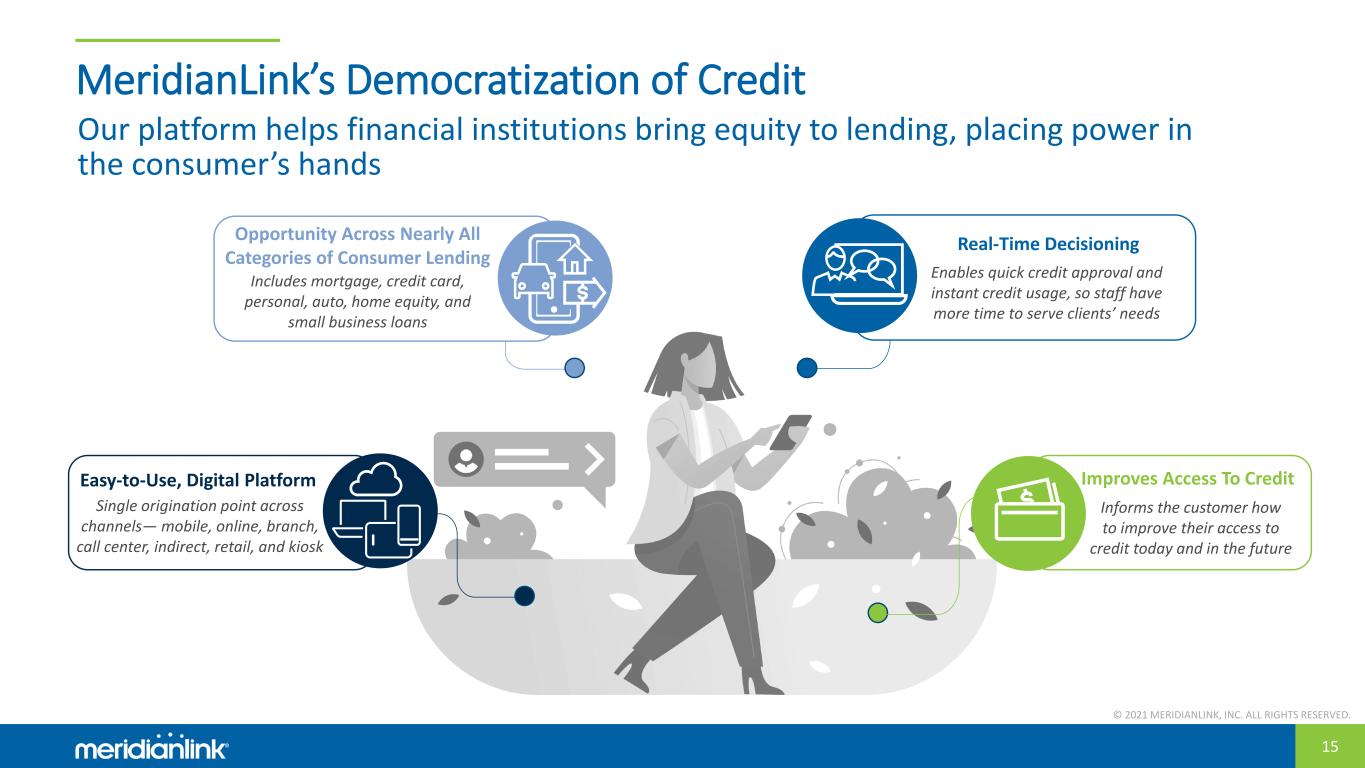
© 2021 MERIDIANLINK, INC. ALL RIGHTS RESERVED. 15 MeridianLink’s Democratization of Credit Our platform helps financial institutions bring equity to lending, placing power in the consumer’s hands Easy-to-Use, Digital Platform Includes mortgage, credit card, personal, auto, home equity, and small business loans Real-Time Decisioning Single origination point across channels— mobile, online, branch, call center, indirect, retail, and kiosk Opportunity Across Nearly All Categories of Consumer Lending Informs the customer how to improve their access to credit today and in the future Enables quick credit approval and instant credit usage, so staff have more time to serve clients’ needs Improves Access To Credit

© 2021 MERIDIANLINK, INC. ALL RIGHTS RESERVED. 16 Multi-Vector Growth Strategy Expand Product Offerings Enhance Partner Marketplace Monetization Add New Logos Capitalize on Organic Volume Growth Robust Pipeline of M&A Opportunities Multiple actionable initiatives to accelerate growth Pursue Unrealized Upsell & Cross-Sell Key Customer Themes Underpinning Growth Paper-to-Digital Transition in Target Market Competition Among Financial Institutions
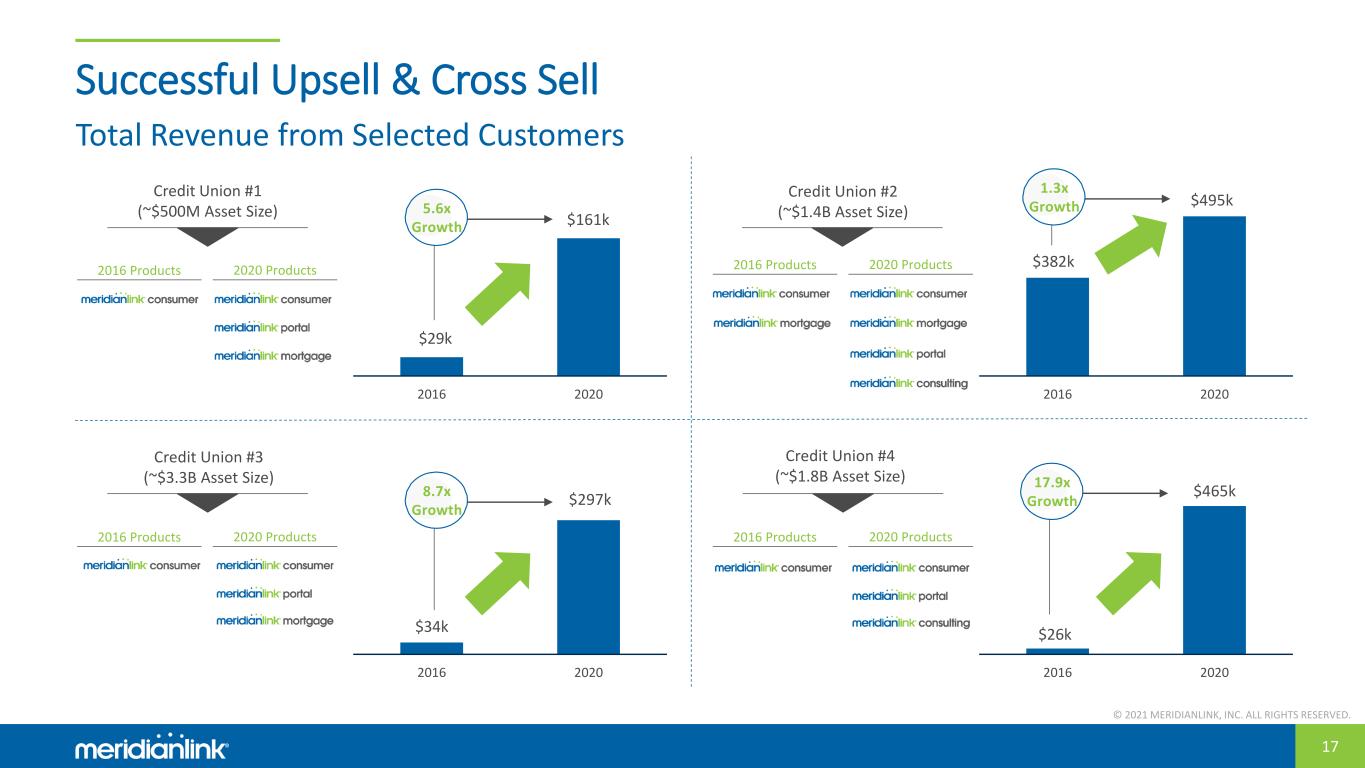
© 2021 MERIDIANLINK, INC. ALL RIGHTS RESERVED. 17 Successful Upsell & Cross Sell 2016 2020 2016 2020 $382k $495kCredit Union #2 (~$1.4B Asset Size) 2016 2020 $34k $297k 2016 2020 $29k $161k 5.6x Growth Credit Union #1 (~$500M Asset Size) Credit Union #3 (~$3.3B Asset Size) Credit Union #4 (~$1.8B Asset Size) $26k $465k8.7x Growth 17.9x Growth 1.3x Growth 2016 Products 2020 Products 2016 Products 2020 Products 2016 Products 2020 Products 2016 Products 2020 Products Total Revenue from Selected Customers
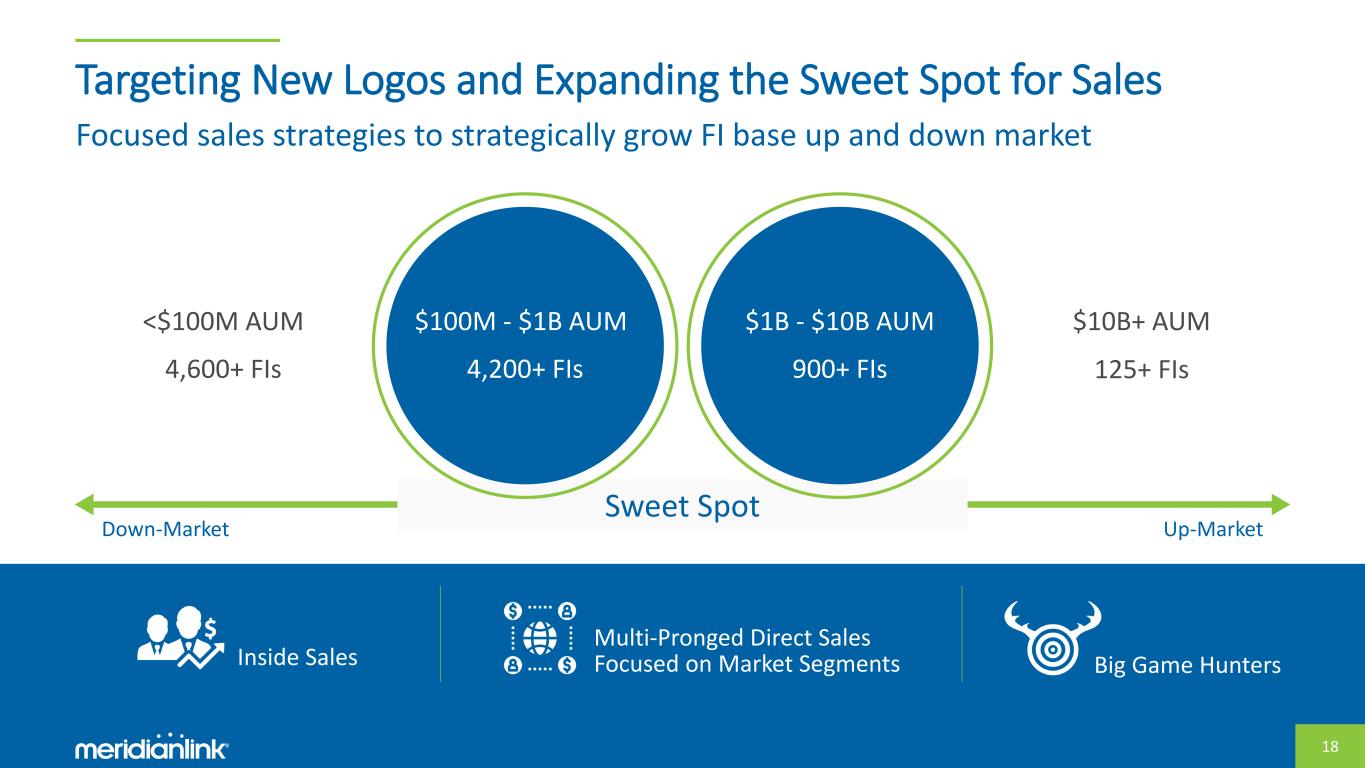
© 2021 MERIDIANLINK, INC. ALL RIGHTS RESERVED. 18 Targeting New Logos and Expanding the Sweet Spot for Sales Big Game Hunters Multi-Pronged Direct Sales Focused on Market Segments Up-MarketDown-Market Sweet Spot <$100M AUM $1B - $10B AUM 4,600+ FIs $10B+ AUM 125+ FIs900+ FIs $100M - $1B AUM 4,200+ FIs Inside Sales Focused sales strategies to strategically grow FI base up and down market
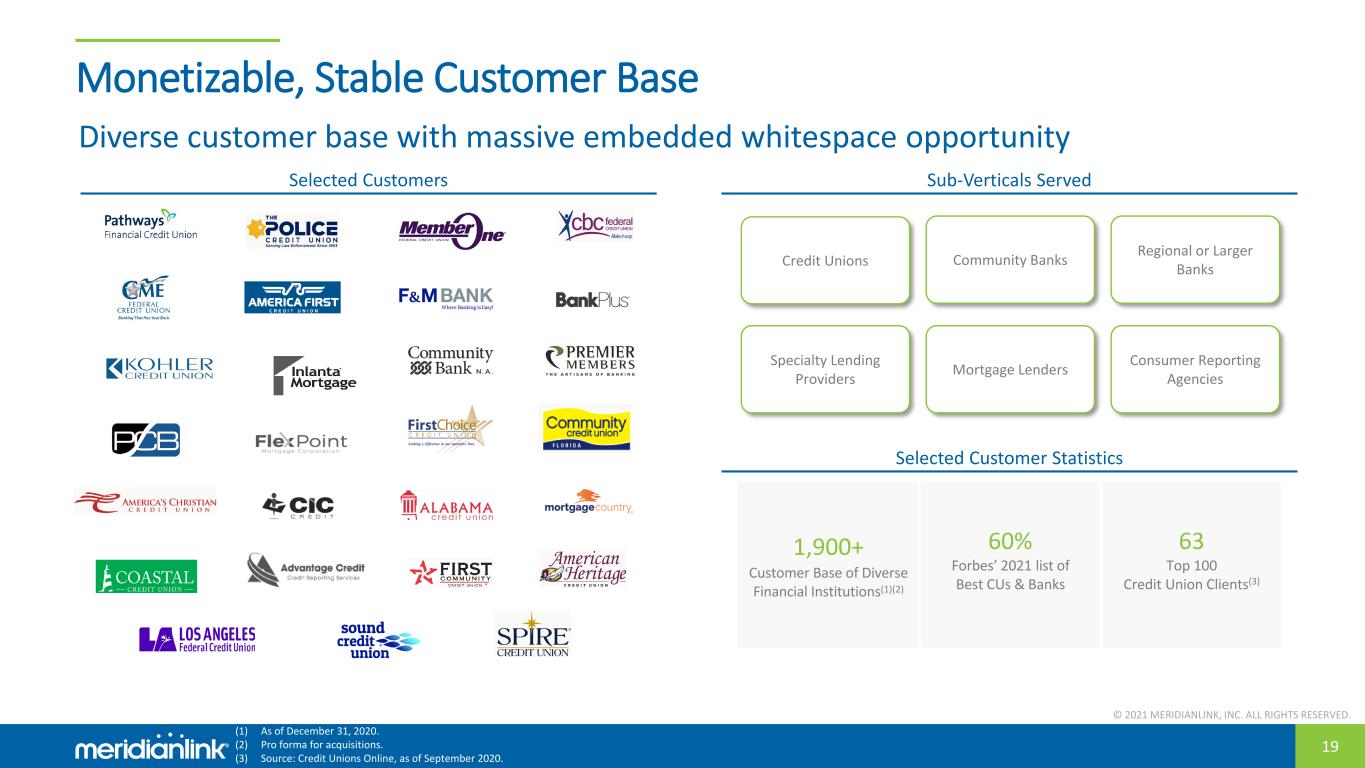
© 2021 MERIDIANLINK, INC. ALL RIGHTS RESERVED. 19 Monetizable, Stable Customer Base 1,900+ Customer Base of Diverse Financial Institutions(1)(2) 60% Forbes’ 2021 list of Best CUs & Banks 63 Top 100 Credit Union Clients(3) Diverse customer base with massive embedded whitespace opportunity (1) As of December 31, 2020. (2) Pro forma for acquisitions. (3) Source: Credit Unions Online, as of September 2020. Credit Unions Specialty Lending Providers Mortgage Lenders Consumer Reporting Agencies Community Banks Regional or Larger Banks Selected Customers Sub-Verticals Served Selected Customer Statistics
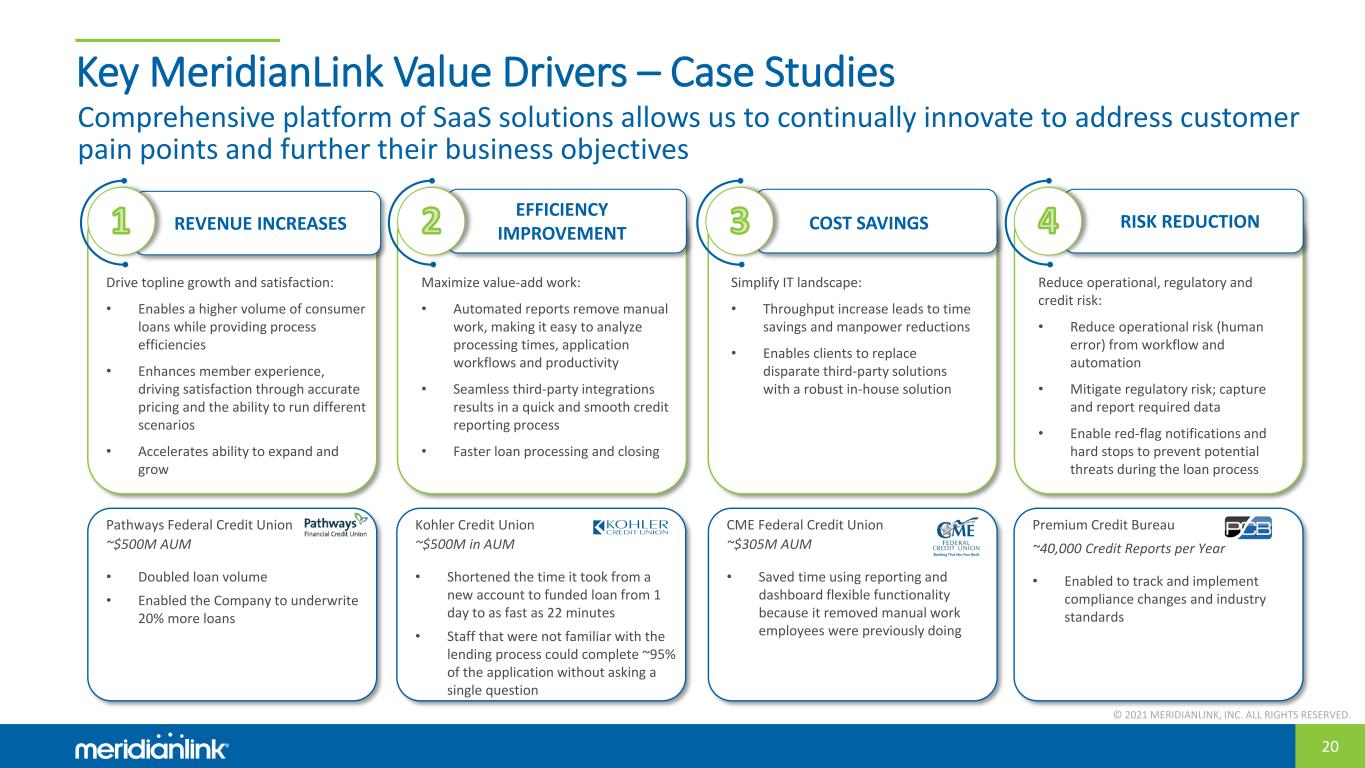
© 2021 MERIDIANLINK, INC. ALL RIGHTS RESERVED. 20 Key MeridianLink Value Drivers – Case Studies EFFICIENCY IMPROVEMENTREVENUE INCREASES COST SAVINGS RISK REDUCTION Drive topline growth and satisfaction: • Enables a higher volume of consumer loans while providing process efficiencies • Enhances member experience, driving satisfaction through accurate pricing and the ability to run different scenarios • Accelerates ability to expand and grow Maximize value-add work: • Automated reports remove manual work, making it easy to analyze processing times, application workflows and productivity • Seamless third-party integrations results in a quick and smooth credit reporting process • Faster loan processing and closing Simplify IT landscape: • Throughput increase leads to time savings and manpower reductions • Enables clients to replace disparate third-party solutions with a robust in-house solution Reduce operational, regulatory and credit risk: • Reduce operational risk (human error) from workflow and automation • Mitigate regulatory risk; capture and report required data • Enable red-flag notifications and hard stops to prevent potential threats during the loan process Pathways Federal Credit Union ~$500M AUM • Doubled loan volume • Enabled the Company to underwrite 20% more loans Kohler Credit Union ~$500M in AUM • Shortened the time it took from a new account to funded loan from 1 day to as fast as 22 minutes • Staff that were not familiar with the lending process could complete ~95% of the application without asking a single question CME Federal Credit Union ~$305M AUM • Saved time using reporting and dashboard flexible functionality because it removed manual work employees were previously doing Premium Credit Bureau ~40,000 Credit Reports per Year • Enabled to track and implement compliance changes and industry standards Comprehensive platform of SaaS solutions allows us to continually innovate to address customer pain points and further their business objectives
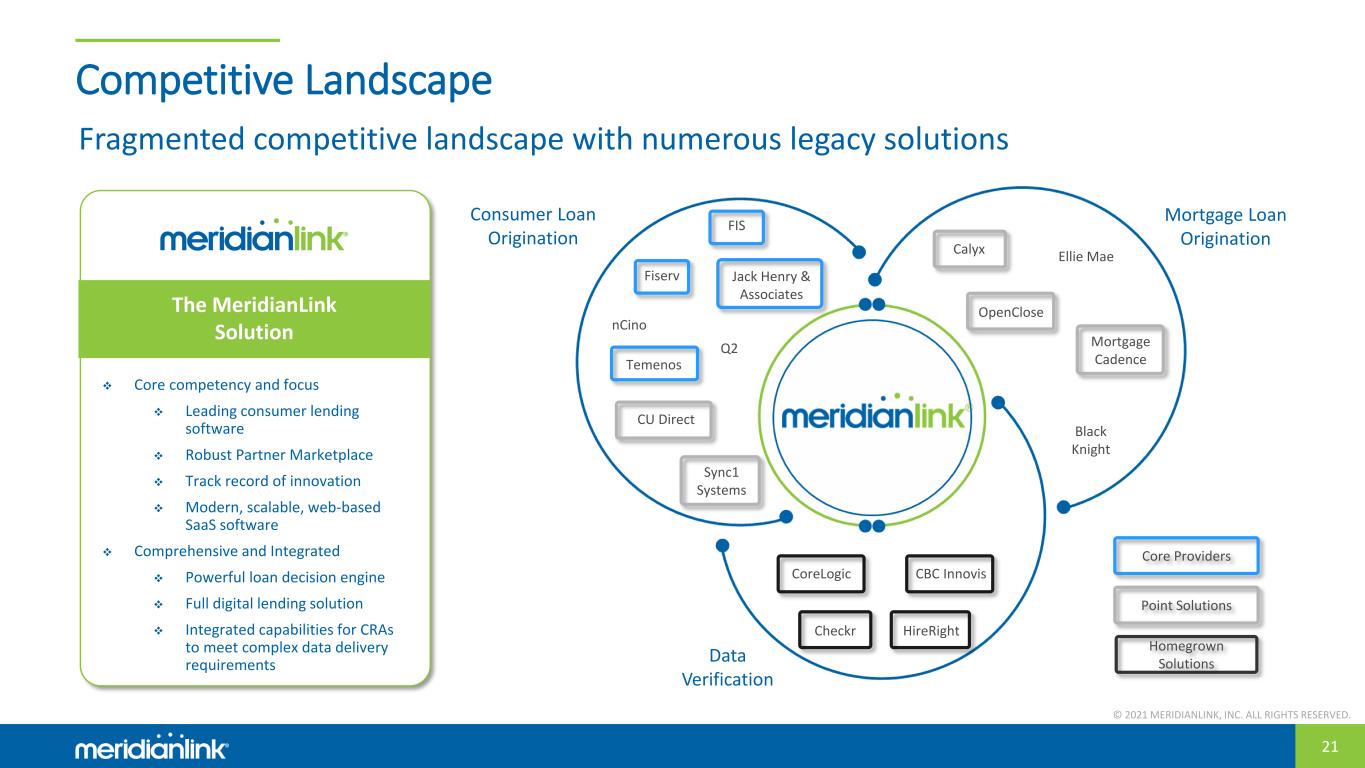
© 2021 MERIDIANLINK, INC. ALL RIGHTS RESERVED. 21 Competitive Landscape Fragmented competitive landscape with numerous legacy solutions Mortgage Loan Origination Data Verification Consumer Loan Origination FIS Fiserv nCino Temenos Q2 Sync1 Systems Calyx OpenClose Ellie Mae Mortgage Cadence Black Knight CBC InnovisCoreLogic Jack Henry & Associates CU Direct Point Solutions Core Providers The MeridianLink Solution Core competency and focus Leading consumer lending software Robust Partner Marketplace Track record of innovation Modern, scalable, web-based SaaS software Comprehensive and Integrated Powerful loan decision engine Full digital lending solution Integrated capabilities for CRAs to meet complex data delivery requirements Homegrown Solutions Checkr HireRight
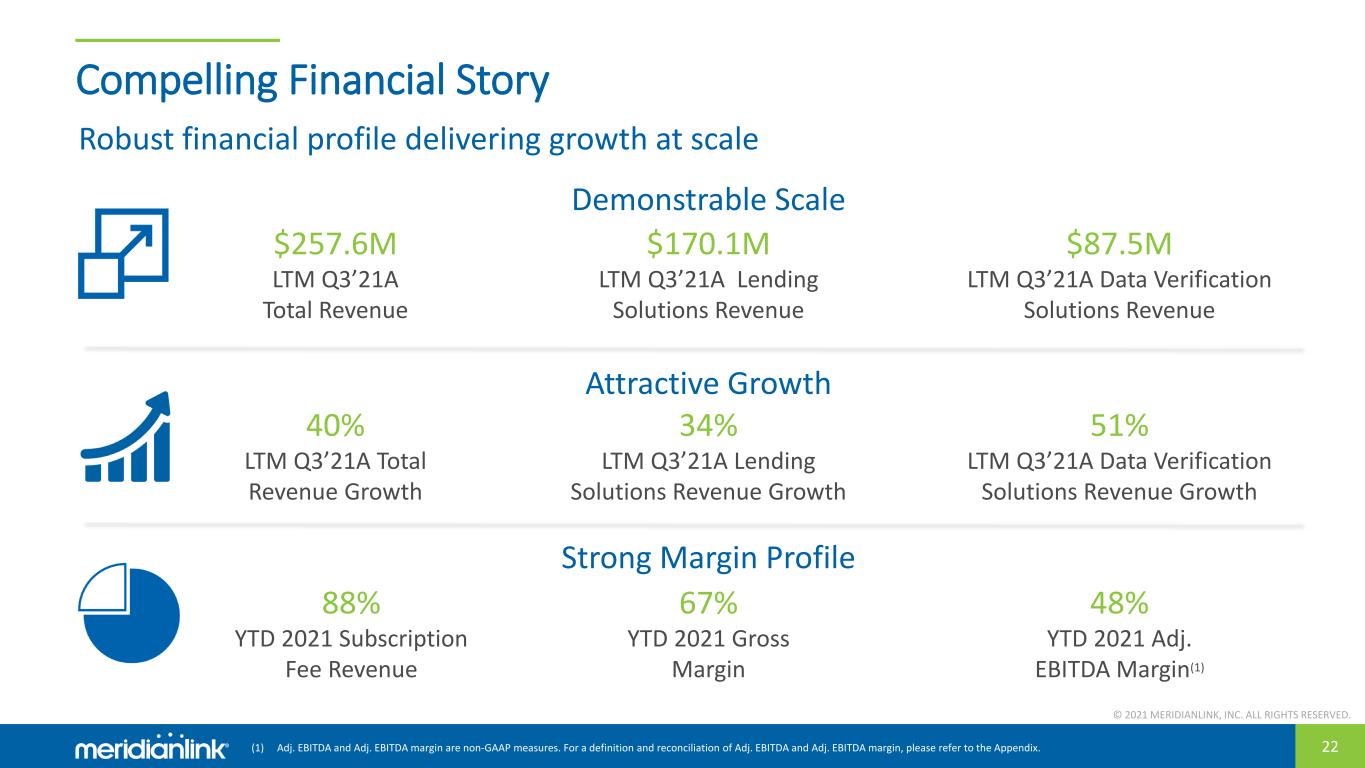
© 2021 MERIDIANLINK, INC. ALL RIGHTS RESERVED. 22 Compelling Financial Story Demonstrable Scale $257.6M LTM Q3’21A Total Revenue 88% YTD 2021 Subscription Fee Revenue Strong Margin Profile $170.1M LTM Q3’21A Lending Solutions Revenue Attractive Growth 67% YTD 2021 Gross Margin 48% YTD 2021 Adj. EBITDA Margin(1) Robust financial profile delivering growth at scale (1) Adj. EBITDA and Adj. EBITDA margin are non-GAAP measures. For a definition and reconciliation of Adj. EBITDA and Adj. EBITDA margin, please refer to the Appendix. $87.5M LTM Q3’21A Data Verification Solutions Revenue 40% LTM Q3’21A Total Revenue Growth 34% LTM Q3’21A Lending Solutions Revenue Growth 51% LTM Q3’21A Data Verification Solutions Revenue Growth
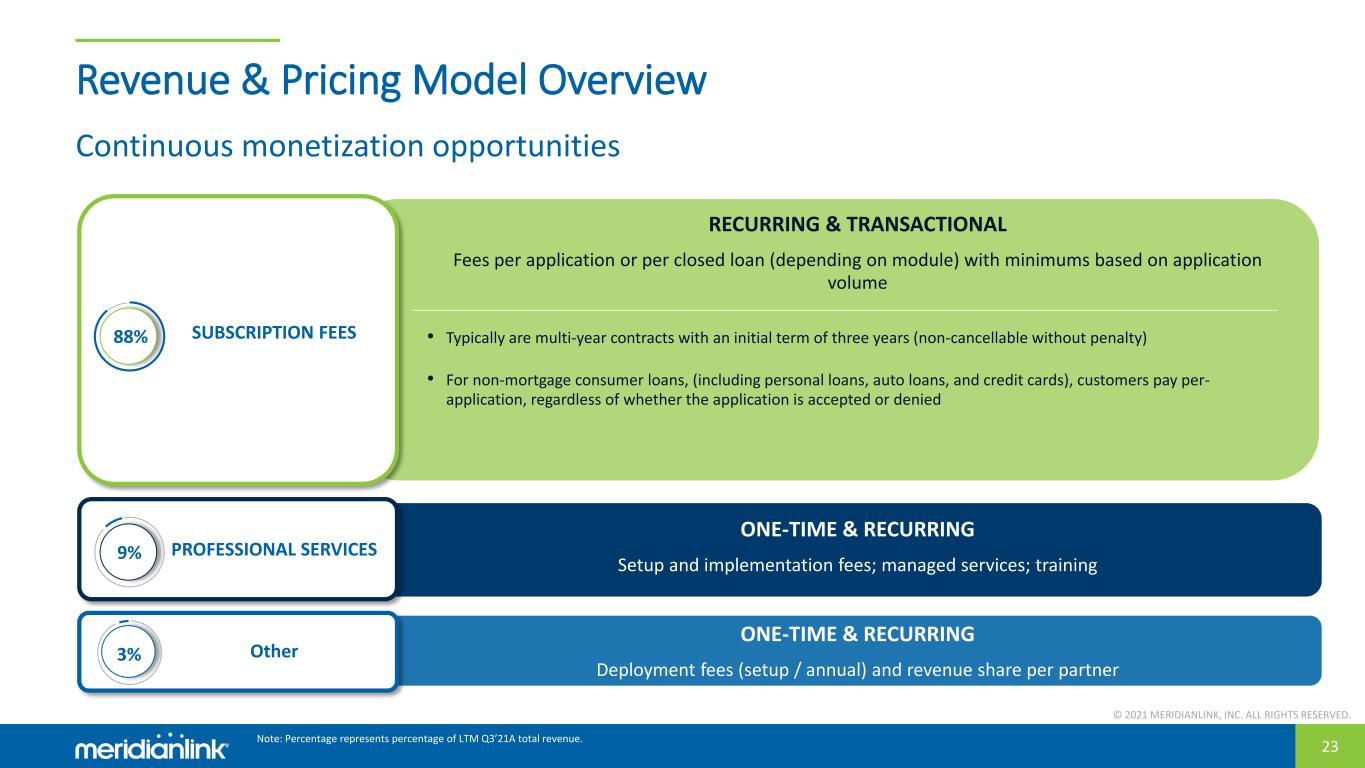
© 2021 MERIDIANLINK, INC. ALL RIGHTS RESERVED. 23 Revenue & Pricing Model Overview Continuous monetization opportunities Note: Percentage represents percentage of LTM Q3’21A total revenue. RECURRING & TRANSACTIONAL Fees per application or per closed loan (depending on module) with minimums based on application volume • Typically are multi-year contracts with an initial term of three years (non-cancellable without penalty) • For non-mortgage consumer loans, (including personal loans, auto loans, and credit cards), customers pay per- application, regardless of whether the application is accepted or denied ONE-TIME & RECURRING Deployment fees (setup / annual) and revenue share per partner ONE-TIME & RECURRING Setup and implementation fees; managed services; training SUBSCRIPTION FEES PROFESSIONAL SERVICES Other 88% 9% 3%
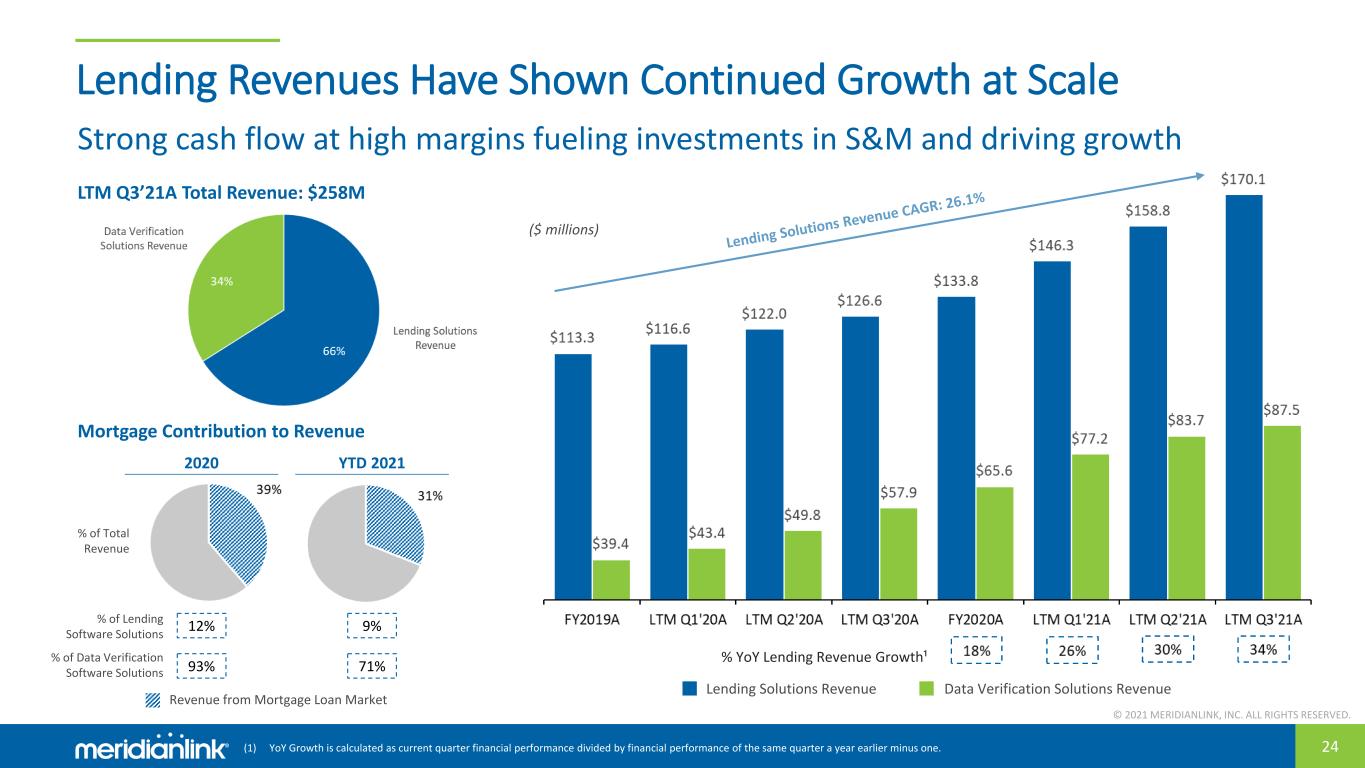
© 2021 MERIDIANLINK, INC. ALL RIGHTS RESERVED. 24 Lending Revenues Have Shown Continued Growth at Scale Lending Solutions Revenue Data Verification Solutions Revenue LTM Q3’21A Total Revenue: $258M Strong cash flow at high margins fueling investments in S&M and driving growth % YoY Lending Revenue Growth¹ Revenue from Mortgage Loan Market % of Total Revenue % of Lending Software Solutions % of Data Verification Software Solutions 2020 YTD 2021 12% 93% 9% 71% Mortgage Contribution to Revenue ($ millions) (1) YoY Growth is calculated as current quarter financial performance divided by financial performance of the same quarter a year earlier minus one.
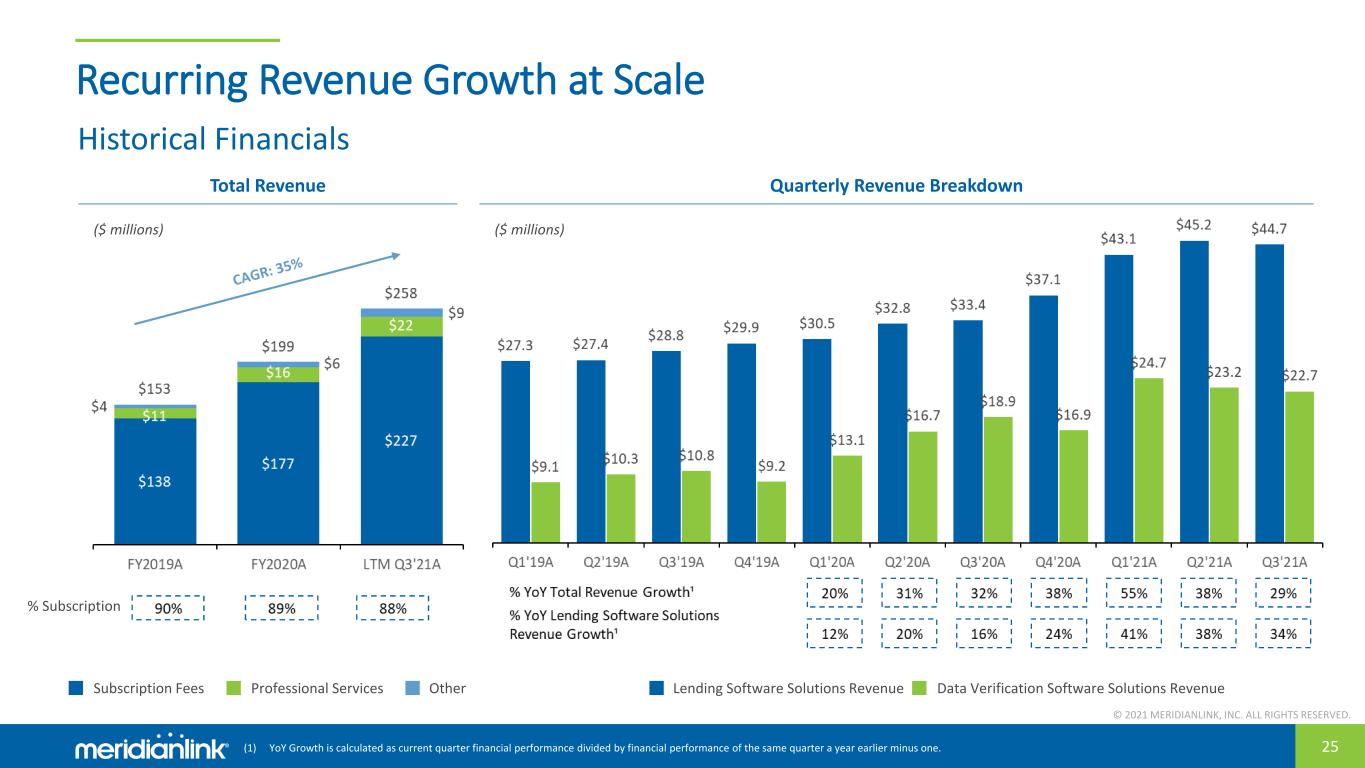
© 2021 MERIDIANLINK, INC. ALL RIGHTS RESERVED. 25 Recurring Revenue Growth at Scale Total Revenue Quarterly Revenue Breakdown ($ millions) ($ millions) % Subscription Professional Services OtherSubscription Fees Lending Software Solutions Revenue Data Verification Software Solutions Revenue Historical Financials (1) YoY Growth is calculated as current quarter financial performance divided by financial performance of the same quarter a year earlier minus one.
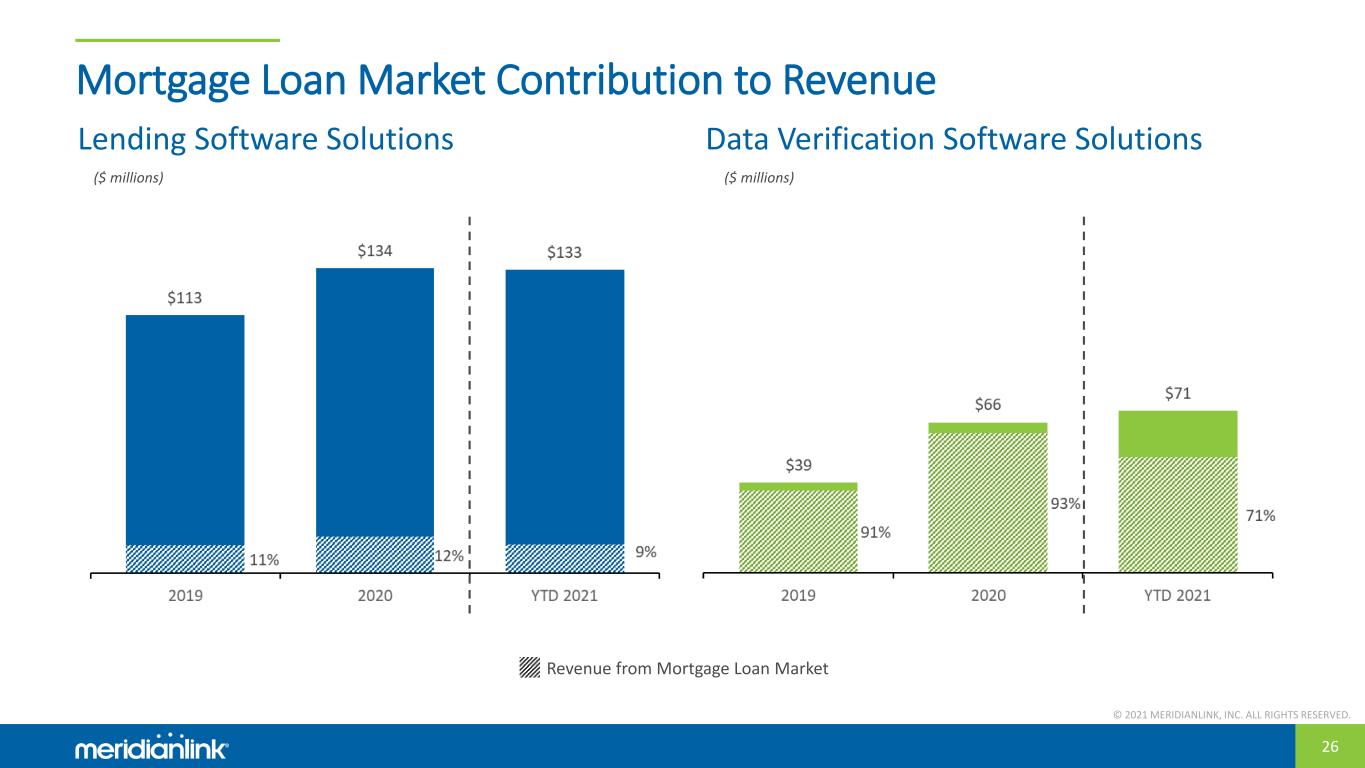
© 2021 MERIDIANLINK, INC. ALL RIGHTS RESERVED. 26 Mortgage Loan Market Contribution to Revenue Lending Software Solutions Data Verification Software Solutions Revenue from Mortgage Loan Market ($ millions) ($ millions)

© 2021 MERIDIANLINK, INC. ALL RIGHTS RESERVED. 27 Strong Margin Profile Gross Profit Adj. EBITDA(1) ($ millions) ($ millions) Gross Profit Gross Profit Margin Adj. EBITDA Adj. EBITDA Margin (1) Adj. EBITDA and Adj. EBITDA margin are non-GAAP measures. For a definition and reconciliation of Adj. EBITDA and Adj. EBITDA margin, please refer to the Appendix.
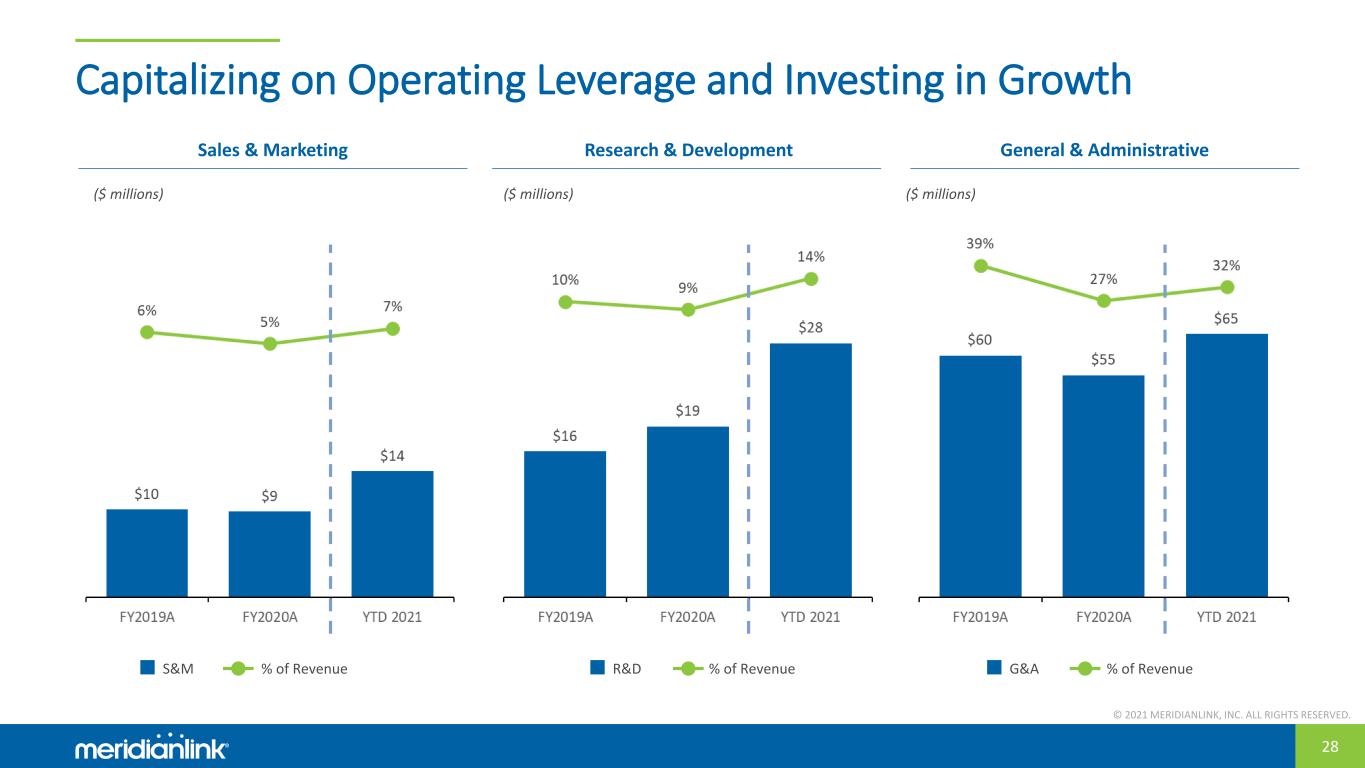
© 2021 MERIDIANLINK, INC. ALL RIGHTS RESERVED. 28 Capitalizing on Operating Leverage and Investing in Growth Sales & Marketing Research & Development General & Administrative ($ millions) ($ millions) ($ millions) S&M % of Revenue R&D % of Revenue G&A % of Revenue
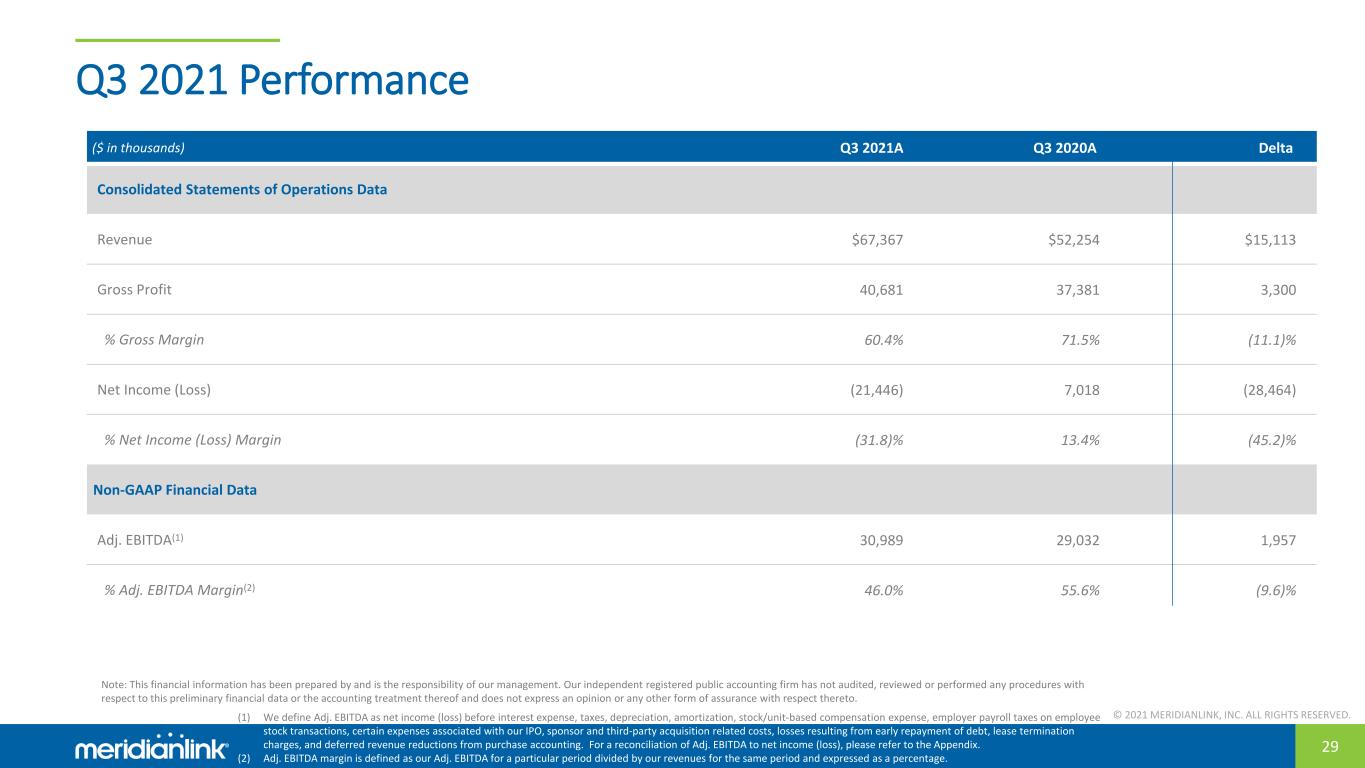
© 2021 MERIDIANLINK, INC. ALL RIGHTS RESERVED. 29 Q3 2021 Performance ($ in thousands) Q3 2021A Q3 2020A Delta Consolidated Statements of Operations Data Revenue $67,367 $52,254 $15,113 Gross Profit 40,681 37,381 3,300 % Gross Margin 60.4% 71.5% (11.1)% Net Income (Loss) (21,446) 7,018 (28,464) % Net Income (Loss) Margin (31.8)% 13.4% (45.2)% Non-GAAP Financial Data Adj. EBITDA(1) 30,989 29,032 1,957 % Adj. EBITDA Margin(2) 46.0% 55.6% (9.6)% (1) We define Adj. EBITDA as net income (loss) before interest expense, taxes, depreciation, amortization, stock/unit-based compensation expense, employer payroll taxes on employee stock transactions, certain expenses associated with our IPO, sponsor and third-party acquisition related costs, losses resulting from early repayment of debt, lease termination charges, and deferred revenue reductions from purchase accounting. For a reconciliation of Adj. EBITDA to net income (loss), please refer to the Appendix. (2) Adj. EBITDA margin is defined as our Adj. EBITDA for a particular period divided by our revenues for the same period and expressed as a percentage. Note: This financial information has been prepared by and is the responsibility of our management. Our independent registered public accounting firm has not audited, reviewed or performed any procedures with respect to this preliminary financial data or the accounting treatment thereof and does not express an opinion or any other form of assurance with respect thereto.
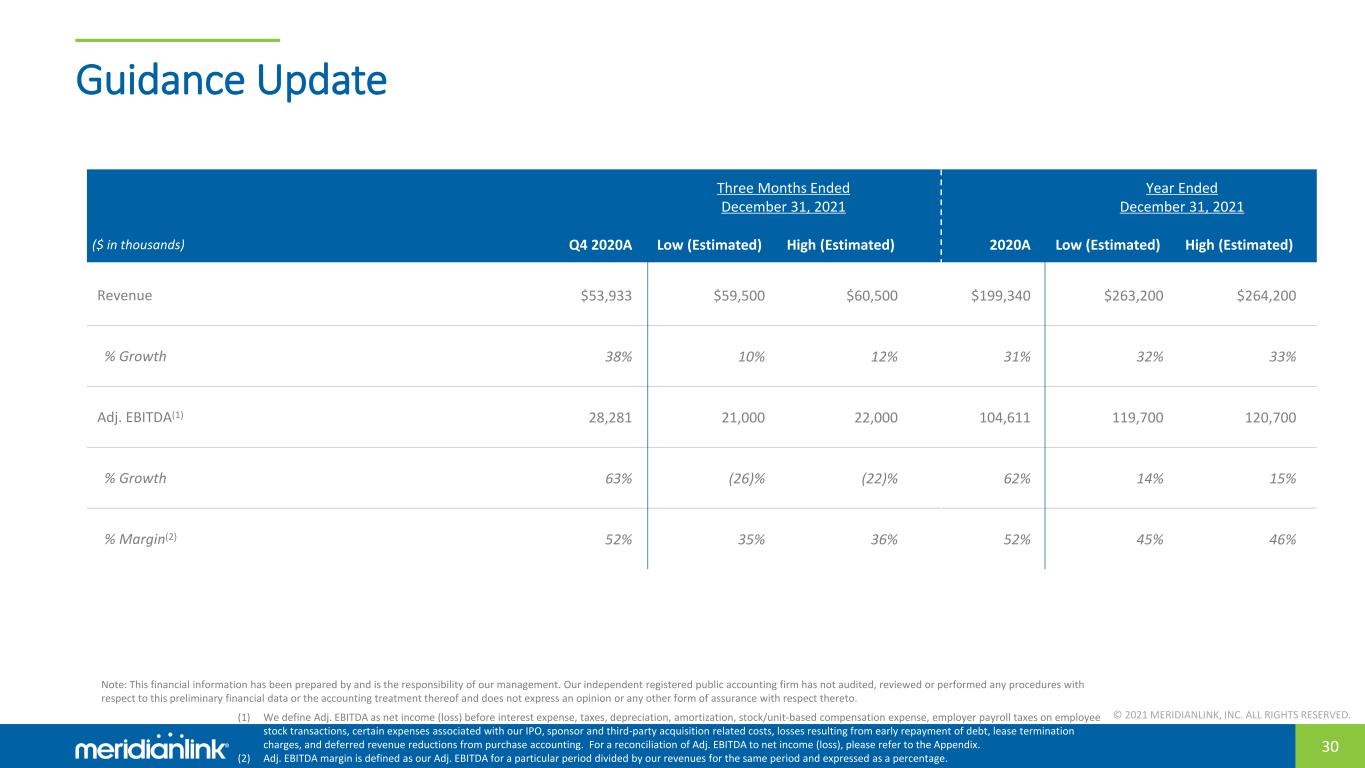
© 2021 MERIDIANLINK, INC. ALL RIGHTS RESERVED. 30 Guidance Update Three Months Ended December 31, 2021 Year Ended December 31, 2021 ($ in thousands) Q4 2020A Low (Estimated) High (Estimated) 2020A Low (Estimated) High (Estimated) Revenue $53,933 $59,500 $60,500 $199,340 $263,200 $264,200 % Growth 38% 10% 12% 31% 32% 33% Adj. EBITDA(1) 28,281 21,000 22,000 104,611 119,700 120,700 % Growth 63% (26)% (22)% 62% 14% 15% % Margin(2) 52% 35% 36% 52% 45% 46% (1) We define Adj. EBITDA as net income (loss) before interest expense, taxes, depreciation, amortization, stock/unit-based compensation expense, employer payroll taxes on employee stock transactions, certain expenses associated with our IPO, sponsor and third-party acquisition related costs, losses resulting from early repayment of debt, lease termination charges, and deferred revenue reductions from purchase accounting. For a reconciliation of Adj. EBITDA to net income (loss), please refer to the Appendix. (2) Adj. EBITDA margin is defined as our Adj. EBITDA for a particular period divided by our revenues for the same period and expressed as a percentage. Note: This financial information has been prepared by and is the responsibility of our management. Our independent registered public accounting firm has not audited, reviewed or performed any procedures with respect to this preliminary financial data or the accounting treatment thereof and does not express an opinion or any other form of assurance with respect thereto.
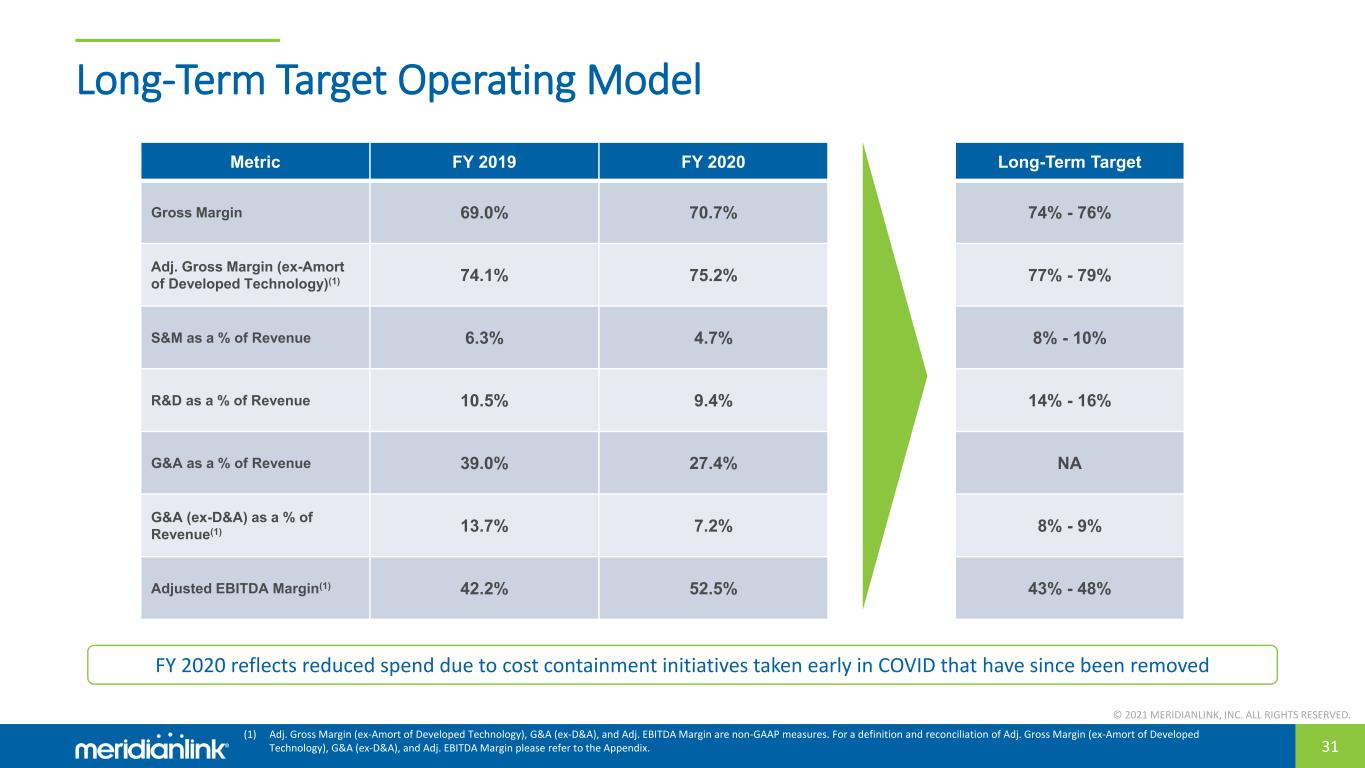
© 2021 MERIDIANLINK, INC. ALL RIGHTS RESERVED. 31 Long-Term Target Operating Model Metric FY 2019 FY 2020 Long-Term Target Gross Margin 69.0% 70.7% 74% - 76% Adj. Gross Margin (ex-Amort of Developed Technology)(1) 74.1% 75.2% 77% - 79% S&M as a % of Revenue 6.3% 4.7% 8% - 10% R&D as a % of Revenue 10.5% 9.4% 14% - 16% G&A as a % of Revenue 39.0% 27.4% NA G&A (ex-D&A) as a % of Revenue(1) 13.7% 7.2% 8% - 9% Adjusted EBITDA Margin(1) 42.2% 52.5% 43% - 48% (1) Adj. Gross Margin (ex-Amort of Developed Technology), G&A (ex-D&A), and Adj. EBITDA Margin are non-GAAP measures. For a definition and reconciliation of Adj. Gross Margin (ex-Amort of Developed Technology), G&A (ex-D&A), and Adj. EBITDA Margin please refer to the Appendix. FY 2020 reflects reduced spend due to cost containment initiatives taken early in COVID that have since been removed
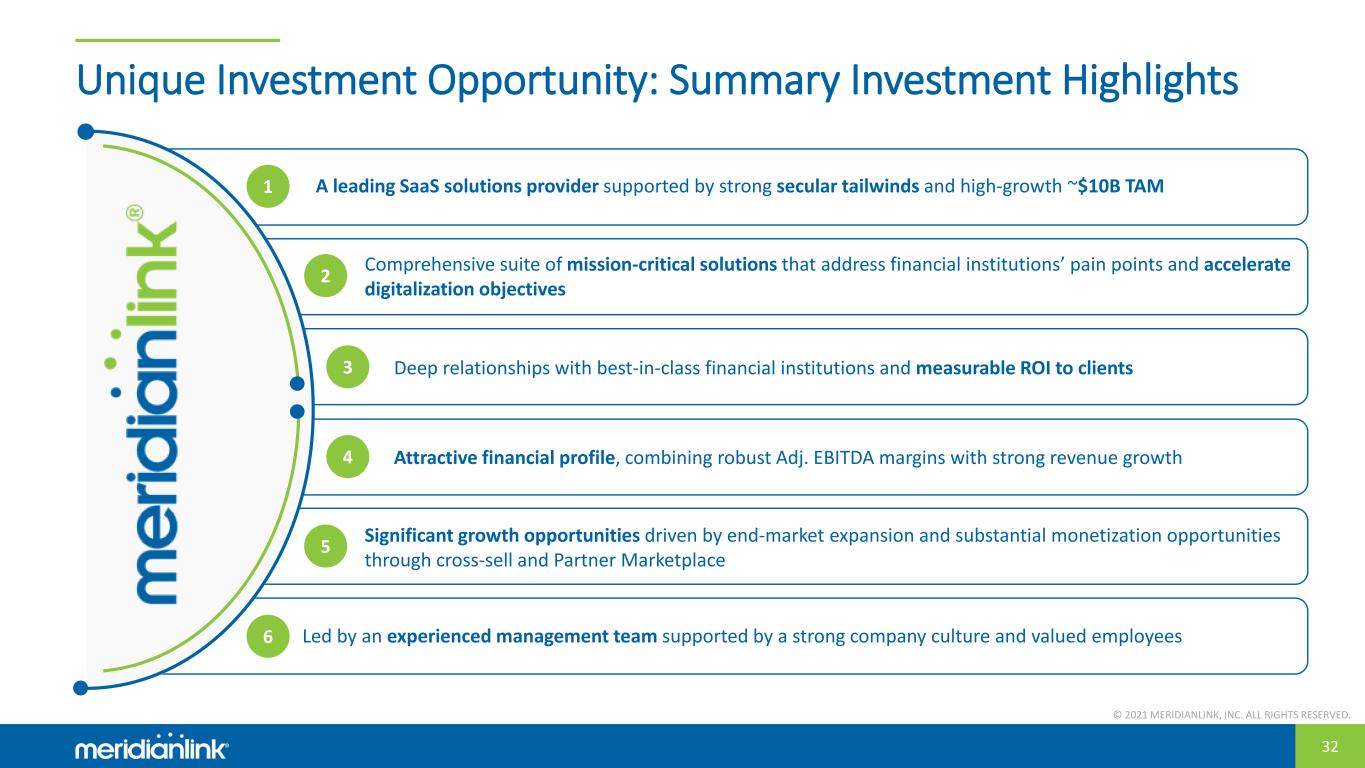
© 2021 MERIDIANLINK, INC. ALL RIGHTS RESERVED. 32 Unique Investment Opportunity: Summary Investment Highlights 1 A leading SaaS solutions provider supported by strong secular tailwinds and high-growth ~$10B TAM 2 4 Attractive financial profile, combining robust Adj. EBITDA margins with strong revenue growth 5 Significant growth opportunities driven by end-market expansion and substantial monetization opportunities through cross-sell and Partner Marketplace 6 Led by an experienced management team supported by a strong company culture and valued employees 3 Deep relationships with best-in-class financial institutions and measurable ROI to clients Comprehensive suite of mission-critical solutions that address financial institutions’ pain points and accelerate digitalization objectives

© 2021 MERIDIANLINK, INC. ALL RIGHTS RESERVED. CONFIDENTIAL Appendix © 2021 MERIDIANLINK, INC. ALL RIGHTS RESERVED.
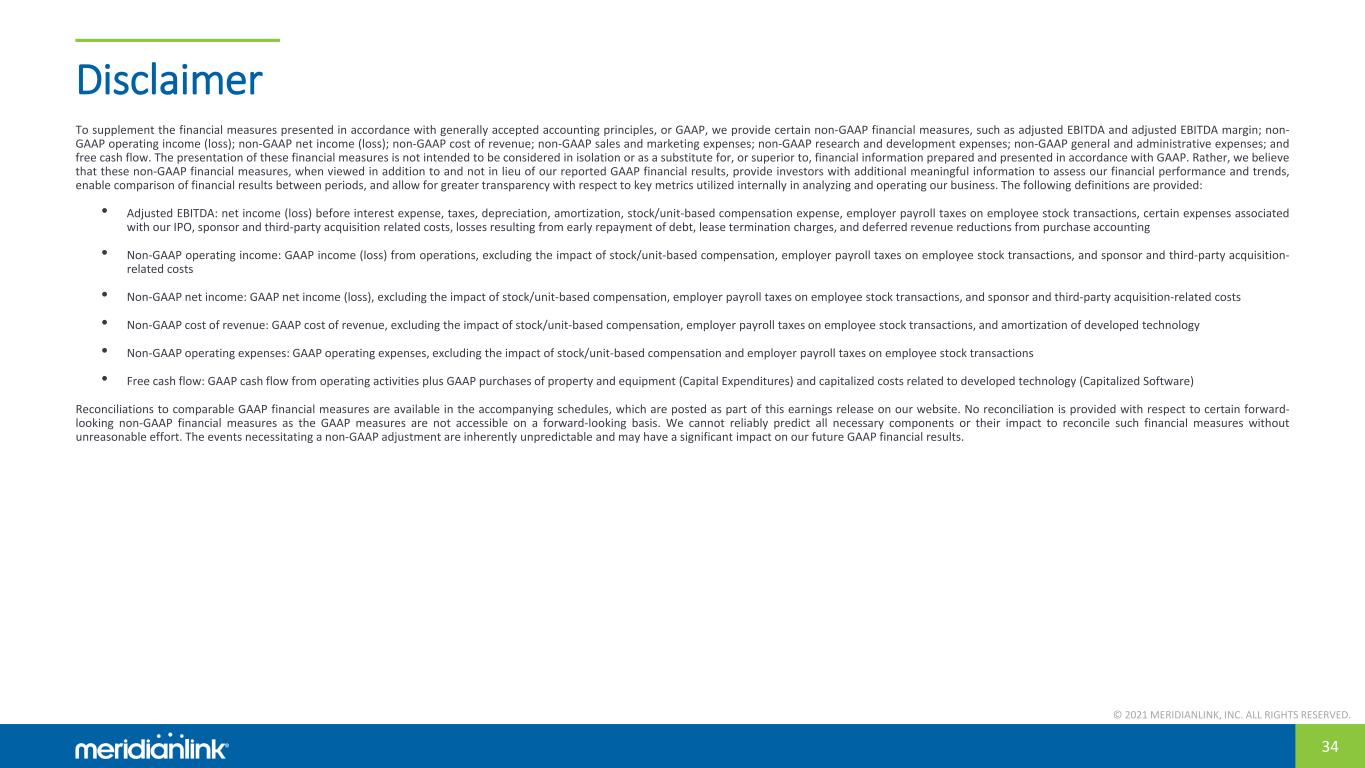
© 2021 MERIDIANLINK, INC. ALL RIGHTS RESERVED. 34 Disclaimer To supplement the financial measures presented in accordance with generally accepted accounting principles, or GAAP, we provide certain non-GAAP financial measures, such as adjusted EBITDA and adjusted EBITDA margin; non- GAAP operating income (loss); non-GAAP net income (loss); non-GAAP cost of revenue; non-GAAP sales and marketing expenses; non-GAAP research and development expenses; non-GAAP general and administrative expenses; and free cash flow. The presentation of these financial measures is not intended to be considered in isolation or as a substitute for, or superior to, financial information prepared and presented in accordance with GAAP. Rather, we believe that these non-GAAP financial measures, when viewed in addition to and not in lieu of our reported GAAP financial results, provide investors with additional meaningful information to assess our financial performance and trends, enable comparison of financial results between periods, and allow for greater transparency with respect to key metrics utilized internally in analyzing and operating our business. The following definitions are provided: • Adjusted EBITDA: net income (loss) before interest expense, taxes, depreciation, amortization, stock/unit-based compensation expense, employer payroll taxes on employee stock transactions, certain expenses associated with our IPO, sponsor and third-party acquisition related costs, losses resulting from early repayment of debt, lease termination charges, and deferred revenue reductions from purchase accounting • Non-GAAP operating income: GAAP income (loss) from operations, excluding the impact of stock/unit-based compensation, employer payroll taxes on employee stock transactions, and sponsor and third-party acquisition- related costs • Non-GAAP net income: GAAP net income (loss), excluding the impact of stock/unit-based compensation, employer payroll taxes on employee stock transactions, and sponsor and third-party acquisition-related costs • Non-GAAP cost of revenue: GAAP cost of revenue, excluding the impact of stock/unit-based compensation, employer payroll taxes on employee stock transactions, and amortization of developed technology • Non-GAAP operating expenses: GAAP operating expenses, excluding the impact of stock/unit-based compensation and employer payroll taxes on employee stock transactions • Free cash flow: GAAP cash flow from operating activities plus GAAP purchases of property and equipment (Capital Expenditures) and capitalized costs related to developed technology (Capitalized Software) Reconciliations to comparable GAAP financial measures are available in the accompanying schedules, which are posted as part of this earnings release on our website. No reconciliation is provided with respect to certain forward- looking non-GAAP financial measures as the GAAP measures are not accessible on a forward-looking basis. We cannot reliably predict all necessary components or their impact to reconcile such financial measures without unreasonable effort. The events necessitating a non-GAAP adjustment are inherently unpredictable and may have a significant impact on our future GAAP financial results.
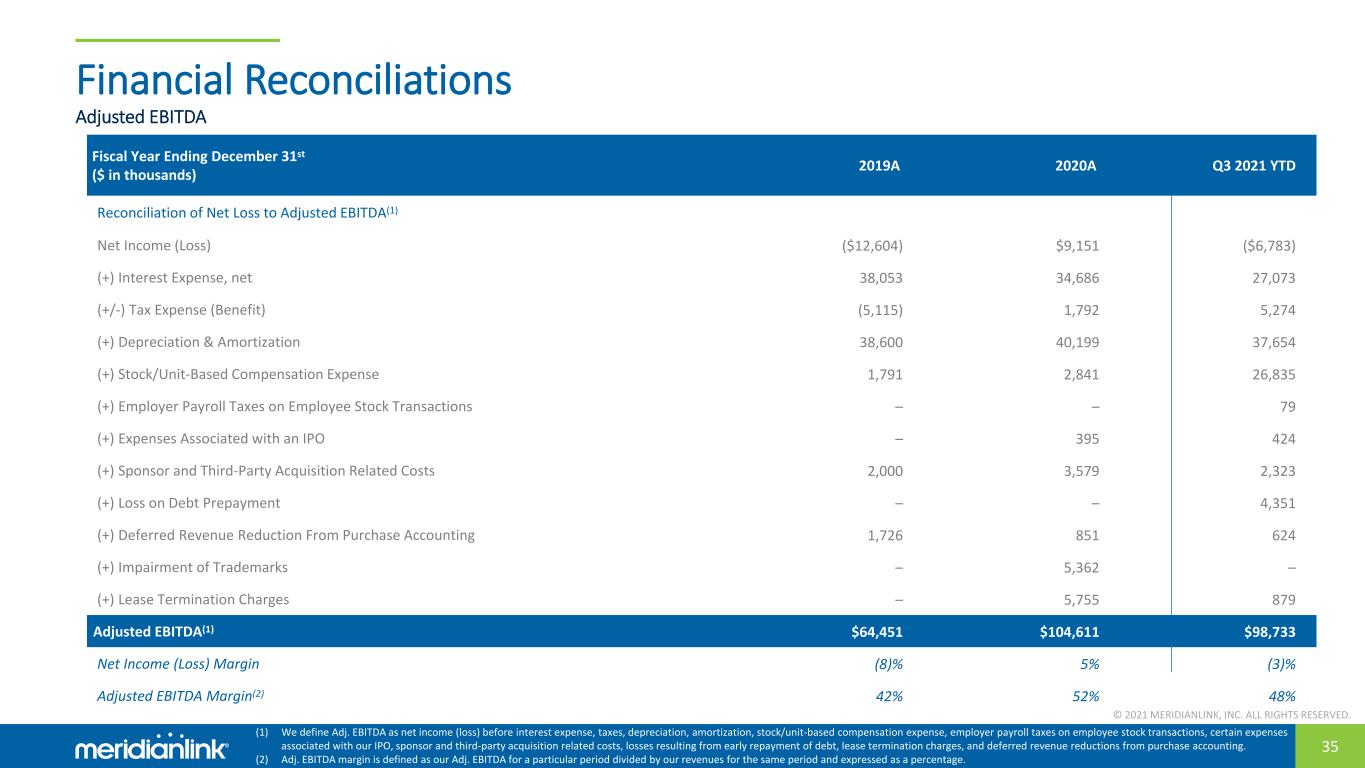
© 2021 MERIDIANLINK, INC. ALL RIGHTS RESERVED. 35 Financial Reconciliations Fiscal Year Ending December 31st ($ in thousands) 2019A 2020A Q3 2021 YTD Reconciliation of Net Loss to Adjusted EBITDA(1) Net Income (Loss) ($12,604) $9,151 ($6,783) (+) Interest Expense, net 38,053 34,686 27,073 (+/-) Tax Expense (Benefit) (5,115) 1,792 5,274 (+) Depreciation & Amortization 38,600 40,199 37,654 (+) Stock/Unit-Based Compensation Expense 1,791 2,841 26,835 (+) Employer Payroll Taxes on Employee Stock Transactions – – 79 (+) Expenses Associated with an IPO – 395 424 (+) Sponsor and Third-Party Acquisition Related Costs 2,000 3,579 2,323 (+) Loss on Debt Prepayment – – 4,351 (+) Deferred Revenue Reduction From Purchase Accounting 1,726 851 624 (+) Impairment of Trademarks – 5,362 – (+) Lease Termination Charges – 5,755 879 Adjusted EBITDA(1) $64,451 $104,611 $98,733 Net Income (Loss) Margin (8)% 5% (3)% Adjusted EBITDA Margin(2) 42% 52% 48% (1) We define Adj. EBITDA as net income (loss) before interest expense, taxes, depreciation, amortization, stock/unit-based compensation expense, employer payroll taxes on employee stock transactions, certain expenses associated with our IPO, sponsor and third-party acquisition related costs, losses resulting from early repayment of debt, lease termination charges, and deferred revenue reductions from purchase accounting. (2) Adj. EBITDA margin is defined as our Adj. EBITDA for a particular period divided by our revenues for the same period and expressed as a percentage. Adjusted EBITDA

© 2021 MERIDIANLINK, INC. ALL RIGHTS RESERVED. 36 Financial Reconciliations (Cont’d) ($ in thousands) 2019A 2020A Q3 2021 YTD Revenues, net $152,731 $199,340 $203,652 Cost of revenue 47,322 58,354 67,268 (-) Stock/unit-based compensation expense 87 180 5,461 (-) Employer payroll taxes on employee stock transactions – – 3 (-) Amortization of developed technology 7,771 8,874 9,190 Non-GAAP cost of revenue 39,464 49,300 52,614 Non-GAAP gross profit $113,267 $150,040 $151,038 Non-GAAP gross margin 74% 75% 74% Non-GAAP Gross Margin ($ in thousands) 2019A 2020A Q3 2021 YTD Net income (loss) ($12,604) $9,151 ($6,783) (+) Stock/unit-based compensation expense 1,791 2,841 26,835 (+) Employer payroll taxes on employee stock transactions – – 79 (+) Sponsor and third-party acquisition related costs 2,000 3,579 2,323 Non-GAAP net income ($8,813) $15,571 $22,454 Non-GAAP basic net income per share ($0.18) $0.30 $0.38 Non-GAAP diluted net income per share – 0.27 0.36 Weighted average shares used to compute Non-GAAP basic net income per share 49,949,858 51,153,041 58,495,073 Weighted average shares used to compute Non-GAAP diluted net income per share – 57,023,685 61,552,071 Non-GAAP net income margin (6)% 8% 11% Non-GAAP Net Income

© 2021 MERIDIANLINK, INC. ALL RIGHTS RESERVED. 37 Financial Reconciliations (Cont’d) ($ in thousands) 2019A 2020A Q3 2021 YTD Sales and marketing $9,589 $9,371 $13,817 (-) Stock/unit-based compensation expense 228 370 2,152 (-) Employer payroll taxes on employee stock transactions – – 9 Non-GAAP sales and marketing $9,361 $9,001 $11,656 % of revenue 6% 5% 6% Non-GAAP Sales and Marketing Expense ($ in thousands) 2019A 2020A Q3 2021 YTD Research and development $15,966 $18,691 $27,807 (-) Stock/unit-based compensation expense 169 339 6,358 (-) Employer payroll taxes on employee stock transactions – – 8 Non-GAAP research and development $15,797 $18,352 $21,441 % of revenue 10% 9% 11% Non-GAAP Research and Development Expense ($ in thousands) 2019A 2020A Q3 2021 YTD General and administrative $59,536 $54,640 $64,884 (-) Stock/unit-based compensation expense 1,307 1,952 12,864 (-) Employer payroll taxes on employee stock transactions – – 59 (-) Depreciation expense 2,656 2,516 1,743 (-) Amortization of intangibles 28,173 28,809 26,721 Non-GAAP general and administrative $27,400 $21,363 $23,497 % of revenue 18% 11% 12% Non-GAAP General and Administrative Expense
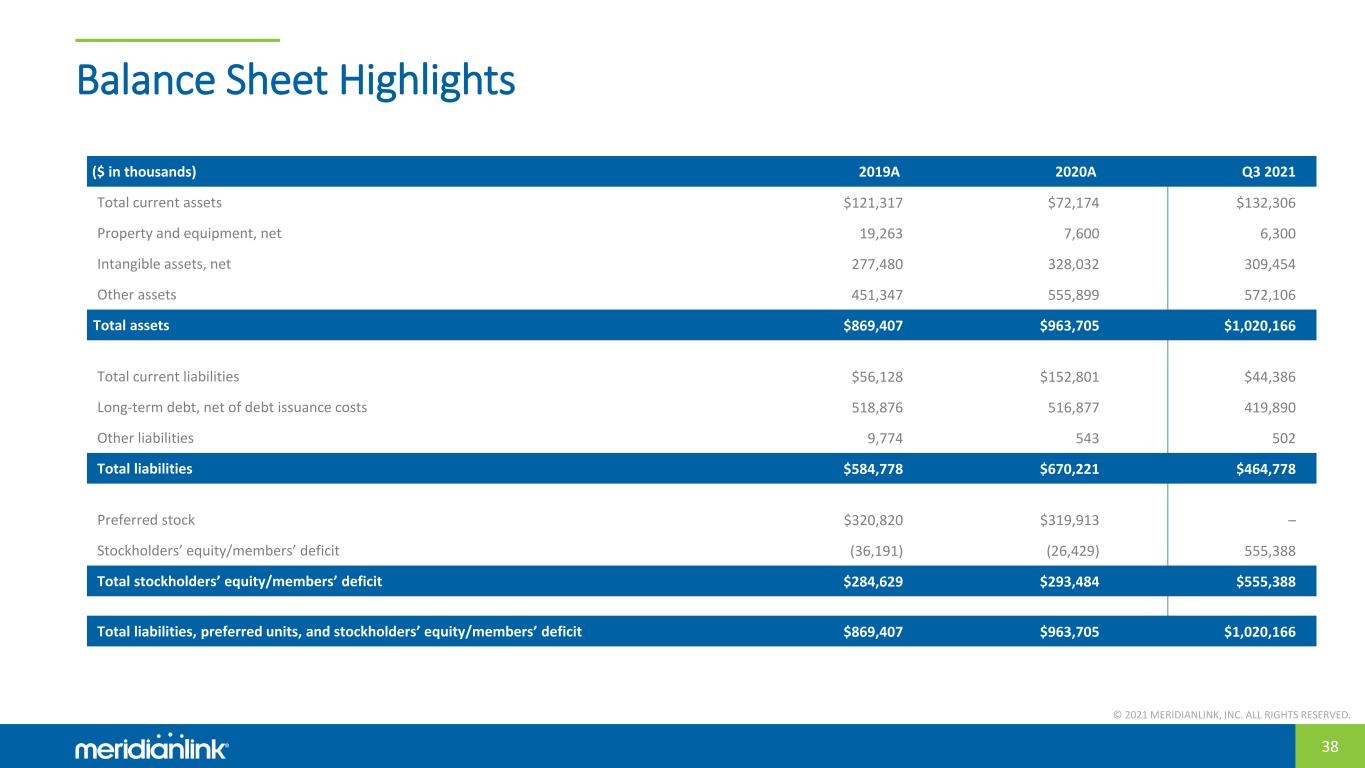
© 2021 MERIDIANLINK, INC. ALL RIGHTS RESERVED. 38 Balance Sheet Highlights ($ in thousands) 2019A 2020A Q3 2021 Total current assets $121,317 $72,174 $132,306 Property and equipment, net 19,263 7,600 6,300 Intangible assets, net 277,480 328,032 309,454 Other assets 451,347 555,899 572,106 Total assets $869,407 $963,705 $1,020,166 Total current liabilities $56,128 $152,801 $44,386 Long-term debt, net of debt issuance costs 518,876 516,877 419,890 Other liabilities 9,774 543 502 Total liabilities $584,778 $670,221 $464,778 Preferred stock $320,820 $319,913 – Stockholders’ equity/members’ deficit (36,191) (26,429) 555,388 Total stockholders’ equity/members’ deficit $284,629 $293,484 $555,388 Total liabilities, preferred units, and stockholders’ equity/members’ deficit $869,407 $963,705 $1,020,166
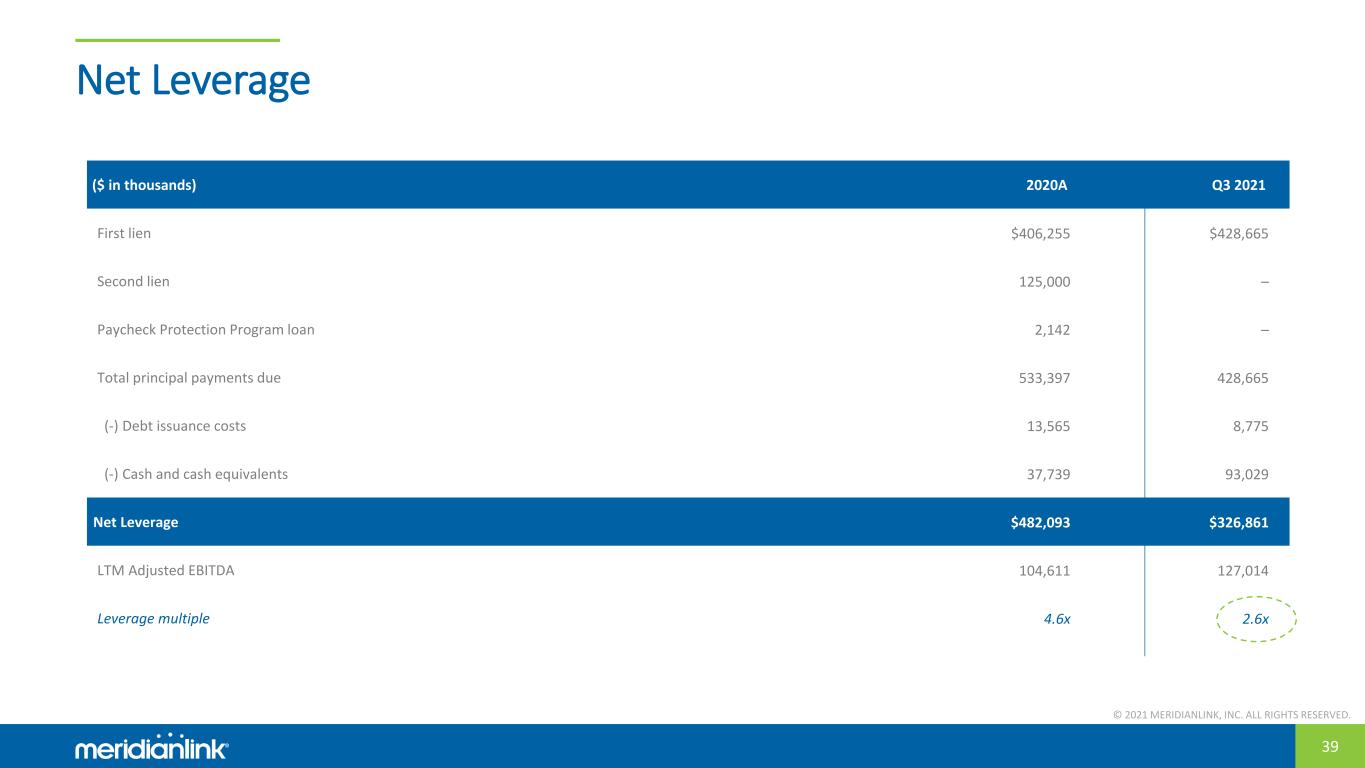
© 2021 MERIDIANLINK, INC. ALL RIGHTS RESERVED. 39 Net Leverage ($ in thousands) 2020A Q3 2021 First lien $406,255 $428,665 Second lien 125,000 – Paycheck Protection Program loan 2,142 – Total principal payments due 533,397 428,665 (-) Debt issuance costs 13,565 8,775 (-) Cash and cash equivalents 37,739 93,029 Net Leverage $482,093 $326,861 LTM Adjusted EBITDA 104,611 127,014 Leverage multiple 4.6x 2.6x

© 2021 MERIDIANLINK, INC. ALL RIGHTS RESERVED. 40 InvestorRelations@meridianlink.com © 2021 MERIDIANLINK, INC. ALL RIGHTS RESERVED.


