
© 2023 MERIDIANLINK, INC. ALL RIGHTS RESERVED. CONFIDENTIAL Transforming financial services for the better. © 2023 MERIDIANLINK, INC. ALL RIGHTS RESERVED. Second Quarter 2023 Review August 2023 Exhibit 99.2

© 2023 MERIDIANLINK, INC. ALL RIGHTS RESERVED. 2 Disclaimer Information in this presentation and the accompanying oral presentation, including any statements regarding MeridianLink’s customer data and other metrics, is based on data and analyses from various sources as of December 31, 2022, unless otherwise indicated. Information in this presentation and the accompanying oral presentation contain forward-looking statements within the meaning of Section 27A of the Securities Act of 1933, as amended, and Section 21E of the Securities Exchange Act of 1934, as amended, which statements involve substantial risks and uncertainties. Forward-looking statements generally relate to future events or our future financial or operating performance. All statements other than statements of historical fact included in this presentation and the accompanying oral presentation, including statements regarding, and guidance with respect to, our strategy, future operations, financial position, projected costs, projected long-term operating model, our future financial and operational performance, prospects, market size and growth opportunities, future economic conditions, competitive position, strategic initiatives, development or delivery of new or enhanced solutions, technological capabilities, plans, and objectives of management are forward-looking statements. In some cases, you can identify forward-looking statements because they contain words such as “may,” “should,” “expects,” “plans,” “anticipates,” “could,” “intends,” “target,” “projects,” “contemplates,” “believes,” “estimates,” “predicts,” “potential,” or “continue” or the negative of these words or other similar terms or expressions that concern our expectations, strategy, plans, or intentions. These forward-looking statements reflect our predictions, expectations, or forecasts. Actual results may differ materially from those described in the forward- looking statements and will be affected by a variety of risks and factors that are beyond our control including, without limitation, risks related to economic and market conditions, including interest rate fluctuations; our ability to retain and attract customers; our ability to expand and evolve our offerings, features, and functionalities or respond to rapid technological changes; our ability to identify and integrate strategic initiatives, including anticipated benefits of an acquisition; our restructuring plan, including expected associated timing, benefits, and costs; our stock repurchase program, including the execution and amount of repurchases; our ability to compete in a highly- fragmented and competitive landscape; market demand for our products and solutions; our ability to effectively implement, integrate, and service our customers; our ability to retain and attract product partners; our commercial disputes, including potential losses related thereto; our future financial performance, including, but not limited to, trends in revenue, costs of revenue, gross profit or gross margin, operating expenses, and number of customers; and our high levels of indebtedness; as well as those set forth in Item 1A. Risk Factors, or elsewhere, in our Annual Report on Form 10-K for the most recently ended fiscal year, any updates in our Quarterly Reports on Form 10-Q filed for periods subsequent to such Form 10-K, and our other SEC filings. These forward-looking statements are based on reasonable assumptions as of the date hereof. The plans, intentions, or expectations disclosed in our forward-looking statements may not be achieved, and you should not rely upon forward-looking statements as predictions of future events. We undertake no obligation, other than as required by applicable law, to update any forward-looking statements, whether as a result of new information, future events, or otherwise. This presentation contains statistical data, estimates, and forecasts that are based on independent industry publications or other publicly available information, as well as other information based on our internal sources. This information involves many assumptions and limitations, and you are cautioned not to give undue weight to these estimates. We have not independently verified the accuracy or completeness of the data contained in these industry publications and other publicly available information. Accordingly, we make no representations as to the accuracy or completeness of that data nor do we undertake to update such data after the date of this presentation. This presentation includes trademarks, which are protected under applicable intellectual property laws and are the property of MeridianLink, Inc. or its subsidiaries. This presentation also contains trademarks, service marks, copyrights, and trade names of other companies, which are the property of their respective owners and are used for reference purposes only. Such use should not be construed as an endorsement of the platform and products of MeridianLink. Solely for convenience, trademarks and trade names may appear without the ® or ™ symbols, but such references are not intended to indicate that, with respect to our intellectual property, we will not assert, to the fullest extent under applicable law, our rights or the right of the applicable licensor to these trademarks and trade names.
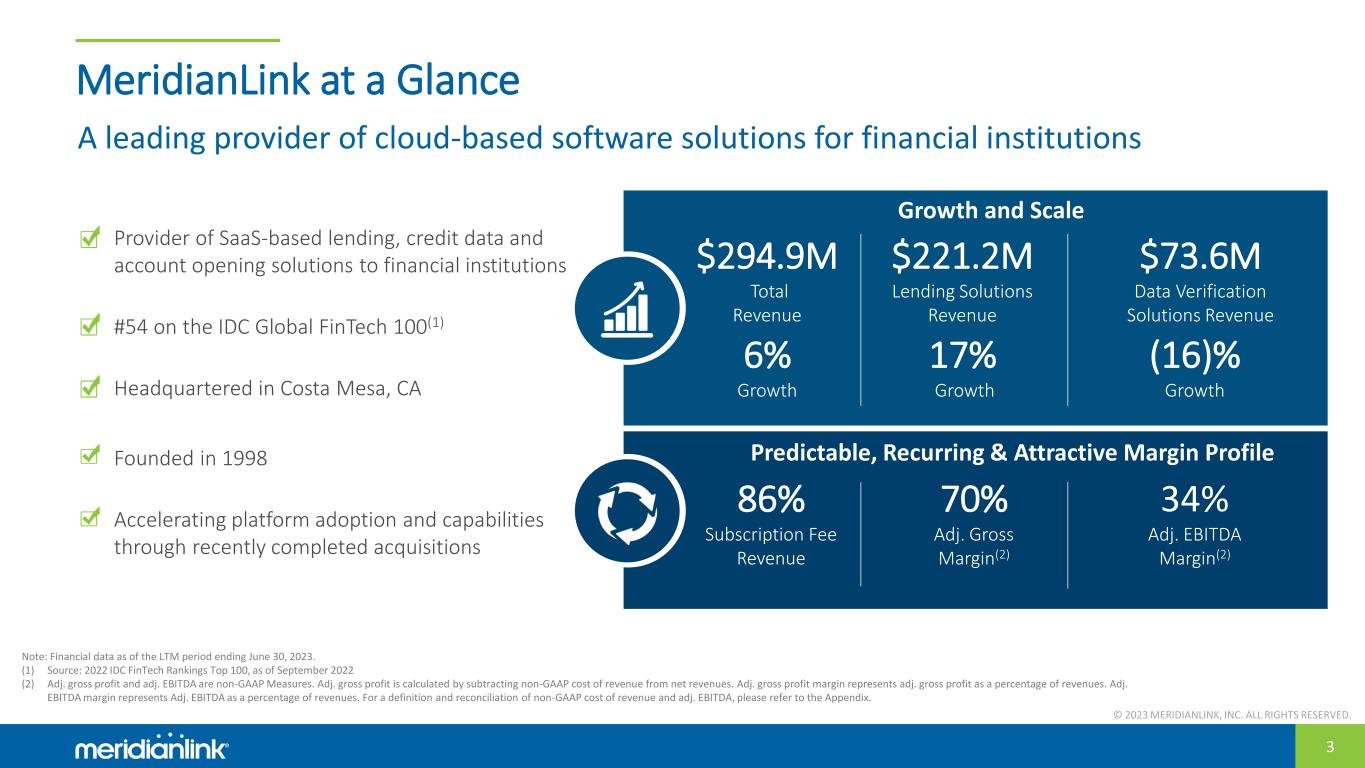
© 2023 MERIDIANLINK, INC. ALL RIGHTS RESERVED. 3 • Provider of SaaS-based lending, credit data and account opening solutions to financial institutions • #54 on the IDC Global FinTech 100(1) • Headquartered in Costa Mesa, CA • Founded in 1998 • Accelerating platform adoption and capabilities through recently completed acquisitions $73.6M Data Verification Solutions Revenue $221.2M Lending Solutions Revenue MeridianLink at a Glance Growth and Scale Predictable, Recurring & Attractive Margin Profile A leading provider of cloud-based software solutions for financial institutions $294.9M Total Revenue 86% Subscription Fee Revenue 70% Adj. Gross Margin(2) 34% Adj. EBITDA Margin(2) Note: Financial data as of the LTM period ending June 30, 2023. (1) Source: 2022 IDC FinTech Rankings Top 100, as of September 2022 (2) Adj. gross profit and adj. EBITDA are non-GAAP Measures. Adj. gross profit is calculated by subtracting non-GAAP cost of revenue from net revenues. Adj. gross profit margin represents adj. gross profit as a percentage of revenues. Adj. EBITDA margin represents Adj. EBITDA as a percentage of revenues. For a definition and reconciliation of non-GAAP cost of revenue and adj. EBITDA, please refer to the Appendix. (16)% Growth 17% Growth 6% Growth
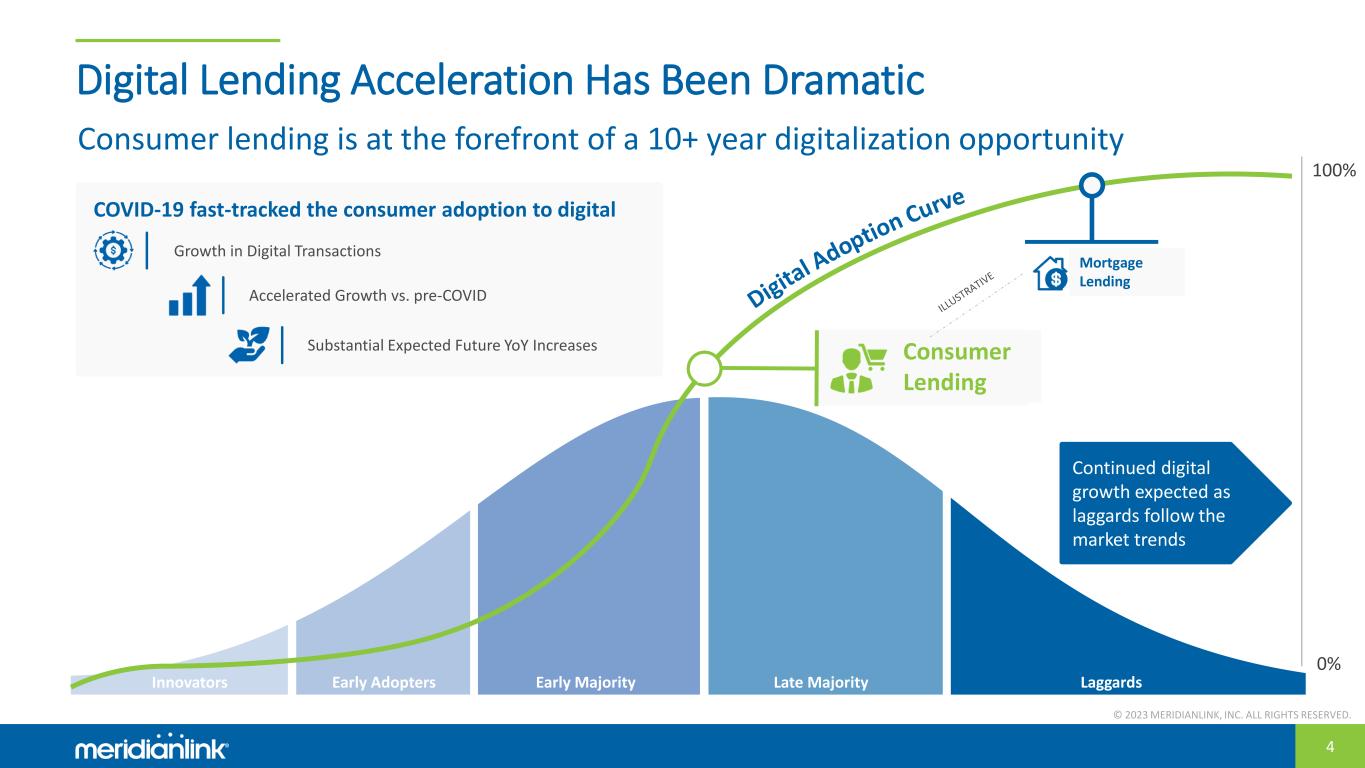
© 2023 MERIDIANLINK, INC. ALL RIGHTS RESERVED. 4 Digital Lending Acceleration Has Been Dramatic Late Majority LaggardsInnovators Early Adopters Early Majority 0% 100% COVID-19 fast-tracked the consumer adoption to digital Growth in Digital Transactions Accelerated Growth vs. pre-COVID Substantial Expected Future YoY Increases Continued digital growth expected as laggards follow the market trends Consumer Lending 20 20 Mortgage Lending Consumer lending is at the forefront of a 10+ year digitalization opportunity

© 2023 MERIDIANLINK, INC. ALL RIGHTS RESERVED. 5 Large TAM with Significant Runway LEVEL 01 LEVEL 02 LEVEL 03 LEVEL 04 LEVEL 05 ~$10B Total Addressable Market MeridianLink serves nearly the entire consumer lending wallet with significant opportunity to expand across the entire addressable market Loan Origination(1) Portfolio & Lending Performance Account Opening & Point-of-Sale Collections Data Access: Consumer Data & CRA Enablement Source: Cornerstone Advisors. (1) Loan origination market size is inclusive of consumer, mortgage, and commercial loan origination.
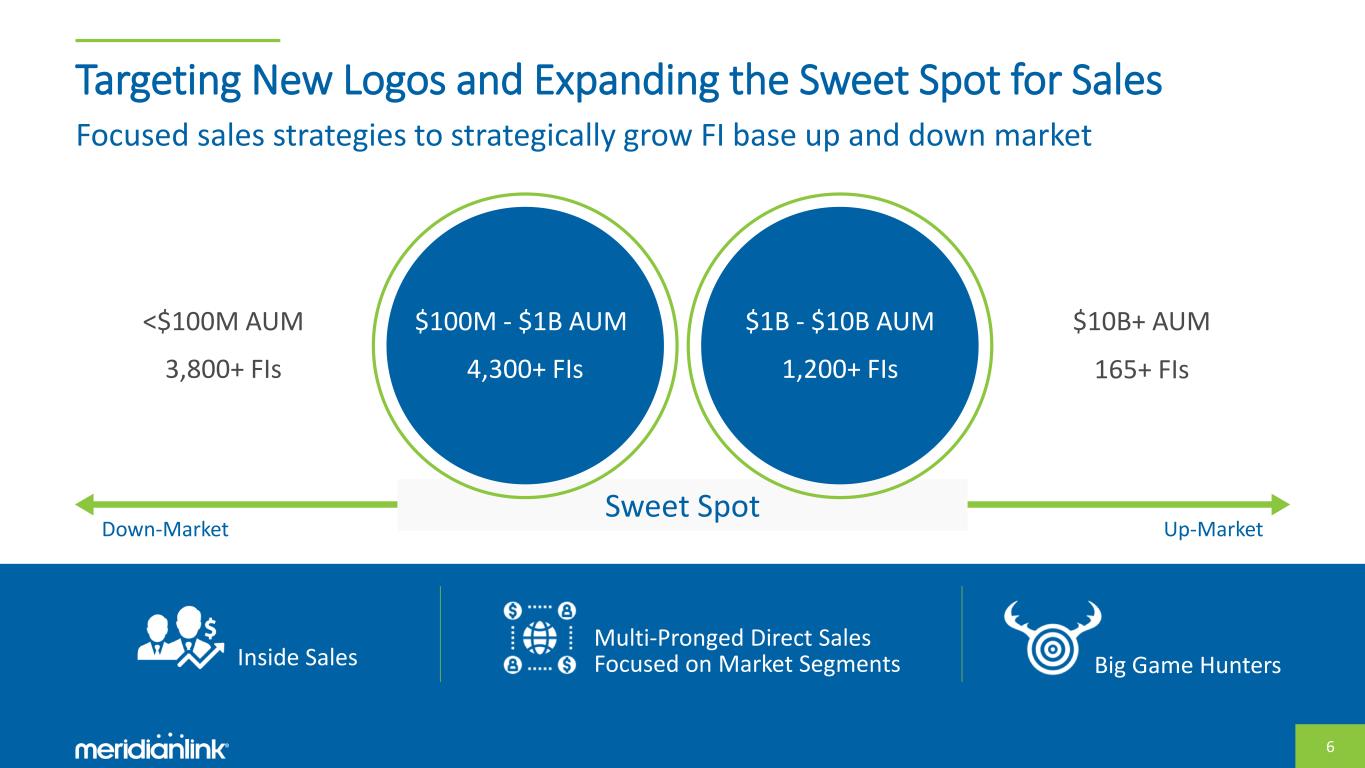
© 2023 MERIDIANLINK, INC. ALL RIGHTS RESERVED. 6 Targeting New Logos and Expanding the Sweet Spot for Sales Big Game Hunters Multi-Pronged Direct Sales Focused on Market Segments Up-MarketDown-Market Sweet Spot <$100M AUM $1B - $10B AUM 3,800+ FIs $10B+ AUM 165+ FIs1,200+ FIs $100M - $1B AUM 4,300+ FIs Inside Sales Focused sales strategies to strategically grow FI base up and down market
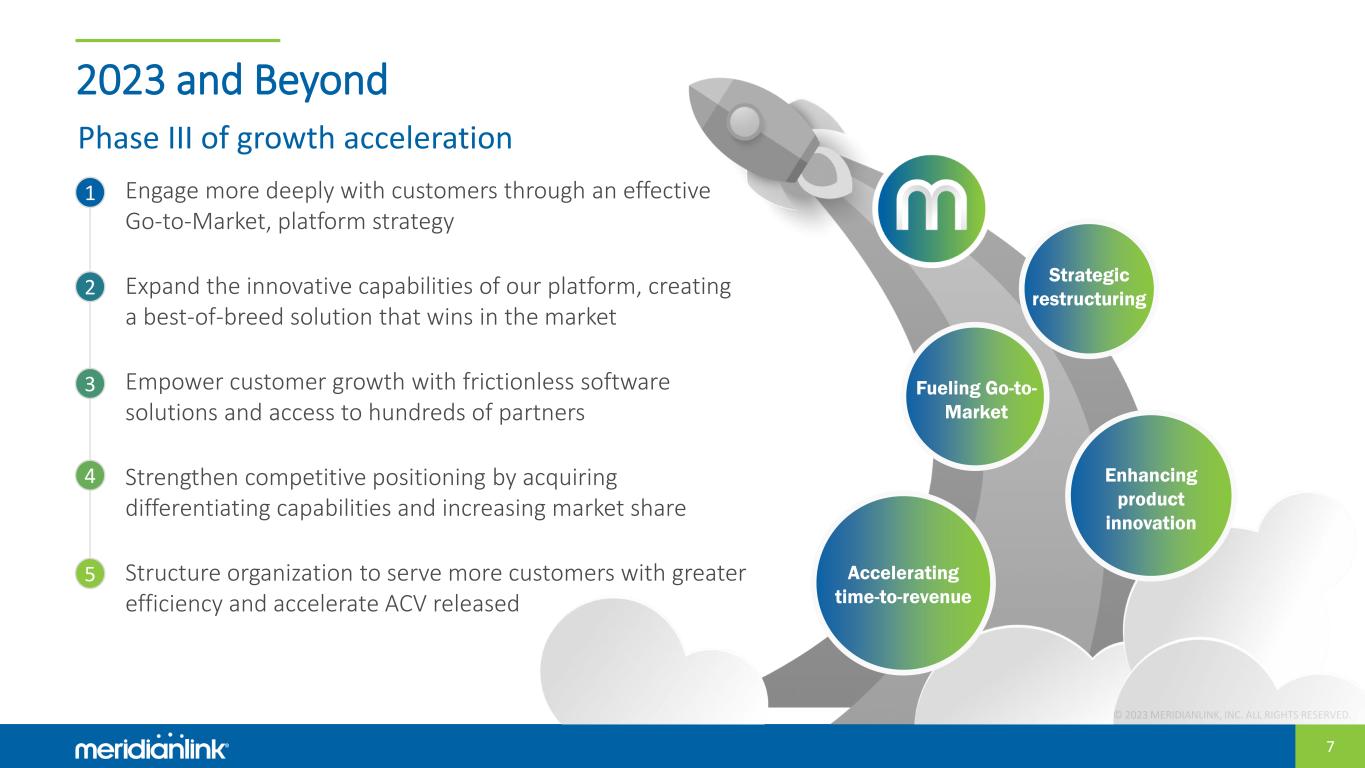
© 2023 MERIDIANLINK, INC. ALL RIGHTS RESERVED. 7 Strategic restructuring Fueling Go-to- Market Enhancing product innovation Accelerating time-to-revenue • Engage more deeply with customers through an effective Go-to-Market, platform strategy • Expand the innovative capabilities of our platform, creating a best-of-breed solution that wins in the market • Empower customer growth with frictionless software solutions and access to hundreds of partners • Strengthen competitive positioning by acquiring differentiating capabilities and increasing market share • Structure organization to serve more customers with greater efficiency and accelerate ACV released 2023 and Beyond 1 2 4 3 5 Phase III of growth acceleration
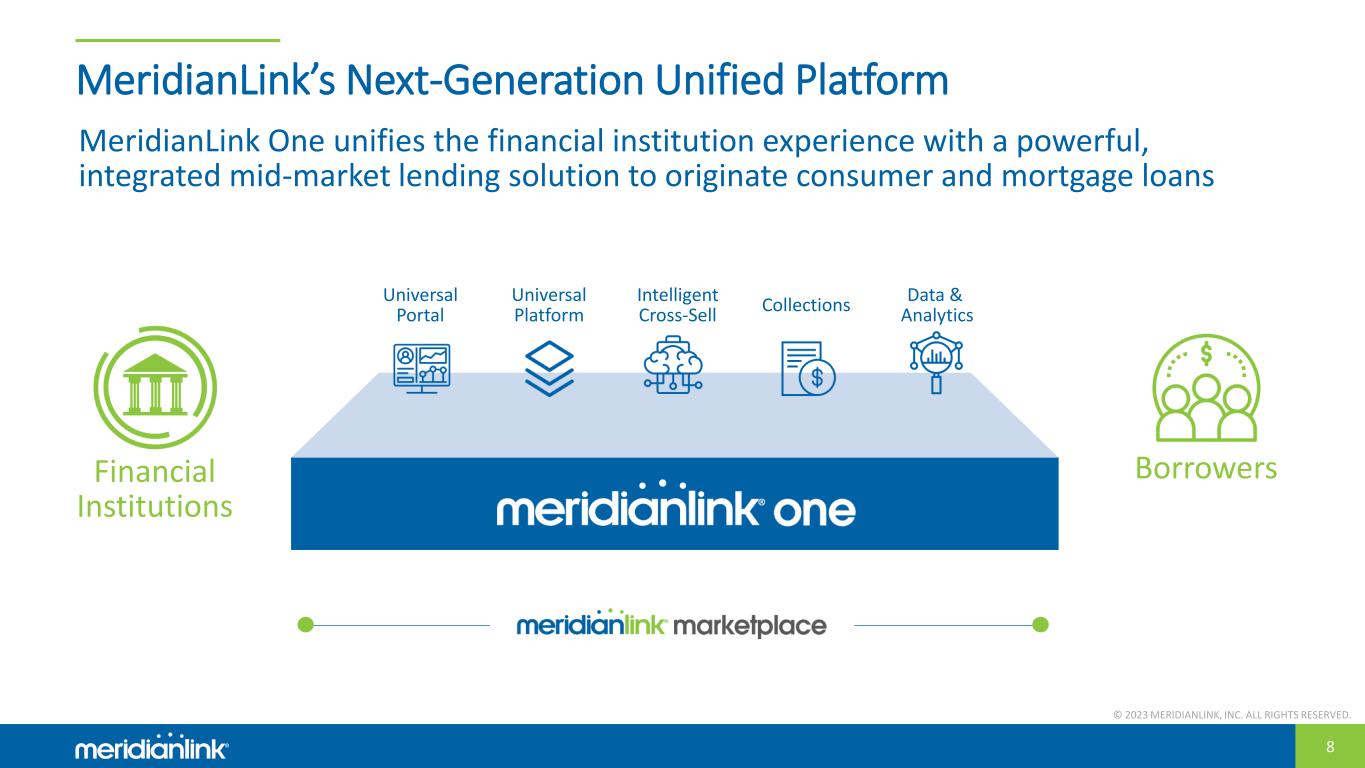
© 2023 MERIDIANLINK, INC. ALL RIGHTS RESERVED. 8 MeridianLink’s Next-Generation Unified Platform MeridianLink One unifies the financial institution experience with a powerful, integrated mid-market lending solution to originate consumer and mortgage loans Financial Institutions Borrowers Universal Platform Intelligent Cross-Sell Collections Universal Portal Data & Analytics
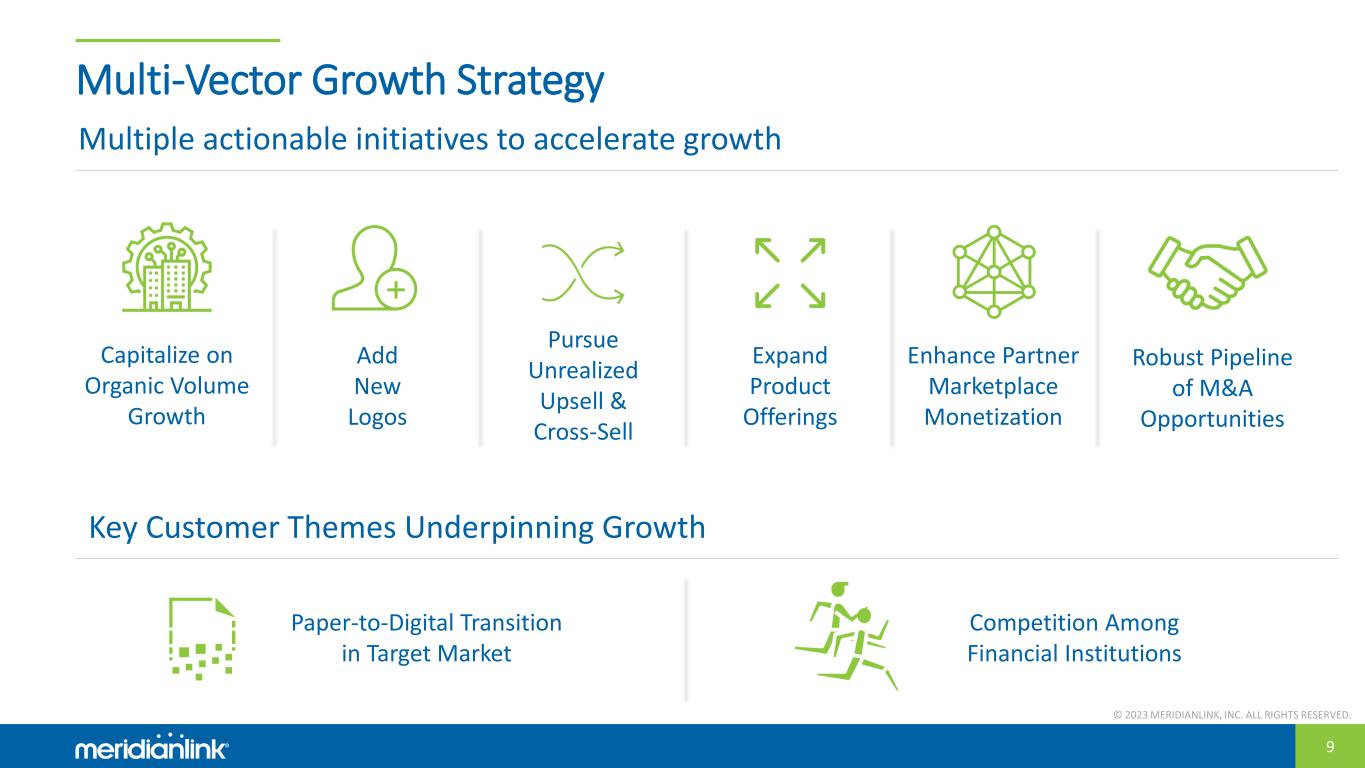
© 2023 MERIDIANLINK, INC. ALL RIGHTS RESERVED. 9 Multi-Vector Growth Strategy Expand Product Offerings Enhance Partner Marketplace Monetization Add New Logos Capitalize on Organic Volume Growth Robust Pipeline of M&A Opportunities Multiple actionable initiatives to accelerate growth Pursue Unrealized Upsell & Cross-Sell Key Customer Themes Underpinning Growth Paper-to-Digital Transition in Target Market Competition Among Financial Institutions
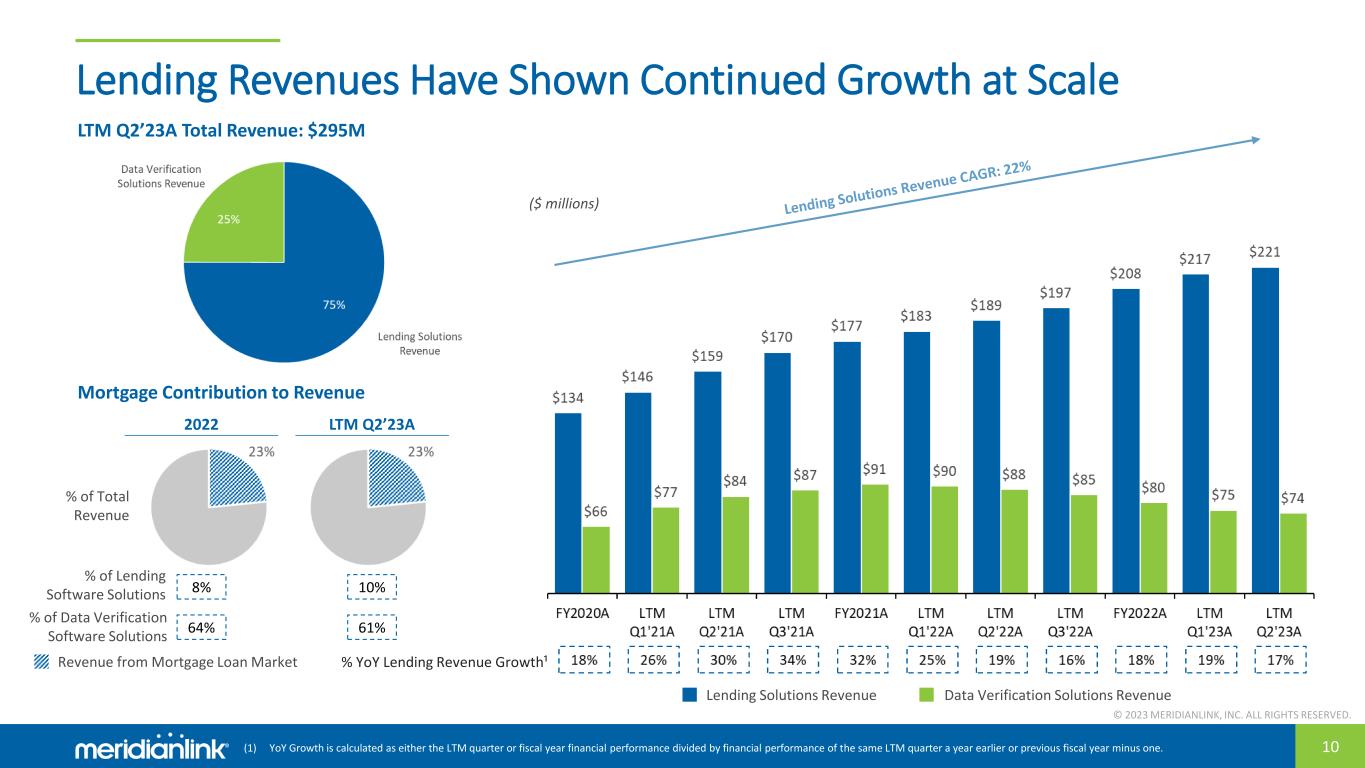
© 2023 MERIDIANLINK, INC. ALL RIGHTS RESERVED. 10 Lending Revenues Have Shown Continued Growth at Scale Lending Solutions Revenue Data Verification Solutions Revenue LTM Q2’23A Total Revenue: $295M % YoY Lending Revenue Growth¹Revenue from Mortgage Loan Market % of Total Revenue % of Lending Software Solutions % of Data Verification Software Solutions 2022 LTM Q2’23A 8% 64% 10% 61% Mortgage Contribution to Revenue ($ millions) (1) YoY Growth is calculated as either the LTM quarter or fiscal year financial performance divided by financial performance of the same LTM quarter a year earlier or previous fiscal year minus one.
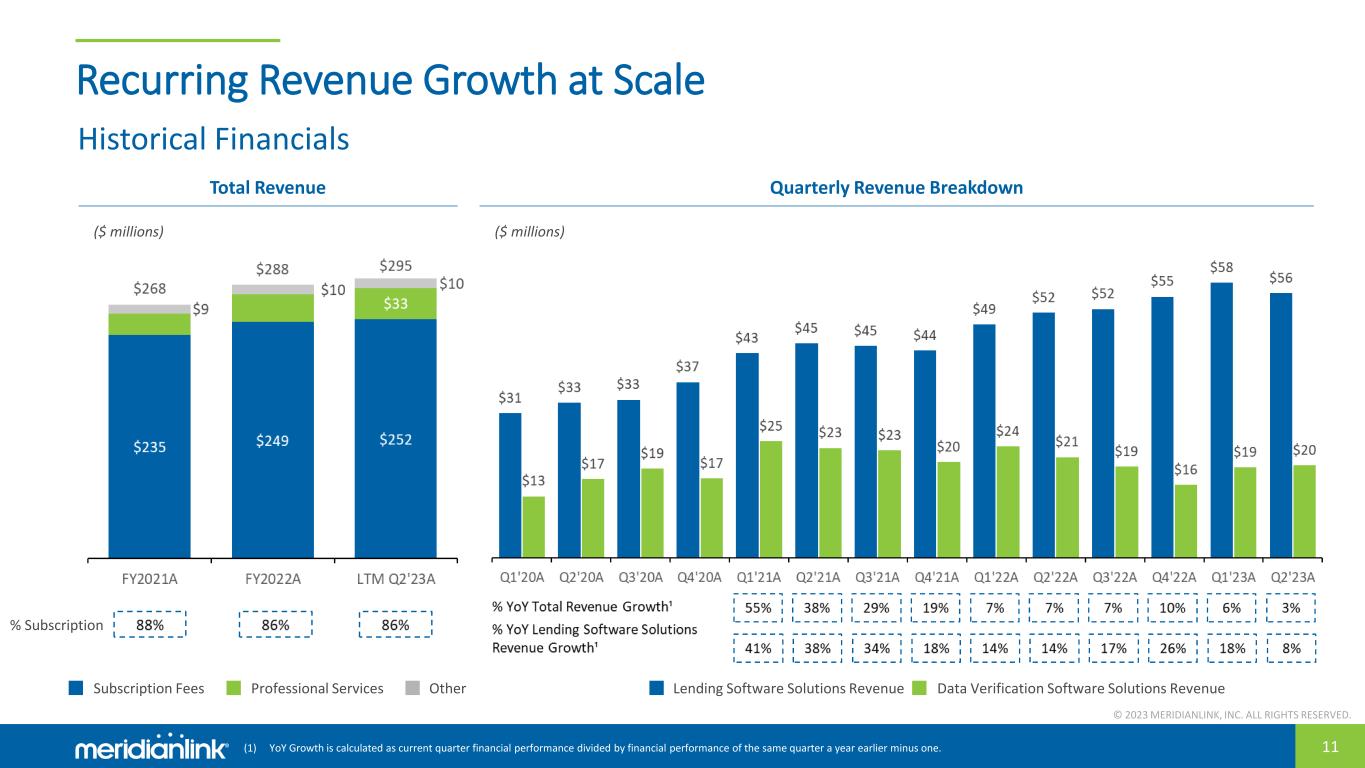
© 2023 MERIDIANLINK, INC. ALL RIGHTS RESERVED. 11 Recurring Revenue Growth at Scale Total Revenue Quarterly Revenue Breakdown ($ millions) ($ millions) % Subscription Professional Services OtherSubscription Fees Lending Software Solutions Revenue Data Verification Software Solutions Revenue Historical Financials (1) YoY Growth is calculated as current quarter financial performance divided by financial performance of the same quarter a year earlier minus one.
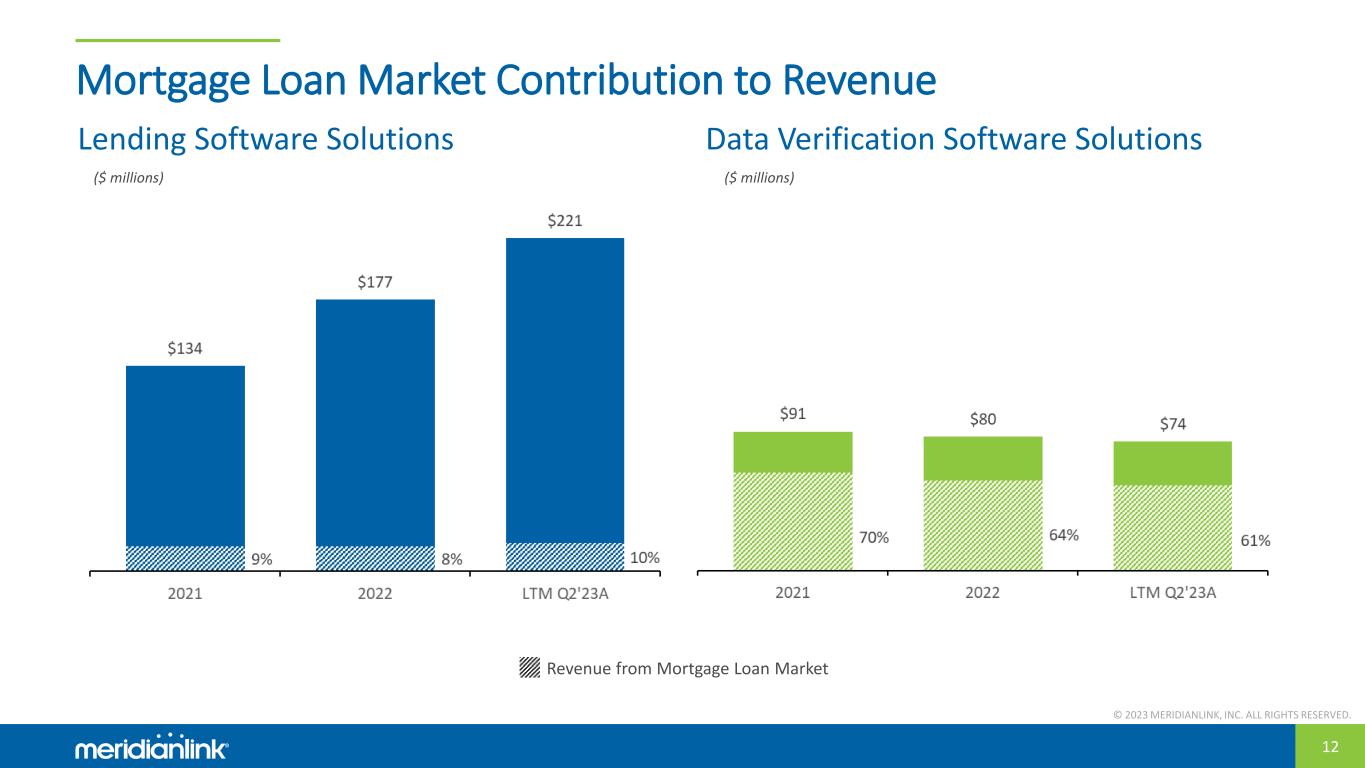
© 2023 MERIDIANLINK, INC. ALL RIGHTS RESERVED. 12 Mortgage Loan Market Contribution to Revenue Lending Software Solutions Data Verification Software Solutions Revenue from Mortgage Loan Market ($ millions) ($ millions)
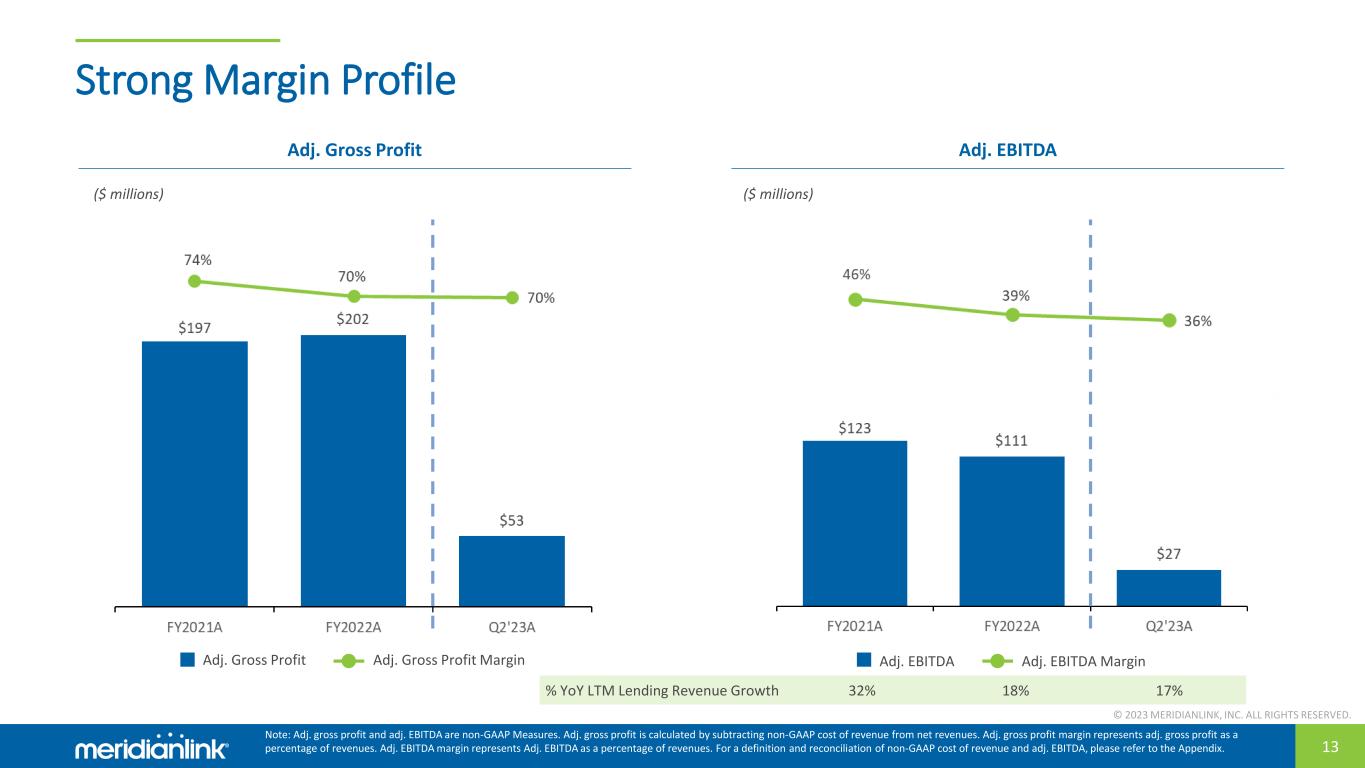
© 2023 MERIDIANLINK, INC. ALL RIGHTS RESERVED. 13 Strong Margin Profile Adj. Gross Profit Adj. EBITDA ($ millions) ($ millions) Adj. Gross Profit Adj. Gross Profit Margin Adj. EBITDA Adj. EBITDA Margin Note: Adj. gross profit and adj. EBITDA are non-GAAP Measures. Adj. gross profit is calculated by subtracting non-GAAP cost of revenue from net revenues. Adj. gross profit margin represents adj. gross profit as a percentage of revenues. Adj. EBITDA margin represents Adj. EBITDA as a percentage of revenues. For a definition and reconciliation of non-GAAP cost of revenue and adj. EBITDA, please refer to the Appendix. % YoY LTM Lending Revenue Growth 32% 18% 17%
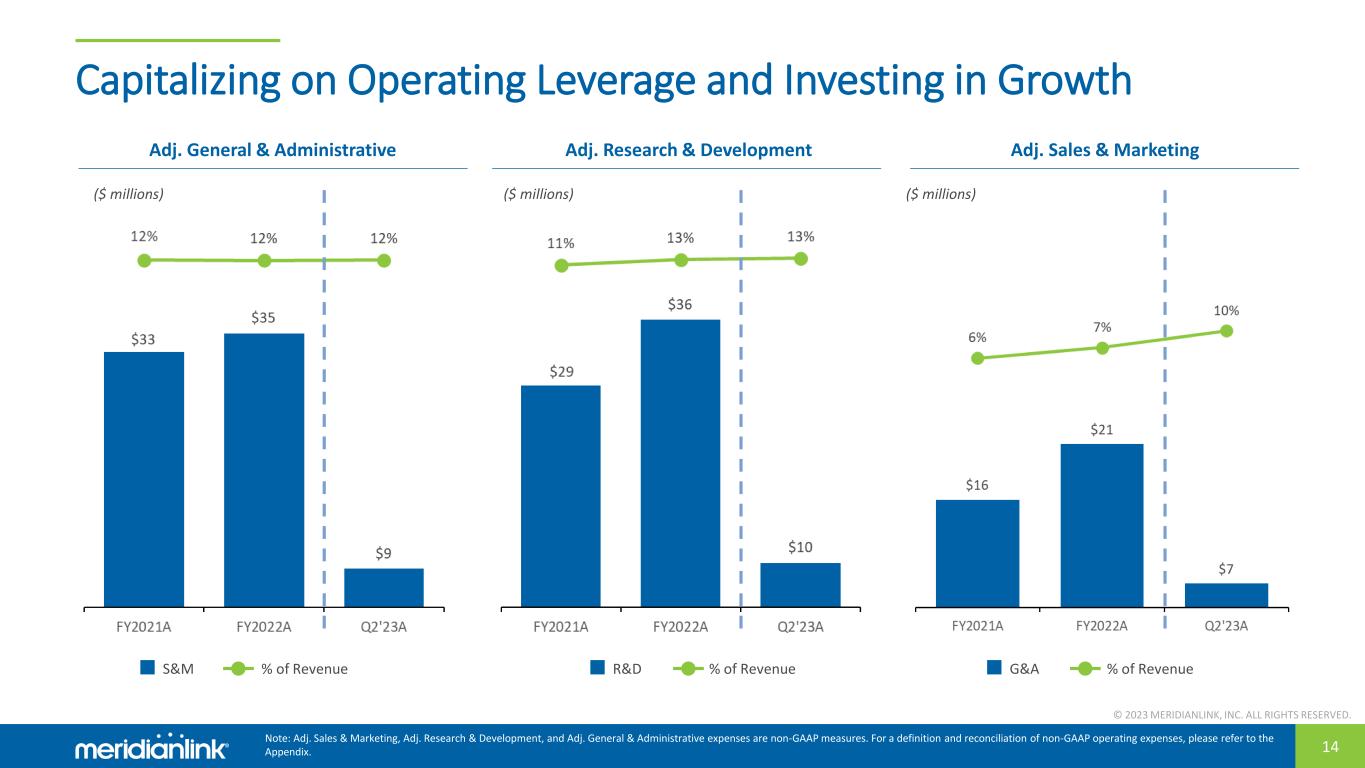
© 2023 MERIDIANLINK, INC. ALL RIGHTS RESERVED. 14 Capitalizing on Operating Leverage and Investing in Growth Adj. General & Administrative Adj. Research & Development Adj. Sales & Marketing ($ millions) ($ millions) ($ millions) S&M % of Revenue R&D % of Revenue G&A % of Revenue Note: Adj. Sales & Marketing, Adj. Research & Development, and Adj. General & Administrative expenses are non-GAAP measures. For a definition and reconciliation of non-GAAP operating expenses, please refer to the Appendix.
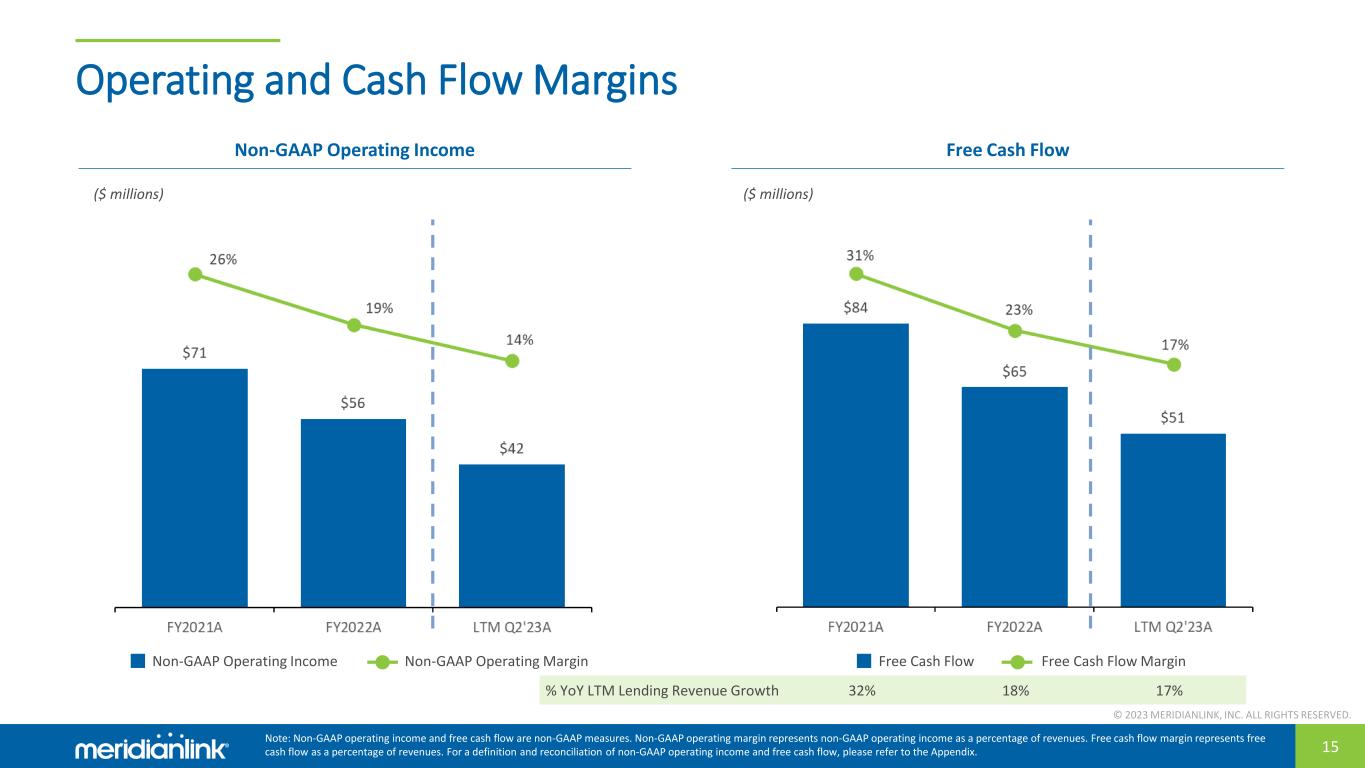
© 2023 MERIDIANLINK, INC. ALL RIGHTS RESERVED. 15 Operating and Cash Flow Margins Non-GAAP Operating Income Free Cash Flow ($ millions) ($ millions) Non-GAAP Operating Income Non-GAAP Operating Margin Note: Non-GAAP operating income and free cash flow are non-GAAP measures. Non-GAAP operating margin represents non-GAAP operating income as a percentage of revenues. Free cash flow margin represents free cash flow as a percentage of revenues. For a definition and reconciliation of non-GAAP operating income and free cash flow, please refer to the Appendix. Free Cash Flow Free Cash Flow Margin % YoY LTM Lending Revenue Growth 32% 18% 17%
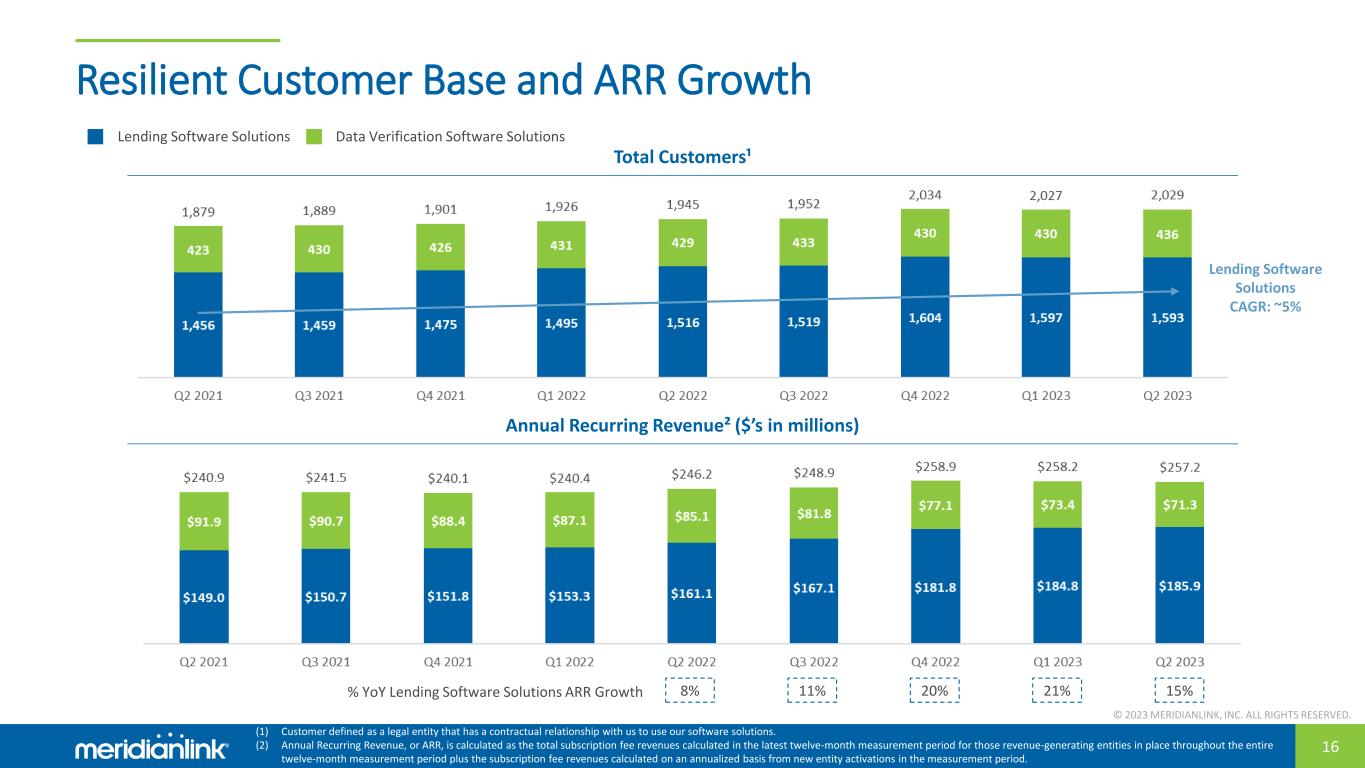
© 2023 MERIDIANLINK, INC. ALL RIGHTS RESERVED. 16 Resilient Customer Base and ARR Growth Lending Software Solutions CAGR: ~5% Total Customers¹ Annual Recurring Revenue² ($’s in millions) 8% 15%21%20%11%% YoY Lending Software Solutions ARR Growth Data Verification Software SolutionsLending Software Solutions (1) Customer defined as a legal entity that has a contractual relationship with us to use our software solutions. (2) Annual Recurring Revenue, or ARR, is calculated as the total subscription fee revenues calculated in the latest twelve-month measurement period for those revenue-generating entities in place throughout the entire twelve-month measurement period plus the subscription fee revenues calculated on an annualized basis from new entity activations in the measurement period.
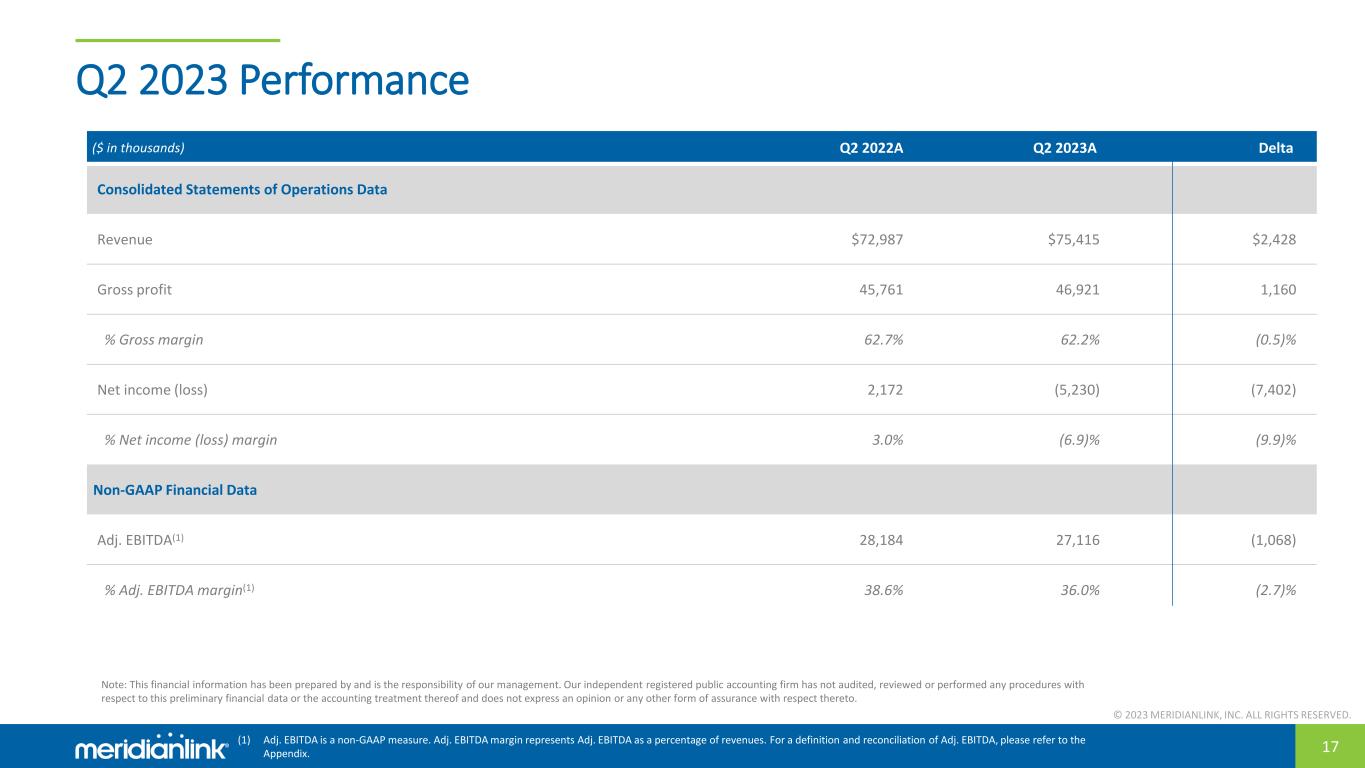
© 2023 MERIDIANLINK, INC. ALL RIGHTS RESERVED. 17 Q2 2023 Performance ($ in thousands) Q2 2022A Q2 2023A Delta Consolidated Statements of Operations Data Revenue $72,987 $75,415 $2,428 Gross profit 45,761 46,921 1,160 % Gross margin 62.7% 62.2% (0.5)% Net income (loss) 2,172 (5,230) (7,402) % Net income (loss) margin 3.0% (6.9)% (9.9)% Non-GAAP Financial Data Adj. EBITDA(1) 28,184 27,116 (1,068) % Adj. EBITDA margin(1) 38.6% 36.0% (2.7)% Note: This financial information has been prepared by and is the responsibility of our management. Our independent registered public accounting firm has not audited, reviewed or performed any procedures with respect to this preliminary financial data or the accounting treatment thereof and does not express an opinion or any other form of assurance with respect thereto. (1) Adj. EBITDA is a non-GAAP measure. Adj. EBITDA margin represents Adj. EBITDA as a percentage of revenues. For a definition and reconciliation of Adj. EBITDA, please refer to the Appendix.
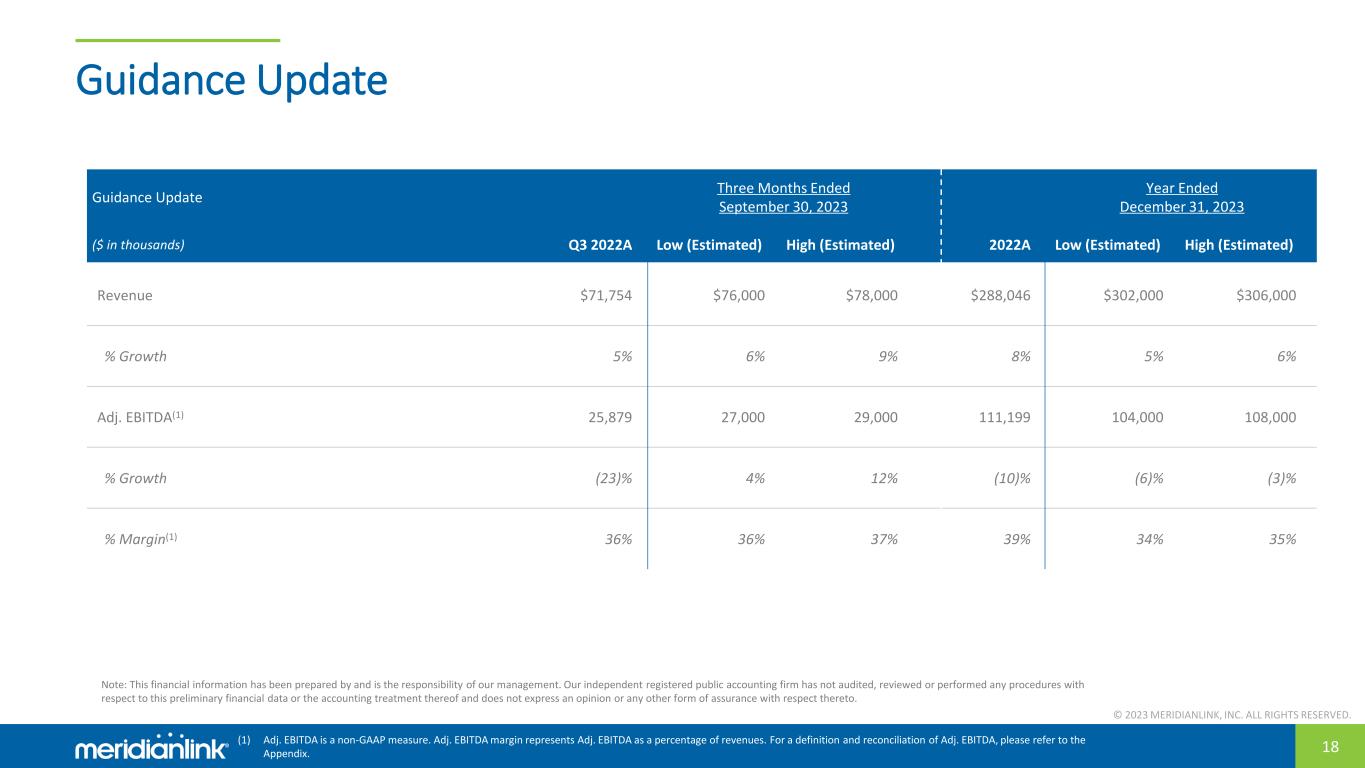
© 2023 MERIDIANLINK, INC. ALL RIGHTS RESERVED. 18 Guidance Update Guidance Update Three Months Ended September 30, 2023 Year Ended December 31, 2023 ($ in thousands) Q3 2022A Low (Estimated) High (Estimated) 2022A Low (Estimated) High (Estimated) Revenue $71,754 $76,000 $78,000 $288,046 $302,000 $306,000 % Growth 5% 6% 9% 8% 5% 6% Adj. EBITDA(1) 25,879 27,000 29,000 111,199 104,000 108,000 % Growth (23)% 4% 12% (10)% (6)% (3)% % Margin(1) 36% 36% 37% 39% 34% 35% Note: This financial information has been prepared by and is the responsibility of our management. Our independent registered public accounting firm has not audited, reviewed or performed any procedures with respect to this preliminary financial data or the accounting treatment thereof and does not express an opinion or any other form of assurance with respect thereto. (1) Adj. EBITDA is a non-GAAP measure. Adj. EBITDA margin represents Adj. EBITDA as a percentage of revenues. For a definition and reconciliation of Adj. EBITDA, please refer to the Appendix.

© 2023 MERIDIANLINK, INC. ALL RIGHTS RESERVED. CONFIDENTIAL Appendix © 2023 MERIDIANLINK, INC. ALL RIGHTS RESERVED.
© 2023 MERIDIANLINK, INC. ALL RIGHTS RESERVED. 20 Disclaimer To supplement the financial measures presented in accordance with United States generally accepted accounting principles, or GAAP, we provide certain non-GAAP financial measures, such as adjusted EBITDA and adjusted EBITDA margin; non-GAAP operating income (loss); non-GAAP net income (loss); non-GAAP cost of revenue; non-GAAP sales and marketing expenses; non-GAAP research and development expenses; non-GAAP general and administrative expenses; and free cash flow. The presentation of these financial measures is not intended to be considered in isolation or as a substitute for, or superior to, financial information prepared and presented in accordance with GAAP. Rather, we believe that these non-GAAP financial measures, when viewed in addition to and not in lieu of our reported GAAP financial results, provide investors with additional meaningful information to assess our financial performance and trends, enable comparison of financial results between periods, and allow for greater transparency with respect to key metrics utilized internally in analyzing and operating our business. The following definitions are provided: • Non-GAAP operating income (loss): GAAP operating income (loss), excluding the impact of share-based compensation, employer payroll taxes on employee stock transactions, restructuring related costs, and sponsor and third-party acquisition-related costs. • Non-GAAP net income (loss): GAAP net income (loss), excluding the impact of share-based compensation, employer payroll taxes on employee stock transactions, restructuring related costs, sponsor and third-party acquisition-related costs, and the effect of income taxes on non-GAAP items. The effects of income taxes on non-GAAP items reflect a fixed long-term projected tax rate of 24%. The Company employs a structural long-term projected non-GAAP income tax rate of 24% for greater consistency across reporting periods, eliminating effects of items not directly related to the Company's operating structure that may vary in size and frequency. This long-term projected non-GAAP income tax rate is determined by analyzing a mix of historical and projected tax filing positions, assumes no additional acquisitions during the projection period, and takes into account various factors, including the Company’s anticipated tax structure, its tax positions in different jurisdictions, and current impacts from key U.S. legislation where the Company operates. We will reevaluate this tax rate, as necessary, for significant events such as significant alterations in the U.S. tax environment, substantial changes in the Company’s geographic earnings mix due to acquisition activity, or other shifts in the Company’s strategy or business operations. • Adjusted EBITDA: net income (loss) before interest expense, taxes, depreciation and amortization, share-based compensation expense, employer payroll taxes on employee stock transactions, restructuring related costs, sponsor and third-party acquisition related costs, and deferred revenue reductions from purchase accounting for acquisitions prior to the adoption of ASU 2021-08, “Business Combinations (Topic 805): Accounting for Contract Assets and Contract Liabilities from Contracts with Customers,” which we early adopted on January 1, 2022 on a prospective basis. As of June 30, 2023, the remaining deferred revenue from acquisitions prior to the adoption of ASU 2021-08 was less than $0.1 million, which will be recognized on a straight line basis through December 31, 2023. • Non-GAAP cost of revenue: GAAP cost of revenue, excluding the impact of share-based compensation, employer payroll taxes on employee stock transactions, and amortization of developed technology. • Non-GAAP operating expenses: GAAP operating expenses, excluding the impact of share-based compensation, employer payroll taxes on employee stock transactions, and depreciation and amortization, as applicable. • Free cash flow: GAAP cash flow from operating activities less GAAP purchases of property and equipment (Capital Expenditures) and capitalized costs related to developed technology (Capitalized Software). Reconciliations to comparable GAAP financial measures are available in the accompanying schedules, which are included in the Appendix of this presentation. No reconciliation is provided with respect to certain forward-looking non- GAAP financial measures as the GAAP measures are not accessible on a forward-looking basis. We cannot reliably predict all necessary components or their impact to reconcile such financial measures without unreasonable effort. The events necessitating a non-GAAP adjustment are inherently unpredictable and may have a significant impact on our future GAAP financial results.
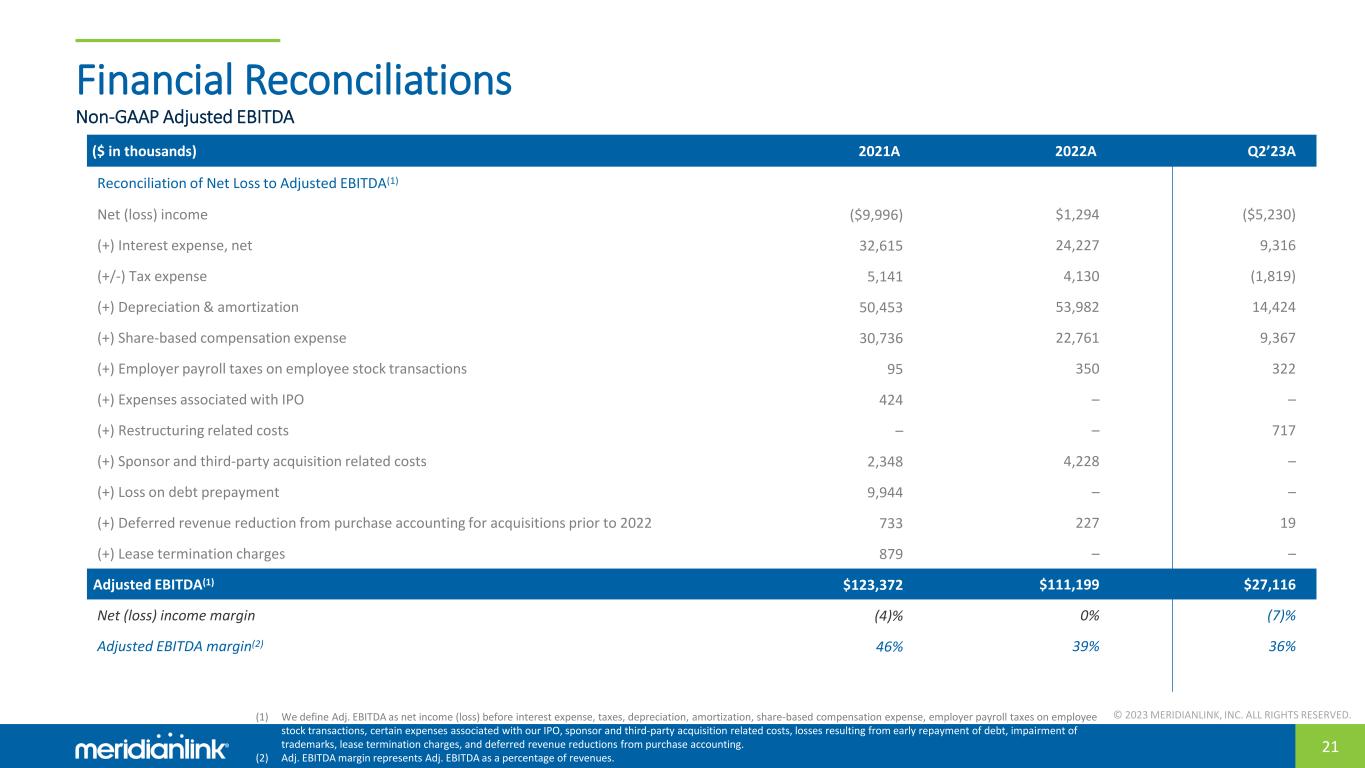
© 2023 MERIDIANLINK, INC. ALL RIGHTS RESERVED. 21 Financial Reconciliations ($ in thousands) 2021A 2022A Q2’23A Reconciliation of Net Loss to Adjusted EBITDA(1) Net (loss) income ($9,996) $1,294 ($5,230) (+) Interest expense, net 32,615 24,227 9,316 (+/-) Tax expense 5,141 4,130 (1,819) (+) Depreciation & amortization 50,453 53,982 14,424 (+) Share-based compensation expense 30,736 22,761 9,367 (+) Employer payroll taxes on employee stock transactions 95 350 322 (+) Expenses associated with IPO 424 – – (+) Restructuring related costs – – 717 (+) Sponsor and third-party acquisition related costs 2,348 4,228 – (+) Loss on debt prepayment 9,944 – – (+) Deferred revenue reduction from purchase accounting for acquisitions prior to 2022 733 227 19 (+) Lease termination charges 879 – – Adjusted EBITDA(1) $123,372 $111,199 $27,116 Net (loss) income margin (4)% 0% (7)% Adjusted EBITDA margin(2) 46% 39% 36% (1) We define Adj. EBITDA as net income (loss) before interest expense, taxes, depreciation, amortization, share-based compensation expense, employer payroll taxes on employee stock transactions, certain expenses associated with our IPO, sponsor and third-party acquisition related costs, losses resulting from early repayment of debt, impairment of trademarks, lease termination charges, and deferred revenue reductions from purchase accounting. (2) Adj. EBITDA margin represents Adj. EBITDA as a percentage of revenues. Non-GAAP Adjusted EBITDA
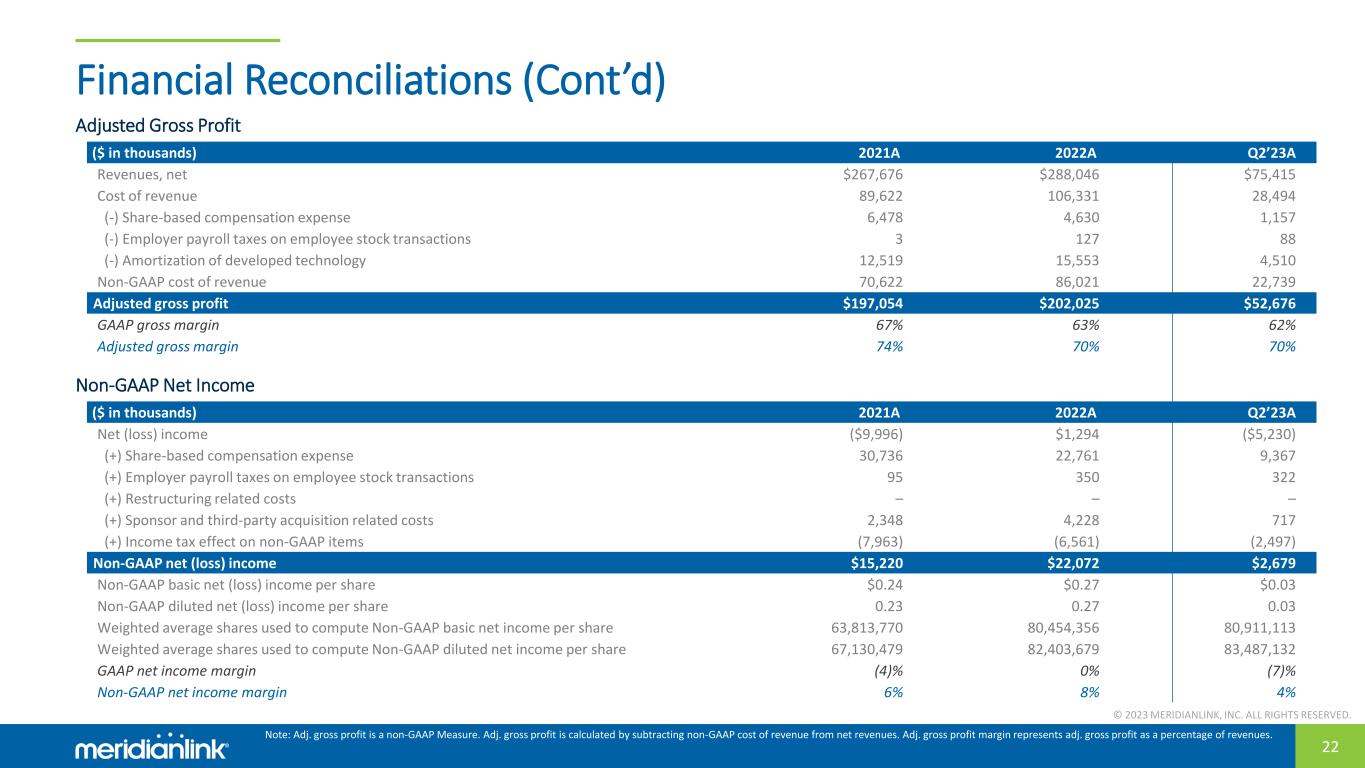
© 2023 MERIDIANLINK, INC. ALL RIGHTS RESERVED. 22 Financial Reconciliations (Cont’d) ($ in thousands) 2021A 2022A Q2’23A Revenues, net $267,676 $288,046 $75,415 Cost of revenue 89,622 106,331 28,494 (-) Share-based compensation expense 6,478 4,630 1,157 (-) Employer payroll taxes on employee stock transactions 3 127 88 (-) Amortization of developed technology 12,519 15,553 4,510 Non-GAAP cost of revenue 70,622 86,021 22,739 Adjusted gross profit $197,054 $202,025 $52,676 GAAP gross margin 67% 63% 62% Adjusted gross margin 74% 70% 70% Adjusted Gross Profit ($ in thousands) 2021A 2022A Q2’23A Net (loss) income ($9,996) $1,294 ($5,230) (+) Share-based compensation expense 30,736 22,761 9,367 (+) Employer payroll taxes on employee stock transactions 95 350 322 (+) Restructuring related costs – – – (+) Sponsor and third-party acquisition related costs 2,348 4,228 717 (+) Income tax effect on non-GAAP items (7,963) (6,561) (2,497) Non-GAAP net (loss) income $15,220 $22,072 $2,679 Non-GAAP basic net (loss) income per share $0.24 $0.27 $0.03 Non-GAAP diluted net (loss) income per share 0.23 0.27 0.03 Weighted average shares used to compute Non-GAAP basic net income per share 63,813,770 80,454,356 80,911,113 Weighted average shares used to compute Non-GAAP diluted net income per share 67,130,479 82,403,679 83,487,132 GAAP net income margin (4)% 0% (7)% Non-GAAP net income margin 6% 8% 4% Non-GAAP Net Income Note: Adj. gross profit is a non-GAAP Measure. Adj. gross profit is calculated by subtracting non-GAAP cost of revenue from net revenues. Adj. gross profit margin represents adj. gross profit as a percentage of revenues.
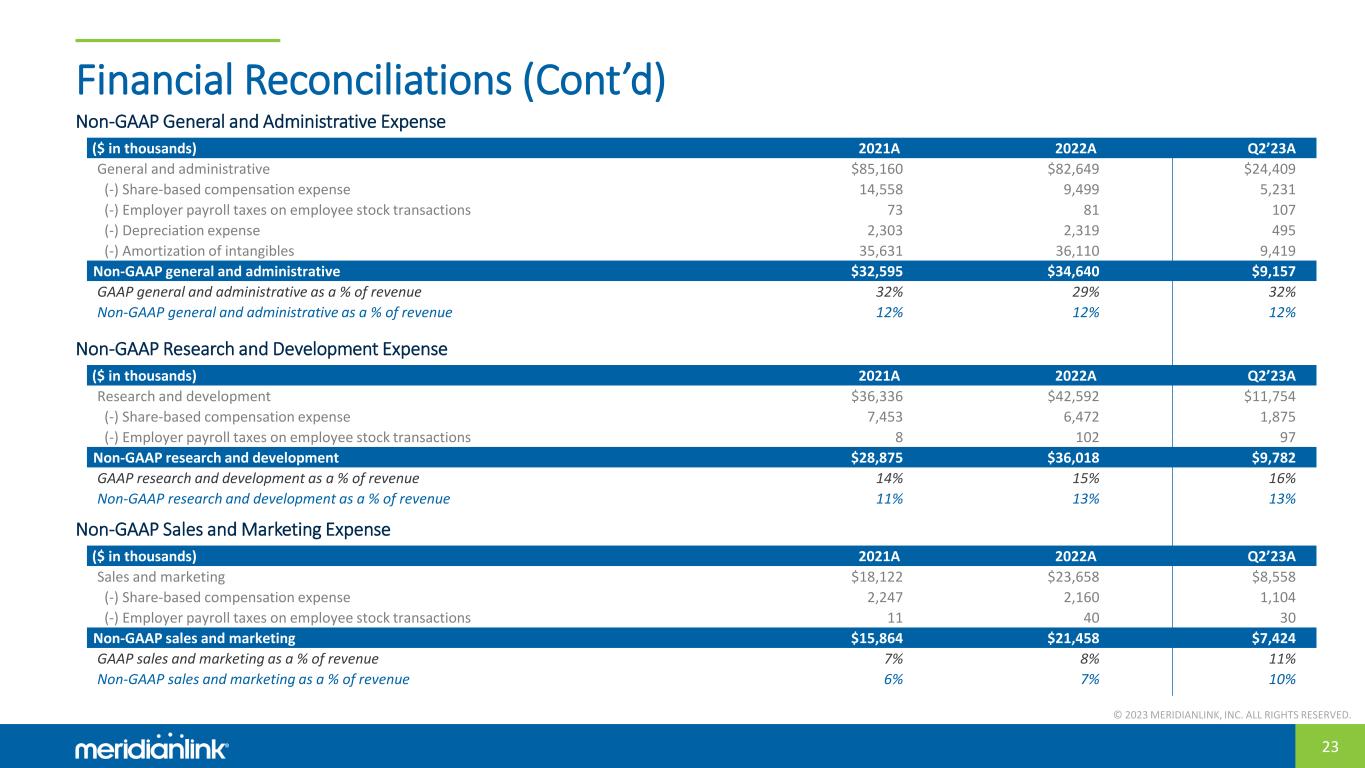
© 2023 MERIDIANLINK, INC. ALL RIGHTS RESERVED. 23 Financial Reconciliations (Cont’d) ($ in thousands) 2021A 2022A Q2’23A Sales and marketing $18,122 $23,658 $8,558 (-) Share-based compensation expense 2,247 2,160 1,104 (-) Employer payroll taxes on employee stock transactions 11 40 30 Non-GAAP sales and marketing $15,864 $21,458 $7,424 GAAP sales and marketing as a % of revenue 7% 8% 11% Non-GAAP sales and marketing as a % of revenue 6% 7% 10% Non-GAAP Sales and Marketing Expense ($ in thousands) 2021A 2022A Q2’23A Research and development $36,336 $42,592 $11,754 (-) Share-based compensation expense 7,453 6,472 1,875 (-) Employer payroll taxes on employee stock transactions 8 102 97 Non-GAAP research and development $28,875 $36,018 $9,782 GAAP research and development as a % of revenue 14% 15% 16% Non-GAAP research and development as a % of revenue 11% 13% 13% Non-GAAP Research and Development Expense ($ in thousands) 2021A 2022A Q2’23A General and administrative $85,160 $82,649 $24,409 (-) Share-based compensation expense 14,558 9,499 5,231 (-) Employer payroll taxes on employee stock transactions 73 81 107 (-) Depreciation expense 2,303 2,319 495 (-) Amortization of intangibles 35,631 36,110 9,419 Non-GAAP general and administrative $32,595 $34,640 $9,157 GAAP general and administrative as a % of revenue 32% 29% 32% Non-GAAP general and administrative as a % of revenue 12% 12% 12% Non-GAAP General and Administrative Expense
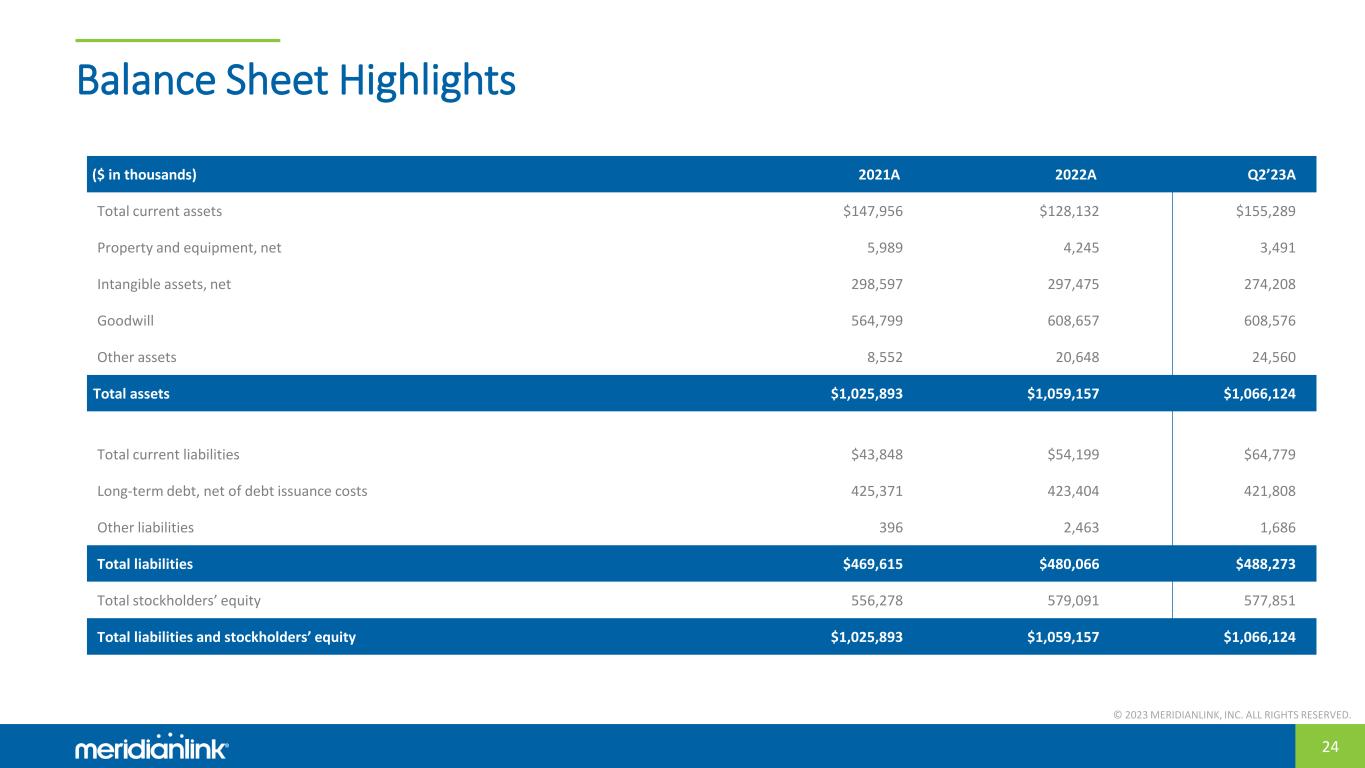
© 2023 MERIDIANLINK, INC. ALL RIGHTS RESERVED. 24 Balance Sheet Highlights ($ in thousands) 2021A 2022A Q2’23A Total current assets $147,956 $128,132 $155,289 Property and equipment, net 5,989 4,245 3,491 Intangible assets, net 298,597 297,475 274,208 Goodwill 564,799 608,657 608,576 Other assets 8,552 20,648 24,560 Total assets $1,025,893 $1,059,157 $1,066,124 Total current liabilities $43,848 $54,199 $64,779 Long-term debt, net of debt issuance costs 425,371 423,404 421,808 Other liabilities 396 2,463 1,686 Total liabilities $469,615 $480,066 $488,273 Total stockholders’ equity 556,278 579,091 577,851 Total liabilities and stockholders’ equity $1,025,893 $1,059,157 $1,066,124
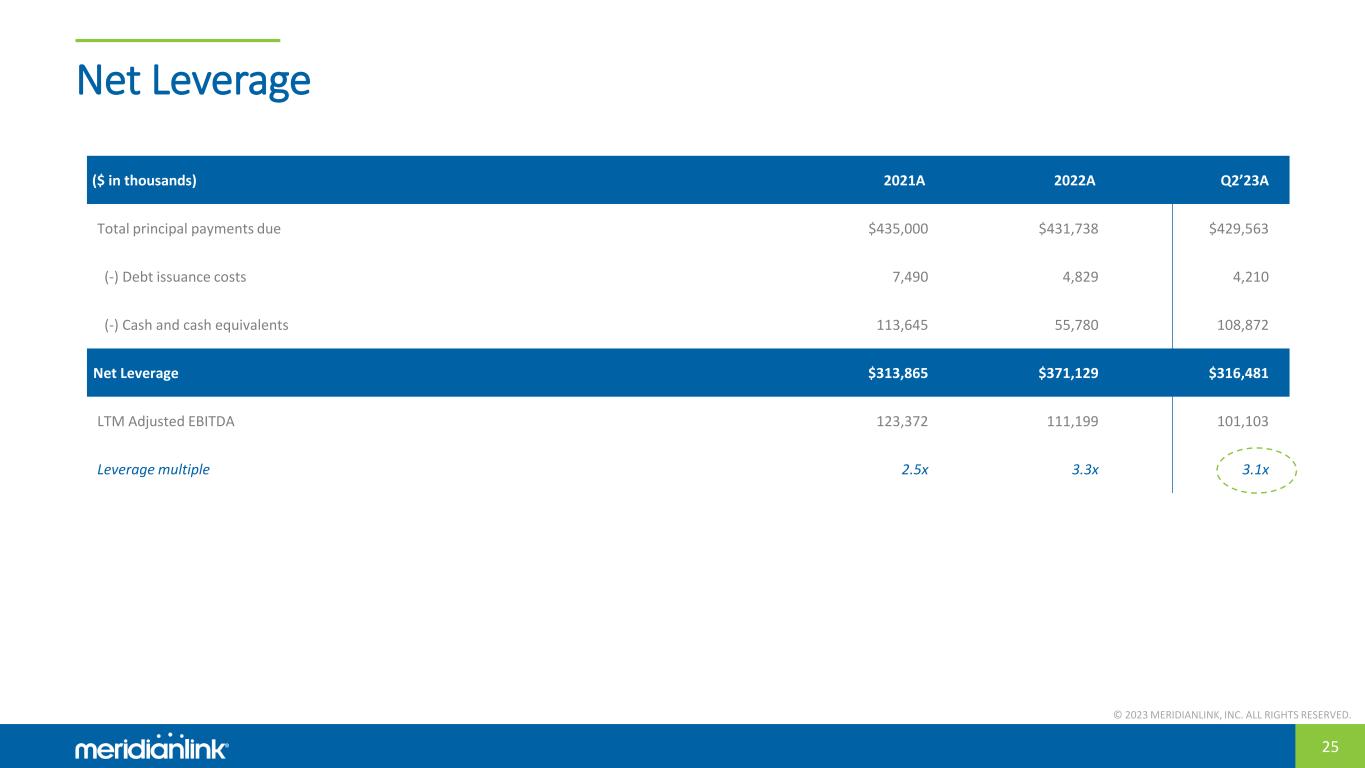
© 2023 MERIDIANLINK, INC. ALL RIGHTS RESERVED. 25 ($ in thousands) 2021A 2022A Q2’23A Total principal payments due $435,000 $431,738 $429,563 (-) Debt issuance costs 7,490 4,829 4,210 (-) Cash and cash equivalents 113,645 55,780 108,872 Net Leverage $313,865 $371,129 $316,481 LTM Adjusted EBITDA 123,372 111,199 101,103 Leverage multiple 2.5x 3.3x 3.1x Net Leverage
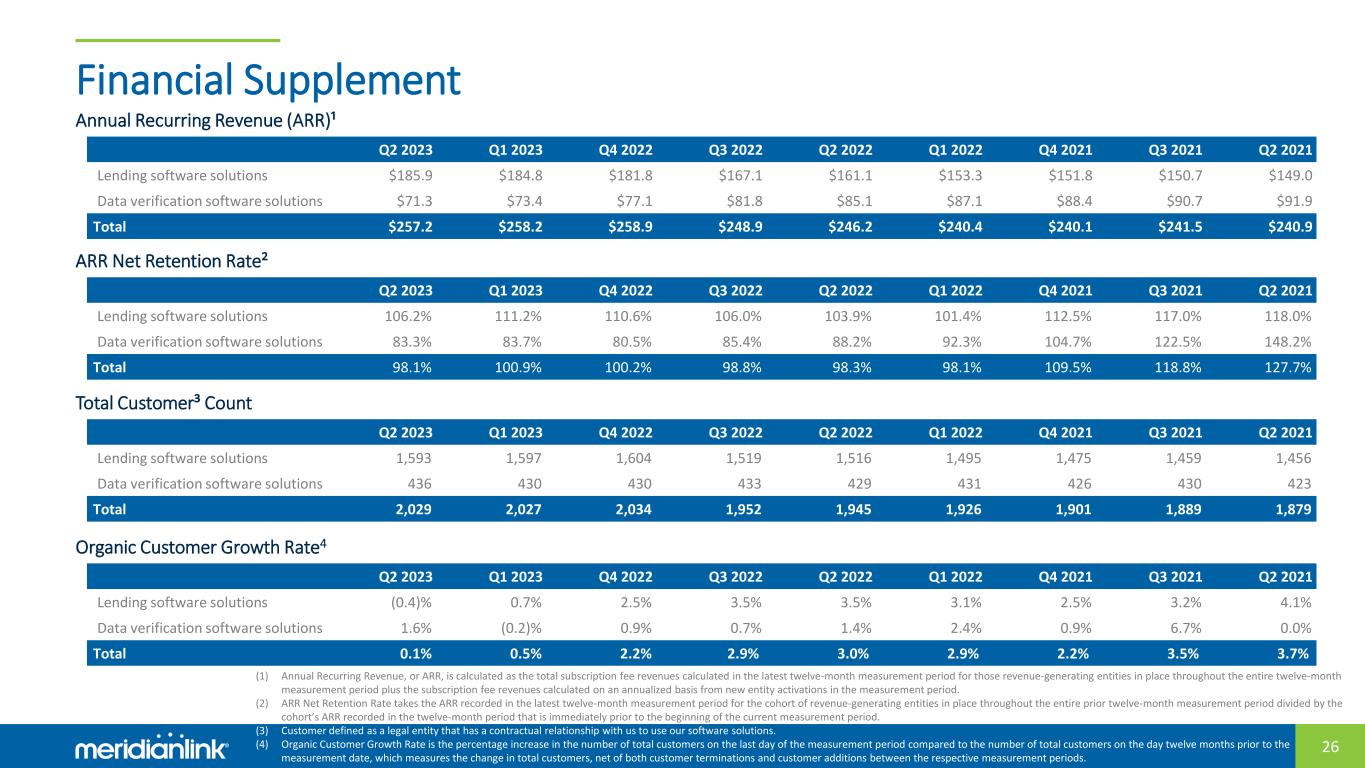
© 2023 MERIDIANLINK, INC. ALL RIGHTS RESERVED. 26 Financial Supplement Q2 2023 Q1 2023 Q4 2022 Q3 2022 Q2 2022 Q1 2022 Q4 2021 Q3 2021 Q2 2021 Lending software solutions $185.9 $184.8 $181.8 $167.1 $161.1 $153.3 $151.8 $150.7 $149.0 Data verification software solutions $71.3 $73.4 $77.1 $81.8 $85.1 $87.1 $88.4 $90.7 $91.9 Total $257.2 $258.2 $258.9 $248.9 $246.2 $240.4 $240.1 $241.5 $240.9 Annual Recurring Revenue (ARR)¹ Q2 2023 Q1 2023 Q4 2022 Q3 2022 Q2 2022 Q1 2022 Q4 2021 Q3 2021 Q2 2021 Lending software solutions 106.2% 111.2% 110.6% 106.0% 103.9% 101.4% 112.5% 117.0% 118.0% Data verification software solutions 83.3% 83.7% 80.5% 85.4% 88.2% 92.3% 104.7% 122.5% 148.2% Total 98.1% 100.9% 100.2% 98.8% 98.3% 98.1% 109.5% 118.8% 127.7% ARR Net Retention Rate² (1) Annual Recurring Revenue, or ARR, is calculated as the total subscription fee revenues calculated in the latest twelve-month measurement period for those revenue-generating entities in place throughout the entire twelve-month measurement period plus the subscription fee revenues calculated on an annualized basis from new entity activations in the measurement period. (2) ARR Net Retention Rate takes the ARR recorded in the latest twelve-month measurement period for the cohort of revenue-generating entities in place throughout the entire prior twelve-month measurement period divided by the cohort’s ARR recorded in the twelve-month period that is immediately prior to the beginning of the current measurement period. (3) Customer defined as a legal entity that has a contractual relationship with us to use our software solutions. (4) Organic Customer Growth Rate is the percentage increase in the number of total customers on the last day of the measurement period compared to the number of total customers on the day twelve months prior to the measurement date, which measures the change in total customers, net of both customer terminations and customer additions between the respective measurement periods. Organic Customer Growth Rate4 Q2 2023 Q1 2023 Q4 2022 Q3 2022 Q2 2022 Q1 2022 Q4 2021 Q3 2021 Q2 2021 Lending software solutions 1,593 1,597 1,604 1,519 1,516 1,495 1,475 1,459 1,456 Data verification software solutions 436 430 430 433 429 431 426 430 423 Total 2,029 2,027 2,034 1,952 1,945 1,926 1,901 1,889 1,879 Total Customer³ Count Q2 2023 Q1 2023 Q4 2022 Q3 2022 Q2 2022 Q1 2022 Q4 2021 Q3 2021 Q2 2021 Lending software solutions (0.4)% 0.7% 2.5% 3.5% 3.5% 3.1% 2.5% 3.2% 4.1% Data verification software solutions 1.6% (0.2)% 0.9% 0.7% 1.4% 2.4% 0.9% 6.7% 0.0% Total 0.1% 0.5% 2.2% 2.9% 3.0% 2.9% 2.2% 3.5% 3.7%

© 2023 MERIDIANLINK, INC. ALL RIGHTS RESERVED. 27 InvestorRelations@meridianlink.com © 2023 MERIDIANLINK, INC. ALL RIGHTS RESERVED.


