
©2024 MERIDIANLINK, INC. ALL RIGHTS RESERVED. Second Quarter 2024 Results August 2024 Exhibit 99.2

©2024 MERIDIANLINK, INC. ALL RIGHTS RESERVED. Forward-Looking Statements and Disclaimers 2 Information in this presentation and the accompanying oral presentation contain forward-looking statements within the meaning of Section 27A of the Securities Act of 1933, as amended, and Section 21E of the Securities Exchange Act of 1934, as amended, which statements involve substantial risks and uncertainties. Forward-looking statements generally relate to future events or our future financial or operating performance. All statements other than statements of historical fact included in this presentation and the accompanying oral presentation, including statements regarding, and guidance with respect to, our strategy, future operations, financial position, projected costs, our future financial and operational performance, prospects, market size and growth opportunities, future economic conditions, competitive position, strategic initiatives, development or delivery of new or enhanced solutions, technological capabilities, plans, and objectives of management are forward-looking statements. In some cases, you can identify forward-looking statements because they contain words such as “may,” “should,” “expects,” “plans,” “anticipates,” “could,” “intends,” “target,” “projects,” “contemplates,” “believes,” “estimates,” “predicts,” “potential,” or “continue” or the negative of these words or other similar terms or expressions that concern our expectations, strategy, plans, or intentions. These forward-looking statements reflect our predictions, expectations, or forecasts. Actual results may differ materially from those described in the forward-looking statements and will be affected by a variety of risks and factors that are beyond our control including, without limitation, risks related to economic and market conditions, including interest rate fluctuations; our ability to retain and attract customers; our ability to expand and evolve our offerings, features, and functionalities or respond to rapid technological changes; our ability to identify and integrate strategic initiatives; our leadership transition and plans; our realignment plan, including expected associated timing, benefits, and costs; our stock repurchase programs, including the execution and amount of repurchases; our ability to maintain effective internal control over financial reporting and disclosure controls and procedures; the status of litigation matters, including expected or contemplated settlements, associated timing, and estimated fees and expenses; our ability to compete in a highly-fragmented and competitive landscape; market demand for our products and solutions; our ability to effectively implement, integrate, and service our customers; our ability to retain and attract product partners; the benefit to us and our customers of integrations with our product partners; our commercial disputes, including potential losses related thereto; our future financial performance, including, but not limited to, trends in revenue, costs of revenue, gross profit or gross margin, operating expenses, and number of customers; and our high levels of indebtedness; as well as those set forth in Item 1A. Risk Factors, or elsewhere, in our Annual Report on Form 10-K for the most recently ended fiscal year, any updates in our Quarterly Reports on Form 10-Q filed for periods subsequent to such Form 10-K, and our other SEC filings. These forward-looking statements are based on reasonable assumptions as of the date hereof. The plans, intentions, or expectations disclosed in our forward-looking statements may not be achieved, and you should not rely upon forward-looking statements as predictions of future events. We undertake no obligation, other than as required by applicable law, to update any forward-looking statements, whether as a result of new information, future events, or otherwise. Information in this presentation and the accompanying oral presentation, including any statements regarding MeridianLink’s customer data and other metrics, is based on data and analyses from various sources as of December 31, 2023, unless otherwise indicated. This presentation contains statistical data, estimates, and forecasts that are based on independent industry publications or other publicly available information, as well as other information based on our internal sources. This information involves many assumptions and limitations, and you are cautioned not to give undue weight to these estimates. We have not independently verified the accuracy or completeness of the data contained in these industry publications and other publicly available information. Accordingly, we make no representations as to the accuracy or completeness of that data nor do we undertake to update such data after the date of this presentation. MeridianLink uses its investor relations website (https://ir.meridianlink.com), press releases, SEC filings, public conference calls and webcasts, blog posts on its website, as well as its social media channels, such as its LinkedIn page (www.linkedin.com/company/meridianlink), X (formerly Twitter) feed (@meridianlink), and Facebook page (www.facebook.com/MeridianLink/), as a means of disclosing material information and for complying with its disclosure obligations under Regulation FD. Information contained on or accessible through the websites is not incorporated by reference into this presentation, and links for these websites are inactive textual references only. Copyright Notice: All copyrightable text and graphics, the selection, arrangement, and presentation of all materials (including information in the public domain) are ©2024 MeridianLink, Inc. All rights reserved. This presentation includes trademarks, which are protected under applicable intellectual property laws and are the property of MeridianLink, Inc. or its subsidiaries. This presentation may also contain trademarks, service marks, copyrights, and trade names of other companies, which are the property of their respective owners and are used for reference purposes only. Such use should not be construed as an endorsement of the platform and products of MeridianLink. Solely for convenience, trademarks and trade names may appear without the ® or symbols, but such references are not intended to indicate that, with respect to our intellectual property, we will not assert, to the fullest extent under applicable law, our rights or the right of the applicable licensor to these trademarks and trade names.
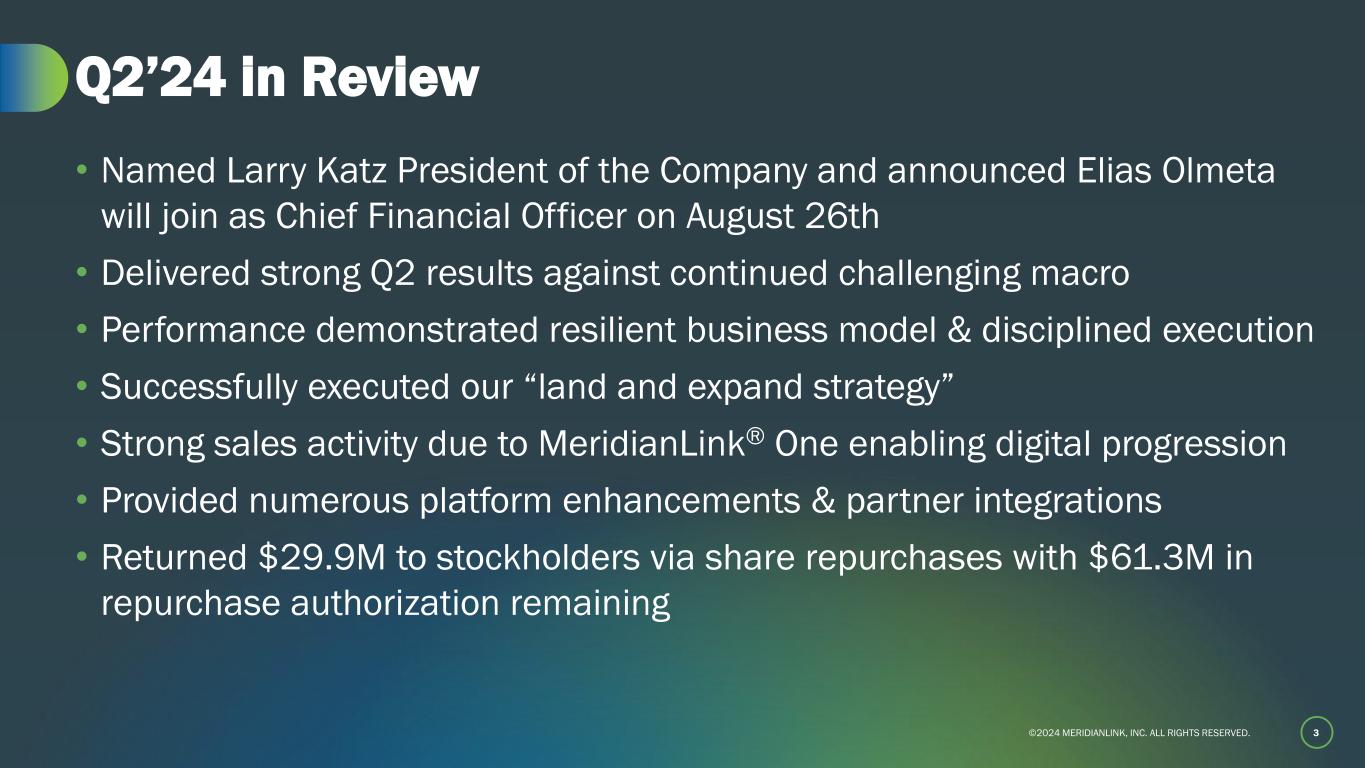
©2024 MERIDIANLINK, INC. ALL RIGHTS RESERVED. 3 Q2’24 in Review • Named Larry Katz President of the Company and announced Elias Olmeta will join as Chief Financial Officer on August 26th • Delivered strong Q2 results against continued challenging macro • Performance demonstrated resilient business model & disciplined execution • Successfully executed our “land and expand strategy” • Strong sales activity due to MeridianLink® One enabling digital progression • Provided numerous platform enhancements & partner integrations • Returned $29.9M to stockholders via share repurchases with $61.3M in repurchase authorization remaining
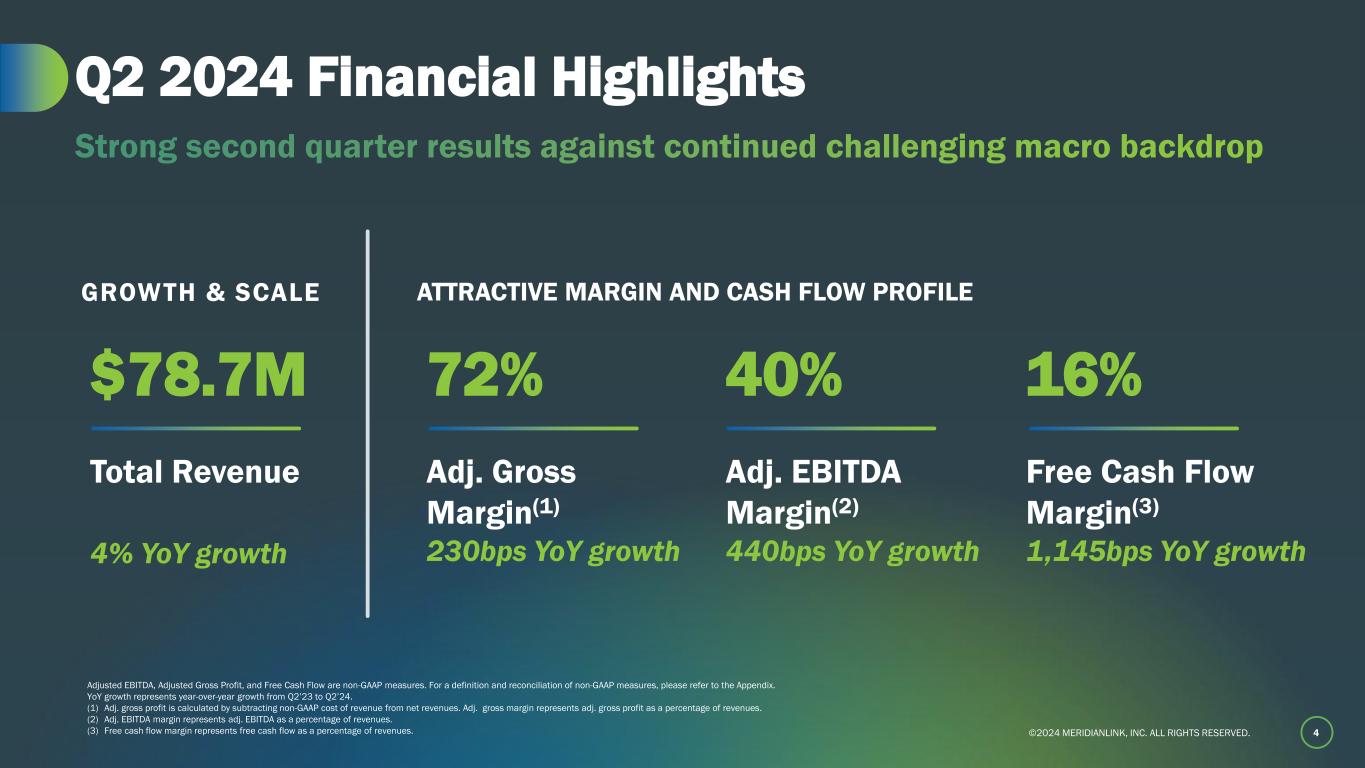
©2024 MERIDIANLINK, INC. ALL RIGHTS RESERVED. 4 Q2 2024 Financial Highlights Strong second quarter results against continued challenging macro backdrop Adjusted EBITDA, Adjusted Gross Profit, and Free Cash Flow are non-GAAP measures. For a definition and reconciliation of non-GAAP measures, please refer to the Appendix. YoY growth represents year-over-year growth from Q2’23 to Q2’24. (1) Adj. gross profit is calculated by subtracting non-GAAP cost of revenue from net revenues. Adj. gross margin represents adj. gross profit as a percentage of revenues. (2) Adj. EBITDA margin represents adj. EBITDA as a percentage of revenues. (3) Free cash flow margin represents free cash flow as a percentage of revenues. $78.7M Total Revenue 4% YoY growth 16% Free Cash Flow Margin(3) 1,145bps YoY growth 72% Adj. Gross Margin(1) 230bps YoY growth 40% Adj. EBITDA Margin(2) 440bps YoY growth GROWTH & SCALE ATTRACTIVE MARGIN AND CASH FLOW PROFILE
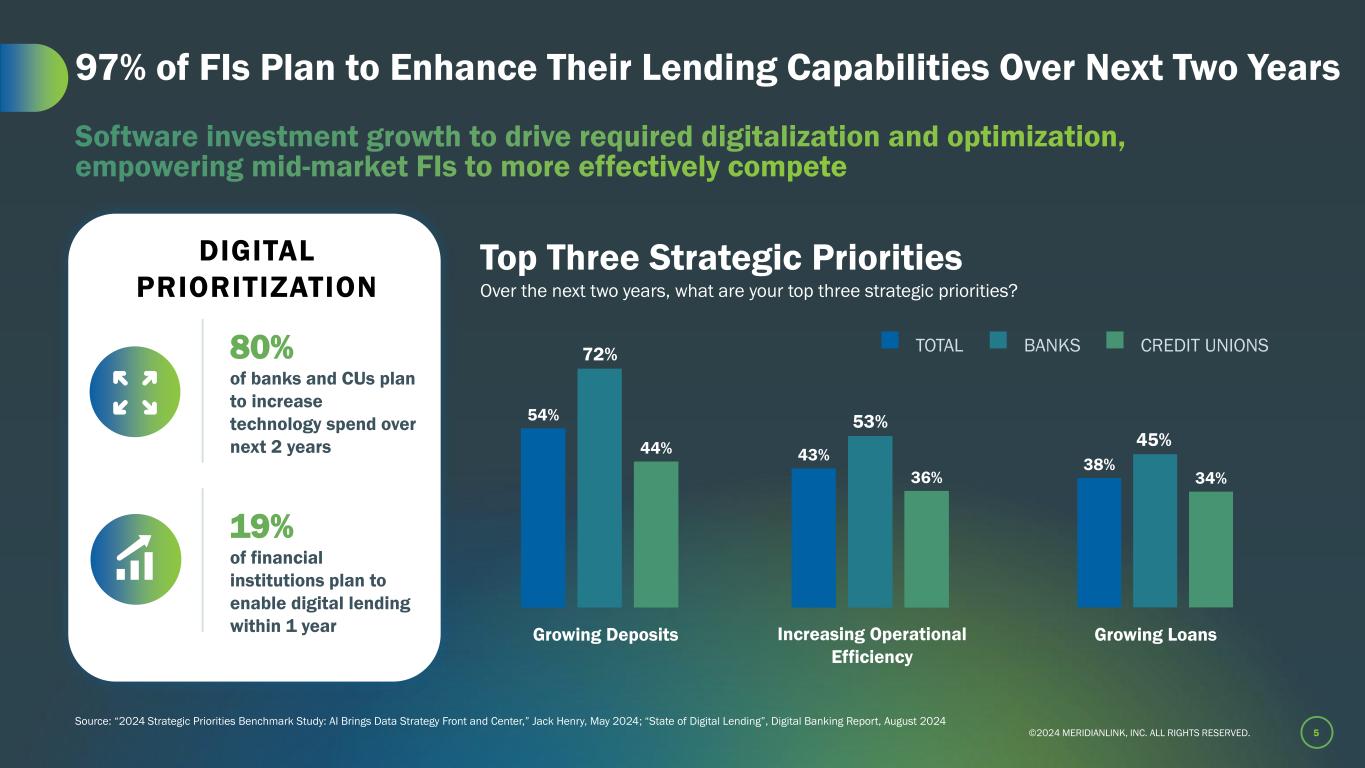
©2024 MERIDIANLINK, INC. ALL RIGHTS RESERVED. 5 97% of FIs Plan to Enhance Their Lending Capabilities Over Next Two Years Software investment growth to drive required digitalization and optimization, empowering mid-market FIs to more effectively compete DIGITAL PRIORITIZATION 80% of banks and CUs plan to increase technology spend over next 2 years Source: “2024 Strategic Priorities Benchmark Study: AI Brings Data Strategy Front and Center,” Jack Henry, May 2024; “State of Digital Lending”, Digital Banking Report, August 2024 19% of financial institutions plan to enable digital lending within 1 year Top Three Strategic Priorities Over the next two years, what are your top three strategic priorities? TOTAL BANKS CREDIT UNIONS 54% 72% 44% Growing Deposits 43% 53% 36% Increasing Operational Efficiency 38% 45% 34% Growing Loans
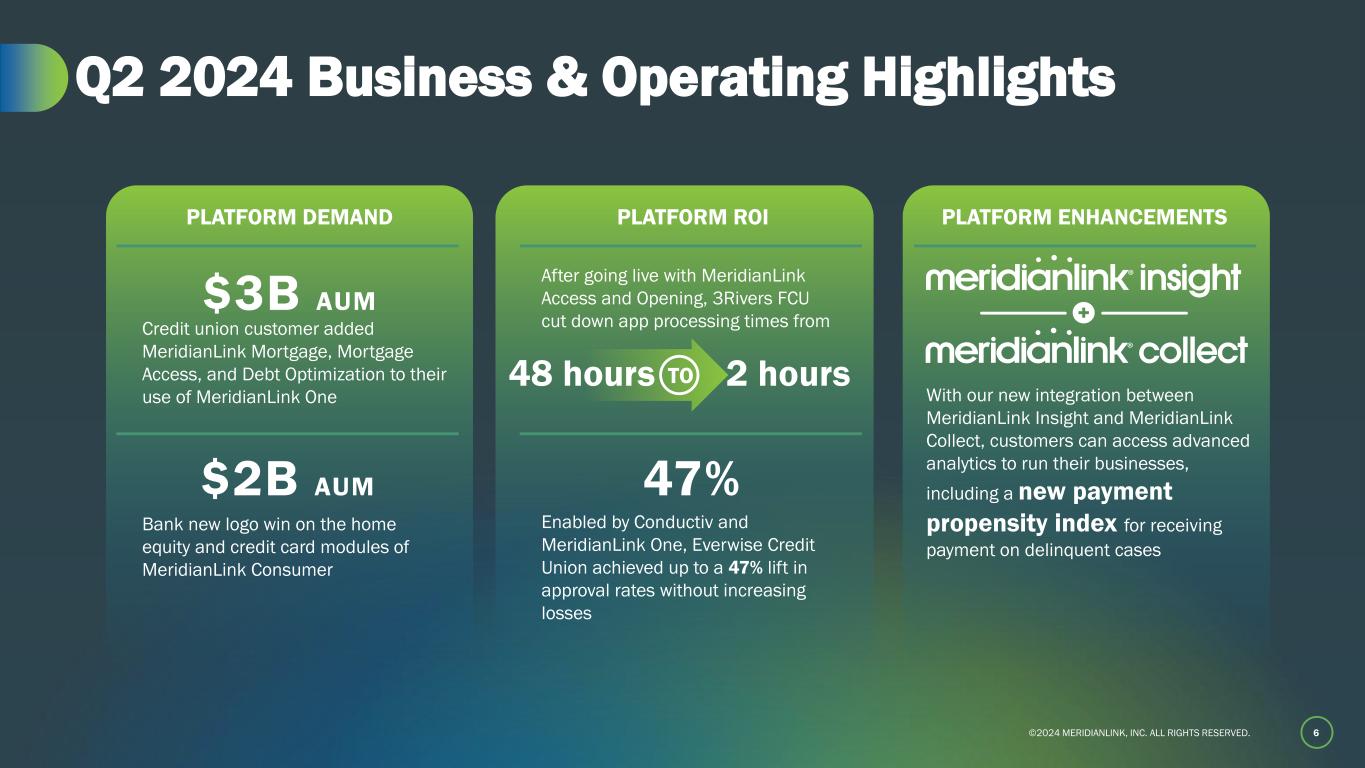
©2024 MERIDIANLINK, INC. ALL RIGHTS RESERVED. 6 Q2 2024 Business & Operating Highlights PLATFORM ENHANCEMENTSPLATFORM DEMAND PLATFORM ROI Credit union customer added MeridianLink Mortgage, Mortgage Access, and Debt Optimization to their use of MeridianLink One $2B AUM After going live with MeridianLink Access and Opening, 3Rivers FCU cut down app processing times from Enabled by Conductiv and MeridianLink One, Everwise Credit Union achieved up to a 47% lift in approval rates without increasing losses With our new integration between MeridianLink Insight and MeridianLink Collect, customers can access advanced analytics to run their businesses, including a new payment propensity index for receiving payment on delinquent cases $3B AUM Bank new logo win on the home equity and credit card modules of MeridianLink Consumer TO48 hours 2 hours 47%
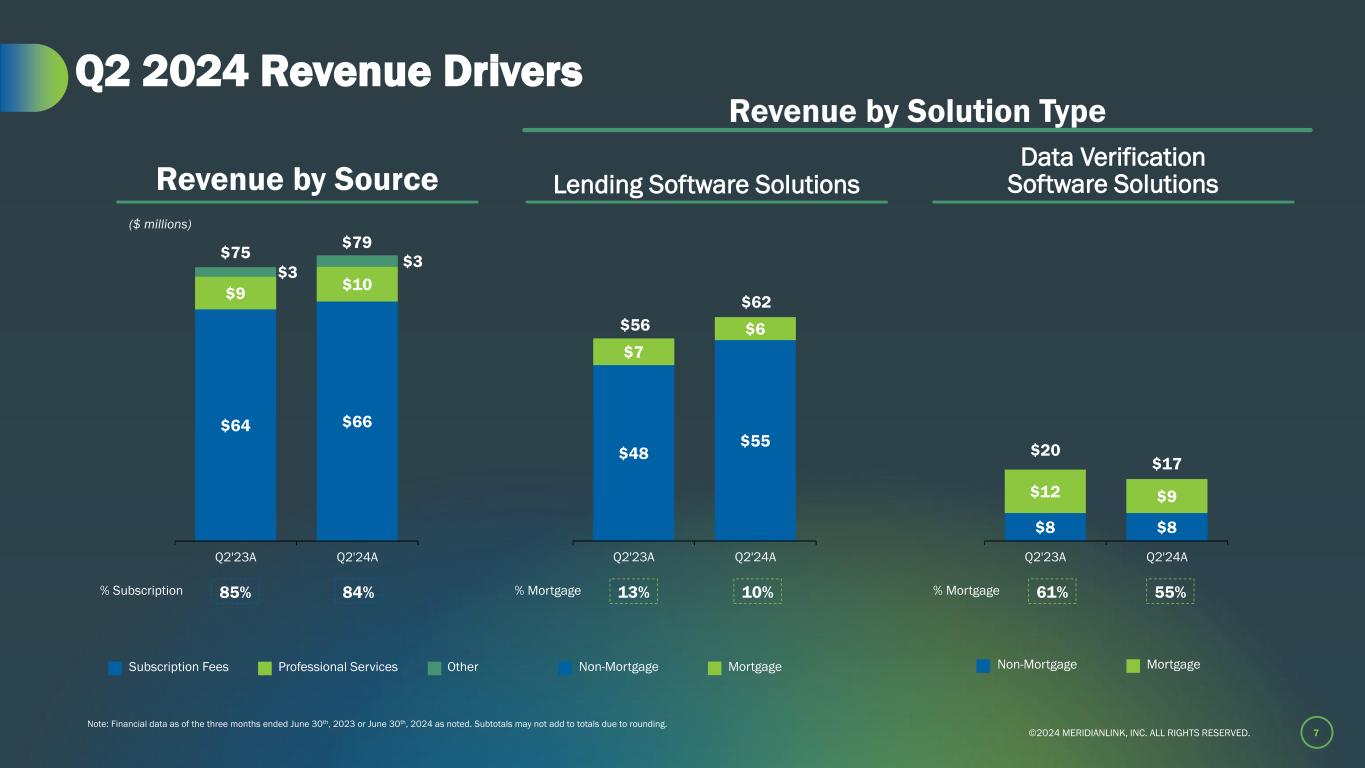
©2024 MERIDIANLINK, INC. ALL RIGHTS RESERVED. 7 Q2 2024 Revenue Drivers Revenue by Source ($ millions) % Subscription Professional Services OtherSubscription Fees Lending Software Solutions Data Verification Software Solutions % Mortgage MortgageNon-Mortgage % Mortgage MortgageNon-Mortgage $64 $66 $9 $10 $3 $3 Q2'23A Q2'24A 84%85% $75 $79 $48 $55 $7 $6 Q2'23A Q2'24A 10%13% $56 $62 $8 $8 $12 $9 Q2'23A Q2'24A 55%61% $20 $17 Revenue by Solution Type Note: Financial data as of the three months ended June 30th, 2023 or June 30th, 2024 as noted. Subtotals may not add to totals due to rounding.
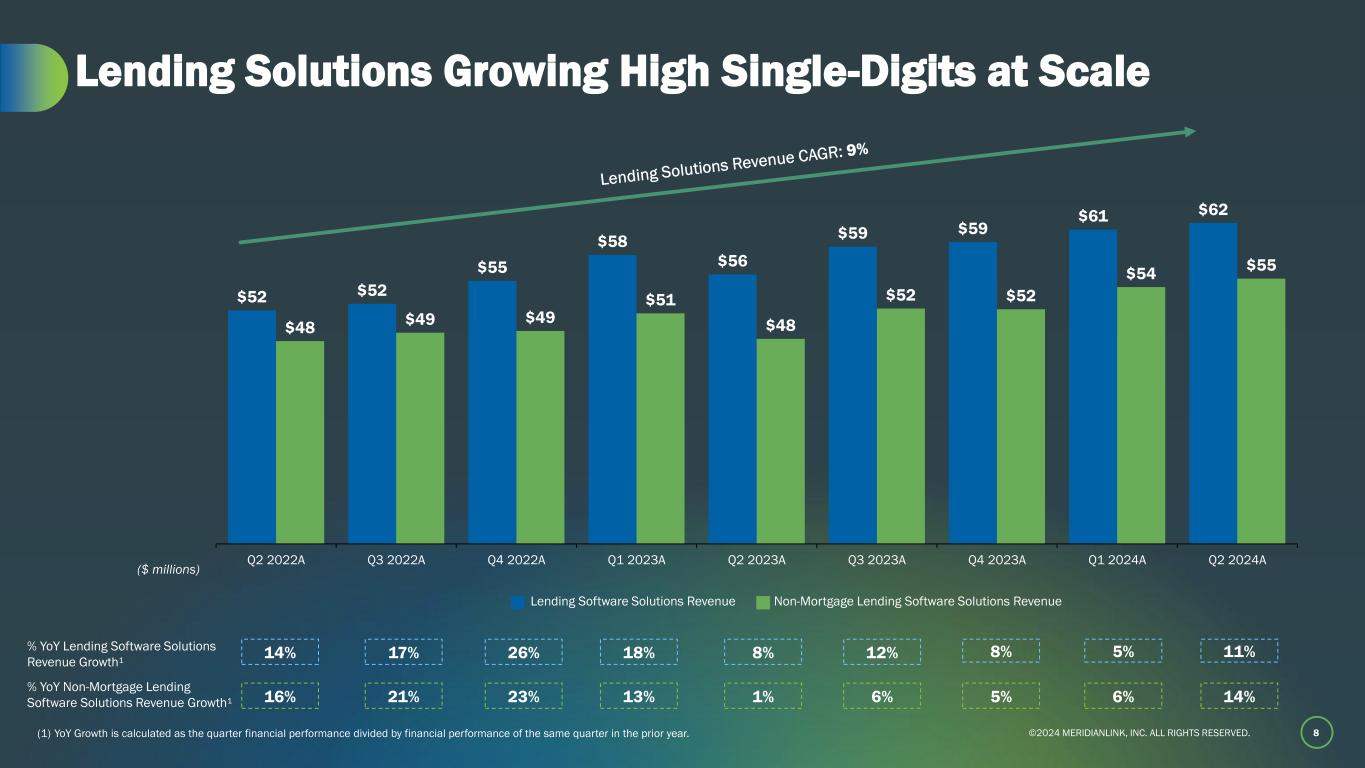
©2024 MERIDIANLINK, INC. ALL RIGHTS RESERVED. $52 $52 $55 $58 $56 $59 $59 $61 $62 $48 $49 $49 $51 $48 $52 $52 $54 $55 Q2 2022A Q3 2022A Q4 2022A Q1 2023A Q2 2023A Q3 2023A Q4 2023A Q1 2024A Q2 2024A 8 Lending Solutions Growing High Single-Digits at Scale Lending Software Solutions Revenue Non-Mortgage Lending Software Solutions Revenue % YoY Non-Mortgage Lending Software Solutions Revenue Growth¹ ($ millions) (1) YoY Growth is calculated as the quarter financial performance divided by financial performance of the same quarter in the prior year. % YoY Lending Software Solutions Revenue Growth¹ 14% 16% 21% 23% 13% 1% 6% 5% 6% 14% 17% 26% 18% 8% 12% 8% 5% 11%
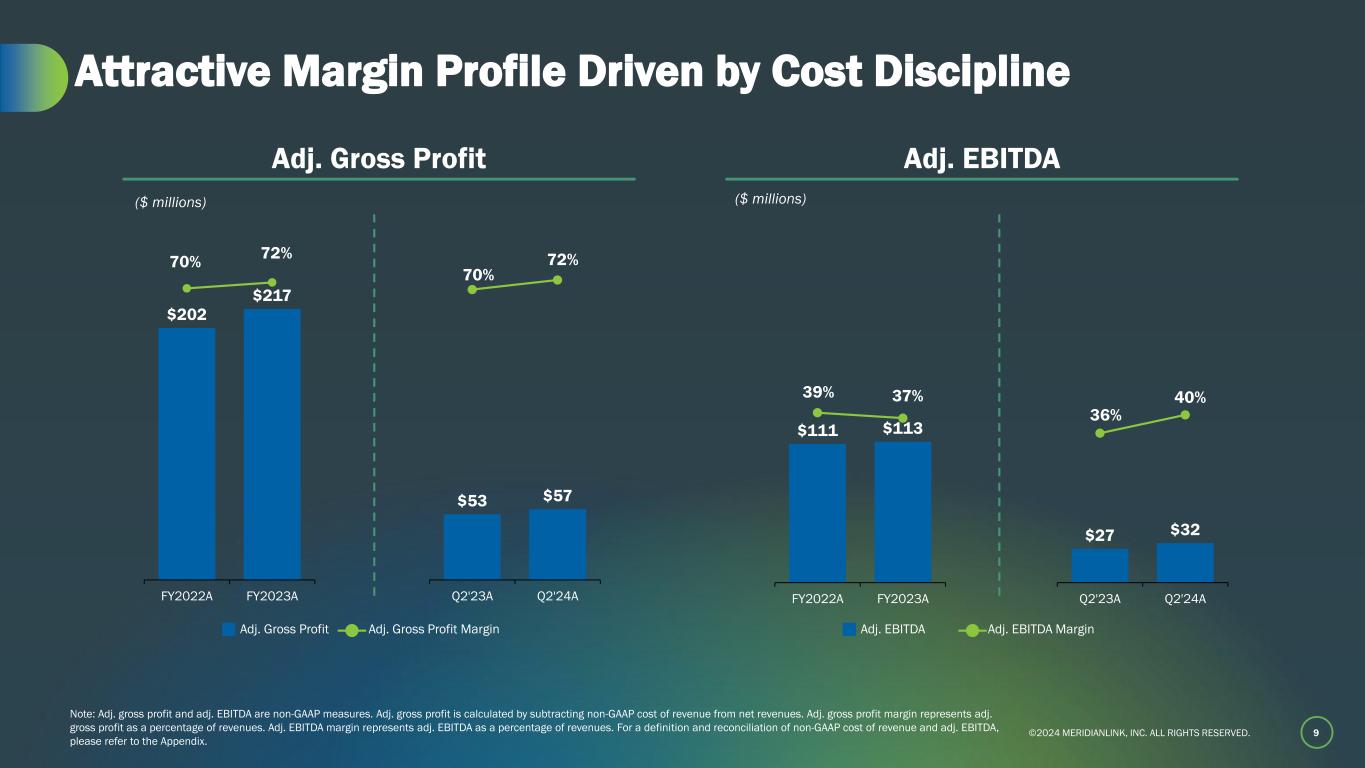
©2024 MERIDIANLINK, INC. ALL RIGHTS RESERVED. $27 $32 36% 40% Q2'23A Q2'24A 9 Attractive Margin Profile Driven by Cost Discipline Adj. Gross Profit ($ millions) Adj. EBITDA ($ millions) Adj. EBITDA Adj. EBITDA Margin Note: Adj. gross profit and adj. EBITDA are non-GAAP measures. Adj. gross profit is calculated by subtracting non-GAAP cost of revenue from net revenues. Adj. gross profit margin represents adj. gross profit as a percentage of revenues. Adj. EBITDA margin represents adj. EBITDA as a percentage of revenues. For a definition and reconciliation of non-GAAP cost of revenue and adj. EBITDA, please refer to the Appendix. Adj. Gross Profit Adj. Gross Profit Margin $111 $113 39% 37% FY2022A FY2023A $202 $217 70% 72% FY2022A FY2023A $53 $57 70% 72% Q2'23A Q2'24A
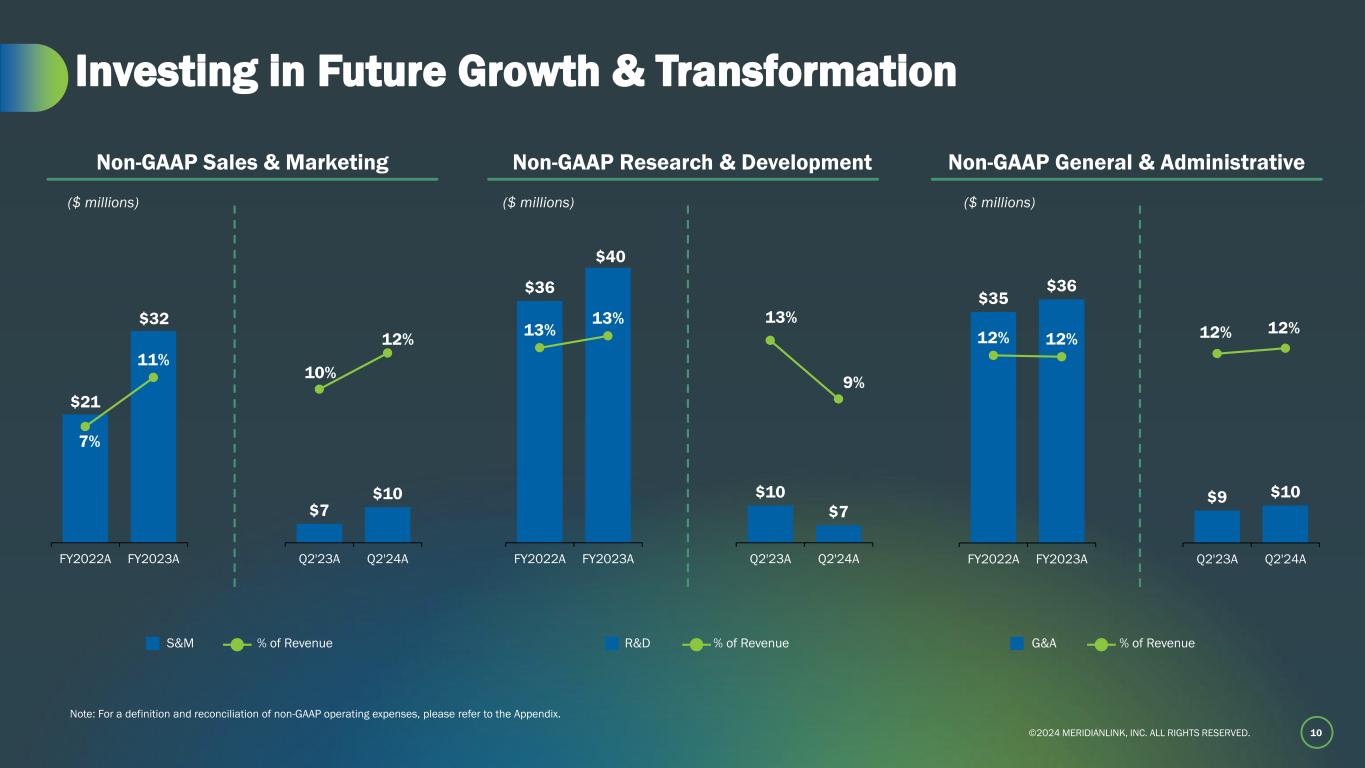
©2024 MERIDIANLINK, INC. ALL RIGHTS RESERVED. $35 $36 12% 12% FY2022A FY2023A 10 Investing in Future Growth & Transformation Non-GAAP Research & DevelopmentNon-GAAP Sales & Marketing ($ millions)($ millions) S&M % of Revenue R&D % of Revenue Note: For a definition and reconciliation of non-GAAP operating expenses, please refer to the Appendix. Non-GAAP General & Administrative ($ millions) G&A % of Revenue $21 $32 7% 11% FY2022A FY2023A $7 $10 10% 12% Q2'23A Q2'24A $36 $40 13% 13% FY2022A FY2023A $10 $7 13% 9% Q2'23A Q2'24A $9 $10 12% 12% Q2'23A Q2'24A
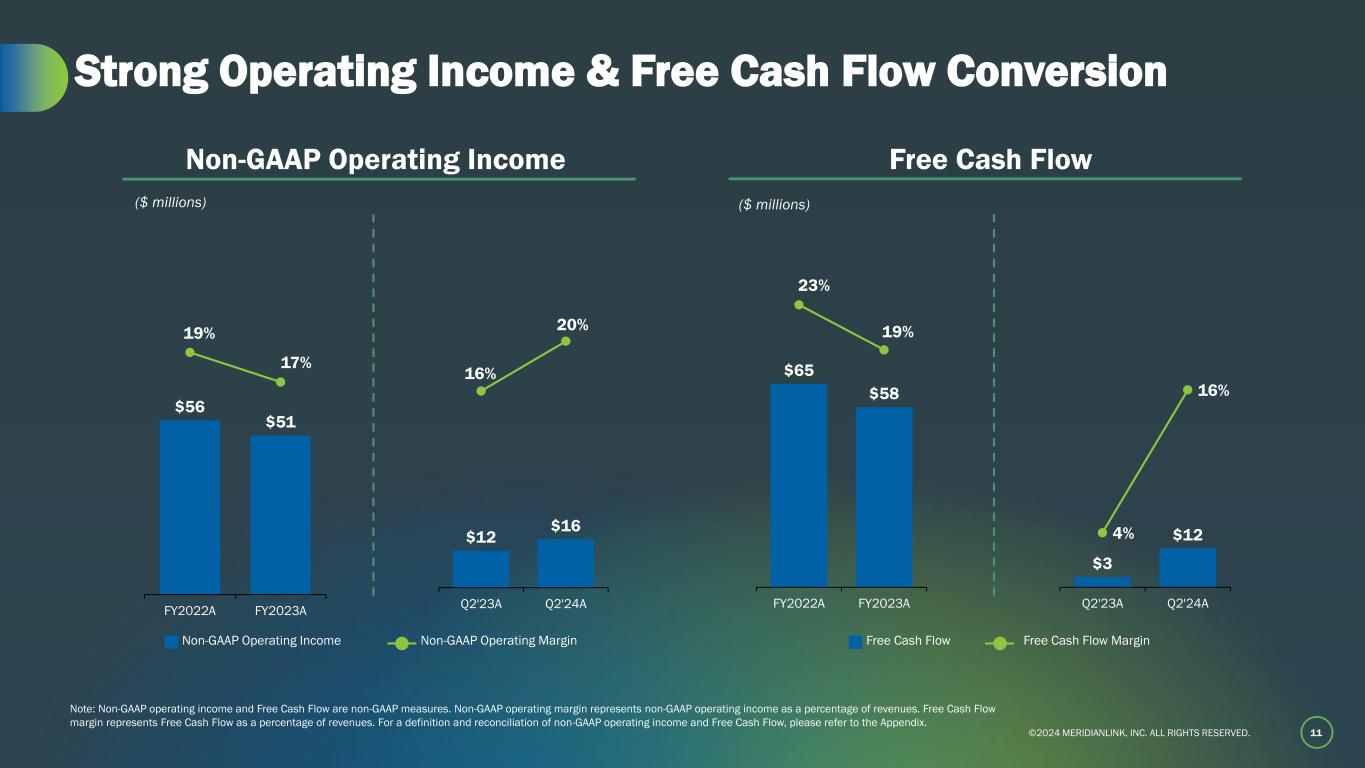
©2024 MERIDIANLINK, INC. ALL RIGHTS RESERVED. Note: Non-GAAP operating income and Free Cash Flow are non-GAAP measures. Non-GAAP operating margin represents non-GAAP operating income as a percentage of revenues. Free Cash Flow margin represents Free Cash Flow as a percentage of revenues. For a definition and reconciliation of non-GAAP operating income and Free Cash Flow, please refer to the Appendix. 11 Strong Operating Income & Free Cash Flow Conversion Non-GAAP Operating Income Free Cash Flow ($ millions) Non-GAAP Operating Income Non-GAAP Operating Margin Free Cash Flow Free Cash Flow Margin ($ millions) $56 $51 19% 17% FY2022A FY2023A $12 $16 16% 20% Q2'23A Q2'24A $65 $58 23% 19% FY2022A FY2023A $3 $124% 16% Q2'23A Q2'24A
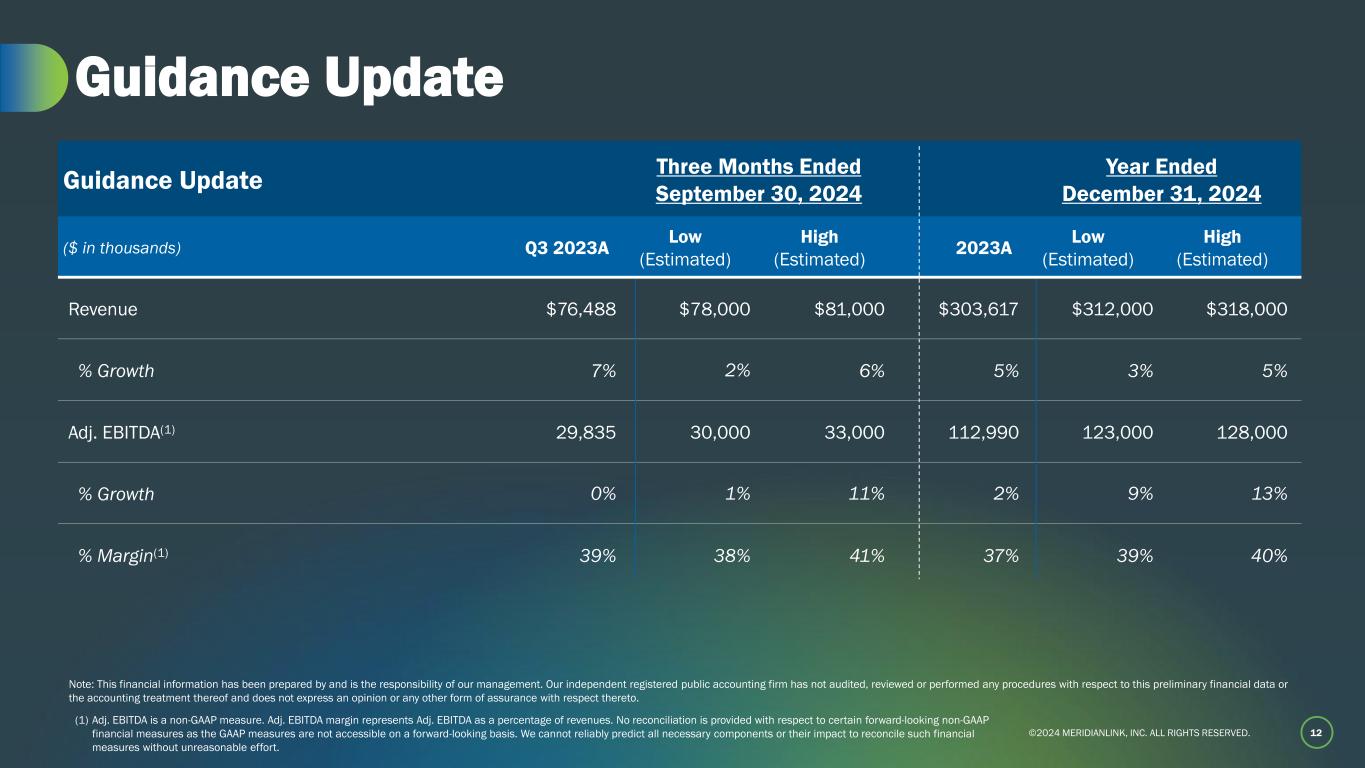
©2024 MERIDIANLINK, INC. ALL RIGHTS RESERVED. 12 Guidance Update Guidance Update Three Months Ended September 30, 2024 Year Ended December 31, 2024 ($ in thousands) Q3 2023A Low (Estimated) High (Estimated) 2023A Low (Estimated) High (Estimated) Revenue $76,488 $78,000 $81,000 $303,617 $312,000 $318,000 % Growth 7% 2% 6% 5% 3% 5% Adj. EBITDA(1) 29,835 30,000 33,000 112,990 123,000 128,000 % Growth 0% 1% 11% 2% 9% 13% % Margin(1) 39% 38% 41% 37% 39% 40% Note: This financial information has been prepared by and is the responsibility of our management. Our independent registered public accounting firm has not audited, reviewed or performed any procedures with respect to this preliminary financial data or the accounting treatment thereof and does not express an opinion or any other form of assurance with respect thereto. (1) Adj. EBITDA is a non-GAAP measure. Adj. EBITDA margin represents Adj. EBITDA as a percentage of revenues. No reconciliation is provided with respect to certain forward-looking non-GAAP financial measures as the GAAP measures are not accessible on a forward-looking basis. We cannot reliably predict all necessary components or their impact to reconcile such financial measures without unreasonable effort.

©2024 MERIDIANLINK, INC. ALL RIGHTS RESERVED. 13 Appendix
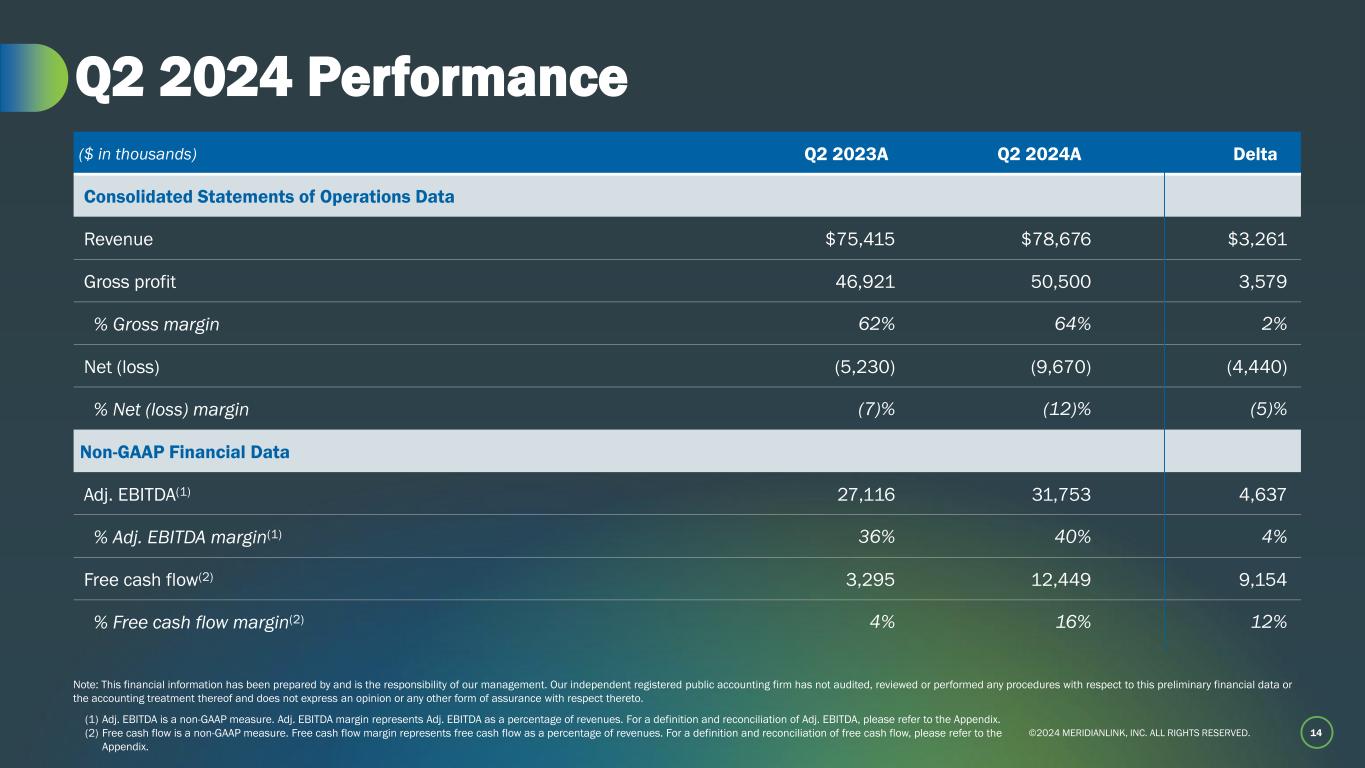
©2024 MERIDIANLINK, INC. ALL RIGHTS RESERVED. 14 Q2 2024 Performance ($ in thousands) Q2 2023A Q2 2024A Delta Consolidated Statements of Operations Data Revenue $75,415 $78,676 $3,261 Gross profit 46,921 50,500 3,579 % Gross margin 62% 64% 2% Net (loss) (5,230) (9,670) (4,440) % Net (loss) margin (7)% (12)% (5)% Non-GAAP Financial Data Adj. EBITDA(1) 27,116 31,753 4,637 % Adj. EBITDA margin(1) 36% 40% 4% Free cash flow(2) 3,295 12,449 9,154 % Free cash flow margin(2) 4% 16% 12% Note: This financial information has been prepared by and is the responsibility of our management. Our independent registered public accounting firm has not audited, reviewed or performed any procedures with respect to this preliminary financial data or the accounting treatment thereof and does not express an opinion or any other form of assurance with respect thereto. (1) Adj. EBITDA is a non-GAAP measure. Adj. EBITDA margin represents Adj. EBITDA as a percentage of revenues. For a definition and reconciliation of Adj. EBITDA, please refer to the Appendix. (2) Free cash flow is a non-GAAP measure. Free cash flow margin represents free cash flow as a percentage of revenues. For a definition and reconciliation of free cash flow, please refer to the Appendix.
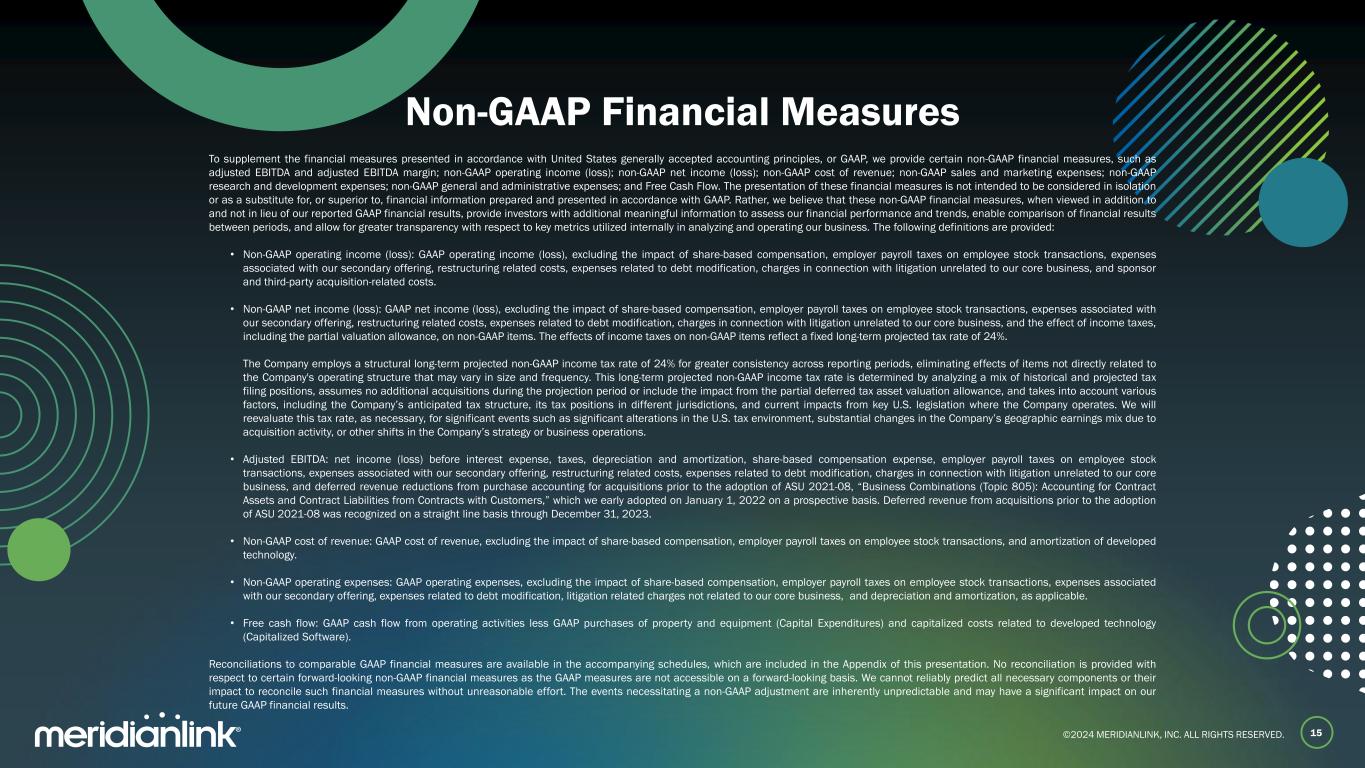
©2024 MERIDIANLINK, INC. ALL RIGHTS RESERVED.©2024 MERIDIA LINK, INC. ALL IGHTS RESERVED. Non-GAAP Financial Measures 15 To supplement the financial measures presented in accordance with United States generally accepted accounting principles, or GAAP, we provide certain non-GAAP financial measures, such as adjusted EBITDA and adjusted EBITDA margin; non-GAAP operating income (loss); non-GAAP net income (loss); non-GAAP cost of revenue; non-GAAP sales and marketing expenses; non-GAAP research and development expenses; non-GAAP general and administrative expenses; and Free Cash Flow. The presentation of these financial measures is not intended to be considered in isolation or as a substitute for, or superior to, financial information prepared and presented in accordance with GAAP. Rather, we believe that these non-GAAP financial measures, when viewed in addition to and not in lieu of our reported GAAP financial results, provide investors with additional meaningful information to assess our financial performance and trends, enable comparison of financial results between periods, and allow for greater transparency with respect to key metrics utilized internally in analyzing and operating our business. The following definitions are provided: • Non-GAAP operating income (loss): GAAP operating income (loss), excluding the impact of share-based compensation, employer payroll taxes on employee stock transactions, expenses associated with our secondary offering, restructuring related costs, expenses related to debt modification, charges in connection with litigation unrelated to our core business, and sponsor and third-party acquisition-related costs. • Non-GAAP net income (loss): GAAP net income (loss), excluding the impact of share-based compensation, employer payroll taxes on employee stock transactions, expenses associated with our secondary offering, restructuring related costs, expenses related to debt modification, charges in connection with litigation unrelated to our core business, and the effect of income taxes, including the partial valuation allowance, on non-GAAP items. The effects of income taxes on non-GAAP items reflect a fixed long-term projected tax rate of 24%. The Company employs a structural long-term projected non-GAAP income tax rate of 24% for greater consistency across reporting periods, eliminating effects of items not directly related to the Company's operating structure that may vary in size and frequency. This long-term projected non-GAAP income tax rate is determined by analyzing a mix of historical and projected tax filing positions, assumes no additional acquisitions during the projection period or include the impact from the partial deferred tax asset valuation allowance, and takes into account various factors, including the Company’s anticipated tax structure, its tax positions in different jurisdictions, and current impacts from key U.S. legislation where the Company operates. We will reevaluate this tax rate, as necessary, for significant events such as significant alterations in the U.S. tax environment, substantial changes in the Company’s geographic earnings mix due to acquisition activity, or other shifts in the Company’s strategy or business operations. • Adjusted EBITDA: net income (loss) before interest expense, taxes, depreciation and amortization, share-based compensation expense, employer payroll taxes on employee stock transactions, expenses associated with our secondary offering, restructuring related costs, expenses related to debt modification, charges in connection with litigation unrelated to our core business, and deferred revenue reductions from purchase accounting for acquisitions prior to the adoption of ASU 2021-08, “Business Combinations (Topic 805): Accounting for Contract Assets and Contract Liabilities from Contracts with Customers,” which we early adopted on January 1, 2022 on a prospective basis. Deferred revenue from acquisitions prior to the adoption of ASU 2021-08 was recognized on a straight line basis through December 31, 2023. • Non-GAAP cost of revenue: GAAP cost of revenue, excluding the impact of share-based compensation, employer payroll taxes on employee stock transactions, and amortization of developed technology. • Non-GAAP operating expenses: GAAP operating expenses, excluding the impact of share-based compensation, employer payroll taxes on employee stock transactions, expenses associated with our secondary offering, expenses related to debt modification, litigation related charges not related to our core business, and depreciation and amortization, as applicable. • Free cash flow: GAAP cash flow from operating activities less GAAP purchases of property and equipment (Capital Expenditures) and capitalized costs related to developed technology (Capitalized Software). Reconciliations to comparable GAAP financial measures are available in the accompanying schedules, which are included in the Appendix of this presentation. No reconciliation is provided with respect to certain forward-looking non-GAAP financial measures as the GAAP measures are not accessible on a forward-looking basis. We cannot reliably predict all necessary components or their impact to reconcile such financial measures without unreasonable effort. The events necessitating a non-GAAP adjustment are inherently unpredictable and may have a significant impact on our future GAAP financial results.
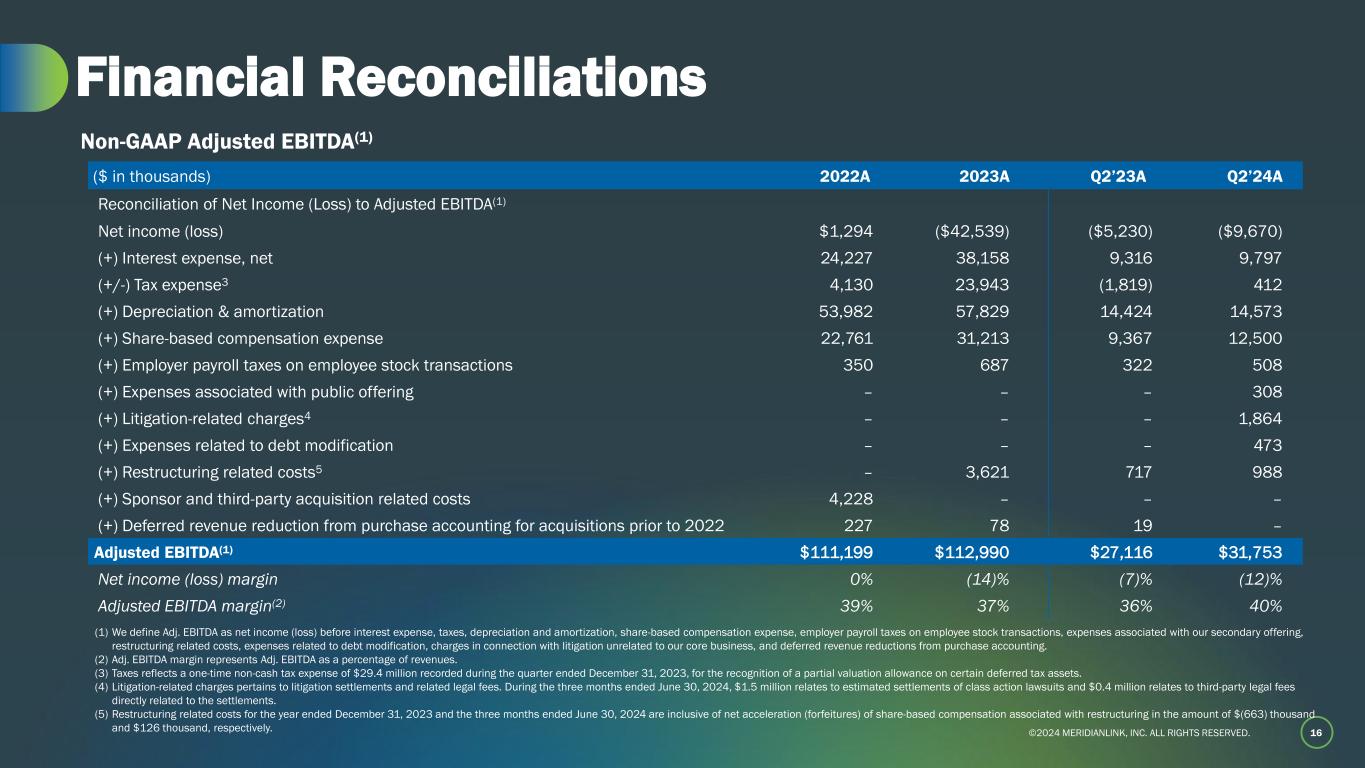
©2024 MERIDIANLINK, INC. ALL RIGHTS RESERVED. 16 Financial Reconciliations ($ in thousands) 2022A 2023A Q2’23A Q2’24A Reconciliation of Net Income (Loss) to Adjusted EBITDA(1) Net income (loss) $1,294 ($42,539) ($5,230) ($9,670) (+) Interest expense, net 24,227 38,158 9,316 9,797 (+/-) Tax expense3 4,130 23,943 (1,819) 412 (+) Depreciation & amortization 53,982 57,829 14,424 14,573 (+) Share-based compensation expense 22,761 31,213 9,367 12,500 (+) Employer payroll taxes on employee stock transactions 350 687 322 508 (+) Expenses associated with public offering – – – 308 (+) Litigation-related charges4 – – – 1,864 (+) Expenses related to debt modification – – – 473 (+) Restructuring related costs5 – 3,621 717 988 (+) Sponsor and third-party acquisition related costs 4,228 – – – (+) Deferred revenue reduction from purchase accounting for acquisitions prior to 2022 227 78 19 – Adjusted EBITDA(1) $111,199 $112,990 $27,116 $31,753 Net income (loss) margin 0% (14)% (7)% (12)% Adjusted EBITDA margin(2) 39% 37% 36% 40% Non-GAAP Adjusted EBITDA(1) (1) We define Adj. EBITDA as net income (loss) before interest expense, taxes, depreciation and amortization, share-based compensation expense, employer payroll taxes on employee stock transactions, expenses associated with our secondary offering, restructuring related costs, expenses related to debt modification, charges in connection with litigation unrelated to our core business, and deferred revenue reductions from purchase accounting. (2) Adj. EBITDA margin represents Adj. EBITDA as a percentage of revenues. (3) Taxes reflects a one-time non-cash tax expense of $29.4 million recorded during the quarter ended December 31, 2023, for the recognition of a partial valuation allowance on certain deferred tax assets. (4) Litigation-related charges pertains to litigation settlements and related legal fees. During the three months ended June 30, 2024, $1.5 million relates to estimated settlements of class action lawsuits and $0.4 million relates to third-party legal fees directly related to the settlements. (5) Restructuring related costs for the year ended December 31, 2023 and the three months ended June 30, 2024 are inclusive of net acceleration (forfeitures) of share-based compensation associated with restructuring in the amount of $(663) thousand and $126 thousand, respectively.

©2024 MERIDIANLINK, INC. ALL RIGHTS RESERVED. 17 Financial Reconciliations (Cont’d) ($ in thousands) 2022A 2023A Q2’23A Q2’24A Revenues, net $288,046 $303,617 $75,415 $78,676 Cost of revenue 106,331 108,491 28,494 28,176 (-) Share-based compensation expense 4,630 3,848 1,157 1,363 (-) Employer payroll taxes on employee stock transactions 127 157 88 97 (-) Amortization of developed technology 15,553 18,129 4,510 4,803 Non-GAAP cost of revenue 86,021 86,357 22,739 21,913 Adjusted gross profit $202,025 $217,260 $52,676 $56,763 GAAP gross margin 63% 66% 62% 64% Adjusted gross margin 70% 72% 70% 72% Adjusted Gross Profit ($ in thousands) 2022A 2023A Q2’23A Q2’24A Operating income (loss) $28,588 $15,533 $1,483 ($1,097) (+) Share-based compensation expense 22,761 31,213 9,367 12,500 (+) Employer payroll taxes on employee stock transactions 350 687 322 508 (+) Expenses associated with public offering – – – 308 (+) Litigation-related charges(1) – – – 1,864 (+) Expenses related to debt modification – – – 473 (+) Sponsor and third-party acquisition related costs 4,228 – – – (+) Restructuring related costs(2) – 3,621 717 988 Non-GAAP operating income $55,927 $51,054 $11,889 $15,544 GAAP operating margin 10% 5% 2% (1)% Non-GAAP operating margin 19% 17% 16% 20% Non-GAAP Operating Income Note: Adj. gross profit is a non-GAAP Measure. Adj. gross profit is calculated by subtracting non-GAAP cost of revenue from net revenues. Adj. gross profit margin represents adj. gross profit as a percentage of revenues. (1) Litigation-related charges pertains to litigation settlements and related legal fees. During the three months ended June 30, 2024, $1.5 million relates to estimated settlements of class action lawsuits and $0.4 million relates to third-party legal fees directly related to the settlements. (2) Restructuring related costs for the year ended December 31, 2023 and the three months ended June 30, 2024 are inclusive of net acceleration (forfeitures) of share-based compensation associated with restructuring in the amount of $(663) thousand and $126 thousand, respectively.

©2024 MERIDIANLINK, INC. ALL RIGHTS RESERVED. 18 Financial Reconciliations (Cont’d) ($ in thousands) 2022A 2023A Q2’23A Q2’24A Sales and marketing $23,658 $35,792 $8,558 $11,467 (-) Share-based compensation expense 2,160 3,849 1,104 1,814 (-) Employer payroll taxes on employee stock transactions 40 95 30 80 Non-GAAP sales and marketing $21,458 $31,848 $7,424 $9,573 GAAP sales and marketing as a % of revenue 8% 12% 11% 15% Non-GAAP sales and marketing as a % of revenue 7% 10% 10% 12% Non-GAAP Sales and Marketing Expense ($ in thousands) 2022A 2023A Q2’23A Q2’24A Research and development $42,592 $47,517 $11,754 $9,905 (-) Share-based compensation expense 6,472 7,060 1,875 2,531 (-) Employer payroll taxes on employee stock transactions 102 189 97 125 Non-GAAP research and development $36,018 $40,268 $9,782 $7,249 GAAP research and development as a % of revenue 15% 16% 16% 13% Non-GAAP research and development as a % of revenue 13% 13% 13% 9% Non-GAAP Research and Development Expense ($ in thousands) 2022A 2023A Q2’23A Q2’24A General and administrative $82,649 $92,663 $24,409 $29,237 (-) Share-based compensation expense 9,499 16,456 5,231 6,792 (-) Employer payroll taxes on employee stock transactions 81 246 107 206 (-) Expenses associated with public offering – – – 308 (-) Litigation-related charges(1) – – – 1,864 (-) Expenses associated with debt modification – – – 473 (-) Depreciation expense 2,319 1,860 495 363 (-) Amortization of intangibles 36,110 37,840 9,419 9,407 Non-GAAP general and administrative $34,640 $36,261 $9,157 $9,824 GAAP general and administrative as a % of revenue 29% 31% 32% 37% Non-GAAP general and administrative as a % of revenue 12% 12% 12% 12% Non-GAAP General and Administrative Expense (1) Litigation-related charges pertains to litigation settlements and related legal fees. During the three months ended June 30, 2024, $1.5 million relates to estimated settlements of class action lawsuits and $0.4 million relates to third-party legal fees directly related to the settlements.
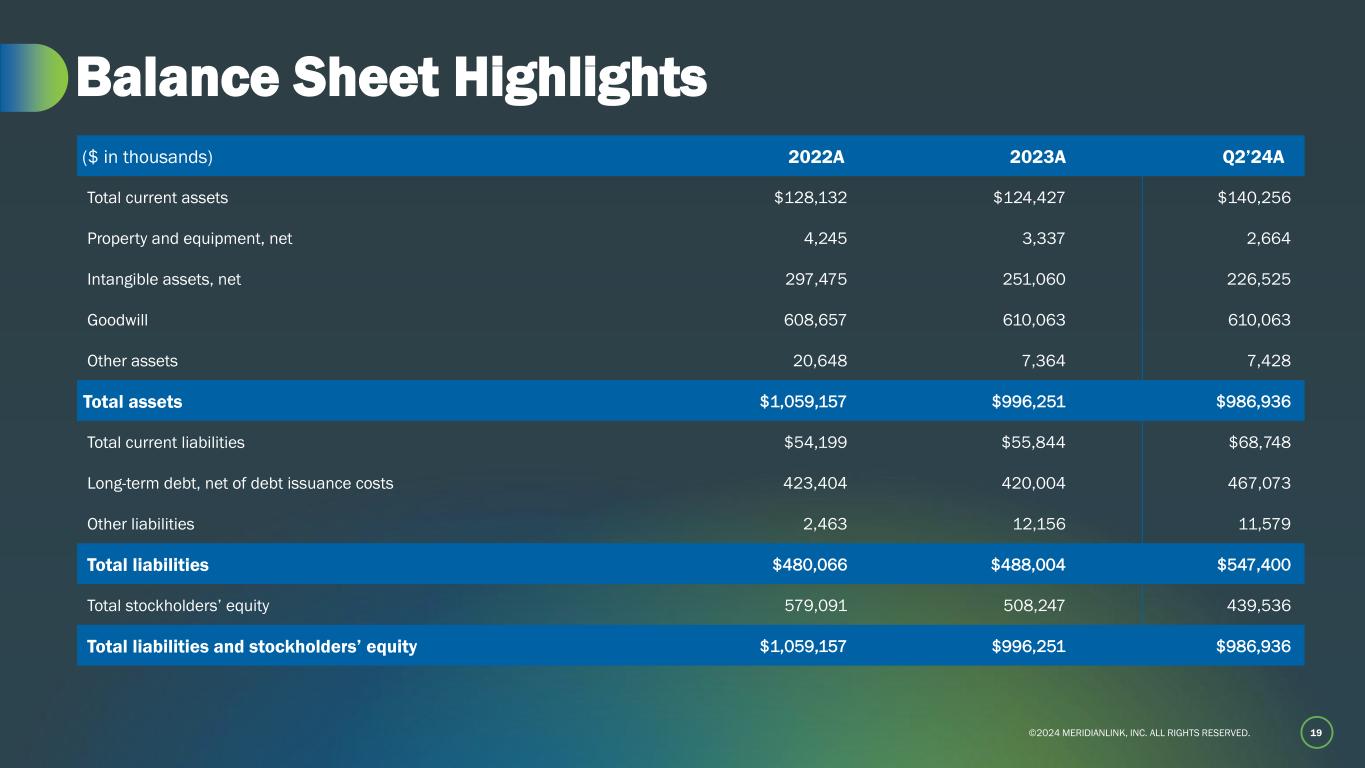
©2024 MERIDIANLINK, INC. ALL RIGHTS RESERVED. 19 Balance Sheet Highlights ($ in thousands) 2022A 2023A Q2’24A Total current assets $128,132 $124,427 $140,256 Property and equipment, net 4,245 3,337 2,664 Intangible assets, net 297,475 251,060 226,525 Goodwill 608,657 610,063 610,063 Other assets 20,648 7,364 7,428 Total assets $1,059,157 $996,251 $986,936 Total current liabilities $54,199 $55,844 $68,748 Long-term debt, net of debt issuance costs 423,404 420,004 467,073 Other liabilities 2,463 12,156 11,579 Total liabilities $480,066 $488,004 $547,400 Total stockholders’ equity 579,091 508,247 439,536 Total liabilities and stockholders’ equity $1,059,157 $996,251 $986,936
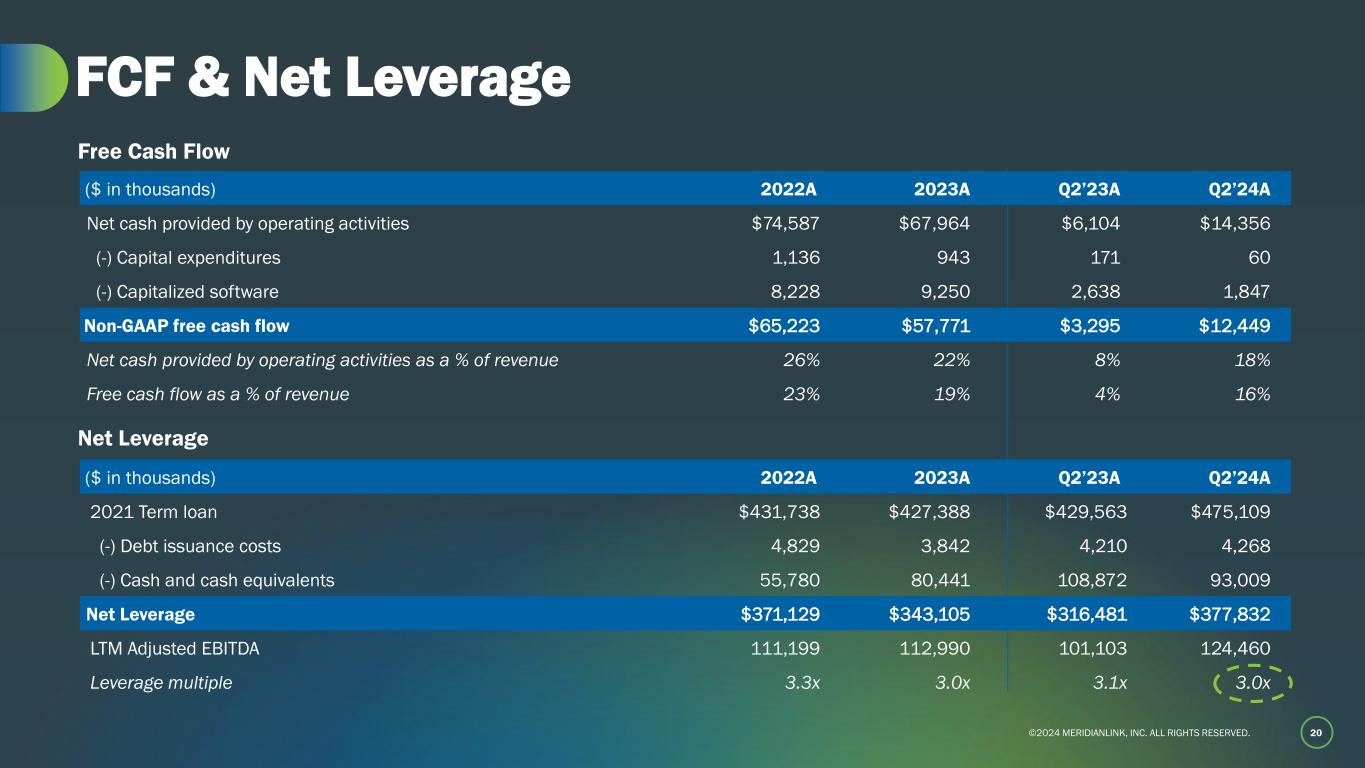
©2024 MERIDIANLINK, INC. ALL RIGHTS RESERVED. 20 FCF & Net Leverage ($ in thousands) 2022A 2023A Q2’23A Q2’24A 2021 Term loan $431,738 $427,388 $429,563 $475,109 (-) Debt issuance costs 4,829 3,842 4,210 4,268 (-) Cash and cash equivalents 55,780 80,441 108,872 93,009 Net Leverage $371,129 $343,105 $316,481 $377,832 LTM Adjusted EBITDA 111,199 112,990 101,103 124,460 Leverage multiple 3.3x 3.0x 3.1x 3.0x ($ in thousands) 2022A 2023A Q2’23A Q2’24A Net cash provided by operating activities $74,587 $67,964 $6,104 $14,356 (-) Capital expenditures 1,136 943 171 60 (-) Capitalized software 8,228 9,250 2,638 1,847 Non-GAAP free cash flow $65,223 $57,771 $3,295 $12,449 Net cash provided by operating activities as a % of revenue 26% 22% 8% 18% Free cash flow as a % of revenue 23% 19% 4% 16% Free Cash Flow Net Leverage
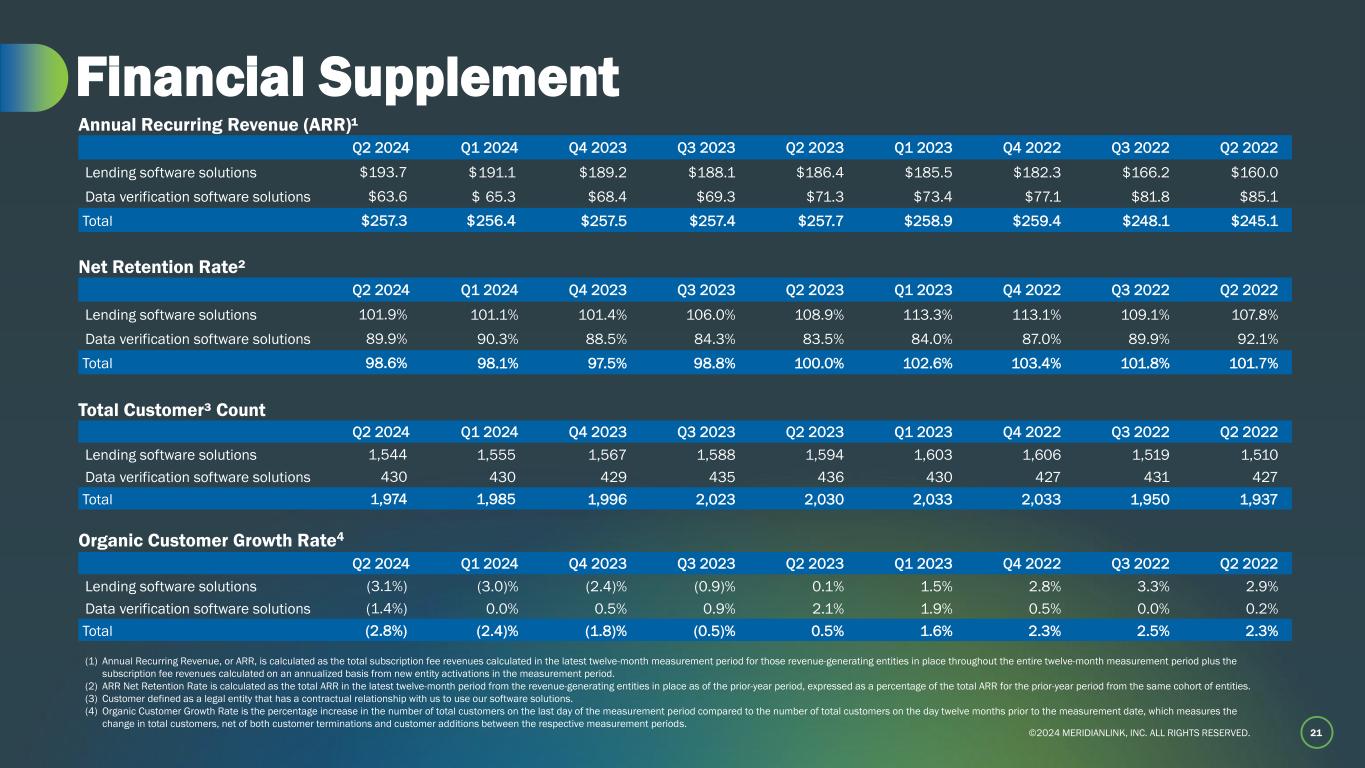
©2024 MERIDIANLINK, INC. ALL RIGHTS RESERVED. 21 Financial Supplement Q2 2024 Q1 2024 Q4 2023 Q3 2023 Q2 2023 Q1 2023 Q4 2022 Q3 2022 Q2 2022 Lending software solutions $193.7 $ 191.1 $189.2 $188.1 $186.4 $185.5 $182.3 $166.2 $160.0 Data verification software solutions $63.6 $ 65.3 $68.4 $69.3 $71.3 $73.4 $77.1 $81.8 $85.1 Total $257.3 $ 256.4 $257.5 $257.4 $257.7 $258.9 $259.4 $248.1 $245.1 Annual Recurring Revenue (ARR)¹ Q2 2024 Q1 2024 Q4 2023 Q3 2023 Q2 2023 Q1 2023 Q4 2022 Q3 2022 Q2 2022 Lending software solutions 101.9% 101.1% 101.4% 106.0% 108.9% 113.3% 113.1% 109.1% 107.8% Data verification software solutions 89.9% 90.3% 88.5% 84.3% 83.5% 84.0% 87.0% 89.9% 92.1% Total 98.6% 98.1% 97.5% 98.8% 100.0% 102.6% 103.4% 101.8% 101.7% Net Retention Rate² Organic Customer Growth Rate4 Q2 2024 Q1 2024 Q4 2023 Q3 2023 Q2 2023 Q1 2023 Q4 2022 Q3 2022 Q2 2022 Lending software solutions 1,544 1,555 1,567 1,588 1,594 1,603 1,606 1,519 1,510 Data verification software solutions 430 430 429 435 436 430 427 431 427 Total 1,974 1,985 1,996 2,023 2,030 2,033 2,033 1,950 1,937 Total Customer³ Count Q2 2024 Q1 2024 Q4 2023 Q3 2023 Q2 2023 Q1 2023 Q4 2022 Q3 2022 Q2 2022 Lending software solutions (3.1%) (3.0)% (2.4)% (0.9)% 0.1% 1.5% 2.8% 3.3% 2.9% Data verification software solutions (1.4%) 0.0% 0.5% 0.9% 2.1% 1.9% 0.5% 0.0% 0.2% Total (2.8%) (2.4)% (1.8)% (0.5)% 0.5% 1.6% 2.3% 2.5% 2.3% (1) Annual Recurring Revenue, or ARR, is calculated as the total subscription fee revenues calculated in the latest twelve-month measurement period for those revenue-generating entities in place throughout the entire twelve-month measurement period plus the subscription fee revenues calculated on an annualized basis from new entity activations in the measurement period. (2) ARR Net Retention Rate is calculated as the total ARR in the latest twelve-month period from the revenue-generating entities in place as of the prior-year period, expressed as a percentage of the total ARR for the prior-year period from the same cohort of entities. (3) Customer defined as a legal entity that has a contractual relationship with us to use our software solutions. (4) Organic Customer Growth Rate is the percentage increase in the number of total customers on the last day of the measurement period compared to the number of total customers on the day twelve months prior to the measurement date, which measures the change in total customers, net of both customer terminations and customer additions between the respective measurement periods.

©2024 MERIDIANLINK, INC. ALL RIGHTS RESERVED.©2024 MERIDIA LINK, INC. ALL IGHTS RESERVED. InvestorRelations@MeridianLink.com 22


