Exhibit 99.1 Synovus Financial Corp. Raymond James Institutional Investor Conference Kevin Blair, Chief Operating Officer March 4th 2019
Forward Looking Statements This slide presentation and certain of our other filings with the Securities and Exchange Commission contain statements that constitute “forward-looking statements” within the meaning of, and subject to the protections of, Section 27A of the Securities Act of 1933, as amended, and Section 21E of the Securities Exchange Act of 1934, as amended. All statements other than statements of historical fact are forward- looking statements. You can identify these forward-looking statements through Synovus’ use of words such as “believes,” “anticipates,” “expects,” “may,” “will,” “assumes,” “should,” “predicts,” “could,” “should,” “would,” “intends,” “targets,” “estimates,” “projects,” “plans,” “potential” and other similar words and expressions of the future or otherwise regarding the outlook for Synovus’ future business and financial performance and/or the performance of the banking industry and economy in general. These forward-looking statements include, among others, statements on (1) future loan and deposit growth; (2) future revenue growth and net interest margin; (3) future non-interest expense levels and operating leverage; (4) future credit trends and key metrics; (5) future effective tax rates; (6) the FCB integration; (7) future capital return to common shareholders; (8) our strategy and initiatives for future growth, capital management, and strategic transactions; (9) future financial targets and goals; (10) our 2019 capital plan; (11) our 2019 outlook, and (12) our assumptions underlying these expectations. Prospective investors are cautioned that any such forward-looking statements are not guarantees of future performance and involve known and unknown risks and uncertainties which may cause the actual results, performance or achievements of Synovus to be materially different from the future results, performance or achievements expressed or implied by such forward-looking statements. Forward-looking statements are based on the information known to, and current beliefs and expectations of, Synovus’ management and are subject to significant risks and uncertainties. Actual results may differ materially from those contemplated by such forward-looking statements. A number of factors could cause actual results to differ materially from those contemplated by the forward-looking statements in this presentation. Many of these factors are beyond Synovus’ ability to control or predict. These forward-looking statements are based upon information presently known to Synovus’ management and are inherently subjective, uncertain and subject to change due to any number of risks and uncertainties, including, without limitation, the risks and other factors set forth in Synovus’ filings with the Securities and Exchange Commission, including its Annual Report on Form 10-K for the year ended December 31, 2018 under the captions “Cautionary Notice Regarding Forward-Looking Statements” and “Risk Factors” and in Synovus’ quarterly reports on Form 10-Q and current reports on Form 8-K. We believe these forward-looking statements are reasonable; however, undue reliance should not be placed on any forward-looking statements, which are based on current expectations and speak only as of the date that they are made. We do not assume any obligation to update any forward-looking statements as a result of new information, future developments or otherwise, except as otherwise may be required by law. Use of Non-GAAP Financial Measures This slide presentation contains certain non-GAAP financial measures determined by methods other than in accordance with generally accepted accounting principles. Such non-GAAP financial measures include the following: adjusted diluted earnings per share; adjusted return on average assets; adjusted return on average common equity; adjusted return on average tangible common equity; adjusted tangible efficiency ratio; adjusted total revenues; tangible book value per common share; and tangible common equity to tangible assets ratio, respectively. The most comparable GAAP measures to these measures are diluted earnings per share; return on average assets; return on average common equity; efficiency ratio; total revenues; book value per common share; and the ratio of total shareholders’ equity to total assets, respectively. Management uses these non-GAAP financial measures to assess the performance of Synovus’ business and the strength of its capital position. Management believes that these non-GAAP financial measures provide meaningful additional information about Synovus to assist management, investors, and bank regulators in evaluating Synovus’ operating results, financial strength, the performance of its business and the strength of its capital position. However, these non-GAAP financial measures have inherent limitations as analytical tools and should not be considered in isolation or as a substitute for analyses of operating results or capital position as reported under GAAP. The non-GAAP financial measures should be considered as additional views of the way our financial measures are affected by significant items and other factors, and since they are not required to be uniformly applied, they may not be comparable to other similarly titled measures at other companies. Adjusted diluted earnings per share, adjusted return on average assets, and adjusted return on average common equity are measures used by management to evaluate operating results exclusive of items that are not indicative of ongoing operations and impact period-to-period comparisons. Adjusted return on average tangible common equity is a measure used by management to compare Synovus’ performance with other financial institutions because it calculates the return available to common shareholders without the impact of intangible assets and their related amortization, thereby allowing management to evaluate the performance of the business consistently. Adjusted tangible efficiency ratio is a measure utilized by management to measure the success of expense management initiatives focused on reducing recurring controllable operating costs. Adjusted total revenues is a measure used by management to evaluate total revenues exclusive of net investment securities gains/losses, changes in fair value of private equity investments, net, and the Cabela’s transaction fee. The tangible common equity to tangible assets ratio and tangible book value per common share are used by management and bank regulators to assess the strength of our capital position. The computations of the non-GAAP financial measures used in this slide presentation are set forth in the Appendix to this slide presentation. 2
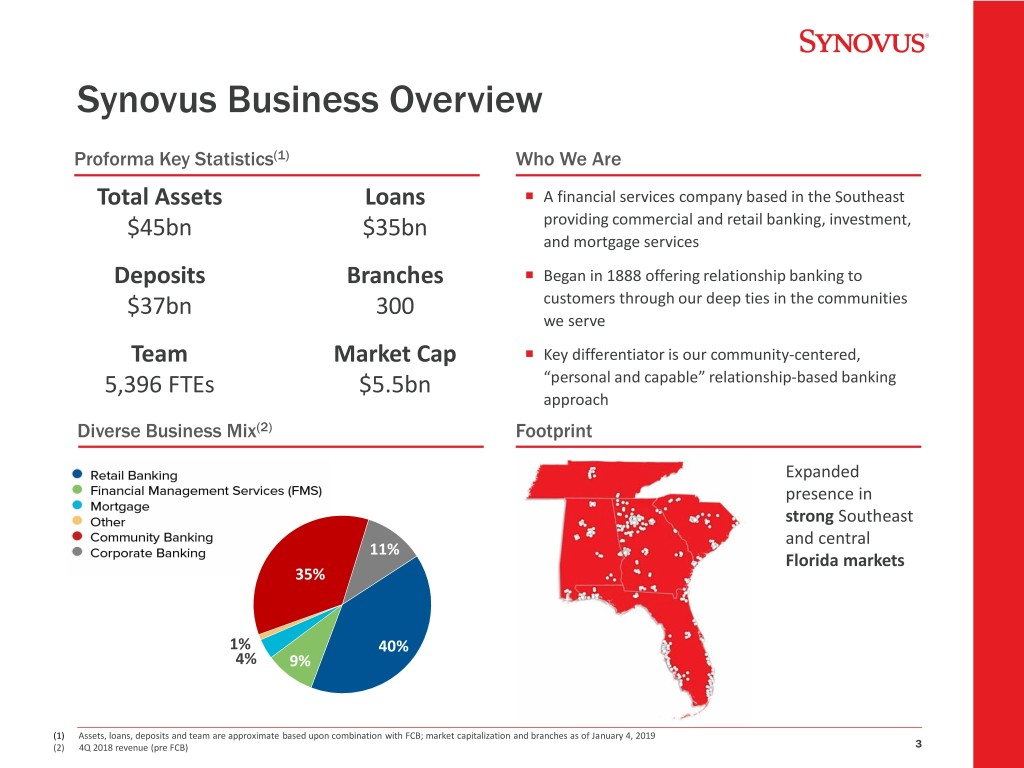
Synovus Business Overview Proforma Key Statistics(1) Who We Are Total Assets Loans A financial services company based in the Southeast $45bn $35bn providing commercial and retail banking, investment, and mortgage services Deposits Branches Began in 1888 offering relationship banking to $37bn 300 customers through our deep ties in the communities we serve Team Market Cap Key differentiator is our community-centered, 5,396 FTEs $5.5bn “personal and capable” relationship-based banking approach Diverse Business Mix(2) Footprint Expanded presence in strong Southeast and central 11% 9% Florida markets 35% 36% 1% 39% 40% 4% 9% 11% (1) Assets, loans, deposits and team are approximate based upon combination with FCB; market capitalization and branches as of January 4, 2019 (2) 4Q 2018 revenue (pre FCB) 3
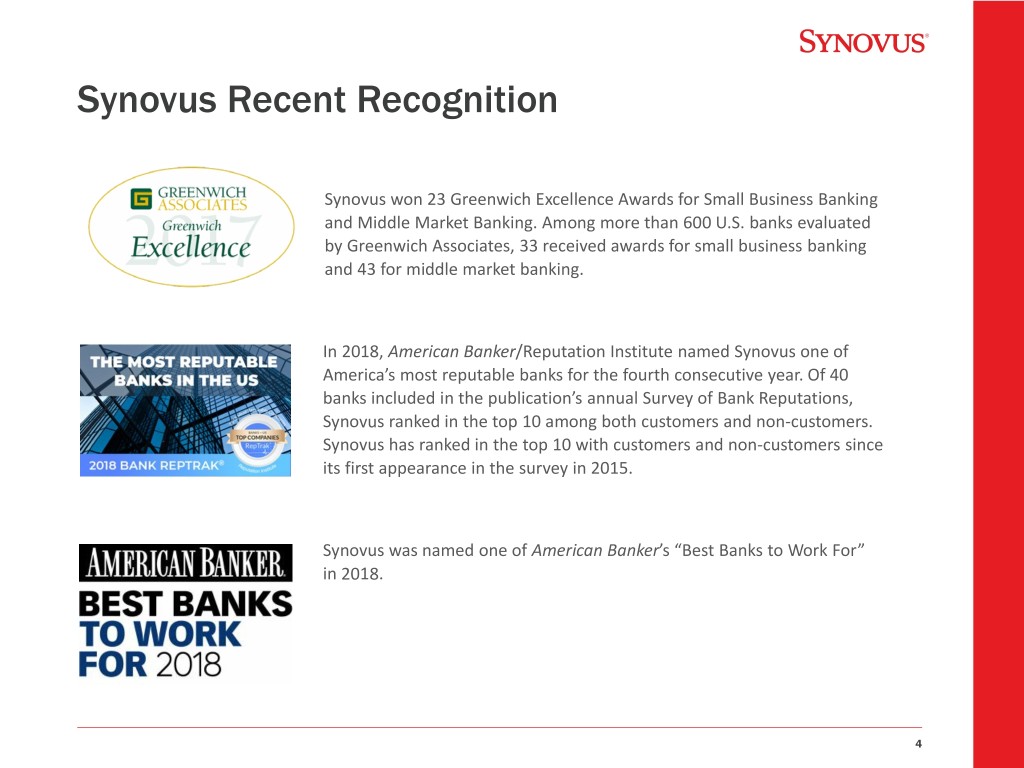
Synovus Recent Recognition Synovus won 23 Greenwich Excellence Awards for Small Business Banking and Middle Market Banking. Among more than 600 U.S. banks evaluated by Greenwich Associates, 33 received awards for small business banking and 43 for middle market banking. In 2018, American Banker/Reputation Institute named Synovus one of America’s most reputable banks for the fourth consecutive year. Of 40 banks included in the publication’s annual Survey of Bank Reputations, Synovus ranked in the top 10 among both customers and non-customers. Synovus has ranked in the top 10 with customers and non-customers since its first appearance in the survey in 2015. Synovus was named one of American Banker’s “Best Banks to Work For” in 2018. 4
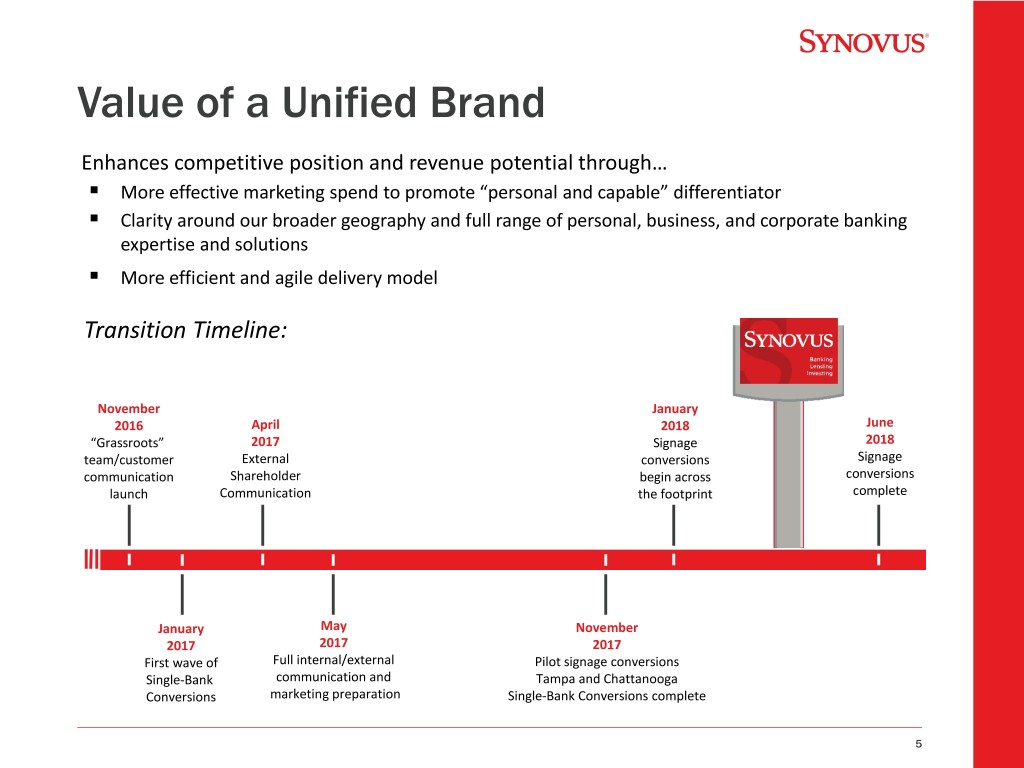
Value of a Unified Brand Enhances competitive position and revenue potential through… . More effective marketing spend to promote “personal and capable” differentiator . Clarity around our broader geography and full range of personal, business, and corporate banking expertise and solutions . More efficient and agile delivery model Transition Timeline: November January 2016 April 2018 June “Grassroots” 2017 Signage 2018 team/customer External conversions Signage communication Shareholder begin across conversions launch Communication the footprint complete January May November 2017 2017 2017 First wave of Full internal/external Pilot signage conversions Single-Bank communication and Tampa and Chattanooga Conversions marketing preparation Single-Bank Conversions complete 5
6
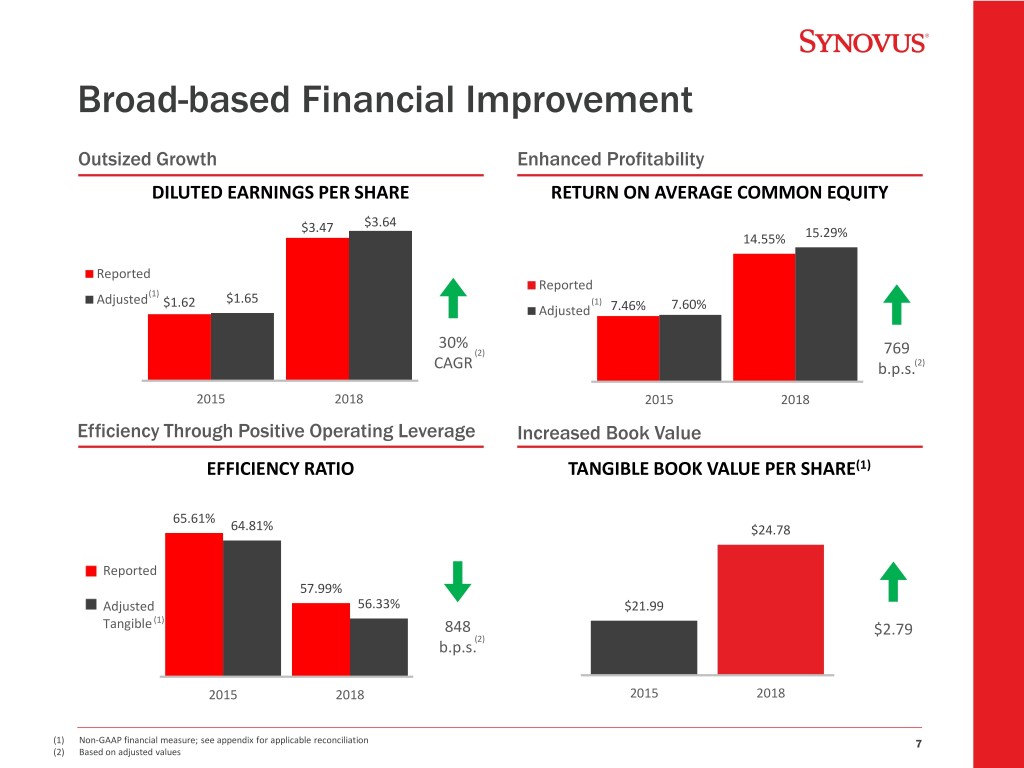
Broad-based Financial Improvement Outsized Growth Enhanced Profitability DILUTED EARNINGS PER SHARE RETURN ON AVERAGE COMMON EQUITY $3.47 $3.64 14.55% 15.29% Reported Reported (1) Adjusted $1.62 $1.65 (1) Adjusted 7.46% 7.60% 30% (2) 769 CAGR b.p.s.(2) 2015 2018 2015 2018 Efficiency Through Positive Operating Leverage Increased Book Value EFFICIENCY RATIO TANGIBLE BOOK VALUE PER SHARE(1) 65.61% 64.81% $24.78 Reported 57.99% Adjusted 56.33% $21.99 (1) Tangible 848 $2.79 (2) b.p.s. 2015 2018 2015 2018 (1) Non-GAAP financial measure; see appendix for applicable reconciliation 7 (2) Based on adjusted values
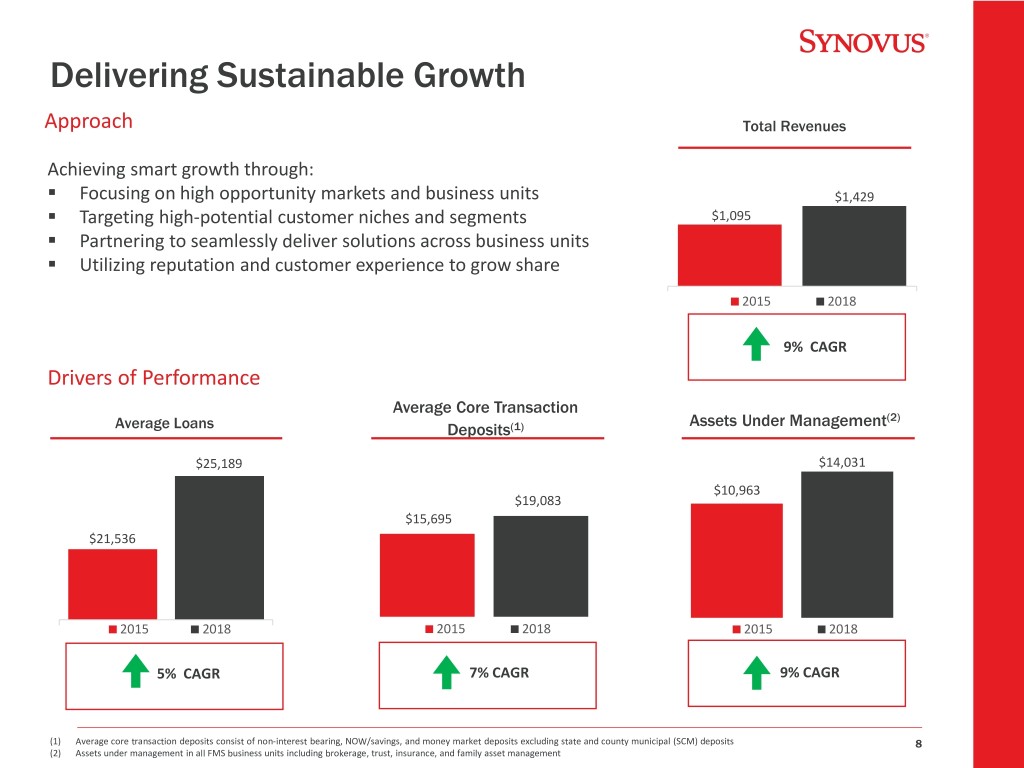
Delivering Sustainable Growth Approach Total Revenues Achieving smart growth through: . Focusing on high opportunity markets and business units $1,429 . Targeting high-potential customer niches and segments $1,095 . Partnering to seamlessly deliver solutions across business units . Utilizing reputation and customer experience to grow share 2015 2018 9% CAGR Drivers of Performance Average Core Transaction Assets Under Management(2) Average Loans Deposits(1) $25,189 $14,031 $10,963 $19,083 $15,695 $21,536 2015 2018 2015 2018 2015 2018 5% CAGR 7% CAGR 9% CAGR (1) Average core transaction deposits consist of non-interest bearing, NOW/savings, and money market deposits excluding state and county municipal (SCM) deposits 8 (2) Assets under management in all FMS business units including brokerage, trust, insurance, and family asset management
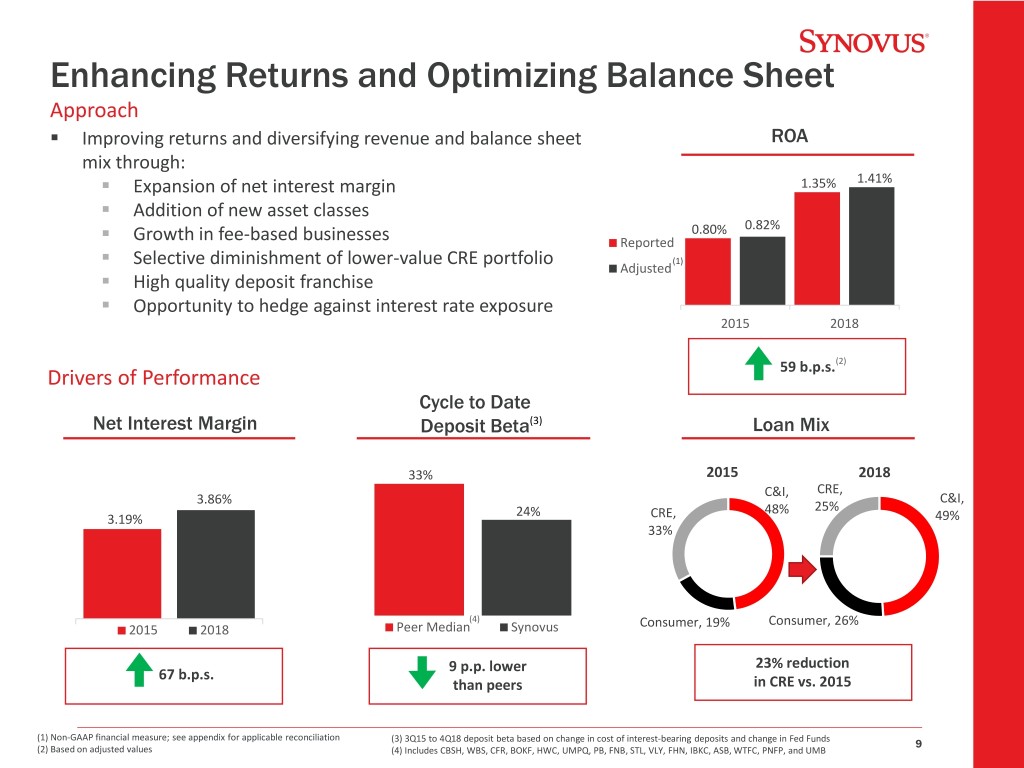
Enhancing Returns and Optimizing Balance Sheet Approach . Improving returns and diversifying revenue and balance sheet ROA mix through: . Expansion of net interest margin 1.35% 1.41% . Addition of new asset classes 0.80% 0.82% . Growth in fee-based businesses Reported . (1) Selective diminishment of lower-value CRE portfolio Adjusted . High quality deposit franchise . Opportunity to hedge against interest rate exposure 2015 2018 59 b.p.s.(2) Drivers of Performance Cycle to Date Net Interest Margin Deposit Beta(3) Loan Mix 33% 2015 2018 C&I, CRE, 3.86% C&I, 24% 48% 25% 3.19% CRE, 49% 33% (4) Consumer, 19% Consumer, 26% 2015 2018 Peer Median Synovus 9 p.p. lower 23% reduction 67 b.p.s. than peers in CRE vs. 2015 (1) Non-GAAP financial measure; see appendix for applicable reconciliation (3) 3Q15 to 4Q18 deposit beta based on change in cost of interest-bearing deposits and change in Fed Funds 9 (2) Based on adjusted values (4) Includes CBSH, WBS, CFR, BOKF, HWC, UMPQ, PB, FNB, STL, VLY, FHN, IBKC, ASB, WTFC, PNFP, and UMB
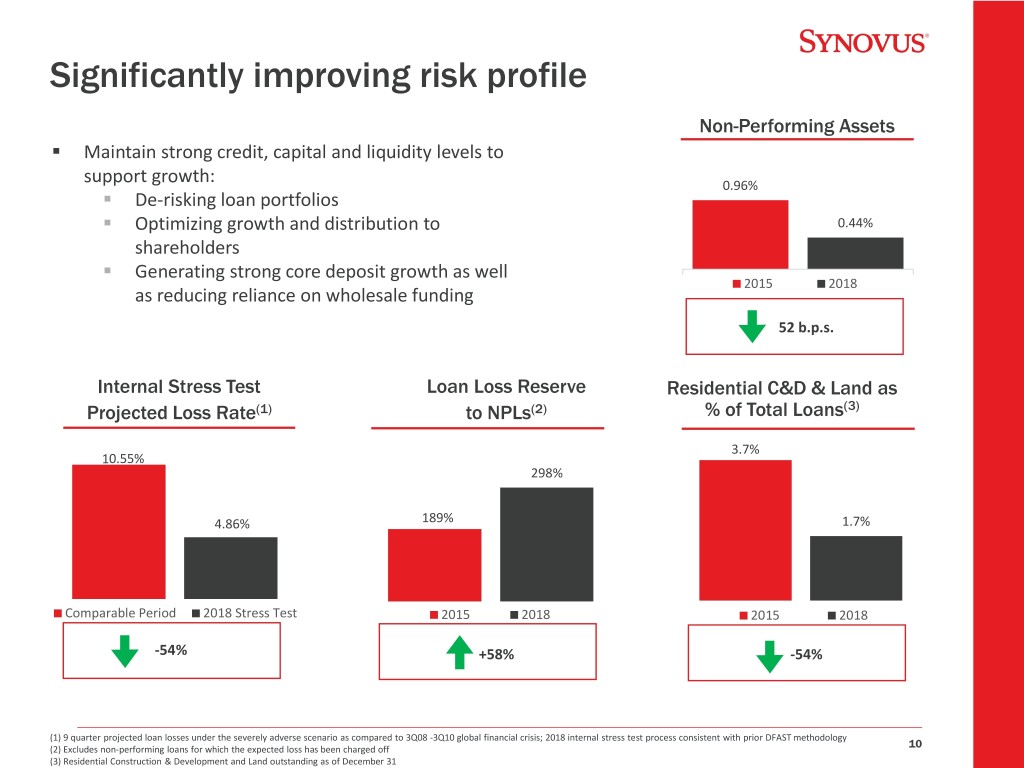
Significantly improving risk profile Non-Performing Assets . Maintain strong credit, capital and liquidity levels to support growth: 0.96% . De-risking loan portfolios . Optimizing growth and distribution to 0.44% shareholders . Generating strong core deposit growth as well 2015 2018 as reducing reliance on wholesale funding 52 b.p.s. Internal Stress Test Loan Loss Reserve Residential C&D & Land as Projected Loss Rate(1) to NPLs(2) % of Total Loans(3) 3.7% 10.55% 298% 4.86% 189% 1.7% Comparable Period 2018 Stress Test 2015 2018 2015 2018 -54% +58% -54% (1) 9 quarter projected loan losses under the severely adverse scenario as compared to 3Q08 -3Q10 global financial crisis; 2018 internal stress test process consistent with prior DFAST methodology (2) Excludes non-performing loans for which the expected loss has been charged off 10 (3) Residential Construction & Development and Land outstanding as of December 31

Strategic Shift in Loan Mix highlights reduced risk profile 2Q 2008 4Q 2018 Change Historical Balance Comparison Loan Balances Mix Loan Balances Mix Loan Balances Mix Investment Properties 4,089,576 14.9% 5,560,951 21.4% 1,580,489 8.0% Land & 1-4 Family 8,029,574 29.3% 1,003,540 3.9% (6,764,351) (24.2%) Commercial Real Estate 12,119,150 44.2% 6,564,491 25.3% (5,183,862) (16.2%) Commercial & Industrial 11,156,019 40.7% 12,781,206 49.2% 867,631 7.8% Consumer 4,211,597 15.3% 6,625,019 25.5% 1,642,260 8.3% 1 2 Total Loans 27,445,891 100.0% 25,970,716 100.0% (2,673,971) - Within Land and 1-4 Family, historically high loss Residential C&D and Land Acquisition loans have declined substantially… Decline of 92% since 2Q08 $5,319 $2,821 $1,363 $862 $829 $606 $434 2Q08 4Q09 4Q11 4Q13 4Q15 4Q17 4Q18 1Includes unearned income of $40.9 million for the period 11 2Includes unearned income of $24.1 million for the period
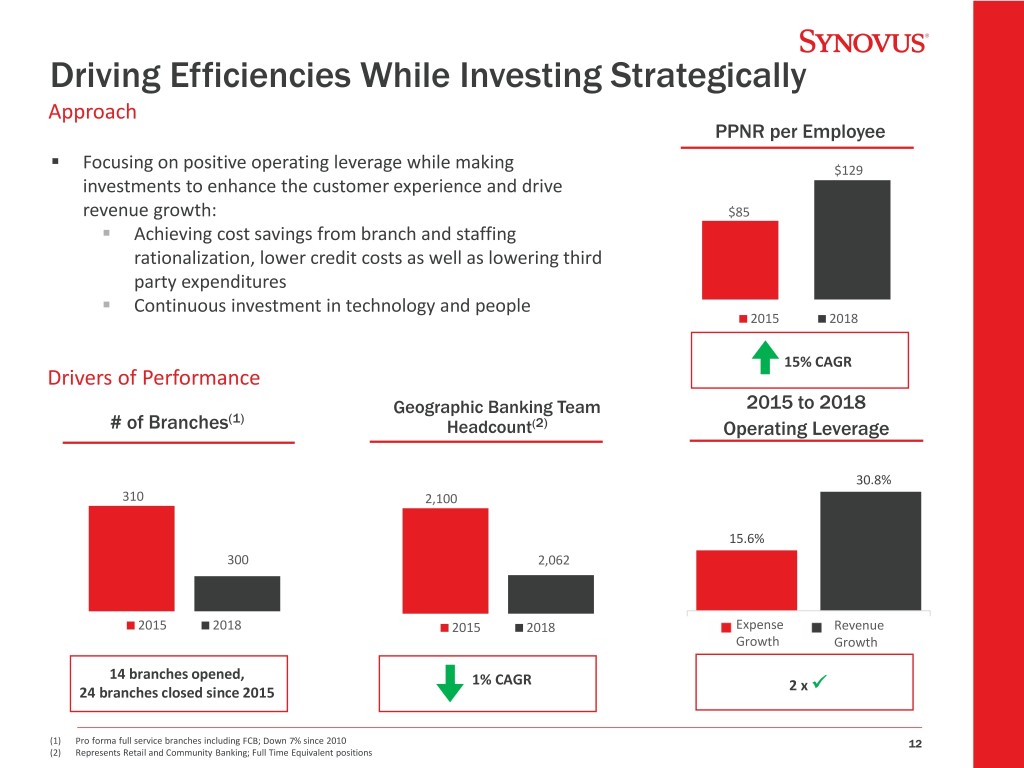
Driving Efficiencies While Investing Strategically Approach PPNR per Employee . Focusing on positive operating leverage while making $129 investments to enhance the customer experience and drive revenue growth: $85 . Achieving cost savings from branch and staffing rationalization, lower credit costs as well as lowering third party expenditures . Continuous investment in technology and people 2015 2018 15% CAGR Drivers of Performance Geographic Banking Team 2015 to 2018 (1) # of Branches Headcount(2) Operating Leverage 30.8% 310 2,100 15.6% 300 2,062 2015 2018 2015 2018 Expense Revenue Growth Growth 14 branches opened, 1% CAGR 24 branches closed since 2015 2 x (1) Pro forma full service branches including FCB; Down 7% since 2010 12 (2) Represents Retail and Community Banking; Full Time Equivalent positions
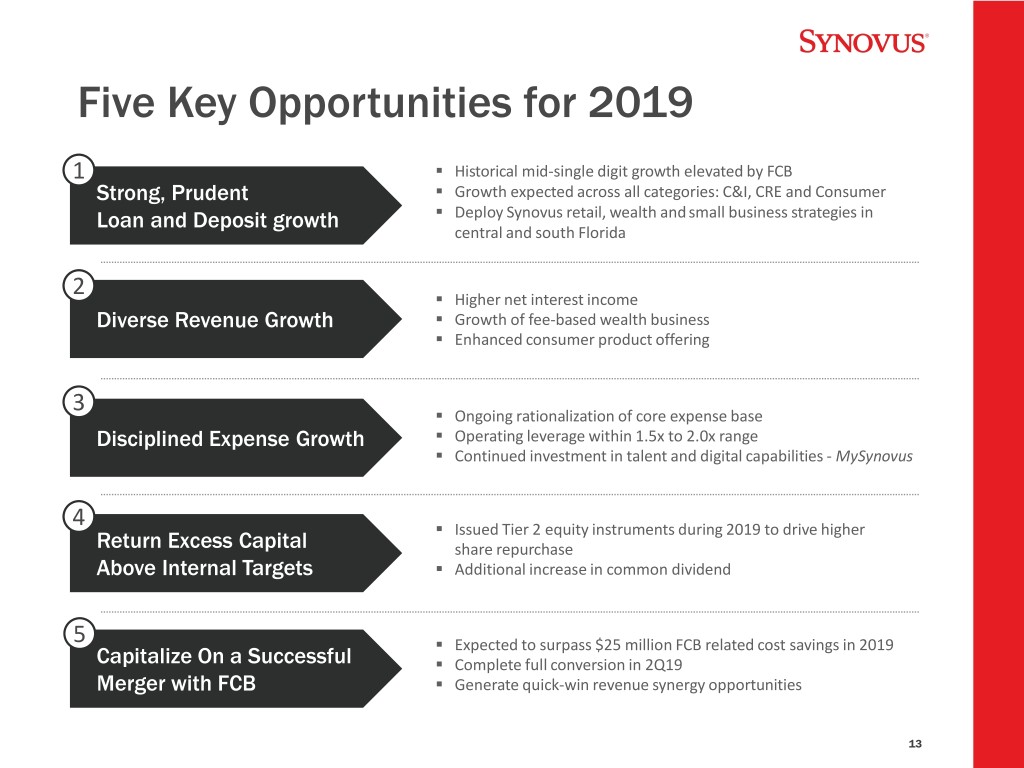
Five Key Opportunities for 2019 1 . Historical mid-single digit growth elevated by FCB Strong, Prudent . Growth expected across all categories: C&I, CRE and Consumer Loan and Deposit growth . Deploy Synovus retail, wealth and small business strategies in central and south Florida 2 . Higher net interest income Diverse Revenue Growth . Growth of fee-based wealth business . Enhanced consumer product offering 3 . Ongoing rationalization of core expense base Disciplined Expense Growth . Operating leverage within 1.5x to 2.0x range . Continued investment in talent and digital capabilities - MySynovus 4 . Issued Tier 2 equity instruments during 2019 to drive higher Return Excess Capital share repurchase Above Internal Targets . Additional increase in common dividend 5 . Expected to surpass $25 million FCB related cost savings in 2019 Capitalize On a Successful . Complete full conversion in 2Q19 Merger with FCB . Generate quick-win revenue synergy opportunities 13
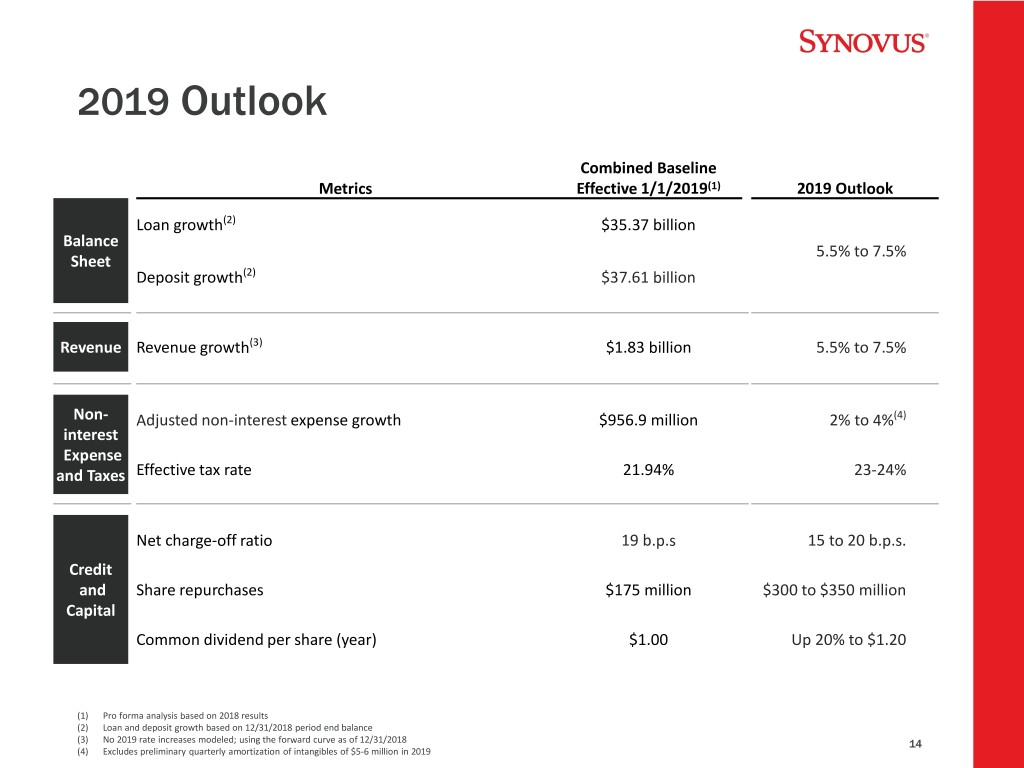
2019 Outlook Combined Baseline Metrics Effective 1/1/2019(1) 2019 Outlook Loan growth(2) $35.37 billion Balance 5.5% to 7.5% Sheet Deposit growth(2) $37.61 billion Revenue Revenue growth(3) $1.83 billion 5.5% to 7.5% Non- Adjusted non-interest expense growth $956.9 million 2% to 4%(4) interest Expense and Taxes Effective tax rate 21.94% 23-24% Net charge-off ratio 19 b.p.s 15 to 20 b.p.s. Credit and Share repurchases $175 million $300 to $350 million Capital Common dividend per share (year) $1.00 Up 20% to $1.20 (1) Pro forma analysis based on 2018 results (2) Loan and deposit growth based on 12/31/2018 period end balance (3) No 2019 rate increases modeled; using the forward curve as of 12/31/2018 14 (4) Excludes preliminary quarterly amortization of intangibles of $5-6 million in 2019
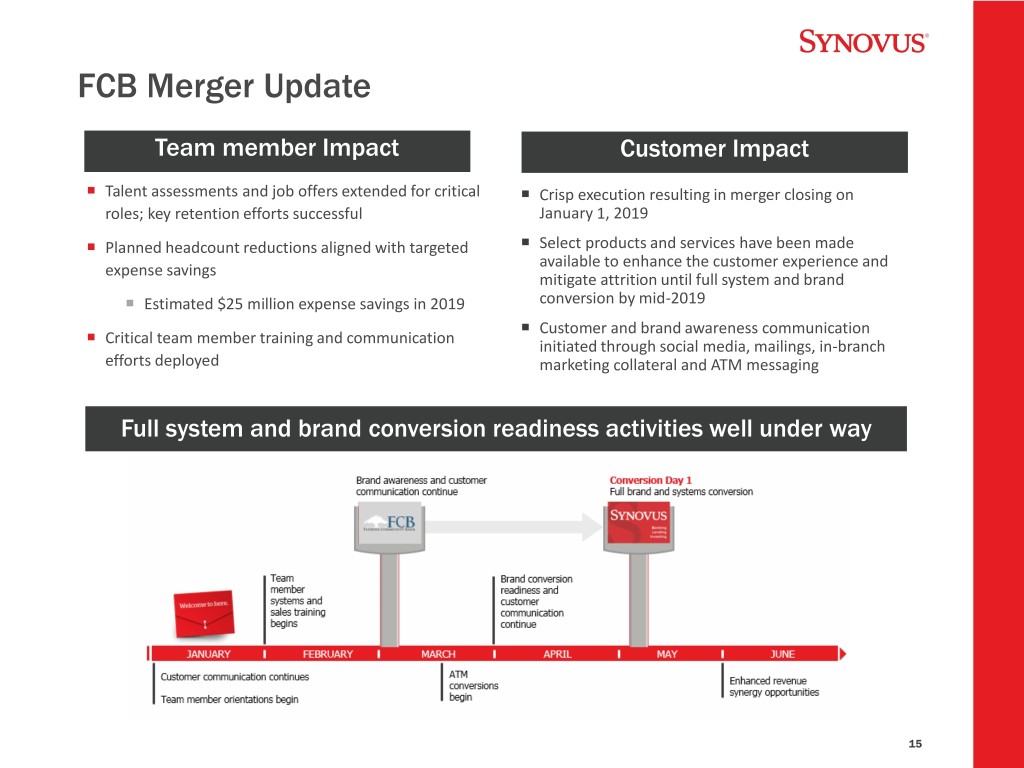
FCB Merger Update Team member Impact Customer Impact Talent assessments and job offers extended for critical Crisp execution resulting in merger closing on roles; key retention efforts successful January 1, 2019 Planned headcount reductions aligned with targeted Select products and services have been made available to enhance the customer experience and expense savings mitigate attrition until full system and brand Estimated $25 million expense savings in 2019 conversion by mid-2019 Customer and brand awareness communication Critical team member training and communication initiated through social media, mailings, in-branch efforts deployed marketing collateral and ATM messaging Full system and brand conversion readiness activities well under way 15
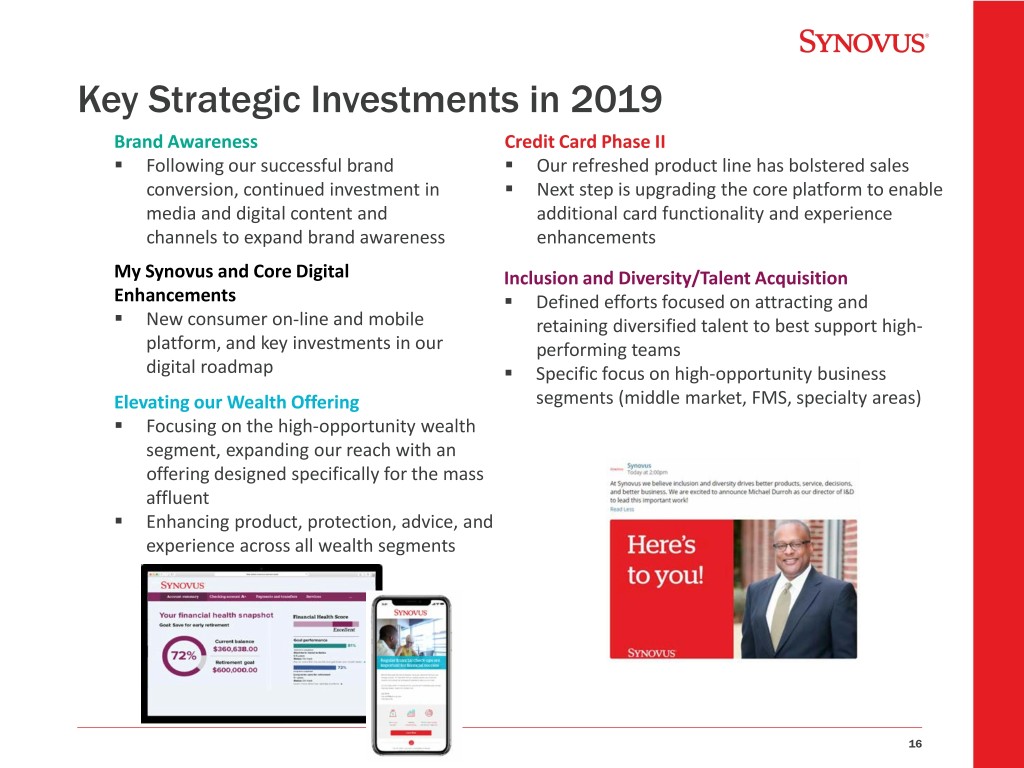
Key Strategic Investments in 2019 Brand Awareness Credit Card Phase II . Following our successful brand . Our refreshed product line has bolstered sales conversion, continued investment in . Next step is upgrading the core platform to enable media and digital content and additional card functionality and experience channels to expand brand awareness enhancements My Synovus and Core Digital Inclusion and Diversity/Talent Acquisition Enhancements . Defined efforts focused on attracting and . New consumer on-line and mobile retaining diversified talent to best support high- platform, and key investments in our performing teams digital roadmap . Specific focus on high-opportunity business Elevating our Wealth Offering segments (middle market, FMS, specialty areas) . Focusing on the high-opportunity wealth segment, expanding our reach with an offering designed specifically for the mass affluent . Enhancing product, protection, advice, and experience across all wealth segments 16
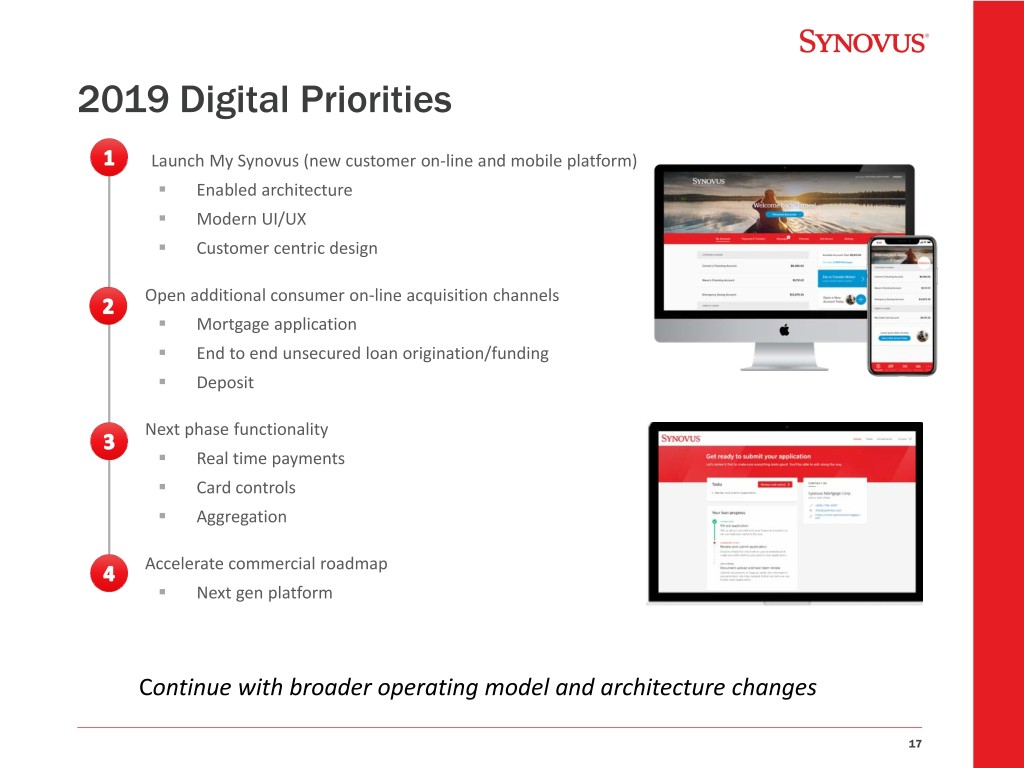
2019 Digital Priorities • Launch My Synovus (new customer on-line and mobile platform) . Enabled architecture . Modern UI/UX . Customer centric design Open additional consumer on-line acquisition channels . Mortgage application . End to end unsecured loan origination/funding . Deposit Next phase functionality . Real time payments . Card controls . Aggregation Accelerate commercial roadmap . Next gen platform Continue with broader operating model and architecture changes 17
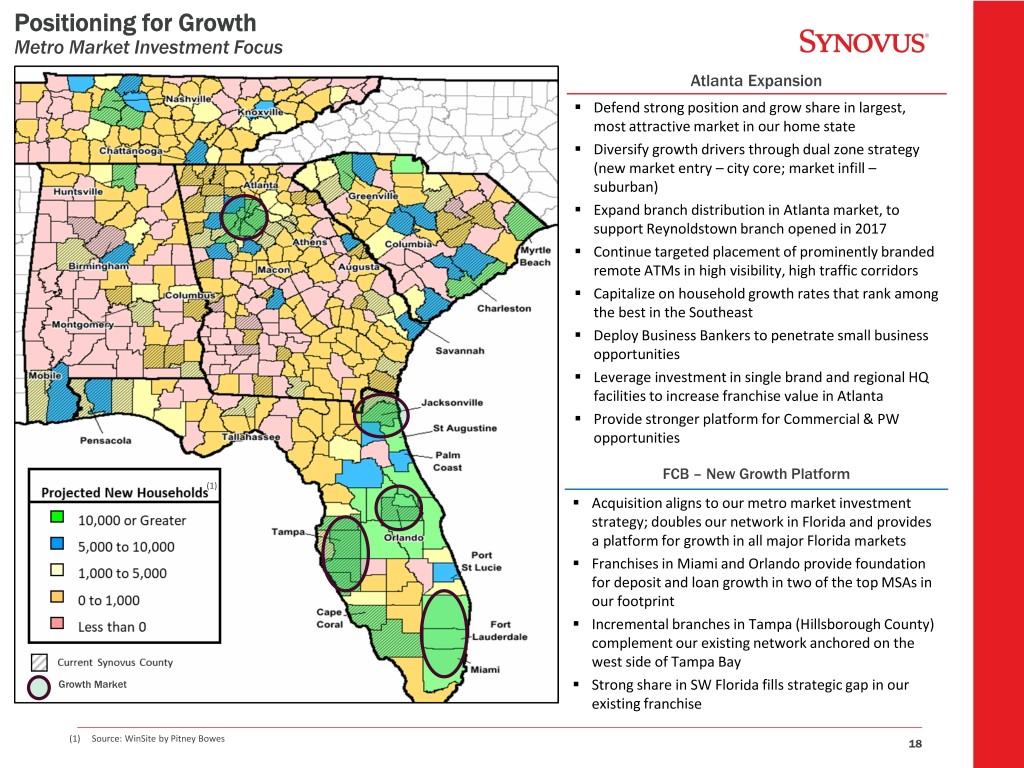
Positioning for Growth Metro Market Investment Focus Atlanta Expansion . Defend strong position and grow share in largest, most attractive market in our home state . Diversify growth drivers through dual zone strategy (new market entry – city core; market infill – suburban) . Expand branch distribution in Atlanta market, to support Reynoldstown branch opened in 2017 . Continue targeted placement of prominently branded remote ATMs in high visibility, high traffic corridors . Capitalize on household growth rates that rank among the best in the Southeast . Deploy Business Bankers to penetrate small business opportunities . Leverage investment in single brand and regional HQ facilities to increase franchise value in Atlanta . Provide stronger platform for Commercial & PW opportunities FCB – New Growth Platform (1) . Acquisition aligns to our metro market investment strategy; doubles our network in Florida and provides a platform for growth in all major Florida markets . Franchises in Miami and Orlando provide foundation for deposit and loan growth in two of the top MSAs in our footprint . Incremental branches in Tampa (Hillsborough County) complement our existing network anchored on the west side of Tampa Bay Growth Market . Strong share in SW Florida fills strategic gap in our existing franchise (1) Source: WinSite by Pitney Bowes 18
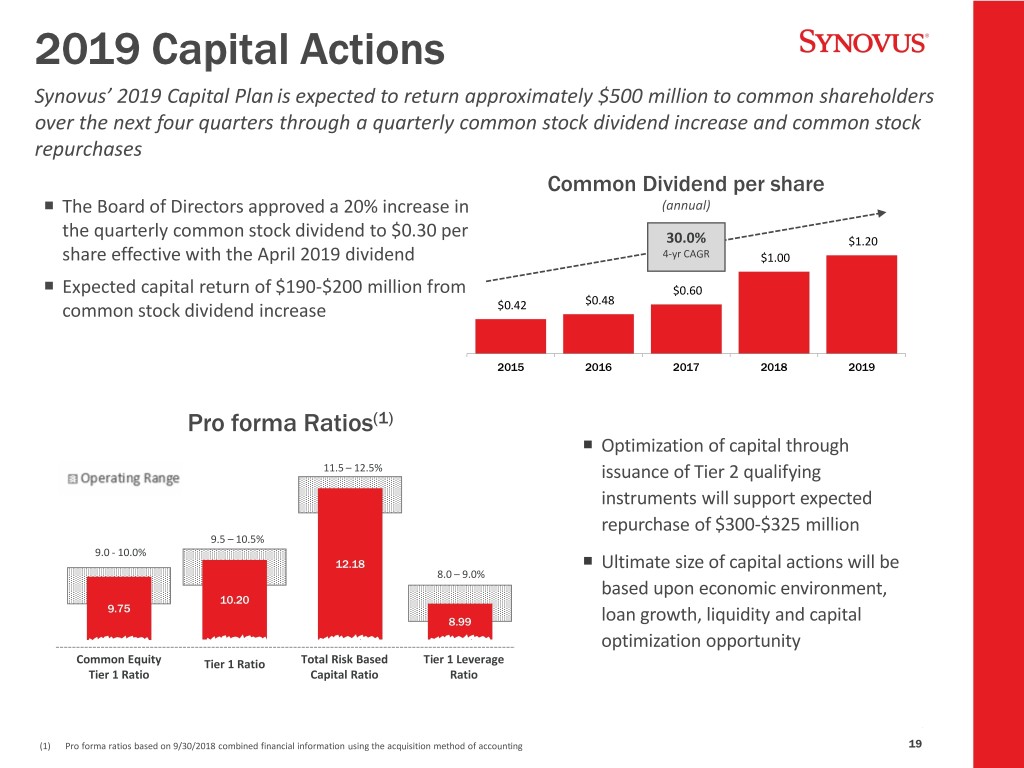
2019 Capital Actions Synovus’ 2019 Capital Plan is expected to return approximately $500 million to common shareholders over the next four quarters through a quarterly common stock dividend increase and common stock repurchases Common Dividend per share The Board of Directors approved a 20% increase in (annual) the quarterly common stock dividend to $0.30 per 30.0% $1.20 share effective with the April 2019 dividend 4-yr CAGR $1.00 Expected capital return of $190-$200 million from $0.60 $0.48 common stock dividend increase $0.42 2015 2016 2017 2018 2019 Pro forma Ratios(1) Optimization of capital through 11.5 – 12.5% issuance of Tier 2 qualifying instruments will support expected repurchase of $300-$325 million 9.5 – 10.5% 9.0 - 10.0% 12.18 Ultimate size of capital actions will be 8.0 – 9.0% based upon economic environment, 10.20 9.75 8.99 loan growth, liquidity and capital optimization opportunity Common Equity Tier 1 Ratio Total Risk Based Tier 1 Leverage Tier 1 Ratio Capital Ratio Ratio (1) Pro forma ratios based on 9/30/2018 combined financial information using the acquisition method of accounting 19
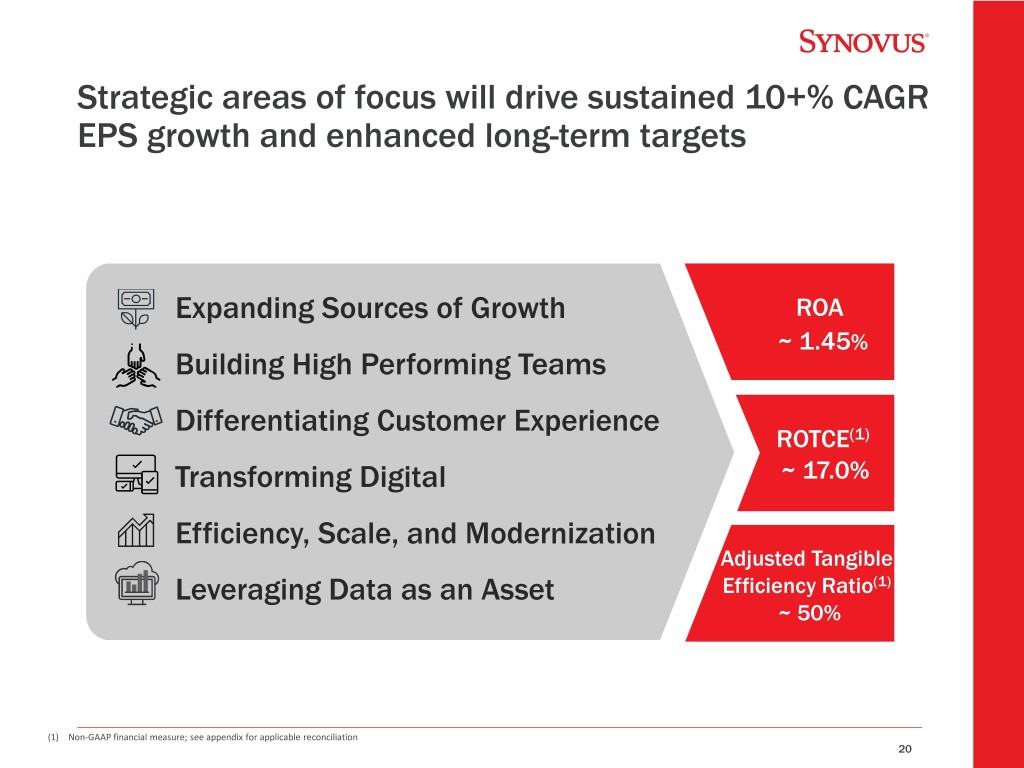
Strategic areas of focus will drive sustained 10+% CAGR EPS growth and enhanced long-term targets Expanding Sources of Growth ROA ~ 1.45% Building High Performing Teams Differentiating Customer Experience ROTCE(1) Transforming Digital ~ 17.0% Efficiency, Scale, and Modernization Adjusted Tangible Leveraging Data as an Asset Efficiency Ratio(1) ~ 50% (1) Non-GAAP financial measure; see appendix for applicable reconciliation 20

Appendix
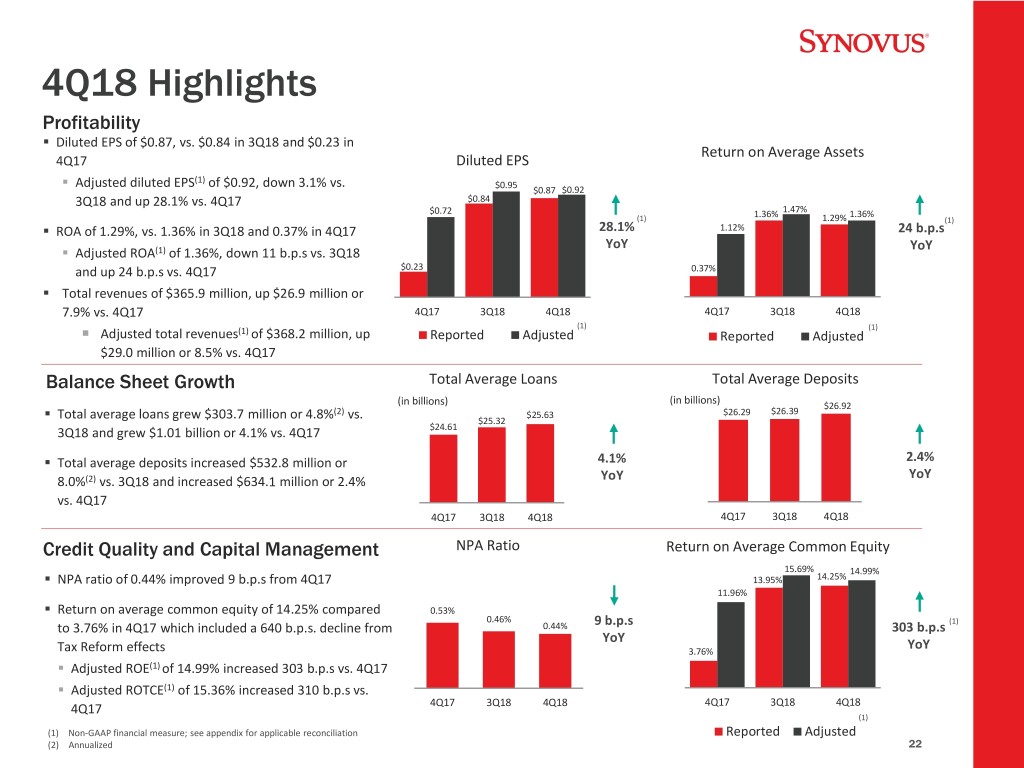
4Q18 Highlights Profitability . Diluted EPS of $0.87, vs. $0.84 in 3Q18 and $0.23 in Return on Average Assets 4Q17 Diluted EPS (1) . Adjusted diluted EPS of $0.92, down 3.1% vs. $0.95 $0.87 $0.92 3Q18 and up 28.1% vs. 4Q17 $0.84 $0.72 1.36% 1.47% 1.36% (1) 1.29% (1) . ROA of 1.29%, vs. 1.36% in 3Q18 and 0.37% in 4Q17 28.1% 1.12% 24 b.p.s YoY YoY . Adjusted ROA(1) of 1.36%, down 11 b.p.s vs. 3Q18 and up 24 b.p.s vs. 4Q17 $0.23 0.37% . Total revenues of $365.9 million, up $26.9 million or 7.9% vs. 4Q17 4Q17 3Q18 4Q18 4Q17 3Q18 4Q18 (1) (1) Adjusted total revenues(1) of $368.2 million, up Reported Adjusted Reported Adjusted $29.0 million or 8.5% vs. 4Q17 Balance Sheet Growth Total Average Loans Total Average Deposits (in billions) (in billions) $26.92 . (2) $25.63 $26.29 $26.39 Total average loans grew $303.7 million or 4.8% vs. $25.32 3Q18 and grew $1.01 billion or 4.1% vs. 4Q17 $24.61 . Total average deposits increased $532.8 million or 4.1% 2.4% YoY 8.0%(2) vs. 3Q18 and increased $634.1 million or 2.4% YoY vs. 4Q17 4Q17 3Q18 4Q18 4Q17 3Q18 4Q18 Credit Quality and Capital Management NPA Ratio Return on Average Common Equity 15.69% 14.99% . NPA ratio of 0.44% improved 9 b.p.s from 4Q17 13.95% 14.25% 11.96% . Return on average common equity of 14.25% compared 0.53% 0.46% 9 b.p.s (1) to 3.76% in 4Q17 which included a 640 b.p.s. decline from 0.44% 303 b.p.s YoY Tax Reform effects 3.76% YoY . Adjusted ROE(1) of 14.99% increased 303 b.p.s vs. 4Q17 . Adjusted ROTCE(1) of 15.36% increased 310 b.p.s vs. 4Q17 3Q18 4Q18 4Q17 4Q17 3Q18 4Q18 (1) (1) Non-GAAP financial measure; see appendix for applicable reconciliation Reported Adjusted (2) Annualized 22
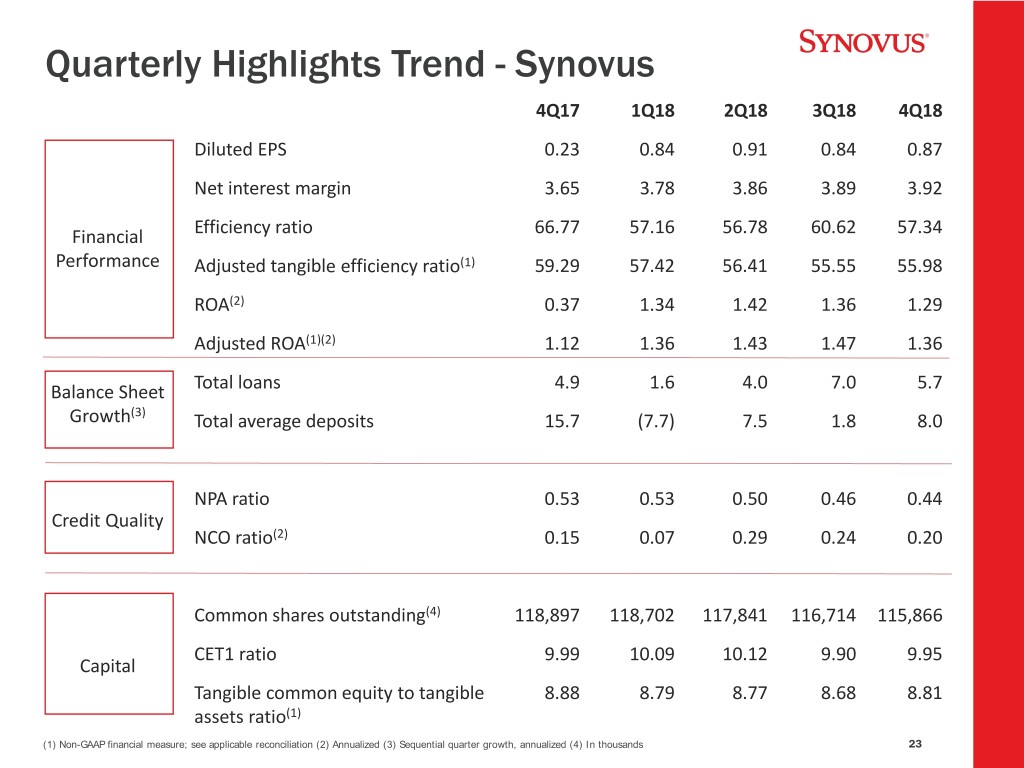
Quarterly Highlights Trend - Synovus 4Q17 1Q18 2Q18 3Q18 4Q18 Diluted EPS 0.23 0.84 0.91 0.84 0.87 Net interest margin 3.65 3.78 3.86 3.89 3.92 Financial Efficiency ratio 66.77 57.16 56.78 60.62 57.34 Performance Adjusted tangible efficiency ratio(1) 59.29 57.42 56.41 55.55 55.98 ROA(2) 0.37 1.34 1.42 1.36 1.29 Adjusted ROA(1)(2) 1.12 1.36 1.43 1.47 1.36 Balance Sheet Total loans 4.9 1.6 4.0 7.0 5.7 Growth(3) Total average deposits 15.7 (7.7) 7.5 1.8 8.0 NPA ratio 0.53 0.53 0.50 0.46 0.44 Credit Quality NCO ratio(2) 0.15 0.07 0.29 0.24 0.20 Common shares outstanding(4) 118,897 118,702 117,841 116,714 115,866 CET1 ratio 9.99 10.09 10.12 9.90 9.95 Capital Tangible common equity to tangible 8.88 8.79 8.77 8.68 8.81 assets ratio(1) (1) Non-GAAP financial measure; see applicable reconciliation (2) Annualized (3) Sequential quarter growth, annualized (4) In thousands 23
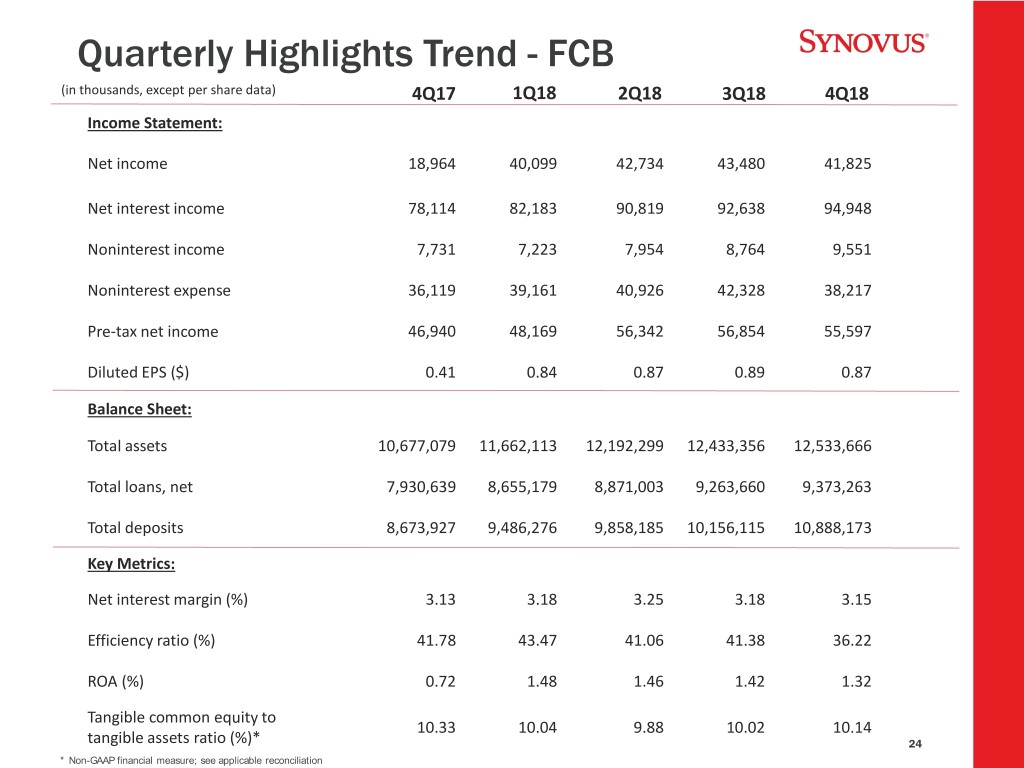
Quarterly Highlights Trend - FCB (in thousands, except per share data) 4Q17 1Q18 2Q18 3Q18 4Q18 Income Statement: Net income 18,964 40,099 42,734 43,480 41,825 Net interest income 78,114 82,183 90,819 92,638 94,948 Noninterest income 7,731 7,223 7,954 8,764 9,551 Noninterest expense 36,119 39,161 40,926 42,328 38,217 Pre-tax net income 46,940 48,169 56,342 56,854 55,597 Diluted EPS ($) 0.41 0.84 0.87 0.89 0.87 Balance Sheet: Total assets 10,677,079 11,662,113 12,192,299 12,433,356 12,533,666 Total loans, net 7,930,639 8,655,179 8,871,003 9,263,660 9,373,263 Total deposits 8,673,927 9,486,276 9,858,185 10,156,115 10,888,173 Key Metrics: Net interest margin (%) 3.13 3.18 3.25 3.18 3.15 Efficiency ratio (%) 41.78 43.47 41.06 41.38 36.22 ROA (%) 0.72 1.48 1.46 1.42 1.32 Tangible common equity to 10.33 10.04 9.88 10.02 10.14 tangible assets ratio (%)* 24 * Non-GAAP financial measure; see applicable reconciliation
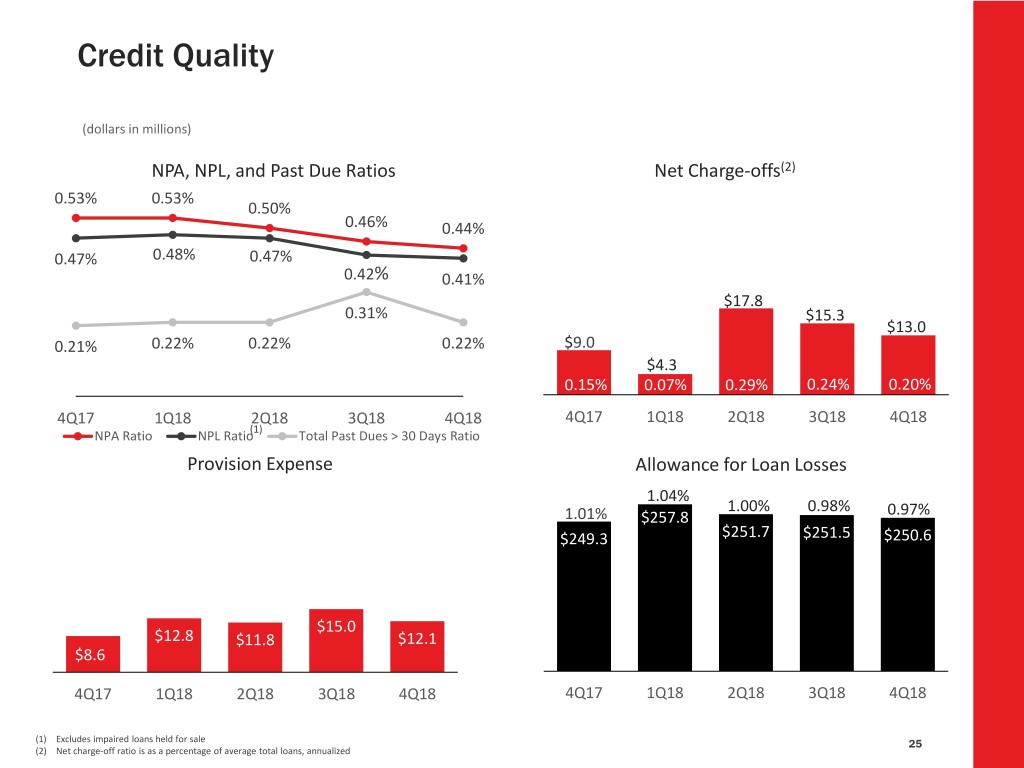
Credit Quality (dollars in millions) NPA, NPL, and Past Due Ratios Net Charge-offs(2) 0.53% 0.53% 0.50% 0.46% (2)0.44% 0.47% 0.48% 0.47% 0.42% 0.41% $17.8 0.31% $15.30.29% $13.0 0.21% 0.22% 0.22% 0.22% $9.0 $4.3 0.15% 0.07% 0.29% 0.24% 0.20% % 4Q17 1Q18 2Q18 3Q18 4Q18 4Q17 1Q18 2Q18 3Q18 4Q18 (1) NPA Ratio NPL Ratio Total Past Dues > 30 Days Ratio Provision Expense Allowance for Loan Losses 1.04% 1.00% 0.98% 0.97% $27.7 1.01% $257.8 $249.3 $251.7 $251.5 $250.6 $15.0 $12.8 $11.8 $12.1 $8.6 4Q17 1Q18 2Q18 3Q18 4Q18 4Q17 1Q18 2Q18 3Q18 4Q18 (1) Excludes impaired loans held for sale 25 (2) Net charge-off ratio is as a percentage of average total loans, annualized
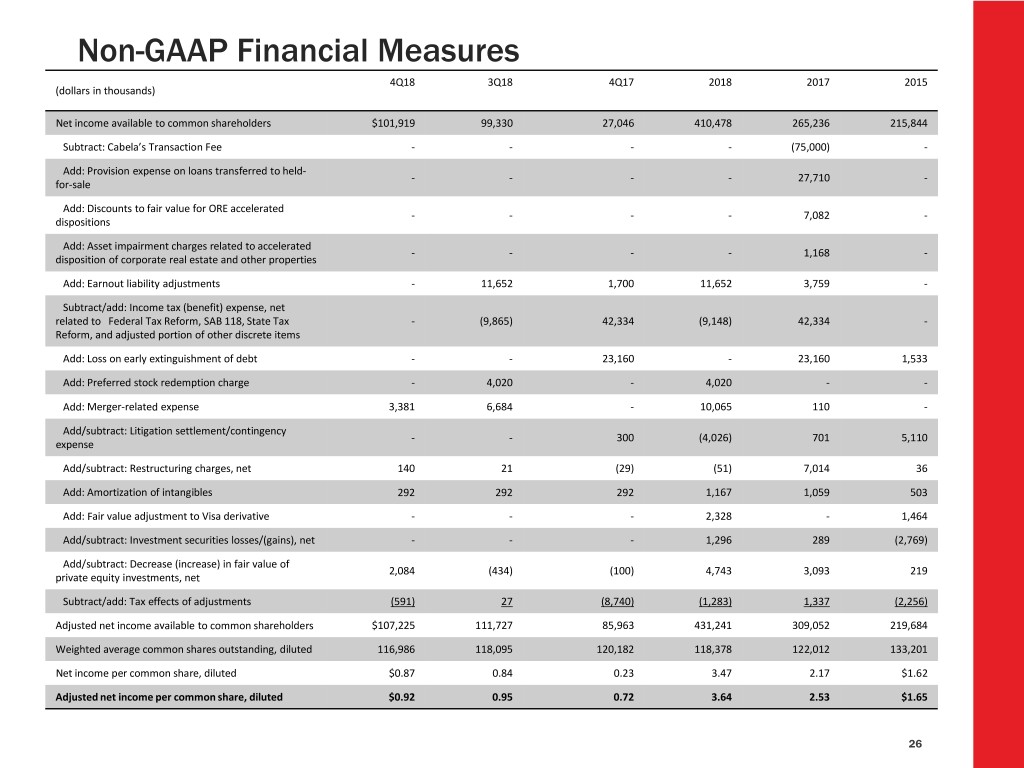
Non-GAAP Financial Measures 4Q18 3Q18 4Q17 2018 2017 2015 (dollars in thousands) Net income available to common shareholders $101,919 99,330 27,046 410,478 265,236 215,844 Subtract: Cabela’s Transaction Fee - - - - (75,000) - Add: Provision expense on loans transferred to held- - - - - 27,710 - for-sale Add: Discounts to fair value for ORE accelerated - - - - 7,082 - dispositions Add: Asset impairment charges related to accelerated - - - - 1,168 - disposition of corporate real estate and other properties Add: Earnout liability adjustments - 11,652 1,700 11,652 3,759 - Subtract/add: Income tax (benefit) expense, net related to Federal Tax Reform, SAB 118, State Tax - (9,865) 42,334 (9,148) 42,334 - Reform, and adjusted portion of other discrete items Add: Loss on early extinguishment of debt - - 23,160 - 23,160 1,533 Add: Preferred stock redemption charge - 4,020 - 4,020 - - Add: Merger-related expense 3,381 6,684 - 10,065 110 - Add/subtract: Litigation settlement/contingency - - 300 (4,026) 701 5,110 expense Add/subtract: Restructuring charges, net 140 21 (29) (51) 7,014 36 Add: Amortization of intangibles 292 292 292 1,167 1,059 503 Add: Fair value adjustment to Visa derivative - - - 2,328 - 1,464 Add/subtract: Investment securities losses/(gains), net - - - 1,296 289 (2,769) Add/subtract: Decrease (increase) in fair value of 2,084 (434) (100) 4,743 3,093 219 private equity investments, net Subtract/add: Tax effects of adjustments (591) 27 (8,740) (1,283) 1,337 (2,256) Adjusted net income available to common shareholders $107,225 111,727 85,963 431,241 309,052 219,684 Weighted average common shares outstanding, diluted 116,986 118,095 120,182 118,378 122,012 133,201 Net income per common share, diluted $0.87 0.84 0.23 3.47 2.17 $1.62 Adjusted net income per common share, diluted $0.92 0.95 0.72 3.64 2.53 $1.65 26
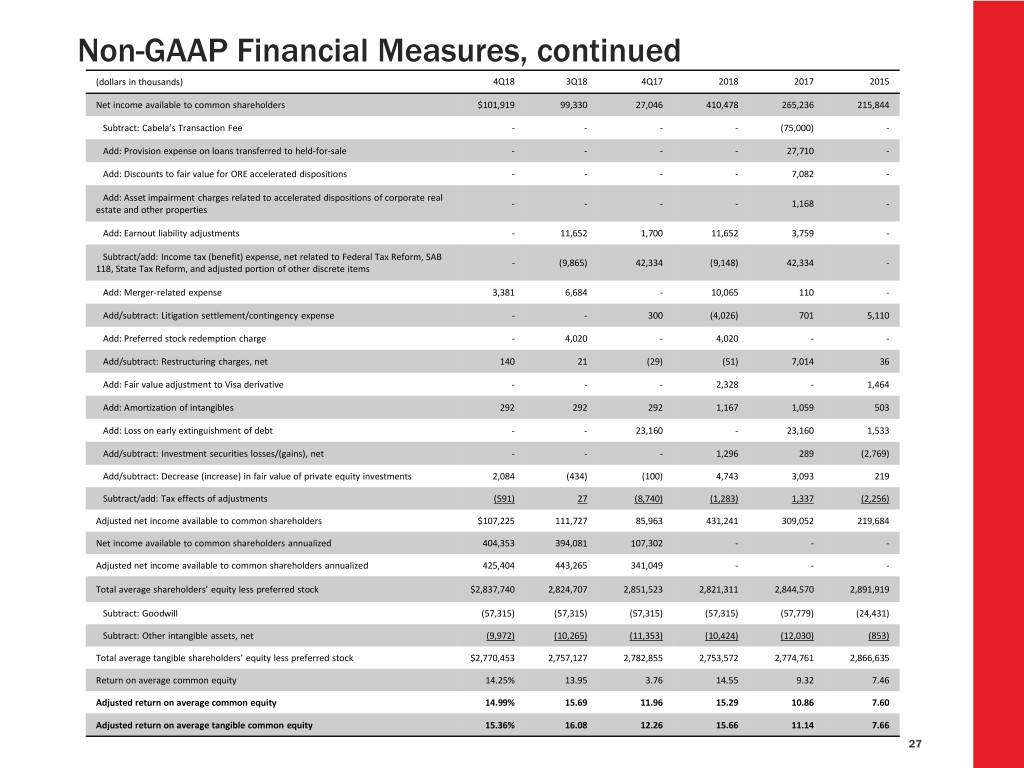
Non-GAAP Financial Measures, continued (dollars in thousands) 4Q18 3Q18 4Q17 2018 2017 2015 Net income available to common shareholders $101,919 99,330 27,046 410,478 265,236 215,844 Subtract: Cabela’s Transaction Fee - - - - (75,000) - Add: Provision expense on loans transferred to held-for-sale - - - - 27,710 - Add: Discounts to fair value for ORE accelerated dispositions - - - - 7,082 - Add: Asset impairment charges related to accelerated dispositions of corporate real - - - - 1,168 - estate and other properties Add: Earnout liability adjustments - 11,652 1,700 11,652 3,759 - Subtract/add: Income tax (benefit) expense, net related to Federal Tax Reform, SAB - (9,865) 42,334 (9,148) 42,334 - 118, State Tax Reform, and adjusted portion of other discrete items Add: Merger-related expense 3,381 6,684 - 10,065 110 - Add/subtract: Litigation settlement/contingency expense - - 300 (4,026) 701 5,110 Add: Preferred stock redemption charge - 4,020 - 4,020 - - Add/subtract: Restructuring charges, net 140 21 (29) (51) 7,014 36 Add: Fair value adjustment to Visa derivative - - - 2,328 - 1,464 Add: Amortization of intangibles 292 292 292 1,167 1,059 503 Add: Loss on early extinguishment of debt - - 23,160 - 23,160 1,533 Add/subtract: Investment securities losses/(gains), net - - - 1,296 289 (2,769) Add/subtract: Decrease (increase) in fair value of private equity investments 2,084 (434) (100) 4,743 3,093 219 Subtract/add: Tax effects of adjustments (591) 27 (8,740) (1,283) 1,337 (2,256) Adjusted net income available to common shareholders $107,225 111,727 85,963 431,241 309,052 219,684 Net income available to common shareholders annualized 404,353 394,081 107,302 - - - Adjusted net income available to common shareholders annualized 425,404 443,265 341,049 - - - Total average shareholders’ equity less preferred stock $2,837,740 2,824,707 2,851,523 2,821,311 2,844,570 2,891,919 Subtract: Goodwill (57,315) (57,315) (57,315) (57,315) (57,779) (24,431) Subtract: Other intangible assets, net (9,972) (10,265) (11,353) (10,424) (12,030) (853) Total average tangible shareholders’ equity less preferred stock $2,770,453 2,757,127 2,782,855 2,753,572 2,774,761 2,866,635 Return on average common equity 14.25% 13.95 3.76 14.55 9.32 7.46 Adjusted return on average common equity 14.99% 15.69 11.96 15.29 10.86 7.60 Adjusted return on average tangible common equity 15.36% 16.08 12.26 15.66 11.14 7.66 27
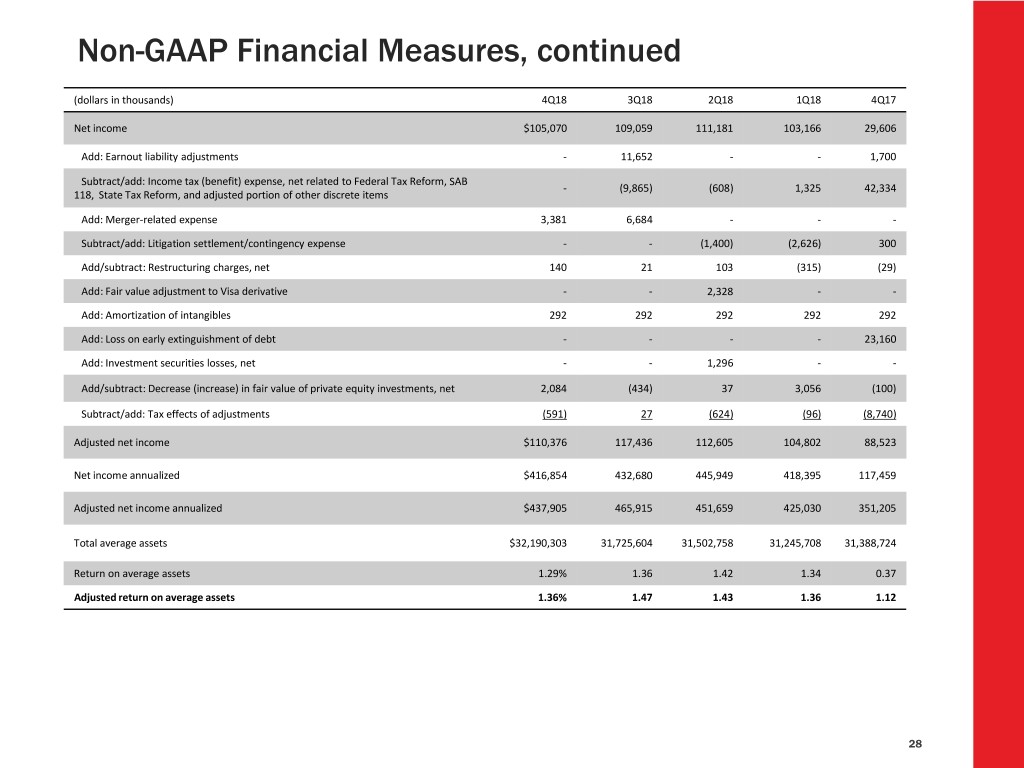
Non-GAAP Financial Measures, continued (dollars in thousands) 4Q18 3Q18 2Q18 1Q18 4Q17 Net income $105,070 109,059 111,181 103,166 29,606 Add: Earnout liability adjustments - 11,652 - - 1,700 Subtract/add: Income tax (benefit) expense, net related to Federal Tax Reform, SAB - (9,865) (608) 1,325 42,334 118, State Tax Reform, and adjusted portion of other discrete items Add: Merger-related expense 3,381 6,684 - - - Subtract/add: Litigation settlement/contingency expense - - (1,400) (2,626) 300 Add/subtract: Restructuring charges, net 140 21 103 (315) (29) Add: Fair value adjustment to Visa derivative - - 2,328 - - Add: Amortization of intangibles 292 292 292 292 292 Add: Loss on early extinguishment of debt - - - - 23,160 Add: Investment securities losses, net - - 1,296 - - Add/subtract: Decrease (increase) in fair value of private equity investments, net 2,084 (434) 37 3,056 (100) Subtract/add: Tax effects of adjustments (591) 27 (624) (96) (8,740) Adjusted net income $110,376 117,436 112,605 104,802 88,523 Net income annualized $416,854 432,680 445,949 418,395 117,459 Adjusted net income annualized $437,905 465,915 451,659 425,030 351,205 Total average assets $32,190,303 31,725,604 31,502,758 31,245,708 31,388,724 Return on average assets 1.29% 1.36 1.42 1.34 0.37 Adjusted return on average assets 1.36% 1.47 1.43 1.36 1.12 28
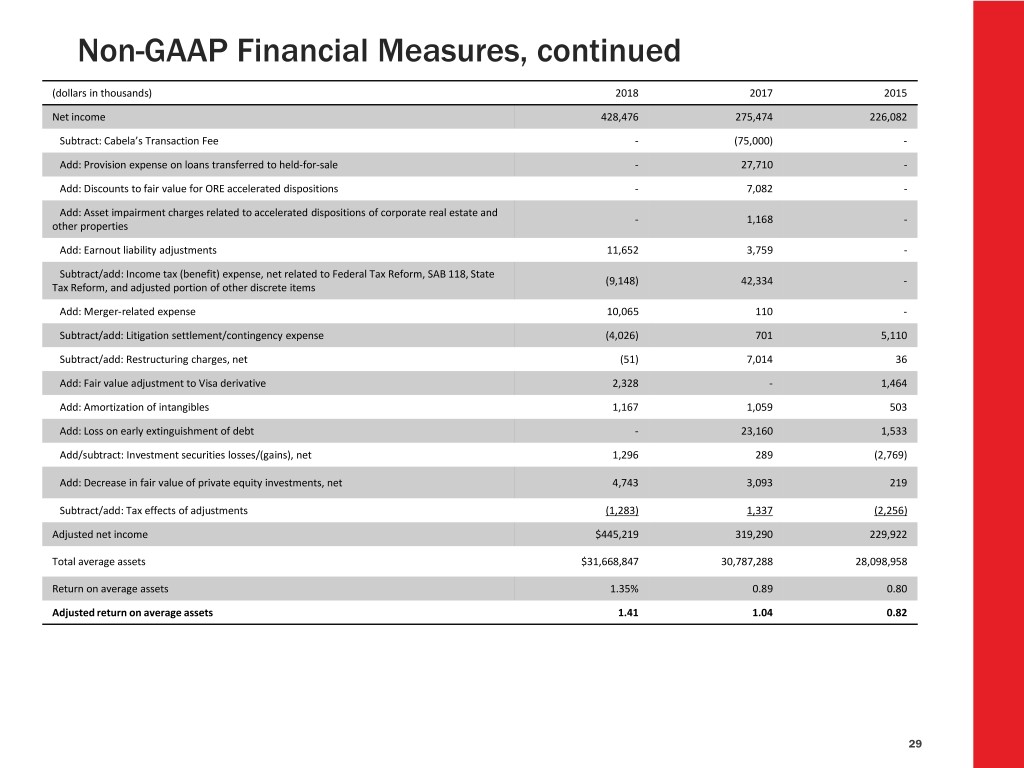
Non-GAAP Financial Measures, continued (dollars in thousands) 2018 2017 2015 Net income 428,476 275,474 226,082 Subtract: Cabela’s Transaction Fee - (75,000) - Add: Provision expense on loans transferred to held-for-sale - 27,710 - Add: Discounts to fair value for ORE accelerated dispositions - 7,082 - Add: Asset impairment charges related to accelerated dispositions of corporate real estate and - 1,168 - other properties Add: Earnout liability adjustments 11,652 3,759 - Subtract/add: Income tax (benefit) expense, net related to Federal Tax Reform, SAB 118, State (9,148) 42,334 - Tax Reform, and adjusted portion of other discrete items Add: Merger-related expense 10,065 110 - Subtract/add: Litigation settlement/contingency expense (4,026) 701 5,110 Subtract/add: Restructuring charges, net (51) 7,014 36 Add: Fair value adjustment to Visa derivative 2,328 - 1,464 Add: Amortization of intangibles 1,167 1,059 503 Add: Loss on early extinguishment of debt - 23,160 1,533 Add/subtract: Investment securities losses/(gains), net 1,296 289 (2,769) Add: Decrease in fair value of private equity investments, net 4,743 3,093 219 Subtract/add: Tax effects of adjustments (1,283) 1,337 (2,256) Adjusted net income $445,219 319,290 229,922 Total average assets $31,668,847 30,787,288 28,098,958 Return on average assets 1.35% 0.89 0.80 Adjusted return on average assets 1.41 1.04 0.82 29
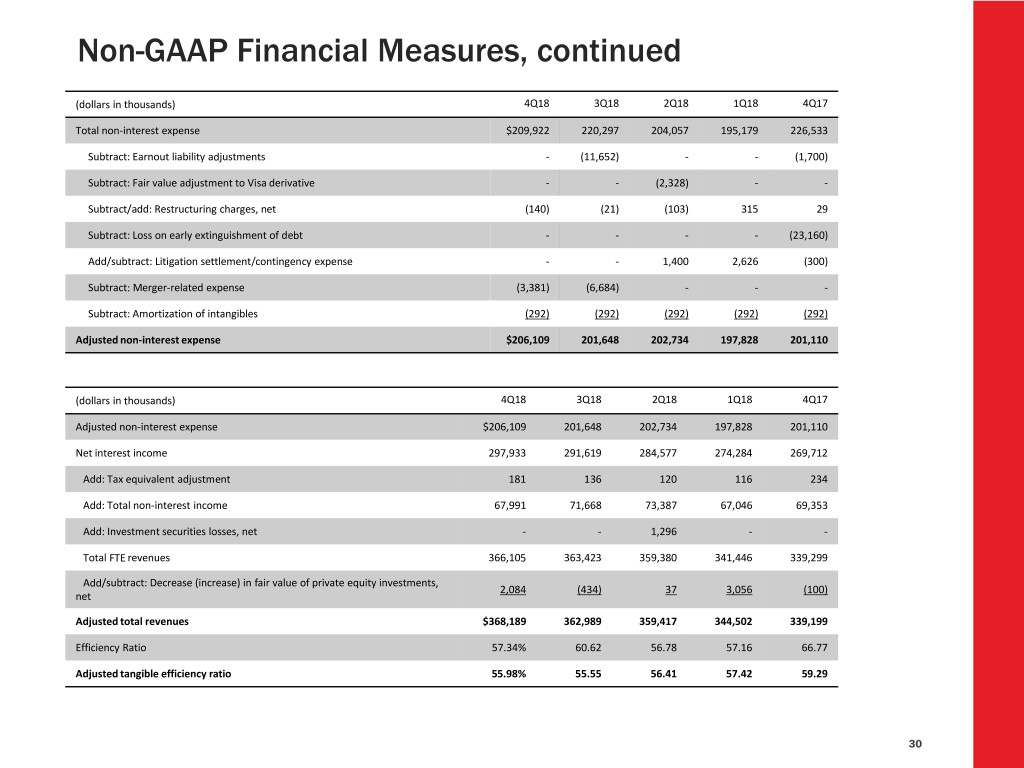
Non-GAAP Financial Measures, continued (dollars in thousands) 4Q18 3Q18 2Q18 1Q18 4Q17 Total non-interest expense $209,922 220,297 204,057 195,179 226,533 Subtract: Earnout liability adjustments - (11,652) - - (1,700) Subtract: Fair value adjustment to Visa derivative - - (2,328) - - Subtract/add: Restructuring charges, net (140) (21) (103) 315 29 Subtract: Loss on early extinguishment of debt - - - - (23,160) Add/subtract: Litigation settlement/contingency expense - - 1,400 2,626 (300) Subtract: Merger-related expense (3,381) (6,684) - - - Subtract: Amortization of intangibles (292) (292) (292) (292) (292) Adjusted non-interest expense $206,109 201,648 202,734 197,828 201,110 (dollars in thousands) 4Q18 3Q18 2Q18 1Q18 4Q17 Adjusted non-interest expense $206,109 201,648 202,734 197,828 201,110 Net interest income 297,933 291,619 284,577 274,284 269,712 Add: Tax equivalent adjustment 181 136 120 116 234 Add: Total non-interest income 67,991 71,668 73,387 67,046 69,353 Add: Investment securities losses, net - - 1,296 - - Total FTE revenues 366,105 363,423 359,380 341,446 339,299 Add/subtract: Decrease (increase) in fair value of private equity investments, 2,084 (434) 37 3,056 (100) net Adjusted total revenues $368,189 362,989 359,417 344,502 339,199 Efficiency Ratio 57.34% 60.62 56.78 57.16 66.77 Adjusted tangible efficiency ratio 55.98% 55.55 56.41 57.42 59.29 30
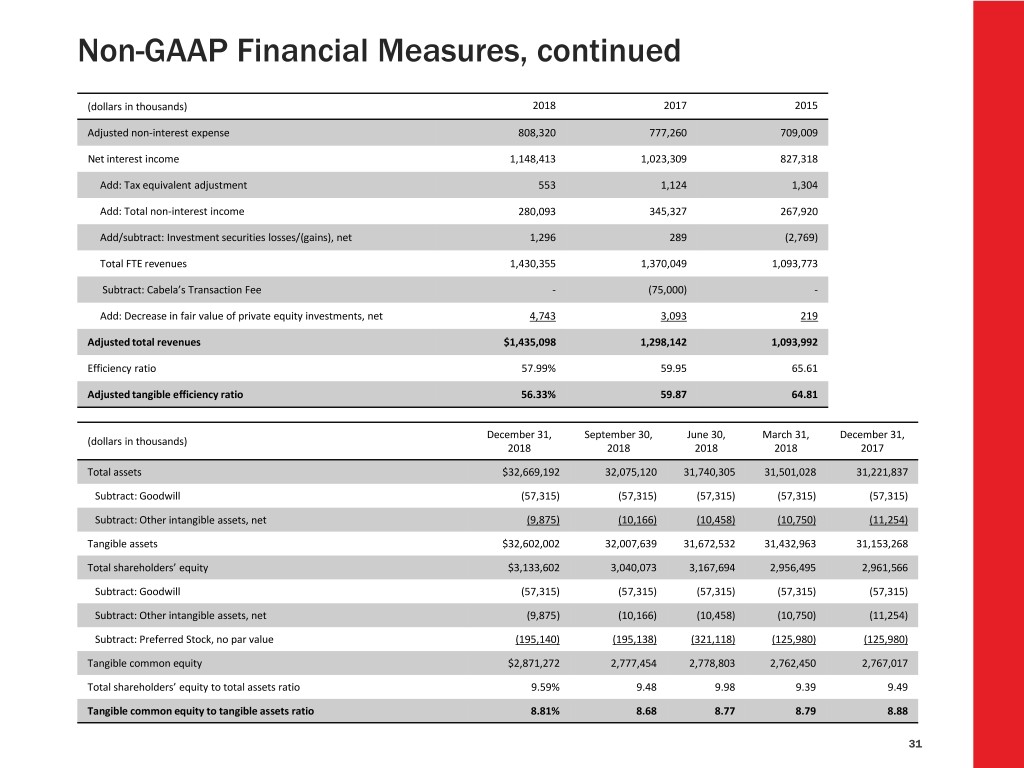
Non-GAAP Financial Measures, continued (dollars in thousands) 2018 2017 2015 Adjusted non-interest expense 808,320 777,260 709,009 Net interest income 1,148,413 1,023,309 827,318 Add: Tax equivalent adjustment 553 1,124 1,304 Add: Total non-interest income 280,093 345,327 267,920 Add/subtract: Investment securities losses/(gains), net 1,296 289 (2,769) Total FTE revenues 1,430,355 1,370,049 1,093,773 Subtract: Cabela’s Transaction Fee - (75,000) - Add: Decrease in fair value of private equity investments, net 4,743 3,093 219 Adjusted total revenues $1,435,098 1,298,142 1,093,992 Efficiency ratio 57.99% 59.95 65.61 Adjusted tangible efficiency ratio 56.33% 59.87 64.81 December 31, September 30, June 30, March 31, December 31, (dollars in thousands) 2018 2018 2018 2018 2017 Total assets $32,669,192 32,075,120 31,740,305 31,501,028 31,221,837 Subtract: Goodwill (57,315) (57,315) (57,315) (57,315) (57,315) Subtract: Other intangible assets, net (9,875) (10,166) (10,458) (10,750) (11,254) Tangible assets $32,602,002 32,007,639 31,672,532 31,432,963 31,153,268 Total shareholders’ equity $3,133,602 3,040,073 3,167,694 2,956,495 2,961,566 Subtract: Goodwill (57,315) (57,315) (57,315) (57,315) (57,315) Subtract: Other intangible assets, net (9,875) (10,166) (10,458) (10,750) (11,254) Subtract: Preferred Stock, no par value (195,140) (195,138) (321,118) (125,980) (125,980) Tangible common equity $2,871,272 2,777,454 2,778,803 2,762,450 2,767,017 Total shareholders’ equity to total assets ratio 9.59% 9.48 9.98 9.39 9.49 Tangible common equity to tangible assets ratio 8.81% 8.68 8.77 8.79 8.88 31
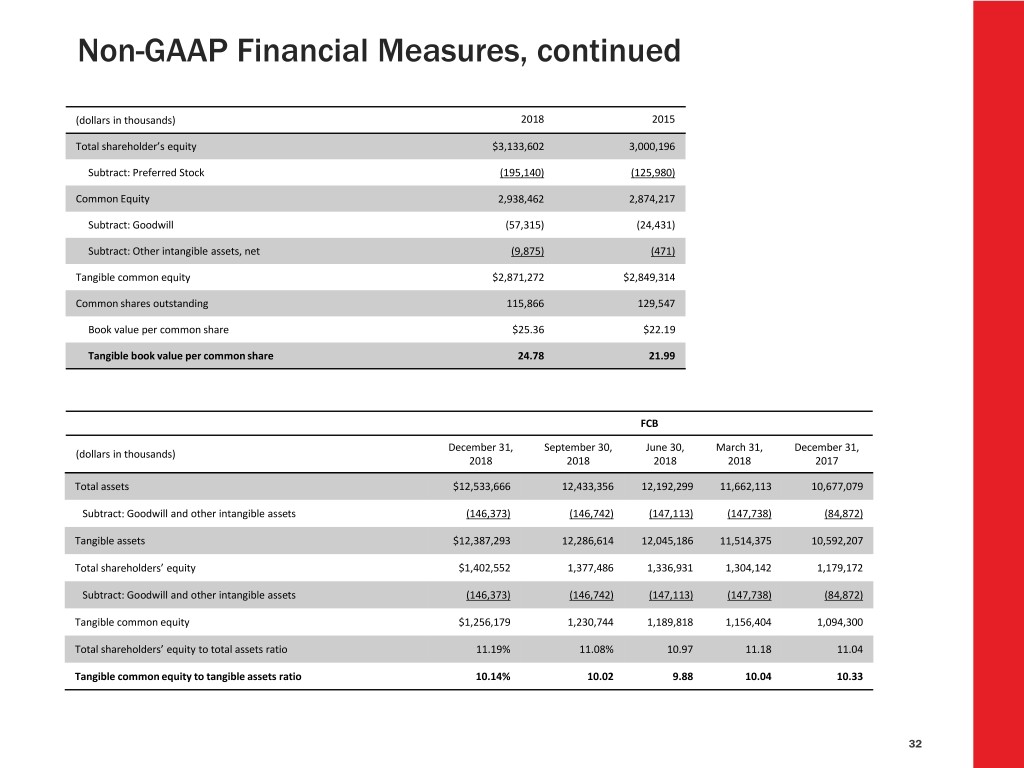
Non-GAAP Financial Measures, continued (dollars in thousands) 2018 2015 Total shareholder’s equity $3,133,602 3,000,196 Subtract: Preferred Stock (195,140) (125,980) Common Equity 2,938,462 2,874,217 Subtract: Goodwill (57,315) (24,431) Subtract: Other intangible assets, net (9,875) (471) Tangible common equity $2,871,272 $2,849,314 Common shares outstanding 115,866 129,547 Book value per common share $25.36 $22.19 Tangible book value per common share 24.78 21.99 FCB December 31, September 30, June 30, March 31, December 31, (dollars in thousands) 2018 2018 2018 2018 2017 Total assets $12,533,666 12,433,356 12,192,299 11,662,113 10,677,079 Subtract: Goodwill and other intangible assets (146,373) (146,742) (147,113) (147,738) (84,872) Tangible assets $12,387,293 12,286,614 12,045,186 11,514,375 10,592,207 Total shareholders’ equity $1,402,552 1,377,486 1,336,931 1,304,142 1,179,172 Subtract: Goodwill and other intangible assets (146,373) (146,742) (147,113) (147,738) (84,872) Tangible common equity $1,256,179 1,230,744 1,189,818 1,156,404 1,094,300 Total shareholders’ equity to total assets ratio 11.19% 11.08% 10.97 11.18 11.04 Tangible common equity to tangible assets ratio 10.14% 10.02 9.88 10.04 10.33 32


