Exhibit 99.3 Third Quarter 2019 Results October 22, 2019

Forward Looking Statements This slide presentation and certain of our other filings with the Securities and Exchange Commission contain statements that constitute "forward-looking statements" within the meaning of, and subject to the protections of, Section 27A of the Securities Act of 1933, as amended, and Section 21E of the Securities Exchange Act of 1934, as amended. All statements other than statements of historical fact are forward- looking statements. You can identify these forward-looking statements through Synovus' use of words such as "believes," "anticipates," "expects," "may," "will," "assumes," "predicts," "could," "should," "would," "intends," "targets," "estimates," "projects," "plans," "potential" and other similar words and expressions of the future or otherwise regarding the outlook for Synovus' future business and financial performance and/or the performance of the banking industry and economy in general. These forward-looking statements include, among others, statements on (1) our future operating and financial performance, including our outlook for future growth; (2) our expectations regarding net interest income and net interest margin; (3) future credit quality and performance; (4) our strategy and initiatives for future growth, capital management, cost and tax savings, and strategic transactions; (5) future long-term financial targets and capital position; (6) future impact of CECL on our allowance for credit losses and our capital position; and (7) our assumptions underlying these expectations. Prospective investors are cautioned that any such forward-looking statements are not guarantees of future performance and involve known and unknown risks and uncertainties which may cause the actual results, performance or achievements of Synovus to be materially different from the future results, performance or achievements expressed or implied by such forward-looking statements. Forward-looking statements are based on the information known to, and current beliefs and expectations of, Synovus' management and are subject to significant risks and uncertainties. Actual results may differ materially from those contemplated by such forward-looking statements. A number of factors could cause actual results to differ materially from those contemplated by the forward-looking statements in this presentation. Many of these factors are beyond Synovus' ability to control or predict. These forward-looking statements are based upon information presently known to Synovus' management and are inherently subjective, uncertain and subject to change due to any number of risks and uncertainties, including, without limitation, the risks and other factors set forth in Synovus' filings with the Securities and Exchange Commission, including its Annual Report on Form 10-K for the year ended December 31, 2018 under the captions "Cautionary Notice Regarding Forward-Looking Statements" and "Risk Factors" and in Synovus' quarterly reports on Form 10-Q and current reports on Form 8-K. We believe these forward-looking statements are reasonable; however, undue reliance should not be placed on any forward-looking statements, which are based on current expectations and speak only as of the date that they are made. We do not assume any obligation to update any forward-looking statements as a result of new information, future developments or otherwise, except as otherwise may be required by law. Use of Non-GAAP Financial Measures This slide presentation contains certain non-GAAP financial measures determined by methods other than in accordance with generally accepted accounting principles. Such non-GAAP financial measures include the following: adjusted diluted earnings per share; adjusted return on average assets; adjusted return on average common equity; return on average tangible common equity; adjusted return on average tangible common equity; adjusted net income available to common shareholders; adjusted non-interest income; adjusted non-interest expense; adjusted tangible non-interest expense; adjusted tangible efficiency ratio; and tangible common equity ratio. The most comparable GAAP measures to these measures are diluted earnings per share; return on average assets; return on average common equity; net income; total non-interest income; total non-interest expense; efficiency ratio; and total shareholders' equity to total assets ratio, respectively. Management uses these non-GAAP financial measures to assess the performance of Synovus' business and the strength of its capital position. Management believes that these non-GAAP financial measures provide meaningful additional information about Synovus to assist management, investors, and bank regulators in evaluating Synovus' operating results, financial strength, the performance of its business and the strength of its capital position. However, these non-GAAP financial measures have inherent limitations as analytical tools and should not be considered in isolation or as a substitute for analyses of operating results or capital position as reported under GAAP. The non-GAAP financial measures should be considered as additional views of the way our financial measures are affected by significant items and other factors, and since they are not required to be uniformly applied, they may not be comparable to other similarly titled measures at other companies. Adjusted diluted earnings per share, adjusted net income available to common shareholders, adjusted return on average assets, and adjusted return on average common equity are measures used by management to evaluate operating results exclusive of items that are not indicative of ongoing operations and impact period-to-period comparisons. Return on average tangible common equity and adjusted return on average tangible common equity are measures used by management to compare Synovus' performance with other financial institutions because it calculates the return available to common shareholders without the impact of intangible assets and their related amortization, thereby allowing management to evaluate the performance of the business consistently. Adjusted non-interest income is a measure used by management to evaluate non-interest income exclusive of net investment securities gains (losses) and net changes in the fair value of private equity investments. Adjusted non-interest expense, adjusted tangible non-interest expense, and the adjusted tangible efficiency ratio are measures utilized by management to measure the success of expense management initiatives focused on reducing recurring controllable operating costs. The tangible common equity ratio is used by management and bank regulators to assess the strength of our capital position. The computations of the non-GAAP financial measures used in this slide presentation are set forth in the Appendix to this slide presentation. 2
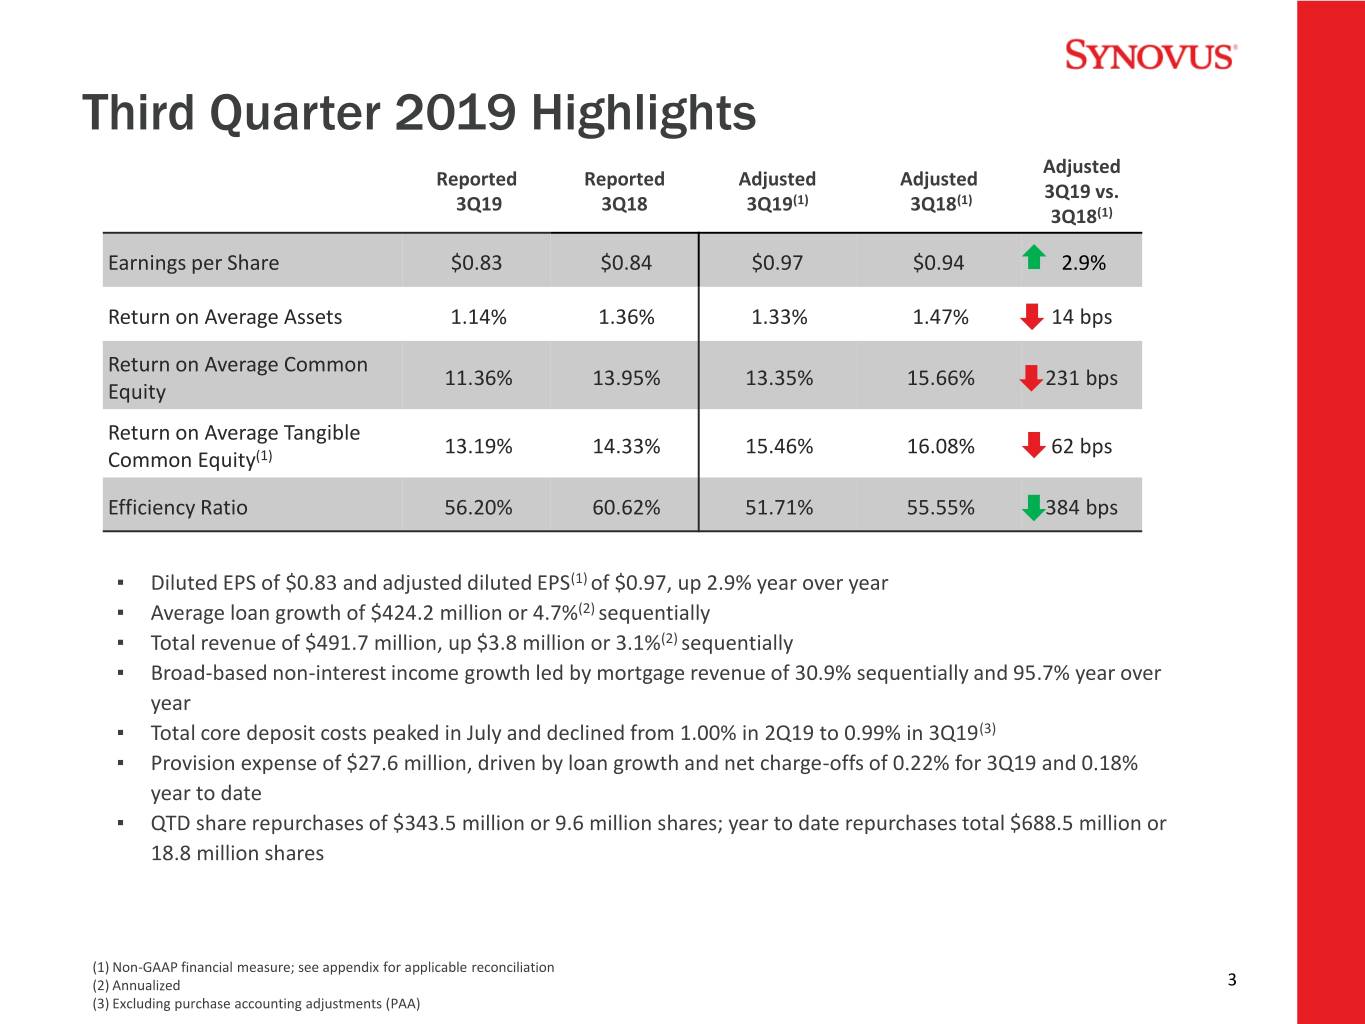
Third Quarter 2019 Highlights Adjusted Reported Reported Adjusted Adjusted 3Q19 vs. 3Q19 3Q18 3Q19(1) 3Q18(1) 3Q18(1) Earnings per Share $0.83 $0.84 $0.97 $0.94 2.9% Return on Average Assets 1.14% 1.36% 1.33% 1.47% 14 bps Return on Average Common 11.36% 13.95% 13.35% 15.66% 231 bps Equity Return on Average Tangible 13.19% 14.33% 15.46% 16.08% 62 bps Common Equity(1) Efficiency Ratio 56.20% 60.62% 51.71% 55.55% 384 bps ▪ Diluted EPS of $0.83 and adjusted diluted EPS(1) of $0.97, up 2.9% year over year ▪ Average loan growth of $424.2 million or 4.7%(2) sequentially ▪ Total revenue of $491.7 million, up $3.8 million or 3.1%(2) sequentially ▪ Broad-based non-interest income growth led by mortgage revenue of 30.9% sequentially and 95.7% year over year ▪ Total core deposit costs peaked in July and declined from 1.00% in 2Q19 to 0.99% in 3Q19(3) ▪ Provision expense of $27.6 million, driven by loan growth and net charge-offs of 0.22% for 3Q19 and 0.18% year to date ▪ QTD share repurchases of $343.5 million or 9.6 million shares; year to date repurchases total $688.5 million or 18.8 million shares (1) Non-GAAP financial measure; see appendix for applicable reconciliation (2) Annualized 3 (3) Excluding purchase accounting adjustments (PAA)
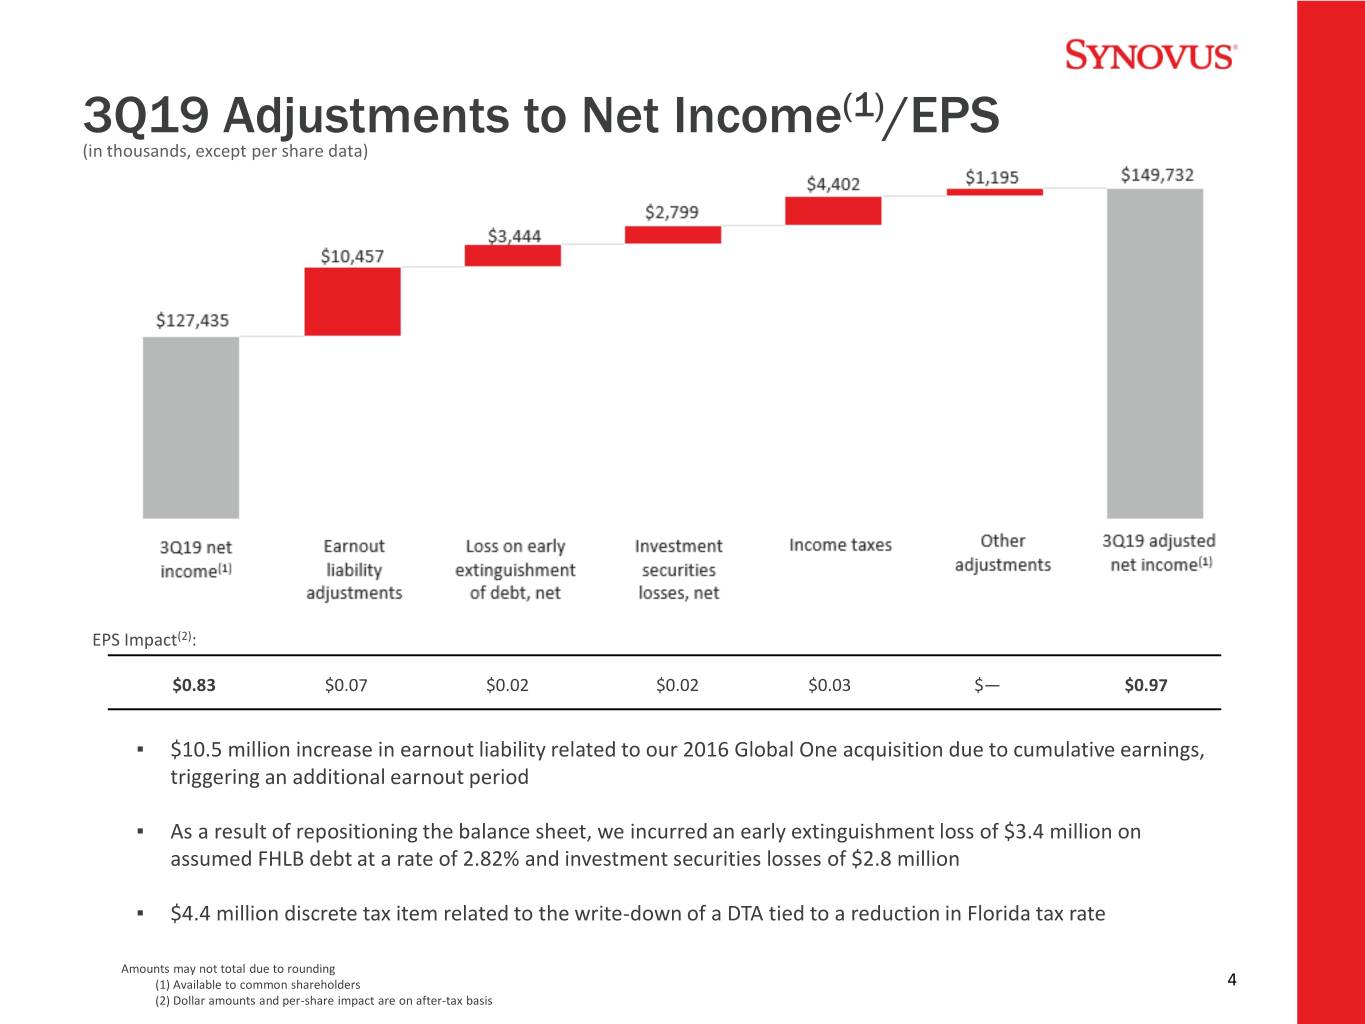
3Q19 Adjustments to Net Income(1)/EPS (in thousands, except per share data) EPS Impact(2): $0.83 $0.07 $0.02 $0.02 $0.03 $— $0.97 ▪ $10.5 million increase in earnout liability related to our 2016 Global One acquisition due to cumulative earnings, triggering an additional earnout period ▪ As a result of repositioning the balance sheet, we incurred an early extinguishment loss of $3.4 million on assumed FHLB debt at a rate of 2.82% and investment securities losses of $2.8 million ▪ $4.4 million discrete tax item related to the write-down of a DTA tied to a reduction in Florida tax rate Amounts may not total due to rounding (1) Available to common shareholders 4 (2) Dollar amounts and per-share impact are on after-tax basis

Loans Period-end Loan Balances (in billions) $36.14(1) $36.42(1) ▪ Sequential quarter period-end growth of $279.3 million or 3.1%(2) vs. 2Q19 ▪ C&I up $197.7 million 44.9% 45.1% $25.58(1) ▪ Consumer up $143.1 million ▪ CRE down $(62.4) million 48.9% ▪ Total average loan growth of $424.2 million 26.5% 26.7% or 4.7%(2) vs. 2Q19 24.9% ▪ Total funded production of ~ $2.60 billion was up nearly 30% and weighted average loan spreads improved 17 bps vs. 2Q19 28.6% 28.2% 26.2% (in millions) Sequential quarter loan $443.1 $504.1 $279.3 growth: Amounts may not total due to rounding (1) Total loans are net of deferred fees, costs, discounts/premiums (2) Annualized 5
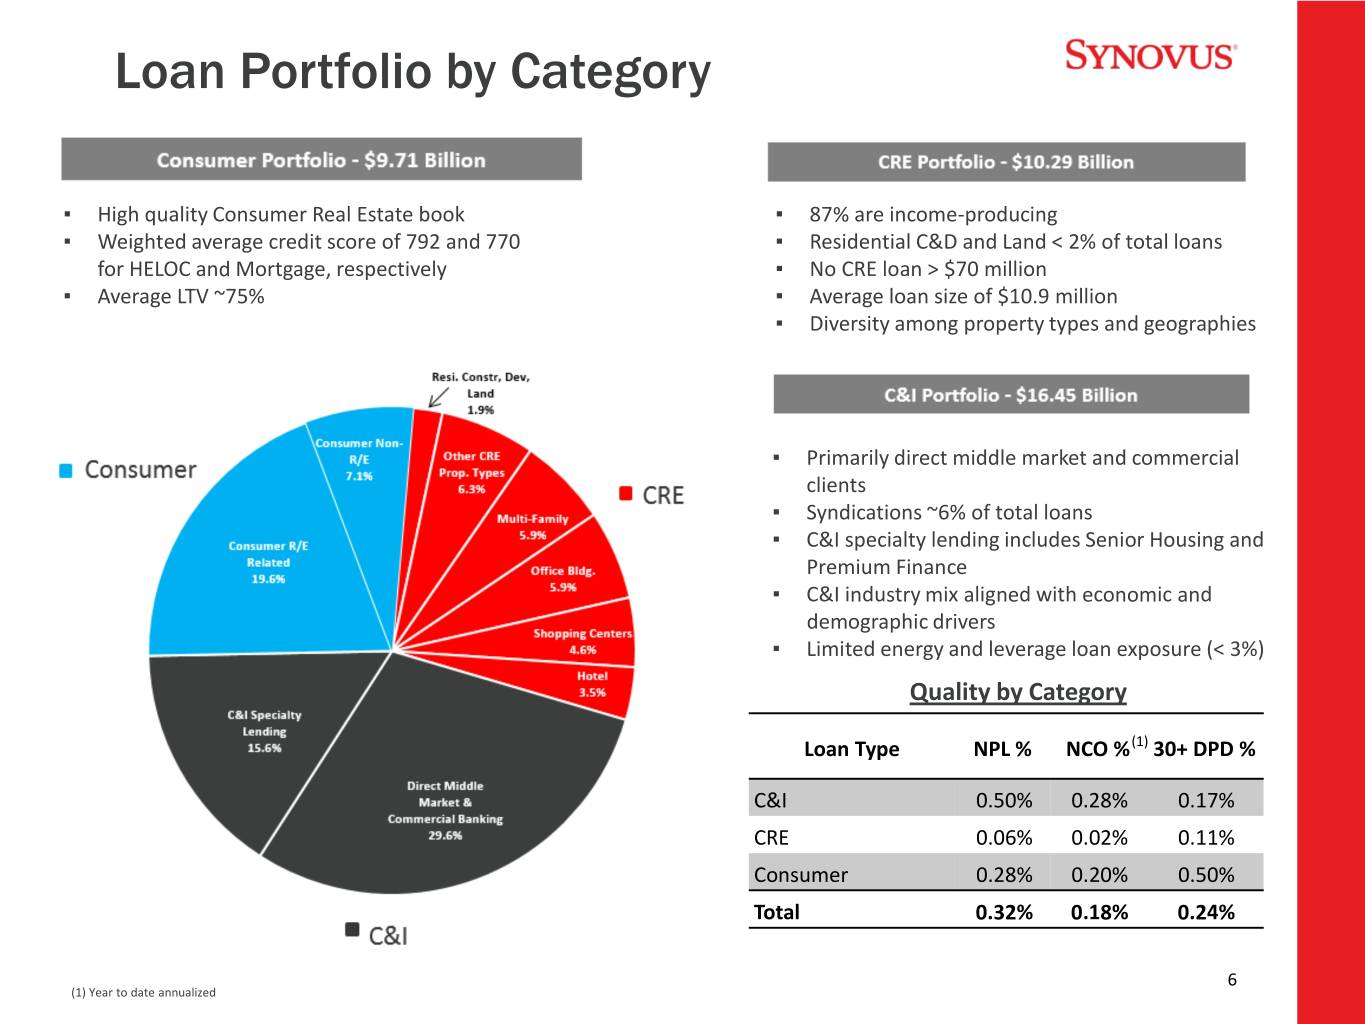
Loan Portfolio by Category ▪ High quality Consumer Real Estate book ▪ 87% are income-producing ▪ Weighted average credit score of 792 and 770 ▪ Residential C&D and Land < 2% of total loans for HELOC and Mortgage, respectively ▪ No CRE loan > $70 million ▪ Average LTV ~75% ▪ Average loan size of $10.9 million ▪ Diversity among property types and geographies Consumer CRE 26.5% 28.6% ▪ Primarily direct middle market and commercial clients ▪ Syndications ~6% of total loans C&I ▪ C&I specialty lending includes Senior Housing and 45.0% Premium Finance ▪ C&I industry mix aligned with economic and demographic drivers ▪ Limited energy and leverage loan exposure (< 3%) Quality by Category Loan Type NPL % NCO %(1) 30+ DPD % C&I 0.50% 0.28% 0.17% CRE 0.06% 0.02% 0.11% Consumer 0.28% 0.20% 0.50% Total 0.32% 0.18% 0.24% 6 (1) Year to date annualized
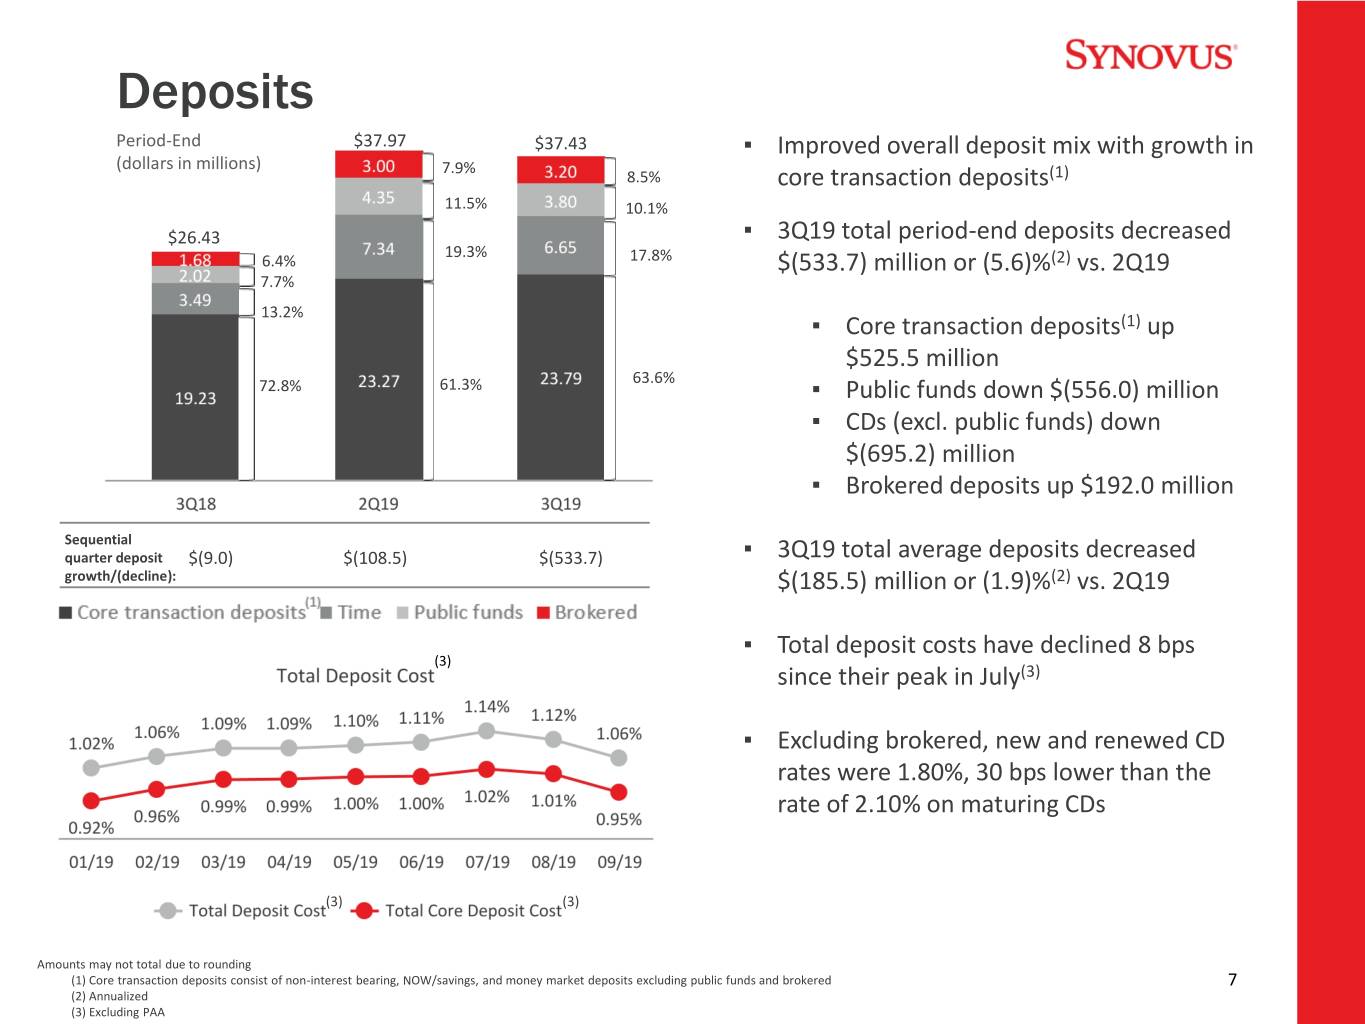
Deposits Period-End $37.97 $37.43 ▪ Improved overall deposit mix with growth in (dollars in millions) 7.9% 8.5% core transaction deposits(1) 11.5% 10.1% $26.43 ▪ 3Q19 total period-end deposits decreased 19.3% 6.4% 17.8% $(533.7) million or (5.6)%(2) vs. 2Q19 7.7% 13.2% ▪ Core transaction deposits(1) up $525.5 million 72.8% 61.3% 63.6% ▪ Public funds down $(556.0) million ▪ CDs (excl. public funds) down $(695.2) million ▪ Brokered deposits up $192.0 million Sequential quarter deposit $(9.0) $(108.5) $(533.7) ▪ 3Q19 total average deposits decreased growth/(decline): $(185.5) million or (1.9)%(2) vs. 2Q19 ▪ Total deposit costs have declined 8 bps (3) since their peak in July(3) ▪ Excluding brokered, new and renewed CD rates were 1.80%, 30 bps lower than the rate of 2.10% on maturing CDs (3) (3) Amounts may not total due to rounding (1) Core transaction deposits consist of non-interest bearing, NOW/savings, and money market deposits excluding public funds and brokered 7 (2) Annualized (3) Excluding PAA
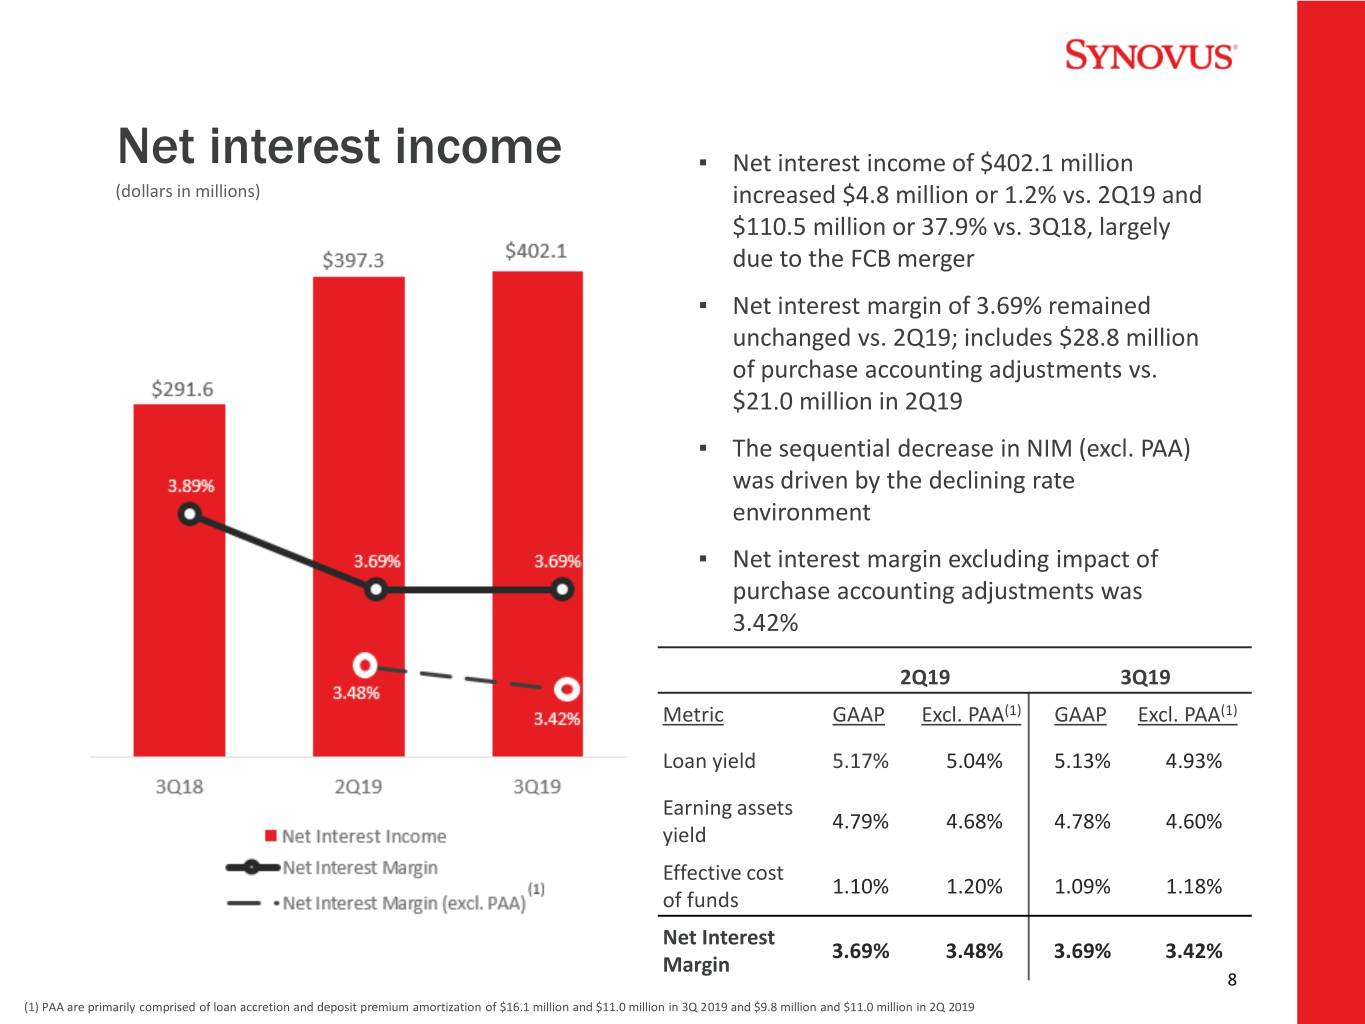
Net interest income ▪ Net interest income of $402.1 million (dollars in millions) increased $4.8 million or 1.2% vs. 2Q19 and $110.5 million or 37.9% vs. 3Q18, largely due to the FCB merger ▪ Net interest margin of 3.69% remained unchanged vs. 2Q19; includes $28.8 million of purchase accounting adjustments vs. $21.0 million in 2Q19 ▪ The sequential decrease in NIM (excl. PAA) was driven by the declining rate environment ▪ Net interest margin excluding impact of purchase accounting adjustments was 3.42% 2Q19 3Q19 Metric GAAP Excl. PAA(1) GAAP Excl. PAA(1) Loan yield 5.17% 5.04% 5.13% 4.93% Earning assets 4.79% 4.68% 4.78% 4.60% yield Effective cost 1.10% 1.20% 1.09% 1.18% of funds Net Interest 3.69% 3.48% 3.69% 3.42% Margin 8 (1) PAA are primarily comprised of loan accretion and deposit premium amortization of $16.1 million and $11.0 million in 3Q 2019 and $9.8 million and $11.0 million in 2Q 2019

Non-interest income ▪ 3Q19 non-interest income of $88.8 million (in millions) decreased $(1.0) million vs. 2Q19 and increased $17.1 million vs. 3Q18 ▪ 3Q19 adjusted non-interest income(1) $89.8 $88.8 of $91.3 million increased $1.1 million or 1.2% vs. 2Q19 and $20.1 $71.7 million or 28.2% vs. 3Q18 ▪ 1.2 Fiduciary/asset management, brokerage, and insurance revenues of $26.6 million increased $2.9 million or 12.3% vs. 3Q18 ▪ Assets under management of $16.21 billion increased 8.0% vs. 3Q18 ▪ Partnerships across the organization led to a $6.2 million or 540.3% increase in capital markets income vs. 3Q18 ▪ Talent acquisition and the rate environment drove mortgage income of $10.4 million, a $5.1 million or 95.7% increase vs. 3Q18 (2) Amounts may not total due to rounding (1) Non-GAAP financial measure; see appendix for applicable reconciliation 9 (2) Include service charges on deposit accounts, card fees, letter of credit fees, ATM fee income, line of credit non-usage fees, gains from sales of government guaranteed loans, and miscellaneous other service charges
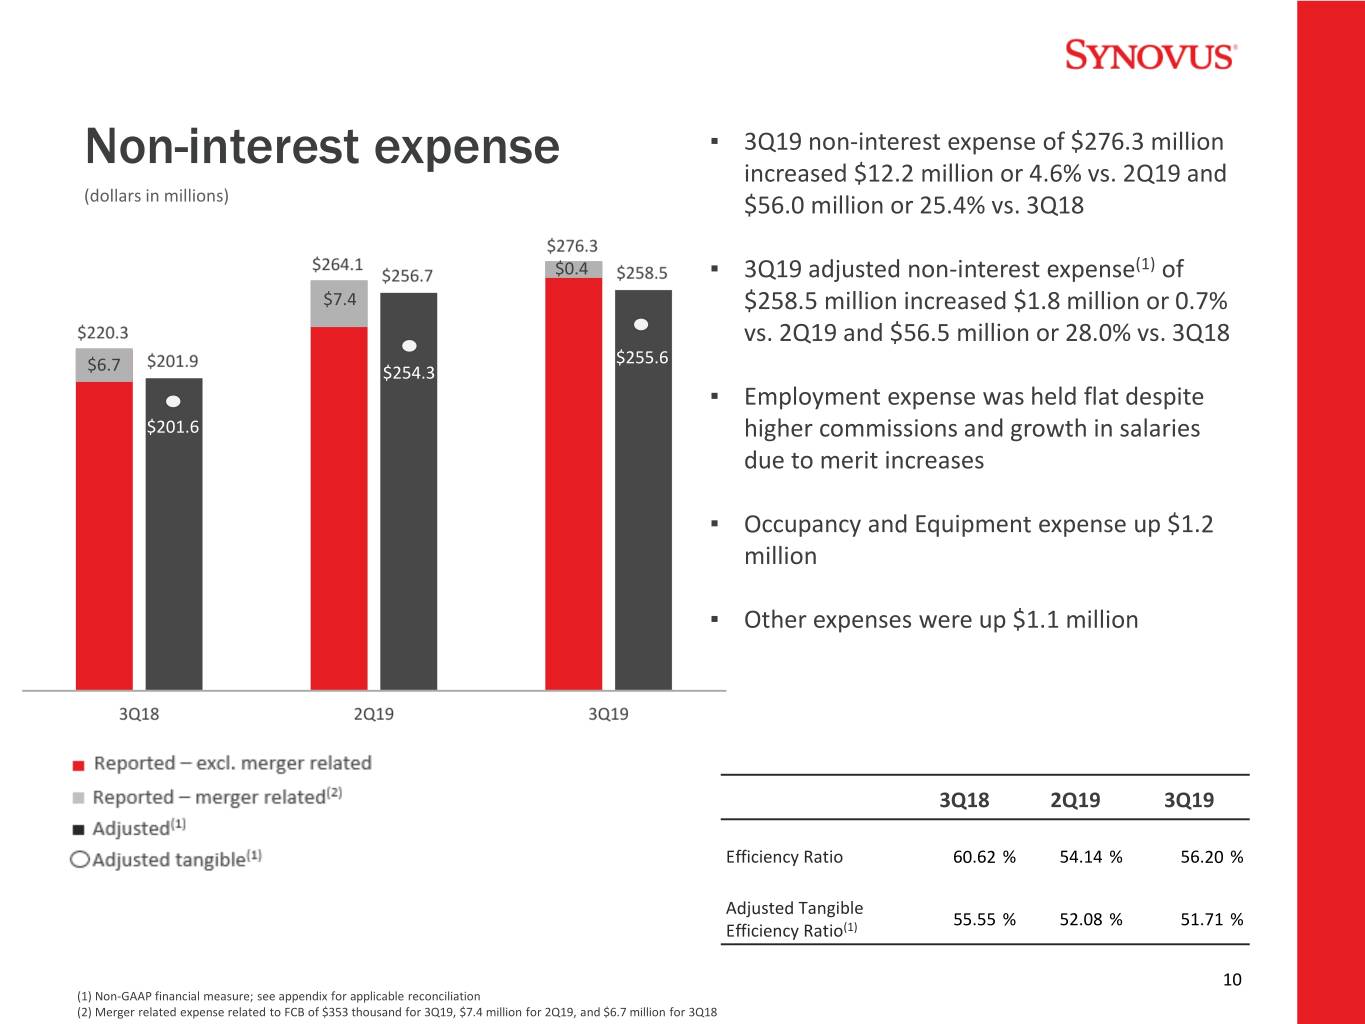
Non-interest expense ▪ 3Q19 non-interest expense of $276.3 million increased $12.2 million or 4.6% vs. 2Q19 and (dollars in millions) $56.0 million or 25.4% vs. 3Q18 $0.4 ▪ 3Q19 adjusted non-interest expense(1) of $7.4 $258.5 million increased $1.8 million or 0.7% vs. 2Q19 and $56.5 million or 28.0% vs. 3Q18 $255.6 $6.7 $254.3 ▪ Employment expense was held flat despite $201.6 higher commissions and growth in salaries due to merit increases ▪ Occupancy and Equipment expense up $1.2 million ▪ Other expenses were up $1.1 million 3Q18 2Q19 3Q19 Efficiency Ratio 60.62 % 54.14 % 56.20 % Adjusted Tangible 55.55 % 52.08 % 51.71 % Efficiency Ratio(1) 10 (1) Non-GAAP financial measure; see appendix for applicable reconciliation (2) Merger related expense related to FCB of $353 thousand for 3Q19, $7.4 million for 2Q19, and $6.7 million for 3Q18
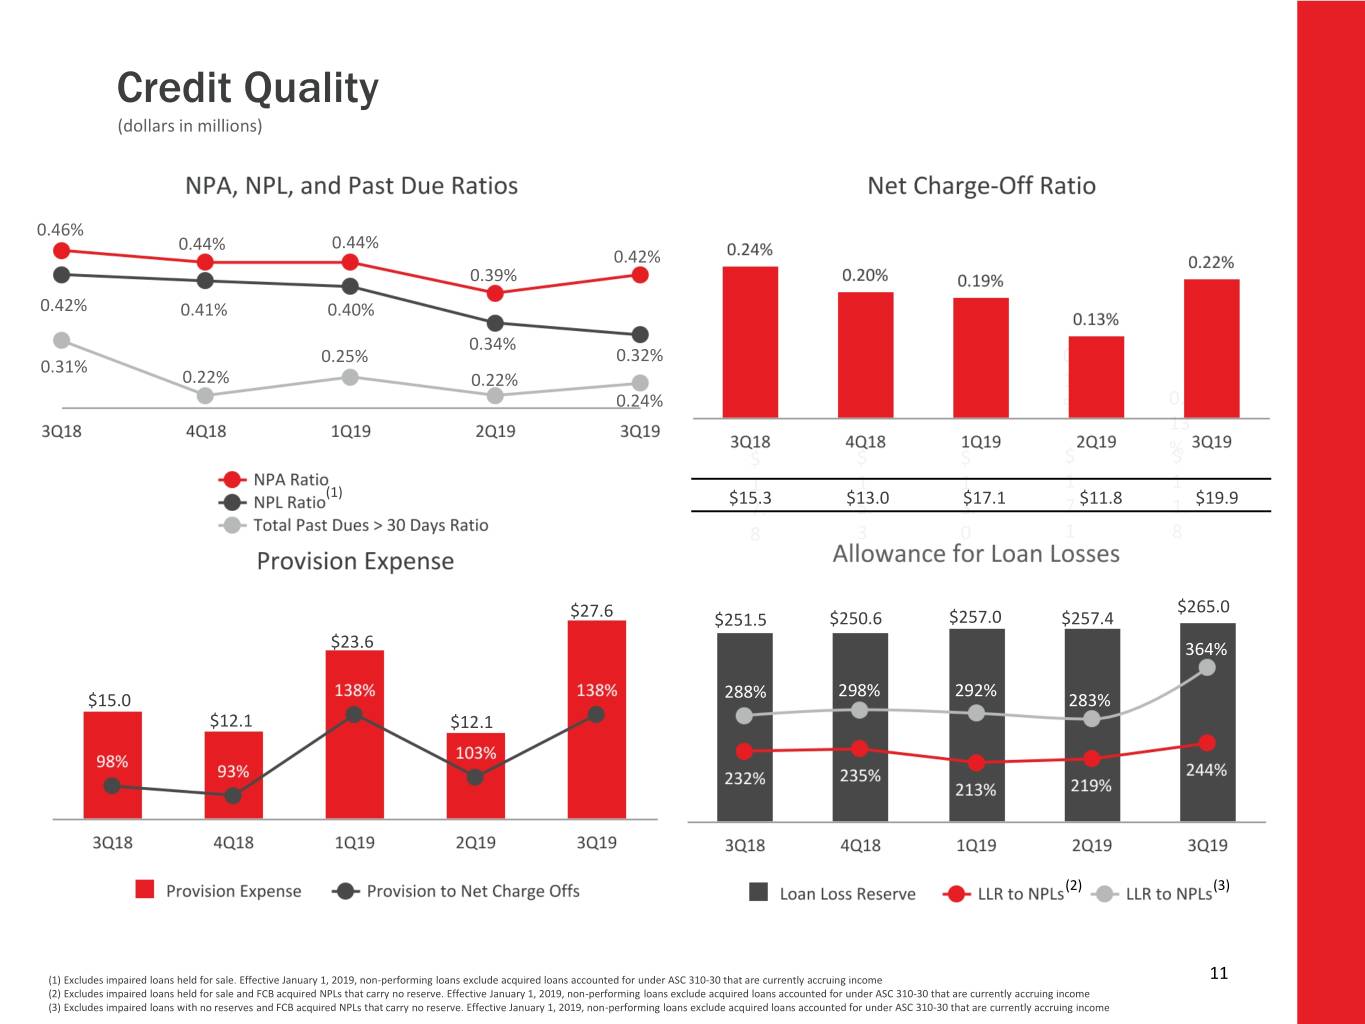
Credit Quality (dollars in millions) 0.46% 0.44% 0.44% 0.42% 0.39% 0. 0.42% 0.41% 0.40% ( 29 0. 2 % 0.34% ) 24 0.25% 0.32% 0. 0. 0.31% % 0.22% 0.22% 20 19 0.24% % % 0. 13 0.2 % $ $ $ $ 9% $ 1 1 1 1 1 (1) $15.3 $13.0 $17.1 $11.8 $19.9 7. 5. 3. 7. 1. 8 0.0 3 0.2 0 0.2 1 8 0.1 7% 9% 4% 9% % $265.0 $27.6 $251.5 $250.6 $257.0 $257.4 $23.6 364% 288% 298% 292% $15.0 $2 283% $12.17. $12.1 7 (2) (3) (1) Excludes impaired loans held for sale. Effective January 1, 2019, non-performing loans exclude acquired loans accounted for under ASC 310-30 that are currently accruing income 11 (2) Excludes impaired loans held for sale and FCB acquired NPLs that carry no reserve. Effective January 1, 2019, non-performing loans exclude acquired loans accounted for under ASC 310-30 that are currently accruing income (3) Excludes impaired loans with no reserves and FCB acquired NPLs that carry no reserve. Effective January 1, 2019, non-performing loans exclude acquired loans accounted for under ASC 310-30 that are currently accruing income
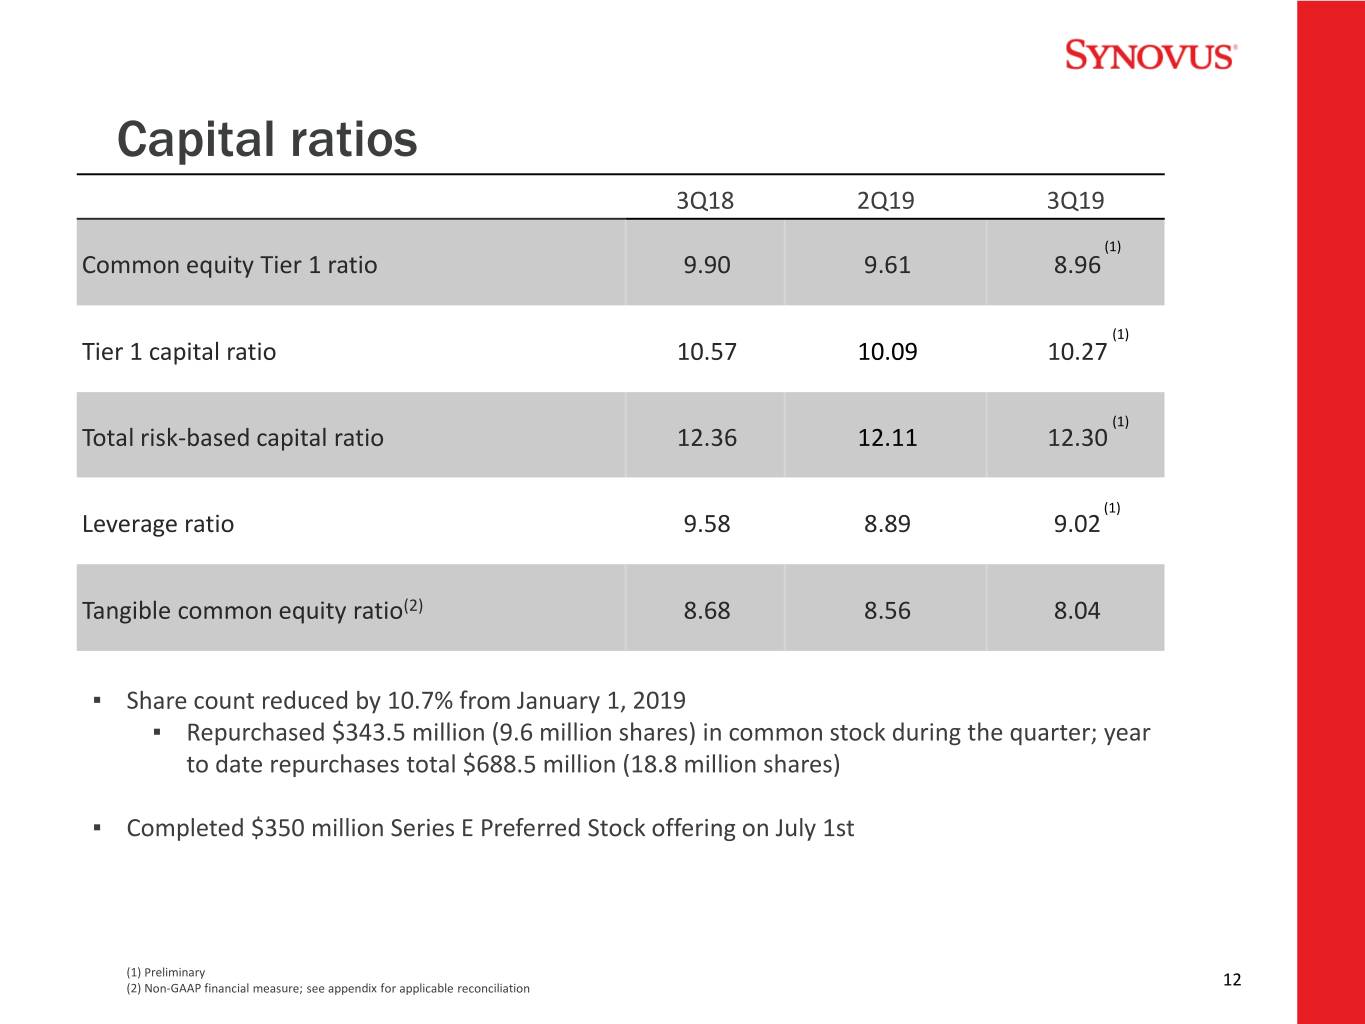
Capital ratios 3Q18 2Q19 3Q19 (1) Common equity Tier 1 ratio 9.90 9.61 8.96 (1) Tier 1 capital ratio 10.57 10.09 10.27 (1) Total risk-based capital ratio 12.36 12.11 12.30 (1) Leverage ratio 9.58 8.89 9.02 Tangible common equity ratio(2) 8.68 8.56 8.04 ▪ Share count reduced by 10.7% from January 1, 2019 ▪ Repurchased $343.5 million (9.6 million shares) in common stock during the quarter; year to date repurchases total $688.5 million (18.8 million shares) ▪ Completed $350 million Series E Preferred Stock offering on July 1st (1) Preliminary (2) Non-GAAP financial measure; see appendix for applicable reconciliation 12
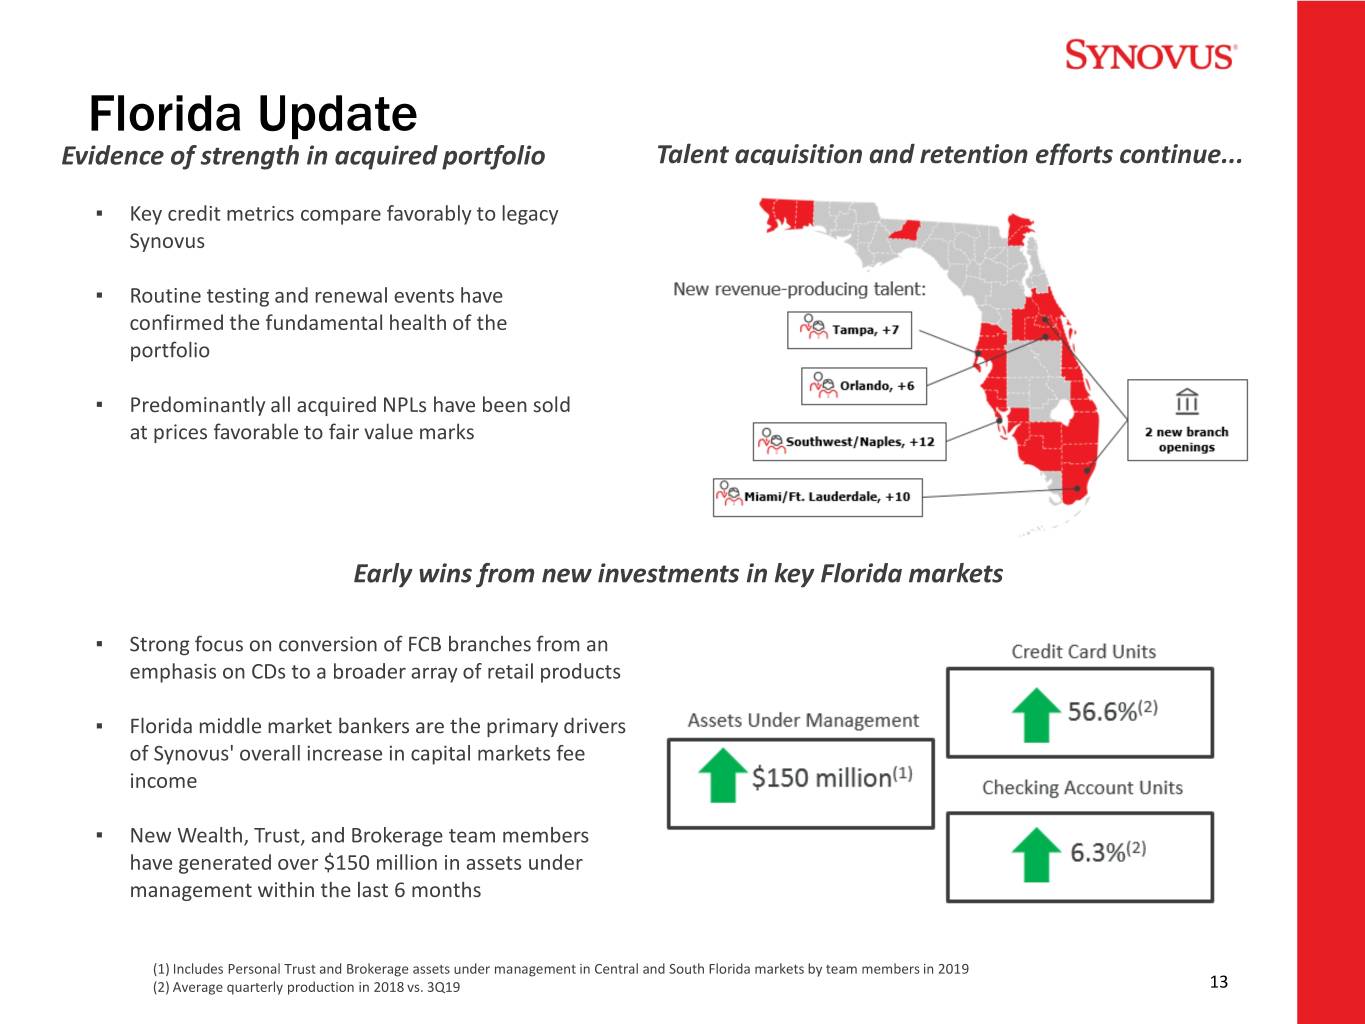
Florida Update Evidence of strength in acquired portfolio Talent acquisition and retention efforts continue... ▪ Key credit metrics compare favorably to legacy Synovus ▪ Routine testing and renewal events have confirmed the fundamental health of the portfolio ▪ Predominantly all acquired NPLs have been sold at prices favorable to fair value marks $4.7 $11.1 $18.2 $3.8 $2.2 $8.7 Early wins from new investments in key Florida markets ▪ Strong focus on conversion of FCB branches from an emphasis on CDs to a broader array of retail products ▪ Florida middle market bankers are the primary drivers of Synovus' overall increase in capital markets fee income ▪ New Wealth, Trust, and Brokerage team members have generated over $150 million in assets under management within the last 6 months (1) Includes Personal Trust and Brokerage assets under management in Central and South Florida markets by team members in 2019 (2) Average quarterly production in 2018 vs. 3Q19 13

2019 Outlook (1) Pro forma combination of FCB and Synovus based on 2018 results (2) Loan and deposit growth based on 12/31/2018 combined period end balance (3) Assumes current forward curve (4) Non-GAAP financial measure; see appendix for applicable reconciliation (5) Growth excludes amortization of intangibles of approximately $12 million in 2019 14
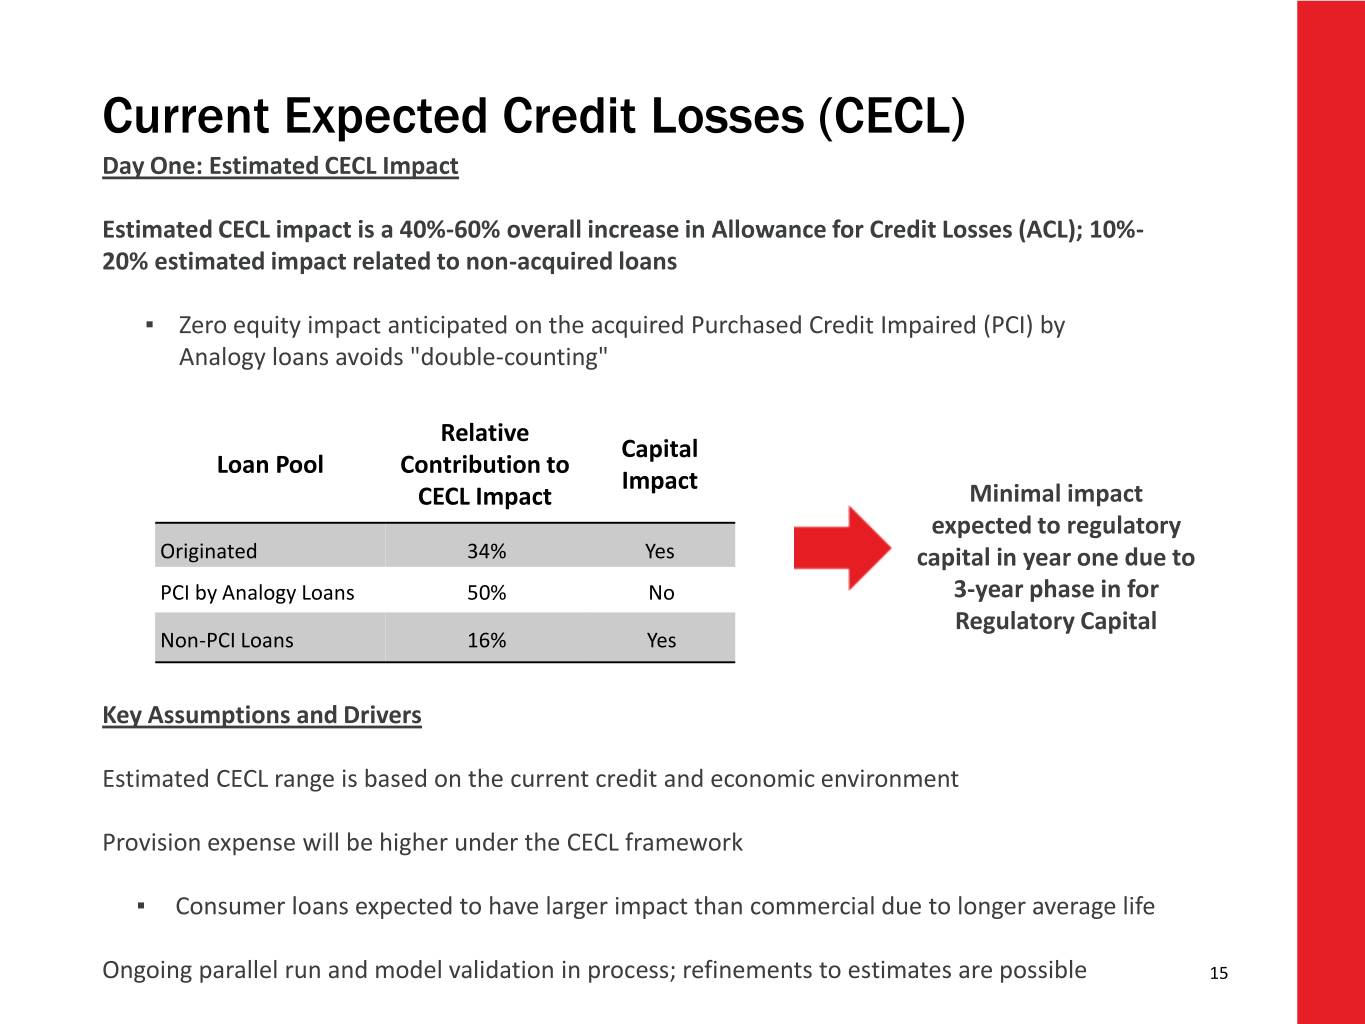
Current Expected Credit Losses (CECL) Day One: Estimated CECL Impact Estimated CECL impact is a 40%-60% overall increase in Allowance for Credit Losses (ACL); 10%- 20% estimated impact related to non-acquired loans ▪ Zero equity impact anticipated on the acquired Purchased Credit Impaired (PCI) by Analogy loans avoids "double-counting" Relative Capital Loan Pool Contribution to Impact CECL Impact Minimal impact expected to regulatory Originated 34% Yes capital in year one due to PCI by Analogy Loans 50% No 3-year phase in for Regulatory Capital Non-PCI Loans 16% Yes Key Assumptions and Drivers Estimated CECL range is based on the current credit and economic environment Provision expense will be higher under the CECL framework ▪ Consumer loans expected to have larger impact than commercial due to longer average life Ongoing parallel run and model validation in process; refinements to estimates are possible 15

Appendix

Quarterly Highlights Trend 3Q18 4Q18 1Q19 2Q19 3Q19 Diluted EPS 0.84 0.87 0.72 0.96 0.83 Net interest margin 3.89 3.92 3.78 3.69 3.69 Efficiency ratio 60.62 57.34 61.28 54.14 56.20 Financial Performance Adjusted tangible efficiency ratio(1) 55.55 55.98 50.24 52.08 51.71 ROA(2) 1.36 1.29 1.06 1.34 1.14 Adjusted ROA(1)(2) 1.47 1.36 1.45 1.39 1.33 Total loans 7.0 5.7 37.3 5.7 3.1 Balance Sheet Growth(3) Total average deposits 1.8 8.0 40.5 0.8 (1.9) NPA ratio 0.46 0.44 0.44 0.39 0.42 Credit Quality NCO ratio(2) 0.24 0.20 0.19 0.13 0.22 Common shares outstanding(4) 116,714 115,866 157,454 156,872 147,594 (5) CET1 ratio 9.90 9.95 9.52 9.61 8.96 Capital Tangible common equity ratio(1) 8.68 8.81 8.34 8.56 8.04 17 (1) Non-GAAP financial measure; see applicable reconciliation (2) Annualized (3) Sequential quarter growth, annualized except for 1Q19 (4) In thousands (5) Preliminary
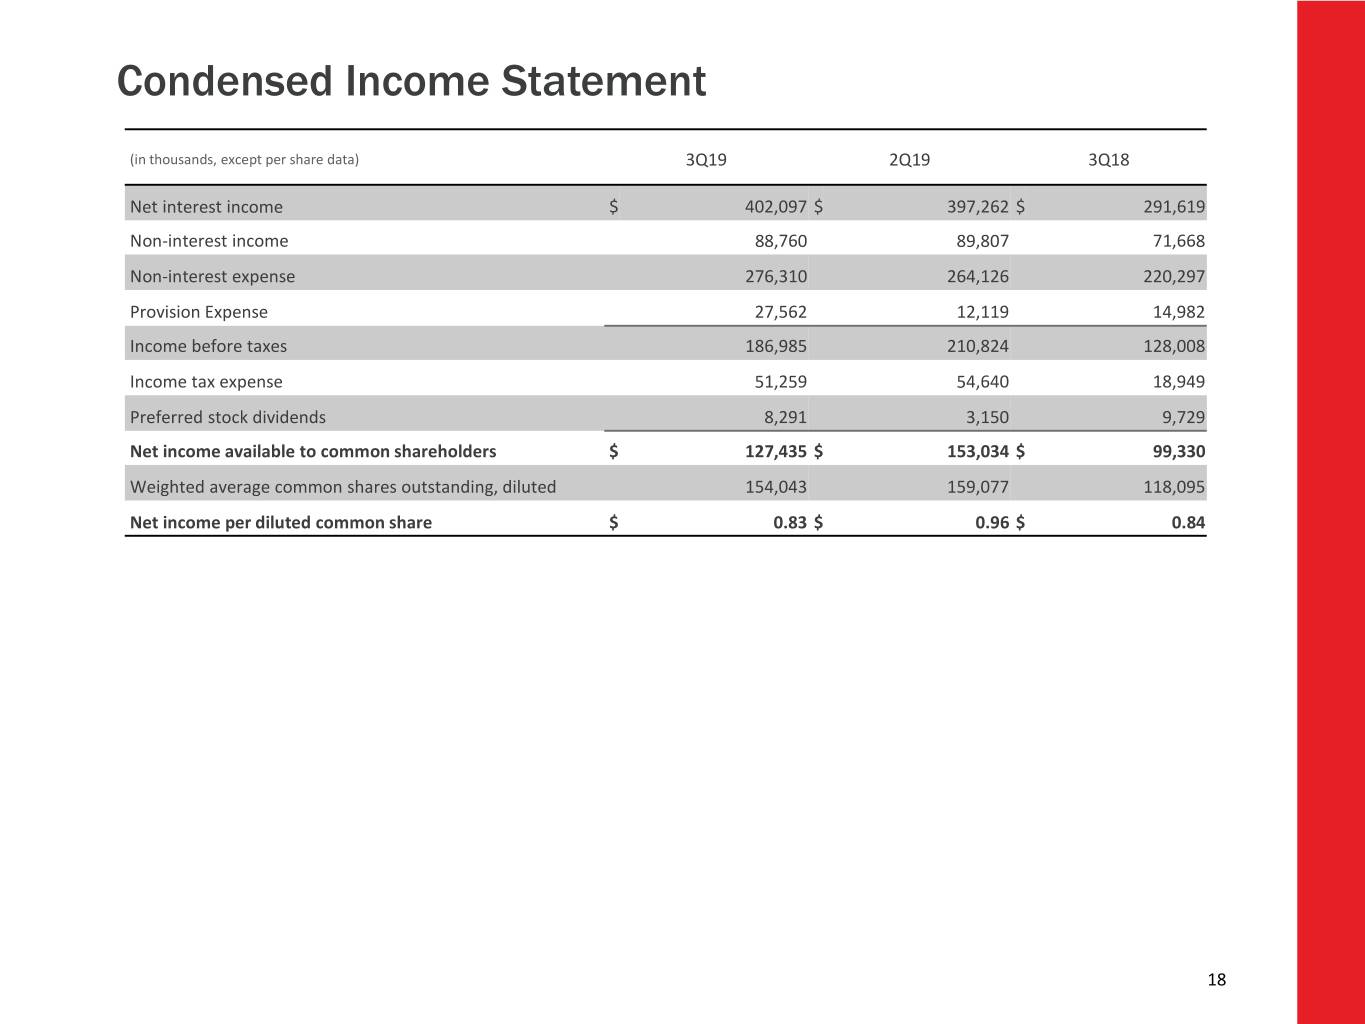
Condensed Income Statement (in thousands, except per share data) 3Q19 2Q19 3Q18 Net interest income $ 402,097 $ 397,262 $ 291,619 Non-interest income 88,760 89,807 71,668 Non-interest expense 276,310 264,126 220,297 Provision Expense 27,562 12,119 14,982 Income before taxes 186,985 210,824 128,008 Income tax expense 51,259 54,640 18,949 Preferred stock dividends 8,291 3,150 9,729 Net income available to common shareholders $ 127,435 $ 153,034 $ 99,330 Weighted average common shares outstanding, diluted 154,043 159,077 118,095 Net income per diluted common share $ 0.83 $ 0.96 $ 0.84 18

Non-interest Income 3Q19 vs. 2Q19 3Q19 vs. 3Q18 (in thousands) 3Q19 2Q19 3Q18 % Change % Change Service charges on deposit accounts $ 22,952 $ 21,994 $ 20,582 4.4 11.5 Fiduciary and asset management fees 14,686 14,478 13,462 1.4 9.1 Brokerage revenue 11,071 10,052 9,041 10.1 22.5 Mortgage banking income 10,351 7,907 5,290 30.9 95.7 Card fees 12,297 11,161 10,608 10.2 15.9 Capital markets income 7,396 8,916 1,155 (17.0) nm Income from bank-owned life insurance 5,139 5,176 3,771 (0.7) 36.3 Other non-interest income 7,405 10,513 7,325 (29.6) 1.1 Adjusted non-interest income $ 91,297 $ 90,197 $ 71,234 1.2 28.2 Gain on sale and increase in fair value of private equity investments, net 1,194 1,455 434 (17.9) nm Investment securities (losses), net (3,731) (1,845) — nm nm Total non-interest income $ 88,760 $ 89,807 $ 71,668 (1.2) 23.8 nm = not meaningful 19

Earning Assets Composition ( 2 ) (1) (1) Net Interest Income Sensitivity (2) Gradual change in short- Estimated % change in net term interest rates interest income (in bps) -100 (2.74)% -25 (1.06)% (1) Loan and investment yields include purchase accounting adjustments (PAA). Excluding the effect of PAA, loan and investment yields were 4.93% and 3.04%, respectively in 3Q19; 5.04% and 3.02%, respectively in 2Q19; and 5.02% and 3.03%, respectively in 1Q19 20 (2) Net interest income sensitivity results include updated mortgage prepayment assumptions
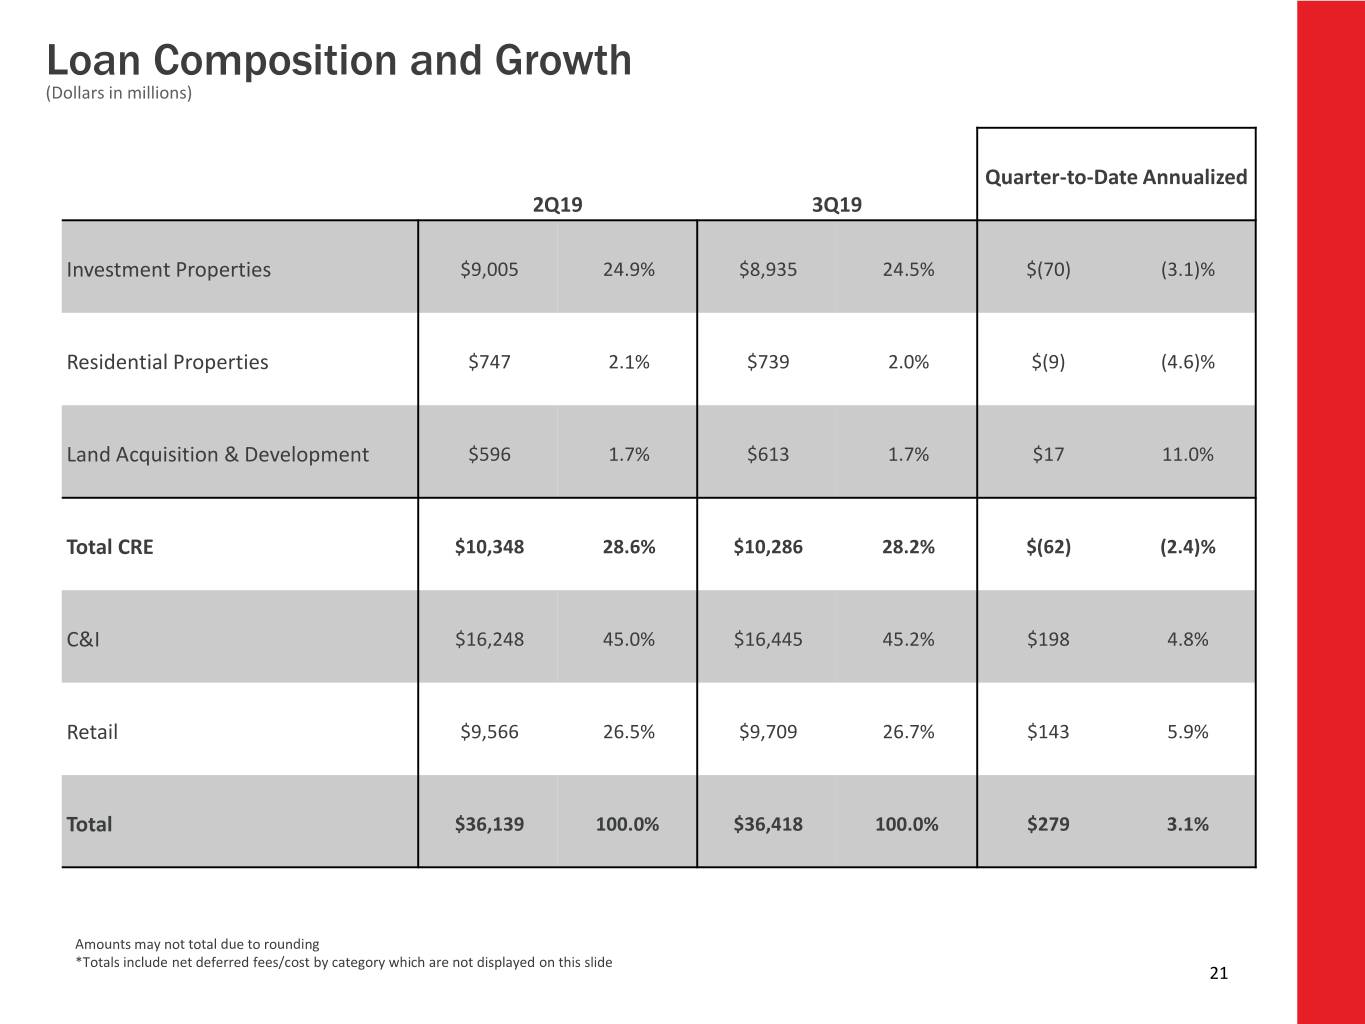
Loan Composition and Growth (Dollars in millions) Quarter-to-Date Annualized 2Q19 3Q19 Investment Properties $9,005 24.9% $8,935 24.5% $(70) (3.1)% Residential Properties $747 2.1% $739 2.0% $(9) (4.6)% Land Acquisition & Development $596 1.7% $613 1.7% $17 11.0% Total CRE $10,348 28.6% $10,286 28.2% $(62) (2.4)% C&I $16,248 45.0% $16,445 45.2% $198 4.8% Retail $9,566 26.5% $9,709 26.7% $143 5.9% Total $36,139 100.0% $36,418 100.0% $279 3.1% Amounts may not total due to rounding *Totals include net deferred fees/cost by category which are not displayed on this slide 21

Commercial Real Estate Composition of 3Q19 Commercial Real Estate Portfolio ▪ Investment Properties portfolio represents Total Portfolio $10.29 billion 87% of total CRE portfolio ▪ The portfolio is well diversified among the property types ▪ Credit quality in Investment Properties portfolio remains excellent ▪ As of 3Q19, Residential C&D and Land Acquisition Portfolios represent only 1.9% of total performing loans ▪ No single CRE loan above $70 million ▪ Average CRE loan size is $10.9 million Credit Indicator 3Q19 NPL Ratio 0.06% Net Charge-off Ratio (annualized) 0.07% 30+ Days Past Due Ratio 0.11% 90+ Days Past Due Ratio 0.02% 22

C&I Portfolio Diverse Industry Exposure Total Portfolio $16.45 billion ▪ Wholesale Bank (includes Large Corporate, Middle Market, and Specialty Lines) represents 56.5% of C&I Balances ▪ Community/Retail Bank represents 43.7% of C&I balances Credit Indicator 3Q19 NPL Ratio 0.50% Net Charge-off Ratio (annualized) 0.32% 30+ Days Past Due Ratio 0.17% 90+ Days Past Due Ratio 0.02% 23

Consumer Portfolio Total Consumer Portfolio $9.71 billion Credit Indicator 3Q19 NPL Ratio 0.28% Net Charge-off Ratio * 0.21% 30+ Days Past Due Ratio 0.50% 90+ Days Past Due Ratio 0.12% ▪ Credit Card Portfolio continues to perform well ▪ Average utilization rate is 23.1% ▪ Average credit score is 727 ▪ Charge-offs below industry average at 3.04% Mortgage and HELOC, the two largest concentrations, have for the year strong credit indicators Credit Indicator Heloc Mortgage Weighted Average Credit 792 770 ▪ Lending Partnerships with GreenSky and SoFi Score of 3Q19 Originations ▪ Currently $1.95 billion in balances, or 5.4% of total portfolio Weighted average credit score 786 777 of total portfolio ▪ GreenSky is a point-of-sale program where the customer applies with home Average LTV 74.7% 75.8% improvement store, contractor, or other Average DTI 32.5% 31.1% merchant Utilization* Annualized Rate 52.2% N/A ▪ SoFi portfolio primarily consists of refinanced student loan debt 24
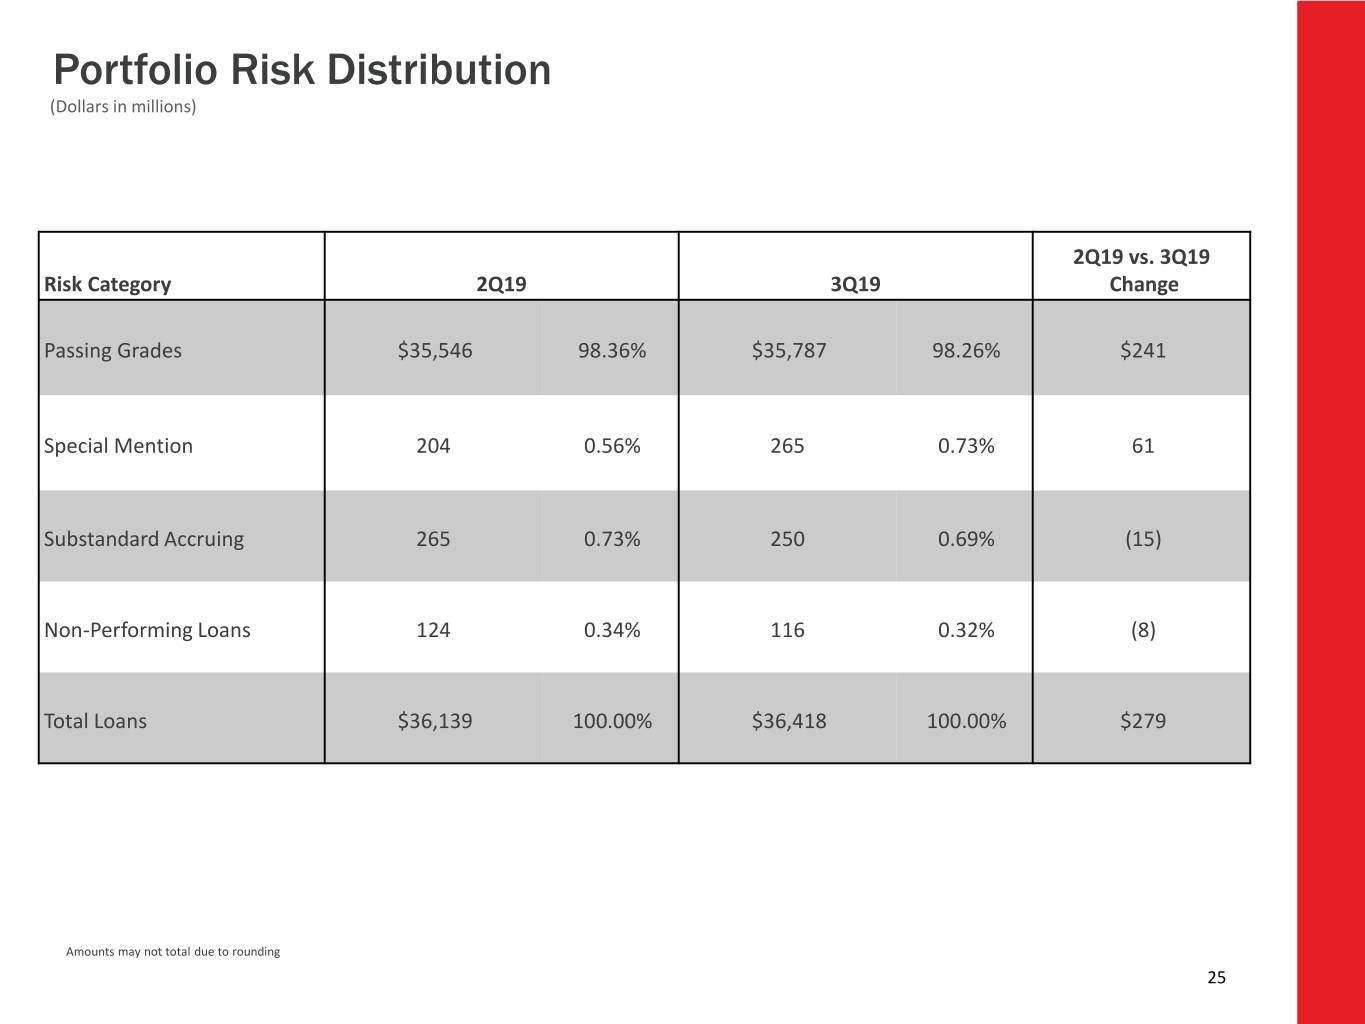
Portfolio Risk Distribution (Dollars in millions) 2Q19 vs. 3Q19 Risk Category 2Q19 3Q19 Change Passing Grades $35,546 98.36% $35,787 98.26% $241 Special Mention 204 0.56% 265 0.73% 61 Substandard Accruing 265 0.73% 250 0.69% (15) Non-Performing Loans 124 0.34% 116 0.32% (8) Total Loans $36,139 100.00% $36,418 100.00% $279 Amounts may not total due to rounding 25
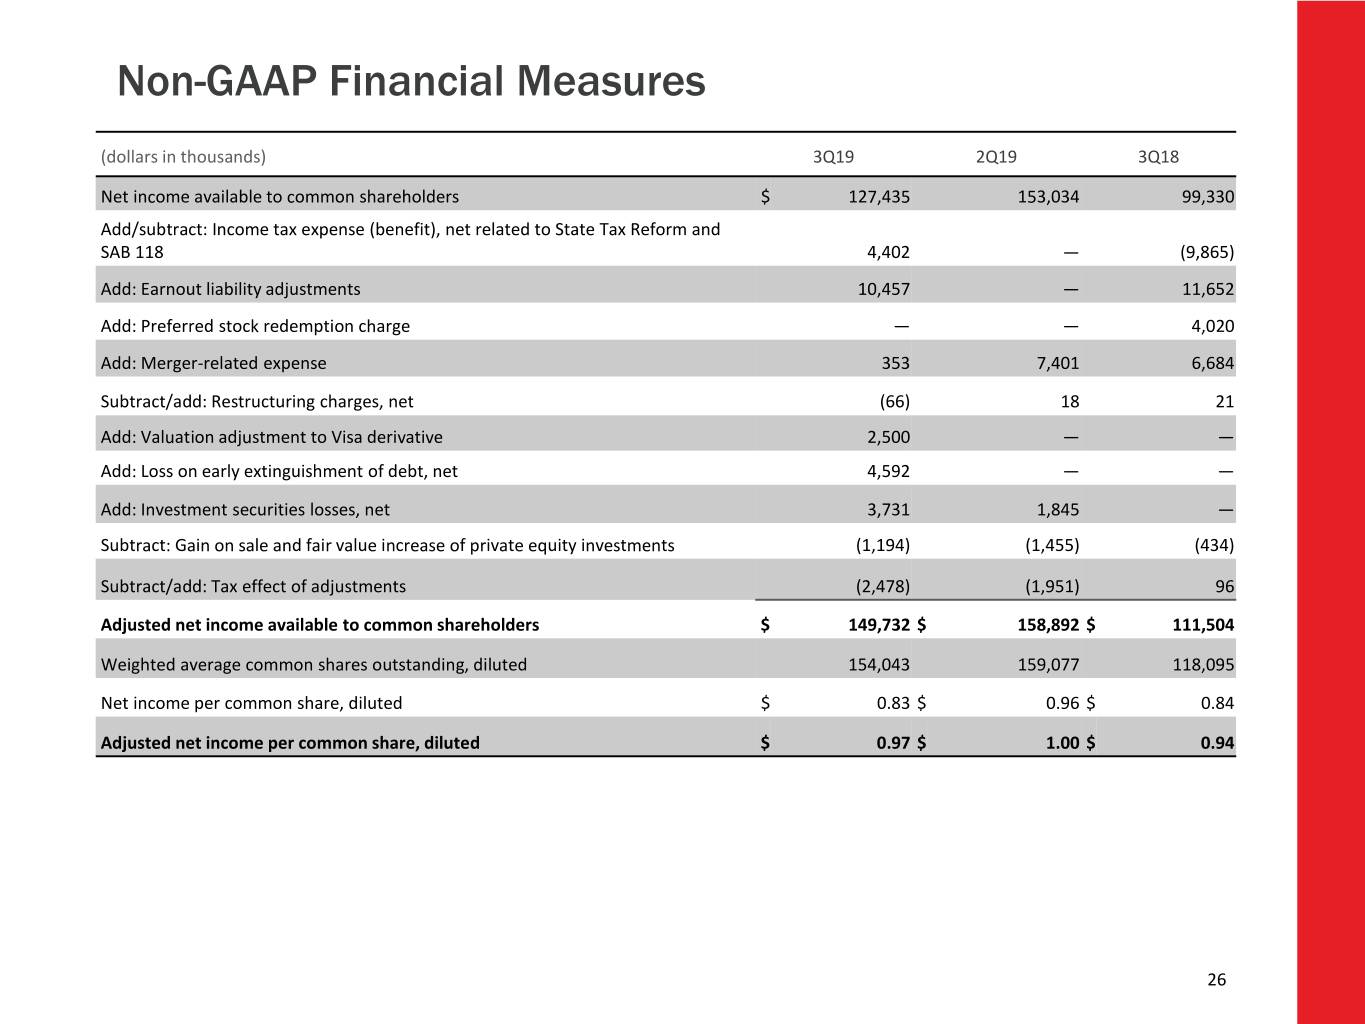
Non-GAAP Financial Measures (dollars in thousands) 3Q19 2Q19 3Q18 Net income available to common shareholders $ 127,435 153,034 99,330 Add/subtract: Income tax expense (benefit), net related to State Tax Reform and SAB 118 4,402 — (9,865) Add: Earnout liability adjustments 10,457 — 11,652 Add: Preferred stock redemption charge — — 4,020 Add: Merger-related expense 353 7,401 6,684 Subtract/add: Restructuring charges, net (66) 18 21 Add: Valuation adjustment to Visa derivative 2,500 — — Add: Loss on early extinguishment of debt, net 4,592 — — Add: Investment securities losses, net 3,731 1,845 — Subtract: Gain on sale and fair value increase of private equity investments (1,194) (1,455) (434) Subtract/add: Tax effect of adjustments (2,478) (1,951) 96 Adjusted net income available to common shareholders $ 149,732 $ 158,892 $ 111,504 Weighted average common shares outstanding, diluted 154,043 159,077 118,095 Net income per common share, diluted $ 0.83 $ 0.96 $ 0.84 Adjusted net income per common share, diluted $ 0.97 $ 1.00 $ 0.94 26
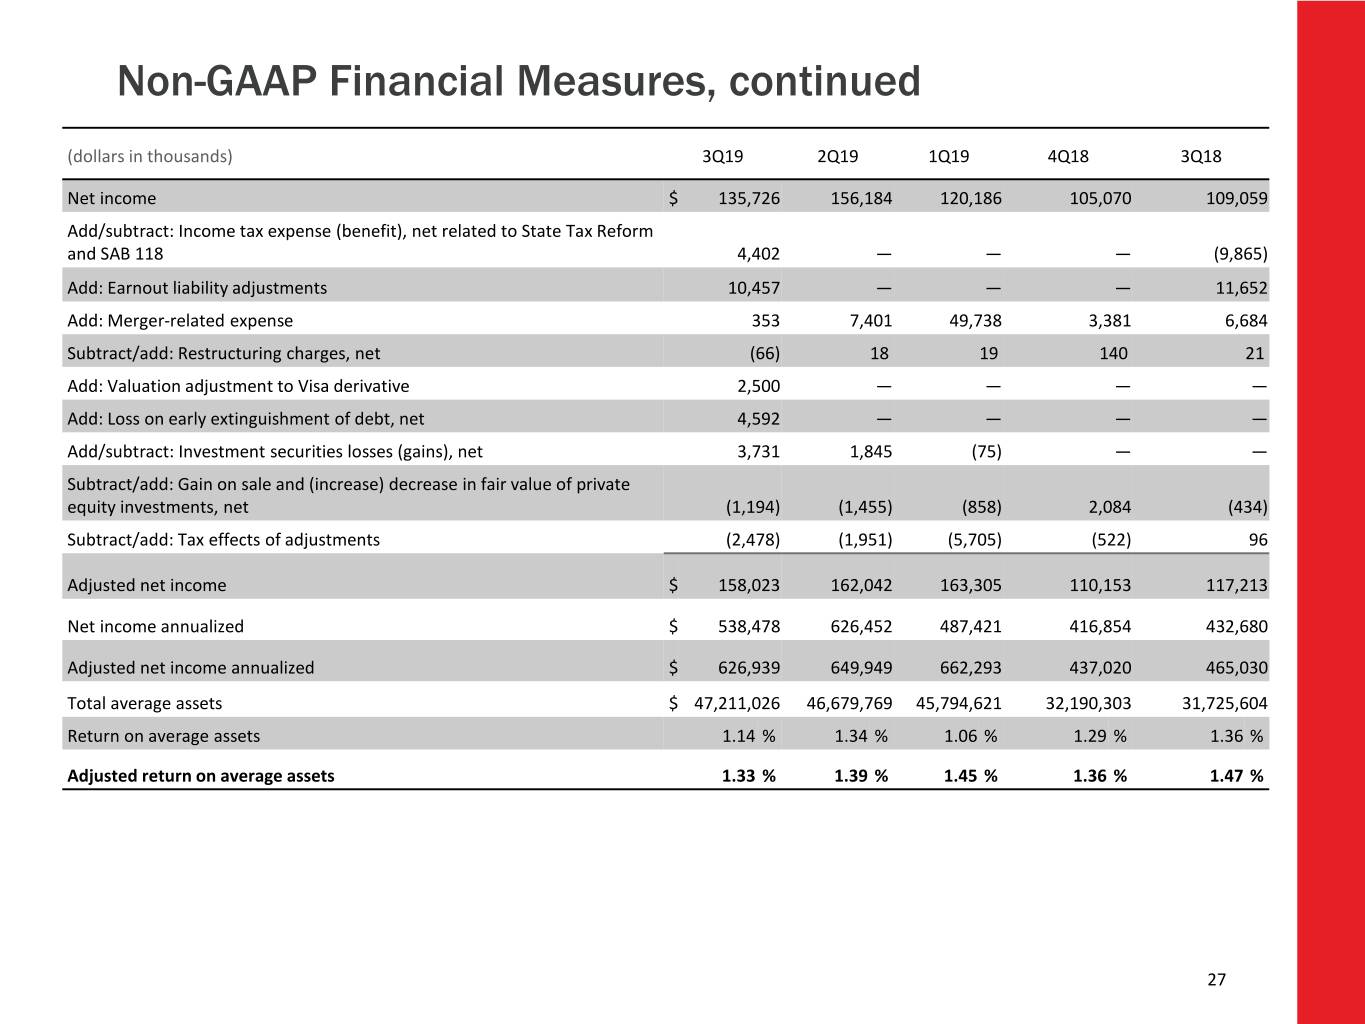
Non-GAAP Financial Measures, continued (dollars in thousands) 3Q19 2Q19 1Q19 4Q18 3Q18 Net income $ 135,726 156,184 120,186 105,070 109,059 Add/subtract: Income tax expense (benefit), net related to State Tax Reform and SAB 118 4,402 — — — (9,865) Add: Earnout liability adjustments 10,457 — — — 11,652 Add: Merger-related expense 353 7,401 49,738 3,381 6,684 Subtract/add: Restructuring charges, net (66) 18 19 140 21 Add: Valuation adjustment to Visa derivative 2,500 — — — — Add: Loss on early extinguishment of debt, net 4,592 — — — — Add/subtract: Investment securities losses (gains), net 3,731 1,845 (75) — — Subtract/add: Gain on sale and (increase) decrease in fair value of private equity investments, net (1,194) (1,455) (858) 2,084 (434) Subtract/add: Tax effects of adjustments (2,478) (1,951) (5,705) (522) 96 Adjusted net income $ 158,023 162,042 163,305 110,153 117,213 Net income annualized $ 538,478 626,452 487,421 416,854 432,680 Adjusted net income annualized $ 626,939 649,949 662,293 437,020 465,030 Total average assets $ 47,211,026 46,679,769 45,794,621 32,190,303 31,725,604 Return on average assets 1.14 % 1.34 % 1.06 % 1.29 % 1.36 % Adjusted return on average assets 1.33 % 1.39 % 1.45 % 1.36 % 1.47 % 27
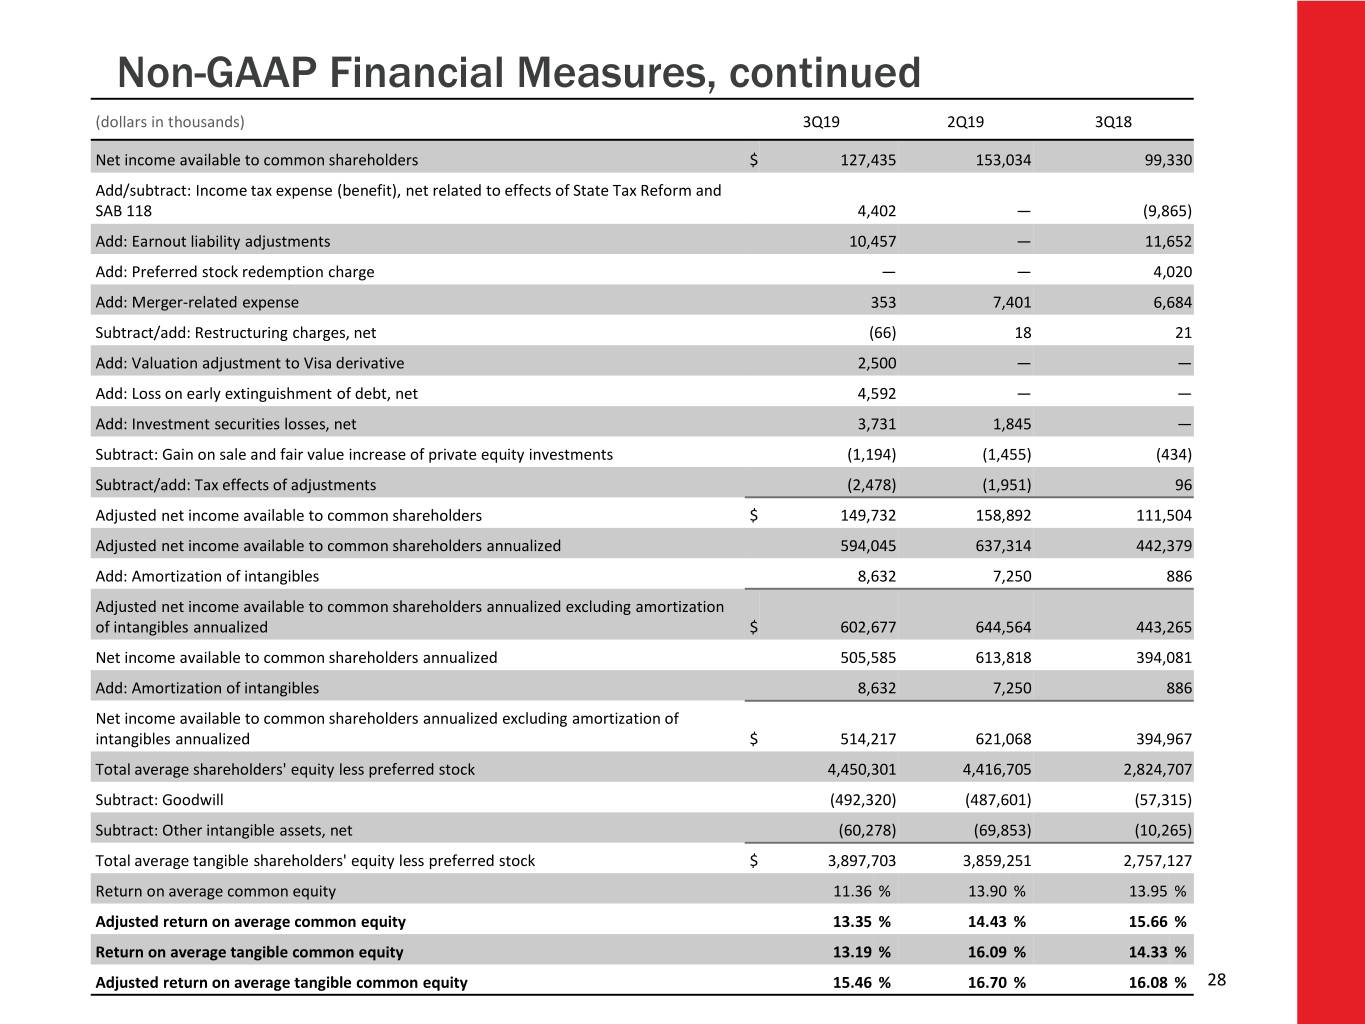
Non-GAAP Financial Measures, continued (dollars in thousands) 3Q19 2Q19 3Q18 Net income available to common shareholders $ 127,435 153,034 99,330 Add/subtract: Income tax expense (benefit), net related to effects of State Tax Reform and SAB 118 4,402 — (9,865) Add: Earnout liability adjustments 10,457 — 11,652 Add: Preferred stock redemption charge — — 4,020 Add: Merger-related expense 353 7,401 6,684 Subtract/add: Restructuring charges, net (66) 18 21 Add: Valuation adjustment to Visa derivative 2,500 — — Add: Loss on early extinguishment of debt, net 4,592 �� — Add: Investment securities losses, net 3,731 1,845 — Subtract: Gain on sale and fair value increase of private equity investments (1,194) (1,455) (434) Subtract/add: Tax effects of adjustments (2,478) (1,951) 96 Adjusted net income available to common shareholders $ 149,732 158,892 111,504 Adjusted net income available to common shareholders annualized 594,045 637,314 442,379 Add: Amortization of intangibles 8,632 7,250 886 Adjusted net income available to common shareholders annualized excluding amortization of intangibles annualized $ 602,677 644,564 443,265 Net income available to common shareholders annualized 505,585 613,818 394,081 Add: Amortization of intangibles 8,632 7,250 886 Net income available to common shareholders annualized excluding amortization of intangibles annualized $ 514,217 621,068 394,967 Total average shareholders' equity less preferred stock 4,450,301 4,416,705 2,824,707 Subtract: Goodwill (492,320) (487,601) (57,315) Subtract: Other intangible assets, net (60,278) (69,853) (10,265) Total average tangible shareholders' equity less preferred stock $ 3,897,703 3,859,251 2,757,127 Return on average common equity 11.36 % 13.90 % 13.95 % Adjusted return on average common equity 13.35 % 14.43 % 15.66 % Return on average tangible common equity 13.19 % 16.09 % 14.33 % Adjusted return on average tangible common equity 15.46 % 16.70 % 16.08 % 28
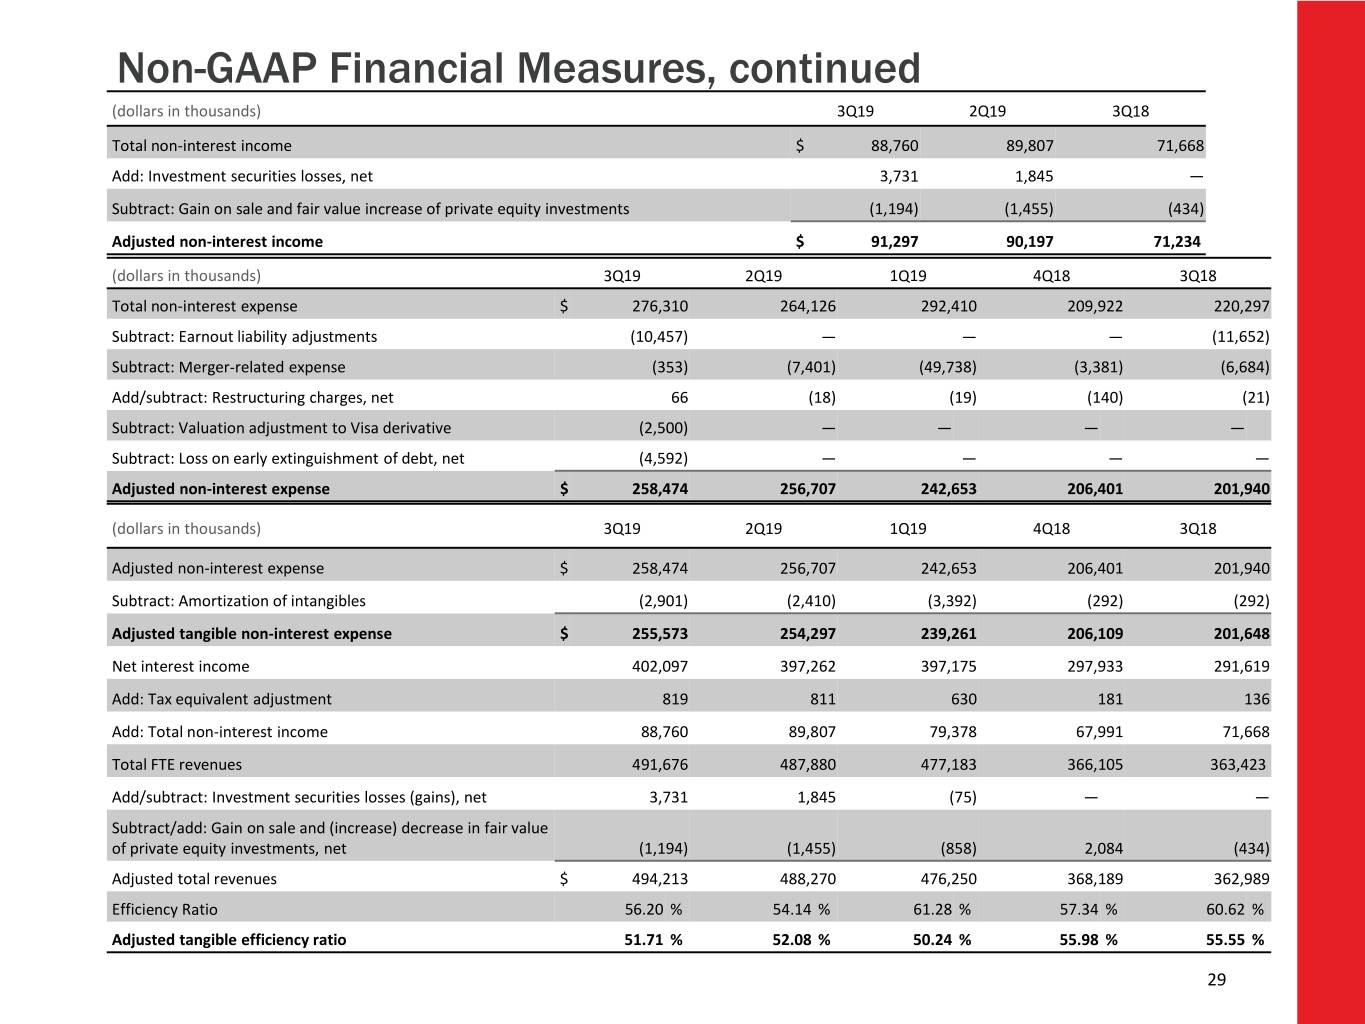
Non-GAAP Financial Measures, continued (dollars in thousands) 3Q19 2Q19 3Q18 Total non-interest income $ 88,760 89,807 71,668 Add: Investment securities losses, net 3,731 1,845 — Subtract: Gain on sale and fair value increase of private equity investments (1,194) (1,455) (434) Adjusted non-interest income $ 91,297 90,197 71,234 (dollars in thousands) 3Q19 2Q19 1Q19 4Q18 3Q18 Total non-interest expense $ 276,310 264,126 292,410 209,922 220,297 Subtract: Earnout liability adjustments (10,457) — — — (11,652) Subtract: Merger-related expense (353) (7,401) (49,738) (3,381) (6,684) Add/subtract: Restructuring charges, net 66 (18) (19) (140) (21) Subtract: Valuation adjustment to Visa derivative (2,500) — — — — Subtract: Loss on early extinguishment of debt, net (4,592) — — — — Adjusted non-interest expense $ 258,474 256,707 242,653 206,401 201,940 (dollars in thousands) 3Q19 2Q19 1Q19 4Q18 3Q18 Adjusted non-interest expense $ 258,474 256,707 242,653 206,401 201,940 Subtract: Amortization of intangibles (2,901) (2,410) (3,392) (292) (292) Adjusted tangible non-interest expense $ 255,573 254,297 239,261 206,109 201,648 Net interest income 402,097 397,262 397,175 297,933 291,619 Add: Tax equivalent adjustment 819 811 630 181 136 Add: Total non-interest income 88,760 89,807 79,378 67,991 71,668 Total FTE revenues 491,676 487,880 477,183 366,105 363,423 Add/subtract: Investment securities losses (gains), net 3,731 1,845 (75) — — Subtract/add: Gain on sale and (increase) decrease in fair value of private equity investments, net (1,194) (1,455) (858) 2,084 (434) Adjusted total revenues $ 494,213 488,270 476,250 368,189 362,989 Efficiency Ratio 56.20 % 54.14 % 61.28 % 57.34 % 60.62 % Adjusted tangible efficiency ratio 51.71 % 52.08 % 50.24 % 55.98 % 55.55 % 29
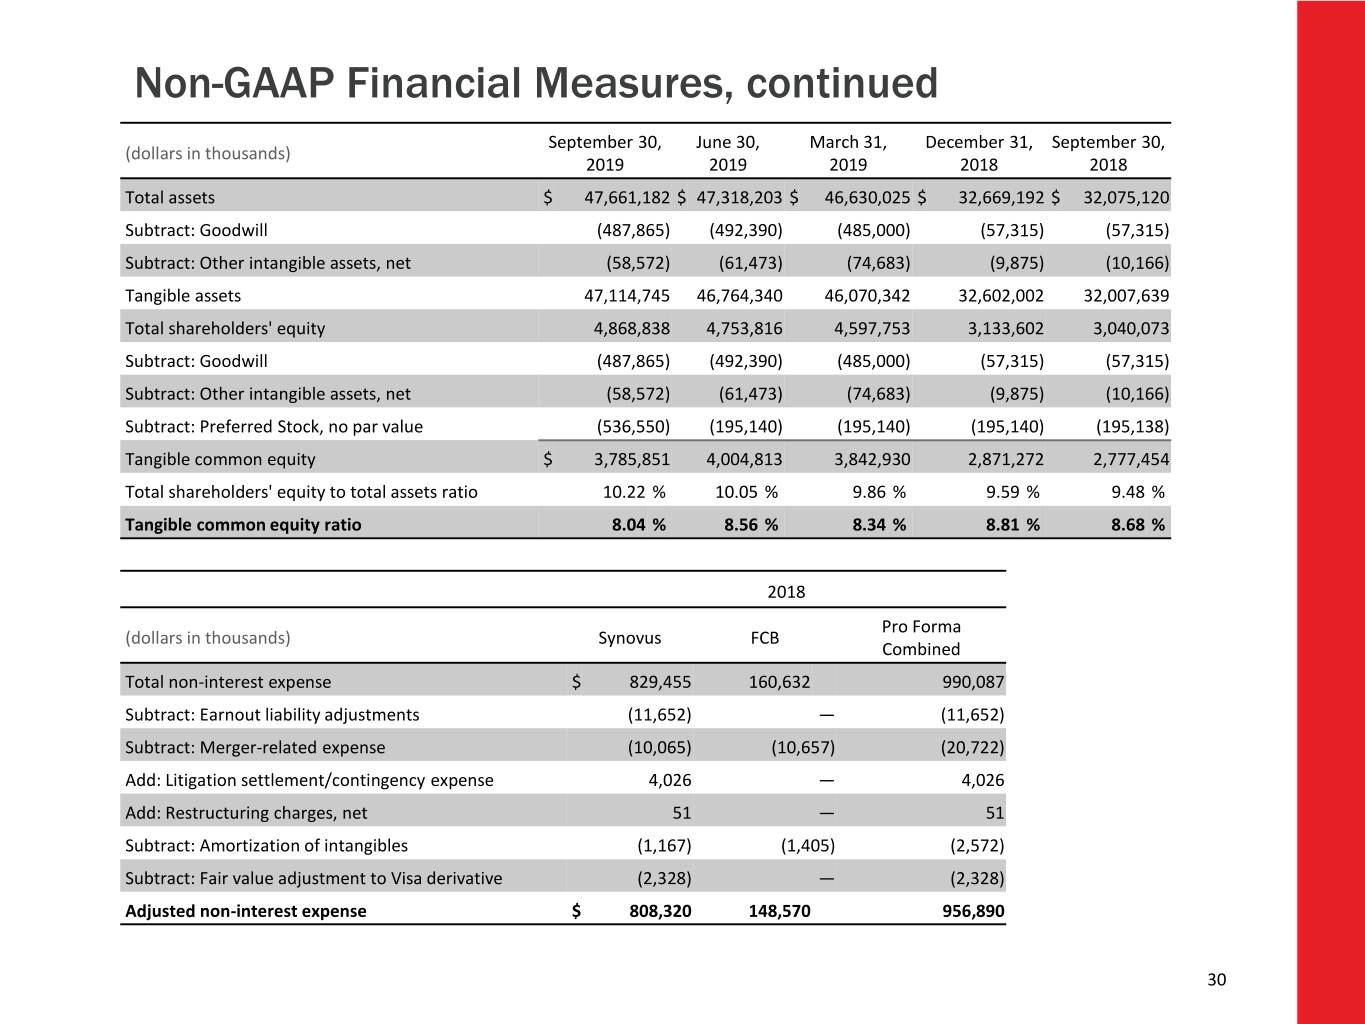
Non-GAAP Financial Measures, continued September 30, June 30, March 31, December 31, September 30, (dollars in thousands) 2019 2019 2019 2018 2018 Total assets $ 47,661,182 $ 47,318,203 $ 46,630,025 $ 32,669,192 $ 32,075,120 Subtract: Goodwill (487,865) (492,390) (485,000) (57,315) (57,315) Subtract: Other intangible assets, net (58,572) (61,473) (74,683) (9,875) (10,166) Tangible assets 47,114,745 46,764,340 46,070,342 32,602,002 32,007,639 Total shareholders' equity 4,868,838 4,753,816 4,597,753 3,133,602 3,040,073 Subtract: Goodwill (487,865) (492,390) (485,000) (57,315) (57,315) Subtract: Other intangible assets, net (58,572) (61,473) (74,683) (9,875) (10,166) Subtract: Preferred Stock, no par value (536,550) (195,140) (195,140) (195,140) (195,138) Tangible common equity $ 3,785,851 4,004,813 3,842,930 2,871,272 2,777,454 Total shareholders' equity to total assets ratio 10.22 % 10.05 % 9.86 % 9.59 % 9.48 % Tangible common equity ratio 8.04 % 8.56 % 8.34 % 8.81 % 8.68 % 2018 Pro Forma (dollars in thousands) Synovus FCB Combined Total non-interest expense $ 829,455 160,632 990,087 Subtract: Earnout liability adjustments (11,652) — (11,652) Subtract: Merger-related expense (10,065) (10,657) (20,722) Add: Litigation settlement/contingency expense 4,026 — 4,026 Add: Restructuring charges, net 51 — 51 Subtract: Amortization of intangibles (1,167) (1,405) (2,572) Subtract: Fair value adjustment to Visa derivative (2,328) — (2,328) Adjusted non-interest expense $ 808,320 148,570 956,890 30


