2021 Raymond James Institutional Investors Conference March 2, 2021 Kevin Blair President and COO Exhibit 99.1
Forward Looking Statements 2 This slide presentation and certain other Synovus Financial Corp.’s filings with the Securities and Exchange Commission contain statements that constitute "forward-looking statements" within the meaning of, and subject to the protections of, Section 27A of the Securities Act of 1933, as amended, and Section 21E of the Securities Exchange Act of 1934, as amended. All statements other than statements of historical fact are forward-looking statements. You can identify these forward- looking statements through Synovus' use of words such as "believes," "anticipates," "expects," "may," "will," "assumes," "predicts," "could," "should," "would," "intends," "targets," "estimates," "projects," "plans," "potential" and other similar words and expressions of the future or otherwise regarding the outlook for Synovus' future business and financial performance and/or the performance of the banking industry and economy in general. These forward-looking statements include, among others, statements on our expectations related to (1) loan and deposit growth; (2) net interest income and net interest margin; (3) non-interest revenue; (4) non-interest expense; (5) credit trends and key credit performance metrics; (6) effective tax rate; (7) capital position; (8) our future operating and financial performance; (9) our strategy and initiatives for future growth, balance sheet management, capital management, and expense savings; (10) executive succession; and (11) our assumptions underlying these expectations. Prospective investors are cautioned that any such forward-looking statements are not guarantees of future performance and involve known and unknown risks and uncertainties which may cause the actual results, performance or achievements of Synovus to be materially different from the future results, performance or achievements expressed or implied by such forward-looking statements. Forward-looking statements are based on the information known to, and current beliefs and expectations of, Synovus' management and are subject to significant risks and uncertainties. Actual results may differ materially from those contemplated by such forward-looking statements. A number of factors could cause actual results to differ materially from those contemplated by the forward-looking statements in this presentation. Many of these factors are beyond Synovus' ability to control or predict. These forward-looking statements are based upon information presently known to Synovus' management and are inherently subjective, uncertain and subject to change due to any number of risks and uncertainties, including, without limitation, the risks and other factors set forth in Synovus' filings with the Securities and Exchange Commission, including its Annual Report on Form 10-K for the year ended December 31, 2020 under the captions "Cautionary Notice Regarding Forward- Looking Statements" and "Risk Factors" and in Synovus' quarterly reports on Form 10-Q and current reports on Form 8-K. We believe these forward-looking statements are reasonable; however, undue reliance should not be placed on any forward-looking statements, which are based on current expectations and speak only as of the date that they are made. We do not assume any obligation to update any forward-looking statements as a result of new information, future developments or otherwise, except as otherwise may be required by law. This slide presentation contains a non-GAAP financial measure determined by methods other than in accordance with generally accepted accounting principles. Such non-GAAP financial measures include the adjusted tangible efficiency ratio. The most comparable GAAP measure to this measure is the efficiency ratio - FTE. Management uses non-GAAP financial measures to assess the performance of Synovus’ business. Management believes that non-GAAP financial measures provide meaningful additional information about Synovus to assist management, investors, and bank regulators in evaluating Synovus’ operating results and the performance of its business. However, non-GAAP financial measures have inherent limitations as analytical tools and should not be considered in isolation or as a substitute for analyses of operating results as reported under GAAP. The non-GAAP financial measures should be considered as additional views of the way our financial measures are affected by significant items and other factors, and since they are not required to be uniformly applied, they may not be comparable to other similarly titled measures at other companies. Adjusted tangible efficiency ratio is a measure utilized by management to measure the success of expense management initiatives focused on reducing recurring controllable operating costs. The reconciliations of the non-GAAP financial measure used in this slide presentation is set forth in the Appendix to this slide presentation. Use of Non-GAAP Financial Measures
3 Committed to Deliver Sustainable, Top-Quartile Performance Positioned for Success Delivering a Superior Customer Experience Committed to Profitable Growth

Attractive Franchise in Southeastern Markets Company Overview (1) All figures as of 12/31/2020, except for market cap, which is as of 02/24/2021 Perfectly Sized to Provide Expertise and a Full Suite of Financial Solutions(1) Total Assets $54.4B Loans $38.3B Deposits $46.7B Branches 289 Team Members 5,247 Market Cap $6.4B Strong presence in top markets throughout five- state Southeast footprint 4 Customer Loyalty Positioned for Success
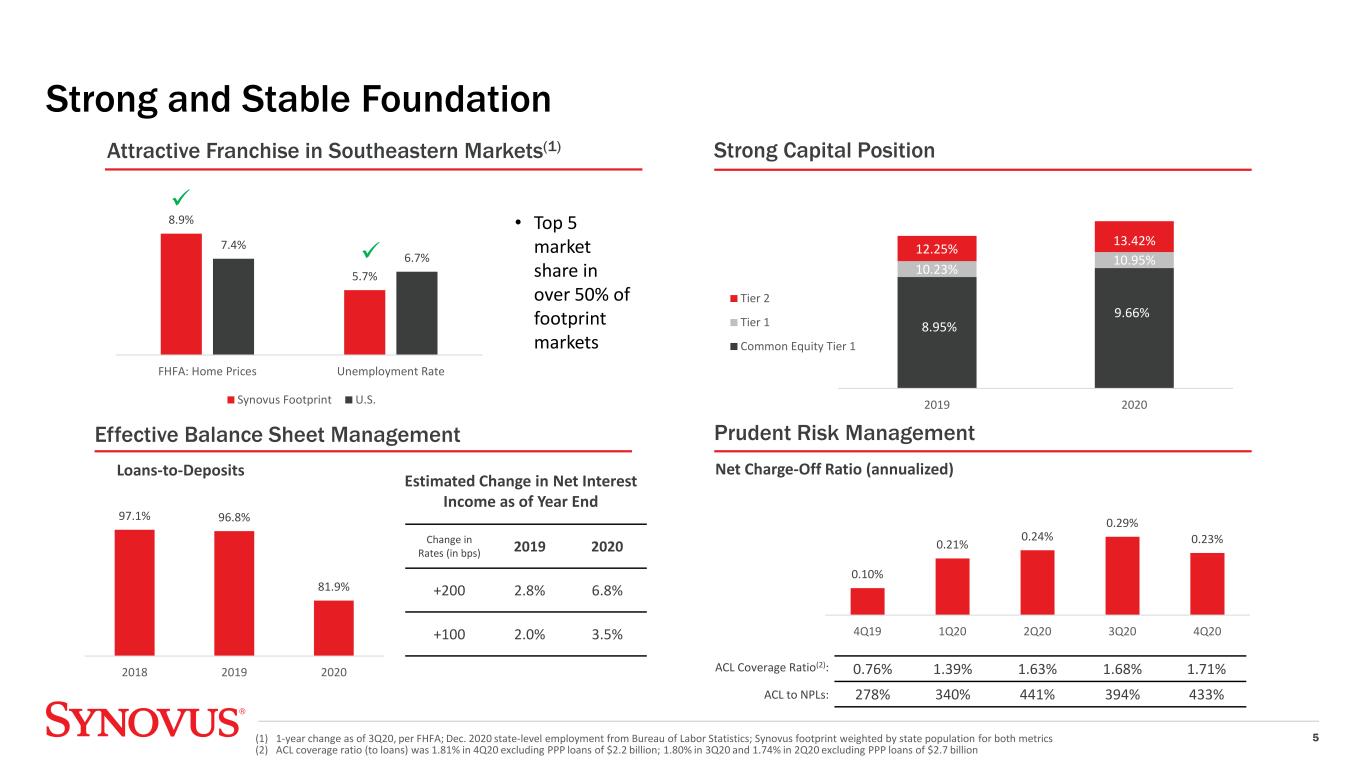
Strong and Stable Foundation 5 Effective Balance Sheet Management Strong Capital Position Prudent Risk Management 8.9% 5.7% 7.4% 6.7% FHFA: Home Prices Unemployment Rate Synovus Footprint U.S. 2019 2020 Tier 2 Tier 1 Common Equity Tier 1 8.95% 9.66% 10.23% 10.95% 12.25% 13.42% (1) 1-year change as of 3Q20, per FHFA; Dec. 2020 state-level employment from Bureau of Labor Statistics; Synovus footprint weighted by state population for both metrics (2) ACL coverage ratio (to loans) was 1.81% in 4Q20 excluding PPP loans of $2.2 billion; 1.80% in 3Q20 and 1.74% in 2Q20 excluding PPP loans of $2.7 billion Attractive Franchise in Southeastern Markets(1) 0.76% 1.39% 1.63% 1.68% 1.71% 278% 340% 441% 394% 433% ACL Coverage Ratio(2): ACL to NPLs: 97.1% 96.8% 81.9% 2018 2019 2020 Loans-to-Deposits Estimated Change in Net Interest Income as of Year End Change in Rates (in bps) 2019 2020 +200 2.8% 6.8% +100 2.0% 3.5% 0.10% 0.21% 0.24% 0.29% 0.23% 4Q19 1Q20 2Q20 3Q20 4Q20 Net Charge-Off Ratio (annualized) • Top 5 market share in over 50% of footprint markets
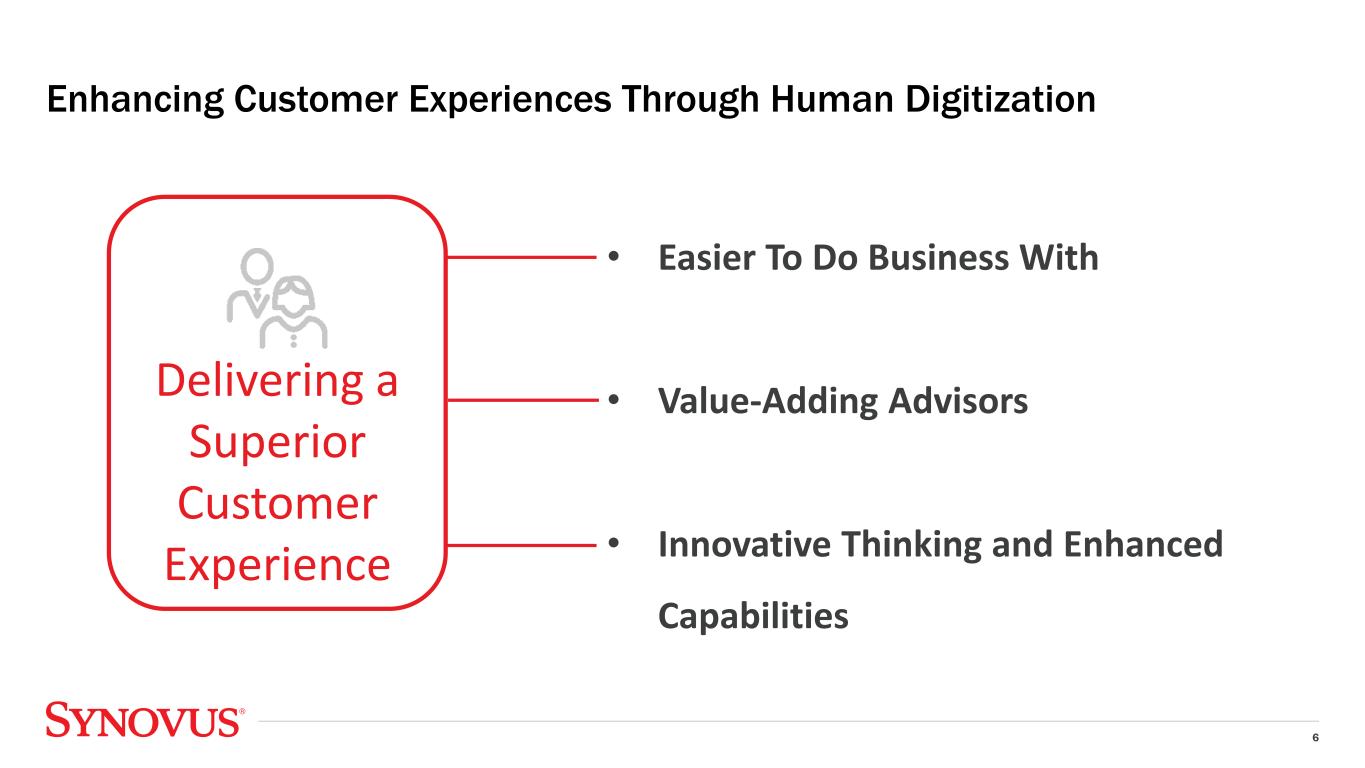
6 Enhancing Customer Experiences Through Human Digitization • Easier To Do Business With • Value-Adding Advisors • Innovative Thinking and Enhanced Capabilities Delivering a Superior Customer Experience
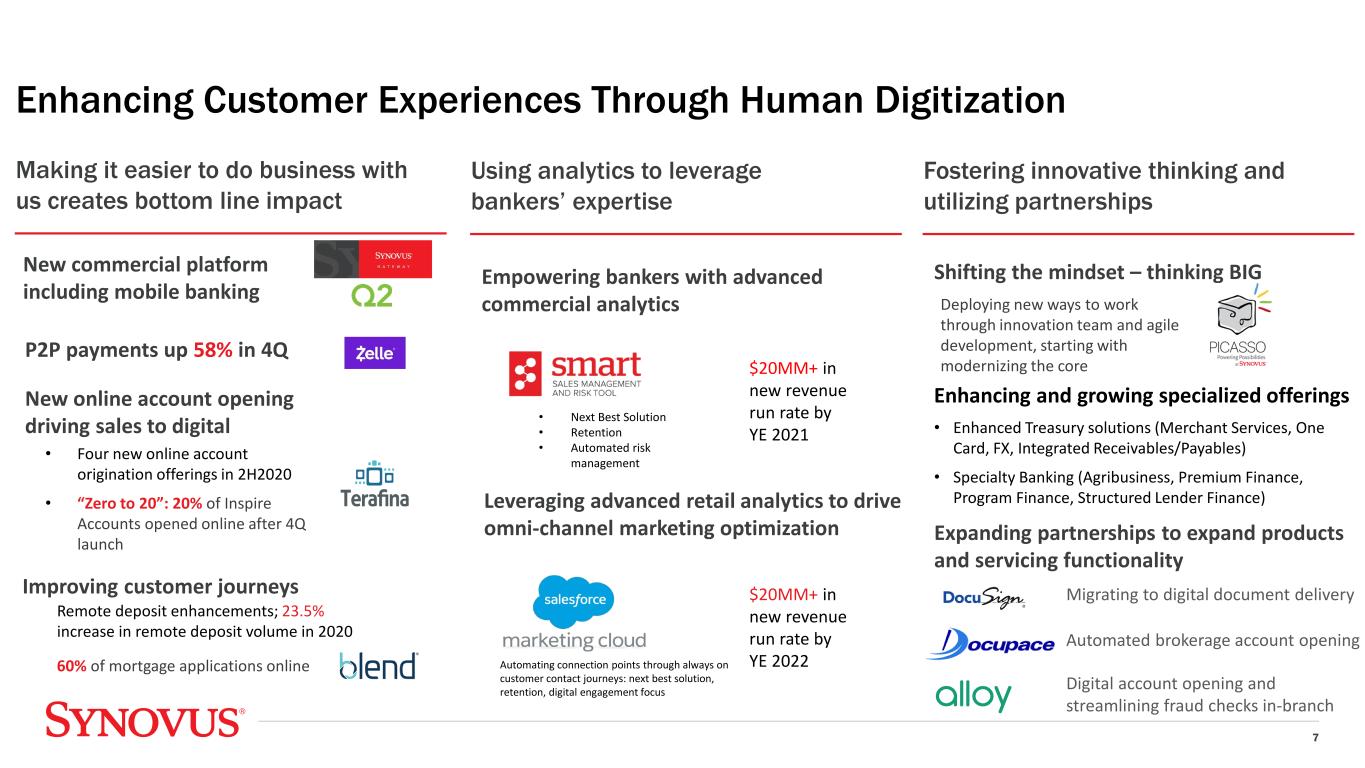
Enhancing and growing specialized offerings • Enhanced Treasury solutions (Merchant Services, One Card, FX, Integrated Receivables/Payables) • Specialty Banking (Agribusiness, Premium Finance, Program Finance, Structured Lender Finance) 7 Making it easier to do business with us creates bottom line impact Enhancing Customer Experiences Through Human Digitization P2P payments up 58% in 4Q New online account opening driving sales to digital • Four new online account origination offerings in 2H2020 • “Zero to 20”: 20% of Inspire Accounts opened online after 4Q launch Improving customer journeys 60% of mortgage applications online Using analytics to leverage bankers’ expertise Empowering bankers with advanced commercial analytics Fostering innovative thinking and utilizing partnerships Shifting the mindset – thinking BIG Expanding partnerships to expand products and servicing functionality $20MM+ in new revenue run rate by YE 2021 $20MM+ in new revenue run rate by YE 2022 • Next Best Solution • Retention • Automated risk management Automating connection points through always on customer contact journeys: next best solution, retention, digital engagement focus Deploying new ways to work through innovation team and agile development, starting with modernizing the core Remote deposit enhancements; 23.5% increase in remote deposit volume in 2020 New commercial platform including mobile banking Migrating to digital document delivery Automated brokerage account opening Digital account opening and streamlining fraud checks in-branch Leveraging advanced retail analytics to drive omni-channel marketing optimization
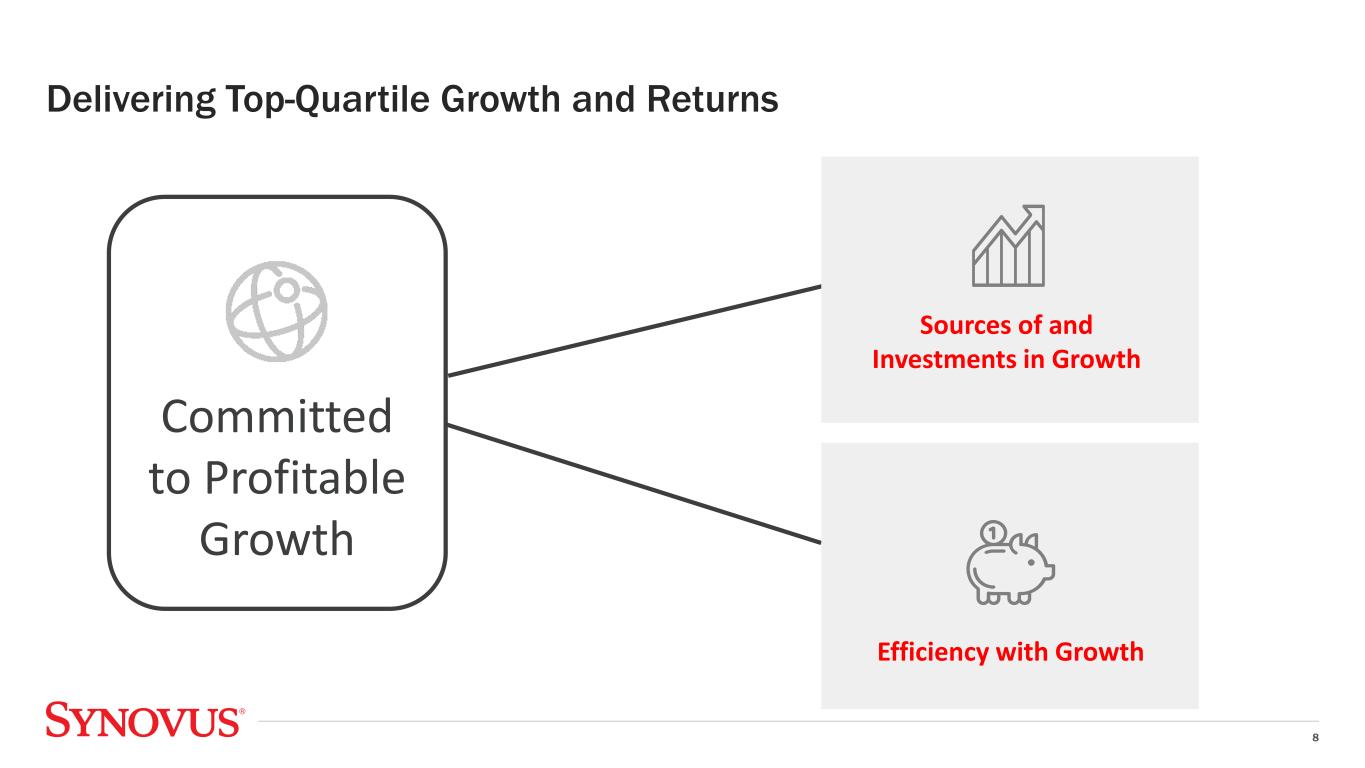
Delivering Top-Quartile Growth and Returns 8 Sources of and Investments in Growth Efficiency with Growth Committed to Profitable Growth
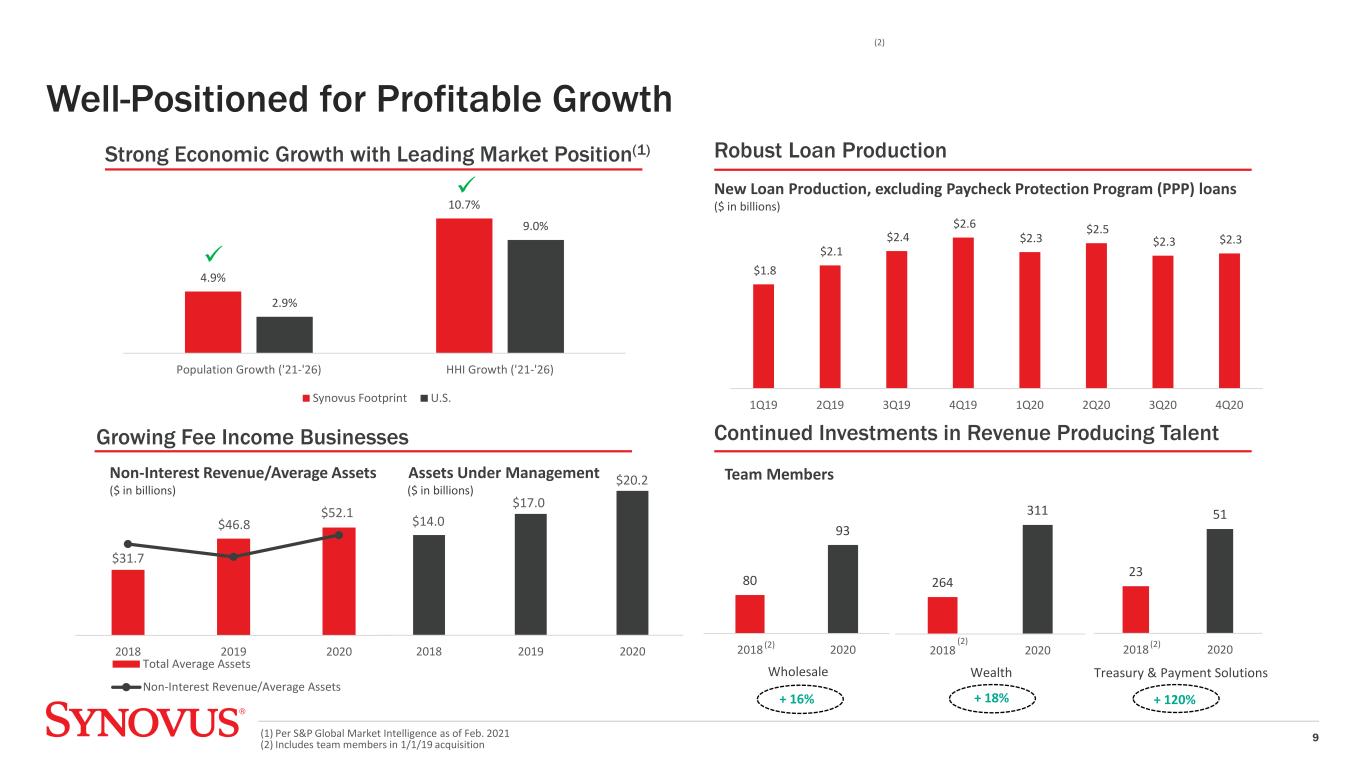
Well-Positioned for Profitable Growth 9 Growing Fee Income Businesses Robust Loan Production Continued Investments in Revenue Producing Talent 2018 2019 2020 Total Average Assets Non-Interest Revenue/Average Assets Non-Interest Revenue/Average Assets ($ in billions) $52.1 $46.8 $31.7 0.97% 0.76% 0.88% 2018 2019 2020 Assets Under Management ($ in billions) $14.0 $17.0 $20.2 + 120% Strong Economic Growth with Leading Market Position(1) 80 93 2018 2020 New Loan Production, excluding Paycheck Protection Program (PPP) loans ($ in billions) $1.8 $2.1 $2.4 $2.6 $2.3 $2.5 $2.3 $2.3 1Q19 2Q19 3Q19 4Q19 1Q20 2Q20 3Q20 4Q20 264 311 2018 2020 23 51 2018 2020 Team Members Wealth Treasury & Payment SolutionsWholesale + 18%+ 16% (1) Per S&P Global Market Intelligence as of Feb. 2021 (2) Includes team members in 1/1/19 acquisition (2) (2) (2) (2) 4.9% 10.7% 2.9% 9.0% Population Growth ('21-'26) HHI Growth ('21-'26) Synovus Footprint U.S.

Committed to Expense Discipline 10 (2) (1) Non-GAAP financial measure; See appendix for applicable reconciliation (2) Source: S&P Global Market Intelligence; Peers include HBAN, BKU, NYCB, ASB, RF, FHN, BPOP, MTB, PBCT, FNB, ZION, HWC, CMA, CFR, and BOKF (3) Includes team members in 1/1/19 acquisition Efficiency Ratio Trend Achieve sustainable, top-quartile performance 64.4% 60.0% 58.0% 56.2% 58.3% 62.7% 59.9% 56.3% 51.8% 55.7% 50.0 52.0 54.0 56.0 58.0 60.0 62.0 64.0 66.0 68.0 70.0 2016 2017 2018 2019 2020 Efficiency Ratio - FTE Adjusted Efficiency Ratio Top Quartile - Adjusted Efficiency Ratio (1) Run-rate benefit realization (pre-tax income) By the end of 2021: Organizational efficiency $30M+ pre-tax benefit Voluntary retirement program with earn back of <2 years and savings of ~$7-8 million Back-Office efficiency Third-party spend $25M pre-tax benefit Branch/real estate optimization $12M pre-tax benefit 13 branch closures in 2020 with additional corporate real estate consolidation in 2021 By the end of 2022: Additional $25M pre-tax benefit with continued execution Team Members -2% decline since 2018 (3) 5,367 5,247 2018 2020
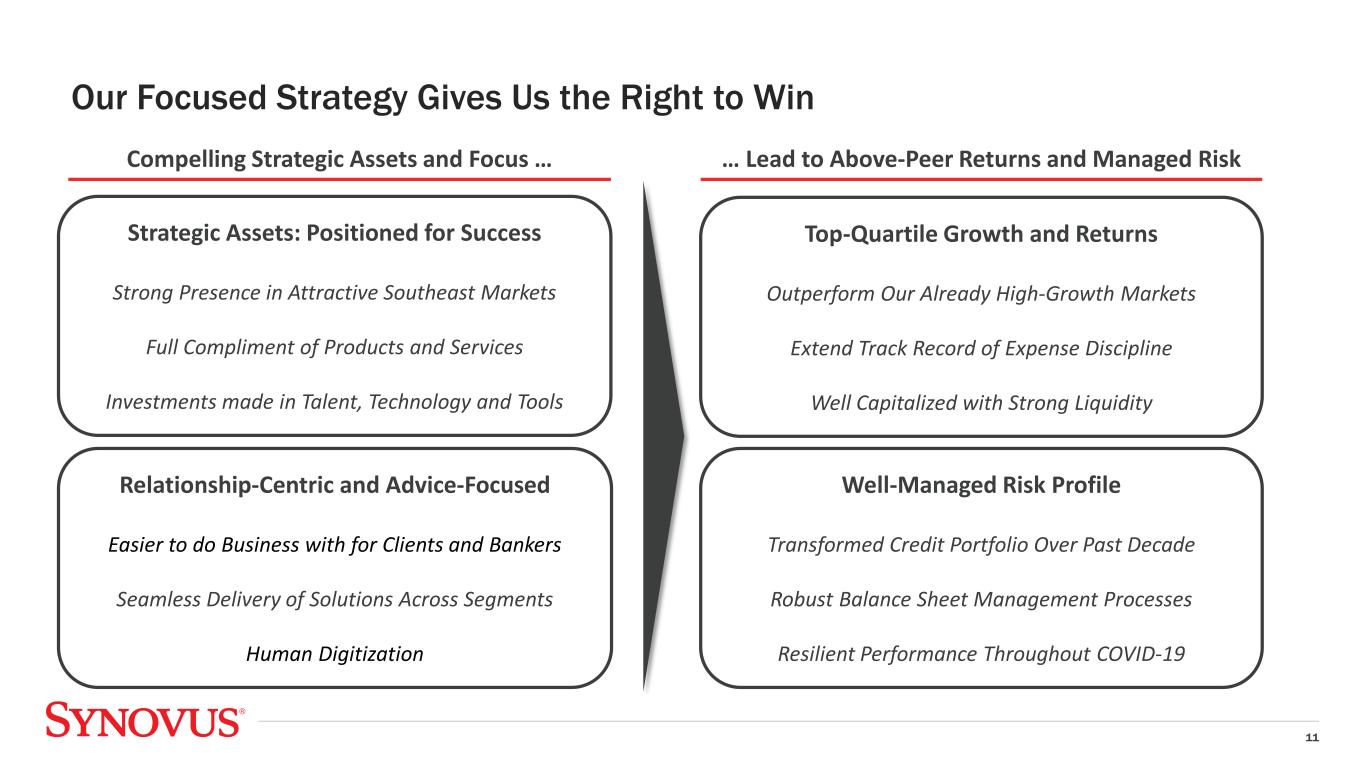
11 Our Focused Strategy Gives Us the Right to Win Compelling Strategic Assets and Focus … … Lead to Above-Peer Returns and Managed Risk Strategic Assets: Positioned for Success Strong Presence in Attractive Southeast Markets Full Compliment of Products and Services Investments made in Talent, Technology and Tools Relationship-Centric and Advice-Focused Easier to do Business with for Clients and Bankers Seamless Delivery of Solutions Across Segments Human Digitization Top-Quartile Growth and Returns Outperform Our Already High-Growth Markets Extend Track Record of Expense Discipline Well Capitalized with Strong Liquidity Well-Managed Risk Profile Transformed Credit Portfolio Over Past Decade Robust Balance Sheet Management Processes Resilient Performance Throughout COVID-19

Appendix
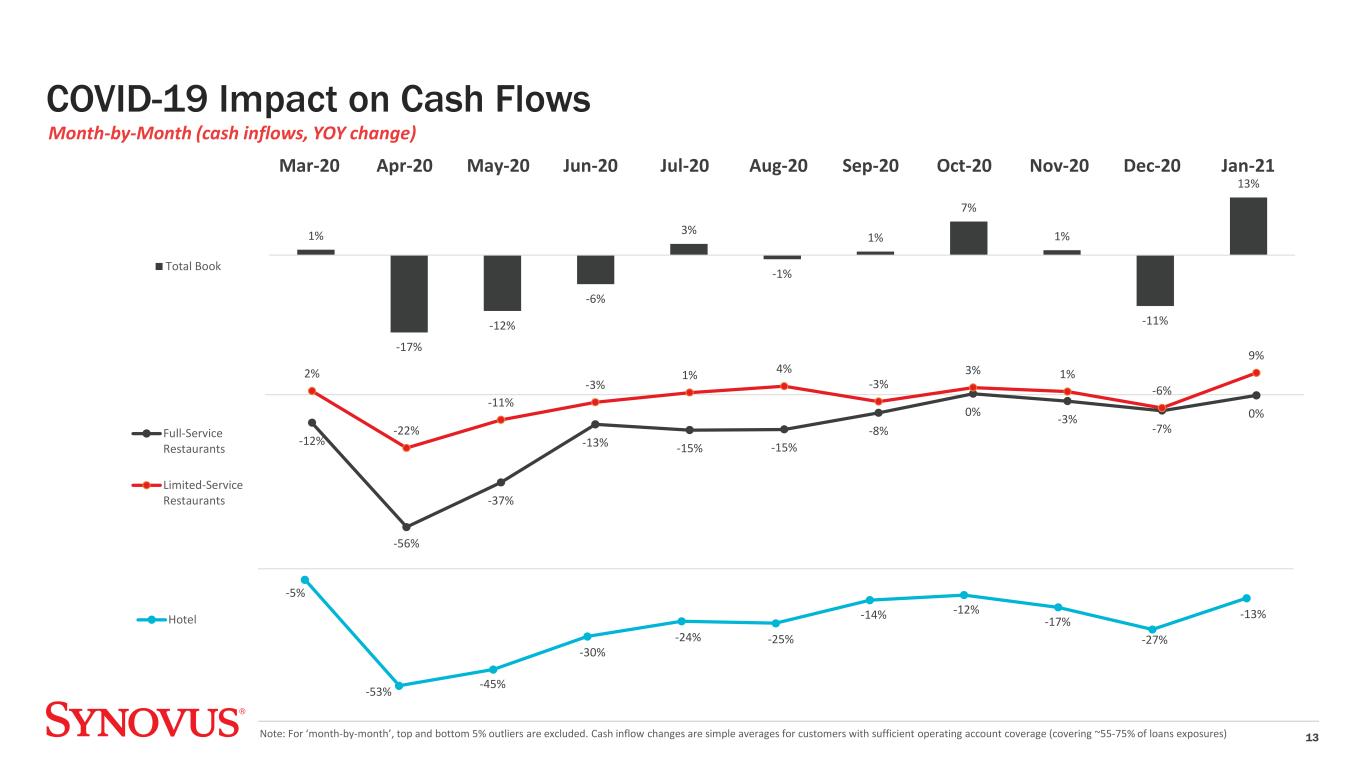
COVID-19 Impact on Cash Flows 13Note: For ‘month-by-month’, top and bottom 5% outliers are excluded. Cash inflow changes are simple averages for customers with sufficient operating account coverage (covering ~55-75% of loans exposures) 1% -17% -12% -6% 3% -1% 1% 7% 1% -11% 13% Total Book -12% -56% -37% -13% -15% -15% -8% 0% -3% -7% 0% 2% -22% -11% -3% 1% 4% -3% 3% 1% -6% 9% Full-Service Restaurants Limited-Service Restaurants -5% -53% -45% -30% -24% -25% -14% -12% -17% -27% -13%Hotel Month-by-Month (cash inflows, YOY change) Mar-20 Apr-20 May-20 Jun-20 Jul-20 Aug-20 Sep-20 Oct-20 Nov-20 Dec-20 Jan-21
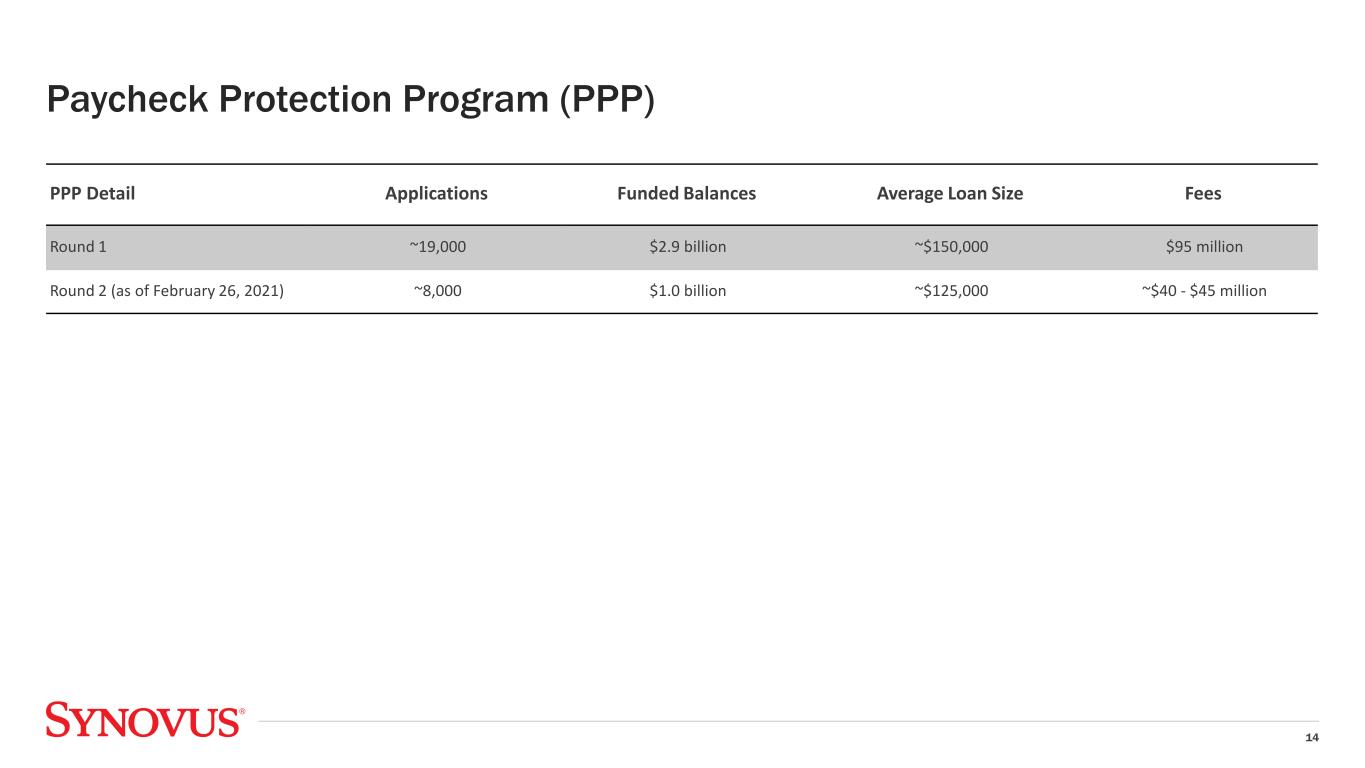
14 Paycheck Protection Program (PPP) PPP Detail Applications Funded Balances Average Loan Size Fees Round 1 ~19,000 $2.9 billion ~$150,000 $95 million Round 2 (as of February 26, 2021) ~8,000 $1.0 billion ~$125,000 ~$40 - $45 million
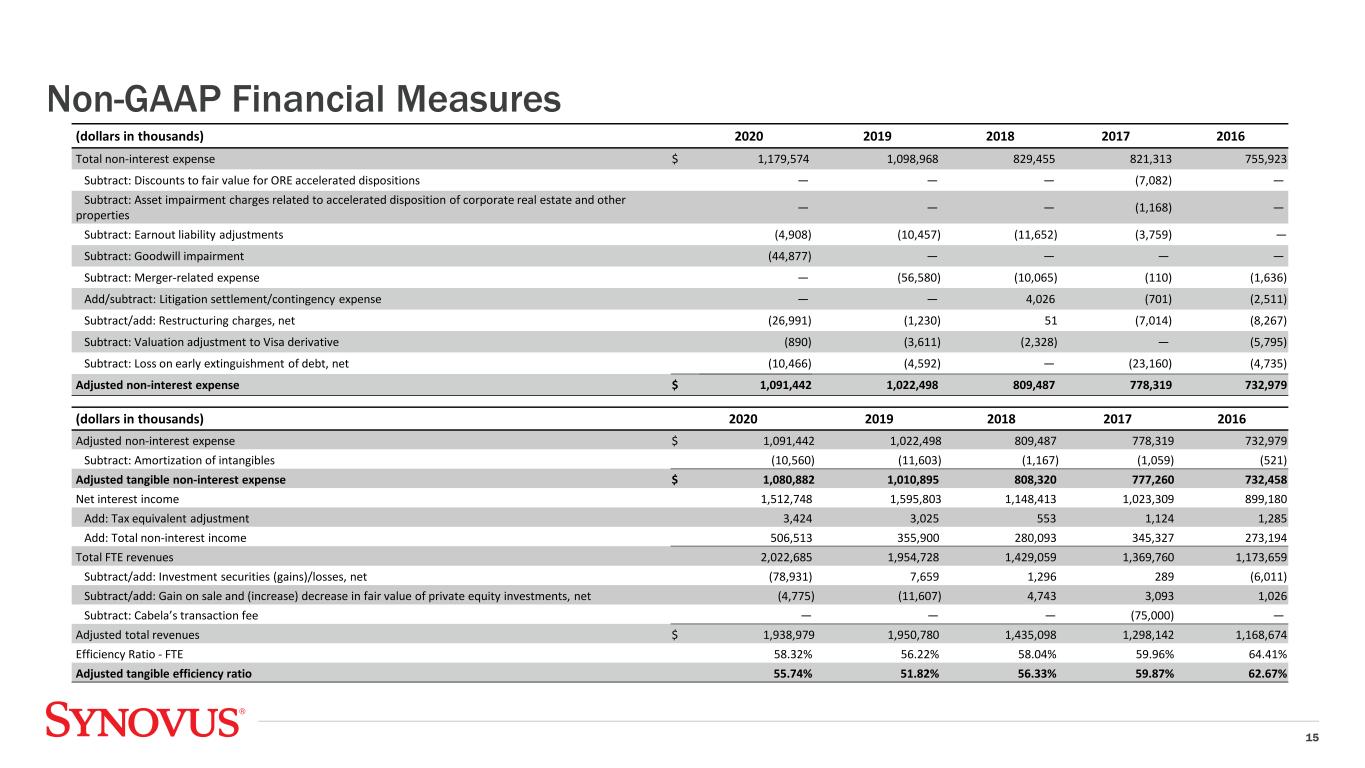
Non-GAAP Financial Measures 15 (dollars in thousands) 2020 2019 2018 2017 2016 Total non-interest expense $ 1,179,574 1,098,968 829,455 821,313 755,923 Subtract: Discounts to fair value for ORE accelerated dispositions — — — (7,082) — Subtract: Asset impairment charges related to accelerated disposition of corporate real estate and other properties — — — (1,168) — Subtract: Earnout liability adjustments (4,908) (10,457) (11,652) (3,759) — Subtract: Goodwill impairment (44,877) — — — — Subtract: Merger-related expense — (56,580) (10,065) (110) (1,636) Add/subtract: Litigation settlement/contingency expense — — 4,026 (701) (2,511) Subtract/add: Restructuring charges, net (26,991) (1,230) 51 (7,014) (8,267) Subtract: Valuation adjustment to Visa derivative (890) (3,611) (2,328) — (5,795) Subtract: Loss on early extinguishment of debt, net (10,466) (4,592) — (23,160) (4,735) Adjusted non-interest expense $ 1,091,442 1,022,498 809,487 778,319 732,979 (dollars in thousands) 2020 2019 2018 2017 2016 Adjusted non-interest expense $ 1,091,442 1,022,498 809,487 778,319 732,979 Subtract: Amortization of intangibles (10,560) (11,603) (1,167) (1,059) (521) Adjusted tangible non-interest expense $ 1,080,882 1,010,895 808,320 777,260 732,458 Net interest income 1,512,748 1,595,803 1,148,413 1,023,309 899,180 Add: Tax equivalent adjustment 3,424 3,025 553 1,124 1,285 Add: Total non-interest income 506,513 355,900 280,093 345,327 273,194 Total FTE revenues 2,022,685 1,954,728 1,429,059 1,369,760 1,173,659 Subtract/add: Investment securities (gains)/losses, net (78,931) 7,659 1,296 289 (6,011) Subtract/add: Gain on sale and (increase) decrease in fair value of private equity investments, net (4,775) (11,607) 4,743 3,093 1,026 Subtract: Cabela’s transaction fee — — — (75,000) — Adjusted total revenues $ 1,938,979 1,950,780 1,435,098 1,298,142 1,168,674 Efficiency Ratio - FTE 58.32% 56.22% 58.04% 59.96% 64.41% Adjusted tangible efficiency ratio 55.74% 51.82% 56.33% 59.87% 62.67%


