Third Quarter 2021 Results October 19, 2021 Exhibit 99.3
Forward-Looking Statements This slide presentation and certain of our other filings with the Securities and Exchange Commission contain statements that constitute "forward-looking statements" within the meaning of, and subject to the protections of, Section 27A of the Securities Act of 1933, as amended, and Section 21E of the Securities Exchange Act of 1934, as amended. All statements other than statements of historical fact are forward-looking statements. You can identify these forward-looking statements through Synovus' use of words such as "believes," "anticipates," "expects," "may," "will," "assumes," "predicts," "could," "should," "would," "intends," "targets," "estimates," "projects," "plans," "potential" and other similar words and expressions of the future or otherwise regarding the outlook for Synovus' future business and financial performance and/or the performance of the banking industry and economy in general. These forward-looking statements include, among others, statements on our expectations related to (1) loan growth and line utilization; (2) deposit costs; (3) net interest income and net interest margin; (4) total adjusted revenue; (5) adjusted non-interest expense; (6) credit trends and key credit performance metrics; (7) effective tax rate; (8) capital position; (9) our future operating and financial performance; (10) our strategy and initiatives for future revenue growth, balance sheet management, capital management, expense savings, and technology; and (11) our assumptions underlying these expectations. Prospective investors are cautioned that any such forward-looking statements are not guarantees of future performance and involve known and unknown risks and uncertainties which may cause the actual results, performance or achievements of Synovus to be materially different from the future results, performance or achievements expressed or implied by such forward-looking statements. Forward-looking statements are based on the information known to, and current beliefs and expectations of, Synovus' management and are subject to significant risks and uncertainties. Actual results may differ materially from those contemplated by such forward-looking statements. A number of factors could cause actual results to differ materially from those contemplated by the forward-looking statements in this presentation. Many of these factors are beyond Synovus' ability to control or predict. These forward-looking statements are based upon information presently known to Synovus' management and are inherently subjective, uncertain and subject to change due to any number of risks and uncertainties, including, without limitation, the risks and other factors set forth in Synovus' filings with the Securities and Exchange Commission, including its Annual Report on Form 10-K for the year ended December 31, 2020 under the captions "Cautionary Notice Regarding Forward-Looking Statements" and "Risk Factors" and in Synovus' quarterly reports on Form 10-Q and current reports on Form 8-K. We believe these forward-looking statements are reasonable; however, undue reliance should not be placed on any forward-looking statements, which are based on current expectations and speak only as of the date that they are made. We do not assume any obligation to update any forward-looking statements as a result of new information, future developments or otherwise, except as otherwise may be required by law. Use of Non-GAAP Financial Measures This slide presentation contains certain non-GAAP financial measures determined by methods other than in accordance with generally accepted accounting principles. Such non-GAAP financial measures include the following: adjusted net income available to common shareholders; adjusted diluted earnings per share; adjusted return on average assets; return on average tangible common equity; adjusted return on average tangible common equity; adjusted non- interest revenue; total adjusted revenue; adjusted non-interest expense; adjusted tangible efficiency ratio; pre-provision net revenue, adjusted pre-provision net revenue; and tangible common equity ratio. The most comparable GAAP measures to these measures are net income available to common shareholders; diluted earnings per share; return on average assets; return on average common equity; total non-interest revenue; total TE revenue; total non-interest expense; efficiency ratio-TE; income before income taxes; and total shareholders' equity to total assets ratio, respectively. Management uses these non-GAAP financial measures to assess the performance of Synovus' business and the strength of its capital position. Management believes that these non-GAAP financial measures provide meaningful additional information about Synovus to assist management, investors, and bank regulators in evaluating Synovus' operating results, financial strength, the performance of its business and the strength of its capital position. However, these non-GAAP financial measures have inherent limitations as analytical tools and should not be considered in isolation or as a substitute for analyses of operating results or capital position as reported under GAAP. The non-GAAP financial measures should be considered as additional views of the way our financial measures are affected by significant items and other factors, and since they are not required to be uniformly applied, they may not be comparable to other similarly titled measures at other companies. Adjusted net income available to common shareholders, adjusted diluted earnings per share and adjusted return on average assets are measures used by management to evaluate operating results exclusive of items that are not indicative of ongoing operations and impact period-to-period comparisons. Return on average tangible common equity and adjusted return on average tangible common equity are measures used by management to compare Synovus' performance with other financial institutions because it calculates the return available to common shareholders without the impact of intangible assets and their related amortization, thereby allowing management to evaluate the performance of the business consistently. Adjusted non- interest revenue and total adjusted revenue are measures used by management to evaluate non-interest revenue and total TE revenue exclusive of net investment securities gains (losses), net changes in the fair value of private equity investments, and fair value adjustment on non-qualified deferred compensation. Adjusted non-interest expense and the adjusted tangible efficiency ratio are measures utilized by management to measure the success of expense management initiatives focused on reducing recurring controllable operating costs. Pre-provision net revenue is used by management to evaluate income before income taxes exclusive of (reversal of) provision for credit losses. Adjusted pre-provision net revenue is used by management to evaluate pre-provision net revenue exclusive of items that management believes are not indicative of ongoing operations and impact period-to-period comparisons. The tangible common equity ratio is used by management and bank regulators to assess the strength of our capital position. The computations of the non-GAAP financial measures used in this slide presentation are set forth in the Appendix to this slide presentation. 2
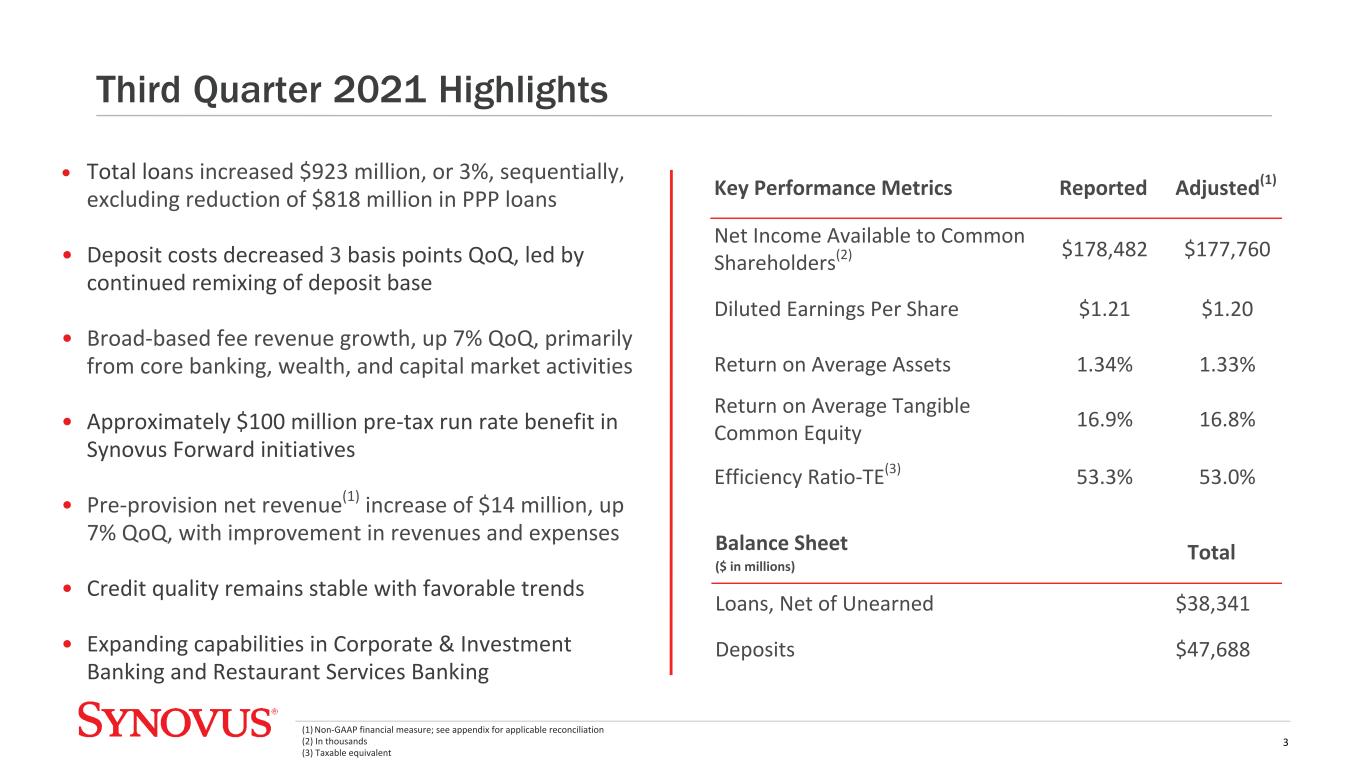
3 (1) Non-GAAP financial measure; see appendix for applicable reconciliation (2) In thousands (3) Taxable equivalent Third Quarter 2021 Highlights • Total loans increased $923 million, or 3%, sequentially, excluding reduction of $818 million in PPP loans • Deposit costs decreased 3 basis points QoQ, led by continued remixing of deposit base • Broad-based fee revenue growth, up 7% QoQ, primarily from core banking, wealth, and capital market activities • Approximately $100 million pre-tax run rate benefit in Synovus Forward initiatives • Pre-provision net revenue(1) increase of $14 million, up 7% QoQ, with improvement in revenues and expenses • Credit quality remains stable with favorable trends • Expanding capabilities in Corporate & Investment Banking and Restaurant Services Banking Key Performance Metrics Reported Adjusted(1) Net Income Available to Common Shareholders(2) $178,482 $177,760 Diluted Earnings Per Share $1.21 $1.20 Return on Average Assets 1.34% 1.33% Return on Average Tangible Common Equity 16.9% 16.8% Efficiency Ratio-TE(3) 53.3% 53.0% Balance Sheet ($ in millions) Total Loans, Net of Unearned $38,341 Deposits $47,688
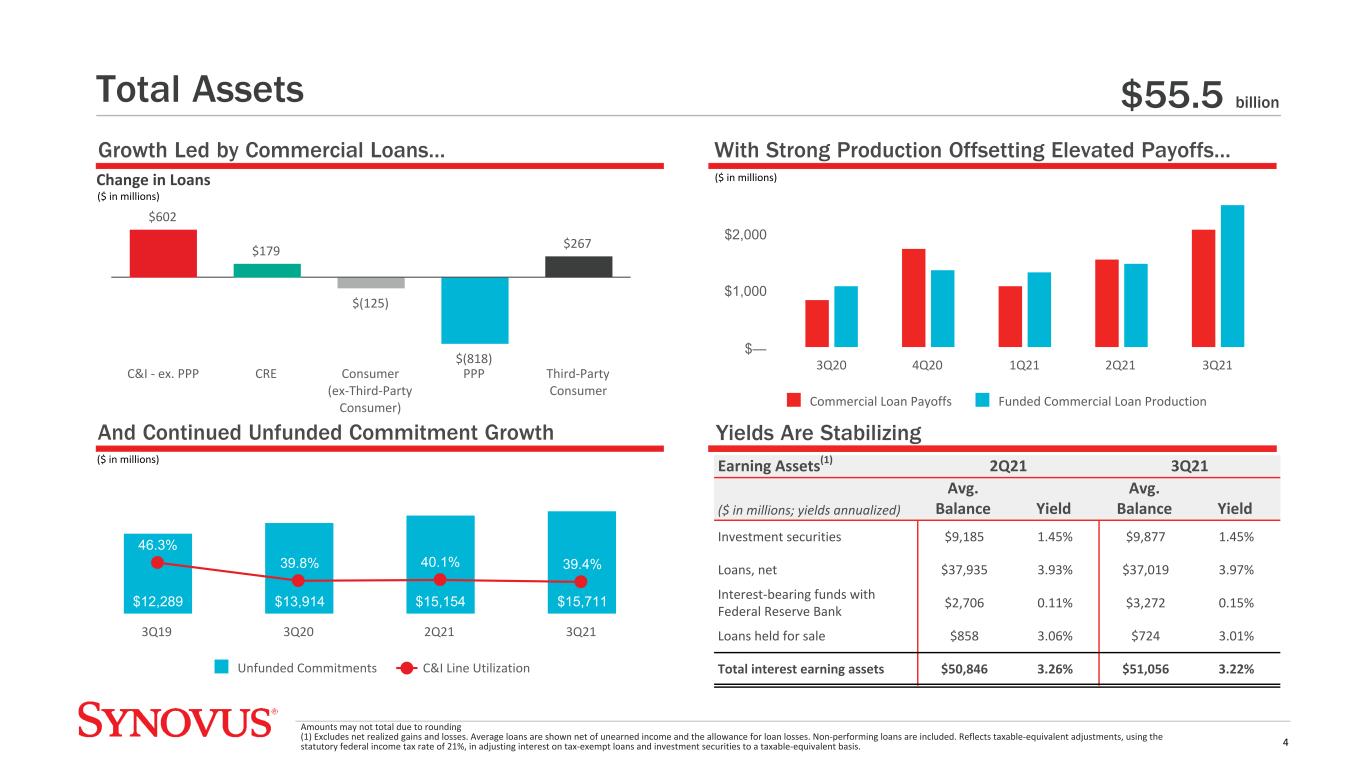
And Continued Unfunded Commitment Growth Growth Led by Commercial Loans... $602 $179 $(125) $(818) $267 C&I - ex. PPP CRE Consumer (ex-Third-Party Consumer) PPP Third-Party Consumer 10.23% 12.25% With Strong Production Offsetting Elevated Payoffs... Change in Loans 4 Earning Assets(1) 2Q21 3Q21 ($ in millions; yields annualized) Avg. Balance Yield Avg. Balance Yield Investment securities $9,185 1.45% $9,877 1.45% Loans, net $37,935 3.93% $37,019 3.97% Interest-bearing funds with Federal Reserve Bank $2,706 0.11% $3,272 0.15% Loans held for sale $858 3.06% $724 3.01% Total interest earning assets $50,846 3.26% $51,056 3.22% Yields Are Stabilizing Amounts may not total due to rounding (1) Excludes net realized gains and losses. Average loans are shown net of unearned income and the allowance for loan losses. Non-performing loans are included. Reflects taxable-equivalent adjustments, using the statutory federal income tax rate of 21%, in adjusting interest on tax-exempt loans and investment securities to a taxable-equivalent basis. ($ in millions) ($ in millions) ($ in millions) $55.5 billionTotal Assets Commercial Loan Payoffs Funded Commercial Loan Production 3Q20 4Q20 1Q21 2Q21 3Q21 $— $1,000 $2,000 $12,289 $13,914 $15,154 $15,711 46.3% 39.8% 40.1% 39.4% Unfunded Commitments C&I Line Utilization 3Q19 3Q20 2Q21 3Q21
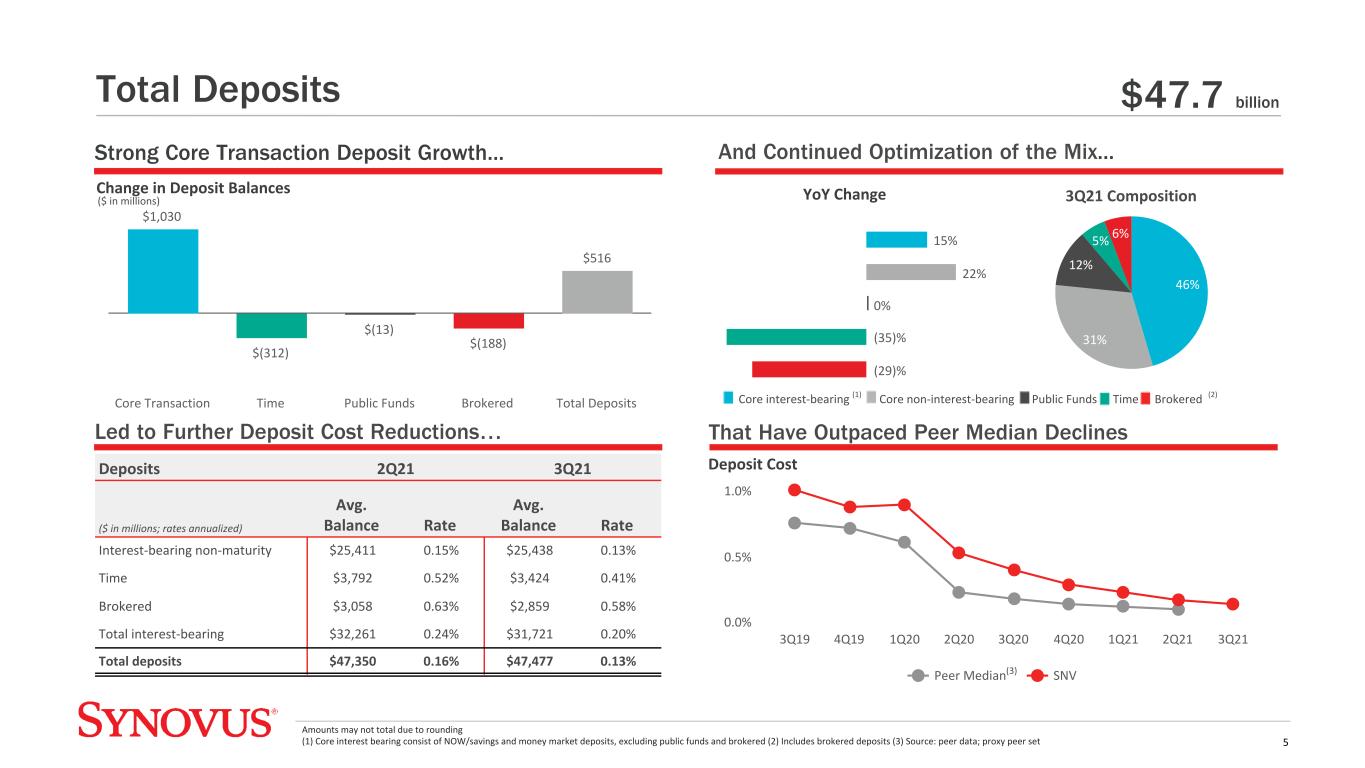
$1,030 $(312) $(13) $(188) $516 Core Transaction Time Public Funds Brokered Total Deposits 10.23% 12.25% Change in Deposit Balances Led to Further Deposit Cost Reductions… And Continued Optimization of the Mix...Strong Core Transaction Deposit Growth... Core Transaction Deposits 3Q21 Composition 46% 31% 12% 5% 6% 5 Deposits 2Q21 3Q21 ($ in millions; rates annualized) Avg. Balance Rate Avg. Balance Rate Interest-bearing non-maturity $25,411 0.15% $25,438 0.13% Time $3,792 0.52% $3,424 0.41% Brokered $3,058 0.63% $2,859 0.58% Total interest-bearing $32,261 0.24% $31,721 0.20% Total deposits $47,350 0.16% $47,477 0.13% That Have Outpaced Peer Median Declines Amounts may not total due to rounding (1) Core interest bearing consist of NOW/savings and money market deposits, excluding public funds and brokered (2) Includes brokered deposits (3) Source: peer data; proxy peer set ($ in millions) $47.7 billionTotal Deposits Core interest-bearing (1) Core non-interest-bearing Public Funds Time Brokered (2) 15% 22% 0% (35)% (29)% YoY Change Peer Median SNV 3Q19 4Q19 1Q20 2Q20 3Q20 4Q20 1Q21 2Q21 3Q21 0.0% 0.5% 1.0% Deposit Cost (3)
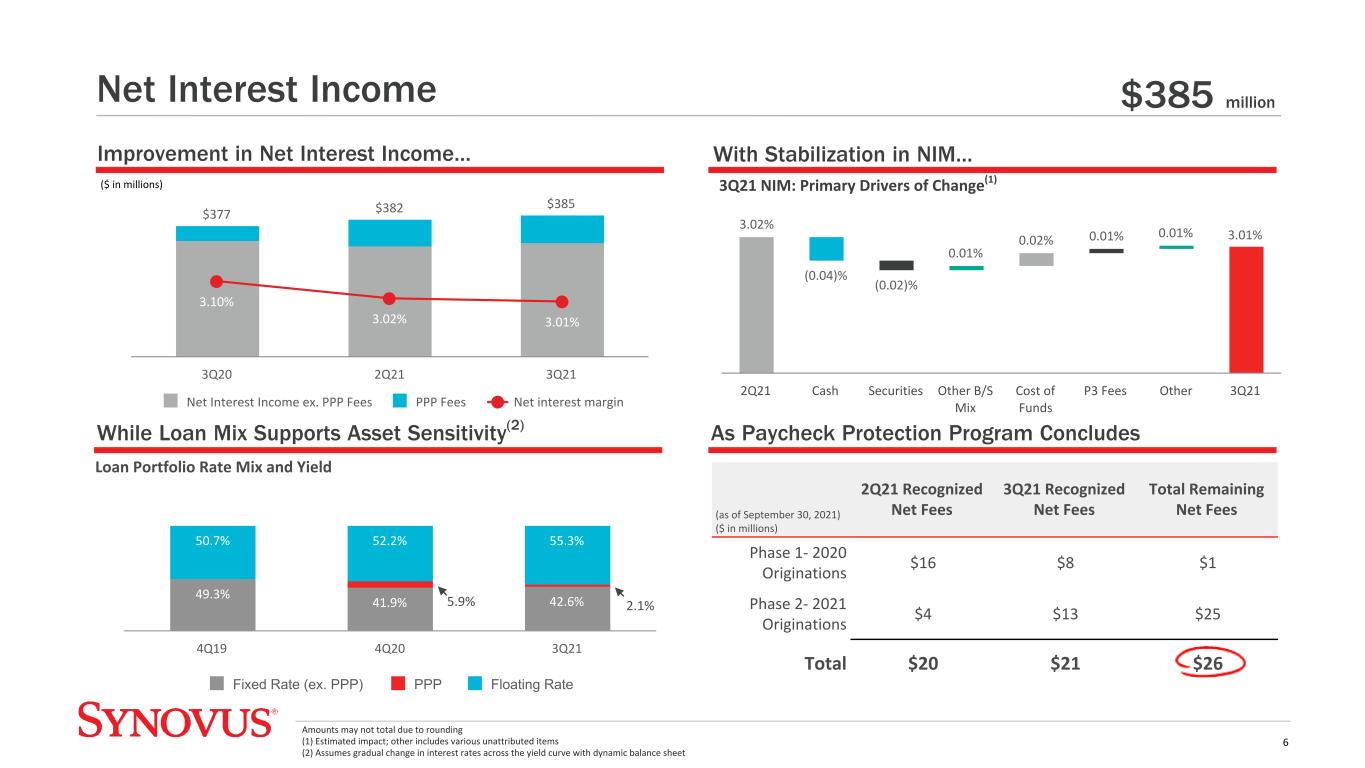
As Paycheck Protection Program Concludes Improvement in Net Interest Income... 3.01% 3.02% (0.04)% (0.02)% 0.01% 0.02% 0.01% 0.01% 2Q21 Cash Securities Other B/S Mix Cost of Funds P3 Fees Other 3Q21 While Loan Mix Supports Asset Sensitivity(2) $377 $382 $385 3.10% 3.02% 3.01% Net Interest Income ex. PPP Fees PPP Fees Net interest margin 3Q20 2Q21 3Q21 6 With Stabilization in NIM... (as of September 30, 2021) ($ in millions) 2Q21 Recognized Net Fees 3Q21 Recognized Net Fees Total Remaining Net Fees Phase 1- 2020 Originations $16 $8 $1 Phase 2- 2021 Originations $4 $13 $25 Total $20 $21 $26 3Q21 NIM: Primary Drivers of Change(1) Amounts may not total due to rounding (1) Estimated impact; other includes various unattributed items (2) Assumes gradual change in interest rates across the yield curve with dynamic balance sheet ($ in millions) $385 millionNet Interest Income 49.3% 41.9% 42.6% 50.7% 52.2% 55.3% Fixed Rate (ex. PPP) PPP Floating Rate 4Q19 4Q20 3Q21 5.9% 2.1% Loan Portfolio Rate Mix and Yield
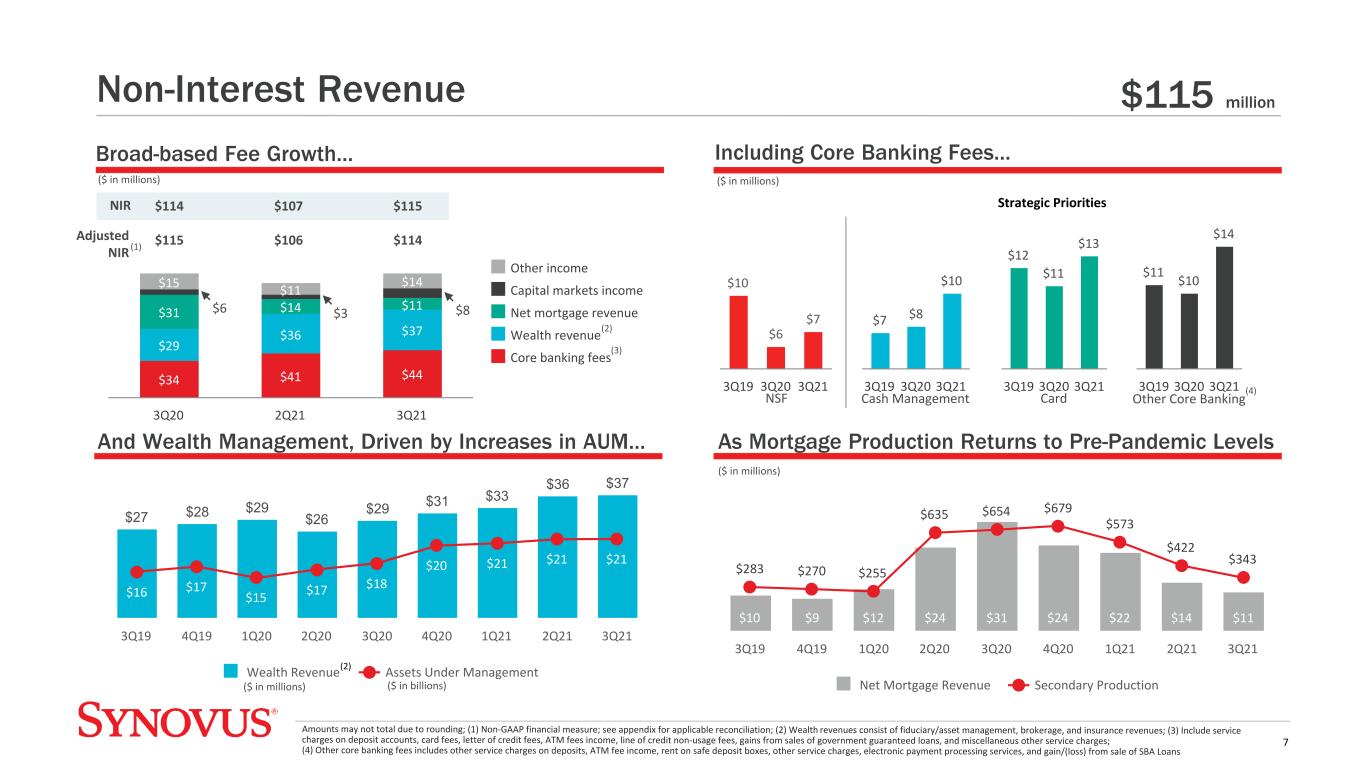
$34 $41 $44 $29 $36 $37 $31 $14 $11 $15 $11 $14 Other income Capital markets income Net mortgage revenue Wealth revenue Core banking fees 3Q20 2Q21 3Q21 Including Core Banking Fees... As Mortgage Production Returns to Pre-Pandemic Levels $10 $9 $12 $24 $31 $24 $22 $14 $11 $283 $270 $255 $635 $654 $679 $573 $422 $343 Net Mortgage Revenue Secondary Production 3Q19 4Q19 1Q20 2Q20 3Q20 4Q20 1Q21 2Q21 3Q21 7 And Wealth Management, Driven by Increases in AUM... Broad-based Fee Growth... Amounts may not total due to rounding; (1) Non-GAAP financial measure; see appendix for applicable reconciliation; (2) Wealth revenues consist of fiduciary/asset management, brokerage, and insurance revenues; (3) Include service charges on deposit accounts, card fees, letter of credit fees, ATM fees income, line of credit non-usage fees, gains from sales of government guaranteed loans, and miscellaneous other service charges; (4) Other core banking fees includes other service charges on deposits, ATM fee income, rent on safe deposit boxes, other service charges, electronic payment processing services, and gain/(loss) from sale of SBA Loans NIR ($ in millions) ($ in millions) $114 $115 $107 $106 $115 $114 $3$6 (2) (3) $115 million Adjusted NIR (1) Non-Interest Revenue $27 $28 $29 $26 $29 $31 $33 $36 $37 $16 $17 $15 $17 $18 $20 $21 $21 $21 Wealth Revenue Assets Under Management 3Q19 4Q19 1Q20 2Q20 3Q20 4Q20 1Q21 2Q21 3Q21 $10 $6 $7 3Q19 3Q20 3Q21 NSF $7 $8 $10 3Q19 3Q20 3Q21 Cash Management $12 $11 $13 3Q19 3Q20 3Q21 Card $11 $10 $14 3Q19 3Q20 3Q21 Other Core Banking 36% ($ in millions) $8 (4) ($ in millions) Strategic Priorities (2) ($ in billions)
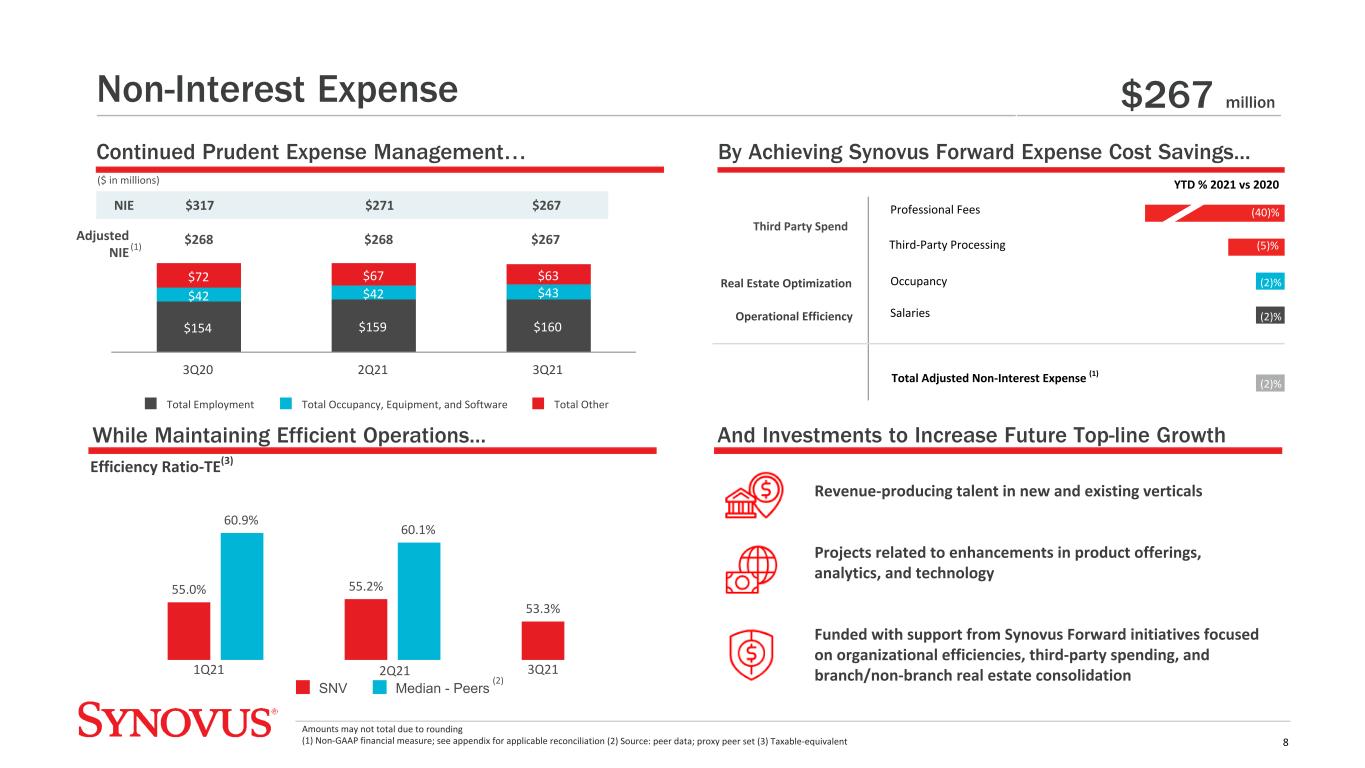
NIE $317 $271 $267 $268 $268 $267 8 $154 $159 $160 $42 $42 $43 $72 $67 $63 Total Employment Total Occupancy, Equipment, and Software Total Other 3Q20 2Q21 3Q21 While Maintaining Efficient Operations... Continued Prudent Expense Management… By Achieving Synovus Forward Expense Cost Savings... Amounts may not total due to rounding (1) Non-GAAP financial measure; see appendix for applicable reconciliation (2) Source: peer data; proxy peer set (3) Taxable-equivalent ($ in millions) 55.0% 55.2% 53.3% 60.9% 60.1% SNV Median - Peers And Investments to Increase Future Top-line Growth Non-Interest Expense (2) Efficiency Ratio-TE(3) 1Q21 2Q21 (15)% $267 million Adjusted NIE (1) 3Q21 (2)% (2)% (2)% Real Estate Optimization Operational Efficiency (5)% Total Adjusted Non-Interest Expense (1) Third-Party Processing Salaries Occupancy YTD % 2021 vs 2020 Revenue-producing talent in new and existing verticals Projects related to enhancements in product offerings, analytics, and technology Funded with support from Synovus Forward initiatives focused on organizational efficiencies, third-party spending, and branch/non-branch real estate consolidation Professional Fees Third Party Spend (40)%
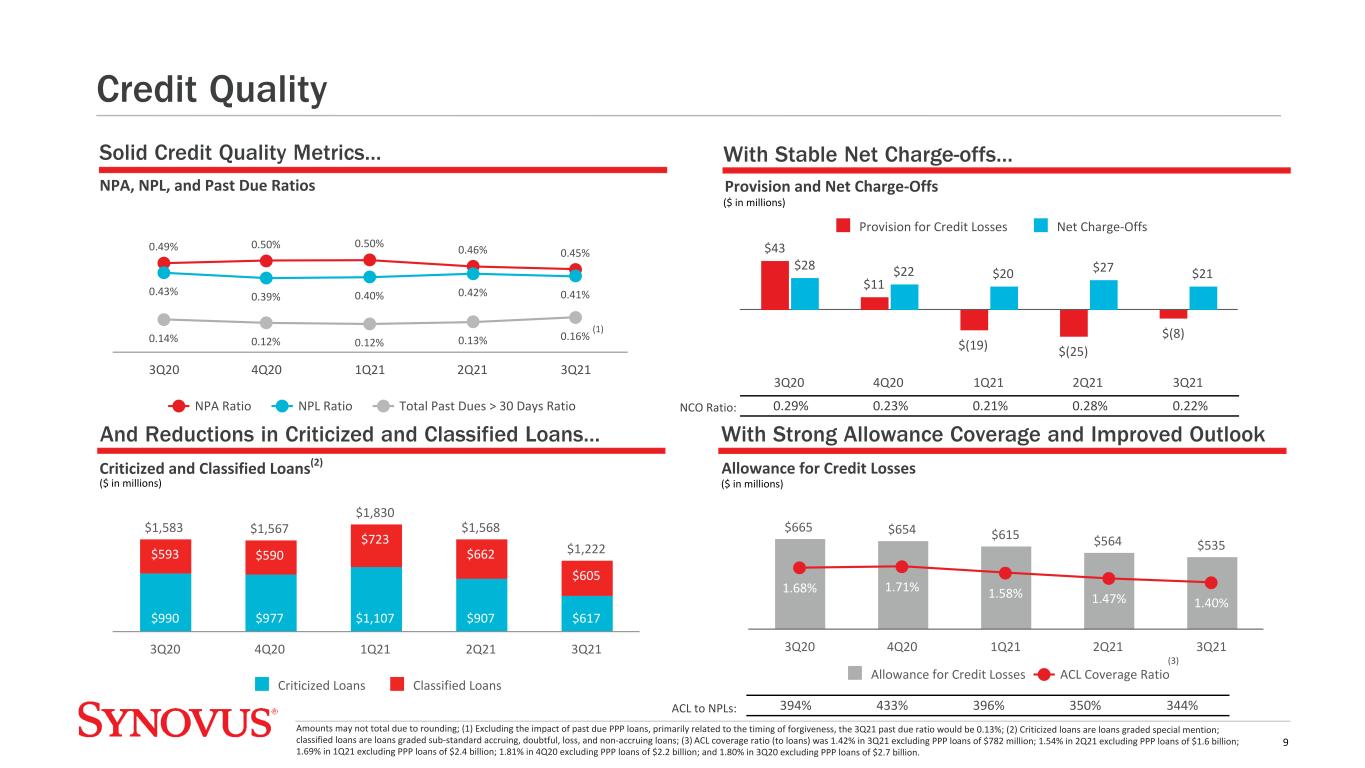
0.49% 0.50% 0.50% 0.46% 0.45% 0.43% 0.39% 0.40% 0.42% 0.41% 0.14% 0.12% 0.12% 0.13% 0.16% NPA Ratio NPL Ratio Total Past Dues > 30 Days Ratio 3Q20 4Q20 1Q21 2Q21 3Q21 With Strong Allowance Coverage and Improved OutlookAnd Reductions in Criticized and Classified Loans... Provision and Net Charge-Offs 9 $43 $11 $(19) $(25) $(8) $28 $22 $20 $27 $21 Provision for Credit Losses Net Charge-Offs 3Q20 4Q20 1Q21 2Q21 3Q21 $1,583 $1,567 $1,830 $1,568 $1,222 $990 $977 $1,107 $907 $617 $593 $590 $723 $662 $605 Criticized Loans Classified Loans 3Q20 4Q20 1Q21 2Q21 3Q21 $665 $654 $615 $564 $535 1.68% 1.71% 1.58% 1.47% 1.40% Allowance for Credit Losses ACL Coverage Ratio 3Q20 4Q20 1Q21 2Q21 3Q21 Allowance for Credit Losses NPA, NPL, and Past Due Ratios Criticized and Classified Loans(2) Solid Credit Quality Metrics... With Stable Net Charge-offs... Amounts may not total due to rounding; (1) Excluding the impact of past due PPP loans, primarily related to the timing of forgiveness, the 3Q21 past due ratio would be 0.13%; (2) Criticized loans are loans graded special mention; classified loans are loans graded sub-standard accruing, doubtful, loss, and non-accruing loans; (3) ACL coverage ratio (to loans) was 1.42% in 3Q21 excluding PPP loans of $782 million; 1.54% in 2Q21 excluding PPP loans of $1.6 billion; 1.69% in 1Q21 excluding PPP loans of $2.4 billion; 1.81% in 4Q20 excluding PPP loans of $2.2 billion; and 1.80% in 3Q20 excluding PPP loans of $2.7 billion. ($ in millions) ($ in millions) ($ in millions) 0.29% 0.23% 0.21% 0.28% 0.22%NCO Ratio: 394% 433% 396% 350% 344%ACL to NPLs: (3) Credit Quality (1)

9.63% 9.75% 0.52% 0.02% (0.04)% (0.32)% (0.13)% (0.17)% Beginning CET1 Ratio (2Q21) PPNR Provision Other (CECL Transition & Taxes) Risk-weighted Assets Dividends Share Repurchases Ending CET1 Ratio (3Q21) Total common shareholder payout of $123 million in 3Q21: • $75 million of share repurchase activity; $33 million of existing 2021 authorization remaining • $49 million common shareholder dividend 9.30% 9.75% 9.63% Common Equity Tier 1 Tier 1 Tier 2 3Q20 2Q21 3Q21 Using Strategic Deployment of Capital and Liquidity... Maintaining Robust Capital Ratios... To Leverage Market and Operating Expertise to Execute Capital Strategy 14% 14% 19% Securities 3Q19 3Q20 3Q21 (% of assets) 4% 1% 3% Third-Party 3Q19 3Q20 3Q21 11.00% 10.83% 13.16% 13.25% 12.96% Amounts may not total due to rounding (1) 3Q21 capital ratios are preliminary 10.57% Capital Ratios1 10
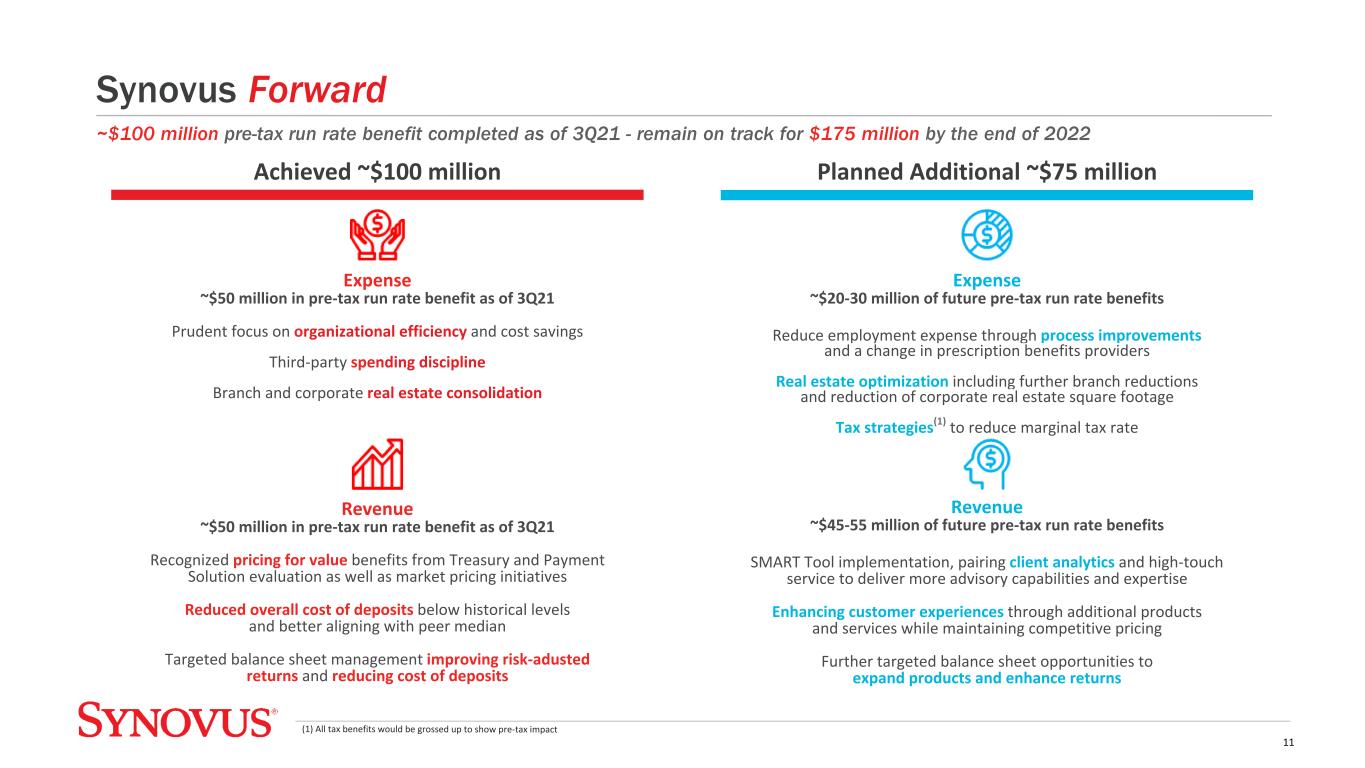
Achieved ~$100 million Planned Additional ~$75 million Revenue ~$50 million in pre-tax run rate benefit as of 3Q21 Recognized pricing for value benefits from Treasury and Payment Solution evaluation as well as market pricing initiatives Reduced overall cost of deposits below historical levels and better aligning with peer median Targeted balance sheet management improving risk-adusted returns and reducing cost of deposits Expense ~$50 million in pre-tax run rate benefit as of 3Q21 Prudent focus on organizational efficiency and cost savings Third-party spending discipline Branch and corporate real estate consolidation Expense ~$20-30 million of future pre-tax run rate benefits Reduce employment expense through process improvements and a change in prescription benefits providers Real estate optimization including further branch reductions and reduction of corporate real estate square footage Tax strategies(1) to reduce marginal tax rate Revenue ~$45-55 million of future pre-tax run rate benefits SMART Tool implementation, pairing client analytics and high-touch service to deliver more advisory capabilities and expertise Enhancing customer experiences through additional products and services while maintaining competitive pricing Further targeted balance sheet opportunities to expand products and enhance returns Synovus Forward ~$100 million pre-tax run rate benefit completed as of 3Q21 - remain on track for $175 million by the end of 2022 11 (1) All tax benefits would be grossed up to show pre-tax impact
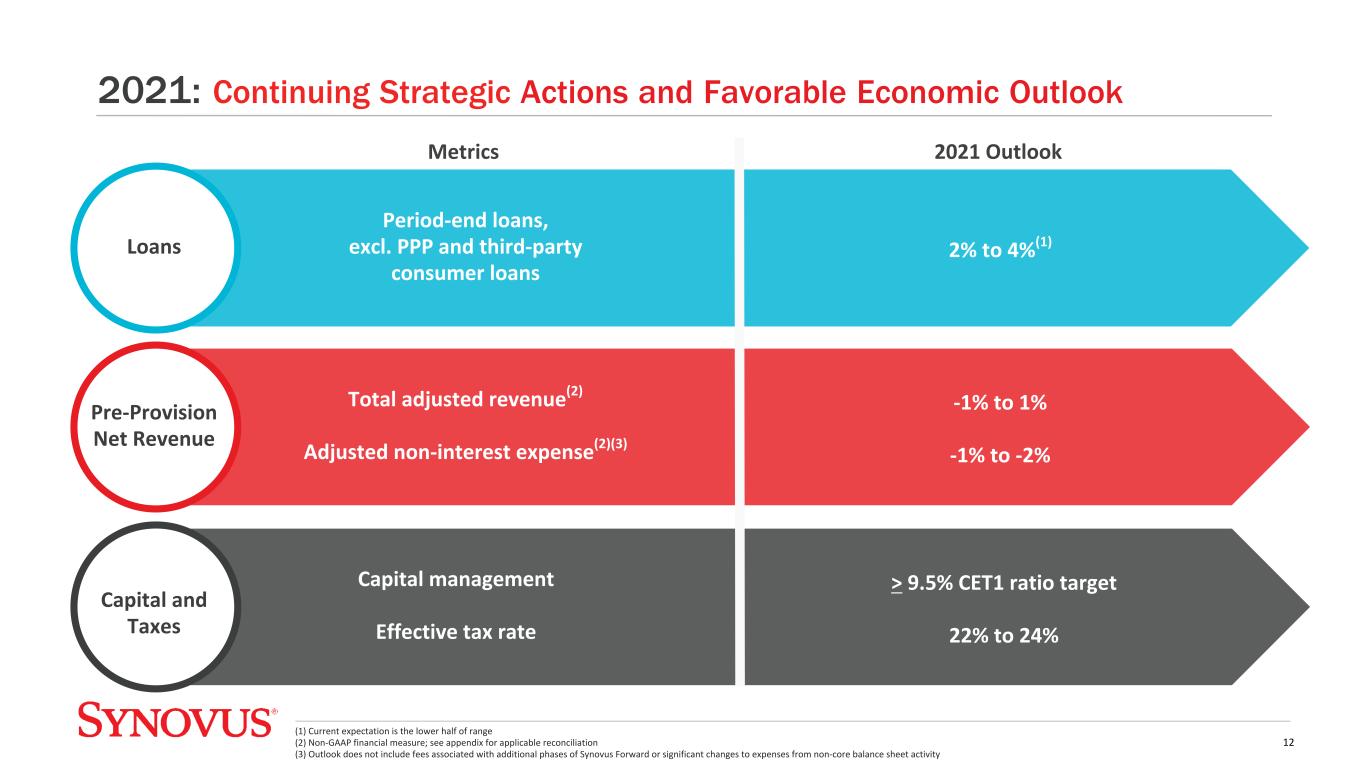
Capital management Effective tax rate Capital and Taxes Loans Pre-Provision Net Revenue Total adjusted revenue(2) Adjusted non-interest expense(2)(3) Metrics Period-end loans, excl. PPP and third-party consumer loans (1) Current expectation is the lower half of range (2) Non-GAAP financial measure; see appendix for applicable reconciliation (3) Outlook does not include fees associated with additional phases of Synovus Forward or significant changes to expenses from non-core balance sheet activity 2021 Outlook 2% to 4%(1) -1% to 1% -1% to -2% > 9.5% CET1 ratio target 22% to 24% 2021: Continuing Strategic Actions and Favorable Economic Outlook 12

Appendix

ACL/Loans: ACL/Loans excl. PPP(2): Key Assumptions 3 1.47% 1.40% 1.54% 1.42% 1 Economic scenario weightings have a 45% downside bias 2 3Baseline includes $3 trillion of stimulus measure impact of Build Back Better Plan 1 Baseline forecast includes unemployment rate decreasing to 4.6% by the end of 2021 (1) (1) Other factors include the impact of dispositions, sub-pool changes, etc. (2) ACL coverage ratio (to loans) was 1.42% in 3Q21 excluding PPP loans of $782 million; 1.54% in 2Q21 excluding PPP loans of $1.6 billion $535,214 $563,598 $(23,355) $(1,296) $(2,642) $(1,091) 2Q21 Performance, Economic Factors, and Net Growth Qualitative Factors Individual Analysis Other Factors 3Q21 Allowance for Credit Losses ($ in thousands) 14

(1) Equals funding less forgiveness, pay-downs/pay-offs, and unearned net fees (as of September 30, 2021) Applications Loan Balances (in million, except count data) Approximate Count Balance Fundings 3Q21 Forgiveness Total Life-to-Date Forgiveness End of Period, Net of Unearned Fees and Costs (1) Phase 1 - 2020 Originations 19,000 $2,958 $2,886 $544 $2,676 $105 Phase 2 - 2021 Originations 11,000 1,135 1,047 295 341 677 Total 30,000 $4,093 $3,933 $839 $3,017 $782 Note: Average balance, net of unearned, of $1.2 billion 3Q21 vs. $2.1 billion 2Q21 (dollars in millions) Total Net Fees Percent of Fundings 3Q21 Recognized Net Fees Total Recognized Net Fees Total Unrecognized or Remaining Net Fees Contractual Maturity Phase 1 - 2020 Originations $94.9 3.3% $7.9 $94.0 $0.9 2 years Phase 2 - 2021 Originations 43.6 4.2% 13.4 18.5 25.1 5 years Total $138.5 3.5% $21.3 $112.5 $26.0 Paycheck Protection Program 15

Total Portfolio Size $7,375 $7,787 $8,755 $9,329 $10,469 2.39% 2.07% 1.40% 1.45% 1.45% Securities Maturities less than one year Yield 3Q20 4Q20 1Q21 2Q21 3Q21 ( 2 ) 1.32% (1) Represents Total Notional outstanding, including both forward and effective period hedges (2) Effective fixed rate represents the weighted average coupon for effective notional positions ( 2 ) 49.5% 47.8% 48.0% 46.3% 44.7% 50.5% 52.2% 52.0% 53.7% 55.3% 3.92% 4.03% 4.02% 3.93% 3.97% Fixed rate Floating rate Yield 3Q20 4Q20 1Q21 2Q21 3Q21 Loan Portfolio Rate Mix and Yield Earning Assets Composition 16 • As of 3Q21, approximately 29% of outstanding variable rate loans had floors which were above the equivalent of 0.25% on overnight rates Derivative Hedge Portfolio $3,600 $3,600 $3,600 $2,600 $1,100 3Q21 4Q21 4Q22 4Q23 4Q24 (1) ($ in millions) $651 • Effective fixed rate of 1.16% as of 3Q21; projected average fixed rate of 1.11% throughout 2022
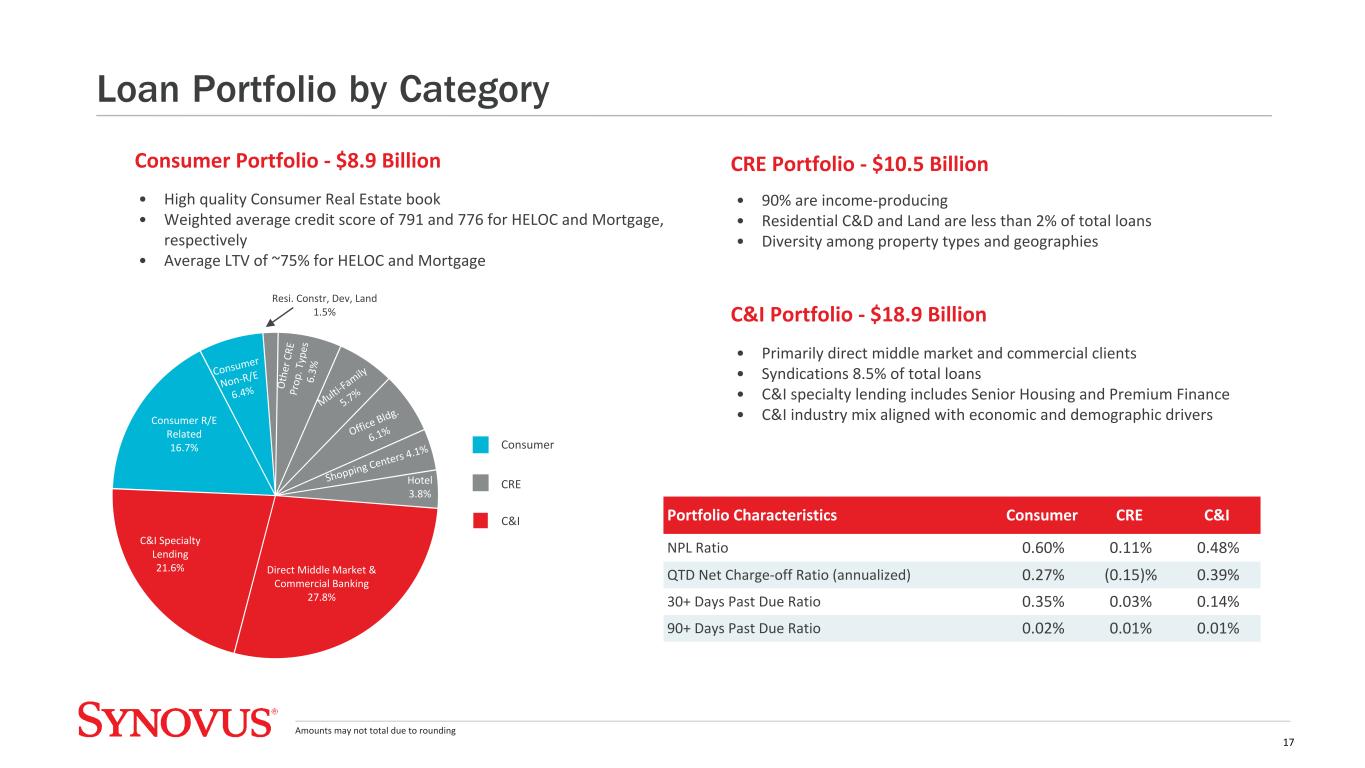
• 90% are income-producing • Residential C&D and Land are less than 2% of total loans • Diversity among property types and geographies • Primarily direct middle market and commercial clients • Syndications 8.5% of total loans • C&I specialty lending includes Senior Housing and Premium Finance • C&I industry mix aligned with economic and demographic drivers • High quality Consumer Real Estate book • Weighted average credit score of 791 and 776 for HELOC and Mortgage, respectively • Average LTV of ~75% for HELOC and Mortgage Consumer Portfolio - $8.9 Billion CRE Portfolio - $10.5 Billion C&I Portfolio - $18.9 Billion Consumer R/E Related 16.7% C&I Specialty Lending 21.6% Direct Middle Market & Commercial Banking 27.8% Hotel 3.8% Shop ping C enter s 4.1% Offi ce B ldg. 6.1% Mu lti- Fam ily 5.7 % O th er C RE Pr op . T yp es 6. 3% Resi. Constr, Dev, Land 1.5% Consumer CRE C&I Amounts may not total due to rounding Portfolio Characteristics Consumer CRE C&I NPL Ratio 0.60% 0.11% 0.48% QTD Net Charge-off Ratio (annualized) 0.27% (0.15)% 0.39% 30+ Days Past Due Ratio 0.35% 0.03% 0.14% 90+ Days Past Due Ratio 0.02% 0.01% 0.01% Loan Portfolio by Category 17 Consu mer Non-R /E 6.4%

Composition of 3Q21 CRE Portfolio Total Portfolio $10.5 billion Office Building Multi-Family Shopping Centers Hotels Other Investment Properties Warehouse 1-4 Family Perm/Mini-Perm Land Acquisition 1-4 Family Construction Residential Development Commercial Development Investment Properties Land, Development, and Residential Properties Portfolio Characteristics (as of September 30, 2021) Office Building Multi-family Shopping Centers Hotels Other Investment Properties Warehouse Residential Properties(1) Development & Land Balance (in millions) $2,341 $2,197 $1,570 $1,411 $1,211 $687 $614 $478 NPL Ratio 0.11% 0.11% 0.06% 0.00% 0.05% 0.04% 0.47% 0.41% Net Charge-off Ratio (annualized) 0.07% 0.03% 0.00% 0.00% (0.06)% (0.74)% (0.21)% (2.08)% 30+ Days Past Due Ratio 0.03% 0.01% 0.01% 0.00% 0.01% 0.00% 0.36% 0.02% 90+ Days Past Due Ratio 0.01% 0.00% 0.00% 0.00% 0.01% 0.00% 0.20% 0.00% Investment Properties portfolio represent 90% of total CRE portfolio • The portfolio is well diversified among the property types • Credit quality in Investment Properties portfolio remains excellent As of 3Q21, Residential C&D and Land Acquisition Portfolios represent less than 2% of total performing loans CRE Credit Quality • 0.11% NPL Ratio • (0.15)% Net Charge-Off Ratio (annualized) • 0.03% 30+ Day Past Due Ratio • 0.01% 90+ Day Past Due Ratio 20.8% 14.9% 13.7% 11.5% 22.2%6.5% 4.0% 1.8% 1.8% 1.8% 1.0% Amounts may not total due to rounding (1) Includes 1-4 Family Construction and 1-4 Family Perm/Mini-Perm (primarily rental homes) Commercial Real Estate 18
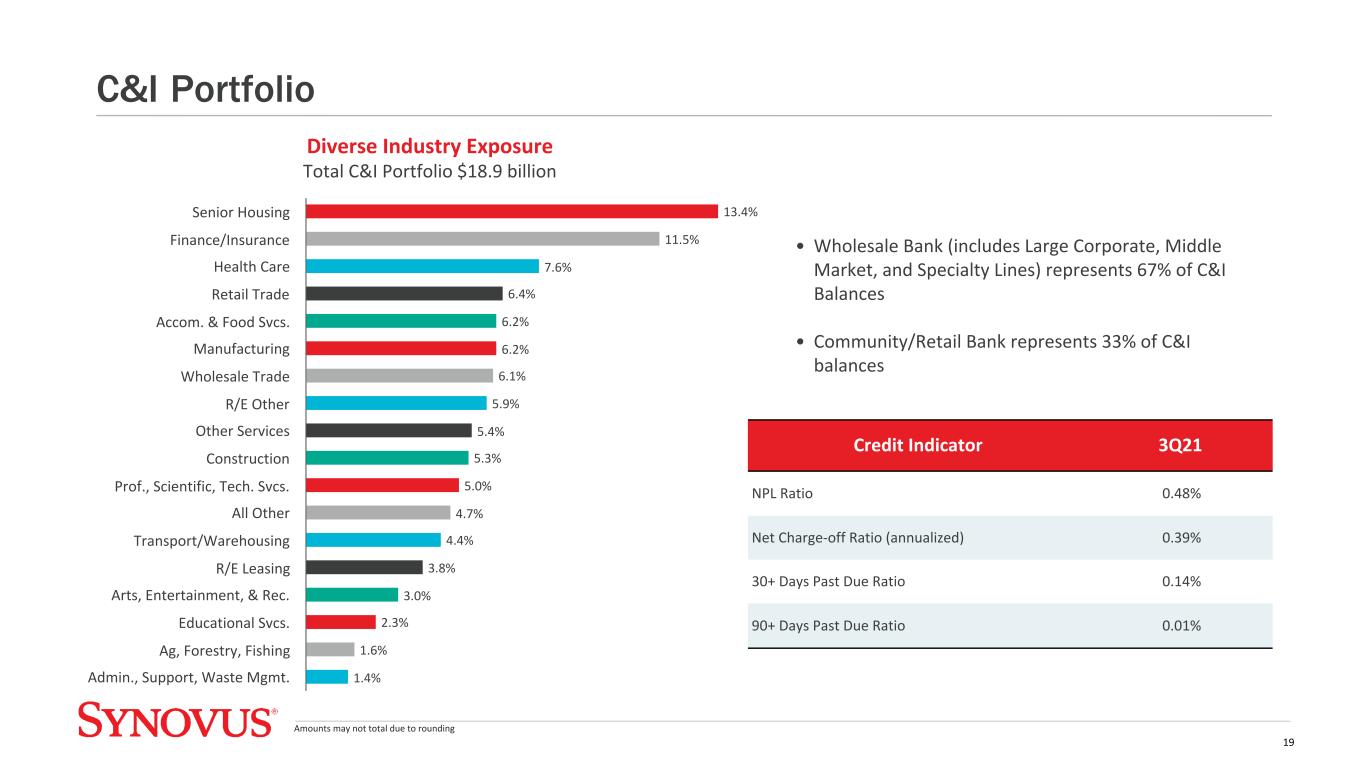
Credit Indicator 3Q21 NPL Ratio 0.48% Net Charge-off Ratio (annualized) 0.39% 30+ Days Past Due Ratio 0.14% 90+ Days Past Due Ratio 0.01% • Wholesale Bank (includes Large Corporate, Middle Market, and Specialty Lines) represents 67% of C&I Balances • Community/Retail Bank represents 33% of C&I balances Diverse Industry Exposure Total C&I Portfolio $18.9 billion 13.4% 11.5% 7.6% 6.4% 6.2% 6.2% 6.1% 5.9% 5.4% 5.3% 5.0% 4.7% 4.4% 3.8% 3.0% 2.3% 1.6% 1.4% Senior Housing Finance/Insurance Health Care Retail Trade Accom. & Food Svcs. Manufacturing Wholesale Trade R/E Other Other Services Construction Prof., Scientific, Tech. Svcs. All Other Transport/Warehousing R/E Leasing Arts, Entertainment, & Rec. Educational Svcs. Ag, Forestry, Fishing Admin., Support, Waste Mgmt. Amounts may not total due to rounding C&I Portfolio 19
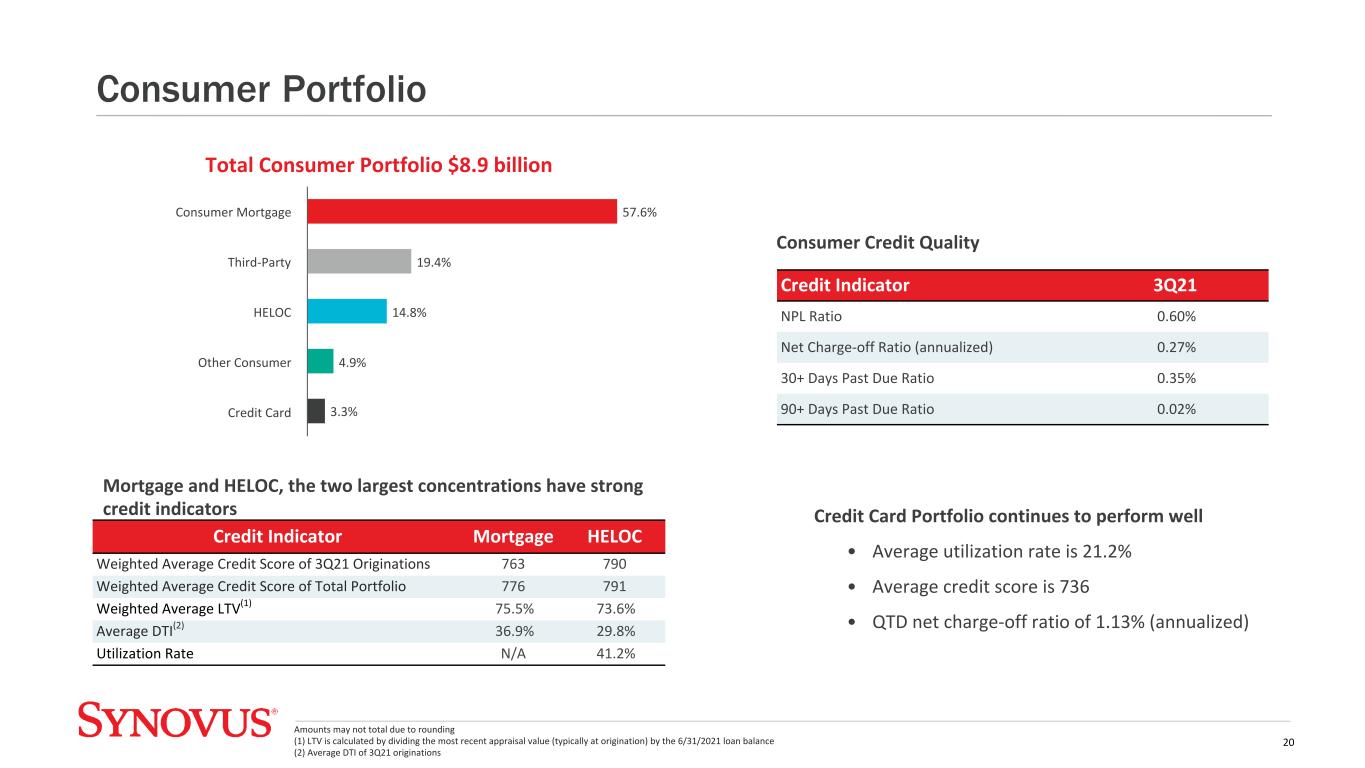
Credit Indicator 3Q21 NPL Ratio 0.60% Net Charge-off Ratio (annualized) 0.27% 30+ Days Past Due Ratio 0.35% 90+ Days Past Due Ratio 0.02% Credit Card Portfolio continues to perform well • Average utilization rate is 21.2% • Average credit score is 736 • QTD net charge-off ratio of 1.13% (annualized) Total Consumer Portfolio $8.9 billion Credit Indicator Mortgage HELOC Weighted Average Credit Score of 3Q21 Originations 763 790 Weighted Average Credit Score of Total Portfolio 776 791 Weighted Average LTV(1) 75.5% 73.6% Average DTI(2) 36.9% 29.8% Utilization Rate N/A 41.2% Mortgage and HELOC, the two largest concentrations have strong credit indicators 57.6% 19.4% 14.8% 4.9% 3.3% Consumer Mortgage Third-Party HELOC Other Consumer Credit Card Amounts may not total due to rounding (1) LTV is calculated by dividing the most recent appraisal value (typically at origination) by the 6/31/2021 loan balance (2) Average DTI of 3Q21 originations Consumer Credit Quality Consumer Portfolio 20
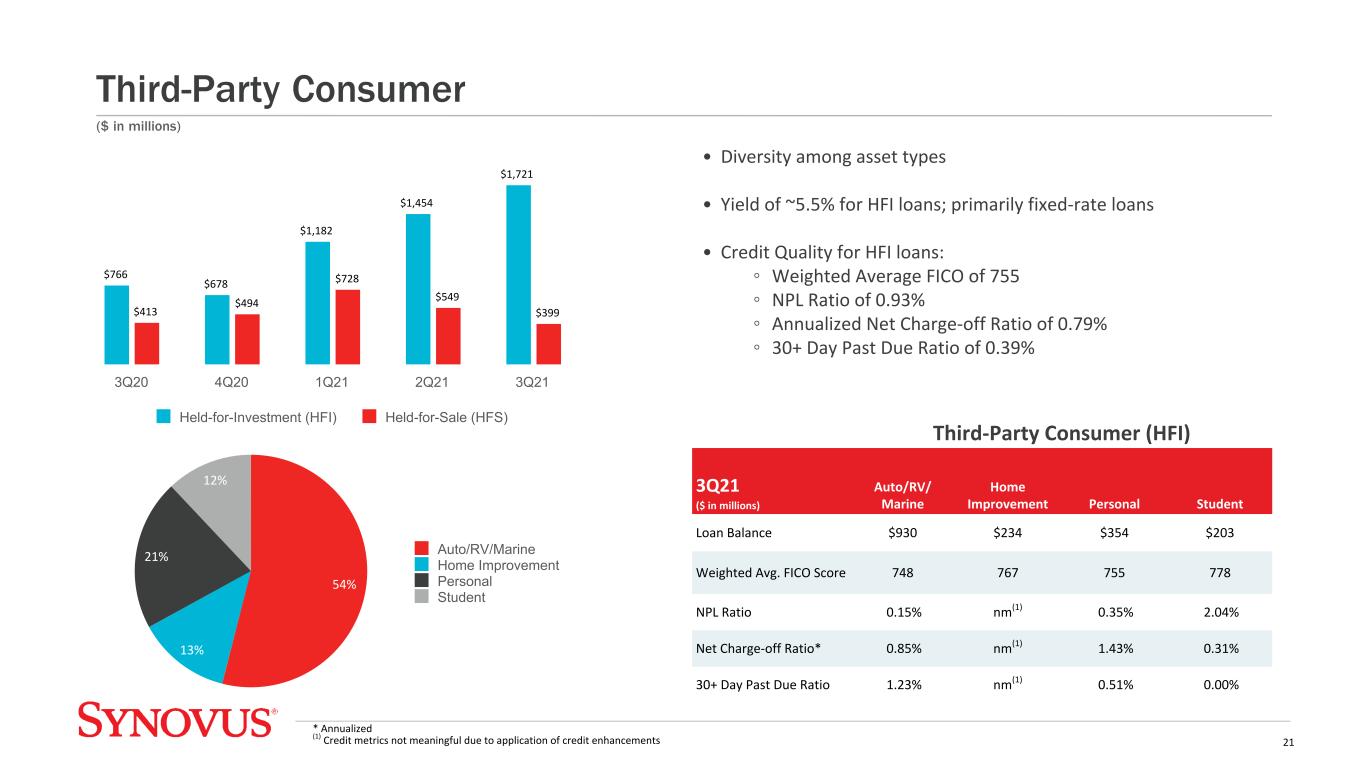
10.23% Core Transaction Deposits $766 $678 $1,182 $1,454 $1,721 $413 $494 $728 $549 $399 Held-for-Investment (HFI) Held-for-Sale (HFS) 3Q20 4Q20 1Q21 2Q21 3Q21 54% 13% 21% 12% Auto/RV/Marine Home Improvement Personal Student Third-Party Consumer (HFI) 3Q21 ($ in millions) Auto/RV/ Marine Home Improvement Personal Student Loan Balance $930 $234 $354 $203 Weighted Avg. FICO Score 748 767 755 778 NPL Ratio 0.15% nm(1) 0.35% 2.04% Net Charge-off Ratio* 0.85% nm(1) 1.43% 0.31% 30+ Day Past Due Ratio 1.23% nm(1) 0.51% 0.00% * Annualized (1) Credit metrics not meaningful due to application of credit enhancements Third-Party Consumer ($ in millions) 21 • Diversity among asset types • Yield of ~5.5% for HFI loans; primarily fixed-rate loans • Credit Quality for HFI loans: ◦ Weighted Average FICO of 755 ◦ NPL Ratio of 0.93% ◦ Annualized Net Charge-off Ratio of 0.79% ◦ 30+ Day Past Due Ratio of 0.39%

Composition Growth Risk Category 3Q21 2Q21 3Q21 vs. 2Q21 Passing Grades $37,119 96.8% $36,668 95.9% $452 Special Mention 617 1.6% 907 2.4% (290) Substandard Accruing 449 1.2% 501 1.3% (51) Non-Performing Loans 155 0.4% 161 0.4% (6) Total Loans $38,341 100% $38,236 100% $105 Amounts may not total due to rounding Portfolio Risk Distribution ($ in millions) 22
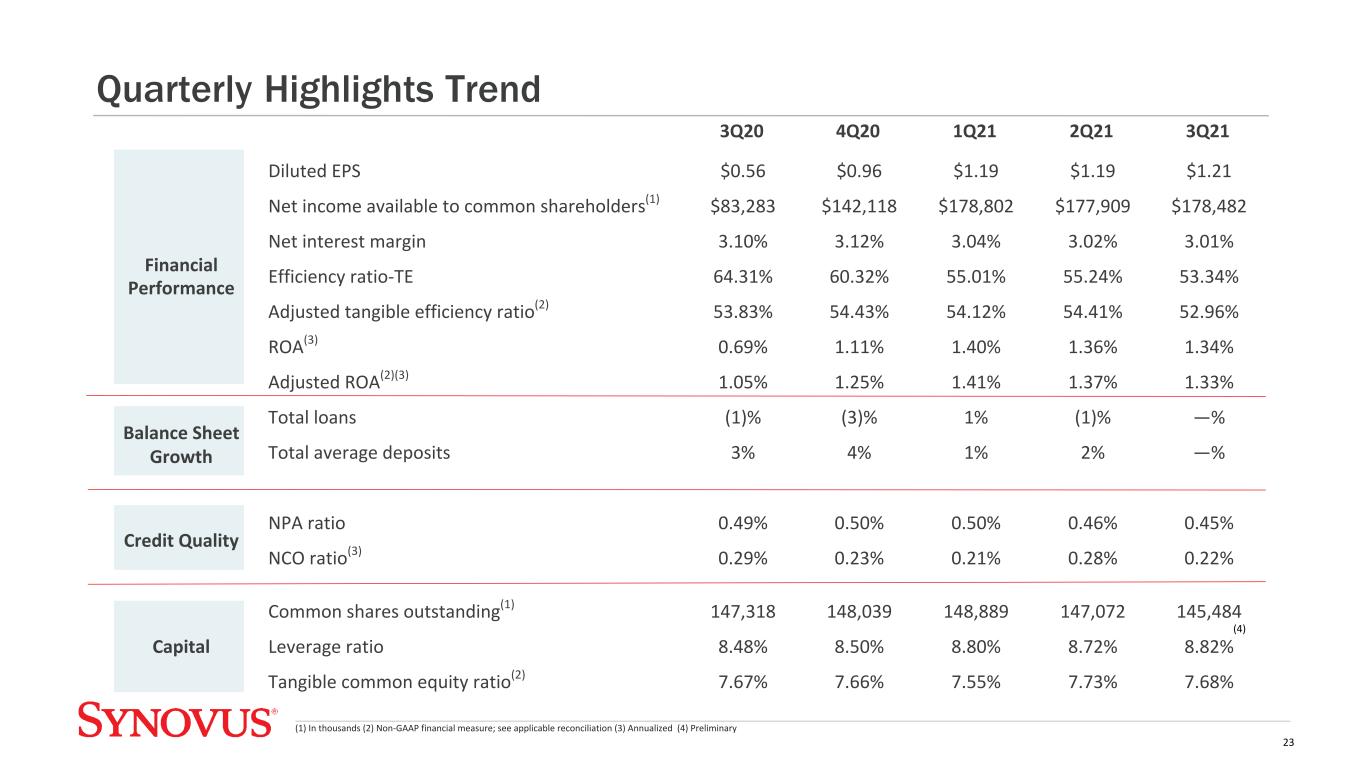
3Q20 4Q20 1Q21 2Q21 3Q21 Financial Performance Diluted EPS $0.56 $0.96 $1.19 $1.19 $1.21 Net income available to common shareholders(1) $83,283 $142,118 $178,802 $177,909 $178,482 Net interest margin 3.10% 3.12% 3.04% 3.02% 3.01% Efficiency ratio-TE 64.31% 60.32% 55.01% 55.24% 53.34% Adjusted tangible efficiency ratio(2) 53.83% 54.43% 54.12% 54.41% 52.96% ROA(3) 0.69% 1.11% 1.40% 1.36% 1.34% Adjusted ROA(2)(3) 1.05% 1.25% 1.41% 1.37% 1.33% Balance Sheet Growth Total loans (1)% (3)% 1% (1)% —% Total average deposits 3% 4% 1% 2% —% Credit Quality NPA ratio 0.49% 0.50% 0.50% 0.46% 0.45% NCO ratio(3) 0.29% 0.23% 0.21% 0.28% 0.22% Capital Common shares outstanding(1) 147,318 148,039 148,889 147,072 145,484 Leverage ratio 8.48% 8.50% 8.80% 8.72% 8.82% Tangible common equity ratio(2) 7.67% 7.66% 7.55% 7.73% 7.68% (1) In thousands (2) Non-GAAP financial measure; see applicable reconciliation (3) Annualized (4) Preliminary (4) Quarterly Highlights Trend 23
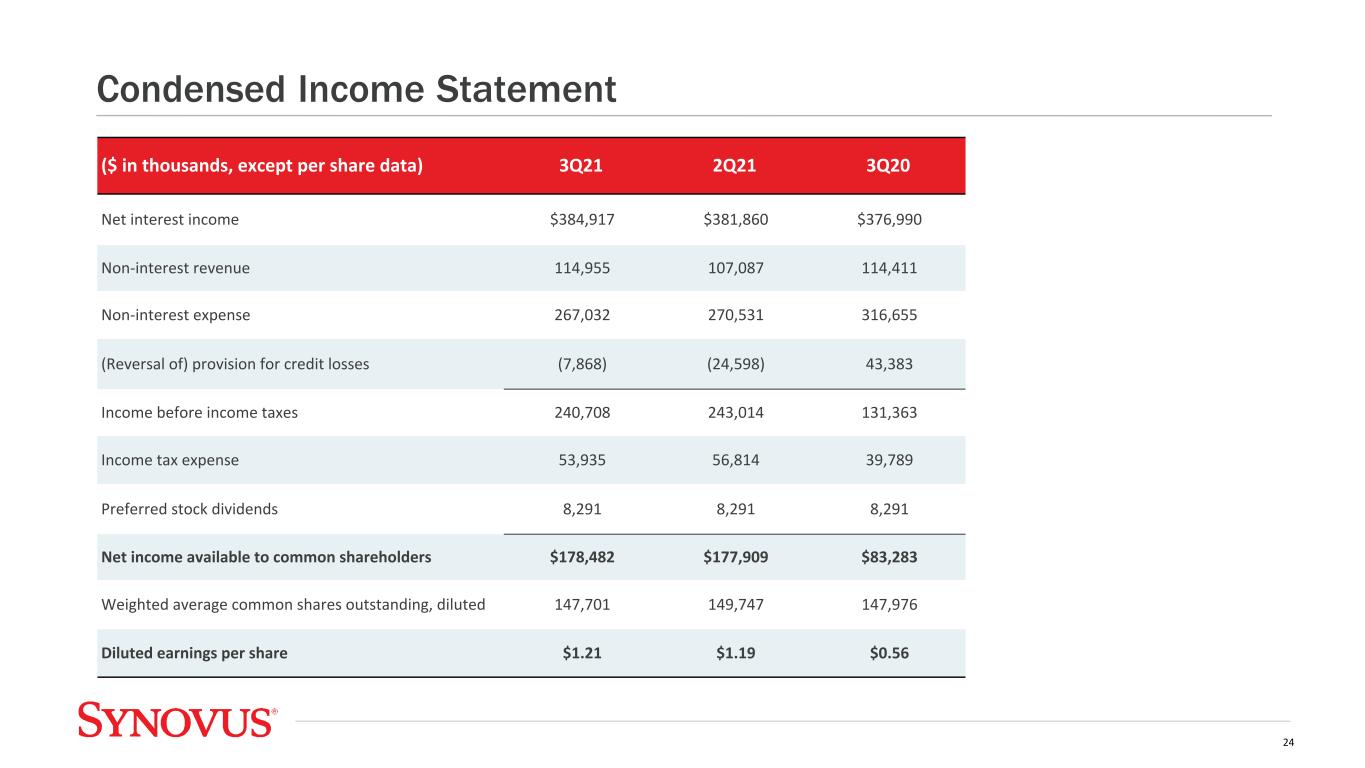
($ in thousands, except per share data) 3Q21 2Q21 3Q20 Net interest income $384,917 $381,860 $376,990 Non-interest revenue 114,955 107,087 114,411 Non-interest expense 267,032 270,531 316,655 (Reversal of) provision for credit losses (7,868) (24,598) 43,383 Income before income taxes 240,708 243,014 131,363 Income tax expense 53,935 56,814 39,789 Preferred stock dividends 8,291 8,291 8,291 Net income available to common shareholders $178,482 $177,909 $83,283 Weighted average common shares outstanding, diluted 147,701 149,747 147,976 Diluted earnings per share $1.21 $1.19 $0.56 Condensed Income Statement 24

($ in thousands) 3Q21 2Q21 3Q20 Service charges on deposit accounts $22,641 $21,414 $17,813 Fiduciary and asset management fees 19,786 18,805 15,885 Brokerage revenue 14,745 13,926 10,604 Mortgage banking income 11,155 13,842 31,229 Card fees 13,238 13,304 10,823 Capital markets income 8,089 3,335 5,690 Income from bank-owned life insurance 6,820 7,188 7,778 Other non-interest revenue 17,616 14,147 15,083 Adjusted non-interest revenue 114,090 105,961 114,905 Fair value increase of private equity investments, net — — 260 Fair value adjustment on non-qualified deferred compensation (97) 1,126 796 Investment securities gains (losses), net 962 — (1,550) Total non-interest revenue $114,955 $107,087 $114,411 Non-Interest Revenue 25

($ in thousands, except per share data) 3Q21 2Q21 3Q20 Net income available to common shareholders $178,482 $177,909 $83,283 Subtract/add: Earnout liability adjustment (243) 750 — Add: Goodwill Impairment — — 44,877 Add: Restructuring charges 319 415 2,882 Add: Loss on early extinguishment of debt, net — — 154 Subtract/add: Investment securities (gains) losses, net (962) — 1,550 Subtract: Fair value increase of private equity investments — — (260) Add/subtract: Tax effect of adjustments (1) 164 (105) (1,122) Adjusted net income available to common shareholders $177,760 $178,969 $131,364 Weighted average common shares outstanding, diluted 147,701 149,747 147,976 Diluted earnings per share $1.21 $1.19 $0.56 Adjusted diluted earnings per share $1.20 $1.20 $0.89 (1) An assumed marginal tax rate of 25.3% for 2021 and 25.9% for 2020 was applied. Non-GAAP Financial Measures 26
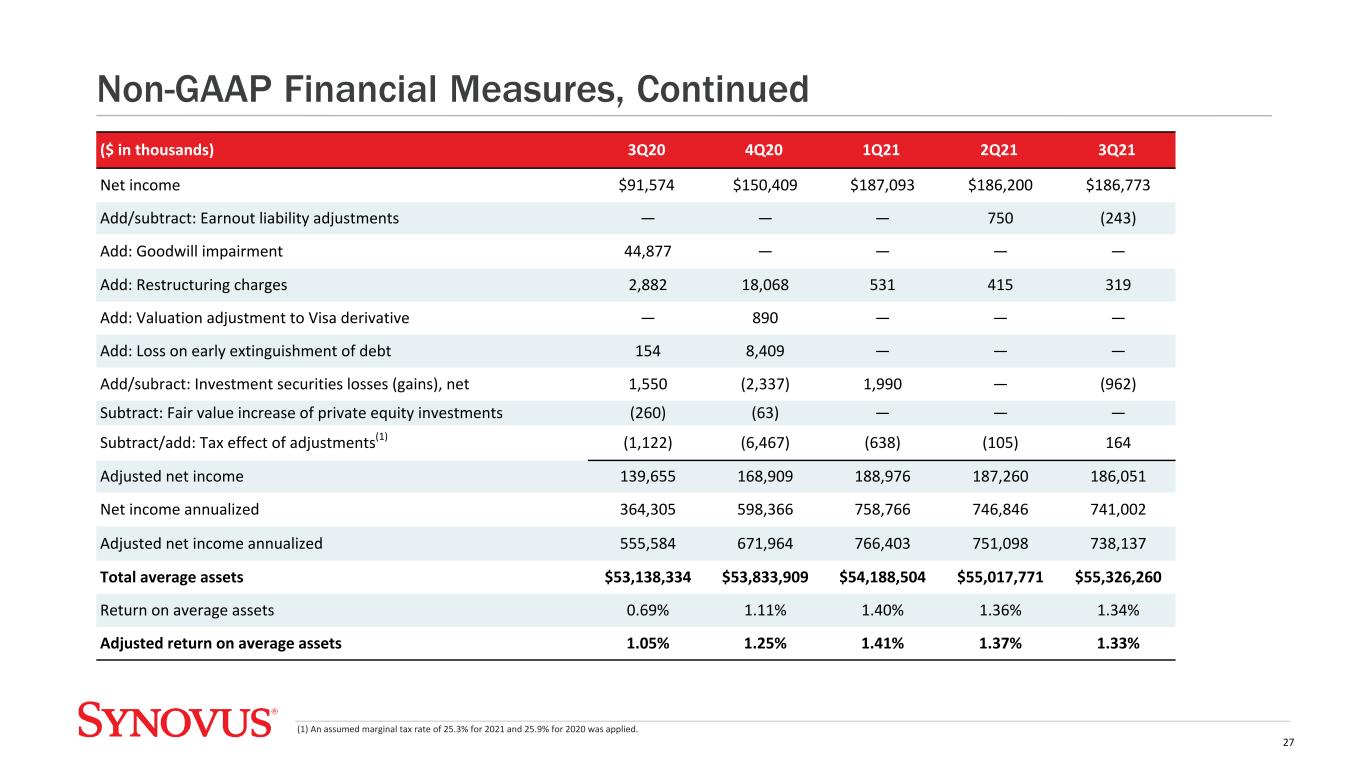
($ in thousands) 3Q20 4Q20 1Q21 2Q21 3Q21 Net income $91,574 $150,409 $187,093 $186,200 $186,773 Add/subtract: Earnout liability adjustments — — — 750 (243) Add: Goodwill impairment 44,877 — — — — Add: Restructuring charges 2,882 18,068 531 415 319 Add: Valuation adjustment to Visa derivative — 890 — — — Add: Loss on early extinguishment of debt 154 8,409 — — — Add/subract: Investment securities losses (gains), net 1,550 (2,337) 1,990 — (962) Subtract: Fair value increase of private equity investments (260) (63) — — — Subtract/add: Tax effect of adjustments(1) (1,122) (6,467) (638) (105) 164 Adjusted net income 139,655 168,909 188,976 187,260 186,051 Net income annualized 364,305 598,366 758,766 746,846 741,002 Adjusted net income annualized 555,584 671,964 766,403 751,098 738,137 Total average assets $53,138,334 $53,833,909 $54,188,504 $55,017,771 $55,326,260 Return on average assets 0.69% 1.11% 1.40% 1.36% 1.34% Adjusted return on average assets 1.05% 1.25% 1.41% 1.37% 1.33% (1) An assumed marginal tax rate of 25.3% for 2021 and 25.9% for 2020 was applied. Non-GAAP Financial Measures, Continued 27

($ in thousands) 3Q21 2Q21 3Q20 Net income available to common shareholders $178,482 $177,909 $83,283 Subtract/add: Earnout liability adjustment (243) 750 — Add: Goodwill impairment — — 44,877 Add: Restructuring charges 319 415 2,882 Subtract/add: Investment securities (gains) losses, net (962) — 1,550 Add: Loss on early extinguishment of debt — — 154 Subtract: Fair value increase of private equity investments — — (260) Add/subtract: Tax effect of adjustments (1) 164 (105) (1,122) Adjusted net income available to common shareholders 177,760 178,969 131,364 Adjusted net income available to common shareholders annualized 705,243 717,843 522,600 Add: Amortization of intangibles, annualized net of tax 7,050 7,128 7,782 Adjusted net income available to common shareholders excluding amortization of intangibles annualized 712,293 724,971 530,382 Net income available to common shareholders annualized 708,108 713,591 331,322 Add: Amortization of intangibles, annualized net of tax 7,050 7,128 7,782 Net income available to common shareholders excluding amortization of intangibles annualized 715,158 720,719 339,104 Total average shareholders' equity less preferred stock 4,734,754 4,632,568 4,553,159 Subtract: Goodwill (452,390) (452,390) (497,267) Subtract: Other intangible assets, net (39,109) (41,399) (49,075) Total average tangible shareholders' equity less preferred stock $4,243,255 $4,138,779 $4,006,817 Return on average common equity 15.0% 15.4% 7.3% Adjusted return on average common equity 14.9% 15.5% 11.5% Return on average tangible common equity 16.9% 17.4% 8.5% Adjusted return on average tangible common equity 16.8% 17.5% 13.2% (1) An assumed marginal tax rate of 25.3% for 2021 and 25.9% for 2020 was applied. Non-GAAP Financial Measures, Continued 28

($ in thousands) 3Q21 2Q21 3Q20 Total non-interest revenue $114,955 $107,087 $114,411 Subtract/add: Investment securities (gains) losses, net (962) — 1,550 Subtract: Fair value increase of private equity investments — — (260) Add/subtract: Fair value adjustment on non-qualified deferred compensation 97 (1,126) (796) Adjusted non-interest revenue $114,090 $105,961 $114,905 Non-GAAP Financial Measures, Continued 29
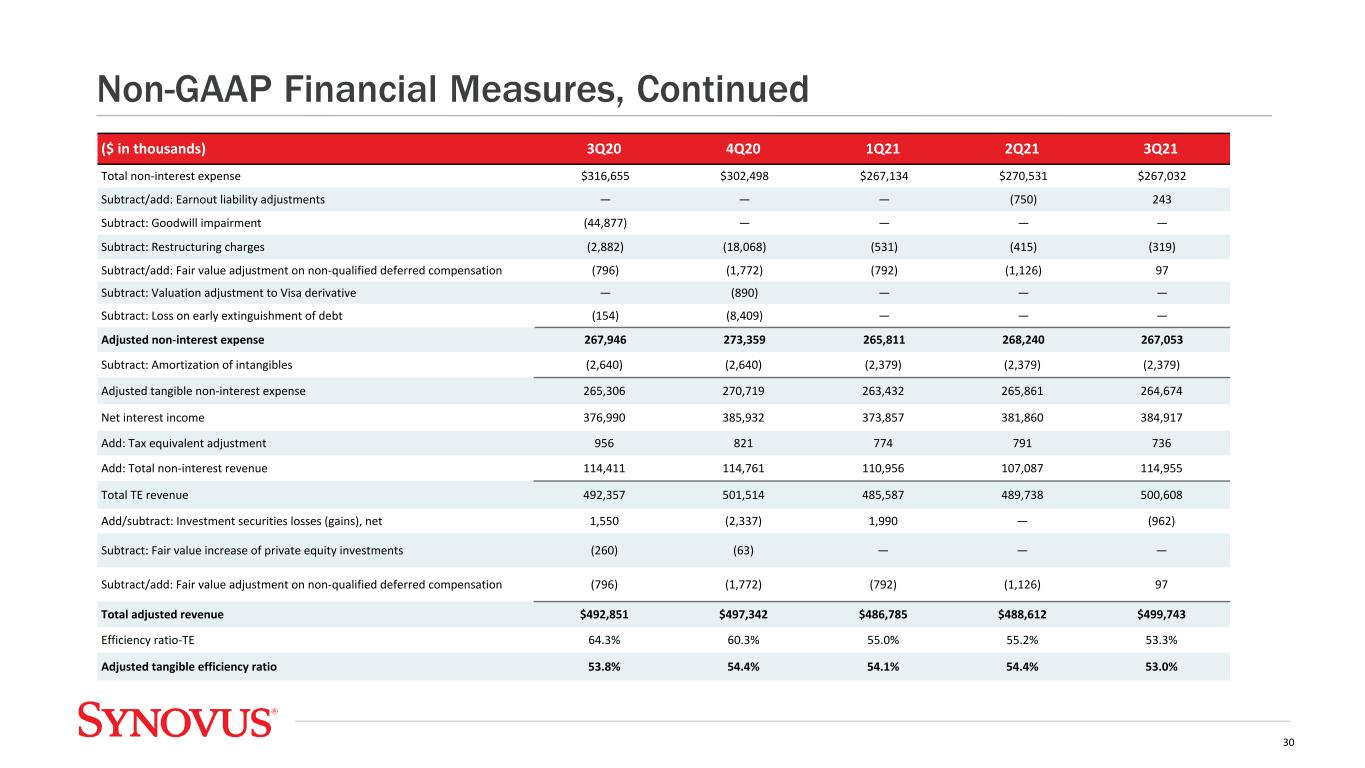
($ in thousands) 3Q20 4Q20 1Q21 2Q21 3Q21 Total non-interest expense $316,655 $302,498 $267,134 $270,531 $267,032 Subtract/add: Earnout liability adjustments — — — (750) 243 Subtract: Goodwill impairment (44,877) — — — — Subtract: Restructuring charges (2,882) (18,068) (531) (415) (319) Subtract/add: Fair value adjustment on non-qualified deferred compensation (796) (1,772) (792) (1,126) 97 Subtract: Valuation adjustment to Visa derivative — (890) — — — Subtract: Loss on early extinguishment of debt (154) (8,409) — — — Adjusted non-interest expense 267,946 273,359 265,811 268,240 267,053 Subtract: Amortization of intangibles (2,640) (2,640) (2,379) (2,379) (2,379) Adjusted tangible non-interest expense 265,306 270,719 263,432 265,861 264,674 Net interest income 376,990 385,932 373,857 381,860 384,917 Add: Tax equivalent adjustment 956 821 774 791 736 Add: Total non-interest revenue 114,411 114,761 110,956 107,087 114,955 Total TE revenue 492,357 501,514 485,587 489,738 500,608 Add/subtract: Investment securities losses (gains), net 1,550 (2,337) 1,990 — (962) Subtract: Fair value increase of private equity investments (260) (63) — — — Subtract/add: Fair value adjustment on non-qualified deferred compensation (796) (1,772) (792) (1,126) 97 Total adjusted revenue $492,851 $497,342 $486,785 $488,612 $499,743 Efficiency ratio-TE 64.3% 60.3% 55.0% 55.2% 53.3% Adjusted tangible efficiency ratio 53.8% 54.4% 54.1% 54.4% 53.0% Non-GAAP Financial Measures, Continued 30

Non-GAAP Financial Measures, Continued 31 ($ in thousands, except per share data) 3Q21 2Q21 3Q20 Net interest income $384,917 $381,860 $376,990 Non-interest revenue 114,955 107,087 114,411 Non-interest expense 267,032 270,531 316,655 Pre-provision net revenue $232,840 $218,416 $174,746 Net interest income $384,917 $381,860 $376,990 Adjusted non-interest revenue 114,090 105,961 114,905 Adjusted non-interest expense 267,053 268,240 267,946 Adjusted pre-provision net revenue $231,954 $219,581 $223,949 Income before income taxes $240,708 $243,014 $131,363
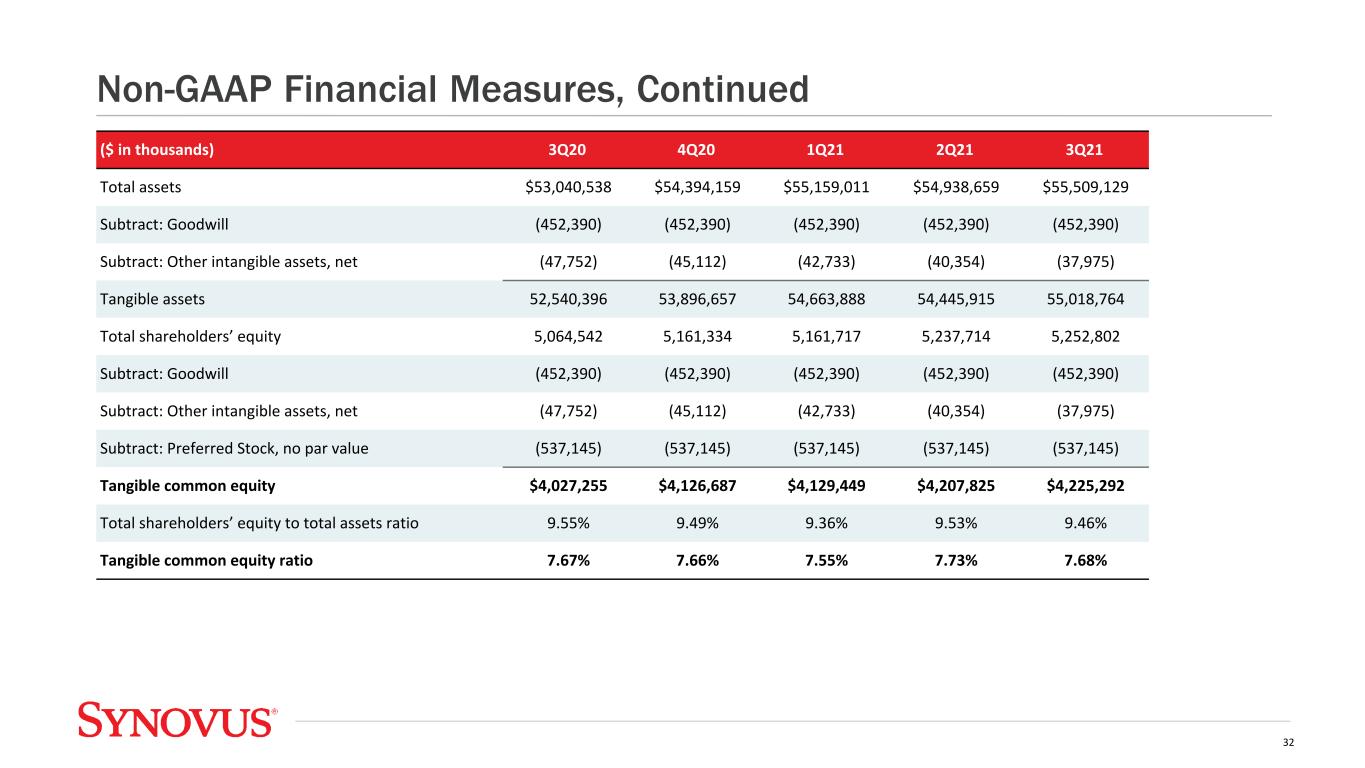
($ in thousands) 3Q20 4Q20 1Q21 2Q21 3Q21 Total assets $53,040,538 $54,394,159 $55,159,011 $54,938,659 $55,509,129 Subtract: Goodwill (452,390) (452,390) (452,390) (452,390) (452,390) Subtract: Other intangible assets, net (47,752) (45,112) (42,733) (40,354) (37,975) Tangible assets 52,540,396 53,896,657 54,663,888 54,445,915 55,018,764 Total shareholders’ equity 5,064,542 5,161,334 5,161,717 5,237,714 5,252,802 Subtract: Goodwill (452,390) (452,390) (452,390) (452,390) (452,390) Subtract: Other intangible assets, net (47,752) (45,112) (42,733) (40,354) (37,975) Subtract: Preferred Stock, no par value (537,145) (537,145) (537,145) (537,145) (537,145) Tangible common equity $4,027,255 $4,126,687 $4,129,449 $4,207,825 $4,225,292 Total shareholders’ equity to total assets ratio 9.55% 9.49% 9.36% 9.53% 9.46% Tangible common equity ratio 7.67% 7.66% 7.55% 7.73% 7.68% Non-GAAP Financial Measures, Continued 32


