
Building the bank of the future Goldman Sachs U.S. Financial Services Conference Kevin Blair President and Chief Executive Officer December 7, 2021 Exhibit 99.1
©2021 Synovus. All Rights Reserved. 2 Forward-Looking Statements This slide presentation and certain of our other filings with the Securities and Exchange Commission contain statements that constitute "forward-looking statements" within the meaning of, and subject to the protections of, Section 27A of the Securities Act of 1933, as amended, and Section 21E of the Securities Exchange Act of 1934, as amended. All statements other than statements of historical fact are forward-looking statements. You can identify these forward-looking statements through Synovus' use of words such as "believes," "anticipates," "expects," "may," "will," "assumes," "predicts," "could," "should," "would," "intends," "targets," "estimates," "projects," "plans," “schedule,” "potential" and other similar words and expressions of the future or otherwise regarding the outlook for Synovus' future business and financial performance and/or the performance of the banking industry and economy in general. These forward-looking statements include, among others, statements on our expectations related to (1) loan and deposit growth; (2) deposit costs; (3) net interest income and net interest margin; (4) total revenues; (5) non-interest expense, including expenses related to our strategic initiatives; (6) credit trends and key credit performance metrics; (7) effective tax rate; (8) capital and deposit position; (9) our future operating and financial performance; (10) our strategy and initiatives for future revenue growth, balance sheet management, capital management, expense savings, and technology; and (11) our assumptions underlying these expectations. Prospective investors are cautioned that any such forward-looking statements are not guarantees of future performance and involve known and unknown risks and uncertainties which may cause the actual results, performance or achievements of Synovus to be materially different from the future results, performance or achievements expressed or implied by such forward-looking statements. Forward-looking statements are based on the information known to, and current beliefs and expectations of, Synovus' management and are subject to significant risks and uncertainties. Actual results may differ materially from those contemplated by such forward-looking statements. A number of factors could cause actual results to differ materially from those contemplated by the forward-looking statements in this presentation. Many of these factors are beyond Synovus' ability to control or predict. These forward-looking statements are based upon information presently known to Synovus' management and are inherently subjective, uncertain and subject to change due to any number of risks and uncertainties, including, without limitation, the risks and other factors set forth in Synovus' filings with the Securities and Exchange Commission, including its Annual Report on Form 10-K for the year ended December 31, 2020 under the captions "Cautionary Notice Regarding Forward-Looking Statements" and "Risk Factors" and in Synovus' quarterly reports on Form 10-Q and current reports on Form 8-K. We believe these forward-looking statements are reasonable; however, undue reliance should not be placed on any forward-looking statements, which are based on current expectations and speak only as of the date that they are made. We do not assume any obligation to update any forward-looking statements as a result of new information, future developments or otherwise, except as otherwise may be required by law. Use of Non-GAAP Financial Measures This slide presentation contains certain non-GAAP financial measures determined by methods other than in accordance with generally accepted accounting principles. Such non-GAAP financial measures include the following: adjusted non-interest revenue; total adjusted revenue; adjusted non-interest expense; pre-provision net revenue and risk adjusted net interest margin (NIM). The most comparable GAAP measures to these measures are total non-interest revenue; total TE revenue; total non-interest expense, income before income taxes, and net interest margin, respectively. Management uses these non-GAAP financial measures to assess the performance of Synovus’ business and the strength of its capital position. Management believes that these non-GAAP financial measures provide meaningful additional information about Synovus to assist management, investors, and bank regulators in evaluating Synovus’ operating results, financial strength, the performance of its business and the strength of its capital position. However, these non-GAAP financial measures have inherent limitations as analytical tools and should not be considered in isolation or as a substitute for analyses of operating results or capital position as reported under GAAP. The non-GAAP financial measures should be considered as additional views of the way our financial measures are affected by significant items and other factors, and since they are not required to be uniformly applied, they may not be comparable to other similarly titled measures at other companies. Adjusted non-interest revenue and total adjusted revenue are measures used by management to evaluate non-interest revenue and total TE revenue exclusive of net investment securities gains (losses) and fair value adjustment on non-qualified deferred compensation. Adjusted non-interest expense is a measure utilized by management to measure the success of expense management initiatives focused on reducing recurring controllable operating costs. Pre-provision net revenue is used by management to evaluate income before income taxes exclusive of (reversal of) provision for credit losses. Risk adjusted NIM is a measure used to measure net interest margin exclusive of net charge-offs. The computations of the non-GAAP financial measures used in this slide presentation are set forth in the Appendix to this slide presentation.
©2021 Synovus. All Rights Reserved. 3 Synovus is built around its people, who are empowered and enabled to deliver. Our Purpose Value differentiators Enabling our clients to reach their full potential ⊲ Trust ⊲ Personalization ⊲ Speed ⊲ Reliability ⊲ Knowledge and expertise

©2021 Synovus. All Rights Reserved. 4 We’re starting on a strong foundation Loyal customer base in attractive Southeastern footprint • 133-year history of serving clients in Southeastern marketplace • #1 market share among mid-cap banks in our footprint with top 5 share in 60% of markets in which we operate • Net promoter score top quartile among top 50 banks Knowledgeable and experienced team • 5,000+ team members strong • Lower team member attrition than industry(1) while continuing to attract top talent across the footprint • Synovus names one of The Atlanta Journal Constitution’s Top Workplaces in Atlanta Best in class banking, delivering solid financial performance • Full complement of consumer and commercial solutions • Digital advancement and augmented functionality • Relationship approach leading to higher levels of PPNR(2) to total assets Solid credit, robust capital and liquidity management • Post GFC, enhanced risk management practices and diversified the balance sheet leading to solid credit metrics and lower risk profile • Relationship focus enhances strong deposit base • Capital ratios and core earnings support significant growth opportunities (1) Source: 2020 BAI benchmarking study (2) Non-GAAP financial measure; see appendix for applicable reconciliation

©2021 Synovus. All Rights Reserved. 5 Synovus is building the bank of the future.
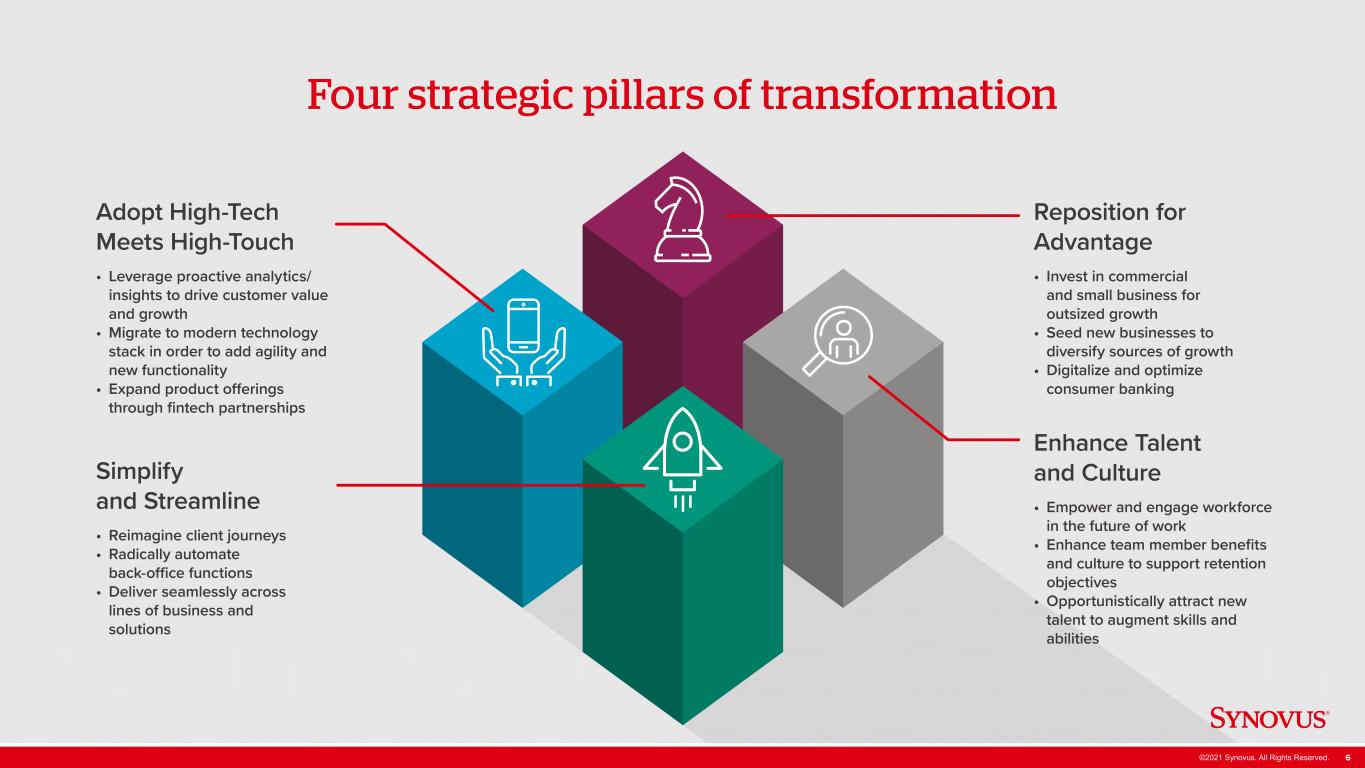
©2021 Synovus. All Rights Reserved. 6 Four strategic pillars of transformation Reposition for Advantage • Invest in commercial and small business for outsized growth • Seed new businesses to diversify sources of growth • Digitalize and optimize consumer banking Simplify and Streamline • Reimagine client journeys • Radically automate back-office functions • Deliver seamlessly across lines of business and solutions Adopt High-Tech Meets High-Touch • Leverage proactive analytics/ insights to drive customer value and growth • Migrate to modern technology stack in order to add agility and new functionality • Expand product offerings through fintech partnerships Enhance Talent and Culture • Empower and engage workforce in the future of work • Enhance team member benefits and culture to support retention objectives • Opportunistically attract new talent to augment skills and abilities

©2021 Synovus. All Rights Reserved. 7 Reposition for advantage

©2021 Synovus. All Rights Reserved. 8 Reposition for advantage Our focus on growth is centered on enhancing and augmenting our core businesses while investing in new sources of revenue where we are well-positioned and have the right to win. Leveraging increased productivity in core business segments to drive growth Diversifying lines of business and offerings based on client needs and behaviors Prioritizing initiatives and investments to ensure growth and return hurdles are achieved Profitable Growth Strategic Investments Solid Franchise

©2021 Synovus. All Rights Reserved. 9 Reposition for advantage Investing in commercial for outsized growth Launched Structured Lending Division in 2019, adding $1B in loans and approximately $20MM in PPNR(1) within 2 years Diversified commercial portfolio with addition of agricultural and timber team in 4Q20 Restaurant Services Group added in 3Q21 to build on significant experience in this sector New business line, Corporate & Investment Banking, capitalizes on up market opportunity in commercial space Added 40 net new revenue-producing team members over last two years in treasury and payments and wholesale bank Two new middle market team leads in high growth markets of central and west Florida Key Talent Acquisition Products and Solutions Accelerate AR Launched 2021 Integrated receivables suite Accelerate AP Expected to launch 2022 Straight through processing of customer payment files Synovus Gateway™ Launched 2021 Digital platform for commercial banking Zelle® Small Business Expected to launch 2022 Safe and convenient way for small businesses to send and receive money Industry Specialty Expansion Today Future Investments Financial institutions Technology & media Healthcare Commercial Relationship Managers Private Wealth Advisors Treasury & Payment Solutions Product Specialists (1) Non-GAAP financial measure; see appendix for applicable reconciliation

©2021 Synovus. All Rights Reserved. 10 Reposition for advantage Corporate & Investment Banking (CIB) Specialty industry verticals Revenue opportunities 2021 New Business Line Go-to-Market Strategies Financial institutions Technology, media, and communications Healthcare Syndication fees Advisory services Loan growth Capital markets income 2022 Estimated Expense $4–6MM

©2021 Synovus. All Rights Reserved. 11 Reposition for advantage Optimizing our branch network 2016 2017 2018 2019 2020 2021 800,000 750,000 700,000 650,000 600,000 550,000 500,000 Total Branches vs Retail Deposit Accounts 300 200 100 Legacy Synovus Branches Legacy FCB Branches Retail Deposit Accounts Retail Transaction Accounts Closed 24% of branch network since 2013 Targeting closure of an additional 15% by end of 2022 Estimated run rate savings of $12MM from 2022 closures 51 51 50 248 250 249 247 239 231 Br an ch es Accounts
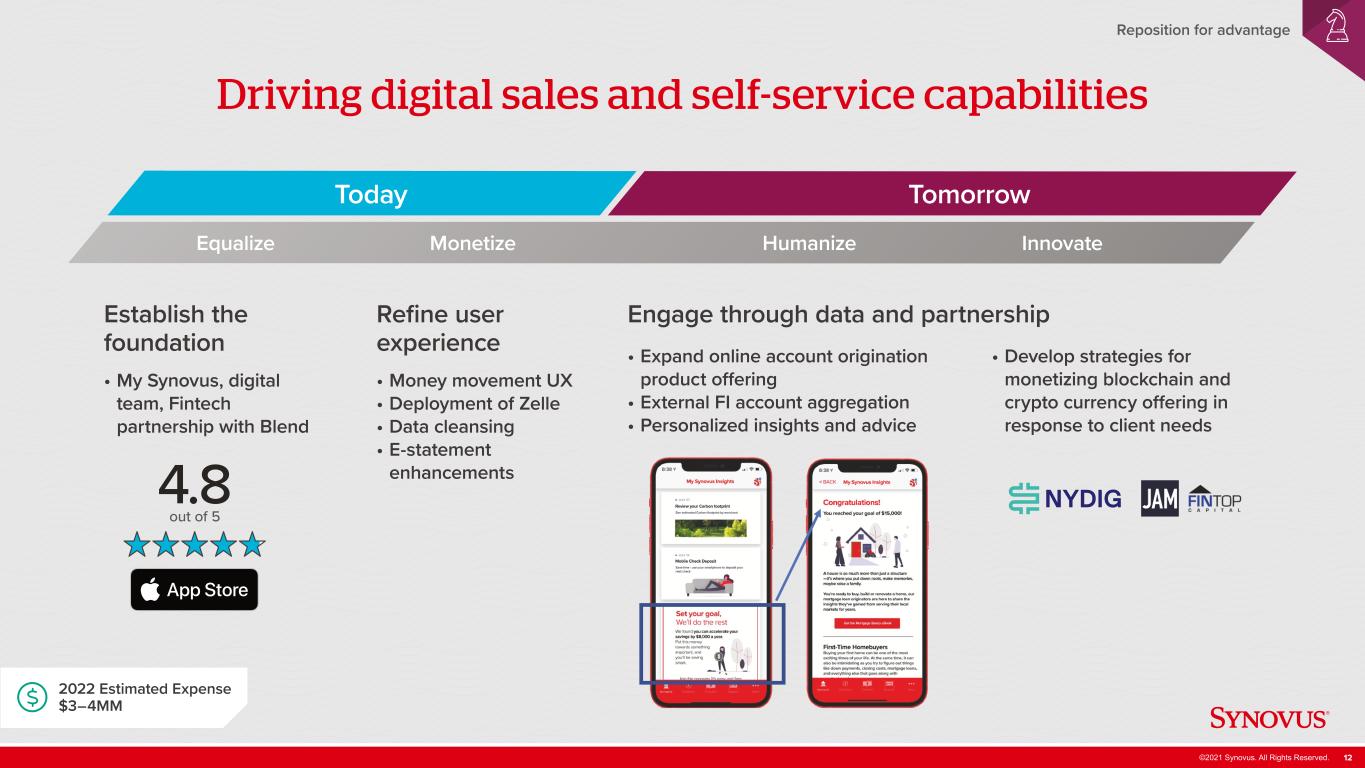
©2021 Synovus. All Rights Reserved. 12 Today Tomorrow Reposition for advantage Driving digital sales and self-service capabilities Establish the foundation • My Synovus, digital team, Fintech partnership with Blend Equalize Monetize InnovateHumanize Refine user experience • Money movement UX • Deployment of Zelle • Data cleansing • E-statement enhancements Engage through data and partnership • Expand online account origination product offering • External FI account aggregation • Personalized insights and advice • Develop strategies for monetizing blockchain and crypto currency offering in response to client needs 2022 Estimated Expense $3–4MM
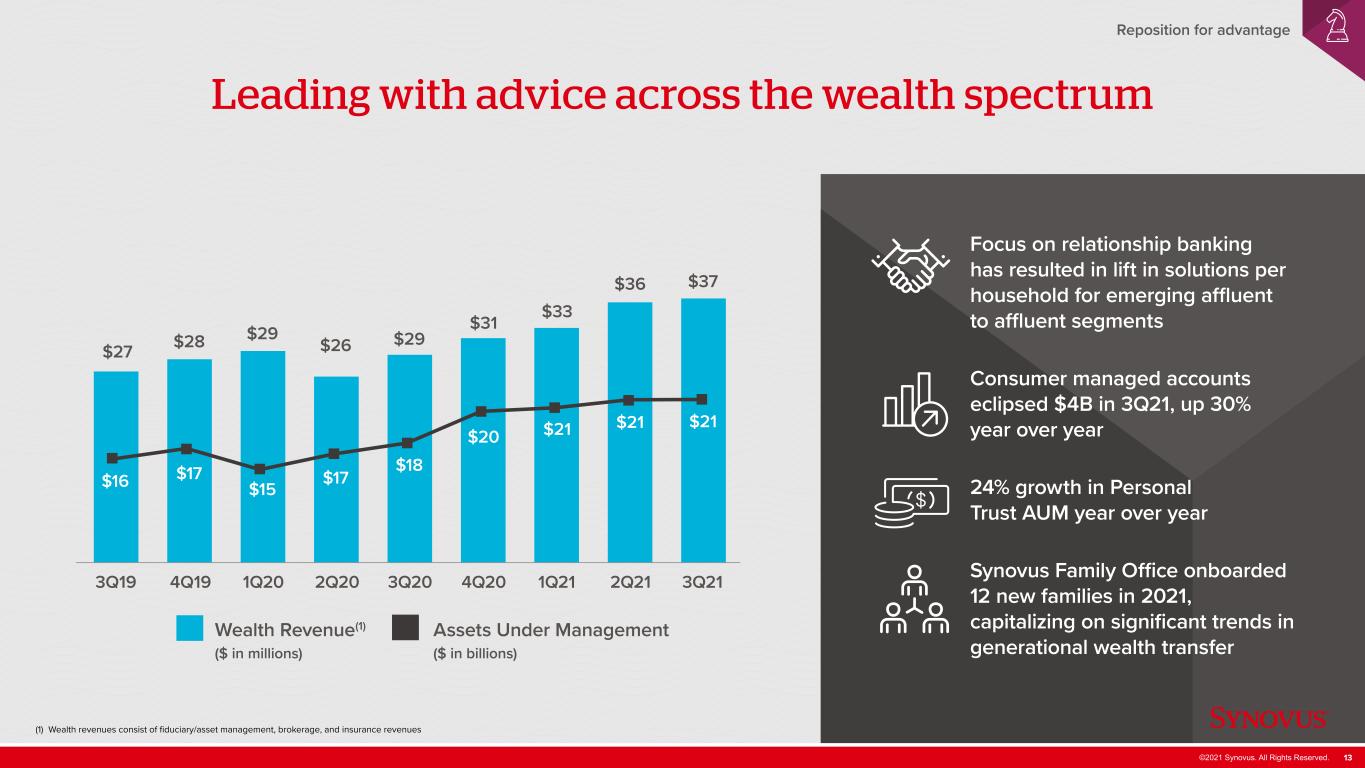
©2021 Synovus. All Rights Reserved. 13 Reposition for advantage Leading with advice across the wealth spectrum 3Q19 4Q19 1Q20 2Q20 3Q20 4Q20 1Q21 2Q21 3Q21 $27 $16 $28 $17 $29 $15 $26 $17 $29 $18 $31 $20 $33 $21 $36 $21 $37 $21 Wealth Revenue(1) ($ in millions) Assets Under Management ($ in billions) (1) Wealth revenues consist of fiduciary/asset management, brokerage, and insurance revenues Focus on relationship banking has resulted in lift in solutions per household for emerging affluent to affluent segments Consumer managed accounts eclipsed $4B in 3Q21, up 30% year over year 24% growth in Personal Trust AUM year over year Synovus Family Office onboarded 12 new families in 2021, capitalizing on significant trends in generational wealth transfer

©2021 Synovus. All Rights Reserved. 14 Simplify and streamline

©2021 Synovus. All Rights Reserved. 15 Simplify and streamline Continued focus on a premier client experience. Platform enhancements and intelligent automation End-to-end redesign • Commercial credit • Account opening • Problem resolution • Money movement Reducing complexity for clients, making it easier to do business with us EmpowermentProcessBest-in-Class Platforms
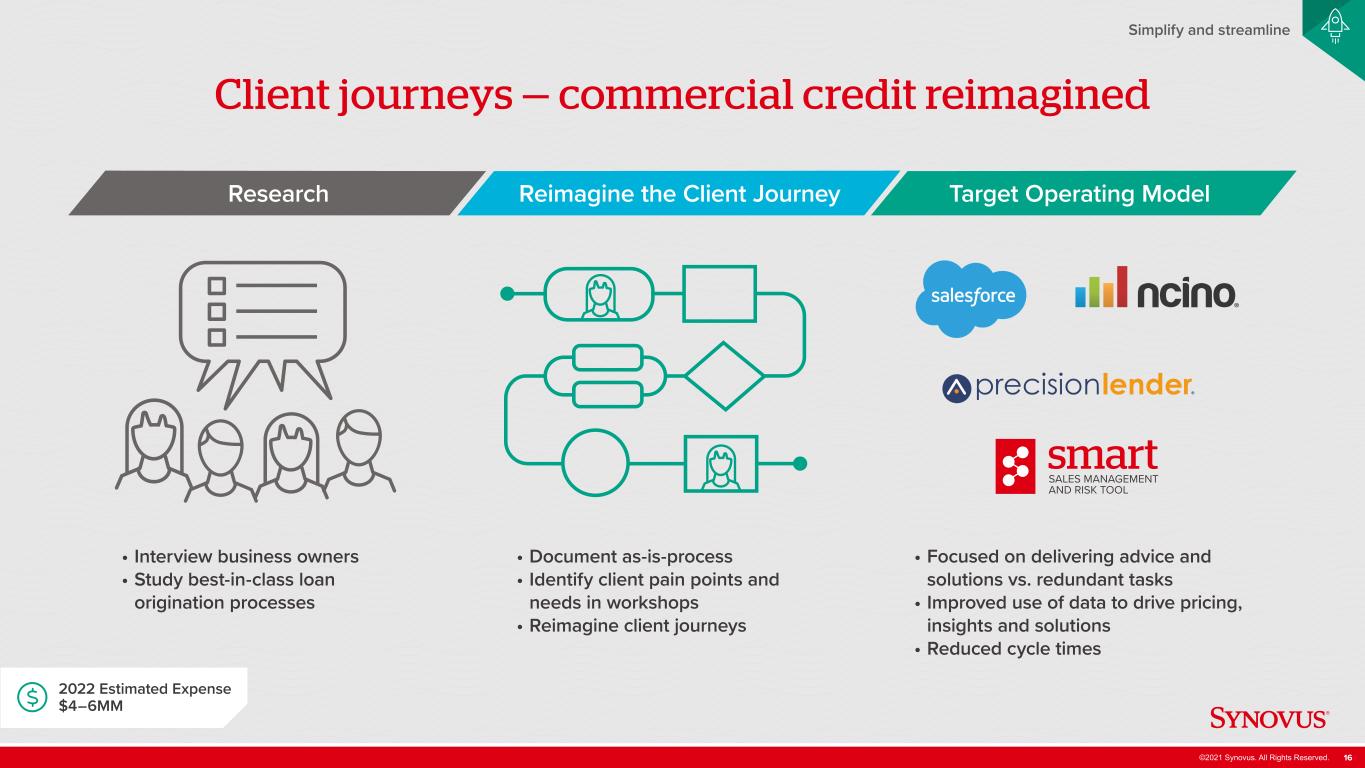
©2021 Synovus. All Rights Reserved. 16 • Document as-is-process • Identify client pain points and needs in workshops • Reimagine client journeys • Focused on delivering advice and solutions vs. redundant tasks • Improved use of data to drive pricing, insights and solutions • Reduced cycle times • Interview business owners • Study best-in-class loan origination processes Simplify and streamline Client journeys — commercial credit reimagined Research Reimagine the Client Journey Target Operating Model 2022 Estimated Expense $4–6MM
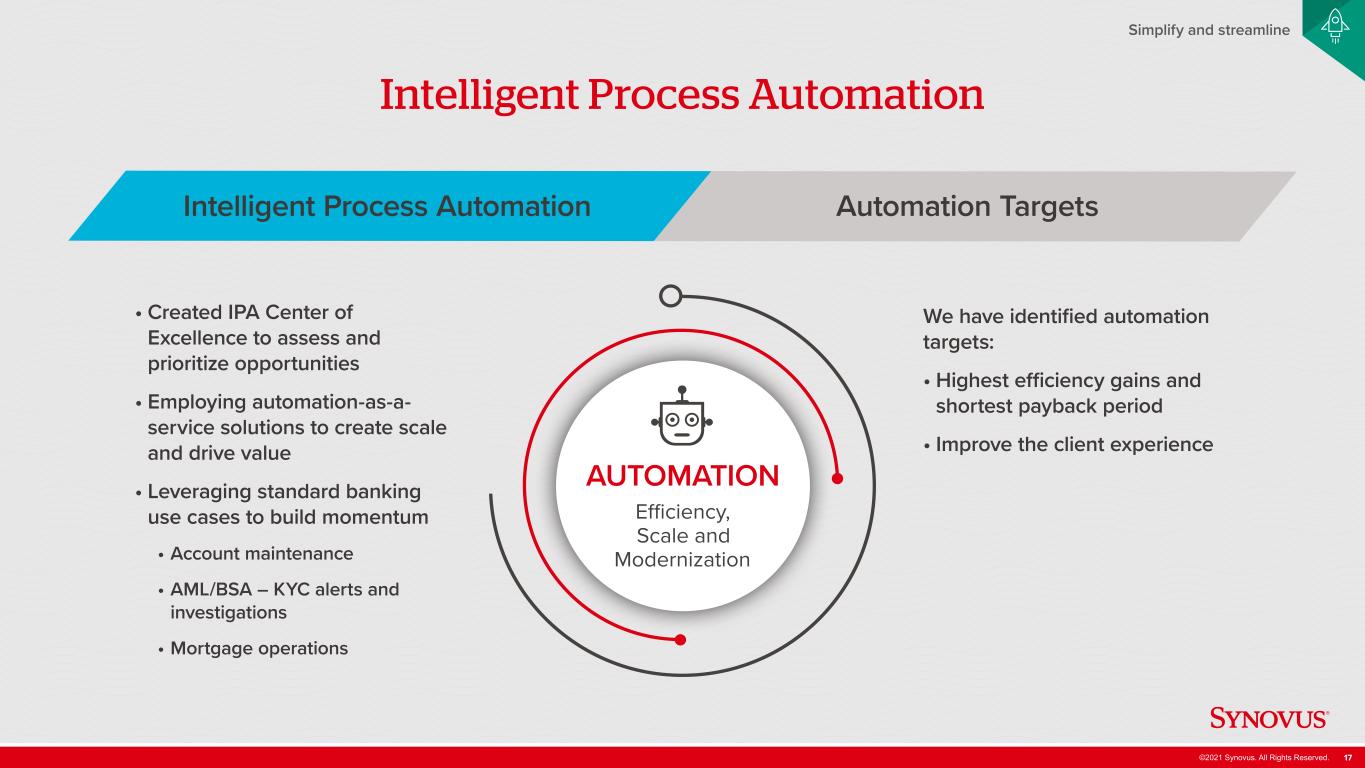
©2021 Synovus. All Rights Reserved. 17 Simplify and streamline Intelligent Process Automation • Created IPA Center of Excellence to assess and prioritize opportunities • Employing automation-as-a- service solutions to create scale and drive value • Leveraging standard banking use cases to build momentum • Account maintenance • AML/BSA – KYC alerts and investigations • Mortgage operations We have identified automation targets: • Highest efficiency gains and shortest payback period • Improve the client experience Intelligent Process Automation Automation Targets AUTOMATION

©2021 Synovus. All Rights Reserved. 18 High-tech meets high-touch

©2021 Synovus. All Rights Reserved. 19 High-tech meets high-touch Further enhancing client loyalty by matching a highly-personalized, advice-based approach with state-of-the-art technology. Core modernization and fintech partnerships Enhancing the client experience and growing the business at a faster pace Best mix of human and digital experiences PersonalizationAnalytics Agile Technology
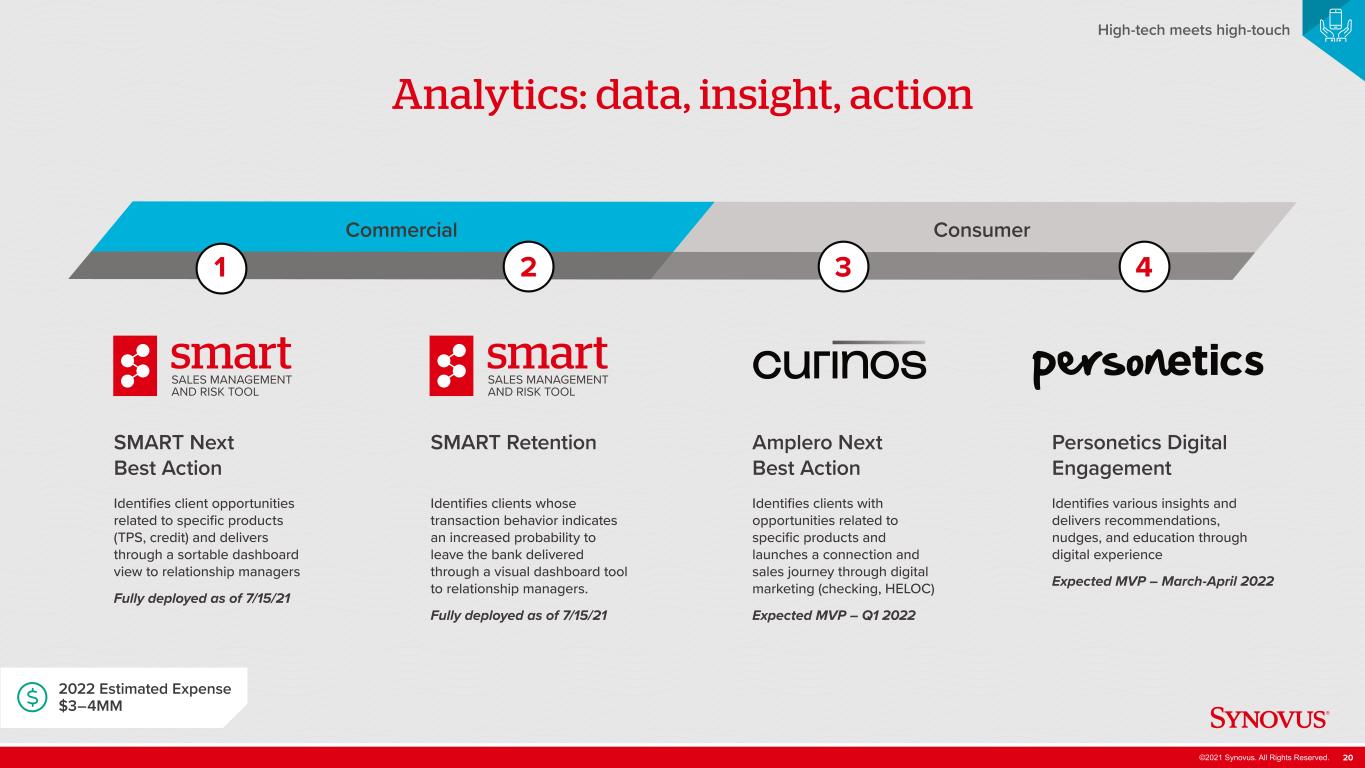
©2021 Synovus. All Rights Reserved. 20 High-tech meets high-touch Analytics: data, insight, action SMART Next Best Action Identifies client opportunities related to specific products (TPS, credit) and delivers through a sortable dashboard view to relationship managers Fully deployed as of 7/15/21 1 2 3 4 SMART Retention Identifies clients whose transaction behavior indicates an increased probability to leave the bank delivered through a visual dashboard tool to relationship managers. Fully deployed as of 7/15/21 Amplero Next Best Action Identifies clients with opportunities related to specific products and launches a connection and sales journey through digital marketing (checking, HELOC) Expected MVP – Q1 2022 Personetics Digital Engagement Identifies various insights and delivers recommendations, nudges, and education through digital experience Expected MVP – March-April 2022 Commercial Consumer 2022 Estimated Expense $3–4MM

©2021 Synovus. All Rights Reserved. 21 High-tech meets high-touch Banking-as-a-service One relationship, one contract, one integration Payment acceptance, checking accounts and loans delivered through strategic partnerships Powered by next generation modern core Software providers and distributors (SaaS /ISVs) Small business end users a platform 2022 Estimated Expense $10+MM
©2021 Synovus. All Rights Reserved. 22 Enhance talent and culture
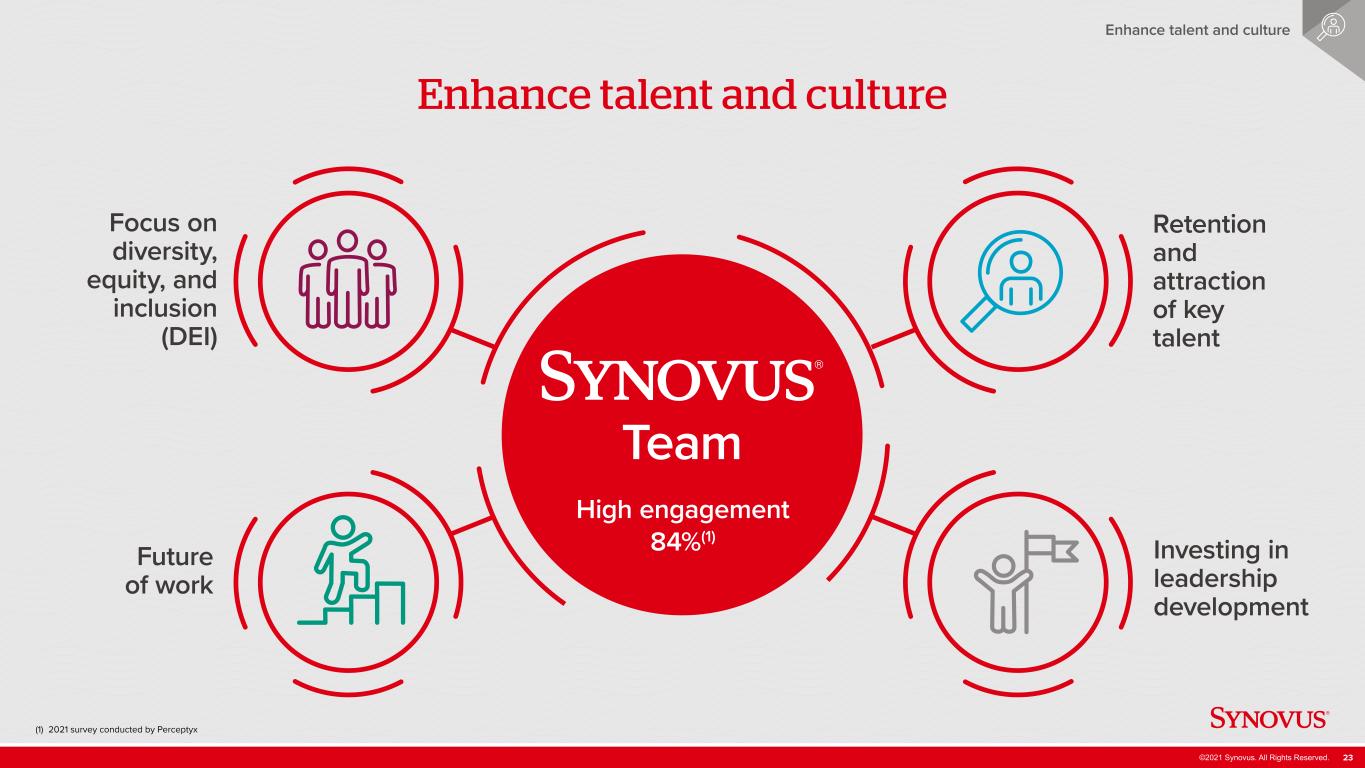
©2021 Synovus. All Rights Reserved. 23 Enhance talent and culture Enhance talent and culture Team Retention and attraction of key talent Investing in leadership development Focus on diversity, equity, and inclusion (DEI) High engagement 84%(1) Future of work (1) 2021 survey conducted by Perceptyx
©2021 Synovus. All Rights Reserved. 24 Delivering results
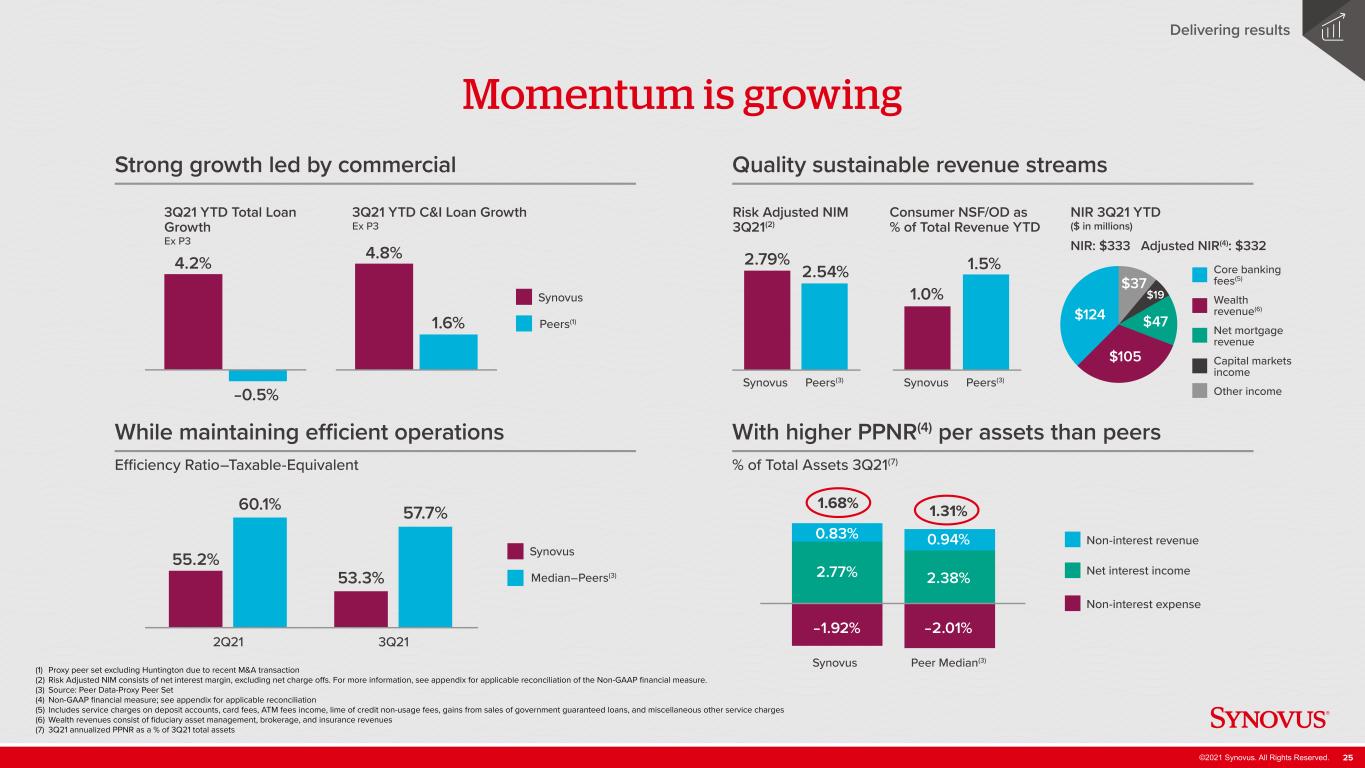
©2021 Synovus. All Rights Reserved. 25 Delivering results Momentum is growing Strong growth led by commercial While maintaining efficient operations Quality sustainable revenue streams With higher PPNR(4) per assets than peers 3Q21 YTD Total Loan Growth Ex P3 3Q21 YTD C&I Loan Growth Ex P3 Risk Adjusted NIM 3Q21(2) Consumer NSF/OD as % of Total Revenue YTD NIR 3Q21 YTD ($ in millions) NIR: $333 Adjusted NIR(4): $332 Efficiency Ratio–Taxable-Equivalent % of Total Assets 3Q21(7) Non-interest revenue Net interest income Non-interest expense Synovus Peer Median(3) 0.83% 0.94% 2.77% 2.38% –1.92% –2.01% 1.68% 1.31% Core banking fees(5) Wealth revenue(6) Net mortgage revenue Capital markets income Other income Synovus Median–Peers(3) Synovus Peers(1) 55.2% 53.3% 60.1% 57.7% 2Q21 3Q21 4.2% –0.5% 4.8% 1.6% Synovus Peers(3) 2.79% 2.54% Synovus Peers(3) 1.0% 1.5% $124 $105 $47 $37 $19 (1) Proxy peer set excluding Huntington due to recent M&A transaction (2) Risk Adjusted NIM consists of net interest margin, excluding net charge offs. For more information, see appendix for applicable reconciliation of the Non-GAAP financial measure. (3) Source: Peer Data-Proxy Peer Set (4) Non-GAAP financial measure; see appendix for applicable reconciliation (5) Includes service charges on deposit accounts, card fees, ATM fees income, lime of credit non-usage fees, gains from sales of government guaranteed loans, and miscellaneous other service charges (6) Wealth revenues consist of fiduciary asset management, brokerage, and insurance revenues (7) 3Q21 annualized PPNR as a % of 3Q21 total assets

©2021 Synovus. All Rights Reserved. 26 Delivering results Previous Guidance Metrics as of 3Q21 Earnings Trend vs Previous Guidance Updated 2021 guidance (1) Non-GAAP financial measure; see appendix for applicable reconciliation Loans Pre-Provision Net Revenue Capital and Taxes Period-end loans, excl. PPP 2% to 4%and third-party consumer loans Total adjusted revenue(1) -1% to 1% Capital management ≥ 9.5% CET1 ratio target At or above upper end of range At or above upper end of range At or above upper end of range No change from previous guidance Middle to upper end of range Adjusted non-interest expense(1) -1% to -2% Effective tax rate 22% to 24%

©2021 Synovus. All Rights Reserved. 27 get there
©2021 Synovus. All Rights Reserved. 28 Appendix

©2021 Synovus. All Rights Reserved. 29 Non-GAAP Financial Measures ($ in thousands) YTD 3Q21 QTD 3Q21 Total non-interest revenue $332,997 $114,955 Subtract/add: Investment securities (gains) losses, net 1,028 (962) Add/subtract: Fair value adjustment on non-qualified deferred compensation (1,821) 97 Adjusted non-interest revenue $332,204 $114,090 ($ in thousands) QTD 3Q21 Total non-interest expense $267,032 Add/subtract: Earnout liability adjustments 243 Subtract: Restructuring charges (319) Add/subtract: Fair value adjustment on non-qualified deferred compensation 97 Adjust non-interest expense $267,053 ($ in thousands) 3Q21 Net interest income $384,917 Non-interest revenue 114,955 Non-interest expense 267,032 Pre-provision net revenue $232,840 Income before income taxes $240,708 ($ in thousands) 3Q21 Net interest income $384,917 Add: Tax equivalent adjustment 736 Add: Total non-interest revenue 114,955 Total TE revenue 500,608 Add/subtract: Investment securities losses (gains), net (962) Subtract/add: Fair value adjustment on non-qualified deferred compensation 97 Total adjusted revenue $499,743 3Q21 Net interest margin 3.01% Subtract/add: annualized NCO ratio 0.22% Risk adjusted net interest margin 2.79%


