©2022 Synovus. All Rights Reserved. 1 BancAnalysts Association of Boston Conference Kevin Blair - President and CEO November 3, 2022 Exhibit 99.1
©2022 Synovus. All Rights Reserved. 2 This slide presentation and certain of our other filings with the Securities and Exchange Commission contain statements that constitute "forward-looking statements" within the meaning of, and subject to the protections of, Section 27A of the Securities Act of 1933, as amended, and Section 21E of the Securities Exchange Act of 1934, as amended. All statements other than statements of historical fact are forward-looking statements. You can identify these forward-looking statements through Synovus' use of words such as "believes," "anticipates," "expects," "may," "will," "assumes," "predicts," "could," "should," "would," "intends," "targets," "estimates," "projects," "plans," "potential" and other similar words and expressions of the future or otherwise regarding the outlook for Synovus' future business and financial performance and/or the performance of the banking industry and economy in general. These forward-looking statements include, among others, statements on our expectations related to (1) loan growth; (2) deposit growth, pricing, and betas; (3) net interest income and net interest margin; (4) revenue growth; (5) non-interest expense, including expenses related to our strategic initiatives; (6) credit trends and key credit performance metrics; (7) capital position; (8) our future operating and financial performance; (9) our strategy and initiatives for future revenue growth, balance sheet management, capital management, expense savings, and technology; and (10) our assumptions underlying these expectations. Prospective investors are cautioned that any such forward-looking statements are not guarantees of future performance and involve known and unknown risks and uncertainties which may cause the actual results, performance or achievements of Synovus to be materially different from the future results, performance or achievements expressed or implied by such forward-looking statements. Forward-looking statements are based on the information known to, and current beliefs and expectations of, Synovus' management and are subject to significant risks and uncertainties. Actual results may differ materially from those contemplated by such forward-looking statements. A number of factors could cause actual results to differ materially from those contemplated by the forward-looking statements in this presentation. Many of these factors are beyond Synovus' ability to control or predict. These forward-looking statements are based upon information presently known to Synovus' management and are inherently subjective, uncertain and subject to change due to any number of risks and uncertainties, including, without limitation, the risks and other factors set forth in Synovus' filings with the Securities and Exchange Commission, including its Annual Report on Form 10-K for the year ended December 31, 2021 under the captions "Cautionary Notice Regarding Forward-Looking Statements" and "Risk Factors" and in Synovus' quarterly reports on Form 10-Q and current reports on Form 8-K. We believe these forward-looking statements are reasonable; however, undue reliance should not be placed on any forward-looking statements, which are based on current expectations and speak only as of the date that they are made. We do not assume any obligation to update any forward-looking statements as a result of new information, future developments or otherwise, except as otherwise may be required by law. Forward Looking Statements Use of Non-GAAP Financial Measures This slide presentation contains certain non-GAAP financial measures determined by methods other than in accordance with generally accepted accounting principles. Such non-GAAP financial measures include the following: adjusted return on average assets; return on average tangible common equity; adjusted return on average tangible common equity; and adjusted tangible efficiency ratio. The most comparable GAAP measures to these measures are return on average assets; return on average common equity; and efficiency ratio-taxable equivalent, respectively. Management uses these non-GAAP financial measures to assess the performance of Synovus' business and the strength of its capital position. Management believes that these non-GAAP financial measures provide meaningful additional information about Synovus to assist management, investors, and bank regulators in evaluating Synovus' operating results, financial strength, the performance of its business and the strength of its capital position. However, these non-GAAP financial measures have inherent limitations as analytical tools and should not be considered in isolation or as a substitute for analyses of operating results or capital position as reported under GAAP. The non-GAAP financial measures should be considered as additional views of the way our financial measures are affected by significant items and other factors, and since they are not required to be uniformly applied, they may not be comparable to other similarly titled measures at other companies. Adjusted return on average assets is a measure used by management to evaluate operating results exclusive of items that are not indicative of ongoing operations and impact period-to-period comparisons. Return on average tangible common equity and adjusted return on average tangible common equity are measures used by management to compare Synovus' performance with other financial institutions because it calculates the return available to common shareholders without the impact of intangible assets and their related amortization, thereby allowing management to evaluate the performance of the business consistently. The adjusted tangible efficiency ratio is a measure utilized by management to measure the success of expense management initiatives focused on reducing recurring controllable operating costs. The computations of the non-GAAP financial measures used in this slide presentation are set forth in the Appendix to this slide presentation. Amounts on certain slides that follow may not total due to rounding.
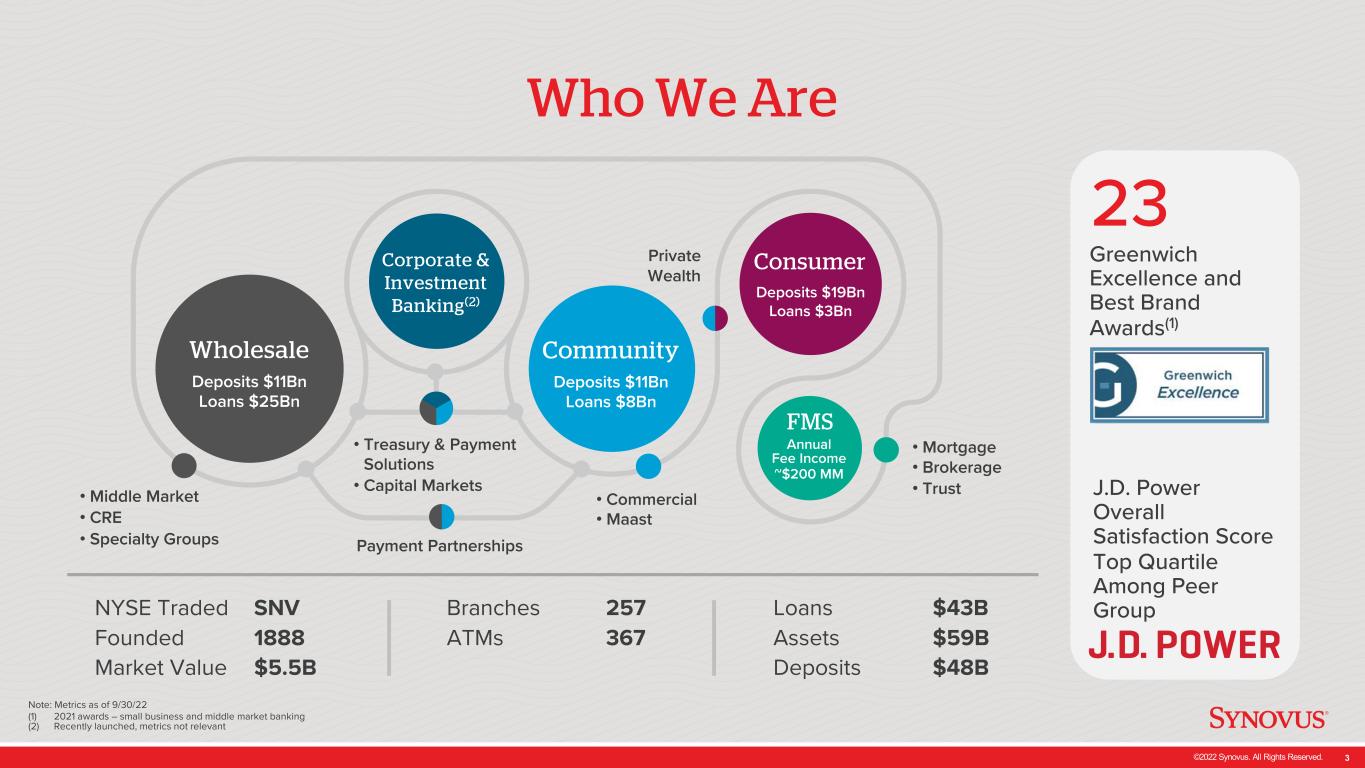
©2022 Synovus. All Rights Reserved. 3 Who We Are Deposits $11Bn Loans $25Bn Wholesale Community Deposits $11Bn Loans $8Bn Consumer Deposits $19Bn Loans $3Bn •Middle Market • CRE • Specialty Groups • Treasury & Payment Solutions • Capital Markets Payment Partnerships •Mortgage • Brokerage • Trust NYSE Traded SNV Founded 1888 Market Value $5.5B Branches 257 ATMs 367 Loans $43B Assets $59B Deposits $48B J.D. Power Overall Satisfaction Score Top Quartile Among Peer Group 23 Greenwich Excellence and Best Brand Awards(1) Note: Metrics as of 9/30/22 (1) 2021 awards – small business and middle market banking (2) Recently launched, metrics not relevant Corporate & Investment Banking(2) • Commercial •Maast Private Wealth FMS Annual Fee Income ~$200 MM
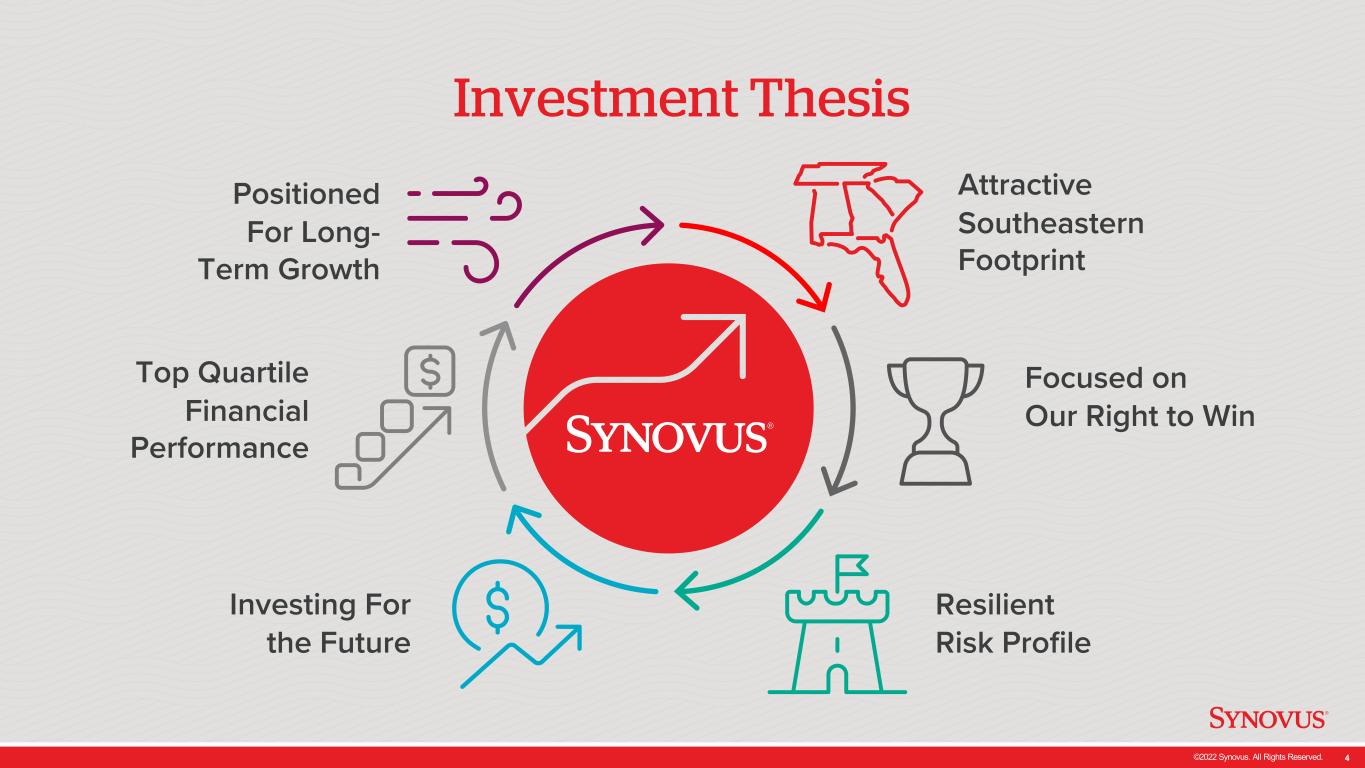
©2022 Synovus. All Rights Reserved. 4 Investment Thesis Focused on Our Right to Win Resilient Risk Profile Investing For the Future Top Quartile Financial Performance Attractive Southeastern Footprint Positioned For Long- Term Growth
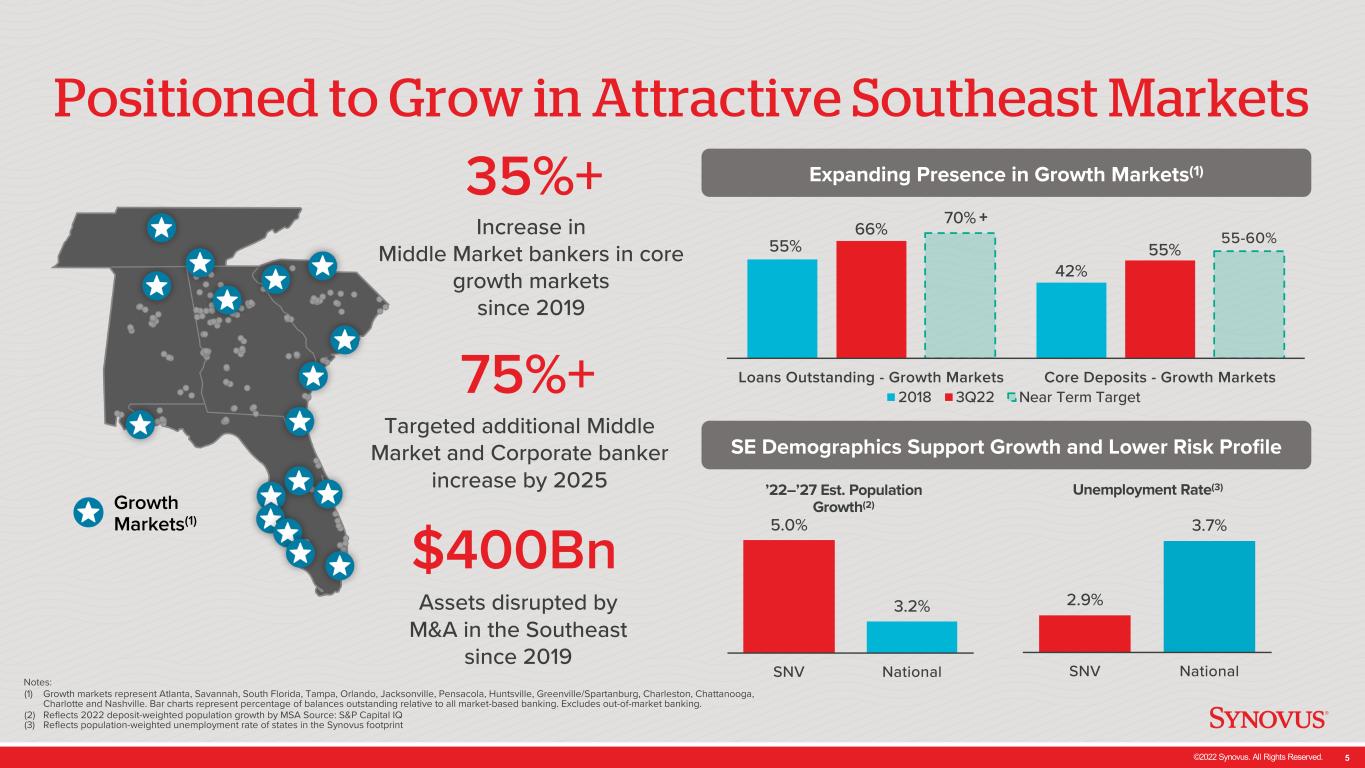
©2022 Synovus. All Rights Reserved. 5 Positioned to Grow in Attractive Southeast Markets Assets disrupted by M&A in the Southeast since 2019 Expanding Presence in Growth Markets(1)35%+ Increase in Middle Market bankers in core growth markets since 2019 75%+ Targeted additional Middle Market and Corporate banker increase by 2025 SE Demographics Support Growth and Lower Risk Profile $400Bn 5.0% 3.2% SNV National ’22–’27 Est. Population Growth(2) 2.9% 3.7% SNV National Unemployment Rate(3) 55% 42% 66% 55% 70% Loans Outstanding - Growth Markets Core Deposits - Growth Markets 2018 3Q22 Near Term Target + Notes: (1) Growth markets represent Atlanta, Savannah, South Florida, Tampa, Orlando, Jacksonville, Pensacola, Huntsville, Greenville/Spartanburg, Charleston, Chattanooga, Charlotte and Nashville. Bar charts represent percentage of balances outstanding relative to all market-based banking. Excludes out-of-market banking. (2) Reflects 2022 deposit-weighted population growth by MSA Source: S&P Capital IQ (3) Reflects population-weighted unemployment rate of states in the Synovus footprint Growth Markets(1) 55-60%
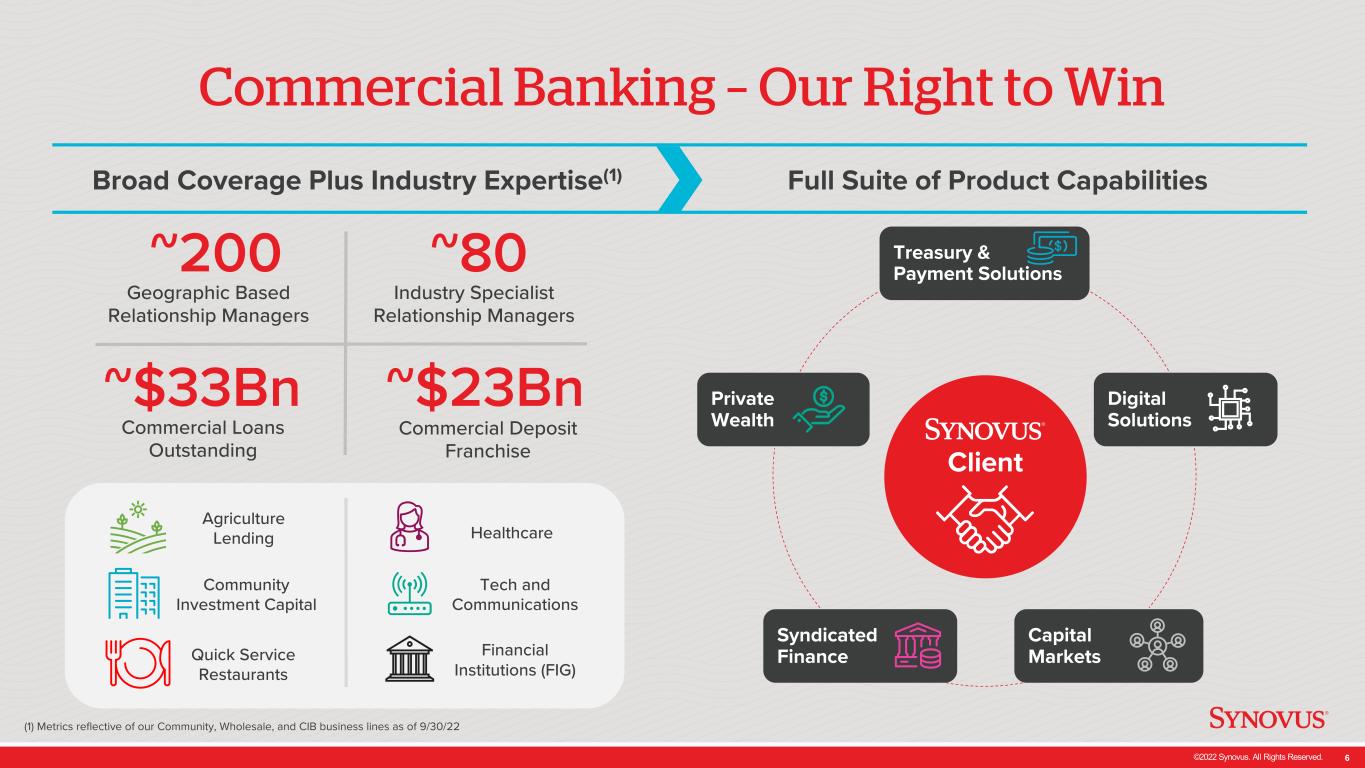
©2022 Synovus. All Rights Reserved. 6 Commercial Banking – Our Right to Win Broad Coverage Plus Industry Expertise(1) Full Suite of Product Capabilities Treasury & Payment Solutions Digital Solutions Capital Markets Syndicated Finance Private Wealth Client Geographic Based Relationship Managers ~200 Industry Specialist Relationship Managers ~80 ~$33Bn Commercial Loans Outstanding ~$23Bn Commercial Deposit Franchise Agriculture Lending Community Investment Capital Quick Service Restaurants Healthcare Tech and Communications Financial Institutions (FIG) (1) Metrics reflective of our Community, Wholesale, and CIB business lines as of 9/30/22
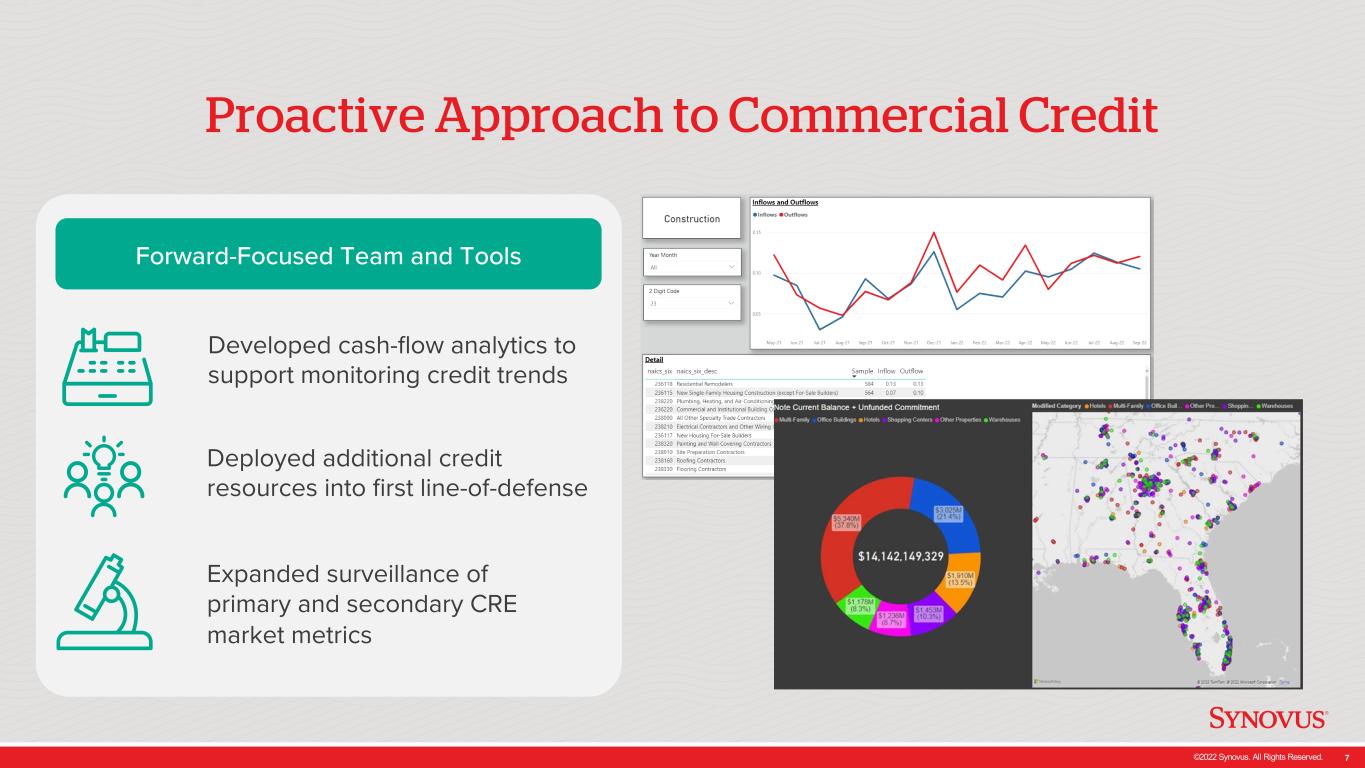
©2022 Synovus. All Rights Reserved. 7 Developed cash-flow analytics to support monitoring credit trends Deployed additional credit resources into first line-of-defense Expanded surveillance of primary and secondary CRE market metrics Proactive Approach to Commercial Credit Forward-Focused Team and Tools
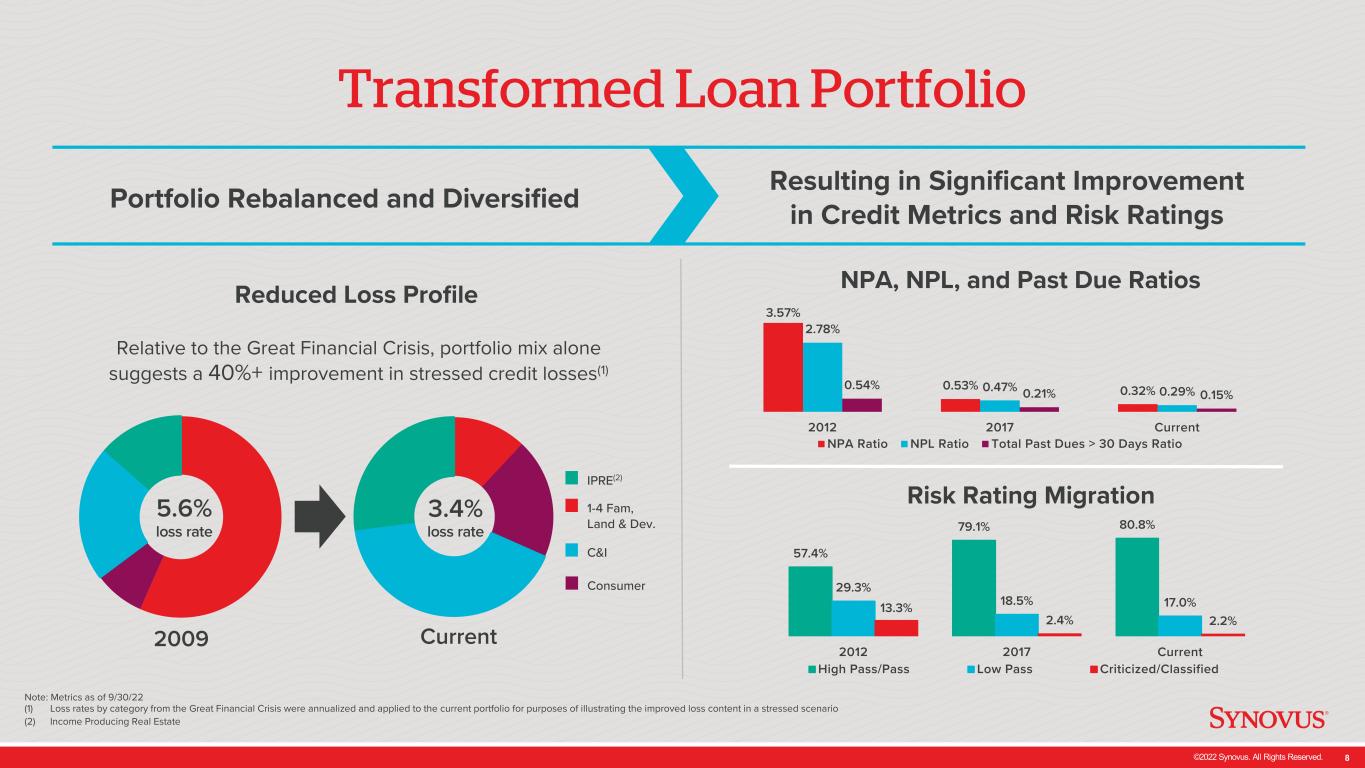
©2022 Synovus. All Rights Reserved. 8 Transformed Loan Portfolio Relative to the Great Financial Crisis, portfolio mix alone suggests a 40%+ improvement in stressed credit losses(1) Reduced Loss Profile Note: Metrics as of 9/30/22 (1) Loss rates by category from the Great Financial Crisis were annualized and applied to the current portfolio for purposes of illustrating the improved loss content in a stressed scenario (2) Income Producing Real Estate Current2009 IPRE(2) 1-4 Fam, Land & Dev. C&I Consumer 5.6% loss rate 3.4% loss rate 3.57% 0.53% 0.32% 2.78% 0.47% 0.29%0.54% 0.21% 0.15% 2012 2017 Current NPA Ratio NPL Ratio Total Past Dues > 30 Days Ratio 57.4% 79.1% 80.8% 29.3% 18.5% 17.0%13.3% 2.4% 2.2% 2012 2017 Current High Pass/Pass Low Pass Criticized/Classified NPA, NPL, and Past Due Ratios Risk Rating Migration Portfolio Rebalanced and Diversified Resulting in Significant Improvement in Credit Metrics and Risk Ratings
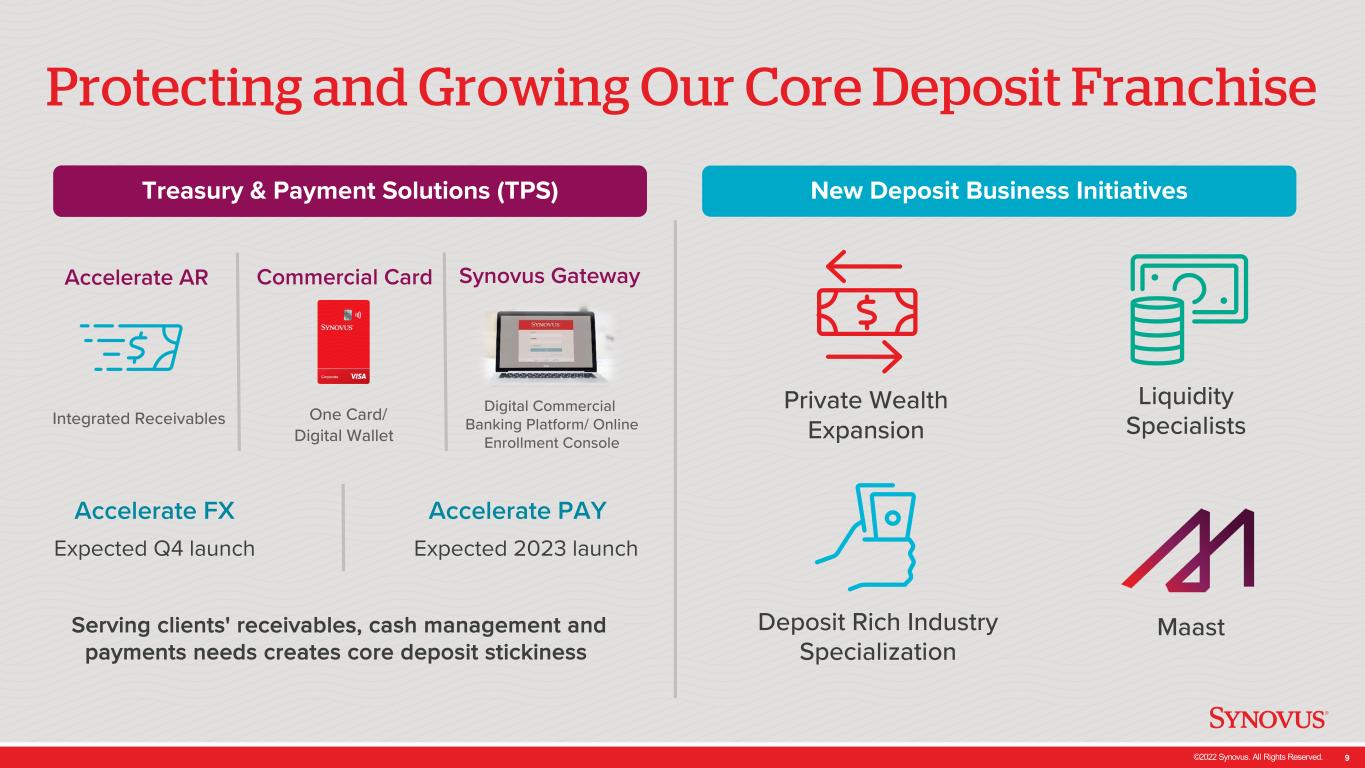
©2022 Synovus. All Rights Reserved. 9 Accelerate AR Synovus GatewayCommercial Card Protecting and Growing Our Core Deposit Franchise Serving clients' receivables, cash management and payments needs creates core deposit stickiness Treasury & Payment Solutions (TPS) One Card/ Digital Wallet Digital Commercial Banking Platform/ Online Enrollment Console Expected Q4 launch Integrated Receivables Accelerate FX Expected 2023 launch Accelerate PAY New Deposit Business Initiatives Private Wealth Expansion Deposit Rich Industry Specialization Maast Liquidity Specialists
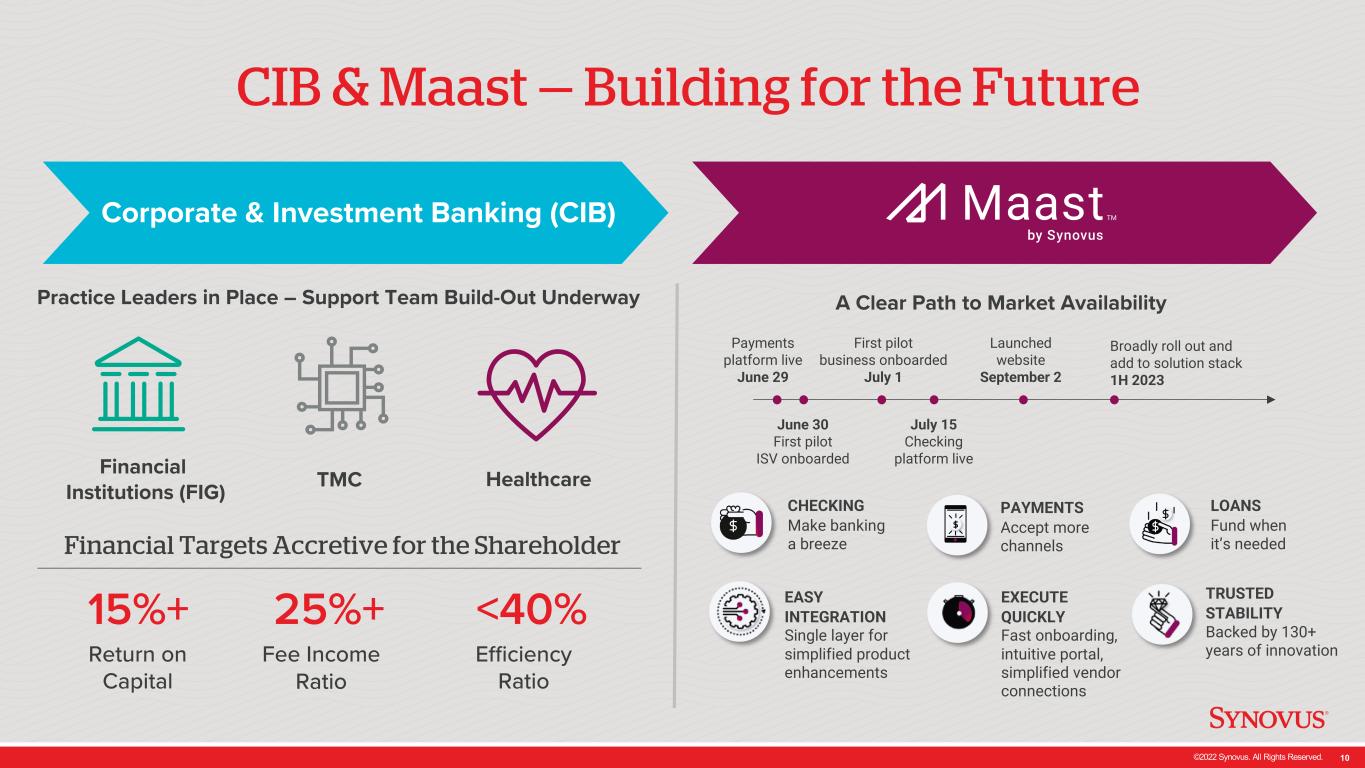
©2022 Synovus. All Rights Reserved. 10 Financial Targets Accretive for the Shareholder CIB & Maast — Building for the Future Corporate & Investment Banking (CIB) Financial Institutions (FIG) TMC Healthcare 15%+ Return on Capital 25%+ Fee Income Ratio <40% Efficiency Ratio A Clear Path to Market Availability PAYMENTS Accept more channels CHECKING Make banking a breeze LOANS Fund when it’s needed EXECUTE QUICKLY Fast onboarding, intuitive portal, simplified vendor connections EASY INTEGRATION Single layer for simplified product enhancements TRUSTED STABILITY Backed by 130+ years of innovation Practice Leaders in Place – Support Team Build-Out Underway June 30 First pilot ISV onboarded Payments platform live June 29 First pilot business onboarded July 1 July 15 Checking platform live Launched website September 2 Broadly roll out and add to solution stack 1H 2023
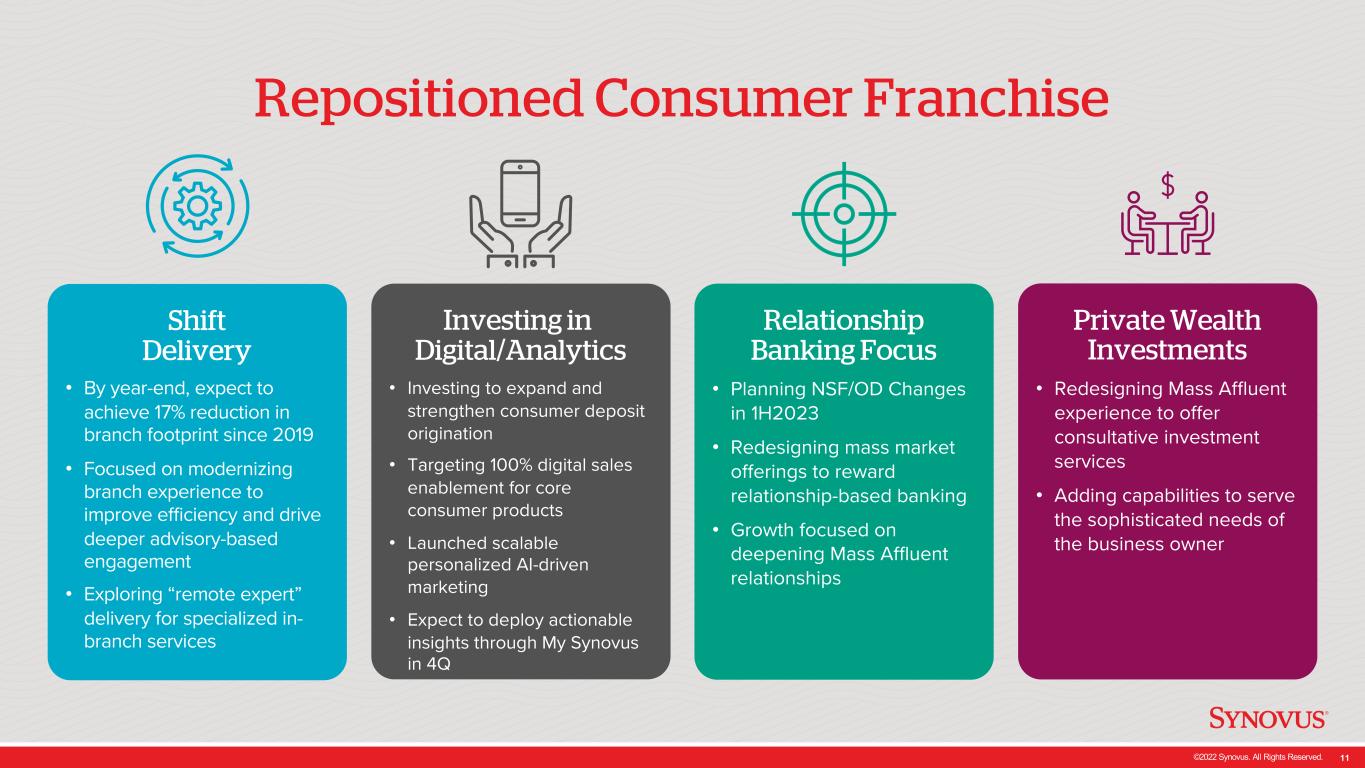
©2022 Synovus. All Rights Reserved. 11 Repositioned Consumer Franchise Shift Delivery • By year-end, expect to achieve 17% reduction in branch footprint since 2019 • Focused on modernizing branch experience to improve efficiency and drive deeper advisory-based engagement • Exploring “remote expert” delivery for specialized in- branch services Investing in Digital/Analytics • Investing to expand and strengthen consumer deposit origination • Targeting 100% digital sales enablement for core consumer products • Launched scalable personalized AI-driven marketing • Expect to deploy actionable insights through My Synovus in 4Q Relationship Banking Focus • Planning NSF/OD Changes in 1H2023 • Redesigning mass market offerings to reward relationship-based banking • Growth focused on deepening Mass Affluent relationships Private Wealth Investments • Redesigning Mass Affluent experience to offer consultative investment services • Adding capabilities to serve the sophisticated needs of the business owner
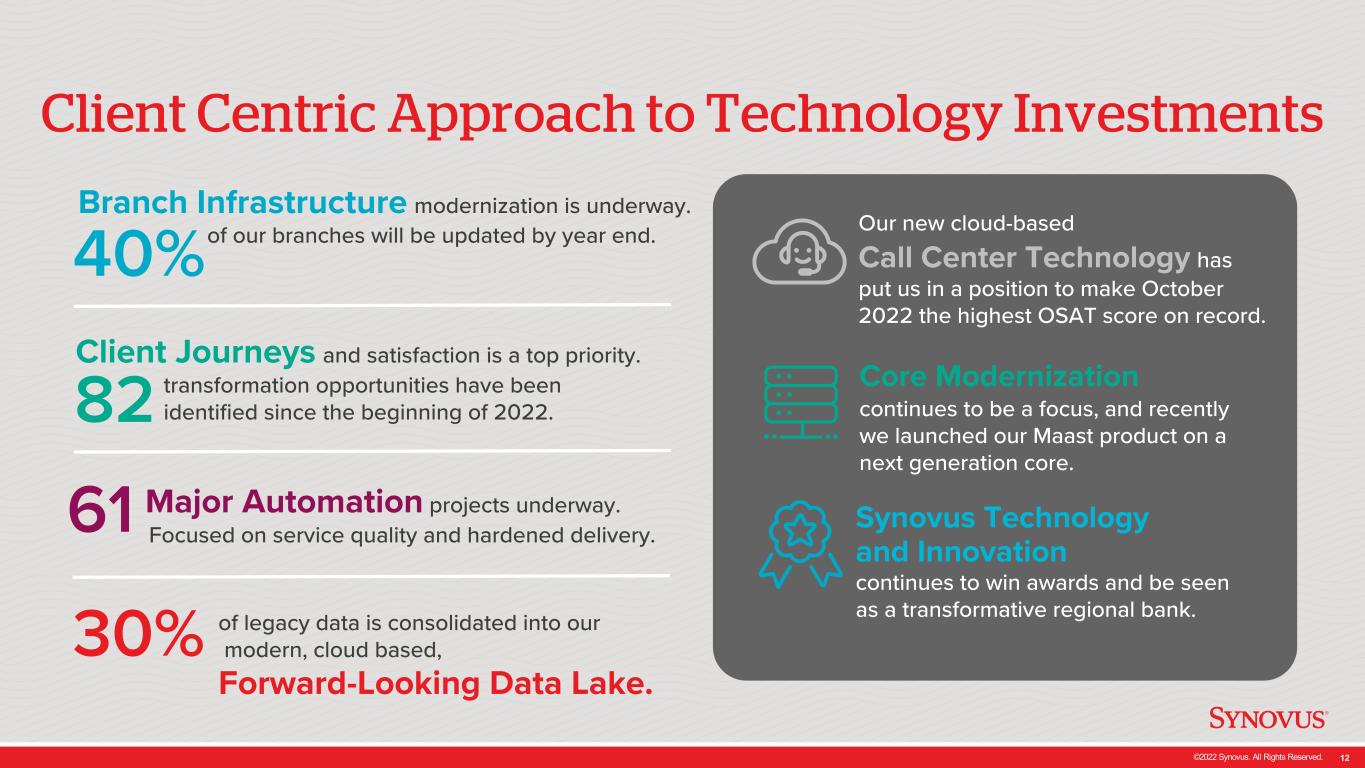
©2022 Synovus. All Rights Reserved. 12 Client Centric Approach to Technology Investments Major Automation projects underway. Focused on service quality and hardened delivery.61 Client Journeys and satisfaction is a top priority. transformation opportunities have been identified since the beginning of 2022.82 40% Branch Infrastructure modernization is underway. of our branches will be updated by year end. Synovus Technology and Innovation continues to win awards and be seen as a transformative regional bank. Our new cloud-based Call Center Technology has put us in a position to make October 2022 the highest OSAT score on record. Core Modernization continues to be a focus, and recently we launched our Maast product on a next generation core. Forward-Looking Data Lake. 30% of legacy data is consolidated into our modern, cloud based,

©2022 Synovus. All Rights Reserved. 13 Note: Metrics as of 9/30/22 (1) Securities portfolio values based on amortized cost (2) As of 3Q22 Stable Capital Ratios & Liquid Balance Sheet Current Operating Range 9.50-9.75% Effective capital and liquidity management are a critical component of our overall growth plan. Robust capital levels Greatly improved liquidity profile available to support growth (1) (2) (2) (2)
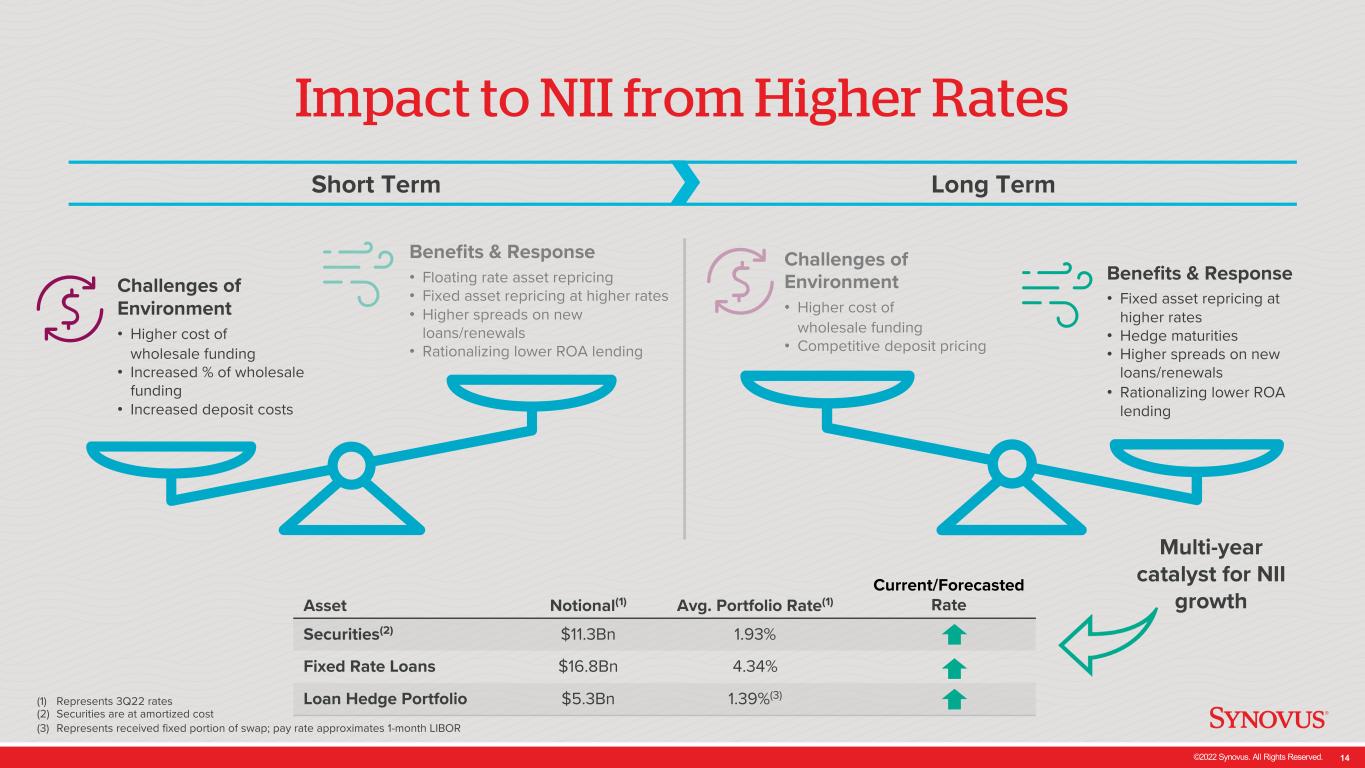
©2022 Synovus. All Rights Reserved. 14 Multi-year catalyst for NII growth Impact to NII from Higher Rates (1) Represents 3Q22 rates (2) Securities are at amortized cost (3) Represents received fixed portion of swap; pay rate approximates 1-month LIBOR Short Term Long Term Asset Notional(1) Avg. Portfolio Rate(1) Current/Forecasted Rate Securities(2) $11.3Bn 1.93% Fixed Rate Loans $16.8Bn 4.34% Loan Hedge Portfolio $5.3Bn 1.39%(3) Benefits & Response • Fixed asset repricing at higher rates • Hedge maturities • Higher spreads on new loans/renewals • Rationalizing lower ROA lending Benefits & Response • Floating rate asset repricing • Fixed asset repricing at higher rates • Higher spreads on new loans/renewals • Rationalizing lower ROA lending Challenges of Environment • Higher cost of wholesale funding • Increased % of wholesale funding • Increased deposit costs Challenges of Environment • Higher cost of wholesale funding • Competitive deposit pricing
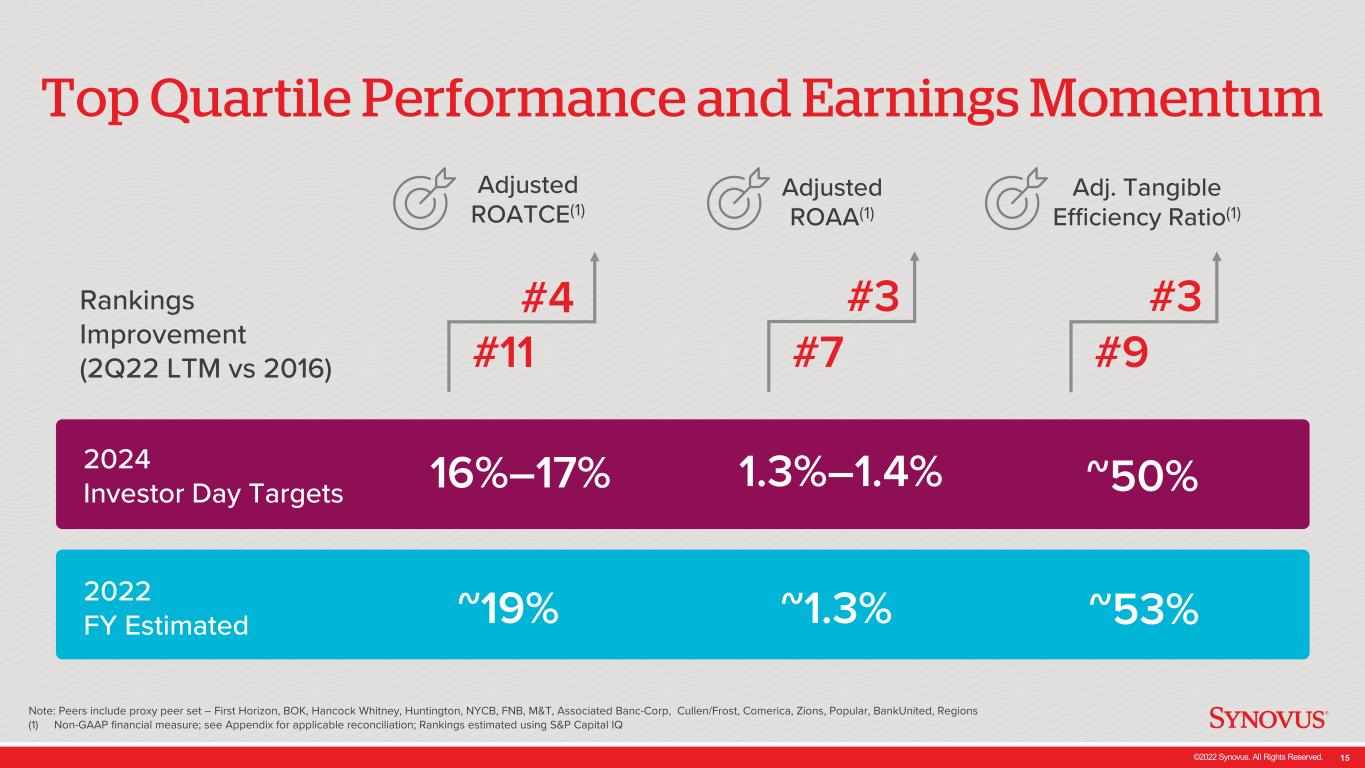
©2022 Synovus. All Rights Reserved. 15 Note: Peers include proxy peer set – First Horizon, BOK, Hancock Whitney, Huntington, NYCB, FNB, M&T, Associated Banc-Corp, Cullen/Frost, Comerica, Zions, Popular, BankUnited, Regions (1) Non-GAAP financial measure; see Appendix for applicable reconciliation; Rankings estimated using S&P Capital IQ Top Quartile Performance and Earnings Momentum Adjusted ROATCE(1) #11 #4 Adjusted ROAA(1) #7 #3 2024 Investor Day Targets 16%–17% 1.3%–1.4% ~50% 2022 FY Estimated ~19% ~1.3% ~53% Rankings Improvement (2Q22 LTM vs 2016) Adj. Tangible Efficiency Ratio(1) #9 #3
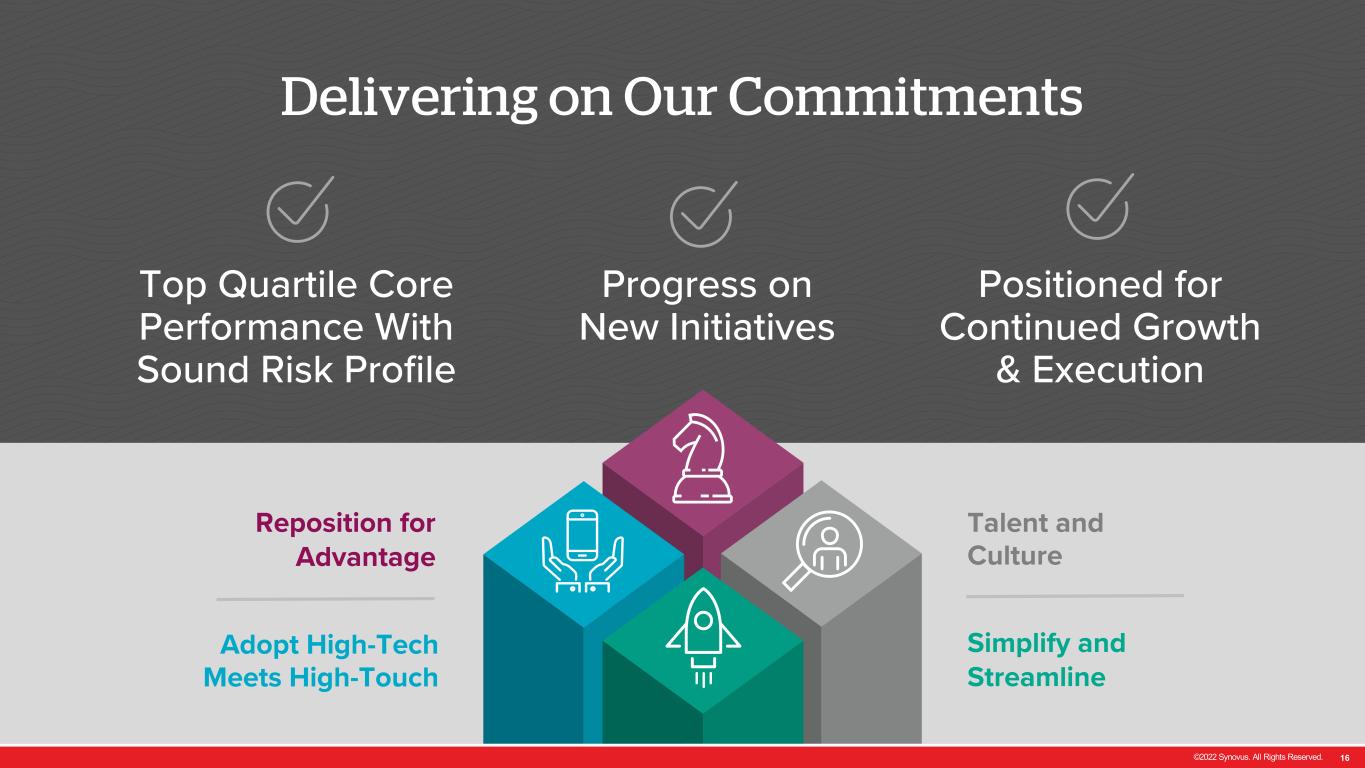
©2022 Synovus. All Rights Reserved. 16 Delivering on Our Commitments Reposition for Advantage Simplify and Streamline Adopt High-Tech Meets High-Touch Talent and Culture Top Quartile Core Performance With Sound Risk Profile Progress on New Initiatives Positioned for Continued Growth & Execution

©2022 Synovus. All Rights Reserved. 17 Appendix
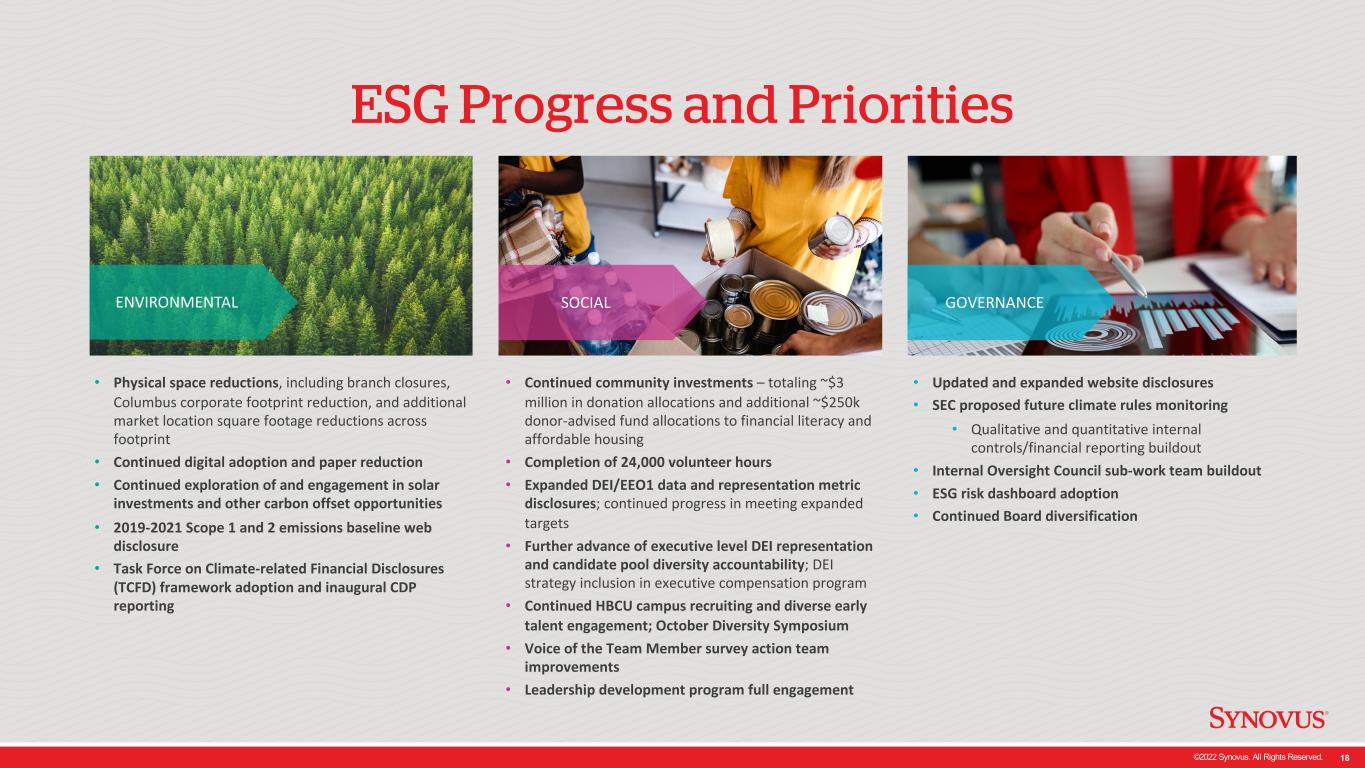
©2022 Synovus. All Rights Reserved. 18 ESG Progress and Priorities • Updated and expanded website disclosures • SEC proposed future climate rules monitoring • Qualitative and quantitative internal controls/financial reporting buildout • Internal Oversight Council sub-work team buildout • ESG risk dashboard adoption • Continued Board diversification • Continued community investments – totaling ~$3 million in donation allocations and additional ~$250k donor-advised fund allocations to financial literacy and affordable housing • Completion of 24,000 volunteer hours • Expanded DEI/EEO1 data and representation metric disclosures; continued progress in meeting expanded targets • Further advance of executive level DEI representation and candidate pool diversity accountability; DEI strategy inclusion in executive compensation program • Continued HBCU campus recruiting and diverse early talent engagement; October Diversity Symposium • Voice of the Team Member survey action team improvements • Leadership development program full engagement ENVIRONMENTAL • Physical space reductions, including branch closures, Columbus corporate footprint reduction, and additional market location square footage reductions across footprint • Continued digital adoption and paper reduction • Continued exploration of and engagement in solar investments and other carbon offset opportunities • 2019-2021 Scope 1 and 2 emissions baseline web disclosure • Task Force on Climate-related Financial Disclosures (TCFD) framework adoption and inaugural CDP reporting SOCIAL GOVERNANCE
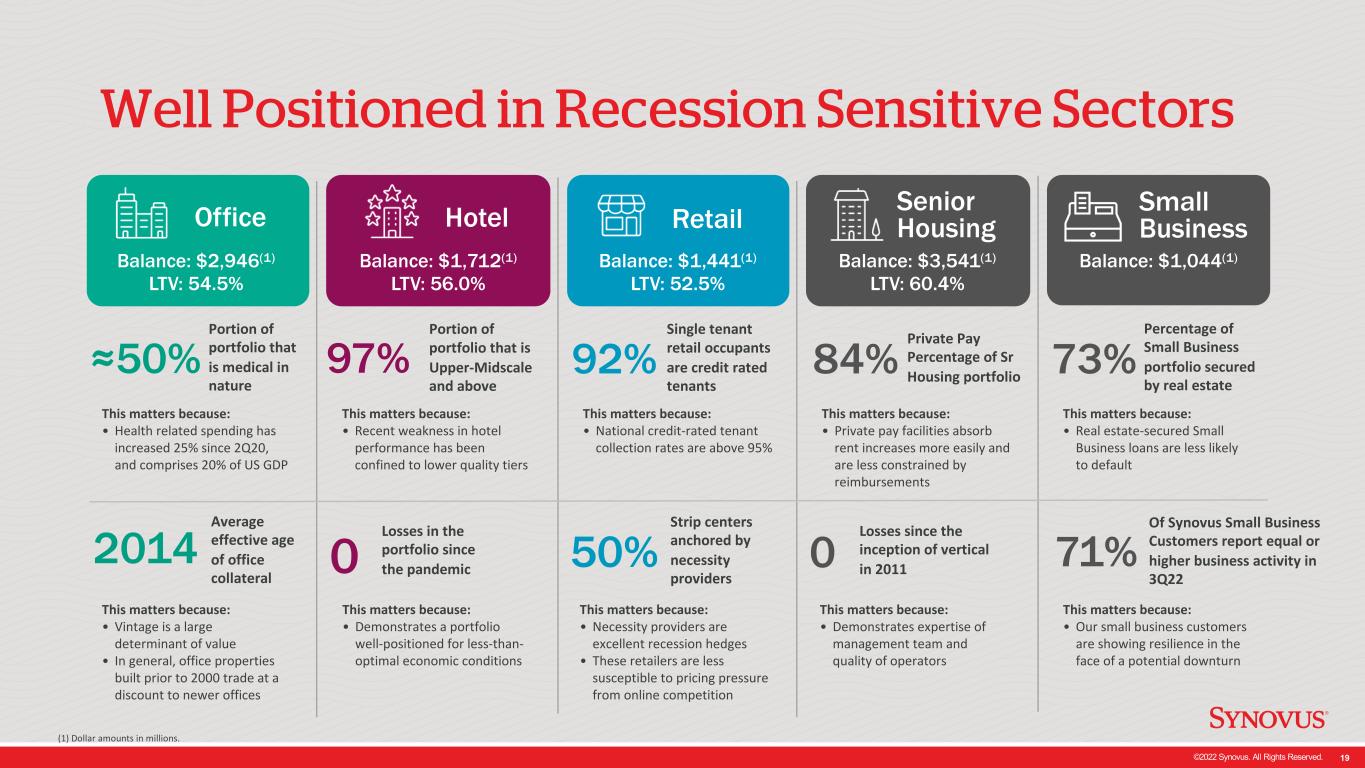
©2022 Synovus. All Rights Reserved. 19 Well Positioned in Recession Sensitive Sectors (1) Dollar amounts in millions. 2014 Office ≈50% This matters because: • Health related spending has increased 25% since 2Q20, and comprises 20% of US GDP Portion of portfolio that is medical in nature Average effective age of office collateral This matters because: • Vintage is a large determinant of value • In general, office properties built prior to 2000 trade at a discount to newer offices Senior HousingOffice Hotel Retail 97% 0 Portion of portfolio that is Upper-Midscale and above Losses in the portfolio since the pandemic 92% 50% Single tenant retail occupants are credit rated tenants Strip centers anchored by necessity providers 0 84% Losses since the inception of vertical in 2011 Private Pay Percentage of Sr Housing portfolio This matters because: • Recent weakness in hotel performance has been confined to lower quality tiers This matters because: • Demonstrates a portfolio well-positioned for less-than- optimal economic conditions This matters because: • National credit-rated tenant collection rates are above 95% This matters because: • Necessity providers are excellent recession hedges • These retailers are less susceptible to pricing pressure from online competition This matters because: • Demonstrates expertise of management team and quality of operators This matters because: • Private pay facilities absorb rent increases more easily and are less constrained by reimbursements Balance: $3,541(1) LTV: 60.4% Balance: $1,441(1) LTV: 52.5% Balance: $1,712(1) LTV: 56.0% Balance: $2,946(1) LTV: 54.5% Small Business This matters because: • Our small business customers are showing resilience in the face of a potential downturn This matters because: • Real estate-secured Small Business loans are less likely to default Balance: $1,044(1) 73% 71% Percentage of Small Business portfolio secured by real estate Of Synovus Small Business Customers report equal or higher business activity in 3Q22
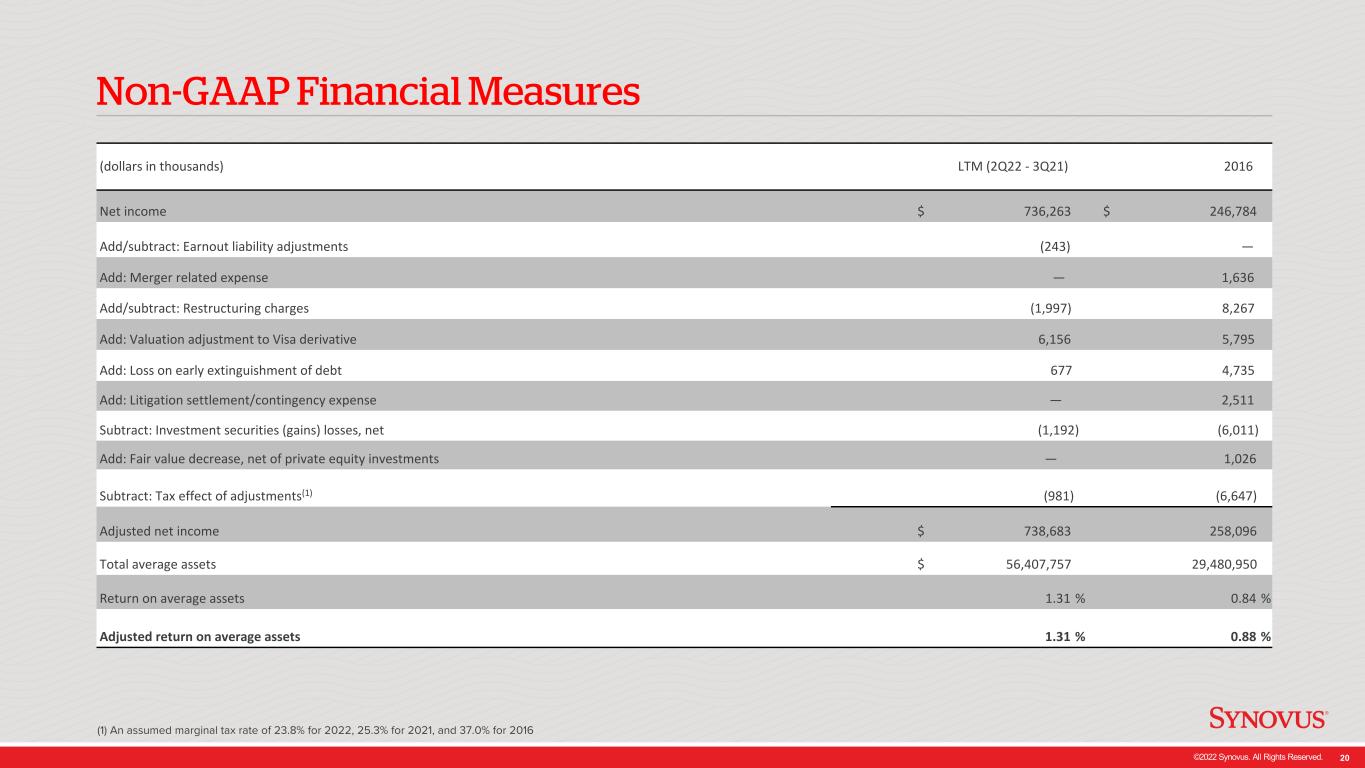
©2022 Synovus. All Rights Reserved. 20 (dollars in thousands) LTM (2Q22 - 3Q21) 2016 Net income $ 736,263 $ 246,784 Add/subtract: Earnout liability adjustments (243) — Add: Merger related expense — 1,636 Add/subtract: Restructuring charges (1,997) 8,267 Add: Valuation adjustment to Visa derivative 6,156 5,795 Add: Loss on early extinguishment of debt 677 4,735 Add: Litigation settlement/contingency expense — 2,511 Subtract: Investment securities (gains) losses, net (1,192) (6,011) Add: Fair value decrease, net of private equity investments — 1,026 Subtract: Tax effect of adjustments(1) (981) (6,647) Adjusted net income $ 738,683 258,096 Total average assets $ 56,407,757 29,480,950 Return on average assets 1.31 % 0.84 % Adjusted return on average assets 1.31 % 0.88 % Non-GAAP Financial Measures (1) An assumed marginal tax rate of 23.8% for 2022, 25.3% for 2021, and 37.0% for 2016

©2022 Synovus. All Rights Reserved. 21 (dollars in thousands) LTM (2Q22 - 3Q21) 2016 Net income available to common shareholders $ 703,099 $ 236,546 Add/subtract: Earnout liability adjustments (243) — Add: Merger related expense — 1,636 Add/subtract: Restructuring charges (1,997) 8,267 Add: Valuation adjustment to Visa derivative 6,156 5,795 Add: Loss on early extinguishment of debt 677 4,735 Add: Litigation settlement/contingency expense — 2,511 Subtract: Investment securities (gains) losses, net (1,192) (6,011) Add: Fair value decrease, net of private equity investments — 1,026 Subtract: Tax effect of adjustments(1) (981) (6,647) Adjusted net income available to common shareholders $ 705,519 $ 247,858 Add: Amortization of intangibles, tax effected 6,782 328 Adjusted net income available to common shareholders excluding amortization of intangibles annualized $ 712,301 $ 248,186 Net income available to common shareholders $ 703,099 $ 236,546 Add: Amortization of intangibles, tax effected 6,782 328 Net income available to common shareholders excluding amortization of intangibles annualized $ 709,881 $ 236,874 Total average shareholders' equity less preferred stock $ 4,318,450 $ 2,813,526 Subtract: Goodwill (452,390) (32,151) Subtract: Other intangible assets, net (34,602) (269) Total average tangible shareholders' equity less preferred stock $ 3,831,458 $ 2,781,106 Return on average common equity 16.28 % 8.41 % Adjusted return on average common equity 16.34 % 8.81 % Return on average tangible common equity 18.53 % 8.52 % Adjusted return on average tangible common equity 18.59 % 8.92 % Non-GAAP Financial Measures (1) An assumed marginal tax rate of 23.8% for 2022, 25.3% for 2021, and 37.0% for 2016
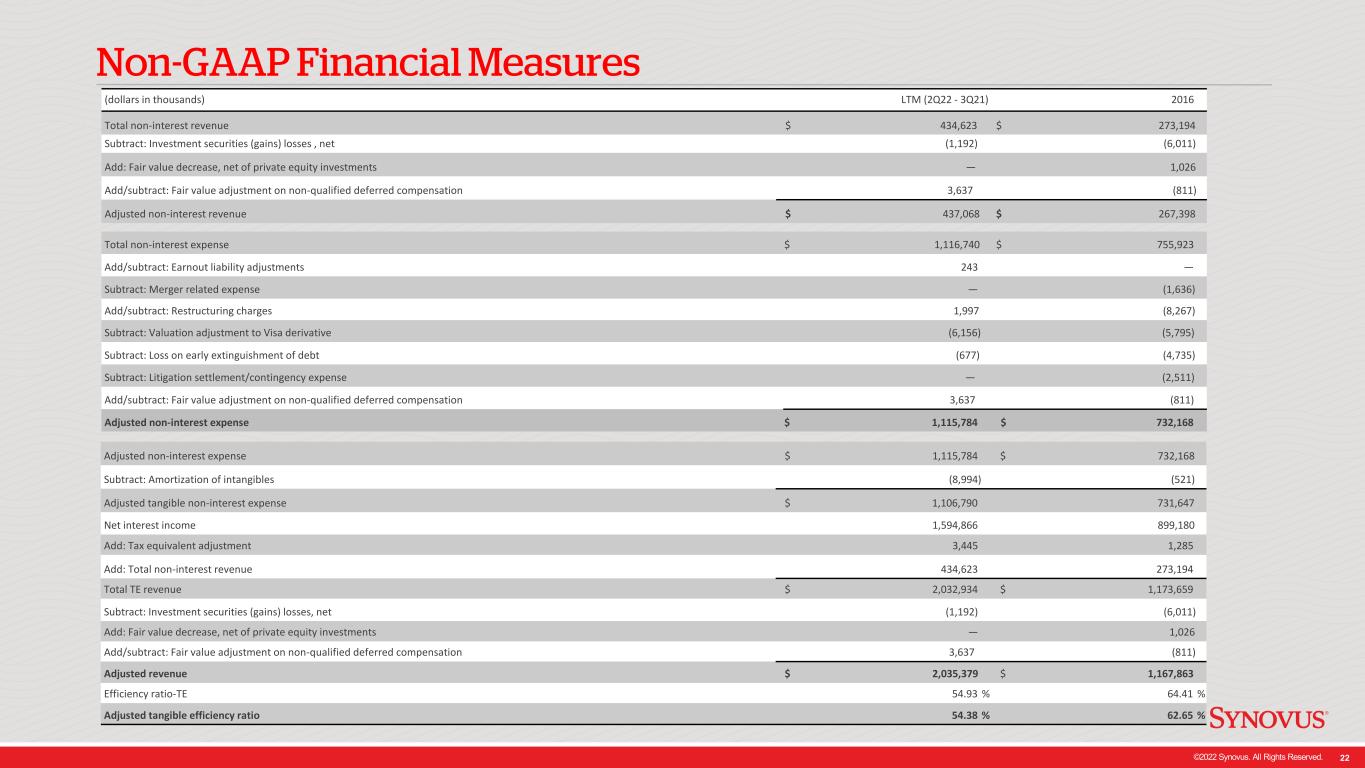
©2022 Synovus. All Rights Reserved. 22 (dollars in thousands) LTM (2Q22 - 3Q21) 2016 Total non-interest revenue $ 434,623 $ 273,194 Subtract: Investment securities (gains) losses , net (1,192) (6,011) Add: Fair value decrease, net of private equity investments — 1,026 Add/subtract: Fair value adjustment on non-qualified deferred compensation 3,637 (811) Adjusted non-interest revenue $ 437,068 $ 267,398 Total non-interest expense $ 1,116,740 $ 755,923 Add/subtract: Earnout liability adjustments 243 — Subtract: Merger related expense — (1,636) Add/subtract: Restructuring charges 1,997 (8,267) Subtract: Valuation adjustment to Visa derivative (6,156) (5,795) Subtract: Loss on early extinguishment of debt (677) (4,735) Subtract: Litigation settlement/contingency expense — (2,511) Add/subtract: Fair value adjustment on non-qualified deferred compensation 3,637 (811) Adjusted non-interest expense $ 1,115,784 $ 732,168 Adjusted non-interest expense $ 1,115,784 $ 732,168 Subtract: Amortization of intangibles (8,994) (521) Adjusted tangible non-interest expense $ 1,106,790 731,647 Net interest income 1,594,866 899,180 Add: Tax equivalent adjustment 3,445 1,285 Add: Total non-interest revenue 434,623 273,194 Total TE revenue $ 2,032,934 $ 1,173,659 Subtract: Investment securities (gains) losses, net (1,192) (6,011) Add: Fair value decrease, net of private equity investments — 1,026 Add/subtract: Fair value adjustment on non-qualified deferred compensation 3,637 (811) Adjusted revenue $ 2,035,379 $ 1,167,863 Efficiency ratio-TE 54.93 % 64.41 % Adjusted tangible efficiency ratio 54.38 % 62.65 % Non-GAAP Financial Measures


