Exhibit 99.1
| Monday, September 14, 2009 1 |
Forward-looking statements
This presentation contains statements that constitute “forward-looking statements” within the
meaning of the Securities Act of 1933 and the Securities Exchange Act of 1934 as amended by the
Private Securities Litigation Reform Act of 1995. These forward-looking statements include, among
others, our statements regarding (1) estimated proceeds of the offering, (2) our pro forma capital
position and ratios following the execution of our capital plan, (3) our expectations regarding our
improvement in net interest margin, (4) expectations regarding the dollar amount of distressed
assets dispositions in the second half of 2009, (5) our outlook regarding our asset disposition
strategy and stabilization of non-performing loans, (6) the assumptions used in our capital
analysis,
(7) our potential earnings power following the execution of our capital plan, (8) the illustrative
loss
analysis under the SCAP more adverse scenario and (9) the assumptions underlying our
expectations. Prospective investors are cautioned that any such forward-looking statements speak
only as of the date hereof and are not guarantees of future performance and involve risks and
uncertainties, and that actual results may differ materially from those contemplated by such
forward-looking statements. A number of important factors could cause actual results to differ
materially from those contemplated by the forward-looking statements in this presentation,
including, without limitation, the risks, uncertainties and factors set forth in our Annual Report
on
Form 10-K, our Quarterly Reports on Form 10-Q, our Current Reports on Form 8-K and our other
filings with the SEC. Many of these factors are beyond our ability to control or predict. Synovus
does
not assume any obligation to update any forward-looking statements as a result of new information,
future developments or otherwise.
Monday, September 14, 2009 2
SYNOVUS®
"3
Use of non-GAAP financial measuresGAAP FINANCIAL MEASURES
This presentation contains certain non-GAAP financial measures determined by methods
other than in accordance with generally accepted accounting principles. Such non-GAAP
financial measures include the following: pre-tax, pre-credit costs income; core deposits;
net interest margin excluding negative impact of non-performing assets; fundamental G&A
expense; the ratio of tangible common equity to tangible assets; and the ratio of pre-tax,
pre-credit costs income to risk-weighted assets. The most comparable GAAP measures to
these measures are pre-tax income (loss); total deposits; net interest margin; total noninterest
expense; and the ratio of total equity to total assets, respectively. Synovus’
management uses these non-GAAP financial measures to assess the performance of
Synovus’ core business and the strength of its capital position. Synovus believes that these
non-GAAP financial measures provide additional meaningful information about Synovus to
assist investors in evaluating Synovus’ operating results, financial strength and capital
position. These non-GAAP measures should not be considered as a substitute for
operating results determined in accordance with GAAP and may not be comparable to
other similarly titled measures at other companies. The computations of the non-GAAP
financial measures used in this presentation are set forth in the Appendix to this
presentation.
Monday, September 14, 2009 3
SYNOVUS®
INVESTInvMENT HIGHLIGHTS
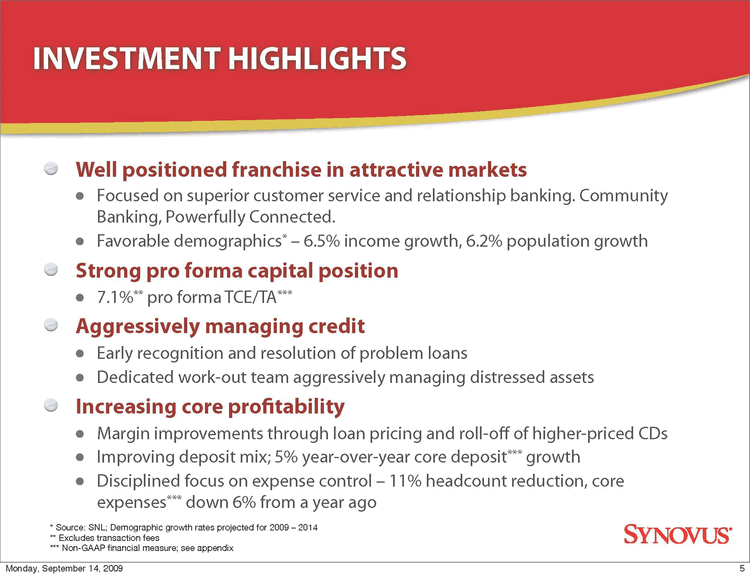
Well positioned franchise in attractive markets
· Focused on superior customer service and relationship banking. Community
Banking, Powerfully Connected.
· Favorable demographics* — 6.5% income growth, 6.2% population growth
Strong pro forma capital position
· 7.1%** pro forma TCE/TA***
Aggressively managing credit
· Early recognition and resolution of problem loans
· Dedicated work-out team aggressively managing distressed assets
Increasing core profitability
· Margin improvements through loan pricing and roll-off of higher-priced CDs
· Improving deposit mix; 5% year-over-year core deposit*** growth
· Disciplined focus on expense control — 11% headcount reduction, core
expenses*** down 6% from a year ago
* Source: SNL; Demographic growth rates projected for 2009 — 2014
** Excludes transaction fees
*** Non-GAAP financial measure; see appendix
Monday, September 14, 2009 5
Investment Highlights SYNOVUS®
6
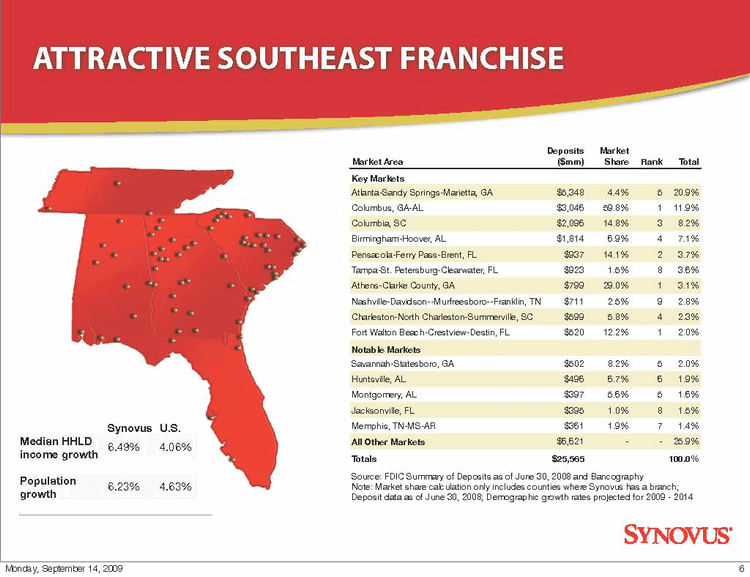
ATTRACTIVE SOUTHEAST FRANCHISE
Market Area
Deposits
($mm)
Market
Share Rank Total
Key Markets
Atlanta-Sandy Springs-Marietta, GA $5,348 4.4% 5 20.9%
Columbus, GA-AL $3,046 59.8% 1 11.9%
Columbia, SC $2,096 14.8% 3 8.2%
Birmingham-Hoover, AL $1,814 6.9% 4 7.1%
Pensacola-Ferry Pass-Brent, FL $937 14.1% 2 3.7%
Tampa-St. Petersburg-Clearwater, FL $923 1.5% 8 3.6%
Athens-Clarke County, GA $799 29.0% 1 3.1%
Nashville-Davidson—Murfreesboro—Franklin, TN $711 2.5% 9 2.8%
Charleston-North Charleston-Summerville, SC $599 5.8% 4 2.3%
Fort Walton Beach-Crestview-Destin, FL $520 12.2% 1 2.0%
Notable Markets
Savannah-Statesboro, GA $502 8.2% 5 2.0%
Huntsville, AL $496 6.7% 6 1.9%
Montgomery, AL $397 5.6% 5 1.6%
Jacksonville, FL $395 1.0% 8 1.5%
Memphis, TN-MS-AR $361 1.9% 7 1.4%
All Other Markets$6,621 — - 25.9%
Totals $25,565 100.0%
Source: FDIC Summary of Deposits as of June 30, 2008 and Bancography
Note: Market share calculation only includes counties where Synovus has a branch;
Deposit data as of June 30, 2008; Demographic growth rates projected for 2009 — 2014
Synovus U.S.
Median HHLD
income growth
6.49% 4.06%
Population
growth
6.23% 4.63%
Monday, September 14, 2009 6
Attractive Southeast Franchise SYNOVUS®
UNIQUE FRANCHISE WELL POSITIONED TO BENEFIT
FROM DISLOCATION IN THE SOUTHEAST
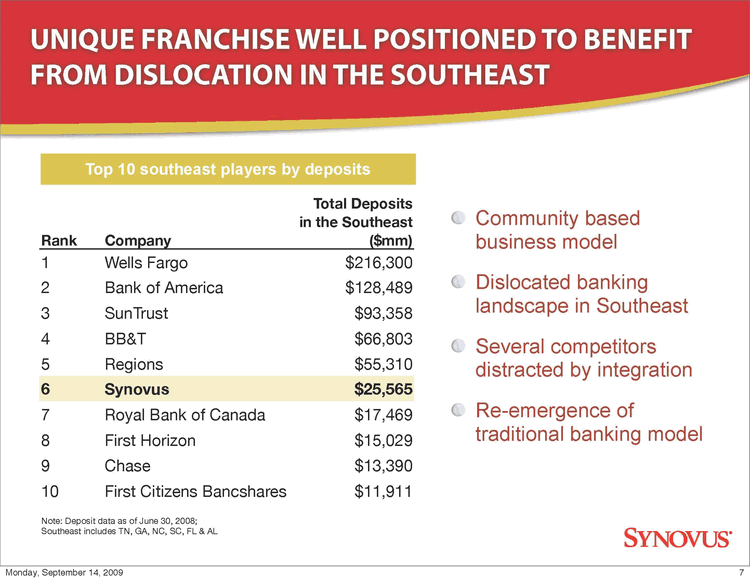
Top 10 southeast players by deposits
Note: Deposit data as of June 30, 2008;
Southeast includes TN, GA, NC, SC, FL & AL
Community based
business model
Dislocated banking
landscape in Southeast
Several competitors
distracted by integration
Re-emergence of
traditional banking model
Rank Company
Total Deposits
in the Southeast
($mm)
1 Wells Fargo $216,300
2 Bank of America $128,489
3 SunTrust $93,358
4 BB&T $66,803
5 Regions $55,310
6 Synovus $25,565
7 Royal Bank of Canada $17,469
8 First Horizon $15,029
9 Chase $13,390
10 First Citizens Bancshares $11,911
Monday, September 14, 2009 7
Inique Franchise Well Positioned to Benefit from Dislocation in the Southeast
SYNOVUS®
CAPITAL PLAN
Monday, September 14, 2009 8 SYNOVUS®
9
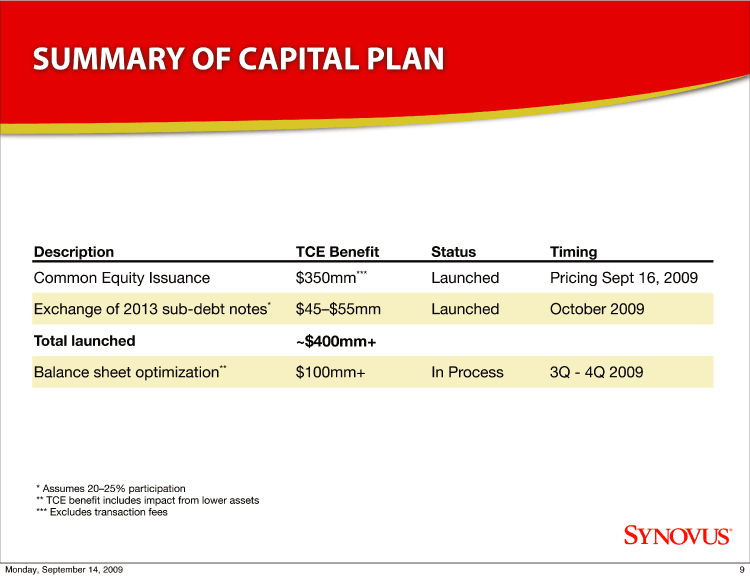
SUMMARY OF CAPITAL PLAN
Description TCE Benefit Status Timing
Common Equity Issuance $350mm*** Launched Pricing Sept 16, 2009
Exchange of 2013 sub-debt notes* $45—$55mm Launched October 2009
Total launched ~$400mm+
Balance sheet optimization** $100mm+ In Process 3Q — 4Q 2009
* Assumes 20—25% participation
** TCE benefit includes impact from lower assets assuming 6% TCE/TA
*** Excludes transaction fees
Monday, September 14, 2009 9
SYNOVUS®
10
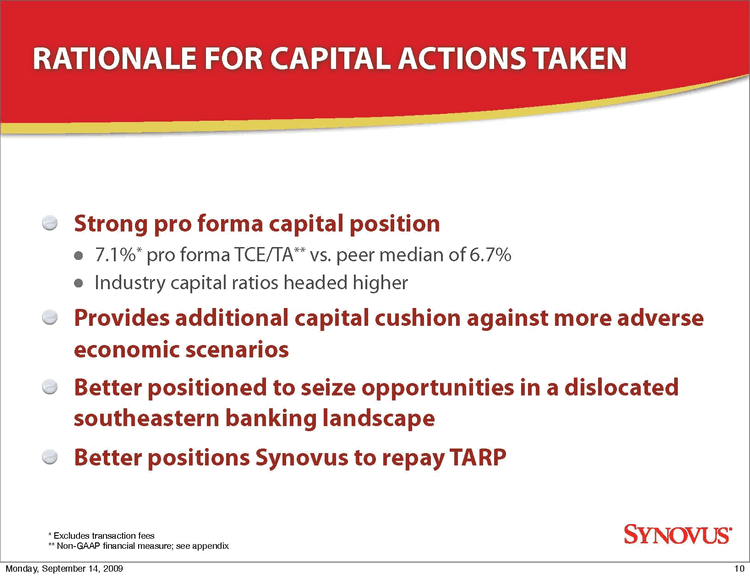
RATIONALE FOR CAPITAL ACTIONS TAKEN Strong pro forma capital position 7.1%* pro forma TCE/TA** vs. peer median of 6.7% Industry capital ratios headed higher Provides additional capital cushion against more adverse economic scenarios Better positioned to seize opportunities in a dislocated southeastern banking landscape Better positions Synovus to repay TARP Excludes transaction fees Non-GAAP financial measure; see appendix Monday, September 14, 2009
SYNOVUS®
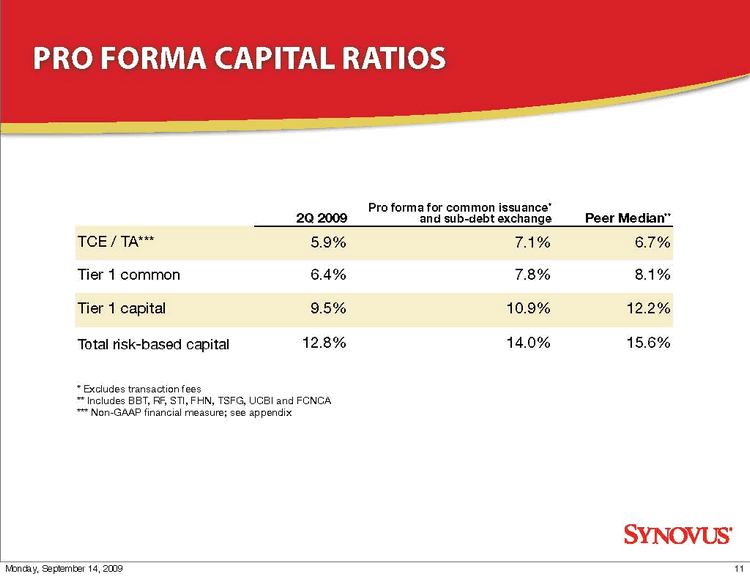
PRO FORMA CAPITAL RATIOS Pro forma for common issuance* 2Q 2009 and sub-debt exchange Peer Median** TCE / TA*** 5.9% 7.1% 6.7% Tier 1 common 6.4% 7.8% 8.1% Tier 1 capital 9.5% 10.9% 12.2% Total risk-based capital 12.8% 14.0% 15.6% Excludes transaction fees Includes BBT, RF, STI, FHN, TSFG, UCBI and FCNCA Non-GAAP financial measure; see appendix Monday, September 14, 2009 11 SYNOVUS®
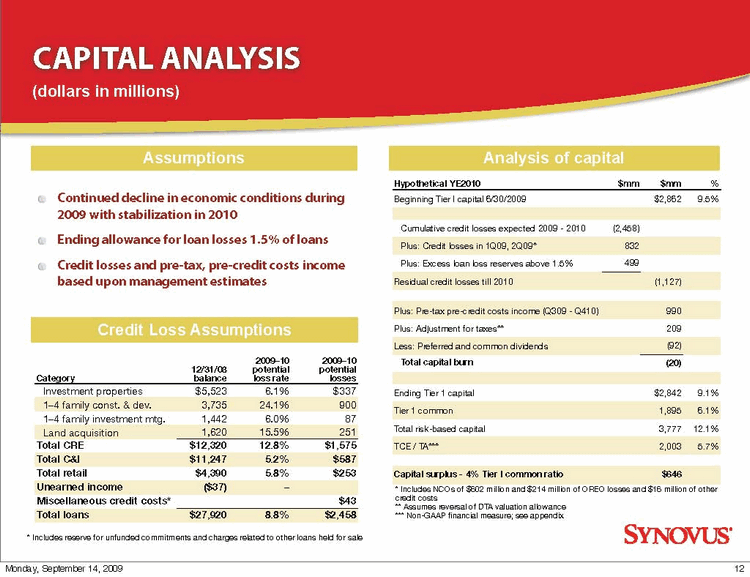
CAPITAL ANALYSIS (dollars in millions) Assumptions Continued decline in economic conditions during 2009 with stabilization in 2010 Ending allowance for loan losses 1.5% of loans Credit losses and pre-tax, pre-credit costs income based upon management estimates Credit Loss Assumptions 2009-10 2009-10 12/31/08 potential potential Category balance loss rate losses Investment properties $5,523 6.1% $337 1-4 family const. & dev. 3,735 24.1% 900 1-4 family investment mtg. 1,442 6.0% 87 Land acquisition 1,620 15.5% 251 Total CRE $12,320 12.8% $1,575 Total C & I $11,247 5.2% $587 Total retail $4,390 5.8% $253 Unearned income ($37) - Miscellaneous credit costs* $43 Total loans $27,920 8.8% $2,458 12 * Includes reserve for unfunded commitments and charges related to other loans held for sale Analysis of capital Hypothetical YE2010 $mm $mm % Beginning Tier I capital 6/30/2009 $2,862 9.5% Cumulative credit losses expected 2009 - 2010 (2,458) Plus: Credit losses in 1Q09, 2Q09* 832 Plus: Excess loan loss reserves above 1.5% 499 Residual credit losses till 2010 (1,127) Plus: Pre-tax pre-credit costs income (Q309 - Q410) 990 Plus: Adjustment for taxes** 209 Less: Preferred and common dividends (92) Total capital burn (20) Ending Tier 1 capital $2,842 9.1% Tier 1 common 1,895 6.1% Total risk-based capital 3,777 12.1% TCE / TA*** 2,003 5.7% Capital surplus - 4% Tier I common ratio $646 * Includes NCOs of $602 million and $214 million of OREO losses and $16 million of other credit costs ** Assumes reversal of DTA valuation allowance *** Non-GAAP financial measure; see appendix Monday, September 14, 2009 12 SYNOVUS®
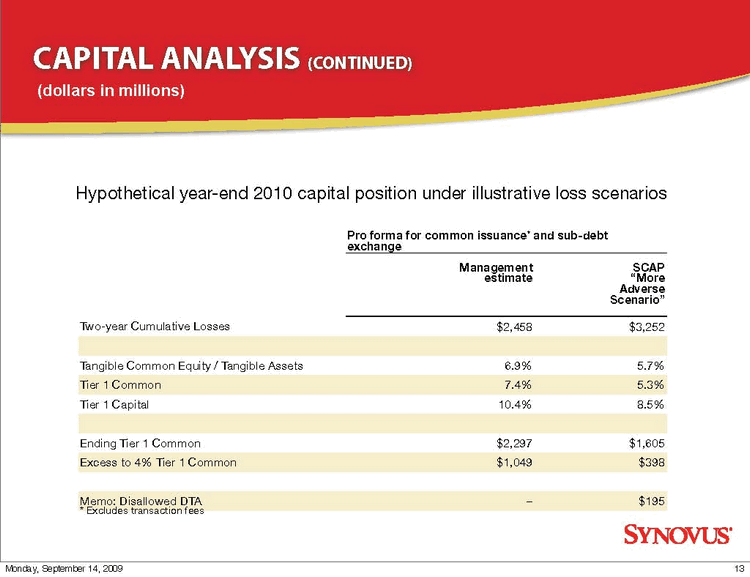
CAPITAL ANALYSIS (CONTINUED) (dollars in millions) Hypothetical year-end 2010 capital position under illustrative loss scenarios Pro forma for common issuance* and sub-debt exchange Management SCAP estimate More Adverse Scenario Two-year Cumulative Losses $2,458 $3,252 Tangible Common Equity / Tangible Assets 6.9% 5.7% Tier 1 Common 7.4% 5.3% Tier 1 Capital 10.4% 8.5% Ending Tier 1 Common $2,297 $1,605 Excess to 4% Tier 1 Common $1,049 $398 Memo: Disallowed DTA - $195 * Excludes transaction fees Monday, September 14, 2009 13 SYNOVUS®
CREDIT PROCESS AND UPDATE
Monday, September 14, 2009 14
SYNOVUS®
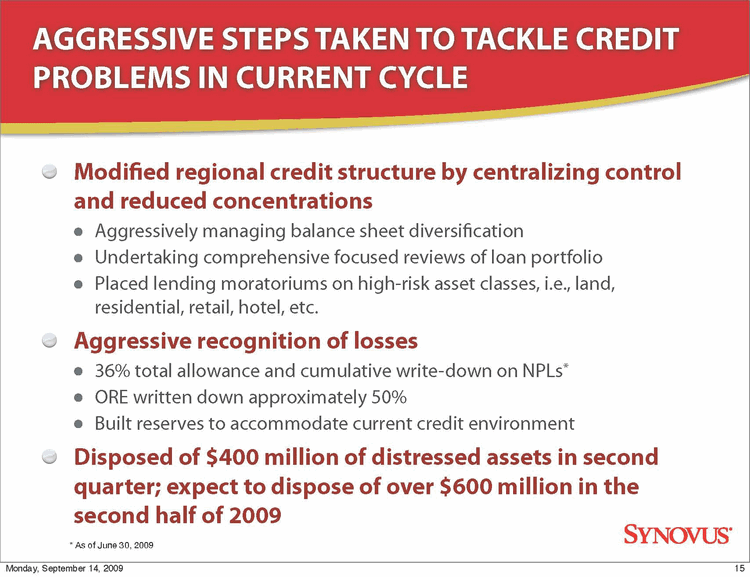
AGGRESSIVE STEPS TAKEN TO TACKLE CREDIT
PROBLEMS IN CURRENT CYCLE
Modified regional credit structure by centralizing control
and reduced concentrations
· Aggressively managing balance sheet diversification
· Undertaking comprehensive focused reviews of loan portfolio
· Placed lending moratoriums on high-risk asset classes, i.e., land,
residential, retail, hotel, etc.
Aggressive recognition of losses
· 36% total allowance and cumulative write-down on NPLs*
· ORE written down approximately 50%
· Built reserves to accommodate current credit environment
Disposed of $400 million of distressed assets in second
quarter; expect to dispose of over $600 million in the
second half of 2009
* As of June 30, 2009
Monday, September 14, 2009 15
SYNOVUS®
ASSET DISPOSITION ACTIVITY
2Q09 Sales Proceeds as a
1Q09
Sales
2Q09
Sales
% of Book
Balance
% of Unpaid
Principal
Balance
2Q09
Loss on
Sale
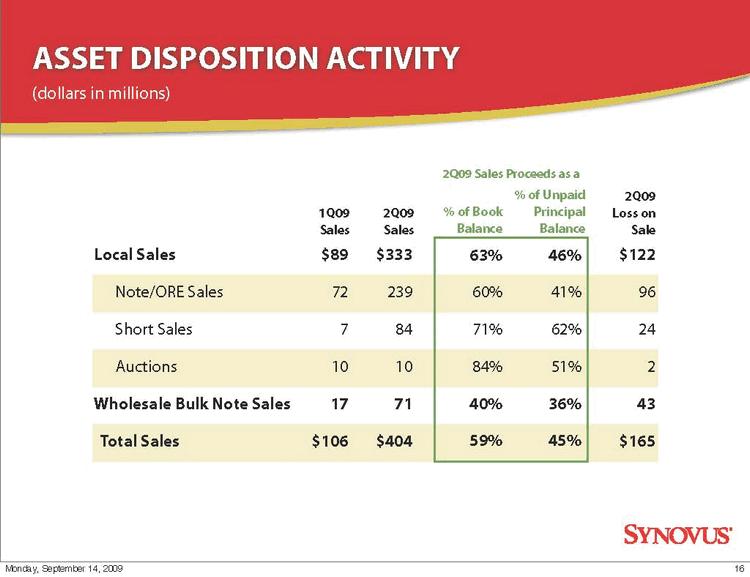
Local Sales $89 $333 63% 46% $122
Note/ORE Sales 72 239 60% 41% 96
Short Sales 7 84 71% 62% 24
Auctions 10 10 84% 51% 2
Wholesale Bulk Note Sales 17 71 40% 36% 43
Total Sales $106 $404 59% 45% $165
(dollars in millions)
Monday, September 14, 2009 16 SYNOVUS®
ALLOWANCE AND CUMULATIVE WRITEDOWNS
ON NON-PERFORMING LOANS
As of June 30, 2009
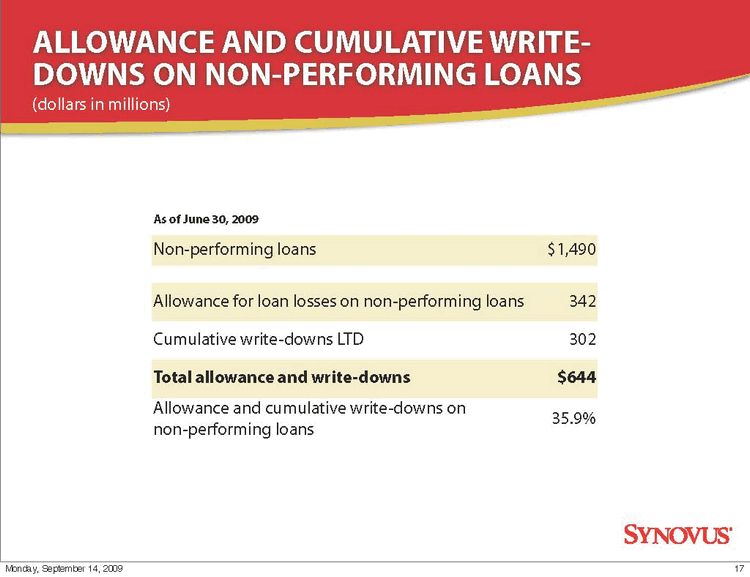
Non-performing loans $1,490
Allowance for loan losses on non-performing loans 342
Cumulative write-downs LTD 302
Total allowance and write-downs $644
Allowance and cumulative write-downs on
non-performing loans 35.9%
(dollars in millions)
Monday, September 14, 2009 17 SYNOVUS®
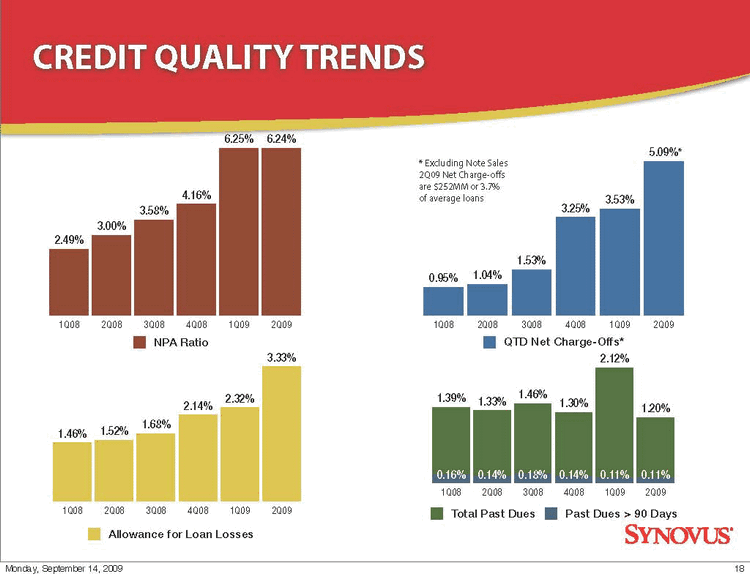
1Q08 2Q08 3Q08 4Q08 1Q09 2Q09
5.09%
3.53%
3.25%
1.53%
0.95% 1.04%
1.20%
2.12%
1.30%
1.39% 1.33% 1.46%
Total Past Dues Past Dues > 90 Days
1Q08 2Q08 3Q08 4Q08 1Q09 2Q09
0.16% 0.14% 0.18% 0.14% 0.11% 0.11%
CREDIT QUALITY TRENDS
1Q08 2Q08 3Q08 4Q08 1Q09 2Q09
3.33%
2.32%
2.14%
1.46% 1.52% 1.68%
1Q08 2Q08 3Q08 4Q08 1Q09 2Q09
6.25% 6.24%
4.16%
3.58%
3.00%
2.49%
NPA Ratio
Allowance for Loan Losses
QTD Net Charge-Offs*
* Excluding Note Sales
2Q09 Net Charge-offs
are $252MM or 3.7%
of average loans
*
Monday, September 14, 2009 18 SYNOVUS®
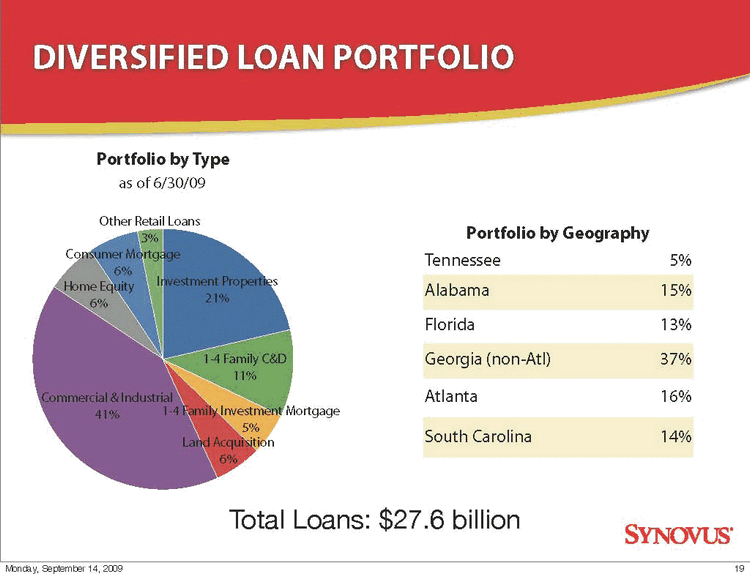
DIVERSIFIED LOAN PORTFOLIO
Other Retail Loans
3%
Consumer Mortgage
6%
Home Equity
6%
Commercial & Industrial
41%
Land Acquisition
6%
1-4 Family Investment Mortgage
5%
1-4 Family C&D
11%
Investment Properties
21%
Total Loans: $27.6 billion
Portfolio by Type
Portfolio by GeographPortfolio Geography
Tennessee 5%
Alabama 15%
Florida 13%
Georgia (non-Atl) 37%
Atlanta 16%
South Carolina 14%
as of 6/30/09
Monday, September 14, 2009 19 SYNOVUS®
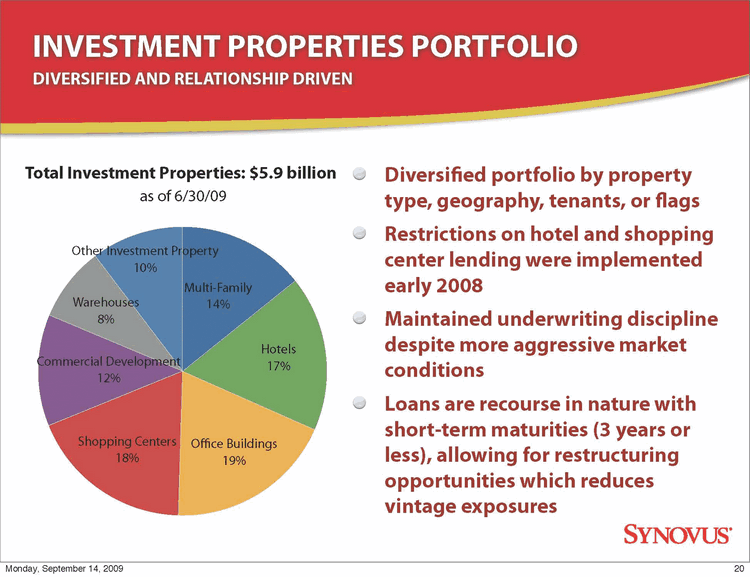
INVESTMENT PROPERTIES PORTFOLIO
DIVERSIFIED AND RELATIONSHIP DRIVEN
Diversified portfolio by property
type, geography, tenants, or flags
Restrictions on hotel and shopping
center lending were implemented
early 2008
Maintained underwriting discipline
despite more aggressive market
conditions
Loans are recourse in nature with
short-term maturities (3 years or
less), allowing for restructuring
opportunities which reduces
vintage exposures
Other Investment Property
10%
Warehouses
8%
Commercial Development
12%
Shopping Centers
18%
Office Buildings
19%
Hotels
17%
Multi-Family
14%
Total Investment Properties: $5.9 billion
as of 6/30/09
Monday, September 14, 2009 20 SYNOVUS®
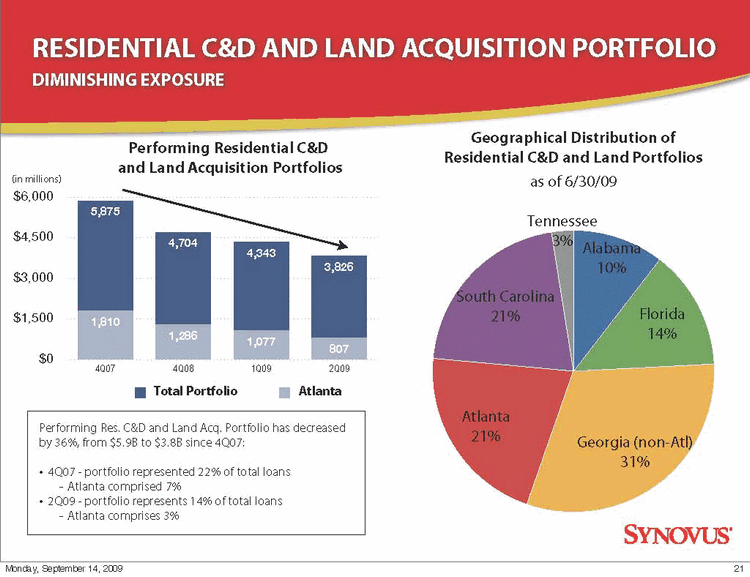
4Q07 4Q08 1Q09 2Q09
3,826
4,343
4,704
5,875
$0
$1,500
$3,000
$4,500
$6,000
807
1,286 1,077
1,810
RESIDENTIAL C&D AND LAND ACQUISITION PORTFOLIO
DIMINISHING EXPOSURE
Total Portfolio
Performing Res. C&D and Land Acq. Portfolio has decreased
by 36%, from $5.9B to $3.8B since 4Q07:
· 4Q07 — portfolio represented 22% of total loans
- - Atlanta comprised 7%
· 2Q09 — portfolio represents 14% of total loans
- - Atlanta comprises 3%
Atlanta
(in millions)
Performing Residential C&D
and Land Acquisition Portfolios
Tennessee
3%
South Carolina
21%
Atlanta
21% Georgia (non-Atl)
31%
Florida
14%
Alabama
10%
Geographical Distribution of
Residential C&D and Land Portfolios
as of 6/30/09
Monday, September 14, 2009 21 SYNOVUS®
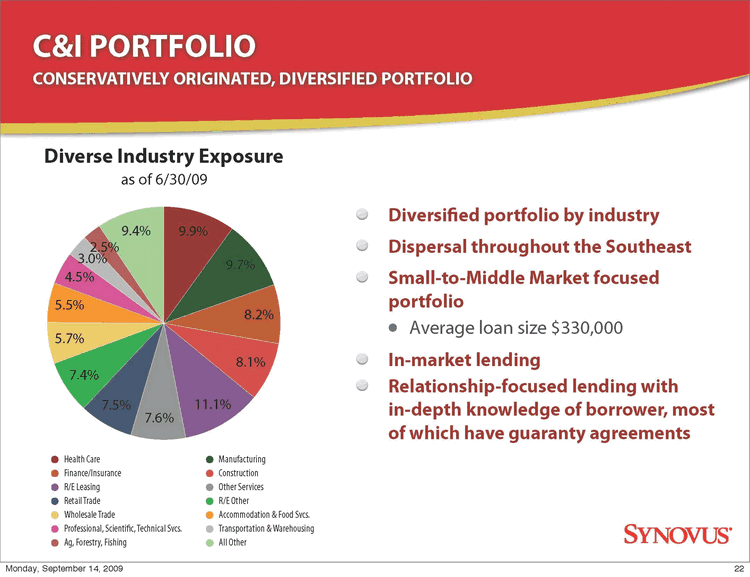
C&I PORTFOLIO
CONSERVATIVELY ORIGINATED, DIVERSIFIED PORTFOLIO
Diversified portfolio by industry
Dispersal throughout the Southeast
Small-to-Middle Market focused
portfolio
· Average loan size $330,000
In-market lending
Relationship-focused lending with
in-depth knowledge of borrower, most
of which have guaranty agreements
9.4%
2.5%
3.0%
4.5%
5.5%
5.7%
7.4%
7.5%
7.6%
11.1%
8.1%
8.2%
9.7%
9.9%
Diverse Industry Exposure
Health Care Manufacturing
Finance/Insurance Construction
R/E Leasing Other Services
Retail Trade R/E Other
Wholesale Trade Accommodation & Food Svcs.
Professional, Scientific, Technical Svcs. Transportation & Warehousing
Ag, Forestry, Fishing All Other
as of 6/30/09
Monday, September 14, 2009 22 SYNOVUS®
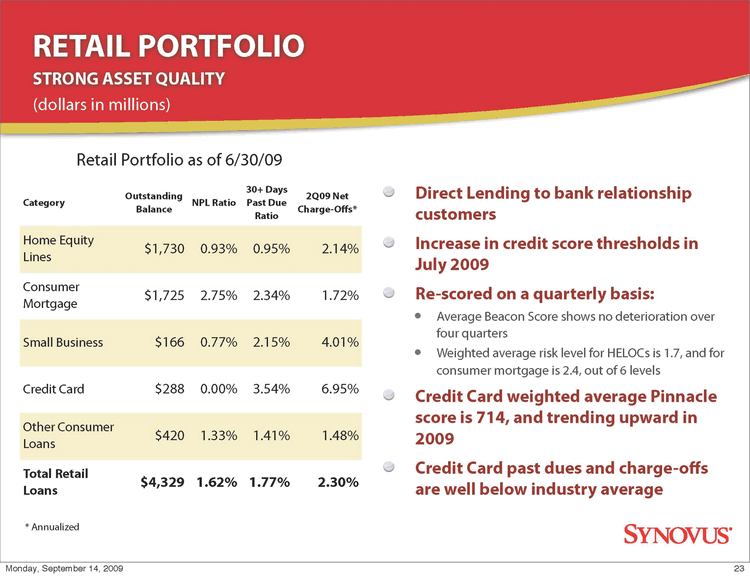
RETAIL PORTFOLIO
STRONG ASSET QUALITY
Category Outstanding
Balance NPL Ratio
30+ Days
Past Due
Ratio
2Q09 Net
Charge-Offs*
Home Equity
Lines $1,730 0.93% 0.95% 2.14%
Consumer
Mortgage $1,725 2.75% 2.34% 1.72%
Small Business $166 0.77% 2.15% 4.01%
Credit Card $288 0.00% 3.54% 6.95%
Other Consumer
Loans $420 1.33% 1.41% 1.48%
Total Retail
Loans $4,329 1.62% 1.77% 2.30%
Retail Portfolio as of 6/30/09
(dollars in millions)
Direct Lending to bank relationship
customers
Increase in credit score thresholds in
July 2009
Re-scored on a quarterly basis:
· Average Beacon Score shows no deterioration over
four quarters
· Weighted average risk level for HELOCs is 1.7, and for
consumer mortgage is 2.4, out of 6 levels
Credit Card weighted average Pinnacle
score is 714, and trending upward in
2009
Credit Card past dues and charge-offs
are well below industry average
* Annualized
Monday, September 14, 2009 23 SYNOVUS®
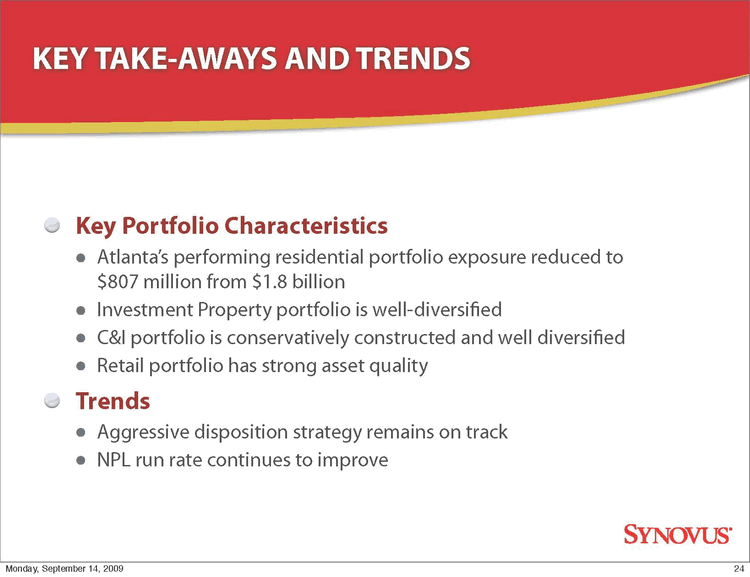
KEY TAKE-AWAYS AND TRENDS
Key Portfolio Characteristics
· Atlanta’s performing residential portfolio exposure reduced to
$807 million from $1.8 billion
· Investment Property portfolio is well-diversified
· C&I portfolio is conservatively constructed and well diversified
· Retail portfolio has strong asset quality
Trends
· Aggressive disposition strategy remains on track
· NPL run rate continues to improve
Monday, September 14, 2009 24 SYNOVUS®
CORE EARNINGS POWER
Monday, September 14, 2009 25 SYNOVUS®
26
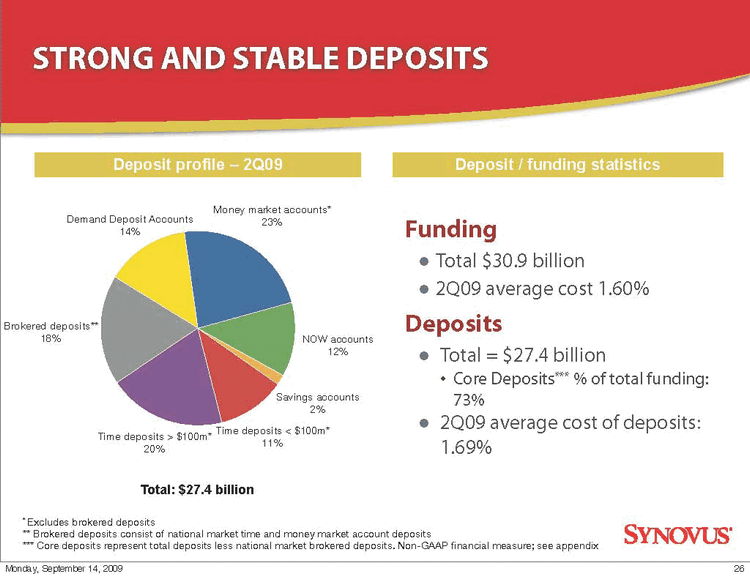
STRONG AND STABLE DEPOSITS
Deposit profile — 2Q09 Deposit / funding statistics
Demand Deposit Accounts
14%
Brokered deposits**
18%
Time deposits > $100m*
20%
Time deposits < $100m*
11%
Savings accounts
2%
NOW accounts
12%
Money market accounts*
23%
* Excludes brokered deposits
** Brokered deposits consist of national market time and money market account deposits
*** Core deposits represent total deposits less national market brokered deposits. Non-GAAP
financial measure; see appendix
Total: $27.4 billion
Funding
· Total $30.9 billion
· 2Q09 average cost 1.60%
Deposits
· Total = $27.4 billion
· Core Deposits*** % of total funding:
73%
· 2Q09 average cost of deposits:
1.69%
Monday, September 14, 2009 26 SYNOVUS®
27
IMPROVING MIX OF CORE DEPOSITS*
$0
$4,800
$9,600
$14,400
$19,200
$24,000
2Q08 2Q09
7,106
7,103
303 1,922
10,482 9,539
3,553 3,862
DDA
Other Interest Bearing Deposits**
Shared Deposits
Time Deposits**
21,441
22,429
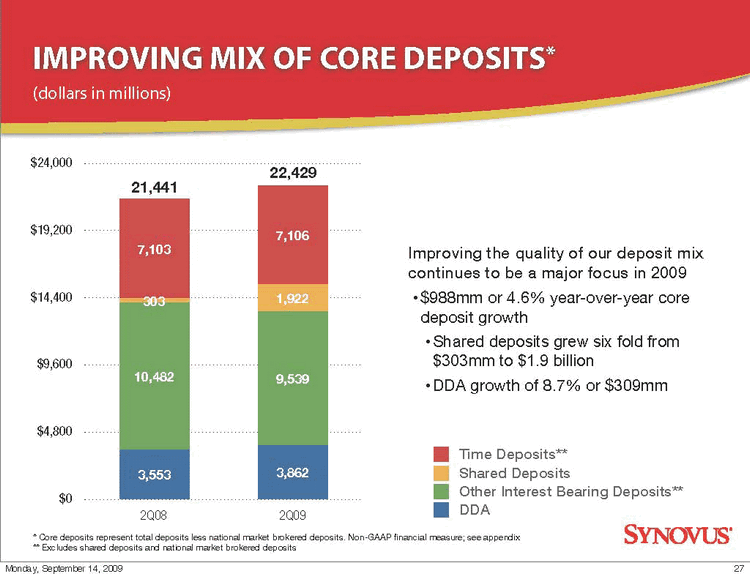
Improving the quality of our deposit mix
continues to be a major focus in 2009
·$988mm or 4.6% year-over-year core
deposit growth
·Shared deposits grew six fold from
$303mm to $1.9 billion
·DDA growth of 8.7% or $309mm
* Core deposits represent total deposits less national market brokered deposits. Non-GAAP financial
measure; see appendix
** Excludes shared deposits and national market brokered deposits
(dollars in millions)
Monday, September 14, 2009 27 SYNOVUS®
IMPROVING INTEREST MARGIN
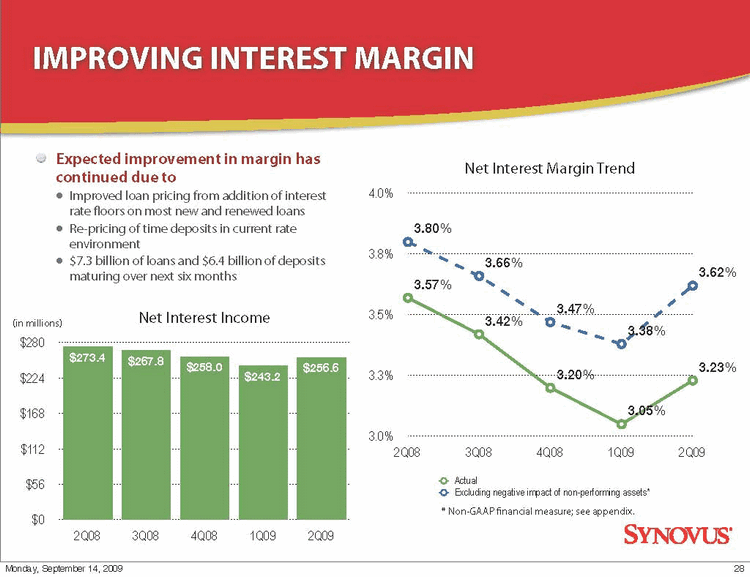
Expected improvement in margin has
continued due to
· Improved loan pricing from addition of interest
rate floors on most new and renewed loans
· Re-pricing of time deposits in current rate
environment
· $7.3 billion of loans and $6.4 billion of deposits
maturing over next six months
$0
$56
$112
$168
$224
$280
2Q08 3Q08 4Q08 1Q09 2Q09
$256.6
$243.2
$273.4 $267.8 $258.0
Net Interest Income
3.0%
3.3%
3.5%
3.8%
4.0%
2Q08 3Q08 4Q08 1Q09 2Q09
3.80%
3.66%
3.47%
3.38%
3.62%
3.57%
3.42%
3.20%
3.05%
3.23%
Net Interest Margin Trend
Actual
Excluding negative impact of non-performing assets*
* Non-GAAP financial measure; see appendix.
(in millions)
Monday, September 14, 2009 28 SYNOVUS®
CONTINUED FOCUS ON EFFICIENCY AND
PRODUCTIVITY
$0
$38
$75
$113
$150
$188
$225
2Q08 3Q08 4Q08 1Q09 2Q09
$59.5 $53.4 $55.5 $47.4 $50.7
$31.1 $31.9 $31.3 $31.6 $30.7
$109.7 $114.5 $112.6 $112.0 $109.3
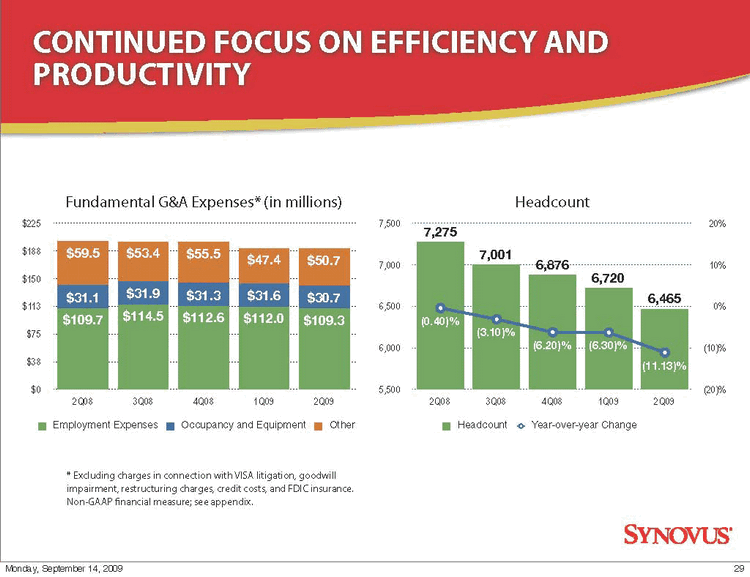
Fundamental G&A Expenses* (in millions)
Employment Expenses Occupancy and Equipment Other
* Excluding charges in connection with VISA litigation, goodwill
impairment, restructuring charges, credit costs, and FDIC insurance.
Non-GAAP financial measure; see appendix.
5,500
6,000
6,500
7,000
7,500
2Q08 3Q08 4Q08 1Q09 2Q09
(20)%
(10)%
0%
10%
20%
7,275
7,001
6,876
6,720
6,465
(0.40)%
(3.10)%
(6.20)% (6.30)%
(11.13)%
Headcount
Headcount Year-over-year Change SYNOVUS®
Monday, September 14, 2009 29
30
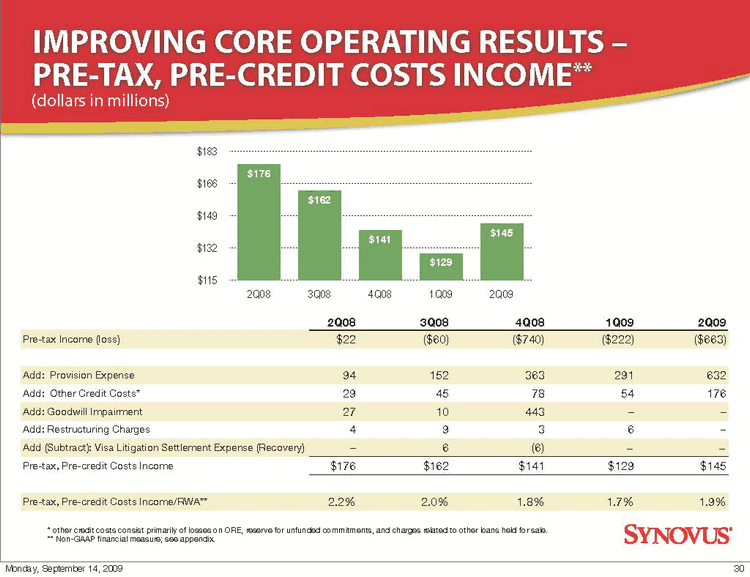
IMPROVING CORE OPERATING RESULTS —
PRE-TAX, PRE-CREDIT COSTS INCOME**
* other credit costs consist primarily of losses on ORE, reserve for unfunded commitments, and
charges related to other loans held for sale.
** Non-GAAP financial measure; see appendix.
2Q08 3Q08 4Q08 1Q09 2Q09
Pre-tax Income (loss) $22 ($60) ($740) ($222) ($663)
Add: Provision Expense 94 152 363 291 632
Add: Other Credit Costs* 29 45 78 54 176
Add: Goodwill Impairment 27 10 443 — —
Add: Restructuring Charges 4 9 3 6 —
Add (Subtract): Visa Litigation Settlement Expense (Recovery) — 6 (6) — —
Pre-tax, Pre-credit Costs Income $176 $162 $141 $129 $145
Pre-tax, Pre-credit Costs Income/RWA** 2.2% 2.0% 1.8% 1.7% 1.9%
$115
$132
$149
$166
$183
2Q08 3Q08 4Q08 1Q09 2Q09
$145
$129
$141
$162
$176
(dollars in millions)
Monday, September 14, 2009 30 SYNOVUS®
31
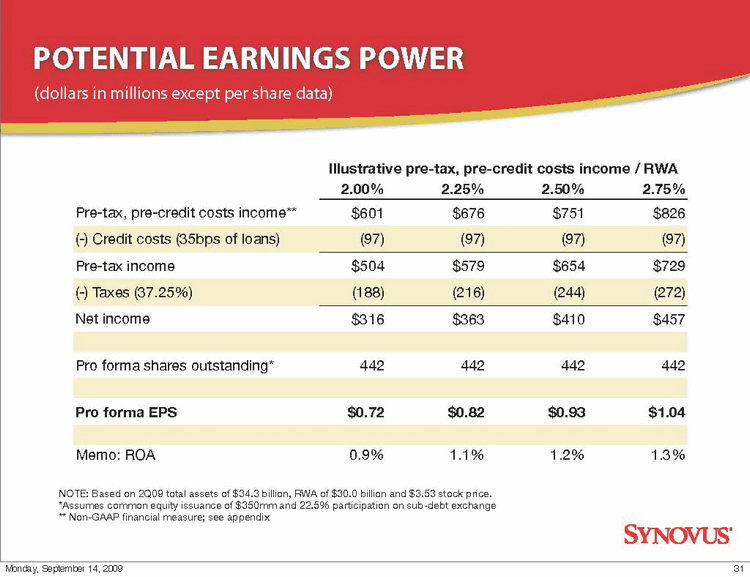
POTENTIAL EARNINGS POWER
NOTE: Based on 2Q09 total assets of $34.3 billion, RWA of $30.0 billion and $3.53 stock price.
*Assumes common equity issuance of $350mm and 22.5% participation on sub-debt exchange
** Non-GAAP financial measure; see appendix
Illustrative pre-tax, pre-credit costs income / RWA
2.00% 2.25% 2.50% 2.75%
Pre-tax, pre-credit costs income** $601 $676 $751 $826
(-) Credit costs (35bps of loans) (97) (97) (97) (97)
Pre-tax income $504 $579 $654 $729
(-) Taxes (37.25%) (188) (216) (244) (272)
Net income $316 $363 $410 $457
Pro forma shares outstanding* 442 442 442 442
Pro forma EPS $0.72 $0.82 $0.93 $1.04
Memo: ROA 0.9% 1.1% 1.2% 1.3%
(dollars in millions except per share data)
Monday, September 14, 2009 31 SYNOVUS®
APPENDIX
Monday, September 14, 2009 32 SYNOVUS®
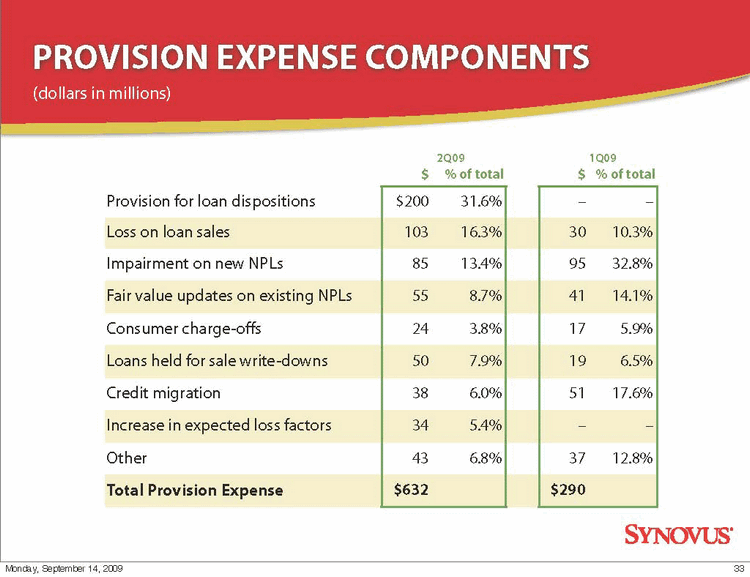
PROVISION EXPENSE COMPONENTS
2Q09 1Q09
$ % of total $ % of total
Provision for loan dispositions $200 31.6% — —
Loss on loan sales 103 16.3% 30 10.3%
Impairment on new NPLs 85 13.4% 95 32.8%
Fair value updates on existing NPLs 55 8.7% 41 14.1%
Consumer charge-offs 24 3.8% 17 5.9%
Loans held for sale write-downs 50 7.9% 19 6.5%
Credit migration 38 6.0% 51 17.6%
Increase in expected loss factors 34 5.4% — —
Other 43 6.8% 37 12.8%
Total Provision Expense $632 $290
(dollars in millions)
Monday, September 14, 2009 33 SYNOVUS®
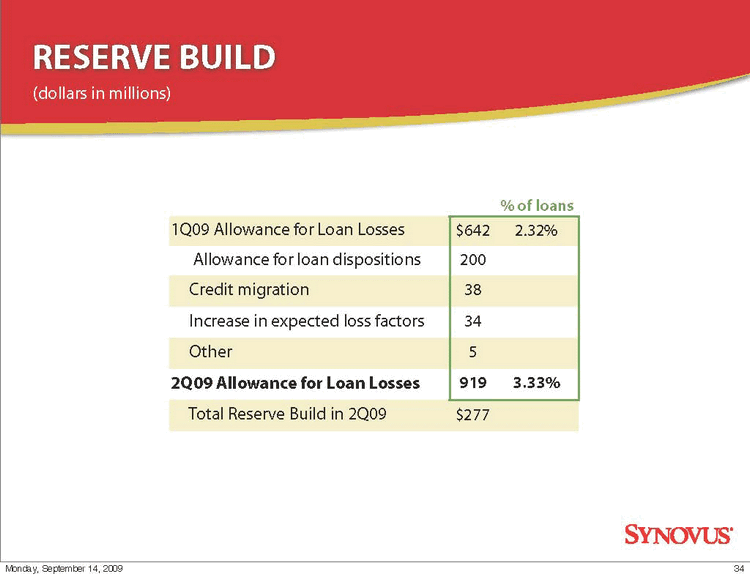
RESERVE BUILD
% of loans
1Q09 Allowance for Loan Losses $642 2.32%
Allowance for loan dispositions 200
Credit migration 38
Increase in expected loss factors 34
Other 5
2Q09 Allowance for Loan Losses 919 3.33%
Total Reserve Build in 2Q09 $277
(dollars in millions)
Monday, September 14, 2009 34 SYNOVUS®
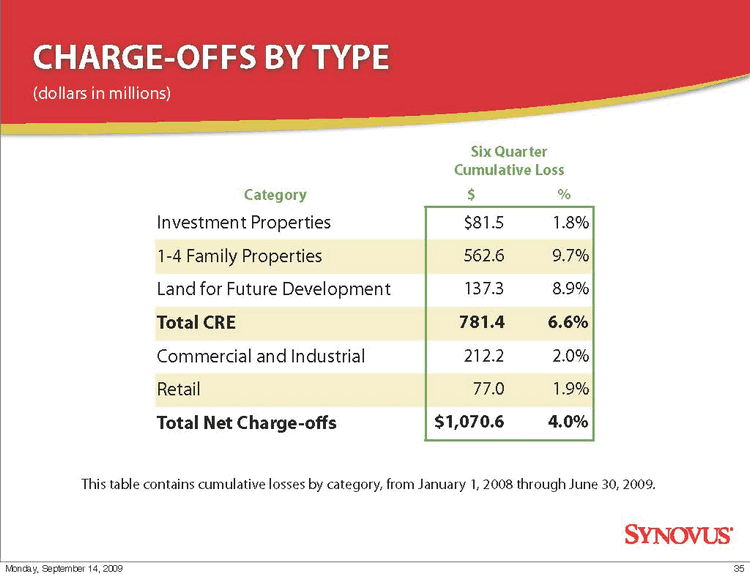
CHARGE-OFFS BY TYPE
Six Quarter
Cumulative Loss
Category $ %
Investment Properties $81.5 1.8%
1-4 Family Properties 562.6 9.7%
Land for Future Development 137.3 8.9%
Total CRE 781.4 6.6%
Commercial and Industrial 212.2 2.0%
Retail 77.0 1.9%
Total Net Charge-offs $1,070.6 4.0%
(dollars in millions)
This table contains cumulative losses by category, from January 1, 2008 through June 30, 2009.
Monday, September 14, 2009 35 SYNOVUS®
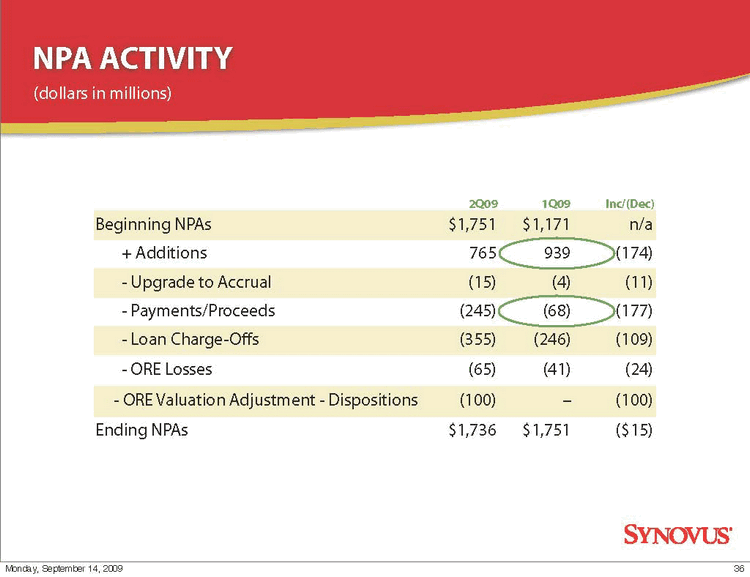
NPA ACTIVITY
2Q09 1Q09 Inc/(Dec)
Beginning NPAs $1,751 $1,171 n/a
+ Additions 765 939 (174)
- - Upgrade to Accrual (15) (4) (11)
- - Payments/Proceeds (245) (68) (177)
- - Loan Charge-Offs (355) (246) (109)
- - ORE Losses (65) (41) (24)
- - ORE Valuation Adjustment — Dispositions (100) — (100)
Ending NPAs $1,736 $1,751 ($15)
(dollars in millions)
Monday, September 14, 2009 36 SYNOVUS®
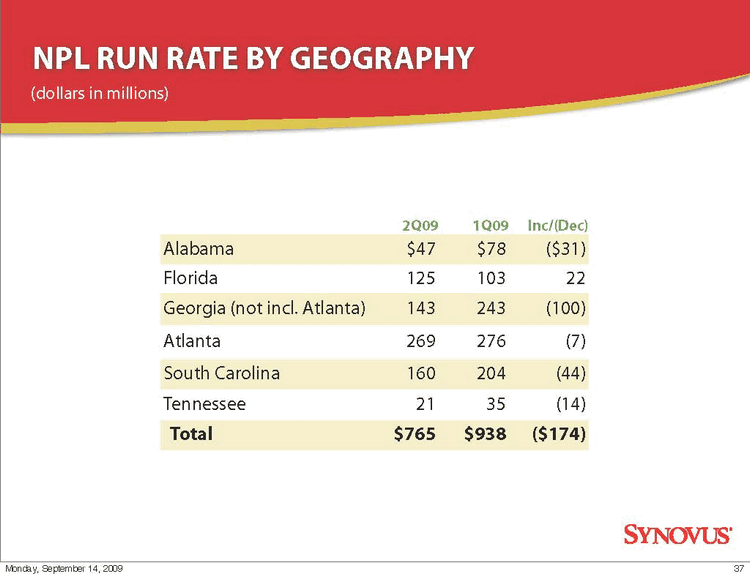
NPL RUN RATE BY GEOGRAPHY
2Q09 1Q09 Inc/(Dec)
Alabama $47 $78 ($31)
Florida 125 103 22
Georgia (not incl. Atlanta) 143 243 (100)
Atlanta 269 276 (7)
South Carolina 160 204 (44)
Tennessee 21 35 (14)
Total $765 $938 ($174)
(dollars in millions)
Monday, September 14, 2009 37 SYNOVUS®
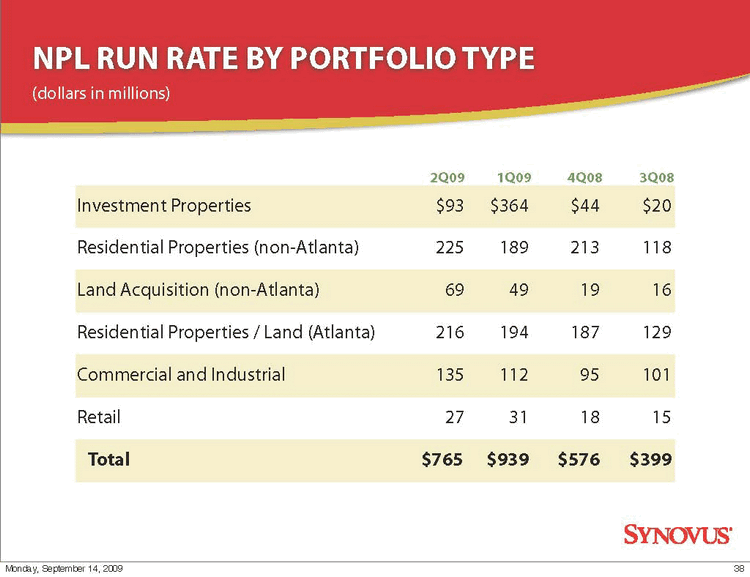
NPL RUN RATE BY PORTFOLIO TYPE
2Q09 1Q09 4Q08 3Q08
Investment Properties $93 $364 $44 $20
Residential Properties (non-Atlanta) 225 189 213 118
Land Acquisition (non-Atlanta) 69 49 19 16
Residential Properties / Land (Atlanta) 216 194 187 129
Commercial and Industrial 135 112 95 101
Retail 27 31 18 15
Total $765 $939 $576 $399
(dollars in millions)
Monday, September 14, 2009 38 SYNOVUS®
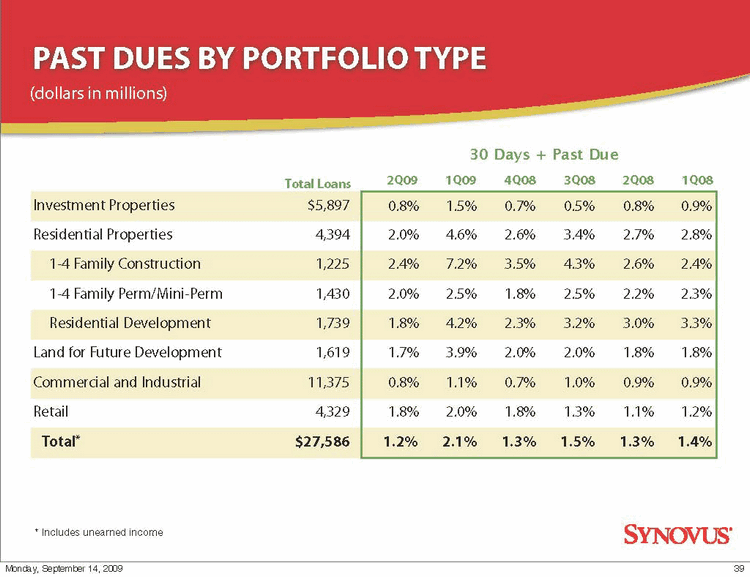
PAST DUES BY PORTFOLIO TYPE
30 Days + Past Due
Total Loans 2Q09 1Q09 4Q08 3Q08 2Q08 1Q08
Investment Properties $5,897 0.8% 1.5% 0.7% 0.5% 0.8% 0.9%
Residential Properties 4,394 2.0% 4.6% 2.6% 3.4% 2.7% 2.8%
1-4 Family Construction 1,225 2.4% 7.2% 3.5% 4.3% 2.6% 2.4%
1-4 Family Perm/Mini-Perm 1,430 2.0% 2.5% 1.8% 2.5% 2.2% 2.3%
Residential Development 1,739 1.8% 4.2% 2.3% 3.2% 3.0% 3.3%
Land for Future Development 1,619 1.7% 3.9% 2.0% 2.0% 1.8% 1.8%
Commercial and Industrial 11,375 0.8% 1.1% 0.7% 1.0% 0.9% 0.9%
Retail 4,329 1.8% 2.0% 1.8% 1.3% 1.1% 1.2%
Total* $27,586 1.2% 2.1% 1.3% 1.5% 1.3% 1.4%
(dollars in millions)
* Includes unearned income
Monday, September 14, 2009 39 SYNOVUS®
40
Breakdown of securities portfolio
High quality and liquid
securities portfolio
Securities with carrying
value of ~$900 million
unpledged as of June 30,
2009
CONSERVATIVE SECURITIES PORTFOLIO
(dollars in millions)
June 30, 2009
Carrying
value
Fair
value
U.S. Treasury securities $1 $1
Other U.S. Government agency
securities 1,463 1,513
Government agency issued
mortgage-backed securities 1,744 1,816
Government agency issued
collateralized mortgage obligations 101 104
State and municipal securities 105 106
Equity securities 9 11
Other investments 8 8
Total $3,431 $3,560
Monday, September 14, 2009 40 SYNOVUS®
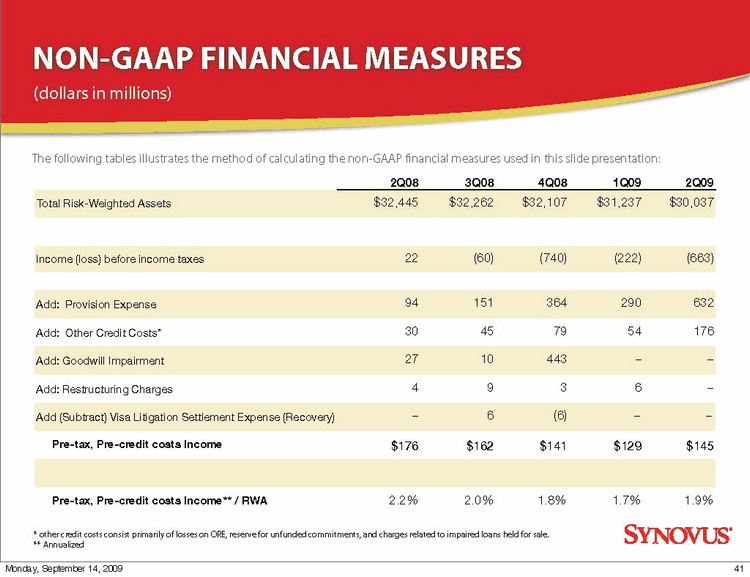
NON-GAAP FINANCIAL MEASURES (dollars in millions) The following tables illustrates the method of calculating the non-GAAP Financial measures used in this slide presentation: 2Q08 3Q08 4Q08 1Q09 2Q09 Total Risk-Weighted Assets $32,445 $32,262 $32,107 $31,237 $30,037 Income (loss) before income taxes 22 (60) (740) (222) (663) Add: Provision Expense 94 151 364 290 632 Add: Other Credit Costs* 30 45 79 54 176 Add: Goodwill Impairment 27 10 443 - - Add: Restructuring Charges 4 9 3 6 - Add (Subtract) Visa Litigation Settlement Expense (Recovery) - 6 (6) - - Pre-tax, Pre-credit costs Income $176 $162 $141 $129 $145 Pre-tax, Pre-credit costs Income** / RWA 2.2% 2.0% 1.8% 1.7% 1.9% other credit costs consist primarily of losses on ORE, reserve for unfunded commitments, and charges related to impaired loans held for sale. Annualized Monday, September 14, 2009 41 SYNOVUS®
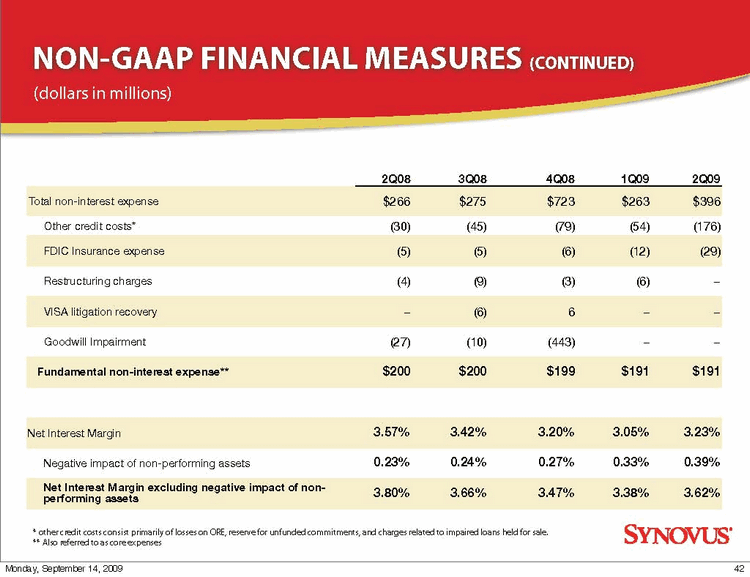
NON-GAAP FINANCIAL MEASURES (CONTINUED) (dollars in millions) 2Q08 3Q08 4Q08 1Q09 2Q09 Total non-interest expense $266 $275 $723 $263 $396 Other credit costs* (30) (45) (79) (54) (176) FDIC Insurance expense (5) (5) (6) (12) (29) Restructuring charges (4) (9) (3) (6) - VISA litigation recovery - (6) 6 - - Goodwill Impairment (27) (10) (443) - - Fundamental non-interest expense** $200 $200 $199 $191 $191 Net Interest Margin 3.57% 3.42% 3.20% 3.05% 3.23% Negative impact of non-performing assets 0.23% 0.24% 0.27% 0.33% 0.39% Net Interest Margin excluding negative impact of non- 3.80% 3.66% 3.47% 3.38% 3.62% performing assets other credit costs consist primarily of losses on ORE, reserve for unfunded commitments, and charges related to impaired loans held for sale. Also referred to as core expenses Monday, September 14, 2009 42 SYNOVUS®
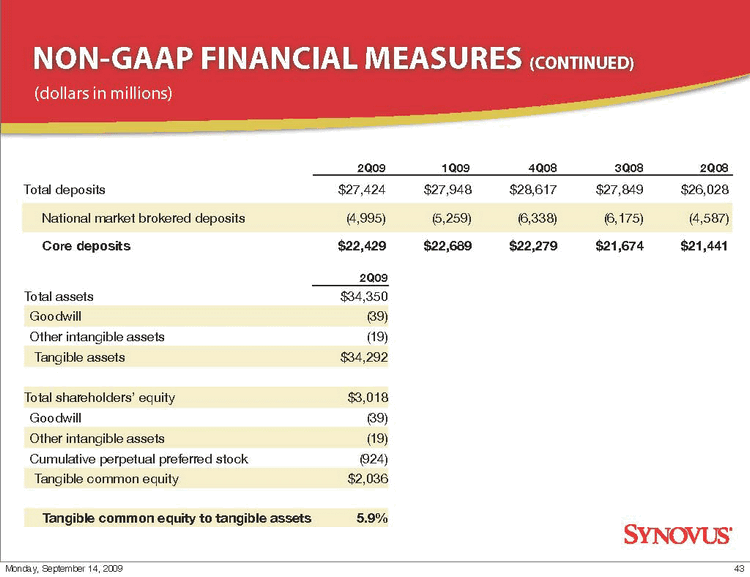
NON-GAAP FINANCIAL MEASURES (CONTINUED)
2Q09
Total assets $34,350
Goodwill (39)
Other intangible assets (19)
Tangible assets $34,292
Total shareholders’ equity $3,018
Goodwill (39)
Other intangible assets (19)
Cumulative perpetual preferred stock (924)
Tangible common equity $2,036
Tangible common equity to tangible assets 5.9%
(dollars in millions)
2Q09 1Q09 4Q08 3Q08 2Q08
Total deposits $27,424 $27,948 $28,617 $27,849 $26,028
National market brokered deposits (4,995) (5,259) (6,338) (6,175) (4,587)
Core deposits $22,429 $22,689 $22,279 $21,674 $21,441
Monday, September 14, 2009 43 SYNOVUS®
