Exhibit 99.3
SYNOVUS
Second Quarter 2011 Results
July 28, 2011
1
SYNOVUS
Forward-looking Statements
This slide presentation and certain of our other filings with the Securities and Exchange Commission contain statements that constitute “forward-looking statements” within the meaning of, and subject to the protections of, Section 27A of the Securities Act of 1933, as amended, and Section 21E of the Securities Exchange Act of 1934, as amended. All statements other than statements of historical fact are forward-looking statements.You can identify these forward-looking statements through Synovus’ use of words such as “believes,”“anticipates,”“expects,”“may,”“will,”“assumes,”“should,” “predicts,”“could,”“should,”“would,”“intends,”“targets,”“estimates,”“projects,”“plans,”“potential” and other similar words and expressions of the future or otherwise regarding the outlook for Synovus’ future business and financial performance and/or the performance of the commercial banking industry and economy in general.These forward-looking statements include, among others, (1) our expectations on credit trends; (2) expectations on core lending activity; (3) expectations on deposit trends; (4) expectations on cost savings from our efficiency and process redesign initiatives; (5) impact of our target deposit mix on our cost of funding; (6) our expected future impact of DTA valuation allowance; (7) expected annual impact from regulatory reform on fee income; and (8) the assumptions underlying our expectations. Prospective investors are cautioned that any such forward-looking statements are not guarantees of future performance and involve known and unknown risks and uncertainties which may cause the actual results, performance or achievements of Synovus to be materially different from the future results, performance or achievements expressed or implied by such forward-looking statements. Forward-looking statements are based on the information known to, and current beliefs and expectations of, Synovus’ management and are subject to significant risks and uncertainties. Actual results may differ materially from those contemplated by such forward-looking statements. A number of factors could cause actual results to differ materially from those contemplated by the forward-looking statements in this report. Many of these factors are beyond Synovus’ ability to control or predict.
These forward-looking statements are based upon information presently known to Synovus’ management and are inherently subjective, uncertain and subject to change due to any number of risks and uncertainties, including, without limitation, risks relating to execution of our efficiency initiatives and plans for growth and the risks and other factors set forth in Synovus’ filings with the Securities and Exchange Commission, including its Annual Report on Form 10-K for the year ended December 31, 2010 under the captions “Cautionary Notice Regarding Forward-Looking Statements” and “Risk Factors” and in Synovus’ quarterly reports on Form 10-Q and current reports on Form 8-K. We believe these forward-looking statements are reasonable; however, undue reliance should not be placed on any forward-looking statements, which are based on current expectations and speak only as of the date that they are made. We do not assume any obligation to update any forward-looking statements as a result of new information, future developments or otherwise, except as otherwise may be required by law.
2
SYNOVUS
Use of Non-GAAP Financial Measures
This slide presentation contains certain non-GAAP financial measures determined by methods other than in accordance with generally accepted accounting principles. Such non-GAAP financial measures include the following: pre-tax, pre-credit costs income; core deposits and core deposits excluding time deposits; net interest margin excluding negative impact of non-performing loans; fundamental non-interest expense; the ratio of pretax, pre-credit costs income to risk weighted assets, the tangible common equity to tangible assets ratio; and net loss per common share excluding restructuring charges. The most comparable GAAP measures to these measures are loss from continuing operations before income taxes; total deposits; net interest margin; total non-interest expense; the ratio of total equity to total assets; and net loss per common share, respectively. Management uses these non-GAAP financial measures to assess the performance of Synovus’ core business and the strength of its capital position. Synovus believes that these non-GAAP financial measures provide meaningful additional information about Synovus to assist investors in evaluating Synovus’ operating results, financial strength and capitalization. The non-GAAP measures should be considered as additional views of the way our financial measures are affected by significant charges for credit costs and other factors.The tangible common equity ratio to tangible assets ratio and tangible common equity to risk-weighted assets ratio are used by management to assess the strength of our capital position. Core deposits and core deposits excluding time deposits are a measure used by management and investment analysts to evaluate organic growth of deposits and the quality of deposits as a funding source. The net interest margin excluding the negative impact of non-performing loans is a measure used by management to evaluate the net interest margin excluding the adverse impact of non-performing loans and interest charge-offs. Pre-tax, pre-credit costs income is a measure used by management to evaluate core operating results exclusive of credit costs as well as certain non-core income/ expenses such as restructuring charges. Fundamental non-interest expense is a measure utilized by management to measure the success of expense management initiatives focused on reducing recurring controllable operating costs.These non-GAAP financial measures should not be considered as a substitute for operating results determined in accordance with GAAP and may not be comparable to other similarly titled measures of other companies. The computations of the non-GAAP financial measures used in this slide presentation are set forth in the Appendix to this slide presentation.
3
SYNOVUS
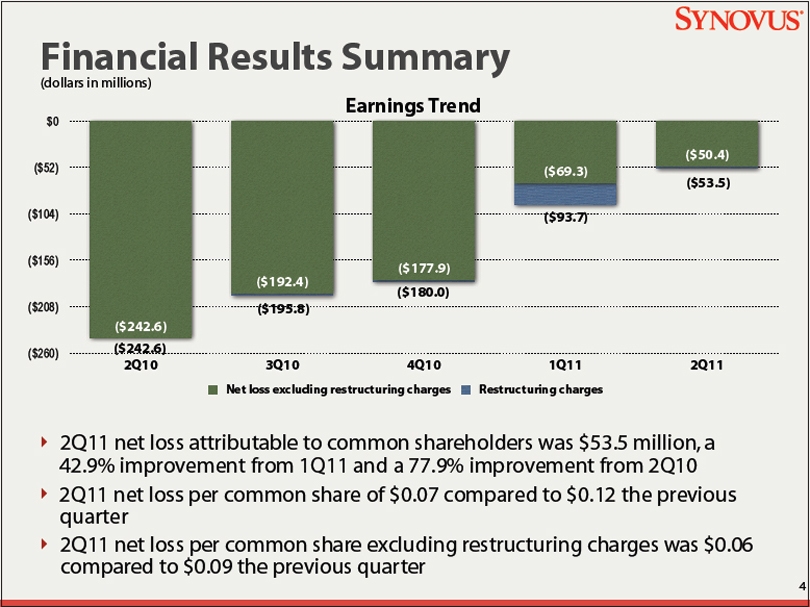
Financial Results Summary
(dollars in millions)
$0
($52)
($104)
($156)
($208)
($260)
Earnings Trend
($242.6)
($242.6)
2Q10
($192.4)
($195.8)
3Q10
($177.9)
($180.0)
(4Q10)
($69.3)
($93.7)
1Q11
($50.4)
($53.5)
2Q11
Net loss excluding restructuring charges Restructuring charges
2Q11 net loss attributable to common shareholders was $53.5 million, a 42.9% improvement from 1Q11 and a 77.9% improvement from 2Q10
2Q11 net loss per common share of $0.07 compared to $0.12 the previous quarter
2Q11 net loss per common share excluding restructuring charges was $0.06 compared to $0.09 the previous quarter
4
SYNOVUS
Financial Results Summary, continued
(dollars in millions)
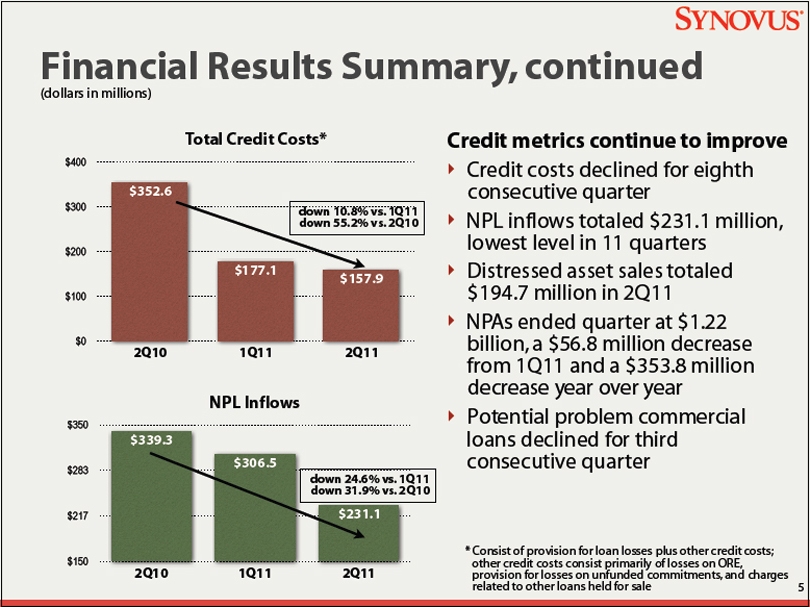
Total Credit Costs*
$400
$300
$200
$100
$0
$352.6
2Q10
$177.1
1Q11
$157.9
2Q11
down 10.8% vs. 1Q11 down 55.2% vs. 2Q10
NPL Inflows
$350
$283
$217
$150
$339.3
2Q10
$306.5
1Q11
$231.1
2Q11
down 24.6% vs. 1Q11 down 31.9% vs. 2Q10
Credit metrics continue to improve
Credit costs declined for eighth consecutive quarter
NPL inflows totaled $231.1 million, lowest level in 11 quarters
Distressed asset sales totaled $194.7 million in 2Q11
NPAs ended quarter at $1.22 billion, a $56.8 million decrease from 1Q11 and a $353.8 million decrease year over year
Potential problem commercial loans declined for third consecutive quarter
* Consist of provision for loan losses plus other credit costs; other credit costs consist primarily of losses on ORE, provision for losses on unfunded commitments, and charges related to other loans held for sale
5
SYNOVUS
Financial Results Summary, continued
Balance Sheet Trends
Loans
Net pay-downs* moderated during 2Q11 ($167.6 million)
Encouraged by recent core lending activity
New originations steadily increased during 2Q11
Building meaningful pipelines with momentum from corporate banking initiatives
Early success in pipeline growth and fundings from corporate banking team
Deposits
Core deposits excluding time deposits increased $114.6 million from 1Q11
Demand deposits were up $178.8 million or 15.3% (annualized) from prior quarter and $626.7 million or 14.7% from prior year
Increase in number of demand deposit accounts from prior quarter
*Excluding the impact of loan sales, transfers to loans held-for-sale, charge-offs, and foreclosures
6
SYNOVUS
Financial Results Summary, continued
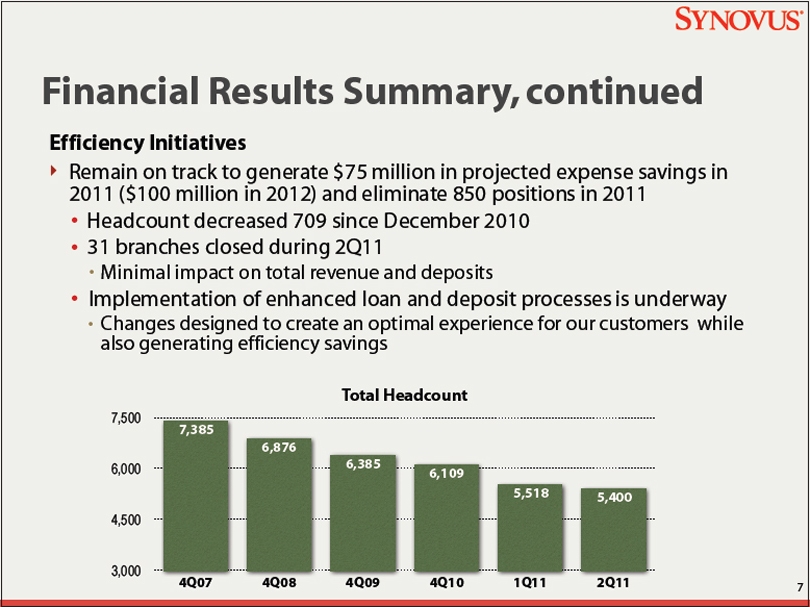
Efficiency Initiatives
Remain on track to generate $75 million in projected expense savings in 2011 ($100 million in 2012) and eliminate 850 positions in 2011
Headcount decreased 709 since December 2010
31 branches closed during 2Q11
Minimal impact on total revenue and deposits
Implementation of enhanced loan and deposit processes is underway
Changes designed to create an optimal experience for our customers while also generating efficiency savings
Total Headcount
7,500
6,000
4,500
3,000
7,385
4Q07
6,876
4Q08
6,385
4Q09
6,109
4Q10
5,518
1Q11
5,400
2Q11
7
SYNOVUS
Financial Results
8
SYNOVUS
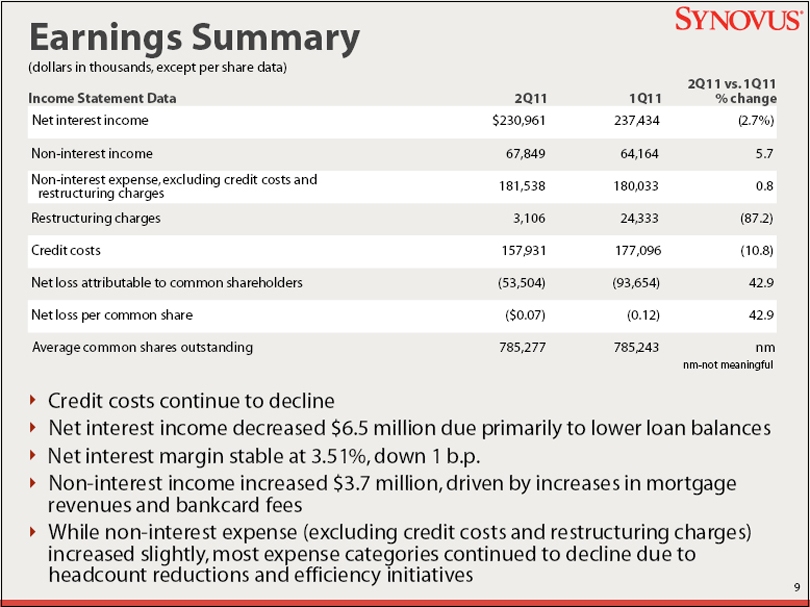
Earnings Summary
(dollars in thousands, except per share data)
Income Statement Data 2Q11 1Q11 2Q11 vs. 1Q11 % change
Net interest income $230,961 237,434 (2.7%)
Non-interest income 67,849 64,164 5.7
Non-interest expense, excluding credit costs and restructuring charges 181,538 180,033 0.8
Restructuring charges 3,106 24,333 (87.2)
Credit costs 157,931 177,096 (10.8)
Net loss attributable to common shareholders (53,504) (93,654) 42.9
Net loss per common share ($0.07) (0.12) 42.9
Average common shares outstanding 785,277 785,243 nm
nm-not meaningful
Credit costs continue to decline
Net interest income decreased $6.5 million due primarily to lower loan balances
Net interest margin stable at 3.51%, down 1 b.p.
Non-interest income increased $3.7 million, driven by increases in mortgage
revenues and bankcard fees
While non-interest expense (excluding credit costs and restructuring charges)
increased slightly, most expense categories continued to decline due to
headcount reductions and efficiency initiatives
9
SYNOVUS
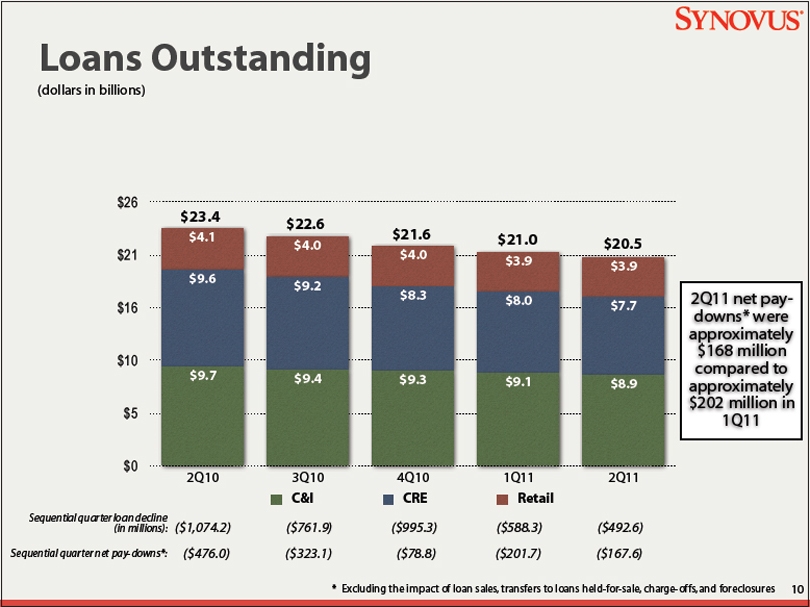
Loans Outstanding
(dollars in billions)
$26
$21
$16
$10
$5
$0
$23.4
$4.1
$9.6
$9.7
2Q10
$22.6
$4.0
$9.2
$9.4
3Q10
$21.6
$4.0
$8.3
$9.3
4Q10
$21.0
$3.9
$8.0
$9.1
1Q11
$20.5
$3.9
$7.7
$8.9
2Q11
2Q11 net paydowns*
were
approximately
$168 million
compared to
approximately
$202 million in
1Q11
C&I CRE Retail
Sequential quarter loan decline
(in millions):
($1,074.2)
($761.9)
($995.3)
($588.3)
($492.6)
Sequential quarter net pay-downs*:
($476.0)
($323.1)
($78.8)
($201.7)
($167.6)
* Excluding the impact of loan sales, transfers to loans held-for-sale, charge-offs, and foreclosures
10
SYNOVUS
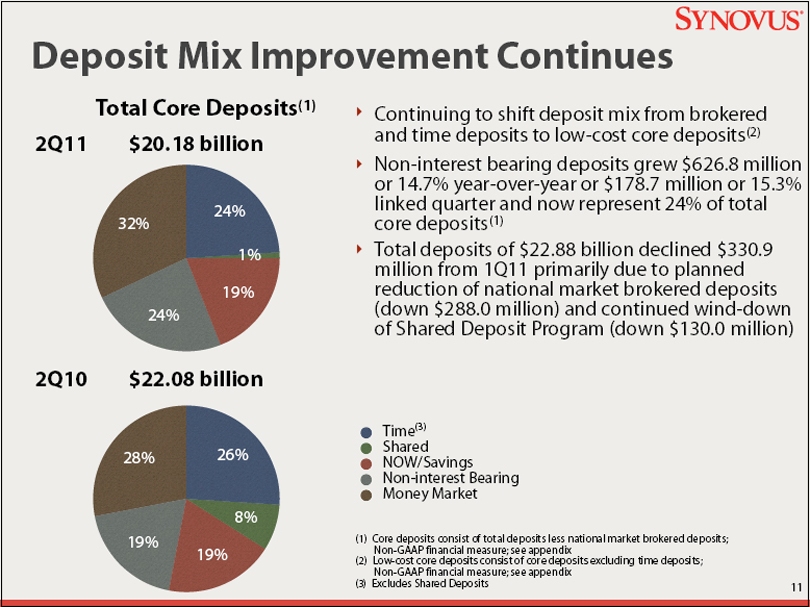
Deposit Mix Improvement Continues
Total Core Deposits(1)
2Q11
$20.18 billion
32%
24%
1%
24%
19%
Continuing to shift deposit mix from brokered
and time deposits to low-cost core deposits(2)
Non-interest bearing deposits grew $626.8 million
or 14.7% year-over-year or $178.7 million or 15.3%
linked quarter and now represent 24% of total
core deposits(1)
Total deposits of $22.88 billion declined $330.9
million from 1Q11 primarily due to planned
reduction of national market brokered deposits
(down $288.0 million) and continued wind-down
of Shared Deposit Program (down $130.0 million)
2Q10
$22.08 billion
Time(3)
Shared
NOW/Savings
Non-interest Bearing
Money Market
28%
19%
19%
8%
26%
(1) Core deposits consist of total deposits less national market brokered deposits;
Non-GAAP financial measure; see appendix
(2) Low-cost core deposits consist of core deposits excluding time deposits;
Non-GAAP financial measure; see appendix
(3) Excludes Shared Deposits
11
SYNOVUS
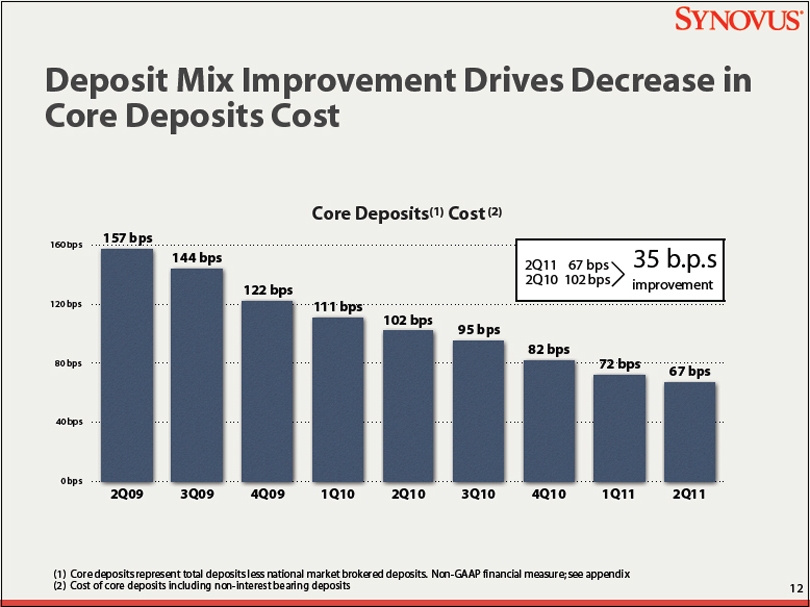
Deposit Mix Improvement Drives Decrease in Core Deposits Cost
Core Deposits(1) Cost (2)
0 bps
40 bps
80 bps
120 bps
160 bps
2Q09 3Q09 4Q09 1Q10 2Q10 3Q10 4Q10 1Q11 2Q11
157 bps
144 bps
122 bps
111 bps
102 bps
95 bps
82 bps
72 bps
67 bps
2Q11 67 bps
2Q10 102 bps
35 b.p.s improvement
(1) Core deposits represent total deposits less national market brokered deposits. Non-GAAP financial measure; see appendix
(2) Cost of core deposits including non-interest bearing deposits
12
SYNOVUS
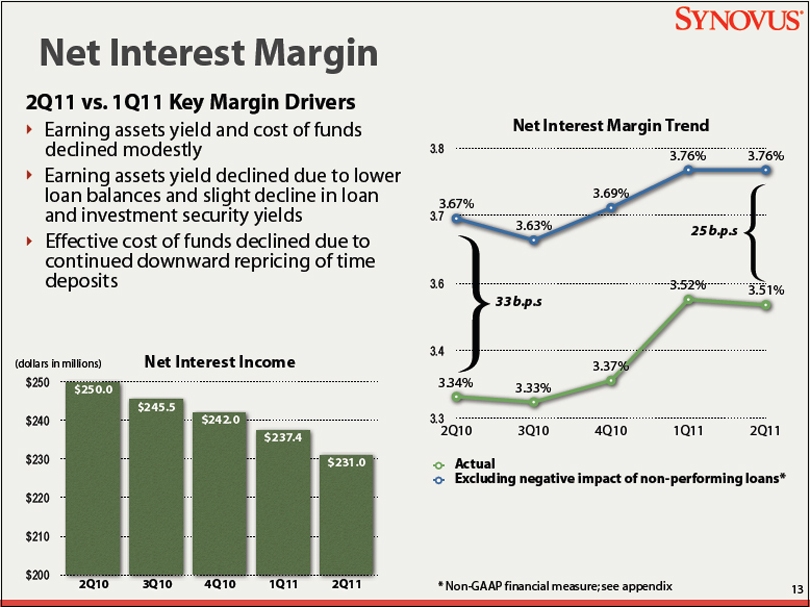
Net Interest Margin
2Q11 vs. 1Q11 Key Margin Drivers
Earning assets yield and cost of funds declined modestly
Earning assets yield declined due to lower loan balances and slight decline in loan and investment security yields
Effective cost of funds declined due to continued downward repricing of time deposits
(dollars in millions) Net Interest Income
$250
$240
$230
$220
$210
$200
2Q10 3Q10 4Q10 1Q11 2Q11
$250.0
$245.5
$242.0
$237.4
$231.0
Net Interest Margin Trend
3.8
3.7
3.6
3.4
3.3
2Q10 3Q10 4Q10 1Q11 2Q11
3.67%
3.63%
3.69%
3.76%
3.76%
3.34%
3.33%
3.37%
3.52%
3.51%
33 b.p.s
25 b.p.s
Actual
Excluding negative impact of non-performing loans*
* Non-GAAP financial measure; see appendix
13
SYNOVUS
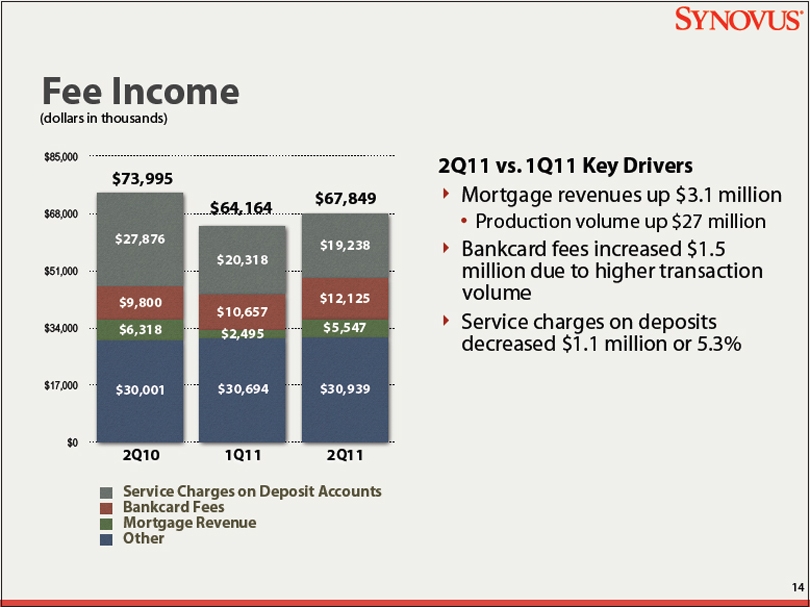
Fee Income
(dollars in thousands)
$85,000
$68,000
$51,000
$34,000
$17,000
$0
$73,995
$64,164
$67,849
$27,876
$9,800
$6,318
$30,001
$20,318
$10,657
$2,495
$30,694
$19,238
$12,125
$5,547
$30,939
2Q10 1Q11 2Q11
2Q11 vs. 1Q11 Key Drivers
Mortgage revenues up $3.1 million
Production volume up $27 million
Bankcard fees increased $1.5 million due to higher transaction volume
Service charges on deposits decreased $1.1 million or 5.3%
Service Charges on Deposit Accounts
Bankcard Fees
Mortgage Revenue
Other
14
SYNOVUS
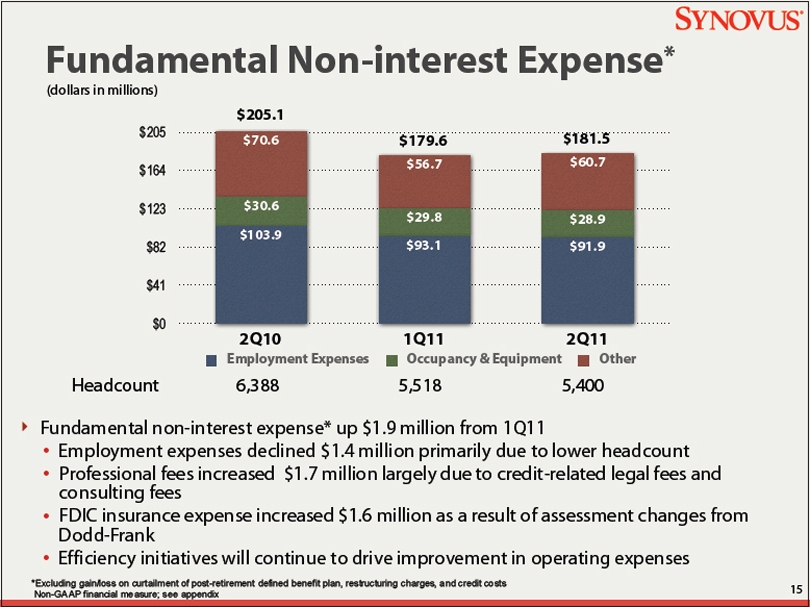
Fundamental Non-interest Expense*
(dollars in millions)
$205
$164
$123
$82
$41
$0
$205.1 $179.6 $181.5
$70.6
$30.6
$103.9
$56.7
$29.8
$93.1
$60.7
$28.9
$91.9
2Q10 1Q11 2Q11
Employment Expenses Occupancy & Equipment Other
Headcount 6,388 5,518 5,400
Fundamental non-interest expense* up $1.9 million from 1Q11
Employment expenses declined $1.4 million primarily due to lower headcount
Professional fees increased $1.7 million largely due to credit-related legal fees and consulting fees
FDIC insurance expense increased $1.6 million as a result of assessment changes from Dodd-Frank
Efficiency initiatives will continue to drive improvement in operating expenses
*Excluding gain/loss on curtailment of post-retirement defined benefit plan, restructuring charges, and credit costs
Non-GAAP financial measure; see appendix
15
SYNOVUS
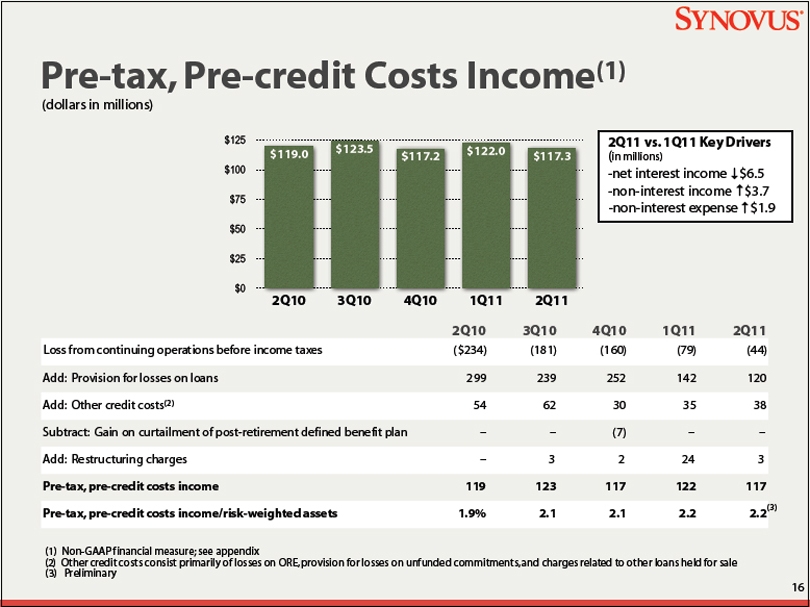
Pre-tax, Pre-credit Costs Income(1)
(dollars in millions)
$125
$100
$75
$50
$25
$0
$119.0 $123.5 $117.2 $122.0 $117.3
2Q10 3Q10 4Q10 1Q11 2Q11
2Q11 vs. 1Q11 Key Drivers
(in millions)
-net interest income $6.5
-non-interest income $3.7
-non-interest expense $1.9
2Q10 3Q10 4Q10 1Q11 2Q11
Loss from continuing operations before income taxes ($234) (181) (160) (79) (44)
Add: Provision for losses on loans 299 239 252 142 120
Add: Other credit costs(2) 54 62 30 35 38
Subtract: Gain on curtailment of post-retirement defined benefit plan – – (7) – –
Add: Restructuring charges – 3 2 24 3
Pre-tax, pre-credit costs income Pre-tax, pre-credit costs income/risk-weighted assets 119 1.9% 123 2.1 117 2.1 122 2.2 117 2.2(3)
(1) Non-GAAP financial measure; see appendix
(2) Other credit costs consist primarily of losses on ORE, provision for losses on unfunded commitments, and charges related to other loans held for sale
(3) Preliminary
16
SYNOVUS
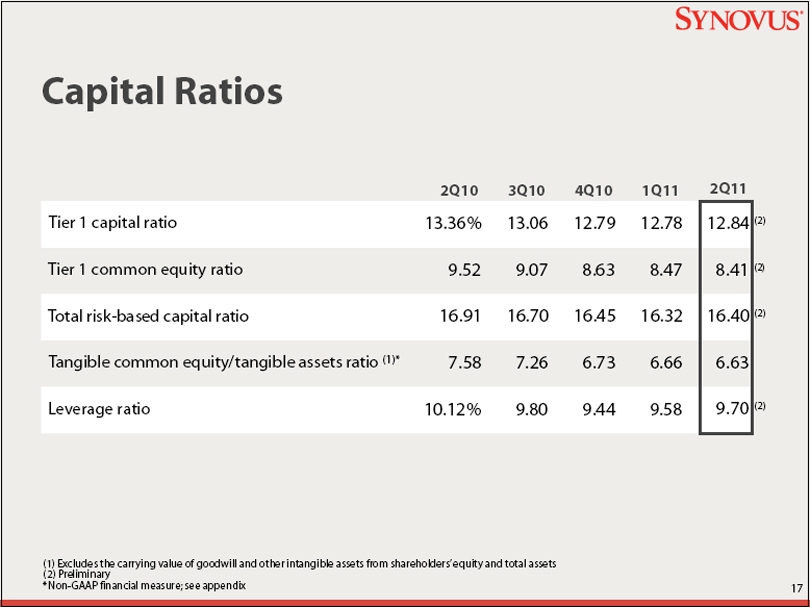
Capital Ratios
2Q10 3Q10 4Q10 1Q11 2Q11
Tier 1 capital ratio 13.36% 13.06 12.79 12.78 12.84 (2)
Tier 1 common equity ratio 9.52 9.07 8.63 8.47 8.41 (2)
Total risk-based capital ratio 16.91 16.70 16.45 16.32 16.40 (2)
Tangible common equity/tangible assets ratio (1)* 7.58 7.26 6.73 6.66 6.63
Leverage ratio 10.12% 9.80 9.44 9.58 9.70 (2)
(1) Excludes the carrying value of goodwill and other intangible assets from shareholders’ equity and total assets
(2) Preliminary
*Non-GAAP financial measure; see appendix
17
SYNOVUS
Credit Update
18
SYNOVUS
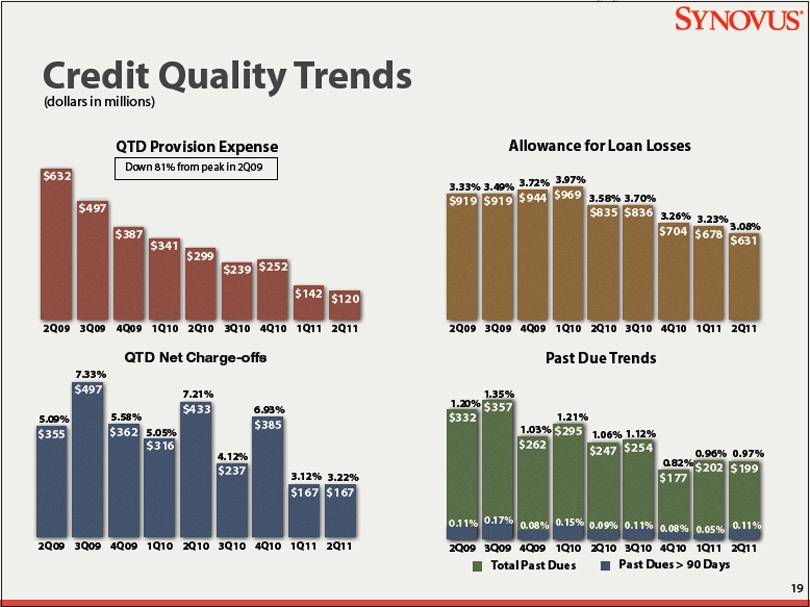
Credit Quality Trends
3.33%
(dollars in millions)
$202 $199
$177
$247 $254
$295
$262
$357
$332
2Q09 3Q09 4Q09 1Q10 2Q10 3Q10 4Q10 1Q11 2Q11
2Q09 3Q09 4Q09 1Q10 2Q10 3Q10 4Q10 1Q11 2Q11
$142 $120
$239 $252
$299
$341
$387
$497
$632
2Q09 3Q09 4Q09 1Q10 2Q10 3Q10 4Q10 1Q11 2Q11
$704 $678 $631
$835 $836
$919 $919 $944 $969
1.03%
Total Past Dues
3.49%
1.20%
1.35%
0.11% 0.17%
3.72%
0.08%
3.97%
1.21%
0.15%
3.58%
1.06%
0.09%
Past Dues > 90 Days
3.70%
1.12%
0.11%
Down 81% from peak in 2Q09
Past Due Trends
Allowance for Loan Losses
QTD Provision Expense
3.26%
0.82%
0.08%
3.23%
0.96%
0.05%
2Q09 3Q09 4Q09 1Q10 2Q10 3Q10 4Q10 1Q11 2Q11
$167 $167
$385
$237
$433
$316
$362
$497
$355
7.21%
7.33%
5.09% 5.58%
5.05%
4.12%
QTD Net Charge-offs
6.93%
3.12%
3.08%
3.22%
0.97%
0.11%
19
SYNOVUS
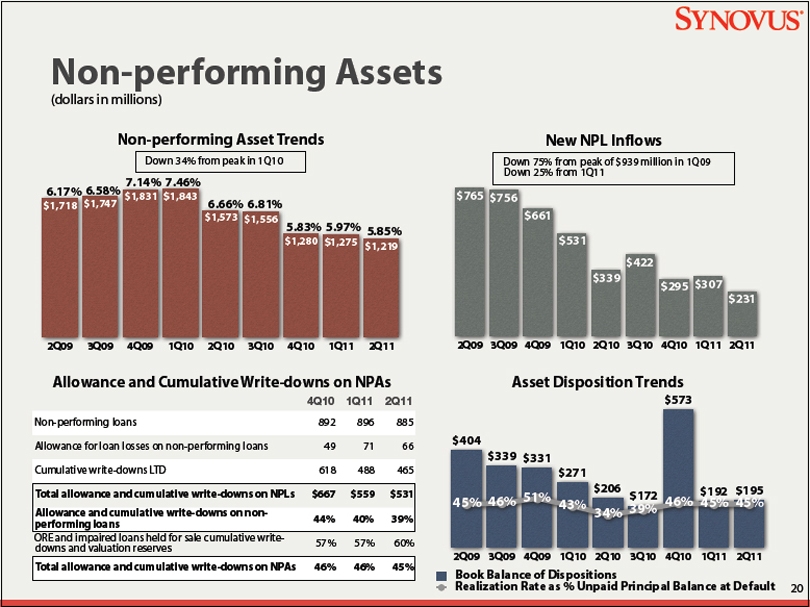
Non-performing Assets
(dollars in millions)
2Q09 3Q09 4Q09 1Q10 2Q10 3Q10 4Q10 1Q11 2Q11
$1,280 $1,275 $1,219
$1,573 $1,556
$1,831 $1,843
$1,718 $1,747
Non-performing Asset Trends
Down 34% from peak in 1Q10
6.66% 6.81%
7.14% 7.46%
6.17% 6.58%
5.83%
5.97%
5.85%
Allowance and Cumulative Write-downs on NPAs
4Q10 1Q11 2Q11
Non-performing loans 892 896 885
Allowance for loan losses on non-performing loans 49 71 66
Cumulative write-downs LTD 618 488 465
Total allowance and cumulative write-downs on NPLs $667 $559 $531
Allowance and cumulative write-downs on nonperforming
loans 44% 40% 39%
ORE and impaired loans held for sale cumulative writedowns
and valuation reserves 57% 57% 60%
Total allowance and cumulative write-downs on NPAs 46% 46% 45%
New NPL Inflows
2Q09 3Q09 4Q09 1Q10 2Q10 3Q10 4Q10 1Q11 2Q11
$231
$295 $307
$422
$339
$531
$661
$765 $756
Down 75% from peak of $939 million in 1Q09
Down 25% from 1Q11
2Q09 3Q09 4Q09 1Q10 2Q10 3Q10 4Q10 1Q11 2Q11
$404
$339 $331
$271
$206
$172
$573
$192 $195
45% 46% 51% 43%
34% 39% 46% 45% 45%
Book Balance of Dispositions
Realization Rate as % Unpaid Principal Balance at Default
Asset Disposition Trends
20
SYNOVUS
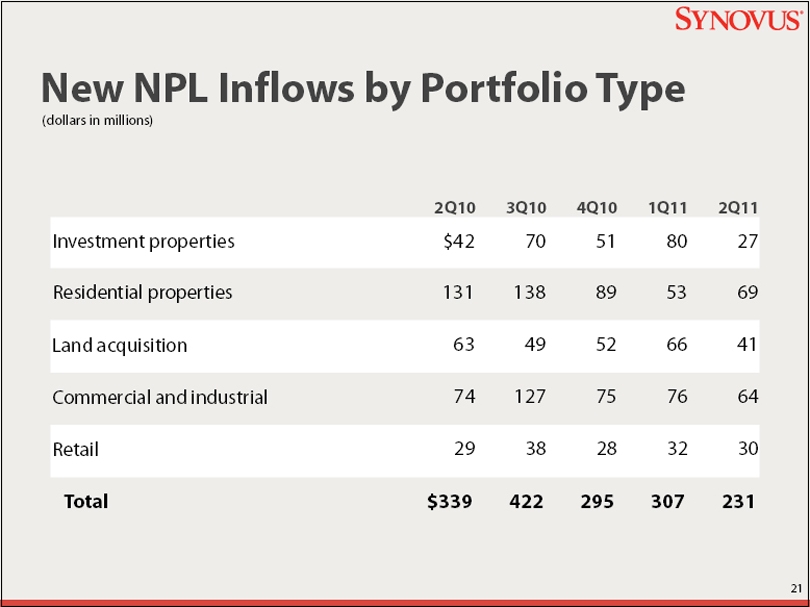
New NPL Inflows by Portfolio Type (dollars in millions)
2Q10 3Q10 4Q10 1Q11 2Q11
Investment properties $42 70 51 80 27
Residential properties 131 138 89 53 69
Land acquisition 63 49 52 66 41
Commercial and industrial 74 127 75 76 64
Retail 29 38 28 32 30
Total $339 422 295 307 231
21
SYNOVUS
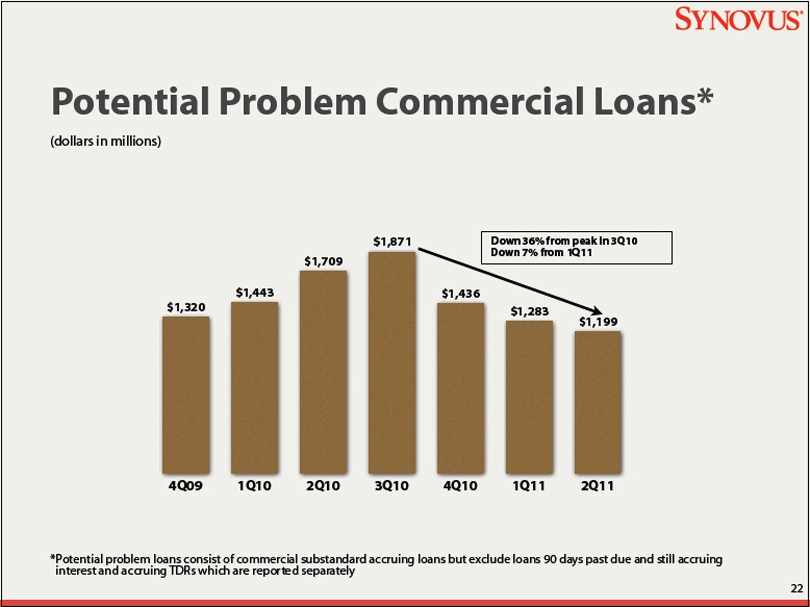
Potential Problem Commercial Loans*
(dollars in millions)
4Q09 1Q10 2Q10 3Q10 4Q10 1Q11 2Q11
$1,199
$1,283
$1,436
$1,871
$1,709
$1,443
$1,320
Down 36% from peak in 3Q10
Down 7% from 1Q11
*Potential problem loans consist of commercial substandard accruing loans but exclude loans 90 days past due and still accruing
interest and accruing TDRs which are reported separately
22
SYNOVUS
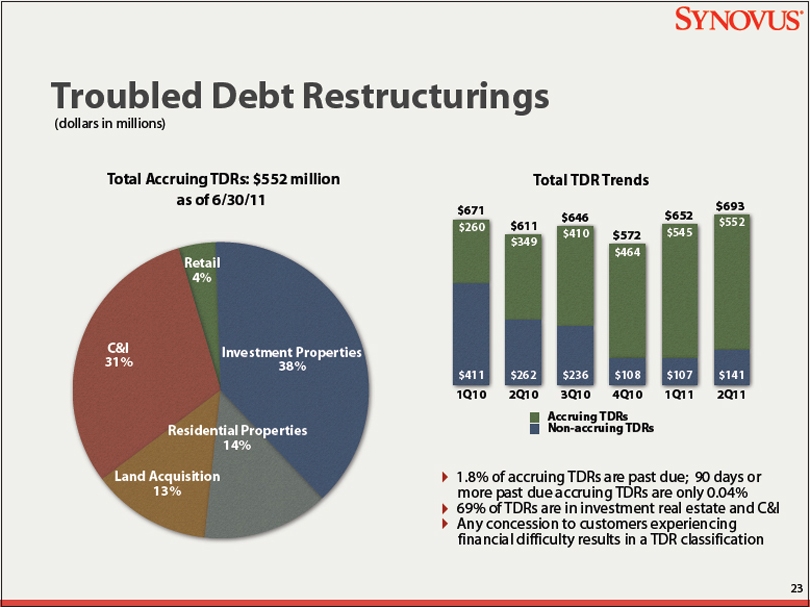
Troubled Debt Restructurings
(dollars in millions)
Total Accruing TDRs: $552 million
as of 6/30/11
Retail
4%
C&I
31%
Land Acquisition
13%
Residential Properties
14%
Investment Properties
38%
1Q10 2Q10 3Q10 4Q10 1Q11 2Q11
$552
$545
$464
$410
$349
$260
$411 $262 $236 $108 $107 $141
Total TDR Trends
$671
$611
$646
$572
$652
$693
Non-accruing TDRs
Accruing TDRs
1.8% of accruing TDRs are past due; 90 days or
more past due accruing TDRs are only 0.04%
69% of TDRs are in investment real estate and C&I
Any concession to customers experiencing
financial difficulty results in a TDR classification
23
SYNOVUS
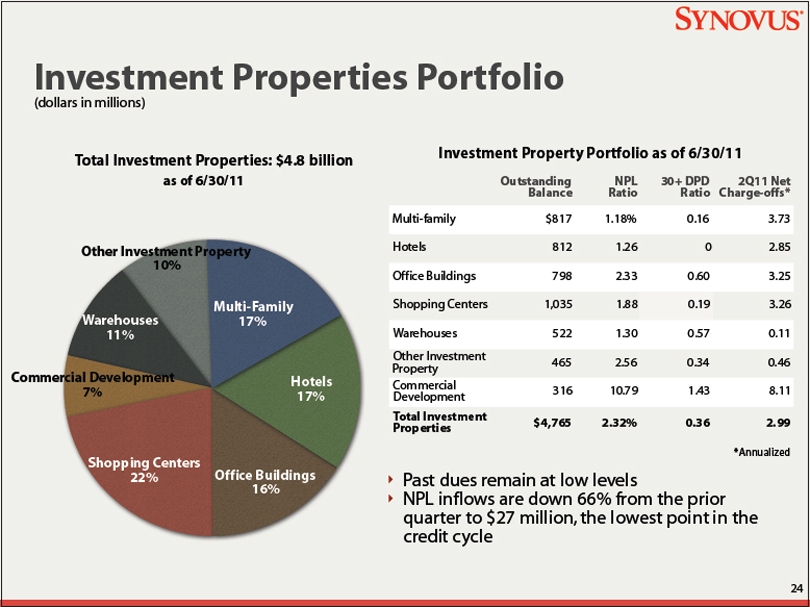
Investment Properties Portfolio
(dollars in millions)
Total Investment Properties: $4.8 billion
as of 6/30/11
Other Investment Property
10%
Warehouses
11%
Commercial Development
7%
Shopping Centers
22% Office Buildings
16%
Hotels
17%
Multi-Family
17%
Investment Property Portfolio as of 6/30/11
Outstanding
Balance NPL Ratio 30+ DPD Ratio 2Q11 Net Charge-offs*
Multi-family $817 1.18% 0.16 3.73
Hotels 812 1.26 0 2.85
Office Buildings 798 2.33 0.60 3.25
Shopping Centers 1,035 1.88 0.19 3.26
Warehouses 522 1.30 0.57 0.11
Other Investment Property Commercial Development Total Investment Properties 465 316 $4,765 2.56 10.79 2.32% 0.34 1.43 0.36 0.46 8.11 2.99
*Annualized
Past dues remain at low levels
NPL inflows are down 66% from the prior
quarter to $27 million, the lowest point in the
credit cycle
24
SYNOVUS
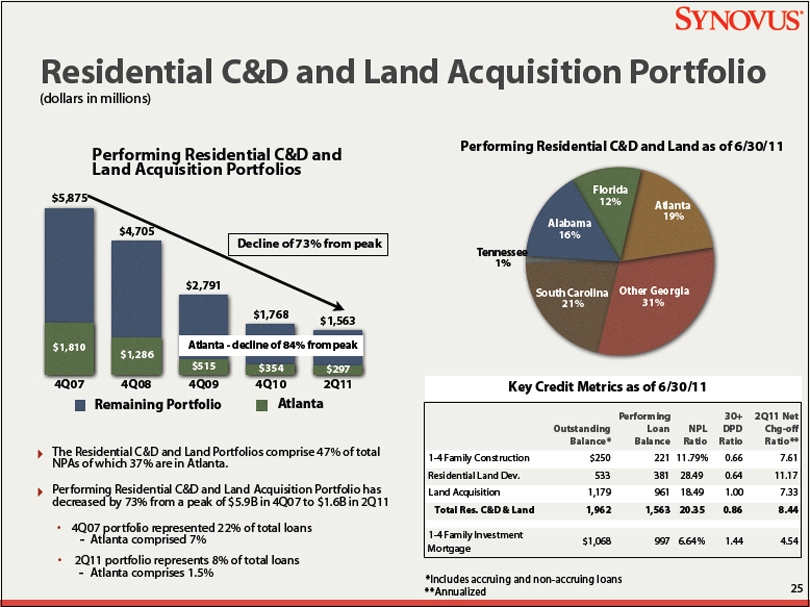
Residential C&D and Land Acquisition Portfolio
(dollars in millions)
Performing Residential C&D and
Land Acquisition Portfolios
4Q07 4Q08 4Q09 4Q10 2Q11
$1,768 $1,563
$2,791
$4,705
$5,875
$515 $354 $297
$1,286
$1,810
Remaining Portfolio
Atlanta
Decline of 73% from peak
Atlanta - decline of 84% from peak
The Residential C&D and Land Portfolios comprise 47% of total
NPAs of which 37% are in Atlanta.
Performing Residential C&D and Land Acquisition Portfolio has
decreased by 73% from a peak of $5.9B in 4Q07 to $1.6B in 2Q11
4Q07 portfolio represented 22% of total loans
Atlanta comprised 7%
2Q11 portfolio represents 8% of total loans
Atlanta comprises 1.5%
Performing Residential C&D and Land as of 6/30/11
Tennessee
1%
South Carolina
21%
Other Georgia
31%
Atlanta
19%
Florida
12%
Alabama
16%
Key Credit Metrics as of 6/30/11
Outstanding
Balance*
Performing
Loan
Balance
NPL
Ratio
30+
DPD
Ratio
2Q11 Net
Chg-off
Ratio**
1-4 Family Construction $250 221 11.79% 0.66 7.61
Residential Land Dev. 533 381 28.49 0.64 11.17
Land Acquisition 1,179 961 18.49 1.00 7.33
Total Res. C&D & Land 1,962 1,563 20.35 0.86 8.44
1-4 Family Investment
Mortgage $1,068 997 6.64% 1.44 4.54
*Includes accruing and non-accruing loans
**Annualized
25
SYNOVUS
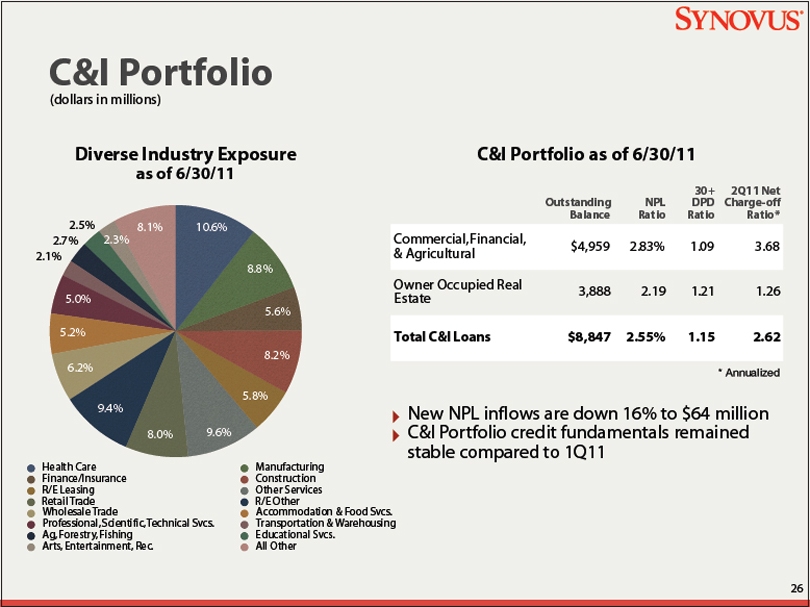
C&I Portfolio
(dollars in millions)
Diverse Industry Exposure as of 6/30/11
8.1%
2.3%
2.5%
2.7%
2.1%
5.0%
5.2%
6.2%
9.4%
8.0%
9.6%
5.8%
8.2%
5.6%
8.8%
10.6%
Health Care
Manufacturing
Finance/Insurance
Construction
R/E Leasing
Other Services
Retail Trade
R/E Other
Wholesale Trade Accommodation & Food Svcs.
Professional, Scientific, Technical Svcs.
Transportation & Warehousing
Ag, Forestry, Fishing
Educational Svcs.
Arts, Entertainment, Rec.
All Other
C&I Portfolio as of 6/30/11
Outstanding Balance
NPL Ratio
30+ DPD Ratio
2Q11 Net Charge-off Ratio*
Commercial, Financial, & Agricultural $4,959 2.83% 1.09 3.68
Owner Occupied Real Estate 3,888 2.19 1.21 1.26
Total C&I Loans $8,847 2.55% 1.15 2.62
* Annualized
New NPL inflows are down 16% to $64 million C&I Portfolio credit fundamentals remained stable compared to 1Q11
26
SYNOVUS
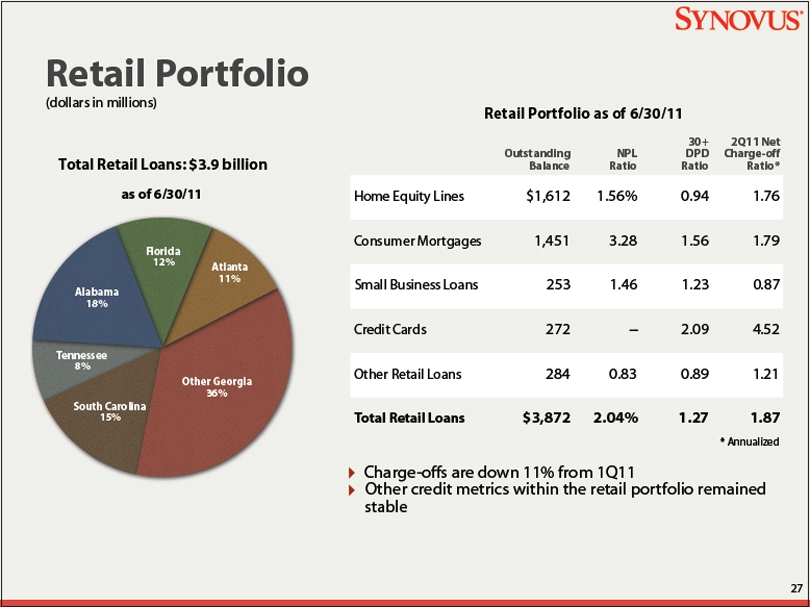
Retail Portfolio
(dollars in millions)
Total Retail Loans: $3.9 billion as of 6/30/11
Tennessee
8%
South Carolina
15%
Other Georgia
36%
Atlanta
11%
Florida
12%
Alabama
18%
Retail Portfolio as of 6/30/11
Outstanding Balance
NPL Ratio
30+ DPD Ratio
2Q11 Net Charge-off Ratio*
Home Equity Lines
Consumer Mortgages
Small Business Loans
Credit Cards
Other Retail Loans
Total Retail Loans
$1,612
1,451
253
272
284
$3,872
1.56%
3.28
1.46
–
0.83
2.04%
0.94
1.56
1.23
2.09
0.89
1.27
1.76
1.79
0.87
4.52
1.21
1.87
*Annualized
Charge-offs are down 11% from 1Q11
Other credit metrics within the retail portfolio remained stable
27
SYNOVUS
Appendix
28
SYNOVUS
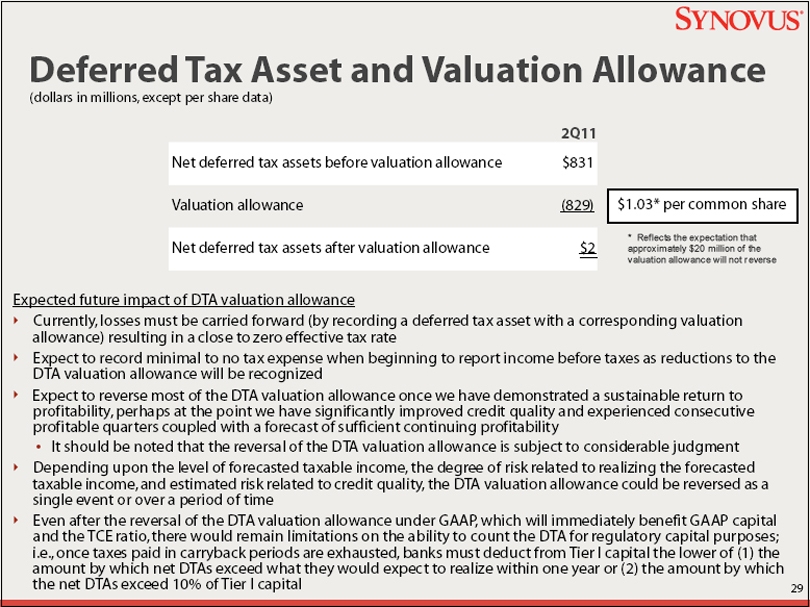
Deferred Tax Asset and Valuation Allowance
(dollars in millions, except per share data)
2Q11
Net deferred tax assets before valuation allowance $831
Valuation allowance (829)
Net deferred tax assets after valuation allowance $2
$1.03* per common share
* Reflects the expectation that approximately $20 million of the valuation allowance will not reverse
Expected future impact of DTA valuation allowance
Currently, losses must be carried forward (by recording a deferred tax asset with a corresponding valuation allowance) resulting in a close to zero effective tax rate
Expect to record minimal to no tax expense when beginning to report income before taxes as reductions to the
DTA valuation allowance will be recognized
Expect to reverse most of the DTA valuation allowance once we have demonstrated a sustainable return to profitability, perhaps at the point we have significantly improved credit quality and experienced consecutive profitable quarters coupled with a forecast of sufficient continuing profitability
It should be noted that the reversal of the DTA valuation allowance is subject to considerable judgment
Depending upon the level of forecasted taxable income, the degree of risk related to realizing the forecasted taxable income, and estimated risk related to credit quality, the DTA valuation allowance could be reversed as a single event or over a period of time
Even after the reversal of the DTA valuation allowance under GAAP, which will immediately benefit GAAP capital and the TCE ratio, there would remain limitations on the ability to count the DTA for regulatory capital purposes; i.e., once taxes paid in carryback periods are exhausted, banks must deduct from Tier I capital the lower of (1) the amount by which net DTAs exceed what they would expect to realize within one year or (2) the amount by which the net DTAs exceed 10% of Tier I capital
29
SYNOVUS
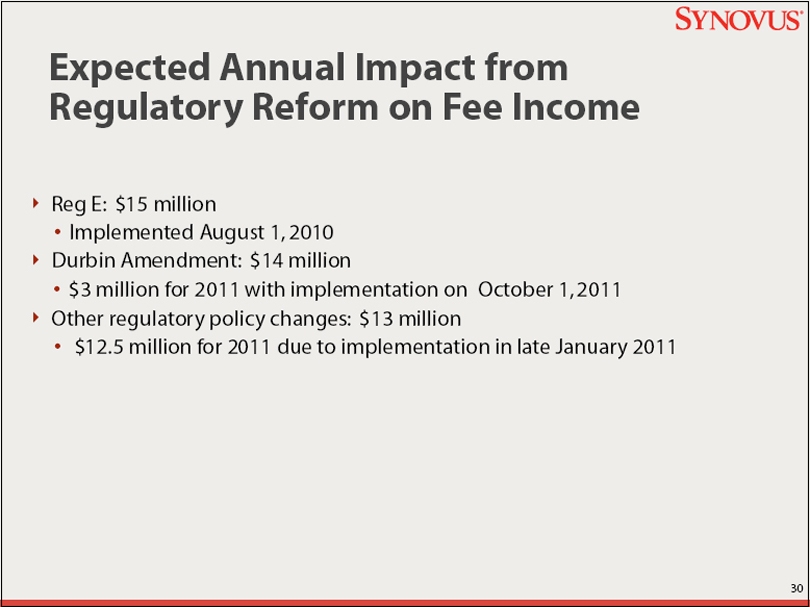
Expected Annual Impact from
Regulatory Reform on Fee Income
Reg E: $15 million
Implemented August 1, 2010
Durbin Amendment: $14 million
$3 million for 2011 with implementation on October 1, 2011
Other regulatory policy changes: $13 million
$12.5 million for 2011 due to implementation in late January 2011
30
SYNOVUS
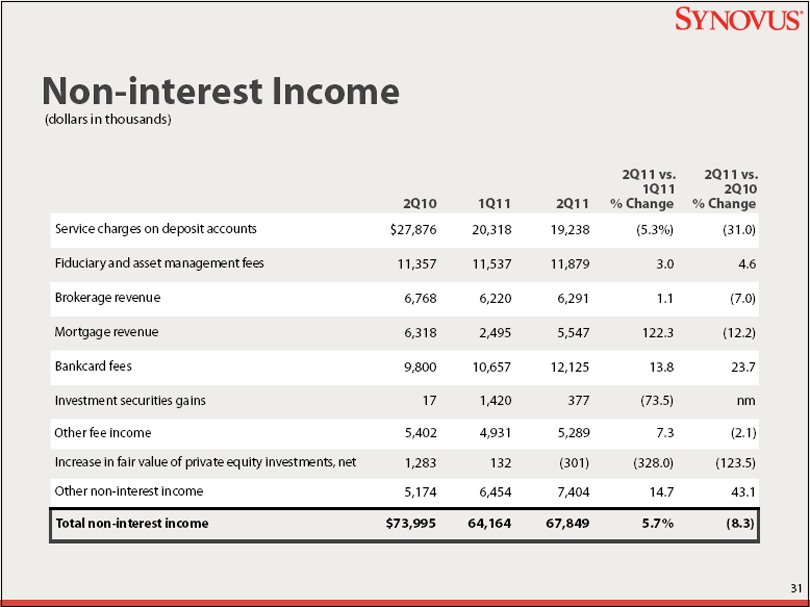
Non-interest Income
(dollars in thousands)
2Q10 1Q11 2Q11
2Q11 vs.
1Q11
% Change
2Q11 vs.
2Q10
% Change
Service charges on deposit accounts $27,876 20,318 19,238 (5.3%) (31.0)
Fiduciary and asset management fees 11,357 11,537 11,879 3.0 4.6
Brokerage revenue 6,768 6,220 6,291 1.1 (7.0)
Mortgage revenue 6,318 2,495 5,547 122.3 (12.2)
Bankcard fees 9,800 10,657 12,125 13.8 23.7
Investment securities gains 17 1,420 377 (73.5) nm
Other fee income 5,402 4,931 5,289 7.3 (2.1)
Increase in fair value of private equity investments, net 1,283 132 (301) (328.0) (123.5)
Other non-interest income 5,174 6,454 7,404 14.7 43.1
Total non-interest income $73,995 64,164 67,849 5.7% (8.3)
31
SYNOVUS
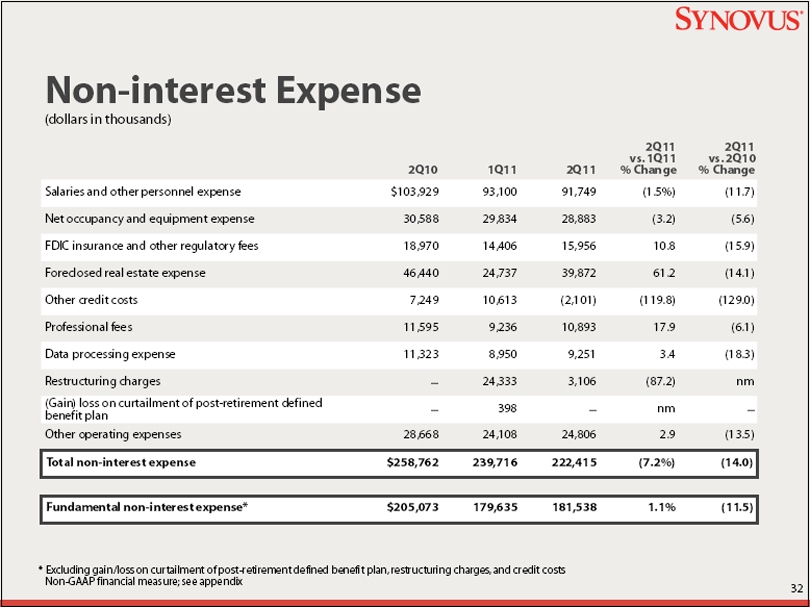
Non-interest Expense
(dollars in thousands)
2Q10 1Q11 2Q11
2Q11
vs. 1Q11
% Change
2Q11
vs. 2Q10
% Change
Salaries and other personnel expense $103,929 93,100 91,749 (1.5%) (11.7)
Net occupancy and equipment expense 30,588 29,834 28,883 (3.2) (5.6)
FDIC insurance and other regulatory fees 18,970 14,406 15,956 10.8 (15.9)
Foreclosed real estate expense 46,440 24,737 39,872 61.2 (14.1)
Other credit costs 7,249 10,613 (2,101) (119.8) (129.0)
Professional fees 11,595 9,236 10,893 17.9 (6.1)
Data processing expense 11,323 8,950 9,251 3.4 (18.3)
Restructuring charges - 24,333 3,106 (87.2) nm
(Gain) loss on curtailment of post-retirement defined
benefit plan - 398 - nm -
Other operating expenses 28,668 24,108 24,806 2.9 (13.5)
Total non-interest expense $258,762 239,716 222,415 (7.2%) (14.0)
Fundamental non-interest expense* $205,073 179,635 181,538 1.1% (11.5)
* Excluding gain/loss on curtailment of post-retirement defined benefit plan, restructuring charges, and credit costs
Non-GAAP financial measure; see appendix
32
SYNOVUS
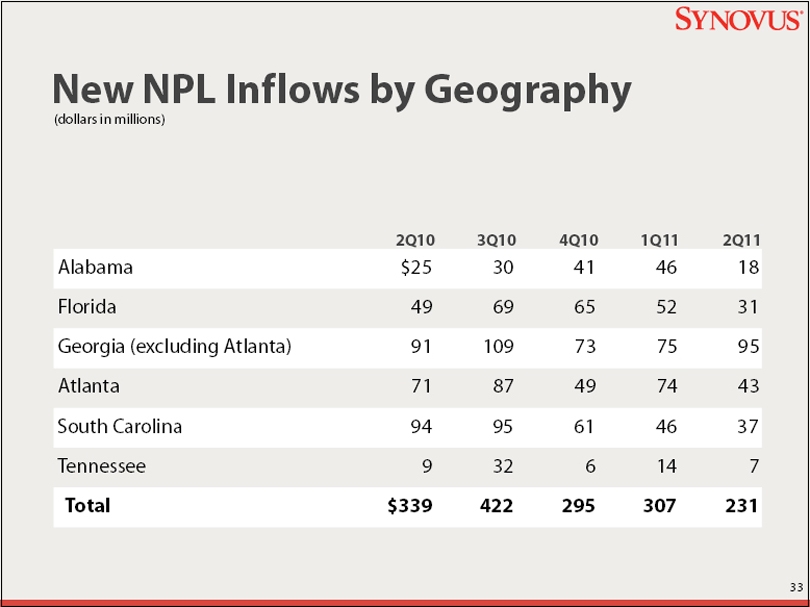
New NPL Inflows by Geography
(dollars in millions)
2Q10 3Q10 4Q10 1Q11 2Q11
Alabama $25 30 41 46 18
Florida 49 69 65 52 31
Georgia (excluding Atlanta) 91 109 73 75 95
Atlanta 71 87 49 74 43
South Carolina 94 95 61 46 37
Tennessee 9 32 6 14 7
Total $339 422 295 307 231
33
SYNOVUS
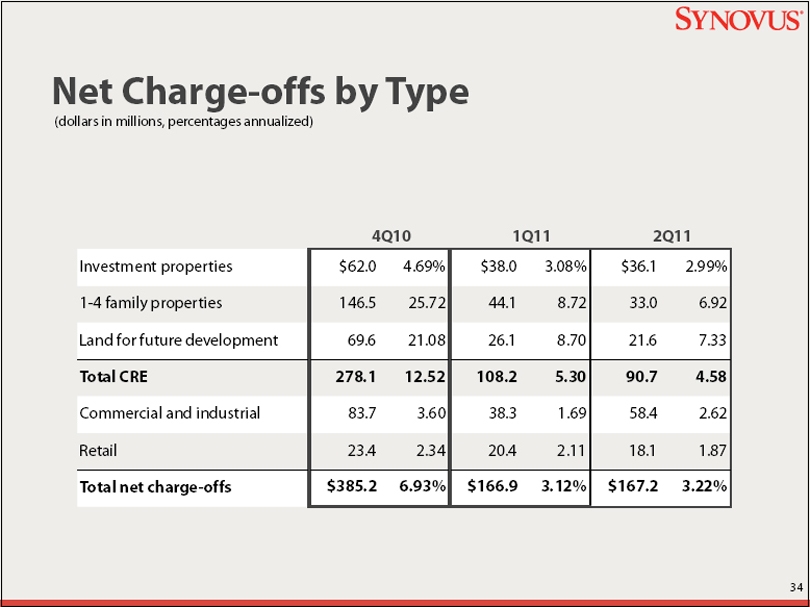
Net Charge-offs by Type
(dollars in millions, percentages annualized)
4Q10 1Q11 2Q11
Investment properties $62.0 4.69% $38.0 3.08% $36.1 2.99%
1-4 family properties 146.5 25.72 44.1 8.72 33.0 6.92
Land for future development 69.6 21.08 26.1 8.70 21.6 7.33
Total CRE 278.1 12.52 108.2 5.30 90.7 4.58
Commercial and industrial 83.7 3.60 38.3 1.69 58.4 2.62
Retail 23.4 2.34 20.4 2.11 18.1 1.87
Total net charge-offs $385.2 6.93% $166.9 3.12% $167.2 3.22%
34
SYNOVUS
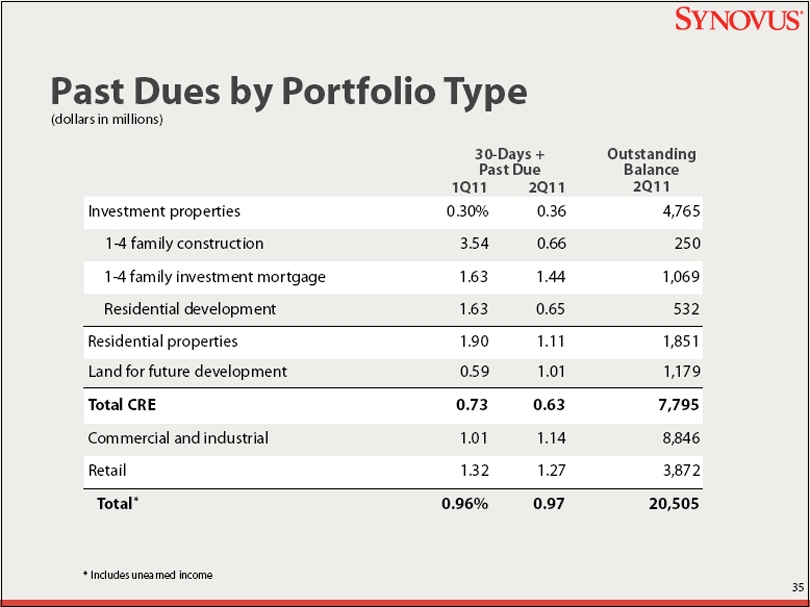
Past Dues by Portfolio Type
(dollars in millions)
30-Days +
Past Due
Outstanding
Balance
1Q11 2Q11 2Q11
Investment properties 0.30% 0.36 4,765
1-4 family construction 3.54 0.66 250
1-4 family investment mortgage 1.63 1.44 1,069
Residential development 1.63 0.65 532
Residential properties 1.90 1.11 1,851
Land for future development 0.59 1.01 1,179
Total CRE 0.73 0.63 7,795
Commercial and industrial 1.01 1.14 8,846
Retail 1.32 1.27 3,872
Total* 0.96% 0.97 20,505
* Includes unearned income
35
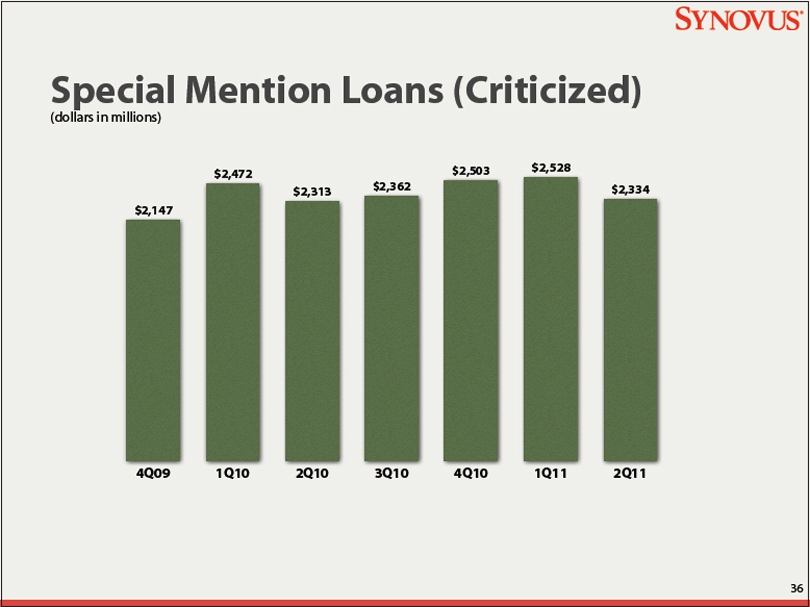
SYNOVUS
Special Mention Loans (Criticized)
(dollars in millions)
$2,147
$2,472
$2,313
$2,362
$2,503
$2,528
$2,334
4Q09
1Q10
2Q10
3Q10
4Q10
1Q11
2Q11
36
SYNOVUS
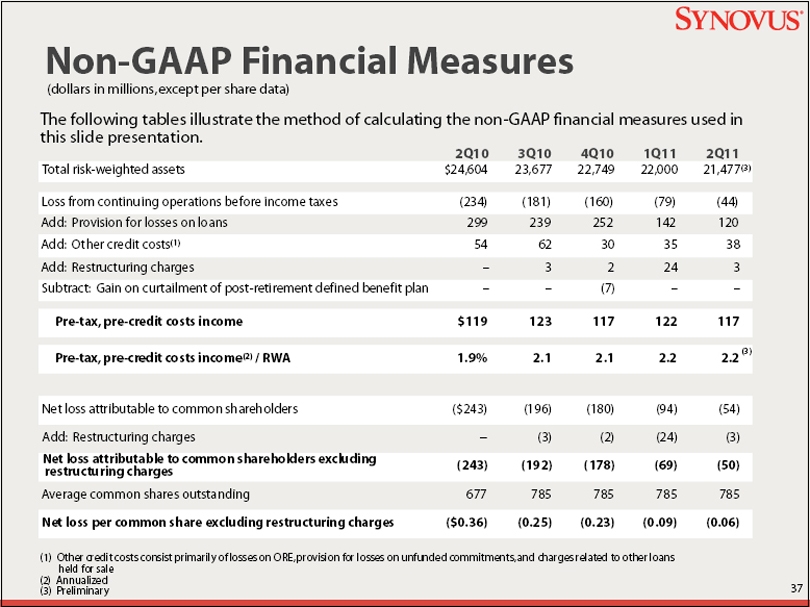
Non-GAAP Financial Measures
(dollars in millions, except per share data)
The following tables illustrate the method of calculating the non-GAAP financial measures used in this slide presentation.
2Q10 3Q10 4Q10 1Q11 2Q11
Total risk-weighted assets $24,604 23,677 22,749 22,000 21,477 (3)
Loss from continuing operations before income taxes (234) (181) (160) (79) (44)
Add: Provision for losses on loans 299 239 252 142 120
Add: Other credit costs(1) 54 62 30 35 38
Add: Restructuring charges - 3 2 24 3
Subtract: Gain on curtailment of post-retirement defined benefit plan - - (7) - -
Pre-tax, pre-credit costs income $119 123 117 122 117
Pre-tax, pre-credit costs income(2) / RWA 1.9% 2.1 2.1 2.2 2.2 (3)
Net loss attributable to common shareholders ($243) (196) (180) (94) (54)
Add: Restructuring charges - (3) (2) (24) (3)
Net loss attributable to common shareholders excluding restructuring charges (243) (192) (178) (69) (50)
Average common shares outstanding 677 785 785 785 785
Net loss per common share excluding restructuring charges ($0.36) (0.25) (0.23) (0.09) (0.06)
(1) Other credit costs consist primarily of losses on ORE, provision for losses on unfunded commitments, and charges related to other loans held for sale
(2) Annualized
(3) Preliminary
37
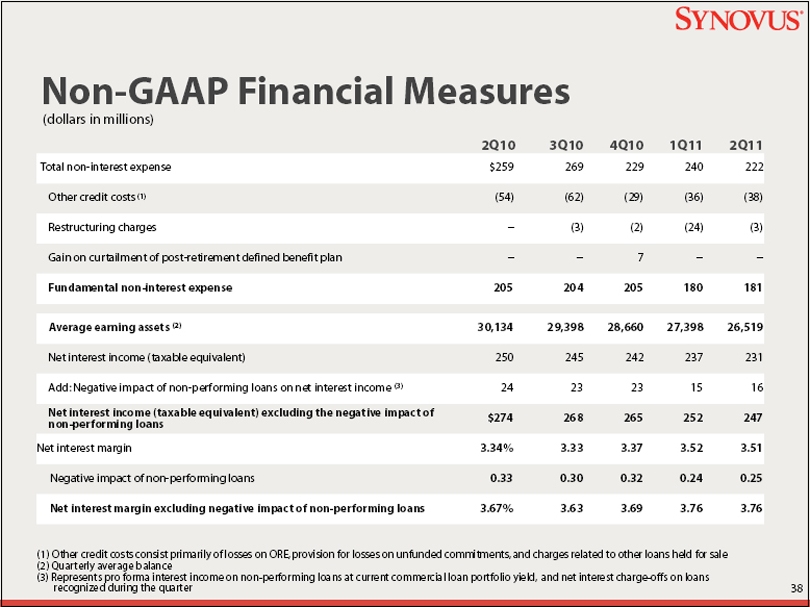
SYNOVUS
Non-GAAP Financial Measures
(dollars in millions)
2Q10 3Q10 4Q10 1Q11 2Q11
Total non-interest expense $259 269 229 240 222
Other credit costs (1) (54) (62) (29) (36) (38)
Restructuring charges - (3) (2) (24) (3)
Gain on curtailment of post-retirement defined benefit plan - - 7 - -
Fundamental non-interest expense 205 204 205 180 181
Average earning assets (2) 30,134 29,398 28,660 27,398 26,519
Net interest income (taxable equivalent) 250 245 242 237 231
Add: Negative impact of non-performing loans on net interest income (3) 24 23 23 15 16
Net interest income (taxable equivalent) excluding the negative impact of non-performing loans $274 268 265 252 247
Net interest margin 3.34% 3.33 3.37 3.52 3.51
Negative impact of non-performing loans 0.33 0.30 0.32 0.24 0.25
Net interest margin excluding negative impact of non-performing loans 3.67% 3.63 3.69 3.76 3.76
(1) Other credit costs consist primarily of losses on ORE, provision for losses on unfunded commitments, and charges related to other loans held for sale
(2) Quarterly average balance
(3) Represents pro forma interest income on non-performing loans at current commercial loan portfolio yield, and net interest charge-offs on loans recognized during the quarter
38
SYNOVUS
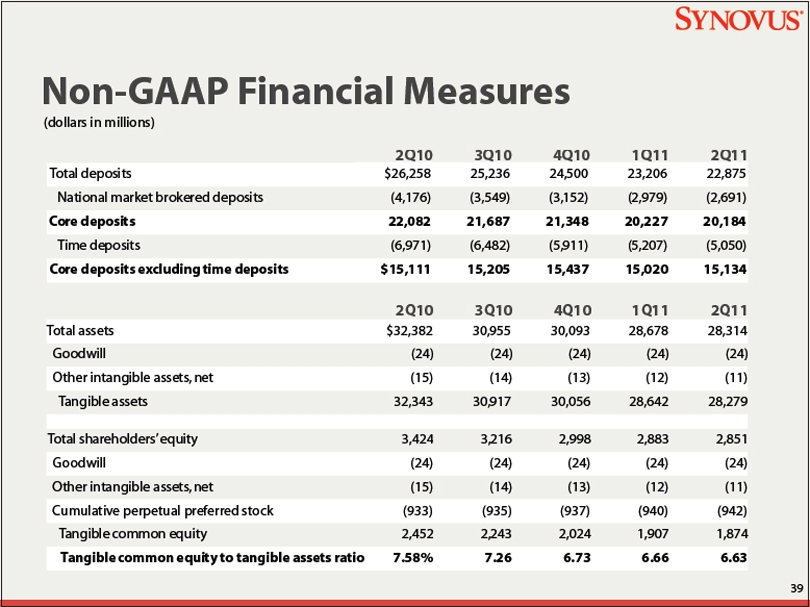
Non-GAAP Financial Measures
(dollars in millions)
2Q10 3Q10 4Q10 1Q11 2Q11
Total assets $32,382 30,955 30,093 28,678 28,314
Goodwill (24) (24) (24) (24) (24)
Other intangible assets, net (15) (14) (13) (12) (11)
Tangible assets 32,343 30,917 30,056 28,642 28,279
Total shareholders’ equity 3,424 3,216 2,998 2,883 2,851
Goodwill (24) (24) (24) (24) (24)
Other intangible assets, net (15) (14) (13) (12) (11)
Cumulative perpetual preferred stock (933) (935) (937) (940) (942)
Tangible common equity 2,452 2,243 2,024 1,907 1,874
Tangible common equity to tangible assets ratio 7.58% 7.26 6.73 6.66 6.63
2Q10 3Q10 4Q10 1Q11 2Q11
Total deposits $26,258 25,236 24,500 23,206 22,875
National market brokered deposits (4,176) (3,549) (3,152) (2,979) (2,691)
Core deposits 22,082 21,687 21,348 20,227 20,184
Time deposits (6,971) (6,482) (5,911) (5,207) (5,050)
Core deposits excluding time deposits $15,111 15,205 15,437 15,020 15,134
39