CONFIDENTIAL TREATMENT REQUESTED BY SYNOVUS FINANCIAL CORP.
PURSUANT TO 17 C.F.R. §200.83
SECTIONS MARKED WITH AN [*] OMIT CONFIDENTIAL INFORMATION DELIVERED TO
THE SEC’S DIVISION OF CORPORATION FINANCE IN AN UNREDACTED COPY OF THIS
LETTER PURSUANT TO 17 C.F.R. §200.83
 | ||
THOMAS J. PRESCOTT Executive Vice President and Chief Financial Officer (706) 649-2401 tommyprescott@synovus.com |
June 21, 2013
VIA EDGAR FILING AND OVERNIGHT DELIVERY
Mr. Amit Pande, Accounting Branch Chief
Division of Corporation Finance
Securities and Exchange Commission
100 F Street N.E.
Washington, D.C. 20549-3561
| Re: | Synovus Financial Corp. |
Form 10-K for the period ended December 31, 2012
Filed March 1, 2013
File No. 001-10312
Dear Mr. Pande:
Synovus Financial Corp., a Georgia corporation (the “Company” or “Synovus” or, in the first person notation, “we”, “us”, and “our”), is hereby responding to the comment letter of the Securities and Exchange Commission (the “SEC” or the “Commission”) dated May 23, 2013. In this letter, we refer to the staff of the SEC as the “Staff.” Paragraph numbering used for each response set forth below corresponds to the paragraph numbering in the Staff’s letter.
Pursuant to 17 C.F.R. §200.83 and because of the commercially sensitive nature of information contained herein, we are requesting confidential treatment for selected portions of this letter. The version of this letter filed via EDGAR omits such confidential information. The omitted confidential information has been replaced in this letter filed via EDGAR with a placeholder identified by a bracketed asterisk [*]. A complete unredacted version of this letter will be provided to the Staff only in hard copy and not electronically as correspondence under the SEC’s EDGAR system. The Company has sent to the Staff and the Office of Freedom of Information and Privacy Act Operations a separate letter requesting that, pursuant to Rule 83 of the SEC’s Rules on Information and Requests [17 C.F.R. §200.83] (“Rule 83”), the omitted confidential information not be disclosed in response to any request made under the Freedom of Information Act or otherwise.
December 31, 2012 Form 10-K
General
| 1. | We note you use the measure core expenses throughout your filing. Please revise future filings to |
| Securities and Exchange Commission | CONFIDENTIAL TREATMENT REQUESTED | |||
| June 21, 2013 | BY SYNOVUS FINANCIAL CORP. | |||
| Page | | 2 | PURSUANT TO 17 C.F.R. §200.83 | ||
change the name of this measure to more accurately reflect its content. In this regard, the use of the word “core” implies you are referring to your most central or essential operations and results. Removal of other credit costs from non-interest expense to arrive at “core” expenses implies that these credit charges are not an inherent part of your core operations. Thus, we believe it would be appropriate to use a more descriptive title to describe this non-GAAP measure, perhaps eliminating the use of the word “core” in its entirety.
Response
Synovus will revise the disclosure in its future filings by renaming the non-GAAP measure “core expenses” to be “adjusted non-interest expense”.
Actions by Federal and State Regulators, page 16
| 2. | You disclose that Synovus Bank entered into an informal written agreement with the FDIC relating to “certain compliance matters” as a result of recent compliance exams. Please confirm that you have disclosed all material terms of the informal written agreement that may impact your results of operations. |
Response
Synovus confirms that it has disclosed all material terms of the informal written agreement between Synovus Bank and the Federal Deposit Insurance Corporation relating to certain compliance matters that may impact Synovus’ results of operations.
Note 24 – Income Taxes, page 160
| 3. | You disclose that at December 31, 2012 you continue to be in a three-year cumulative loss position, which represents significant negative evidence. You further disclose that based on the assessment of all the positive and negative evidence, management concluded that it was more likely than not that $806.4 million of the net deferred tax assets will be realized based upon future taxable income, and you have therefore reversed $802.8 million of the valuation allowance in the fourth quarter of 2012. |
In determining the need for a valuation allowance and considering the guidance in paragraphs 21 – 23 of ASC 740-10-30, forming a conclusion that a valuation allowance is not needed is difficult when there is negative evidence such as cumulative losses in recent years, which is considered a significant piece of negative evidence that is difficult to overcome. Furthermore the weight given to the potential effect of negative and positive evidence should be commensurate with the extent to which it can be objectively verified.
Please provide us with the following information to support the realizability of the net deferred tax asset at December 31, 2012:
| a. | Detailed information comparing actual versus forecasted taxable income or financial results for the fiscal years ended December 31, 2012, 2011 and 2010. In regard to any forecasts and assumptions utilized, provide us with specific evidence to support the assumptions such as the number of years in the projections, estimated growth rates, net interest margins considered, estimated loan loss provision rates as well as revenue and expense growth rates utilized; |
Response
| Securities and Exchange Commission | CONFIDENTIAL TREATMENT REQUESTED | |||
| June 21, 2013 | BY SYNOVUS FINANCIAL CORP. | |||
| Page | | 3 | PURSUANT TO 17 C.F.R. §200.83 | ||
Annual Forecasting
Prior to the recent economic downturn, Synovus routinely produced reliable one-year annual forecasts. Based on consistent profitability and steady trending extending more than 25 years, Synovus had not deemed it necessary in the past to produce forecasts going out more than one year (see discussion of two-year forecast below). Synovus’ annual forecasts are approved by the Board of Directors during the early part of each year, and in recent years, the annual forecast has also been submitted to our banking regulatory agencies.
As illustrated in the chart below, in recent years, Synovus has been reasonably accurate in forecasting pre-tax income excluding credit costs and other unusual income and expense items, as shown below (“pre-tax, pre-credit costs income”), with variances from forecasted amounts of [*] in 2012, 2011 and 2010, respectively. However, in 2010, the credit costs variance to forecast was significant, primarily due to the economic downturn and rapid deterioration in real estate values in the Company’s market areas, as well as a continued elevated level of problematic credits in our loan portfolio. In 2011 and 2012, Synovus demonstrated a significantly improved ability to forecast credit costs and credit trends in its loan portfolio with actual non-performing loan (NPL) inflows compared to forecast variances of only [*] for 2011 and 2012, respectively. The 2011 total credit costs variance to forecast of [*], was largely due to management’s decision to reduce classified assets by disposing of an additional [*] million of distressed assets. The 2012 total credit costs variance to forecast of [*] was due to the strategic decision in the latter part of the fourth quarter of 2012 to enter into a bulk sale of distressed assets totaling [*] million in order to accelerate the reduction of non-performing assets (NPAs). This discretionary bulk asset sale added approximately [*] million of incremental credit costs for 2012. Excluding the incremental impact of these discretionary sales, total credit costs would have aligned consistently with forecasted credit costs for 2012 and reasonably close to forecasted credit costs for 2011.
Our improved credit costs and credit trend forecasting has been the result of strengthened credit monitoring processes, including centralization of credit management to a regional credit structure and the creation of a loan workout function, managed and staffed almost entirely with newly hired, experienced loan workout professionals, that support the Chief Credit Officer by providing a bottoms-up view that is utilized in the forecasting process. See further description of credit related process improvements in our response to Comment 4(b). Further, credit forecasting was extremely difficult at the beginning of the 2008 recession as no recent economic downturn has been as severe or rapid; and as a result, there were few comparisons available to predict the expected impact or duration. As Synovus has more experience in this economic cycle and with the benefit of strengthened processes, our credit forecasting has significantly improved, as demonstrated by the accuracy of our forecasted 2012 credit costs, and is expected to be reliable on a prospective basis.
The Company’s long-term ability to forecast pre-tax, pre-credit costs income and improved experience in forecasting credit costs supports the Company’s ability to accurately project future operating results. The following is detailed information comparing actual results to the annual forecast, including taxable income for the fiscal years ended December 31, 2012, 2011 and 2010.
| Securities and Exchange Commission | CONFIDENTIAL TREATMENT REQUESTED | |||
| June 21, 2013 | BY SYNOVUS FINANCIAL CORP. | |||
| Page | | 4 | PURSUANT TO 17 C.F.R. §200.83 | ||
| Synovus Financial Corp. | ||||||||||||||||
| 2010-2012: Actual vs. Forecast | ||||||||||||||||
| Variance | Assumptions | |||||||||||||||
| Favorable | (Unfavorable) | |||||||||||||||
(in thousands) | Actual | Forecast (1) | $ | % | Actual | Forecast | Comments | |||||||||
Net Interest Income | ||||||||||||||||
2010 | $986,333 | [*] | [*] | [*] | NIM 3.36% | [*] | N/A | |||||||||
2011 | 924,154 | [*] | [*] | [*] | NIM 3.51% | [*] | N/A | |||||||||
2012 | 854,117 | [*] | [*] | [*] | NIM 3.50% | [*] | N/A | |||||||||
Non-Interest Income(2) | ||||||||||||||||
2010 | $306,618 | [*] | [*] | [*] | 11.0% decline | [*] | N/A | |||||||||
2011 | 263,867 | [*] | [*] | [*] | 13.9% decline | [*] | Unfavorable variance due primarily to impact of regulatory reform changes on NSF fees and reductions in interchange fee income due to the implementation of the Durbin Amendment. | |||||||||
2012 | 274,824 | [*] | [*] | [*] | 4.2% increase | [*] | N/A | |||||||||
Adjusted Non-Interest Expense(3) |
| |||||||||||||||
2010 | $812,704 | [*] | [*] | [*] | 0.3% decline | [*] | N/A | |||||||||
2011 | 717,371 | [*] | [*] | [*] | 11.7% decline | [*] | N/A | |||||||||
2012 | 692,271 | [*] | [*] | [*] | 3.5% decline | [*] | N/A | |||||||||
Pre-Tax, Pre-Credit Costs Income(4) |
| |||||||||||||||
2010 | $480,247 | [*] | [*] | [*] | see above | N/A | ||||||||||
2011 | 470,650 | [*] | [*] | [*] | see above | N/A | ||||||||||
2012 | 436,670 | [*] | [*] | [*] | see above | N/A | ||||||||||
Total Credit Costs(5) | ||||||||||||||||
2010 | $1,329,700 | [*] | [*] | [*] | Net charge-off ratio 5.82%; LLR ratio 3.26% | [*] | Credit costs were higher due primarily to the economic downturn and rapid deterioration in real estate values in the Company’s market areas. | |||||||||
2011 | 568,088 | [*] | [*] | [*] | Net charge-off ratio 2.84%; LLR ratio 2.67% | [*] | Negative variance driven by higher levels of distressed asset dispositions which increased credit costs | |||||||||
2012 | 432,619 | [*] | [*] | [*] | Net charge-off ratio 2.45%; LLR ratio 1.91% | [*] | Actual results include approximately [*] in incremental credit costs related | |||||||||
| 2012 - Total Credit Costs excluding incremental impact of late Q4 discretionary distressed asset bulk sale | $ | 304,619 | [*] | [*] | [*] | N/A | N/A | |||||||||
| Securities and Exchange Commission | CONFIDENTIAL TREATMENT REQUESTED | |||
| June 21, 2013 | BY SYNOVUS FINANCIAL CORP. | |||
| Page | | 5 | PURSUANT TO 17 C.F.R. §200.83 | ||
Synovus Financial Corp. 2010-2012: Actual vs. Forecast | ||||||||||||||
| Variance Favorable (Unfavorable) | Assumptions | |||||||||||||
(in thousands) | Actual | Forecast (1) | $ | % | Forecast | Comments | ||||||||
Non-Performing Loan Inflows |
| |||||||||||||
2010 | $ | 1,587,000 | [*] | [*] | [*] | Management Estimate | While actual inflows were slightly favorable, charge-offs were significantly higher due to continued rapid deterioration in real estate values. | |||||||
2011 | 949,000 | [*] | [*] | [*] | Management Estimate | N/A | ||||||||
2012 | 641,406 | [*] | [*] | [*] | Management Estimate | N/A | ||||||||
Distressed Asset Dispositions |
| |||||||||||||
2010 | $ | 1,221,106 | [*] | [*] | [*] | Management Estimate | N/A | |||||||
2011 | 702,513 | [*] | [*] | [*] | Management Estimate | Actual results reflect higher levels of dispositions due to management’s decision to reduce classified assets. | ||||||||
2012 | 918,765 | [*] | [*] | [*] | Management Estimate | [*] | ||||||||
Investment Securities Gains / (Losses) | ||||||||||||||
2010 | $ | (1,271 | ) | [*] | [*] | NM | N/A | N/A | ||||||
2011 | 75,007 | [*] | [*] | NM | N/A | During the third quarter of 2011, Synovus implemented a repositioning of the investment securities portfolio. The primary purpose of this repositioning was to reduce prepayment risk in the mortgage backed securities portfolio and enhance capital by realizing market premiums on existing securities. | ||||||||
2012 | 39,142 | [*] | [*] | [*] | Management Estimate | N/A | ||||||||
Other Expense/(Income) Reported Separately(6) | ||||||||||||||
2010 | $ | (1,554 | ) | [*] | [*] | NM | N/A | N/A | ||||||
2011 | 37,101 | [*] | [*] | [*] | N/A | N/A | ||||||||
2012 | 11,716 | [*] | [*] | [*] | N/A | N/A | ||||||||
Income (Loss) From Continuing Operations Before Taxes | ||||||||||||||
2010 | $ | (849,170 | ) | [*] | [*] | [*] | See above | See comments above | ||||||
2011 | (59,532 | ) | [*] | [*] | [*] | See above | See comments above | |||||||
2012 | 31,477 | [*] | [*] | [*] | See above | See comments above | ||||||||
| 2012 Pre-tax Income excluding incremental impact of late Q4 discretionary distressed asset bulk sale | $ | 159,477 | [*] | [*] | [*] | |||||||||
(1) Annual forecast as originally approved by the Synovus Board of Directors and presented to our regulatory agencies in the first quarter of each year which was prepared using macroeconomic assumptions from Moody’s® Analytics, historical run rate analyses, and driver based models.
(2) Non-interest income excludes net investment securities gains, which are separately presented.
(3) Adjusted non-interest expense excludes other real estate expense and other credit costs, which are included in total credit costs. Further, adjusted non-interest expense also excludes Visa indemnification charges, restructuring charges, and gain / (loss) on curtailment of post-retirement defined benefit plan, which are separately presented as “Other Expense / (Income)”.
(4) Pre-tax, pre-credit costs income excludes total credit costs, restructuring charges, gain/(loss) on curtailment of post-retirement defined benefit plan, Visa indemnification charges, and net investment securities gains.
(5) Total credit costs include provision for loan losses, other real estate expense, and other credit costs, such as provision for losses on unfunded commitments and charges related to other loans held for sale.
(6) Other expense / (income) reported separately includes Visa indemnification charges (2012, $6.3 million expense; 2011, $6.0 million expense), gain/(loss) on curtailment of post retirement defined benefit plan (2011, $398 thousand loss; 2010, $7.1 million gain), and restructuring charges (2012, $5.4 million expense; 2011, $30.7 million expense; 2010, $5.5 million expense)
NM-not meaningful; NIM-net interest margin
| Securities and Exchange Commission | CONFIDENTIAL TREATMENT REQUESTED | |||
| June 21, 2013 | BY SYNOVUS FINANCIAL CORP. | |||
| Page | | 6 | PURSUANT TO 17 C.F.R. §200.83 | ||
Two-Year Forecast Prepared in 2010 for 2011 and 2012
In October 2010, Synovus developed a capital analysis plan that included a two-year detailed financial forecast. Prior to October 2010, detailed financial forecasts were generally only prepared for one-year periods.
As part of the two-year financial forecast and capital analysis, management prepared two economic forecast scenarios to analyze future capital levels, a “baseline” management forecast scenario (Base Case) and a “stressed” macroeconomic management forecast (Stress Case). The Base Case scenario was management’s estimate in 2010 of the most likely financial outcome, which assumed moderate economic improvement over the next two years. The Stress Case scenario was based on the macroeconomic assumptions published in the September 2010 publication of Moody’s® Analytics scenario, entitled “Deeper Second Recession” and included higher credit costs and lower loan growth as compared to the Base Case.
The following is detailed information comparing actual results for the year ended December 31, 2012 to the Base Case and Stress Case scenarios of the two-year forecast (2012) as prepared in October 2010. The one-year (2011) component of the two-year forecast is similar to the one-year forecast developed at the beginning of 2011, as discussed above, and with similar results in terms of actual versus forecast and is therefore not repeated here.
| Two Year Forecast from 2010 | Base Case 2012 | Stress Case 2012 | ||||||||||||||||||||||||||||||
| Forecast | Variance Favorable (Unfavorable) | Forecast | Variance Favorable (Unfavorable) | |||||||||||||||||||||||||||||
| (in thousands) | Actual | (from 2010) | $ | % | Actual | (from 2010) | $ | % | ||||||||||||||||||||||||
Net Interest Income | $ | 854,117 | [*] | [*] | [*] | $ | 854,117 | [*] | [*] | [*] | ||||||||||||||||||||||
Non-Interest Income | $ | 274,824 | [*] | [*] | [*] | $ | 274,824 | [*] | [*] | [*] | ||||||||||||||||||||||
Non-Interest Expense | $ | 692,271 | [*] | [*] | [*] | $ | 692,271 | [*] | [*] | [*] | ||||||||||||||||||||||
|
|
|
|
|
|
|
|
|
|
|
|
|
|
|
| |||||||||||||||||
Pre-Tax, Pre-Credit Costs Income | $ | 436,670 | [*] | [*] | [*] | $ | 436,670 | [*] | [*] | [*] | ||||||||||||||||||||||
Total Credit Costs | $ | 432,619 | [*] | [*] | [*] | $ | 432,619 | [*] | [*] | [*] | ||||||||||||||||||||||
Income Before Taxes | $ | 31,477 | [*] | [*] | [*] | $ | 31,477 | [*] | [*] | [*] | ||||||||||||||||||||||
|
|
|
|
|
|
|
|
|
|
|
|
|
|
|
| |||||||||||||||||
| Actual 2012 excluding incremental impact of late 4Q discretionary asset bulk sale | ||||||||||||||||||||||||||||||||
Total Credit Costs | $ | 304,619 | [*] | [*] | [*] | $ | 304,619 | [*] | [*] | [*] | ||||||||||||||||||||||
Income Before Taxes | $ | 159,477 | [*] | [*] | [*] | $ | 159,477 | [*] | [*] | [*] | ||||||||||||||||||||||
|
|
|
|
|
|
|
|
|
|
|
|
|
|
|
| |||||||||||||||||
For 2012 of the two-year forecast, for the Base Case, Pre-Tax, Pre-Credit Costs Income had an unfavorable variance mainly from lower net interest income than forecasted, which was driven by lower than forecasted loan growth and lower than forecasted interest rates. Non-Interest Income and Expense forecasts in both the Base and Stress Case scenarios were fairly accurate with an unfavorable variance of [*] for Non-Interest Income and a favorable variance of [*] for Non-Interest Expense.
In the Stress Case scenario, we were much more accurate in our forecast of 2012 Pre-Tax, Pre-Credit Costs Income with a favorable variance of [*] and an unfavorable variance of [*] for Net Interest Income. The main drivers in the difference between the Base and Stress Case scenarios were our forecast of the expected rate environment assumptions utilized in developing forecasted NIM, as well as forecasted loan growth for each respective scenario. In the Base Case scenario, management assumed the Federal Funds Rate would gradually begin to rise during the forecast period, ending at 3.25% in 4Q12. In the Stress Case scenario, a flat rate environment was assumed. The Stress Case scenario turned out to be a more accurate picture of where the economy was in our two-year forecast (2012), with the actual Federal Funds Rate remaining flat at 0.25% during the forecasted period.
| Securities and Exchange Commission | CONFIDENTIAL TREATMENT REQUESTED | |||
| June 21, 2013 | BY SYNOVUS FINANCIAL CORP. | |||
| Page | | 7 | PURSUANT TO 17 C.F.R. §200.83 | ||
This Stress Case scenario assumption for NIM is more consistent with our 10-Year Forecasted Taxable Income Analysis (FTI Analysis) in which we forecast [*]. Further, as seen in our response to Comment 3(b), [*], which has no material impact on our overall net deferred tax asset realization analysis.
Loan growth in the two-year projection was projected using historical trend data and qualitative management adjustments that incorporated macroeconomic projections from Moody’s® Analytics. For 2012, [*]. This compared to an actual net decline of $538 million in 2012.
For the 10-Year FTI Analysis, we have forecasted a 10-year ACGR for gross loans of only [*] as discussed in our response to Comment 3(b). This 10-year ACGR assumption was [*]. The reasonableness of the 10-year loan growth rate used in our 10-Year FTI Analysis was validated by both a Multivariate Statistical Model and an ARIMA Time Series Statistical Model, as discussed in our response to Comment 3(b). Further, by utilizing the assumption that loan growth would be 50% less than was forecasted in the 10-Year FTI Analysis, the sensitivity analysis shows that income before tax would decline by [*], which has no material impact on our overall net deferred tax asset realization analysis.
In addition, the current 10-Year FTI Analysis does not forecast annual loan growth before credit impact greater than [*]. This compares to loan growth projections in the above Stress Case scenario [*].
Also, since the time when the two-year forecast was prepared in October 2010, Synovus has made significant enhancements around loss forecasting/sensitivity testing processes with the development of an enhanced quantitative and qualitative estimation process, as discussed in our response to Comment 3(b).
The Base Case scenario of the two-year forecast in 2010 was performed for a different purpose and under different conditions from our 10-Year FTI Analysis performed as part of our deferred tax asset (DTA) Realization analysis. Similar to our approach in the two-year Stress Case scenario, in our 10-Year FTI Analysis, we selected more conservative assumptions; for example, [*]
Further, the comprehensive nature of the Company’s 10-Year FTI Analysis, the sufficiency of forecasted appropriate taxable income, and the validation of the reasonableness of the Company’s forecast assumptions to third-party data and sensitivity analysis of significant forecast assumptions, provides a basis to rely on our forecast at a more likely than not level to conclude that the Company will generate sufficient future taxable income to realize all of its $806.4 million net deferred tax asset at December 31, 2012.
| b. | Your forecasts utilized at December 31, 2012 describing all assumptions utilized; |
Response
Background
As noted in our 2012 Annual Report on SEC Form 10-K, Synovus was in a three-year cumulative loss position at December 31, 2012, which is considered significant negative evidence in the Company’s evaluation of the realizability of its net deferred tax asset at December 31, 2012. Based on the Company’s 10-Year FTI Analysis, the Company projects it will no longer be in a three-year cumulative loss position after [*].
After decades of consistent profitability and a track record of accurately forecasting annual operating results, Synovus began to experience significant losses in 2008, coinciding with the start of the economic downturn and real estate value declines experienced throughout much of the country. The Company’s five-state market area was adversely impacted by the recession, and real estate valuation declines which resulted in significant unforeseen levels of credit losses in 2008 through 2010, and which accumulated to a three-year cumulative loss position in the second quarter of 2009.
| Securities and Exchange Commission | CONFIDENTIAL TREATMENT REQUESTED | |||
| June 21, 2013 | BY SYNOVUS FINANCIAL CORP. | |||
| Page | | 8 | PURSUANT TO 17 C.F.R. §200.83 | ||
Although we were adversely impacted by macroeconomic forces beyond our control beginning in 2008, during this period, significant organizational changes were implemented, as illustrated in our response to Comment 4(b), to include process improvement and best-practice policies and procedures implementation needed to strengthen the Company’s lending processes and enhance its credit monitoring, risk management and forecasting capabilities related to its lending operations, the primary source of the losses incurred during this time frame. During 2009 and 2010, pursuant to Synovus’ Memorandum of Understanding (MOU) and Synovus Bank’s MOU (the “Synovus Bank MOU”) disclosed in the Company’s SEC filings, our bank regulators placed added requirements and restrictions on the Bank and the Company, including reductions in classified assets, capital requirements, dividend restrictions, process improvement requirements and additional reporting requirements. As of December 31, 2012, the Company and the Bank were in compliance with the provisions of the Synovus MOU and the Synovus Bank MOU. Subsequent to December 31, 2012, the MOU and the Synovus Bank MOU were terminated by the respective banking regulatory agencies.
During much of the period from 2008 to year-end 2012, self-imposed lending moratoriums were placed on higher-risk asset classes, and the Company focused on reducing classified asset levels and strengthening its lending, credit monitoring, and risk management processes and meeting regulatory criticized and classified asset reduction targets. These efforts have resulted in a strengthened franchise as evidenced in the Company’s credit quality trends, as illustrated in the Credit Quality section below and in our response to Comment 4(b). Further, recent economic indicators are beginning to show improvement. Real estate market valuation declines appear to have bottomed out, and there are now signs of slight improvement in our market areas.
Return to Profitability
The Company returned to profitability in the third quarter of 2011, and reported five consecutive quarters of income before taxes (IBT) through September 30, 2012. Additionally, the Company reported pre-tax income of $31.5 million for the year ended December 31, 2012, including pre-tax charges of [*] from the discretionary bulk sale of [*] of distressed assets in the latter part of the fourth quarter of 2012. The strategic decision to execute the bulk asset sale was discretionary; excluding the pre-tax charges on the bulk asset sale and approximately $39 million in net gains on the sale of investment securities available for sale, the year’s IBT would have been [*], and IBT for the fourth quarter of 2012 would have been approximately [*], which would have represented the Company’s sixth consecutive quarter of profitability. Further, as noted in our response to Comment 3(a) above, excluding the impact of the discretionary bulk sale of distressed assets in the latter part of the fourth quarter of 2012, actual 2012 credit costs were consistent with forecasted credit costs for 2012.
| Securities and Exchange Commission | CONFIDENTIAL TREATMENT REQUESTED | |||
| June 21, 2013 | BY SYNOVUS FINANCIAL CORP. | |||
| Page | | 9 | PURSUANT TO 17 C.F.R. §200.83 | ||
Forecast Utilized at December 31, 2012 in Support of the Net Deferred Tax Asset
Synovus acknowledges that pursuant to Financial Accounting Standards Board (FASB) Accounting Standards Codification (ASC) 740, Income Taxes, and given that the Company remains in a three-year cumulative loss position at December 31, 2012, it may be difficult to support a conclusion that a deferred tax asset is realizable at a more likely than not level based upon the generation of future taxable income. However, management has assessed that the weight of the following evidence of the Company’s ability to generate sufficient future taxable income overcomes the fact that at December 31, 2012, the Company was in a three-year cumulative loss position:
| • | Six consecutive quarters of profitability (excluding the results of the discretionary bulk sale of distressed assets in the latter part of the fourth quarter of 2012, as discussed above), |
| • | Significant credit quality improvements and the reduction of credit risk on the Company’s balance sheet that has been achieved through December 31, 2012, |
| • | Strengthened loan underwriting, loan monitoring, and risk management processes, and hired more experienced credit management personnel, |
| • | Long-term record of accurately forecasting non-credit related operating results, |
| • | Recently improved ability to accurately forecast credit results, |
| • | Comprehensive nature of the Company’s 10-Year FTI Analysis, |
| • | Sufficiency of forecasted future taxable income, |
| • | Validation of the reasonableness of the Company’s key assumptions to third-party data, and |
| • | Management forecasts that the Company will no longer be in a three-year cumulative loss position after [*]. |
Accordingly, management has concluded that it is more likely than not that the Company will generate sufficient future taxable income of the appropriate character and within the applicable carryforward periods permitted to support realization of the Company’s net deferred tax asset at December 31, 2012, except for $18.7 million relating to certain state net operating loss (NOL) carryforwards and tax credits which are expected to expire before they are utilized.
As additional evidence of the Company’s ability to sustain its current profitability and generate sufficient levels of future taxable income necessary to realize all of its net deferred tax asset of $806.4 million at December 31, 2012, we performed a number of sensitivity analysis scenarios of the 10-year future taxable income forecasts by adversely changing significant key assumptions to levels considered to be unlikely. As discussed below, the results of the sensitivity analysis scenarios were supportive of our conclusion that based upon the Company’s ability to generate future taxable income, all of the Company’s net deferred tax asset at December 31, 2012 is realizable at a more likely than not level of certainty, except for certain state NOL carryforwards and tax credits, which is consistent with the description above.
As shown in the 10-Year Forecast table below, Synovus expects to generate over the [*] years approximately $2.1 billion of taxable income, sufficient income generation to realize substantially all of its December 31, 2012 net deferred tax asset, except for $18.7 million of certain state NOL carryforwards and tax credits.
At year-end 2012, Synovus had 16 independent analysts writing research on the Company, most of whom projected various operating results for two years and a few projecting certain operating results for three years. As part of the Company’s 10-Year FTI Analysis validation procedures, and to assist in providing increased confidence in the Company’s ability to realize the 10-year forecasted income results, we compared our assumptions/results to the average of the independent analysts’ projections for the periods for which such projections were available and are comparable. Included throughout this section is a comparison of various assumptions and outputs used in our 10-Year FTI Analysis to these independent analysts’ estimates of selected
| Securities and Exchange Commission | CONFIDENTIAL TREATMENT REQUESTED | |||
| June 21, 2013 | BY SYNOVUS FINANCIAL CORP. | |||
| Page | | 10 | PURSUANT TO 17 C.F.R. §200.83 | ||
measurements for the years noted. While analysts do not project for a 10-year period, validating consistency in the first few years of the 10-Year FTI Analysis adds independent evidence as to the reasonableness of the key assumptions. Further, significant assumptions were also validated to other third-party data sources or alternative methodologies, as discussed below.
The Company’s 10-Year FTI Analysis is presented below, followed by a description of the significant assumptions. The Company also included a summary of the validation procedures used to test the reasonableness of the 10-Year FTI Analysis’ assumptions against independent analyst projections of the Company and other third-party data and/or projections, as well as the results of sensitivity analysis scenarios for the significant assumptions:
Synovus Financial Corp.
10-Year FTI Analysis
Summary Results
Year | 1 | 2 | 3 | 4 | 5 | 6 | 7 | 8 | 9 | 10 | ||||||||||||||||||||||||||||||||||
| (dollars in millions) | 2012(1) | 2013 | 2014 | 2015 | 2016 | 2017 | 2018 | 2019 | 2020 | 2021 | 2022 | |||||||||||||||||||||||||||||||||
Net interest income | $ | 854 | [*] | [*] | [*] | [*] | [*] | [*] | [*] | [*] | [*] | [*] | ||||||||||||||||||||||||||||||||
Non-interest income | 315 | [*] | [*] | [*] | [*] | [*] | [*] | [*] | [*] | [*] | [*] | |||||||||||||||||||||||||||||||||
|
|
|
|
|
|
|
|
|
|
|
|
|
|
|
|
|
|
|
|
|
| |||||||||||||||||||||||
Total revenues | 1,129 | [*] | [*] | [*] | [*] | [*] | [*] | [*] | [*] | [*] | [*] | |||||||||||||||||||||||||||||||||
Adjusted non -interest expense(4) | (692) | [*] | [*] | [*] | [*] | [*] | [*] | [*] | [*] | [*] | [*] | |||||||||||||||||||||||||||||||||
|
|
|
|
|
|
|
|
|
|
|
|
|
|
|
|
|
|
|
|
|
| |||||||||||||||||||||||
Pre-tax, pre-credit costs income | 437 | [*] | [*] | [*] | [*] | [*] | [*] | [*] | [*] | [*] | [*] | |||||||||||||||||||||||||||||||||
Provision for loan losses | (321) | [*] | [*] | [*] | [*] | [*] | [*] | [*] | [*] | [*] | [*] | |||||||||||||||||||||||||||||||||
Other credit costs(3) | (112) | [*] | [*] | [*] | [*] | [*] | [*] | [*] | [*] | [*] | [*] | |||||||||||||||||||||||||||||||||
|
|
|
|
|
|
|
|
|
|
|
|
|
|
|
|
|
|
|
|
|
| |||||||||||||||||||||||
Total credit costs | (433) | (2) | [*] | [*] | [*] | [*] | [*] | [*] | [*] | [*] | [*] | [*] | ||||||||||||||||||||||||||||||||
Restructuring / Visa indemnification charges | (12) | [*] | [*] | [*] | [*] | [*] | [*] | [*] | [*] | [*] | [*] | |||||||||||||||||||||||||||||||||
Securities gains, net | 39 | [*] | [*] | [*] | [*] | [*] | [*] | [*] | [*] | [*] | [*] | |||||||||||||||||||||||||||||||||
Income before taxes | $ | 31 | [*] | [*] | [*] | [*] | [*] | [*] | [*] | [*] | [*] | [*] | ||||||||||||||||||||||||||||||||
Cumulative total | n/a | [*] | [*] | [*] | [*] | [*] | [*] | [*] | [*] | [*] | [*] | |||||||||||||||||||||||||||||||||
| (1) | 2012 reflects actual results. |
| (2) | The decline in total credit costs beginning in 2013 is attributable to a decline in non-performing assets primarily as a result of Synovus completing a discretionary bulk sale of approximately [*] in distressed assets in the latter part of the fourth quarter of 2012. The sale of these distressed assets increased credit costs by [*], and reduced Synovus’ exposure to future credit costs, resulting in lower projected future credit costs in the 10-Year FTI Analysis. |
| (3) | Other credit costs consist primarily of losses on other real estate, provision for losses on unfunded commitments, and charges related to other loans held for sale. |
| (4) | Adjusted non-interest expense excludes Visa indemnification charges, restructuring charges, and other credit costs. |
| Securities and Exchange Commission | CONFIDENTIAL TREATMENT REQUESTED | |||
| June 21, 2013 | BY SYNOVUS FINANCIAL CORP. | |||
| Page | | 11 | PURSUANT TO 17 C.F.R. §200.83 | ||
Synovus Financial Corp.
10-Year FTI Analysis
Key Metrics
Year | 1 | 2 | 3 | 4 | 5 | 6 | 7 | 8 | 9 | 10 | ||||||||||||||||||||||||||||||||||
| (dollars in millions) | 2012(1) | 2013 | 2014 | 2015 | 2016 | 2017 | 2018 | 2019 | 2020 | 2021 | 2022 | |||||||||||||||||||||||||||||||||
Total loans | $ | 19,542 | [*] | [*] | [*] | [*] | [*] | [*] | [*] | [*] | [*] | [*] | ||||||||||||||||||||||||||||||||
Net loan growth rate (decline) - annual | (1.9%) | [*] | [*] | [*] | [*] | [*] | [*] | [*] | [*] | [*] | [*] | |||||||||||||||||||||||||||||||||
Core deposits | $ | 19,964 | [*] | [*] | [*] | [*] | [*] | [*] | [*] | [*] | [*] | [*] | ||||||||||||||||||||||||||||||||
Return on average assets | 3.15% | [*] | [*] | [*] | [*] | [*] | [*] | [*] | [*] | [*] | [*] | |||||||||||||||||||||||||||||||||
Return on average equity | 29.0% | [*] | [*] | [*] | [*] | [*] | [*] | [*] | [*] | [*] | [*] | |||||||||||||||||||||||||||||||||
Net interest margin (NIM) | 3.50% | [*] | [*] | [*] | [*] | [*] | [*] | [*] | [*] | [*] | [*] | |||||||||||||||||||||||||||||||||
Non-interest income annual growth (decline) rate | 4.15% | [*] | [*] | [*] | [*] | [*] | [*] | [*] | [*] | [*] | [*] | |||||||||||||||||||||||||||||||||
Fee income/ total revenue | 24.3% | [*] | [*] | [*] | [*] | [*] | [*] | [*] | [*] | [*] | [*] | |||||||||||||||||||||||||||||||||
Efficiency ratio(4) | 61% | [*] | [*] | [*] | [*] | [*] | [*] | [*] | [*] | [*] | [*] | |||||||||||||||||||||||||||||||||
Net charge-off ratio | [*] | (2) | [*] | [*] | [*] | [*] | [*] | [*] | [*] | [*] | [*] | [*] | ||||||||||||||||||||||||||||||||
| Year-end allowance for loan losses (ALL) / total year-end loans | 1.91% | [*] | [*] | [*] | [*] | [*] | [*] | [*] | [*] | [*] | [*] | |||||||||||||||||||||||||||||||||
NPL ratio | 2.78% | [*] | [*] | [*] | [*] | [*] | [*] | [*] | [*] | [*] | [*] | |||||||||||||||||||||||||||||||||
NPA ratio | 3.57% | [*] | [*] | [*] | [*] | [*] | [*] | [*] | [*] | [*] | [*] | |||||||||||||||||||||||||||||||||
NPL inflows | $ | 641 | (3) | [*] | [*] | [*] | [*] | [*] | [*] | [*] | [*] | [*] | [*] | |||||||||||||||||||||||||||||||
Distressed asset dispositions | $ | 919 | [*] | [*] | [*] | [*] | [*] | [*] | [*] | [*] | [*] | [*] | ||||||||||||||||||||||||||||||||
| (1) | 2012 reflects actual results. |
| (2) | 2012 net charge-off ratio excludes net charge-offs related to the discretionary bulk sale of distressed loans in the latter part of the fourth quarter of 2012; including this item, the net charge-off ratio for 2012 was 2.45%. |
| (3) | 2012 NPL inflows include [*] related to one larger borrower relationship previously classified as accruing substandard; movement to NPL status had no significant adverse impact on operating results as the corresponding ALL before classification to NPLs approximated the specific reserve after NPL classification. [*] |
| (4) | The efficiency ratio is calculated by dividing adjusted non-interest expense (excludes other credit costs, restructuring charges, and Visa indemnification charges) by net interest income (taxable equivalent) plus non-interest income, less net investment securities gains. |
| Securities and Exchange Commission | CONFIDENTIAL TREATMENT REQUESTED | |||
| June 21, 2013 | BY SYNOVUS FINANCIAL CORP. | |||
| Page | | 12 | PURSUANT TO 17 C.F.R. §200.83 | ||
Synovus Financial Corp.
10-Year FTI Analysis
Assumptions Utilized
Assumption Type | Methodology Utilized | Quantitative Input into Forecast | Methods of Assumption Validation | |||
1. Macroeconomic | Moody’s® Analytics Below-Trend Long-Term Growth scenario (independent third-party data source) | Over the 10-year forecast period, the assumptions are noted below. This selected scenario assumes the U.S. recovery continues in 2012, but the growth rate is below Moody’s® estimated baseline estimate, assuming deeper than expected effects of the federal fiscal contraction in early 2013, the European sovereign debt crisis, the persistence of foreclosures and weak home prices, and reduced consumer confidence. | • Synovus Economic Advisory Council assessed and recommended
• Synovus Executive Risk Committee approved | |||
2. Loan Growth | • Consideration of bottoms-up
• Loan net charge-offs and | • 10-year (2013-2022) Annual Compounded Growth Rate (ACGR) of [*] for gross loan growth and [*] for net loan growth
¡ 2013 and 2014: Incorporate management’s qualitative assumptions, integrating bottoms-up and top-down forecasts at the local market area level
¡ [*] | • Comparison of results to Multivariate Statistical Model
• Comparison of results to ARIMA Time Series Statistical Model
• Comparison of results to independent third-party analysts loan growth projections for Synovus | |||
3. Funding and | A combination of historical run rate analysis, qualitative analysis and incorporation of wholesale funding targets | • Assumed overall 10-year Annual Compounded Growth Rate (ACGR) for Core Deposits of [*]
• Brokered deposits to Core Deposits held at a maximum of [*] | • Moody’s® Analytics forecast of Quarterly Deposits at all FDIC-Insured Banks, using data for the markets in which Synovus operates
• Synovus developed funding and liquidity coverage ratios | |||
4. Net Interest | Driver-based model | • 2013 and 2014 NIM derived from [*].
• 2015-2022 NIM was derived by [*]. | • Comparison of Synovus net interest income and NIM forecast for three years to independent third-party analysts net interest income and NIM projections for Synovus | |||
5. TARP | [*] | • [*] | • [*] | |||
6. Non-Interest | Driver-based model | • Core banking fees are projected to [*]
• Financial management Services (FMS) fees are projected to [*] | • Comparison of Synovus non-interest income three-year forecast to independent third-party analysts’ projections | |||
7. Adjusted Non-Interest Expense | Historical run rate analysis | • Forecast efficiency ratio
¡ �� 2013 – [*], 2014 – [*]
• 2013 and 2014: Incorporate management’s qualitative assumptions, integrating bottoms-up analysis by market areas as well as a top-down forecast
¡ [*]
• Above assumptions result in 10-year ACGR of [*] for non-interest expense | • Comparison of Synovus adjusted non-interest expense three-year forecast to independent third-party analysts’ projections | |||
| Securities and Exchange Commission | CONFIDENTIAL TREATMENT REQUESTED | |||
| June 21, 2013 | BY SYNOVUS FINANCIAL CORP. | |||
| Page | | 13 | PURSUANT TO 17 C.F.R. §200.83 | ||
Assumption Type | Methodology Utilized | Quantitative Input into Forecast | Methods of Assumption Validation | |||
8. Credit Quality | Driver-based model | • Average annualized net charge-off ratio to average loans of [*] for the 10-year period
• Average NPL coverage ratio of [*] for the 10-year period
• Average allowance for loan losses as a percentage of total loans of [*] for the 10-year period
• Average NPA ratio of [*] for the 10-year period
• Average NPL inflows of [*] per year for the 10-year period | • Comparison of Synovus credit quality indicators three-year forecasts to independent third-party analysts’ projections | |||
Discussion of Significant Assumptions Utilized in the 10-Year FTI Analysis
(1) Macroeconomic assumptions – Macroeconomic assumptions are from the “U.S. Macroeconomic Outlook Alternative Scenarios,” published by Moody’s® Analytics in September 2012 and were selected by the Synovus Economic Advisory Council and approved by the Synovus Executive Risk Committee. The scenario selected for Synovus’ 10-Year FTI Analysis was the “Below-Trend Long-Term Growth” scenario. The selected Moody’s® Analytics scenario provides more conservative macroeconomic assumptions than Moody’s® Baseline scenario. There are six scenarios published monthly by Moody’s® Analytics, and each scenario assumes one of a variety of estimates of the economic outlooks. The “Below-Trend Long-Term Growth” scenario assumes the U.S. recovery continues in 2012, but the growth rate is below Moody’s® baseline estimate, assuming deeper than expected effects of the federal fiscal contraction in early 2013, the European sovereign debt crisis, the persistence of foreclosures and weak housing prices, and reduced consumer confidence. The applicable assumptions from the Below-Trend Long-Term Growth Scenario are summarized in the table below. This scenario was specifically utilized in validating forecasted loan growth and forecasted net interest margin, as discussed below. The Moody’s® Below-Trend Long-Term Growth scenario publication from September 2012 was used for the 10-Year FTI Analysis, as it was the most currently available data at year-end 2012. Synovus’ review of the corresponding December 2012 Moody’s® forecast data indicated no material changes versus the September 2012 report. Below is a summary of the Moody’s® “Below-Trend Long-Term Growth” scenario assumptions by year:
Selected assumptions from the Moody’s® Analytics “Below-Trend Long-Term Growth Scenario”
Year | 1 | 2 | 3 | 4 | 5 | 6 | 7 | 8 | 9 | 10 | ||||||||||||||||||||||||||||||||
| 2013 | 2014 | 2015 | 2016 | 2017 | 2018 | 2019 | 2020 | 2021 | 2022 | |||||||||||||||||||||||||||||||||
GDP growth | 1.60 | % | 3.36 | 3.59 | 2.91 | 2.02 | 1.84 | 1.97 | 2.04 | 2.10 | 2.10 | |||||||||||||||||||||||||||||||
Unemployment rate | 8.42 | 7.91 | 7.06 | 6.45 | 6.27 | 6.44 | 6.53 | 6.58 | 6.62 | 6.68 | ||||||||||||||||||||||||||||||||
10-Year Treasury bill | 2.24 | 3.22 | 4.08 | 4.45 | 4.46 | 4.41 | 4.39 | 4.37 | 4.37 | 4.37 | ||||||||||||||||||||||||||||||||
Change in median home prices | (3.78 | ) | 0.39 | 4.33 | 4.69 | 3.73 | 4.77 | 3.85 | 3.74 | 3.44 | 2.98 | |||||||||||||||||||||||||||||||
Federal Funds rate | 0.08 | 0.24 | 1.51 | 3.09 | 3.22 | 3.13 | 3.01 | 2.93 | 2.93 | 2.92 | ||||||||||||||||||||||||||||||||
Source: Moody’s® Analytics September 2012 U.S. Macroeconomic Outlook Alternative Scenarios
(2) Loan Growth - Loan growth was forecasted for years 2013 and 2014 as part of the Bank division budgeting sessions, in which division-level management at each of the 30 separate Bank divisions performed a market level loan growth analysis. These market level analyses considered, among other items, market specific macroeconomic data, relative market share and opportunities as compared to peers, current loan pipeline data, and commercial banker performance metrics. The evaluation of each of these items, both individually and in conjunction with each other, formed the basis for division level loan growth assumptions before credit impacts for years 2013 and 2014 of the FTI Analysis.
| Securities and Exchange Commission | CONFIDENTIAL TREATMENT REQUESTED | |||
| June 21, 2013 | BY SYNOVUS FINANCIAL CORP. | |||
| Page | | 14 | PURSUANT TO 17 C.F.R. §200.83 | ||
In addition, considered in loan growth forecasts for years 2013 and 2014 is our Large Corporate Banking loans which include Syndicated and Senior Housing Loans. Consistent with the Company’s strategic objective to grow Large Corporate Banking Loans, Synovus has added experienced loan officers and support staff with the specialized skill set necessary to significantly grow these types of loans. Through year-end 2012, these strategic efforts have been successful in developing new business relationships for Synovus, as well as increasing the penetration of ancillary products and services. In 2012, Synovus generated $583 million combined net loan growth in Large Corporate Banking Loans, ending 2012 with outstanding loans totaling $1.2 billion, up 92.1% from 2011. These loans were forecasted to grow [*] and [*] in years 2013 and 2014, respectively.
Loan growth was forecasted for the remaining years (2015 – 2022), for all loans, [*]. As noted above, the Synovus Economic Advisory Council evaluated and recommended, and the Synovus Executive Risk Committee approved, the selection of the Moody’s® Analytics “Below-Trend Long-Term Growth” scenario. [*]:
| [*] | Synovus FTI Analysis | |||||||||||||||||||||||
(dollars in billions) | 2012 | 2022 | 10-year ACGR | 2012 | 2022* | 10-year ACGR | ||||||||||||||||||
Commercial and industrial | [*] | [*] | [*] | $ | 9.10 | [*] | [*] | |||||||||||||||||
Commercial real estate | [*] | [*] | [*] | 6.45 | [*] | [*] | ||||||||||||||||||
Consumer | [*] | [*] | [*] | 4.01 | [*] | [*] | ||||||||||||||||||
|
|
|
|
|
|
|
| |||||||||||||||||
Total loans | [*] | [*] | [*] | $ | 19.56 | [*] | [*] | |||||||||||||||||
*[*]
Source: Moody’s® Analytics U.S. Macroeconomic Outlook and the [*]
To incorporate the 10-year ACGR for gross loan growth noted above, management utilized qualitative assumptions and bottoms-up projections at the local market level for the first two years of the 10-Year FTI Analysis. Gross loan growth for the remaining eight years was applied at a constant rate to achieve the desired 10-year ACGR of [*].
Summary of Forecasted Annual Net Loan Growth (2013-2022)
Based upon the above, and after consideration of forecasted loan net charge-offs, foreclosures and transfers to the loans held for sale portfolio, the ending 10-year ACGR is [*]. The table below shows the forecasted components of forecasted loan growth for the next 10 years:
| 1 | 2 | 3 | 4 | 5 | 6 | 7 | 8 | 9 | 10 | |||||||||||||||||||||||||||||||
| (dollars in millions) | 2013 | 2014 | 2015 | 2016 | 2017 | 2018 | 2019 | 2020 | 2021 | 2022 | ||||||||||||||||||||||||||||||
Beginning loans, net of deferred fees and costs | [*] | [*] | [*] | [*] | [*] | [*] | [*] | [*] | [*] | [*] | ||||||||||||||||||||||||||||||
Total loan growth | [*] | [*] | [*] | [*] | [*] | [*] | [*] | [*] | [*] | [*] | ||||||||||||||||||||||||||||||
Loans transferred to held for sale / foreclosures | [*] | [*] | [*] | [*] | [*] | [*] | [*] | [*] | [*] | [*] | ||||||||||||||||||||||||||||||
Net charge-offs | [*] | [*] | [*] | [*] | [*] | [*] | [*] | [*] | [*] | [*] | ||||||||||||||||||||||||||||||
Total net charge-offs and transfers | [*] | [*] | [*] | [*] | [*] | [*] | [*] | [*] | [*] | [*] | ||||||||||||||||||||||||||||||
Ending loans, net of deferred fees and costs | [*] | [*] | [*] | [*] | [*] | [*] | [*] | [*] | [*] | [*] | ||||||||||||||||||||||||||||||
Net loan growth | [*] | [*] | [*] | [*] | [*] | [*] | [*] | [*] | [*] | [*] | ||||||||||||||||||||||||||||||
Net loan growth rate -annual | [*] | [*] | [*] | [*] | [*] | [*] | [*] | [*] | [*] | [*] | ||||||||||||||||||||||||||||||
Net growth rate – 10-year ACGR | [*] | |||||||||||||||||||||||||||||||||||||||
The Moody’s® Analytics loan growth forecast of [*] used in the 10-year ACGR for gross loan growth was validated through the use of two statistical methodologies, discussed below, which resulted in higher 10-year ACGRs for gross loan growth of [*] for the multivariate statistical model and [*] for the ARIMA time series statistical model.
| Securities and Exchange Commission | CONFIDENTIAL TREATMENT REQUESTED | |||
| June 21, 2013 | BY SYNOVUS FINANCIAL CORP. | |||
| Page | | 15 | PURSUANT TO 17 C.F.R. §200.83 | ||
Loan Growth Validation Methodologies
The gross loan growth assumptions were validated using the following two methodologies:
a)Multivariate Statistical Model
Loan growth was derived from a multivariate statistical model that correlates Synovus’ historical loan growth over a [*] period of time to [*]. The loan growth model was created using data from the [*]. After testing several macroeconomic variables, [*] were determined to be the best predictors of loan growth. Based upon the historical correlation and the forecast of [*] obtained from Moody’s® Analytics “Below-Trending Long-Term Growth” scenario, the gross Loan 10-year growth projection was determined.
This model forecasted the Synovus 10-year gross loan ACGR to be [*], which validates the 10-year gross loan ACGR of [*] used in the 10-Year FTI Analysis.
As part of our validation of this Multivariate Statistical model, the model was back tested using data from the [*] and did not result in any significant variances between the model’s predicted loan growth compared to actual loan growth , which adds to our confidence that this methodology reasonably predicts loan growth.
b)ARIMA Time Series Statistical Model
As part of Synovus’ ongoing development of the credit stress testing aspect of the Internal Capital Adequacy Assessment Process, management developed a modeling process through use of various time series techniques. To develop a benchmark model, Synovus utilized a type of time series analysis called Auto Regressive Integrated Moving Average (ARIMA). In a standard form of applied time series analysis, an ARIMA model is fit to time series data, either to better understand the data or to predict future points in the series. This form of modeling macroeconomic indicators is considered a best practice. The results of this model produced similar results as the Multivariate Statistical model with a forecasted ending loan balance [*] [*] actual historical results. This technique forecasted a 10-year ACGR of [*]. The results of the comparison of Synovus’ loan growth estimate using the [*] supports that our growth rate assumptions are reasonable and not likely to overstate estimated growth.
Comparison of Synovus’ Forecast Assumptions to Independent Financial Analysts’ Projections
Additionally, management compared the forecasted loan balances to analysts’ projections of loan balances. The following is a comparison of the first three years of the 10-Year FTI Analysis forecasted loan balances to independent financial analysts’ projections from the respective December 2012 analysts’ reports:
(dollars in millions) | End of Year Loan Balance | |||||
Year | FTI Analysis | Average Analyst Estimate | # of Analysts Providing Estimate | |||
2013 (1) | [*] | [*] | [*] | |||
2014 (2) | [*] | [*] | [*] | |||
2015 (3) | [*] | [*] | [*] | |||
[*]
(3) Funding and Liquidity - Deposit and Wholesale Funding assumptions are derived by utilizing a combination of historical run rate analysis, qualitative analysis and incorporation of wholesale funding targets. Based upon historical growth rates, as well as current deposit market share rankings, a 10-year ACGR of [*] was forecasted for core deposits. It was also assumed throughout the 10-Year FTI Analysis that the ratio of brokered deposits to total deposits would be no more than [*].
To test the reasonableness of our core deposit growth assumption, we compared the overall 10-year
| Securities and Exchange Commission | CONFIDENTIAL TREATMENT REQUESTED | |||
| June 21, 2013 | BY SYNOVUS FINANCIAL CORP. | |||
| Page | | 16 | PURSUANT TO 17 C.F.R. §200.83 | ||
ACGR of [*] to the Moody’s® Analytics forecast of Quarterly Deposits at all FDIC-Insured Banks. Management applied Moody’s® forecasted 10-year ACGR of FDIC Deposits within each Synovus market to the respective Synovus market balance as of the second quarter 2012 (the most recent market data available from the FDIC), which resulted in a 10-year ACGR of [*], which supports the reasonableness of the assumption Synovus used in the FTI Analysis.
(4) Net Interest Margin - Similar to loan growth projections, management developed net interest margin assumptions in two phases. For the first two years, the net interest margin was derived from Synovus’ driver-based cash flow model for interest rate risk modeling. Management then projected 2022 balance sheet mix, asset yields and funding costs in an interest rate environment that included an increase in short-term interest rates of approximately [*], beginning in 2015, as forecasted in the Moody’s® Analytics “Below-Trend Long-Term Growth” scenario published by Moody’s® Analytics, as noted above.
The net interest margin for years 2015-2021 was calculated by evenly distributing the change from the net interest margin using the driver-based model [*] in 2014 and the net interest margin of [*] in 2022, which was derived by management’s qualitative assumptions consistent with the approved economic scenario. This resulted in an [*] per year for 2015-2022.
The projected NIM used in the 10-Year FTI Analysis is shown below:
Year | 1 | 2 | 3 | 4 | 5 | 6 | 7 | 8 | 9 | 10 | ||||||||||||||||||||||||||||||
| 2013 | 2014 | 2015 | 2016 | 2017 | 2018 | 2019 | 2020 | 2021 | 2022 | |||||||||||||||||||||||||||||||
Net interest margin | [*] | [*] | [*] | [*] | [*] | [*] | [*] | [*] | [*] | [*] | ||||||||||||||||||||||||||||||
The following is a comparison of the first three years in the 10-Year FTI Analysis to independent, third-party analysts’ projections for Synovus from analysts’ reports published around December 31, 2012 for both NIM and net interest income:
Net Interest Margin | ||||||
Year | FTI Analysis | Average Analyst Estimate | # of Analysts Providing Estimate | |||
2013 (1) | [*] | [*] | [*] | |||
2014 (2) | [*] | [*] | [*] | |||
2015 (3) | [*] | [*] | [*] | |||
(dollars in millions) | Net Interest Income | |||||
Year | FTI Analysis | Average Analyst Estimate | # of Analysts Providing Estimate | |||
2013 (1) | [*] | [*] | [*] | |||
2014 (2) | [*] | [*] | [*] | |||
2015 (3) | [*] | [*] | [*] | |||
[*]
| Securities and Exchange Commission | CONFIDENTIAL TREATMENT REQUESTED | |||
| June 21, 2013 | BY SYNOVUS FINANCIAL CORP. | |||
| Page | | 17 | PURSUANT TO 17 C.F.R. §200.83 | ||
(5) TARP Repayment – Consistent with Synovus’ announced intentions to repurchase $968 million in Series A Preferred Stock (“TARP Repayment”), subject to regulatory approval, the 10-Year FTI Analysis assumes TARP Repayment in the second half of 2013. Forecast assumptions for the source of cash for the TARP Repayment in the 10-Year FTI Analysis consist of the issuance [*].
The Company currently pays 5% on its Series A Preferred Stock, which is reflected as a reduction to net income to arrive at net income available for common shareholders for purposes of calculating earnings per share (EPS). Preferred stock dividends do not impact income before taxes. However, consistent with the planned repayment funding sources noted above, included in the 10-Year FTI Analysis is the addition of [*].
In the unlikely scenario that Synovus is not approved for TARP Repayment, the TARP-related preferred stock dividend rate increases from the current rate of 5.0% to 9.0% in 2014. As noted above, preferred stock dividends do not impact income before tax; and therefore, the inclusion of the impact from the planned TARP Repayment noted above in the 10-Year FTI Analysis would understate forecasted IBT, as compared to a scenario where Synovus was not approved for TARP Repayment.
(6) Non-Interest Income - Non-interest income sources such as service charges on deposit accounts, fiduciary and asset management fees, brokerage revenue, mortgage banking income, bankcard fees, and other fee income are forecasted using multiple driver-based models that incorporate a combination of transaction volumes, retention rates, and pricing structures. The transaction volume and retention rate projections are developed using historical run rate analyses and qualitative adjustments based on management’s expectations of customer behavior. A smaller portion of revenues (trust fees, letter of credit fees, and miscellaneous fees) are forecasted primarily on historical run rate analysis.
While at December 31, 2012, our investment securities available for sale portfolio had gross unrealized gain positions of $54.1 million (and a net unrealized gain position of $49.5 million), the 10-Year FTI Analysis assumes [*]. Additionally, the 10-Year FTI Analysis [*].
The following is a comparison of the first three years of the 10-Year FTI Analysis Non-Interest Income results to independent, third-party analysts’ projections for Synovus as of December 31, 2012:
(dollars in millions) | Non-Interest Income | |||||
Year | FTI Analysis | Average Analyst Estimate | # of Analysts Providing Estimate | |||
2013 (1) | [*] | [*] | [*] | |||
2014 (2) | [*] | [*] | [*] | |||
2015 (3) | [*] | [*] | [*] | |||
[*].
(7) Adjusted Non-Interest Expense – Adjusted non-interest expense (excludes restructuring charges, Visa indemnification charges, and other credit costs—primarily consisting of losses on other real estate, provision for losses on unfunded commitments, and charges related to other loans held for sale, all of which are included in other applicable cost categories) was forecasted for years 2013 and 2014 as part of the Bank division budgeting process, in which division level management at each of the 30 separate Bank divisions performed a market level non-interest expense analysis. These market level analyses considered, among other items, planned workforce reductions, including the January 2013 announced expense savings initiatives of $30 million. This forecast is accumulated through the bottoms up non-interest expense analysis as well as our forecasted targeted efficiency ratios (the ratio of overhead as a percentage of its total revenue) noted below. The forecasted efficiency ratio is then applied to total revenues to determine the annual non-interest expense.
Throughout the 10-Year FTI Analysis, costs are projected, such that the efficiency ratio is maintained between [*]. Management believes that this is a reasonable estimate since the efficiency ratio averaged [*] from 2003 through 2012, and was [*] in 2011 and [*] in 2012. This approach results in a 10-year ACGR of [*] for non-interest expense.
| Securities and Exchange Commission | CONFIDENTIAL TREATMENT REQUESTED | |||
| June 21, 2013 | BY SYNOVUS FINANCIAL CORP. | |||
| Page | | 18 | PURSUANT TO 17 C.F.R. §200.83 | ||
The following is a comparison of the first three years of the 10-Year FTI Analysis adjusted non-interest expense and efficiency ratio results to independent, third-party analysts’ projections of these amounts for Synovus from the respective analysts’ December 2012 reports:
($ in millions) | Adjusted Non-Interest Expense | |||||
Year | FTI Analysis | Average Analyst Estimate | # of Analysts Providing Estimate | |||
2013 (1) | [*] | [*] | [*] | |||
2014 (2) | [*] | [*] | [*] | |||
2015 (3) | [*] | [*] | [*] | |||
| Efficiency Ratio | ||||||
Year | FTI Analysis | Average Analyst Estimate | # of Analysts Providing Estimate | |||
2013 (1) | [*] | [*] | [*] | |||
2014 (2) | [*] | [*] | [*] | |||
2015 (3) | [*] | [*] | [*] | |||
| [*] |
(8) Credit Quality – Components of credit quality, including credit costs and non-performing assets, are projected utilizing a driver-based forecast model. Although historical trend analysis is part of the process in developing the assumptions in this driver-based model, migration projections of loans and concentrations, economic forecasts and continuous discussions with regional credit are all important components of the credit forecast process. For the 2013 and 2014 forecasts, management’s qualitative assumptions were incorporated, which integrated the bottoms-up and top-down forecasts at the local market area level. Additionally, historical trend analysis, loan portfolio reviews, and economic outlook considerations were used to complete the driver-based forecast throughout the 10-year forecast period. Management confirmed the reasonableness of forecast assumptions through the assessment of the reasonableness of the resulting credit-related ratios and trending during the forecast period. Significant credit quality inputs to the 10-Year FTI Analysis and resulting credit quality ratios and trends are noted below:
Year | 1 | 2 | 3 | 4 | 5 | 6 | 7 | 8 | 9 | 10 | ||||||||||||||||||||||||||||||
| (dollars in millions) | 2013 | 2014 | 2015 | 2016 | 2017 | 2018 | 2019 | 2020 | 2021 | 2022 | ||||||||||||||||||||||||||||||
Net charge-off ratio | [*] | [*] | [*] | [*] | [*] | [*] | [*] | [*] | [*] | [*] | ||||||||||||||||||||||||||||||
Year-end allowance for loan losses (ALL) / total year-end loans | [*] | [*] | [*] | [*] | [*] | [*] | [*] | [*] | [*] | [*] | ||||||||||||||||||||||||||||||
NPL ratio | [*] | [*] | [*] | [*] | [*] | [*] | [*] | [*] | [*] | [*] | ||||||||||||||||||||||||||||||
NPA ratio | [*] | [*] | [*] | [*] | [*] | [*] | [*] | [*] | [*] | [*] | ||||||||||||||||||||||||||||||
NPL inflows | [*] | [*] | [*] | [*] | [*] | [*] | [*] | [*] | [*] | [*] | ||||||||||||||||||||||||||||||
Provision for loan losses | [*] | [*] | [*] | [*] | [*] | [*] | [*] | [*] | [*] | [*] | ||||||||||||||||||||||||||||||
Total credit costs(1) | [*] | [*] | [*] | [*] | [*] | [*] | [*] | [*] | [*] | [*] | ||||||||||||||||||||||||||||||
| (1) | Include provision for loan losses, other real estate expense, and other credit costs, such as provision for loan losses on unfunded commitments and charges related to other loans held for sale |
As inflows of new non-performing loans continue to decrease, net charge-offs resulting from impairments and loan dispositions will also continue to decline. The net charge-off ratio is projected to be [*] for 2015 and is projected to [*] by 2022 (year 10). This estimate is based on consideration of Synovus’ experience from [*], when the average net charge-off ratio was [*], reaching a [*]. This is considered a reasonable net charge-off ratio as enhancements to the underwriting process continue to have a positive direct impact on a larger portion of the loan portfolio, and as significant reductions in NPLs and potential problem loans naturally generate reduced loan net charge-offs, as well as reduced concentration in higher risk loans (such as CRE loans).
Credit costs are expected to reach the lowest level in [*] within the 10-Year FTI Analysis, driven by the significant improvements in credit quality which will result in reduced loan loss reserve levels; thereafter, credit costs increase as the allowance to total loans is maintained at approximately [*], which corresponds to the [*] average of [*].
| Securities and Exchange Commission | CONFIDENTIAL TREATMENT REQUESTED | |||
| June 21, 2013 | BY SYNOVUS FINANCIAL CORP. | |||
| Page | | 19 | PURSUANT TO 17 C.F.R. §200.83 | ||
The following is an illustration of the projected activity in the allowance for loan losses during the 10-Year FTI Analysis forecast period:
Year | 1 | 2 | 3 | 4 | 5 | 6 | 7 | 8 | 9 | 10 | ||||||||||||||||||||||||||||||
| (in millions) | 2013 | 2014 | 2015 | 2016 | 2017 | 2018 | 2019 | 2020 | 2021 | 2022 | ||||||||||||||||||||||||||||||
Beginning LLR | [*] | [*] | [*] | [*] | [*] | [*] | [*] | [*] | [*] | [*] | ||||||||||||||||||||||||||||||
Provision for Loan Losses | [*] | [*] | [*] | [*] | [*] | [*] | [*] | [*] | [*] | [*] | ||||||||||||||||||||||||||||||
Net charge-offs | [*] | [*] | [*] | [*] | [*] | [*] | [*] | [*] | [*] | [*] | ||||||||||||||||||||||||||||||
|
|
|
|
|
|
|
|
|
|
|
|
|
|
|
|
|
|
|
| |||||||||||||||||||||
Ending LLR | [*] | [*] | [*] | [*] | [*] | [*] | [*] | [*] | [*] | [*] | ||||||||||||||||||||||||||||||
The following is a comparison of the first three years of the 10-Year FTI Analysis to independent, third-party analysts’ projections for Synovus from the respective December 2012 analysts’ reports:
| (dollars in millions) | Provision For Loan Losses | |||||
Year | FTI Analysis | Average Analyst Estimate | # of analysts providing estimate | |||
2013 (1) | [*] | [*] | [*] | |||
2014 (2) | [*] | [*] | [*] | |||
2015 (3) | [*] | [*] | [*] | |||
| ALL/Total Loans | ||||||
Year | FTI Analysis | Average Analyst Estimate | # of analysts providing estimate | |||
2013 (1) | [*] | [*] | [*] | |||
2014 (2) | [*] | [*] | [*] | |||
2015 (3) | [*] | [*] | [*] | |||
| NPA Ratio | ||||||
Year | FTI Analysis | Average Analyst Estimate | # of analysts providing estimate | |||
2013 (1) | [*] | [*] | [*] | |||
2014 (2) | [*] | [*] | [*] | |||
2015 (3) | [*] | [*] | [*] | |||
| Net Charge-off Ratio | ||||||
Year | FTI Analysis | Average Analyst Estimate | # of analysts providing estimate | |||
2013 (1) | [*] | [*] | [*] | |||
2014 (2) | [*] | [*] | [*] | |||
2015 (3) | [*] | [*] | [*] |
[*]
Independent, Third-Party Analysts’ Projections of Synovus’ Pre-Tax Income
[*]
| (dollars in millions) | Pre-Tax Income | |||||
Year | FTI Analysis | Average Analysts’ Estimate | # of analysts providing estimate | |||
2013 (1) | [*] | [*] | [*] | |||
2014 (2) | [*] | [*] | [*] | |||
2015 (3) | [*] | [*] | [*] |
[*]
2013 Operating Results for the First Quarter and Comparison to Forecast
Synovus reported income before taxes of $46.6 million for the three months ended March 31, 2013 as compared to [*] in the Company’s 10-Year FTI Analysis, a [*] variance of [*] or [*]. Included in reported income before taxes were individual components of net interest income, non-interest income, and adjusted non-interest expense, as summarized below.
| Securities and Exchange Commission | CONFIDENTIAL TREATMENT REQUESTED | |||
| June 21, 2013 | BY SYNOVUS FINANCIAL CORP. | |||
| Page | | 20 | PURSUANT TO 17 C.F.R. §200.83 | ||
| Three Months Ended March, 31 2013: Actual vs. 1Q13 Forecast from 10-Year FTI Analysis | ||||||||||||||||
| (dollars in thousands) | 1Q13 Actual | 1Q13 Forecast from 10- Year FTI Analysis | Variance Favorable (Unfavorable) | |||||||||||||
| $ | % | |||||||||||||||
Net interest income | $ | 199,814 | [*] | [*] | [*] | |||||||||||
Non-interest income, excluding investment securities gains, net | 64,676 | [*] | [*] | [*] | ||||||||||||
Adjusted non-interest expense | 163,804 | [*] | [*] | [*] | ||||||||||||
|
|
|
|
|
| |||||||||||
Pre-tax, pre-credit costs income | 100,686 | [*] | [*] | [*] | ||||||||||||
Investment securities gains, net | 45 | [*] | [*] | [*] | ||||||||||||
Credit costs(1) | 49,291 | [*] | [*] | [*] | ||||||||||||
Restructuring/Visa indemnification charges | 4,887 | [*] | [*] | [*] | ||||||||||||
|
|
|
|
|
| |||||||||||
Income before taxes | $ | 46,553 | [*] | [*] | [*] | |||||||||||
|
|
|
|
|
| |||||||||||
Net interest margin | 3.43% | [*] | [*] | nm | ||||||||||||
Annualized net charge-off ratio | 1.18% | [*] | (2) | [*] | nm | |||||||||||
NPL inflows | $ | 83,901 | $ | [*] | [*] | [*] | ||||||||||
NPA ratio | 3.47% | [*] | [*] | nm | ||||||||||||
Total loans | $ | 19,367,887 | [*] | [*] | [*] | |||||||||||
| (1) | Include provision for loan losses, other real estate expense, and other credit costs, such as provision for loan losses on unfunded commitments and charges related to other loans held for sale |
| (2) | Annualized net charge-off ratio for 2013 |
| nm | – not meaningful |
Total credit costs were $49.3 million for the first quarter of 2013 as compared to [*] in the Company’s 10-Year FTI analysis, a [*] variance of [*]. Additionally, NPL inflows had [*]. The first quarter of 2013 annualized net charge-off ratio of 1.18% [*].
Consideration of Contingent Liabilities
In preparing the 10-year forecast, management also considered existing contingent liabilities to determine their impact, if any, on forecasted future earnings. Contingent liabilities at December 31, 2012 relate primarily to outstanding litigation proceedings. At December 31, 2012, management estimates that the aggregate range of reasonably possible losses related to outstanding litigation ranges from zero to $75 million. While the Company does not expect that the high end of this range will be realized, for purposes of our 10-Year FTI Analysis, assuming a worst case scenario where litigation losses equal $75 million, cumulative pre-tax income over the 10-year forecast period would decline by [*]. Our operating results in this scenario would remain sufficient to realize all of the Company’s December 31, 2012 net deferred tax asset of $806.4 million.
Sensitivity Analysis Scenarios for the 10-Year Future Taxable Income Analyses
As additional evidence of the Company’s ability to sustain its current profitability and generate sufficient levels of future taxable income necessary to realize its net deferred tax asset at December 31, 2012, we performed a number of sensitivity analysis scenarios for the 10-Year FTI Analysis by adversely changing significant assumptions to levels considered to be unlikely. As discussed below, the results of the sensitivity analysis scenarios for the 10-Year FTI analyses were supportive of our conclusion related to the realization of our net deferred tax asset at December 31, 2012, except for certain state NOL carryforwards and tax credits, consistent with the description above. The results of these hypothetical sensitivity analysis scenarios provide additional evidence regarding the future earnings capacity of the Company even in these unlikely scenarios, at sufficient levels and in appropriate future periods to demonstrate our ability to realize all of our December 31, 2012 net deferred tax asset of $806.4 million, except for certain state NOL carryforwards and tax credits which may expire unused as discussed above.
| Securities and Exchange Commission | CONFIDENTIAL TREATMENT REQUESTED | |||
| June 21, 2013 | BY SYNOVUS FINANCIAL CORP. | |||
| Page | | 21 | PURSUANT TO 17 C.F.R. §200.83 | ||
| • | Core Loan Growth Reduced by 50%: |
By utilizing the assumption that Core Loan growth would be 50% less than was forecasted in the 10-Year FTI Analysis, the sensitivity analysis scenario below shows that IBT would decline [*] over the seven-year time horizon. These operating results would remain sufficient to realize all of the Company’s December 31, 2012 net deferred tax asset of $806.4 million in approximately the same period of time as our 10-Year FTI Analysis.
| 10-Year FTI Analysis Results | ||||||||||||||||||||||||||||
| Year | 1 | 2 | 3 | 4 | 5 | 6 | 7 | |||||||||||||||||||||
| (dollars in thousands) | 2013 | 2014 | 2015 | 2016 | 2017 | 2018 | 2019 | |||||||||||||||||||||
Ending loans | [ | *] | [ | *] | [ | *] | [ | *] | [ | *] | [ | *] | [ | *] | ||||||||||||||
Income before taxes | [ | *] | [ | *] | [ | *] | [ | *] | [ | *] | [ | *] | [ | *] | ||||||||||||||
Cumulative income before taxes | [ | *] | [ | *] | [ | *] | [ | *] | [ | *] | [ | *] | [ | *] | ||||||||||||||
Net loan growth % | [ | *] | [ | *] | [ | *] | [ | *] | [ | *] | [ | *] | [ | *] | ||||||||||||||
| Pro Forma – Reduced Core Loan Growth Over the Forecasted Period | ||||||||||||||||||||||||||||
| Year | 1 | 2 | 3 | 4 | 5 | 6 | 7 | |||||||||||||||||||||
| (dollars in thousands) | 2013 | 2014 | 2015 | 2016 | 2017 | 2018 | 2019 | |||||||||||||||||||||
Ending loans | [ | *] | [ | *] | [ | *] | [ | *] | [ | *] | [ | *] | [ | *] | ||||||||||||||
Income before taxes | [ | *] | [ | *] | [ | *] | [ | *] | [ | *] | [ | *] | [ | *] | ||||||||||||||
Cumulative income before taxes | [ | *] | [ | *] | [ | *] | [ | *] | [ | *] | [ | *] | [ | *] | ||||||||||||||
Net loan growth % | [ | *] | [ | *] | [ | *] | [ | *] | [ | *] | [ | *] | [ | *] | ||||||||||||||
| • | Flat Interest Rate Scenario: |
By utilizing a flat interest rate scenario for all rates affecting net interest income over the 10-year period, the sensitivity analysis scenario below shows that income before tax would [*] [*] [*] in the seven-year time horizon. These operating results would remain sufficient to realize all of the Company’s December 31, 2012 net deferred tax asset of $806.4 million in approximately the same period of time as our 10-Year FTI Analysis.
| 10-Year FTI Analysis Results | ||||||||||||||||||||||||||||
| Projection | ||||||||||||||||||||||||||||
| Year | 1 | 2 | 3 | 4 | 5 | 6 | 7 | |||||||||||||||||||||
| (dollars in thousands) | 2013 | 2014 | 2015 | 2016 | 2017 | 2018 | 2019 | |||||||||||||||||||||
Net interest margin | [ | *] | [ | *] | [ | *] | [ | *] | [ | *] | [ | *] | [ | *] | ||||||||||||||
Income before taxes | [ | *] | [ | *] | [ | *] | [ | *] | [ | *] | [ | *] | [ | *] | ||||||||||||||
Cumulative income before taxes | [ | *] | [ | *] | [ | *] | [ | *] | [ | *] | [ | *] | [ | *] | ||||||||||||||
| Pro Forma Flat Interest Rate Scenario | ||||||||||||||||||||||||||||
| Flat Interest Rates | ||||||||||||||||||||||||||||
| Year | 1 | 2 | 3 | 4 | 5 | 6 | 7 | |||||||||||||||||||||
| (dollars in thousands) | 2013 | 2014 | 2015 | 2016 | 2017 | 2018 | 2019 | |||||||||||||||||||||
Net interest margin | [ | *] | [ | *] | [ | *] | [ | *] | [ | *] | [ | *] | [ | *] | ||||||||||||||
Income before taxes | [ | *] | [ | *] | [ | *] | [ | *] | [ | *] | [ | *] | [ | *] | ||||||||||||||
Cumulative income before taxes | [ | *] | [ | *] | [ | *] | [ | *] | [ | *] | [ | *] | [ | *] | ||||||||||||||
| • | Flat Income Before Taxes, As Adjusted Scenario (referenced on page 70 of December 31, 2012 Form 10-K Management’s Discussion and Analysis) |
This sensitivity analysis scenario assumes that pre-tax income remains the same as 2012 throughout the 10-year forecast period, except that credit costs are reduced by the pre-tax charges of approximately $157 million from the fourth quarter sales of distressed assets and non-interest income excludes the $39 million of net gains on the sales of investment securities available for sale. The sensitivity analysis scenario below shows that income
| Securities and Exchange Commission | CONFIDENTIAL TREATMENT REQUESTED | |||
| June 21, 2013 | BY SYNOVUS FINANCIAL CORP. | |||
| Page | | 22 | PURSUANT TO 17 C.F.R. §200.83 | ||
before tax of $2.1 billion would be realized by year 14 (2026). Under this unlikely hypothetical scenario, the Company would realize substantially all of the $806.4 million net deferred tax asset in approximately 14 years (2026) except for an additional approximately $4 million to $7 million of certain state NOL carryforwards and tax credits which would be forecasted to expire in this unlikely hypothetical sensitivity analysis before they could be utilized (an $18.7 million valuation allowance is recorded at December 31, 2012 for certain state NOL carryforwards and tax credits which are forecasted to expire unutilized based upon the 10-Year FTI Analysis).
| Pro Forma – Flat Income Before Taxes, as adjusted | ||||||||||||||||||||||||||||||||||||||||
| Year | 1 | 2 | 3 | 4 | 5 | 6 | 7 | 8 | 9 | 10 | ||||||||||||||||||||||||||||||
| (in thousands) | 2013 | 2014 | 2015 | 2016 | 2017 | 2018 | 2019 | 2020 | 2021 | 2022 | ||||||||||||||||||||||||||||||
Income before taxes | $ | 149,335 | $ | 149,335 | $ | 149,335 | $ | 149,335 | $ | 149,335 | $ | 149,335 | $ | 149,335 | $ | 149,335 | $ | 149,335 | $ | 149,335 | ||||||||||||||||||||
Cumulative income before taxes | $ | 149,335 | 298,670 | 448,005 | 597,340 | 746,675 | 896,010 | 1,045,345 | 1,194,680 | 1,344,015 | 1,493,350 | |||||||||||||||||||||||||||||
Flat Credit Costs from 2012 | ||||||||||||||||||||||||||||||||||||||||
| Year | 11 | 12 | 13 | 14 | ||||||||||||||||||||||||||||||||||||
| (in thousands) | 2023 | 2024 | 2025 | 2026 | ||||||||||||||||||||||||||||||||||||
Income before taxes | $ | 149,335 | $ | 149,335 | $ | 149,335 | $ | 149,335 | ||||||||||||||||||||||||||||||||
Cumulative income before taxes | 1,642,685 | 1,792,020 | 1,941,355 | 2,090,690 | ||||||||||||||||||||||||||||||||||||
| • | Credit Quality Scenario-Credit costs remain consistent with 2012 at $433 million (no adjustment for the [*] in pre-tax charges from the discretionary bulk sale of distressed assets in the latter part of the fourth quarter of 2012) |
In an even more unlikely sensitivity analysis scenario, if credit costs do not improve from 2012 results, including the impact of the discretionary bulk sale of distressed assets in the latter part of the fourth quarter of 2012, the sensitivity analysis scenario below shows that income before tax of $2.1 billion would be realized by [*]. Under this unlikely hypothetical scenario, the Company would realize substantially all of the $806.4 million in net deferred tax assets in approximately [*], except for an additional approximately $5 million to $8 million of certain state NOL carryforwards and tax credits which would be forecasted to expire in this sensitivity analysis before they could be utilized (an $18.7 million valuation allowance is recorded at December 31, 2012 for certain state NOL carryforwards and tax credits which are forecasted to expire unutilized based upon the 10-Year FTI Analysis).
| Pro Forma - Credit Costs Consistent with Total 2012 Credit Costs | ||||||||||||||||||||
Flat Credit Costs from 2012 | ||||||||||||||||||||
Year | [*] | [*] | [*] | [*] | [*] | [*] | [*] | [*] | [*] | [*] | ||||||||||
(in thousands) | [*] | [*] | [*] | [*] | [*] | [*] | [*] | [*] | [*] | [*] | ||||||||||
|
|
|
|
|
|
|
|
|
| |||||||||||
Credit costs | [*] | [*] | [*] | [*] | [*] | [*] | [*] | [*] | [*] | [*] | ||||||||||
Income before taxes | [*] | [*] | [*] | [*] | [*] | [*] | [*] | [*] | [*] | [*] | ||||||||||
Cumulative income before taxes | [*] | [*] | [*] | [*] | [*] | [*] | [*] | [*] | [*] | [*] | ||||||||||
Flat Credit Costs from 2012 | ||||||||||||||||||||
Year | [*] | [*] | [*] | [*] | [*] | [*] | ||||||||||||||
(in thousands) | [*] | [*] | [*] | [*] | [*] | [*] | ||||||||||||||
|
|
|
|
|
| |||||||||||||||
Credit costs | [*] | [*] | [*] | [*] | [*] | [*] | ||||||||||||||
Income before taxes | [*] | [*] | [*] | [*] | [*] | [*] | ||||||||||||||
Cumulative income before taxes | [*] | [*] | [*] | [*] | [*] | [*] | ||||||||||||||
| Securities and Exchange Commission | CONFIDENTIAL TREATMENT REQUESTED | |||
| June 21, 2013 | BY SYNOVUS FINANCIAL CORP. | |||
| Page | | 23 | PURSUANT TO 17 C.F.R. §200.83 | ||
Conclusion
Based upon the comprehensive analysis supporting the reasonableness of the assumptions used in our 10- Year FTI Analysis and the accumulation of supporting evidence obtained from the comparison of our assumptions and results to independent third-party data and/or projections, the Company concluded, at a more likely than not level of certainty, that Synovus will generate sufficient future taxable income of the appropriate character and within the carry forward periods permitted to support the realization of the Company’s net DTA at December 31, 2012, except for $18.7 million relating to certain state NOL carryforwards and tax credits which are expected to expire before they are utilized.
As further evidence of Synovus’ ability to generate sufficient taxable income at a more likely than not level of certainty necessary to support the realizability of the Company’s December 31, 2012 net deferred tax asset, the Company performed sensitivity analysis scenarios for certain forecast assumptions or operating results using unlikely and more conservative assumptions than utilized in the 10-Year FTI Analysis, with results that also demonstrate Synovus’ income generation capabilities to produce sufficient amounts of future taxable income, in the appropriate future periods, at a more likely than not level of certainty, to support the realization of all of its December 31, 2012 net deferred tax asset, except for $18.7 million relating to certain state NOL carryforwards and tax credits which are expected to expire before they can be utilized (and which are reserved for at December 31, 2012 through a valuation allowance).
| c. | If you exclude certain expense items in your forecasts, please explain to us your basis; and |
Response
Synovus confirms that it did not exclude any expense items from the forecast developed to determine the realizability of the deferred tax assets as of December 31, 2012.
| d. | A detailed analysis of the amount and timing of the use of federal and state NOL and tax credit carryforwards that supports your disclosure on page 70 that based on the 2012 level of income, excluding both the impact of the pre-tax charge of $157 million from the fourth quarter sales of distressed assets and the net gain on the sales of securities, the Company would realize the $806.4 million in net deferred tax assets in 14 years. |
Response
The disclosure on page 70 of the 2012 Form 10-K was intended to convey management’s high degree of confidence in the Company’s ability to generate sufficient levels of future taxable income necessary to support the realization of the December 31, 2012 net deferred tax asset by noting that even in the unlikely scenario where the 2012 level of income before tax, excluding both the impact of the pre-tax charge of $157 million from the fourth quarter sales of distressed assets and the net gain on the sales of investment securities ($39.1 million), is held flat for all future years at $149.3 million, the Company would still realize substantially all of its December 31, 2012 net deferred tax asset, in approximately 14 years, which remains within the available carryforward periods, except for an approximately $4 million to $7 million related to certain additional state NOL carryforwards and tax credits which would expire prior to utilization in this unlikely scenario. The above noted approximately $4 million to $7 million is in addition to the $18.7 million December 31, 2012 recorded valuation allowance for certain state NOL carryforwards and tax credits which are forecasted to expire before they can be utilized based upon the 10-Year FTI Analysis.
Based upon the Company’s 10-Year FTI Analysis, the Company expects to generate sufficient future taxable income in the appropriate carryforward periods necessary to realize all of its net deferred tax asset at December 31, 2012, except for $18.7 million related to certain state NOL carryforwards and tax credits which are
| Securities and Exchange Commission | CONFIDENTIAL TREATMENT REQUESTED | |||
| June 21, 2013 | BY SYNOVUS FINANCIAL CORP. | |||
| Page | | 24 | PURSUANT TO 17 C.F.R. §200.83 | ||
expected to expire before they are utilized. Our response to Comment 3(b) discusses the 10-Year FTI Analysis assumptions, related supporting evidence, and the basis for the Company’s conclusion that it is more likely than not that Synovus will generate sufficient future taxable income to realize $806.4 million of its net deferred tax asset at December 31, 2012.
A detailed analysis of the amount and timing of the use of Federal and state NOL and tax credit carryforwards based upon our 10-Year FTI Analysis is included in the attached schedules:
| ¡ | Attachment A: Book DTA Reversal Schedule |
| ¡ | Attachment B: Tax DTA Reversal Schedule |
Book DTA Reversal Schedule
The Book DTA Reversal Schedule in Attachment A provides forecasted pre-tax book income by year for a 10-year period offset by the utilization of deferred tax assets within the respective allowable carryforward periods, with a remaining amount of pre-tax book income available to offset deferred tax assets with no expiration period. As presented in the Book DTA Reversal Schedule, the full amount of Federal deferred tax assets subject to expiration periods is projected to be realized by [*]. The remaining net Federal deferred tax assets, general business tax credits, and alternative minimum tax (AMT) tax credits are projected to be realized in [*].
Based on the Book DTA Reversal Schedule, Synovus’ state jurisdictions of Alabama, Florida 1, Florida 2, Georgia, South Carolina, and Tennessee deferred tax assets subject to expiration periods would be realized in the [*] of the forecast period for Alabama’s NOL and [*] for Florida’s NOL.
The Book DTA Reversal Schedule also shows that the NOL asset related to Florida 2 of $3.8 million and certain Georgia state tax credits totaling $14.9 million, are projected to expire prior to the Company’s ability to utilize these assets and therefore a valuation allowance of $18.7 million has been maintained for these assets at December 31, 2012.
Tax DTA Reversal Schedule
In addition to the analysis discussed above, Synovus also prepared taxable income forecasts to project the timing for the utilization of the net deferred tax assets. The Tax DTA Reversal Schedule in Attachment B adjusts the 10-year forecasted pre-tax book income for forecasted permanent differences as well as the estimated reversal of temporary differences (deferred tax assets and deferred tax liabilities) by year to derive forecasted estimated Federal taxable income for the respective years. Based on the Tax DTA Reversal Schedule, the full amount of Federal deferred tax assets subject to expiration periods, as well as the general business tax credits which have no expiration periods, would be realized by [*]. In addition, substantially all of the remaining Federal deferred tax assets with no expiration date are expected to reverse by [*], with the remaining reversing through [*].
Based on the Tax DTA Reversal Schedule, Synovus’ state jurisdictions of Alabama, Florida 1, Florida 2, South Carolina and Tennessee deferred tax assets subject to expiration periods are projected to be realized between [*], including the estimated timing for the reversal of the DTA.
The Tax DTA Reversal Schedule also shows that the NOL asset related to Florida 2 of $3.8 million and certain Georgia state tax credits totaling $14.9 million, will expire prior to the Company’s ability to utilize these assets and therefore a valuation allowance of $18.7 million has been maintained for these assets at December 31, 2012.
| Securities and Exchange Commission | CONFIDENTIAL TREATMENT REQUESTED | |||
| June 21, 2013 | BY SYNOVUS FINANCIAL CORP. | |||
| Page | | 25 | PURSUANT TO 17 C.F.R. §200.83 | ||
| 4. | As a related matter, please explain to us how you considered the following in support of management’s decision to reverse a portion of the deferred tax asset valuation allowance at December 31, 2012: |
| a. | The magnitude and duration of your past losses as well as your return to profitability; |
Response
Beginning in 2008, Synovus began to experience significant losses which coincided with the start of the economic downturn and rapid decreases in real estate values. We generated losses from 2008 through the second quarter of 2011 largely due to the economic downturn and declines in real estate values which impacted much of the nation, but impacted the Company’s market areas especially hard. Losses hit their peak in 2009, as seen below, at the same time that most of the Company’s credit quality indicators also reached their worst levels.
The magnitude and duration of our past losses as well as our return to profitability are illustrated below:
| ( in thousands) | ||||||||
Period Ended | Adjusted Pre-tax Income (Loss)(1) | Three-year Cumulative Loss Position(2) | ||||||
YTD 12/31/06 | $ | 973,533 | $ | — | ||||
YTD 12/31/07 | 856,268 | — | ||||||
YTD 12/31/08(3) | (652,421 | ) | — | |||||
YTD 12/31/09(3) | (1,598,181 | ) | (1,394,334 | ) | ||||
YTD 12/31/10 | (778,529 | ) | (3,029,131 | ) | ||||
QTD 3/31/11 | (79,864 | ) | (3,235,196 | ) | ||||
QTD 6/30/11 | (43,764 | ) | (3,300,499 | ) | ||||
QTD 9/30/11 | 37,118 | (3,203,699 | ) | |||||
QTD 12/31/11 | 26,978 | (2,436,242 | ) | |||||
QTD 3/31/12 | 35,916 | (2,178,520 | ) | |||||
QTD 6/30/12 | 37,347 | (1,477,778 | ) | |||||
QTD 9/30/12 | 30,514 | (976,717 | ) | |||||
QTD 12/31/12(4) | $ | (72,300 | ) | $ | (806,584 | ) | ||
| (1) | ASC Topic 740 does not prescribe a methodology to determine whethercumulative losses in recent yearsexist. In practice, recent years generally has been interpreted to mean the current year and prior two years, and earnings (losses) have been measured based on pre-tax book income (loss), including results of discontinued operations. Minority interest income and losses are also included in adjusted pre-tax income (loss). Amounts shown exclude dividends and accretion of discount on preferred stock. |
| (2) | Represents rolling twelve quarters’ cumulative loss position. |
| (3) | During 2008 and 2009, Synovus recognized charges of approximately $480 million and $15 million, respectively, for impairment of goodwill, which have been included in adjusted pre-tax income (loss), shown herein. |
| (4) | The loss for this quarter is attributable to the completion of a discretionary distressed asset bulk sale, which resulted in pre-tax charges of approximately [*]. Excluding this discretionary distressed asset bulk sale and net gains on the sale of investment securities available for sale of $8.2 million, the fourth quarter of 2012 pre-tax income would have been approximately [*]. |
The Company returned to profitability in the third quarter of 2011 and reported five consecutive quarters of income before taxes through the third quarter of 2012 and has reported income before taxes for the full year of 2012 of $31.5 million, including [*] in pre-tax charges from the discretionary bulk sale of [*] of distressed assets in the latter part of the fourth quarter of 2012. The strategic decision to execute a bulk asset sale in the latter part of the fourth quarter of 2012 was discretionary; excluding the bulk asset sale pre-tax charges of [*] and excluding the 2012 net gains on the sale of investment securities available for sale of $39.1 million for the 2012 year ($8.2 million for the fourth quarter of 2012), the 2012 year’s income before taxes would have been [*], and the pre-tax income for the fourth quarter of 2012 would have been approximately [*], representing a sixth consecutive quarter of pre-tax income.
The return to profitability has been driven largely by significant improvements in credit quality. See a summary of credit quality improvement measurements in the charts and tables below. Synovus expects to continue to report gradual improvements in profitability, driven by continued improvements in credit quality as
| Securities and Exchange Commission | CONFIDENTIAL TREATMENT REQUESTED | |||
| June 21, 2013 | BY SYNOVUS FINANCIAL CORP. | |||
| Page | | 26 | PURSUANT TO 17 C.F.R. §200.83 | ||
well as modest growth in pre-tax, pre-credit costs income. While earnings may take some time to return to levels prior to the economic downturn, we are confident that we have returned to sustainable, long-term profitability at levels sufficient to support all of the net deferred tax asset of $806.4 million at December 31, 2012.
| b. | The significant factors driving your past losses and the current profitability; and |
Response
Significant Factors Driving Past Losses
The significant factors driving Synovus’ losses from 2008 through the second quarter of 2011 include an economic downturn which was particularly severe in the Company’s market areas as well as rapid and significant declines in real estate values in the Company’s market areas. The Company had a significant amount of loans secured by real estate, resulting in significant credit losses and related expenses during the period from 2008 to 2011. During the period from 2008 to 2011, total losses before taxes were $3.09 billion and during the same period, total credit costs were $4.52 billion. Non-performing loan inflows reached a peak of $3.12 billion in 2009 and have declined by 79.5% to $641.4 million in 2012.
Losses in Commercial Real Estate Portfolio
The credit losses were driven primarily by net charge-offs in the commercial real estate (CRE) portfolio. From 2008 through 2011, this portfolio had $2.74 billion in net charge-offs, which was approximately 70% of all net charge-offs during this period of time. NPLs in this portfolio have also decreased $877.9 million or 71.2% from a peak of $1.23 billion at December 31, 2009 to $355.9 million at December 31, 2012. More specifically, the largest losses were incurred in the residential construction and development and land acquisition categories (consisting of 1-4 family construction, residential development, and land acquisition), which during the recent economic downturn, experienced a higher level of NPLs and losses than any other loan category. From 2008 through 2011, this segment of the CRE portfolio had $1.91 billion in losses, which was approximately 49% of all losses during this time period. The exposure from this part of the CRE portfolio has declined significantly as performing loans have decreased over 83% from a peak of $5.88 billion, or 22% of total performing loans at the end of 2007 to $970.5 million or 5% of total performing loans at the end of 2012. Similarly, NPLs in this segment of the CRE portfolio have decreased $569.1 million or 70.6% from a peak of $806.2 million at September 30, 2009 to $237.1 million at December 31, 2012.
The following table illustrates net charge-offs for total CRE loans as well as all other loan categories for the five years ended December 31, 2012:
| ($ in millions) | YTD 12/31/08 | YTD 12/31/09 | YTD 12/31/10 | YTD 12/31/11 | YTD 12/31/12 | |||||||||||||||||||||||||||||||||||
| Loans by Category | Net C/Os | % | Net C/Os | % | Net C/Os | % | Net C/Os | % | Net C/Os | % | ||||||||||||||||||||||||||||||
|
|
|
|
|
|
|
|
|
|
|
|
|
|
|
|
|
|
|
| |||||||||||||||||||||
| Investment properties | $ | 18 | 4% | $ | 166 | 11% | $ | 334 | 24% | $ | 134 | 23% | $ | 83 | 17% | |||||||||||||||||||||||||
1-4 family construction | 135 | 29 | 220 | 15 | 109 | 8 | 16 | 3 | 10 | 2 | ||||||||||||||||||||||||||||||
1-4 family perm/mini-perm | 17 | 3 | 58 | 4 | 56 | 4 | 51 | 9 | 32 | 7 | ||||||||||||||||||||||||||||||
Residential development | 112 | 24 | 407 | 28 | 289 | 21 | 65 | 11 | 38 | 8 | ||||||||||||||||||||||||||||||
|
|
|
|
|
|
|
|
|
|
|
|
|
|
|
|
|
|
|
| |||||||||||||||||||||
| Residential properties | 264 | 56% | 685 | 47% | 454 | 33% | 132 | 23% | 80 | 17% | ||||||||||||||||||||||||||||||
Land acquisition | 55 | 12% | 202 | 14% | 204 | 15% | 93 | 16% | 117 | 24% | ||||||||||||||||||||||||||||||
Total CRE | $ | 337 | 72% | $ | 1,053 | 72% | $ | 991 | 72% | $ | 359 | 61% | $ | 280 | 58% | |||||||||||||||||||||||||
C&I | 97 | 21% | 296 | 20% | 271 | 20% | 157 | 27% | 153 | 32% | ||||||||||||||||||||||||||||||
Retail | 35 | 7% | 111 | 8% | 109 | 8% | 70 | 12% | 50 | 10% | ||||||||||||||||||||||||||||||
Total | $ | 469 | 100% | $ | 1,460 | 100% | $ | 1,371 | 100% | $ | 586 | 100% | $ | 483 | 100% | |||||||||||||||||||||||||
The loan portfolio has shown significant improvements in concentrations over the past few years as CRE has declined in both total dollars and as a percentage of total loans. CRE totaled $6.45 billion or 33.0% of total loans at December 31, 2012, down 47.7% from $12.32 billion or 44.1% of total loans at December 31, 2008.
| Securities and Exchange Commission | CONFIDENTIAL TREATMENT REQUESTED | |||
| June 21, 2013 | BY SYNOVUS FINANCIAL CORP. | |||
| Page | | 27 | PURSUANT TO 17 C.F.R. §200.83 | ||
| Loans by Category | ||||||||||||||||||||||||||||||||||||||||
| ($ in millions) | 12/31/08 | 12/31/09 | 12/31/10 | 12/31/11 | 12/31/12 | |||||||||||||||||||||||||||||||||||
Investment properties | $ | 5,523 | 20% | $ | 5,897 | 23% | $ | 5,059 | 23% | $ | 4,557 | 23% | $ | 4,365 | 22% | |||||||||||||||||||||||||
Residential properties | 5,177 | 18% | 3,316 | 13% | 2,103 | 10% | 1,618 | 8% | 1,288 | 7% | ||||||||||||||||||||||||||||||
Land acquisition | 1,620 | 6% | 1,529 | 6% | 1,219 | 6% | 1,095 | 5% | 794 | 4% | ||||||||||||||||||||||||||||||
Total CRE | $ | 12,320 | 44% | $ | 10,742 | 42% | $ | 8,381 | 39% | $ | 7,271 | 36% | 6,447 | 33% | ||||||||||||||||||||||||||
C&I | 11,247 | 40% | 10,447 | 41% | 9,265 | 43% | 8,941 | 45% | 9,104 | 47% | ||||||||||||||||||||||||||||||
Retail | 4,390 | 16% | 4,212 | 17% | 3,951 | 18% | 3,880 | 19% | 4,011 | 20% | ||||||||||||||||||||||||||||||
Total loans* | $ | 27,920 | 100% | $ | 25,383 | 100% | $ | 21,583 | 100% | $ | 20,080 | 100% | $ | 19,541 | 100% | |||||||||||||||||||||||||
| * | Total loans are net of unearned income, which is not displayed on this table. |
While the concentration of CRE loans was a significant driver to our past losses, the significant reduction in CRE loan concentration is a factor in our current profitability and a factor contributing to the sustainability of our profitability.
Large Borrower Concentrations
Synovus’ previous business model led to a high number of large lending relationships (with outstanding balances greater than $75 million), which created significant exposure and credit risk. During the recent economic downturn, a number of these large borrowers defaulted on their loans, which resulted in significant losses. Between the years 2008 and 2011, Synovus lost approximately [*] on large lending relationships, as defined above, and at December 31, 2009, there were [*] large lending relationships totaling [*]. In 2009, Synovus put in place large borrower concentration limits. As a result, at December 31, 2012, there were [*] large lending relationships totaling [*], representing a [*] or [*] decline from December 31, 2009. Of the [*] large lending relationships at December 31, 2012, [*]. See graph below.
[*]
| [*] | [*] | [*] | [*] | [*] | [*] |
Further, at December 31, 2012, Synovus has only two Substandard accruing credits and six Special Mention credits greater than $20 million, none of which are over $40 million.
While this concentration of large loan relationships was a significant driver to our past losses, the significant reduction in these relationships is an important factor contributing to the de-risking of our loan portfolio and the sustainability of our profitability.
| Securities and Exchange Commission | CONFIDENTIAL TREATMENT REQUESTED | |||
| June 21, 2013 | BY SYNOVUS FINANCIAL CORP. | |||
| Page | | 28 | PURSUANT TO 17 C.F.R. §200.83 | ||
Significant Factors Driving Current Profitability
Reduction of Risk on Balance Sheet
The significant factors driving current profitability consist of a significant reduction in non-performing loans in the Company’s loan portfolio which were reduced 65.1% to $543.3 million at December 31, 2012 from the peak of $1.56 billion in the fourth quarter of 2009, as well as a significant reduction in potential problem loans in the Company’s loan portfolio which were reduced 74.3% to $369.5 million at December 31, 2012 from the peak of $1.44 billion in the fourth quarter of 2010.
The improvements in credit quality have led to a significant reduction in credit costs (composed of provision for loan losses and other credit costs, which consist primarily of losses on other real estate, provision for losses on unfunded commitments, and charges related to other loans held for sale), which declined to $432.6 million in 2012 compared to $2.19 billion in 2009, as well as a lower net charge-off ratio of 2.45% in 2012, compared to a peak of 5.82% in 2010. Annual NPL inflows declined 79.5% from $3.12 billion during 2009 to $641.4 million during 2012. Excluding the [*], as defined above, [*], 2012 NPL inflows would have been approximately [*] million, a decline of approximately [*] from 2009.
Since 2009, management and the Board of Directors have taken significant actions to bolster risk management, return to sustainable profitability, and strengthen the franchise, including:
Governance and Oversight
| • | Consolidated 30 bank charters to centralize oversight, establish consistency, improve capital efficiency, and increase opportunities for operational efficiency |
| • | Improved corporate governance by strengthening the Company’s Board of Directors |
| ¡ | Added 5 independent directors, enhancing financial and risk expertise |
| ¡ | Decreased number of directors from 18 to 14 |
| ¡ | Adopted a Board-approved risk statement to manage risks within established boundaries in order to achieve an appropriate risk return |
| • | Implemented governance enhancements to address current and anticipated regulatory changes; adopted best practices used among similarly sized institutions |
| • | Improved ability to manage risks through organizational changes in Enterprise Risk, consolidated risk reporting, and alignment of risk identification with capital and strategic planning processes |
| • | Achieved full compliance with supervisory requirements noted in the MOU and the Synovus Bank MOU. Both MOUs were terminated in 2013. |
Credit Process Improvements
In addition, the Company has implemented strengthened loan underwriting and loan monitoring standards and procedures which have also been important in driving credit quality portfolio improvements and current profitability. Improvement in underwriting and general risk management practices can be attributed to a number of key initiatives, including the implementation, with regular enhancements, of a single Synovus loan policy, the formation of a centralized credit structure, and loan monitoring policies and procedures.
| • | Created a Managed Assets Division (MAD) to develop and execute resolution strategies for problem credits across the footprint, allowing MAD team members who possess specialized credit workout skills to efficiently and effectively execute workout strategies. |
| • | Placed moratoriums on high-risk asset classes. |
| ¡ | Since 2007, residential construction and development and land acquisition loans declined 80.2% |
| Securities and Exchange Commission | CONFIDENTIAL TREATMENT REQUESTED | |||
| June 21, 2013 | BY SYNOVUS FINANCIAL CORP. | |||
| Page | | 29 | PURSUANT TO 17 C.F.R. §200.83 | ||
| • | Post charter consolidation, implemented a single loan policy that reflects consistent underwriting standards; established a centralized regional credit structure to improve quality and consistency; and invested in experienced credit resources to strengthen underwriting, approval, and collateral valuation processes. |
| • | A formal loan concentration policy was also adopted to limit and manage exposure to certain loan concentrations, including commercial real estate. This enhanced policy provides a more detailed program for portfolio risk management and reporting, including setting limits on commercial real estate loans as a percentage of risk-based capital (in the aggregate and by loan type), having large borrower concentration limits, and monitoring of loans per division and region as well as portfolio mix. Since implementation, historically high loan loss categories such as land acquisition and residential construction and development loans (within the CRE portfolio) have decreased dramatically. |
| • | Created a valuation services team for the independent function of ordering and reviewing third-party appraisals. This group is divided among the regional areas and provides market intelligence to the divisions regarding local market conditions, vacancies, cap rates, etc. Synovus’ valuation services team provides a quarterly update on the stability of all of Synovus’ market areas. |
The key steps discussed above strengthened the quality of the loan portfolio. The effects that these efforts have had on Synovus’ key credit quality metrics are summarized below:
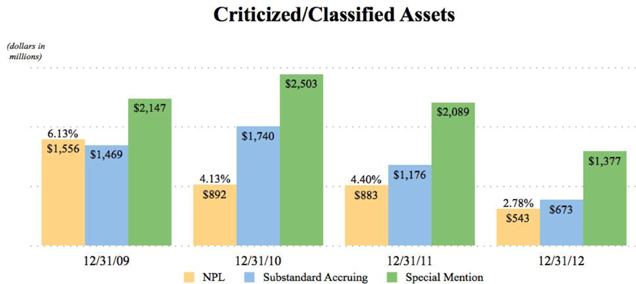
| Securities and Exchange Commission | CONFIDENTIAL TREATMENT REQUESTED | |||
| June 21, 2013 | BY SYNOVUS FINANCIAL CORP. | |||
| Page | | 30 | PURSUANT TO 17 C.F.R. §200.83 | ||
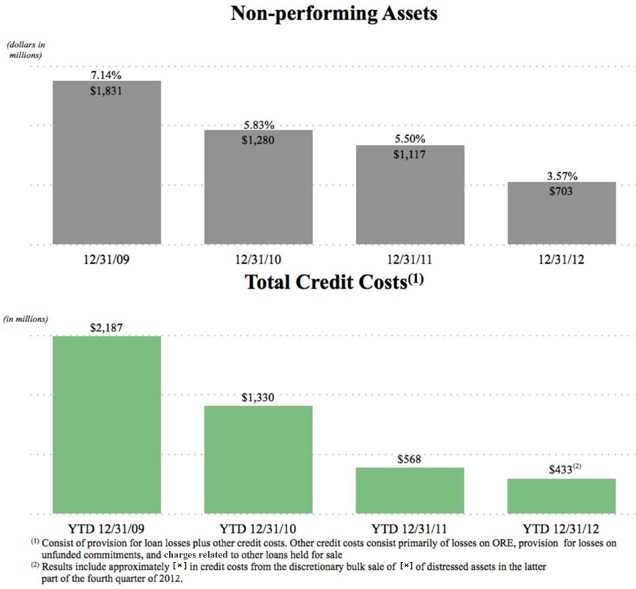
| Securities and Exchange Commission | CONFIDENTIAL TREATMENT REQUESTED | |||
| June 21, 2013 | BY SYNOVUS FINANCIAL CORP. | |||
| Page | | 31 | PURSUANT TO 17 C.F.R. §200.83 | ||
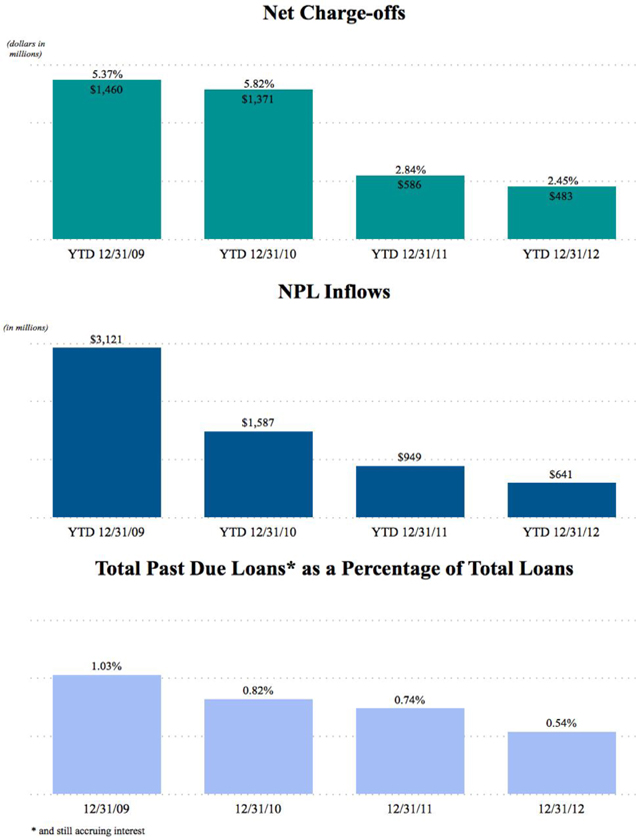
| Securities and Exchange Commission | CONFIDENTIAL TREATMENT REQUESTED | |||
| June 21, 2013 | BY SYNOVUS FINANCIAL CORP. | |||
| Page | | 32 | PURSUANT TO 17 C.F.R. §200.83 | ||
Net Interest Income and Non-Interest Income
Synovus’ current profitability is also supported by its banking revenue which consists of net interest income and non-interest income. Net interest income and non-interest income continue to be a reliable source of revenue for the Company. The trend for these two revenue sources is illustrated below:
| (in thousands) | QTD 3/31/11 | QTD 6/30/11 | QTD 9/30/11 | QTD 12/31/11 | QTD 3/31/12 | QTD 6/30/12 | QTD 9/30/12 | QTD 12/31/12 | ||||||||||||||||||||||||
Net interest income | $ | 237,434 | 230,961 | 228,603 | 227,156 | 220,959 | 213,356 | 212,345 | 207,457 | |||||||||||||||||||||||
| Total non-interest income excluding net investment securities gains | $ | 62,744 | 67,472 | 70,519 | 63,132 | 64,056 | 72,307 | 66,577 | 71,884 | |||||||||||||||||||||||
Efficiency
Efficiency gains have supported the Company’s current profitability. The Company has aligned the operating cost structure with the size of the organization while retaining a framework that supports growth and customer service. Approximately $100 million and $25 million in expense reductions in 2011 and 2012, respectively, have been realized while continuing to make significant investments in the risk, compliance, and IT infrastructure. Headcount has decreased 32.8% from 7,385 at December 31, 2007 to 4,963 at December 31, 2012. As shown below, total adjusted 2012 non-interest expense* was down $25.1 million or 3.5% vs. 2011, and total adjusted 2011 non-interest expense* was down $95.3 million or 11.7% vs. 2010.
| (in thousands) | YTD 12/31/10 | YTD 12/31/11 | YTD 12/31/12 | |||||||||
Employment expenses | $ | 418,628 | 371,149 | 375,872 | ||||||||
Occupancy and equipment expenses | 122,046 | 114,036 | 105,575 | |||||||||
Other expenses | 272,030 | 232,186 | 210,823 | |||||||||
Total adjusted non-interest expense* | $ | 812,704 | 717,371 | 692,271 | ||||||||
| * | Excludes other credit costs (consisting primarily of losses on other real estate, provision for losses on unfunded commitments, and charges related to other loans held for sale), restructuring charges, Visa indemnification charges and (loss) gain on curtailment of post-retirement benefits. |
The reduction in total adjusted non-interest expense reflects the results of efficiency initiatives implemented in 2011 and 2012 which were partially offset by continued investments in key growth areas such as credit related areas, risk management, and technology.
The reduction of credit risk in our loan portfolio resulting from the changing mix of our loan portfolio combined with corporate governance and oversight improvements, significant loan underwriting and loan monitoring process improvements, and significant improvements in our credit quality measurement as noted above, along with our long history of reliable levels of net interest income and non-interest income and the successful efficiencies in our operations that have already been achieved (without regard for further cost reductions expected in the future), are significant factors driving our current profitability as well as the sustainability of that profitability.
c. The sustainability of your current profitability in light of the current economic environment.
Response
The Company’s market areas have been severely impacted by the economic downturn and real estate valuation declines; although there are important signs of economic improvement, such improvement appears modest. As discussed further in our response to Comment 3(b), appropriate considerations of the economic conditions are built into the 10-Year FTI Analysis, such that we can conclude that the December 31, 2012 net
| Securities and Exchange Commission | CONFIDENTIAL TREATMENT REQUESTED | |||
| June 21, 2013 | BY SYNOVUS FINANCIAL CORP. | |||
| Page | | 33 | PURSUANT TO 17 C.F.R. §200.83 | ||
deferred tax asset, except for certain state NOL carryforwards and tax credits amounting to $18.7 million, is more likely than not realizable. [*] Further, while the banking environment is expected to remain challenging due to economic and other uncertainties, Synovus is confident that it can sustain the current level of profitability as well as continue to show improving profitability in future periods consistent with our forecast in the 10-Year FTI Analysis.
In addition, to further validate our ability to continue to generate long-term future taxable income at levels sufficient to support the December 31, 2012 net deferred tax asset, we have performed various sensitivity analysis scenarios. These scenarios demonstrate that even in various unlikely scenarios, which are more conservative than our 10-Year FTI Analysis, we will have continued profitability for the long-term and at levels of future taxable income that support the realization of all of the December 31, 2012 net deferred tax asset of $806.4 million.
| Item 13. | Certain Relationships and Related Transactions, and Director Independence |
Definitive Proxy Statement on Schedule 14A
| 5. | We note that you have qualified the representations regarding the transactions covered by Item 404 of Regulation S-K on page 48 of your Proxy Statement. Please revisit and evaluate the transactions with related parties and provide the representations contemplated by Instruction 4 to 404(a), without qualification, in your response letter to the staff. In addition, please revise future filings to remove such qualification. |
Response
Synovus confirms that during 2012, the lending relationships with our executive officers and directors (including their immediate family members and organizations with which they are affiliated) were made in the ordinary course of business and on substantially the same terms, including interest rates, collateral and repayment terms, as those prevailing at the time for comparable transactions with persons not related to the lender and did not involve more than the normal risk of collectability or present other unfavorable features. In addition, Synovus confirms that it will revise future filings to remove such qualification as cited by the Staff in future filings.
In addition, as requested in the Staff’s letter of May 23, 2013, the Company acknowledges that:
| • | it is responsible for the adequacy and accuracy of the disclosure in the filing; |
| • | Staff comments or changes to disclosure in response to Staff comments do not foreclose the Commission from taking any action with respect to the filing; and |
| • | it may not assert Staff comments as a defense in any proceeding initiated by the Commission or any person under the federal securities laws of the United States. |
* * * * *
| Securities and Exchange Commission | CONFIDENTIAL TREATMENT REQUESTED | |||
| June 21, 2013 | BY SYNOVUS FINANCIAL CORP. | |||
| Page | | 34 | PURSUANT TO 17 C.F.R. §200.83 | ||
If you have any questions concerning the foregoing, please contact the undersigned at (770) 649-2401.
Very truly yours,
/s/Thomas J. Prescott
Thomas J. Prescott
| cc: | Kessel D. Stelling |
Samuel F. Hatcher
Liliana C. McDaniel
| Securities and Exchange Commission | CONFIDENTIAL TREATMENT REQUESTED | |||
| June 21, 2013 | BY SYNOVUS FINANCIAL CORP. | |||
| Page | | 35 | PURSUANT TO 17 C.F.R. §200.83 | ||
Attachment A: Book DTA Reversal Schedule
[*]
| Securities and Exchange Commission | CONFIDENTIAL TREATMENT REQUESTED | |||
| June 21, 2013 | BY SYNOVUS FINANCIAL CORP. | |||
| Page | | 36 | PURSUANT TO 17 C.F.R. §200.83 | ||
Attachment B: Tax DTA Reversal Schedule
[*]