Exhibit 99.3
Second Quarter 2014 Results
July 22, 2014
SYNOVUS®
Forward-looking Statements and Use of Non-GAAP Financial Measures
Forward Looking Statements
This slide presentation and certain of our other filings with the Securities and Exchange Commission contain statements that constitute “forward-looking statements” within the meaning of, and subject to the protections of, Section 27A of the Securities Act of 1933, as amended, and Section 21E of the Securities Exchange Act of 1934, as amended. All statements other than statements of historical fact are forward-looking statements. You can identify these forward-looking statements through Synovus’ use of words such as “believes,” “anticipates,” “expects,” “may,” “will,” “assumes,” “should,” “predicts,” “could,” “should,” “would,” “intends,” “targets,” “estimates,” “projects,” “plans,” “potential” and other similar words and expressions of the future or otherwise regarding the outlook for Synovus’ future business and financial performance and/or the performance of the banking industry and economy in general. These forward-looking statements include, among others, (1) our expectations on credit trends and key credit metrics, including credit costs, future NPL inflows, and overall NPL levels; (2) expectations on future loan growth; (3) expectations on net interest margin; (4) expectations on mortgage banking income and other non-interest income; (5) expectations regarding adjusted non-interest expense levels and the impact of our ongoing efficiency initiatives and further cost savings; (6) the expected impact of Basel III on our capital ratios; (7) expectations regarding our strategic plan and future growth; and (8) the assumptions underlying our expectations. Prospective investors are cautioned that any such forward-looking statements are not guarantees of future performance and involve known and unknown risks and uncertainties which may cause the actual results, performance or achievements of Synovus to be materially different from the future results, performance or achievements expressed or implied by such forward-looking statements. Forward-looking statements are based on the information known to, and current beliefs and expectations of, Synovus’ management and are subject to significant risks and uncertainties. Actual results may differ materially from those contemplated by such forward-looking statements. A number of factors could cause actual results to differ materially from those contemplated by the forward-looking statements in this report. Many of these factors are beyond Synovus’ ability to control or predict.
These forward-looking statements are based upon information presently known to Synovus’ management and are inherently subjective, uncertain and subject to change due to any number of risks and uncertainties, including, without limitation, the risks and other factors set forth in Synovus’ filings with the Securities and Exchange Commission, including its Annual Report on Form 10-K for the year ended December 31, 2013 under the captions “Cautionary Notice Regarding Forward-Looking Statements” and “Risk Factors” and in Synovus’ quarterly reports on Form 10-Q and current reports on Form 8-K. We believe these forward-looking statements are reasonable; however, undue reliance should not be placed on any forward-looking statements, which are based on current expectations and speak only as of the date that they are made. We do not assume any obligation to update any forward-looking statements as a result of new information, future developments or otherwise, except as otherwise may be required by law.
Use of Non-GAAP Financial Measures
This slide presentation contains certain non-GAAP financial measures determined by methods other than in accordance with generally accepted accounting principles. Such non-GAAP financial measures include the following: net income available to common shareholders excluding restructuring charges; adjusted non-interest income; adjusted non-interest expense; adjusted revenues; adjusted pre-tax, pre-credit costs income; the ratio of adjusted pre-tax, pre-credit costs income to risk weighted assets; average core deposits; average core deposits excluding average time deposits; the Tier 1 common equity ratio; the estimated Tier 1 common equity ratio under final Basel III rules; and the tangible common equity to tangible assets ratio. The most comparable GAAP measures to these measures are income before income taxes; the ratio of net income to average total assets, total non-interest income, total non-interest expense, net sequential quarter total loan growth; total deposits; and the ratio of total equity to total assets, respectively. Management uses these non-GAAP financial measures to assess the performance of Synovus’ core business and the strength of its capital position. Synovus believes that these non-GAAP financial measures provide meaningful additional information about Synovus to assist investors in evaluating Synovus’ operating results, financial strength and capitalization. The non-GAAP financial measures should be considered as additional views of the way our financial measures are affected by significant charges for credit costs and other factors. Adjusted pre-tax, pre-credit costs income and adjusted pre-tax, pre-credit costs income to risk weighted assets are measures used by management to evaluate core operating results exclusive of credit costs as well as certain income/expenses. Adjusted non-interest income is a measure used by management to evaluate non-interest income exclusive of net investment securities gains and other non-recurring income items. Adjusted non-interest expense is a measure utilized by management to measure the success of expense management initiatives focused on reducing recurring controllable operating costs. 1Q14 loan growth excluding the impact from the Memphis transaction is a measure used by management to evaluate organic loan growth. Core deposits, core deposits excluding the impact from the Memphis transaction, core deposits excluding time deposits and the impact from the Memphis transaction, and total deposits excluding the impact from the Memphis transaction are measures used by management to evaluate organic growth of deposits and the quality of deposits as a funding source. The Tier 1 common equity ratio, the estimated Tier 1 common ratio under final Basel III rules, and the tangible common equity to tangible assets ratio are used by management to assess the strength of our capital position. These non-GAAP financial measures should not be considered as a substitute for operating results determined in accordance with GAAP and may not be comparable to other similarly titled measures of other companies. The computations of the non-GAAP financial measures used in this slide presentation are set forth in the Appendix to this slide presentation.
2
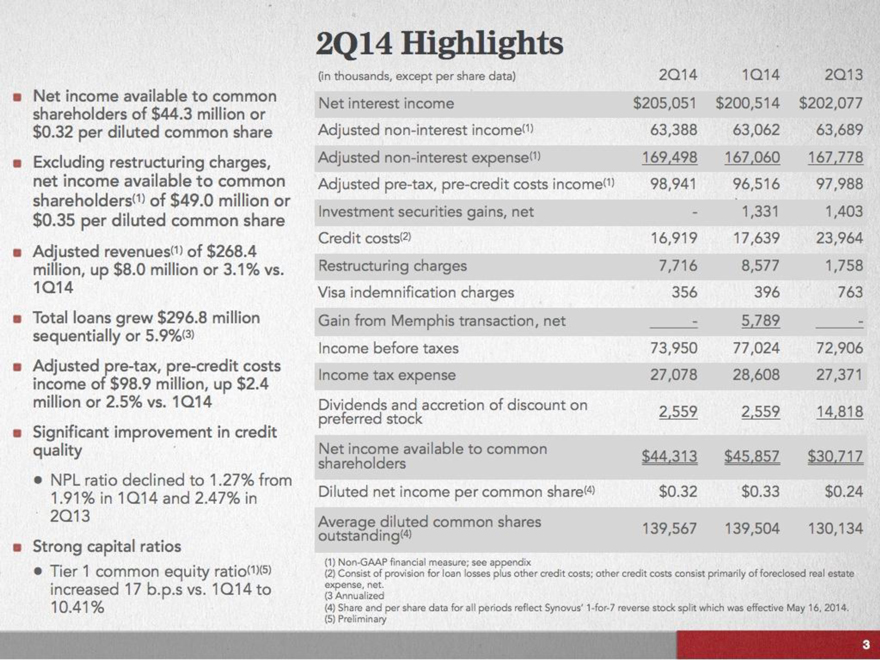
Net income available to common shareholders of $44.3 million or $0.32 per diluted common share
Excluding restructuring charges, net income available to common shareholders(1) of $49.0 million or $0.35 per diluted common share
Adjusted revenues(1) of $268.4 million, up $8.0 million or 3.1% vs. 1Q14
Total loans grew $296.8 million sequentially or 5.9%(3)
Adjusted pre-tax, pre-credit costs income of $98.9 million, up $2.4 million or 2.5% vs. 1Q14
Significant improvement in credit quality
NPL ratio declined to 1.27% from 1.91% in 1Q14 and 2.47% in 2Q13
Strong capital ratios
Tier 1 common equity ratio(1)(5) increased 17 b.p.s vs. 1Q14 to 10.41%
2Q14 Highlights
(in thousands, except per share data) 2Q14 1Q14 2Q13
Net interest income $205,051 $200,514 $202,077
Adjusted non-interest income(1) 63,388 63,062 63,689
Adjusted non-interest expense(1) 169,498 167,060 167,778
Adjusted pre-tax, pre-credit costs income(1) 98,941 96,516 97,988
Investment securities gains, net – 1,331 1,403
Credit costs(2) 16,919 17,639 23,964
Restructuring charges 7,716 8,577 1,758
Visa indemnification charges 356 396 763
Gain from Memphis transaction, net – 5,789 –
Income before taxes 73,950 77,024 72,906
Income tax expense 27,078 28,608 27,371
Dividends and accretion of discount on preferred stock 2,559 2,559 14,818
Net income available to common shareholders $44,313 $45,857 $30,717
Diluted net income per common share(4) $0.32 $0.33 $0.24
Average diluted common shares outstanding(4) 139,567 139,504 130,134
(1) Non-GAAP financial measure; see appendix
(2) Consist of provision for loan losses plus other credit costs; other credit costs consist primarily of foreclosed real estate expense, net.
(3 Annualized
(4) Share and per share data for all periods reflect Synovus’ 1-for-7 reverse stock split which was effective May 16, 2014.
(5) Preliminary
3
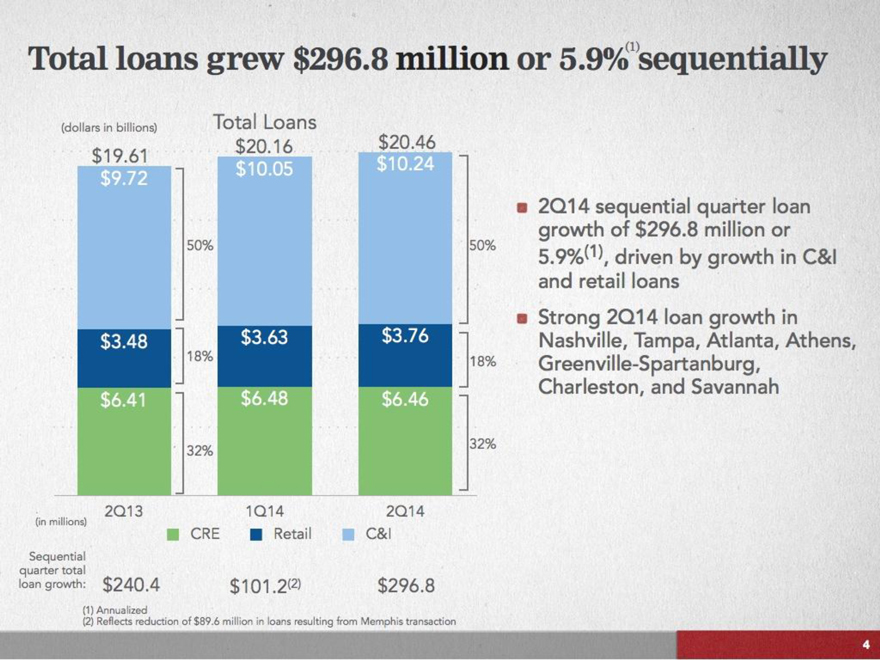
Total loans grew $296.8 million or 5.9%(1) sequentially
(dollars in billions) $19.61 $9.72 50% $3.48 18% $6.41 32%
Total Loans $20.16 $10.05 $3.63 $6.48
$20.46 $10.24 50% $3.76 18% $6.46 32%
2Q13 1Q14 2Q14 (in millions) CRE Retail C&I
Sequential quarter total loan growth: $240.4 $101.2(2) $296.8
(1) Annualized
(2) Reflects reduction of $89.6 million in loans resulting from Memphis transaction
2Q14 sequential quarter loan growth of $296.8 million or 5.9%(1), driven by growth in C&I and retail loans
Strong 2Q14 loan growth in Nashville, Tampa, Atlanta, Athens, Greenville-Spartanburg, Charleston, and Savannah
4
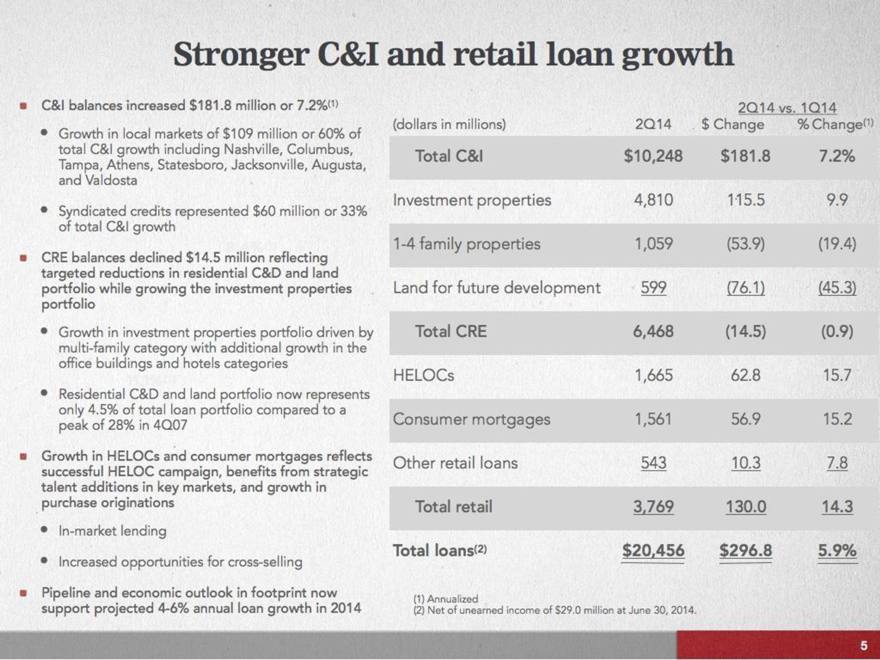
Stronger C&I and retail loan growth
C&I balances increased $181.8 million or 7.2%(1)
Growth in local markets of $109 million or 60% of total C&I growth including Nashville, Columbus, Tampa, Athens, Statesboro, Jacksonville, Augusta, and Valdosta
Syndicated credits represented $60 million or 33% of total C&I growth
CRE balances declined $14.5 million reflecting targeted reductions in residential C&D and land portfolio while growing the investment properties portfolio
Growth in investment properties portfolio driven by multi-family category with additional growth in the office buildings and hotels categories
Residential C&D and land portfolio now represents only 4.5% of total loan portfolio compared to a peak of 28% in 4Q07
Growth in HELOCs and consumer mortgages reflects successful HELOC campaign, benefits from strategic talent additions in key markets, and growth in purchase originations
In-market lending
Increased opportunities for cross-selling
Pipeline and economic outlook in footprint now support projected 4-6% annual loan growth in 2014
(dollars in millions) 2Q14 vs. 1Q14 2Q14 $ Change % Change(1)
Total C&I $10,248 $181.8 7.2%
Investment properties 4,810 115.5 9.9
1-4 family properties 1,059 (53.9) (19.4)
Land for future development 599 (76.1) (45.3)
Total CRE 6,468 (14.5) (0.9)
HELOCs 1,665 62.8 15.7
Consumer mortgages 1,561 56.9 15.2
Other retail loans 543 10.3 7.8
Total retail 3,769 130.0 14.3
Total loans(2) $20,456 $296.8 5.9%
(1) Annualized
(2) Net of unearned income of $29.0 million at June 30, 2014.
5
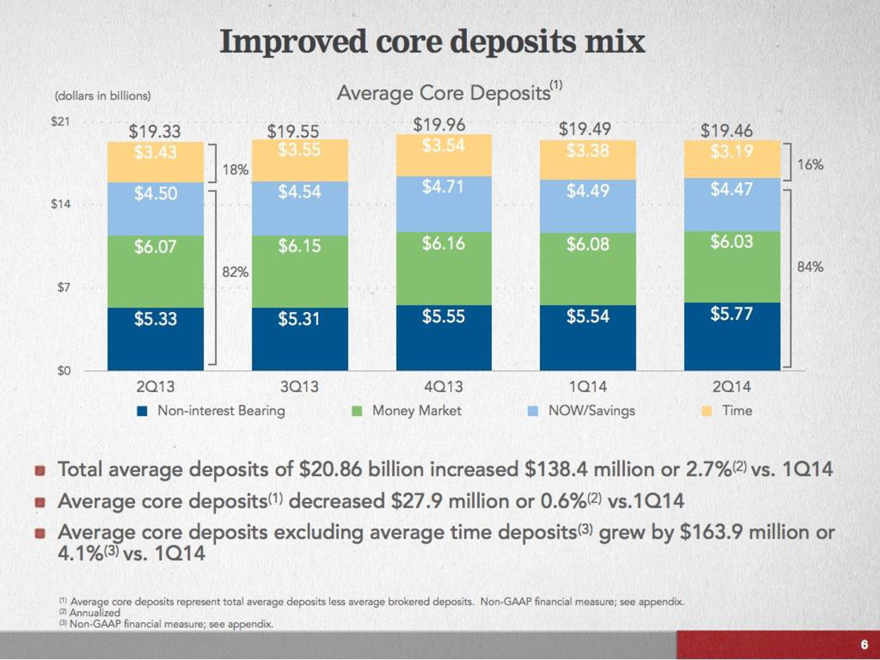
Improved core deposits mix
(dollars in billions)
Average Core Deposits(1)
$21 $14 $7 $0
$19.33 $3.43 $4.50 $6.07 $5.33
18% 82%
$19.55 $3.55 $4.54 $6.15 $5.31
$19.96 $3.54 $4.71 $6.16 $5.55
$19.49 $3.38 $4.49 $6.08 $5.54
$19.46 $3.19 $4.47 $6.03 $5.77
16% 84%
2Q13 3Q13 4Q13 1Q14 2Q14
Non-interest Bearing
Money Market
NOW/Savings
Time
Total Average deposits of $20.86 billion increased $138.4 million or 2.7%(2) vs. 1Q14
Average core deposits(1) decreased $27.9 million or 0.6%(2) vs. 1Q14
Average core deposits excluding average time deposits(3) grew by $163.9 million or 4.1%(3) vs. 1Q14
(1) Average core deposits represent total average deposits less average brokered deposits. Non-GAAP financial measure; see appendix.
(2) Annualized
(3) Non-GAAP financial measure; see appendix.
6
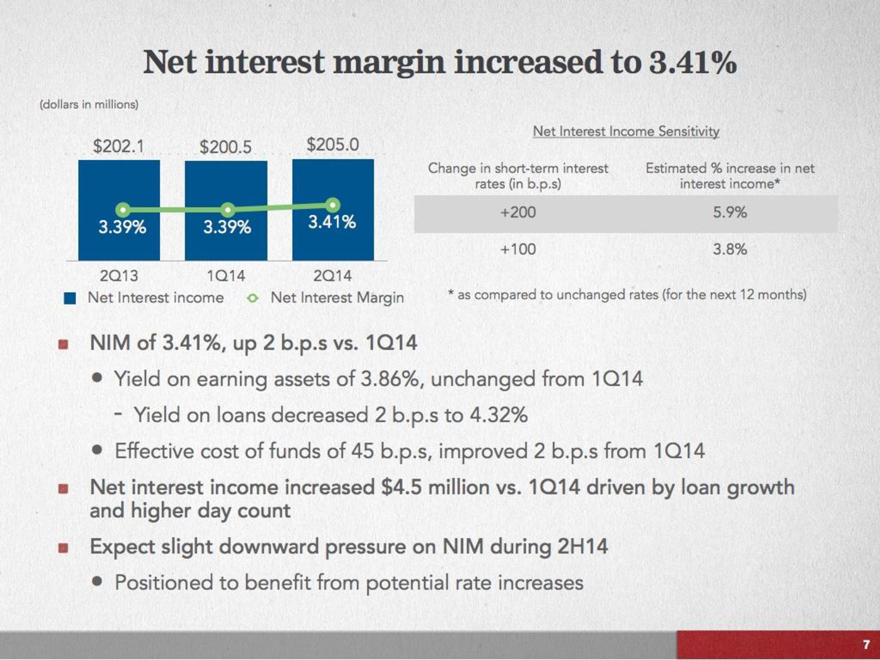
Net interest margin increased to 3.41%
(dollars in millions)
$202.1 $200.5 $205.0
3.39% 3.39% 3.41% 2Q13 1Q14 2Q14
Net Interest income Net Interest Margin
Net Interest Income Sensitivity
Change in short-term interest rates (in b.p.s)
Estimated % increase in net interest income*
+200 +100 5.9% 3.8%
NIM of 3.41%, up 2 b.p.s vs. 1Q14
Yield on earning assets of 3.86%, unchanged from 1Q14
- Yield on loans decreased 2 b.p.s to 4.32%
Effective cost of funds of 45 b.p.s, improved 2 b.p.s from 1Q14
Net interest income increased $4.5 million vs. 1Q14 driven by loan growth and higher day count
Expect slight downward pressure on NIM during 2H14
Positioned to benefit from potential rate increases
7
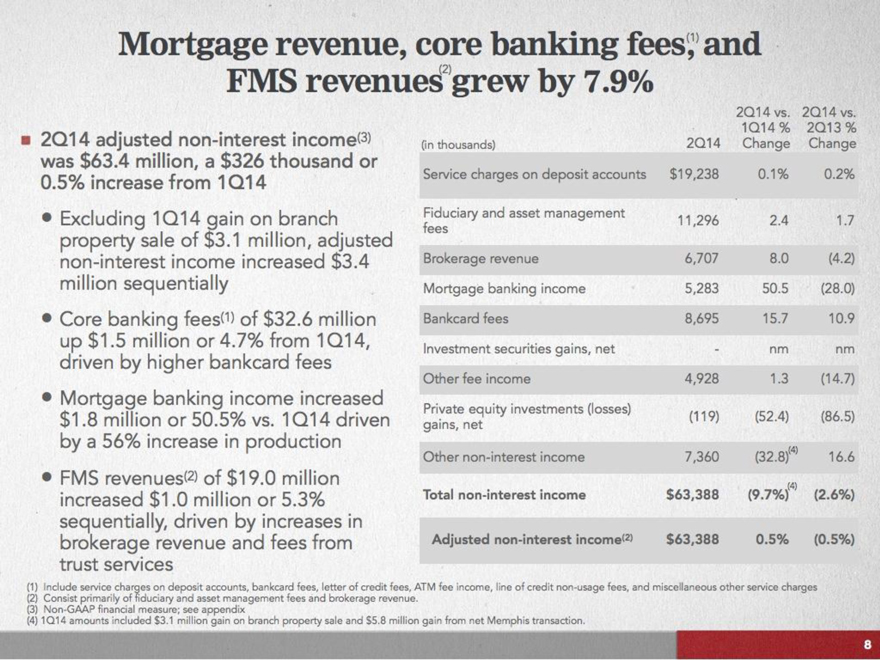
Mortgage revenue, core banking fees(1), and FMS revenues(2) grew by 7.9%
20Q14 adjusted non-interest income(3) was $63.4 million, a $326 thousand or 0.5% increase from 1Q14
Excluding 1Q14 gain on branch property sale of $3.1 million, adjusted non-interest income increased $3.4 million sequentially
Core banking fees(1) of $32.6 million up $1.5 million or 4.7% from 1Q14, driven by higher bankcard fees
Mortgage banking income increased $1.8 million or 50.5% vs. 1Q14 driven by a 56% increase in production
FMS revenues(2) of $19.0 million increased $1.0 million or 5.3% sequentially, driven by increases in brokerage revenue and fees from trust services
(1) Include service charges on deposit accounts, bankcard fees, letter of credit fees, ATM fee income, line of credit non-usage fees, and miscellaneous other service charges
(2) Consist primarily of fiduciary and asset management fees and brokerage revenue.
(3) Non-GAAP financial measure; see appendix
(4) 1Q14 amounts included $3.1 million gain on branch property sale and $5.8 million gain from net Memphis transaction.
(in thousands) 2Q14 2Q14 vs. 1Q14 % Change 2Q14 vs. 2Q13 % Change
Service charges on deposit accounts $19,238 0.1% 0.2%
Fiduciary and asset management fees 11,296 2.4 1.7
Brokerage revenue 6,707 8.0 (4.2)
Mortgage banking income 5,283 50.5 (28.0)
Bankcard fees 8,695 15.7 10.9
Investment securities gains, net—nm nm
Other fee income 4,928 1.3 (14.7)
Private equity investments (losses) gains, net (119) (52.4) (86.5)
Other non-interest income 7,360 (32.8)(4) 16.6
Total non-interest income $63,388 (9.7%)(4) (2.6%)
Adjusted non-interest income(2) $63,388 0.5% (0.5%)
8
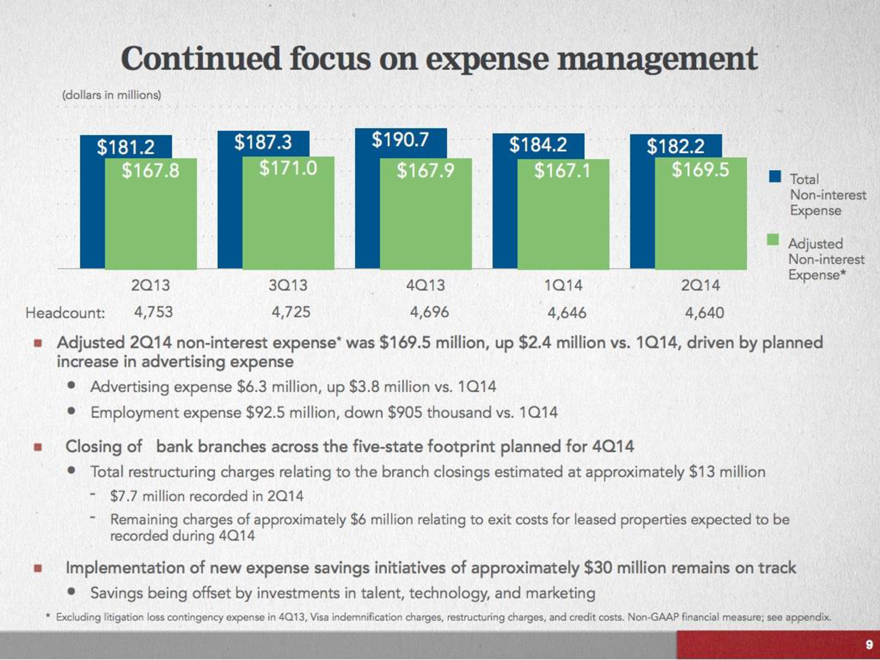
Continued focus on expense management
(dollars in millions)
$181.2 $187.3 $190.7 $184.2 $182.2
$167.8 $171.0 $167.9 $167.1 $169.5
2Q13 3Q13 4Q13 1Q14 2Q14
Headcount: 4,753 4,725 4,696 4,646 4,640
Total Non-interest Expense
Adjusted Non-interest Expense*
Adjusted 2Q14 non-interest expense* was $169.5 million, up $2.4 million vs. 1Q14, driven by planned increase in advertising expense
Advertising expense $6.3 million, up $3.8 million vs. 1Q14
Employment expense $92.5 million, down $905 thousand vs. 1Q14
Closing of bank branches across the five-state footprint planned for 4Q14
Total restructuring charges relating to the branch closings estimated at approximately $13 million
-$7.7 million recorded in 2Q14
-Remaining charges of approximately $6 million relating to exit costs for leased properties expected to be recorded during 4Q14
Implementation of new expense savings initiatives of approximately $30 million remains on track
Savings being offset by investment in talent, technology, and marketing
* Excluding litigation loss contingency expense in 4Q13, Visa indemnification charges, restructuring charges, and credit costs. Non-GAAP financial measure; see appendix.
9
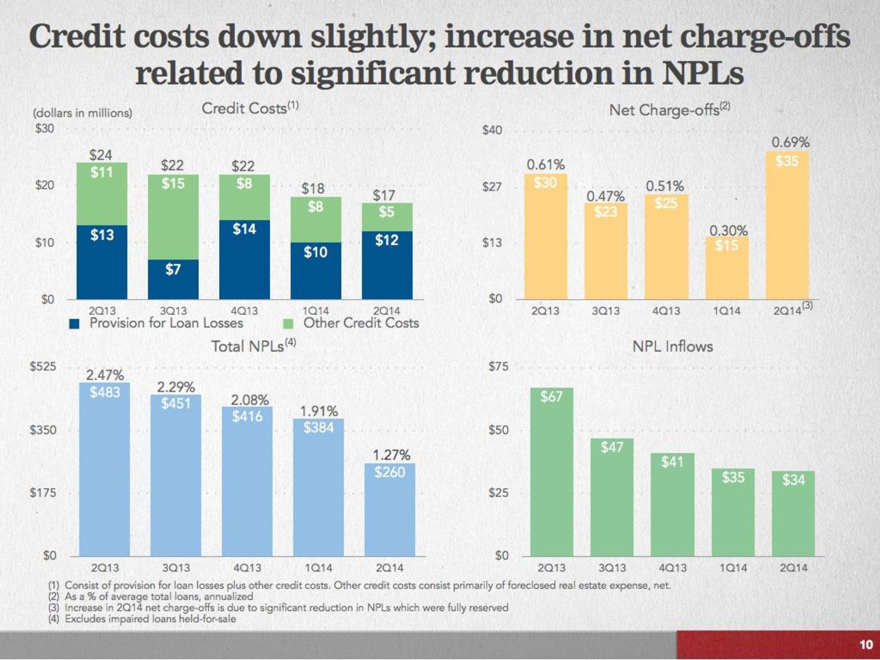
Credit costs down slightly; increase in net charge-offs related to significant reduction in NPLs
(dollars in millions) Credit Costs(1)
$30
$20 $24 $22 $22 $18 $17
$11 $15 $8 $8 $5
$10 $13 $7 $14 $10 $12
$0 2Q13 3Q13 4Q13 1Q14 2Q14
Provision for Loan Losses Other Credit Costs
Total NPLs(4)
$525
2.47% 2.29% 2.08% 1.91% 1.27%
$483 $451 $416 $384 $260
$350 $175 $0 2Q13 3Q13 4Q13 1Q14 2Q14
Net Charge-offs(2)
$40 0.69%
0.61% 0.47% 0.51% 0.30%
$27 $30 $23 $25 $15 $35
$13
$0 2Q13 3Q13 4Q13 1Q14 2Q14(3)
NPL Inflows
$75 $67 $47 $41 $35 $34
$50 $25 $0
2Q13 3Q13 4Q13 1Q14 2Q14
(1) Consist of provision for loan losses plus other credit costs. Other credit costs consist primarily of foreclosed real estate expense, net.
(2) As a % of average total loans, annualized
(3) Increase in 2Q14 net charge-offs is due to significant reduction in NPLs which were fully reserved
(4) Excludes impaired loans held-for-sale
10
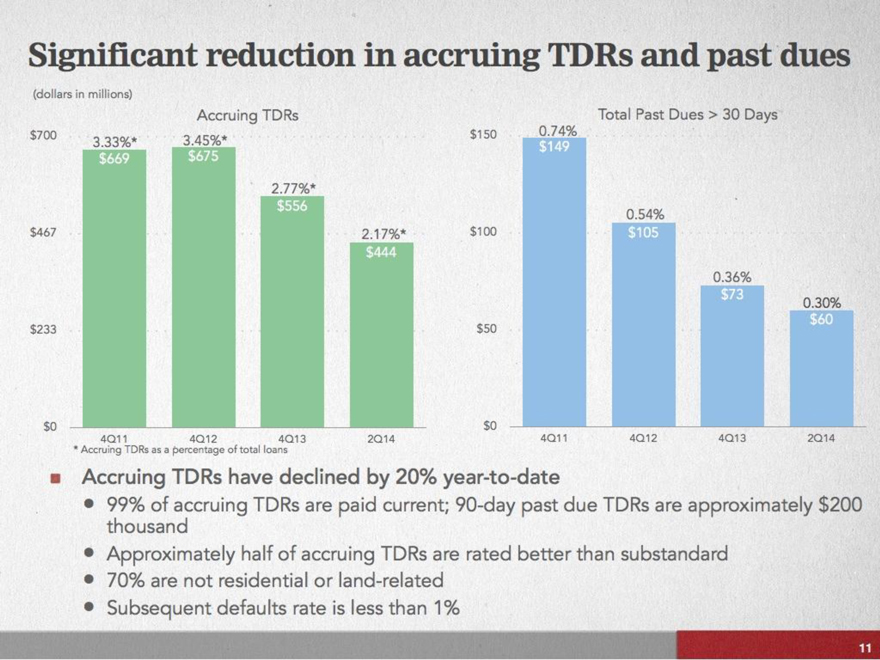
Significant reduction in accruing TDRs and past dues
(dollars in millions)
Accruing TDRs Total Past Dues > 30 Days
$700 3.33%* 3.45%* $150 0.74%
$669 $675 $149
$467 2.77%* $556 2.17%* $444 $100 0.54% $105
$233 $50 0.36% $73 0.30% $60
$0 $0
4Q11 4Q12 4Q13 2Q14 4Q11 4Q12 4Q13 2Q14
Accruing TDRs have declined by 20% year-to-date
99% of accruing TDRs are paid current; 90-day past due TDRs are approximately $200 thousand
Approximately half of accruing TDRs are rated better than substandard
70% are not residential or land-related
Subsequent defaults rate is less than 1%
11
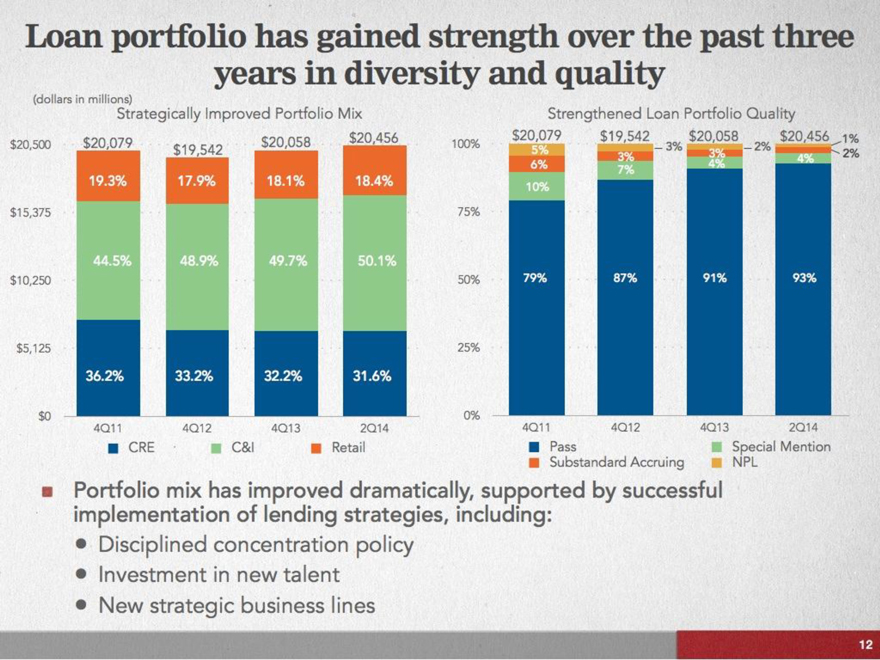
Loan portfolio has gained strength over the past three years in diversity and quality
(dollars in millions)
Strategically Improved Portfolio Mix
Strengthened Loan Portfolio Quality
$20,500 $15,375 $10,250 $5,125 $0
$20,079 19.3% 44.5% 36.2% 4Q11
$19,542 17.9% 48.9% 33.2% 4Q12
$20,258 18.1% 49.7% 32.2% 4Q13
$20,456 18.4% 50.1% 31.6% 2Q14
100% 75% 50% 25% 0%
$20,079 5% 6% 10% 79% 4Q11
$19,542 3% 7% 87% 4Q12
3%
$20,058 3% 4% 91% 4Q13
2%
$20,456 4% 93% 2Q14 1% 2%
CRE C&I Retail Pass Special Mention Substandard Accruing NPL
Portfolio mix has improved dramatically, supported by successful implementation of lending strategies, including:
Disciplined concentration policy
Investment in new talent
New strategic business lines
12
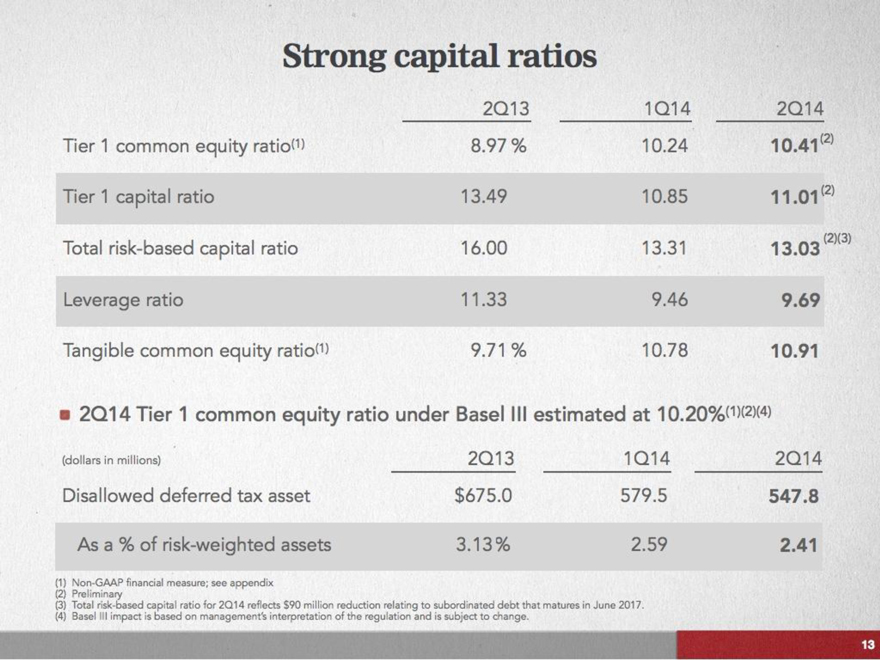
Strong capital ratios
2Q13 1Q14 2Q14
Tier 1 common equity ratio(1) 8.97% 10.24 10.41(2)
Tier 1 capital ratio 13.49 10.85 11.01(2)
Total risk-based capital ratio 16.00 13.31 13.03(2)(3)
Leverage ratio 11.33 9.46 9.69
Tangible common equity ratio(1) 9.71% 10.78 10.91
2Q14 Tier 1 common equity ratio under Based III estimated at 10.20%(1)(2)(4)
(dollars in millions) 2Q13 1Q14 2Q14
Disallowed deferred tax asset $675.0 579.5 547.8
As a % of risk-weighted assets 3.13% 2.59 2.41
(1) Non-GAAP financial measure; see appendix
(2) Preliminary
(3) Total risk-based capital ratio for 2Q14 reflects $90 million reduction relating to subordinated debt that matures in June 2017.
(4) Basel III impact is based on management’s interpretation of the regulation and is subject to change.
13
Path to improved earnings
Brand awareness work continues with…
Launch of capability ads and expansion of initial awareness ads in additional markets to promote our comprehensive offerings and increase market share
Balance sheet growth through…
Better alignment of commercial banking talent with customer needs and targeted market opportunities
Increased penetration in the high-opportunity middle market segment
Strategic expansion into specialized lending areas, most recently healthcare and equipment financing
Refreshed retail banking strategy to better serve consumer and small business customers
New and enhanced technology that offers added customer convenience
Net interest income growth driven by…
Balance sheet growth and continued focus on pricing
Accelerated by an increase in short-term interest rates
14
Path to improved earnings
Fee income growth generated by…
Growing our team of retail brokerage financial consultants, mortgage originators, and trust professionals
Offering highly-specialized training and licensing to our Private Wealth Management and Retail bank teams
Credit-related expense improvements through…
Further reduction of credit costs as legacy problem loans subside
Continued reduction in credit-related environmental costs
Focus on efficiency through…
Appropriately managing the level and positioning of headcount
Regularly reviewing and adjusting our branch network and operations to match evolving customer behaviors and preferences
Streamlining and enhancing internal processes while ensuring a positive customer experience
15

Appendix
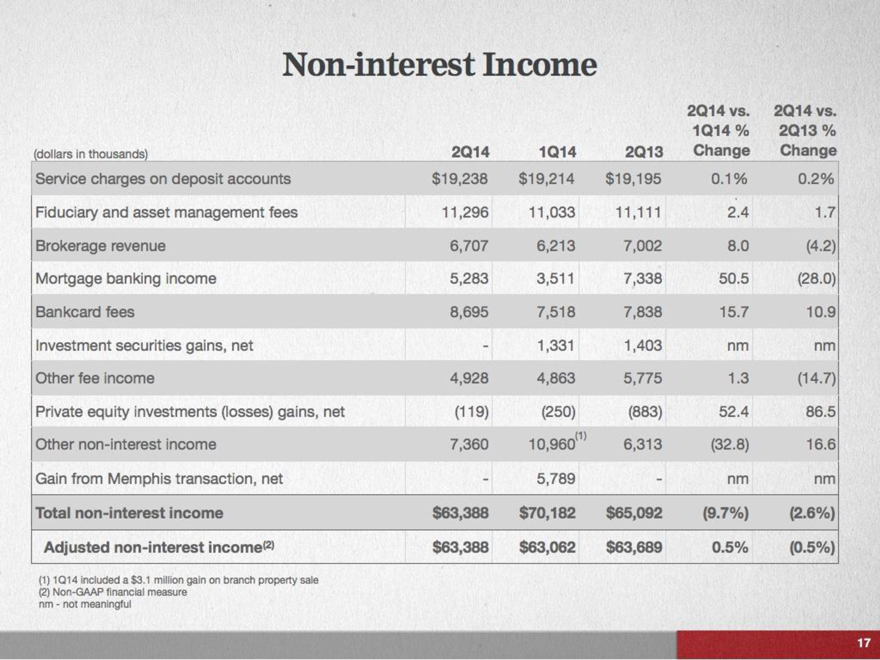
Non-interest Income
(dollars in thousands) 2Q14 1Q14 2Q13 2Q14 vs. 1Q14 % Change 2Q14 vs. 2Q13 % Change
Service charges on deposit accounts $19,238 $19,214 $19,195 0.1% 0.2%
Fiduciary and asset management fees 11,296 11,033 11,111 2.4 1.7
Brokerage revenue 6,707 6,213 7,002 8.0 (4.2)
Mortgage banking income 5,283 3,511 7,338 50.5 (28.0)
Bankcard fees 8,695 7,518 7,838 15.7 10.9
Investment securities gains, net – 1,331 1,403 nm nm
Other fee income 4,928 4,863 5,775 1.3 (14.7)
Private equity investments (losses) gains, net (119) (250) (883) 52.4 86.5
Other non-interest income 7,360 10,960(1) 6, 313 (32.8) 16.6
Gain from Memphis transaction, net – 5,789 – nm nm
Total non-interest income $63,388 $70,182 $65,092 (9.7%) (2.6%)
Adjusted non-interest income(2) $63,388 $63,062 $63,689 0.5% (0.5%)
(1) 1Q14 included a $3.1 million gain on branch property sale
(2) Non-GAAP financial measure
nm – not meaningful
17
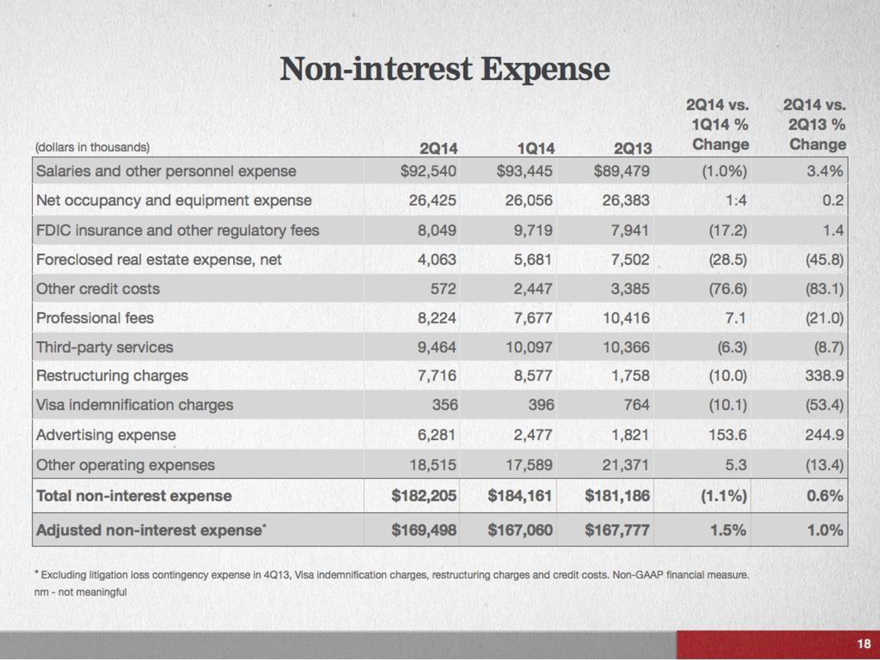
Non-interest Expense
(dollars in thousands) 2Q14 1Q14 2Q13 2Q14 vs. 1Q14 % Change 2Q14 vs. 2Q13 % Change
Salaries and other personnel expense $92,540 $93,445 $89,479 (1.0%) 3.4%
Net occupancy and equipment expense 26,425 26,056 26,383 1.4 0.2
FDIC insurance and other regulatory fees 8,049 9,719 7,941 (17.2) 1.4
Foreclosed real estate expense, net 4,063 5,681 7,502 (28.5) (45.8)
Other credit costs 572 2,447 3,385 (76.6) (83.1)
Professional fees 8,224 7,677 10,416 7.1 (21.0)
Third-party services 9,464 10,097 10,366 (6.3) (8.7)
Restructuring charges 7,716 8,577 1,758 (10.0) 338.9
Visa indemnification charges 356 396 764 (10.1) (53.4)
Advertising expense 6,281 2,477 1,821 153.6 244.9
Other operating expenses 18,515 17,589 21,371 5.3 (13.4)
Total non-interest expense $182,205 $184,161 $181,186 (1.1%) 0.6%
Adjusted non-interest expense* $169,498 $167,060 $167,777 1.5% 1.0%
* Excluding litigation loss contingency expense in 4Q13, Visa indemnification charges, restructuring charges and credit costs. Non-GAAP financial measure.
nm – not meaningful
18
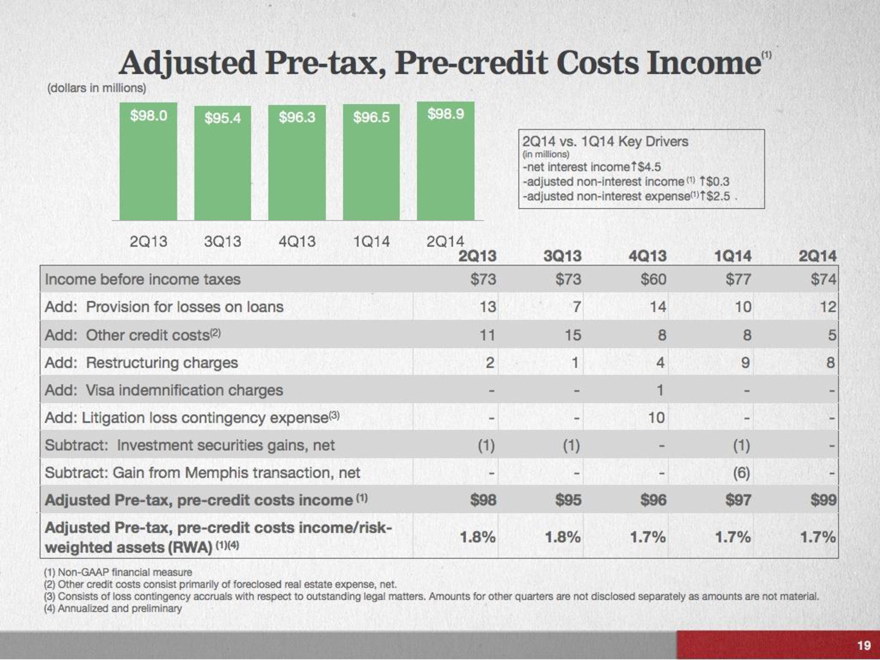
Adjusted Pre-tax, Pre-credit Costs Income(1)
(dollars in millions)
$98.0 $95.4 $96.3 $96.5 $98.9
2Q13 3Q13 4Q13 1Q14 2Q14
2Q14 vs. 1Q14 Key Drivers
(in millions)
-net interest income $4.5
-adjusted non-interest income(1) $0.3
-adjusted non-interest expense(1) $2.5
Income before income taxes
Add: Provision for losses on loans
Add: Other credit costs(2)
Add: Restructuring charges
Add: Visa indemnification charges
Add: Litigation loss contingency expense(3)
Subtract: Investment securities gains, net
Subtract: Gain from Memphis transaction, net
Adjusted Pre-tax, pre-credit costs income (1)
Adjusted Pre-tax, pre-credit costs income/risk- weighted assets (RWA) (1)(4)
2Q13 $73 13 11 2 - - (1) - $98 1.8%
3Q13 $73 7 15 1 - - (1) - $95 1.8%
4Q13 $60 14 8 4 1 10 - - $96 1.7%
1Q14 $77 10 8 9 - - (1) (6) $97 1.7%
2Q14 $74 12 5 8 - - - - $99 1.7%
(1) Non-GAAP financial measure
(2) Other credit costs consist primarily of foreclosed real estate expense, net.
(3) Consists of loss contingency accruals with respect to outstanding legal matters. Amounts for other quarters are not disclosed separately as amounts are not material. (4) Annualized and preliminary
19
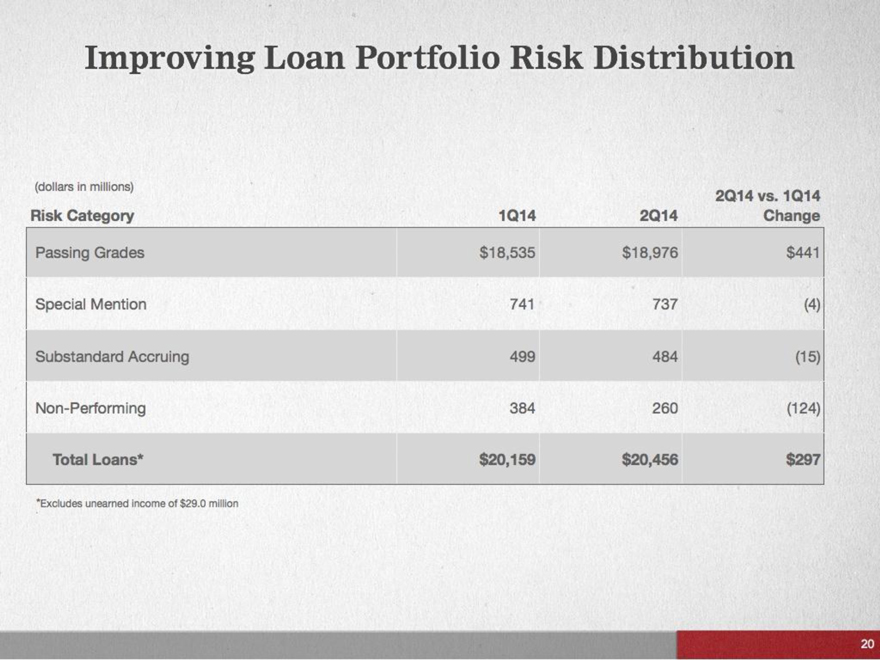
Improving Loan Portfolio Risk Distribution
(dollars in millions)
Risk Category
Passing Grades
Special Mention
Substandard Accruing
Non-Performing
Total Loans*
1Q14
$18,535
741
499
384
$20,159
2Q14
$18,976
737
484
260
$20,456
2Q14 vs. 1Q14 Change
$441
(4)
(15)
(124)
$297
*Excludes unearned income of $29.0 million
20
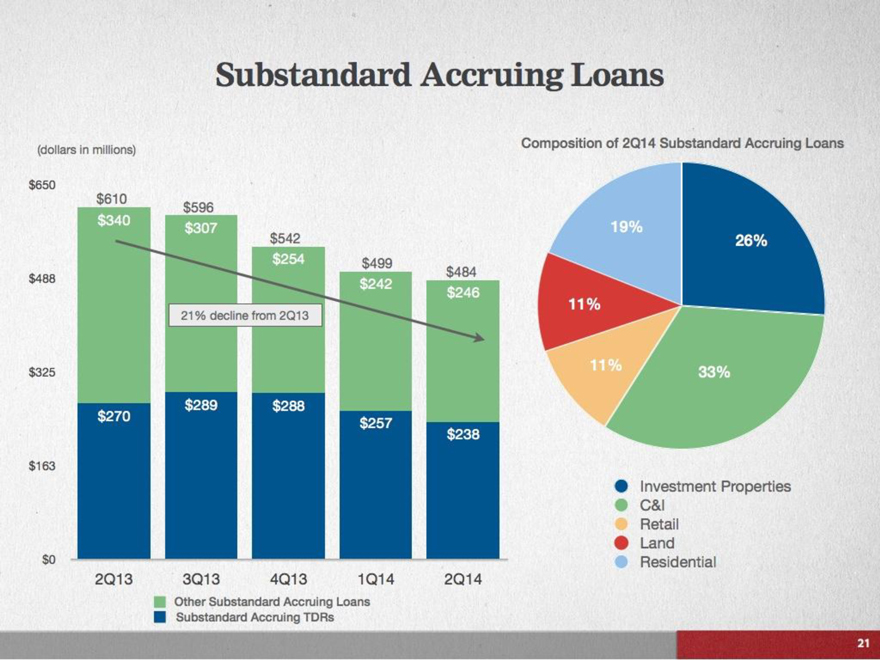
Substandard Accruing Loans
(dollars in millions)
$650
$488
$325
$163
$0
$610
$340
21% decline from 2Q13
$270
2Q13
$596
$307
$289
3Q13
$542
$254
$288
4Q13
$499
$242
$257
1Q14
$484
$246
$238
2Q14
Other Substandard Accruing Loans
Substandard Accruing TDRs
Composition of 2Q14 Substandard Accruing Loans
19%
11%
11%
26%
33%
Investment Properties
C&I Retail
Land
Residential
21

Troubled Debt Restructurings
(dollars in millions)
Composition of 2Q14 Performing TDRs
Risk Categories:
Pass
22%
$99
Substandard 54% $238 Special Mention 24% $107
Loan Type:
Retail 11%
C&I
33%
Land 11%
Resi. Prop.
19%
Inv. Prop. 26%
Accruing TDR Trends
$635
2Q13
$574
3Q13
$556
4Q13
$495
1Q14
$444
2Q14
99% of performing TDRs are paid current; 90-days past due TDRs are only $200 thousand
46% of performing TDRs are rated better than substandard
Approximately 70% of performing TDRs are not residential or land-related
Subsequent defaults rate is less than 1 %
22
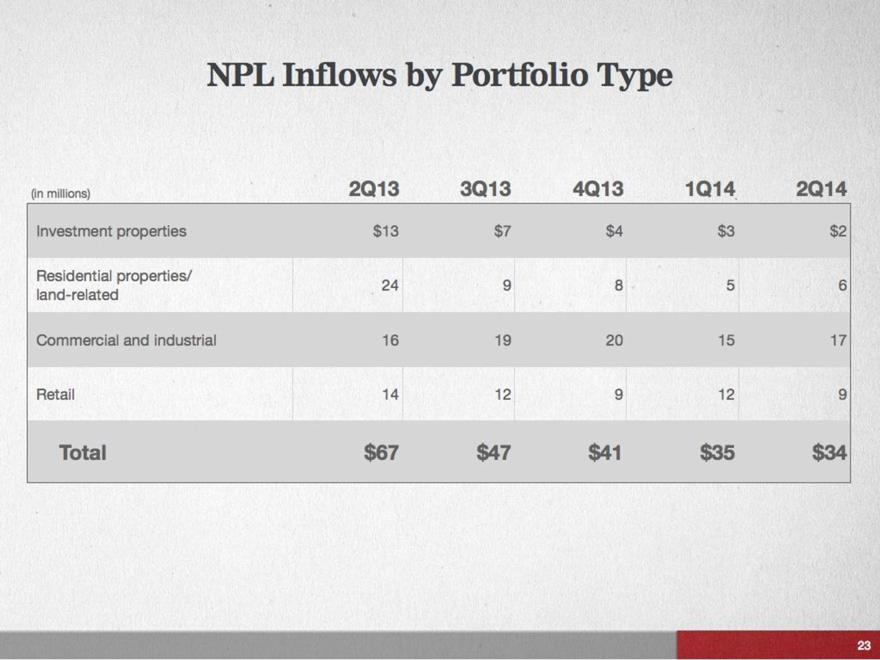
NPL Inflows by Portfolio Type
(in millions)
Investment properties
Residential properties/ land-related
Commercial and industrial
Retail
Total
2Q13
$13
24
16
14
$67
3Q13
$7
9
19
12
$47
4Q13
$4
8
20
9
$41
1Q14
$3
5
15
12
$35
2Q14
$2
6
17
9
$34
23
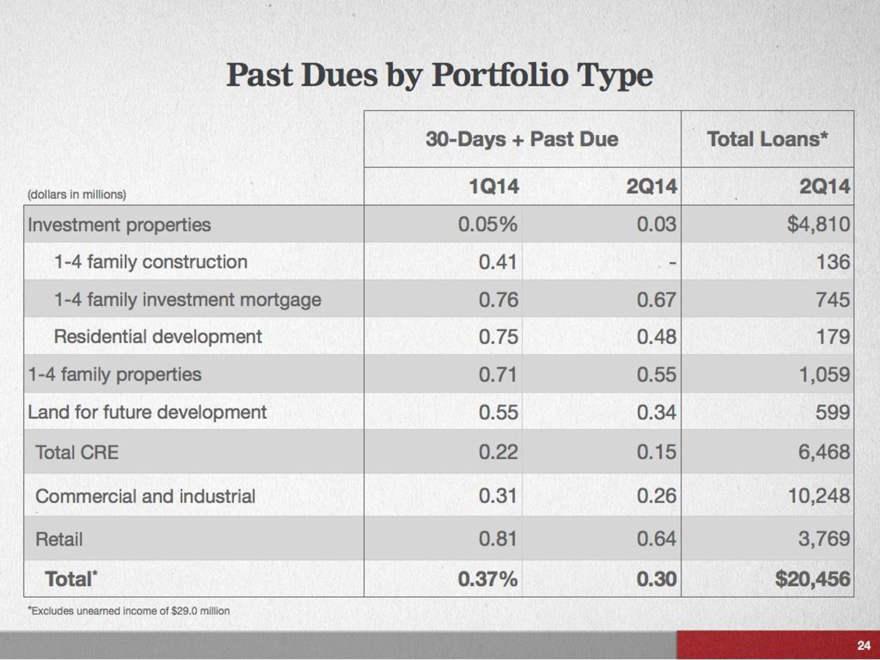
Past Dues by Portfolio Type
(dollars in millions)
Investment properties
1-4 family construction
1-4 family investment mortgage
Residential development
1-4 family properties
Land for future development
Total CRE
Commercial and industrial
Retail
Total*
30-Days + Past Due
Total Loans*
2Q14
$4,810
136
745
179
1,059
599
6,468
10,248
3,769
$20,456
1Q14
0.05%
0.41
0.76
0.75
0.71
0.55
0.22
0.31
0.81
0.37%
2Q14
0.03
-
0.67
0.48
0.55
0.34
0.15
0.26
0.64
0.30
*Excludes unearned income of $29.0 million
24
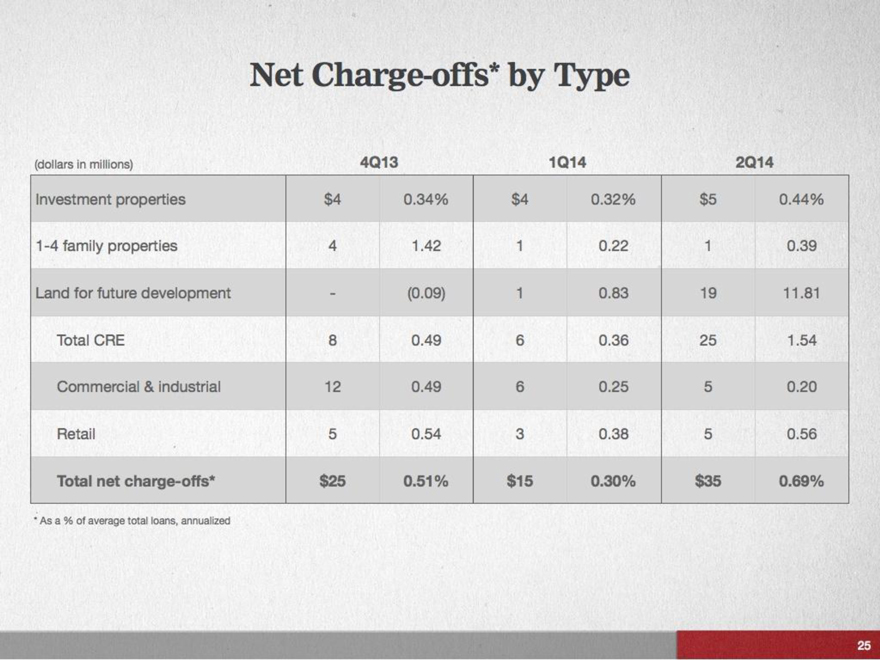
Net Charge-offs* by Type
(dollars in millions)
4Q13
1Q14
2Q14
Investment properties
$4
0.34%
$4
0.32%
$5
0.44%
1-4 family properties
4
1.42
1
0.22
1
0.39
Land for future development
-
(0.09)
1
0.83
19
11.81
Total CRE
8
0.49
6
0.36
25
1.54
Commercial & industrial
12
0.49
6
0.25
5
0.20
Retail
5
0.54
3
0.38
5
0.56
Total net charge-offs*
$25
0.51%
$15
0.30%
$35
0.69%
* As a % of average total loans, annualized
25
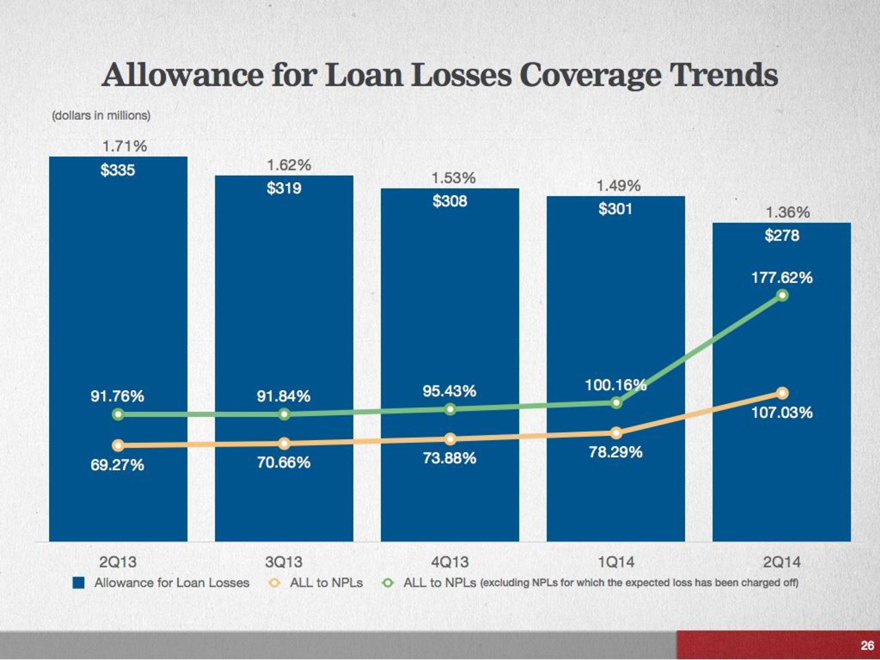
Allowance for Loan Losses Coverage Trends
(dollars in millions)
1.71%
$335
1.62%
1.53%
1.49%
1.36%
$319
$308
$301
$278
177.62%
91.76%
91.84%
95.43%
100.16%
107.03%
69.27%
70.66%
73.88%
78.29%
2Q13
3Q13
4Q13
1Q14
2Q14
Allowance for Loan Losses
ALL to NPLs
ALL to NPLs (excluding NPLs for which the expected loss has been charged off)
26
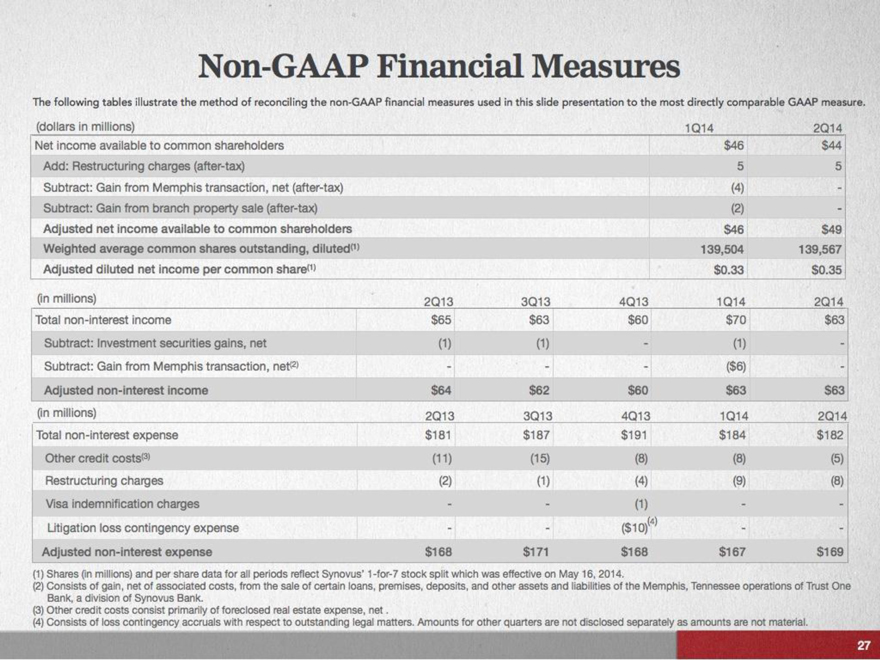
Non-GAAP Financial Measures
The following tables illustrate the method of reconciling the non-GAAP financial measures used in this slide presentation to the most directly comparable GAAP measure.
(dollars in millions)
1Q14
2Q14
Net income available to common shareholders
$46
$44
Add: Restructuring charges (after-tax)
5
5
Subtract: Gain from Memphis transaction, net (after-tax)
(4)
-
Subtract: Gain from branch property sale (after-tax)
(2)
-
Adjusted net income available to common shareholders
$46
$49
Weighted average common shares outstanding, diluted(1)
139,504
139,567
Adjusted diluted net income per common share(1)
$0.33
$0.35
(in millions)
2Q13
3Q13
4Q13
1Q14
2Q14
Total non-interest income
$65
$63
$60
$70
$63
Subtract: Investment securities gains, net
(1) (1)
-
(1)
-
Subtract: Gain from Memphis transaction, net(2)
-
-
-
($6)
-
Adjusted non-interest income
$64
$62
$60
$63
$63
(in millions)
2Q13
3Q13
4Q13
1Q14
2Q14
Total non-interest expense
$181
$187
$191
$184
$182
Other credit costs(3)
(11)
(15)
(8) (8)
(5)
Restructuring charges
(2)
(1)
(4)
(9) (8)
Visa indemnification charges
-
-
(1)
-
-
Litigation loss contingency expense
-
-
($10)(4)
-
-
Adjusted non-interest expense
$168
$171
$168
$167
$169
(1) Shares (in millions) and per share data for all periods reflect Synovus’ 1-for-7 stock split which was effective on May 16, 2014.
(2) Consists of gain, net of associated costs, from the sale of certain loans, premises, deposits, and other assets and liabilities of the Memphis, Tennessee operations of Trust One Bank, a division of Synovus Bank.
(3) Other credit costs consist primarily of foreclosed real estate expense, net.
(4) Consists of loss contingency accruals with respect to outstanding legal matters. Amounts for other quarters are not disclosed separately as amounts are not material.
27
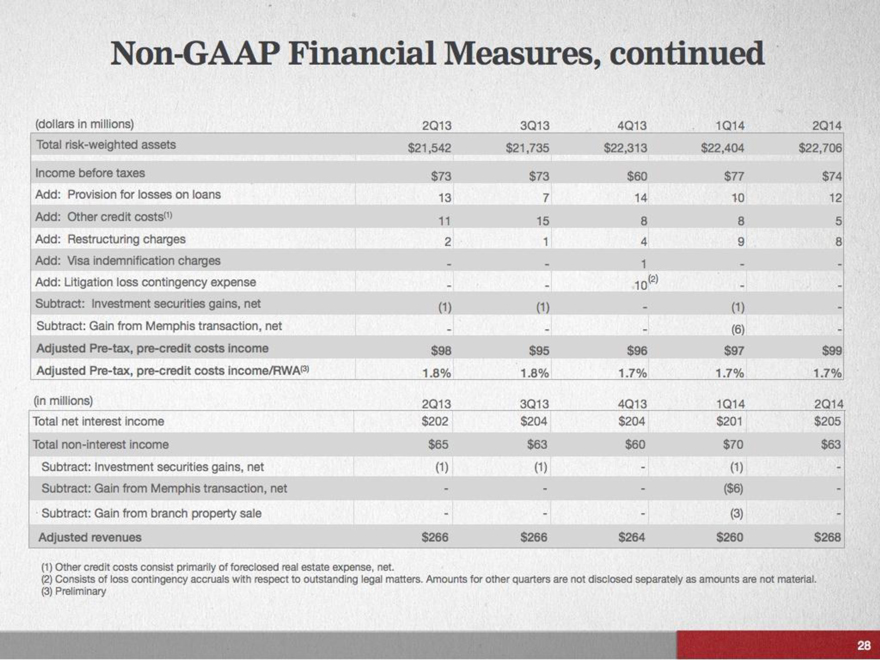
Non-GAAP Financial Measures, continued
(dollars in millions)
2Q13
3Q13
4Q13
1Q14
2Q14
Total risk-weighted assets
$21,542
$21,735
$22,313
$22,404
$22,706
Income before taxes
$73
$73
$60
$77
$74
Add: Provision for losses on loans
13
7
14
10
12
Add: Other credit costs(1)
11
15
8
8
5
Add: Restructuring charges
2
1
4
9
8
Add: Visa indemnification charges
-
-
1
-
-
Add: Litigation loss contingency expense
-
-
10(2)
-
-
Subtract: Investment securities gains, net
(1)
(1)
-
(1)
-
Subtract: Gain from Memphis transaction, net
-
-
(6)
-
Adjusted Pre-tax, pre-credit costs income
$98
$95
$96
$97
$99
Adjusted Pre-tax, pre-credit costs income/RWA(3)
1.8%
1.8%
1.7%
1.7%
1.7%
(in millions)
2Q13
3Q13
4Q13
1Q14
2Q14
Total net interest income
$202
$204
$204
$201
$205
Total non-interest income
$65
$63
$60
$70
$63
Subtract: Investment securities gains, net
(1)
(1)
-
(1)
-
Subtract: Gain from Memphis transaction, net
-
-
-
($6)
-
Subtract: Gain from branch property sale
-
-
-
(3)
-
Adjusted revenues
$266
$266
$264
$260
$268
(1) Other credit costs consist primarily of foreclosed real estate expense, net.
(2) Consists of loss contingency accruals with respect to outstanding legal matters. Amounts for other quarters are not disclosed separately as amounts are not material.
(3) Preliminary
28
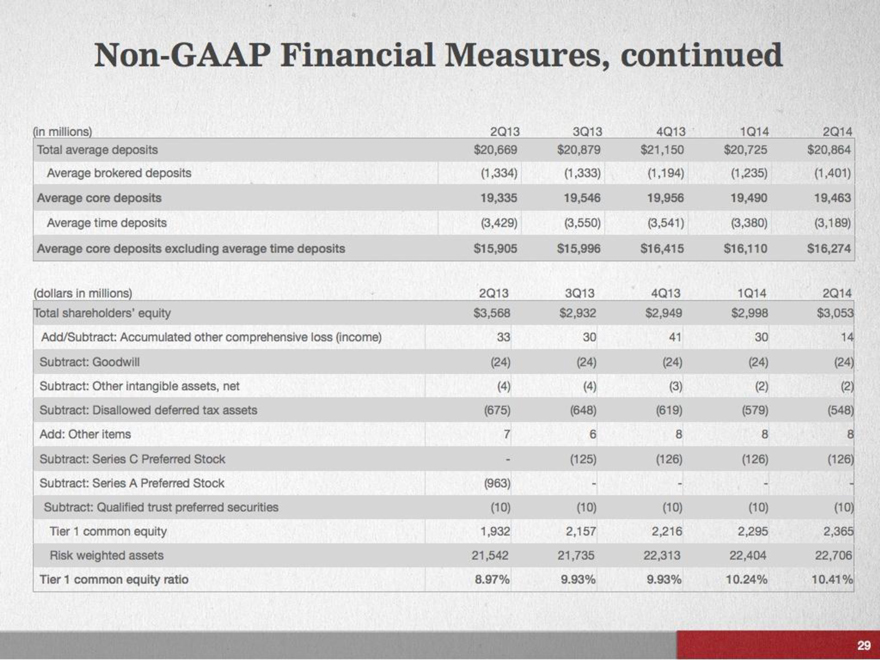
Non-GAAP Financial Measures, continued
(in millions)
2Q13
3Q13
4Q13
1Q14
2Q14
Total average deposits
$20,669
$20,879
$21,150
$20,725
$20,864
Average brokered deposits
(1,334)
(1,333)
(1,194)
(1,235)
(1,401)
Average core deposits
19,335
19,546
19,956
19,490
19,463
Average time deposits
(3,429)
(3,550)
(3,541)
(3,380)
(3,189)
Average core deposits excluding average time deposits
$15,905
$15,996
$16,415
$16,110
$16,274
(dollars in millions)
2Q13
3Q13
4Q13
1Q14
2Q14
Total shareholders’ equity
$3,568
$2,932
$2,949
$2,998
$3,053
Add/Subtract: Accumulated other comprehensive loss (income)
33
30
41
30
14
Subtract: Goodwill
(24)
(24)
(24)
(24)
(24)
Subtract: Other intangible assets, net
(4) (4)
(3)
(2)
(2)
Subtract: Disallowed deferred tax assets
(675)
(648)
(619)
(579)
(548)
Add: Other items
7
6
8
8
8
Subtract: Series C Preferred Stock
-
(125)
(126)
(126)
(126)
Subtract: Series A Preferred Stock
(963)
-
-
-
-
Subtract: Qualified trust preferred securities
(10)
(10)
(10)
(10)
(10)
Tier 1 common equity
1,932
2,157
2,216
2,295
2,365
Risk weighted assets
21,542
21,735
22,313
22,404
22,706
Tier 1 common equity ratio
8.97%
9.93%
9.93%
10.24%
10.41%
29
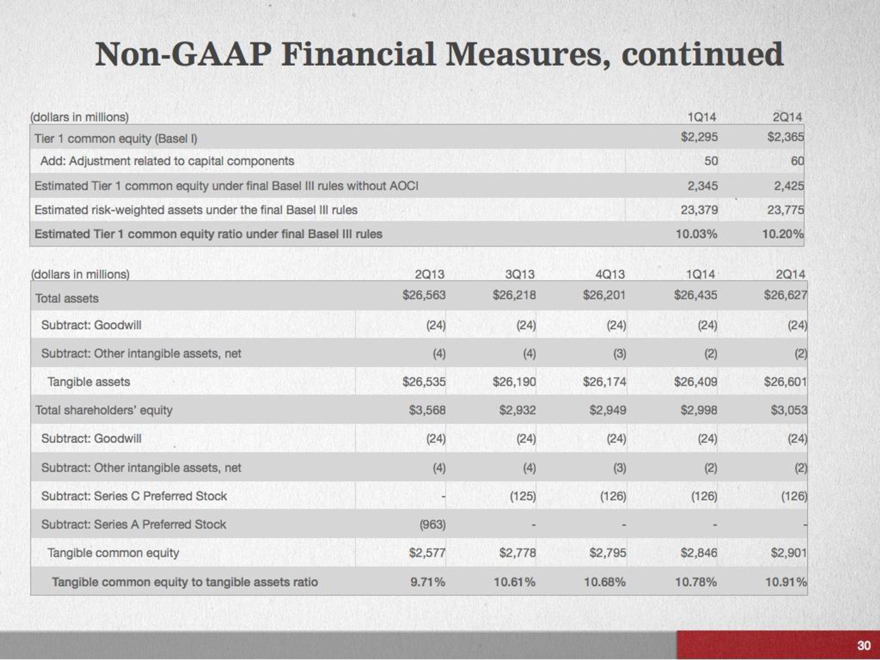
Non-GAAP Financial Measures, continued
(dollars in millions) 1Q14 2Q14
Tier 1 common equity (Basel I)
$2,295
$2,365
Add: Adjustment related to capital components
50
60
Estimated Tier 1 common equity under final Basel III rules without AOCI
2,345
2,425
Estimated risk-weighted assets under the final Basel III rules
23,379
23,775
Estimated Tier 1 common equity ratio under final Basel III rules
10.03%
10.20%
(dollars in millions)
2Q13
3Q13
4Q13
1Q14
2Q14
Total assets
$26,563
$26,218
$26,201
$26,435
$26,627
Subtract: Goodwill
(24)
(24)
(24)
(24)
(24)
Subtract: Other intangible assets, net
(4)
(4)
(3)
(2)
(2)
Tangible assets
$26,535
$26,190
$26,174
$26,409
$26,601
Total shareholders’ equity
$3,568
$2,932
$2,949
$2,998
$3,053
Subtract: Goodwill
(24)
(24)
(24)
(24)
(24)
Subtract: Other intangible assets, net
(4)
(4)
(3)
(2)
(2)
Subtract: Series C Preferred Stock
-
(125)
(126)
(126)
(126)
Subtract: Series A Preferred Stock
(963)
-
-
-
-
Tangible common equity
$2,577
$2,778
$2,795
$2,846
$2,901
Tangible common equity to tangible assets ratio
9.71%
10.61%
10.68%
10.78%
10.91%
30