Exhibit 99.3
Exhibit 99.3
Third Quarter 2017 Results
October 17, 2017
Synovus the bank of here
SYNOVUS
Forward Looking Statements
This slide presentation and certain of our other filings with the Securities and Exchange Commission contain statements that constitute “forward-looking statements” within the meaning of, and subject to the protections of, Section 27A of the Securities Act of 1933. as amended, and Section 21E of the Securities Exchange Act of 1934, as amended All statements other than statements of historical fact are forward-looking statements. You can identify these forward-looking statements through Synovus’ use of words such as “believes,” “anticipates,” “expects,” “may,” “will,” “assumes,” “should,” “predicts,” ’could,” “should,” “would,” “intends,” “targets,” “estimates,” “projects,” “plans,” ’potential” and other similar words and expressions of the future or otherwise regarding the outlook for Synovus’ future business and financial performance and/or the performance of the banking industry and economy in general. These forward-looking statements include, among others, statements on (1) future loan growth; (2) future deposit growth; (3) future net interest income and net interest margin; (4) future adjustednon-interest income; (5) futurenon-interest expense levels and efficiency ratios; (6) future credit trends and key metrics; (7) future effective tax rates; (8) our strategy and initiatives for future growth, capital management, strategic transactions, our brand initiative and financial planning; (9) our expectations related to the anticipated benefits of certain transactions and initiatives, including those related to the Cabela’s transaction and debt redemption; and (10) our assumptions underlying these expectations. Prospective investors are cautioned that any such forward-looking statements are not guarantees of future performance and involve known and unknown risks and uncertainties which may cause the actual results, performance or achievements of Synovus to be materially different from the future results, performance or achievements expressed or implied by such forward-looking statements. Forward-looking statements are based on the information known to, and current beliefs and expectations of Synovus’ management and are subject to significant risks and uncertainties. Actual results may differ materially from those contemplated by such forward-looking statements. A number of factors could cause actual results to differ materially from those contemplated by the forward-looking statements in this presentation. Many of these factors are beyond Synovus’ ability to control or predict.
These forward-looking statements are based upon information presently known to Synovus’ management and are inherently subjective, uncertain and subject to change due to any number of risks and uncertainties, including, without limitation, the risks and other factors set forth in Synovus’ filings with the Securities and Exchange Commission, including its Annual Report on Form10-K for the year ended December 31, 2016 under the captions “Cautionary Notice Regarding Forward-Looking Statements” and “Risk Factors” and in Synovus’ quarterly reports on Form10-Q and current reports on Form8-K. We believe these forward-looking statements are reasonable; however, undue reliance should not be placed on any forward-looking statements, which are based on current expectations and speak only as of the date that they are made. We do not assume any obligation to update any forward-looking statements as a result of new information, future developments or otherwise, except as otherwise may be required by law.
Use ofNon-GAAP Financial Measures
This slide presentation contains certainnon-GAAP financial measures determined by methods other than in accordance with generally accepted accounting principles. Suchnon-GAAP financial measures include the following: adjusted diluted earnings per share; adjusted return on average assets; adjusted return on average common equity; adjusted return on average tangible common equity, loan growth excluding transfers toheld-for-sale; netcharge-off ratio excluding charge-offs on loans transferred toheld-for-sale; average deposit growth excluding WFB deposits; average core transaction deposits; cost of interest bearing core deposits; total adjusted revenues; adjustednon-interest income; adjustednon-interest expense; adjusted efficiency ratio; tangible common equity ratio; and common equity Tier 1 (CET1) ratio (fullyphased-in). The most comparable GAAP measures to these measures are diluted earnings per share; return on average assets; return on average common equity; loan growth; netcharge-off ratio; total average deposits; effective cost of funds; totalnon-interest income; totalnon-interest expense; efficiency ratio; total shareholders’ equity to total assets ratio; and CET1 ratio, respectively Management uses thesenon-GAAP financial measures to assess the performance of Synovus’ business and the strength of its capital position Management believes that thesenon-GAAP financial measures provide meaningful additional information about Synovus to assist management, investors, and bank regulators in evaluating Synovus’ operating results, financial strength, the performance of its business and the strength of its capital position. However, thesenon-GAAP financial measures have inherent limitations as analytical tools and should not be considered in isolation or as a substitute for analyses of operating results or capital position as reported under GAAP. Thenon-GAAP financial measures should be considered as additional views of the way our financial measures are affected by significant items and other factors, and since they are not required to be uniformly applied, they may not be comparable to other similarly titled measures at other companies. Adjusted diluted earnings per share, adjusted return on average assets, and adjusted return on average common equity are measures used by management to evaluate operating results exclusive of items that are not indicative of ongoing operations and impactperiod-to-period comparisons. Adjusted return on average tangible common equity is a measure used by management to compare Synovus’ performance with other financial institutions because it calculates the return available to common shareholders without the impact of intangible assets and their related amortization, thereby allowing management to evaluate the performance of the business consistently. Loan growth excluding transfers toheld-for-sale is a measure used by management to evaluate organic loan growth exclusive of loans transferred toheld-for-sale and the netcharge-off ratio excluding charge-offs on loans transferred toheld-for-sale is a measure used by management to evaluate charge-offs exclusive of charge-offs on loans transferred toheld-for-sale. Average core transaction deposits is a measure used by management to evaluate organic growth of deposits and the quality of deposits as a funding source. The cost of interest bearing core deposits is a measure used to evaluate the cost of deposits as a funding source exclusive of brokered deposits andnon-interest bearing deposits. Total adjusted revenues and adjustednon-interest income are measures used by management to evaluate total revenue andnon-interest income exclusive of net investment securities gains/losses and changes in fair value of private equity investments, net, and the Cabela’s transaction fee. Adjustednon-interest expense and the adjusted efficiency ratio are measures utilized by management to measure the success of expense management initiatives focused on reducing recurring controllable operating costs. The tangible common equity ratio and common equity Tier 1 (CET1) ratio (fullyphased-in) are used by management and bank regulators to assess the strength of our capital position. The computations of thenon- GAAP financial measures used in this slide presentation are set forth in the Appendix to this slide presentation.
SYNOVUS
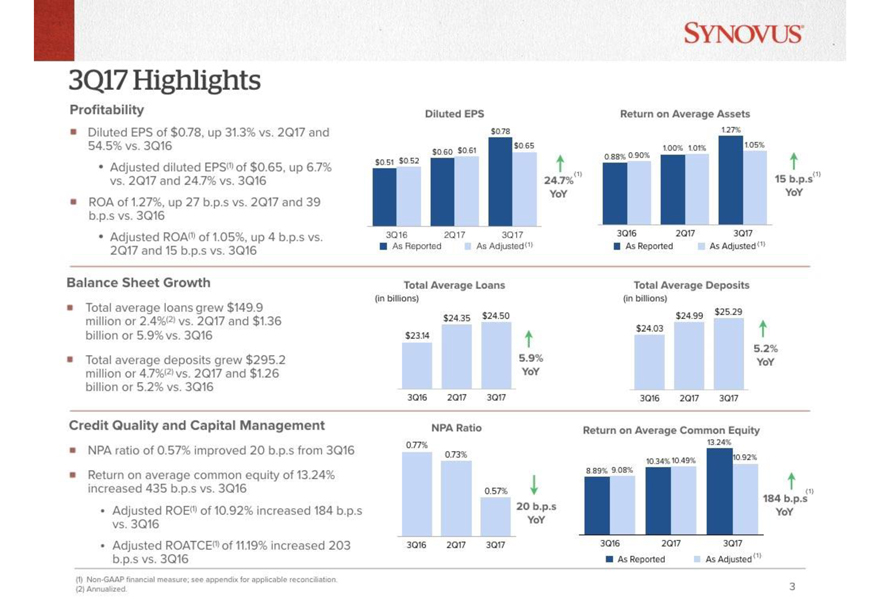
3Q17 Highlights Profitability Diluted EPS of $0.78, up 31.3% vs. 2Q17 and 54.5% vs. 3Q16 Adjusted diluted EPS(1) of $0.65, up 6.7% vs. 2Q17 and 24.7% vs. 3Q16 ROA of 1.27%, up 27 b.p.s vs. 2Q17 and 39 b.p.s vs. 3Q16 Adjusted ROA(1) of 1.05%, up 4 b.p.s vs. 2Q17 and 15 b.p.s vs. 3Q16 Diluted EPS Return on Average Assets Balance Sheet Growth Total average loans grew $149.9 million or 2.4%(2) vs. 2Q17 and $1.36 billion or 5.9% vs. 3Q16 Total average deposits grew $295.2 million or 4.7%(2) vs. 2Q17 and $1.26 billion or 5.2% vs. 3Q16 Credit Quality and Capital Management NPA ratio of 0.57% improved 20 b.p.s from 3Q16 Return on average common equity of 13.24% increased 435 b.p.s vs. 3Q16 Adjusted ROE(1) of 10.92% increased 184 b.p.s vs. 3Q16 Adjusted ROATCE(1) of 11.19% increased 203 b.p.s vs. 3Q16 (1)Non-GAAP financial measure, see appendix for applicable reconciliation. (2) Annualized 3 $0.51 $0.52 $0.60 $0.61 $0.78 $0.65 3Q16 2Q17 3Q17 24.7%(1) YoY As Reported As Adjusted(1) Return on Average Assets 0.88% 0.90% 1.00% 1.01% 1.27% 1.05% 15 b.p.s(1) YoY 3Q16 2Q17 3Q17 As Reported As Adjusted(1) Total Average Loans (in billions) $23.14 $24.35 $24.50 5.9% YoY 3Q16 2Q17 3Q17 Total Average Deposits (in billions) $24.03 $24.99 $25.29 5.2% YoY 3Q16 2Q17 3Q17 NPA Ration 0.77% 0.73% 0.57% 20 b.p.s YoY 3Q16 2Q17 3Q17 Return on Average Common Equity 8.89% 9.08% 10.34% 10.49% 13.24% 10.92% 184 b.p.s YoY 3Q16 2Q17 3Q17 As Reported As Adjusted(1)
3
SYNOVUS
Transaction with World’s Foremost Bank and Capital One
On September 25, 2017, Synovus Bank completed the acquisition of certain assets and assumption of certain liabilities of World’s Foremost Bank (WFB), a wholly-owned subsidiary of Cabela’s Incorporated.
Simultaneous with the above transaction, Synovus Bank sold the credit card assets and related liabilities to Capital One Bank (Capital One), while retaining WFB’s $1.1 billion brokered time deposit portfolio.
The acquired deposits have a weighted average remaining maturity of approximately 2.53 years and a weighted average rate of 1.83%, which represented a discount to market rates of approximately 14 b.p.s as of September 25, 2017.
3Q17non-interest income includes a $75.0 million fee received from Cabela’s and Capital One as part of the transaction.
During the third quarter, concurrent with the transaction, Synovus initiated various balance sheet restructuring actions which will continue into the fourth quarter. These actions are expected to result in over 5% EPS accretion in 2018 through increased net interest income, lower provision expense, and lowernon-interest expense growth.
4
SYNOVUS
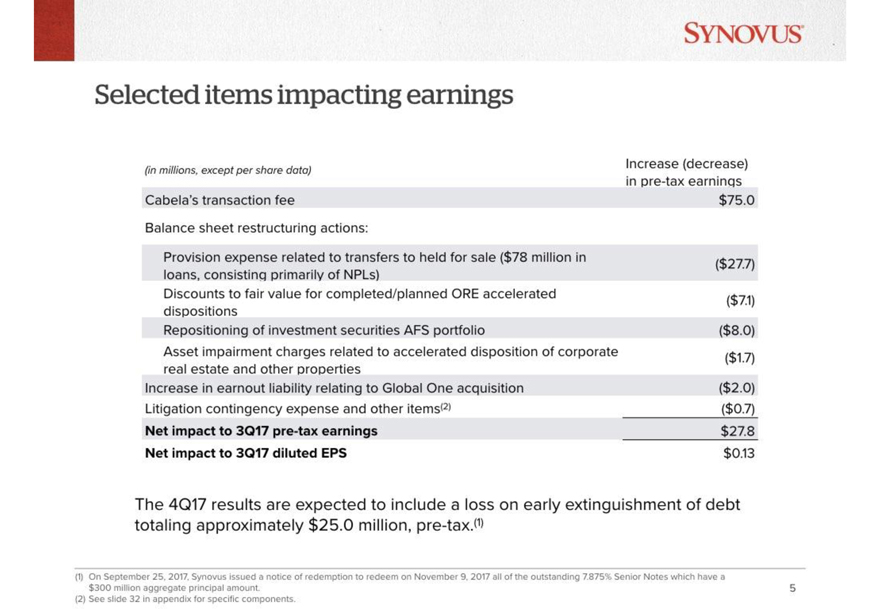
Selected items impacting earnings
(tin millions, except per share data) Increase (decrease)
inpre-tax earnings
Cabela’s transaction fee $75.0 Balance sheet restructuring actions:
Provision expense related to transfers to held for sale ($78 million in ($27.7) loans, consisting primarily of NPLs)
Discounts to fair value for completed/planned ORE accelerated dispositions ($7.1)
Repositioning of investment securities AFS portfolio ($8.0)
Asset impairment charges related to accelerated disposition of corporate ($1.7) real estate and other properties
Increase in earnout liability relating to Global One acquisition ($2.0)
Litigation contingency expense and other items(2) ($0.7)
Net impact to 3Q17pre-tax earnings $27.8
Net impact to 3Q17 diluted EPS $0.13
The 4Q17 results are expected to include a loss on early extinguishment of debt totaling approximately $25.0 million,pre-tax.(1)
(1) On September 25, 2017, Synovus issued a notice of redemption to redeem on November 9, 2017 all of the outstanding 7.875% Senior Notes which have a $300 million aggregate principal amount.
(2) See slide 32 in appendix for specific components.
5
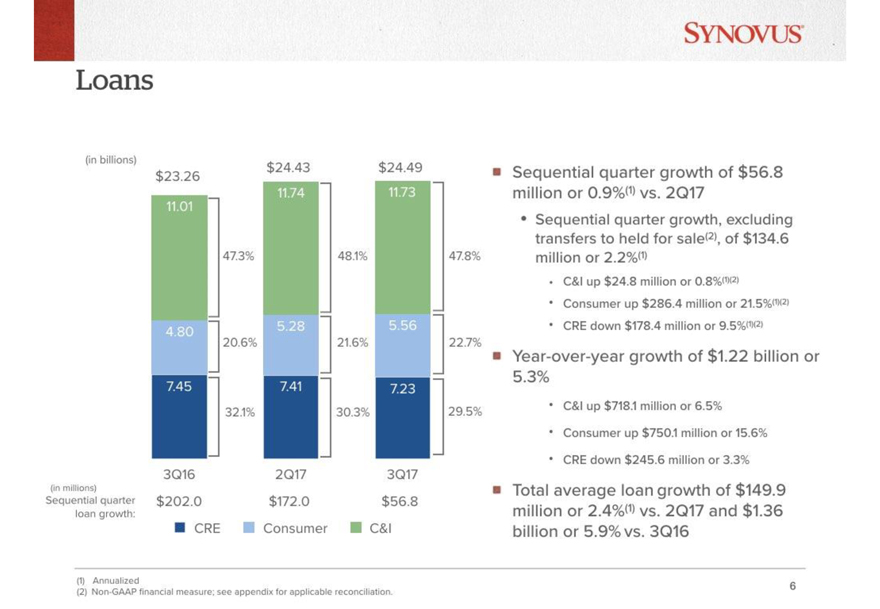
Sequential quarter growth of $56.8 million or 0.9%(1) vs. 2Q17 Sequential quarter growth, excluding transfers to held for sale(2), of $134.6 million or 2.2%(1) C&I up $24.8 million or 0.8%(1)(2) Consumer up $286.4 million or 21.5%(1)(2) CRE down $178.4 million or 9.5%(1)(2) Year-over-year growth of $1.22 billion or 5.3% C&I up $718.1 million or 6.5% Consumer up $750.1 million or 15.6% CRE down $245.6 million or 3.3% Total average loan growth of $149.9 million or 2.4%(1) vs. 2Q17 and $1.36 billion or 5.9% vs. 3Q16 (1) Annualized(2) Non-GAAP financial measure; see appendix for applicable reconciliation. (in billions) $23.26 $24.43 $24.49 11.01 11.74 11.73 47.3% 48.1% 47.8% 4.80 5.28 5.56 20.6% 21.6% 22.7% 7.45 7.41 7.23 32.1% 30.3% 29.5% 3Q16 2Q17 3Q17 (in milions) Sequential quarter loan growth: $202.0 $172.0 $56.8 CRE Consumer C&I 6
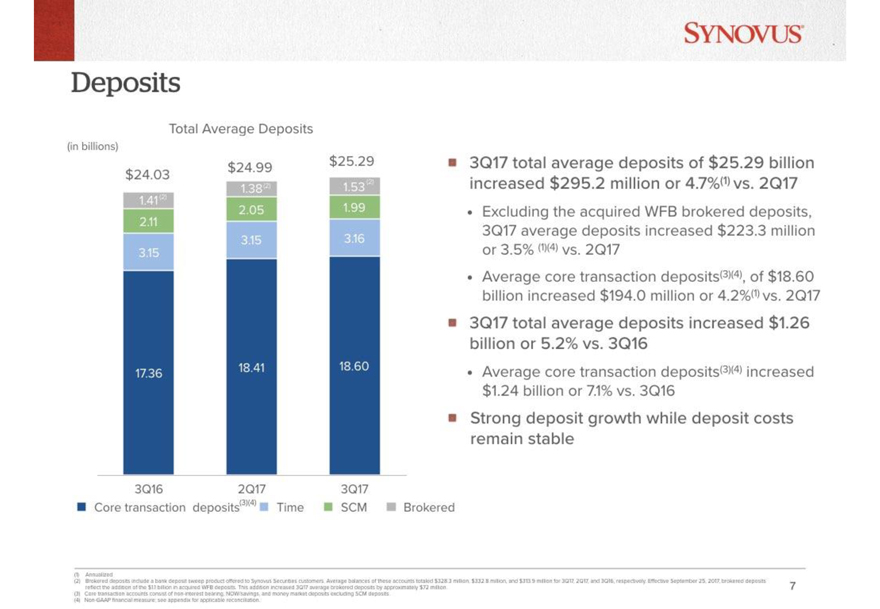
Deposits Total Average Deposits Synovus 3Q17 total average deposits of $25.29 billion increased $295.2 million or 4.7%(1) vs.2Q17 Excluding the acquired WFB brokered deposits, 3Q17 average deposits increased $223.3 million or 3.5%(1)(4) vs. 2Q!7 Average core transaction deposits(3)(4), of $18.60 billion increased $194.0 million or 4.2%(1) vs. 2Q17 3Q17 total average deposits increased $1.26 billion or 5.2% vs. 3Q16 Average core transaction deposits(3)(4) increased $1.24 billion or 7.1% vs. 3Q16 Strong deposits growth while deposit costs remain stable core transaction deposits(3)(4) Time SCM Brokered (1) Annualized (2) Brokered deposits include a bank deposit sweep product offered to synovus Securities customers. Average balances of these accounts totaled $328.3 million $332.8 million and $313.9 million for 3Q16, respectively. Effective September 25, 2017 brokered deposits reflect the addition of the $11 billion in acquired deposits. The addition increased 3Q17 averaged brokered deposits by approximately $72 million (3) Core transaction accounts consists ofnon-interest banning. Now/savings, and money deposits excluding SCM deposits.(4) Non-GAAP financial measure, see appendix for applicable reconciliation. Total Average Deposits (in billions) $24.03 $24.99 $25.29 1.41(2) 1.38(2) 1.53(2) 2.11 2.05 1.99 3.15 3.15 3.16 17.36 18.41 18.60 3Q16 2Q17 3Q17 Core transaction deposits(3)(4) Time SCM Brokered 7
SYNOVUS
Net interest income
(dollars in millions)
$226.0
$251.1
$262.6
3.27%
3.51%
3.63%
3Q16
2Q17
3Q17
Net Interest Income
Net Interest Margin
(1) See slide 18 in the appendix for applicable calculation.
(2) Non-GAAP financial measure; see appendix for applicable reconciliation.
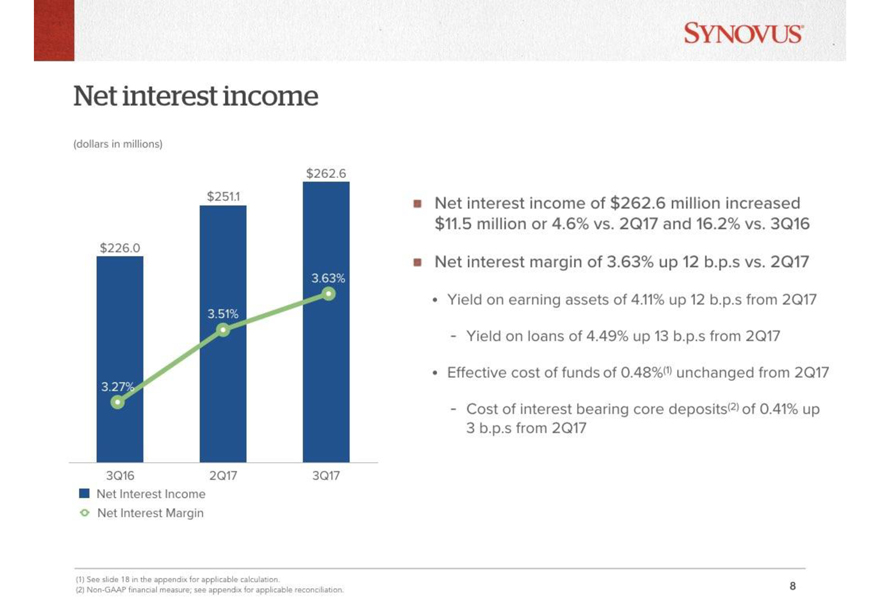
Net interest income of $262.6 million increased $11.5 million or 4.6% vs. 2Q17 and 16.2% vs. 3Q16
Net interest margin of 3.63% up 12 b.p.s vs. 2Q17
Yield on earning assets of 4.11% up 12 b.p.s from 2Q17
Yield on loans of 4.49% up 13 b.p.s from 2Q17
Effective cost of funds of 0.48%(1) unchanged from 2Q17
Cost of interest bearing core deposits(2) of 0.41% up 3 b.p.s from 2Q17
8
SYNOVUS
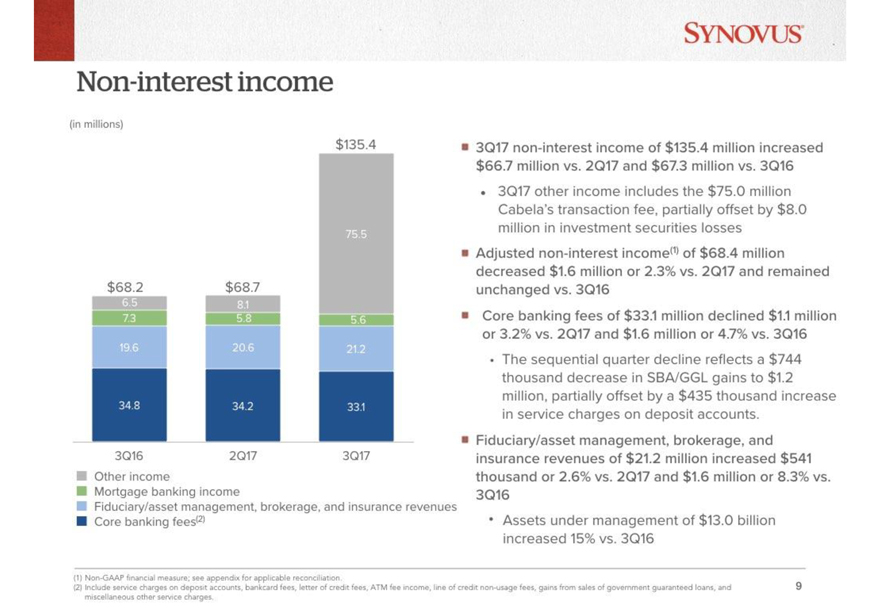
Non-interest income (in millions) $68.2 $68.7 $135.4 6.5 7.3 19.6 34.8 8.1 5.8 20.6 34.2 75.5 5.6 21.2 33.1 3Q16 2Q17 3Q17
Other income Mortgage banking income Fiduciary/asset management, brokerage, and insurance revenues Core banking fees(2)
(1) Non-GAAP financial measure; see appendix for applicable reconciliation. (2) Include service charges on deposit accounts, bankcard fees, letter of credit fees, ATM fee income, line of credit non-usage fees, gains from sales of government guaranteed loans, and miscellaneous other service charges. 3Q17 non-interest income of $135.4 million increased $66.7 million vs. 2Q17 and $67.3 million vs. 3Q16 3Q17 other income includes the $75.0 million Cabela’s transaction fee, partially offset by $8.0 million in investment securities losses Adjusted non-interest income(1) of $68.4 million decreased $1.6 million or 2.3% vs. 2Q17 and remained unchanged vs. 3Q16 Core banking fees of $33.1 million declined $1.1 million or 3.2% vs. 2Q17 and $1.6 million or 4.7% vs. 3Q16
The sequential quarter decline reflects a $744 thousand decrease in SBA/GGL gains to $1.2 million, partially offset by a $435 thousand increase in service charges on deposit accounts. Fiduciary/asset management, brokerage, and insurance revenues of $21.2 million increased $541 thousand or 2.6% vs. 2Q17 and $1.6 million or 8.3% vs. 3Q16
Assets under management of $13.0 billion increased 15% vs. 3Q16
9
Non- interest expense
(dollars in millions)
SYNOVUS
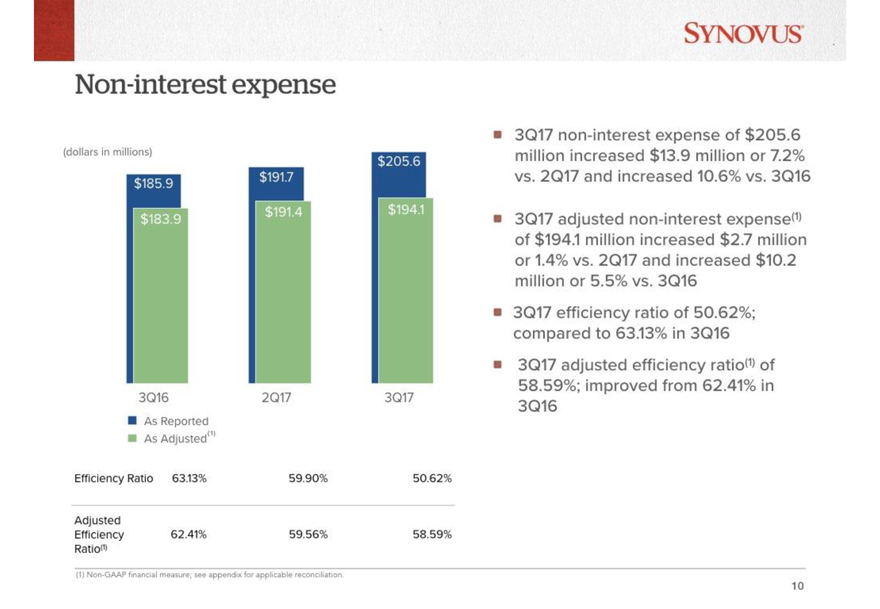
3Q17 non - interest expense of $205.6 million increased $13.9 million or 7.2% vs. 2Q17 and increased 10.6% vs. 3Q16
3Q17 adjusted non - interest expense (1) of $194.1 million increased $2.7 million or 1.4% vs. 2Q17 and increased $10.2 million or 5.5% vs. 3Q16
3Q17 efficiency ratio of 50.62%; compared to 63.13% in 3Q16
3Q17 adjusted efficiency ratio (1) of 58.59%; improved from 62.41% in 3Q16
As Reported
As Adjusted (1)
Efficiency Ratio 63.13% 59.90% 50.62%
Adjusted Efficiency Ratio (1) 62.41% 59.56% 58.59%
(1) Non- GAAP financial measure; see appendix for applicable reconciliation.
$185.9 $183.9 $191.7 $191.4
$205.6 $194.1
10
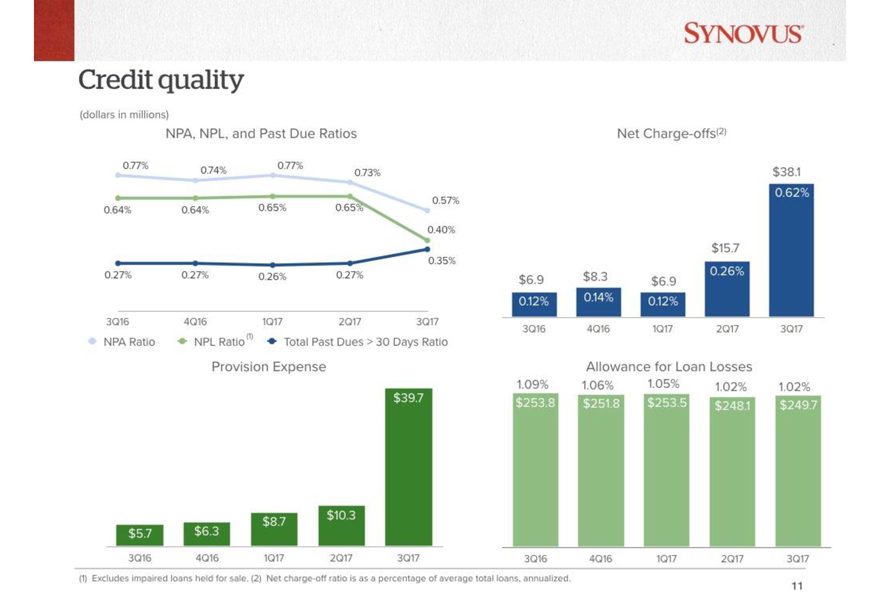
Credit quality
(dollars in million)
NPA, NPL, and Past Due Ratios
0.77% 0.74% 0.77% 0.73% 0.64% 0.64% 0.65% 0.65% 0.27% 0.27% 0.26% 0.27% 0.57% 0.40% 0.35%
3Q16 4Q16 1Q17 2Q17 3Q17
NPA Ratio
NPL Ratio
Total Past Dues > 30 Days Ratio
Provision Expense
SYNOVUS
Net Charges-offs[2]
$6.9 $8.3 $6.9 $15.7 $38.1 0.12% 0.14% 0.12% 0.26% 0.62%
3Q16 4Q16 1Q17 2Q17 3Q17 $5.7 $6.3 $8.7 $10.3 $39.7
3Q16 4Q16 1Q17
2Q17 3Q17
Allowance for Loan Losses 1.09%
1.06% 1.05% 1.02% 1.02% $253.8 $251.8 $253.5 $248.1 $249.7
3Q16 4Q16 1Q17 2Q17 3Q17
(1) Excludes impaired loans held for sale. (2) Netcharge-off ratio is as a percentage of average total loans, annualized.
11
SYNOVUS
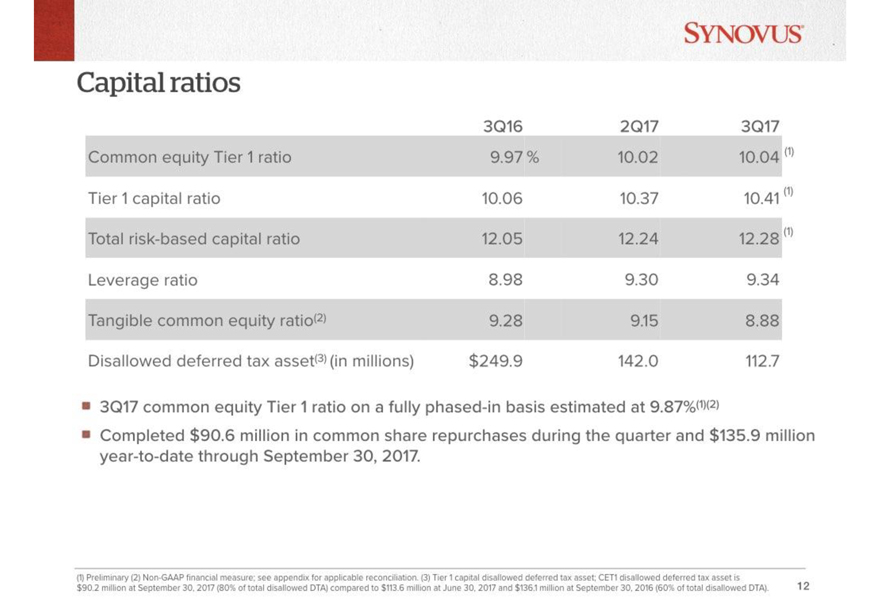
Capital ratios
3Q16 2Q17 3Q17
Common equity Tier 1 ratio 9.97 % 10.02 10.04 (1)
Tier 1 capital ratio 10.06 10.37 10.41(1)
Total risk-based capital ratio 12.05 12.24 12.28 (1)
Leverage ratio 8.98 9.30 9.34
Tangible common equity ratio(2) 9.28 9.15 8.88
Disallowed deferred tax assets(3) (in millions) $249.9 142.0 112.7
3Q17 common equity Tier 1 ratio on a fullyphased-in basis estimated at 9.87%(1)(2)
Completed $90.6 million in common share repurchases during the quarter and $135.9 millionyear-to-date through September 30, 2017.
(1) Preliminary(2) Non-GAAP financial measure: see appendix for applicable reconciliation. (3) Tier 1 capital disallowed deferred tax asset; CET1 disallowed deferred tax asset is $90.2 million at September 30, 2017 (80% of total disallowed DTA) compared to S113.6 million at June 30, 2017 and $136.1 million at September 30, 2016 (60% of total disallowed DTA). 12
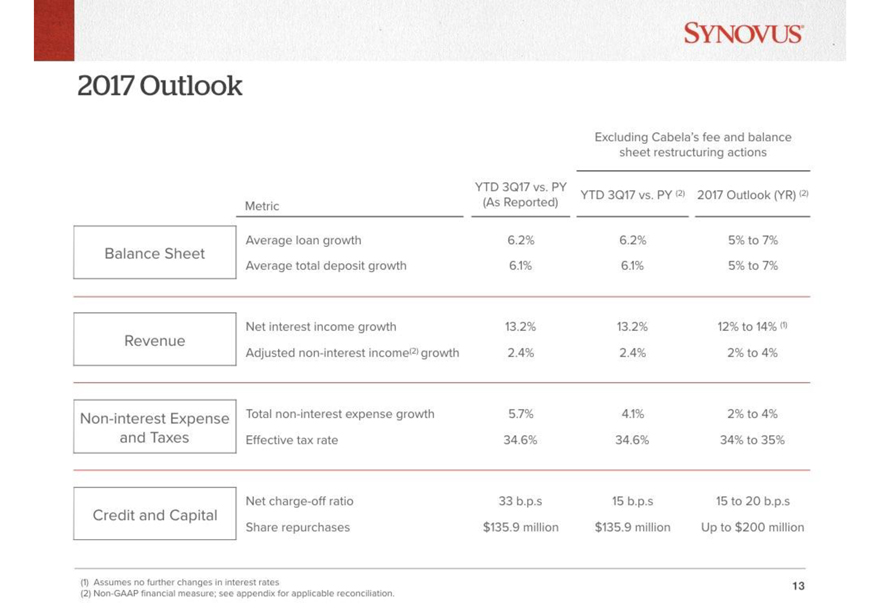
2017 Outlook Excluding Cabela’s fee and balance sheet restructuring actions Metric YTD 3Q17 vs. PY (As Reported)
YTD 3Q17 vs. PY (2) 2017 Outlook (YR) (2) Balance Sheet Average loan growth 6.2% 6.2% 5% to 7%
Average total deposit growth 6.1% 6.1% 5% to 7% Revenue Net interest income growth 13.2% 13.2% 12% to 14% Adjustednon-interest income (2) growth 2.4% 2.4% 2% to 4%Non-interest Expense and Taxes Totalnon-interest expense growth 5.7% 4.1% 2% to 4% Effective tax rate 34.6% 34.6% 34% to 35%
Credit and capital Netcharge-off ratio 33 b.p.s 15p.b.s 15 to 20 b.p.s Share repurchases $135.9 million $135.9 million
Up to $200 million (1) Assumes no further changes in interest rates (2) Non-GAAP financial measure; see appendix for applicable reconciliation 13
Appendix
14
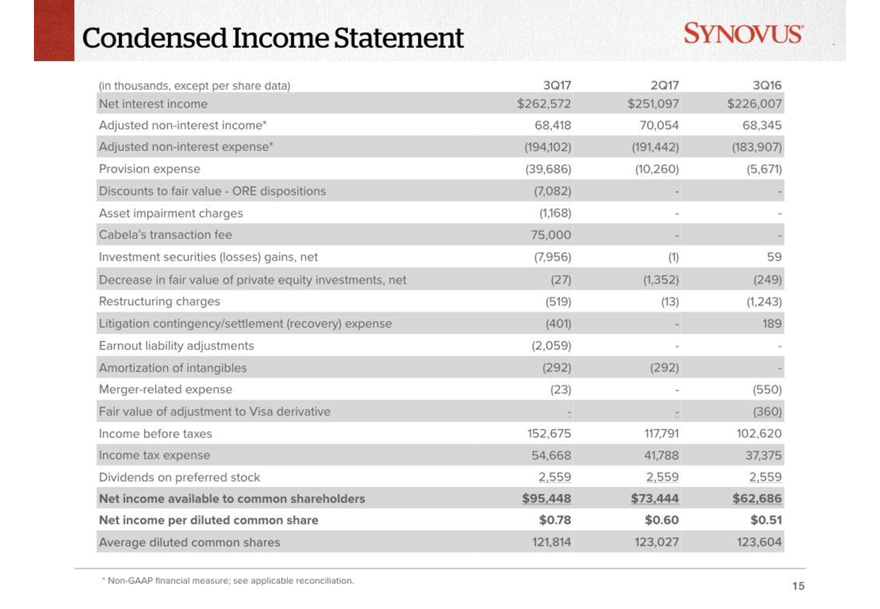
Condensed Income Statement
(In thousands, except per share data) 3Q17 2Q173Q16
Net interest income $262,572 $251,097$226,007
Adjustednon-interest income* 68,418 70,054 68,345
Adjustednon-interest expense* (194,102) (191,442) (183,907)
Provision expense (39,686) (10,260) (5,671)
Discounts to fair value—ORE dispositions (7,082) - -
Asset impairment charges (1,168) - -
Cabela’s transaction fee 75,000 - -
Investment securities (losses) gains, net (7,956) (1) 59
Decrease in fair value of private equity investments, net (27) (1.352) (249)
Restructuring charges (519) (13) (1.243)
Litigation contingency/settlement (recovery) expense (401) - 189
Earnout liability adjustments (2,059) - -
Amortization of intangibles (292) (292) -
Merger-related expense (23) - (550)
Fair value of adjustment to Visa derivative - - (360)
Income before taxes 152,675 117,791 102,620
Income tax expense 54,668 41,788 37,375
Dividends on preferred stock 2,559 2,559 2,559
Net income available to common shareholders $95,448 $73,444 $62,686
Net income per diluted common share $0.78 $0.60 $0.51
Average diluted common shares 121,814 123,027 123,604
*Non-GAAP financial measure; see applicable reconciliation.
15
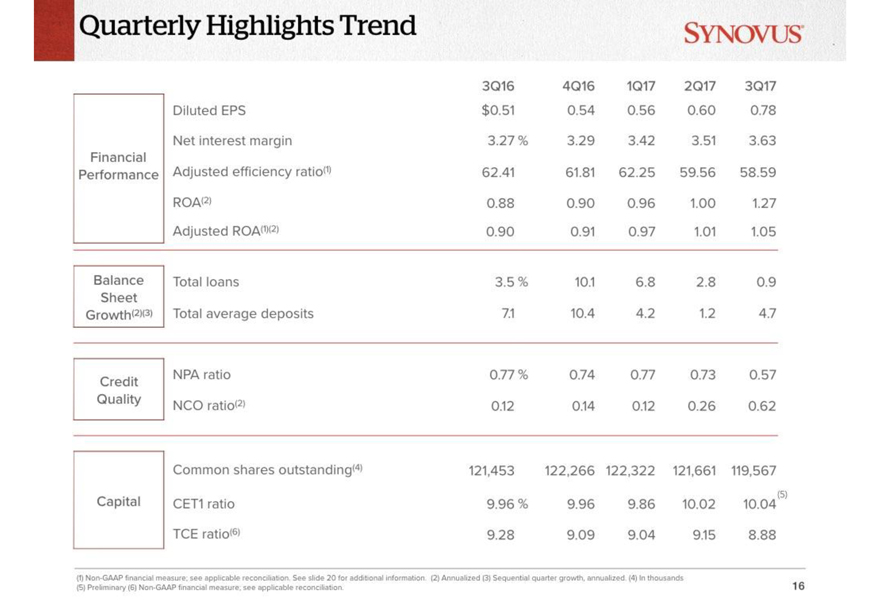
Quarterly Highlights Trend
3Q16 4Q16 1Q17 2Q17 3Q17
Diluted EPS $0.51 0.54 0.56 0.60 0.78
Net interest margin 3.27 % 3.29 3.42 3.51 3.63
Financial
Performance Adjusted efficiency ratio(1) 62.41 61.81 62.25 59.56 58.59
ROA(2) 0.88 0.90 0.96 1.00 1.27
Adjusted ROA(1)(2) 0.90 0.91 0.97 1.01 1.05
Balance Total loans 3.5% 10.1 6.8 2.8 0.9
Sheet
Growth(2)(3) Total average deposits 7.1 10.4 4.2 1.2 4.7
Credit NPA ratio 0.77 % 0.74 0.77 0.73 0.57
Quality NCO ratio(2) 0.12 0.14 0.12 0.26 0.62
Common shares outstanding(4) 121,453 122,266 122,322 121,661 119,567
Capital CET1 ratio 9.96 % 9.96 9.86 10.02 10.04(5)
TCE ratio(6) 9.28 9.09 9.04 9.15 8.88
(1)Non-GAAP financial measure; see applicable reconciliation. See slide 20 for additional information (2) Annualized (3) Sequential quarter growth, annualized (4) In thousands (5) Preliminary(6) Non-GAAP financial measure; see applicable reconciliation.
16
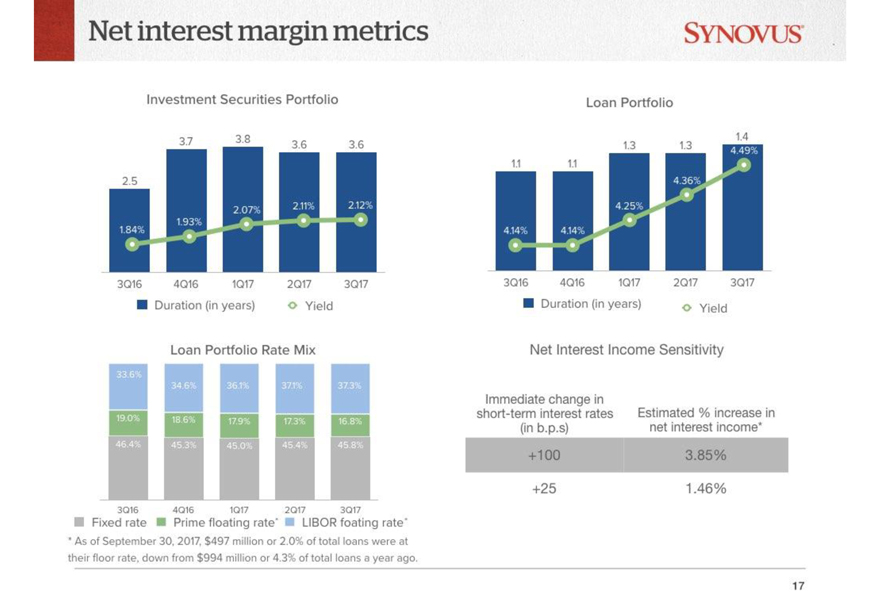
Net interest margin metrics
Investment Securities Portfolio
2.5 1.84% 3Q16 3.7 1.93% 4Q16 3.8 2.07%
1Q17 3.6 2.11% 2Q17 3.6 2.12% 3Q17
Duration (in years) Yield
SYNOVUS Loan Portfolio
1.1 4.14% 3Q16 1.1 4.14% 4Q16 1.3 4.25% 1Q17 1.3 4.36% 2Q17 1.4 4.49% 3Q17
Duration (in years) Yield Loan Portfolio Rate Mix 33.6%
19.0% 46.4% 3Q16 34.6% 18.6% 45.3% 4Q16 36.1% 17.9% 45.0%
1Q17 37.1% 17.3% 45.4%
2Q17 37.3% 16.8% 45.8%
3Q17 Fixed rate Prime floating rate* LIBOR foating rate*
* As of September 30, 2017, $497 million or 2.0% of total loans were at their floor rate, down from $994 million or 4.3% of total loans a year ago Net Interest Income Sensitivity Immediate change in short-term interest rates (in b.p.s) +100 +25 Estimated % increase in net interest income* 3.85%1.46% 17

Effective cost of funds calculation
(dollars in thousands) 3Q16 2Q17 3Q17
Total interest expense $30,547 $34,412 $35,080
Total interest expense, annualized 121,524 138,003 139,176
Total average interest earning assets $27,593,919 $28,741,517 $28,816,967
Effective cost of funds (total interest expense, annualized divided by 0.44% 0.48%0.48%
total average interest earning assets)
18
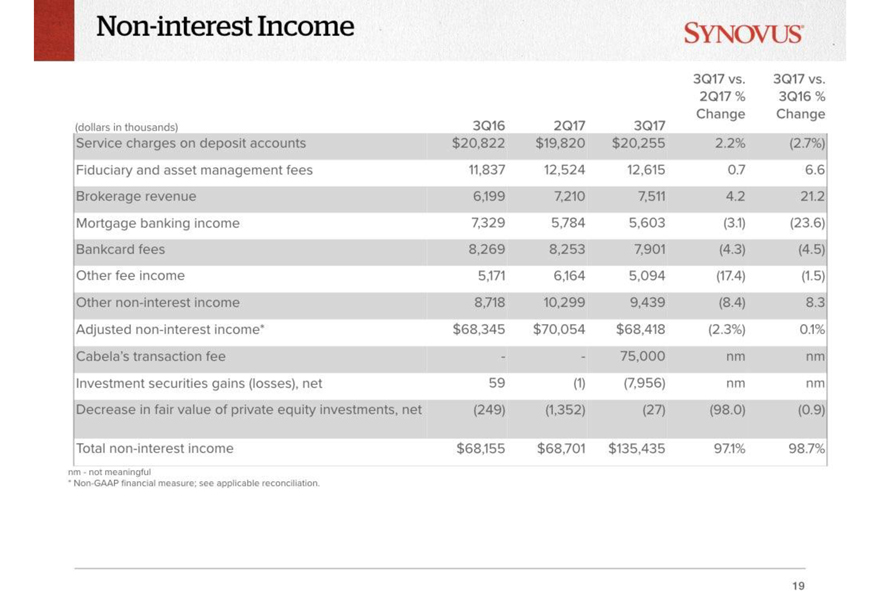
Non-interest Income
3Q17 vs. 3Q17 vs. 2Q17 % 3Q16 %
(dollars in thousands) 3Q16 2Q17 3Q17 Change Change
Service charges on deposit accounts $20,822 $19,820 $20,255 2.2% (2.7%)
Fiduciary and asset management fees 11,837 12,524 12,615 0.7 6.6
Brokerage revenue 6,199 7,210 7,511 4.2 21.2
Mortgage banking income 7,329 5,784 5,603 (3.1) (23.6)
Bankcard fees 8,269 8,253 7,901 (4.3) (4.5)
Other fee income 5,171 6,164 5,094 (17.4) (1.5)
Othernon-interest income 8,718 10,299 9,439 (8.4) 8.3
Adjustednon-interest income* $68,345 $70,054 $68,418 (2.3%) 0.1%
Cabela’s transaction fee - - 75,000 nm nm
Investment securities gains (losses), net 59 (1) (7,956) nm nm
Decrease in fair value of private equity investments, net (249) (1,352) (27) (98.0) (0.9)
Totalnon-interest income $68,155 $68,701 $135,435 97.1% 98.7%
nm - not meaningful
* Non-GAAP financial measure; see applicable reconciliation.
19
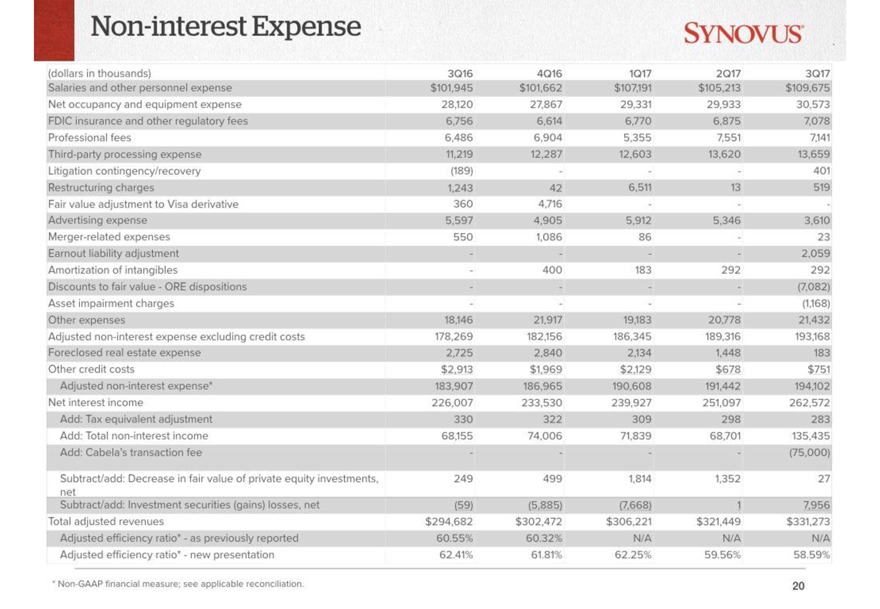
Non-interest Expense (dollars in thousands) Salaries and other personnel expense Net occupancy and equipment expense FDIC insurance and other regulatory fees Professional fees Third-party processing expense Litigation contingency/recovery Restructuring charges Fair value adjustment to Visa derivative Advertising expense Merger-related expenses Earnout liability adjustment Amortization of intangibles Discounts to fair value-ORE dispositions Asset impairment charges Other expenses Adjustednon-interest expense excluding credit costs Foreclosed real estate expense Other credit costs
Adjustednon-interest expense* Net interest income Add: Tax equivalent adjustment Add: Totalnon-interest income Add: Cabela’s transaction fee Subtract/add: Decrease in fair value of private equity investments, net Subtract/add: Investment securities (gains) losses, net Total adjusted revenues Adjusted efficiency ratio*-as previously reported Adjusted efficiency ratio*-new presentation*Non-GAAP financial measure; see applicable reconciliation 3Q16 4Q16 1Q17 2Q17 3Q17 $101,945 $101,662 $107,191 $105,213 $109,675 28,120 27,867 29,331 29,933 30,573 6,756 6,614 6,770 6,875 7,078 6,486 6,904 5,355 7,551 7,141 11,219 12,287 12,603 13,620 13,659 (189) - - - 401 1,243 42 6,511 13 519 360 4,716 - - - 5,597 4,905 5,912 5,346 3,610
550 1,086 86 - 23 - - - - 2,059 - 400 183 292 292 - - - - (7,082) - - - - (1,168) 18,146 21,917 19,183 20,778 21,432 178,269 182,156 186,345 189,316 193,168 2,725 2,840 2,134 1,448 183 $2,913 $1,969 $2,129 $678 $751 183,907 186,965 190,608 191,442 194,102 226,007 233,530 239,927 251,097 262,572 330 322 309 298 283 68,155 74,006 71,839 68,701 135,435 - - - - (75,000) 249 499 1,814 1,352 27 (59) (5,885) (7,668) 1 7,956 $294,682 $302,472 $306,221 $321,449 $331,273
60.55% 60.32% N/A N/A N/A 62.41% 61.81% 62.25% 59.56% 58.59% 20
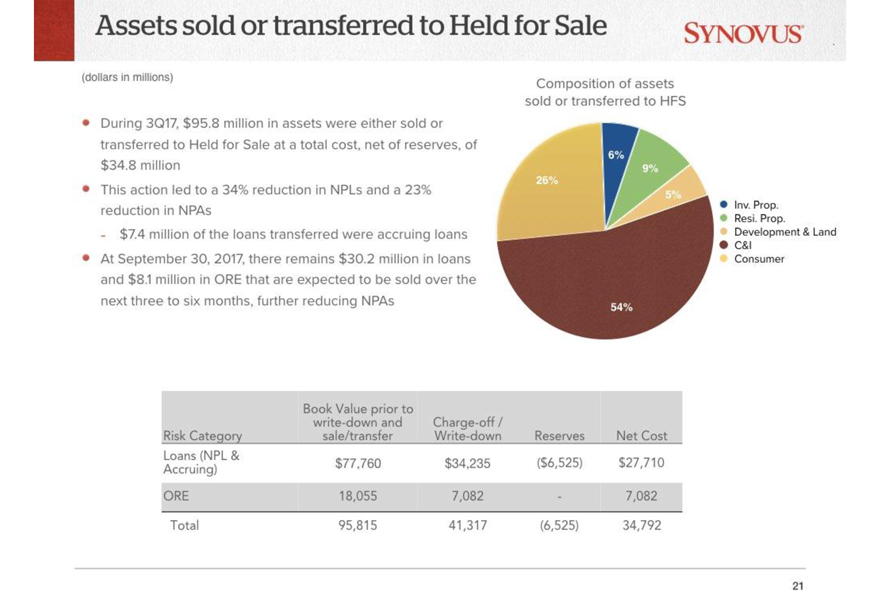
(dollars in millions) (SYNOVUS) Assets sold or transferred to Held for Sale During 3Q17, $95.8 million in assets were either sold or transferred to Held for Sale at a total cost, net of reserves, of $34.8 million This action led to a 34% reduction in NPLs and a 23% reduction in NPAs - $7.4 million of the loans transferred were accruing loans At September 30, 2017, there remains $30.2 million in loans and $8.1 million in ORE that are expected to be sold over the next three to six months, further reducing NPAs Composition of assets sold or transferred to HFS 26% 6% 9% 5% 54% Inv. Prop. Resi. Prop. Development & Land C&I Consumer Risk Category Book Value prior to Write-down and sale/transferCharge-off / Write-down Reserves Net Cost Loans (NPL & Accruing) $77,760 $34,235 ($6,525) $27,710 ORE 18,055 7,082 - 7,082 Total 95,815 41,317 (6,525) 34,792
21
Portfolio Distribution by Type
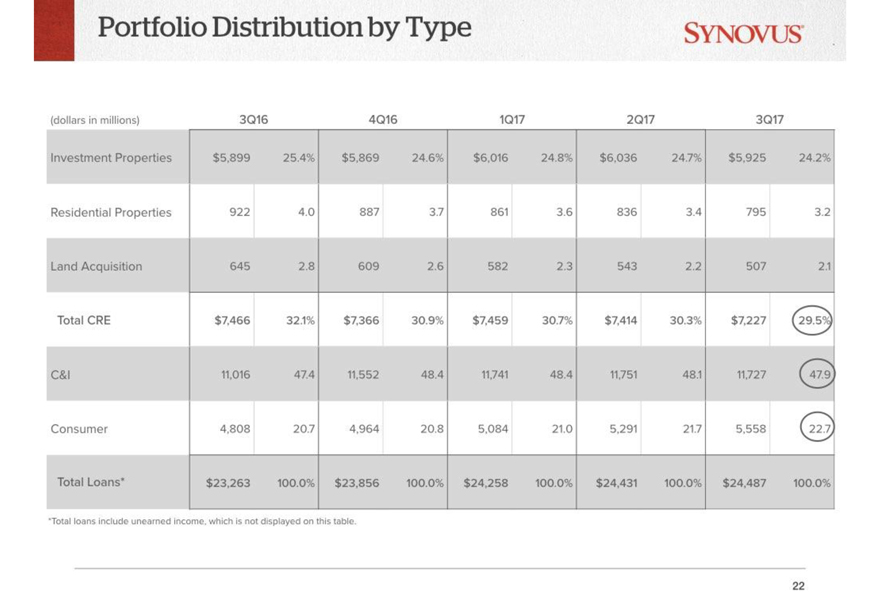
SYNOVUS (dollars in millions) 3Q16 4Q16 1Q17 2Q17 3Q17 Investment Properties $5,899 25.4%
$5,869 24.6% $6,016 24.8% $6,036 24.7% $5,925 24.2% Residential Properties 922 4.0
887 3.7 861 3.6 836 3.4 795 3.2 Land Acquisition 645 2.8 609 2.6 582 2.3 543 2.2 507 2.1
Total CRE $7,466 32.1%
$7,366 30.9%$7,459 30.7% $7,414 30.3% $7,227 29.5% C&I 11,016 47.4 11,552 48.4 11,741 48.4 11,751 48.1 11,727 47.9 Consumer 4,808 20.7 4,964 20.8 5,084 21.0 5,291 21.7 5,558 22.7 Total Loans* $23,263 100.0% $23,856 100.0% $24,258 100.0% $24,431 100.0% $24,487 100.0%*Total loans include unearned income, which is not displayed on this table.
22
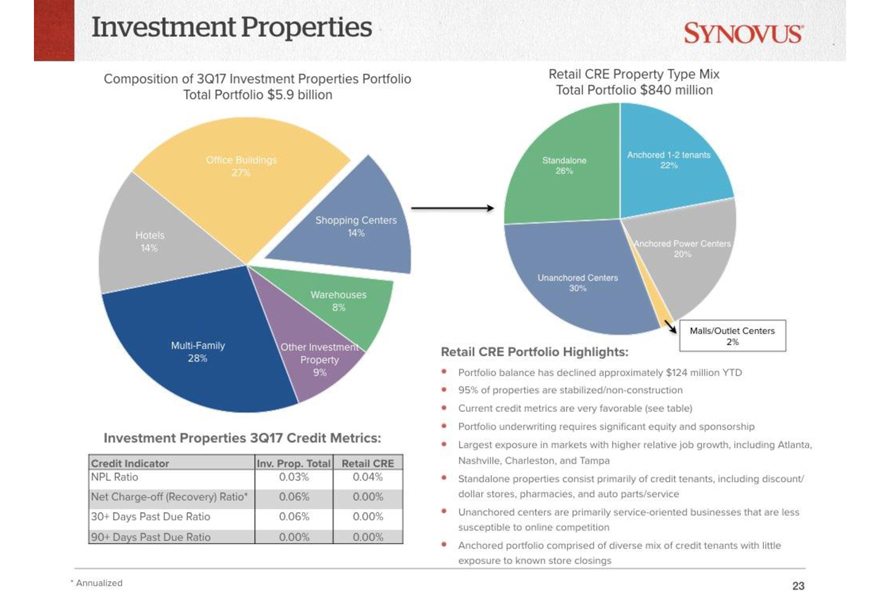
Investment Properties SYNOVUS Composition of 3Q17 Investment Properties Portfolio Total Portfolio $5.9 billion Office Buildings 27% Hotels 14% Multi-Family 28% Other Investment Property 9% Warehouses 8% Shopping Centers 14% Retail CRE Property Type Mix Total Portfolio $840 million Standalone 26% Unanchored Centers 30% Anchored Power Centers 20% Anchored1-2 tenants 22% Malls/Outlet Centers 2% Investment Properties 3Q17 Credit Metrics: Credit Indicator NPL Ratio NetCharge-off (Recovery) Ratio* 30+ Days Past Due Ratio 90+ Days Past Due Ratio Inv. Prop. Total 0.03% 0.06% 0.06% 0.00% Retail CRE 0.04% 0.00% 0.00% 0.00% Retail CRE Portfolio Highlights: Portfolio balance has declined approximately $124 million YND 95% of Properties arestabilized/non-construction Current credit metrics are very favorable (see table) Portfolio underwriting requires significant equity and sponsorship Largest exposure in markets with higher relative job growth, including Atlanta, Nashville, Charleston, and Tampa Standalone properties consist primarily of credit tenants, including discount/dollar stores, pharmacies, and auto parts/service Unanchored centers are primarily service-oriented businesses that are less susceptible to online competition Anchored portfolio comprised of diverse mix of credit tenants with little exposure to known store closings
23
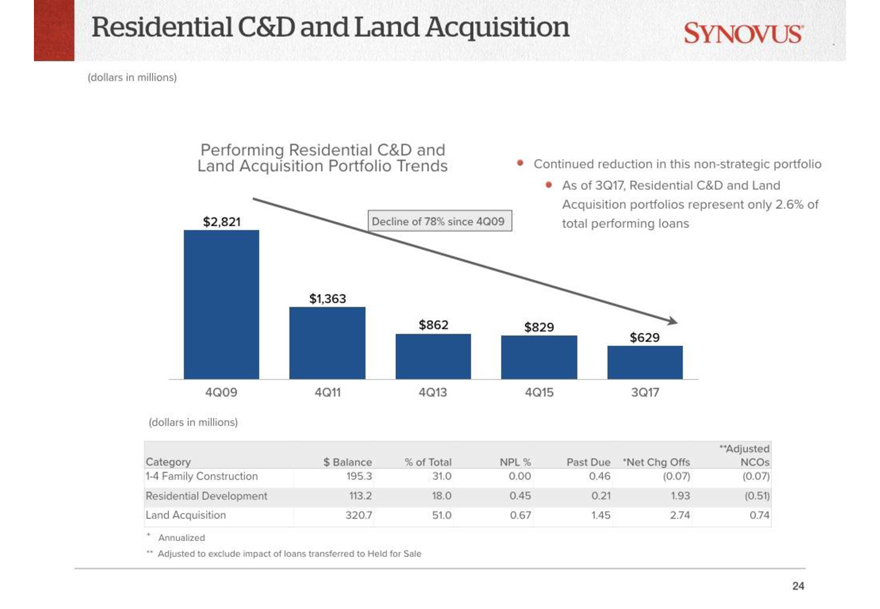
Residential C&D and Land Acquisition SYNOVUS (dollars in millions) Performing Residential C&D and Land Acquisition Portfolio Trends Continued reduction in thisnon-strategic portfolio As of 3Q17, Residential C&D and Land Acquisition portfolios represent only 2.6% total performing loans Decline of 78% since 4Q09 $2,821 $1,363 $862 $829 $629 4Q09 4Q11 4Q13 4Q15 3Q17 (dollars in millions) Category $ Balance % of Total NPL % Past Due *Net Chg Offs “Adjusted NCOs1-4 Family Construction 195.3 31.0 0.00 0.46 (0.07) (0.07) Residential Development 113.2 18.0 0.45 0.21 1.93 (0.51) Land Acquisition 320.7 51.0 0.67 1.45 2.74 0.74 * Annualized ** Adjusted to exclude impact of loans transferred to Hold for Sale 24
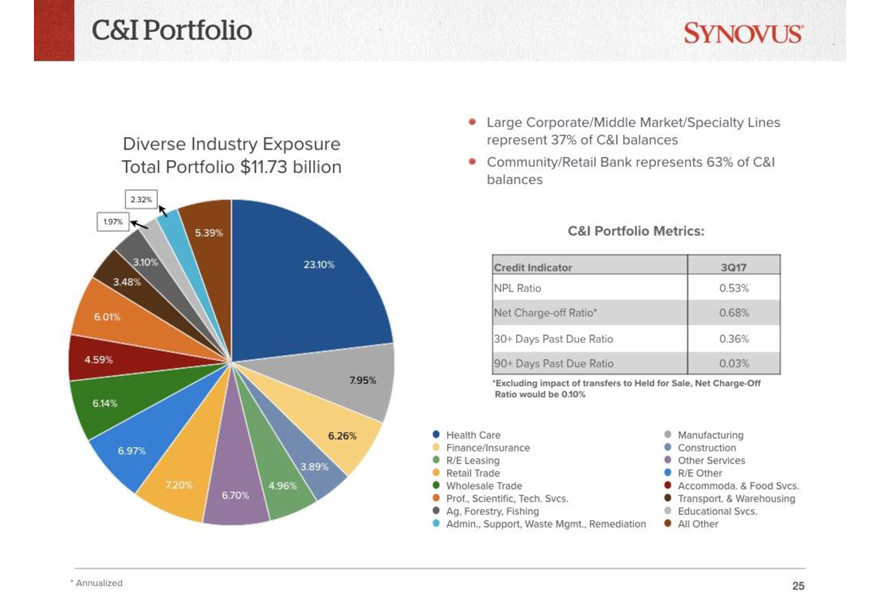
C&I Portfolio Diverse Industry Exposure Total Portfolio $11.73 billion 2.32% 1.97% 3.10% 3.48% 6.01% 4.59% 6.14% 6.97%
7.20% 6.70% 4.96% 3.89% 6.26% 7.95% 23.10% 5.39% SYNOVUS® Large Corporate/Middle Market/Specialty Lines represent 37% of C&I balances Community/Retail Bank represents 63% of C&I balances C&I Portfolio Metrics: Credit Indicator 3Q17 NPL Ratio 0.53% Net Charge-off Ratio* 0.68% 30+ Days Past Due Ratio 0.36% 90+ Days Past Due Ratio 0.03% *Excluding impact of transfers to Held for Sale, Net Charge-Off Ratio would be 0.10% Health Care Finance/Insurance R/E Leasing Retail Trade Wholesale Trade Prof., Scientific, Tech. Svcs. Ag, Forestry, Fishing Admin., Support, Waste Mgmt., Remediation Manufacturing Construction Other Services R/E Other Accommoda. & Food Svcs. Transport. & Warehousing Educational Svcs. All Other
*Annualized
Consumer Portfolio
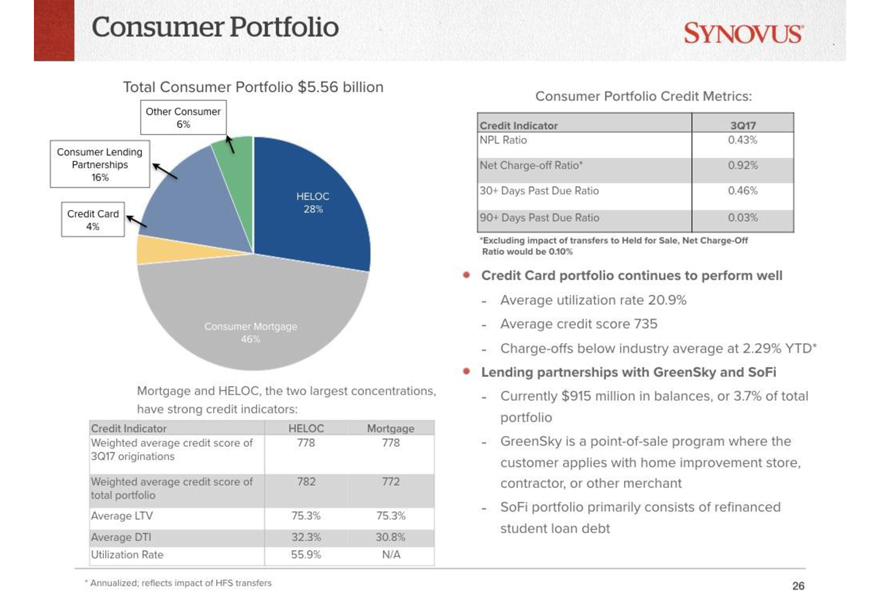
Total Consumer Portfolio $5.56 billion
Other Consumer 6%
Consumer Lending Partnerships 16%
Credit Card 4%
Consumer Mortgage 46%
HELOC 28%
Mortgage and HELOC, the two largest concentrations, have strong credit indicators:
Credit Indicator HELOC Mortgage
Weighted average credit score of 3Q17 originations 778 778
Weighted average credit score of total portfolio 782 772
Average LTV 75.3% 75.3%
Average DTI 32.3% 30.8%
Utilization Rate 55.9% N/A
*Annualized; reflects impact of HFS transfers
SYNOVUS®
Consumer Portfolio Credit Metrics:
Credit Indicator 3Q17
NPL Ratio 0.43%
Net Charge-off Ratio* 0.92%
30+ Days Past Due Ratio 0.46%
90+ Days Past Due Ratio 0.03%
*Excluding impact of transfers to Held for Sale, Net Charge-Off Ratio would be 0.10%
Credit Card portfolio continues to perform well
- Average utilization rate 20.9%
- Average credit score 735
- Charge-offs below industry average at 2.29% YTD*
Lending partnerships with GreenSky and SoFi
- Currently $915 million in balances, or 3.7% of total portfolio
- GreenSky is a point-of-sale program where the customer applies with home improvement store, contractor, or other merchant
- SoFi portfolio primarily consists of refinanced student loan debt 26
portfolio risk Distribution synovus
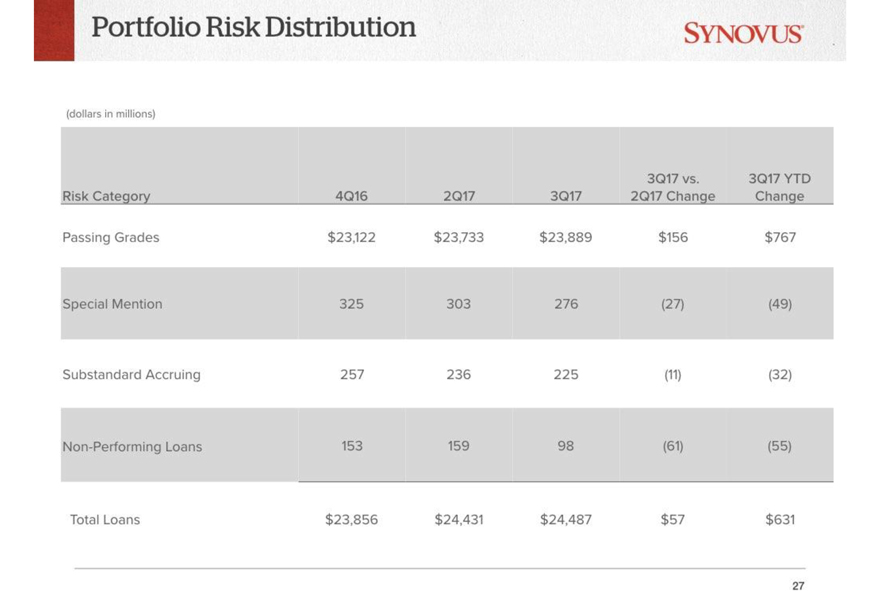
(dollars in millions)
Risk Category 4Q16 2Q17 3Q17 3Q17 vs. 2Q17 Change 3Q17 YTD Change
Passing Grades $23,122 $23,733 $23,889 $156 $767
Special Mention 325 303 276 (27) (49)
Substandard Accruing 257 236 225 (11) (32)
Non-Performing Loans 153 159 98 (61) (55)
Total Loans
$23,856 $24,431 $24,487 $57 $631
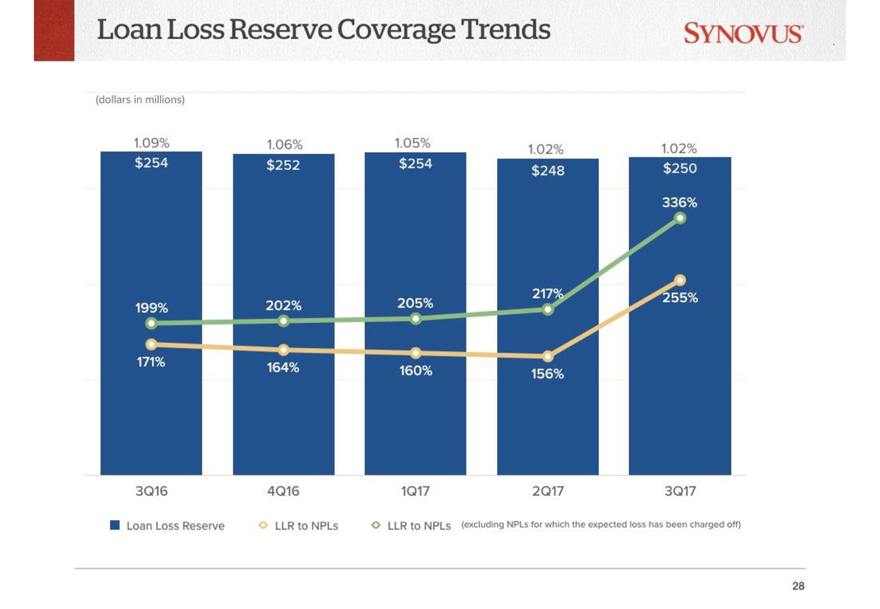
Loan Loss Reserve Coverage Trends SYNOVUS®
(dollars in millions)
1.09% 1.06% 1.05% 1.02% 1.02%
$254 $252 $254 $248 $250
199% 202% 205% 217% 336%
171% 164% 160% 156% 255%
3Q16 4Q16 1Q17 2Q17 3Q17
Loan Loss Reserve
LLR to NPLs
LLR to NPLs (excluding NPLs for which the expected loss has been charged off) 28
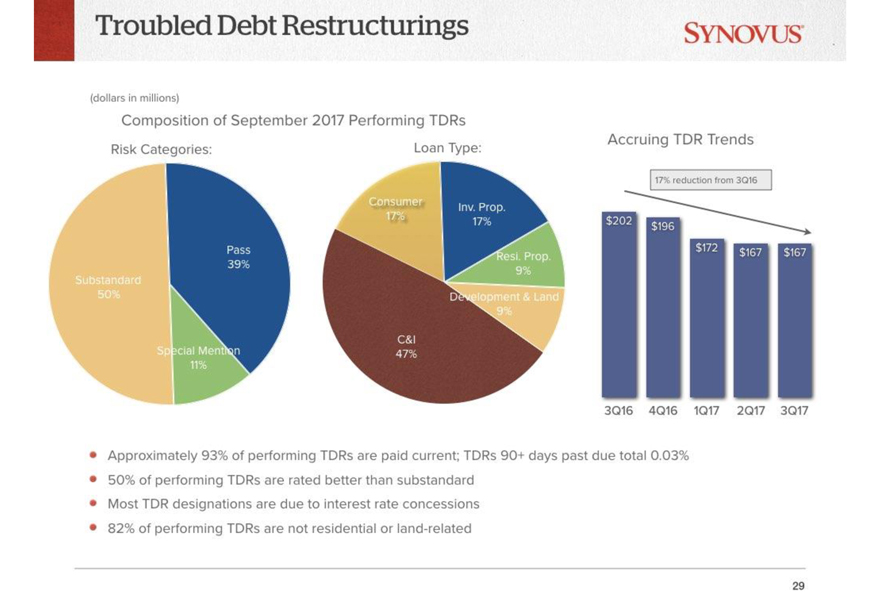
Troubled Debt Restructurings SYNOVUS®
(dollars in millions)
Composition of September 2017 Performing TDRs
Risk Categories: Loan Type:
Substandard 50% Consumer 17%
Pass 39% Inv. Prop. 17%
Special Mention 11% Resi. Prop. 9%
Development & Land 9%
C&I 47%
Accruing TDR Trends
17% reduction from 3Q16
$202 $196 $172 $167 $167
3Q16 4Q16 1Q17 2Q17 3Q17
Approximately 93% of performing TDRs are paid current; TDRs 90+ days past due total 0.03%
50% of performing TDRs are rated better than substandard
Most TDR designations are due to interest rate concessions
82% of performing TDRs are not residential or land-related 29
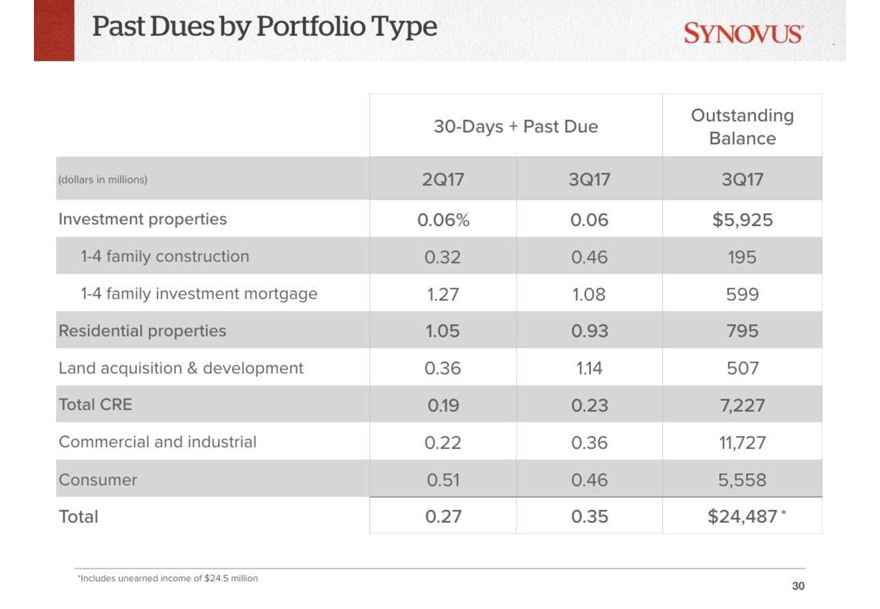
Past Dues by Portfolio Type SYNOVUS
30-Days + Past Due Outstanding
Balance
(dollars in millions) 2Q17 3Q17 3Q17
Investment properties 0.06% 0.06 $5,925
1-4 family construction 0.32 0.46 195
1-4 family investment mortgage 1.27 1.08 599
Residential properties 1.05 0.93 795
Land acquisition & development 0.36 1.14 507
Total CRE 0.19 0.23 7,227
Commercial and industrial 0.22 0.36 11,727
Consumer 0.51 0.46 5,558
Total 0.27 0.35 $24,487*
*Includes unearned income of $24.5 million
30
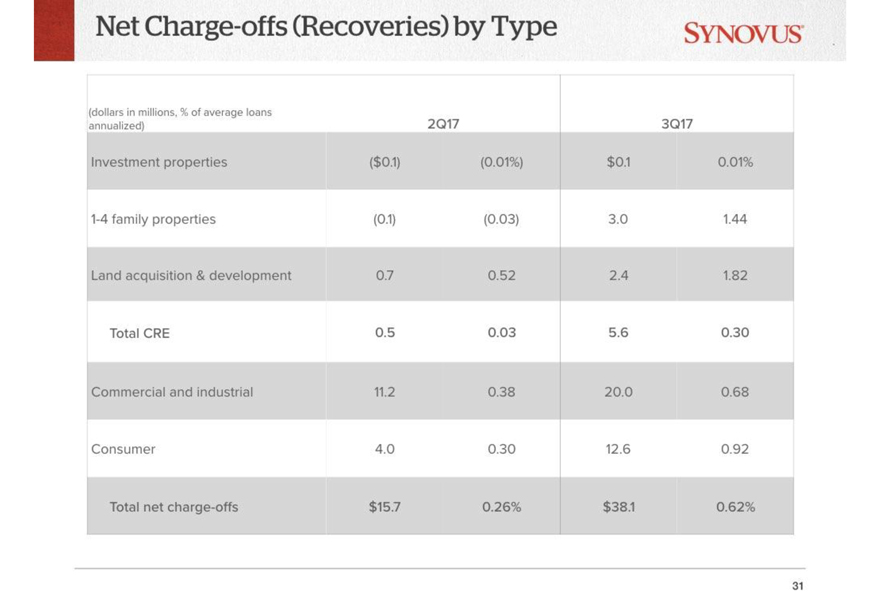
Net Charge-offs (Recoveries) by Type SYNOVUS
(dollars in millions, % of average loans annualized) 2Q17 3Q17
Investment properties ($0.1) (0.01%) $0.1 0.01%
1-4 family properties (0.1) (0.03) 3.0 1.44
Land acquisition & development 0.7 0.52 2.4 1.82
Total CRE 0.5 0.03 5.6 0.30
Commercial and industrial 11.2 0.38 20.0 0.68
Consumer 4.0 0.30 12.6 0.92
Total net charge-offs $15.7 0.26% $38.1 0.62%
31
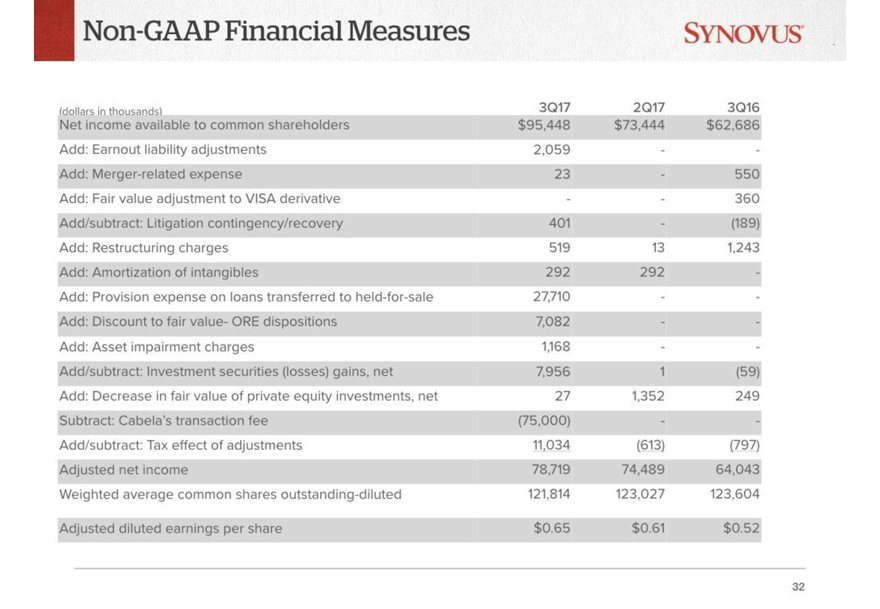
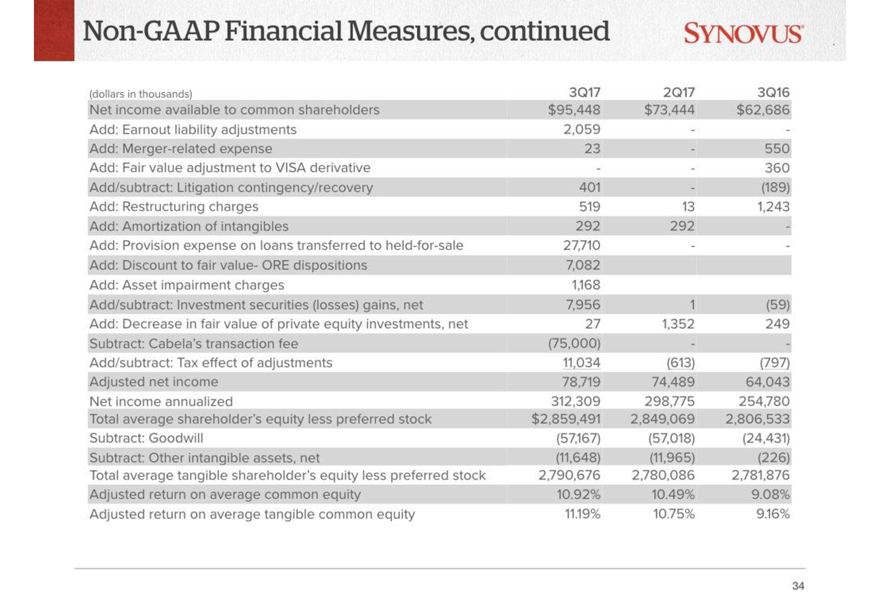
Non-GAAP Financial Measures SYNOVUS
(dollars in thousands) 3Q17 2Q17 3Q16
Net income available to common shareholders $95,448 $73,444 $62,686
Add: Earnout liability adjustments 2,059 - -
Add: Merger-related expense 23 - 550
Add: Fair value adjustment to VISA derivative - - 360
Add/subtract: Litigation contingency/recovery 401 - (189)
Add: Restructuring charges 519 13 1,243
Add: Amortization of intangibles 292 292 -
Add: Provision expense on loans transferred toheld-for-sale 27,710 - -
Add: Discount to fair value- ORE dispositions 7,082 - -
Add: Asset impairment charges 1,168 - -
Add/subtract: Investment securities (losses) gains, net 7,956 1 (59)
Add: Decrease in fair value of private equity investments, net 27 1,352 249
Subtract: Cabela’s transaction fee (75,000) - -
Add/subtract: Tax effect of adjustments 11,034 (613) (797)
Adjusted net income 78,719 74,489 64,043
Weighted average common shares outstanding-diluted 121,814 123,027 123,604
Adjusted diluted earnings per share $0.65 $0.61 $0.52
32
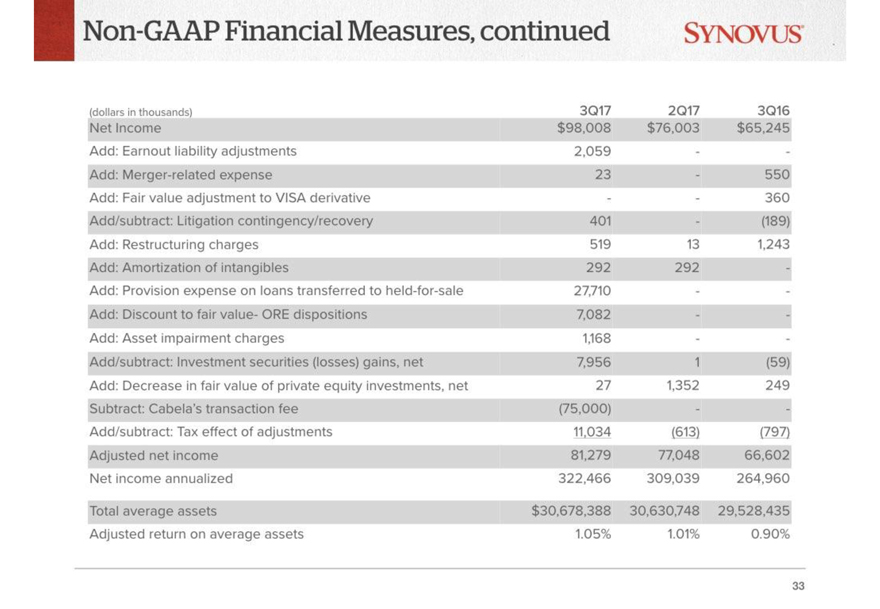
Non-GAAP Financial Measures, continued
SYNOVUS
(dollars in thousands) 3Q17 2Q17 3Q16
Net Income $98,008 $76,003 $65,245
Add: Earnout liability adjustments 2,059 - -
Add: Merger-related expense 23 - 550
Add: Fair value adjustment to VISA derivative - - 360
Add/subtract: Litigation contingency/recovery 401 - (189)
Add: Restructuring charges 519 13 1,243
Add: Amortization of intangibles 292 292 -
Add: Provision expense on loans transferred toheld-for-sale 27,710 - -
Add: Discount to fair value- ORE dispositions 7,082 - -
Add: Asset impairment charges 1,168 - -
Add/subtract: Investment securities (losses) gains, net 7,956 1 (59)
Add: Decrease in fair value of private equity investments, net 27 1,352 249
Subtract: Cabela’s transaction fee (75,000) - -
Add/subtract: Tax effect of adjustments 11,034 (613) (797)
Adjusted net income 81,279 77,048 66,602
Net income annualized 322,466 309,039 264,960
Total average assets $30,678,388 30,630,748 29,528,435
Adjusted return on average assets 1.05% 1.01% 0.90%
Non-GAAP Financial Measures, continued SYNOVUS
(dollars in thousands) 3Q17 2Q17 3Q16
Net income available to common shareholders $95,448 $73,444 $62,686
Add: Earnout liability adjustments 2,059 - -
Add: Merger-related expense 23 - 550
Add: Fair value adjustment to VISA derivative - - 360
Add/subtract: Litigation contingency/recovery 401 - (189)
Add: Restructuring charges 519 13 1,243
Add: Amortization of intangibles 292 292 -
Add: Provision expense on loans transferred toheld-for-sale 27,710 - -
Add: Discount to fair value- ORE dispositions 7,082
Add: Asset impairment charges 1,168
Add/subtract: Investment securities (losses) gains, net 7,956 1 (59)
Add: Decrease in fair value of private equity investments, net 27 1,352 249
Subtract: Cabela’s transaction fee (75,000) - -
Add/subtract: Tax effect of adjustments 11,034 (613) (797)
Adjusted net income 78,719 74,489 64,043
Net income annualized 312,309 298,775 254,780
Total average shareholder’s equity less preferred stock $2,859,491 2,849,069 2,806,533
Subtract: Goodwill (57,167) (57,018) (24,431)
Subtract: Other intangible assets, net (11,648) (11,965) (226)
Total average tangible shareholder’s equity less preferred stock 2,790,676 2,780,086 2,781,876
Adjusted return on average common equity 10.92% 10.49% 9.08%
Adjusted return on average tangible common equity 11.19% 10.75% 9.16%
34
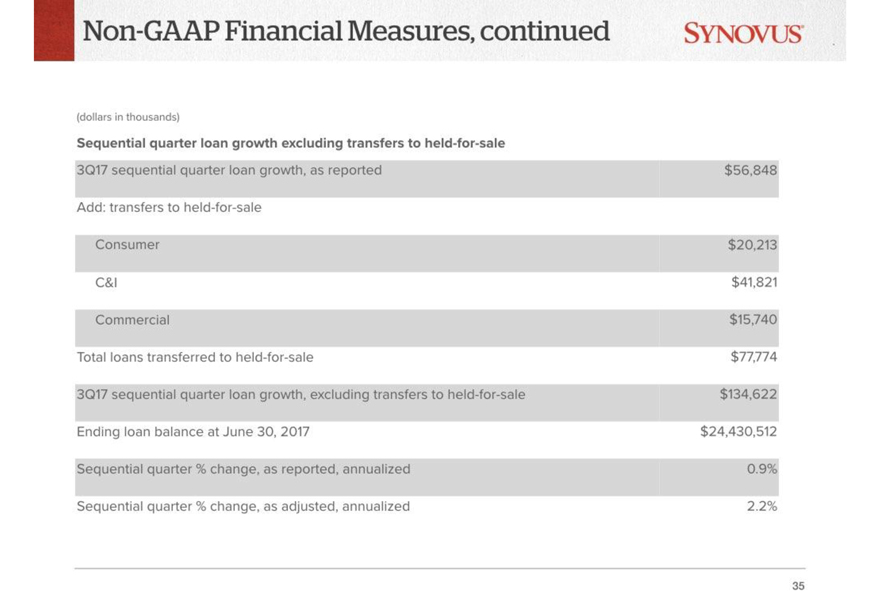
Non-GAAP Financial Measures, continued SYNOVUS
(dollars in thousands) Sequential quarter loan growth excluding transfers toheld-for-sale 3Q17 sequential quarter loan growth, as reported $56,848 Add: transfers toheld-for-sale Consumer $20,213 C&l $41,821 Commercial $15,740 Total loans transferred toheld-for-sale $77,774 3Q17 sequential quarter loan growth, excluding transfers toheld-for-sale $134,622 Ending loan balance at June 30, 2017 $24,430,512 Sequential quarter % change, as reported, annualized 0.9% Sequential quarter % change, as adjusted, annualized 2.2% 35
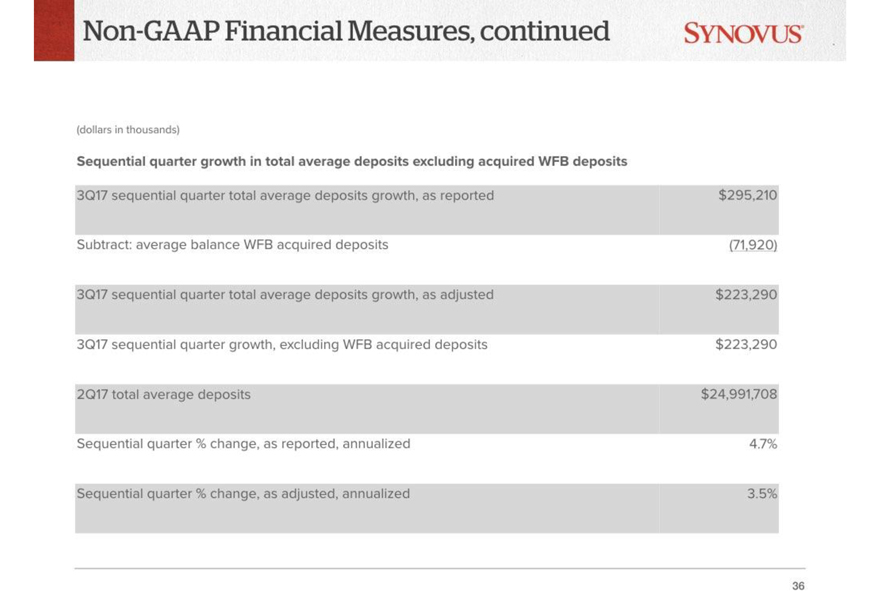
Non-GAAP Financial Measures, continued SYNOVUS
(dollars in thousands)
Sequential quarter growth in total average deposits excluding acquired WFB deposits
3Q17 sequential quarter total average deposits growth, as reported $295,210
Subtract: average balance WFB acquired deposits (71,920)
3Q17 sequential quarter total average deposits growth, as adjusted $223,290
3Q17 sequential quarter growth, excluding WFB acquired deposits $223,290
2Q17 total average deposits $24,991,708
Sequential quarter % change, as reported, annualized 4.7%
Sequential quarter % change, as adjusted, annualized 3.5%
36
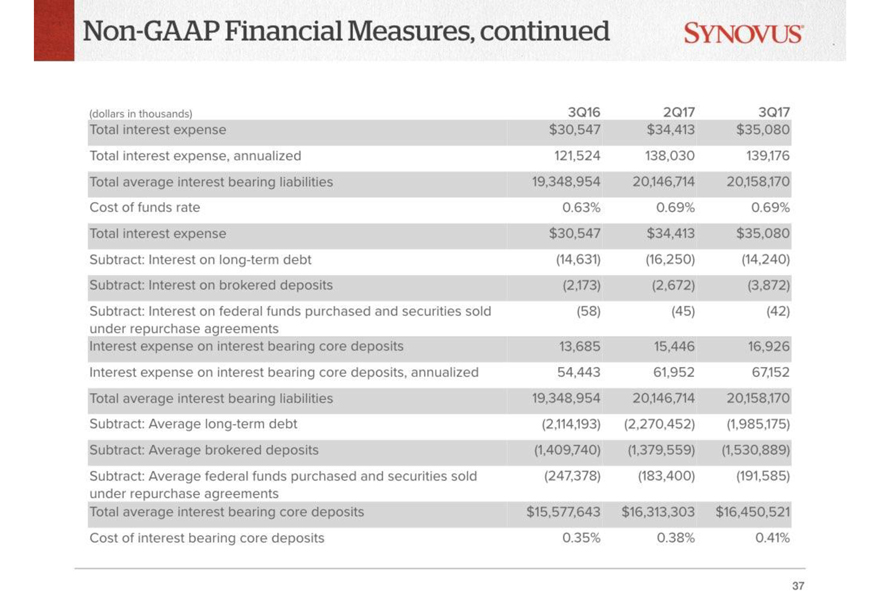
Non-GAAP Financial Measures, continued (dollars in thousands) 3Q16 2Q17 3Q17 SYNOVUS
Total interest expense $30,547 $34,413 $35,080
Total interest expense, annualized 121,524 138,030 139,176
Total average interest bearing liabilities 19,348,954 20,146,714 20,158,170
Cost of funds rate 0.63% 0.69% 0.69%
Total interest expense $30,547 $34,413 $35,080
Subtract: Interest on long-term debt (14,631) (16,250) (14,240)
Subtract: Interest on brokered deposits (2,173) (2,672) (3,872)
Subtract: Interest on federal funds purchased and securities sold under repurchase agreements (58) (45) (42)
Interest expense on interest bearing core deposits 13,685 15,446 16,926
Interest expense on interest bearing core deposits, annualized 54,443 61,952 67,152
Total average interest bearing liabilities 19,348,954 20,146,714 20,158,170
Subtract: Average long-term debt (2,114,193) (2,270,452) (1,985,175)
Subtract: Average brokered deposits (1,409,740) (1,379,559) (1,530,889)
Subtract: Average federal funds purchased and securities sold under repurchase agreements (247,378) (183,400) (191,585)
Total average interest bearing core deposits $15,577,643 $16,313,303 $16,450,521
Cost of interest bearing core deposits 0.35% 0.38% 0.41%
37
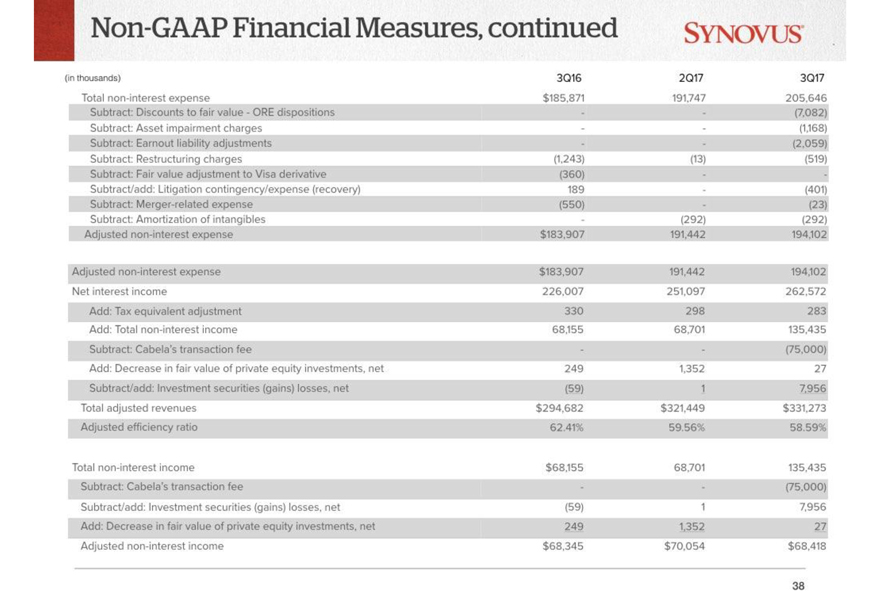
Non-GAAP Financial Measures, continued SYNOVUS (in thousands) 3Q16 2Q17 3Q17 Totalnon-interest expense $185,871 191,747 205,646 Subtract: Discounts to fair value - ORE dispositions - - (7,082) Subtract: Asset impairment charges - - (1,168) Subtract: Earnout liability adjustments - - (2,059) Subtract: Restructuring charges (1,243) (13) (519) Subtract: Fair value adjustment to Visa derivative (360) - - Subtract/add: Litigation contingency/expense (recovery) 189 - (401) Subtract: Merger-related expense (550) - (23) Subtract: Amortization of intangibles - (292) (292) Adjustednon-interest expense $183,907 191,442 194,102 Adjustednon-interest expense $183,907 191,442 194,102 Net interest income 226,007 251,097 262,572 Add: Tax equivalent adjustment 330 298 283 Add: Totalnon-interest income 68,155 68,701 135,435 Subtract: Cabela’s transaction fee - - (75,000) Add: Decrease in fair value of private equity investments, net 249 1,352 27 Subtract/add: Investment securities (gains) losses, net (59) 1 7,956 Total adjusted revenues $294,682 $321,449 $331,273 Adjusted efficiency ratio 62.41% 59.56% 58.59%
Totalnon-interest income $68,155 68,701 135,435
Subtract: Cabela’s transaction fee - (75,000)
Subtract/add: Investment securities (gains) losses, net (59) 1 7,956
Add: Decrease in fair value of private equity investments, net 249 1,352 27
Adjustednon-interest income $68,345 $70,054 $68,418
38
Non-GAAP Financial Measures, continued SYNOVUS
(dollars in thousands)
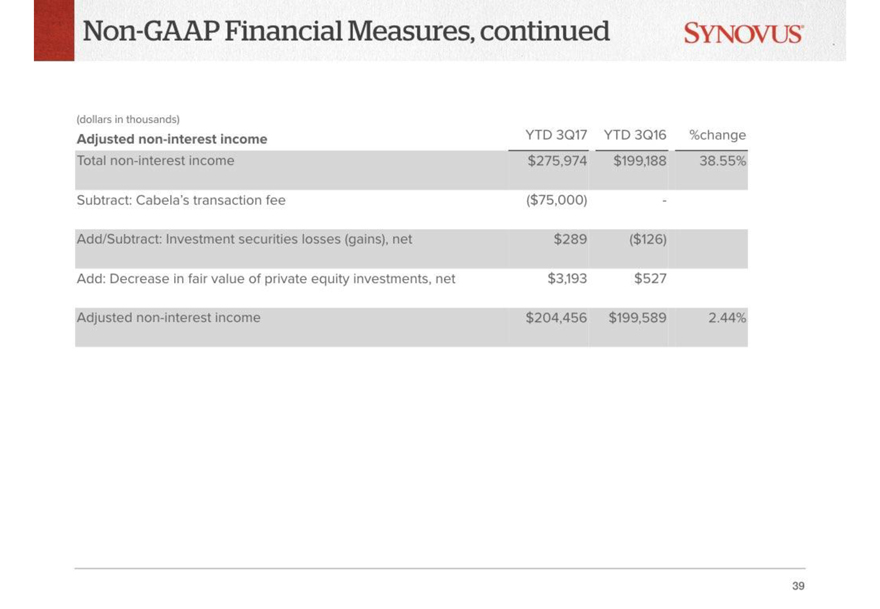
Adjustednon-interest income YTD 3Q17 YTD 3Q16 %change
Totalnon-interest income $275,974 $199,188 38.55%
Subtract: Cabela’s transaction fee ($75,000) -
Add/Subtract: Investment securities losses (gains), net $289 ($126)
Add: Decrease in fair value of private equity investments, net $3,193 $527
Adjustednon-interest income $204,456 $199,589 2.44%
39
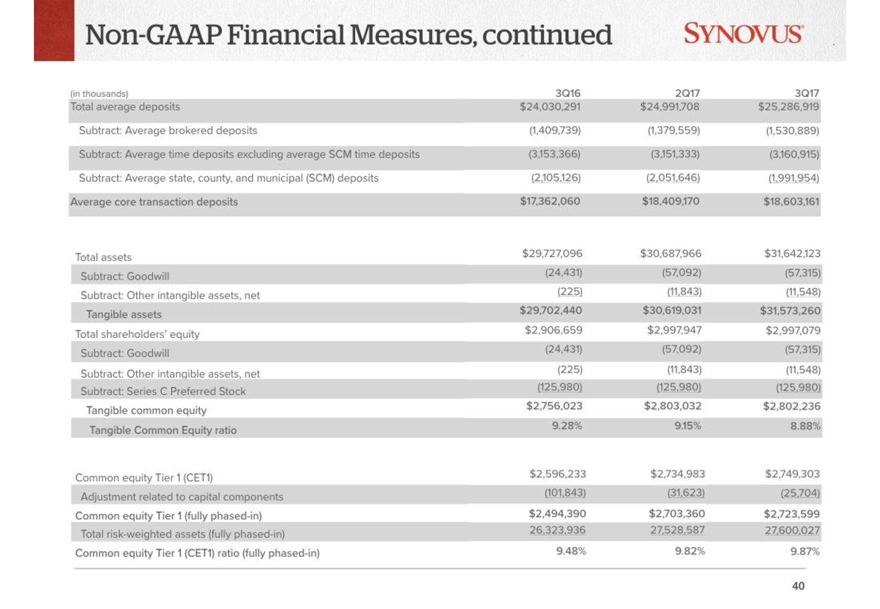
Non-GAAP Financial Measures, continued (in thousands) 3Q16 2Q17 3Q17 Total average deposits $24,030,291 $24,991,708 $25,286,919 Subtract: Average brokered deposits (1,409,739) (1,379,559) (1,530,889) Subtract: Average time deposits excluding average SCM time deposits (3,153,366) (3,151,333) (3,160,915) Subtract: Average state, county, and municipal (SCM) deposits (2,105,126) (2,051,646) (1,991,954) Average core transaction deposits $17,362,060 $18,409,170 $18,603,161
Total assets $29,727,096 $30,687,966 $31,642,123 Subtract: Goodwill (24,431) (57,092) (57,315) Subtract: Other intangible assets, net (225) (11,843) (11,548) Tangible assets $29,702,440 $30,619,031 $31,573,260 Total shareholders’ equity $2,906,659 $2,997,947 $2,997,079 Subtract: Goodwill (24,431) (57,092) (57,315) Subtract: Other intangible assets, net (225) (11,843) (11,548) Subtract: Series C Preferred Stock (125,980) (125,980) (125,980) Tangible common equity $2,756,023 $2,803,032 $2,802,236 Tangible Common Equity ratio 9.28% 9.15% 8.88% Common equity Tier 1 (CET1) $2,596,233 $2,734,983 $2,749,303 Adjustment related to capital components (101,843) (31,623) (25,704) Common equity Tier 1 (fullyphased-in) $2,494,390 $2,703,360 $2,723,599 Total risk-weighted assets (fullyphased-in) 26,323,936 27,528,587 27,600,027
Common equity Tier 1 (CET1) ratio (fullyphased-in) 9.48% 9.82% 9.87% 40
Non-GAAP Financial Measures, continued (in thousands)
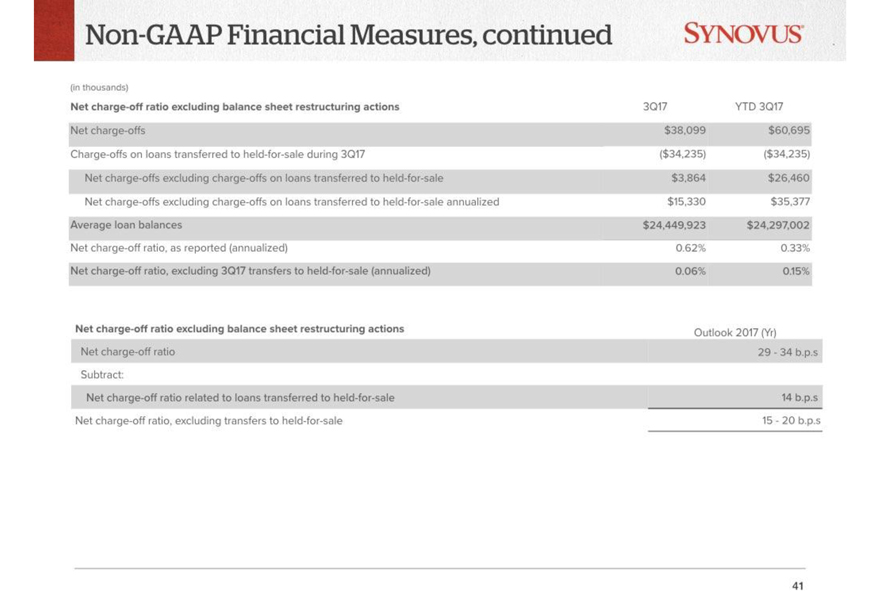
Netcharge-off ratio excluding balance sheet restructuring actions 3Q17 YTD 3Q17
Net charge-offs $38,099 $60,695
Charge-offs on loans transferred toheld-for-sale during 3Q17 ($34,235) ($34,235)
Net charge-offs excluding charge-offs on loans transferred toheld-for-sale $3,864 $26,460
Net charge-offs excluding charge-offs on loans transferred toheld-for-sale annualized $15,330 $35,377
Average loan balances $24,449,923 $24,297,002
Netcharge-off ratio, as reported (annualized) 0.62% 0.33%
Netcharge-off ratio, excluding 3Q17 transfers toheld-for-sale (annualized) 0.06% 0.15%
Netcharge-off ratio excluding balance sheet restructuring actions Outlook 2017 (Yr)
Netcharge-off ratio 29-34 b.p.s
Subtract:
Netcharge-off ratio related to loans transferred toheld-for-sale 14 b.p.s
Netcharge-off ratio, excluding transfers toheld-for-sale 15-20 b.p.s
41
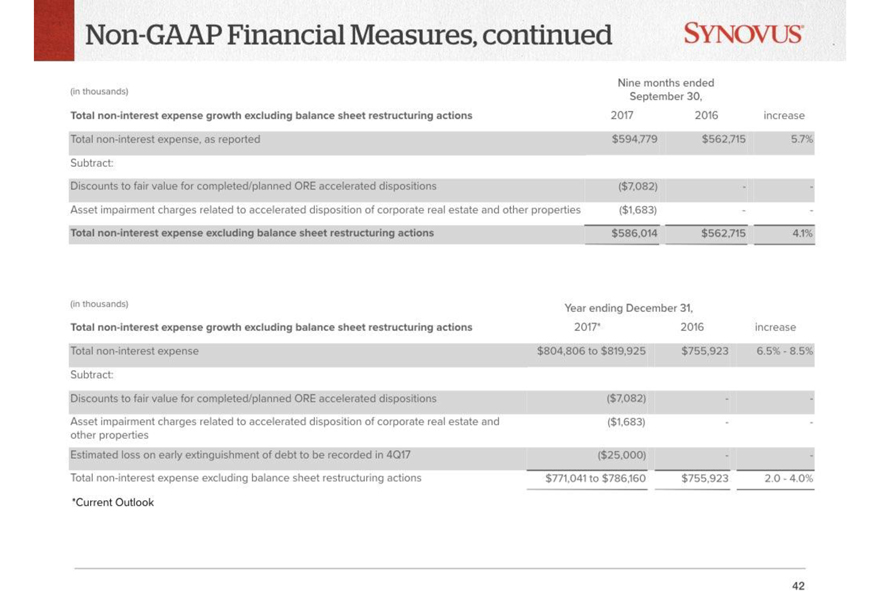
Non-GAAP Financial Measures, continued synovus Nine months ended
(in thousands) September 30,
Totalnon-interest expense growth excluding balance sheet restructuring actions 2017 2016 increase
Totalnon-interest expense, as reported $594,779 $562,715 5.7%
Subtract:
Discounts to fair value for completed/planned ORE accelerated dispositions ($7,082) - -
Asset impairment charges related to accelerated disposition of corporate real estate and other properties ($1,683) - -
Totalnon-interest expense excluding balance sheet restructuring actions $586,014 $562,715 4.1%
(in thousands) Year ending December 31,
Totalnon-interest expense growth excluding balance sheet restructuring actions 2017* 2016 increase
Totalnon-interest expense $804,806 to $819,925 $755,923 6.5%-8.5%
Subtract:
Discounts to fair value for completed/planned ORE accelerated dispositions ($7,082) - -
Asset impairment charges related to accelerated disposition of corporate real estate and other properties ($1,683) - -
Estimated loss on early extinguishment of debt to be recorded in 4Q17 ($25,000) - -
Totalnon-interest expense excluding balance sheet restructuring actions $771,041 to $786,160 $755,923 2.0-4.0%
*Current Outlook
42