Fourth Quarter 2017 Results January 23, 2018 Exhibit 99.3
Forward Looking Statements This slide presentation and certain of our other filings with the Securities and Exchange Commission contain statements that constitute “forward-looking statements” within the meaning of, and subject to the protections of, Section 27A of the Securities Act of 1933, as amended, and Section 21E of the Securities Exchange Act of 1934, as amended. All statements other than statements of historical fact are forward-looking statements. You can identify these forward-looking statements through Synovus’ use of words such as “believes,” “anticipates,” “expects,” “may,” “will,” “assumes,” “should,” “predicts,” “could,” “should,” “would,” “intends,” “targets,” “estimates,” “projects,” “plans,” “potential” and other similar words and expressions of the future or otherwise regarding the outlook for Synovus’ future business and financial performance and/or the performance of the banking industry and economy in general. These forward-looking statements include, among others, statements on (1) future loan growth; (2) future deposit growth; (3) future net interest income and net interest margin; (4) future adjusted non-interest income; (5) future non-interest expense levels, efficiency ratios, and operating leverage; (6) future credit trends and key metrics; (7) future effective tax rates; (8) our strategy and initiatives for future growth, capital management, strategic transactions and our brand initiative; and (9) our assumptions underlying these expectations. Prospective investors are cautioned that any such forward-looking statements are not guarantees of future performance and involve known and unknown risks and uncertainties which may cause the actual results, performance or achievements of Synovus to be materially different from the future results, performance or achievements expressed or implied by such forward-looking statements. Forward-looking statements are based on the information known to, and current beliefs and expectations of, Synovus’ management and are subject to significant risks and uncertainties. Actual results may differ materially from those contemplated by such forward-looking statements. A number of factors could cause actual results to differ materially from those contemplated by the forward-looking statements in this presentation. Many of these factors are beyond Synovus’ ability to control or predict. These forward-looking statements are based upon information presently known to Synovus’ management and are inherently subjective, uncertain and subject to change due to any number of risks and uncertainties, including, without limitation, the risks and other factors set forth in Synovus’ filings with the Securities and Exchange Commission, including its Annual Report on Form 10-K for the year ended December 31, 2016 under the captions “Cautionary Notice Regarding Forward-Looking Statements” and “Risk Factors” and in Synovus’ quarterly reports on Form 10-Q and current reports on Form 8-K. We believe these forward-looking statements are reasonable; however, undue reliance should not be placed on any forward-looking statements, which are based on current expectations and speak only as of the date that they are made. We do not assume any obligation to update any forward-looking statements as a result of new information, future developments or otherwise, except as otherwise may be required by law. Use of Non-GAAP Financial Measures This slide presentation contains certain non-GAAP financial measures determined by methods other than in accordance with generally accepted accounting principles. Such non-GAAP financial measures include the following: adjusted diluted earnings per share; adjusted return on average assets; adjusted return on average common equity; adjusted return on average tangible common equity; average loan growth excluding transfers to held-for-sale; average core deposits; average core transaction deposits; cost of interest bearing core deposits; adjusted non-interest income; adjusted non-interest expense; adjusted efficiency ratio; tangible common equity ratio; and common equity Tier 1 (CET1) ratio (fully phased-in). The most comparable GAAP measures to these measures are diluted earnings per share; return on average assets; return on average common equity; loan growth; total average deposits; effective cost of funds; total non-interest income; total non-interest expense; efficiency ratio; total shareholders’ equity to total assets ratio; and CET1 ratio, respectively. Management uses these non-GAAP financial measures to assess the performance of Synovus’ business and the strength of its capital position. Management believes that these non-GAAP financial measures provide meaningful additional information about Synovus to assist management, investors, and bank regulators in evaluating Synovus’ operating results, financial strength, the performance of its business and the strength of its capital position. However, these non-GAAP financial measures have inherent limitations as analytical tools and should not be considered in isolation or as a substitute for analyses of operating results or capital position as reported under GAAP. The non-GAAP financial measures should be considered as additional views of the way our financial measures are affected by significant items and other factors, and since they are not required to be uniformly applied, they may not be comparable to other similarly titled measures at other companies. Adjusted diluted earnings per share, adjusted return on average assets, and adjusted return on average common equity are measures used by management to evaluate operating results exclusive of items that are not indicative of ongoing operations and impact period-to-period comparisons. Adjusted return on average tangible common equity is a measure used by management to compare Synovus’ performance with other financial institutions because it calculates the return available to common shareholders without the impact of intangible assets and their related amortization, thereby allowing management to evaluate the performance of the business consistently. Loan growth excluding transfers to held-for-sale is a measure used by management to evaluate organic loan growth exclusive of loans transferred to held-for-sale. Average core deposits and average core transaction deposits are measures used by management to evaluate organic growth of deposits and the quality of deposits as a funding source. The cost of interest bearing core deposits is a measure used to evaluate the cost of deposits as a funding source exclusive of brokered deposits and non-interest bearing deposits. Adjusted non-interest income is a measure used by management to evaluate non-interest income exclusive of net investment securities gains/losses and changes in fair value of private equity investments, net, and the Cabela’s transaction fee. Adjusted non-interest expense and the adjusted efficiency ratio are measures utilized by management to measure the success of expense management initiatives focused on reducing recurring controllable operating costs. The tangible common equity ratio is used by management and bank regulators to assess the strength of our capital position. The computations of the non-GAAP financial measures used in this slide presentation are set forth in the Appendix to this slide presentation.
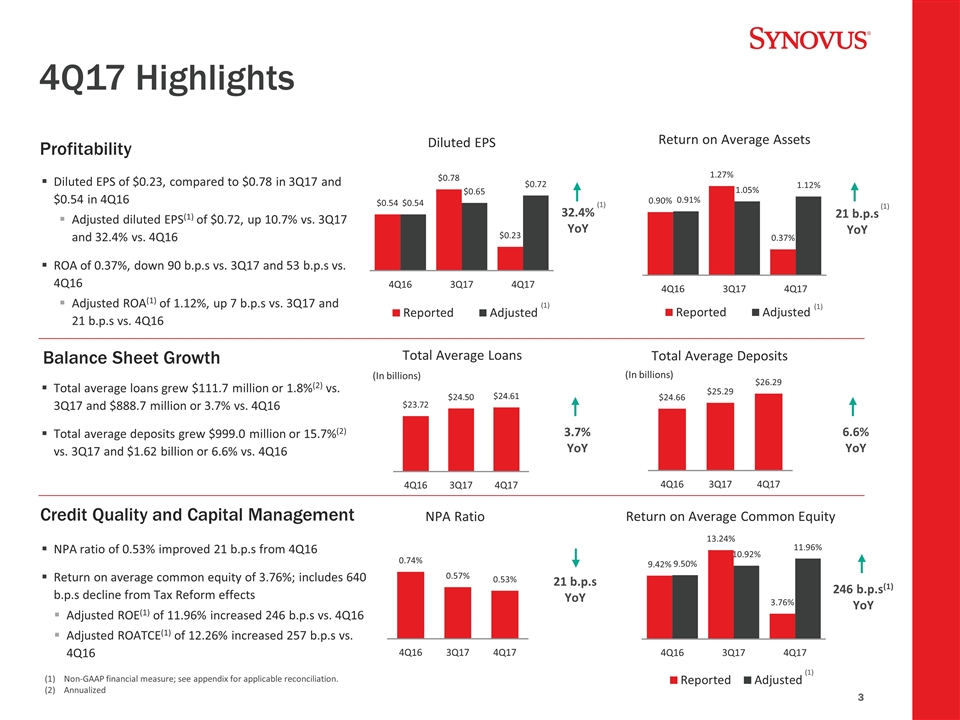
4Q17 Highlights 32.4% YoY (1) 21 b.p.s YoY (1) (In billions) 3.7% YoY Total Average Deposits (In billions) 6.6% YoY 21 b.p.s YoY Return on Average Common Equity (1) (1) (1) Non-GAAP financial measure; see appendix for applicable reconciliation. Annualized 246 b.p.s(1) YoY Diluted EPS of $0.23, compared to $0.78 in 3Q17 and $0.54 in 4Q16 Adjusted diluted EPS(1) of $0.72, up 10.7% vs. 3Q17 and 32.4% vs. 4Q16 ROA of 0.37%, down 90 b.p.s vs. 3Q17 and 53 b.p.s vs. 4Q16 Adjusted ROA(1) of 1.12%, up 7 b.p.s vs. 3Q17 and 21 b.p.s vs. 4Q16 Profitability Balance Sheet Growth Total average loans grew $111.7 million or 1.8%(2) vs. 3Q17 and $888.7 million or 3.7% vs. 4Q16 Total average deposits grew $999.0 million or 15.7%(2) vs. 3Q17 and $1.62 billion or 6.6% vs. 4Q16 Credit Quality and Capital Management NPA ratio of 0.53% improved 21 b.p.s from 4Q16 Return on average common equity of 3.76%; includes 640 b.p.s decline from Tax Reform effects Adjusted ROE(1) of 11.96% increased 246 b.p.s vs. 4Q16 Adjusted ROATCE(1) of 12.26% increased 257 b.p.s vs. 4Q16
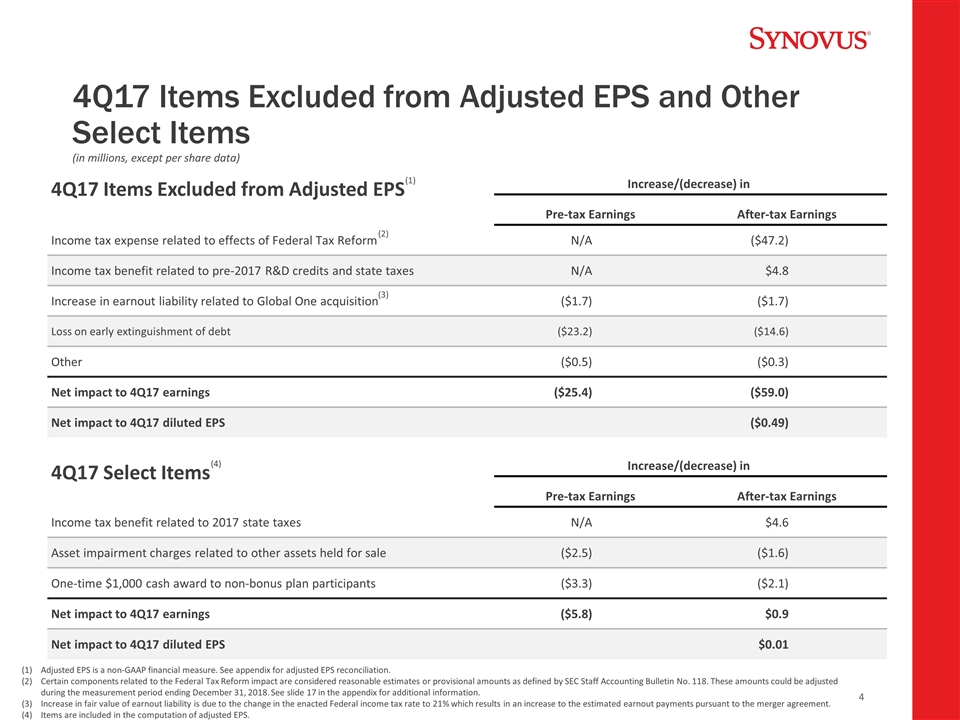
4Q17 Items Excluded from Adjusted EPS and Other Select Items 4Q17 Items Excluded from Adjusted EPS Increase/(decrease) in Pre-tax Earnings After-tax Earnings Income tax expense related to effects of Federal Tax Reform N/A ($47.2) Income tax benefit related to pre-2017 R&D credits and state taxes N/A $4.8 Increase in earnout liability related to Global One acquisition ($1.7) ($1.7) Loss on early extinguishment of debt ($23.2) ($14.6) Other ($0.5) ($0.3) Net impact to 4Q17 earnings ($25.4) ($59.0) Net impact to 4Q17 diluted EPS ($0.49) 4Q17 Select Items Increase/(decrease) in Pre-tax Earnings After-tax Earnings Income tax benefit related to 2017 state taxes N/A $4.6 Asset impairment charges related to other assets held for sale ($2.5) ($1.6) One-time $1,000 cash award to non-bonus plan participants ($3.3) ($2.1) Net impact to 4Q17 earnings ($5.8) $0.9 Net impact to 4Q17 diluted EPS $0.01 (in millions, except per share data) Adjusted EPS is a non-GAAP financial measure. See appendix for adjusted EPS reconciliation. Certain components related to the Federal Tax Reform impact are considered reasonable estimates or provisional amounts as defined by SEC Staff Accounting Bulletin No. 118. These amounts could be adjusted during the measurement period ending December 31, 2018. See slide 17 in the appendix for additional information. Increase in fair value of earnout liability is due to the change in the enacted Federal income tax rate to 21% which results in an increase to the estimated earnout payments pursuant to the merger agreement. Items are included in the computation of adjusted EPS. (4) (1) (2) (3)
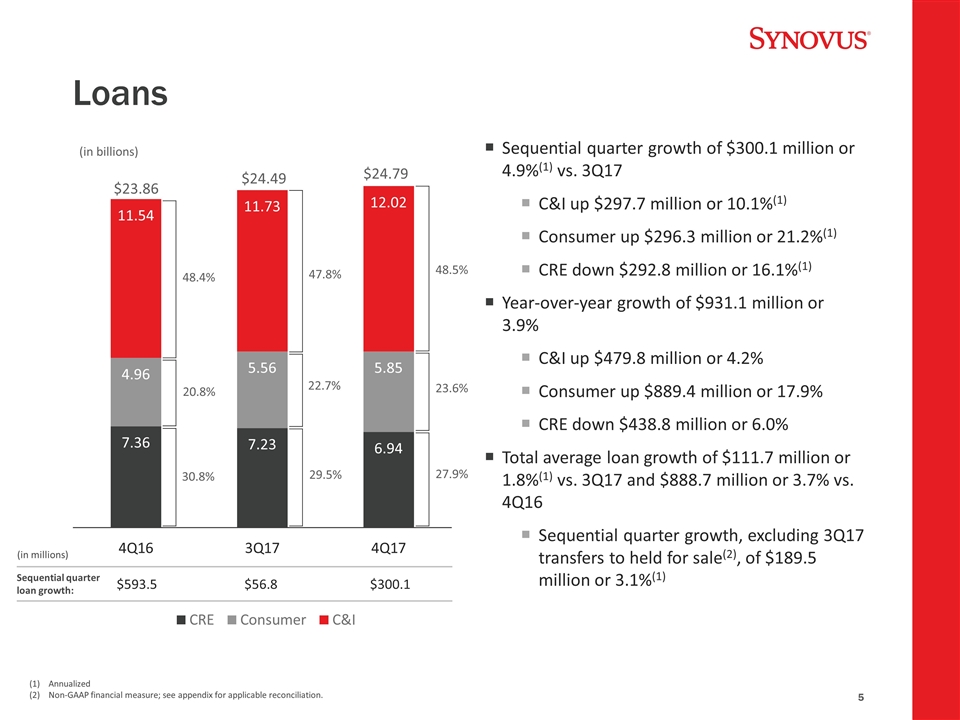
Loans Sequential quarter growth of $300.1 million or 4.9%(1) vs. 3Q17 C&I up $297.7 million or 10.1%(1) Consumer up $296.3 million or 21.2%(1) CRE down $292.8 million or 16.1%(1) Year-over-year growth of $931.1 million or 3.9% C&I up $479.8 million or 4.2% Consumer up $889.4 million or 17.9% CRE down $438.8 million or 6.0% Total average loan growth of $111.7 million or 1.8%(1) vs. 3Q17 and $888.7 million or 3.7% vs. 4Q16 Sequential quarter growth, excluding 3Q17 transfers to held for sale(2), of $189.5 million or 3.1%(1) (in billions) $23.86 $24.79 $24.49 48.5% 23.6% 27.9% 48.4% 20.8% 30.8% 47.8% 22.7% 29.5% Sequential quarter loan growth: $593.5 $56.8 $300.1 (in millions) Annualized Non-GAAP financial measure; see appendix for applicable reconciliation.
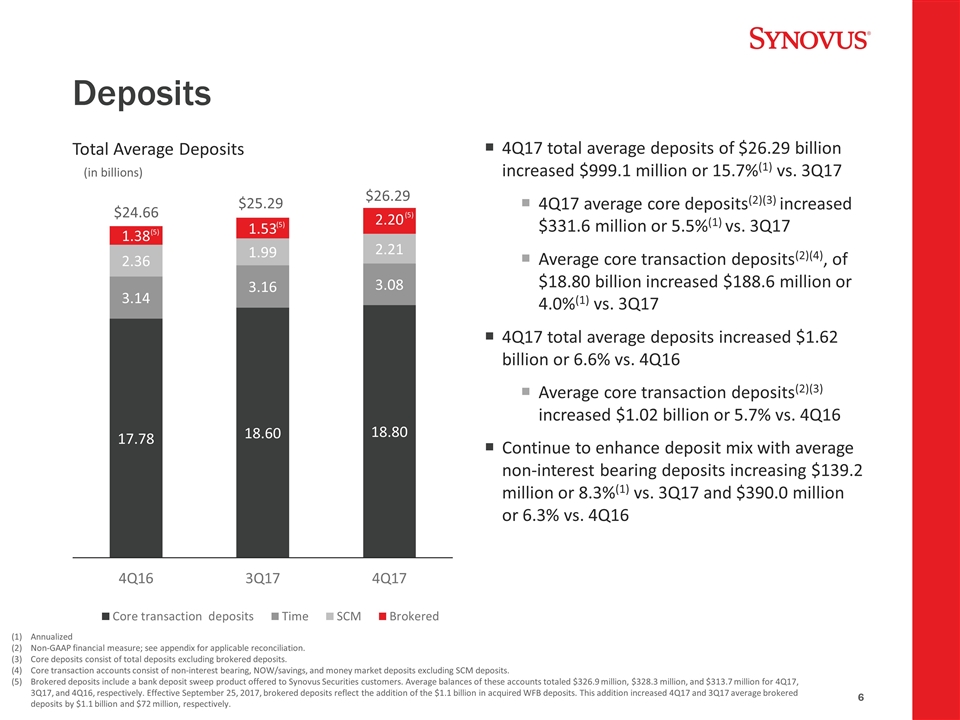
Deposits 4Q17 total average deposits of $26.29 billion increased $999.1 million or 15.7%(1) vs. 3Q17 4Q17 average core deposits(2)(3) increased $331.6 million or 5.5%(1) vs. 3Q17 Average core transaction deposits(2)(4), of $18.80 billion increased $188.6 million or 4.0%(1) vs. 3Q17 4Q17 total average deposits increased $1.62 billion or 6.6% vs. 4Q16 Average core transaction deposits(2)(3) increased $1.02 billion or 5.7% vs. 4Q16 Continue to enhance deposit mix with average non-interest bearing deposits increasing $139.2 million or 8.3%(1) vs. 3Q17 and $390.0 million or 6.3% vs. 4Q16 (in billions) $24.66 $26.29 $25.29 Total Average Deposits (5) (5) (5) Annualized Non-GAAP financial measure; see appendix for applicable reconciliation. Core deposits consist of total deposits excluding brokered deposits. Core transaction accounts consist of non-interest bearing, NOW/savings, and money market deposits excluding SCM deposits. Brokered deposits include a bank deposit sweep product offered to Synovus Securities customers. Average balances of these accounts totaled $326.9 million, $328.3 million, and $313.7 million for 4Q17, 3Q17, and 4Q16, respectively. Effective September 25, 2017, brokered deposits reflect the addition of the $1.1 billion in acquired WFB deposits. This addition increased 4Q17 and 3Q17 average brokered deposits by $1.1 billion and $72 million, respectively.
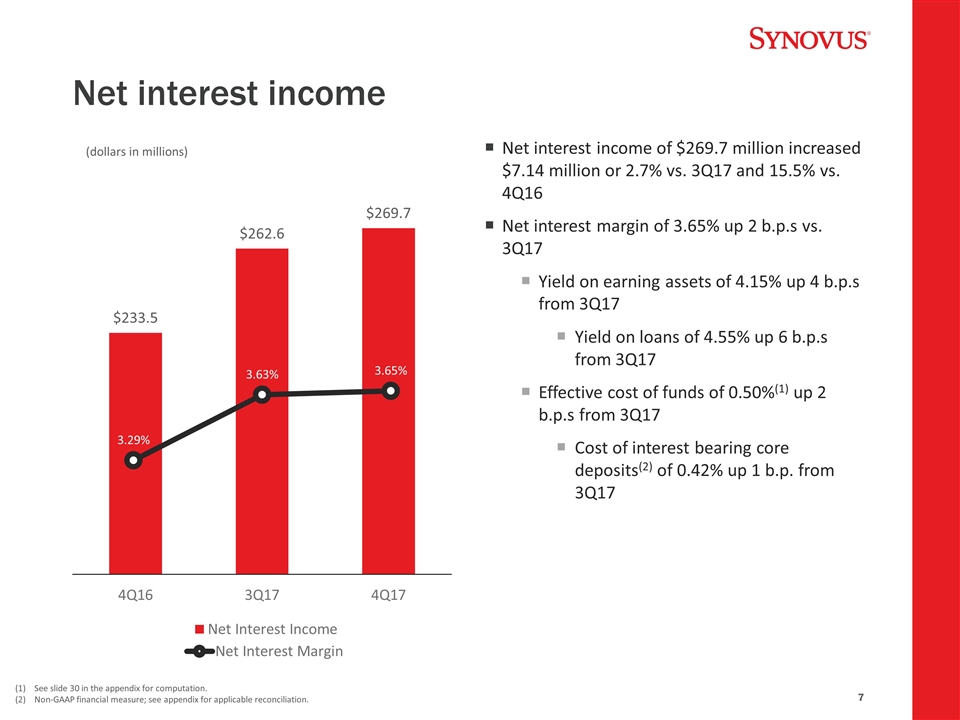
Net interest income Net interest income of $269.7 million increased $7.14 million or 2.7% vs. 3Q17 and 15.5% vs. 4Q16 Net interest margin of 3.65% up 2 b.p.s vs. 3Q17 Yield on earning assets of 4.15% up 4 b.p.s from 3Q17 Yield on loans of 4.55% up 6 b.p.s from 3Q17 Effective cost of funds of 0.50%(1) up 2 b.p.s from 3Q17 Cost of interest bearing core deposits(2) of 0.42% up 1 b.p. from 3Q17 (dollars in millions) See slide 30 in the appendix for computation. Non-GAAP financial measure; see appendix for applicable reconciliation.
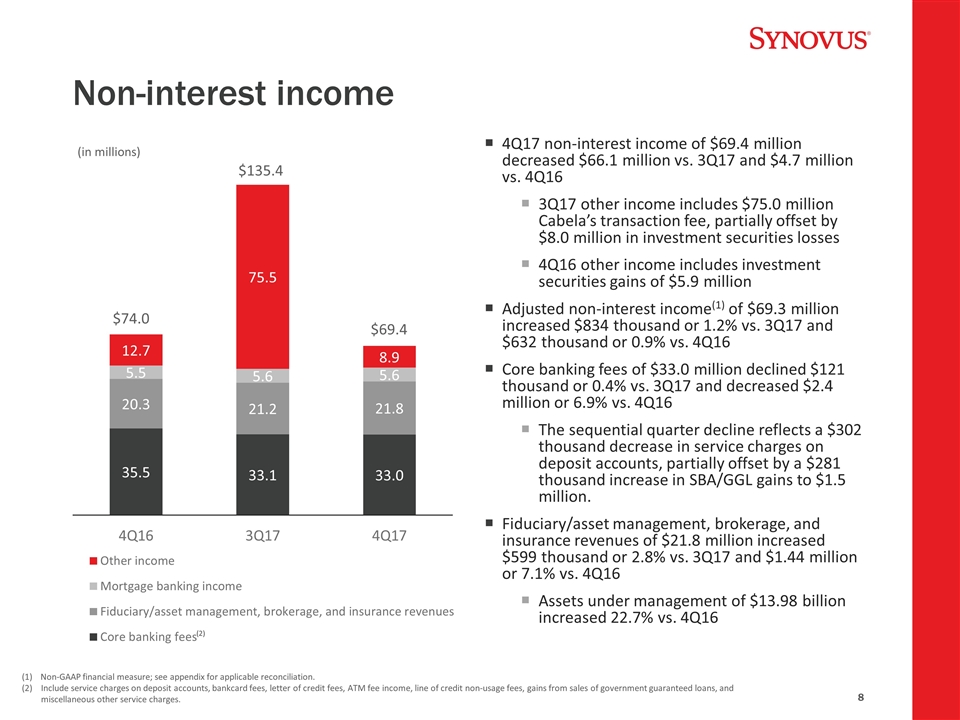
Non-interest income 4Q17 non-interest income of $69.4 million decreased $66.1 million vs. 3Q17 and $4.7 million vs. 4Q16 3Q17 other income includes $75.0 million Cabela’s transaction fee, partially offset by $8.0 million in investment securities losses 4Q16 other income includes investment securities gains of $5.9 million Adjusted non-interest income(1) of $69.3 million increased $834 thousand or 1.2% vs. 3Q17 and $632 thousand or 0.9% vs. 4Q16 Core banking fees of $33.0 million declined $121 thousand or 0.4% vs. 3Q17 and decreased $2.4 million or 6.9% vs. 4Q16 The sequential quarter decline reflects a $302 thousand decrease in service charges on deposit accounts, partially offset by a $281 thousand increase in SBA/GGL gains to $1.5 million. Fiduciary/asset management, brokerage, and insurance revenues of $21.8 million increased $599 thousand or 2.8% vs. 3Q17 and $1.44 million or 7.1% vs. 4Q16 Assets under management of $13.98 billion increased 22.7% vs. 4Q16 (in millions) $74.0 $69.4 $135.4 (2) (2) Non-GAAP financial measure; see appendix for applicable reconciliation. Include service charges on deposit accounts, bankcard fees, letter of credit fees, ATM fee income, line of credit non-usage fees, gains from sales of government guaranteed loans, and miscellaneous other service charges. (2)
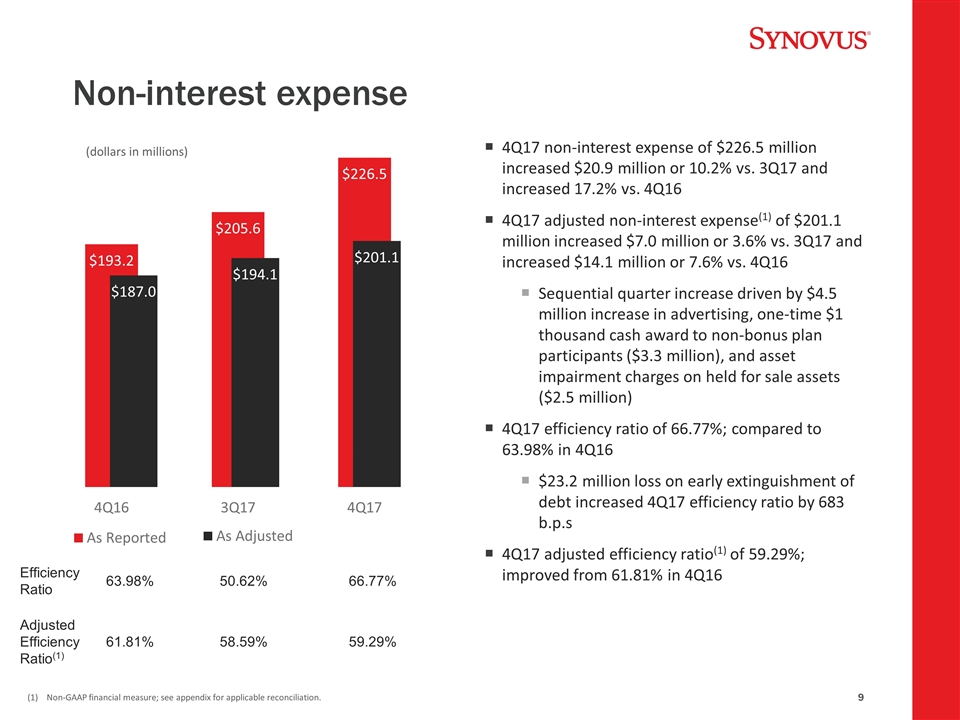
Non-interest expense 4Q17 non-interest expense of $226.5 million increased $20.9 million or 10.2% vs. 3Q17 and increased 17.2% vs. 4Q16 4Q17 adjusted non-interest expense(1) of $201.1 million increased $7.0 million or 3.6% vs. 3Q17 and increased $14.1 million or 7.6% vs. 4Q16 Sequential quarter increase driven by $4.5 million increase in advertising, one-time $1 thousand cash award to non-bonus plan participants ($3.3 million), and asset impairment charges on held for sale assets ($2.5 million) 4Q17 efficiency ratio of 66.77%; compared to 63.98% in 4Q16 $23.2 million loss on early extinguishment of debt increased 4Q17 efficiency ratio by 683 b.p.s 4Q17 adjusted efficiency ratio(1) of 59.29%; improved from 61.81% in 4Q16 (dollars in millions) Non-GAAP financial measure; see appendix for applicable reconciliation. Efficiency Ratio 63.98% 50.62% 66.77% Adjusted Efficiency Ratio(1) 61.81% 58.59% 59.29%
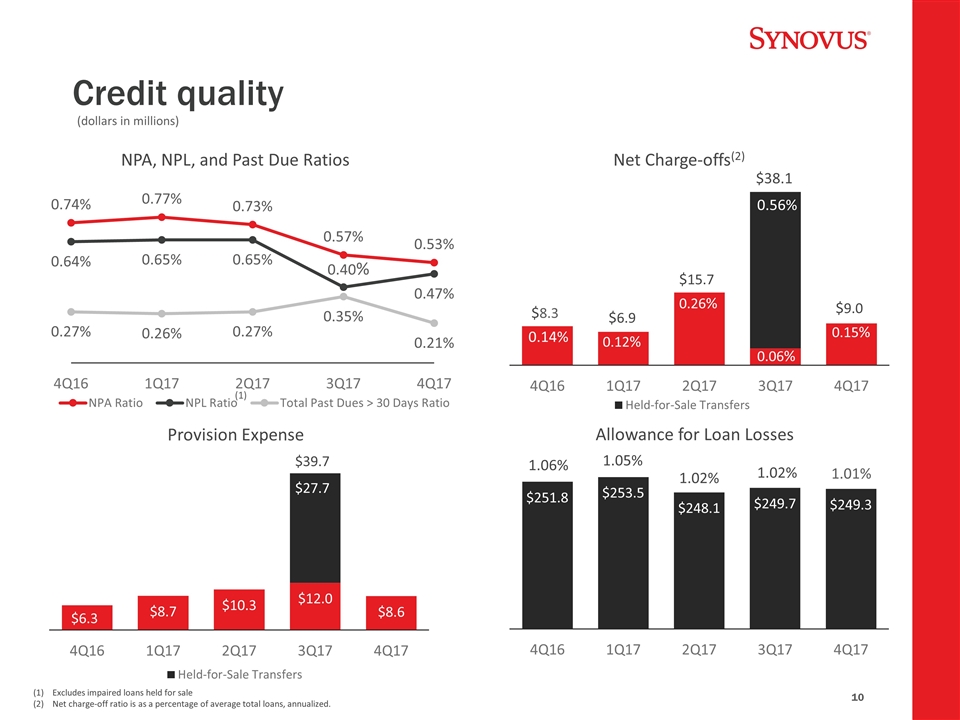
Credit quality (dollars in millions) (2) 0.14% 0.12% 0.26% 0.06% 0.15% 0.56% $8.3 $6.9 $15.7 $38.1 $9.0 Net Charge-offs(2) $27.7 Provision Expense Allowance for Loan Losses 1.06% 1.05% 1.02% 1.02% 1.01% 0.40% NPA, NPL, and Past Due Ratios Excludes impaired loans held for sale Net charge-off ratio is as a percentage of average total loans, annualized. (1) $39.7
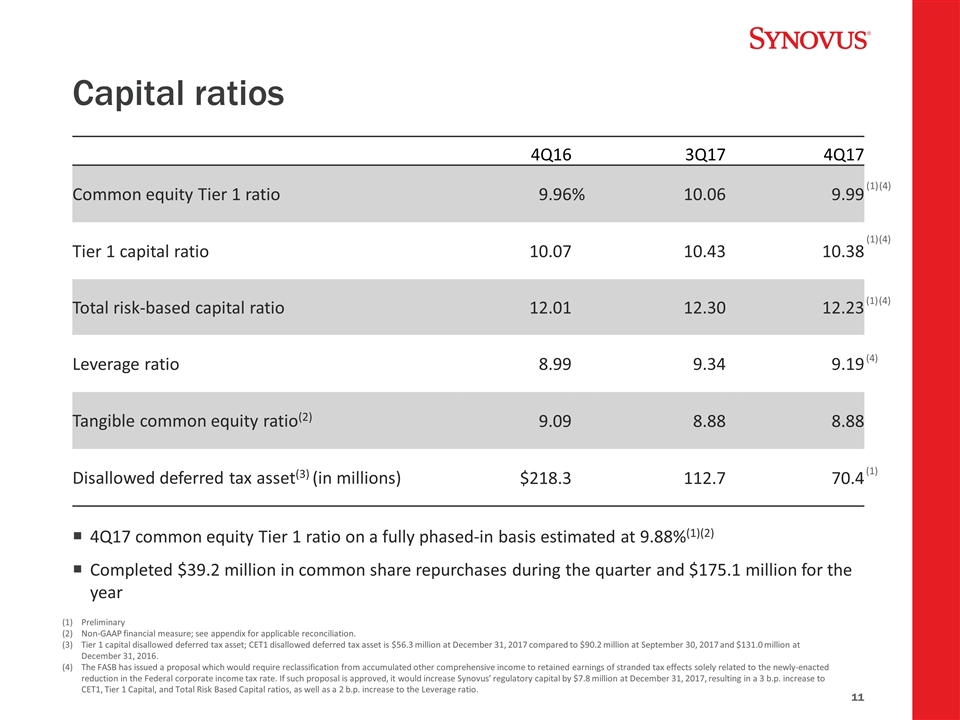
Capital ratios 4Q16 3Q17 4Q17 Common equity Tier 1 ratio 9.96 % 10.06 9.99 Tier 1 capital ratio 10.07 10.43 10.38 Total risk-based capital ratio 12.01 12.30 12.23 Leverage ratio 8.99 9.34 9.19 Tangible common equity ratio(2) 9.09 8.88 8.88 Disallowed deferred tax asset(3) (in millions) $218.3 112.7 70.4 (1) Preliminary Non-GAAP financial measure; see appendix for applicable reconciliation. Tier 1 capital disallowed deferred tax asset; CET1 disallowed deferred tax asset is $56.3 million at December 31, 2017 compared to $90.2 million at September 30, 2017 and $131.0 million at December 31, 2016. The FASB has issued a proposal which would require reclassification from accumulated other comprehensive income to retained earnings of stranded tax effects solely related to the newly-enacted reduction in the Federal corporate income tax rate. If such proposal is approved, it would increase Synovus’ regulatory capital by $7.8 million at December 31, 2017, resulting in a 3 b.p. increase to CET1, Tier 1 Capital, and Total Risk Based Capital ratios, as well as a 2 b.p. increase to the Leverage ratio. 4Q17 common equity Tier 1 ratio on a fully phased-in basis estimated at 9.88%(1)(2) Completed $39.2 million in common share repurchases during the quarter and $175.1 million for the year (4) (1) (4) (1) (4) (4) (1)
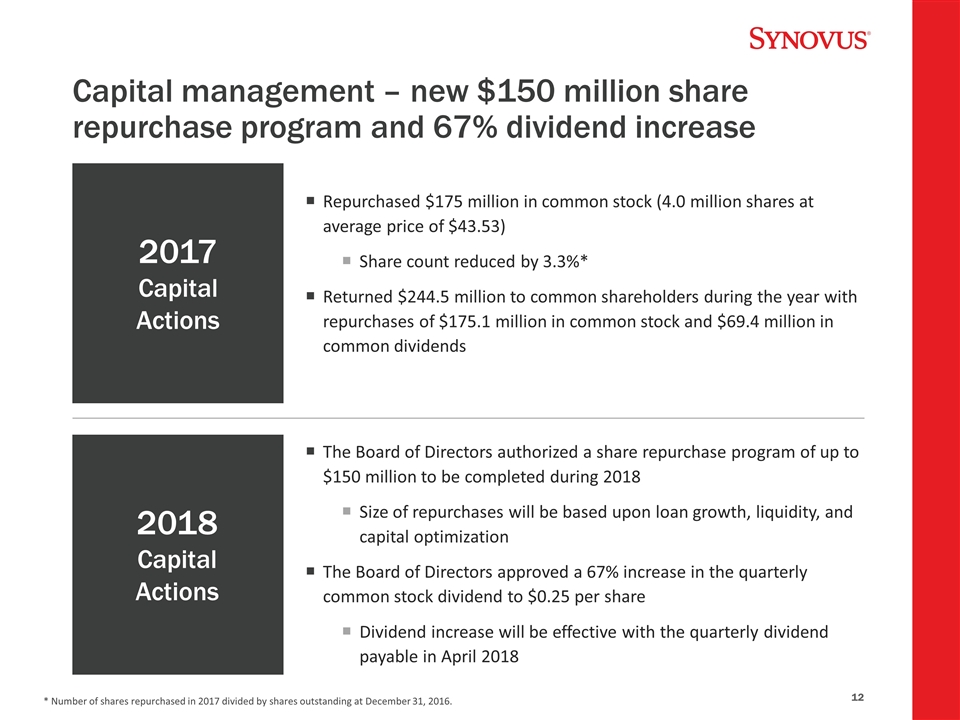
Capital management – new $150 million share repurchase program and 67% dividend increase Repurchased $175 million in common stock (4.0 million shares at average price of $43.53) Share count reduced by 3.3%* Returned $244.5 million to common shareholders during the year with repurchases of $175.1 million in common stock and $69.4 million in common dividends The Board of Directors authorized a share repurchase program of up to $150 million to be completed during 2018 Size of repurchases will be based upon loan growth, liquidity, and capital optimization The Board of Directors approved a 67% increase in the quarterly common stock dividend to $0.25 per share Dividend increase will be effective with the quarterly dividend payable in April 2018 2017 Capital Actions 2018 Capital Actions * Number of shares repurchased in 2017 divided by shares outstanding at December 31, 2016.
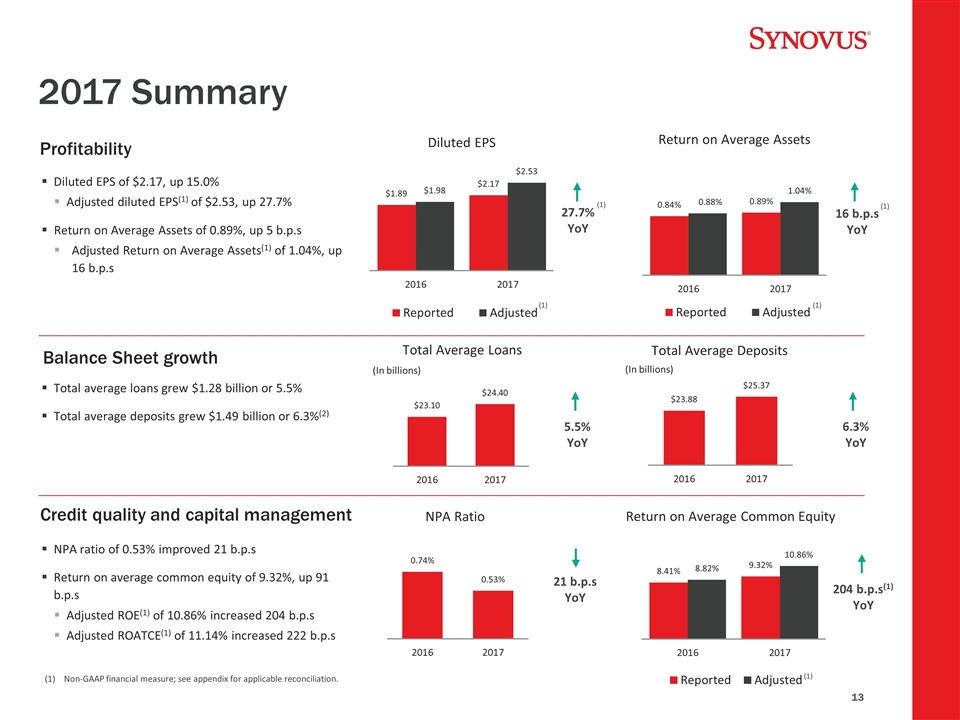
2017 Summary 27.7% YoY (1) 16 b.p.s YoY (1) (In billions) 5.5% YoY Total Average Deposits (In billions) 6.3% YoY 21 b.p.s YoY Return on Average Common Equity (1) (1) (1) Non-GAAP financial measure; see appendix for applicable reconciliation. 204 b.p.s(1) YoY Diluted EPS of $2.17, up 15.0% Adjusted diluted EPS(1) of $2.53, up 27.7% Return on Average Assets of 0.89%, up 5 b.p.s Adjusted Return on Average Assets(1) of 1.04%, up 16 b.p.s Profitability Balance Sheet growth Total average loans grew $1.28 billion or 5.5% Total average deposits grew $1.49 billion or 6.3%(2) Credit quality and capital management NPA ratio of 0.53% improved 21 b.p.s Return on average common equity of 9.32%, up 91 b.p.s Adjusted ROE(1) of 10.86% increased 204 b.p.s Adjusted ROATCE(1) of 11.14% increased 222 b.p.s
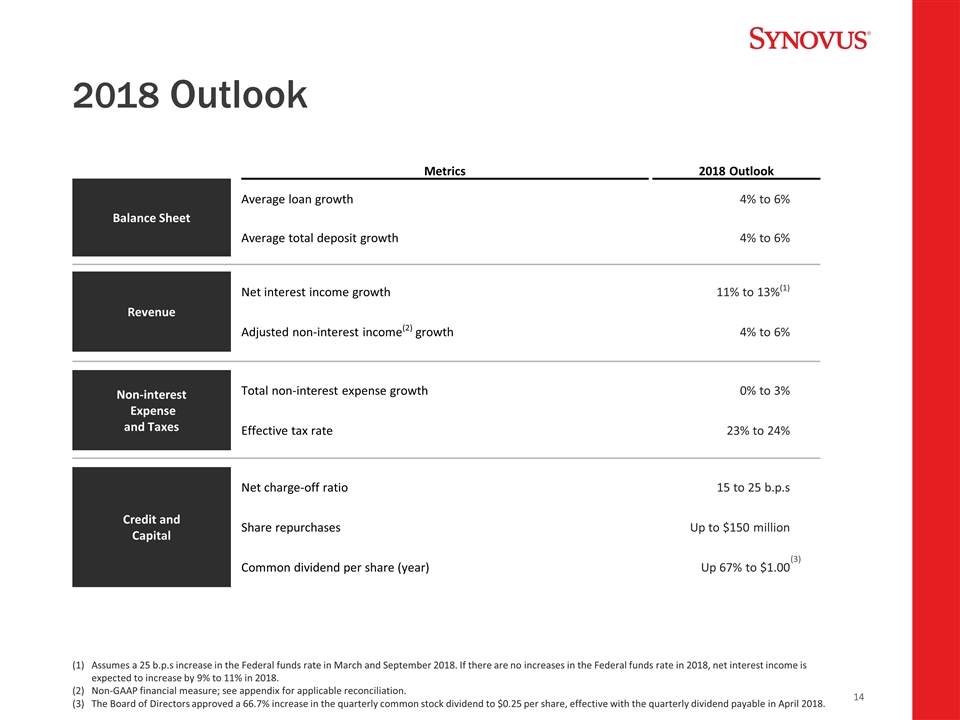
2018 Outlook Metrics 2018 Outlook Balance Sheet Average loan growth 4% to 6% Average total deposit growth 4% to 6% Revenue Net interest income growth 11% to 13%(1) Adjusted non-interest income(2) growth 4% to 6% Non-interest Expense and Taxes Total non-interest expense growth 0% to 3% Effective tax rate 23% to 24% Credit and Capital Net charge-off ratio 15 to 25 b.p.s Share repurchases Up to $150 million Common dividend per share (year) Up 67% to $1.00 Assumes a 25 b.p.s increase in the Federal funds rate in March and September 2018. If there are no increases in the Federal funds rate in 2018, net interest income is expected to increase by 9% to 11% in 2018. Non-GAAP financial measure; see appendix for applicable reconciliation. The Board of Directors approved a 66.7% increase in the quarterly common stock dividend to $0.25 per share, effective with the quarterly dividend payable in April 2018. (3)
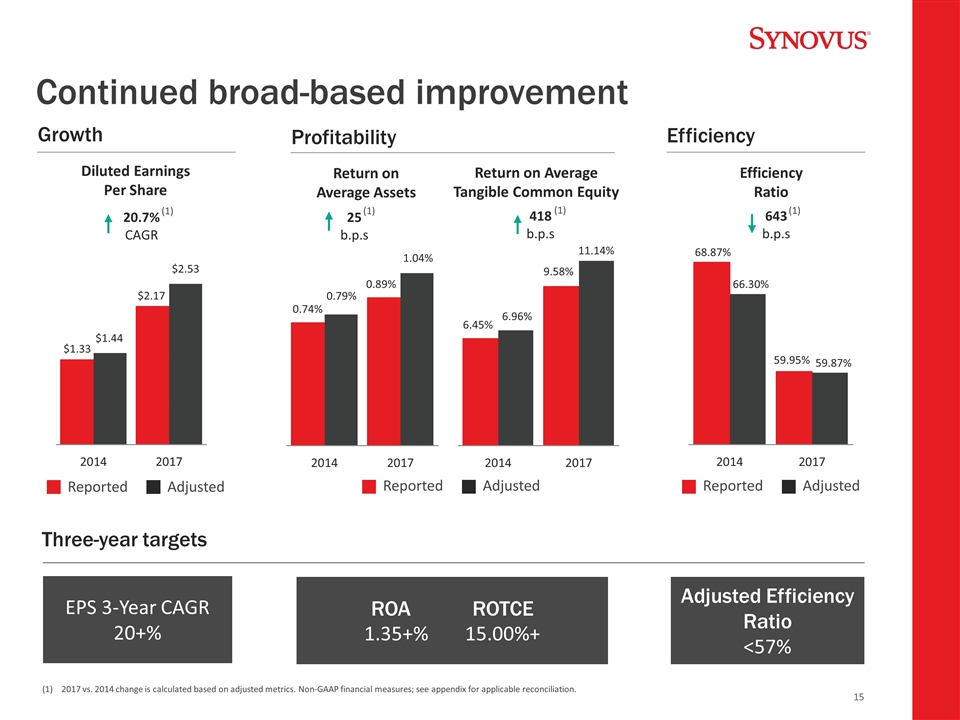
Continued broad-based improvement Diluted Earnings Per Share Return on Average Assets Efficiency Ratio EPS 3-Year CAGR 20+% ROA ROTCE 1.35+% 15.00%+ Adjusted Efficiency Ratio <57% 2017 vs. 2014 change is calculated based on adjusted metrics. Non-GAAP financial measures; see appendix for applicable reconciliation. 20.7% CAGR (1) 25 b.p.s (1) Profitability Growth Efficiency Three-year targets 643 b.p.s (1) Reported Adjusted Return on Average Tangible Common Equity 418 b.p.s (1) Reported Adjusted Reported Adjusted
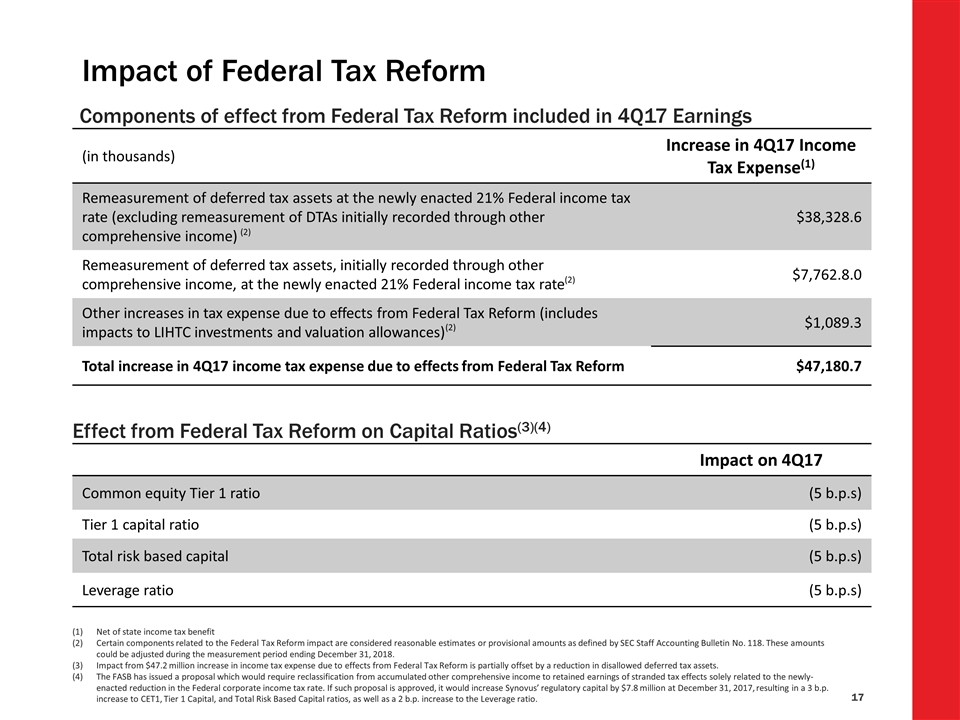
Components of effect from Federal Tax Reform included in 4Q17 Earnings (in thousands) Increase in 4Q17 Income Tax Expense(1) Remeasurement of deferred tax assets at the newly enacted 21% Federal income tax rate (excluding remeasurement of DTAs initially recorded through other comprehensive income) $38,328.6 Remeasurement of deferred tax assets, initially recorded through other comprehensive income, at the newly enacted 21% Federal income tax rate $7,762.8.0 Other increases in tax expense due to effects from Federal Tax Reform (includes impacts to LIHTC investments and valuation allowances) $1,089.3 Total increase in 4Q17 income tax expense due to effects from Federal Tax Reform $47,180.7 Net of state income tax benefit Certain components related to the Federal Tax Reform impact are considered reasonable estimates or provisional amounts as defined by SEC Staff Accounting Bulletin No. 118. These amounts could be adjusted during the measurement period ending December 31, 2018. Impact from $47.2 million increase in income tax expense due to effects from Federal Tax Reform is partially offset by a reduction in disallowed deferred tax assets. The FASB has issued a proposal which would require reclassification from accumulated other comprehensive income to retained earnings of stranded tax effects solely related to the newly-enacted reduction in the Federal corporate income tax rate. If such proposal is approved, it would increase Synovus’ regulatory capital by $7.8 million at December 31, 2017, resulting in a 3 b.p. increase to CET1, Tier 1 Capital, and Total Risk Based Capital ratios, as well as a 2 b.p. increase to the Leverage ratio. (2) (2) Impact of Federal Tax Reform Impact on 4Q17 Common equity Tier 1 ratio (5 b.p.s) Tier 1 capital ratio (5 b.p.s) Total risk based capital (5 b.p.s) Leverage ratio (5 b.p.s) Effect from Federal Tax Reform on Capital Ratios(3)(4) (2)
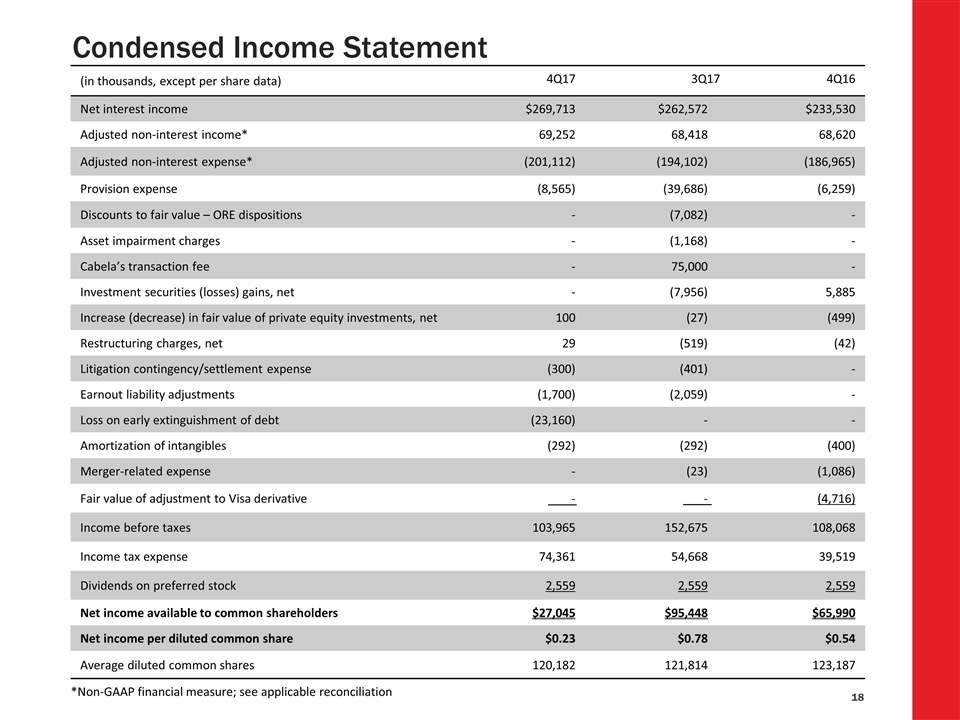
Condensed Income Statement (in thousands, except per share data) 4Q17 3Q17 4Q16 Net interest income $269,713 $262,572 $233,530 Adjusted non-interest income* 69,252 68,418 68,620 Adjusted non-interest expense* (201,112) (194,102) (186,965) Provision expense (8,565) (39,686) (6,259) Discounts to fair value – ORE dispositions - (7,082) - Asset impairment charges - (1,168) - Cabela’s transaction fee - 75,000 - Investment securities (losses) gains, net - (7,956) 5,885 Increase (decrease) in fair value of private equity investments, net 100 (27) (499) Restructuring charges, net 29 (519) (42) Litigation contingency/settlement expense (300) (401) - Earnout liability adjustments (1,700) (2,059) - Loss on early extinguishment of debt (23,160) - - Amortization of intangibles (292) (292) (400) Merger-related expense - (23) (1,086) Fair value of adjustment to Visa derivative - - (4,716) Income before taxes 103,965 152,675 108,068 Income tax expense 74,361 54,668 39,519 Dividends on preferred stock 2,559 2,559 2,559 Net income available to common shareholders $27,045 $95,448 $65,990 Net income per diluted common share $0.23 $0.78 $0.54 Average diluted common shares 120,182 121,814 123,187 *Non-GAAP financial measure; see applicable reconciliation
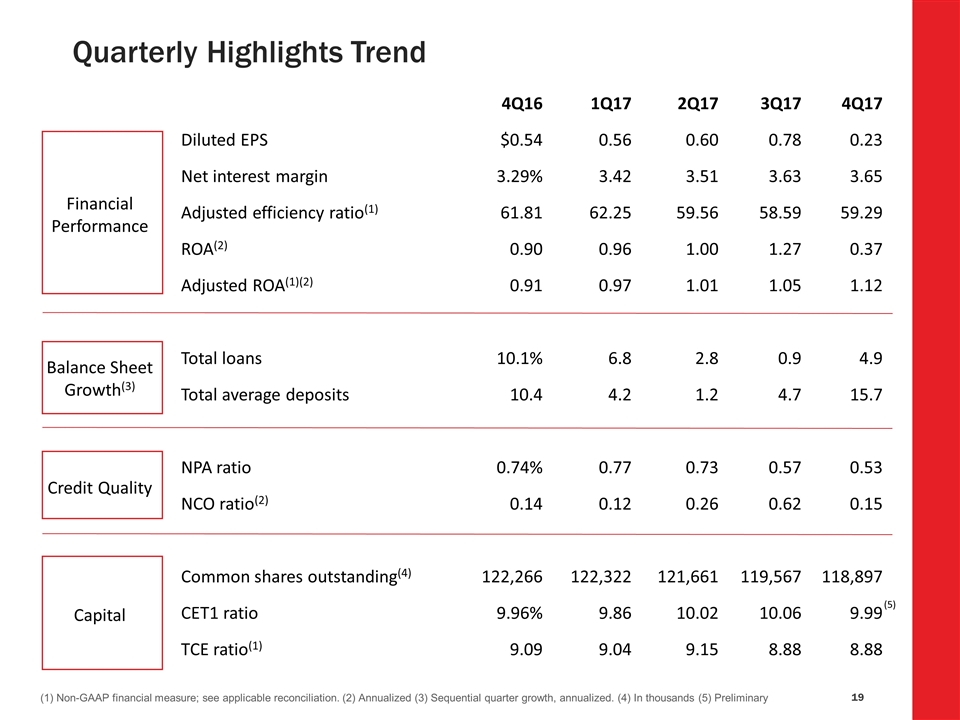
Quarterly Highlights Trend 4Q16 1Q17 2Q17 3Q17 4Q17 Diluted EPS $0.54 0.56 0.60 0.78 0.23 Financial Performance Net interest margin 3.29% 3.42 3.51 3.63 3.65 Adjusted efficiency ratio(1) 61.81 62.25 59.56 58.59 59.29 ROA(2) 0.90 0.96 1.00 1.27 0.37 Adjusted ROA(1)(2) 0.91 0.97 1.01 1.05 1.12 Balance Sheet Growth(3) Total loans 10.1% 6.8 2.8 0.9 4.9 Total average deposits 10.4 4.2 1.2 4.7 15.7 Credit Quality NPA ratio 0.74% 0.77 0.73 0.57 0.53 NCO ratio(2) 0.14 0.12 0.26 0.62 0.15 Capital Common shares outstanding(4) 122,266 122,322 121,661 119,567 118,897 CET1 ratio 9.96% 9.86 10.02 10.06 9.99 TCE ratio(1) 9.09 9.04 9.15 8.88 8.88 (1) Non-GAAP financial measure; see applicable reconciliation. (2) Annualized (3) Sequential quarter growth, annualized. (4) In thousands (5) Preliminary (5)
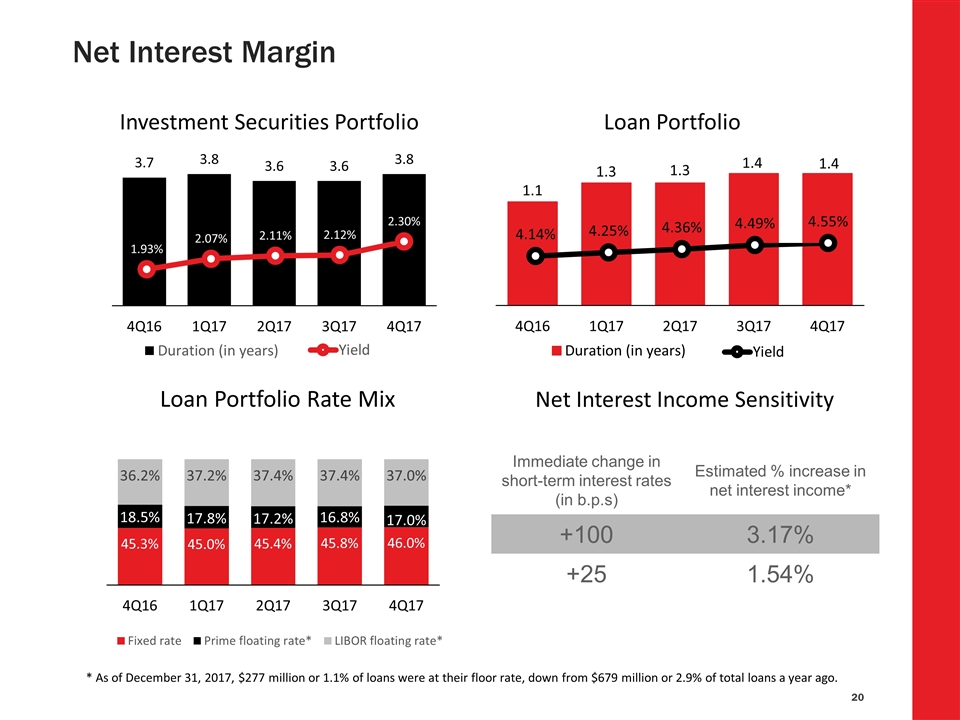
Net Interest Margin (2) Immediate change in short-term interest rates (in b.p.s) Estimated % increase in net interest income* +100 3.17% +25 1.54% Net Interest Income Sensitivity * As of December 31, 2017, $277 million or 1.1% of loans were at their floor rate, down from $679 million or 2.9% of total loans a year ago.
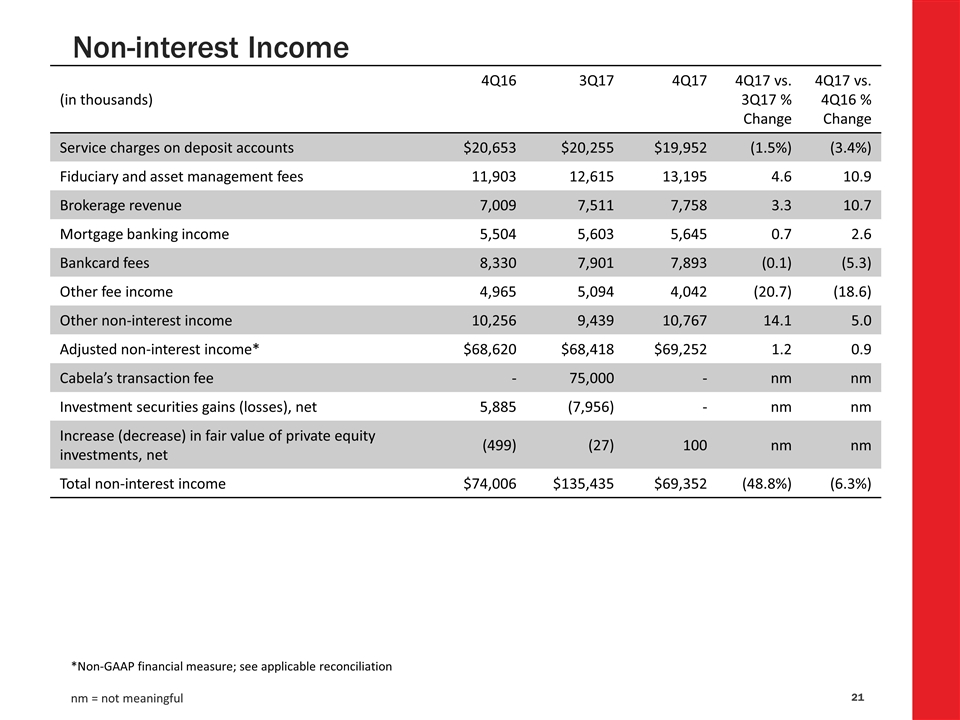
Non-interest Income (in thousands) 4Q16 3Q17 4Q17 4Q17 vs. 3Q17 % Change 4Q17 vs. 4Q16 % Change Service charges on deposit accounts $20,653 $20,255 $19,952 (1.5%) (3.4%) Fiduciary and asset management fees 11,903 12,615 13,195 4.6 10.9 Brokerage revenue 7,009 7,511 7,758 3.3 10.7 Mortgage banking income 5,504 5,603 5,645 0.7 2.6 Bankcard fees 8,330 7,901 7,893 (0.1) (5.3) Other fee income 4,965 5,094 4,042 (20.7) (18.6) Other non-interest income 10,256 9,439 10,767 14.1 5.0 Adjusted non-interest income* $68,620 $68,418 $69,252 1.2 0.9 Cabela’s transaction fee - 75,000 - nm nm Investment securities gains (losses), net 5,885 (7,956) - nm nm Increase (decrease) in fair value of private equity investments, net (499) (27) 100 nm nm Total non-interest income $74,006 $135,435 $69,352 (48.8%) (6.3%) *Non-GAAP financial measure; see applicable reconciliation nm = not meaningful
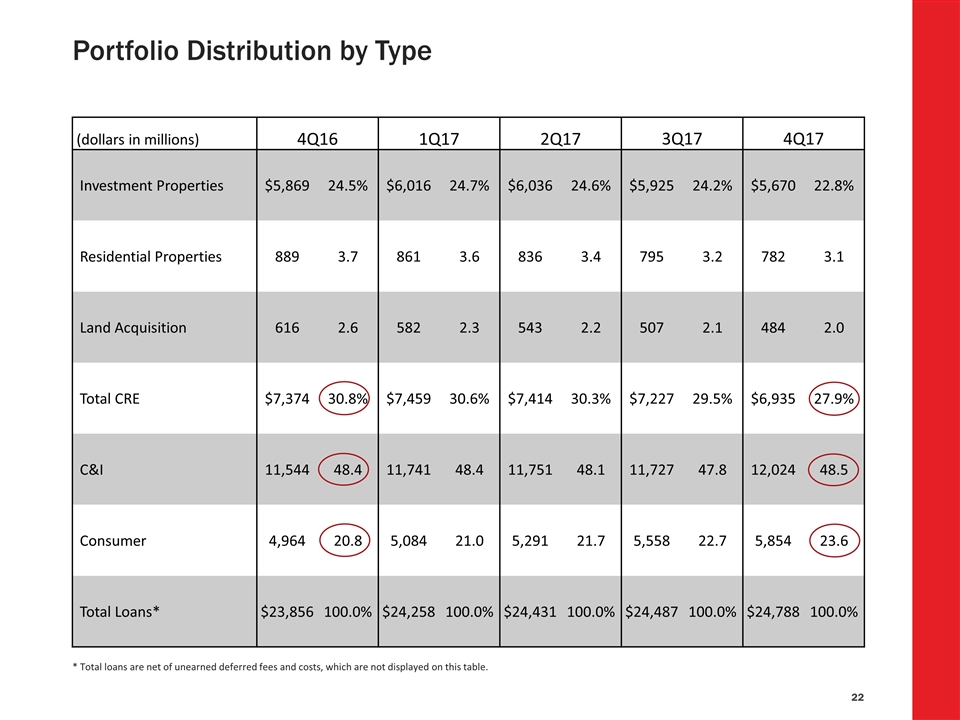
Portfolio Distribution by Type * Total loans are net of unearned deferred fees and costs, which are not displayed on this table. (dollars in millions) 4Q16 1Q17 2Q17 3Q17 4Q17 Investment Properties $5,869 24.5% $6,016 24.7% $6,036 24.6% $5,925 24.2% $5,670 22.8% Residential Properties 889 3.7 861 3.6 836 3.4 795 3.2 782 3.1 Land Acquisition 616 2.6 582 2.3 543 2.2 507 2.1 484 2.0 Total CRE $7,374 30.8% $7,459 30.6% $7,414 30.3% $7,227 29.5% $6,935 27.9% C&I 11,544 48.4 11,741 48.4 11,751 48.1 11,727 47.8 12,024 48.5 Consumer 4,964 20.8 5,084 21.0 5,291 21.7 5,558 22.7 5,854 23.6 Total Loans* $23,856 100.0% $24,258 100.0% $24,431 100.0% $24,487 100.0% $24,788 100.0%
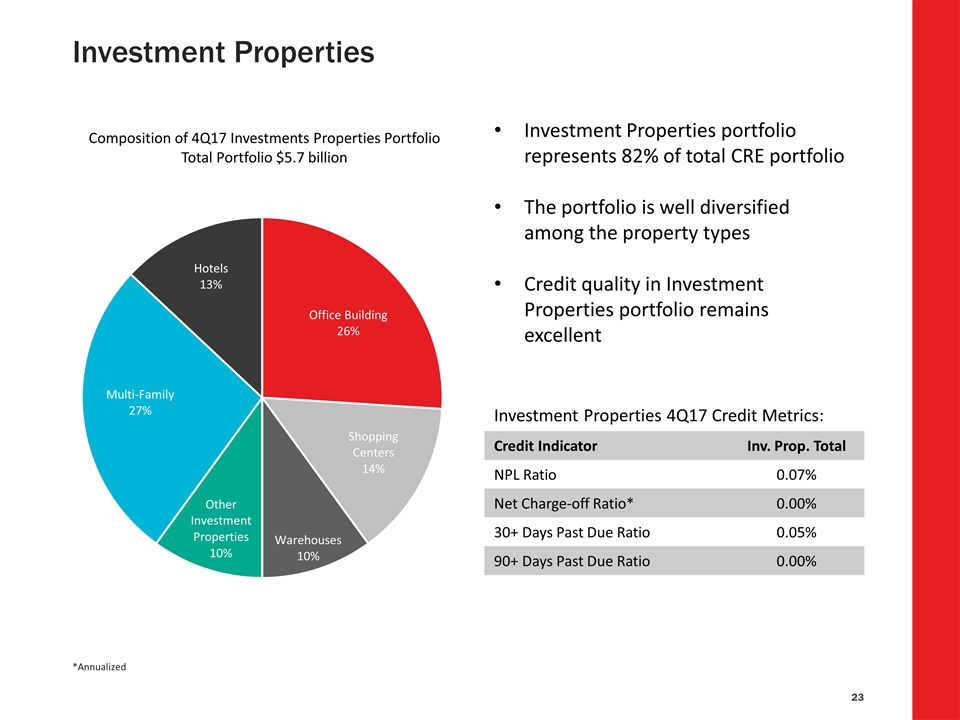
Investment Properties *Annualized Investment Properties 4Q17 Credit Metrics: Credit Indicator Inv. Prop. Total NPL Ratio 0.07% Net Charge-off Ratio* 0.00% 30+ Days Past Due Ratio 0.05% 90+ Days Past Due Ratio 0.00% Investment Properties portfolio represents 82% of total CRE portfolio The portfolio is well diversified among the property types Credit quality in Investment Properties portfolio remains excellent
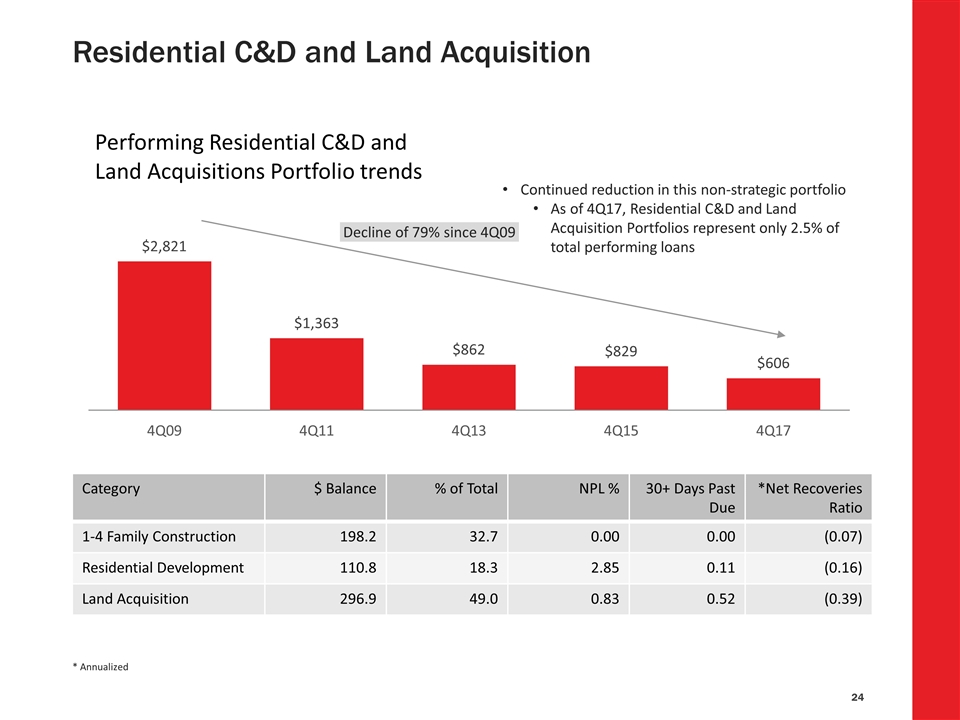
Residential C&D and Land Acquisition * Annualized Category $ Balance % of Total NPL % 30+ Days Past Due *Net Recoveries Ratio 1-4 Family Construction 198.2 32.7 0.00 0.00 (0.07) Residential Development 110.8 18.3 2.85 0.11 (0.16) Land Acquisition 296.9 49.0 0.83 0.52 (0.39) Continued reduction in this non-strategic portfolio As of 4Q17, Residential C&D and Land Acquisition Portfolios represent only 2.5% of total performing loans
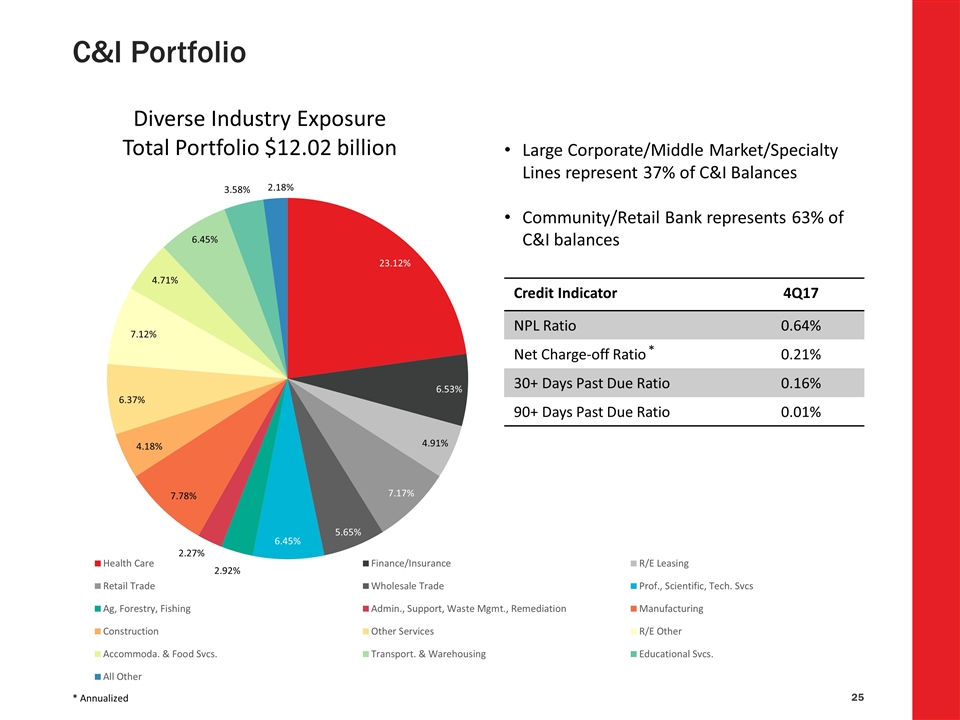
C&I Portfolio * Annualized Credit Indicator 4Q17 NPL Ratio 0.64% Net Charge-off Ratio 0.21% 30+ Days Past Due Ratio 0.16% 90+ Days Past Due Ratio 0.01% Large Corporate/Middle Market/Specialty Lines represent 37% of C&I Balances Community/Retail Bank represents 63% of C&I balances *
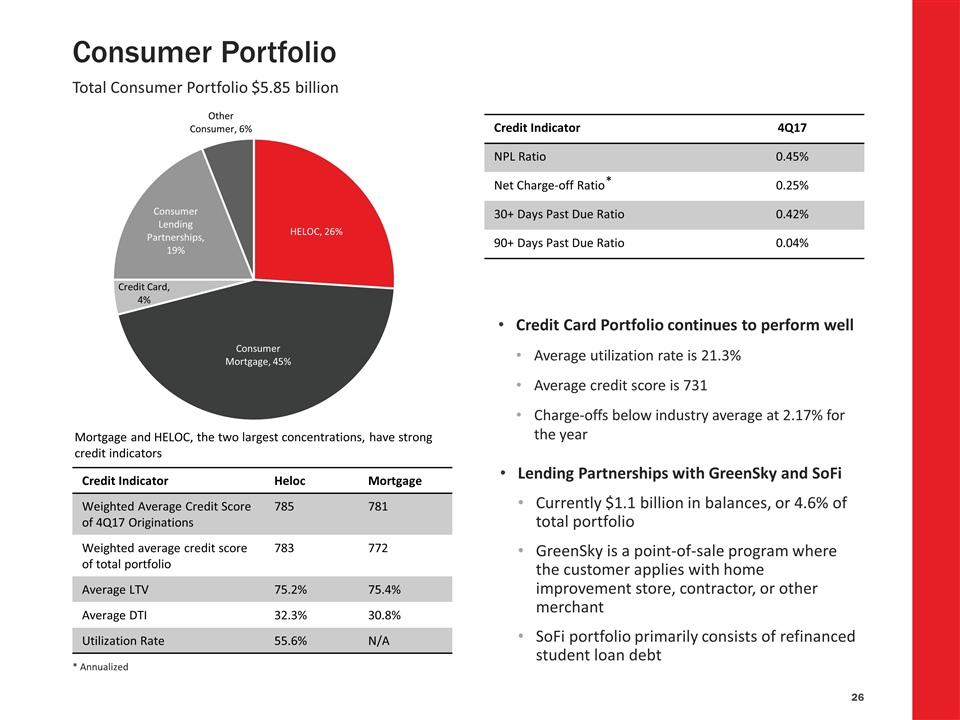
Consumer Portfolio * Annualized Credit Indicator 4Q17 NPL Ratio 0.45% Net Charge-off Ratio 0.25% 30+ Days Past Due Ratio 0.42% 90+ Days Past Due Ratio 0.04% Credit Card Portfolio continues to perform well Average utilization rate is 21.3% Average credit score is 731 Charge-offs below industry average at 2.17% for the year Total Consumer Portfolio $5.85 billion Lending Partnerships with GreenSky and SoFi Currently $1.1 billion in balances, or 4.6% of total portfolio GreenSky is a point-of-sale program where the customer applies with home improvement store, contractor, or other merchant SoFi portfolio primarily consists of refinanced student loan debt Credit Indicator Heloc Mortgage Weighted Average Credit Score of 4Q17 Originations 785 781 Weighted average credit score of total portfolio 783 772 Average LTV 75.2% 75.4% Average DTI 32.3% 30.8% Utilization Rate 55.6% N/A Mortgage and HELOC, the two largest concentrations, have strong credit indicators *
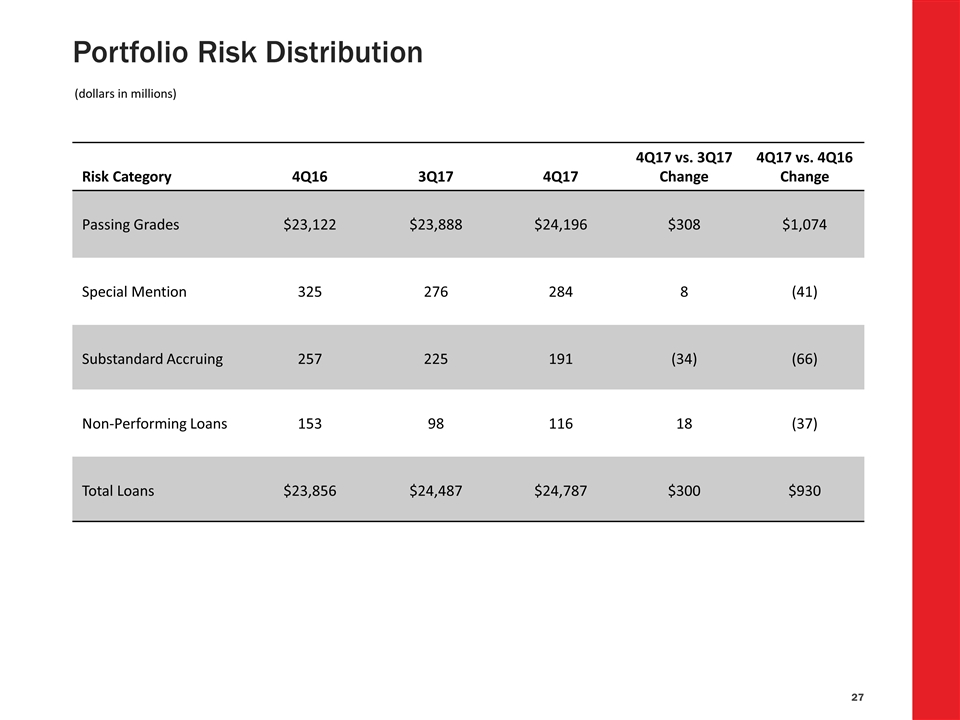
Portfolio Risk Distribution Risk Category 4Q16 3Q17 4Q17 4Q17 vs. 3Q17 Change 4Q17 vs. 4Q16 Change Passing Grades $23,122 $23,888 $24,196 $308 $1,074 Special Mention 325 276 284 8 (41) Substandard Accruing 257 225 191 (34) (66) Non-Performing Loans 153 98 116 18 (37) Total Loans $23,856 $24,487 $24,787 $300 $930 (dollars in millions)

Loan Loss Reserve Coverage Trends (Excluding NPLs for which the expected loss has been charged off) (dollars in millions) 1.06 % % % % %
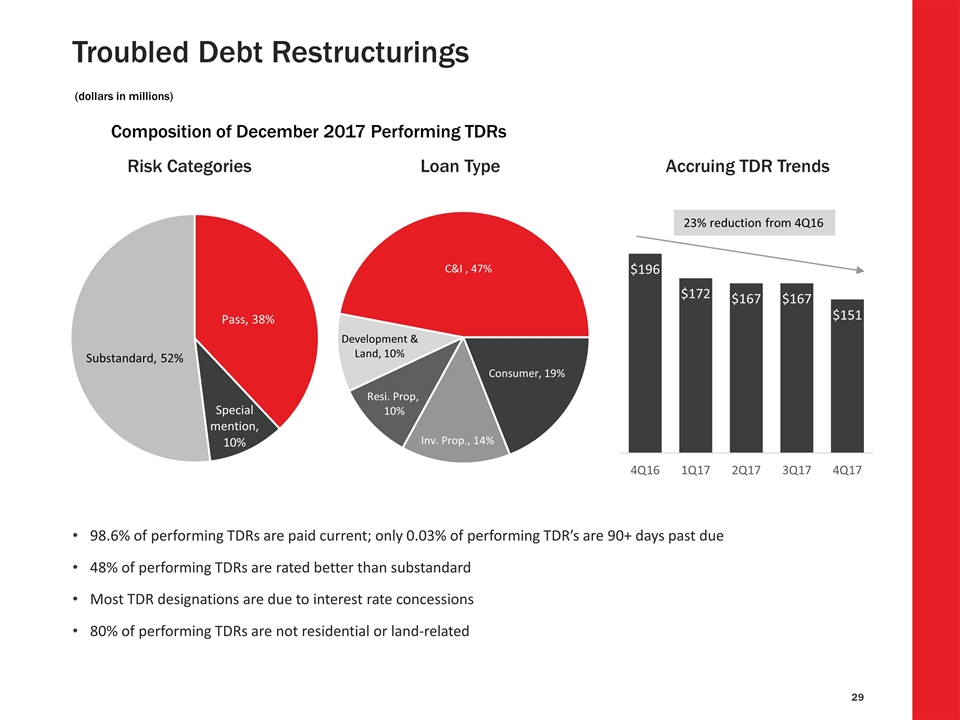
Troubled Debt Restructurings 98.6% of performing TDRs are paid current; only 0.03% of performing TDR’s are 90+ days past due 48% of performing TDRs are rated better than substandard Most TDR designations are due to interest rate concessions 80% of performing TDRs are not residential or land-related Accruing TDR Trends Loan Type 23% reduction from 4Q16 Risk Categories Composition of December 2017 Performing TDRs (dollars in millions)
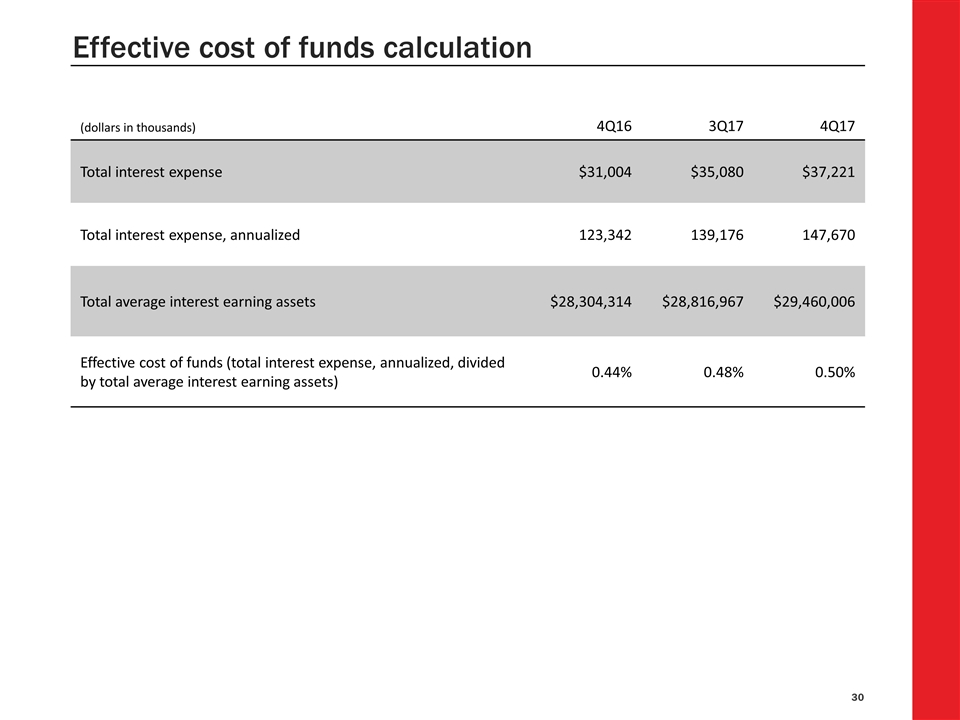
Effective cost of funds calculation (dollars in thousands) 4Q16 3Q17 4Q17 Total interest expense $31,004 $35,080 $37,221 Total interest expense, annualized 123,342 139,176 147,670 Total average interest earning assets $28,304,314 $28,816,967 $29,460,006 Effective cost of funds (total interest expense, annualized, divided by total average interest earning assets) 0.44% 0.48% 0.50%
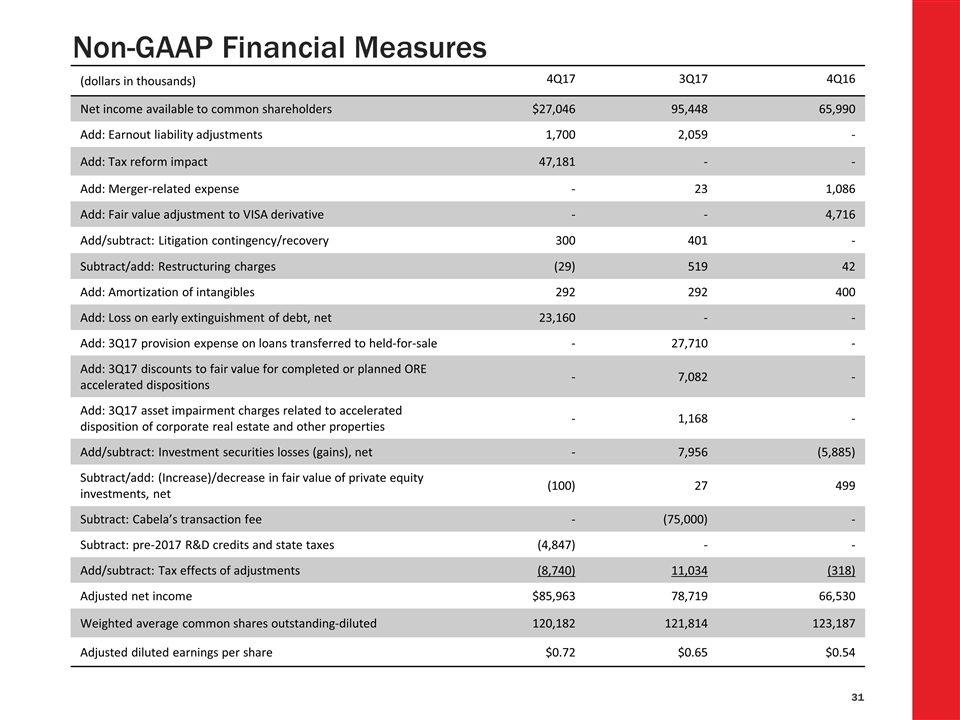
Non-GAAP Financial Measures (dollars in thousands) 4Q17 3Q17 4Q16 Net income available to common shareholders $27,046 95,448 65,990 Add: Earnout liability adjustments 1,700 2,059 - Add: Tax reform impact 47,181 - - Add: Merger-related expense - 23 1,086 Add: Fair value adjustment to VISA derivative - - 4,716 Add/subtract: Litigation contingency/recovery 300 401 - Subtract/add: Restructuring charges (29) 519 42 Add: Amortization of intangibles 292 292 400 Add: Loss on early extinguishment of debt, net 23,160 - - Add: 3Q17 provision expense on loans transferred to held-for-sale - 27,710 - Add: 3Q17 discounts to fair value for completed or planned ORE accelerated dispositions - 7,082 - Add: 3Q17 asset impairment charges related to accelerated disposition of corporate real estate and other properties - 1,168 - Add/subtract: Investment securities losses (gains), net - 7,956 (5,885) Subtract/add: (Increase)/decrease in fair value of private equity investments, net (100) 27 499 Subtract: Cabela’s transaction fee - (75,000) - Subtract: pre-2017 R&D credits and state taxes (4,847) - - Add/subtract: Tax effects of adjustments (8,740) 11,034 (318) Adjusted net income $85,963 78,719 66,530 Weighted average common shares outstanding-diluted 120,182 121,814 123,187 Adjusted diluted earnings per share $0.72 $0.65 $0.54
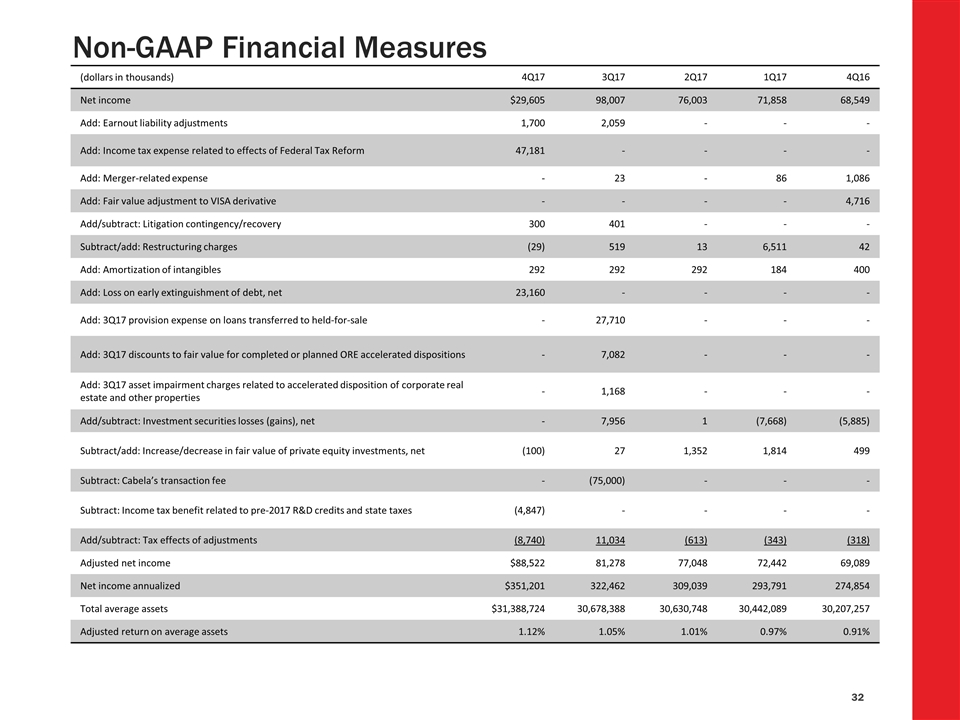
Non-GAAP Financial Measures (dollars in thousands) 4Q17 3Q17 2Q17 1Q17 4Q16 Net income $29,605 98,007 76,003 71,858 68,549 Add: Earnout liability adjustments 1,700 2,059 - - - Add: Income tax expense related to effects of Federal Tax Reform 47,181 - - - - Add: Merger-related expense - 23 - 86 1,086 Add: Fair value adjustment to VISA derivative - - - - 4,716 Add/subtract: Litigation contingency/recovery 300 401 - - - Subtract/add: Restructuring charges (29) 519 13 6,511 42 Add: Amortization of intangibles 292 292 292 184 400 Add: Loss on early extinguishment of debt, net 23,160 - - - - Add: 3Q17 provision expense on loans transferred to held-for-sale - 27,710 - - - Add: 3Q17 discounts to fair value for completed or planned ORE accelerated dispositions - 7,082 - - - Add: 3Q17 asset impairment charges related to accelerated disposition of corporate real estate and other properties - 1,168 - - - Add/subtract: Investment securities losses (gains), net - 7,956 1 (7,668) (5,885) Subtract/add: Increase/decrease in fair value of private equity investments, net (100) 27 1,352 1,814 499 Subtract: Cabela’s transaction fee - (75,000) - - - Subtract: Income tax benefit related to pre-2017 R&D credits and state taxes (4,847) - - - - Add/subtract: Tax effects of adjustments (8,740) 11,034 (613) (343) (318) Adjusted net income $88,522 81,278 77,048 72,442 69,089 Net income annualized $351,201 322,462 309,039 293,791 274,854 Total average assets $31,388,724 30,678,388 30,630,748 30,442,089 30,207,257 Adjusted return on average assets 1.12% 1.05% 1.01% 0.97% 0.91%
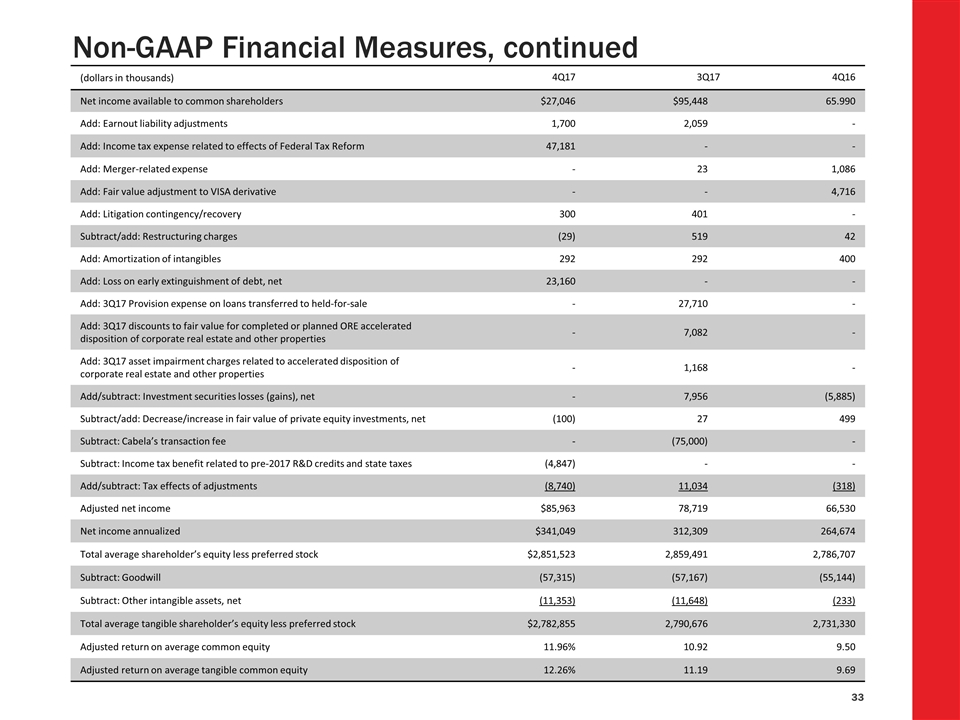
Non-GAAP Financial Measures, continued (dollars in thousands) 4Q17 3Q17 4Q16 Net income available to common shareholders $27,046 $95,448 65.990 Add: Earnout liability adjustments 1,700 2,059 - Add: Income tax expense related to effects of Federal Tax Reform 47,181 - - Add: Merger-related expense - 23 1,086 Add: Fair value adjustment to VISA derivative - - 4,716 Add: Litigation contingency/recovery 300 401 - Subtract/add: Restructuring charges (29) 519 42 Add: Amortization of intangibles 292 292 400 Add: Loss on early extinguishment of debt, net 23,160 - - Add: 3Q17 Provision expense on loans transferred to held-for-sale - 27,710 - Add: 3Q17 discounts to fair value for completed or planned ORE accelerated disposition of corporate real estate and other properties - 7,082 - Add: 3Q17 asset impairment charges related to accelerated disposition of corporate real estate and other properties - 1,168 - Add/subtract: Investment securities losses (gains), net - 7,956 (5,885) Subtract/add: Decrease/increase in fair value of private equity investments, net (100) 27 499 Subtract: Cabela’s transaction fee - (75,000) - Subtract: Income tax benefit related to pre-2017 R&D credits and state taxes (4,847) - - Add/subtract: Tax effects of adjustments (8,740) 11,034 (318) Adjusted net income $85,963 78,719 66,530 Net income annualized $341,049 312,309 264,674 Total average shareholder’s equity less preferred stock $2,851,523 2,859,491 2,786,707 Subtract: Goodwill (57,315) (57,167) (55,144) Subtract: Other intangible assets, net (11,353) (11,648) (233) Total average tangible shareholder’s equity less preferred stock $2,782,855 2,790,676 2,731,330 Adjusted return on average common equity 11.96% 10.92 9.50 Adjusted return on average tangible common equity 12.26% 11.19 9.69
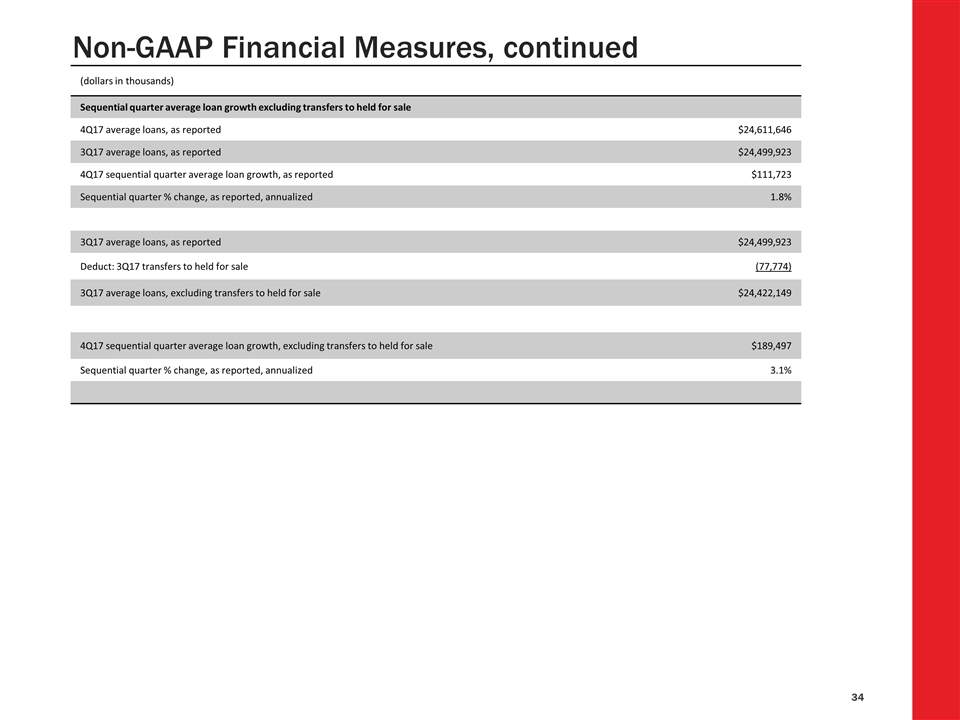
Non-GAAP Financial Measures, continued (dollars in thousands) Sequential quarter average loan growth excluding transfers to held for sale 4Q17 average loans, as reported $24,611,646 3Q17 average loans, as reported $24,499,923 4Q17 sequential quarter average loan growth, as reported $111,723 Sequential quarter % change, as reported, annualized 1.8% 3Q17 average loans, as reported $24,499,923 Deduct: 3Q17 transfers to held for sale (77,774) 3Q17 average loans, excluding transfers to held for sale $24,422,149 4Q17 sequential quarter average loan growth, excluding transfers to held for sale $189,497 Sequential quarter % change, as reported, annualized 3.1%

Non-GAAP Financial Measures, continued (dollars in thousands) 4Q16 3Q17 4Q17 Total interest expense $31,004 $35,080 $37,221 Total interest expense, annualized 123,342 139,176 147,670 Total average interest bearing liabilities 19,791,377 20,158,170 20,563,212 Cost of funds rate 0.62% 0.69% 0.72% Total interest expense $31,004 $35,080 $37,221 Subtract: Interest on long-term debt (14,823) (14,240) (11,698) Subtract: Interest on brokered deposits (2,176) (3,872) (7,886) Subtract: Interest on federal funds purchased and securities sold under repurchase agreements (47) (42) (73) Interest expense on interest bearing core deposits 13,958 16,926 17,565 Interest expense on interest bearing core deposits, annualized 55,529 67,152 69,687 Total average interest bearing liabilities 19,791,377 20,158,170 20,563,212 Subtract: Average long-term debt (2,190,716) (1,985,175) (1,713,982) Subtract: Average brokered deposits (1,380,931) (1,530,889) (2,198,333) Subtract: Average federal funds purchased and securities sold under repurchase agreements (219,429) (191,585) (184,369) Total average interest bearing core deposits 16,000,301 $16,450,521 16,466,528 Cost of interest bearing core deposits 0.35% 0.41% 0.42%
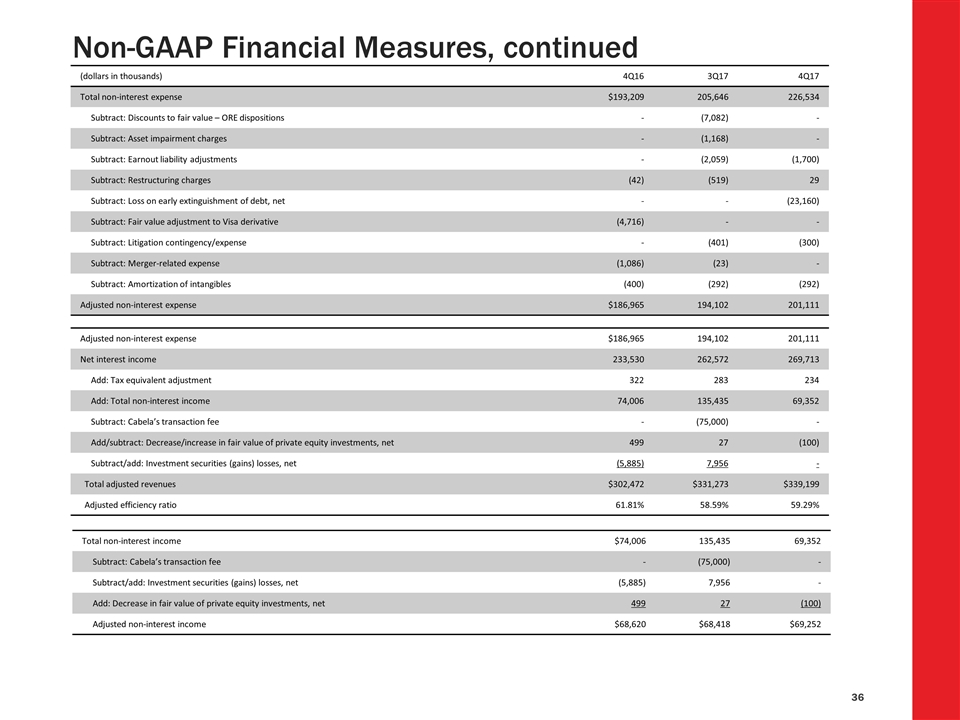
Non-GAAP Financial Measures, continued (dollars in thousands) 4Q16 3Q17 4Q17 Total non-interest expense $193,209 205,646 226,534 Subtract: Discounts to fair value – ORE dispositions - (7,082) - Subtract: Asset impairment charges - (1,168) - Subtract: Earnout liability adjustments - (2,059) (1,700) Subtract: Restructuring charges (42) (519) 29 Subtract: Loss on early extinguishment of debt, net - - (23,160) Subtract: Fair value adjustment to Visa derivative (4,716) - - Subtract: Litigation contingency/expense - (401) (300) Subtract: Merger-related expense (1,086) (23) - Subtract: Amortization of intangibles (400) (292) (292) Adjusted non-interest expense $186,965 194,102 201,111 Adjusted non-interest expense $186,965 194,102 201,111 Net interest income 233,530 262,572 269,713 Add: Tax equivalent adjustment 322 283 234 Add: Total non-interest income 74,006 135,435 69,352 Subtract: Cabela’s transaction fee - (75,000) - Add/subtract: Decrease/increase in fair value of private equity investments, net 499 27 (100) Subtract/add: Investment securities (gains) losses, net (5,885) 7,956 - Total adjusted revenues $302,472 $331,273 $339,199 Adjusted efficiency ratio 61.81% 58.59% 59.29% Total non-interest income $74,006 135,435 69,352 Subtract: Cabela’s transaction fee - (75,000) - Subtract/add: Investment securities (gains) losses, net (5,885) 7,956 - Add: Decrease in fair value of private equity investments, net 499 27 (100) Adjusted non-interest income $68,620 $68,418 $69,252
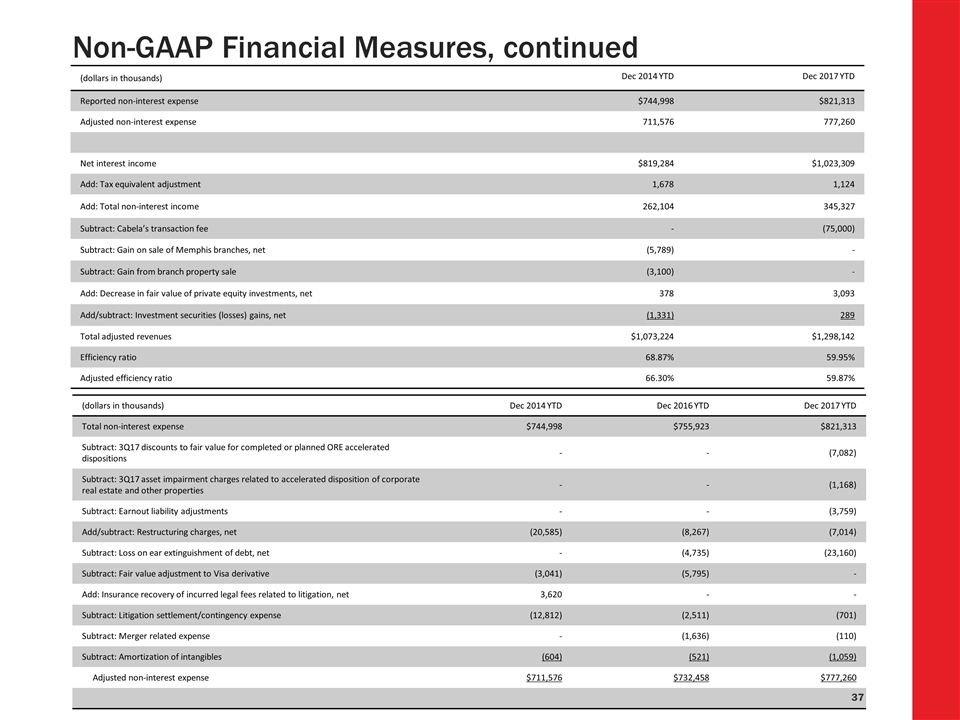
Non-GAAP Financial Measures, continued (dollars in thousands) Dec 2014 YTD Dec 2017 YTD Reported non-interest expense $744,998 $821,313 Adjusted non-interest expense 711,576 777,260 Net interest income $819,284 $1,023,309 Add: Tax equivalent adjustment 1,678 1,124 Add: Total non-interest income 262,104 345,327 Subtract: Cabela’s transaction fee - (75,000) Subtract: Gain on sale of Memphis branches, net (5,789) - Subtract: Gain from branch property sale (3,100) - Add: Decrease in fair value of private equity investments, net 378 3,093 Add/subtract: Investment securities (losses) gains, net (1,331) 289 Total adjusted revenues $1,073,224 $1,298,142 Efficiency ratio 68.87% 59.95% Adjusted efficiency ratio 66.30% 59.87% (dollars in thousands) Dec 2014 YTD Dec 2016 YTD Dec 2017 YTD Total non-interest expense $744,998 $755,923 $821,313 Subtract: 3Q17 discounts to fair value for completed or planned ORE accelerated dispositions - - (7,082) Subtract: 3Q17 asset impairment charges related to accelerated disposition of corporate real estate and other properties - - (1,168) Subtract: Earnout liability adjustments - - (3,759) Add/subtract: Restructuring charges, net (20,585) (8,267) (7,014) Subtract: Loss on ear extinguishment of debt, net - (4,735) (23,160) Subtract: Fair value adjustment to Visa derivative (3,041) (5,795) - Add: Insurance recovery of incurred legal fees related to litigation, net 3,620 - - Subtract: Litigation settlement/contingency expense (12,812) (2,511) (701) Subtract: Merger related expense - (1,636) (110) Subtract: Amortization of intangibles (604) (521) (1,059) Adjusted non-interest expense $711,576 $732,458 $777,260
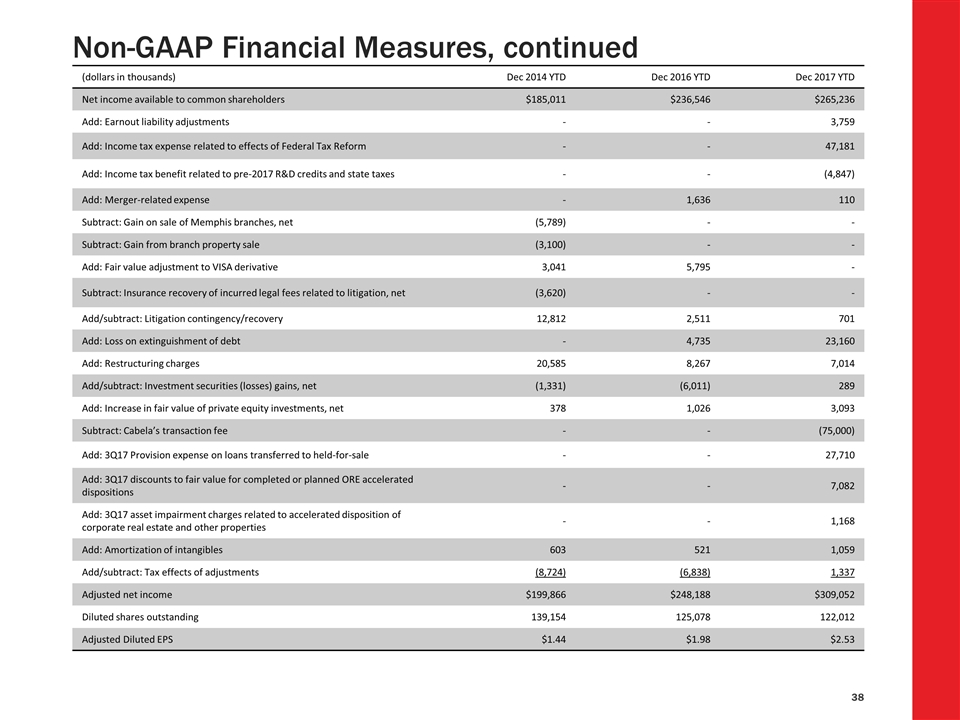
Non-GAAP Financial Measures, continued (dollars in thousands) Dec 2014 YTD Dec 2016 YTD Dec 2017 YTD Net income available to common shareholders $185,011 $236,546 $265,236 Add: Earnout liability adjustments - - 3,759 Add: Income tax expense related to effects of Federal Tax Reform - - 47,181 Add: Income tax benefit related to pre-2017 R&D credits and state taxes - - (4,847) Add: Merger-related expense - 1,636 110 Subtract: Gain on sale of Memphis branches, net (5,789) - - Subtract: Gain from branch property sale (3,100) - - Add: Fair value adjustment to VISA derivative 3,041 5,795 - Subtract: Insurance recovery of incurred legal fees related to litigation, net (3,620) - - Add/subtract: Litigation contingency/recovery 12,812 2,511 701 Add: Loss on extinguishment of debt - 4,735 23,160 Add: Restructuring charges 20,585 8,267 7,014 Add/subtract: Investment securities (losses) gains, net (1,331) (6,011) 289 Add: Increase in fair value of private equity investments, net 378 1,026 3,093 Subtract: Cabela’s transaction fee - - (75,000) Add: 3Q17 Provision expense on loans transferred to held-for-sale - - 27,710 Add: 3Q17 discounts to fair value for completed or planned ORE accelerated dispositions - - 7,082 Add: 3Q17 asset impairment charges related to accelerated disposition of corporate real estate and other properties - - 1,168 Add: Amortization of intangibles 603 521 1,059 Add/subtract: Tax effects of adjustments (8,724) (6,838) 1,337 Adjusted net income $199,866 $248,188 $309,052 Diluted shares outstanding 139,154 125,078 122,012 Adjusted Diluted EPS $1.44 $1.98 $2.53
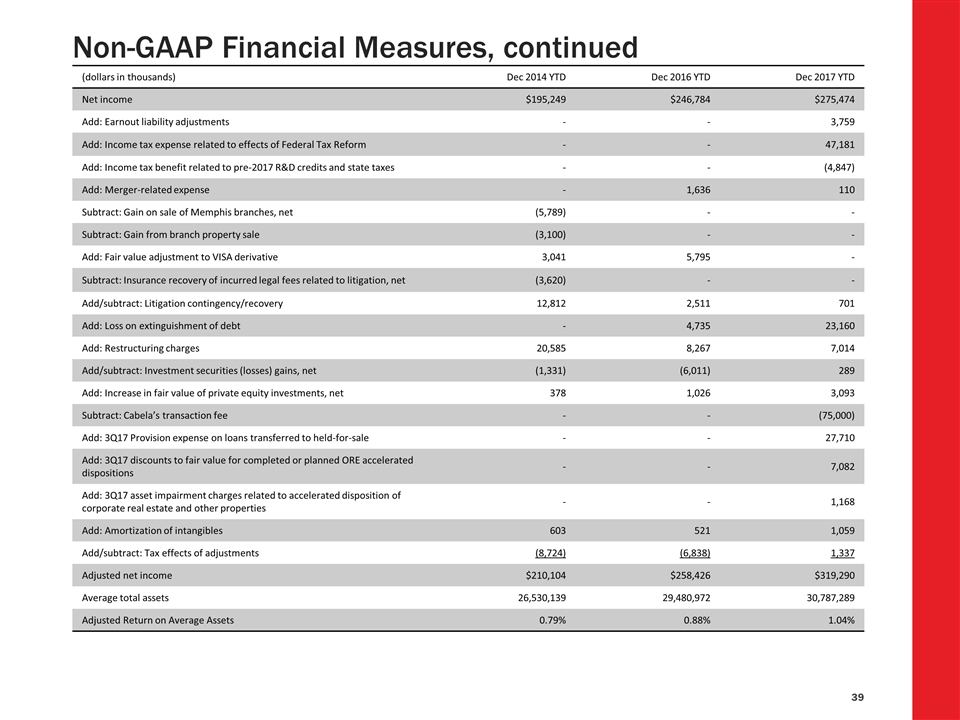
Non-GAAP Financial Measures, continued (dollars in thousands) Dec 2014 YTD Dec 2016 YTD Dec 2017 YTD Net income $195,249 $246,784 $275,474 Add: Earnout liability adjustments - - 3,759 Add: Income tax expense related to effects of Federal Tax Reform - - 47,181 Add: Income tax benefit related to pre-2017 R&D credits and state taxes - - (4,847) Add: Merger-related expense - 1,636 110 Subtract: Gain on sale of Memphis branches, net (5,789) - - Subtract: Gain from branch property sale (3,100) - - Add: Fair value adjustment to VISA derivative 3,041 5,795 - Subtract: Insurance recovery of incurred legal fees related to litigation, net (3,620) - - Add/subtract: Litigation contingency/recovery 12,812 2,511 701 Add: Loss on extinguishment of debt - 4,735 23,160 Add: Restructuring charges 20,585 8,267 7,014 Add/subtract: Investment securities (losses) gains, net (1,331) (6,011) 289 Add: Increase in fair value of private equity investments, net 378 1,026 3,093 Subtract: Cabela’s transaction fee - - (75,000) Add: 3Q17 Provision expense on loans transferred to held-for-sale - - 27,710 Add: 3Q17 discounts to fair value for completed or planned ORE accelerated dispositions - - 7,082 Add: 3Q17 asset impairment charges related to accelerated disposition of corporate real estate and other properties - - 1,168 Add: Amortization of intangibles 603 521 1,059 Add/subtract: Tax effects of adjustments (8,724) (6,838) 1,337 Adjusted net income $210,104 $258,426 $319,290 Average total assets 26,530,139 29,480,972 30,787,289 Adjusted Return on Average Assets 0.79% 0.88% 1.04%
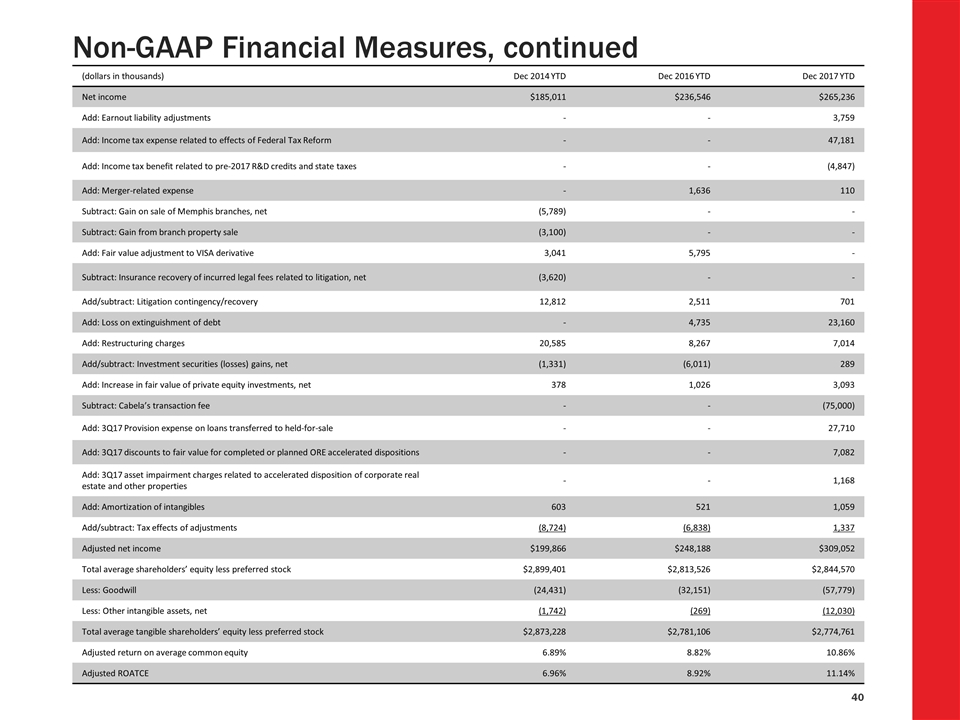
Non-GAAP Financial Measures, continued (dollars in thousands) Dec 2014 YTD Dec 2016 YTD Dec 2017 YTD Net income $185,011 $236,546 $265,236 Add: Earnout liability adjustments - - 3,759 Add: Income tax expense related to effects of Federal Tax Reform - - 47,181 Add: Income tax benefit related to pre-2017 R&D credits and state taxes - - (4,847) Add: Merger-related expense - 1,636 110 Subtract: Gain on sale of Memphis branches, net (5,789) - - Subtract: Gain from branch property sale (3,100) - - Add: Fair value adjustment to VISA derivative 3,041 5,795 - Subtract: Insurance recovery of incurred legal fees related to litigation, net (3,620) - - Add/subtract: Litigation contingency/recovery 12,812 2,511 701 Add: Loss on extinguishment of debt - 4,735 23,160 Add: Restructuring charges 20,585 8,267 7,014 Add/subtract: Investment securities (losses) gains, net (1,331) (6,011) 289 Add: Increase in fair value of private equity investments, net 378 1,026 3,093 Subtract: Cabela’s transaction fee - - (75,000) Add: 3Q17 Provision expense on loans transferred to held-for-sale - - 27,710 Add: 3Q17 discounts to fair value for completed or planned ORE accelerated dispositions - - 7,082 Add: 3Q17 asset impairment charges related to accelerated disposition of corporate real estate and other properties - - 1,168 Add: Amortization of intangibles 603 521 1,059 Add/subtract: Tax effects of adjustments (8,724) (6,838) 1,337 Adjusted net income $199,866 $248,188 $309,052 Total average shareholders’ equity less preferred stock $2,899,401 $2,813,526 $2,844,570 Less: Goodwill (24,431) (32,151) (57,779) Less: Other intangible assets, net (1,742) (269) (12,030) Total average tangible shareholders’ equity less preferred stock $2,873,228 $2,781,106 $2,774,761 Adjusted return on average common equity 6.89% 8.82% 10.86% Adjusted ROATCE 6.96% 8.92% 11.14%
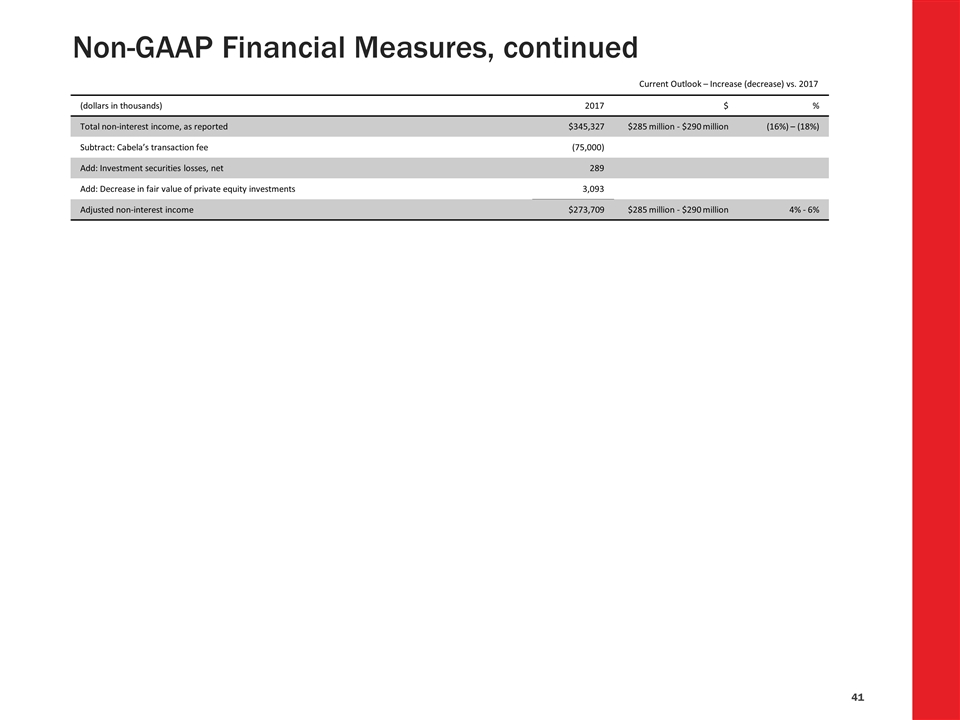
Non-GAAP Financial Measures, continued (dollars in thousands) 2017 $ % Total non-interest income, as reported $345,327 $285 million - $290 million (16%) – (18%) Subtract: Cabela’s transaction fee (75,000) Add: Investment securities losses, net 289 Add: Decrease in fair value of private equity investments 3,093 Adjusted non-interest income $273,709 $285 million - $290 million 4% - 6% Current Outlook – Increase (decrease) vs. 2017
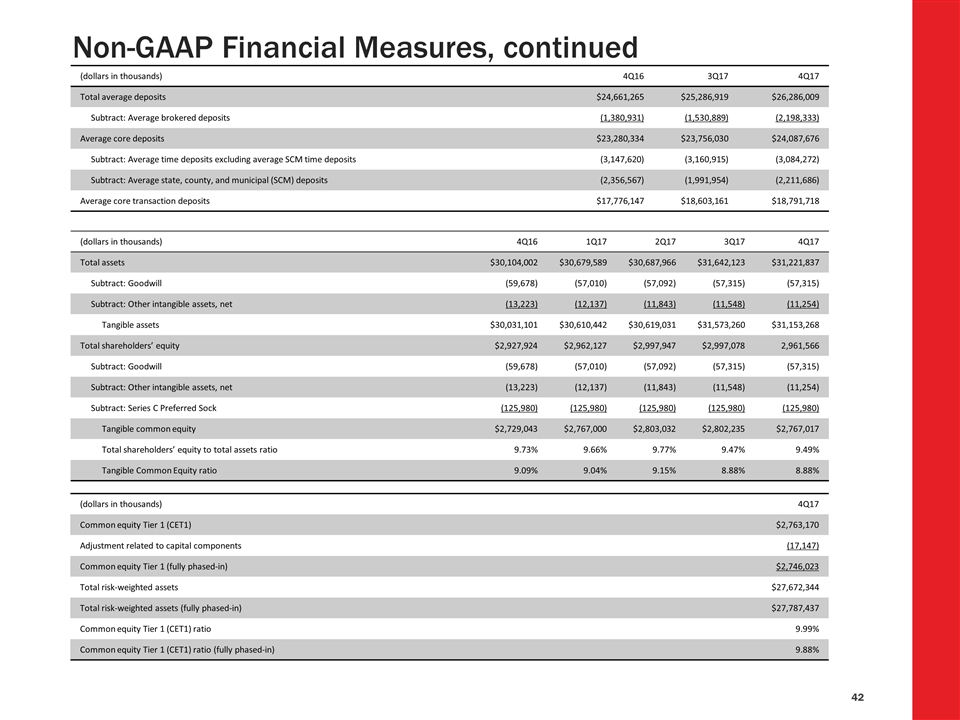
Non-GAAP Financial Measures, continued (dollars in thousands) 4Q16 3Q17 4Q17 Total average deposits $24,661,265 $25,286,919 $26,286,009 Subtract: Average brokered deposits (1,380,931) (1,530,889) (2,198,333) Average core deposits $23,280,334 $23,756,030 $24,087,676 Subtract: Average time deposits excluding average SCM time deposits (3,147,620) (3,160,915) (3,084,272) Subtract: Average state, county, and municipal (SCM) deposits (2,356,567) (1,991,954) (2,211,686) Average core transaction deposits $17,776,147 $18,603,161 $18,791,718 (dollars in thousands) 4Q16 1Q17 2Q17 3Q17 4Q17 Total assets $30,104,002 $30,679,589 $30,687,966 $31,642,123 $31,221,837 Subtract: Goodwill (59,678) (57,010) (57,092) (57,315) (57,315) Subtract: Other intangible assets, net (13,223) (12,137) (11,843) (11,548) (11,254) Tangible assets $30,031,101 $30,610,442 $30,619,031 $31,573,260 $31,153,268 Total shareholders’ equity $2,927,924 $2,962,127 $2,997,947 $2,997,078 2,961,566 Subtract: Goodwill (59,678) (57,010) (57,092) (57,315) (57,315) Subtract: Other intangible assets, net (13,223) (12,137) (11,843) (11,548) (11,254) Subtract: Series C Preferred Sock (125,980) (125,980) (125,980) (125,980) (125,980) Tangible common equity $2,729,043 $2,767,000 $2,803,032 $2,802,235 $2,767,017 Total shareholders’ equity to total assets ratio 9.73% 9.66% 9.77% 9.47% 9.49% Tangible Common Equity ratio 9.09% 9.04% 9.15% 8.88% 8.88% (dollars in thousands) 4Q17 Common equity Tier 1 (CET1) $2,763,170 Adjustment related to capital components (17,147) Common equity Tier 1 (fully phased-in) $2,746,023 Total risk-weighted assets $27,672,344 Total risk-weighted assets (fully phased-in) $27,787,437 Common equity Tier 1 (CET1) ratio 9.99% Common equity Tier 1 (CET1) ratio (fully phased-in) 9.88%


