Exhibit 99.2
Global Leader in Small Satellites |
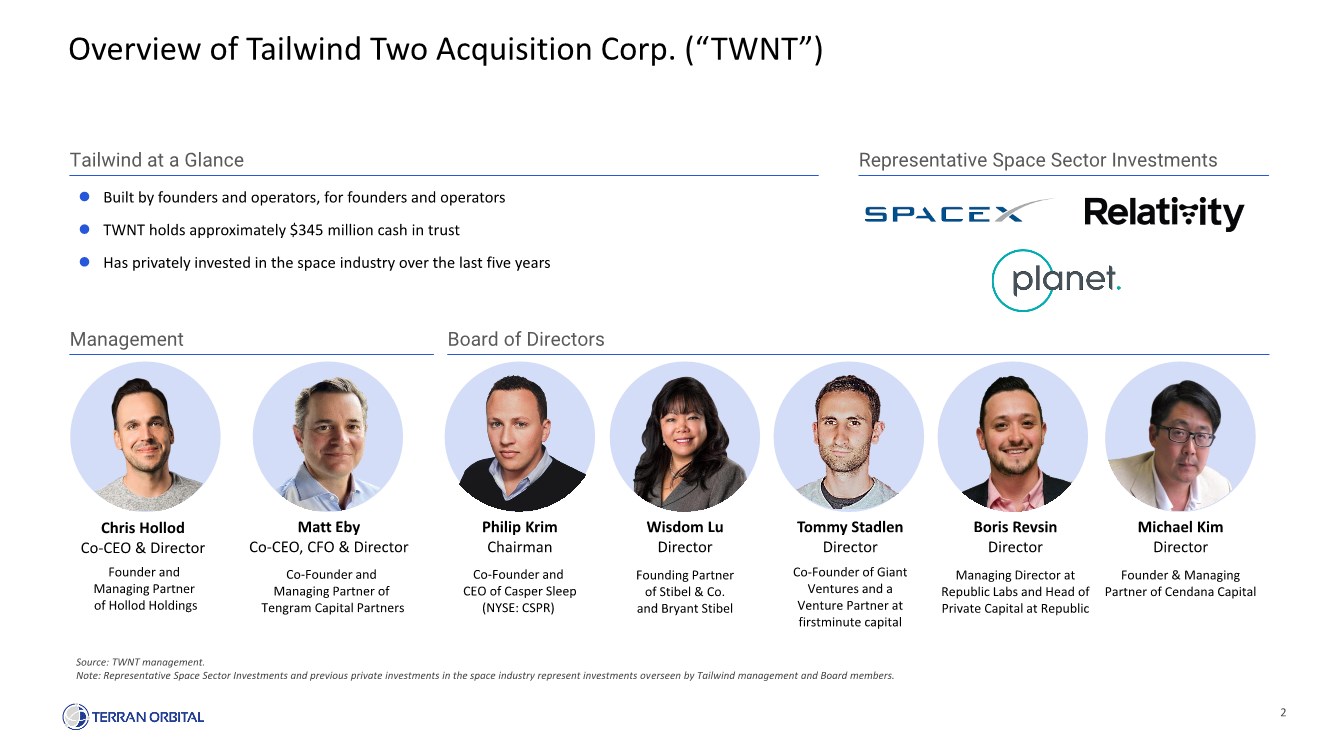
2 Overview of Tailwind Two Acquisition Corp. (“TWNT”) Founder and Managing Partner of Hollod Holdings Chris Hollod Co-CEO & Director Co-Founder and Managing Partner of Tengram Capital Partners Matt Eby Co-CEO, CFO & Director Co-Founder and CEO of Casper Sleep (NYSE: CSPR) Philip Krim Chairman Founding Partner of Stibel & Co. and Bryant Stibel Wisdom Lu Director Co-Founder of Giant Ventures and a Venture Partner at firstminute capital Tommy Stadlen Director Managing Director at Republic Labs and Head of Private Capital at Republic Boris Revsin Director Founder & Managing Partner of Cendana Capital Michael Kim Director ⚫ Built by founders and operators, for founders and operators ⚫ TWNT holds approximately $345 million cash in trust ⚫ Has privately invested in the space industry over the last five years Tailwind at a Glance Management Board of Directors Representative Space Sector Investments Source: TWNT management. Note: Representative Space Sector Investments and previous private investments in the space industry represent investments overseen by Tailwind management and Board members. |
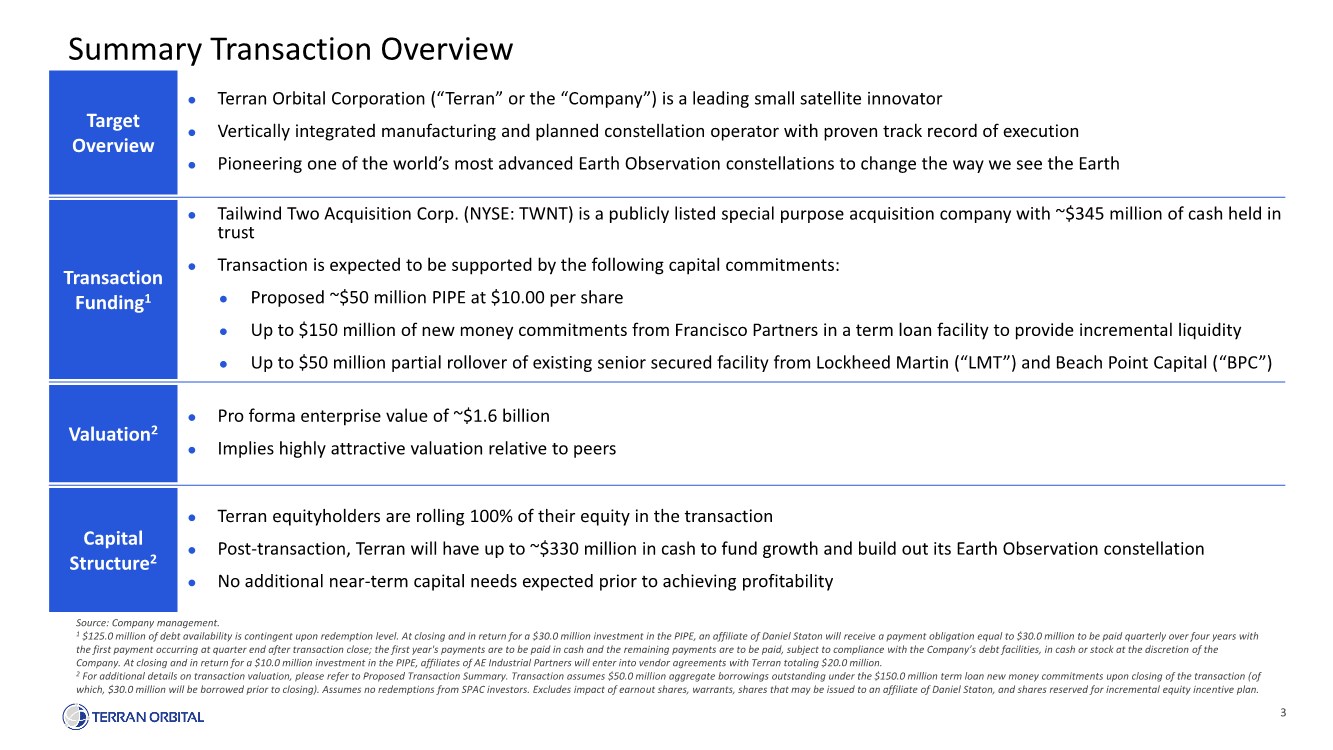
3 Summary Transaction Overview Source: Company management. 1 $125.0 million of debt availability is contingent upon redemption level. At closing and in return for a $30.0 million investment in the PIPE, an affiliate of Daniel Staton will receive a payment obligation equal to $30.0 million to be paid quarterly over four years with the first payment occurring at quarter end after transaction close; the first year's payments are to be paid in cash and the remaining payments are to be paid, subject to compliance with the Company’s debt facilities, in cash or stock at the discretion of the Company. At closing and in return for a $10.0 million investment in the PIPE, affiliates of AE Industrial Partners will enter into vendor agreements with Terran totaling $20.0 million. 2 For additional details on transaction valuation, please refer to Proposed Transaction Summary. Transaction assumes $50.0 million aggregate borrowings outstanding under the $150.0 million term loan new money commitments upon closing of the transaction (of which, $30.0 million will be borrowed prior to closing). Assumes no redemptions from SPAC investors. Excludes impact of earnout shares, warrants, shares that may be issued to an affiliate of Daniel Staton, and shares reserved for incremental equity incentive plan. Target Overview ⚫ Terran Orbital Corporation (“Terran” or the “Company”) is a leading small satellite innovator ⚫ Vertically integrated manufacturing and planned constellation operator with proven track record of execution ⚫ Pioneering one of the world’s most advanced Earth Observation constellations to change the way we see the Earth Transaction Funding1 ⚫ Tailwind Two Acquisition Corp. (NYSE: TWNT) is a publicly listed special purpose acquisition company with ~$345 million of cash held in trust ⚫ Transaction is expected to be supported by the following capital commitments: ⚫ Proposed ~$50 million PIPE at $10.00 per share ⚫ Up to $150 million of new money commitments from Francisco Partners in a term loan facility to provide incremental liquidity ⚫ Up to $50 million partial rollover of existing senior secured facility from Lockheed Martin (“LMT”) and Beach Point Capital (“BPC”) Valuation2 ⚫ Pro forma enterprise value of ~$1.6 billion ⚫ Implies highly attractive valuation relative to peers Capital Structure2 ⚫ Terran equityholders are rolling 100% of their equity in the transaction ⚫ Post-transaction, Terran will have up to ~$330 million in cash to fund growth and build out its Earth Observation constellation ⚫ No additional near-term capital needs expected prior to achieving profitability |
Opening Remarks |
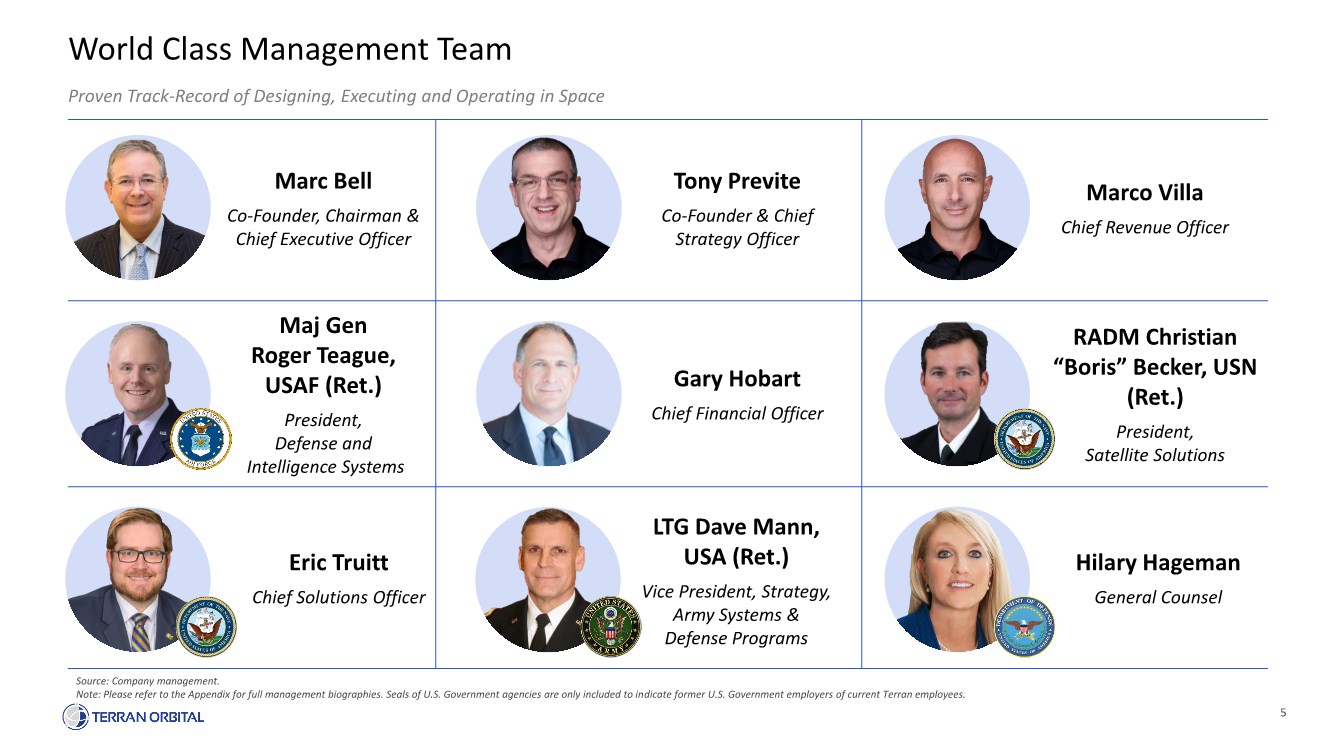
5 Proven Track-Record of Designing, Executing and Operating in Space World Class Management Team Source: Company management. Note: Please refer to the Appendix for full management biographies. Seals of U.S. Government agencies are only included to indicate former U.S. Government employers of current Terran employees. Marc Bell Co-Founder, Chairman & Chief Executive Officer Tony Previte Co-Founder & Chief Strategy Officer Marco Villa Chief Revenue Officer Gary Hobart Chief Financial Officer Maj Gen Roger Teague, USAF (Ret.) President, Defense and Intelligence Systems RADM Christian “Boris” Becker, USN (Ret.) President, Satellite Solutions LTG Dave Mann, USA (Ret.) Vice President, Strategy, Army Systems & Defense Programs Eric Truitt Chief Solutions Officer Hilary Hageman General Counsel |
6 Building One of the Most Advanced Earth Observation Constellations Source: Company management. A Global Leader in Small Satellites |
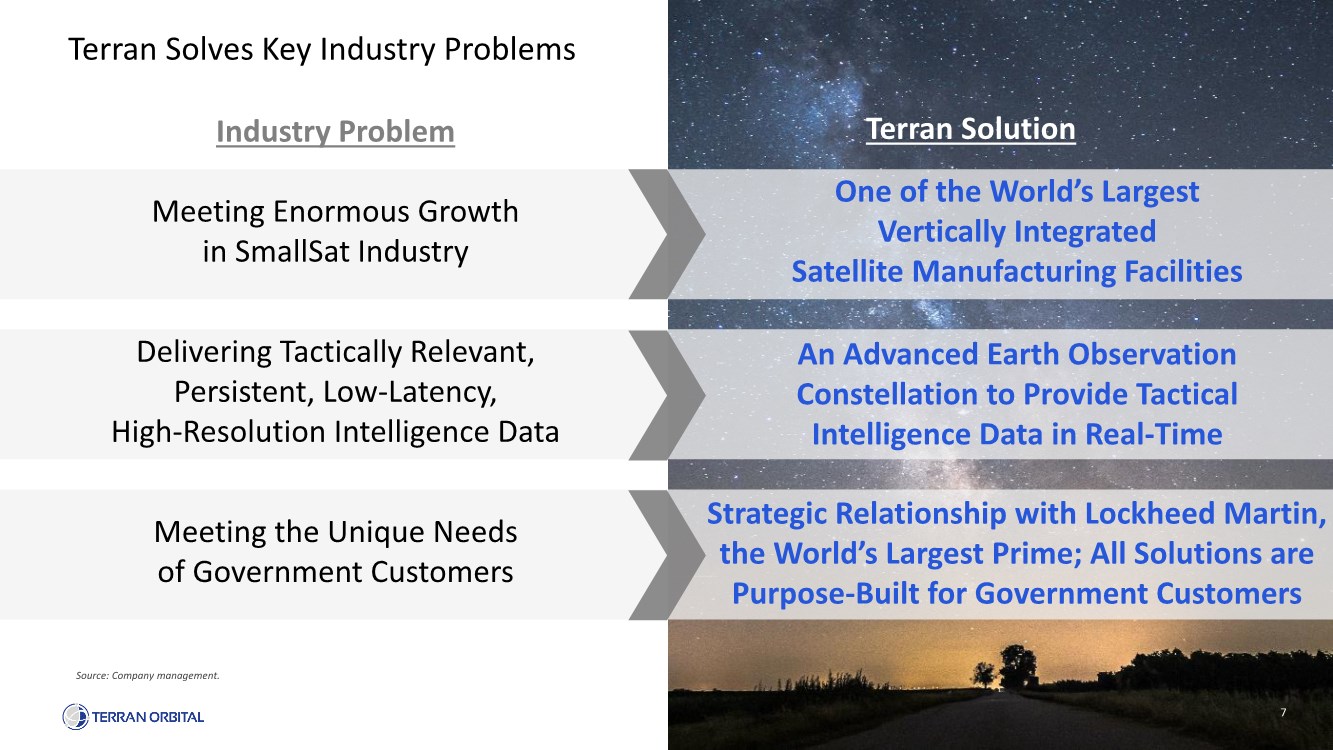
7 7 Terran Solves Key Industry Problems Meeting Enormous Growth in SmallSat Industry Industry Problem Terran Solution One of the World’s Largest Vertically Integrated Satellite Manufacturing Facilities Meeting the Unique Needs of Government Customers Strategic Relationship with Lockheed Martin, the World’s Largest Prime; All Solutions are Purpose-Built for Government Customers Delivering Tactically Relevant, Persistent, Low-Latency, High-Resolution Intelligence Data An Advanced Earth Observation Constellation to Provide Tactical Intelligence Data in Real-Time Source: Company management. |
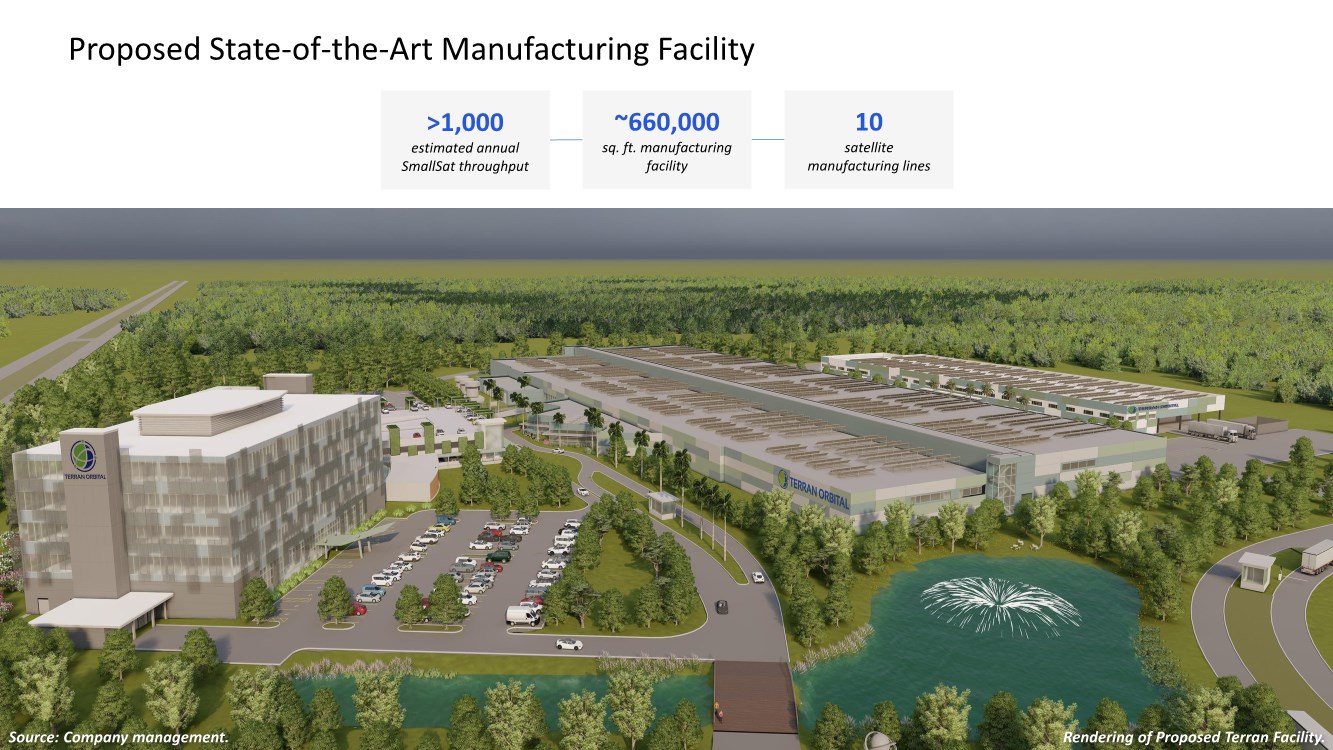
8 Proposed State-of-the-Art Manufacturing Facility Rendering of Proposed Terran Facility. Source: Company management. ~660,000 sq. ft. manufacturing facility 10 satellite manufacturing lines >1,000 estimated annual SmallSat throughput |
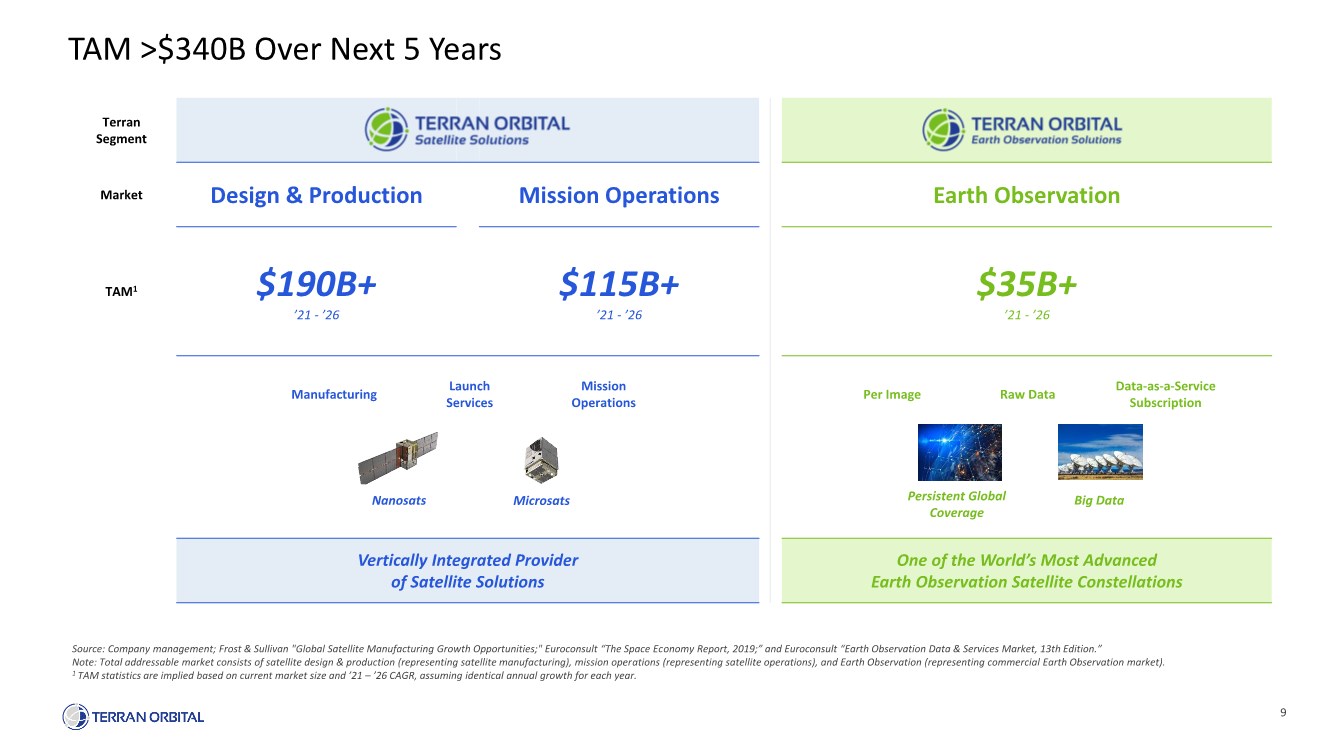
9 TAM >$340B Over Next 5 Years Source: Company management; Frost & Sullivan "Global Satellite Manufacturing Growth Opportunities;" Euroconsult “The Space Economy Report, 2019;” and Euroconsult “Earth Observation Data & Services Market, 13th Edition.” Note: Total addressable market consists of satellite design & production (representing satellite manufacturing), mission operations (representing satellite operations), and Earth Observation (representing commercial Earth Observation market). 1 TAM statistics are implied based on current market size and ’21 –’26 CAGR, assuming identical annual growth for each year. Terran Segment Market Design & Production Mission Operations Earth Observation TAM1 $190B+ ’21 -’26 $115B+ ’21 -’26 $35B+ ’21 -’26 Vertically Integrated Provider of Satellite Solutions One of the World’s Most Advanced Earth Observation Satellite Constellations Microsats Nanosats Manufacturing Mission Operations Launch Services Per Image Data-as-a-Service Subscription Raw Data Big Data Persistent Global Coverage |
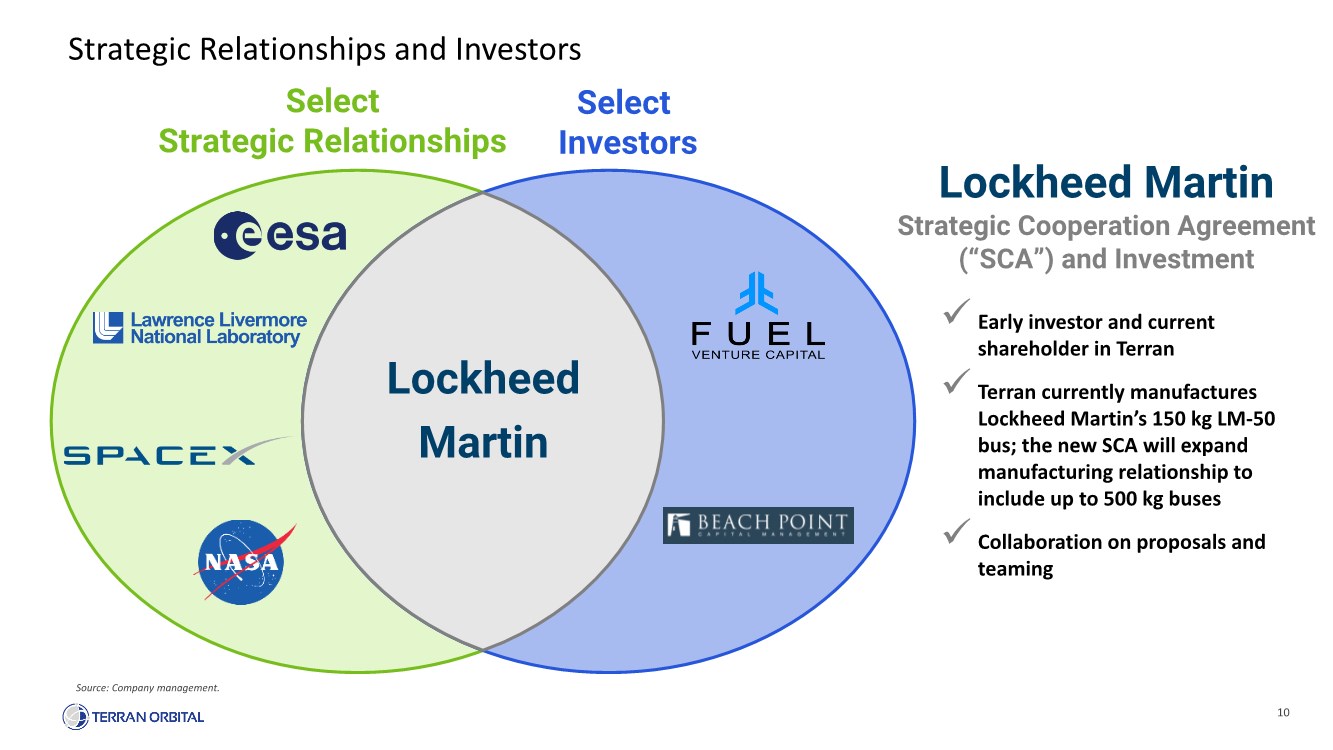
10 Strategic Relationships and Investors Select Strategic Relationships Select Investors Strategic Cooperation Agreement (“SCA”) and Investment ✓ Early investor and current shareholder in Terran ✓ Terran currently manufactures Lockheed Martin’s 150 kg LM-50 bus; the new SCA will expand manufacturing relationship to include up to 500 kg buses ✓ Collaboration on proposals and teaming Source: Company management. Lockheed Martin Lockheed Martin |
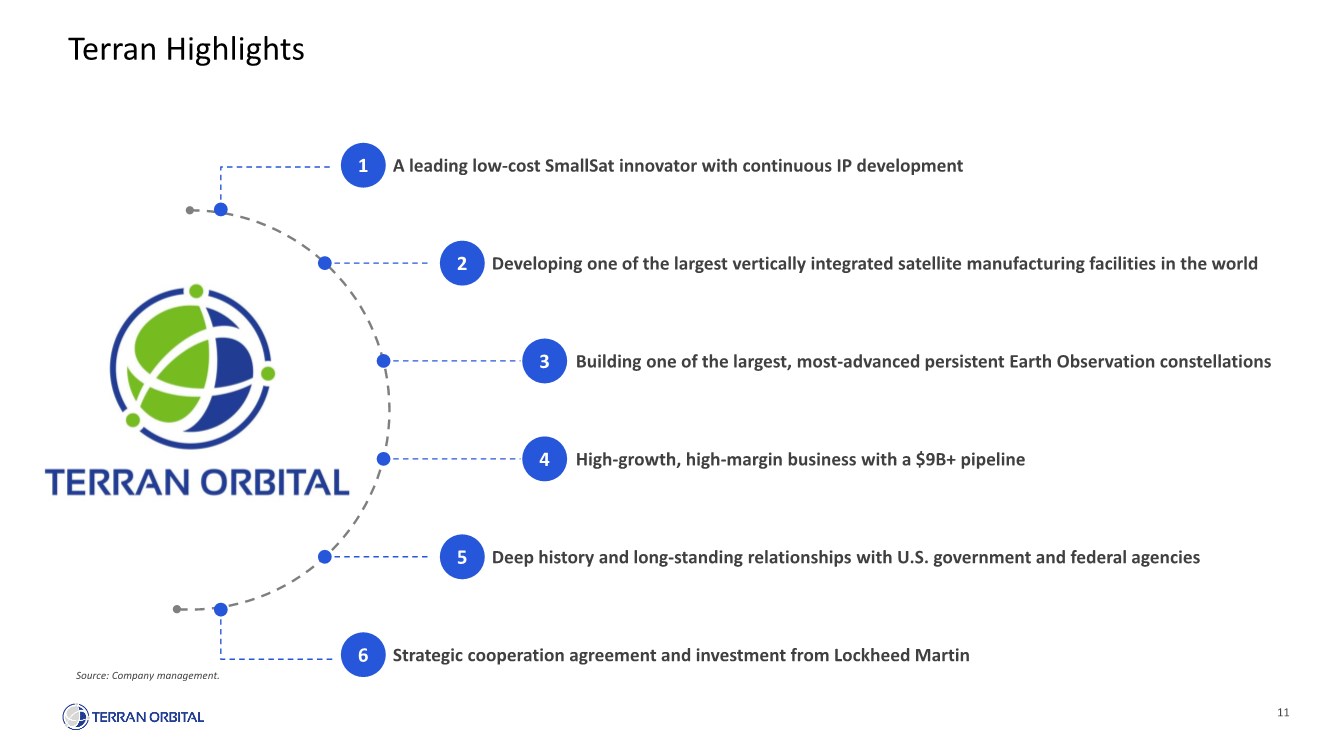
11 Terran Highlights A leading low-cost SmallSat innovator with continuous IP development Developing one of the largest vertically integrated satellite manufacturing facilities in the world Building one of the largest, most-advanced persistent Earth Observation constellations High-growth, high-margin business with a $9B+ pipeline Deep history and long-standing relationships with U.S. government and federal agencies Strategic cooperation agreement and investment from Lockheed Martin 1 2 3 4 5 6 Source: Company management. |
Vertically Integrated Provider of Satellite Solutions |
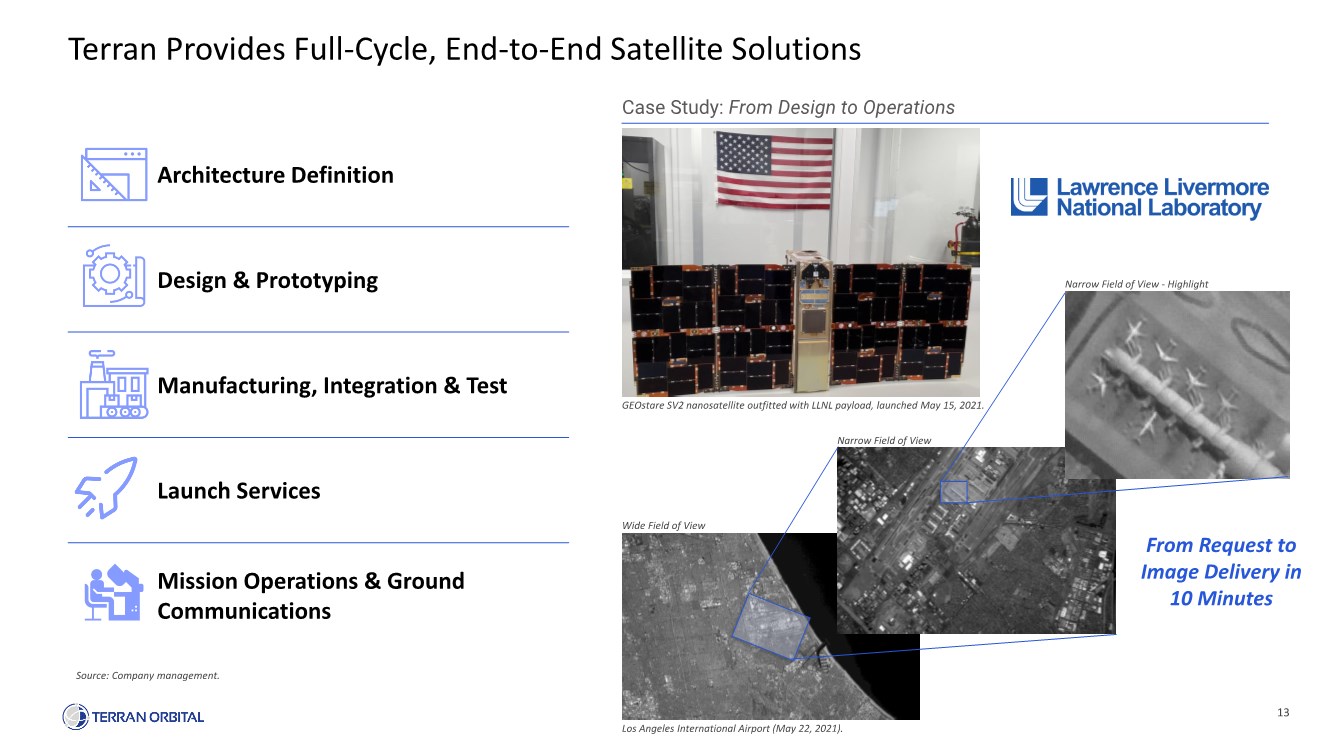
13 Architecture Definition Design & Prototyping Manufacturing, Integration & Test Launch Services Mission Operations & Ground Communications Terran Provides Full-Cycle, End-to-End Satellite Solutions Source: Company management. GEOstare SV2 nanosatellite outfitted with LLNL payload, launched May 15, 2021. Case Study: From Design to Operations Wide Field of View Narrow Field of View Narrow Field of View - Highlight From Request to Image Delivery in 10 Minutes Los Angeles International Airport (May 22, 2021). |
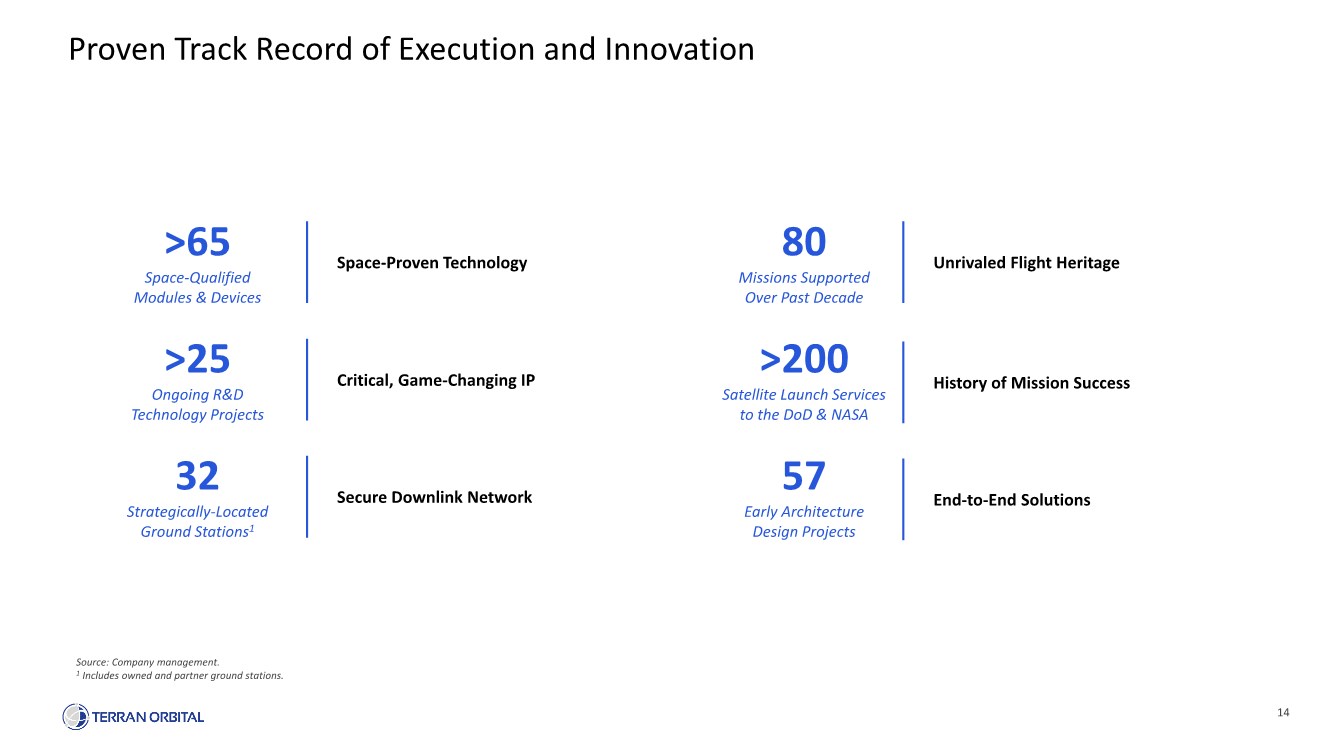
14 Proven Track Record of Execution and Innovation Source: Company management. 1 Includes owned and partner ground stations. Unrivaled Flight Heritage 80 Missions Supported Over Past Decade End-to-End Solutions 57 Early Architecture Design Projects Space-Proven Technology >65 Space-Qualified Modules & Devices Critical, Game-Changing IP >25 Ongoing R&D Technology Projects Secure Downlink Network 32 Strategically-Located Ground Stations1 History of Mission Success >200 Satellite Launch Services to the DoD & NASA |
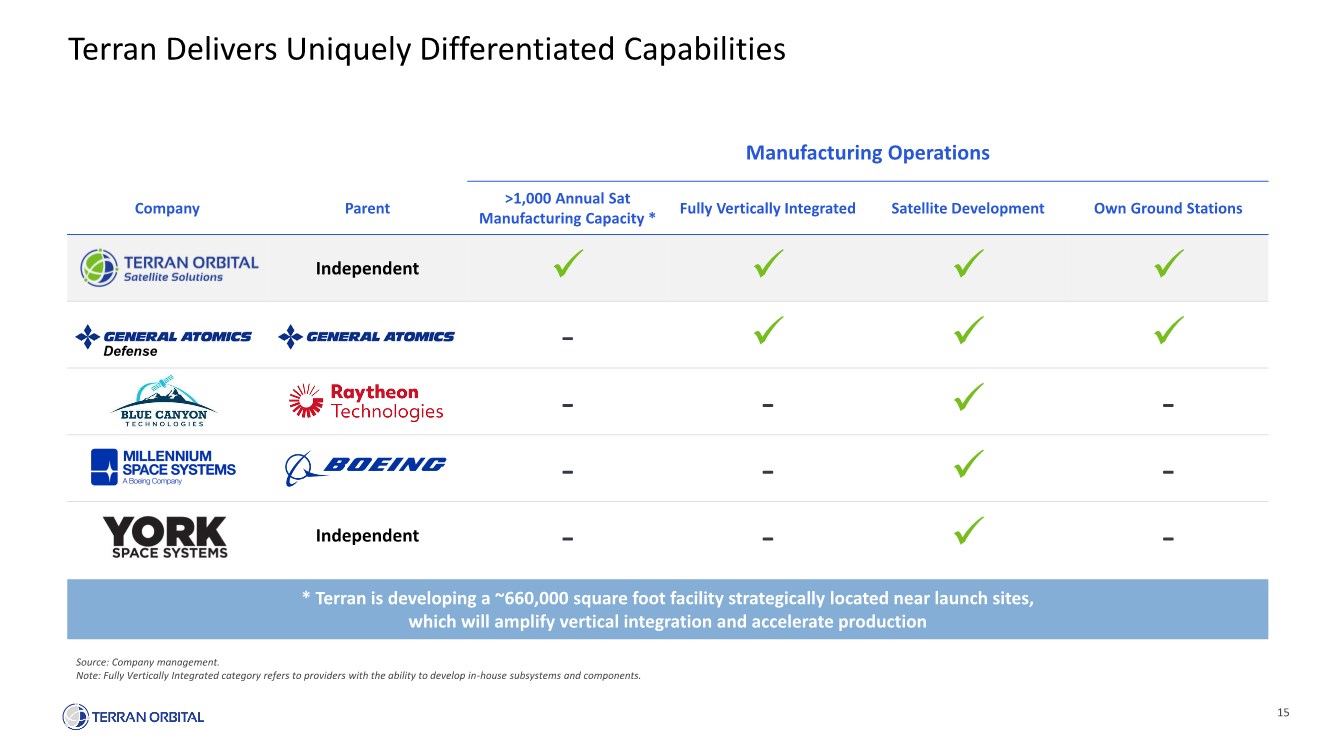
15 Source: Company management. Note: Fully Vertically Integrated category refers to providers with the ability to develop in-house subsystems and components. Terran Delivers Uniquely Differentiated Capabilities * Terran is developing a ~660,000 square foot facility strategically located near launch sites, which will amplify vertical integration and accelerate production Manufacturing Operations Company Parent >1,000 Annual Sat Manufacturing Capacity * Fully Vertically Integrated Satellite Development Own Ground Stations Independent ✓ ✓ ✓ ✓ - ✓ ✓ ✓ -- ✓ - -- ✓ - Independent -- ✓ - Defense |
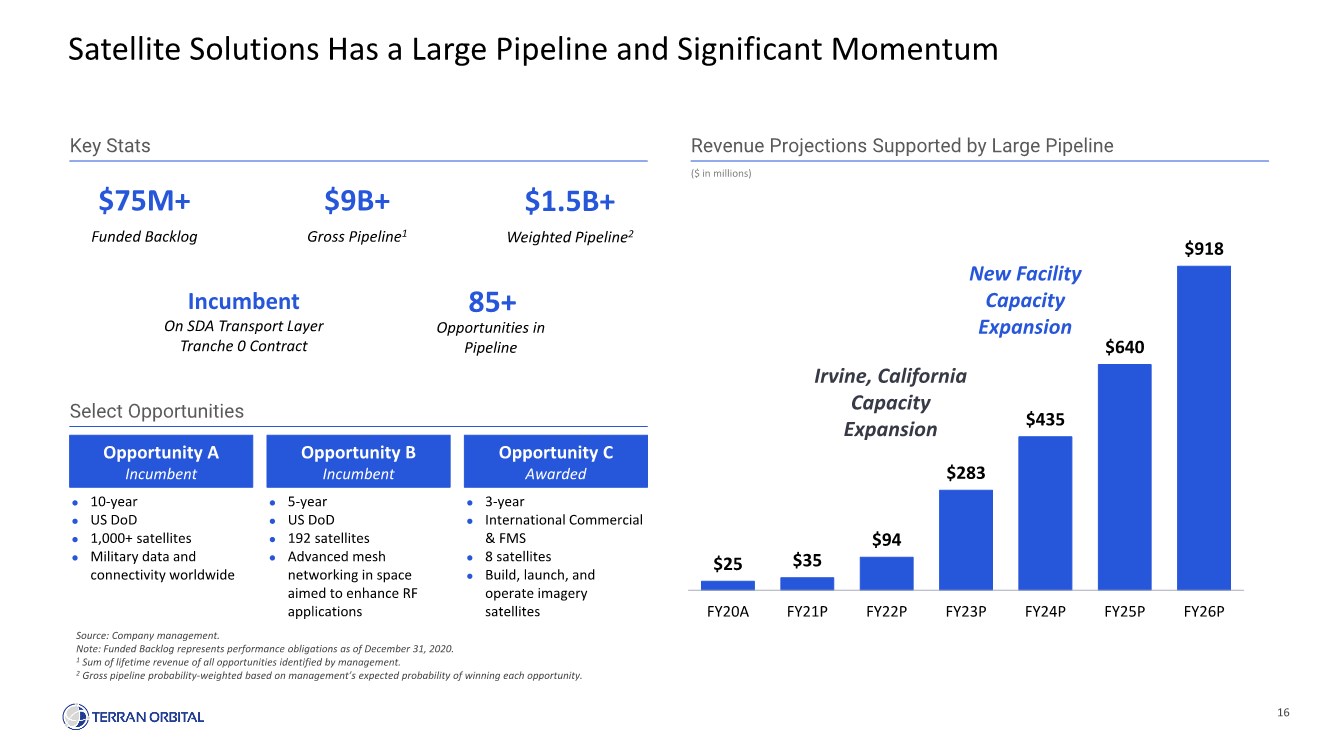
16 Satellite Solutions Has a Large Pipeline and Significant Momentum Key Stats Revenue Projections Supported by Large Pipeline Select Opportunities Opportunity A Incumbent ⚫ 10-year ⚫ US DoD ⚫ 1,000+ satellites ⚫ Military data and connectivity worldwide Opportunity B Incumbent ⚫ 5-year ⚫ US DoD ⚫ 192 satellites ⚫ Advanced mesh networking in space aimed to enhance RF applications Opportunity C Awarded ⚫ 3-year ⚫ International Commercial & FMS ⚫ 8 satellites ⚫ Build, launch, and operate imagery satellites $25 $35 $94 $283 $435 $640 $918 FY20A FY21P FY22P FY23P FY24P FY25P FY26P Funded Backlog $75M+ Gross Pipeline1 $9B+ Weighted Pipeline2 $1.5B+ Incumbent On SDA Transport Layer Tranche 0 Contract 85+ Opportunities in Pipeline Irvine, California Capacity Expansion New Facility Capacity Expansion ($ in millions) Source: Company management. Note: Funded Backlog represents performance obligations as of December 31, 2020. 1 Sum of lifetime revenue of all opportunities identified by management. 2 Gross pipeline probability-weighted based on management’s expected probability of winning each opportunity. |
Industry-Leading Earth Observation Satellite Constellation |
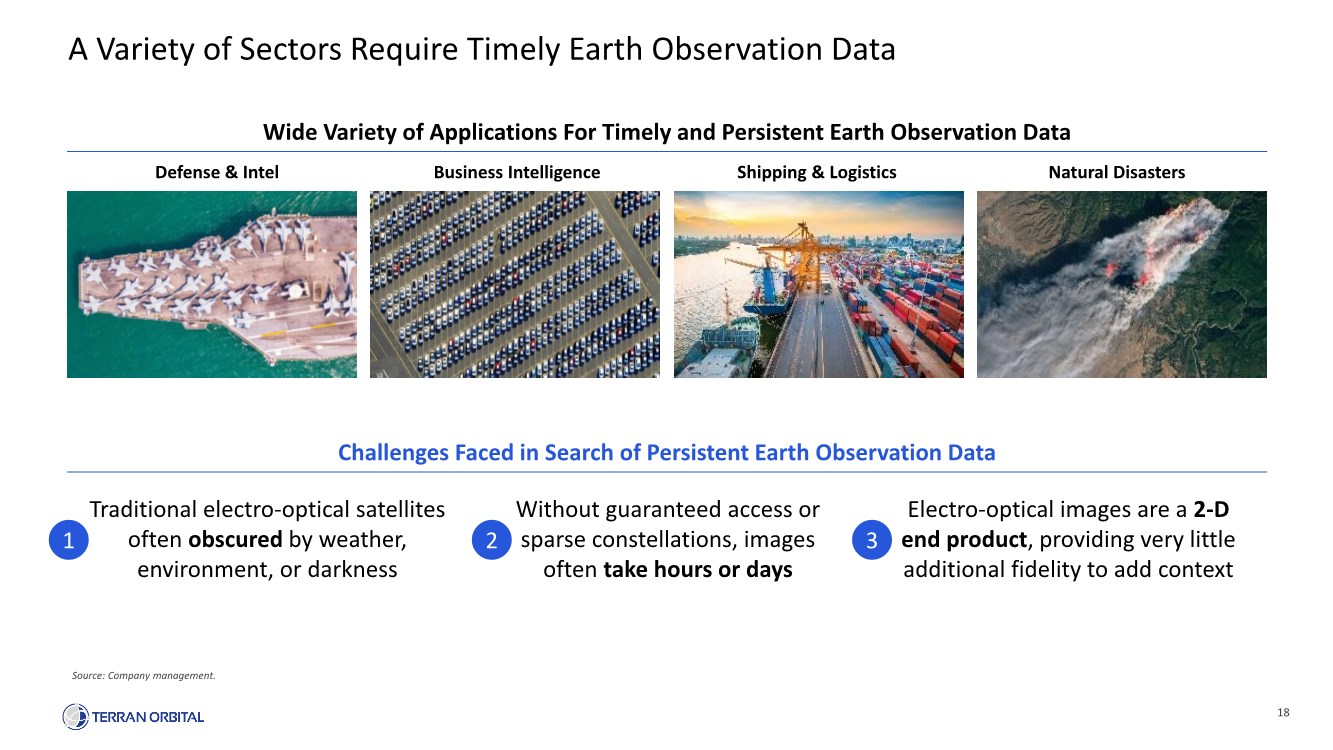
18 A Variety of Sectors Require Timely Earth Observation Data Source: Company management. Wide Variety of Applications For Timely and Persistent Earth Observation Data Challenges Faced in Search of Persistent Earth Observation Data Traditional electro-optical satellites often obscured by weather, environment, or darkness Without guaranteed access or sparse constellations, images often take hours or days Electro-optical images are a 2-D end product, providing very little additional fidelity to add context Defense & Intel Business Intelligence Shipping & Logistics Natural Disasters 1 2 3 |
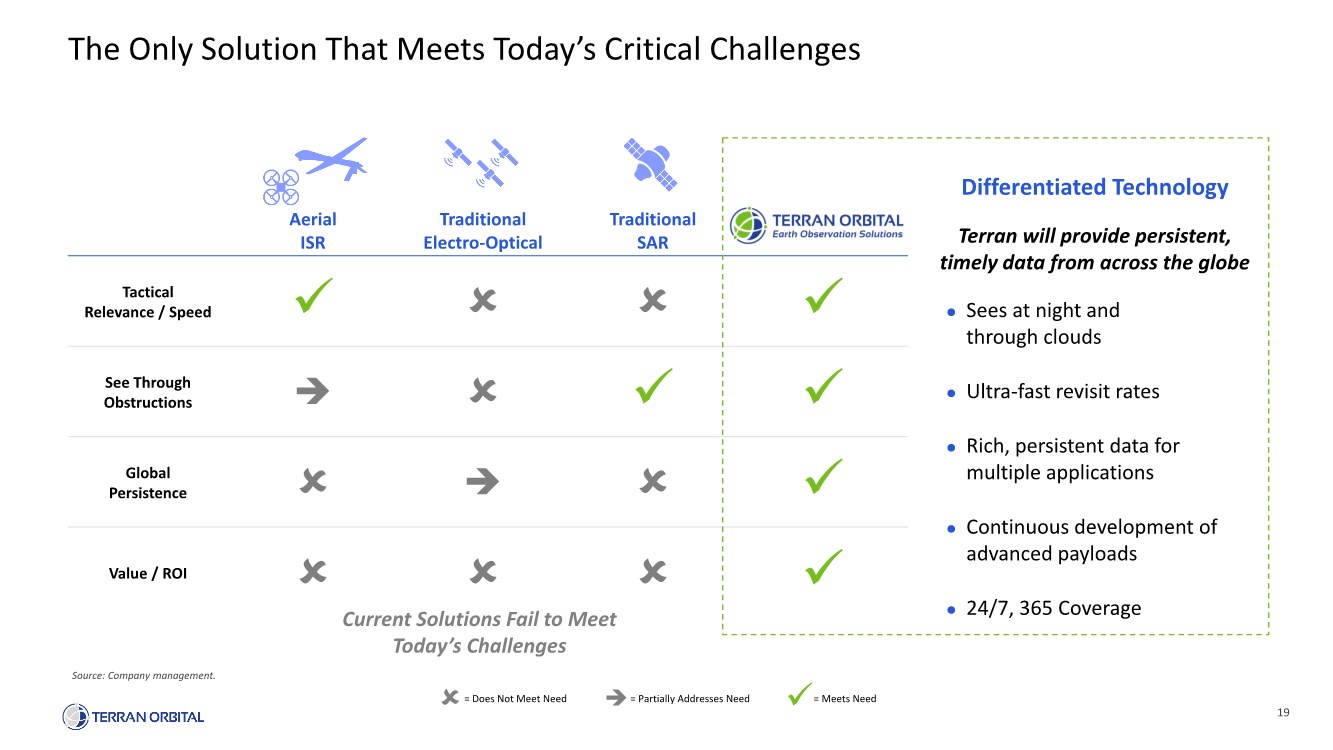
19 The Only Solution That Meets Today’s Critical Challenges Source: Company management. Aerial ISR Traditional Electro-Optical Traditional SAR Tactical Relevance / Speed ✓ See Through Obstructions ➔ ✓ ✓ Global Persistence ➔ ✓ Value / ROI ✓ ⚫ Sees at night and through clouds ⚫ Ultra-fast revisit rates ⚫ Rich, persistent data for multiple applications ⚫ Continuous development of advanced payloads ⚫ 24/7, 365 Coverage Differentiated Technology Terran will provide persistent, timely data from across the globe Current Solutions Fail to Meet Today’s Challenges = Meets Need ✓ = Does Not Meet Need = Partially Addresses Need ➔ |
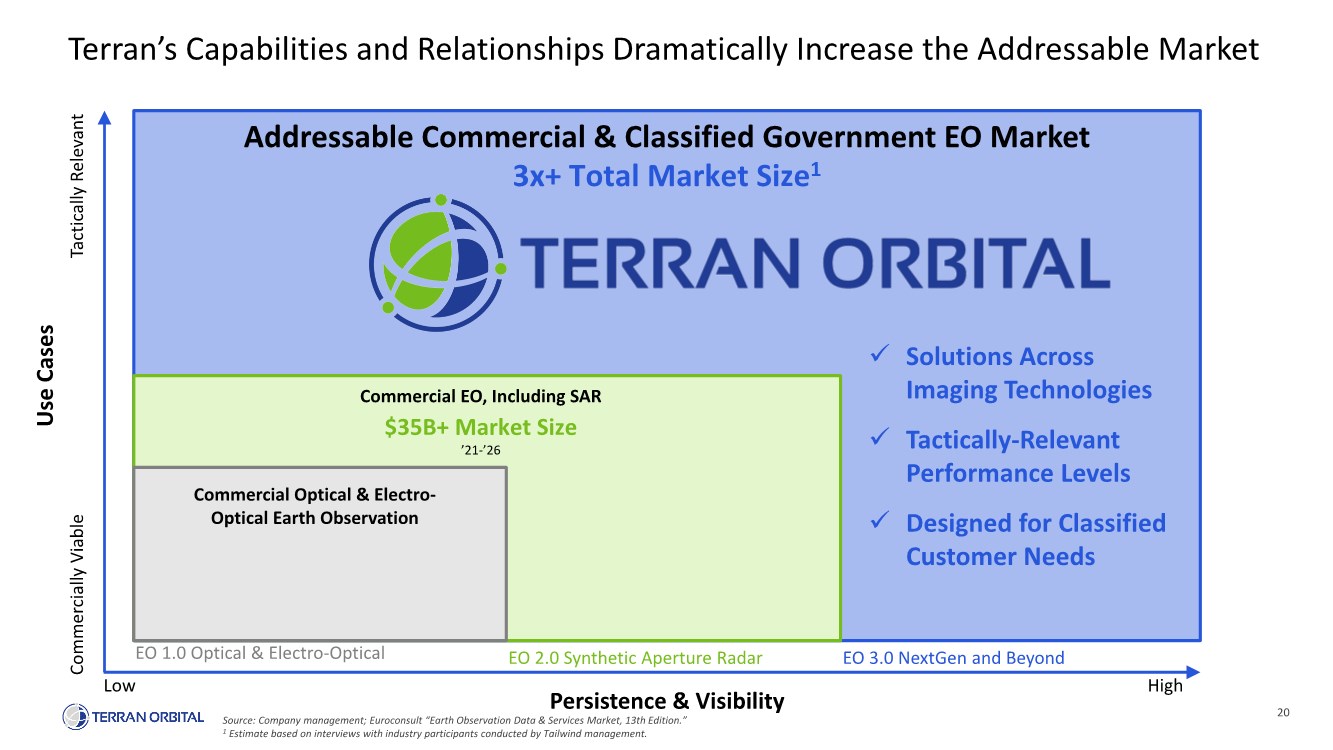
20 Terran’s Capabilities and Relationships Dramatically Increase the Addressable Market Addressable Commercial & Classified Government EO Market Commercial EO, Including SAR Commercial Optical & Electro- Optical Earth Observation $35B+ Market Size ’21-’26 ✓ Solutions Across Imaging Technologies ✓ Tactically-Relevant Performance Levels ✓ Designed for Classified Customer Needs 3x+ Total Market Size1 Use Cases Persistence & Visibility Commercially Viable EO 3.0 NextGen and Beyond EO 2.0 Synthetic Aperture Radar EO 1.0 Optical & Electro-Optical High Low Tactically Relevant Source: Company management; Euroconsult “Earth Observation Data & Services Market, 13th Edition.” 1 Estimate based on interviews with industry participants conducted by Tailwind management. |
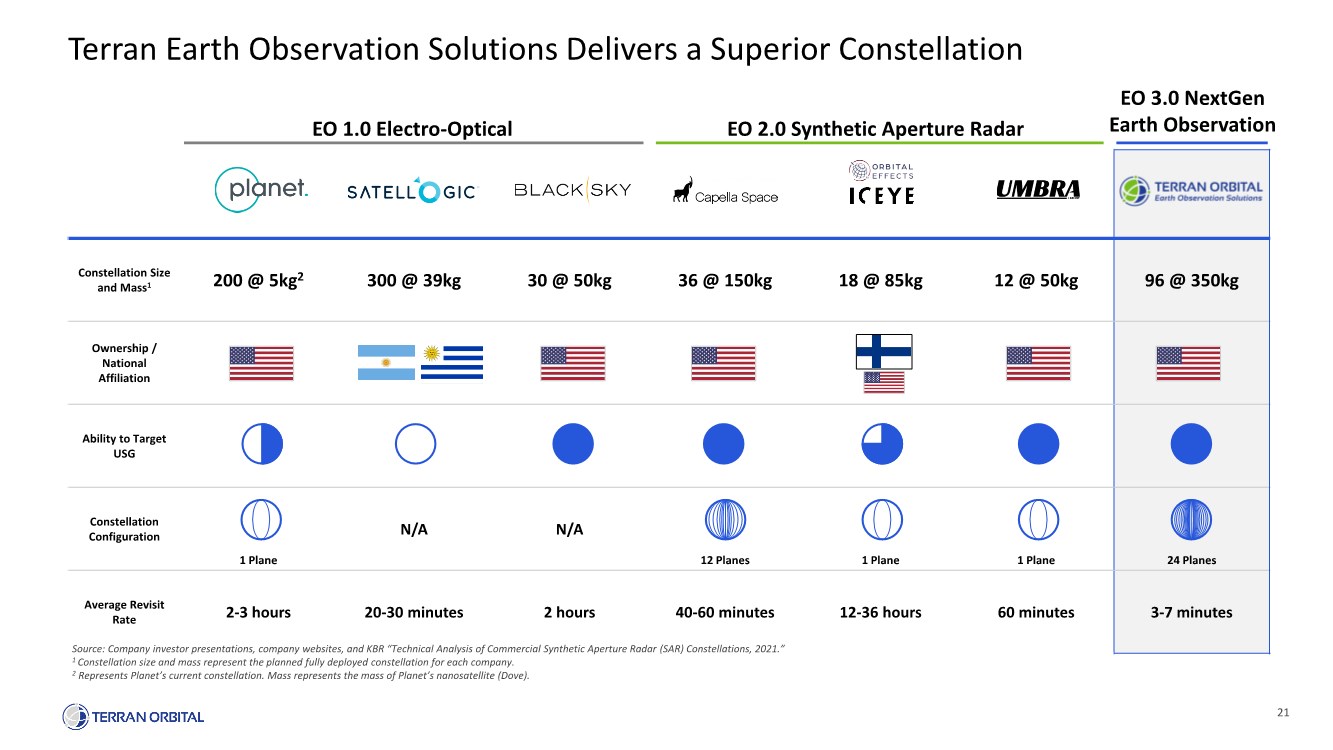
21 Constellation Size and Mass1 200 @ 5kg2 300 @ 39kg 30 @ 50kg 36 @ 150kg 18 @ 85kg 12 @ 50kg 96 @ 350kg Ownership / National Affiliation Ability to Target USG Constellation Configuration 1 Plane N/A N/A 12 Planes 1 Plane 1 Plane 24 Planes Average Revisit Rate 2-3 hours 20-30 minutes 2 hours 40-60 minutes 12-36 hours 60 minutes 3-7 minutes Terran Earth Observation Solutions Delivers a Superior Constellation Source: Company investor presentations, company websites, and KBR “Technical Analysis of Commercial Synthetic Aperture Radar (SAR) Constellations, 2021.” 1 Constellation size and mass represent the planned fully deployed constellation for each company. 2 Represents Planet’s current constellation. Mass represents the mass of Planet’s nanosatellite (Dove). EO 2.0 Synthetic Aperture Radar EO 1.0 Electro-Optical EO 3.0 NextGen Earth Observation |
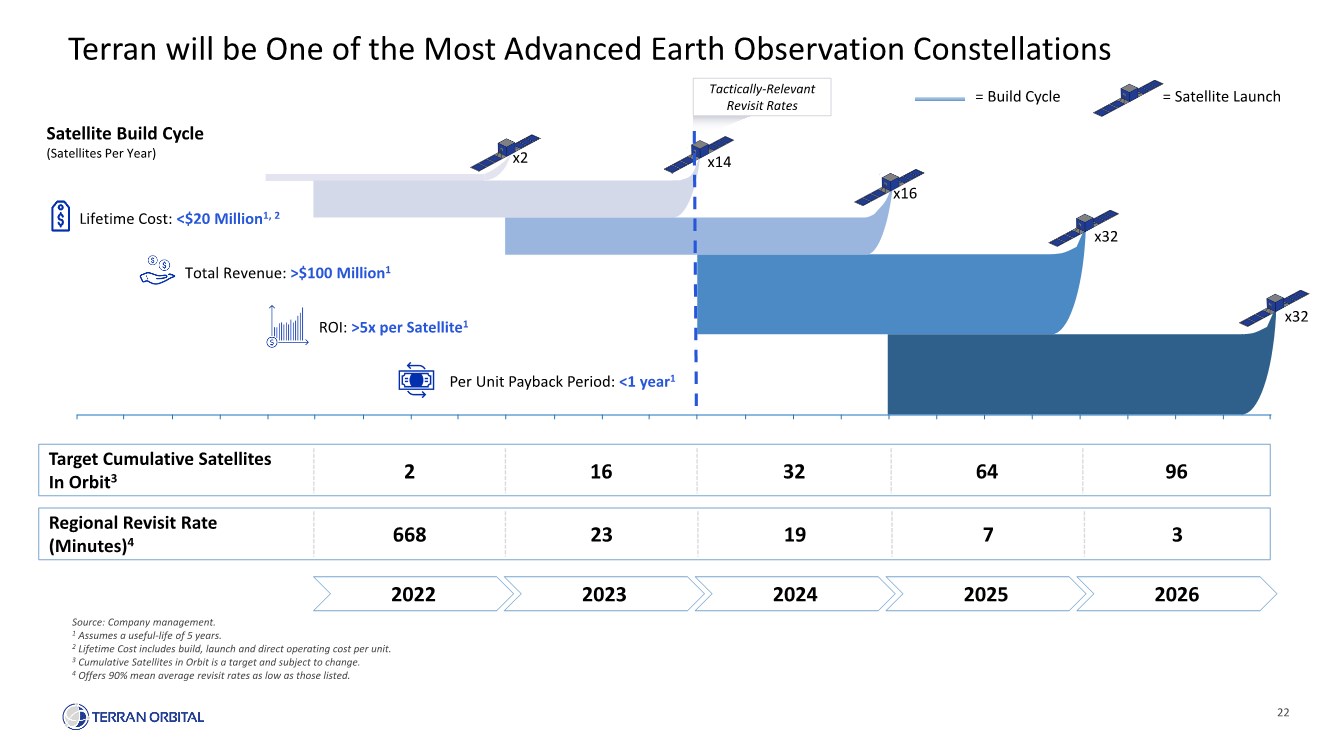
22 Satellite Build Cycle (Satellites Per Year) x32 x2 x14 x16 x32 Terran will be One of the Most Advanced Earth Observation Constellations Source: Company management. 1 Assumes a useful-life of 5 years. 2 Lifetime Cost includes build, launch and direct operating cost per unit. 3 Cumulative Satellites in Orbit is a target and subject to change. 4 Offers 90% mean average revisit rates as low as those listed. Regional Revisit Rate (Minutes)4 Target Cumulative Satellites In Orbit3 2 16 32 64 96 2024 2025 2022 2023 668 23 19 7 3 2026 = Satellite Launch = Build Cycle Tactically-Relevant Revisit Rates Per Unit Payback Period: <1 year1 ROI: >5x per Satellite1 Lifetime Cost: <$20 Million1, 2 Total Revenue: >$100 Million1 |
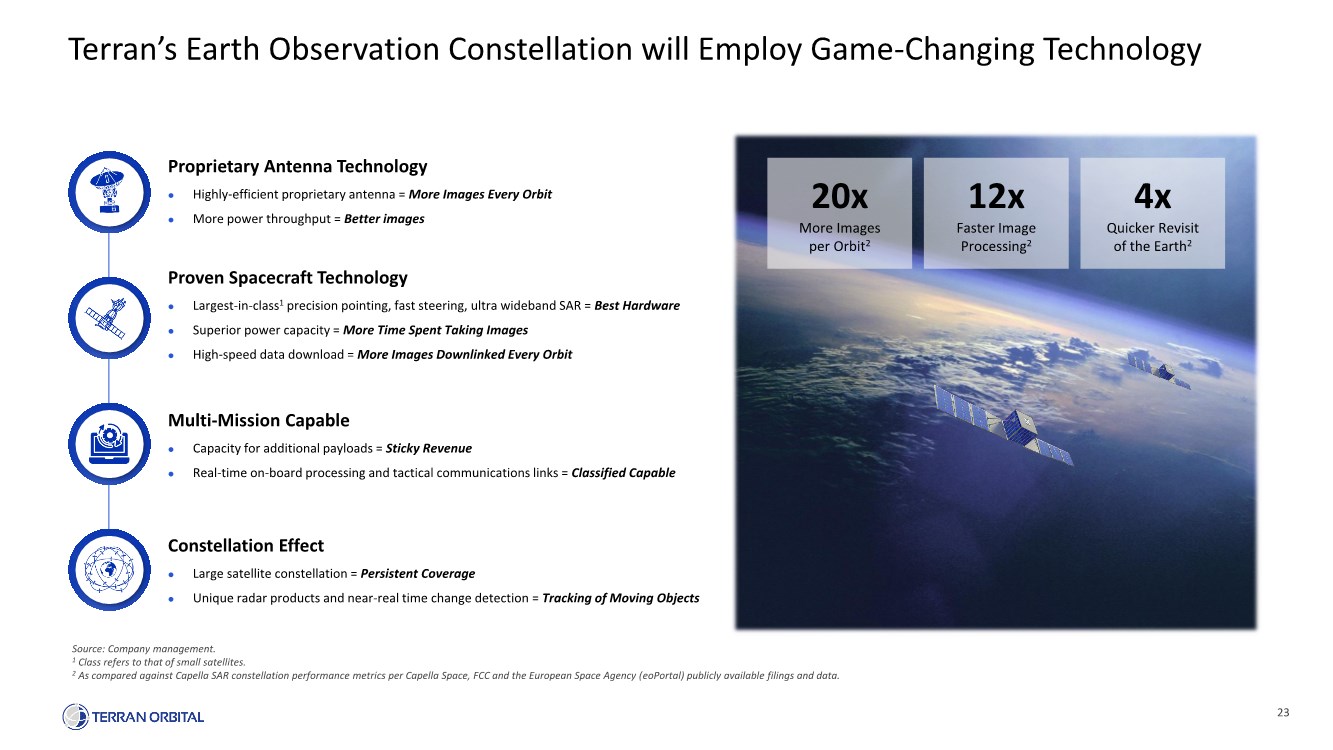
23 Terran’s Earth Observation Constellation will Employ Game-Changing Technology Source: Company management. 1 Class refers to that of small satellites. 2 As compared against Capella SAR constellation performance metrics per Capella Space, FCC and the European Space Agency (eoPortal) publicly available filings and data. Proprietary Antenna Technology ⚫ Highly-efficient proprietary antenna = More Images Every Orbit ⚫ More power throughput = Better images Proven Spacecraft Technology ⚫ Largest-in-class1 precision pointing, fast steering, ultra wideband SAR = Best Hardware ⚫ Superior power capacity = More Time Spent Taking Images ⚫ High-speed data download = More Images Downlinked Every Orbit Multi-Mission Capable ⚫ Capacity for additional payloads = Sticky Revenue ⚫ Real-time on-board processing and tactical communications links = Classified Capable Constellation Effect ⚫ Large satellite constellation = Persistent Coverage ⚫ Unique radar products and near-real time change detection = Tracking of Moving Objects 4x Quicker Revisit of the Earth2 12x Faster Image Processing2 20x More Images per Orbit2 |
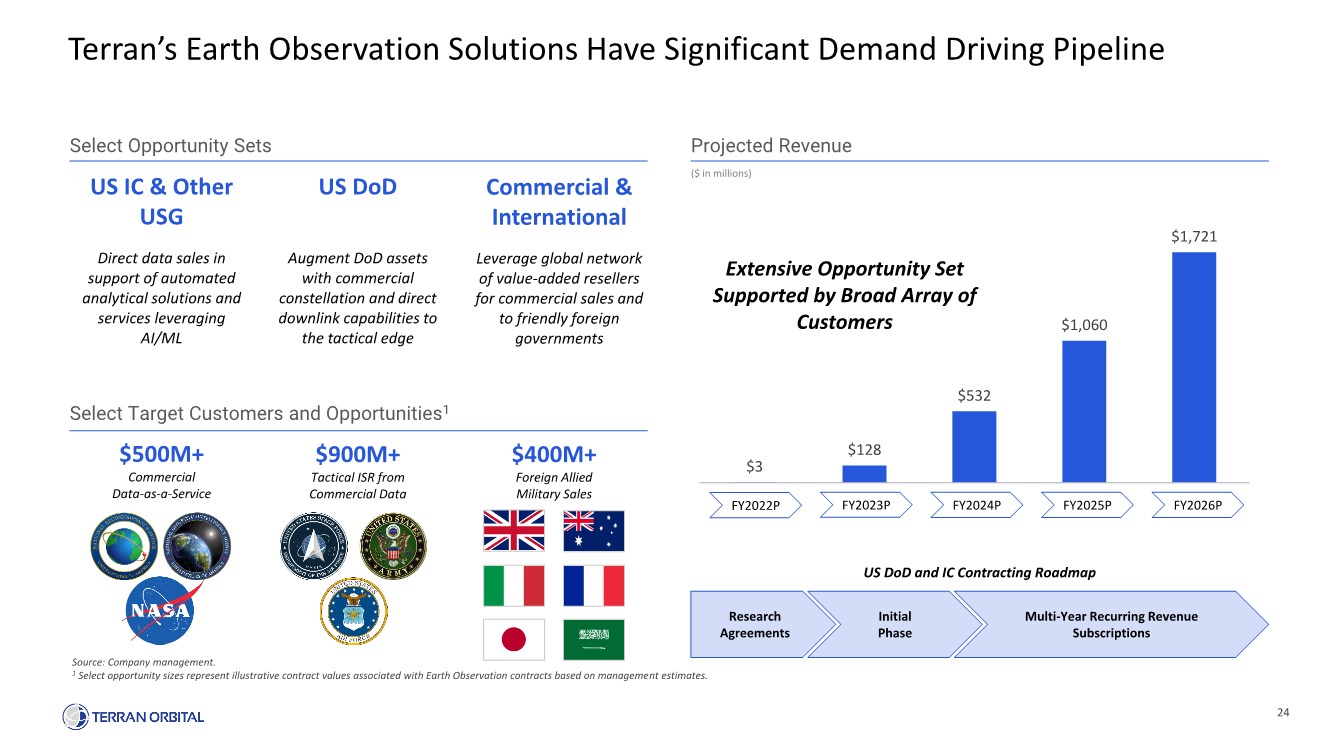
24 $3 $128 $532 $1,060 $1,721 Terran’s Earth Observation Solutions Have Significant Demand Driving Pipeline Source: Company management. 1 Select opportunity sizes represent illustrative contract values associated with Earth Observation contracts based on management estimates. ($ in millions) Select Opportunity Sets Projected Revenue Extensive Opportunity Set Supported by Broad Array of Customers US DoD and IC Contracting Roadmap Research Agreements Initial Phase Multi-Year Recurring Revenue Subscriptions FY2025P FY2024P FY2022P FY2023P FY2026P US IC & Other USG Direct data sales in support of automated analytical solutions and services leveraging AI/ML Commercial & International Leverage global network of value-added resellers for commercial sales and to friendly foreign governments $500M+ Commercial Data-as-a-Service $900M+ Tactical ISR from Commercial Data $400M+ Foreign Allied Military Sales Select Target Customers and Opportunities1 US DoD Augment DoD assets with commercial constellation and direct downlink capabilities to the tactical edge |
Financial and Transaction Overview |
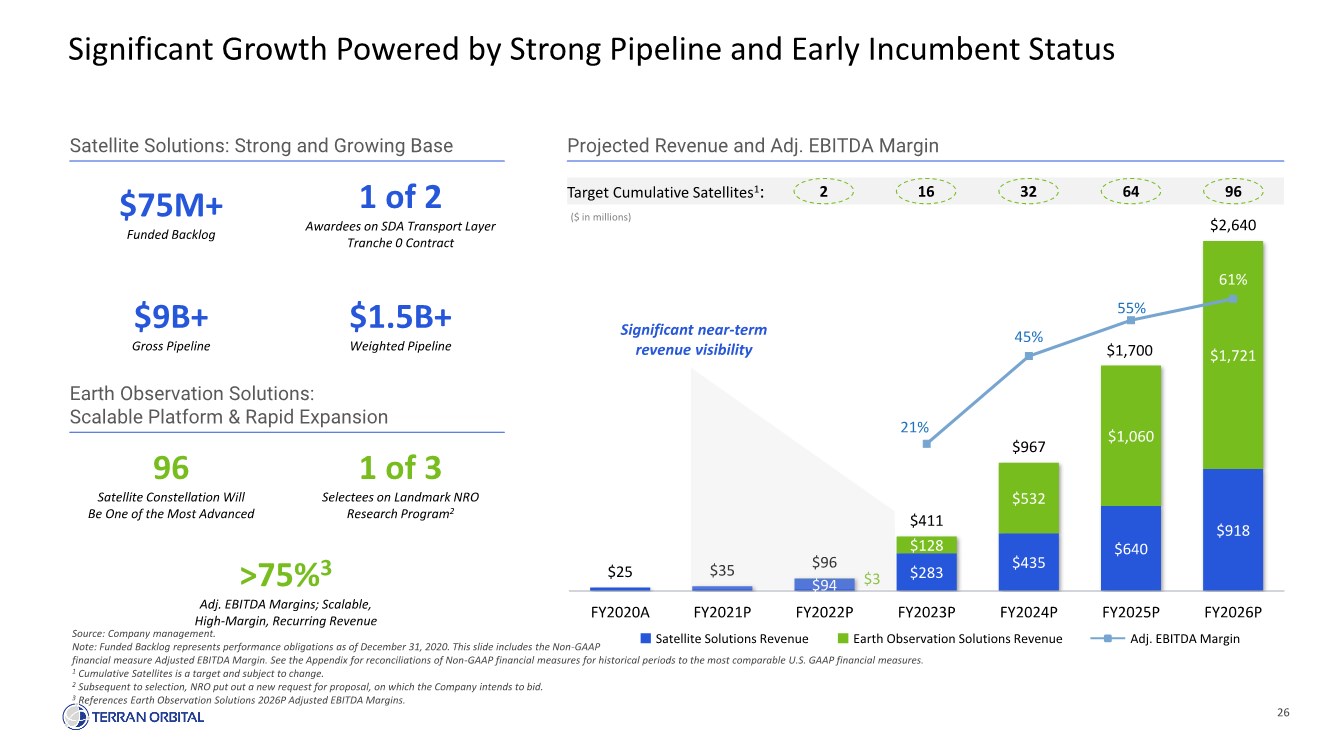
26 $94 $283 $435 $640 $918 $3 $128 $532 $1,060 $1,721 $25 $35 $96 $411 $967 $1,700 $2,640 21% 45% 55% 61% FY2020A FY2021P FY2022P FY2023P FY2024P FY2025P FY2026P Significant Growth Powered by Strong Pipeline and Early Incumbent Status Source: Company management. Note: Funded Backlog represents performance obligations as of December 31, 2020. This slide includes the Non-GAAP financial measure Adjusted EBITDA Margin. See the Appendix for reconciliations of Non-GAAP financial measures for historical periods to the most comparable U.S. GAAP financial measures. 1 Cumulative Satellites is a target and subject to change. 2 Subsequent to selection, NRO put out a new request for proposal, on which the Company intends to bid. 3 References Earth Observation Solutions 2026P Adjusted EBITDA Margins. Satellite Solutions: Strong and Growing Base $75M+ Funded Backlog $9B+ Gross Pipeline $1.5B+ Weighted Pipeline 1 of 2 Awardees on SDA Transport Layer Tranche 0 Contract 96 Satellite Constellation Will Be One of the Most Advanced 1 of 3 Selectees on Landmark NRO Research Program2 >75%3 Adj. EBITDA Margins; Scalable, High-Margin, Recurring Revenue Earth Observation Solutions: Scalable Platform & Rapid Expansion Significant near-term revenue visibility Earth Observation Solutions Revenue Adj. EBITDA Margin Satellite Solutions Revenue Target Cumulative Satellites1: 2 96 64 32 16 ($ in millions) Projected Revenue and Adj. EBITDA Margin |
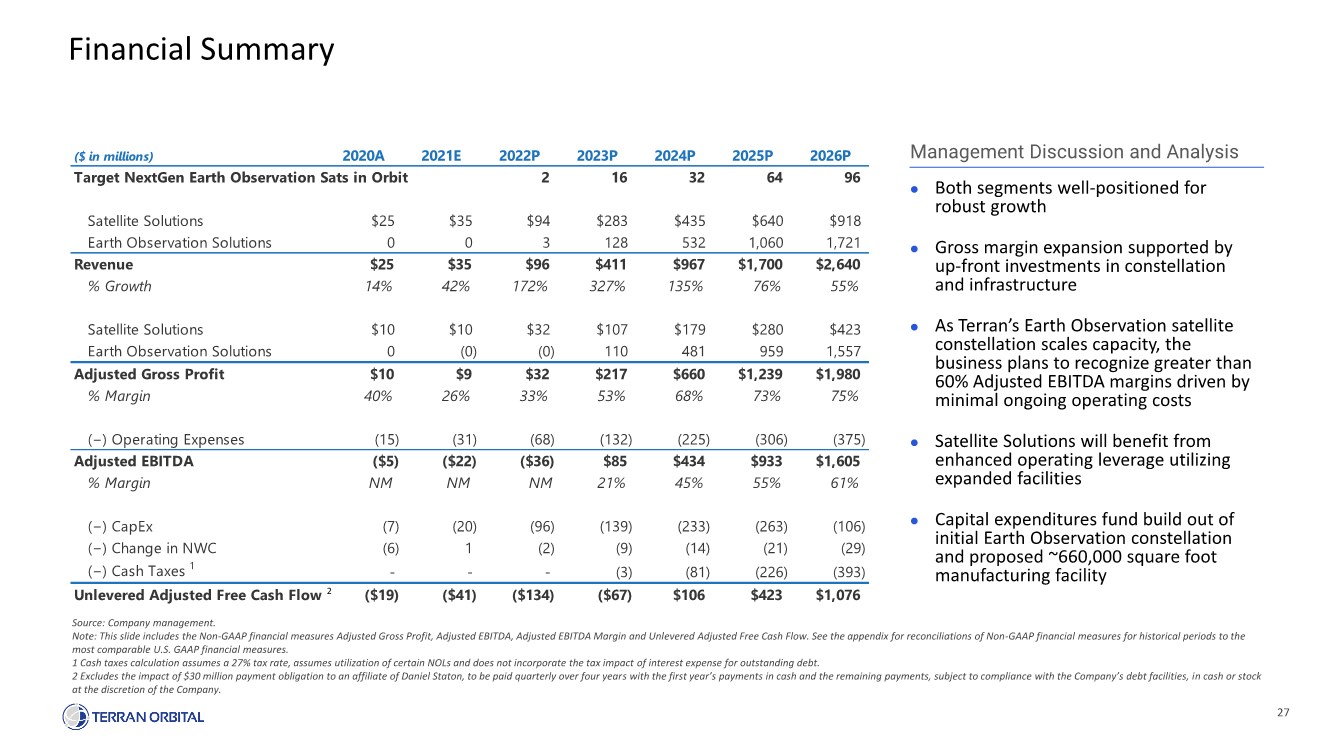
27 Financial Summary Source: Company management. Note: This slide includes the Non-GAAP financial measures Adjusted Gross Profit, Adjusted EBITDA, Adjusted EBITDA Margin and Unlevered Adjusted Free Cash Flow. See the appendix for reconciliations of Non-GAAP financial measures for historical periods to the most comparable U.S. GAAP financial measures. 1 Cash taxes calculation assumes a 27% tax rate, assumes utilization of certain NOLs and does not incorporate the tax impact of interest expense for outstanding debt. 2 Excludes the impact of $30 million payment obligation to an affiliate of Daniel Staton, to be paid quarterly over four years with the first year’s payments in cash and the remaining payments, subject to compliance with the Company’s debt facilities, in cash or stock at the discretion of the Company. Management Discussion and Analysis ⚫ Both segments well-positioned for robust growth ⚫ Gross margin expansion supported by up-front investments in constellation and infrastructure ⚫ As Terran’s Earth Observation satellite constellation scales capacity, the business plans to recognize greater than 60% Adjusted EBITDA margins driven by minimal ongoing operating costs ⚫ Satellite Solutions will benefit from enhanced operating leverage utilizing expanded facilities ⚫ Capital expenditures fund build out of initial Earth Observation constellation and proposed ~660,000 square foot manufacturing facility ($ in millions) 2020A 2021E 2022P 2023P 2024P 2025P 2026P Target NextGen Earth Observation Sats in Orbit 2 16 32 64 96 Satellite Solutions $25 $35 $94 $283 $435 $640 $918 Earth Observation Solutions 0 0 3 128 532 1,060 1,721 Revenue $25 $35 $96 $411 $967 $1,700 $2,640 % Growth 14% 42% 172% 327% 135% 76% 55% Satellite Solutions $10 $10 $32 $107 $179 $280 $423 Earth Observation Solutions 0 (0) (0) 110 481 959 1,557 Adjusted Gross Profit $10 $9 $32 $217 $660 $1,239 $1,980 % Margin 40% 26% 33% 53% 68% 73% 75% (−) Operating Expenses (15) (31) (68) (132) (225) (306) (375) Adjusted EBITDA ($5) ($22) ($36) $85 $434 $933 $1,605 % Margin NM NM NM 21% 45% 55% 61% (−) CapEx (7) (20) (96) (139) (233) (263) (106) (−) Change in NWC (6) 1 (2) (9) (14) (21) (29) (−) Cash Taxes 1 ---(3) (81) (226) (393) Unlevered Adjusted Free Cash Flow ($19) ($41) ($134) ($67) $106 $423 $1,076 2 |
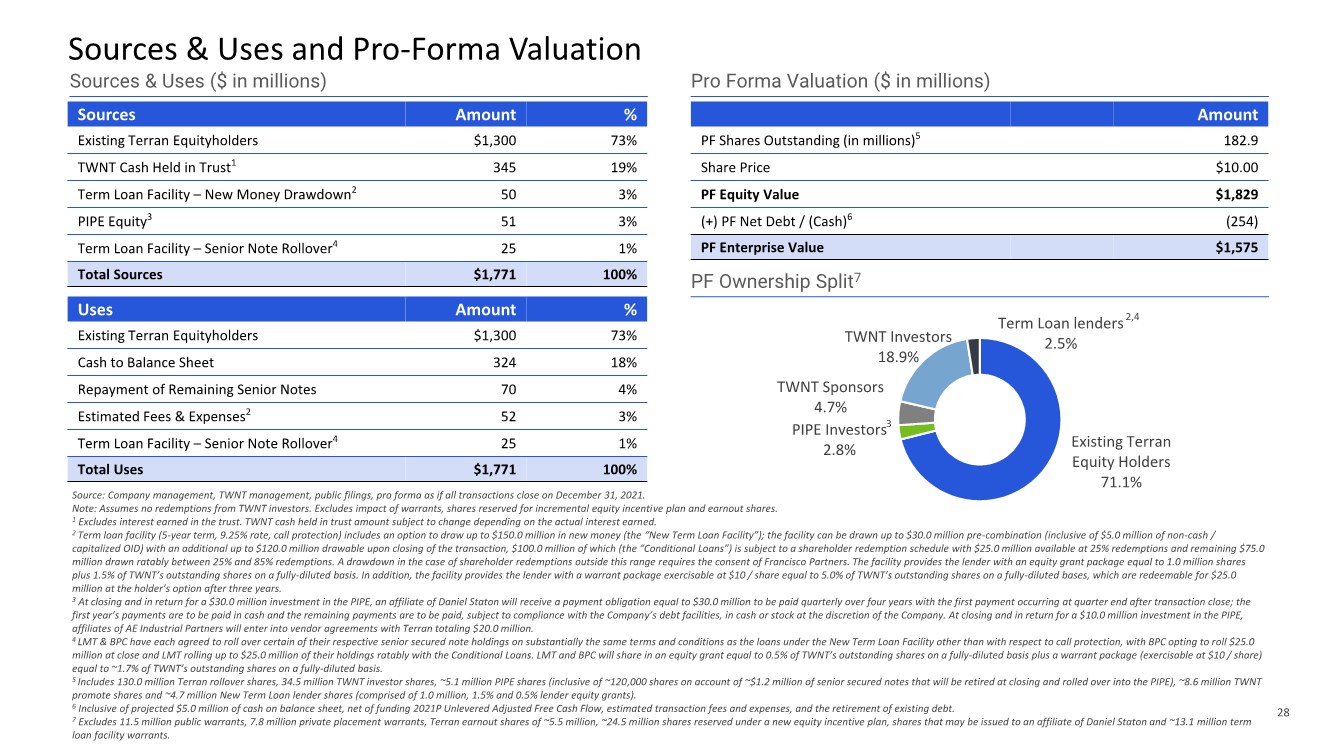
28 Sources & Uses and Pro-Forma Valuation Sources Amount % Existing Terran Equityholders $1,300 73% TWNT Cash Held in Trust1 345 19% Term Loan Facility – New Money Drawdown2 50 3% PIPE Equity3 51 3% Term Loan Facility – Senior Note Rollover4 25 1% Total Sources $1,771 100% Uses Amount % Existing Terran Equityholders $1,300 73% Cash to Balance Sheet 324 18% Repayment of Remaining Senior Notes 70 4% Estimated Fees & Expenses2 52 3% Term Loan Facility – Senior Note Rollover4 25 1% Total Uses $1,771 100% Amount PF Shares Outstanding (in millions)5 182.9 Share Price $10.00 PF Equity Value $1,829 (+) PF Net Debt / (Cash)6 (254) PF Enterprise Value $1,575 Sources & Uses ($ in millions) Pro Forma Valuation ($ in millions) PF Ownership Split7 Existing Terran Equity Holders 71.1% PIPE Investors 2.8% TWNT Sponsors 4.7% TWNT Investors 18.9% Term Loan lenders 2.5% 2,4 3 Source: Company management, TWNT management, public filings, pro forma as if all transactions close on December 31, 2021. Note: Assumes no redemptions from TWNT investors. Excludes impact of warrants, shares reserved for incremental equity incentive plan and earnout shares. 1 Excludes interest earned in the trust. TWNT cash held in trust amount subject to change depending on the actual interest earned. 2 Term loan facility (5-year term, 9.25% rate, call protection) includes an option to draw up to $150.0 million in new money (the “New Term Loan Facility”); the facility can be drawn up to $30.0 million pre-combination (inclusive of $5.0 million of non-cash / capitalized OID) with an additional up to $120.0 million drawable upon closing of the transaction, $100.0 million of which (the “Conditional Loans”) is subject to a shareholder redemption schedule with $25.0 million available at 25% redemptions and remaining $75.0 million drawn ratably between 25% and 85% redemptions. A drawdown in the case of shareholder redemptions outside this range requires the consent of Francisco Partners. The facility provides the lender with an equity grant package equal to 1.0 million shares plus 1.5% of TWNT’s outstanding shares on a fully-diluted basis. In addition, the facility provides the lender with a warrant package exercisable at $10 / share equal to 5.0% of TWNT’s outstanding shares on a fully-diluted bases, which are redeemable for $25.0 million at the holder’s option after three years. 3 At closing and in return for a $30.0 million investment in the PIPE, an affiliate of Daniel Staton will receive a payment obligation equal to $30.0 million to be paid quarterly over four years with the first payment occurring at quarter end after transaction close; the first year’s payments are to be paid in cash and the remaining payments are to be paid, subject to compliance with the Company’s debt facilities, in cash or stock at the discretion of the Company. At closing and in return for a $10.0 million investment in the PIPE, affiliates of AE Industrial Partners will enter into vendor agreements with Terran totaling $20.0 million. 4 LMT & BPC have each agreed to roll over certain of their respective senior secured note holdings on substantially the same terms and conditions as the loans under the New Term Loan Facility other than with respect to call protection, with BPC opting to roll $25.0 million at close and LMT rolling up to $25.0 million of their holdings ratably with the Conditional Loans. LMT and BPC will share in an equity grant equal to 0.5% of TWNT’s outstanding shares on a fully-diluted basis plus a warrant package (exercisable at $10 / share) equal to ~1.7% of TWNT’s outstanding shares on a fully-diluted basis. 5 Includes 130.0 million Terran rollover shares, 34.5 million TWNT investor shares, ~5.1 million PIPE shares (inclusive of ~120,000 shares on account of ~$1.2 million of senior secured notes that will be retired at closing and rolled over into the PIPE), ~8.6 million TWNT promote shares and ~4.7 million New Term Loan lender shares (comprised of 1.0 million, 1.5% and 0.5% lender equity grants). 6 Inclusive of projected $5.0 million of cash on balance sheet, net of funding 2021P Unlevered Adjusted Free Cash Flow, estimated transaction fees and expenses, and the retirement of existing debt. 7 Excludes 11.5 million public warrants, 7.8 million private placement warrants, Terran earnout shares of ~5.5 million, ~24.5 million shares reserved under a new equity incentive plan, shares that may be issued to an affiliate of Daniel Staton and ~13.1 million term loan facility warrants. |
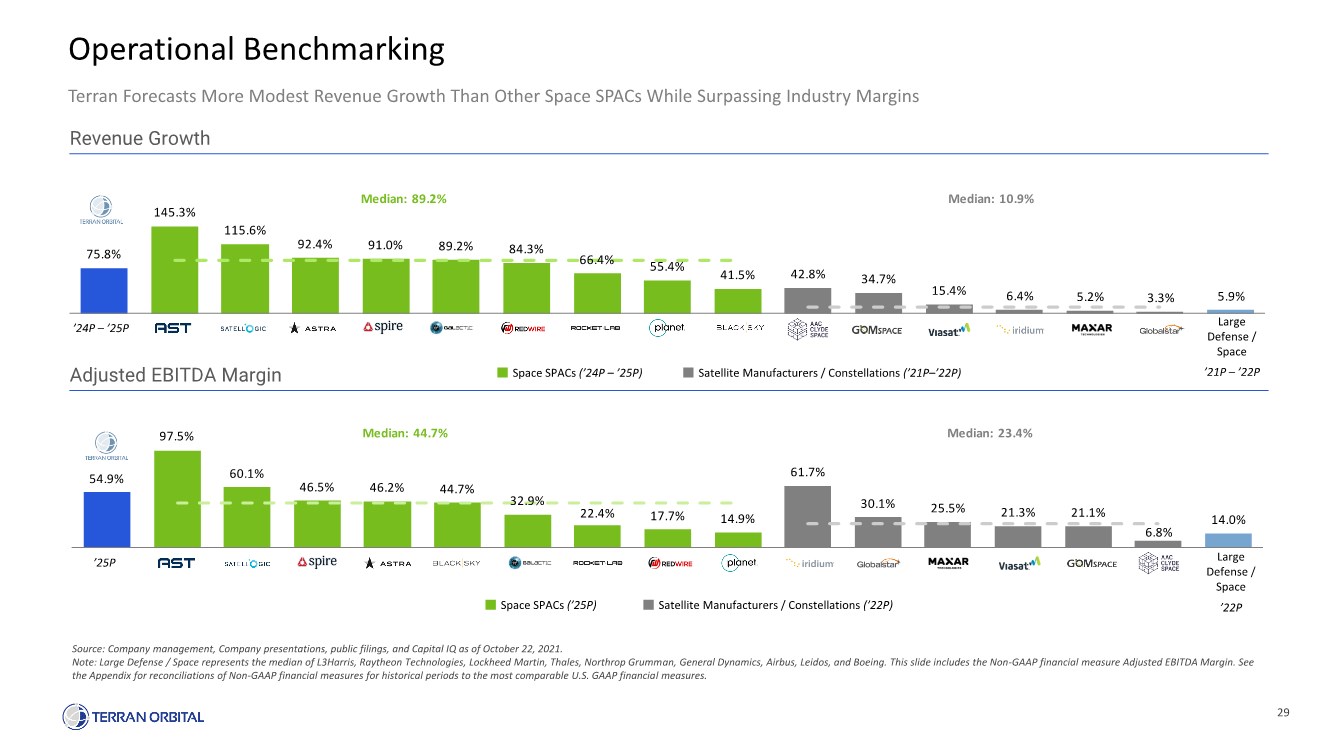
29 54.9% 97.5% 60.1% 46.5% 46.2% 44.7% 32.9% 22.4% 17.7% 14.9% 61.7% 30.1% 25.5% 21.3% 21.1% 6.8% 14.0% Median: 44.7% Median: 23.4% ’25P Operational Benchmarking Source: Company management, Company presentations, public filings, and Capital IQ as of October 22, 2021. Note: Large Defense / Space represents the median of L3Harris, Raytheon Technologies, Lockheed Martin, Thales, Northrop Grumman, General Dynamics, Airbus, Leidos, and Boeing. This slide includes the Non-GAAP financial measure Adjusted EBITDA Margin. See the Appendix for reconciliations of Non-GAAP financial measures for historical periods to the most comparable U.S. GAAP financial measures. Terran Forecasts More Modest Revenue Growth Than Other Space SPACs While Surpassing Industry Margins Revenue Growth Adjusted EBITDA Margin ’24P –’25P Large Defense / Space ’21P –’22P Large Defense / Space ’22P Space SPACs (’25P) Satellite Manufacturers / Constellations (’22P) Space SPACs (’24P –’25P) Satellite Manufacturers / Constellations (’21P–’22P) 75.8% 145.3% 115.6% 92.4% 91.0% 89.2% 84.3% 66.4% 55.4% 41.5% 42.8% 34.7% 15.4% 6.4% 5.2% 3.3% 5.9% Median: 89.2% Median: 10.9% |
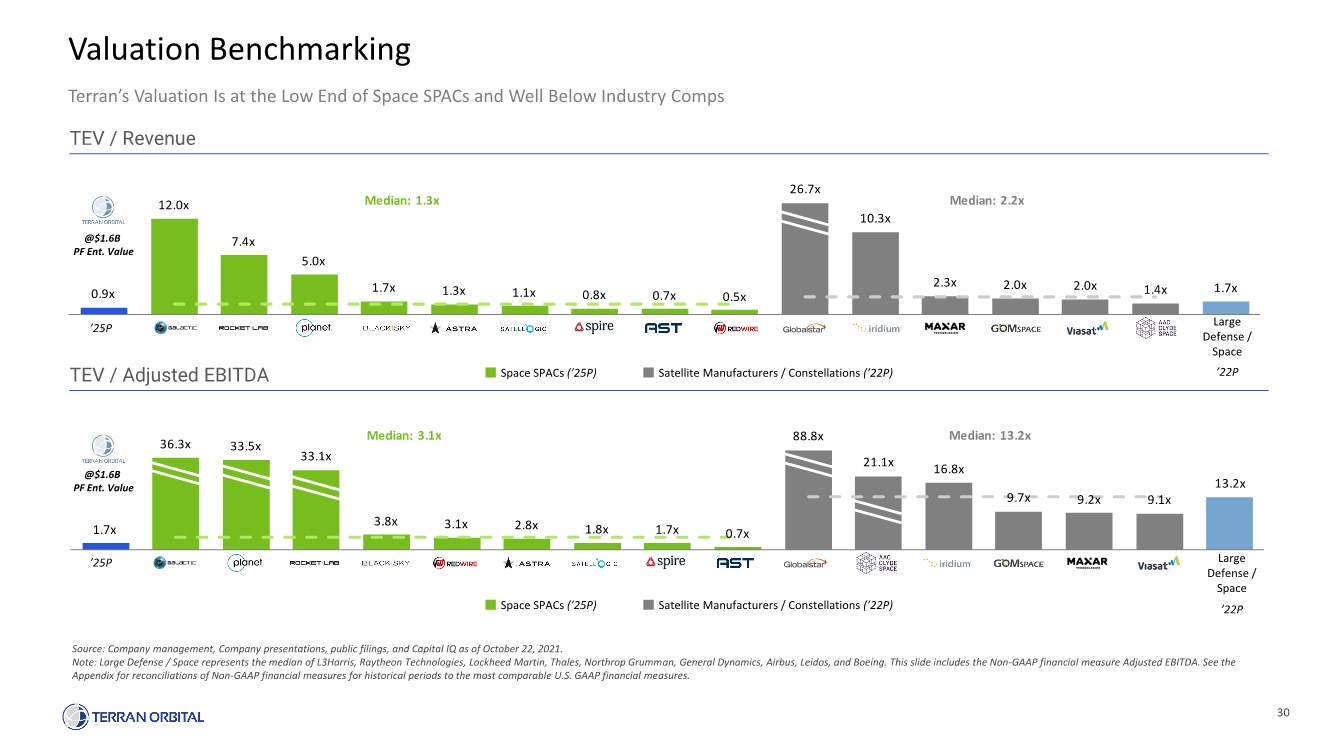
30 1.7x 36.3x 33.5x 33.1x 3.8x 3.1x 2.8x 1.8x 1.7x 0.7x 88.8x 21.1x 16.8x 9.7x 9.2x 9.1x 13.2x Median: 3.1x Median: 13.2x 0.9x 12.0x 7.4x 5.0x 1.7x 1.3x 1.1x 0.8x 0.7x 0.5x 26.7x 10.3x 2.3x 2.0x 2.0x 1.4x 1.7x Median: 1.3x Median: 2.2x ’25P Valuation Benchmarking Source: Company management, Company presentations, public filings, and Capital IQ as of October 22, 2021. Note: Large Defense / Space represents the median of L3Harris, Raytheon Technologies, Lockheed Martin, Thales, Northrop Grumman, General Dynamics, Airbus, Leidos, and Boeing. This slide includes the Non-GAAP financial measure Adjusted EBITDA. See the Appendix for reconciliations of Non-GAAP financial measures for historical periods to the most comparable U.S. GAAP financial measures. Terran’s Valuation Is at the Low End of Space SPACs and Well Below Industry Comps TEV / Revenue TEV / Adjusted EBITDA ’25P Large Defense / Space ’22P Large Defense / Space ’22P @$1.6B PF Ent. Value @$1.6B PF Ent. Value Space SPACs (’25P) Satellite Manufacturers / Constellations (’22P) Space SPACs (’25P) Satellite Manufacturers / Constellations (’22P) |
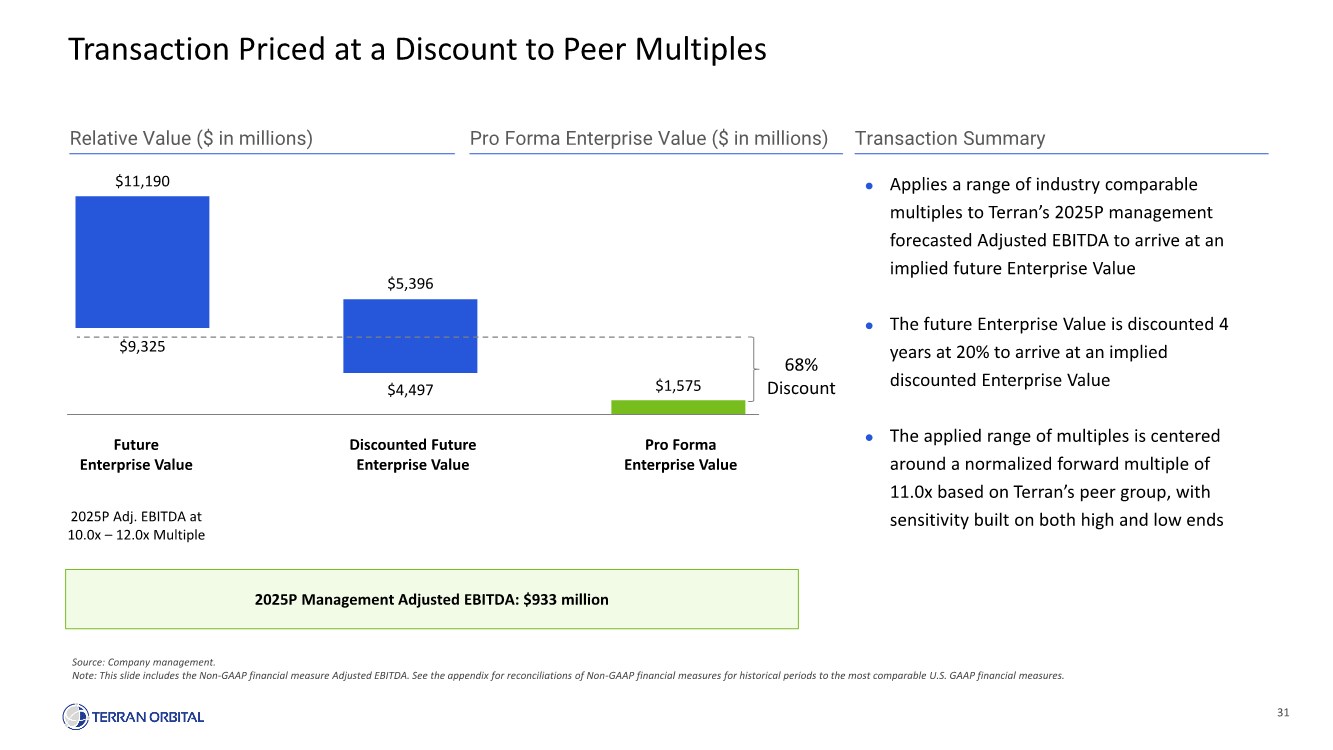
31 $9,325 $4,497 $1,575 $11,190 $5,396 Transaction Priced at a Discount to Peer Multiples Source: Company management. Note: This slide includes the Non-GAAP financial measure Adjusted EBITDA. See the appendix for reconciliations of Non-GAAP financial measures for historical periods to the most comparable U.S. GAAP financial measures. Relative Value ($ in millions) Transaction Summary ⚫ Applies a range of industry comparable multiples to Terran’s 2025P management forecasted Adjusted EBITDA to arrive at an implied future Enterprise Value ⚫ The future Enterprise Value is discounted 4 years at 20% to arrive at an implied discounted Enterprise Value ⚫ The applied range of multiples is centered around a normalized forward multiple of 11.0x based on Terran’s peer group, with sensitivity built on both high and low ends 68% Discount Pro Forma Enterprise Value ($ in millions) 2025P Management Adjusted EBITDA: $933 million Pro Forma Enterprise Value Discounted Future Enterprise Value Future Enterprise Value 2025P Adj. EBITDA at 10.0x – 12.0x Multiple |
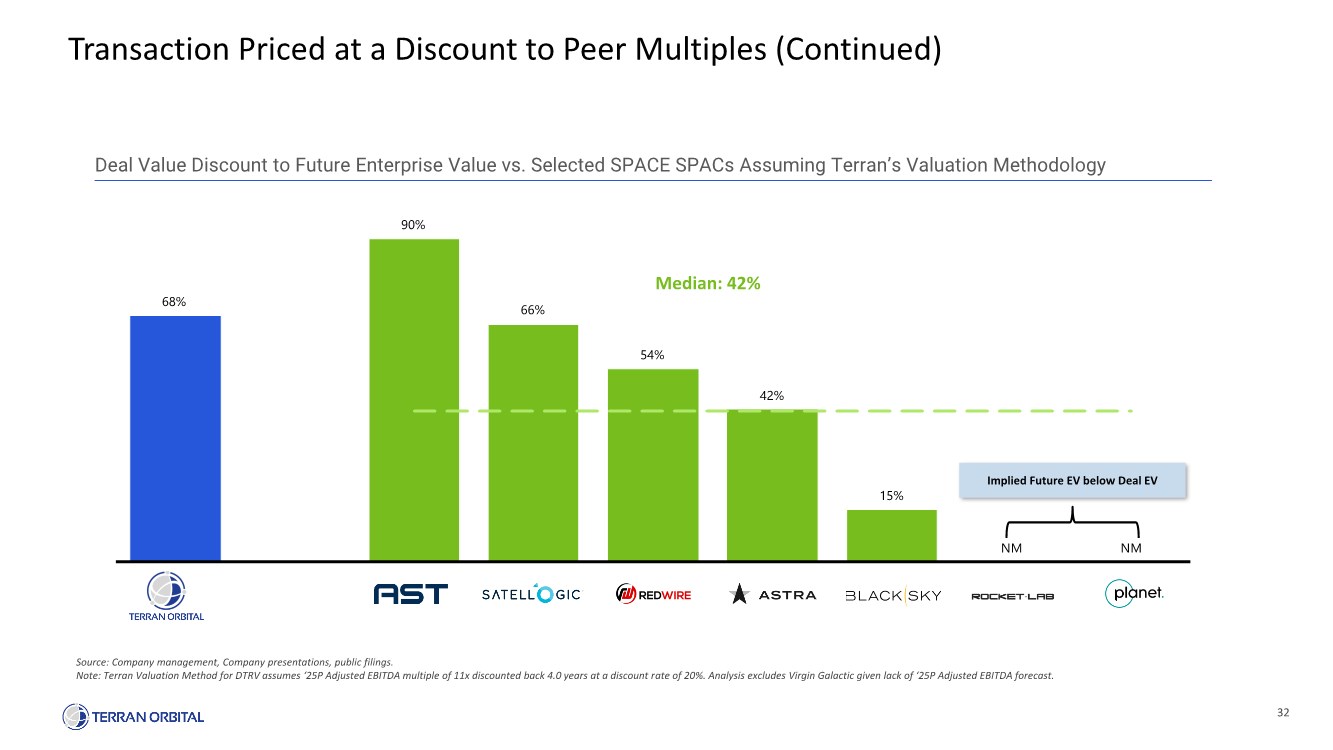
32 Transaction Priced at a Discount to Peer Multiples (Continued) Source: Company management, Company presentations, public filings. Note: Terran Valuation Method for DTRV assumes ‘25P Adjusted EBITDA multiple of 11x discounted back 4.0 years at a discount rate of 20%. Analysis excludes Virgin Galactic given lack of ‘25P Adjusted EBITDA forecast. Implied Future EV below Deal EV Median: 42% Deal Value Discount to Future Enterprise Value vs. Selected SPACE SPACs Assuming Terran’s Valuation Methodology 68% 90% 66% 54% 42% 15% NM NM |
Appendix |
34 Disclaimer This Information Presentation (this “Presentation”) is being provided for informational purposes only and is being furnished to a limited number of parties by Jefferies LLC (the “Placement Agent”) solely for the purpose of considering an investment transaction in connection with a potential business combination between Terran Orbital Corporation (the “Company”) and Tailwind Two Acquisition Corp. (“Tailwind”) (the “Potential Transactions”). By accepting this Presentation, you acknowledge and agree that all of the information contained herein is confidential, that you will distribute, disclose, and use such information only for purposes of the Potential Transactions and that you shall not distribute, disclose or use such information in any way detrimental to Tailwind or Terran or contrary to local law or regulation. The information in this Presentation discusses trends and markets that the leadership team of the Company believes will impact the development and success of the Company based on its current understanding of the industry. Such information has not been independently verified by Tailwind or the Placement Agent. None of the Company, Tailwind, the Placement Agent, their respective affiliates or their respective employees, directors, officers, contractors, advisors, members, successors, representatives or agents makes any representation or warranty as to the accuracy, reasonableness or completeness of the information contained in this Presentation, and shall have no liability for any representations or warranties (expressed or implied) contained in, or for any omissions from or errors in, this Presentation or any other written or oral communications transmitted to the recipient in the course of its evaluation of the Company, Tailwind or the Potential Transactions. Only those representations and warranties as may be contained in definitive written agreements relating to the Potential Transactions shall have any legal effect. The information in this Presentation speaks only as of the date of this Presentation and is subject to change. The Company and Tailwind are under no obligation to update, amend or supplement this Presentation or any information contained herein. This Presentation includes certain forward-looking statements, estimates, and projections provided by the Company that reflect management’s views regarding the anticipated future financial and operating performance of the Company. Forward-looking statements are statements that are not historical, including statements regarding operational and financial plans, terms and performance of the Company and other projections or predictions of the future. Forward looking statements are typically identified by such words as “project,” “believe,” “expect,” “anticipate,” “intend,” “estimate,” “may,” “will,” “should,” and “could” and similar expressions. Such statements, estimates, and projections reflect numerous assumptions concerning anticipated results. Forward-looking statements in this Presentation may include, for example; statements about the Company’s industry and market sizes; future opportunities; expectations and projections concerning future financial and operational performance and results of the Company; and the Potential Transactions, including items such as the implied enterprise value, ownership structure, the amount of redemption requests made by Tailwind’s shareholders, the ability of Tailwind to issue equity or equity-linked instruments in connection with the Potential Transactions or in the future, the likelihood and ability of the parties to successfully consummate the Potential Transactions, and those factors set forth on page 35 of this Presentation in the section entitled "Risk Factors" and "Cautionary Note Regarding Forward-Looking Statements" in Tailwind's final prospectus relating to its initial public offering dated March 8, 2021, and in subsequent filings with the Securities and Exchange Commission ("SEC"), including the proxy statement/prospectus relating to the Potential Transaction expected to be filed by Tailwind. As these assumptions may or may not prove to be correct and there are numerous factors which will affect the Company’s actual results (many of which are beyond the Company’s control), there can be no assurances that any projected results are attainable or will be realized. The Company, Tailwind and the Placement Agent disclaim any intention or obligation to update or revise any forward-looking statements whether as a result of new information, future events, or otherwise. The Company’s actual results may differ materially from those set forth in this Presentation. Accordingly, no representations are made as to the accuracy, reasonableness or completeness of such statements, estimates, or projections. This Presentation includes certain non-GAAP financial measures. For more information with respect to such measures, please refer to Appendix slide covering Non-GAAP Financial Measures. This Presentation contains financial forecasts with respect to the Company's projected financial results and operating data, including target Earth Observation satellites in orbit and related metrics, revenue, gross profit, SG&A, research and development, Adjusted EBITDA, Adjusted EBITDA Margin, Adjusted Gross Profit, capital expenditures, net working capital, cash taxes, Adjusted Free Cash Flow, total enterprise value, and backlog for the periods ending in December 31, 2021, 2022, 2023, 2024, 2025, and 2026, as well as our long-term guidance. Neither the Company's independent auditors, nor Tailwind’s independent registered public accounting firm, has audited, reviewed, compiled or performed any procedures with respect to the projections for the purpose of their inclusion in this Presentation, and accordingly, neither of them expressed an opinion or provided any other form of assurance with respect thereto for the purpose of this Presentation. These projections should not be relied upon as being necessarily indicative of future results. The assumptions and estimates underlying the prospective financial information are inherently uncertain and are subject to a wide variety of significant business, economic and competitive risks and uncertainties that could cause actual results to differ materially from those contained in the prospective financial information, including those references under "forward-looking statements" above. Accordingly, there can be no assurance that the prospective results are indicative of the Company’s future performance or that actual results will not differ materially from those presented in the prospective financial information. Inclusion of the prospective financial information in this Presentation should not be regarded as a representation by any person that the results contained in such prospective financial information will be achieved. In addition, the financial information and data contained in this Presentation is either audited in accordance with private company auditing standards or is unaudited and, in each case, does not conform to Regulation S-X or Public Company Account Oversight Board ("PCAOB") standards. Accordingly, such information and data may not be included in, may be adjusted in or may be presented differently in any proxy statement/prospectus to be filed with the SEC. This Presentation and any oral statements made in connection with this Presentation shall not constitute an offer, nor a solicitation of an offer, of the sale or purchase of any securities, nor shall any securities of the Company or Tailwind be offered or sold, in any jurisdiction in which such an offer, solicitation or sale would be unlawful. Neither the SEC nor any state securities commission has approved or disapproved of the transactions contemplated hereby or determined if this Presentation is truthful or complete. Any representation to the contrary is a criminal offense. Nothing in this Presentation constitutes investment, tax or legal advice or a recommendation regarding any securities. You should consult your own counsel and tax and financial advisors as to legal and related matters concerning the matters described herein, must make your own decisions and perform your own independent investment and analysis of the Potential Transactions, and, by accepting this Presentation, you confirm that you are not relying upon the information contained herein to make any decision. Certain information contained herein has been derived from sources prepared by third parties. While such information is believed to be reliable for the purposes used herein, neither the Company nor Tailwind makes any representation or warranty with respect to the accuracy of such information. In this Presentation, Tailwind and the Company rely on and refer to certain information and statistics obtained from third-party sources including reports by market research firms. Neither Tailwind nor the Company has independently verified the accuracy or completeness of any such third-party information. You are cautioned not to give undue weight to such industry and market data. Any and all trademarks and trade names referred to in this presentation are the property of their respective owners. In connection with the proposed Potential Transaction, Tailwind intends to file with the SEC a registration statement on Form S-4 containing a preliminary proxy statement and a preliminary prospectus of Tailwind, and after the registration statement is declared effective, Tailwind will mail a definitive proxy statement/prospectus relating to the proposed Potential Transaction to its shareholders. This Presentation does not contain all the information that should be considered concerning the Potential Transaction and is not intended to form the basis of any investment decision or any other decision in respect of the Potential Transaction. Tailwind’s shareholders and other interested persons are advised to read, when available, the preliminary proxy statement/prospectus and the amendments thereto and the definitive proxy statement/prospectus and other documents filed in connection with the Potential Transaction, as these materials will contain important information about the Company, Tailwind and the Potential Transaction. When available, the definitive proxy statement/prospectus and other relevant materials for the Potential Transaction will be mailed to shareholders of Tailwind as of a record date to be established for voting on the Potential Transaction. Shareholders will also be able to obtain copies of the preliminary proxy statement/prospectus, the definitive proxy statement/prospectus and other documents filed with the SEC, without charge, once available, at the SEC's website sec.gov. Tailwind and its directors and executive officers may be deemed participants in the solicitation of proxies from Tailwind's shareholders with respect to the Potential Transaction. A list of the names of those directors and executive officers and a description of their interests in Tailwind is contained in Tailwind's final prospectus relating to its initial public offering dated March 8, 2021, which was filed with the SEC and is available free of charge at the SEC's web site at www.sec.gov. Additional information regarding the interests of such participants will be contained in the proxy statement/prospectus for the Potential Transaction when available. The Company and its directors and executive officers may also be deemed to be participants in the solicitation of proxies from Tailwind’s shareholders in connection with the Potential Transaction. A list of the names of such directors and executive officers and information regarding their interests in the Potential Transaction will be included in the proxy statement/prospectus for the Potential Transaction when available. |
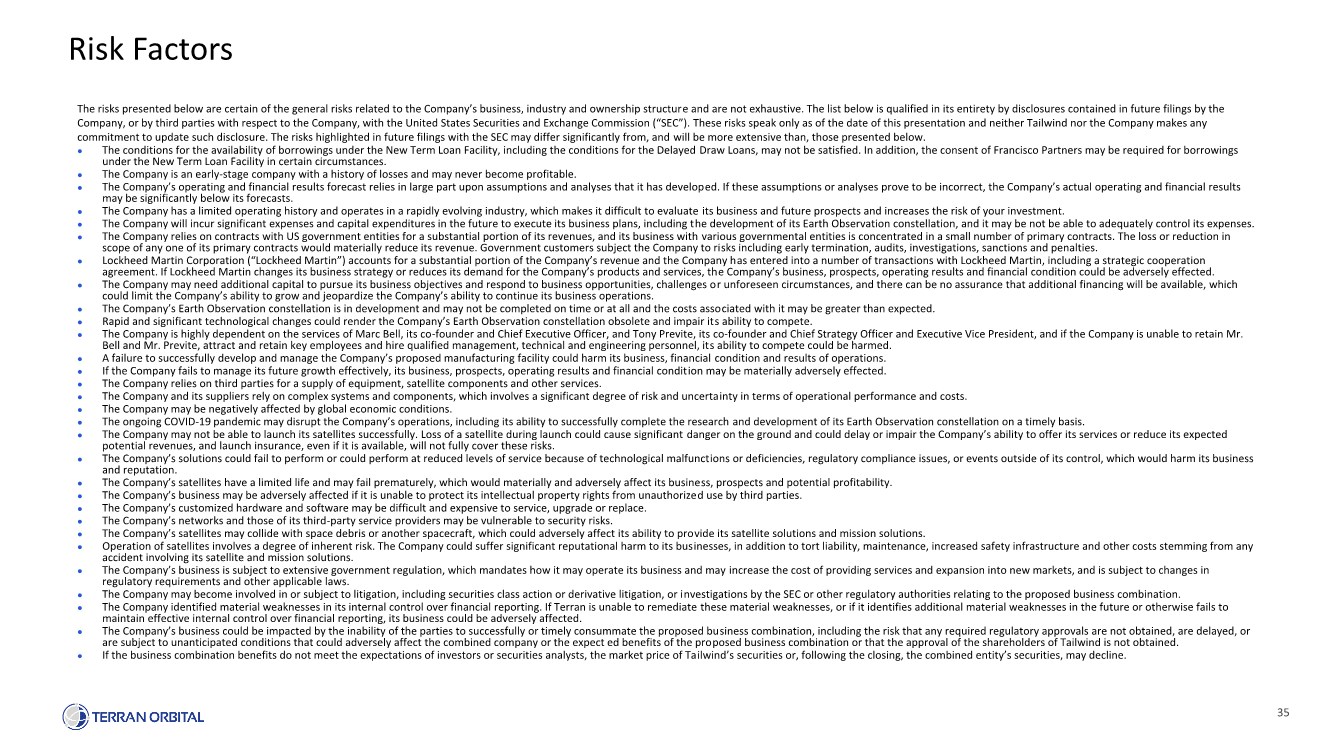
35 Risk Factors The risks presented below are certain of the general risks related to the Company’s business, industry and ownership structure and are not exhaustive. The list below is qualified in its entirety by disclosures contained in future filings by the Company, or by third parties with respect to the Company, with the United States Securities and Exchange Commission (“SEC”). These risks speak only as of the date of this presentation and neither Tailwind nor the Company makes any commitment to update such disclosure. The risks highlighted in future filings with the SEC may differ significantly from, and will be more extensive than, those presented below. ⚫ The conditions for the availability of borrowings under the New Term Loan Facility, including the conditions for the Delayed Draw Loans, may not be satisfied. In addition, the consent of Francisco Partners may be required for borrowings under the New Term Loan Facility in certain circumstances. ⚫ The Company is an early-stage company with a history of losses and may never become profitable. ⚫ The Company’s operating and financial results forecast relies in large part upon assumptions and analyses that it has developed. If these assumptions or analyses prove to be incorrect, the Company’s actual operating and financial results may be significantly below its forecasts. ⚫ The Company has a limited operating history and operates in a rapidly evolving industry, which makes it difficult to evaluate its business and future prospects and increases the risk of your investment. ⚫ The Company will incur significant expenses and capital expenditures in the future to execute its business plans, including the development of its Earth Observation constellation, and it may be not be able to adequately control its expenses. ⚫ The Company relies on contracts with US government entities for a substantial portion of its revenues, and its business with various governmental entities is concentrated in a small number of primary contracts. The loss or reduction in scope of any one of its primary contracts would materially reduce its revenue. Government customers subject the Company to risks including early termination, audits, investigations, sanctions and penalties. ⚫ Lockheed Martin Corporation (“Lockheed Martin”) accounts for a substantial portion of the Company’s revenue and the Company has entered into a number of transactions with Lockheed Martin, including a strategic cooperation agreement. If Lockheed Martin changes its business strategy or reduces its demand for the Company’s products and services, the Company’s business, prospects, operating results and financial condition could be adversely effected. ⚫ The Company may need additional capital to pursue its business objectives and respond to business opportunities, challenges or unforeseen circumstances, and there can be no assurance that additional financing will be available, which could limit the Company’s ability to grow and jeopardize the Company’s ability to continue its business operations. ⚫ The Company’s Earth Observation constellation is in development and may not be completed on time or at all and the costs associated with it may be greater than expected. ⚫ Rapid and significant technological changes could render the Company’s Earth Observation constellation obsolete and impair its ability to compete. ⚫ The Company is highly dependent on the services of Marc Bell, its co-founder and Chief Executive Officer, and Tony Previte, its co-founder and Chief Strategy Officer and Executive Vice President, and if the Company is unable to retain Mr. Bell and Mr. Previte, attract and retain key employees and hire qualified management, technical and engineering personnel, its ability to compete could be harmed. ⚫ A failure to successfully develop and manage the Company’s proposed manufacturing facility could harm its business, financial condition and results of operations. ⚫ If the Company fails to manage its future growth effectively, its business, prospects, operating results and financial condition may be materially adversely effected. ⚫ The Company relies on third parties for a supply of equipment, satellite components and other services. ⚫ The Company and its suppliers rely on complex systems and components, which involves a significant degree of risk and uncertainty in terms of operational performance and costs. ⚫ The Company may be negatively affected by global economic conditions. ⚫ The ongoing COVID-19 pandemic may disrupt the Company’s operations, including its ability to successfully complete the research and development of its Earth Observation constellation on a timely basis. ⚫ The Company may not be able to launch its satellites successfully. Loss of a satellite during launch could cause significant danger on the ground and could delay or impair the Company’s ability to offer its services or reduce its expected potential revenues, and launch insurance, even if it is available, will not fully cover these risks. ⚫ The Company’s solutions could fail to perform or could perform at reduced levels of service because of technological malfunctions or deficiencies, regulatory compliance issues, or events outside of its control, which would harm its business and reputation. ⚫ The Company’s satellites have a limited life and may fail prematurely, which would materially and adversely affect its business, prospects and potential profitability. ⚫ The Company’s business may be adversely affected if it is unable to protect its intellectual property rights from unauthorized use by third parties. ⚫ The Company’s customized hardware and software may be difficult and expensive to service, upgrade or replace. ⚫ The Company’s networks and those of its third-party service providers may be vulnerable to security risks. ⚫ The Company’s satellites may collide with space debris or another spacecraft, which could adversely affect its ability to provide its satellite solutions and mission solutions. ⚫ Operation of satellites involves a degree of inherent risk. The Company could suffer significant reputational harm to its businesses, in addition to tort liability, maintenance, increased safety infrastructure and other costs stemming from any accident involving its satellite and mission solutions. ⚫ The Company’s business is subject to extensive government regulation, which mandates how it may operate its business and may increase the cost of providing services and expansion into new markets, and is subject to changes in regulatory requirements and other applicable laws. ⚫ The Company may become involved in or subject to litigation, including securities class action or derivative litigation, or investigations by the SEC or other regulatory authorities relating to the proposed business combination. ⚫ The Company identified material weaknesses in its internal control over financial reporting. If Terran is unable to remediate these material weaknesses, or if it identifies additional material weaknesses in the future or otherwise fails to maintain effective internal control over financial reporting, its business could be adversely affected. ⚫ The Company’s business could be impacted by the inability of the parties to successfully or timely consummate the proposed business combination, including the risk that any required regulatory approvals are not obtained, are delayed, or are subject to unanticipated conditions that could adversely affect the combined company or the expect ed benefits of the proposed business combination or that the approval of the shareholders of Tailwind is not obtained. ⚫ If the business combination benefits do not meet the expectations of investors or securities analysts, the market price of Tailwind’s securities or, following the closing, the combined entity’s securities, may decline. |
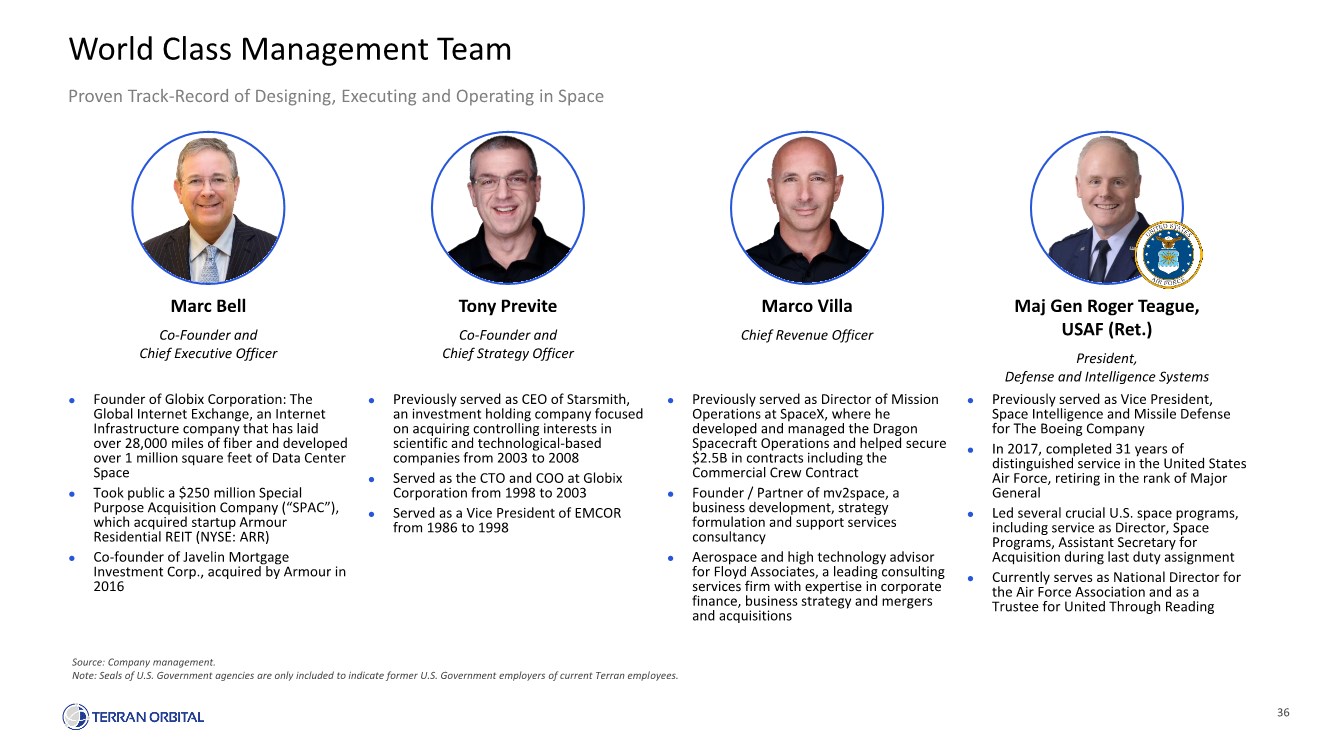
36 World Class Management Team Proven Track-Record of Designing, Executing and Operating in Space Marc Bell Co-Founder and Chief Executive Officer ⚫ Founder of Globix Corporation: The Global Internet Exchange, an Internet Infrastructure company that has laid over 28,000 miles of fiber and developed over 1 million square feet of Data Center Space ⚫ Took public a $250 million Special Purpose Acquisition Company (“SPAC”), which acquired startup Armour Residential REIT (NYSE: ARR) ⚫ Co-founder of Javelin Mortgage Investment Corp., acquired by Armour in 2016 Tony Previte Co-Founder and Chief Strategy Officer ⚫ Previously served as CEO of Starsmith, an investment holding company focused on acquiring controlling interests in scientific and technological-based companies from 2003 to 2008 ⚫ Served as the CTO and COO at Globix Corporation from 1998 to 2003 ⚫ Served as a Vice President of EMCOR from 1986 to 1998 Marco Villa Chief Revenue Officer ⚫ Previously served as Director of Mission Operations at SpaceX, where he developed and managed the Dragon Spacecraft Operations and helped secure $2.5B in contracts including the Commercial Crew Contract ⚫ Founder / Partner of mv2space, a business development, strategy formulation and support services consultancy ⚫ Aerospace and high technology advisor for Floyd Associates, a leading consulting services firm with expertise in corporate finance, business strategy and mergers and acquisitions Maj Gen Roger Teague, USAF (Ret.) President, Defense and Intelligence Systems ⚫ Previously served as Vice President, Space Intelligence and Missile Defense for The Boeing Company ⚫ In 2017, completed 31 years of distinguished service in the United States Air Force, retiring in the rank of Major General ⚫ Led several crucial U.S. space programs, including service as Director, Space Programs, Assistant Secretary for Acquisition during last duty assignment ⚫ Currently serves as National Director for the Air Force Association and as a Trustee for United Through Reading Source: Company management. Note: Seals of U.S. Government agencies are only included to indicate former U.S. Government employers of current Terran employees. |
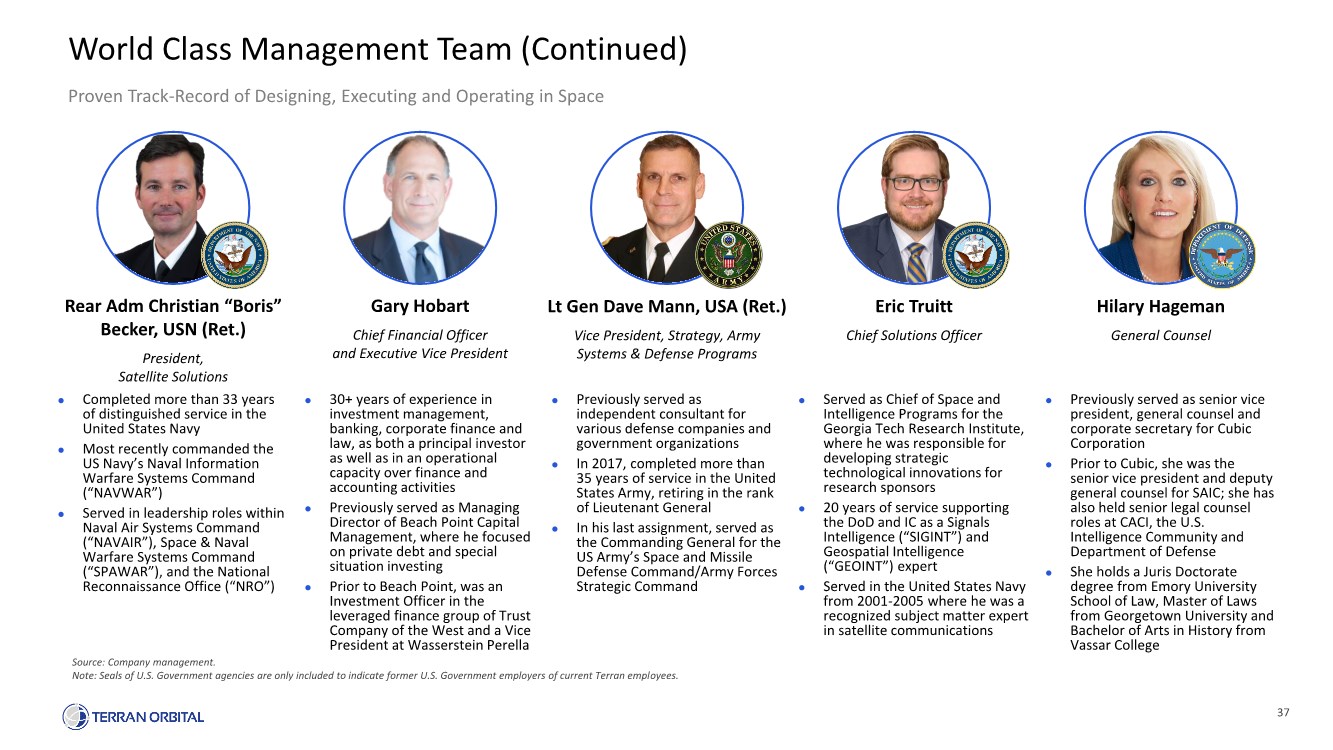
37 World Class Management Team (Continued) Proven Track-Record of Designing, Executing and Operating in Space Source: Company management. Note: Seals of U.S. Government agencies are only included to indicate former U.S. Government employers of current Terran employees. Gary Hobart Chief Financial Officer and Executive Vice President ⚫ 30+ years of experience in investment management, banking, corporate finance and law, as both a principal investor as well as in an operational capacity over finance and accounting activities ⚫ Previously served as Managing Director of Beach Point Capital Management, where he focused on private debt and special situation investing ⚫ Prior to Beach Point, was an Investment Officer in the leveraged finance group of Trust Company of the West and a Vice President at Wasserstein Perella Lt Gen Dave Mann, USA (Ret.) Vice President, Strategy, Army Systems & Defense Programs ⚫ Previously served as independent consultant for various defense companies and government organizations ⚫ In 2017, completed more than 35 years of service in the United States Army, retiring in the rank of Lieutenant General ⚫ In his last assignment, served as the Commanding General for the US Army’s Space and Missile Defense Command/Army Forces Strategic Command Hilary Hageman General Counsel ⚫ Previously served as senior vice president, general counsel and corporate secretary for Cubic Corporation ⚫ Prior to Cubic, she was the senior vice president and deputy general counsel for SAIC; she has also held senior legal counsel roles at CACI, the U.S. Intelligence Community and Department of Defense ⚫ She holds a Juris Doctorate degree from Emory University School of Law, Master of Laws from Georgetown University and Bachelor of Arts in History from Vassar College Rear Adm Christian “Boris” Becker, USN (Ret.) President, Satellite Solutions ⚫ Completed more than 33 years of distinguished service in the United States Navy ⚫ Most recently commanded the US Navy’s Naval Information Warfare Systems Command (“NAVWAR”) ⚫ Served in leadership roles within Naval Air Systems Command (“NAVAIR”), Space & Naval Warfare Systems Command (“SPAWAR”), and the National Reconnaissance Office (“NRO”) Eric Truitt Chief Solutions Officer ⚫ Served as Chief of Space and Intelligence Programs for the Georgia Tech Research Institute, where he was responsible for developing strategic technological innovations for research sponsors ⚫ 20 years of service supporting the DoD and IC as a Signals Intelligence (“SIGINT”) and Geospatial Intelligence (“GEOINT”) expert ⚫ Served in the United States Navy from 2001-2005 where he was a recognized subject matter expert in satellite communications |
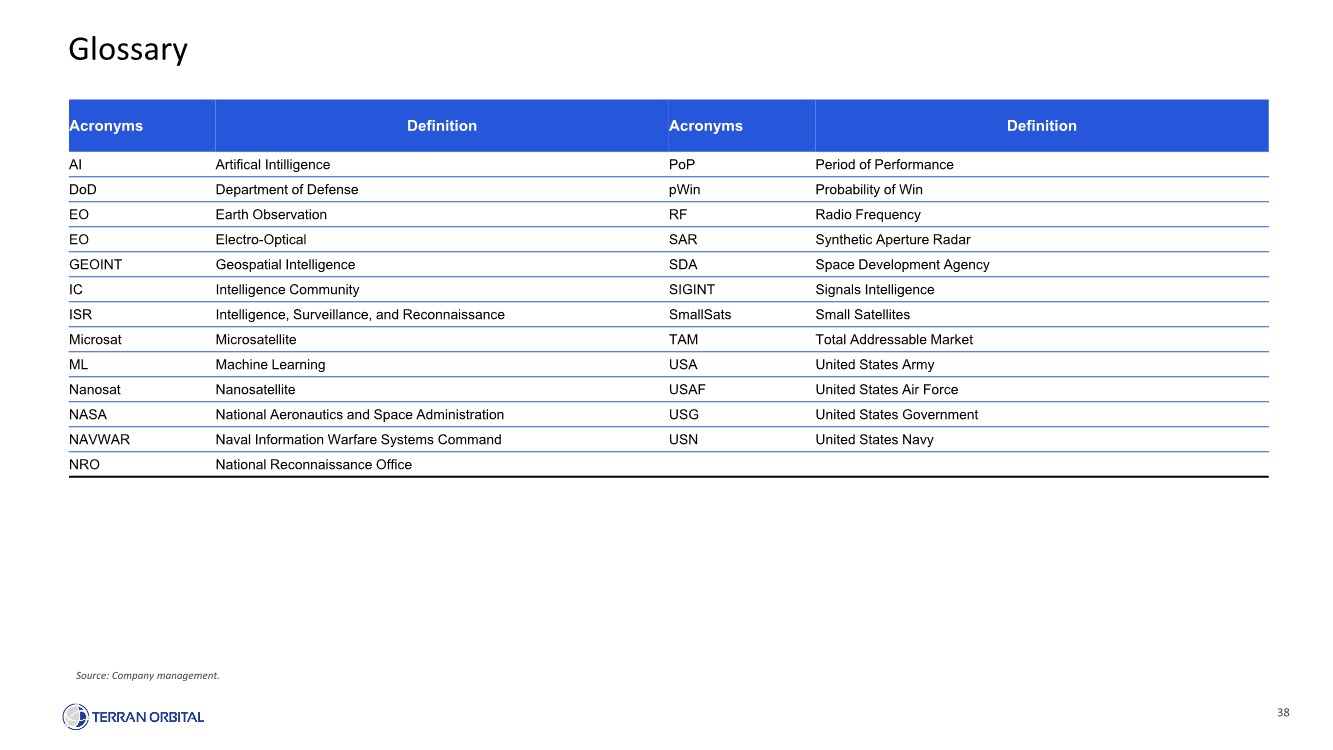
38 Glossary Acronyms Definition Acronyms Definition AI Artifical Intilligence PoP Period of Performance DoD Department of Defense pWin Probability of Win EO Earth Observation RF Radio Frequency EO Electro-Optical SAR Synthetic Aperture Radar GEOINT Geospatial Intelligence SDA Space Development Agency IC Intelligence Community SIGINT Signals Intelligence ISR Intelligence, Surveillance, and Reconnaissance SmallSats Small Satellites Microsat Microsatellite TAM Total Addressable Market ML Machine Learning USA United States Army Nanosat Nanosatellite USAF United States Air Force NASA National Aeronautics and Space Administration USG United States Government NAVWAR Naval Information Warfare Systems Command USN United States Navy NRO National Reconnaissance Office Source: Company management. |
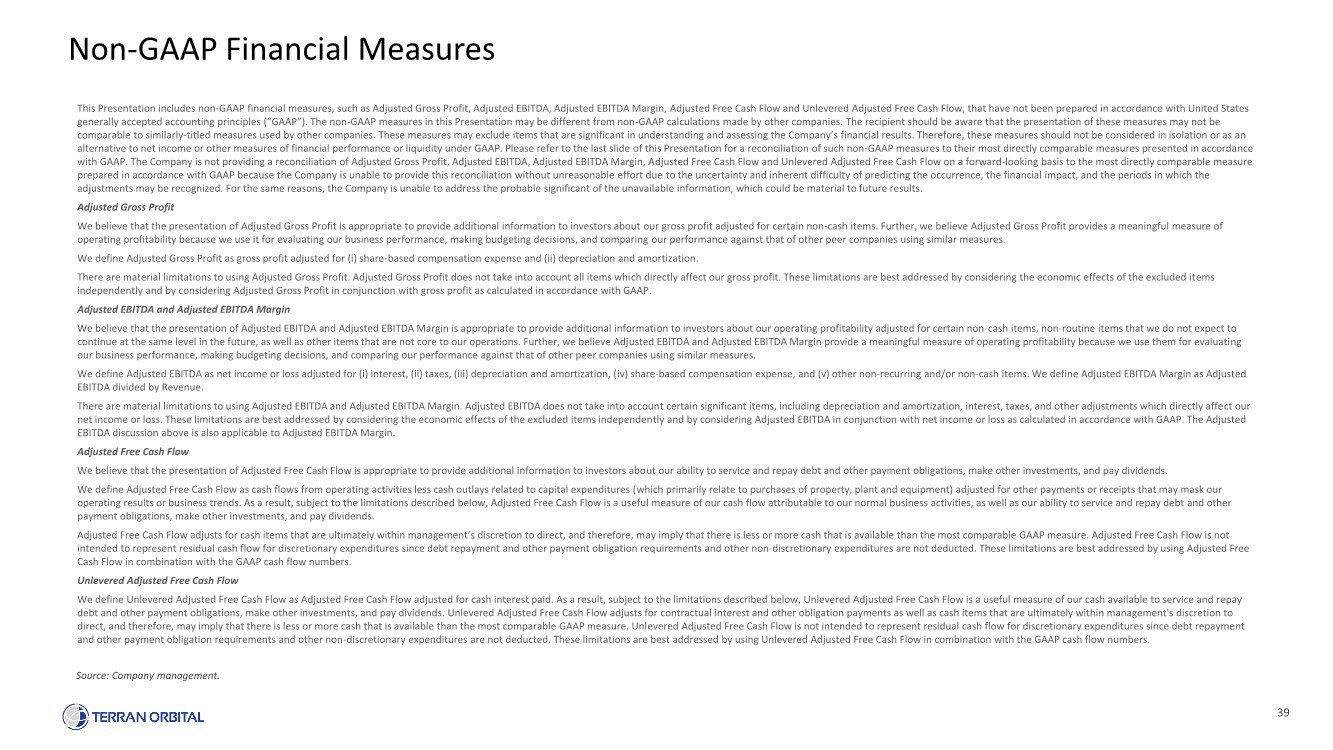
39 Non-GAAP Financial Measures This Presentation includes non-GAAP financial measures, such as Adjusted Gross Profit, Adjusted EBITDA, Adjusted EBITDA Margin, Adjusted Free Cash Flow and Unlevered Adjusted Free Cash Flow, that have not been prepared in accordance with United States generally accepted accounting principles (“GAAP”). The non-GAAP measures in this Presentation may be different from non-GAAP calculations made by other companies. The recipient should be aware that the presentation of these measures may not be comparable to similarly-titled measures used by other companies. These measures may exclude items that are significant in understanding and assessing the Company’s financial results. Therefore, these measures should not be considered in isolation or as an alternative to net income or other measures of financial performance or liquidity under GAAP. Please refer to the last slide of this Presentation for a reconciliation of such non-GAAP measures to their most directly comparable measures presented in accordance with GAAP. The Company is not providing a reconciliation of Adjusted Gross Profit, Adjusted EBITDA, Adjusted EBITDA Margin, Adjusted Free Cash Flow and Unlevered Adjusted Free Cash Flow on a forward-looking basis to the most directly comparable measure prepared in accordance with GAAP because the Company is unable to provide this reconciliation without unreasonable effort due to the uncertainty and inherent difficulty of predicting the occurrence, the financial impact, and the periods in which the adjustments may be recognized. For the same reasons, the Company is unable to address the probable significant of the unavailable information, which could be material to future results. Adjusted Gross Profit We believe that the presentation of Adjusted Gross Profit is appropriate to provide additional information to investors about our gross profit adjusted for certain non-cash items. Further, we believe Adjusted Gross Profit provides a meaningful measure of operating profitability because we use it for evaluating our business performance, making budgeting decisions, and comparing our performance against that of other peer companies using similar measures. We define Adjusted Gross Profit as gross profit adjusted for (i) share-based compensation expense and (ii) depreciation and amortization. There are material limitations to using Adjusted Gross Profit. Adjusted Gross Profit does not take into account all items which directly affect our gross profit. These limitations are best addressed by considering the economic effects of the excluded items independently and by considering Adjusted Gross Profit in conjunction with gross profit as calculated in accordance with GAAP. Adjusted EBITDA and Adjusted EBITDA Margin We believe that the presentation of Adjusted EBITDA and Adjusted EBITDA Margin is appropriate to provide additional information to investors about our operating profitability adjusted for certain non-cash items, non-routine items that we do not expect to continue at the same level in the future, as well as other items that are not core to our operations. Further, we believe Adjusted EBITDA and Adjusted EBITDA Margin provide a meaningful measure of operating profitability because we use them for evaluating our business performance, making budgeting decisions, and comparing our performance against that of other peer companies using similar measures. We define Adjusted EBITDA as net income or loss adjusted for (i) interest, (ii) taxes, (iii) depreciation and amortization, (iv) share-based compensation expense, and (v) other non-recurring and/or non-cash items. We define Adjusted EBITDA Margin as Adjusted EBITDA divided by Revenue. There are material limitations to using Adjusted EBITDA and Adjusted EBITDA Margin. Adjusted EBITDA does not take into account certain significant items, including depreciation and amortization, interest, taxes, and other adjustments which directly affect our net income or loss. These limitations are best addressed by considering the economic effects of the excluded items independently and by considering Adjusted EBITDA in conjunction with net income or loss as calculated in accordance with GAAP. The Adjusted EBITDA discussion above is also applicable to Adjusted EBITDA Margin. Adjusted Free Cash Flow We believe that the presentation of Adjusted Free Cash Flow is appropriate to provide additional information to investors about our ability to service and repay debt and other payment obligations, make other investments, and pay dividends. We define Adjusted Free Cash Flow as cash flows from operating activities less cash outlays related to capital expenditures (which primarily relate to purchases of property, plant and equipment) adjusted for other payments or receipts that may mask our operating results or business trends. As a result, subject to the limitations described below, Adjusted Free Cash Flow is a useful measure of our cash flow attributable to our normal business activities, as well as our ability to service and repay debt and other payment obligations, make other investments, and pay dividends. Adjusted Free Cash Flow adjusts for cash items that are ultimately within management’s discretion to direct, and therefore, may imply that there is less or more cash that is available than the most comparable GAAP measure. Adjusted Free Cash Flow is not intended to represent residual cash flow for discretionary expenditures since debt repayment and other payment obligation requirements and other non-discretionary expenditures are not deducted. These limitations are best addressed by using Adjusted Free Cash Flow in combination with the GAAP cash flow numbers. Unlevered Adjusted Free Cash Flow We define Unlevered Adjusted Free Cash Flow as Adjusted Free Cash Flow adjusted for cash interest paid. As a result, subject to the limitations described below, Unlevered Adjusted Free Cash Flow is a useful measure of our cash available to service and repay debt and other payment obligations, make other investments, and pay dividends. Unlevered Adjusted Free Cash Flow adjusts for contractual interest and other obligation payments as well as cash items that are ultimately within management's discretion to direct, and therefore, may imply that there is less or more cash that is available than the most comparable GAAP measure. Unlevered Adjusted Free Cash Flow is not intended to represent residual cash flow for discretionary expenditures since debt repayment and other payment obligation requirements and other non-discretionary expenditures are not deducted. These limitations are best addressed by using Unlevered Adjusted Free Cash Flow in combination with the GAAP cash flow numbers. Source: Company management. |
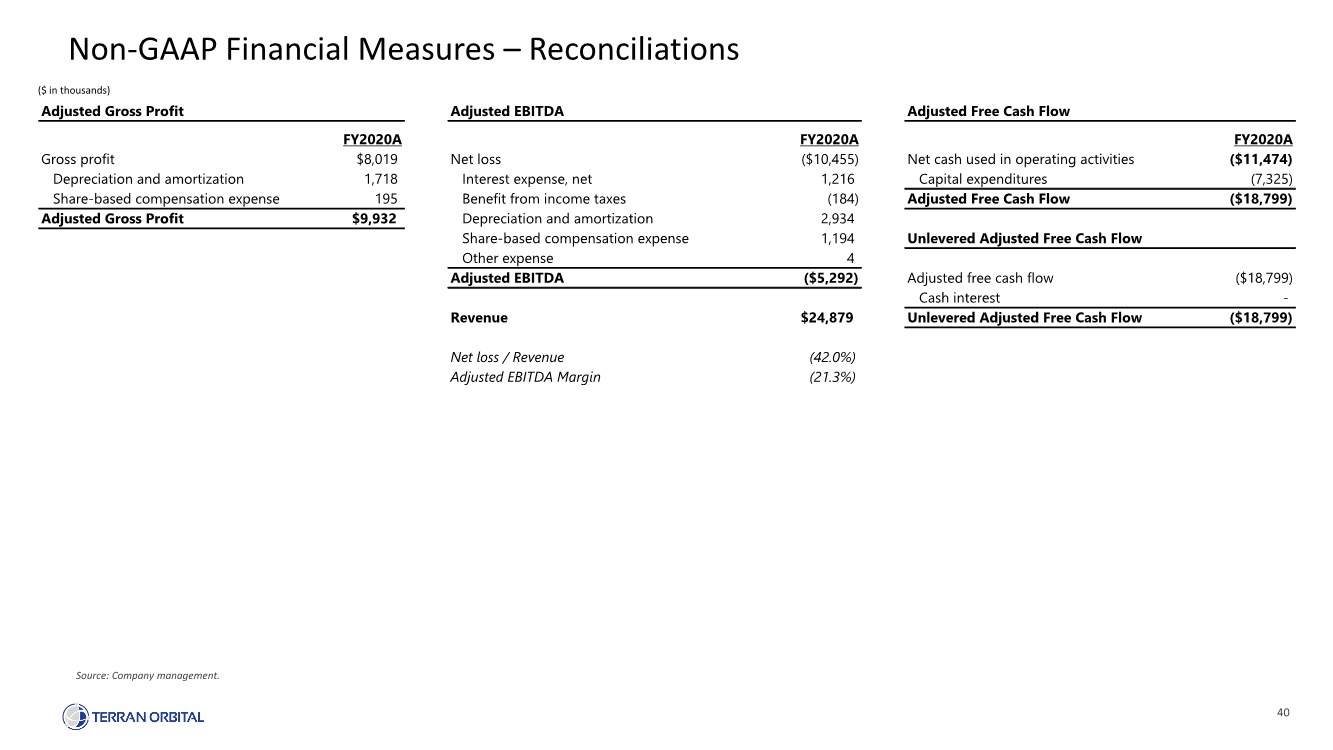
40 Non-GAAP Financial Measures – Reconciliations Source: Company management. ($ in thousands) Adjusted Gross Profit Adjusted EBITDA Adjusted Free Cash Flow FY2020A FY2020A FY2020A Gross profit $8,019 Net loss ($10,455) Net cash used in operating activities ($11,474) Depreciation and amortization 1,718 Interest expense, net 1,216 Capital expenditures (7,325) Share-based compensation expense 195 Benefit from income taxes (184) Adjusted Free Cash Flow ($18,799) Adjusted Gross Profit $9,932 Depreciation and amortization 2,934 Share-based compensation expense 1,194 Unlevered Adjusted Free Cash Flow Other expense 4 Adjusted EBITDA ($5,292) Adjusted free cash flow ($18,799) Cash interest - Revenue $24,879 Unlevered Adjusted Free Cash Flow ($18,799) Net loss / Revenue (42.0%) Adjusted EBITDA Margin (21.3%) |