Exhibit 99.3

First Quarter 2022 Financial Results May 12, 2022 Olink Proteomics Vision Enable understanding of real - time human biology Mission Accelerate proteomics together
Strictly private and confidential Disclaimer This presentation may contain certain forward - looking statements and opinions . Forward - looking statements are statements that do not relate to historical facts and events and such statements and opinions pertaining to the future that, for example, contain wording such as “may,” “might,” “will,” “could,” “would,” “should,” “expect,” “intend,” “plan,” “objective,” “anticipate,” “believe,” “estimate,” “predict,” “potential,” “continue,” “ongoing,” or the negative of these terms, or other comparable terminology intended to identify statements about the future . Forward - looking statements contained in this presentation include, but are not limited to, statements about : our addressable market, market growth, future revenue, key performance indicators, expenses, capital requirements and our needs for additional financing, our commercial launch plans, our strategic plans for our business and products, market acceptance of our products, our competitive position and developments and projections relating to our competitors, domestic and foreign regulatory approvals, third - party manufacturers and suppliers, our intellectual property, the potential effects of government regulation and local, regional and national and international economic conditions and events affecting our business . We cannot assure that the forward - looking statements in this presentation will prove to be accurate . Furthermore, if our forward - looking statements prove to be inaccurate, the inaccuracy may be material . These statements involve known and unknown risks, uncertainties and other important factors that may cause our actual results, levels of activity, performance or achievements to be materially different from the information expressed or implied by these forward - looking statements . The forward - looking statements and opinions contained in this presentation are based on our management’s beliefs and assumptions and are based upon information currently available to our management as of the date of this presentation and, while we believe such information forms a reasonable basis for such statements, such information may be limited or incomplete, and our statements should not be read to indicate that we have conducted an exhaustive inquiry into, or review of, all potentially available relevant information . In light of the significant uncertainties in these forward - looking statements, you should not regard these statements as a representation or warranty by us or any other person that we will achieve our objectives and plans in any specified time frame, or at all . Actual results, performance or events may differ materially from those in such statements due to, without limitation, risks generally associated with product development, including delays or challenges that may arise in the development, launch or scaling of our new products, programs or services, challenges in the commercialization of our products and services, the risk that we may not maintain our existing relationships with suppliers or enter into new ones, or that we will not realize the intended benefits from such relationships, any inability to protect our intellectual property effectively, changes in general economic conditions, in particular economic conditions in the markets on which we operate, changes affecting interest rate levels, changes affecting currency exchange rates, changes in competition levels, and changes in laws and regulations, and other risks described under the caption "Risk Factors" in our Form 20 - F (Commission file number 001 - 40277 ) and elsewhere in the documents we file with the Securities and Exchange Commission from time to time . The information, opinions and forward - looking statements contained in this announcement speak only as of its date, and are subject to change without notice and we undertake no obligation to update any such forward - looking statements for any reason, except as required by law . This presentation contains estimates, projections and other information concerning our industry, our business, and the markets for our products and services . Information that is based on estimates, forecasts, projections, market research or similar methodologies is inherently subject to uncertainties, and actual events or circumstances may differ materially from events and circumstances that are assumed in this information . Unless otherwise expressly stated, we obtained this industry, business, market and other data from our own internal estimates and research as well as from reports, research surveys, studies and similar data prepared by market research firms and other third parties, industry, medical and general publications, government data and similar sources . While we believe our internal company research as to such matters is reliable and the market definitions are appropriate, neither such research nor these definitions have been verified by any independent source . 2
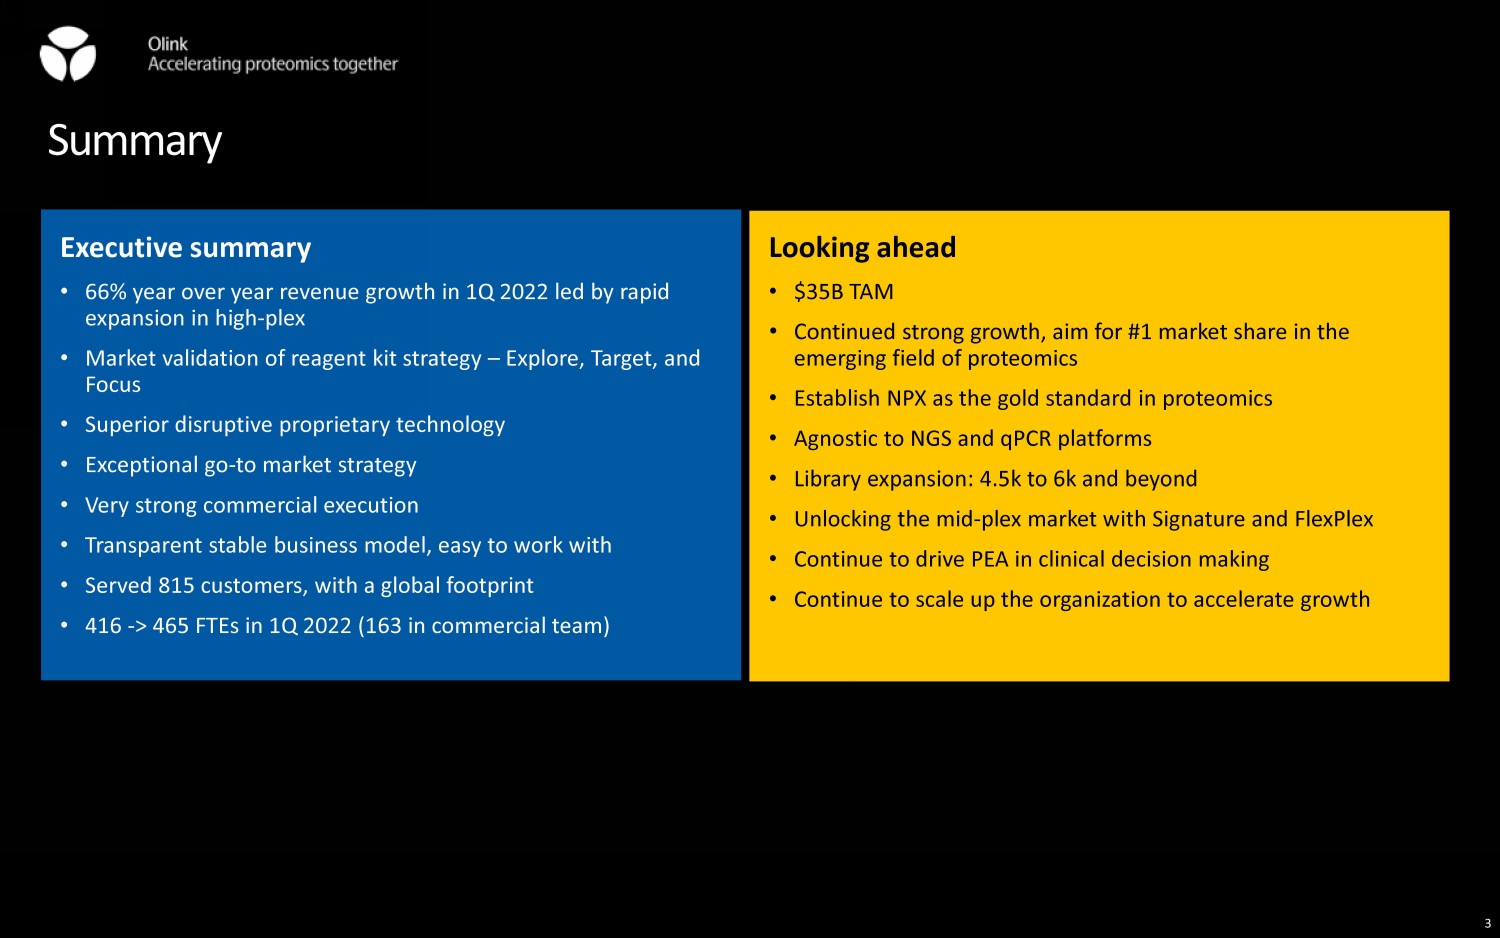
Summary Executive summary • 66% year over year revenue growth in 1Q 2022 led by rapid expansion in high - plex • Market validation of reagent kit strategy – Explore, Target, and Focus • Superior disruptive proprietary technology • Exceptional go - to market strategy • Very strong commercial execution • Transparent stable business model, easy to work with • Served 815 customers, with a global footprint • 416 - > 465 FTEs in 1Q 2022 (163 in commercial team) Looking ahead • $35B TAM • Continued strong growth, aim for #1 market share in the emerging field of proteomics • Establish NPX as the gold standard in proteomics • Agnostic to NGS and qPCR platforms • Library expansion: 4.5k to 6k and beyond • Unlocking the mid - plex market with Signature and FlexPlex • Continue to drive PEA in clinical decision making • Continue to scale up the organization to accelerate growth 3
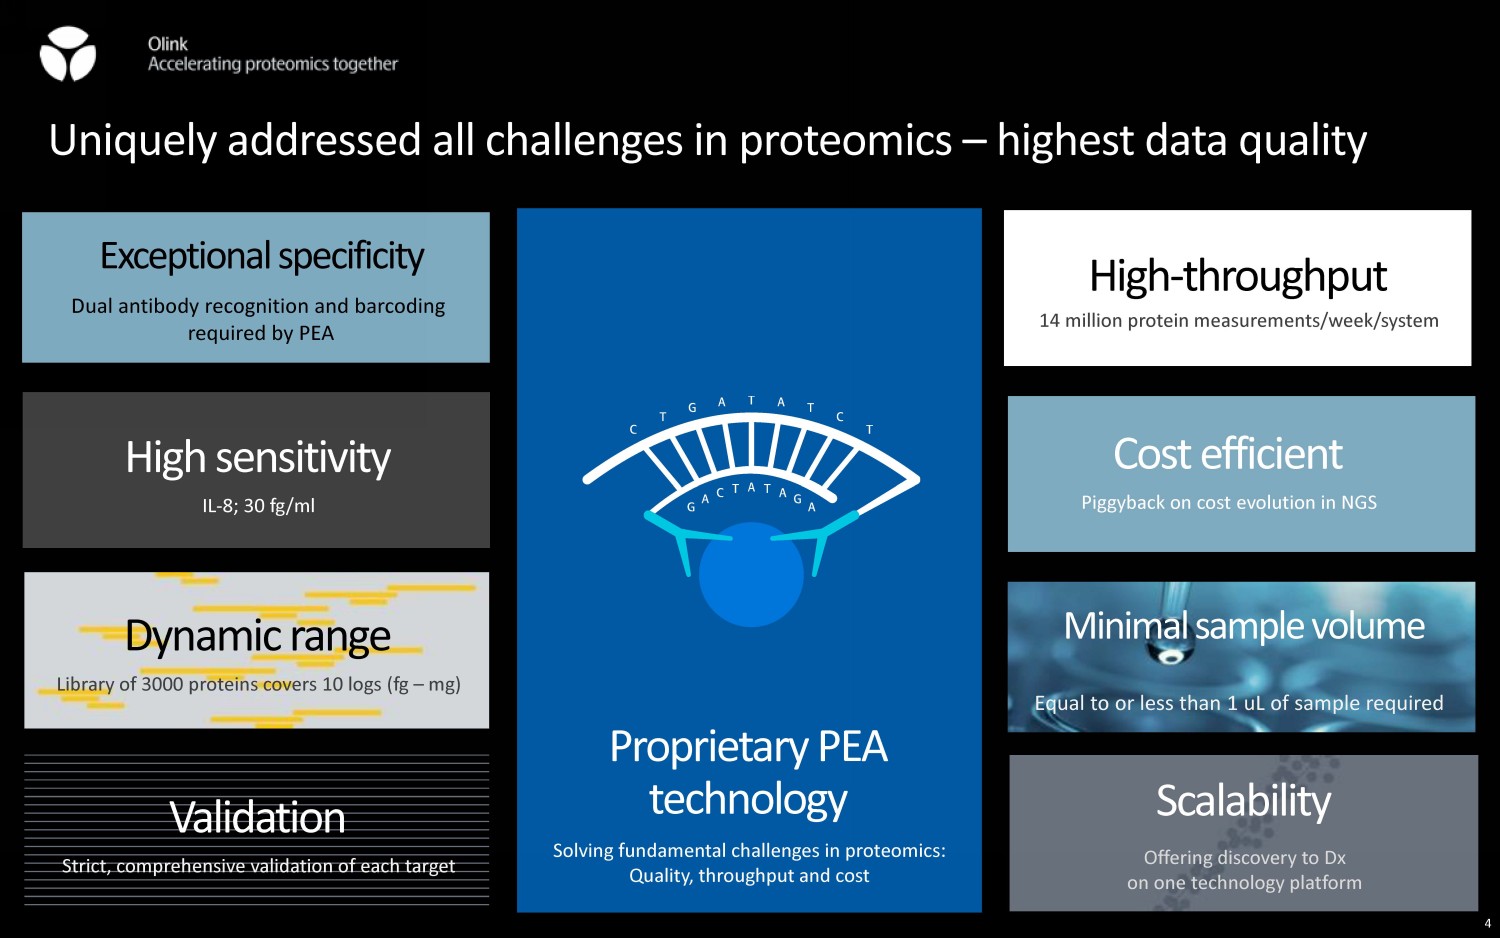
Uniquely addressed all challenges in proteomics – highest data quality 4 Dynamic range Library of 3000 proteins covers 10 logs ( fg – mg) Validation Strict, comprehensive validation of each target High - throughput 14 million protein measurements/week/system Cost efficient Piggyback on cost evolution in NGS Scalability Offering discovery to Dx on one technology platform High sensitivity IL - 8; 30 fg /ml Proprietary PEA technology Solving fundamental challenges in proteomics: Quality, throughput and cost Dual antibody recognition and barcoding required by PEA Exceptional specificity Minimal sample volume Equal to or less than 1 uL of sample required 4
Break - through science in high - impact peer reviewed literature 5
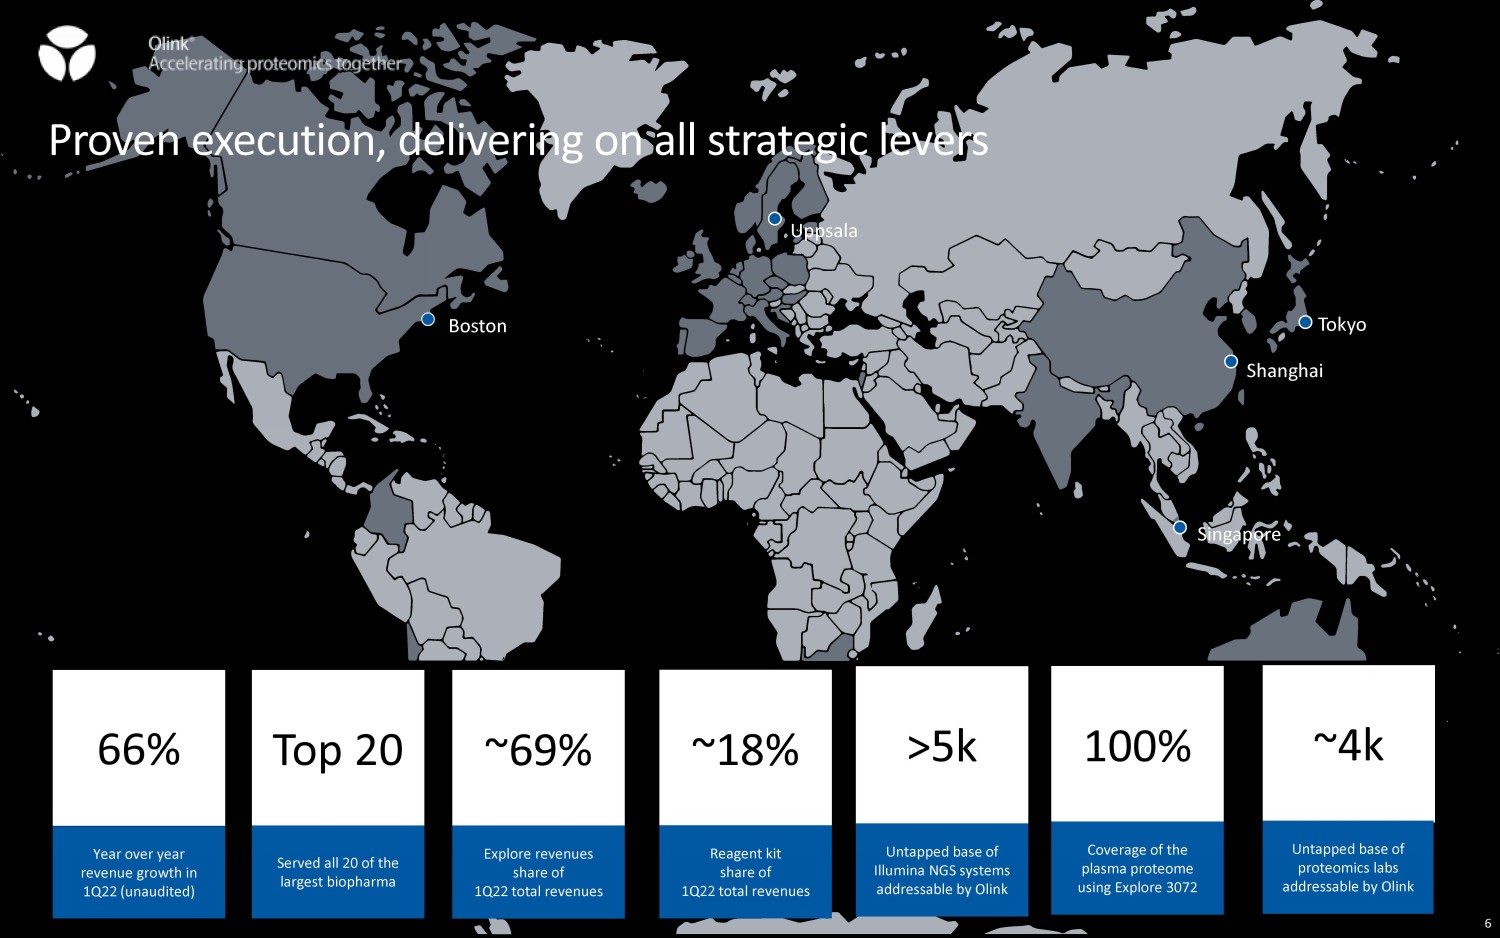
Singapore Shanghai Boston Tokyo Uppsala Proven execution, delivering on all strategic levers 66% Year over year revenue growth in 1Q22 (unaudited) ~18% Reagent kit share of 1Q22 total revenues >5k Untapped base of Illumina NGS systems addressable by Olink ~69% Explore revenues share of 1Q22 total revenues Top 20 Served all 20 of the largest biopharma 100% Coverage of the plasma proteome using Explore 3072 ~4k Untapped base of proteomics labs addressable by Olink 6
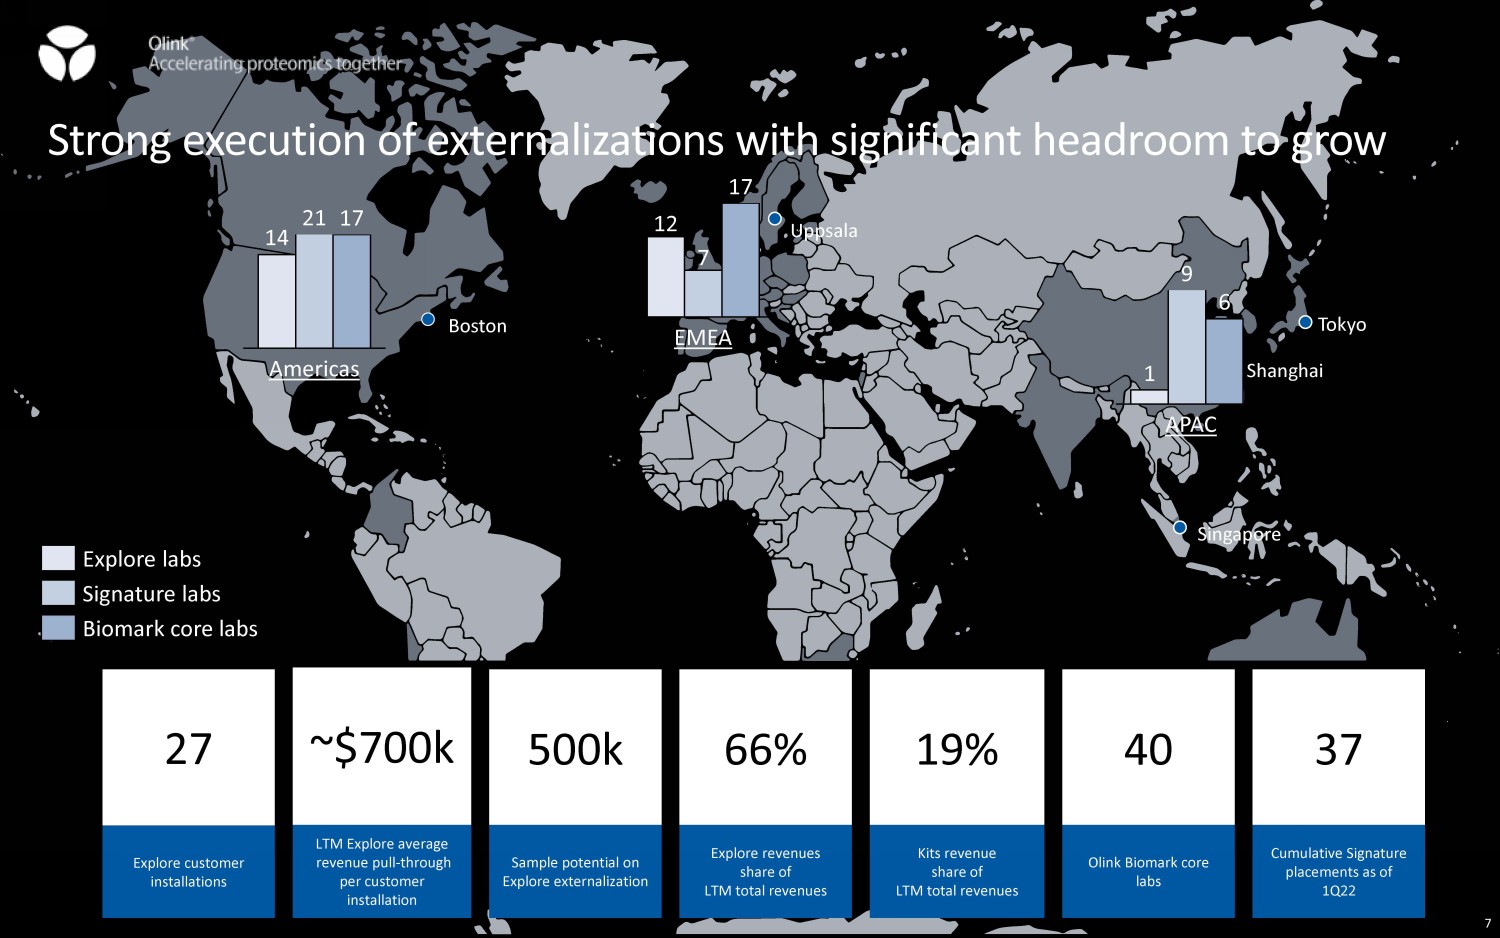
Singapore Shanghai Boston Tokyo Uppsala Strong execution of externalizations with significant headroom to grow 27 Explore customer installations 1 9 6 APAC 12 7 17 EMEA 14 21 17 Americas Explore labs Biomark core labs Signature labs 66% Explore revenues share of LTM total revenues 19% Kits revenue share of LTM total revenues ~$700k LTM Explore average revenue pull - through per customer installation 500k Sample potential on Explore externalization 37 Cumulative Signature placements as of 1Q22 40 Olink Biomark core labs 7
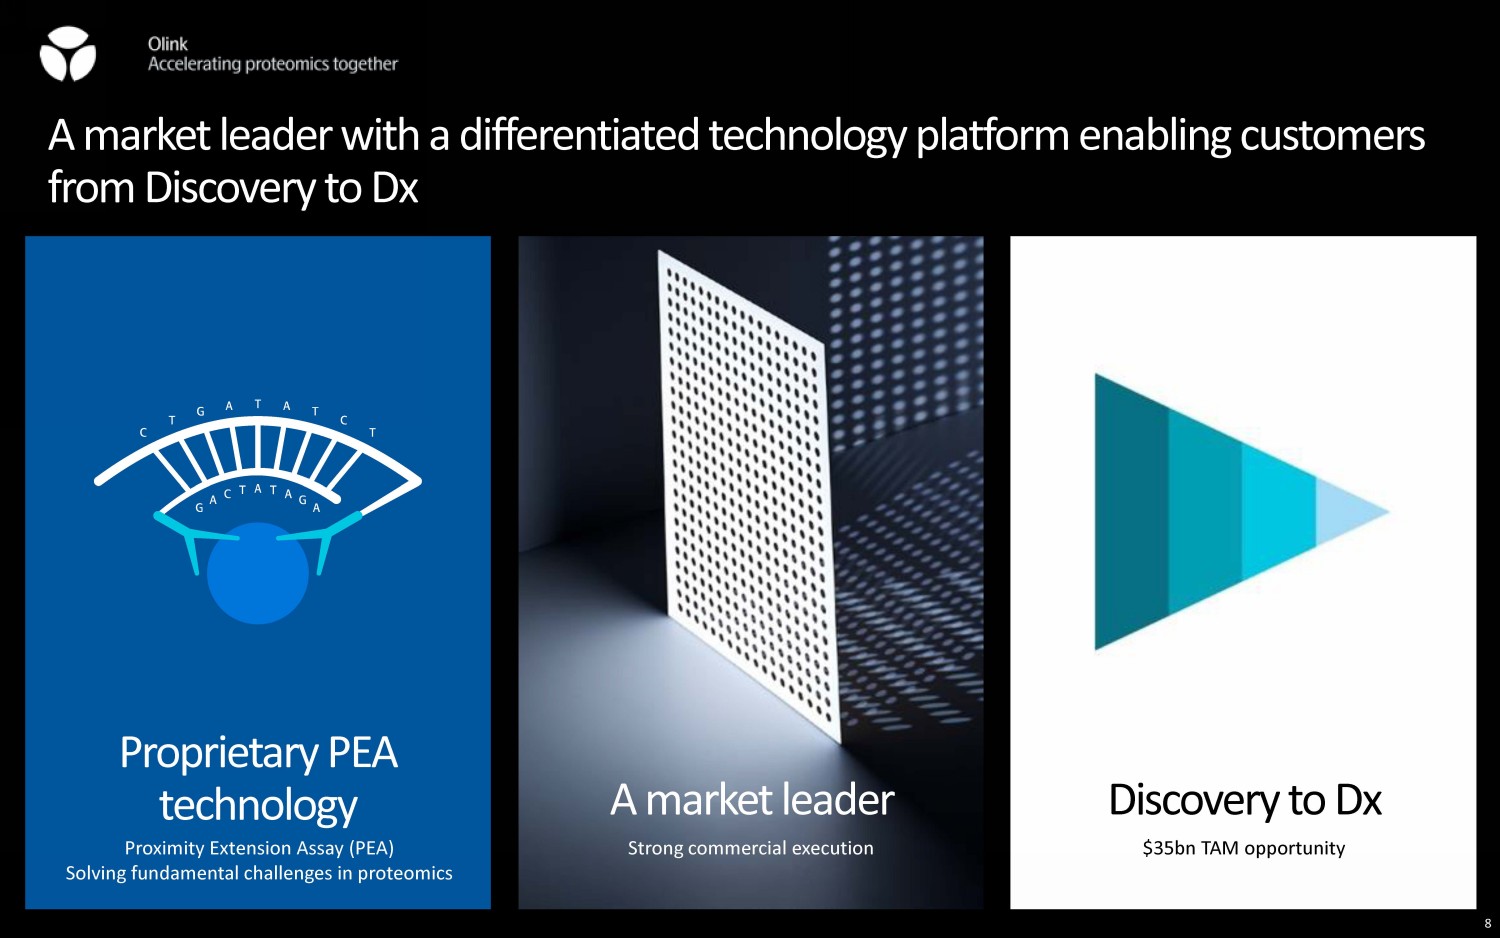
8 Proprietary PEA technology Discovery to Dx Proximity Extension Assay (PEA) Solving fundamental challenges in proteomics $35bn TAM opportunity A market leader Strong commercial execution A market leader with a differentiated technology platform enabling customers from Discovery to Dx 8

Actionable science driving rapid customer adoption and growth Evolution of publications based on PEA 1 Number of publications (accumulated) 54 123 223 349 513 768 839 FY17 FY16 FY20 FY19 FY18 FY21 Customer account acquisition Total number of accounts served since inception 1Q22 1 PEA publication count exceeded 860 as of April 30, 2022. Publication counts are estimates. 116 216 329 469 637 753 815 FY17 FY16 FY20 FY19 FY18 FY21 1Q22 9
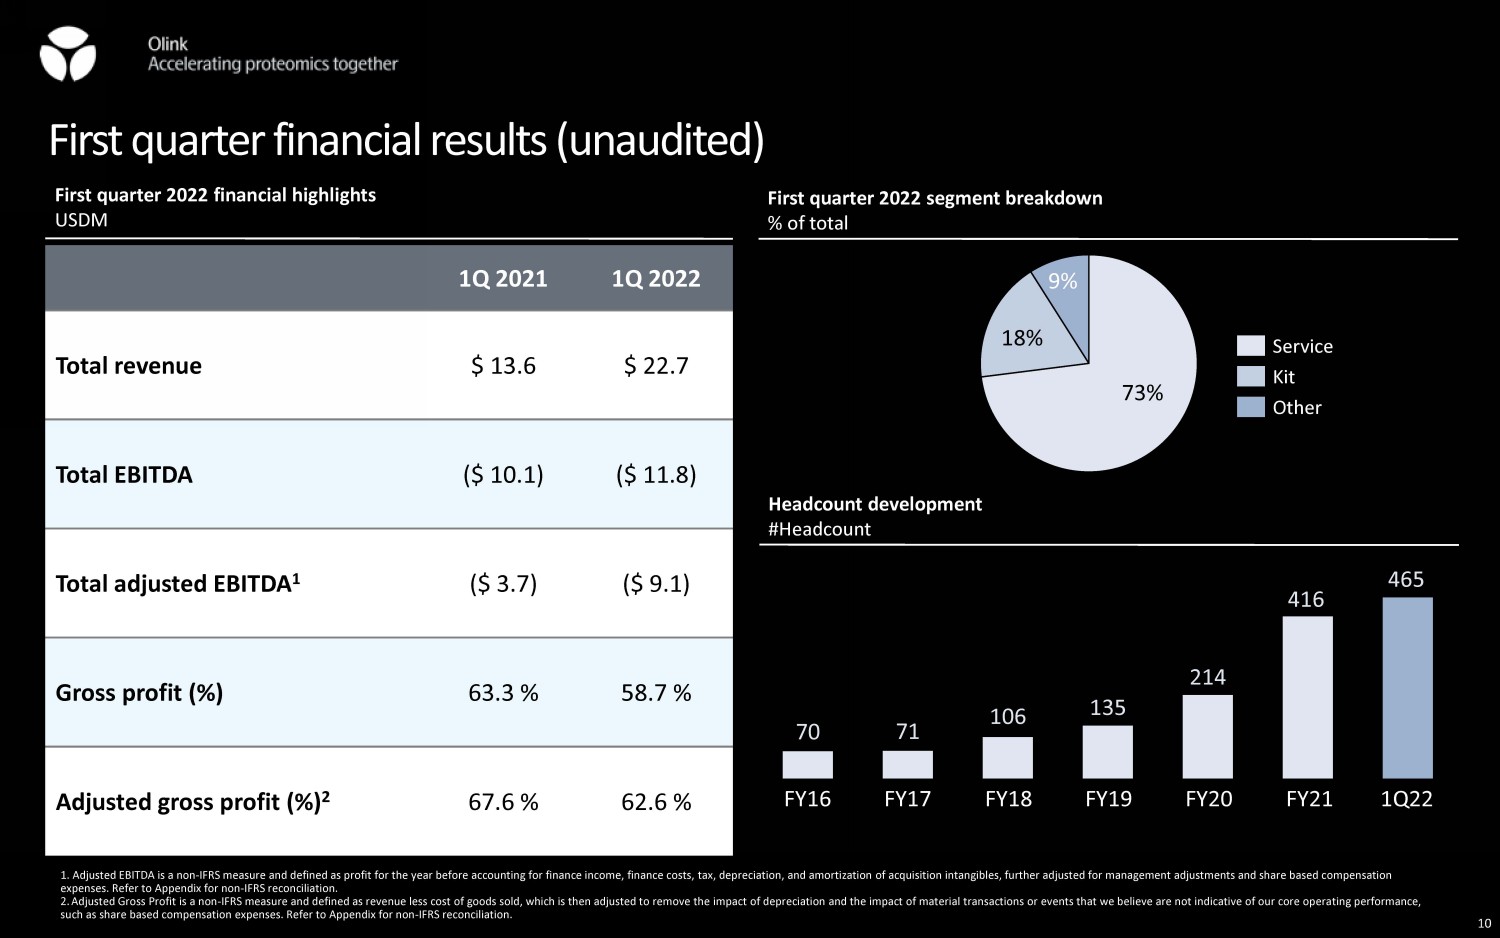
First quarter financial results (unaudited) 1. Adjusted EBITDA is a non - IFRS measure and defined as profit for the year before accounting for finance income, finance costs, tax, depreciation, and amortization of acquisition intangibles, further adjusted for management adjustments and share based c om pensation expenses. Refer to Appendix for non - IFRS reconciliation. 2. Adjusted Gross Profit is a non - IFRS measure and defined as revenue less cost of goods sold, which is then adjusted to remove the impact of depreciation and the impact of material transactions or events that we believe are not indicative of our core opera ti ng performance, such as share based compensation expenses. Refer to Appendix for non - IFRS reconciliation. . 1Q 2021 1Q 2022 Total revenue $ 13.6 $ 22.7 Total EBITDA ($ 10.1) ($ 11.8) Total adjusted EBITDA 1 ($ 3.7) ($ 9.1) Gross profit (%) 63.3 % 58.7 % Adjusted gross profit (%) 2 67.6 % 62.6 % 73% 18% 9% Service Kit Other First quarter 2022 segment breakdown % of total Headcount development #Headcount First quarter 2022 financial highlights USDM 70 71 106 135 214 416 465 FY16 FY17 FY19 FY18 FY20 FY21 1Q22 10
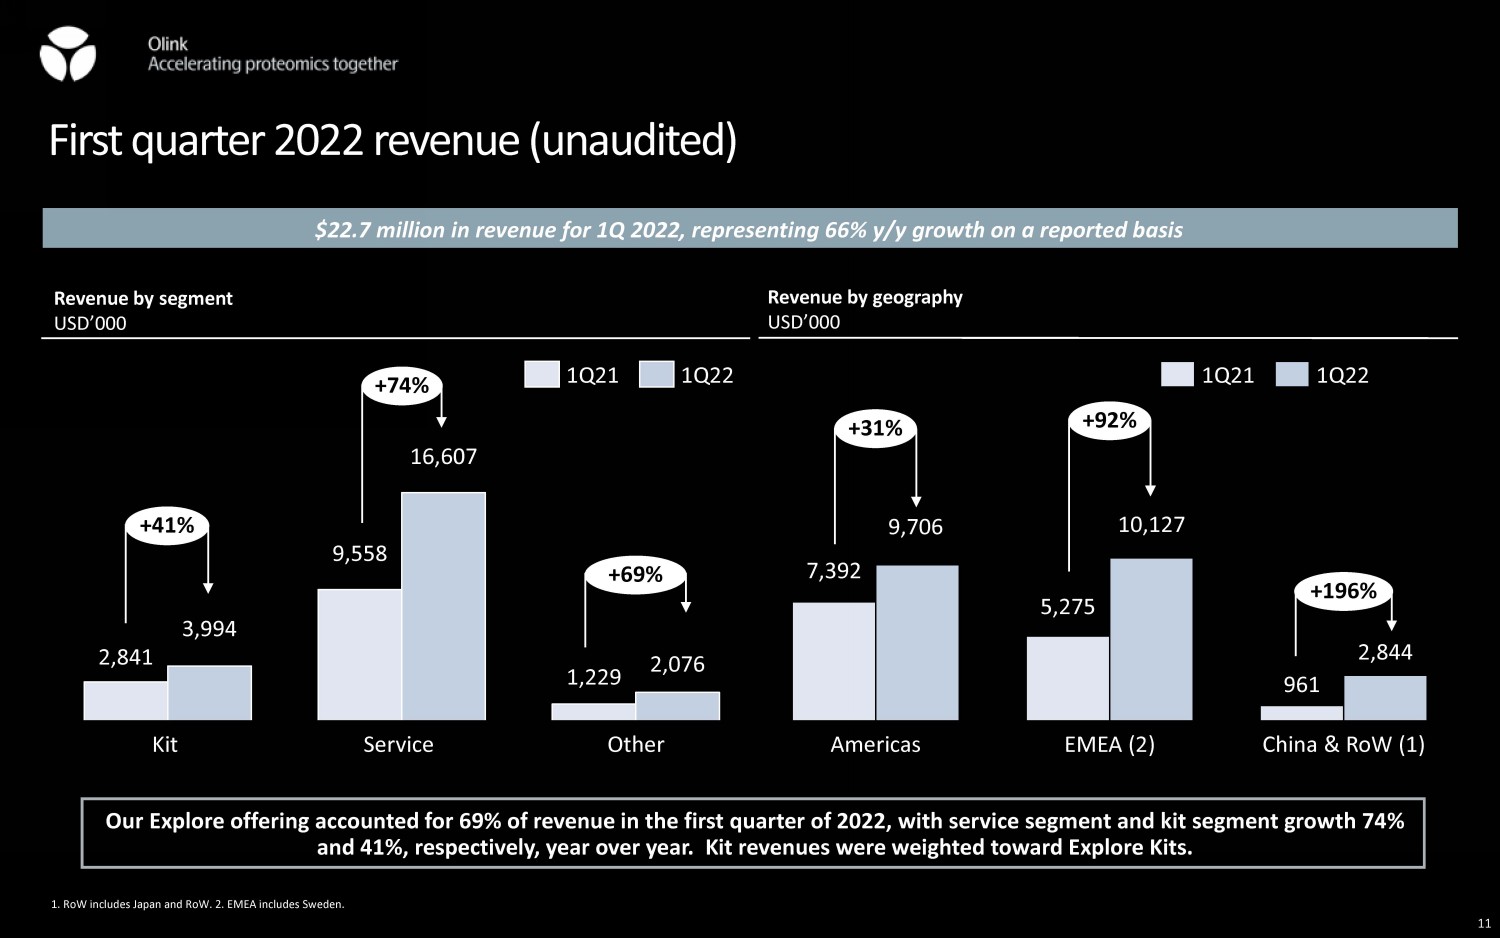
First quarter 2022 revenue (unaudited) 1. RoW includes Japan and RoW . 2. EMEA includes Sweden. $22.7 million in revenue for 1Q 2022, representing 66% y/y growth on a reported basis Revenue by segment USD’000 Revenue by geography USD’000 2,841 9,558 1,229 3,994 16,607 2,076 Other Kit Service +41% +74% +69% 1Q21 1Q22 7,392 5,275 961 9,706 10,127 2,844 China & RoW (1) Americas EMEA (2) +31% +92% +196% 1Q21 1Q22 Our Explore offering accounted for 69% of revenue in the first quarter of 2022, with service segment and kit segment growth 7 4% and 41%, respectively, year over year. Kit revenues were weighted toward Explore Kits. 11
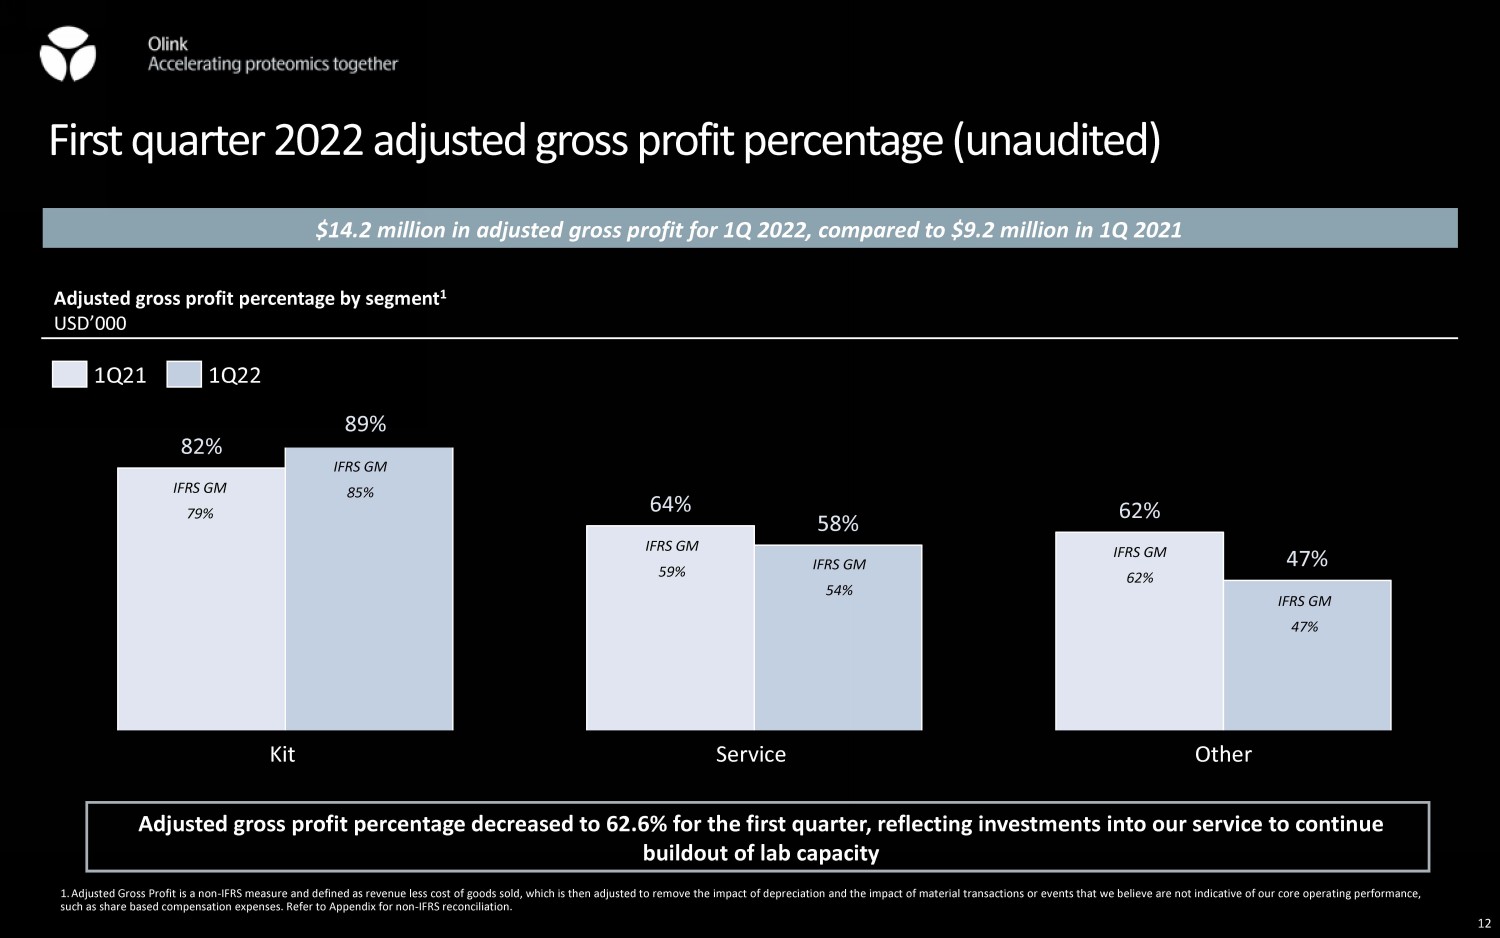
First quarter 2022 adjusted gross profit percentage (unaudited) $14.2 million in adjusted gross profit for 1Q 2022, compared to $9.2 million in 1Q 2021 Adjusted gross profit percentage decreased to 62.6% for the first quarter, reflecting investments into our service to continu e buildout of lab capacity Adjusted gross profit percentage by segment 1 USD’000 82 % 64 % 62 % 89 % 58 % 47 % Kit Other Service 1Q21 1Q22 1. Adjusted Gross Profit is a non - IFRS measure and defined as revenue less cost of goods sold, which is then adjusted to remove the impact of depreciation and the impact of material transactions or events that we believe are not indicative of our core opera ti ng performance, such as share based compensation expenses. Refer to Appendix for non - IFRS reconciliation. IFRS GM 79% IFRS GM 85% IFRS GM 59% IFRS GM 54% IFRS GM 62% IFRS GM 47% 12
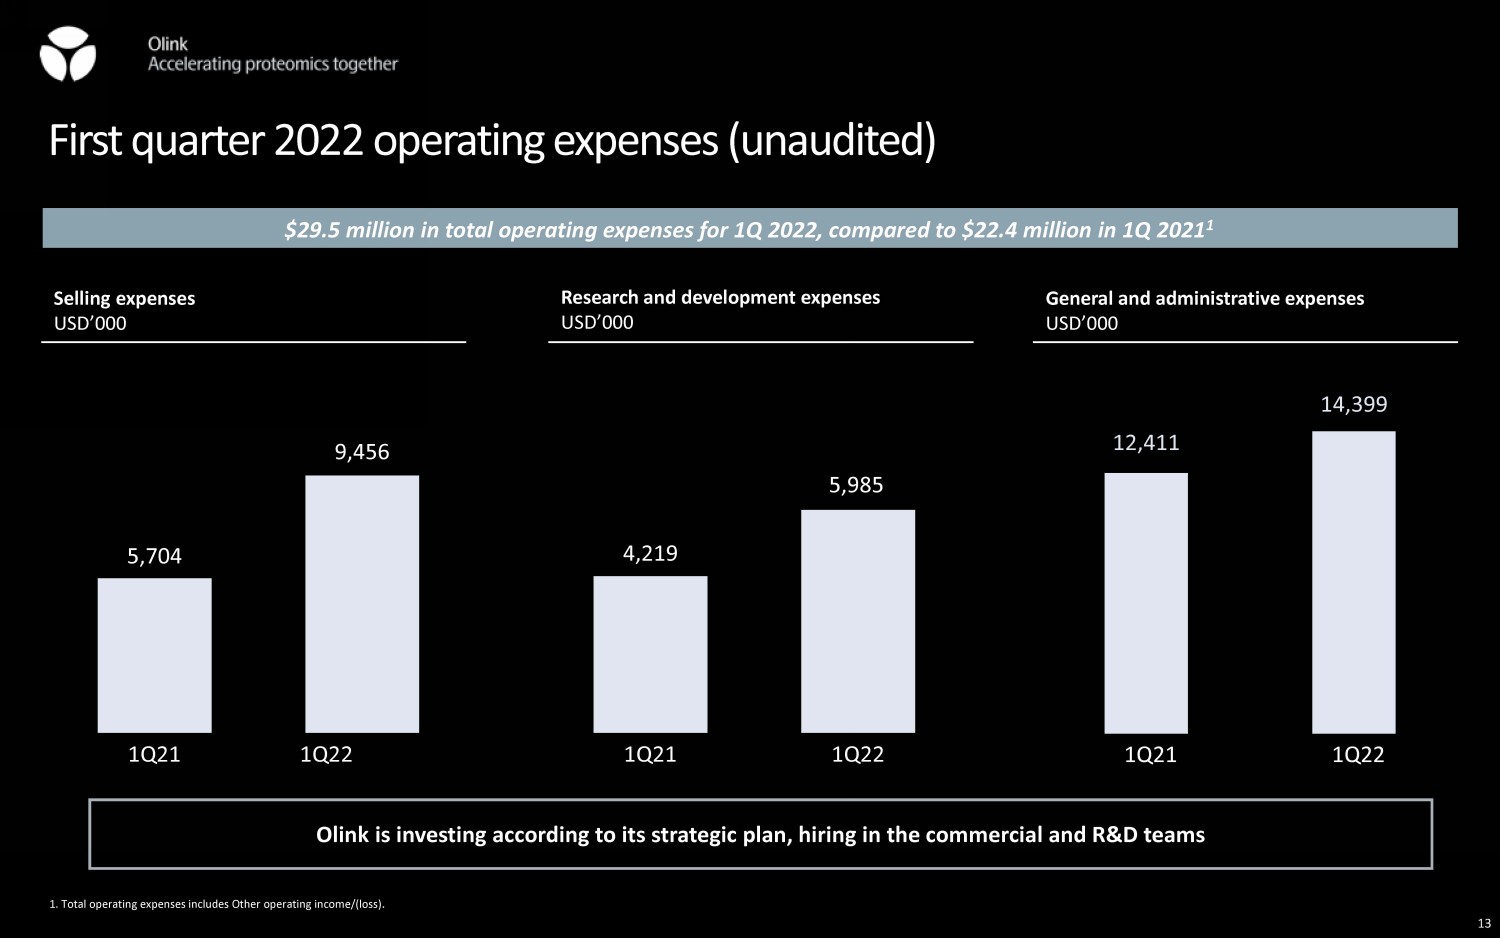
First quarter 2022 operating expenses (unaudited) $29.5 million in total operating expenses for 1Q 2022, compared to $22.4 million in 1Q 2021 1 Olink is investing according to its strategic plan, hiring in the commercial and R&D teams Selling expenses USD’000 5,704 9,456 1Q21 1Q22 Research and development expenses USD’000 4,219 5,985 1Q21 1Q22 General and administrative expenses USD’000 12,411 14,399 Q4’21 Q4’20 1Q21 1Q22 1. Total operating expenses includes Other operating income/(loss) . 13
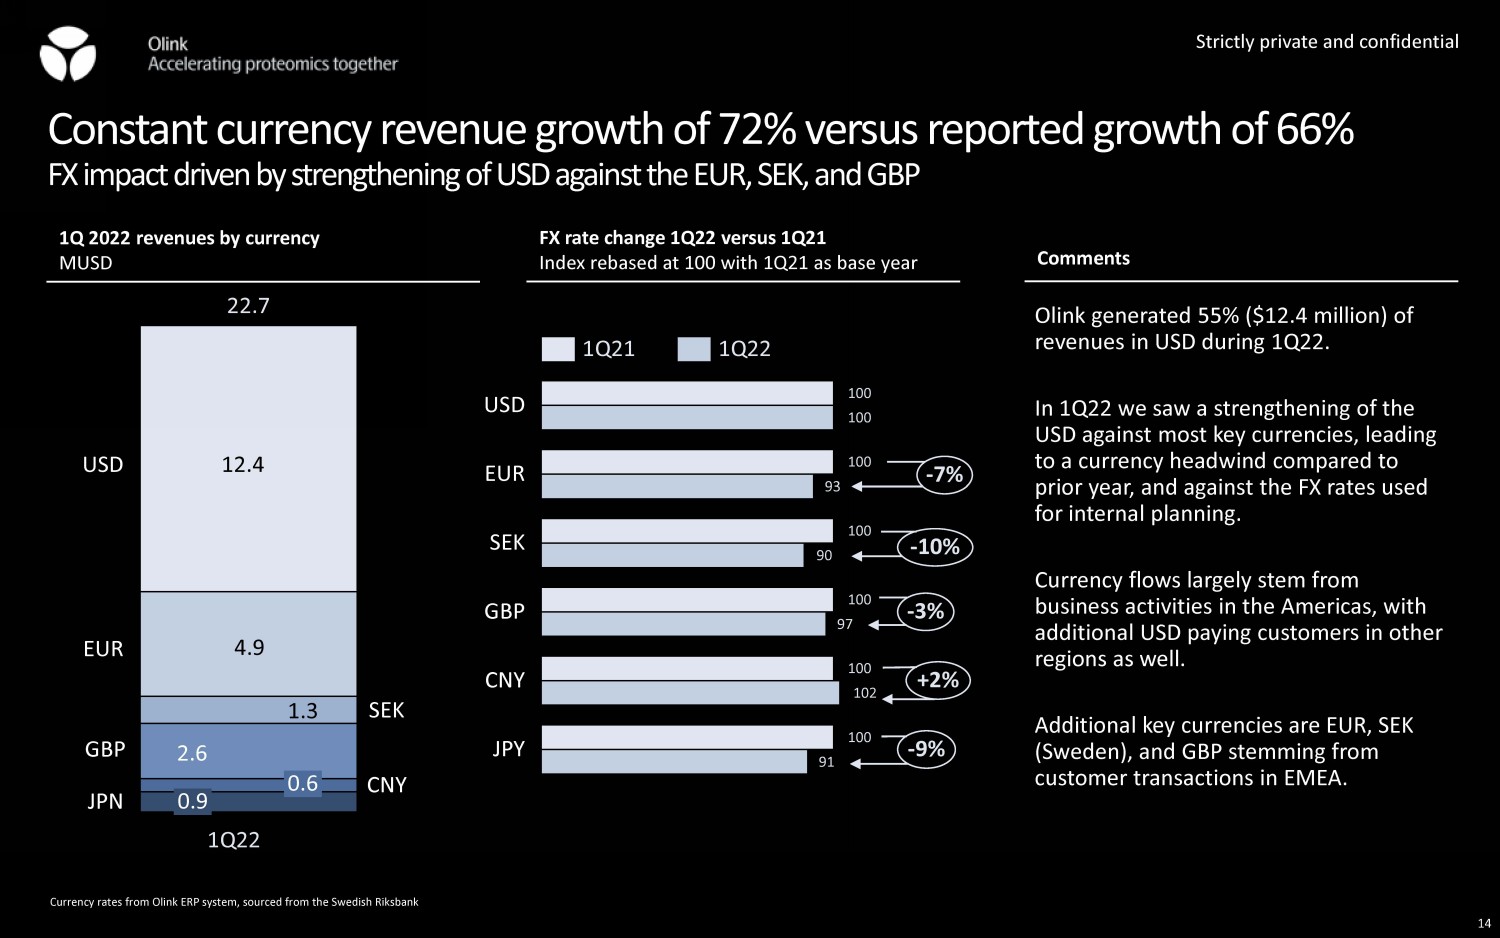
Strictly private and confidential Constant currency revenue growth of 72% versus reported growth of 66% FX impact driven by strengthening of USD against the EUR, SEK, and GBP Currency rates from Olink ERP system, sourced from the Swedish Riksbank FX rate change 1Q22 versus 1Q21 Index rebased at 100 with 1Q21 as base year SEK 0.6 GBP 0.9 1Q22 USD EUR 2.6 1.3 CNY JPN 22.7 12.4 4.9 Comments Olink generated 55% ($12.4 million) of revenues in USD during 1Q22. In 1Q22 we saw a strengthening of the USD against most key currencies, leading to a currency headwind compared to prior year, and against the FX rates used for internal planning. Currency flows largely stem from business activities in the Americas, with additional USD paying customers in other regions as well. Additional key currencies are EUR, SEK (Sweden), and GBP stemming from customer transactions in EMEA. 100 100 100 100 100 100 100 93 90 97 102 91 USD EUR SEK GBP CNY JPY - 7% - 10% - 3% +2% - 9% 1Q21 1Q22 1Q 2022 revenues by currency MUSD 14
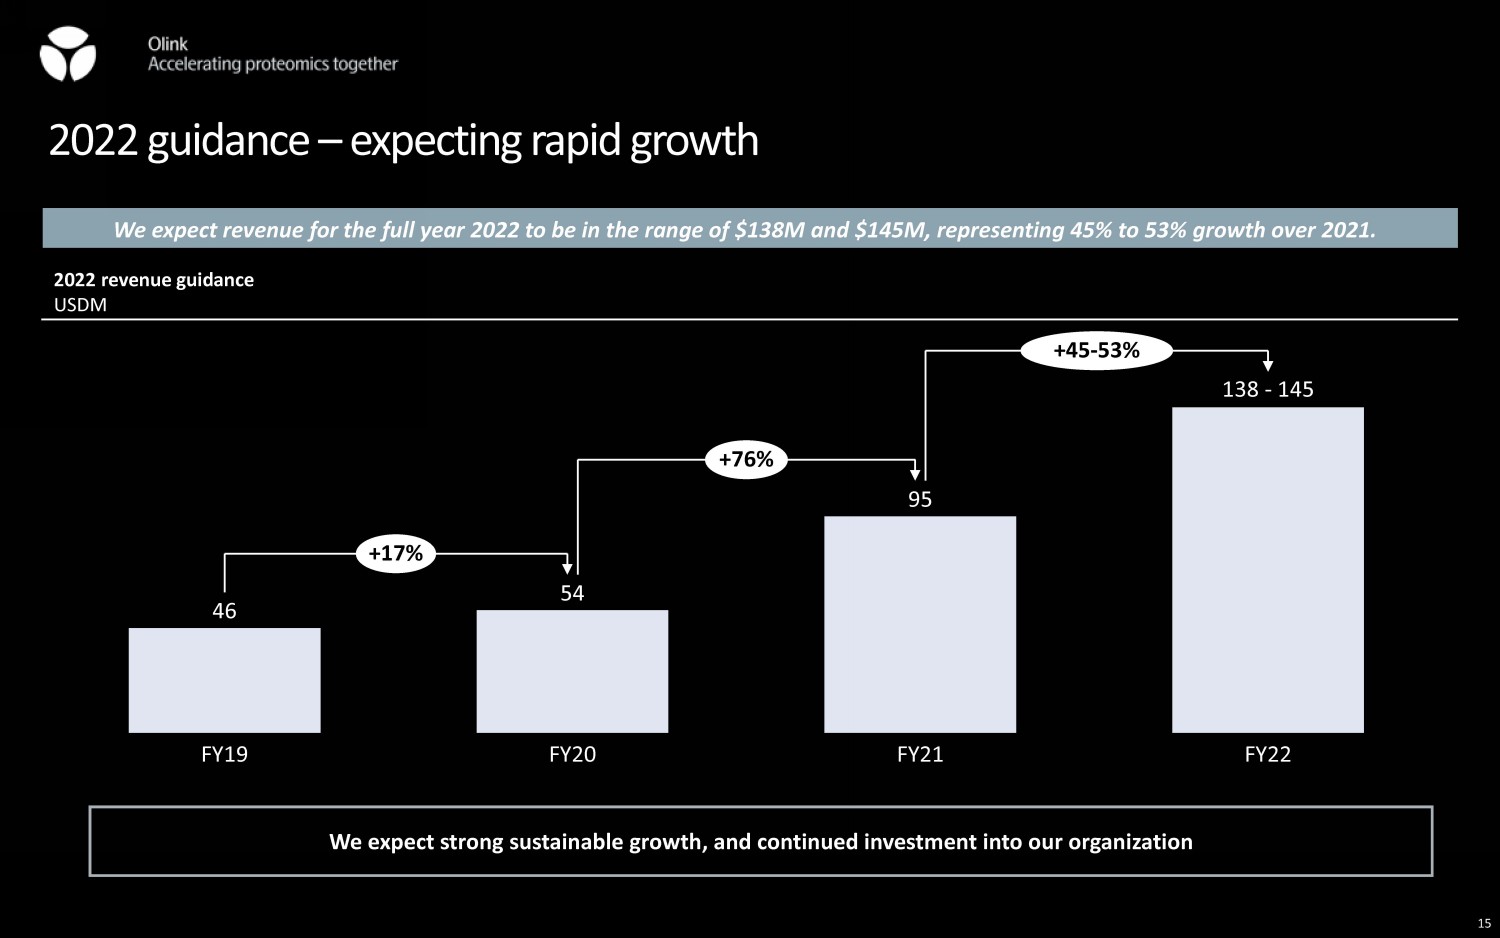
2022 guidance – expecting rapid growth We expect revenue for the full year 2022 to be in the range of $138M and $145M, representing 45% to 53% growth over 2021. We expect strong sustainable growth, and continued investment into our organization 2022 revenue guidance USDM 46 54 95 138 - 145 FY19 FY20 FY21 FY22 +17% +76% +45 - 53% 15

APPENDIX 16
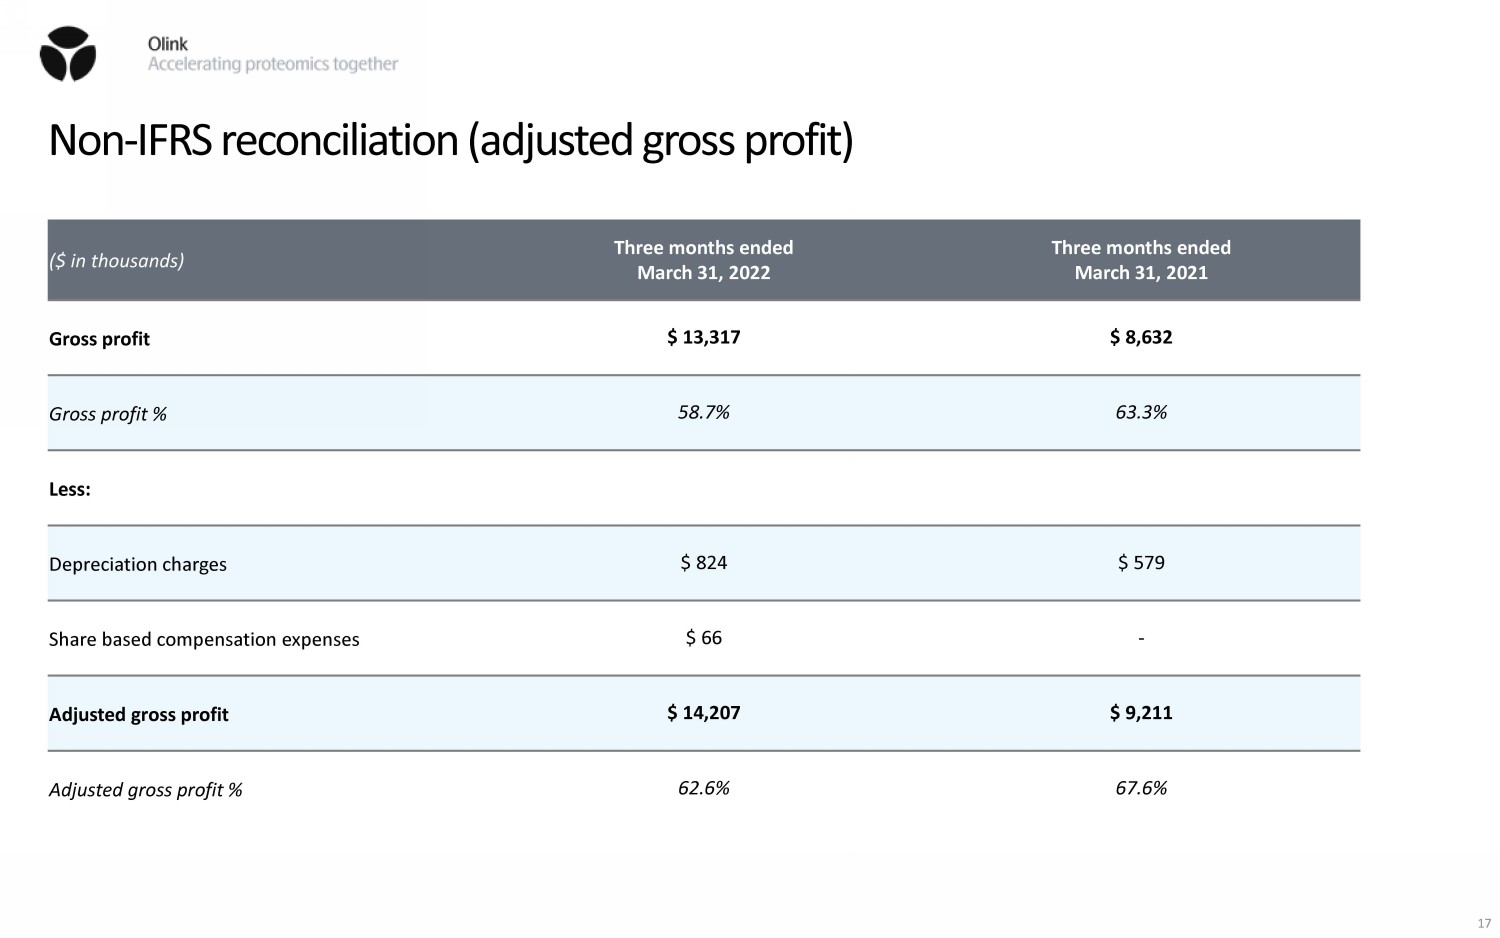
Non - IFRS reconciliation (adjusted gross profit) ($ in thousands) Three months ended March 31, 2022 Three months ended March 31, 2021 Gross profit $ 13,317 $ 8,632 Gross profit % 58.7% 63.3% Less: Depreciation charges $ 824 $ 579 Share based compensation expenses $ 66 - Adjusted gross profit $ 14,207 $ 9,211 Adjusted gross profit % 62.6% 67.6% 17
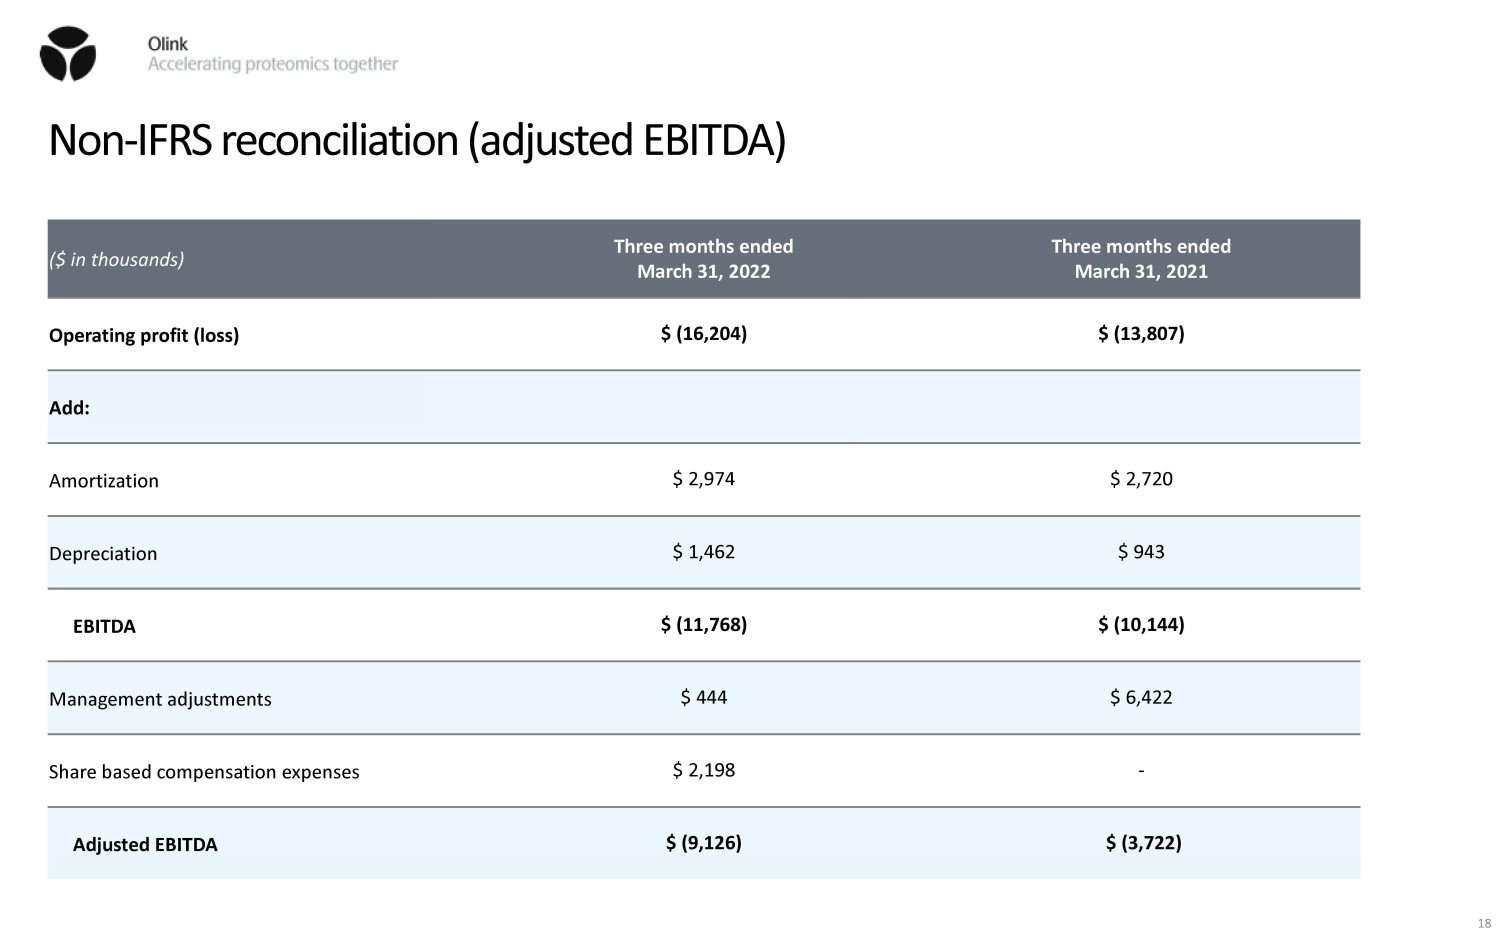
Non - IFRS reconciliation (adjusted EBITDA) ($ in thousands) Three months ended March 31, 2022 Three months ended March 31, 2021 Operating profit (loss) $ (16,204) $ (13,807) Add: Amortization $ 2,974 $ 2,720 Depreciation $ 1,462 $ 943 EBITDA $ (11,768) $ (10,144) Management adjustments $ 444 $ 6,422 Share based compensation expenses $ 2,198 - Adjusted EBITDA $ (9,126) $ (3,722) 18
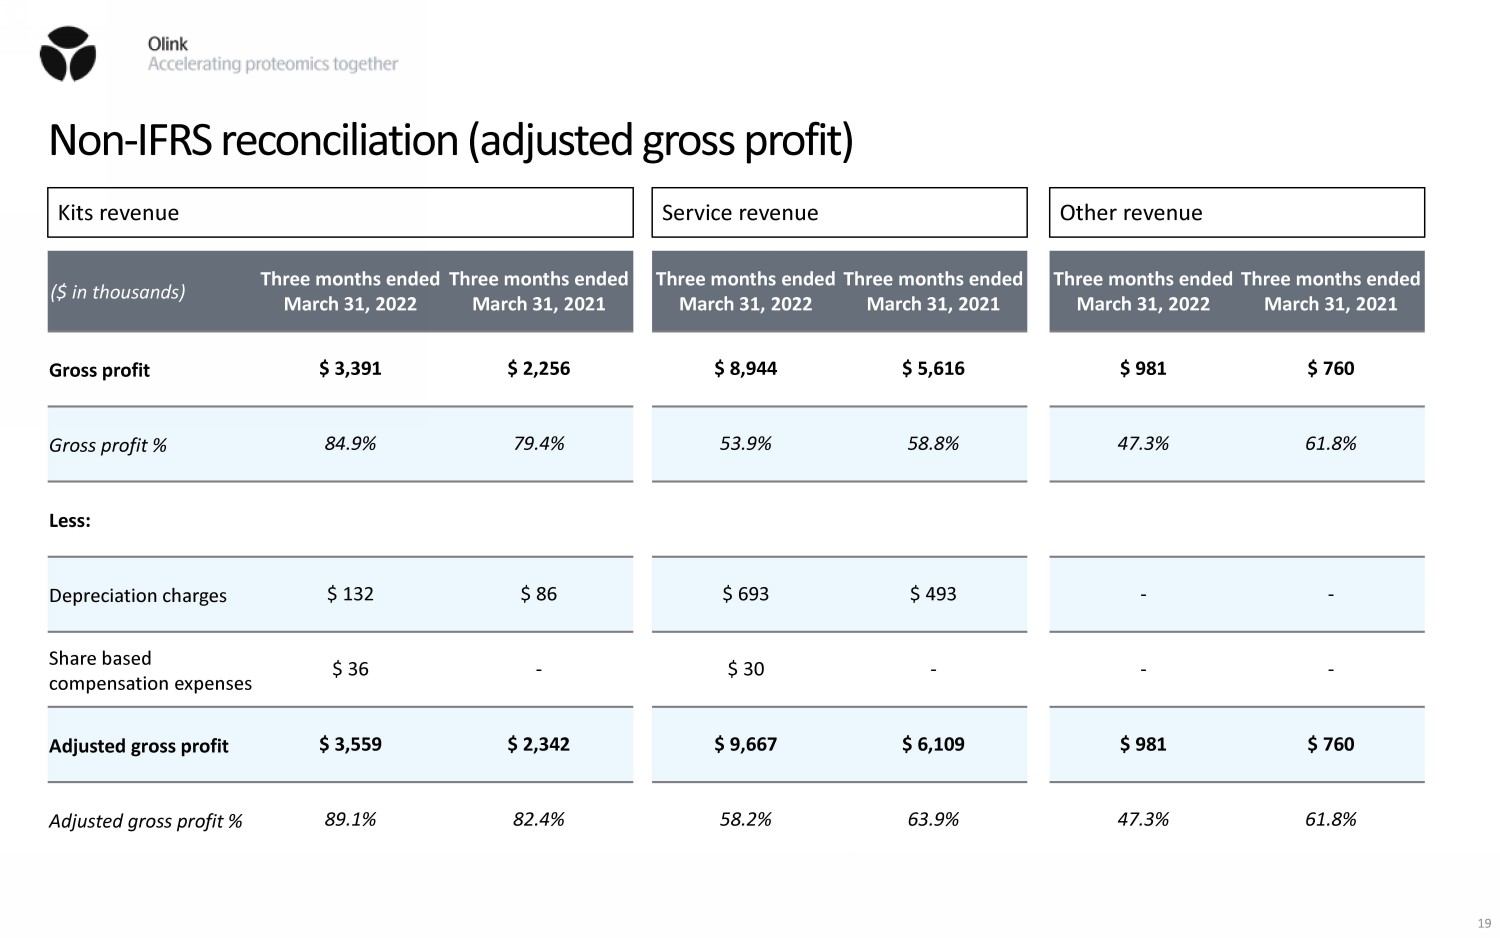
Non - IFRS reconciliation (adjusted gross profit) ($ in thousands) Three months ended March 31, 2022 Three months ended March 31, 2021 Gross profit $ 3,391 $ 2,256 Gross profit % 84.9% 79.4% Less: Depreciation charges $ 132 $ 86 Share based compensation expenses $ 36 - Adjusted gross profit $ 3,559 $ 2,342 Adjusted gross profit % 89.1% 82.4% Three months ended March 31, 2022 Three months ended March 31, 2021 $ 8,944 $ 5,616 53.9% 58.8% $ 693 $ 493 $ 30 - $ 9,667 $ 6,109 58.2% 63.9% Three months ended March 31, 2022 Three months ended March 31, 2021 $ 981 $ 760 47.3% 61.8% - - - - $ 981 $ 760 47.3% 61.8% Kits revenue Service revenue Other revenue 19