Exhibit 99.3

August 11, 2022 Olink Proteomics Vision Enable understanding of real - time human biology Mission Accelerate proteomics together
Disclaimer This presentation may contain certain forward - looking statements and opinions . Forward - looking statements are statements that do not relate to historical facts and events and such statements and opinions pertaining to the future that, for example, contain wording such as “may,” “might,” “will,” “could,” “would,” “should,” “expect,” “intend,” “plan,” “objective,” “anticipate,” “believe,” “estimate,” “predict,” “potential,” “continue,” “ongoing,” or the negative of these terms, or other comparable terminology intended to identify statements about the future . Forward - looking statements contained in this presentation include, but are not limited to, statements about : our addressable market, market growth, future revenue, key performance indicators, expenses, capital requirements and our needs for additional financing, our commercial launch plans, our strategic plans for our business and products, market acceptance of our products, our competitive position and developments and projections relating to our competitors, domestic and foreign regulatory approvals, third - party manufacturers and suppliers, our intellectual property, the potential effects of government regulation and local, regional and national and international economic conditions and events affecting our business . We cannot assure that the forward - looking statements in this presentation will prove to be accurate . Furthermore, if our forward - looking statements prove to be inaccurate, the inaccuracy may be material . These statements involve known and unknown risks, uncertainties and other important factors that may cause our actual results, levels of activity, performance or achievements to be materially different from the information expressed or implied by these forward - looking statements . The forward - looking statements and opinions contained in this presentation are based on our management’s beliefs and assumptions and are based upon information currently available to our management as of the date of this presentation and, while we believe such information forms a reasonable basis for such statements, such information may be limited or incomplete, and our statements should not be read to indicate that we have conducted an exhaustive inquiry into, or review of, all potentially available relevant information . In light of the significant uncertainties in these forward - looking statements, you should not regard these statements as a representation or warranty by us or any other person that we will achieve our objectives and plans in any specified time frame, or at all . Actual results, performance or events may differ materially from those in such statements due to, without limitation, risks generally associated with product development, including delays or challenges that may arise in the development, launch or scaling of our new products, programs or services, challenges in the commercialization of our products and services, the risk that we may not maintain our existing relationships with suppliers or enter into new ones, or that we will not realize the intended benefits from such relationships, any inability to protect our intellectual property effectively, changes in general economic conditions, in particular economic conditions in the markets on which we operate, changes affecting interest rate levels, changes affecting currency exchange rates, changes in competition levels, and changes in laws and regulations, and other risks described under the caption "Risk Factors" in our Form 20 - F (Commission file number 001 - 40277 ) and elsewhere in the documents we file with the Securities and Exchange Commission from time to time . The information, opinions ad forward - looking statements contained in this announcement speak only as of its date, and are subject to change without notice and we undertake no obligation to update any such forward - looking statements for any reason, except as required by law . This presentation contains estimates, projections and other information concerning our industry, our business, and the markets for our products and services . Information that is based on estimates, forecasts, projections, market research or similar methodologies is inherently subject to uncertainties, and actual events or circumstances may differ materially from events and circumstances that are assumed in this information . Unless otherwise expressly stated, we obtained this industry, business, market and other data from our own internal estimates and research as well as from reports, research surveys, studies and similar data prepared by market research firms and other third parties, industry, medical and general publications, government data and similar sources . While we believe our internal company research as to such matters is reliable and the market definitions are appropriate, neither such research nor these definitions have been verified by any independent source . 2
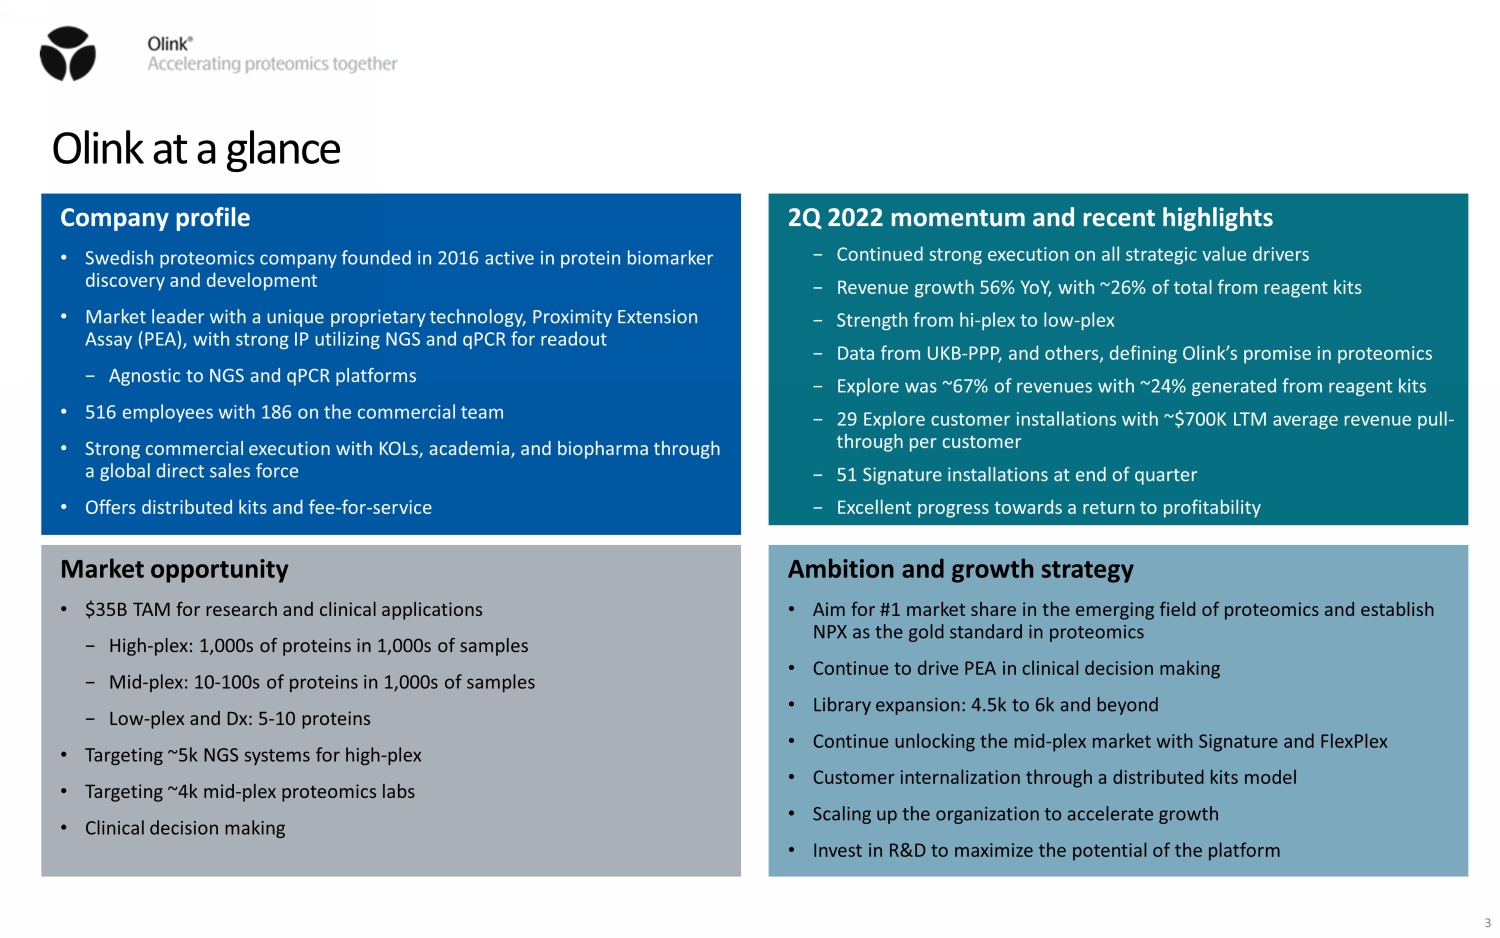
Olink at a glance Company profile • Swedish proteomics company founded in 2016 active in protein biomarker discovery and development • Market leader with a unique proprietary technology, Proximity Extension Assay (PEA), with strong IP utilizing NGS and qPCR for readout − Agnostic to NGS and qPCR platforms • 516 employees with 186 on the commercial team • Strong commercial execution with KOLs, academia, and biopharma through a global direct sales force • Offers distributed kits and fee - for - service 2Q 2022 momentum and recent highlights − Continued strong execution on all strategic value drivers − Revenue growth 56% YoY, with ~26% of total from reagent kits − Strength from hi - plex to low - plex − Data from UKB - PPP, and others, defining Olink’s promise in proteomics − Explore was ~67% of revenues with ~24% generated from reagent kits − 29 Explore customer installations with ~$700K LTM average revenue pull - through per customer − 51 Signature installations at end of quarter − Excellent progress towards a return to profitability Market opportunity • $35B TAM for research and clinical applications − High - plex: 1,000s of proteins in 1,000s of samples − Mid - plex: 10 - 100s of proteins in 1,000s of samples − Low - plex and Dx: 5 - 10 proteins • Targeting ~5k NGS systems for high - plex • Targeting ~4k mid - plex proteomics labs • Clinical decision making Ambition and growth strategy • Aim for #1 market share in the emerging field of proteomics and establish NPX as the gold standard in proteomics • Continue to drive PEA in clinical decision making • Library expansion: 4.5k to 6k and beyond • Continue unlocking the mid - plex market with Signature and FlexPlex • Customer internalization through a distributed kits model • Scaling up the organization to accelerate growth • Invest in R&D to maximize the potential of the platform 3
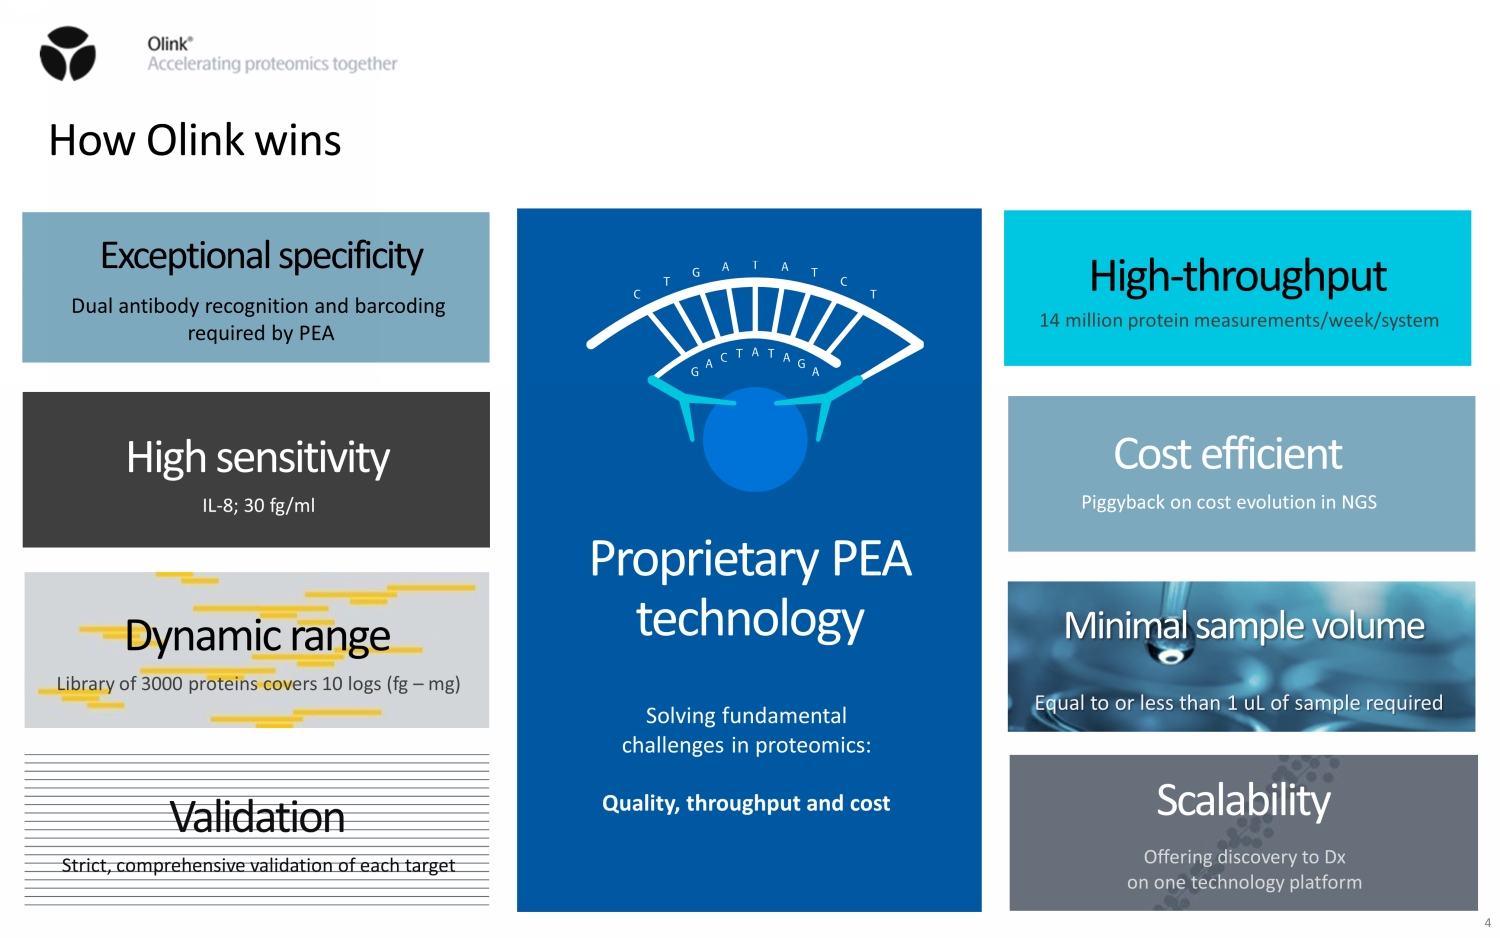
4 How Olink wins 4 Dynamic range Library of 3000 proteins covers 10 logs (fg – mg) Validation Strict, comprehensive validation of each target High - throughput 14 million protein measurements/week/system Cost efficient Piggyback on cost evolution in NGS Scalability Offering discovery to Dx on one technology platform High sensitivity IL - 8; 30 fg/ml Proprietary PEA technology Solving fundamental challenges in proteomics: Quality, throughput and cost Dual antibody recognition and barcoding required by PEA Exceptional specificity Minimal sample volume Equal to or less than 1 uL of sample required 4
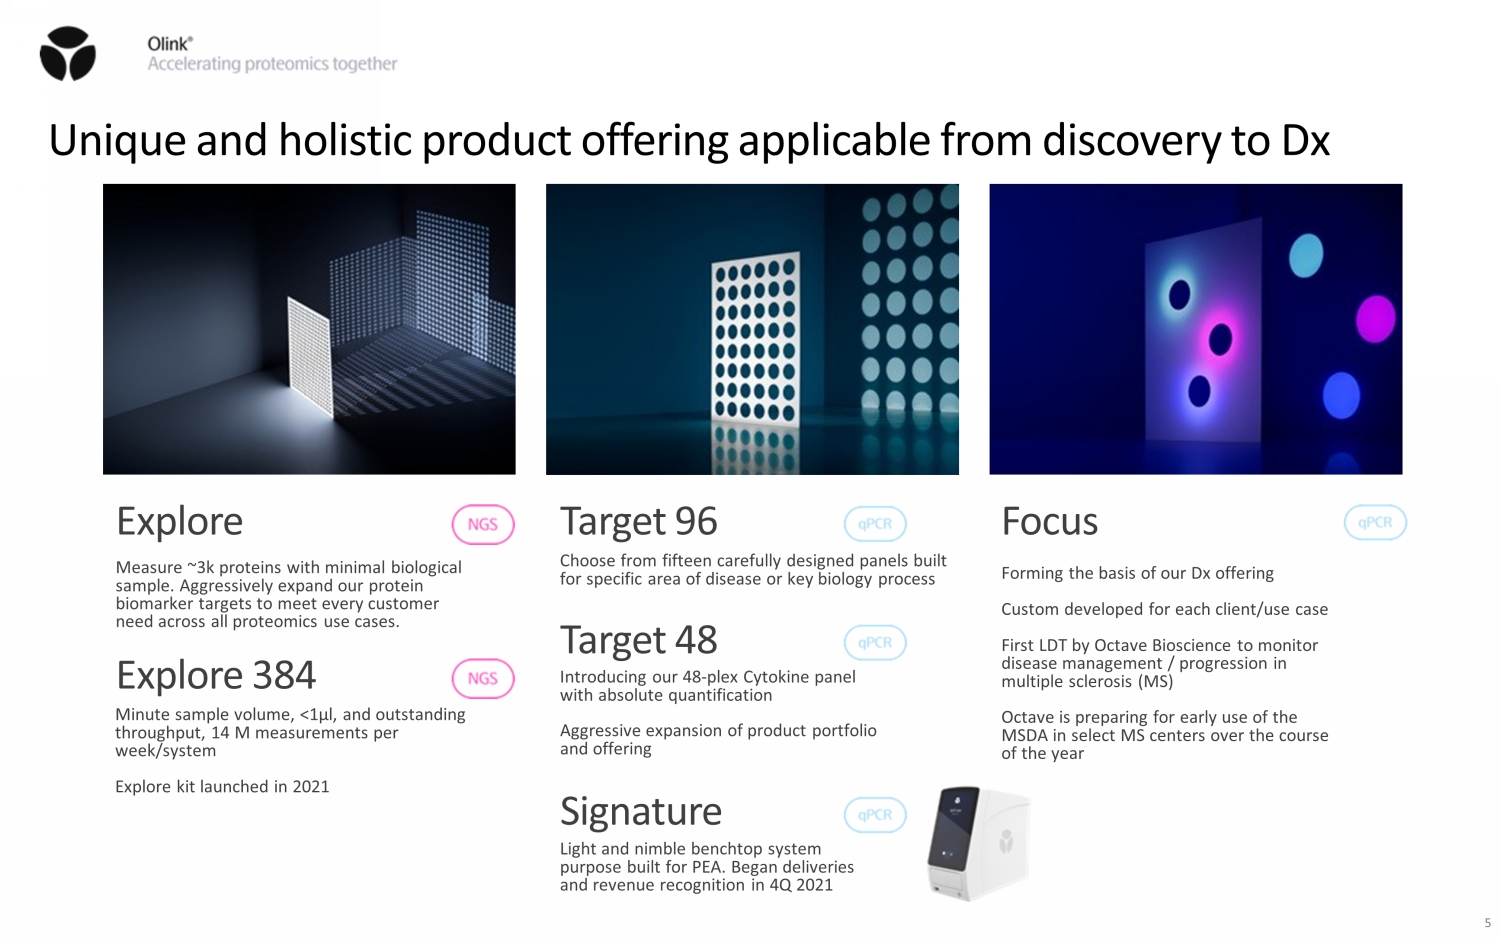
Focus Forming the basis of our Dx offering Custom developed for each client/use case First LDT by Octave Bioscience to monitor disease management / progression in multiple sclerosis (MS) Octave is preparing for early use of the MSDA in select MS centers over the course of the year Explore Measure ~3k proteins with minimal biological sample. Aggressively expand our protein biomarker targets to meet every customer need across all proteomics use cases. Explore 384 Minute sample volume, <1µl, and outstanding throughput, 14 M measurements per week/system Explore kit launched in 2021 Target 96 Choose from fifteen carefully designed panels built for specific area of disease or key biology process Target 48 Introducing our 48 - plex Cytokine panel with absolute quantification Signature Light and nimble benchtop system purpose built for PEA. Began deliveries and revenue recognition in 4Q 2021 Aggressive expansion of product portfolio and offering Unique and holistic product offering applicable from discovery to Dx 5
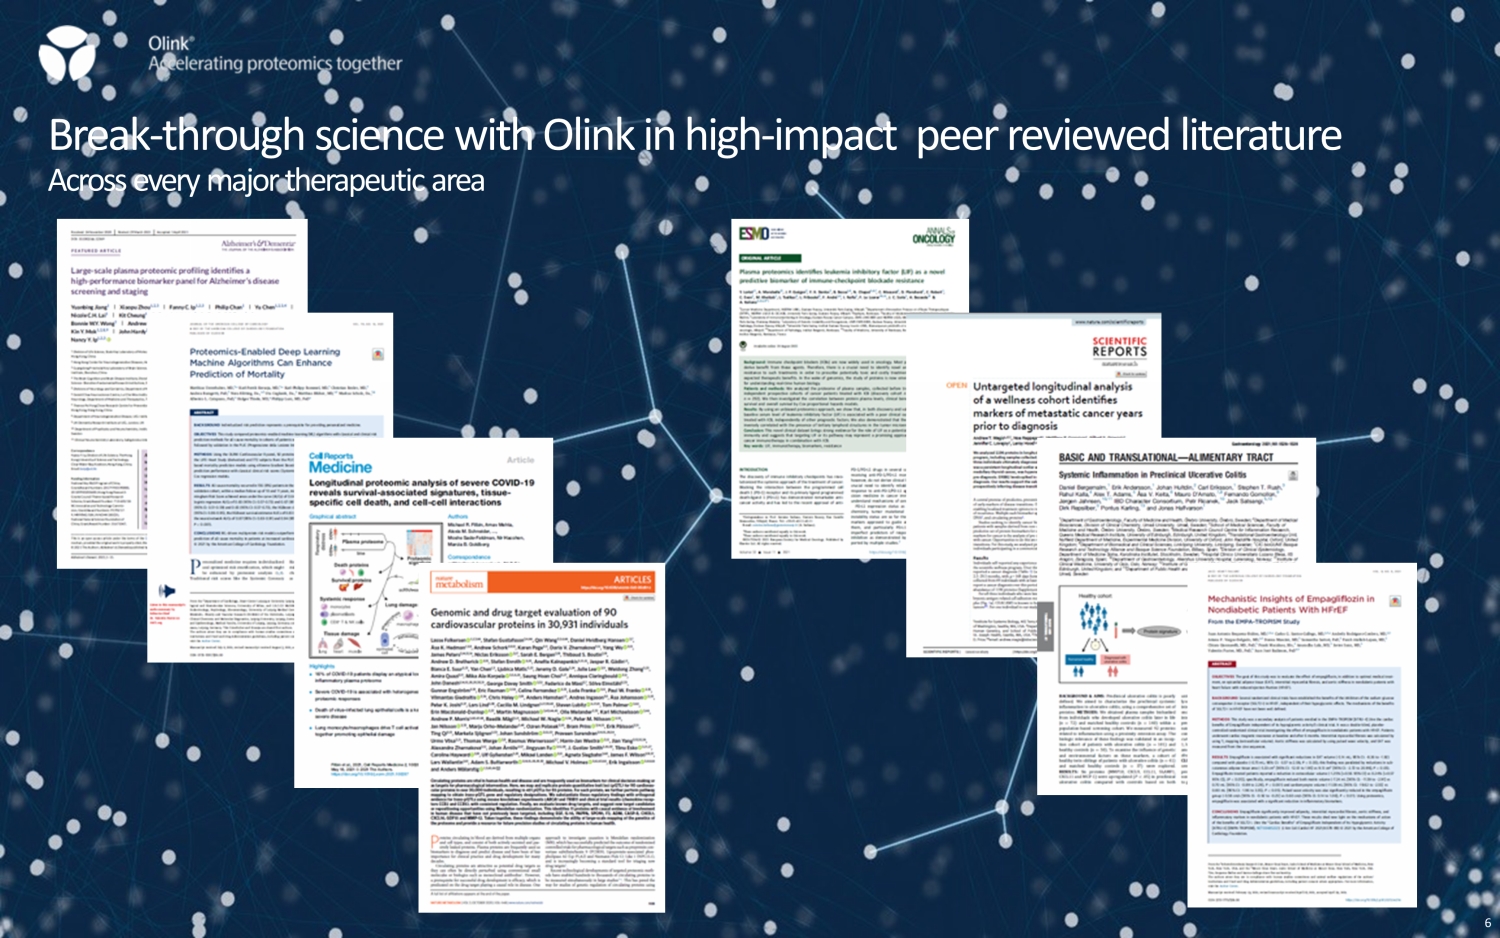
Break - through science with Olink in high - impact peer reviewed literature Across every major therapeutic area 6
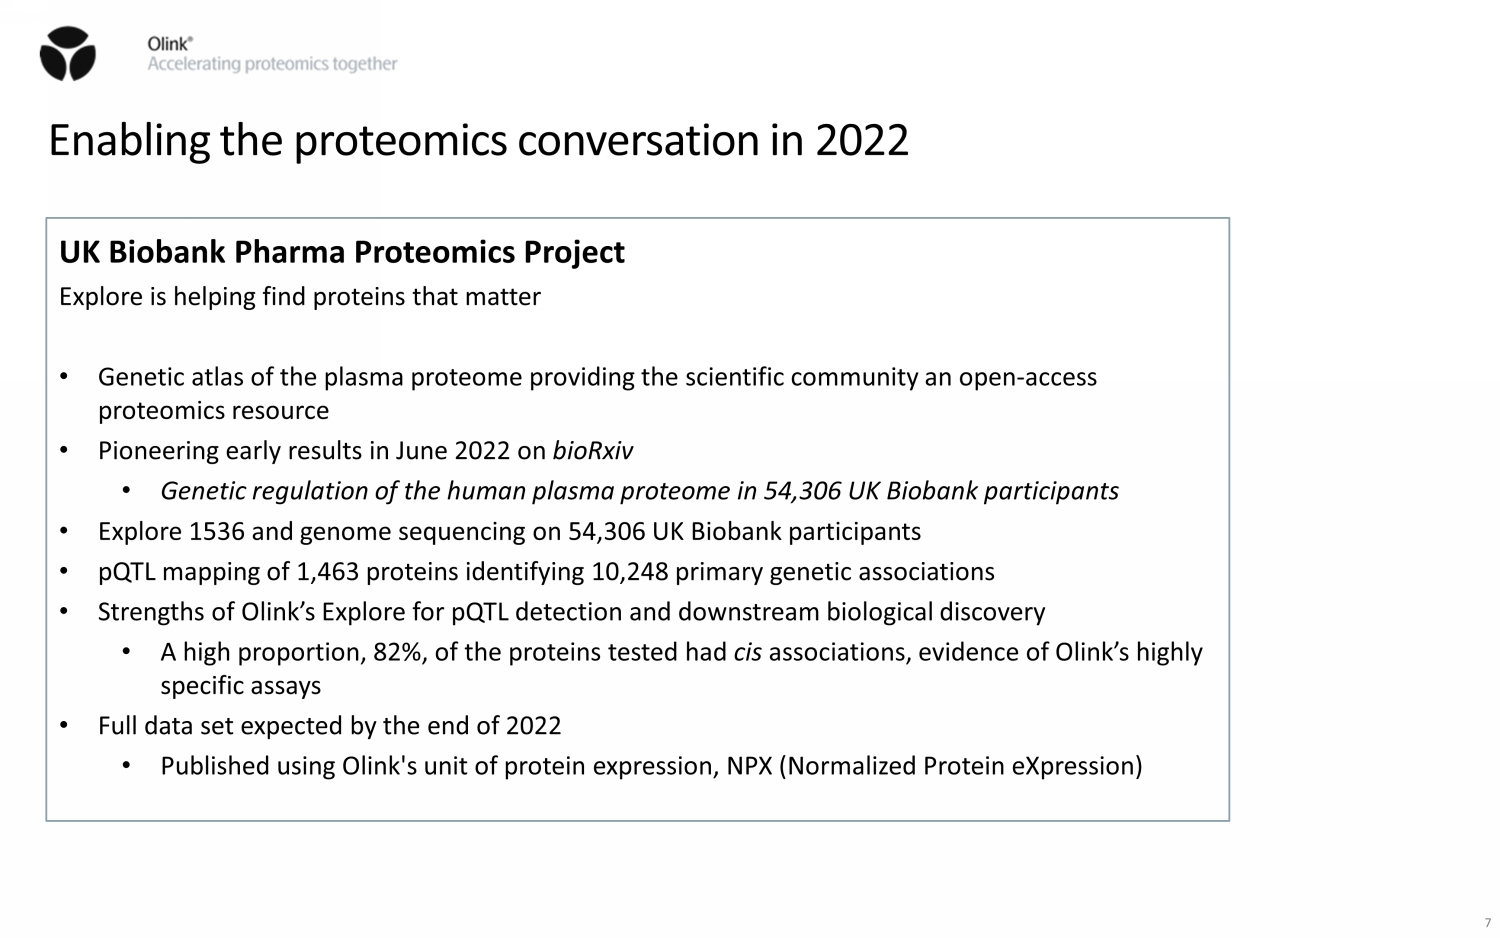
Enabling the proteomics conversation in 2022 7 UK Biobank Pharma Proteomics Project Explore is helping find proteins that matter • Genetic atlas of the plasma proteome providing the scientific community an open - access proteomics resource • Pioneering early results in June 2022 on bioRxiv • Genetic regulation of the human plasma proteome in 54,306 UK Biobank participants • Explore 1536 and genome sequencing on 54,306 UK Biobank participants • pQTL mapping of 1,463 proteins identifying 10,248 primary genetic associations • Strengths of Olink’s Explore for pQTL detection and downstream biological discovery • A high proportion, 82%, of the proteins tested had cis associations, evidence of Olink’s highly specific assays • Full data set expected by the end of 2022 • Published using Olink's unit of protein expression, NPX (Normalized Protein eXpression)
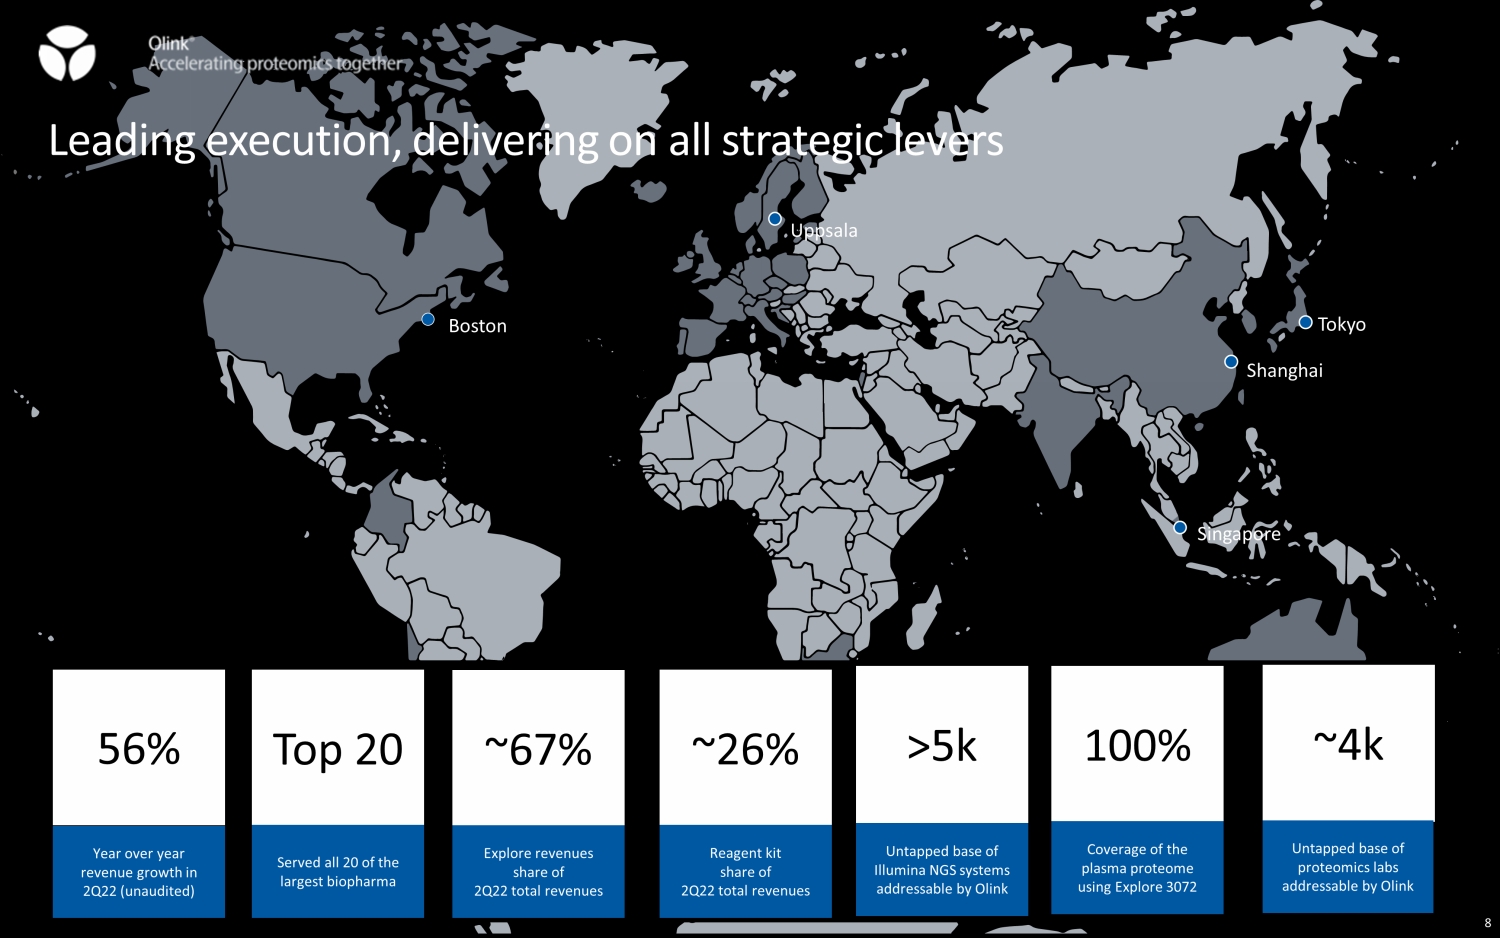
Singapore Shanghai Boston Tokyo Uppsala Leading execution, delivering on all strategic levers 56% Year over year revenue growth in 2Q22 (unaudited) ~67% Explore revenues share of 2Q22 total revenues Top 20 Served all 20 of the largest biopharma 100% Coverage of the plasma proteome using Explore 3072 ~4k Untapped base of proteomics labs addressable by Olink 8 >5k Untapped base of Illumina NGS systems addressable by Olink ~26% Reagent kit share of 2Q22 total revenues
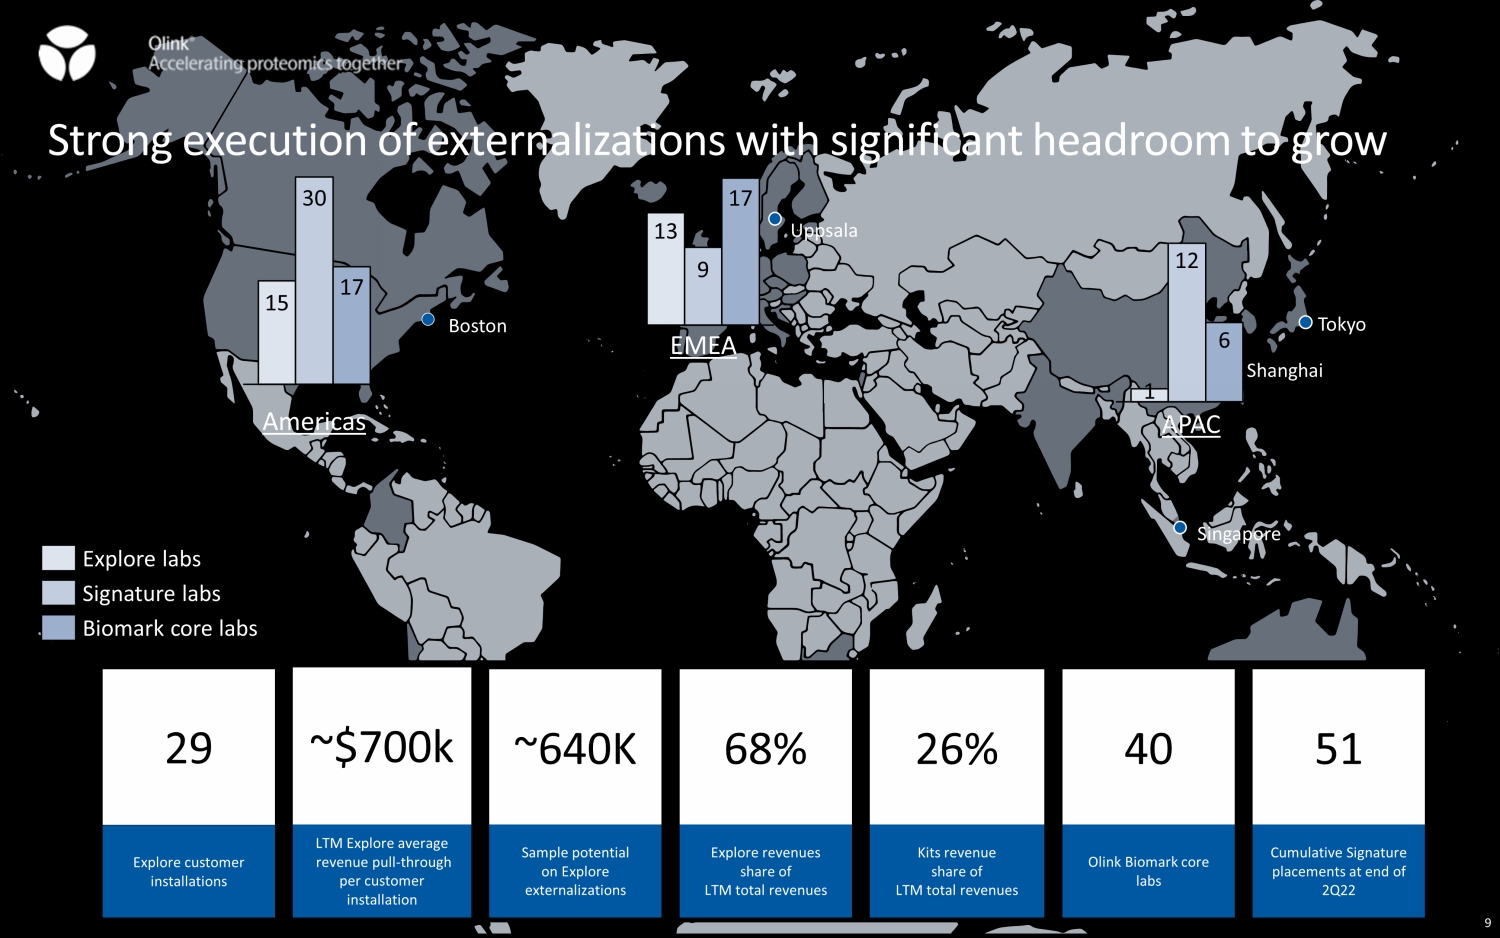
Singapore Shanghai Boston Tokyo Uppsala Strong execution of externalizations with significant headroom to grow 29 Explore customer installations 1 12 6 APAC 13 9 17 EMEA 15 30 17 Americas Explore labs Biomark core labs Signature labs 51 Cumulative Signature placements at end of 2Q22 9 68% Explore revenues share of LTM total revenues ~640K Sample potential on Explore externalizations 26% Kits revenue share of LTM total revenues 40 Olink Biomark core labs ~$700k LTM Explore average revenue pull - through per customer installation
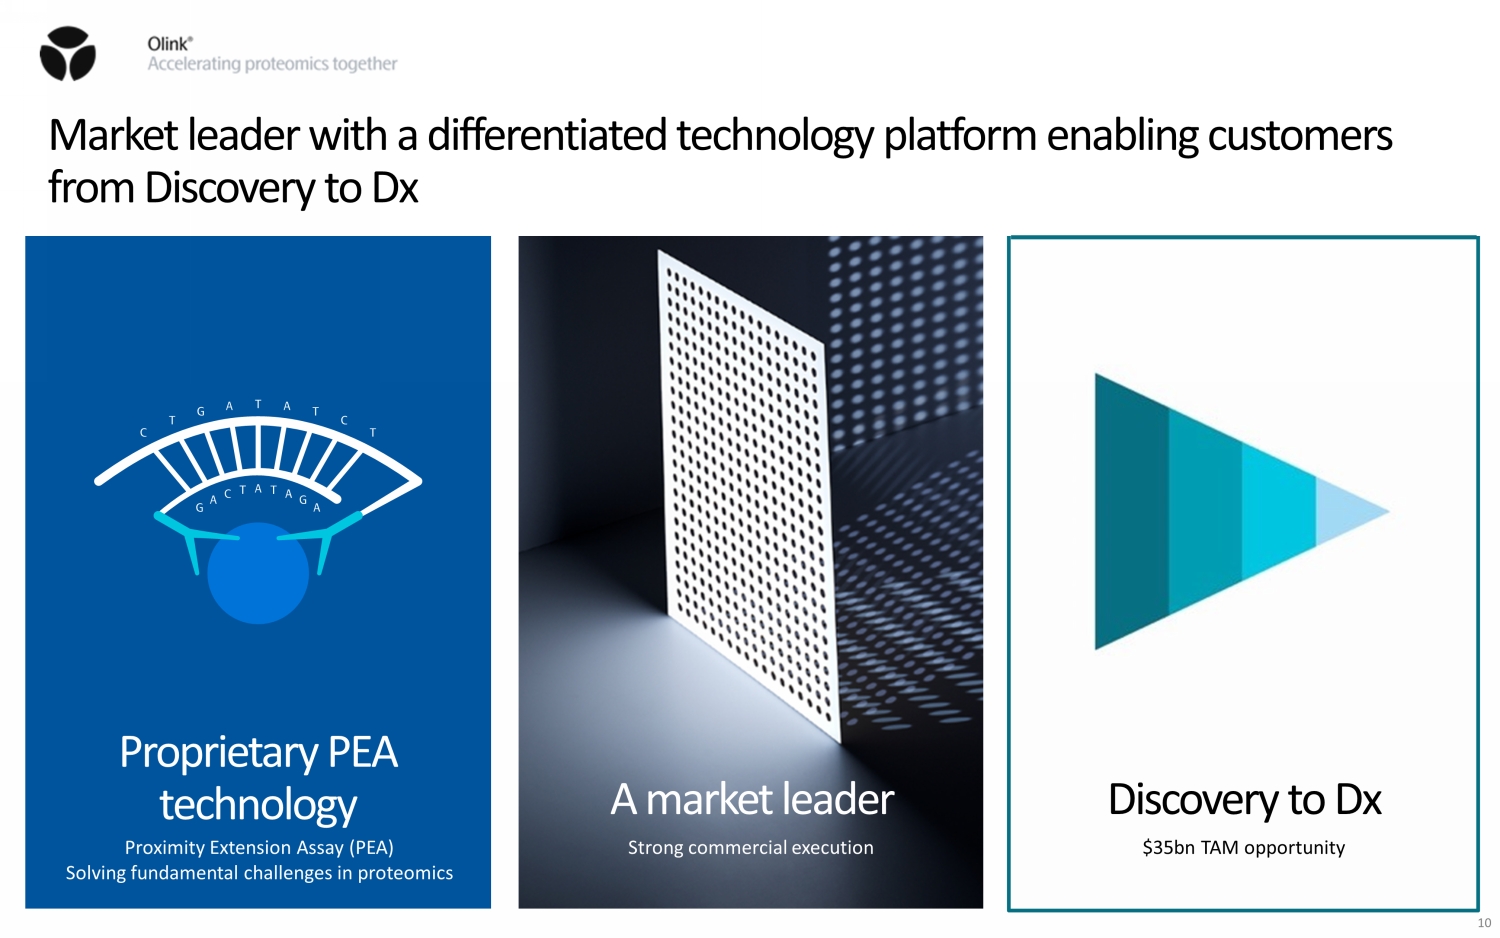
10 Proprietary PEA technology Discovery to Dx Proximity Extension Assay (PEA) Solving fundamental challenges in proteomics $35bn TAM opportunity A market leader Strong commercial execution Market leader with a differentiated technology platform enabling customers from Discovery to Dx 10
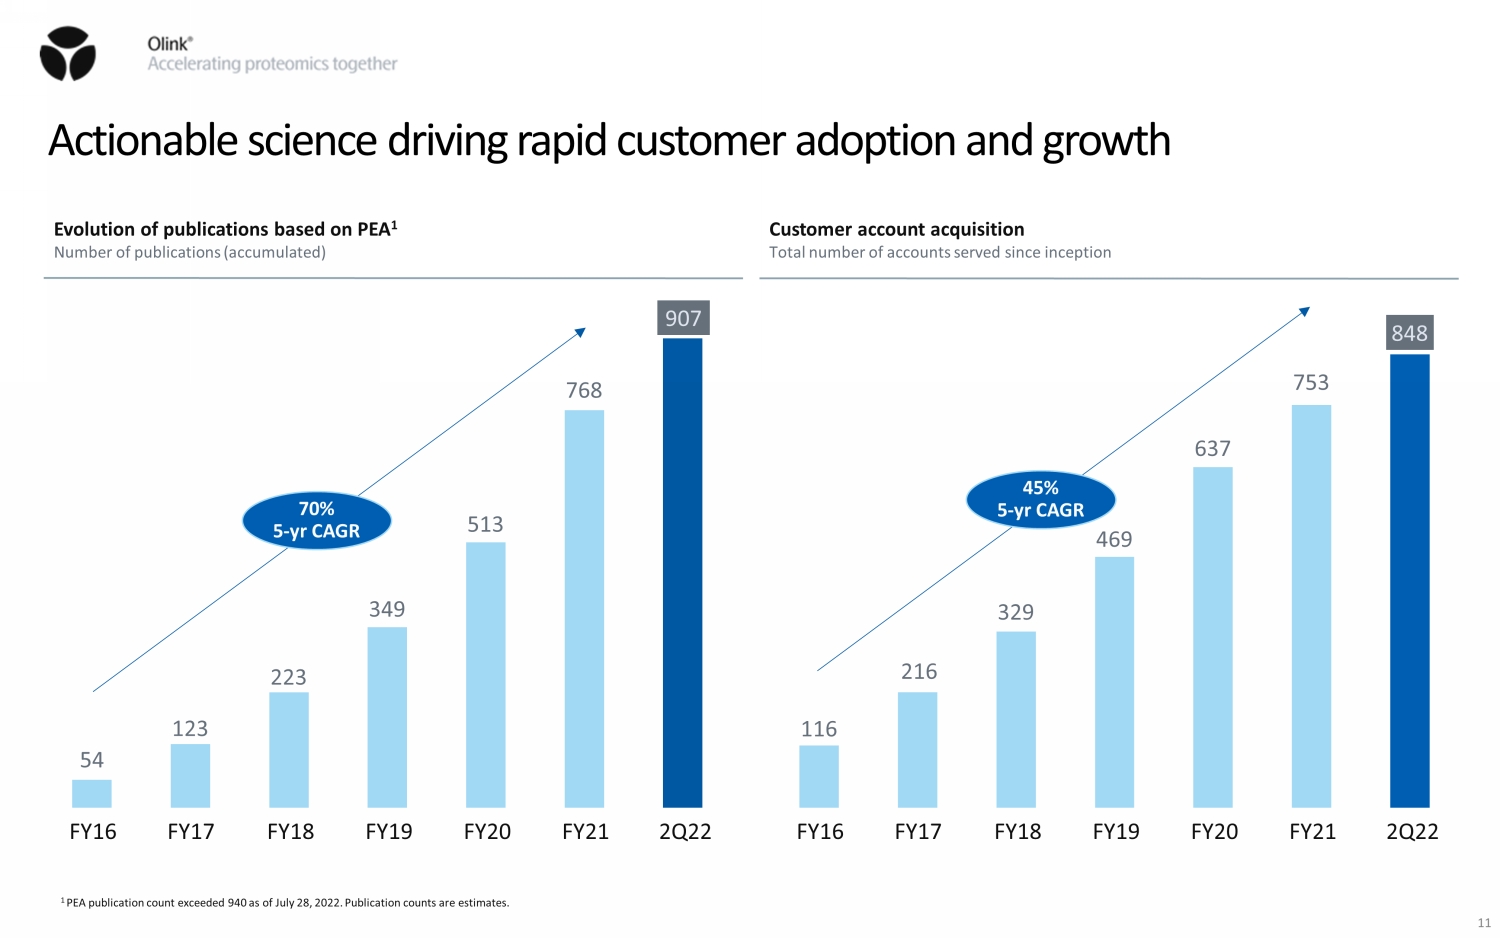
Actionable science driving rapid customer adoption and growth Evolution of publications based on PEA 1 Number of publications (accumulated) 54 123 223 349 513 768 907 FY17 FY16 FY20 FY19 FY18 FY21 Customer account acquisition Total number of accounts served since inception 2Q22 116 216 329 469 637 753 848 FY17 FY16 FY20 FY19 FY18 FY21 2Q22 70% 5 - yr CAGR 45% 5 - yr CAGR 1 PEA publication count exceeded 940 as of July 28, 2022. Publication counts are estimates. 11

Second quarter financial results (unaudited) 12 1. Adjusted EBITDA is a non - IFRS measure and defined as profit for the year before accounting for finance income, finance costs, tax, depreciation, and amortization of acquisition intangibles, further adjusted for management adjustments and share based c om pensation expenses. Refer to Appendix for non - IFRS reconciliation. 2. Adjusted Gross Profit is a non - IFRS measure and defined as revenue less cost of goods sold, which is then adjusted to remove the impact of depreciation and the impact of material transactions or events that we believe are not indicative of our core opera ti ng performance, such as share based compensation expenses. Refer to Appendix for non - IFRS reconciliation. 2Q 2021 2Q 2022 Total revenue $ 17.7 $ 27.5 Total EBITDA ($ 7.7) ($ 10.2) Total adjusted EBITDA 1 ($ 6.3) ($ 7.9) Gross profit (%) 67.1 % 62.0 % Adjusted gross profit (%) 2 70.6 % 65.1 % 65% 26% 9% Service Kit Other Segment breakdown % of total Headcount development #Headcount Financial highlights USDM 70 71 106 135 214 416 516 FY16 FY17 FY19 FY18 FY20 FY21 2Q22
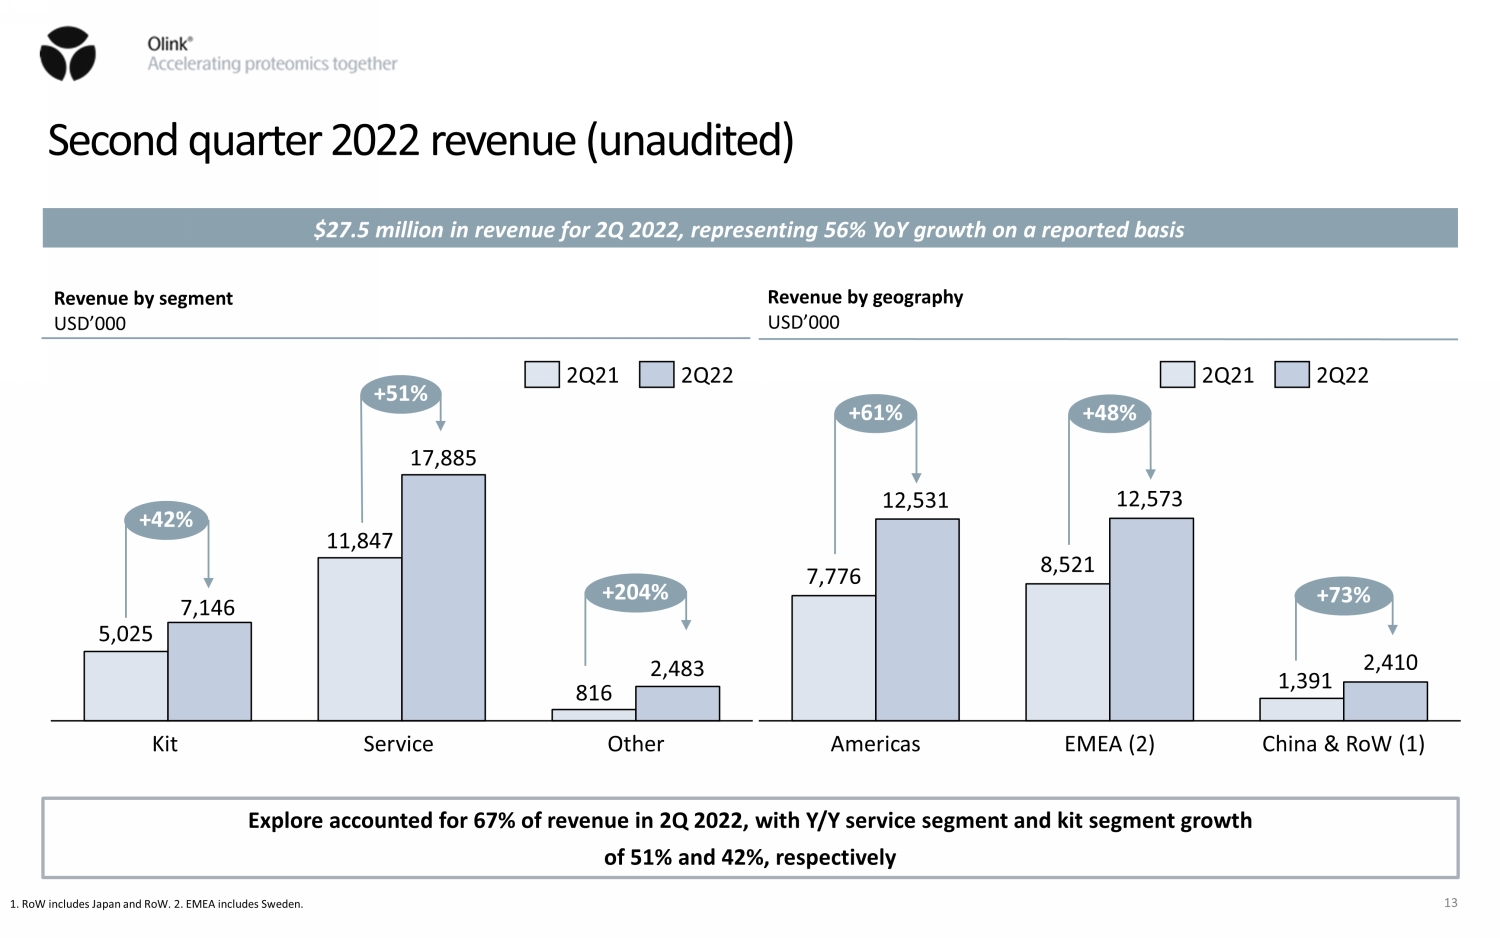
Second quarter 2022 revenue (unaudited) 13 1. RoW includes Japan and RoW. 2. EMEA includes Sweden. $27.5 million in revenue for 2Q 2022, representing 56% YoY growth on a reported basis Revenue by segment USD’000 Revenue by geography USD’000 5,025 11,847 816 7,146 17,885 2,483 Other Kit Service +42% +204% 2Q21 2Q22 7,776 8,521 1,391 12,531 12,573 2,410 China & RoW (1) Americas EMEA (2) +61% +48% +73% 2Q21 2Q22 Explore accounted for 67% of revenue in 2Q 2022, with Y/Y service segment and kit segment growth of 51% and 42%, respectively +51%
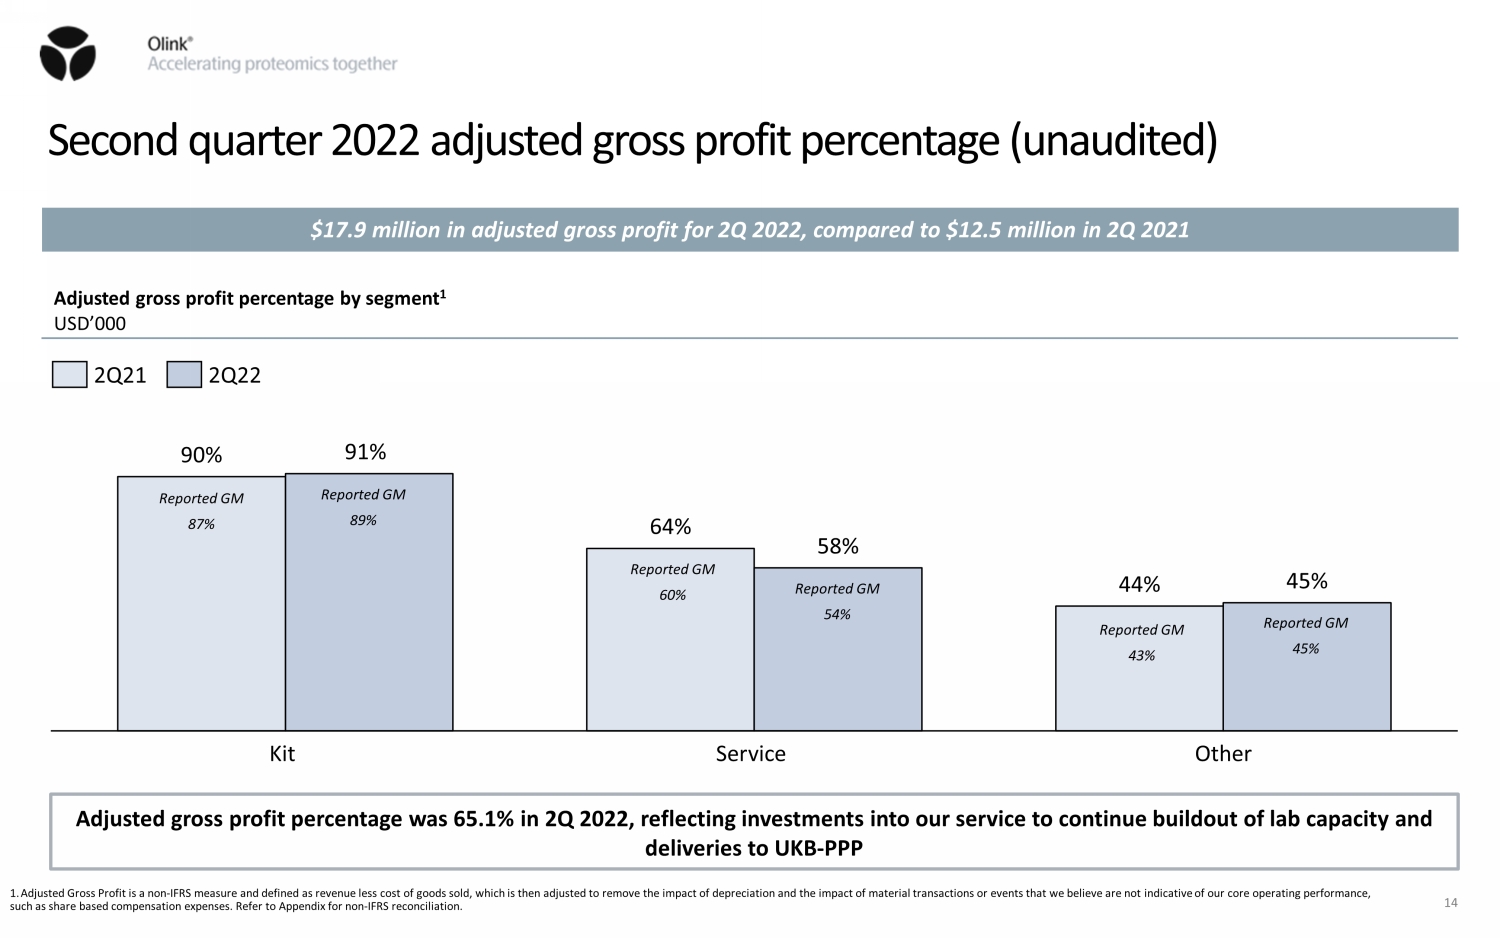
Second quarter 2022 adjusted gross profit percentage (unaudited) 14 1. Adjusted Gross Profit is a non - IFRS measure and defined as revenue less cost of goods sold, which is then adjusted to remove the impact of depreciation and the impact of material transactions or events that we believe are not indicative of our core opera ti ng performance, such as share based compensation expenses. Refer to Appendix for non - IFRS reconciliation. $17.9 million in adjusted gross profit for 2Q 2022, compared to $12.5 million in 2Q 2021 Adjusted gross profit percentage was 65.1% in 2Q 2022, reflecting investments into our service to continue buildout of lab ca pac ity and deliveries to UKB - PPP Adjusted gross profit percentage by segment 1 USD’000 90% 64% 44% 91% 58% 45% Kit Other Service 2Q21 2Q22 Reported GM 87% Reported GM 89% Reported GM 60% Reported GM 54% Reported GM 43% Reported GM 45%
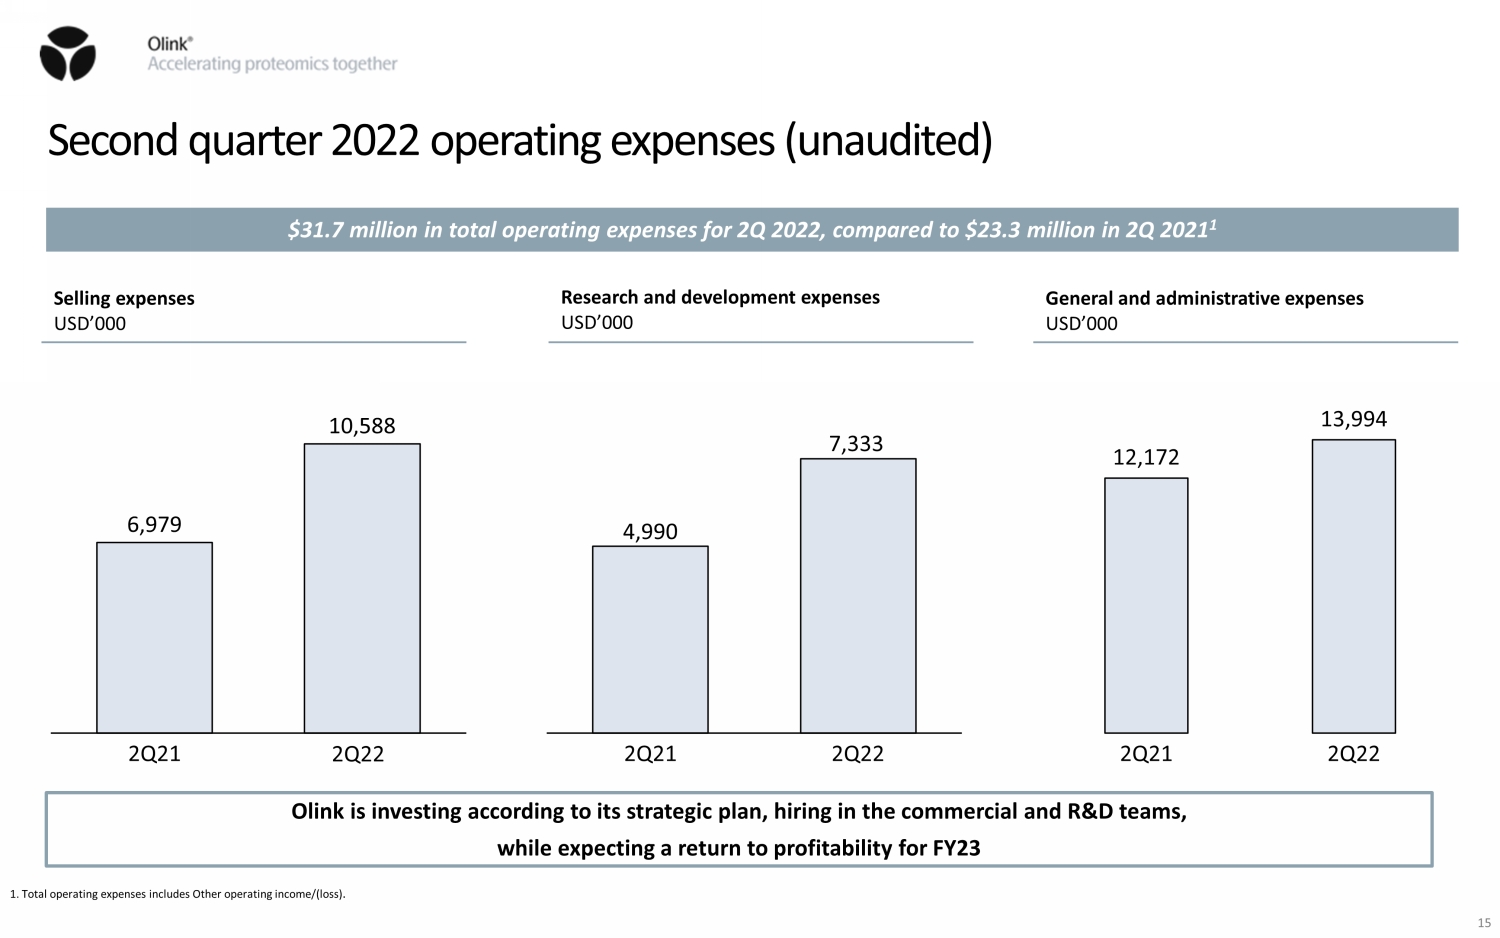
Second quarter 2022 operating expenses (unaudited) $31.7 million in total operating expenses for 2Q 2022, compared to $23.3 million in 2Q 2021 1 Olink is investing according to its strategic plan, hiring in the commercial and R&D teams, while expecting a return to profitability for FY23 Selling expenses USD’000 6,979 10,588 2Q21 Research and development expenses USD’000 4,990 7,333 2Q21 2Q22 General and administrative expenses USD’000 12,172 13,994 2Q22 2Q21 1. Total operating expenses includes Other operating income/(loss) . 2Q22 15
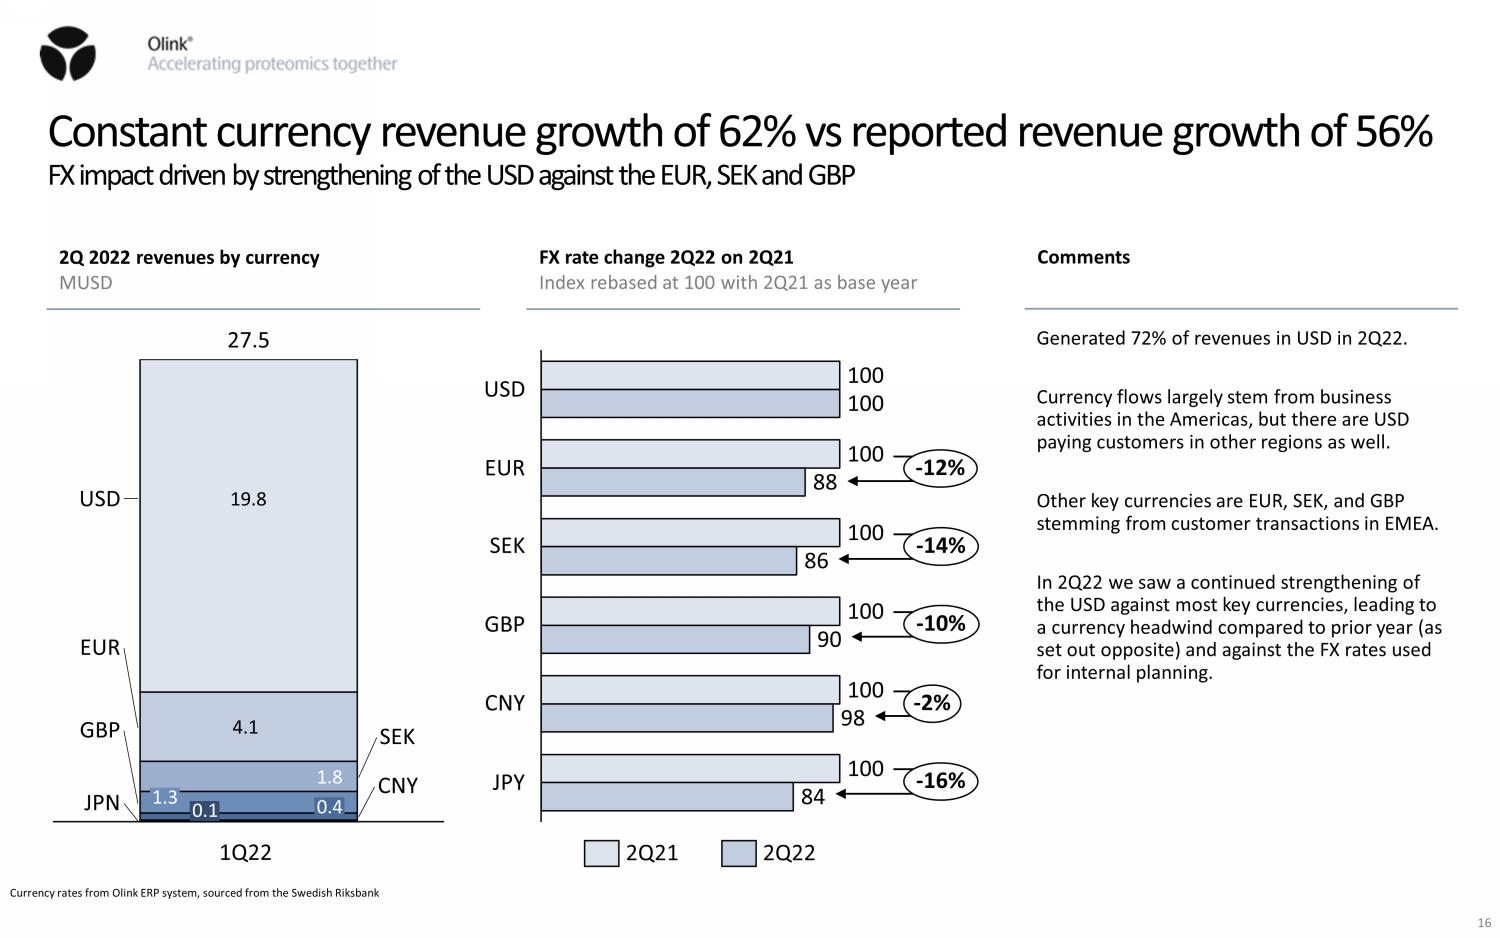
Constant currency revenue growth of 62% vs reported revenue growth of 56% FX impact driven by strengthening of the USD against the EUR, SEK and GBP Currency rates from Olink ERP system, sourced from the Swedish Riksbank 2Q 2022 revenues by currency MUSD FX rate change 2Q22 on 2Q21 Index rebased at 100 with 2Q21 as base year 19.8 0.4 4.1 1.8 1Q22 GBP 1.3 0.1 USD EUR SEK CNY JPN 27.5 Comments Generated 72% of revenues in USD in 2Q22. Currency flows largely stem from business activities in the Americas, but there are USD paying customers in other regions as well. Other key currencies are EUR, SEK, and GBP stemming from customer transactions in EMEA. In 2Q22 we saw a continued strengthening of the USD against most key currencies, leading to a currency headwind compared to prior year (as set out opposite) and against the FX rates used for internal planning. 100 100 100 100 100 100 100 88 86 90 98 84 USD EUR SEK GBP JPY CNY - 12% - 14% - 10% - 2% - 16% 2Q21 2Q22 16
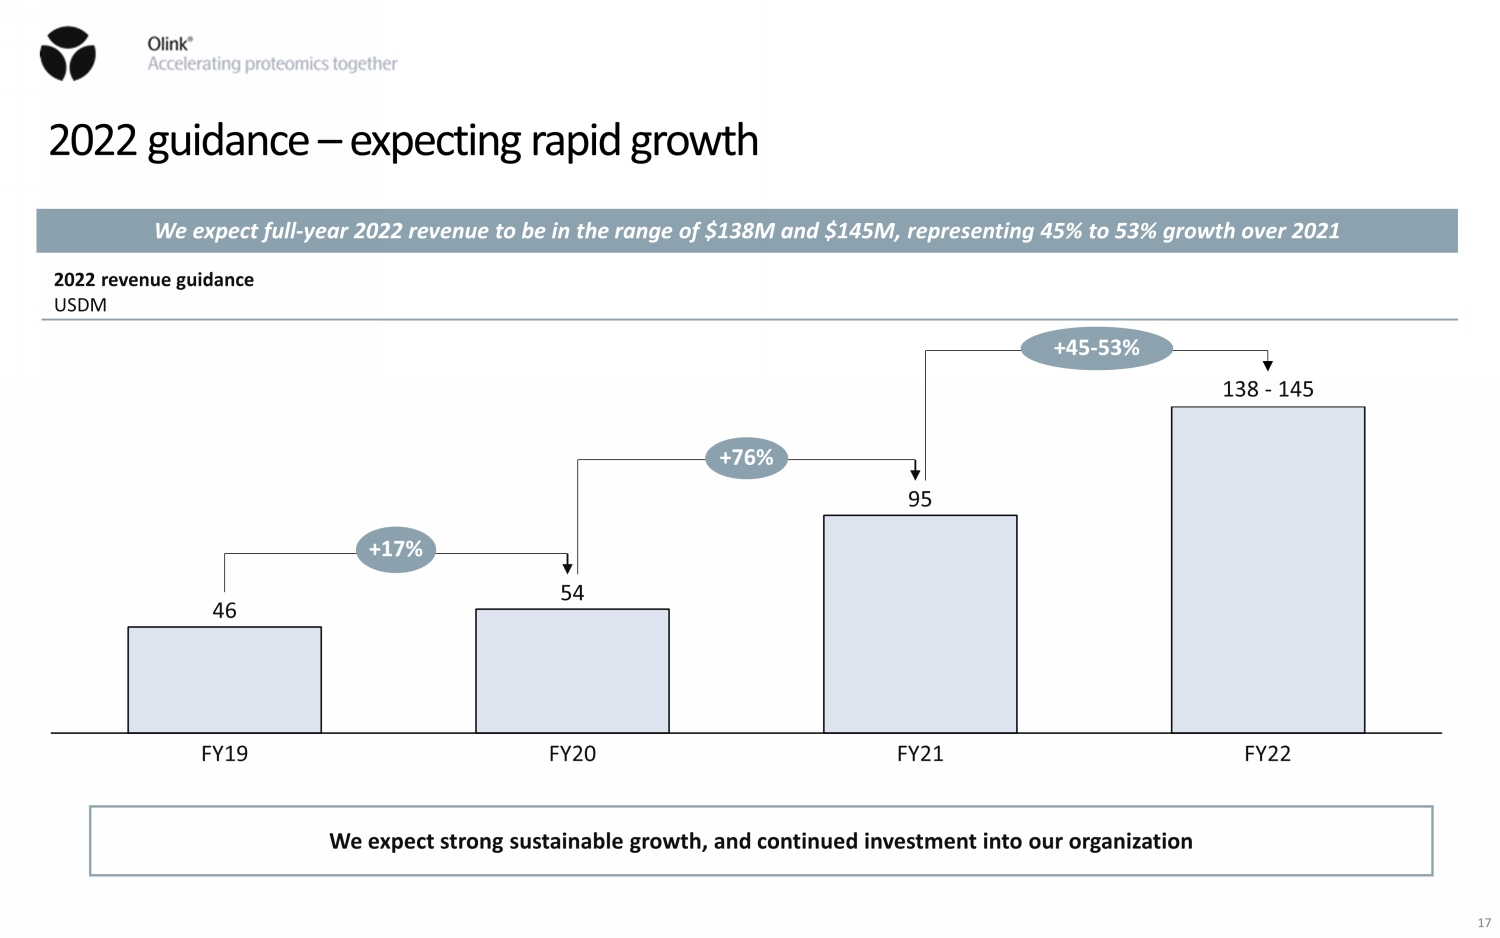
2022 guidance – expecting rapid growth We expect full - year 2022 revenue to be in the range of $138M and $145M, representing 45% to 53% growth over 2021 We expect strong sustainable growth, and continued investment into our organization 2022 revenue guidance USDM 46 54 95 138 - 145 FY19 FY20 FY21 FY22 +17% +76% +45 - 53% 17
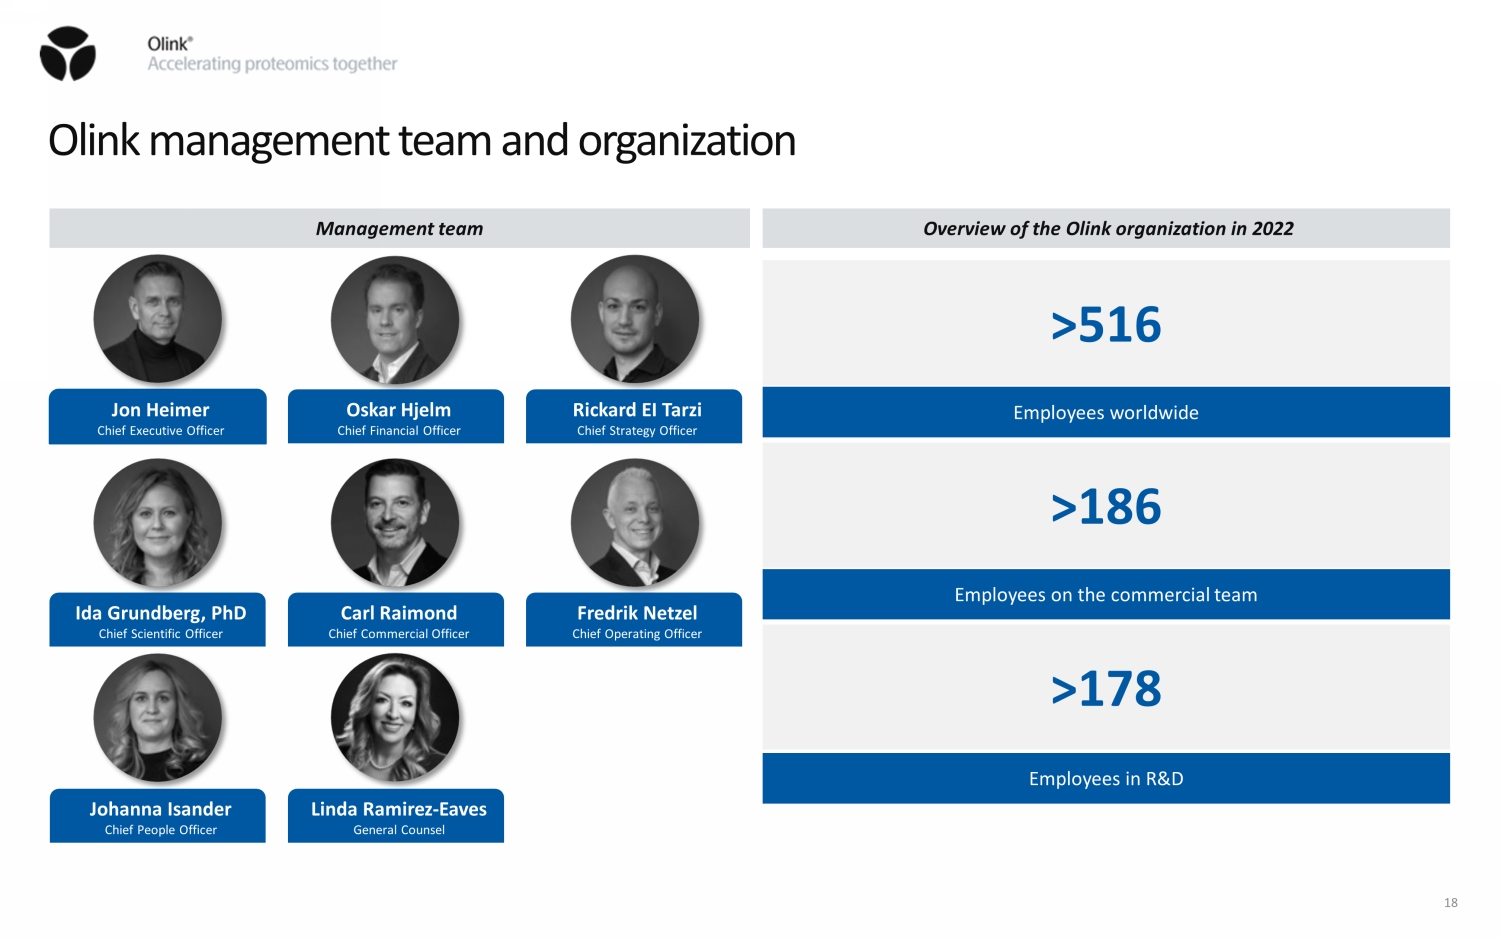
18 Olink management team and organization Jon Heimer Chief Executive Officer Oskar Hjelm Chief Financial Officer Rickard EI Tarzi Chief Strategy Officer Ida Grundberg, PhD Chief Scientific Officer Carl Raimond Chief Commercial Officer Fredrik Netzel Chief Operating Officer Linda Ramirez - Eaves General Counsel Management team Overview of the Olink organization in 2022 Johanna Isander Chief People Officer >516 Employees worldwide >186 Employees on the commercial team >178 Employees in R&D 18
A complete picture of real - time human biology Genomics Proteomics Epigenomics Transcriptomics Metabolomics Accelerating proteomics together Our mission Enable understanding of real - time human biology Our vision

Non - IFRS reconciliations 20
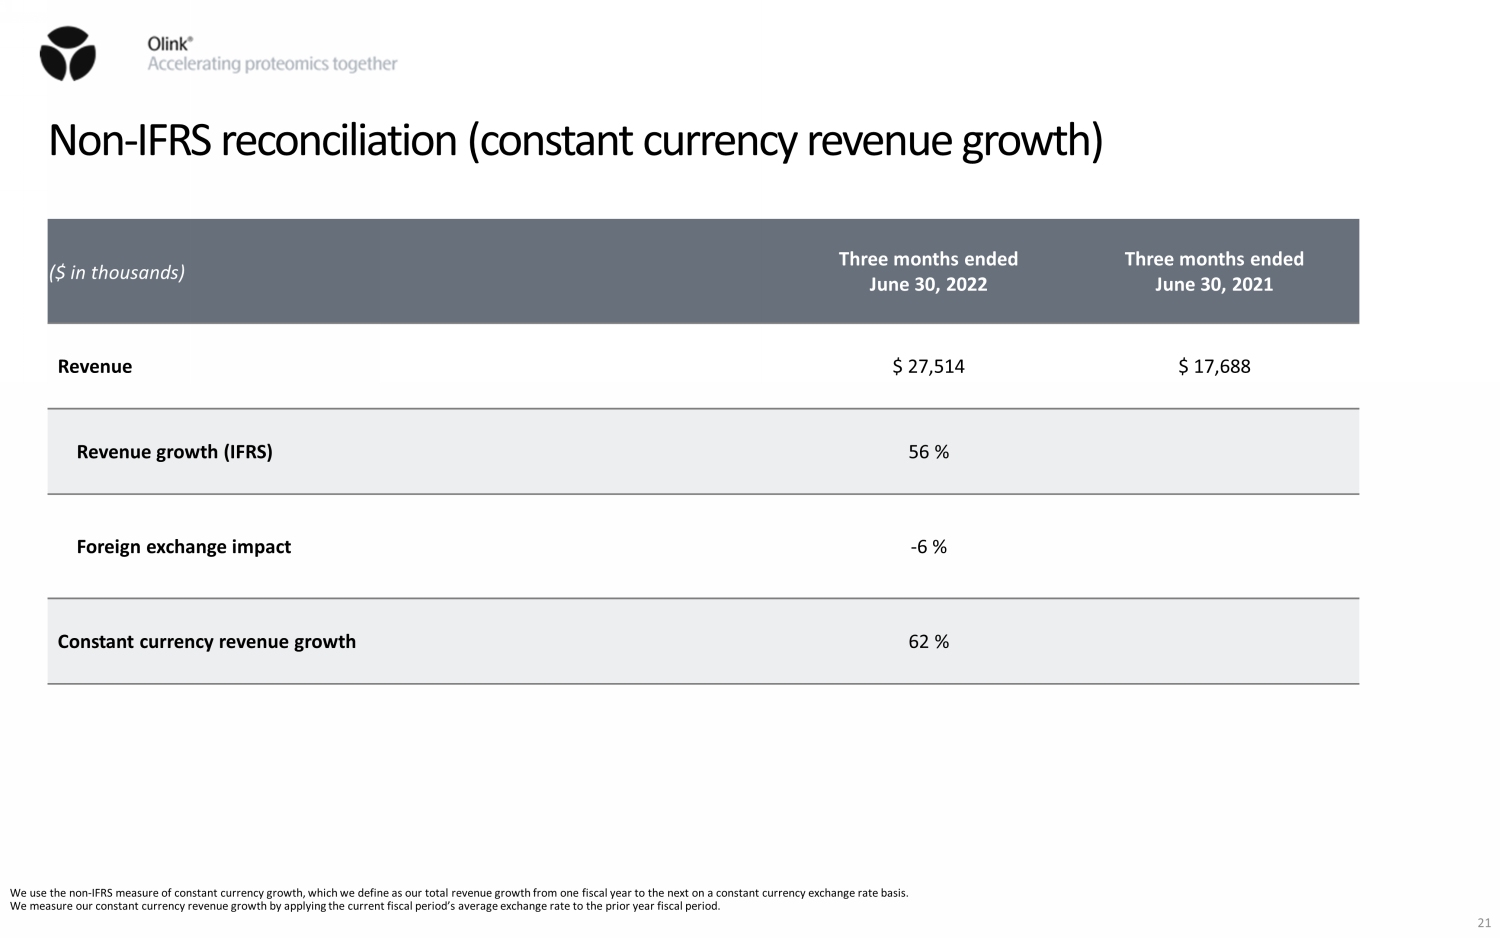
Non - IFRS reconciliation (constant currency revenue growth) 21 ($ in thousands) Three months ended June 30, 2022 Three months ended June 30, 2021 Revenue $ 27,514 $ 17,688 Revenue growth (IFRS) 56 % Foreign exchange impact - 6 % Constant currency revenue growth 62 % We use the non - IFRS measure of constant currency growth, which we define as our total revenue growth from one fiscal year to the next on a constant currency exchange rate basis. We measure our constant currency revenue growth by applying the current fiscal period’s average exchange rate to the prior ye ar fiscal period.
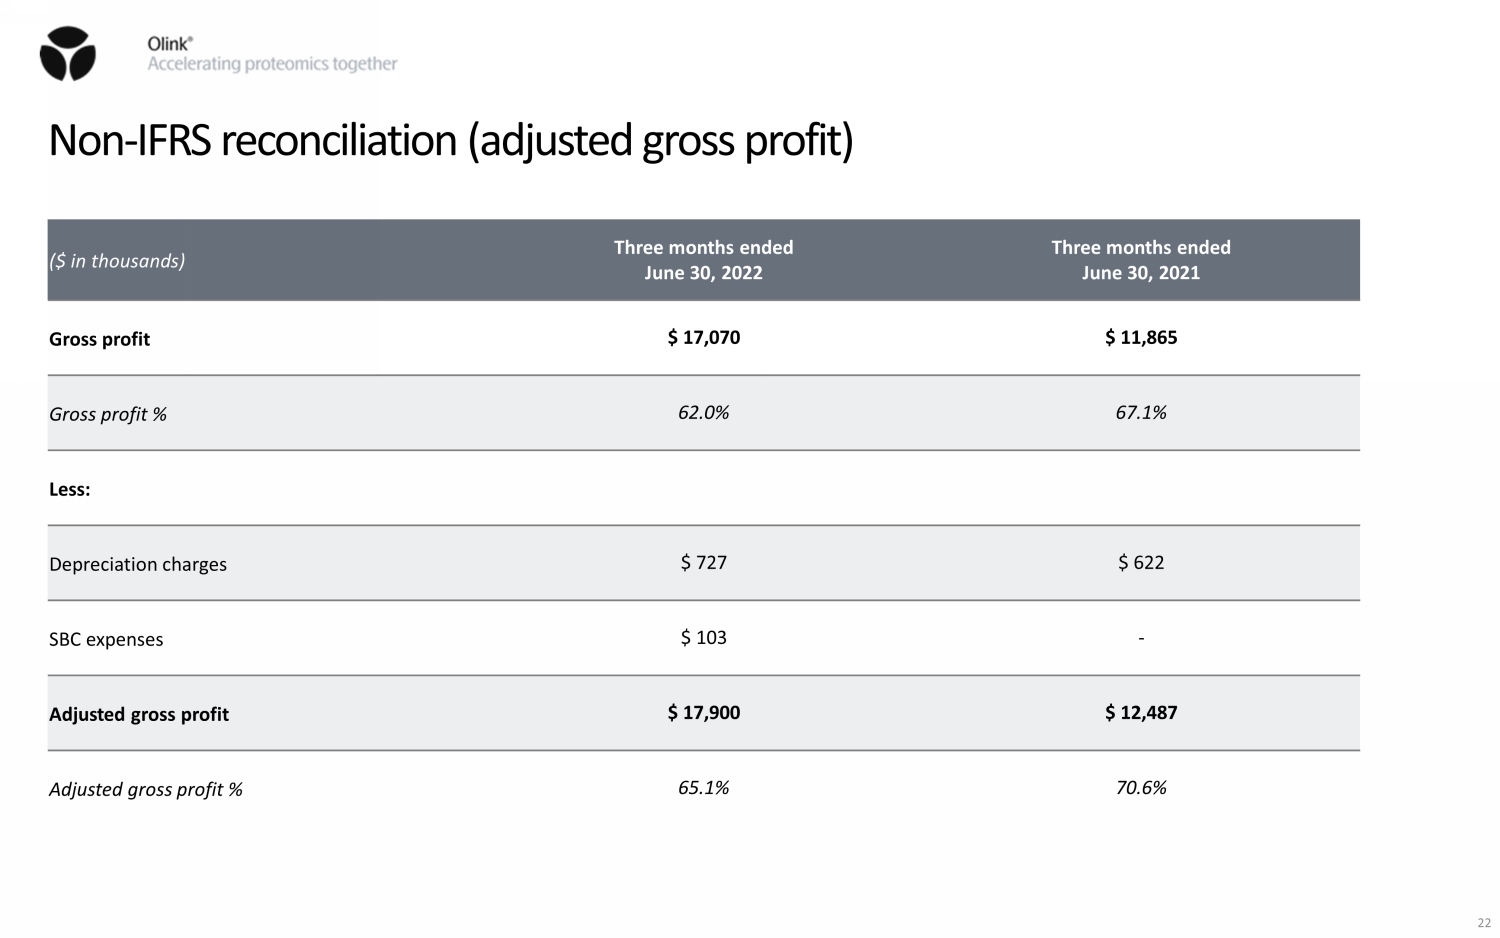
Non - IFRS reconciliation (adjusted gross profit) ($ in thousands) Three months ended June 30, 2022 Three months ended June 30, 2021 Gross profit $ 17,070 $ 11,865 Gross profit % 62.0% 67.1% Less: Depreciation charges $ 727 $ 622 SBC expenses $ 103 - Adjusted gross profit $ 17,900 $ 12,487 Adjusted gross profit % 65.1% 70.6% 22
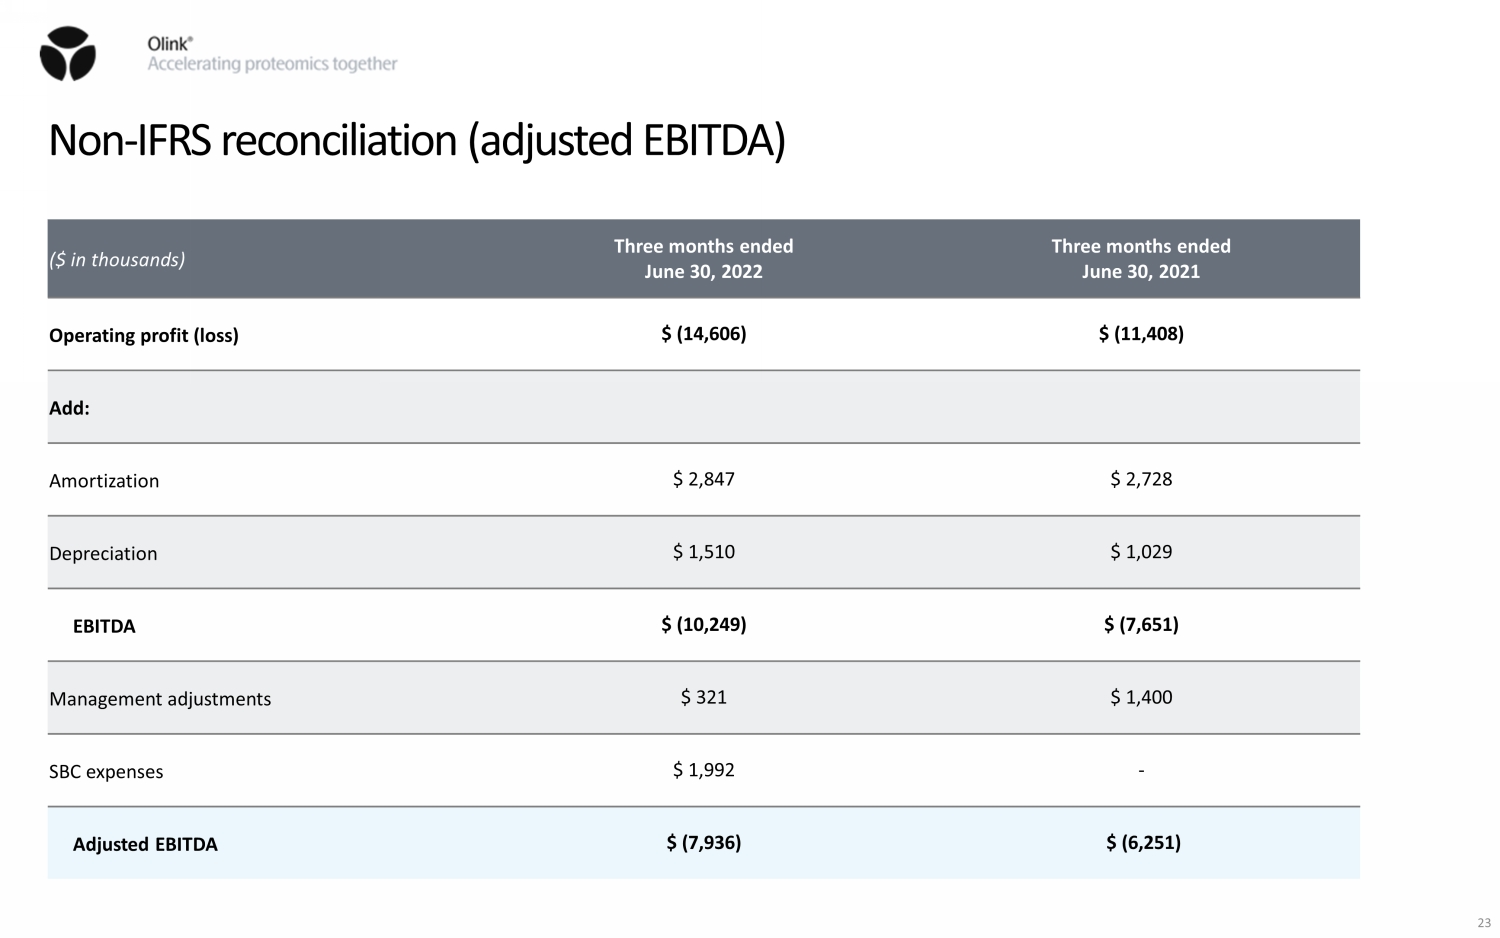
Non - IFRS reconciliation (adjusted EBITDA) ($ in thousands) Three months ended June 30, 2022 Three months ended June 30, 2021 Operating profit (loss) $ (14,606) $ (11,408) Add: Amortization $ 2,847 $ 2,728 Depreciation $ 1,510 $ 1,029 EBITDA $ (10,249) $ (7,651) Management adjustments $ 321 $ 1,400 SBC expenses $ 1,992 - Adjusted EBITDA $ (7,936) $ (6,251) 23
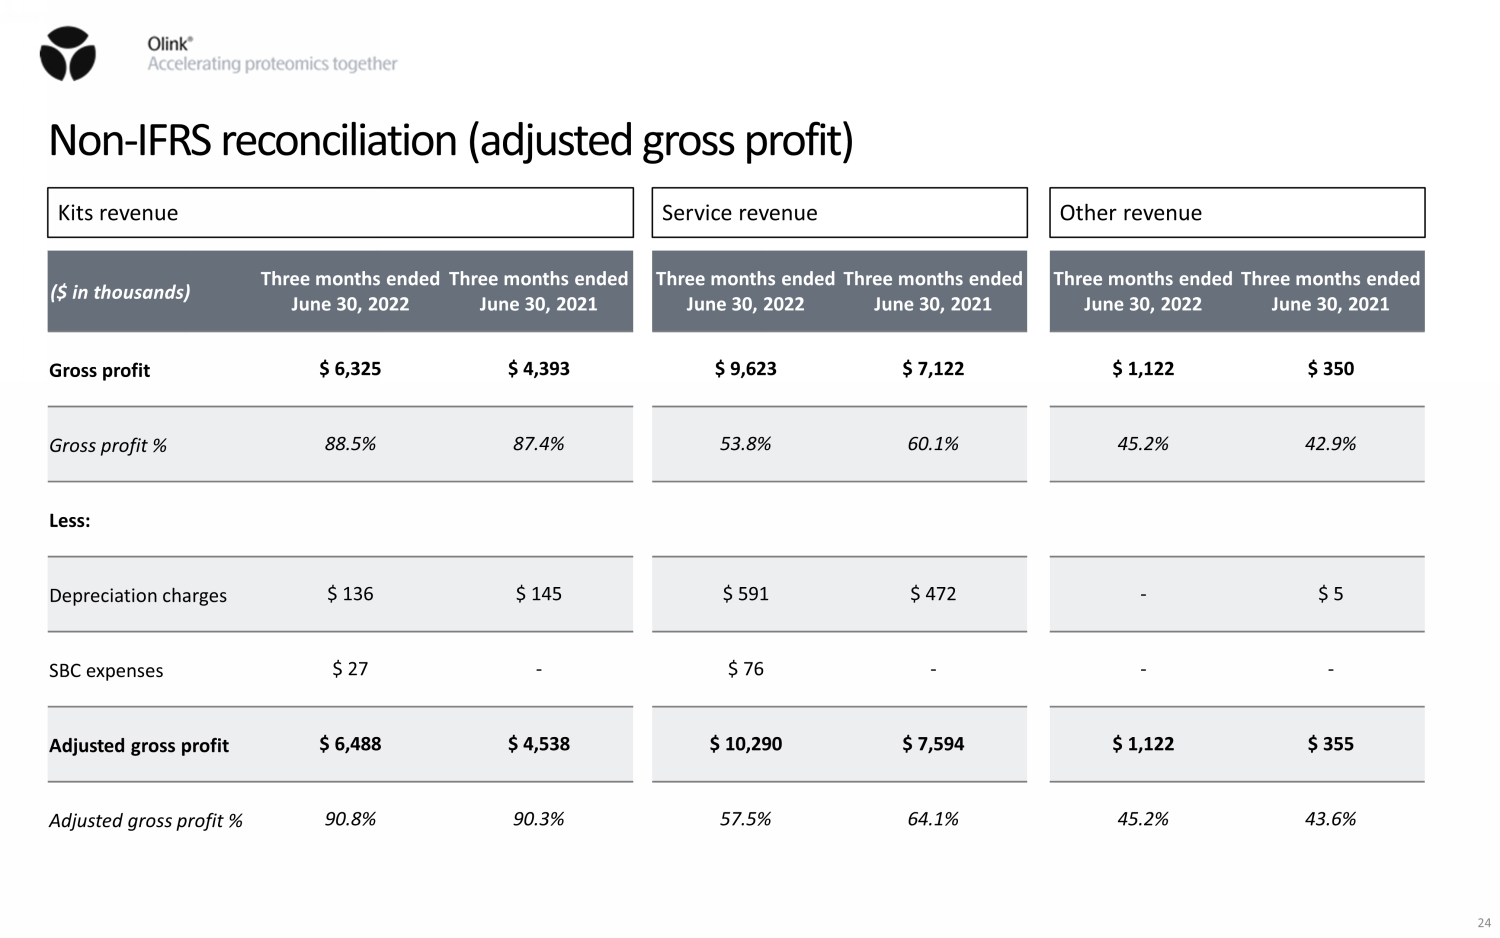
Non - IFRS reconciliation (adjusted gross profit) ($ in thousands) Three months ended June 30, 2022 Three months ended June 30, 2021 Gross profit $ 6,325 $ 4,393 Gross profit % 88.5% 87.4% Less: Depreciation charges $ 136 $ 145 SBC expenses $ 27 - Adjusted gross profit $ 6,488 $ 4,538 Adjusted gross profit % 90.8% 90.3% Three months ended June 30, 2022 Three months ended June 30, 2021 $ 9,623 $ 7,122 53.8% 60.1% $ 591 $ 472 $ 76 - $ 10,290 $ 7,594 57.5% 64.1% Three months ended June 30, 2022 Three months ended June 30, 2021 $ 1,122 $ 350 45.2% 42.9% - $ 5 - - $ 1,122 $ 355 45.2% 43.6% Kits revenue Service revenue Other revenue 24