2Q 2023 earnings August 9, 2023 Olink Proteomics Vision Enable understanding of real-time human biology Mission Accelerate proteomics together
Disclaimer This presentation contains express or implied "forward-looking statements," as defined under the Private Securities Litigation Reform Act of 1995, that involve substantial risks and uncertainties. In some cases, you can identify forward- looking statements by the words “may,” “might,” “will,” “could,” “would,” “should,” “expect,” “intend,” "seek," “plan,” "outlook," “objective,” “anticipate,” “believe,” “estimate,” “predict,” "project," “potential,” “continue,” "currently," “ongoing,” or the negative of these terms, or other comparable terminology intended to identify statements about the future. You should not place undue reliance on these statements because they involve known and unknown risks, uncertainties and other important factors that may cause our actual results, levels of activity, performance or achievements to be materially different from the information expressed or implied by these forward- looking statements. The forward-looking statements and opinions contained in this presentation are based on our management’s beliefs and assumptions and are based upon information currently available to our management as of the date of this presentation and, while we believe such information forms a reasonable basis for such statements, such information may be limited or incomplete, and our statements should not be read to indicate that we have conducted an exhaustive inquiry into, or review of, all potentially available relevant information. The forward-looking statements contained in this presentation should be read in conjunction with, and are subject to and qualified by, the risks described in the "Risk Factors" section in our Form 20-F for the fiscal year ended December 31, 2022 (Commission file number 001-40277) and elsewhere in the documents we file with the SEC from time to time. Forward-looking statements contained in this presentation include, but are not limited to, information about estimates of our addressable market, market growth, future revenue, key performance indicators, expenses, capital requirements and our needs for additional financing; our ability to successfully implement our commercial plans, including the development, launch and scaling of our Explore product line and Olink signature platform as well as our new product Olink Flex and our new Olink Insight online platform; the implementation of our business model and strategic plans; our plan to grow our library of protein biomarker targets; our expectations regarding the rate and degree of market acceptance of our product lines; our dependence on levels of research and development spending by academic and governmental research institutions and biopharmaceutical companies, a reduction in which could limit demand for our products; the impact of our products and our proprietary technology, Proximity Extension Assay, on the field of proteomics and the size and growth of the addressable proteomics market; our competitive position, and developments and projections relating to our competitors and our industry, including estimates of the size and growth potential of the markets for our products; the timing, scope or likelihood of domestic and foreign regulatory filings and approvals; occurrence of cyber incidents or failure by us or our third-party service providers to maintain cybersecurity; our ability to maintain an effective system of internal control over financial reporting; our ability to manage and grow our business; our ability to develop and commercialize new products; the performance of third-party manufacturers and suppliers; our ability to retain the continued service of our key professionals and to identify, hire and retain additional qualified professionals; our ability to obtain additional financing in future offerings, including among others, impacts of the current volatility in the global capital and credit markets and the effects of increased inflation on the cost of capital; the quarterly progression of our business and major financial metrics, as they relate to the seasonal nature of our customers' buying patterns; the impact of local, regional, and national and international economic conditions and events, including among others, rising inflation, currency exchange rates, the ongoing military conflict between Russia and Ukraine, and developments in China; and any lingering impacts from the COVID-19 pandemic on our business. This presentation contains estimates, projections and other information concerning our industry, our business, and the markets for our products and services. Information that is based on estimates, forecasts, projections, market research or similar methodologies is inherently subject to uncertainties, and actual events or circumstances may differ materially from events and circumstances that are assumed in this information. Unless otherwise expressly stated, we obtained this industry, business, market and other data from our own internal estimates and research as well as from reports, research surveys, studies and similar data prepared by market research firms and other third parties, industry, medical and general publications, government data and similar sources. While we believe our internal company research as to such matters is reliable and the market definitions are appropriate, neither such research nor these definitions have been verified by any independent source. We undertake no obligation to publicly update or revise any forward-looking statements as a result of new information, future events or otherwise 2
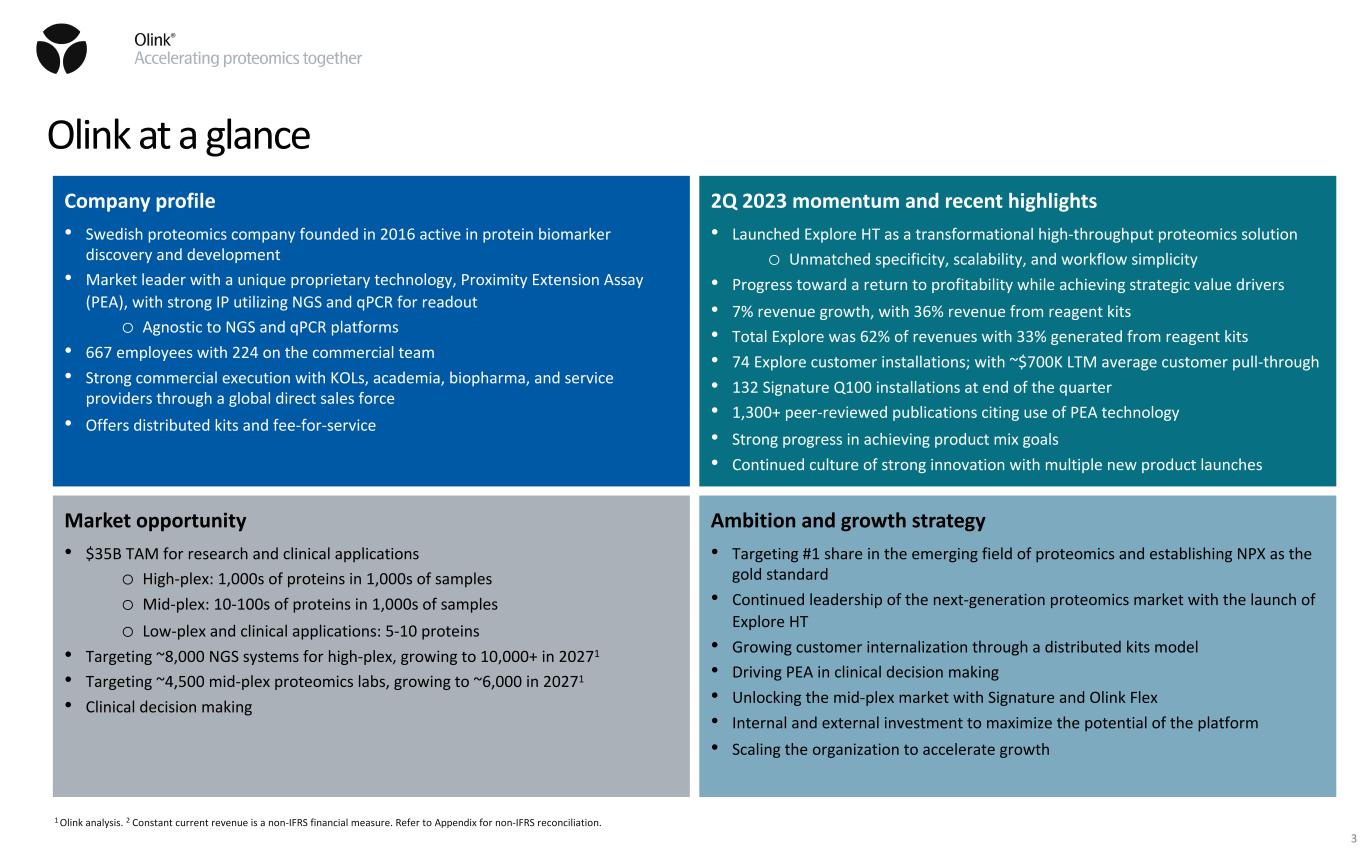
Olink at a glance Company profile • Swedish proteomics company founded in 2016 active in protein biomarker discovery and development • Market leader with a unique proprietary technology, Proximity Extension Assay (PEA), with strong IP utilizing NGS and qPCR for readout o Agnostic to NGS and qPCR platforms • 667 employees with 224 on the commercial team • Strong commercial execution with KOLs, academia, biopharma, and service providers through a global direct sales force • Offers distributed kits and fee-for-service 2Q 2023 momentum and recent highlights • Launched Explore HT as a transformational high-throughput proteomics solution o Unmatched specificity, scalability, and workflow simplicity • Progress toward a return to profitability while achieving strategic value drivers • 7% revenue growth, with 36% revenue from reagent kits • Total Explore was 62% of revenues with 33% generated from reagent kits • 74 Explore customer installations; with ~$700K LTM average customer pull-through • 132 Signature Q100 installations at end of the quarter • 1,300+ peer-reviewed publications citing use of PEA technology • Strong progress in achieving product mix goals • Continued culture of strong innovation with multiple new product launches Market opportunity • $35B TAM for research and clinical applications o High-plex: 1,000s of proteins in 1,000s of samples o Mid-plex: 10-100s of proteins in 1,000s of samples o Low-plex and clinical applications: 5-10 proteins • Targeting ~8,000 NGS systems for high-plex, growing to 10,000+ in 20271 • Targeting ~4,500 mid-plex proteomics labs, growing to ~6,000 in 20271 • Clinical decision making Ambition and growth strategy • Targeting #1 share in the emerging field of proteomics and establishing NPX as the gold standard • Continued leadership of the next-generation proteomics market with the launch of Explore HT • Growing customer internalization through a distributed kits model • Driving PEA in clinical decision making • Unlocking the mid-plex market with Signature and Olink Flex • Internal and external investment to maximize the potential of the platform • Scaling the organization to accelerate growth 3 1 Olink analysis. 2 Constant current revenue is a non-IFRS financial measure. Refer to Appendix for non-IFRS reconciliation.

Sensitivity Specificity Dynamic range Sample consumption Throughput Cost“Casting a broad net” 4 Uniquely addressed all major challenges in proteomics – highest data quality
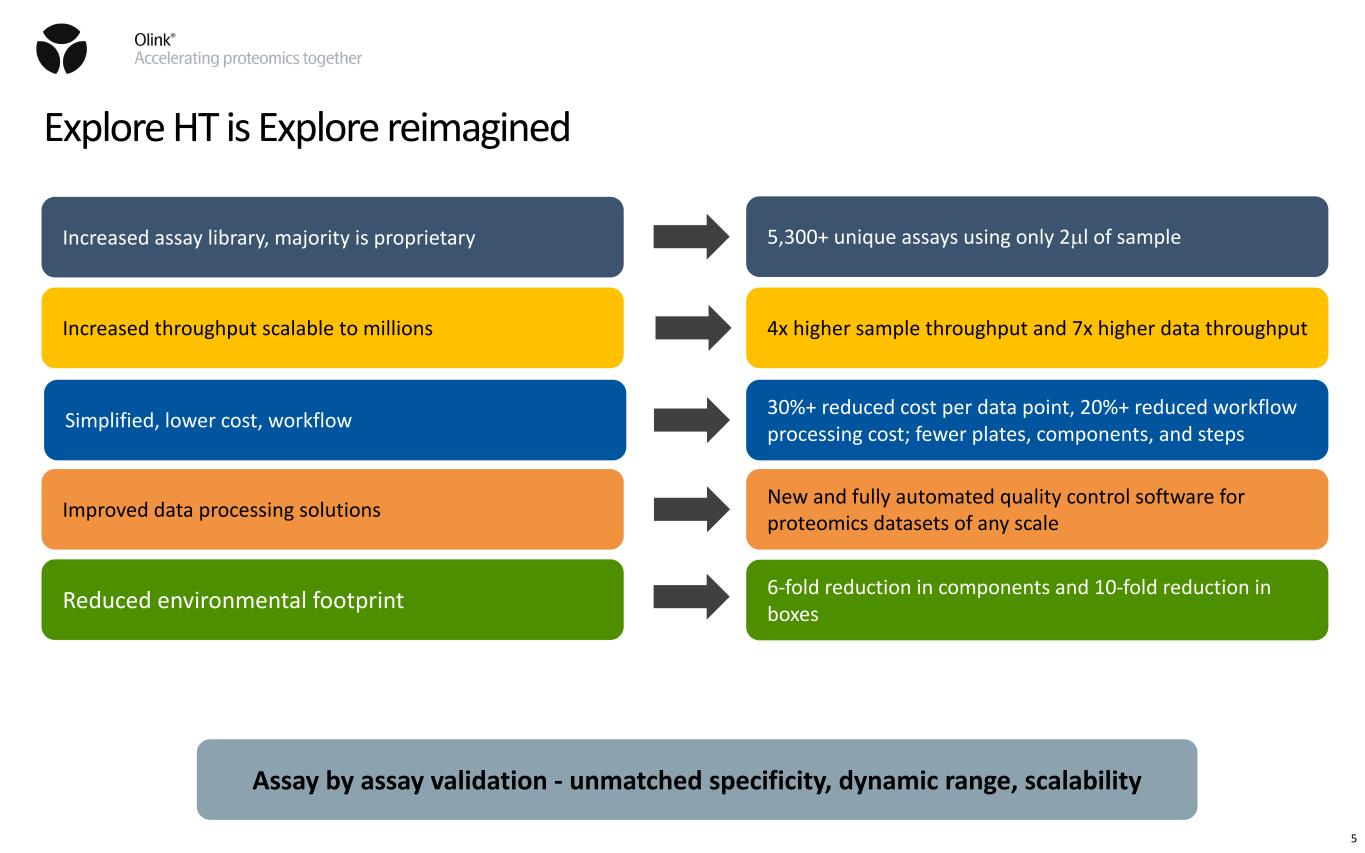
5 Explore HT is Explore reimagined Simplified, lower cost, workflow Increased assay library, majority is proprietary Increased throughput scalable to millions Improved data processing solutions 30%+ reduced cost per data point, 20%+ reduced workflow processing cost; fewer plates, components, and steps 4x higher sample throughput and 7x higher data throughput 5,300+ unique assays using only 2µl of sample New and fully automated quality control software for proteomics datasets of any scale Assay by assay validation - unmatched specificity, dynamic range, scalability 6-fold reduction in components and 10-fold reduction in boxesReduced environmental footprint
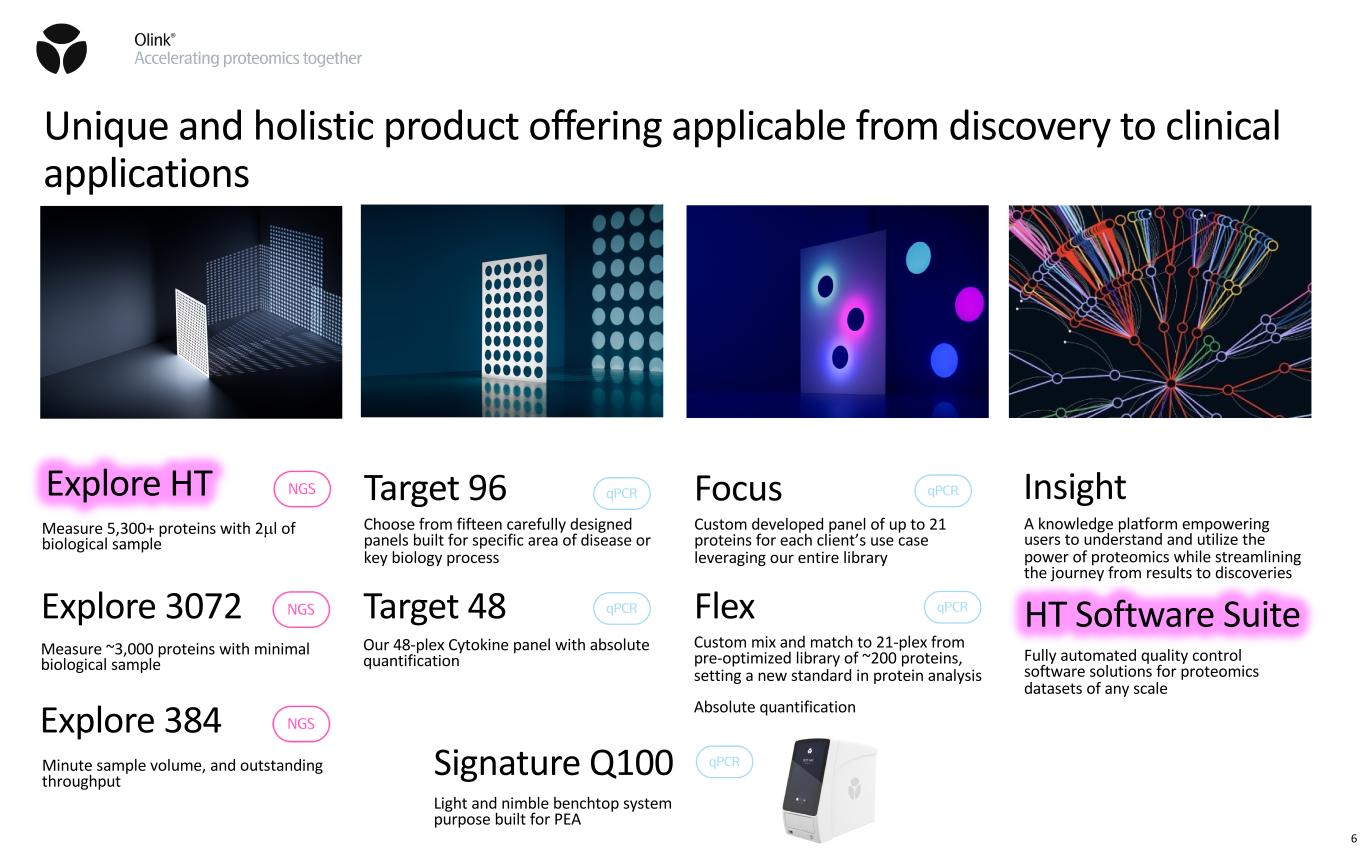
Focus Custom developed panel of up to 21 proteins for each client’s use case leveraging our entire library Explore 3072 Measure ~3,000 proteins with minimal biological sample Explore 384 Minute sample volume, and outstanding throughput Target 96 Choose from fifteen carefully designed panels built for specific area of disease or key biology process Target 48 Our 48-plex Cytokine panel with absolute quantification Signature Q100 Light and nimble benchtop system purpose built for PEA Insight A knowledge platform empowering users to understand and utilize the power of proteomics while streamlining the journey from results to discoveries Custom mix and match to 21-plex from pre-optimized library of ~200 proteins, setting a new standard in protein analysis Absolute quantification Flex 6 Unique and holistic product offering applicable from discovery to clinical applications Measure 5,300+ proteins with 2µl of biological sample Explore HT Fully automated quality control software solutions for proteomics datasets of any scale HT Software Suite
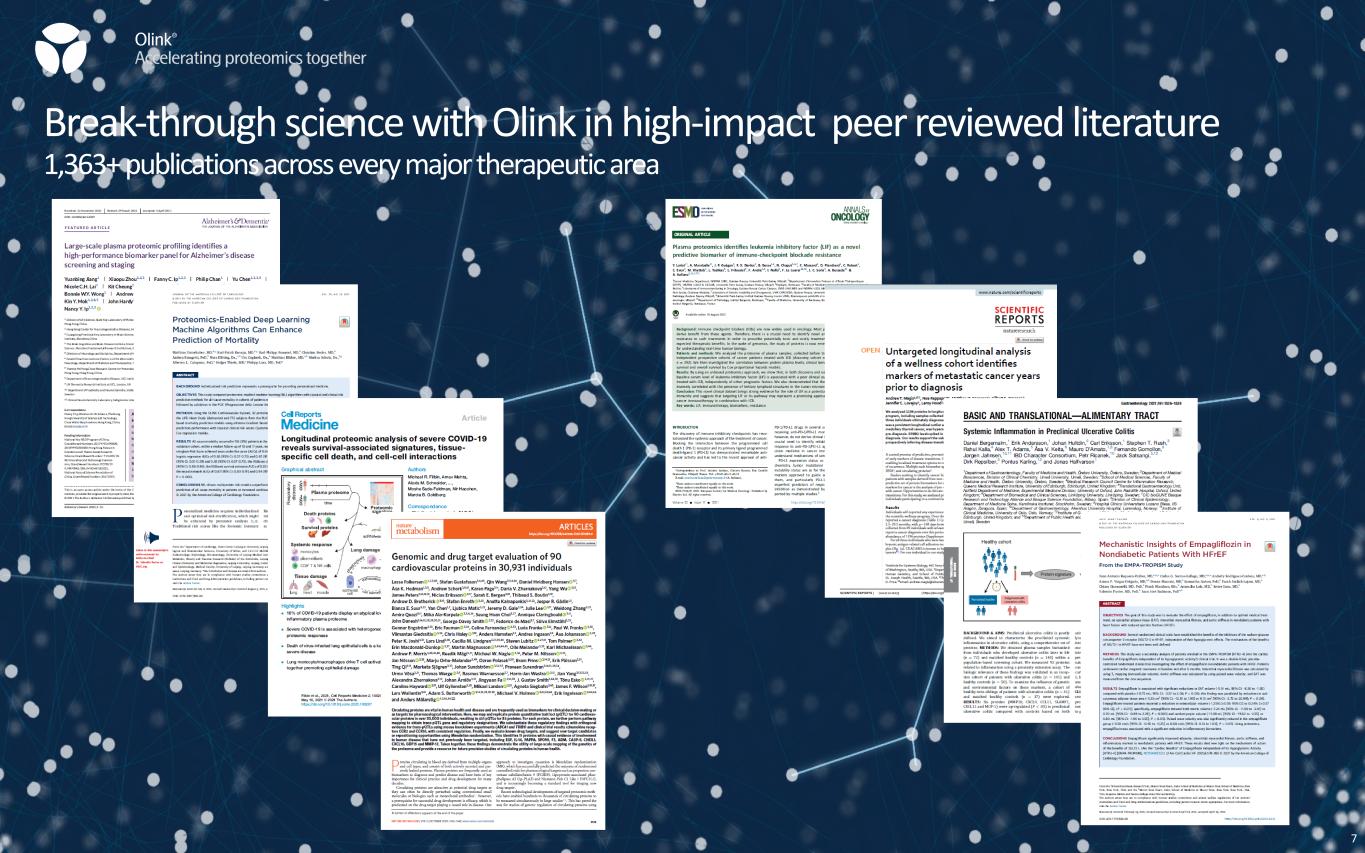
Break-through science with Olink in high-impact peer reviewed literature 1,363+ publications across every major therapeutic area 7
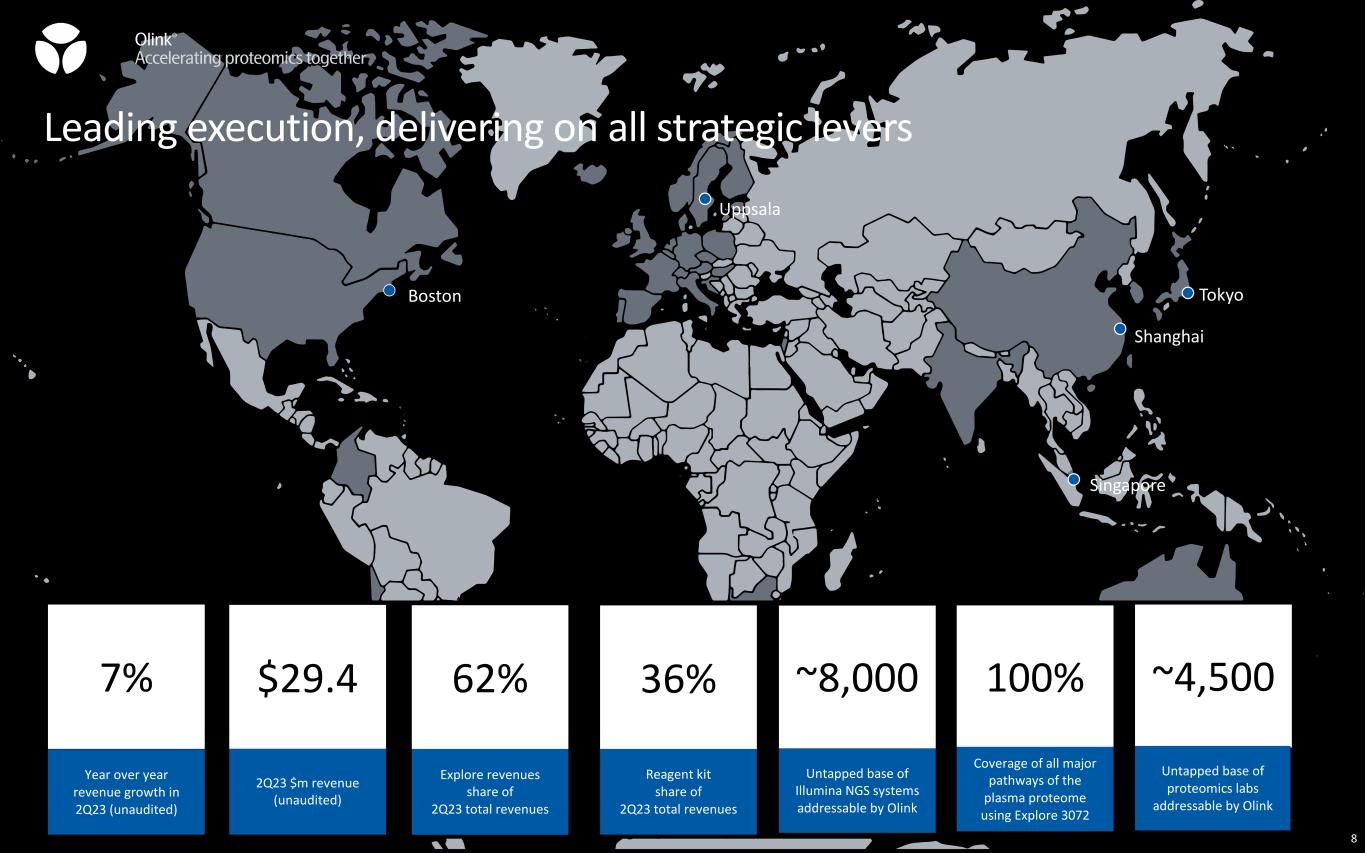
Singapore Shanghai Boston Tokyo Uppsala Leading execution, delivering on all strategic levers 7% Year over year revenue growth in 2Q23 (unaudited) 62% Explore revenues share of 2Q23 total revenues $29.4 2Q23 $m revenue (unaudited) 100% Coverage of all major pathways of the plasma proteome using Explore 3072 ~4,500 Untapped base of proteomics labs addressable by Olink 8 ~8,000 Untapped base of Illumina NGS systems addressable by Olink 36% Reagent kit share of 2Q23 total revenues
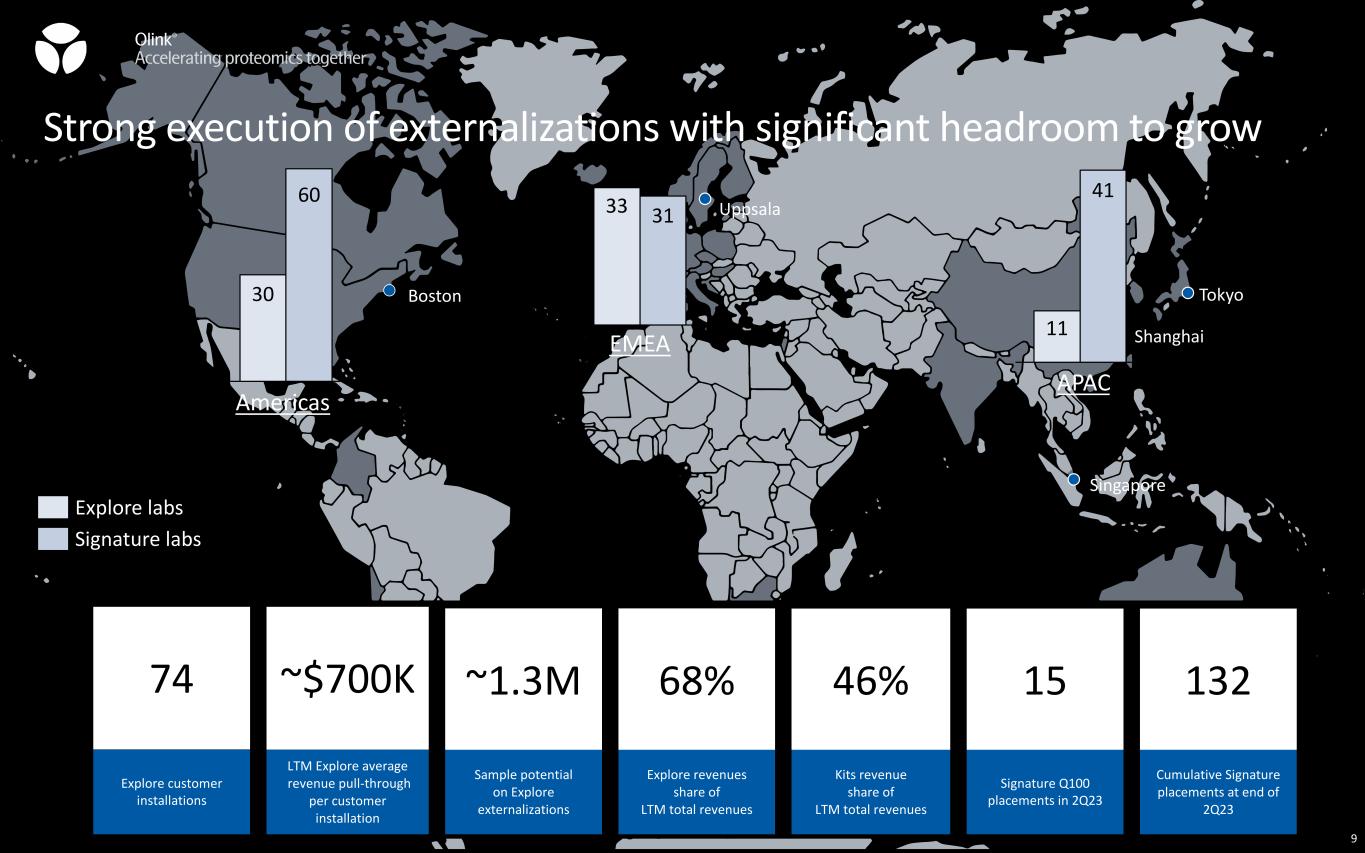
Singapore Shanghai Boston Tokyo Uppsala Strong execution of externalizations with significant headroom to grow 74 Explore customer installations Explore labs 132 Cumulative Signature placements at end of 2Q23 9 68% Explore revenues share of LTM total revenues ~1.3M Sample potential on Explore externalizations 46% Kits revenue share of LTM total revenues 15 Signature Q100 placements in 2Q23 ~$700K LTM Explore average revenue pull-through per customer installation Signature labs 11 41 APAC 33 31 EMEA 30 60 Americas
10 Proprietary PEA technology Discovery to clinical applications Proximity Extension Assay (PEA) Solving fundamental challenges in proteomics $35bn TAM opportunity A market leader Strong commercial execution Market leader with a differentiated technology platform enabling customers from discovery to clinical applications 10
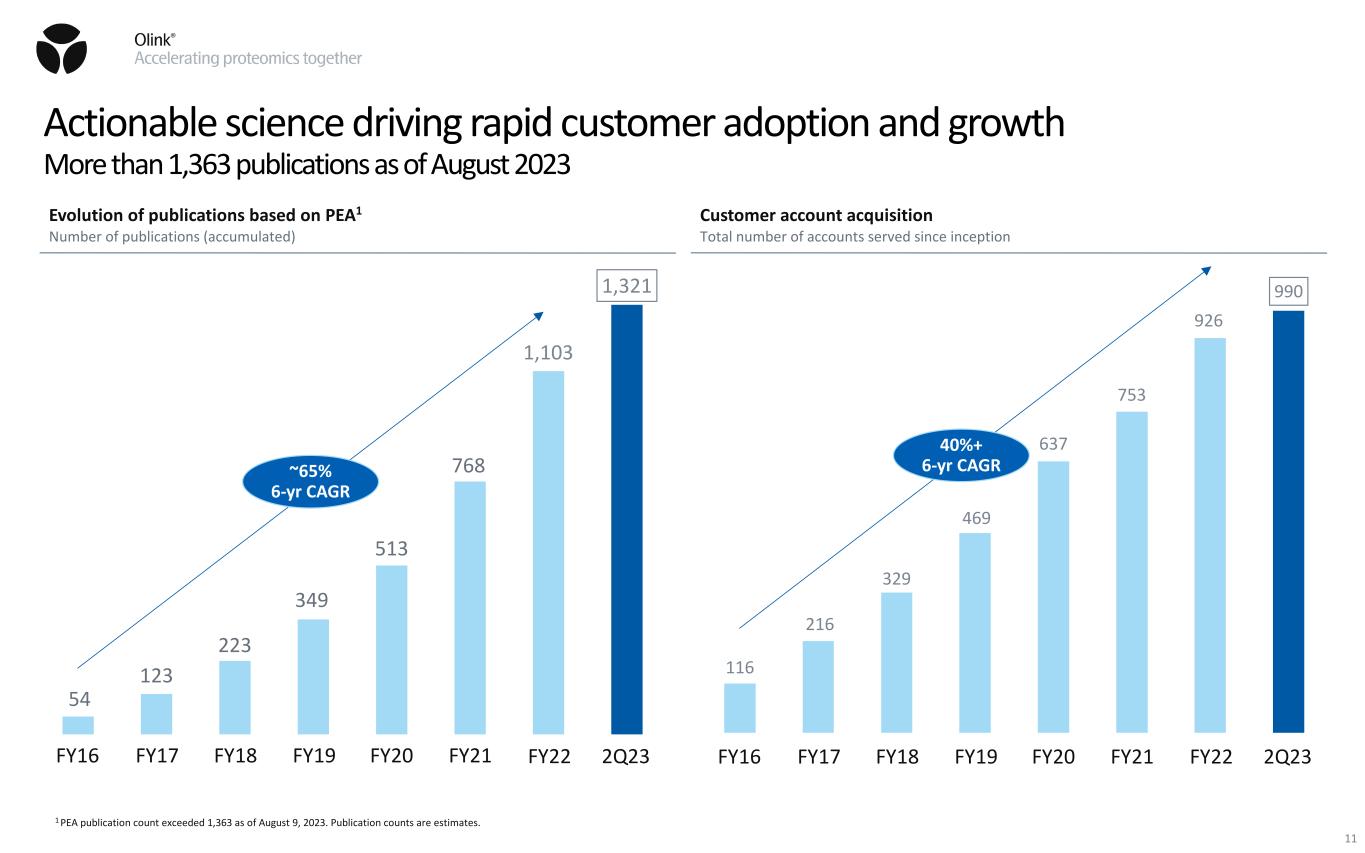
Actionable science driving rapid customer adoption and growth More than 1,363 publications as of August 2023 Evolution of publications based on PEA1 Number of publications (accumulated) 54 123 223 349 513 768 1,103 1,321 FY17FY16 FY20FY19FY18 FY21 Customer account acquisition Total number of accounts served since inception FY22 116 216 329 469 637 753 926 990 ~65% 6-yr CAGR 40%+ 6-yr CAGR 1 PEA publication count exceeded 1,363 as of August 9, 2023. Publication counts are estimates. 11 2Q23 FY17FY16 FY20FY19FY18 FY21 FY22 2Q23
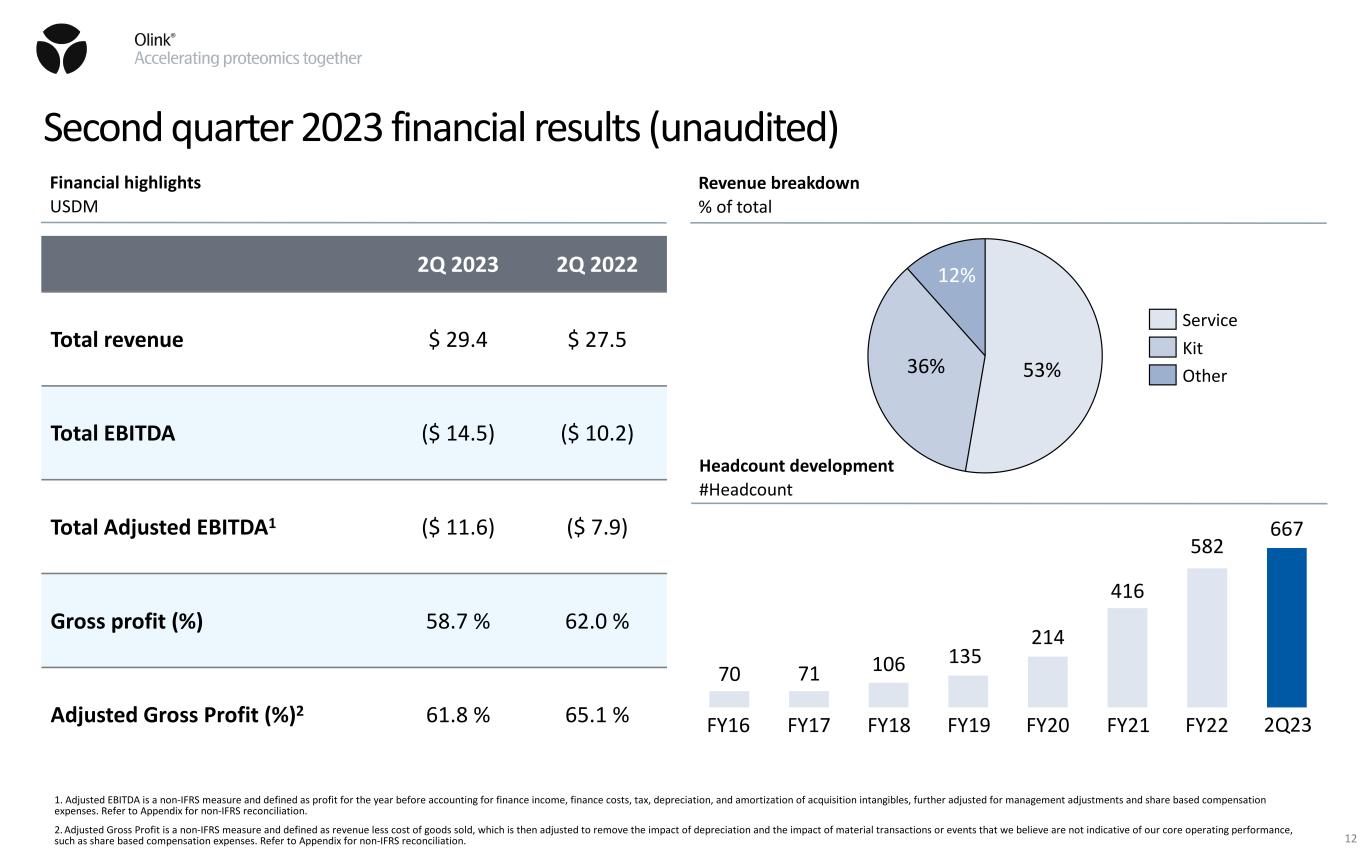
Second quarter 2023 financial results (unaudited) 1. Adjusted EBITDA is a non-IFRS measure and defined as profit for the year before accounting for finance income, finance costs, tax, depreciation, and amortization of acquisition intangibles, further adjusted for management adjustments and share based compensation expenses. Refer to Appendix for non-IFRS reconciliation. 2. Adjusted Gross Profit is a non-IFRS measure and defined as revenue less cost of goods sold, which is then adjusted to remove the impact of depreciation and the impact of material transactions or events that we believe are not indicative of our core operating performance, such as share based compensation expenses. Refer to Appendix for non-IFRS reconciliation. 2Q 2023 2Q 2022 Total revenue $ 29.4 $ 27.5 Total EBITDA ($ 14.5) ($ 10.2) Total Adjusted EBITDA1 ($ 11.6) ($ 7.9) Gross profit (%) 58.7 % 62.0 % Adjusted Gross Profit (%)2 61.8 % 65.1 % 53%36% 12% Service Kit Other Revenue breakdown % of total Headcount development #Headcount Financial highlights USDM 70 71 106 135 214 416 582 667 FY16 FY17 FY19FY18 FY20 FY21 FY22 12 2Q23
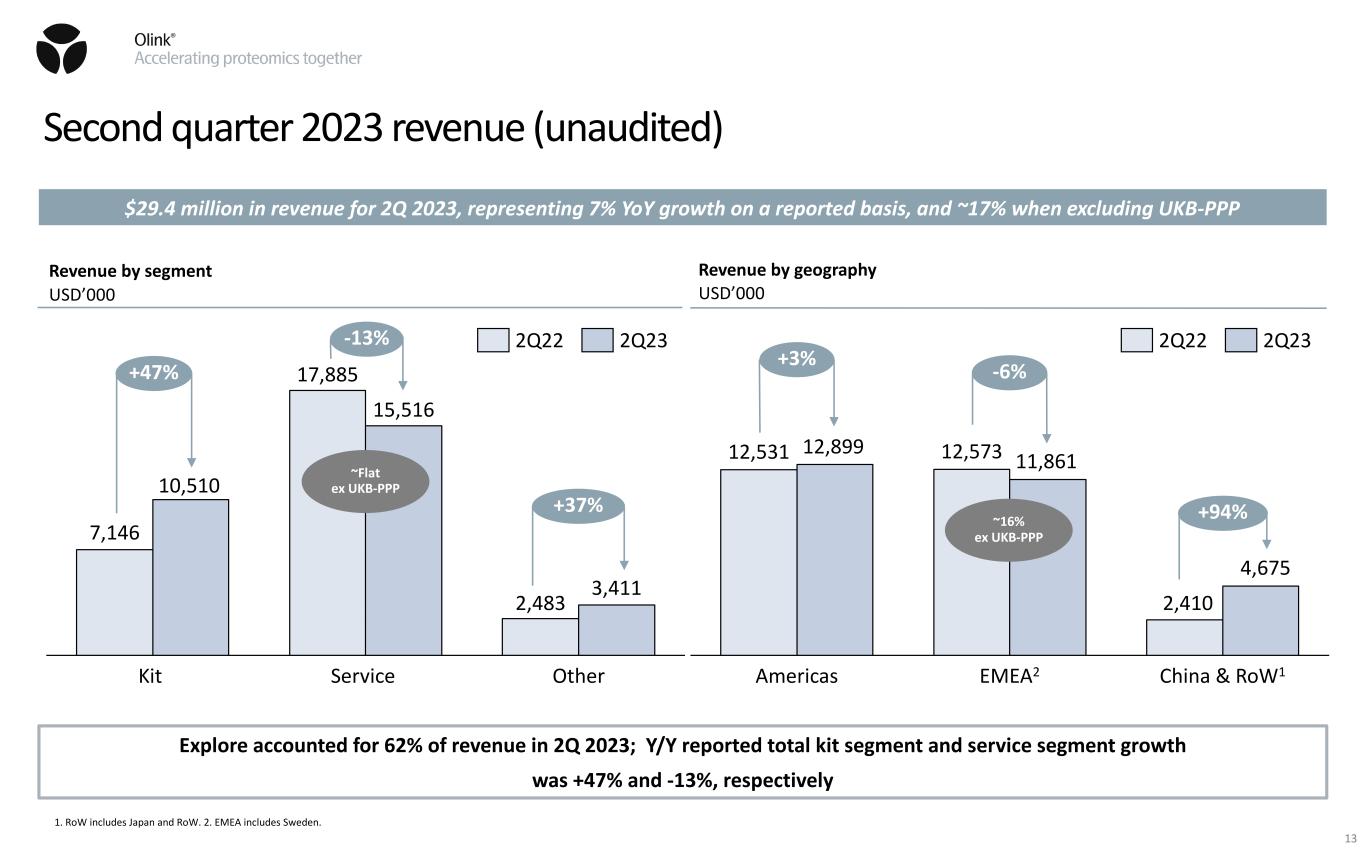
Second quarter 2023 revenue (unaudited) 1. RoW includes Japan and RoW. 2. EMEA includes Sweden. $29.4 million in revenue for 2Q 2023, representing 7% YoY growth on a reported basis, and ~17% when excluding UKB-PPP Revenue by segment USD’000 Revenue by geography USD’000 7,146 17,885 2,483 10,510 15,516 3,411 OtherKit Service +47% +37% 2Q22 2Q23 12,531 12,573 2,410 12,899 11,861 4,675 China & RoW1Americas EMEA2 +3% -6% +94% 2Q22 2Q23 Explore accounted for 62% of revenue in 2Q 2023; Y/Y reported total kit segment and service segment growth was +47% and -13%, respectively -13% 13 ~Flat ex UKB-PPP ~16% ex UKB-PPP
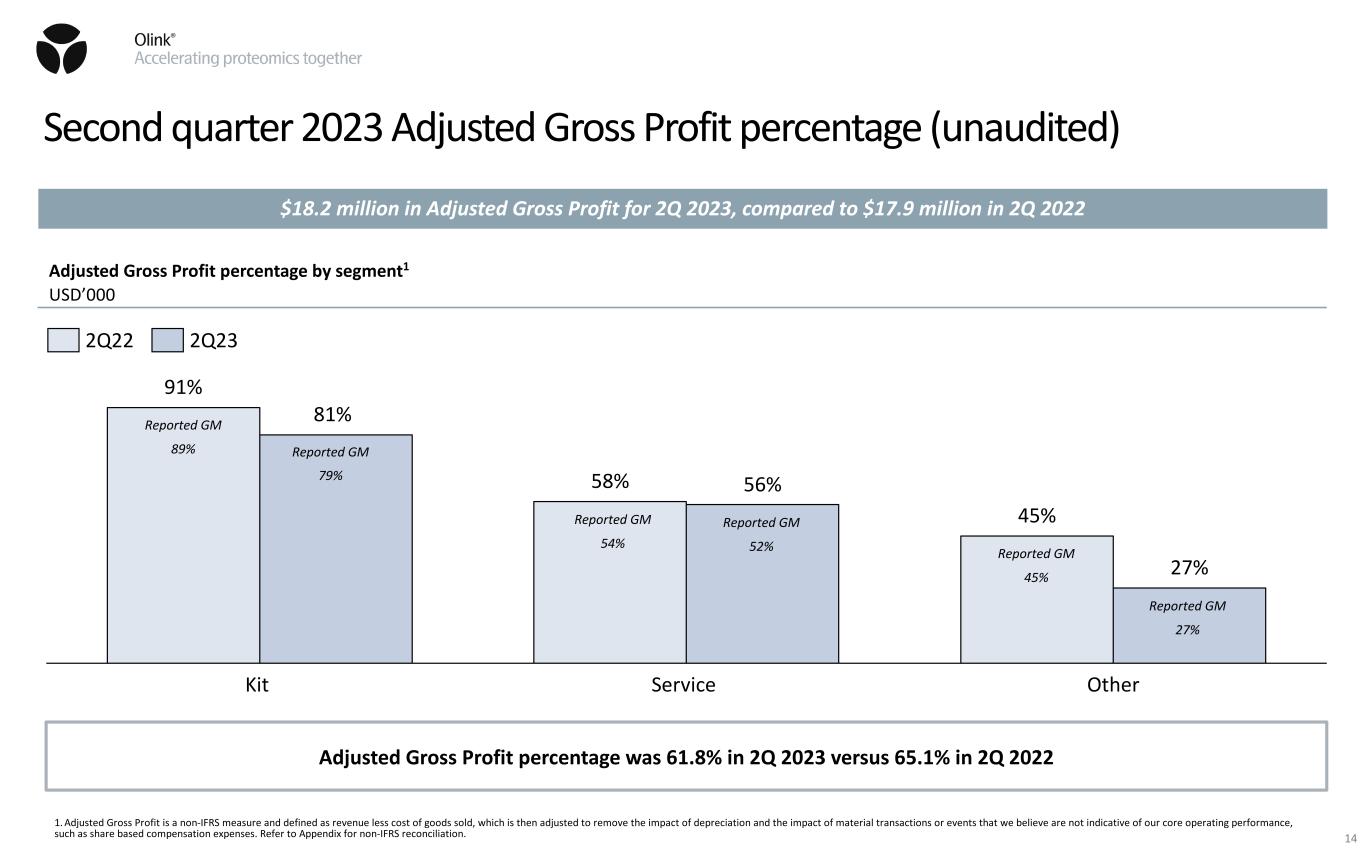
Second quarter 2023 Adjusted Gross Profit percentage (unaudited) 1. Adjusted Gross Profit is a non-IFRS measure and defined as revenue less cost of goods sold, which is then adjusted to remove the impact of depreciation and the impact of material transactions or events that we believe are not indicative of our core operating performance, such as share based compensation expenses. Refer to Appendix for non-IFRS reconciliation. $18.2 million in Adjusted Gross Profit for 2Q 2023, compared to $17.9 million in 2Q 2022 Adjusted Gross Profit percentage was 61.8% in 2Q 2023 versus 65.1% in 2Q 2022 Adjusted Gross Profit percentage by segment1 USD’000 91% 58% 45% 81% 56% 27% Kit OtherService 2Q22 2Q23 Reported GM 89% Reported GM 79% Reported GM 54% Reported GM 52% Reported GM 45% Reported GM 27% 14
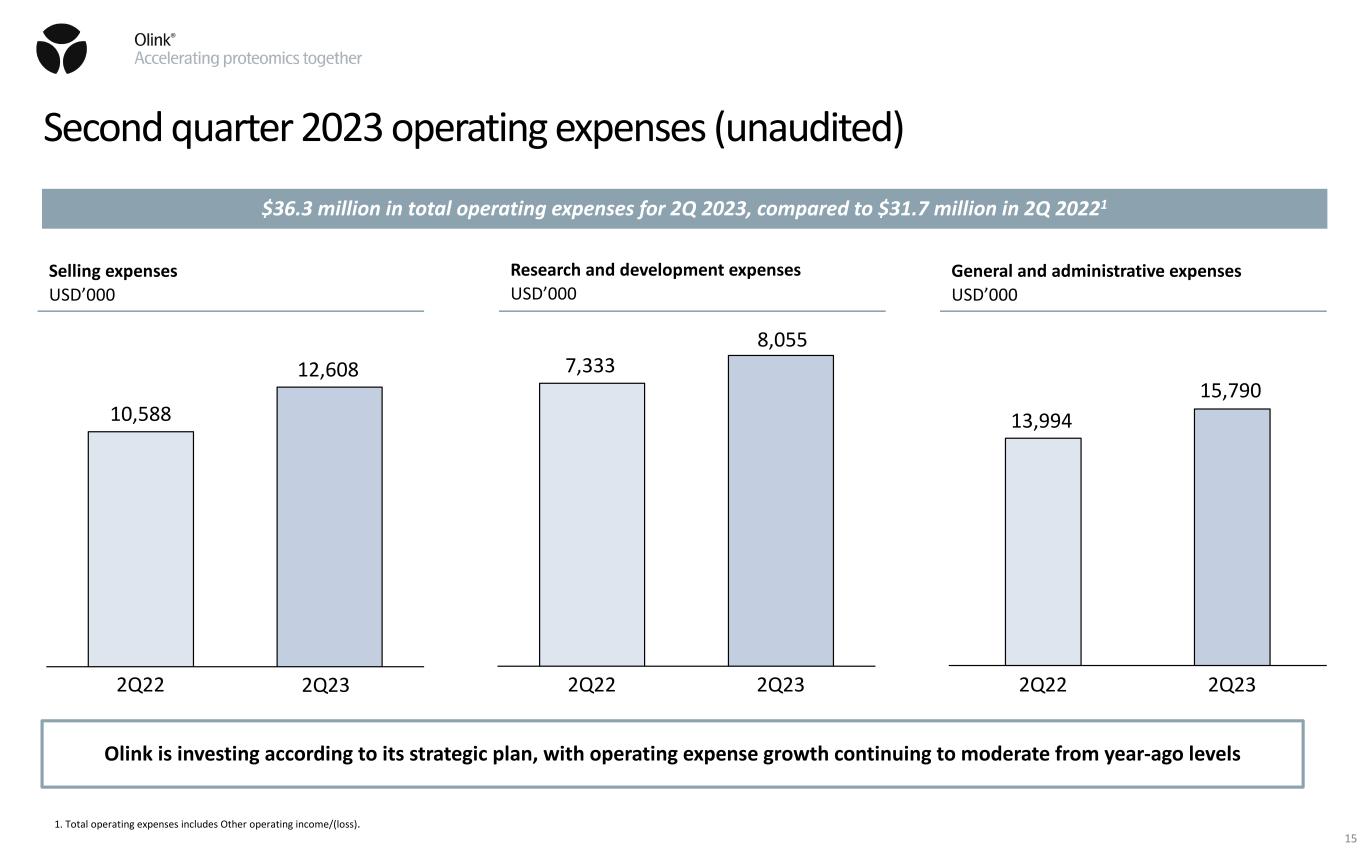
Second quarter 2023 operating expenses (unaudited) $36.3 million in total operating expenses for 2Q 2023, compared to $31.7 million in 2Q 20221 Olink is investing according to its strategic plan, with operating expense growth continuing to moderate from year-ago levels Selling expenses USD’000 10,588 12,608 2Q22 Research and development expenses USD’000 7,333 8,055 2Q22 2Q23 General and administrative expenses USD’000 13,994 15,790 2Q232Q22 1. Total operating expenses includes Other operating income/(loss). 2Q23 15
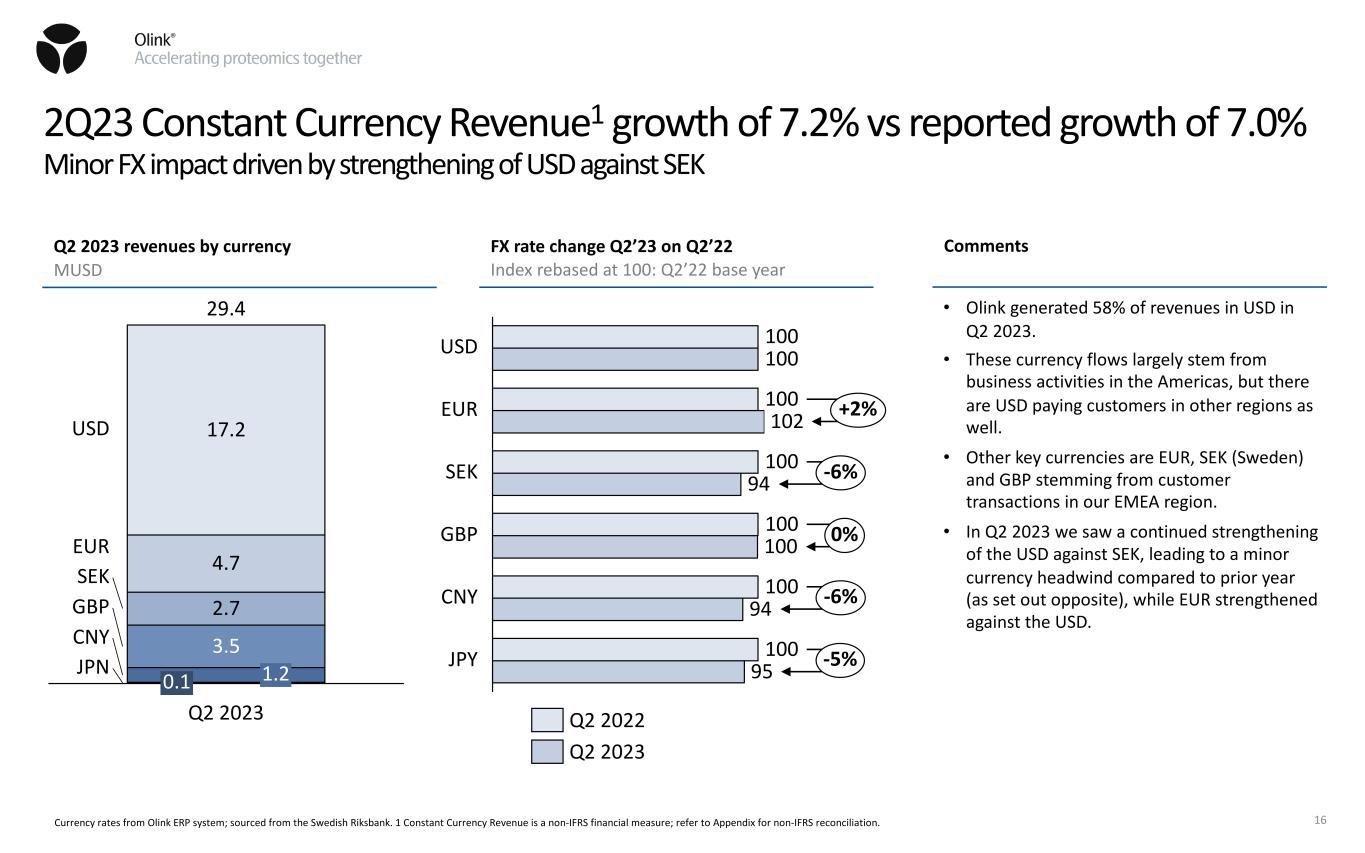
2Q23 Constant Currency Revenue1 growth of 7.2% vs reported growth of 7.0% Minor FX impact driven by strengthening of USD against SEK 16 Q2 2023 revenues by currency MUSD FX rate change Q2’23 on Q2’22 Index rebased at 100: Q2’22 base year 3.5 2.7 4.7 17.2 0.1 USD 1.2 Q2 2023 EUR SEK GBP CNY JPN 29.4 Comments • Olink generated 58% of revenues in USD in Q2 2023. • These currency flows largely stem from business activities in the Americas, but there are USD paying customers in other regions as well. • Other key currencies are EUR, SEK (Sweden) and GBP stemming from customer transactions in our EMEA region. • In Q2 2023 we saw a continued strengthening of the USD against SEK, leading to a minor currency headwind compared to prior year (as set out opposite), while EUR strengthened against the USD. 100 100 100 100 100 100 100 102 94 100 94 95 GBP SEK JPY USD EUR CNY +2% -6% 0% -6% -5% Q2 2023 Q2 2022 Currency rates from Olink ERP system; sourced from the Swedish Riksbank. 1 Constant Currency Revenue is a non-IFRS financial measure; refer to Appendix for non-IFRS reconciliation.
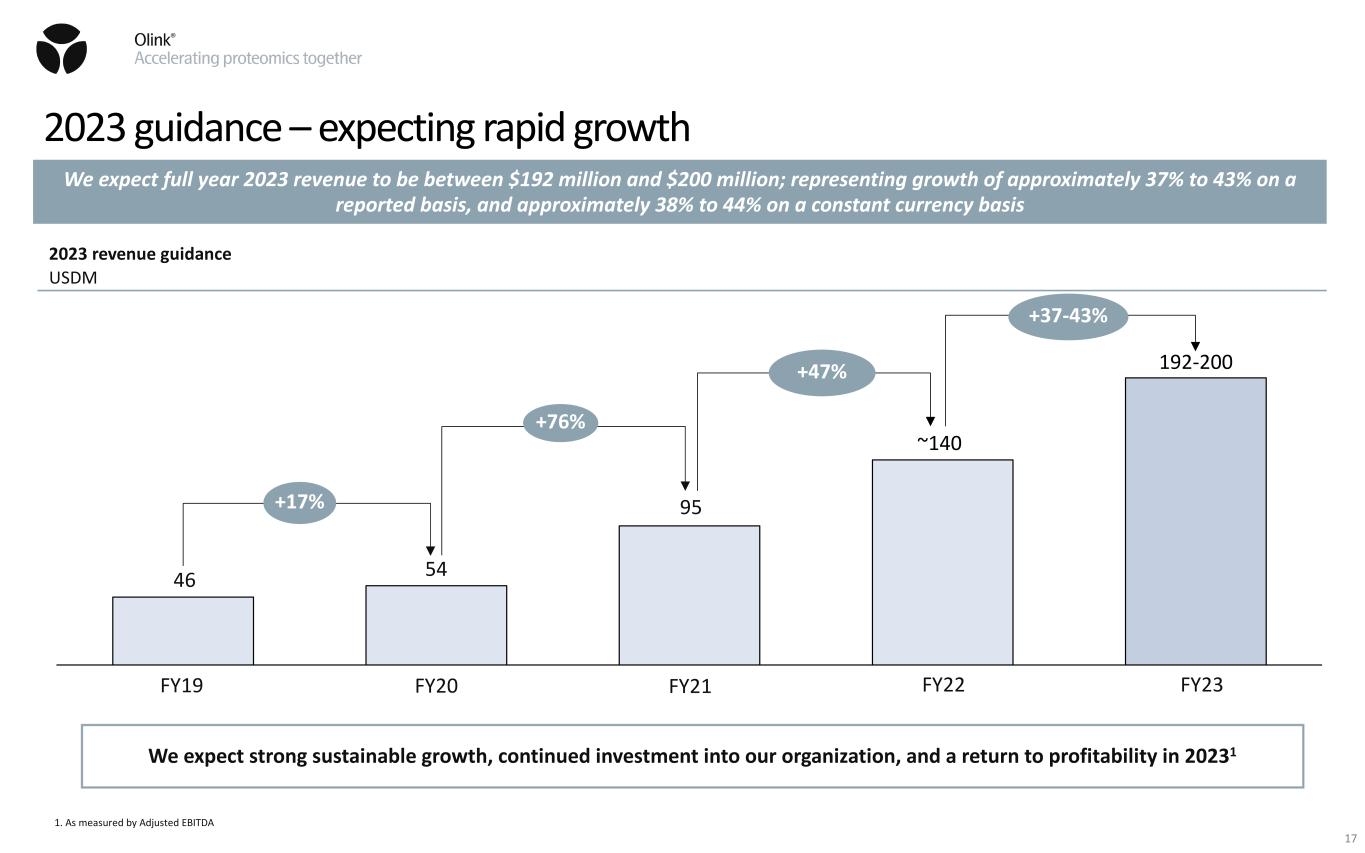
2023 guidance – expecting rapid growth We expect full year 2023 revenue to be between $192 million and $200 million; representing growth of approximately 37% to 43% on a reported basis, and approximately 38% to 44% on a constant currency basis We expect strong sustainable growth, continued investment into our organization, and a return to profitability in 20231 2023 revenue guidance USDM 46 54 95 ~140 192-200 FY19 FY20 FY21 FY22 +17% +76% +47% 17 FY23 +37-43% 1. As measured by Adjusted EBITDA

A complete picture of real-time human biology Genomics ProteomicsEpigenomics Transcriptomics Metabolomics Accelerating proteomics together Our mission Enable understanding of real-time human biology Our vision
Non-IFRS reconciliations 19 We present certain non-IFRS financial measures because they are used by our management to evaluate our operating performance and formulate business plans. We believe that the use of these non-IFRS measures facilitates investors’ assessment of our operating performance. We caution readers that amounts presented in accordance with our definitions of adjusted EBITDA, adjusted gross profit, adjusted gross profit margin, adjusted gross profit margin by segment, and constant currency revenue growth, may not be the same as similar measures used by other companies. Not all companies and Wall Street analysts calculate the non-IFRS measures we use in the same manner. We compensate for these limitations by reconciling each of these non-IFRS measures to the nearest IFRS performance measure, which should be considered when evaluating our performance. We encourage you to review our financial information in its entirety and not rely on a single financial measure. We are not able to forecast constant currency revenue on a forward-looking basis without unreasonable efforts due to the high variability and difficulty in predicting foreign currency exchange rates and, as a result, are unable to provide a reconciliation to forecasted constant currency revenue.
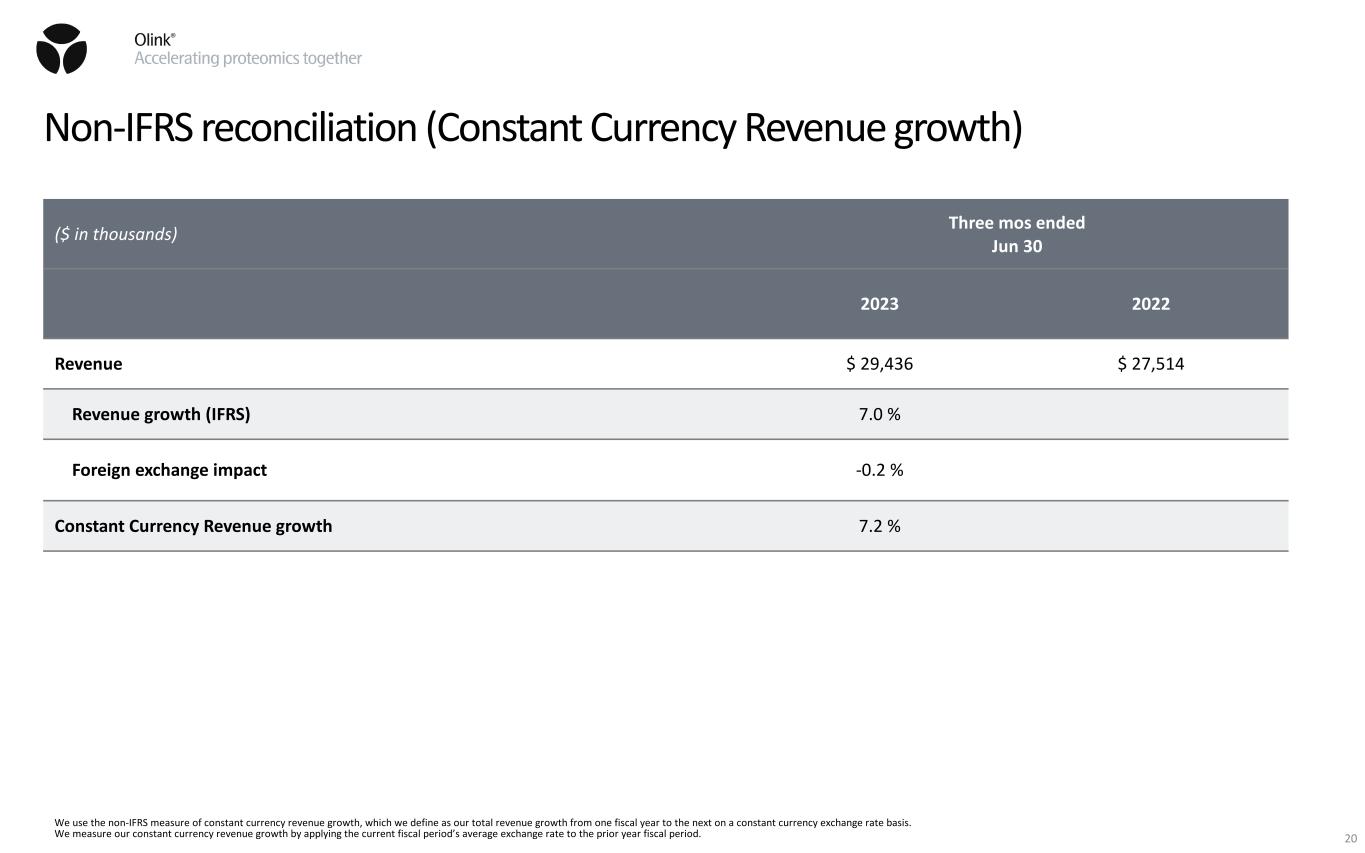
Non-IFRS reconciliation (Constant Currency Revenue growth) 20 ($ in thousands) Three mos ended Jun 30 2023 2022 Revenue $ 29,436 $ 27,514 Revenue growth (IFRS) 7.0 % Foreign exchange impact -0.2 % Constant Currency Revenue growth 7.2 % We use the non-IFRS measure of constant currency revenue growth, which we define as our total revenue growth from one fiscal year to the next on a constant currency exchange rate basis. We measure our constant currency revenue growth by applying the current fiscal period’s average exchange rate to the prior year fiscal period.
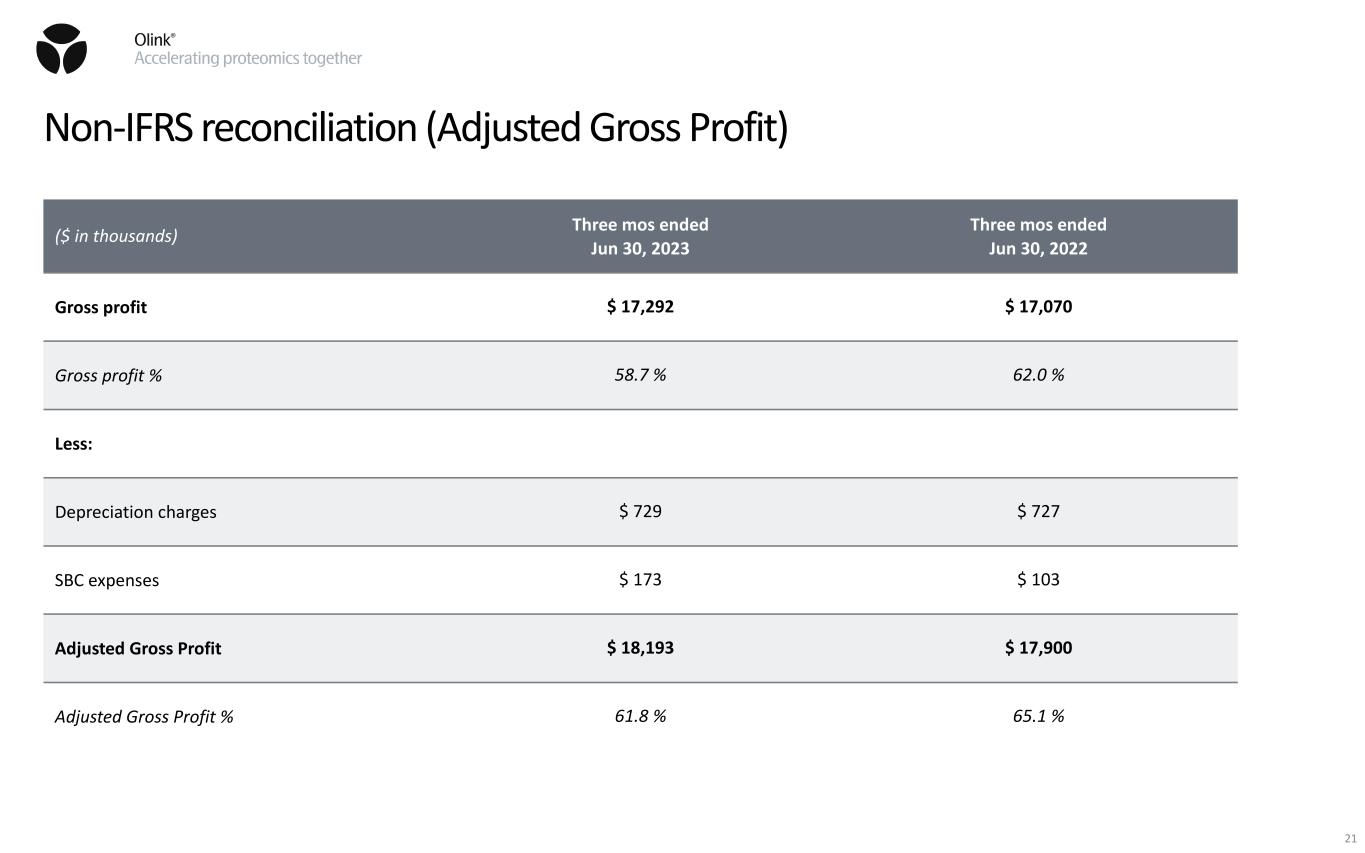
Non-IFRS reconciliation (Adjusted Gross Profit) ($ in thousands) Three mos ended Jun 30, 2023 Three mos ended Jun 30, 2022 Gross profit $ 17,292 $ 17,070 Gross profit % 58.7 % 62.0 % Less: Depreciation charges $ 729 $ 727 SBC expenses $ 173 $ 103 Adjusted Gross Profit $ 18,193 $ 17,900 Adjusted Gross Profit % 61.8 % 65.1 % 21
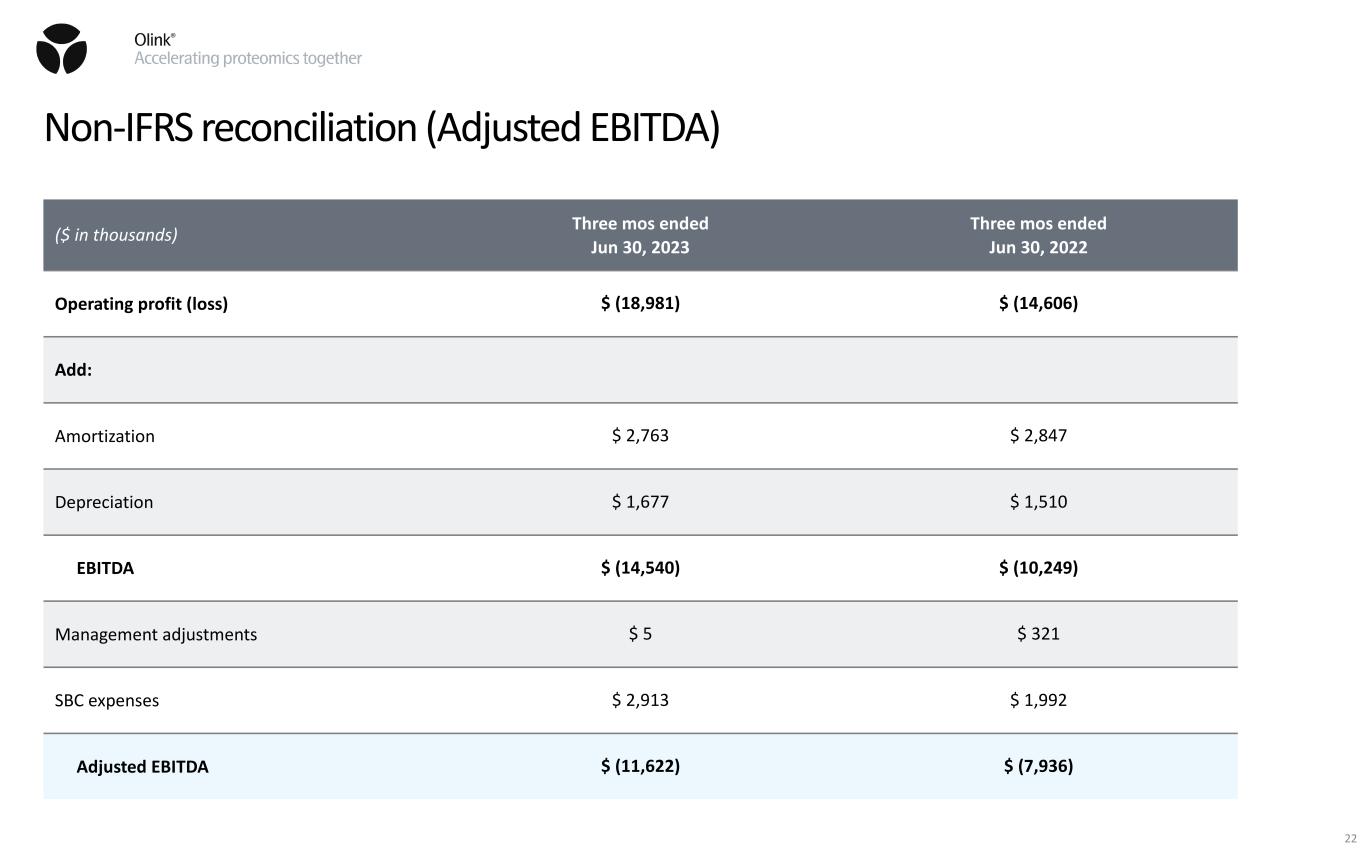
Non-IFRS reconciliation (Adjusted EBITDA) ($ in thousands) Three mos ended Jun 30, 2023 Three mos ended Jun 30, 2022 Operating profit (loss) $ (18,981) $ (14,606) Add: Amortization $ 2,763 $ 2,847 Depreciation $ 1,677 $ 1,510 EBITDA $ (14,540) $ (10,249) Management adjustments $ 5 $ 321 SBC expenses $ 2,913 $ 1,992 Adjusted EBITDA $ (11,622) $ (7,936) 22
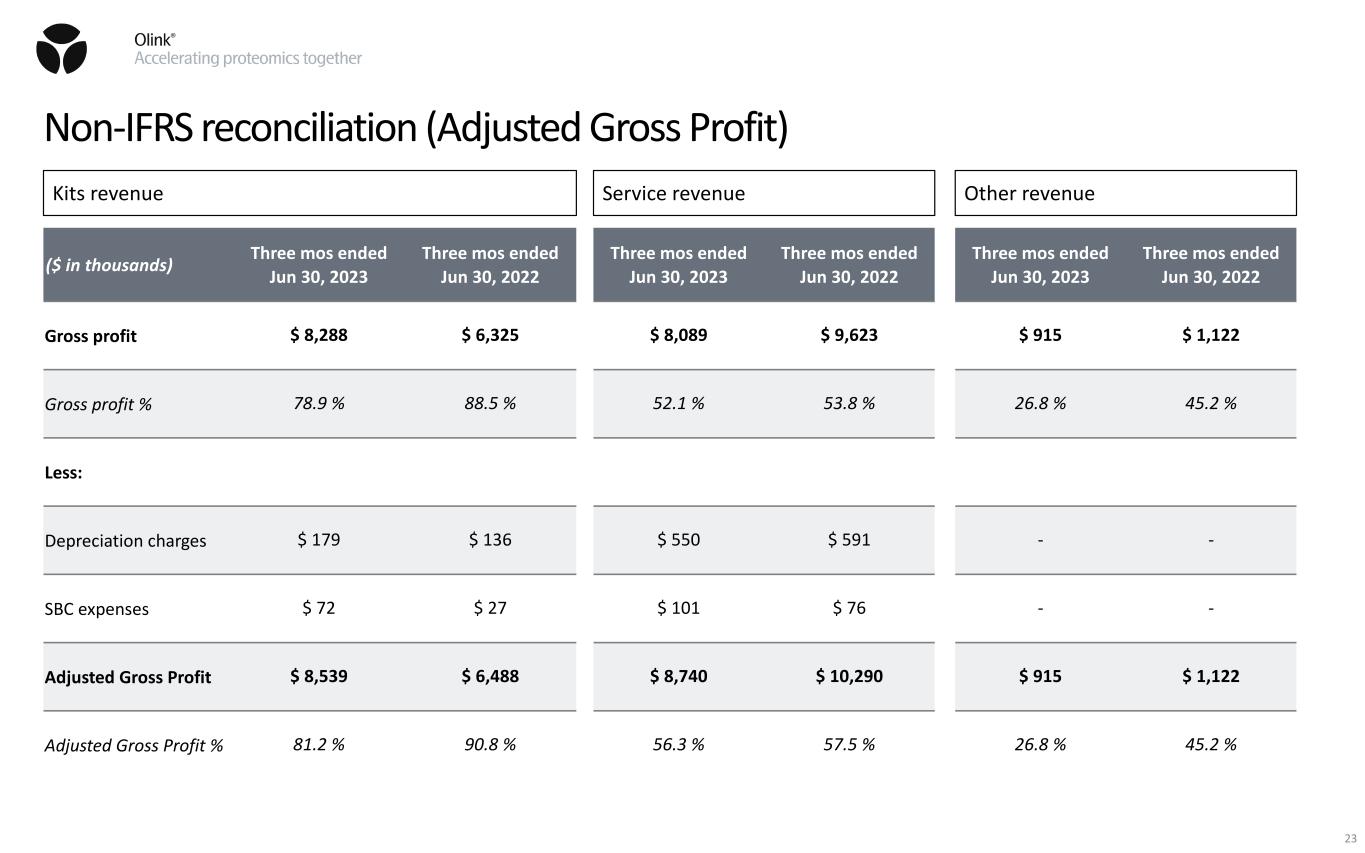
Non-IFRS reconciliation (Adjusted Gross Profit) ($ in thousands) Three mos ended Jun 30, 2023 Three mos ended Jun 30, 2022 Gross profit $ 8,288 $ 6,325 Gross profit % 78.9 % 88.5 % Less: Depreciation charges $ 179 $ 136 SBC expenses $ 72 $ 27 Adjusted Gross Profit $ 8,539 $ 6,488 Adjusted Gross Profit % 81.2 % 90.8 % Three mos ended Jun 30, 2023 Three mos ended Jun 30, 2022 $ 8,089 $ 9,623 52.1 % 53.8 % $ 550 $ 591 $ 101 $ 76 $ 8,740 $ 10,290 56.3 % 57.5 % Three mos ended Jun 30, 2023 Three mos ended Jun 30, 2022 $ 915 $ 1,122 26.8 % 45.2 % - - - - $ 915 $ 1,122 26.8 % 45.2 % Kits revenue Service revenue Other revenue 23


