Exhibit 99.1
INDEX TO THE UNAUDITED CONDENSED CONSOLIDATED FINANCIAL STATEMENTS
MEIHUA INTERNATIONAL MEDICAL TECHNOLOGIES CO., LTD.
UNAUDITED CONDENSED CONSOLIDATED FINANCIAL STATEMENTS
TABLE OF CONTENTS
MEIHUA INTERNATIONAL MEDICAL TECHNOLOGIES CO., LTD.
UNAUDITED CONDENSED CONSOLIDATED BALANCE SHEETS
As of June 30, 2023 and December 31, 2022
(US$, except share data or otherwise noted)
| | | June 30, 2023 | | | December 31, 2022 | |
| | | | | | | |
| Assets | | | | | | |
| Current Assets | | | | | | |
| Cash | | $ | 17,861,214 | | | $ | 26,736,700 | |
| Bank acceptance receivables | | | 18,374,380 | | | | 22,085,846 | |
| Accounts receivable | | | 79,052,428 | | | | 68,945,792 | |
| Inventories | | | 1,647,146 | | | | 1,122,038 | |
| Prepayment and other current assets | | | 15,329,511 | | | | 16,428,779 | |
| Total current assets | | | 132,264,679 | | | | 135,319,155 | |
| | | | | | | | | |
| Property, plant and equipment | | | 8,617,192 | | | | 8,758,047 | |
| Intangible assets | | | 3,876,027 | | | | 497,600 | |
| Investment | | | 5,997,634 | | | | 6,669,655 | |
| Other noncurrent assets | | | 11,856,920 | | | | 12,333,122 | |
| Total assets | | $ | 162,612,452 | | | $ | 163,577,579 | |
| | | | | | | | | |
| Liabilities and shareholders’ equity | | | | | | | | |
| Liabilities | | | | | | | | |
| Current liabilities | | | | | | | | |
| Short-term bank borrowings | | $ | 7,171,128 | | | $ | 6,089,428 | |
| Accounts payable | | | 13,820,348 | | | | 16,096,165 | |
| Taxes payable | | | 1,451,855 | | | | 1,131,276 | |
| Accrued expenses and other current liabilities | | | 778,369 | | | | 856,698 | |
| Total current liabilities | | | 23,221,700 | | | | 24,173,567 | |
| | | | | | | | | |
| Long term loan | | | - | | | | 724,932 | |
| Total liabilities | | | 23,221,700 | | | | 24,898,499 | |
| | | | | | | | | |
| Commitments and contingencies | | | | | | | | |
| Shareholders’ equity | | | | | | | | |
| Ordinary share, $0.0005 par value, 80,000,000 shares authorized, 23,940,000 and 23,940,000 shares issued and outstanding as of June 30, 2023 and December 31, 2022, respectively | | | 11,970 | | | | 11,970 | |
| Preferred share, $0.0005 par value, 20,000,000 shares authorized, no shares issued and outstanding as of as of June 30, 2023 and December 31, 2022 | | | - | | | | - | |
| Additional paid-in capital | | | 42,967,006 | | | | 42,967,006 | |
| Statutory surplus reserves | | | 15,665,860 | | | | 15,665,860 | |
| Retained earnings | | | 90,392,246 | | | | 83,330,239 | |
| Accumulated other comprehensive income (loss) | | | (10,146,195 | ) | | | (3,852,138 | ) |
| Total shareholders’ equity | | | 138,890,887 | | | | 138,122,937 | |
| Non-controlling interest | | | 499,865 | | | | 556,143 | |
| TOTAL EQUITY | | | 139,390,752 | | | | 138,679,080 | |
| | | | | | | | | |
| Total liabilities and shareholders’ equity | | $ | 162,612,452 | | | $ | 163,577,579 | |
The accompanying notes form an integral part of these consolidated financial statements.
MEIHUA INTERNATIONAL MEDICAL TECHNOLOGIES CO., LTD.
UNAUDITED CONDENSED CONSOLIDATED STATEMENTS OF INCOME AND COMPREHENSIVE INCOME
For the six months ended June 30, 2023 and 2022
(US$, except share data or otherwise noted)
| | | For the Six months Ended
June 30, | |
| | | 2023 | | | 2022 | |
| Revenues | | | | | | |
| Third party sales | | $ | 48,178,325 | | | $ | 54,803,181 | |
| Related party sales | | | 11,751 | | | | 29,666 | |
| Total revenues | | | 48,190,076 | | | | 54,832,847 | |
| Cost of revenues | | | 31,019,347 | | | | 33,941,115 | |
| | | | | | | | | |
| Gross profit | | | 17,170,729 | | | | 20,891,732 | |
| | | | | | | | | |
| Operating expenses | | | | | | | | |
| Selling | | | 3,161,070 | | | | 3,311,649 | |
| General and administrative | | | 3,452,610 | | | | 4,799,711 | |
| Research and development | | | 1,460,376 | | | | 1,642,204 | |
| Written-off Tai He deposit | | | - | | | | 2,469,466 | |
| Total operating expenses | | | 8,074,056 | | | | 12,223,030 | |
| | | | | | | | | |
| Income from operations | | | 9,096,673 | | | | 8,668,702 | |
| | | | | | | | | |
| Other (income) expense: | | | | | | | | |
| Interest expense | | | 128,973 | | | | 98,805 | |
| Interest income | | | (361,532 | ) | | | (19,725 | ) |
| Currency exchange gain | | | 119,193 | | | | (449,217 | ) |
| Other expense, net | | | 114,298 | | | | 50,180 | |
| Total other (income) expenses | | | 932 | | | | (319,957 | ) |
| | | | | | | | | |
| Income before income tax provision | | | 9,095,741 | | | | 8,988,659 | |
| Income taxes expense | | | 2,064,212 | | | | 2,433,772 | |
| Net income | | | 7,031,529 | | | $ | 6,554,887 | |
| Net loss attributable to non-controlling interests | | | (30,478 | ) | | | - | |
| Net income attributable to shareholders | | | 7,062,007 | | | | 6,554,887 | |
| | | | | | | | | |
| Foreign currency translation adjustment – gain / (loss) | | | (6,319,857 | ) | | | (6,133,093 | ) |
| Comprehensive (loss) income | | $ | 711,672 | | | $ | 421,794 | |
| Comprehensive loss attributable to non-controlling interests | | | (56,278 | ) | | | - | |
| Comprehensive (loss) income attributable to shareholders | | | 767,950 | | | | 421,794 | |
| | | | | | | | | |
| Weighted average number of ordinary shares - basic and diluted | | | 23,940,000 | | | | 22,873,370 | |
| | | | | | | | | |
| Basic & diluted net income per ordinary share | | $ | 0.29 | | | $ | 0.29 | |
The accompanying notes form an integral part of these consolidated financial statements.
MEIHUA INTERNATIONAL MEDICAL TECHNOLOGIES CO., LTD.
UNAUDITED CONDENSED CONSOLIDATED STATEMENTS OF CHANGES IN SHAREHOLDERS’ EQUITY
For the six months ended June 30, 2023 and 2022
(US$, except share data)
| | | Ordinary
shares | | | Ordinary
shares
amount | | | Additional
paid-in
capital | | | Ordinary
shares
subscribed | | | Statutory
surplus
reserves | | | Retained
earnings | | | Accumulated
other
comprehensive
income (loss) | | | Non-
controlling
interests | | | Total
Equity | |
| Balance as of December 31, 2021 | | | 20,000,000 | | | $ | 10,000 | | | $ | 9,716,484 | | | $ | - | | | $ | 15,178,467 | | | $ | 77,574,663 | | | $ | 5,288,988 | | | | - | | | $ | 107,768,602 | |
| | | | | | | | | | | | | | | | | | | | | | | | | | | | | | | | | | | | | |
| Ordinary shares subscribed | | | 3,940,000 | | | | 1,970 | | | | 33,748,358 | | | | - | | | | - | | | | - | | | | - | | | | - | | | | 33,750,328 | |
| Net income | | | - | | | | - | | | | - | | | | - | | | | - | | | | 6,554,887 | | | | - | | | | - | | | | 6,554,887 | |
| Currency translation adjustment | | | - | | | | - | | | | - | | | | - | | | | - | | | | - | | | | (6,133,093 | ) | | | - | | | | (6,133,093 | ) |
| Balance as of June 30, 2022 | | | 23,940,000 | | | $ | 11,970 | | | $ | 43,464,842 | | | | - | | | $ | 15,178,467 | | | $ | 84,129,550 | | | $ | (844,105 | ) | | | - | | | $ | 141,940,724 | |
| | | | | | | | | | | | | | | | | | | | | | | | | | | | | | | | | | | | | |
| Balance as of December 31, 2022 | | | 23,940,000 | | | $ | 11,970 | | | $ | 42,967,006 | | | | - | | | $ | 15,665,860 | | | $ | 83,330,239 | | | $ | (3,852,138 | ) | | | 556,143 | | | $ | 138,679,080 | |
| Net income | | | - | | | | - | | | | - | | | | - | | | | - | | | | 7,062,007 | | | | - | | | | (30,478 | ) | | | 7,031,529 | |
| Currency translation adjustment | | | - | | | | - | | | | - | | | | - | | | | - | | | | - | | | | (6,294,057 | ) | | | (25,800 | ) | | | (6,319,857 | ) |
| | | | | | | | | | | | | | | | | | | | | | | | | | | | | | | | | | | | | |
| Balance as of June 30, 2023 | | | 23,940,000 | | | | 11,970 | | | | 42,967,006 | | | | - | | | | 15,665,860 | | | | 90,392,246 | | | | (10,146,195 | ) | | | 499,865 | | | | 139,390,752 | |
The accompanying notes form an integral part of these consolidated financial statements.
MEIHUA INTERNATIONAL MEDICAL TECHNOLOGIES CO., LTD.
UNAUDITED CONDENSED CONSOLIDATED STATEMENTS OF CASH FLOWS
For the six months ended June 30, 2023 and 2022
(US$)
| | | For The Six Months Ended June 30, | |
| | | 2023 | | | 2022 | |
| Cash Flows from operating activities: | | | | | | |
| Net income | | $ | 7,031,529 | | | $ | 6,554,887 | |
| Adjustments for items not affecting cash: | | | | | | | | |
| Depreciation | | | 283,484 | | | | 239,597 | |
| Amortization | | | 13,733 | | | | 13,417 | |
| Net loss from disposal of property, plant and equipment | | | 104,572 | | | | - | |
| Written-off Tai He deposit | | | - | | | | 2,469,466 | |
| Deferred tax expenses (benefit) | | | - | | | | (294,567 | ) |
| Currency exchange (gain) loss | | | 119,193 | | | | - | |
| Loss from equity method investments | | | 1,632 | | | | - | |
| Gain from cost method investments | | | (202 | ) | | | - | |
| Changes in operating assets and liabilities: | | | | | | | | |
| Bank acceptance receivables | | | 2,755,706 | | | | (9,730,622 | ) |
| Accounts receivable | | | (14,101,576 | ) | | | 3,472,261 | |
| Inventories | | | (606,934 | ) | | | (7,197 | ) |
| Prepayments and other assets | | | 178,920 | | | | (5,268,377 | ) |
| Due from related parties | | | - | | | | (33,523 | ) |
| Accounts payable | | | (1,559,255 | ) | | | (4,851,578 | ) |
| Taxes payable | | | 393,343 | | | | (285,556 | ) |
| Accrued expenses and other current liabilities | | | (38,714 | ) | | | (64,985 | ) |
| Advance from customers | | | - | | | | (12,039 | ) |
| Net cash used in operating activities | | | (5,424,569 | ) | | | (7,798,816 | ) |
| | | | | | | | | |
| Cash flows from investing activities: | | | | | | | | |
| Purchases of property, plant and equipment | | | (1,001,925 | ) | | | (459,163 | ) |
| Additions to intangible assets | | | (3,581,058 | ) | | | - | |
| Proceeds from disposal of property, plant and equipment | | | 355,993 | | | | - | |
| Proceeds from disposal of long-term investment | | | 360,839 | | | | - | |
| Net cash used in investing activities | | | (3,866,151 | ) | | | (459,163 | ) |
| | | | | | | | | |
| Cash flows from financing activities: | | | | | | | | |
| Proceeds from short-term bank borrowings | | | 5,340,415 | | | | 3,549,857 | |
| Repayments of short-term bank borrowings | | | (4,618,738 | ) | | | (2,932,491 | ) |
| Shareholder contribution | | | - | | | | 34,527,480 | |
| Net cash provided by financing activities | | | 721,677 | | | | 35,144,846 | |
| | | | | | | | | |
| Effect of foreign exchange rate changes | | | (306,443 | ) | | | (370,615 | ) |
| Net increase (decrease) in cash | | | (8,875,486 | ) | | | 26,516,252 | |
| Cash, beginning of year | | | 26,736,700 | | | | 8,149,276 | |
| Cash, end of year | | $ | 17,861,214 | | | $ | 34,665,528 | |
| | | | | | | | | |
| SUPPLEMENTAL DISCLOSURE OF CASH FLOWS INFORMATION: | | | | | | | | |
| Cash paid during the period for: | | | | | | | | |
| Cash paid for income tax | | $ | 2,313,417 | | | $ | 2,956,643 | |
| Cash paid for interest | | $ | 128,973 | | | $ | 98,804 | |
| | | | | | | | | |
| Non-cash transactions | | | | | | | | |
| Shareholder contribution through deferred cost | | | - | | | | 1,277,152 | |
The accompanying notes form an integral part of these consolidated financial statements.
MEIHUA INTERNATIONAL MEDICAL TECHNOLOGIES CO., LTD.
NOTES TO UNAUDITED CONDENSED CONSOLIDATED FINANCIAL STATEMENTS
1. Organization and principal activities
Principal Activities:
Meihua International Medical Technologies Co., Ltd. (“Meihua”) was incorporated on November 10, 2020 in the Cayman Islands. Meihua is a holding company with no operations. Meihua produces and sells medical consumables through its wholly owned subsidiaries located in People’s Republic of China (“PRC” or “China”). Below is Meihua’s organizational chart, as well as a description of the ownership structure.
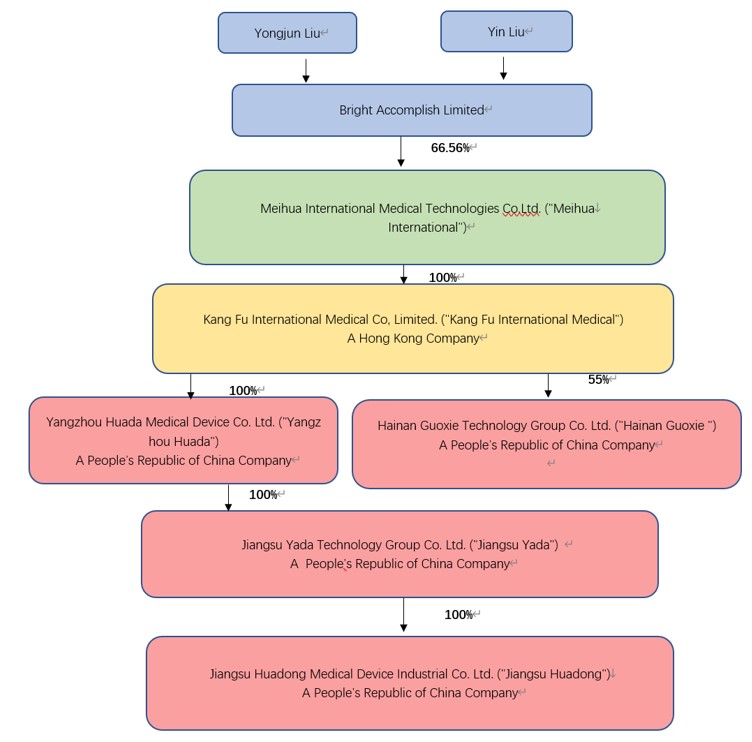
Entity Name | | Registered
Location | | Percentage
of
ownership | | Date of
incorporation | | Principal
activities |
| Meihua International Medical Technologies Co., Ltd. (“Meihua”) | | Cayman | | Parent | | November 10, 2020 | | Investment holding |
| | | | | | | | | |
康复国际医疗有限公司
Kang Fu International Medical Co., Limited (“Kang Fu”) | | Hong Kong | | 100% by Meihua | | October 13, 2015 | | Investment holding |
| | | | | | | | | |
扬州华达医疗器械有限公司
Yangzhou Huada Medical Equipment Co., Ltd. (“Huada”) | | Yangzhou | | 100% by Kang Fu | | December 24, 2001 | | Medical Equipment Sales |
| | | | | | | | | |
江苏亚达科技集团有限公司
Jiangsu Yada Technology Group Co., Ltd. (“Yada”) | | Yangzhou | | 100% by Huada | | December 5, 1991 | | Medical Equipment Sales |
| | | | | | | | | |
江苏华东医疗器械实业有限公司
Jiangsu Huadong Medical Device Industry Co., Ltd. (“Huadong”) | | Yangzhou | | 100% by Yada | | November 18, 2000 | | Medical Equipment Sales |
| | | | | | | | | |
扬州光辉医疗科技有限公司*
Yangzhou Guanghui Medical Technology Co., Ltd. (“Guanghui”) | | Yangzhou | | 100% by Huadong | | December 22, 2020 | | Medical Equipment Sales |
| | | | | | | | | |
海南国械医疗科技有限公司
Hainan GuoxieTechnology Group Co. Ltd. (“Hainan Guoxie”) | | Hainan | | 55% by Kang Fu | | October 07, 2021 | | Medical Equipment Sales |
Kang Fu was incorporated on October 13, 2015 with a registered capital of HKD 53,911,815 ($6,911,771). Kang Fu is a holding company with no operations. The following operating entities (Huada, Yada and Huadong) are all directly and indirectly 100% owned by Kang Fu for all the periods presented.
Huada is a subsidiary wholly owned by Kang Fu and established in Yangzhou, China on December 24, 2001 with a registered capital of $17,193,021.
Yada is a subsidiary wholly owned by Huada and was established in Yangzhou, China on December 5, 1991 with a registered capital of RMB51,390,000.
Huadong is a subsidiary wholly owned by Yada and was established in Yangzhou, China on November 18, 2000 with a registered capital of RMB50,000,000.
Those three subsidiaries primarily manufacture and sell Class I, II and III disposable medical devices under the Company’s own brands, and distribute Class I, II and III disposable medical devices sourced from other manufacturers to our domestic and overseas customers.
Guanghui was a subsidiary wholly owned by Huadong and was dissolved on June 1, 2023.
Hainan Guoxie is a subsidiary 55% owned by Kang Fu and established in Hainan, China on October 07, 2021 with a registered capital of RMB100,000,000.
2. Summary of Significant Accounting Policies
Basis of Presentation
The accompanying unaudited condensed consolidated financial statements have been prepared in accordance with accounting principles generally accepted in the United States of America (“U.S. GAAP”) pursuant to the rules and regulations of the Securities Exchange Commission (“SEC”). The interim results of operations are not necessarily indicative of results to be expected for any other interim period or for a full year. In the opinion of management, all adjustments, consisting only of normal recurring adjustments, considered necessary for a fair presentation of its financial position and operating results have been included. These financial statements should be read in conjunction with the Company’s audited consolidated financial statements and the related notes thereto for the fiscal years ended December 31, 2022 and 2021.
Use of Estimates
The preparation of unaudited condensed consolidated financial statements in conformity with U.S. GAAP requires management to make certain estimates and assumptions that affect the amounts reported and disclosed in the consolidated financial statements and related notes.
The most significant estimates and judgments include allowance for bad debts and the valuation of inventory. Actual amounts could differ from those estimates.
Non-controlling interests
Non-controlling interest represents the portion of the net assets of subsidiaries attributable to interests that are not owned or controlled by the Company. The non-controlling interest is presented in the consolidated balance sheets, separately from equity attributable to the shareholders of the Company. Non-controlling interest’s operating results are presented on the face of the consolidated statements of income and comprehensive income as an allocation of the total income for the year between non-controlling shareholders and the shareholders of the Company. As of June 30, 2023, non-controlling interests represent one non-controlling shareholders’ proportionate share of equity interests in Hainan Guoxie.
Functional Currency and Foreign Currency Translation
The Company’s reporting currency is the United States dollar (“US$”). The Company’s operations are principally conducted through the PRC subsidiaries where the local currency is the functional currency. Therefore, the functional currency of Kang Fu is the Hong Kong dollar and the functional currency of Huada, Yada, Huadong and Guanghui is the Renminbi (“RMB”).
Transactions denominated in currencies other than the functional currencies are translated into the functional currency of the entity at the exchange rates prevailing on the transaction dates. Monetary assets and liabilities denominated in currencies other than the applicable functional currency are translated into the functional currency at the prevailing rates of exchange at the balance date. The resulting exchange differences are reported in the consolidated statements of income and comprehensive income.
The assets and liabilities of the Company are translated at the exchange spot rate at the balance sheet date, stockholders’ equity is translated at the historical rates and the revenues and expenses are translated at the average exchange rates for the periods, except that the exchange rate used for translation from Hong Kong dollar to US$ was 7.8000, a pegged rate determined by the linked exchange rate system in Hong Kong. This pegged rate was used to translate Kang Fu’s balance sheets, income statement items and cash flow items for both the six months ended June 30, 2023 and 2022. The resulting translation adjustments are reported under other comprehensive income in the consolidated statements of income and comprehensive income in accordance with Financial Accounting Standards Board (“FASB”) Accounting Standards Codification (“ASC”) 220, Comprehensive Income. The following are the exchange rates that were used in translating the Company’s PRC subsidiaries’ financial statements into the consolidated financial statements:
| | | June 30, 2023 | | December 31, 2022 | | June 30, 2022 |
| | | | | | | |
| Period-end spot rate | | US$1=RMB 7.2513 | | US$1=RMB 6.8972 | | US$1=RMB 6.6981 |
| | | | | | | |
| Average rate | | US$1=RMB 6.9283 | | US$1=RMB 6.7290 | | US$1=RMB 6.4791 |
Certain Risks and Concentration
The Company’s financial instruments that potentially subject the Company to significant concentrations of credit risk consist primarily of cash and receivables. As of six months ended June 30, 2023 and December 31, 2022 substantially all the Company’s cash were held in major financial institutions located in Hong Kong and the PRC, which management considers to be of high credit quality.
For the six months ended June 30, 2023, two customers accounted for approximately 18.18% and 10.01% of the Company’s total revenues. For the six months ended June 30, 2022, two customers accounted for approximately 32.53% and 11.25% of the Company’s total revenues.
As of June 30, 2023, two customers accounted for approximately 30.92% and 21.31% of the Company’s accounts receivable. As of December 31, 2022, two customers accounted for approximately 27.73% and 13.14% respectively, of the Company’s accounts receivable.
For the six months ended June 30, 2023, one supplier accounted for approximately 14.73% of the Company’s total purchases. As of six months ended June 30, 2022, there was no supplier that individually represented greater than 10% of the total purchase of the Company’s total purchases.
Fair Value Measurement
Fair value is the price that would be received from selling an asset or paid to transfer a liability in an orderly transaction between market participants at the measurement date. When determining the fair value measurements for assets and liabilities required or permitted to be recorded at fair value, the Company considers the principal or most advantageous market in which it would transact, and it considers assumptions that market participants would use when pricing the asset or liability.
The Company adopted the guidance of Accounting Standards Codification (“ASC”) 820 for fair value measurements which clarifies the definition of fair value, prescribes methods for measuring fair value, and establishes a fair value hierarchy to classify the inputs used in measuring fair value as follows:
| | Level 1: | Inputs are unadjusted quoted prices in active markets for identical assets or liabilities available at the measurement date. |
| | | |
| | Level 2: | Inputs are unadjusted quoted prices for similar assets and liabilities in active markets, quoted prices for identical or similar assets and liabilities in markets that are not active, inputs other than quoted prices that are observable, and inputs derived from or corroborated by observable market data. |
| | | |
| | Level 3: | Inputs are unobservable inputs which reflect the reporting entity’s own assumptions on what assumptions the market participants would use in pricing the asset or liability based on the best available information. |
The Company’s financial instruments include cash, accounts receivable, bank acceptance receivables, due from related parties, accounts payable, other liabilities and accrued expenses and short-term bank borrowings. The carrying amounts approximate their fair values due to their short maturities as of June 30, 2023 and December 31, 2022.
The Company noted no transfers between levels during any of the periods presented. The Company did not have any instruments that were measured at fair value on a recurring or non-recurring basis as of June 30, 2023 and December 31, 2022.
Cash
Cash consists of petty cash on hand and cash held in banks, which are highly liquid and are unrestricted as to withdrawal or use.
Bank Acceptance Receivables
Bank acceptance receivables are issued by bank under the request of the Company’s customers, to pay for the purchased goods. The Company can choose to hold acceptance notes until maturity and receive the face value payment from the bank, or sell (exchange) the acceptance notes at a discount to another party willing to wait until maturity to receive the bank’s promised payment. The maturity date of the receivables is all within one year of the original issuance date and carried at face value. The Company is not lending money, it just sells goods to the customers (customers can pay the purchased goods by cash, accounts receivable or bank acceptance receivables). The receivables mature within one year, and are non-interest bearing. As bank acceptance receivables are issued by the banks and payments are guaranteed. The Company has not discounted any bank acceptances and there were no endorsed bank acceptances that are unmatured as of June 30, 2023. The Company collected approximately $6.0 million as of August 31, 2023.
Accounts Receivable and Allowance for Doubtful Accounts
Accounts receivable represent trade receivables and are recognized initially at fair value and subsequently adjusted for any allowance for doubtful accounts or impairment.
The Company follows the guidance under ASC 326, Financial Instruments – Credit Losses, Measurement of Credit Losses on Financial Instruments. The standard uses a new forward-looking “methodology that reflects expected credit losses and requires consideration of a broader range of reasonable and supportable information to inform credit loss estimates.” The Company has adopted the loss rate methodology to estimate historical losses on accounts receivables. The Company has adopted the aging methodology to estimate the credit losses on accounts receivables. The historical data is adjusted to account for forecasted changes in the macroeconomic environment in order to calculate the current expected credit loss. The provision is recorded against accounts receivables balances, with a corresponding charge recorded in the consolidated statements of operations and comprehensive income.
The Company historically has not had material bad debts in accounts receivable. There were no bad debt expenses related to accounts receivable for six months ended June 30, 2023 and 2022, and there was no provision for doubtful accounts as of June 30, 2023 and December 31, 2022.
Inventories
Inventories are valued using the lower of cost or net realizable value. Cost is principally determined using the weighted-average method. Manufactured inventories included cost of materials, labor and overhead expenses. The Company records adjustments to inventory for excess quantities, obsolescence, or impairment, when appropriate, to reflect inventory at net realizable value. These adjustments are based upon a combination of factors including current sales volume, market conditions, lower of cost or market analysis and expected realizable value of the inventory.
There were no write-downs recognized of inventories as of June 30, 2023 and December 31, 2022.
Prepayment and other current assets
As of June 30, 2023 and December 31, 2022, prepayment and other current assets were $15,329,511 and $16,428,779.
Prepayment and other assets primarily consist of prepayments for land use right and property, refundable tax credits and receivables, security deposits made to customers, advances to employees, which are presented net of allowance for doubtful accounts. These balances are unsecured and are reviewed periodically to determine whether their carrying value has become impaired. The Company considers the balances to be impaired if the utilization or refund of the balances becomes doubtful. The Company uses the aging method to estimate the allowance for uncollectible balances. The allowance is also based on management’s best estimate of specific losses on individual exposures, as well as a provision on historical trends of collections and utilizations. Actual amounts received or utilized may differ from management’s estimate of credit worthiness and the economic environment. Delinquent account balances are written off against allowance for doubtful accounts after management has determined that the likelihood of collection is not probable. The allowance for doubtful accounts amounted to nil as of June 30, 2023 and December 31, 2022.
Property, Plant and Equipment
Property, plant and equipment items are recorded at their historic cost, less accumulated depreciation and impairment losses. The Company calculates depreciation using the straight-line method, after consideration of the estimated residual values, over the following estimated useful lives:
| Category | | Useful lives | | Estimated
residual
value | |
| Buildings | | 20 years | | | 10 | % |
| Machinery and Equipment | | 10 years | | | 10 | % |
| Motor vehicles | | 5 years | | | 10 | % |
| Electronic Equipment | | 5 years | | | 10 | % |
| Office Equipment | | 3 years | | | 10 | % |
| Inspection Equipment | | 5 years | | | 10 | % |
Major improvements are capitalized and expenditures for maintenance and repairs are expensed as incurred. Construction in progress represents property, plant and equipment under construction or being installed. Costs include original cost, installation, construction and other direct costs. Interest expenses directly related to construction in progress would be capitalized. Construction in progress is transferred to the appropriate fixed asset account and depreciation commences when the asset has been substantially completed and placed in service.
Intangible Assets
Intangible assets are non-monetary assets without physical substance. These items are initially measured at cost and subsequently carried at cost less any accumulated amortization and impairment losses. Intangible assets with finite useful lives are amortized on a straight-line basis over their estimated useful lives. Amortization of finite-lived intangible assets is computed using the straight-line method over the estimated useful lives, which is as follows:
| Category | | Useful lives |
| Land use rights | | 50 years |
| Patent | | 5 years |
| Trademark | | 10 years |
Impairment of Long-Lived Assets
The Company accounts for impairment of long-lived assets in accordance with Accounting Standards Codification (“ASC”) 360, Property, Plant and Equipment. (“ASC 360”). Long-lived assets consist primarily of property, plant and equipment, and intangible assets. In accordance with ASC 360, the Company evaluates the carrying value of long-lived assets when it determines a triggering event has occurred, or whenever events or changes in circumstances indicate that the carrying amount of an asset may not be recoverable. When indicators exist, recoverability of assets is measured by a comparison of the carrying value of the asset group to the estimated undiscounted future net cash flows expected to be generated by the asset. Examples of such triggering events include a significant disposal of a portion of such assets, and adverse change in the market involving the business employing the related assets. If such assets are determined not to be recoverable, the Company performs an analysis of the fair value of the asset group and will recognize an impairment loss when the fair value is less than the carrying amounts of such assets. The fair value, based on reasonable and supportable assumptions and projections, require subjective judgments. Depending on the assumptions and estimates used, the appraised fair value projected in the evaluation of long-lived assets can vary within a range of outcomes. The Company considers the likelihood of possible outcomes in determining the best estimate for the fair value of the assets. The Company did not record any impairment charges for the six months ended June 30, 2023 and 2022. There can be no assurance that future events will not have impact on company revenue or financial position which could result in impairment in the future.
Investment
In accordance with Financial Accounting Standards Board (“FASB”) ASC 321, “Investment-Equity Securities,” the Company accounts for non-marketable securities on a prospective basis. Equity investments that do not have readily determinable fair values and do not qualify for the net asset value practical expedient are eligible for the measurement alternative.
On March 3, 2011, Yada invested in Yangzhou Juyuan Guarantee Co., Ltd (“Juyuan”) and obtained 12% equity interest of Juyuan. For the Company’s passive and without significant influence or control equity investment in private company which do not have readily determinable fair values, the Company has elected the measurement alternative defined as cost, less impairment, plus or minus adjustments resulting from observable price changes in orderly transactions for the identical or a similar investment of the Company. The investment is reviewed periodically to determine if its value has been impaired and adjustments are recorded as necessary in profit or loss for the period. On January 5, 2023, majority shareholder of Juyuan purchased 5% equity interest of Juyuan from Yada for a consideration of $360,839 (RMB 2.5 million).
Investments in entities in which the Company can exercise significant influence but does not own a majority equity interest or control are accounted for using the equity method of accounting in accordance with ASC 323, Investments-Equity Method and Joint Ventures (“ASC 323”). Under the equity method, the Company initially records its investment at cost and the difference between the cost of the equity investee and the amount of the underlying equity in the net assets of the equity investee is accounted for as if the investee were a consolidated subsidiary. The share of earnings or losses of the investee are recognized in the consolidated statements of comprehensive loss. Equity method adjustments include the Company’s proportionate share of investee income or loss, adjustments to recognize certain differences between the Company’s carrying value and its equity in net assets of the investee at the date of investment, impairments, and other adjustments required by the equity method. The Company assesses its equity investment for other-than-temporary impairment by considering factors as well as all relevant and available information including, but not limited to, current economic and market conditions, the operating performance of the investees including current earnings trends, the general market conditions in the investee’s industry or geographic area, factors related to the investee’s ability to remain in business, such as the investee’s liquidity, debt ratios, and cash burn rate and other company-specific information.
Investments in equity securities without readily determinable fair values are measured at cost minus impairment adjusted by observable price changes in orderly transactions for the identical or a similar investment of the same issuer. These investments are measured at fair value on a nonrecurring basis when there are events or changes in circumstances that may have a significant adverse effect. An impairment loss is recognized in the consolidated statements of comprehensive loss equal to the amount by which the carrying value exceeds the fair value of the investment. Prior to the adoption of ASU 2016-01 on January 1, 2019, these investments were accounted for using the cost method of accounting, measured at cost less other-than-temporary impairment.
On December 1, 2022, Huadong invested RMB 40 million into Jiangsu Zhongxiangxin International Science and Technology Innovation Park Co., Ltd. (“Zhongxiangxin”), and obtained 25% ownership interest of Zhongxiangxin. Zhongxiangxin manufactures and sells medical materials in the PRC. The Company accounted for the investments using equity method, because the Company has significant influence but does not own a majority equity interest or otherwise control over the equity investee. Under the equity method, the Company adjusts the carrying amount of the investment and recognizes investment income or loss for its share of the earnings or loss of the investee after the date of investment. When the Company’s share of losses in the equity investee equals or exceeds its interest in the equity investee, the Company does not recognize further losses, unless the Company has incurred obligations or made payments or guarantees on behalf of the equity investee. For the six months ended June 30, 2023 and 2022, the investment loss from Zhongxiangxin was $1,632 and nil.
The Company continually reviews its investments in equity investees to determine whether a decline in fair value below the carrying value is other-than-temporary. The primary factors the Company considers in its determination include the financial condition, operating performance and the prospects of the equity investee; other company specific information such as recent financing rounds; the geographic region, market and industry in which the equity investee operates; and the length of time that the fair value of the investment is below its carrying value. If the decline in fair value is deemed to be other-than-temporary, the carrying value of the equity investee is written down to fair value.
For the for the six months ended June 30, 2023 and 2022, no impairment indicators were identified of its investment in the private company was no impairment recorded.
Value-added Tax
Value-added taxes (“VAT”) collected from customers relating to product sales and remitted to governmental authorities are presented on a net basis. VAT collected from customers is excluded from revenue which is recorded in VAT payable. The Company is subject to a VAT rate of 13%. The VAT payable may be offset by VAT paid by the Company on raw materials and other materials included in the cost of producing or acquiring its finished products.
Related Parties
Parties are considered to be related to the Company if the parties, directly or indirectly, through one or more intermediaries, control, are controlled by, or are under common control with the Company. Related parties also include principal owners of the Company, its management, members of the immediate families of principal owners of the Company and its management and other parties with which the Company may deal with if one party controls or can significantly influence the management or operating policies of the other to an extent that one of the transacting parties might be prevented from fully pursuing its own separate interests. The Company discloses all significant related party transactions.
Revenue Recognition
Based on the requirements of ASC Topic 606, the Company recognizes revenue when control of the promised goods or services is transferred to the customers in an amount that reflects the consideration the Company expects to be entitled to receive in exchange for those goods or services. The Company primarily sells its products to hospitals and medical equipment companies. Revenue is recognized when the following 5-step revenue recognition criteria are met:
| 1) | Identify the contract with a customer |
| 2) | Identify the performance obligations in the contract |
| 3) | Determine the transaction price |
| 4) | Allocate the transaction price |
| 5) | Recognize revenue when or as the entity satisfies a performance obligation |
Revenue from product sales is recognized at the point in time control of the products is transferred, generally upon customer receipt based upon the standard contract terms. Shipping and handling activities are considered to be fulfillment activities rather than promised services and are not, therefore, considered to be separate performance obligations. The Company’s sales terms provide no right of return outside of a standard quality policy and returns are generally not significant. Payment terms for product sales are generally set at 90 to 180 days after customer acceptance of the product.
Revenue Disaggregation
The Company’s disaggregated revenues are represented by two categories which are type of goods and type of customers.
Type of Goods
| | | For The Six Months Ended
June 30, | |
| | | 2023 | | | 2022 | |
| | | US$ | | | US$ | |
| Self-Manufactured Products | | | 23,435,544 | | | | 27,046,663 | |
| Resales of Sourced Disposable Medical Devices from Third Party Manufacturers | | | 24,754,532 | | | | 27,786,184 | |
| Total Revenue | | | 48,190,076 | | | | 54,832,847 | |
Type of Customers
| | | For The Six Months Ended
June 30, | |
| | | 2023 | | | 2022 | |
| | | US$ | | | US$ | |
| Direct sales | | | 4,305,506 | | | | 4,582,321 | |
| Distributors | | | 43,884,570 | | | | 50,250,526 | |
| Total Revenue | | | 48,190,076 | | | | 54,832,847 | |
Earnings per Ordinary Share
Earnings (loss) per ordinary share is calculated in accordance with ASC 260, Earnings per Share. Basic earnings (loss) per ordinary share is computed by dividing the net income (loss) attributable to shareholders of the Company by the weighted average number of ordinary shares outstanding during the year. Diluted earnings per ordinary share is computed in accordance with the treasury stock method and based on the weighted average number of ordinary shares and dilutive ordinary share equivalents. Dilutive ordinary share equivalents are excluded from the computation of diluted earnings per ordinary share if their effects would be anti-dilutive. There is no ordinary share equivalent issued to date.
Comprehensive Income (Loss)
ASC 220, Comprehensive Income (“ASC 220”) establishes rules for reporting and display of comprehensive income and its components. ASC 220 requires that unrealized gains and losses on the Company’s foreign currency translation adjustments be included in comprehensive income (loss).
Advertising Costs
The Company’s advertising costs are expensed as incurred. Advertising expenses are included in selling expenses in the accompanying consolidated statements of income and comprehensive income. Advertising expenses were $8,275, and $7,603 for the six months ended June 30, 2023, and 2022, respectively.
Research and Development Costs
Research and development expenses are expensed as incurred. Research and development expenses were $1,460,376 and $1,642,204 for the six months ended June 30, 2023, and 2022, respectively.
Income Tax
Current income taxes are provided on the basis of net profit for financial reporting purposes, adjusted for income and expense items which are not assessable or deductible for income tax purposes, in accordance with the regulations of the relevant tax jurisdictions.
Deferred income taxes are recognized for temporary differences between the tax bases of assets and liabilities and their reported amounts in the consolidated financial statements, net operating loss carry forwards and credits. Deferred tax assets are reduced by a valuation allowance when, in the opinion of management, it is more likely than not that some portion or all of the deferred tax assets will not be realized. Current income taxes are provided in accordance with the laws of the relevant taxing authorities. Deferred tax assets and liabilities are measured using enacted rates expected to apply to taxable income in which temporary differences are expected to be reversed or settled. The effect on deferred tax assets and liabilities of changes in tax rates is recognized in the statement of comprehensive income in the period of the enactment of the change.
The Company considers positive and negative evidence when determining whether a portion or all of its deferred tax assets will more likely than not be realized. This assessment considers, among other matters, the nature, frequency and severity of current and cumulative losses, forecasts of future profitability, the duration of statutory carry-forward periods, its experience with tax attributes expiring unused, and its tax planning strategies. The ultimate realization of deferred tax assets is dependent upon its ability to generate sufficient future taxable income within the carry-forward periods provided for in the tax law and during the periods in which the temporary differences become deductible. When assessing the realization of deferred tax assets, the Company has considered possible sources of taxable income including (i) future reversals of existing taxable temporary differences, (ii) future taxable income exclusive of reversing temporary differences and carryforwards, (iii) future taxable income arising from implementing tax planning strategies, and (iv) specific known trend of profits expected to be reflected within the industry.
The Company recognizes a tax benefit associated with an uncertain tax position when, in its judgment, it is more likely than not that the position will be sustained upon examination by a taxing authority. For a tax position that meets the more-likely-than-not recognition threshold, the Company initially and subsequently measures the tax benefit as the largest amount that the Company judges to have a greater than 50% likelihood of being realized upon ultimate settlement with a taxing authority. The Company’s liability associated with unrecognized tax benefits is adjusted periodically due to changing circumstances, such as the progress of tax audits, case law developments and new or emerging legislation. Such adjustments are recognized entirely in the period in which they are identified. The Company’s effective tax rate includes the net impact of changes in the liability for unrecognized tax benefits and subsequent adjustments as considered appropriate by management. The Company classifies interest and penalties recognized on the liability for unrecognized tax benefits as income tax expense.
Segment Reporting
FASB ASC 280, “Segment Reporting,” establishes standards for reporting information about operating segments on a basis consistent with the Company’s internal organizational structure as well as information of the Company’s business segments, geographical areas, segments and major customers. The Company uses the “management approach” in determining reportable operating segments. The management approach considers the internal organization and reporting used by the Company’s chief operating decision maker for making operating decisions and assessing performance as the source for determining the Company’s reportable segments. The chief operating decision maker is the Company’s president and Chief Executive Officer (“CEO”). Management, including the chief operating decision maker, reviews operating results of different products at revenue level with no allocation of operating costs. Consequently, based on management’s assessment, the Company has determined that it has only one operating segment as defined by FASB ASC 280.
The Company has disclosed the type of revenue by government category as follows.
| | | June 30, 2023 | | | June 30, 2022 | |
| | | US$ | | | US$ | |
| Category | | Produced | | | Purchased | | | Total | | | Produced | | | Purchased | | | Total | |
| Class I | | | 3,561,156 | | | | 4,462,704 | | | | 8,023,860 | | | | 3,812,092 | | | | 3,845,205 | | | | 7,657,297 | |
| Class II | | | 17,313,377 | | | | 17,761,970 | | | | 35,075,347 | | | | 20,185,052 | | | | 19,712,006 | | | | 39,897,058 | |
| Class III | | | 524,802 | | | | 873,575 | | | | 1,398,377 | | | | 416,595 | | | | 1,168,221 | | | | 1,584,816 | |
| Others | | | 2,036,209 | | | | 1,656,283 | | | | 3,692,492 | | | | 2,632,924 | | | | 3,060,752 | | | | 5,693,676 | |
| Total | | | 23,435,544 | | | | 24,754,532 | | | | 48,190,076 | | | | 27,046,663 | | | | 27,786,184 | | | | 54,832,847 | |
Class I, II, and III medical devices are defined by the National Medical Products Administration of China according to their risk levels under the Regulation on the Supervision and Administration of Medical Devices (2021 Revision), Article 6 as follows:
| ● | “Class I Medical Devices” means medical devices with low risks, whose safety and effectiveness can be ensured through routine administration. |
| ● | “Class II Medical Devices” means medical devices with moderate risks, which shall be strictly controlled and administered to ensure their safety and effectiveness. |
| ● | “Class III Medical Devices” means medical devices with relatively high risks, which shall be strictly controlled and administered through special measures to ensure their safety and effectiveness. |
Furthermore, the Company has disclosed revenue by major product type included in each government category.
| | | | | June 30, 2023 | | | June 30, 2022 | |
| Category | | Products | | US$ | | | US$ | |
| Class I | | Eye drops bottle | | | 1,073,853 | | | | 1,346,164 | |
| | | Oral medicine bottle | | | 1,830,363 | | | | 2,189,018 | |
| | | Anal bag | | | 849,099 | | | | 395,292 | |
| | | Other Class I | | | 4,270,545 | | | | 3,726,823 | |
| Subtotal-Class I | | | | | 8,023,860 | | | | 7,657,297 | |
| Class II | | Masks | | | 47,946 | | | | 211,468 | |
| | | Identification tape | | | 5,494,306 | | | | 7,218,564 | |
| | | Disposable medical brush | | | 4,481,601 | | | | 4,606,634 | |
| | | Gynecological inspection kits | | | 3,022,727 | | | | 5,807,398 | |
| | | Surgical kit | | | 2,206,201 | | | | 13,546,908 | |
| | | Medical brush | | | 2,809,448 | | | | 2,586,945 | |
| | | Medical kit | | | 983,584 | | | | 883,977 | |
| | | Other Class II | | | 16,029,534 | | | | 5,035,164 | |
| Subtotal-Class II | | | | | 35,075,347 | | | | 39,897,058 | |
| Class III | | Electronic pump | | | 138,751 | | | | 67,866 | |
| | | Anesthesia puncture kit | | | 229,616 | | | | 205,218 | |
| | | Disposable infusion pump | | | 113,335 | | | | 78,453 | |
| | | Infusion pump | | | 178,461 | | | | 90,036 | |
| | | Electronic infusion pump | | | 330 | | | | 43,397 | |
| | | Laparoscopic trocar | | | 38 | | | | 94,337 | |
| | | Other Class III | | | 737,846 | | | | 1,005,509 | |
| Subtotal-Class III | | | | | 1,398,377 | | | | 1,584,816 | |
| Others | | | | | 3,692,492 | | | | 5,693,676 | |
| Total | | | | | 48,190,076 | | | | 54,832,847 | |
For the six months ended June 30, 2023, and 2022, revenues and assets within PRC contributed over 99.1% of the Company’s total revenues and assets.
The Outbreak of COVID-19
On January 30, 2020, the World Health Organization declared the outbreak of the coronavirus disease (COVID-19) a “Public Health Emergency of International Concern,” and on March 11, 2020, the World Health Organization characterized the outbreak as a “pandemic.” COVID-19 has had a severe and negative impact on the Chinese and the global economy and such impact persists as of the date of this annual report.
In fiscal year 2020, COVID-19 had a significant impact on our business and results of operations as the sales volume of masks rose sharply while the sales of products other than masks declined due to an overall decrease in market demand. In fiscal year 2021, with the stable control of the domestic epidemic in China, the market of masks was no longer in urgent shortage compared to the same period in 2020, and the production of epidemic prevention products resumed more normal production levels. In general, with the precise control of the epidemic in China, our production and operations have recovered smoothly, and the demand for other products has increased gradually. After the initial outbreak of COVID-19, from time to time, some instances of COVID-19 infections have emerged in various regions of China, including the infections caused by the Omicron variants in 2022. For example, a wave of infections caused by the Omicron variants emerged in Shanghai in 2022, and a series of restrictions and quarantines were implemented to contain the spread.
Many of the restrictive measures previously adopted by the PRC governments at various levels to control the spread of the COVID-19 virus have been revoked or replaced with more flexible measures since December 2022. While the revocation or replacement of the restrictive measures to contain the COVID-19 pandemic could have a positive impact on our normal operations, the extent of the impact on the Company’s future financial results will be dependent on future developments such as the length and severity of the crisis, the potential resurgence of the crisis, future government actions in response to the crisis and the overall impact of the COVID-19 pandemic on the global economy and capital markets, among many other factors, all of which remain highly uncertain and unpredictable. Given this uncertainty, the Company is currently unable to quantify the expected impact of the COVID-19 pandemic on its future operations, financial condition, liquidity and results of operations if the current situation continues.
Recently Issued Accounting Standards
In October 2021, the FASB issued ASU No. 2021-08, “‘Business Combinations (Topic 805): Accounting for Contract Assets and Contract Liabilities from Contracts with Customers” (“ASU 2021-08”). This ASU requires entities to apply Topic 606 to recognize and measure contract assets and contract liabilities in a business combination. The amendments improve comparability after the business combination by providing consistent recognition and measurement guidance for revenue contracts with customers acquired in a business combination and revenue contracts with customers not acquired in a business combination. The amendments are effective for the Company beginning after December 15, 2023, and are applied prospectively to business combinations that occur after the effective date. The Company does not expect the adoption of ASU 2021-04 will have a material effect on the consolidated financial statements.
In June 2022, the FASB issued ASU 2022-03 Fair Value Measurement (Topic 820): Fair Value Measurement of Equity Securities Subject to Contractual Sale Restrictions. The update clarifies that a contractual restriction on the sale of an equity security is not considered part of the unit of account of the equity security and, therefore, is not considered in measuring fair value. The update also clarifies that an entity cannot, as a separate unit of account, recognize and measure a contractual sale restriction. The update also requires certain additional disclosures for equity securities subject to contractual sale restrictions. For public business entities, the amendments in this Update are effective for fiscal years beginning after December 15, 2023, and interim periods within those fiscal years. For all other entities, the amendments are effective for fiscal years beginning after December 15, 2024, and interim periods within those fiscal years. Early adoption is permitted for both interim and annual financial statements that have not yet been issued or made available for issuance. As an emerging growth company, the standard is effective for the Company for the year ended December 31, 2025. The Company is in the process of evaluating the impact of the new guidance on its consolidated financial statements.
3. Prepayments and other assets
Prepayments and other current assets consist of the following:
| | | June 30, 2023 | | | December 31, 2022 | |
| | | US$ | | | US$ | |
| Other receivable | | | 159,817 | | | | 239,148 | |
| Prepaid tax | | | - | | | | 250,410 | |
| Prepaid for land use right (1) | | | 15,169,694 | | | | 15,948,501 | |
| Prepaid for property (2) | | | 11,856,920 | | | | 12,323,842 | |
| Total | | | 27,186,431 | | | | 28,761,901 | |
| Less: non-current portion | | | (11,856,920 | ) | | | (12,333,122 | ) |
| Prepayments and other current assets | | | 15,329,511 | | | | 16,428,779 | |
| (1) | On October 22, 2018, the Company signed a land use right agreement with the government of Touqiao Town, Yangzhou City and paid RMB 50 million ($6.9 million) and RMB 60 million ($8.27 million), respectively, in 2018 and 2019 according to the agreement. As a result of COVID-19, the land use right had not been transferred to the Company as scheduled. Both parties agreed to cancel the transaction and the funds prepaid for land use right will be returned to the Company before December 31, 2023. |
| (2) | On April 20, 2020, the Company signed a factory building purchase agreement with Jiangsu Qionghua Group Co., Ltd. and paid deposit of RMB 85 million ($11.72 million). As a result of COVID-19, the factory building had not been completed as scheduled. Both parties agreed to cancel the transaction and that the deposit for the building would be returned to the Company on or before December 31, 2025, with such deposit accumulating interest at an annual interest rate of 3.5%. |
4. Inventories
Inventories consist of the following:
| | | June 30, 2023 | | | December 31, 2021 | |
| | | US$ | | | US$ | |
| Raw material | | | 493,143 | | | | 177,474 | |
| Work-in-process | | | 20,501 | | | | 343,795 | |
| Finished goods | | | 977,974 | | | | 560,119 | |
| Goods in transit | | | 95,814 | | | | | |
| Low-value consumables | | | 59,714 | | | | 40,650 | |
| Total | | | 1,647,146 | | | | 1,122,038 | |
For the six months ended June 30, 2023 and 2022, there were no writes-down of inventories.
5. Intangible Assets
Intangible assets consisted of the following:
| | | June 30, 2023 | | | December 31, 2022 | |
| | | US$ | | | US$ | |
| Land use rights | | | 4,134,521 | | | | 752,887 | |
| Patents | | | 27,582 | | | | 28,997 | |
| Software | | | 12,113 | | | | 9,424 | |
| Trademarks | | | 115,836 | | | | 121,789 | |
| Total | | | 4,290,052 | | | | 913,097 | |
| Less: accumulated amortization | | | 414,025 | | | | 415,497 | |
| Intangible assets, net | | | 3,876,027 | | | | 497,600 | |
Amortization expense was $13,733 and $13,417 for the six months ended June 30, 2023 and 2022, respectively. Hainan Guoxie spent $3.4 million in purchasing land use right for the six months ended June 30, 2023 and the price was fully paid. The land will be used for manufacturing facility.
The following table sets forth the Company’s amortization expenses for the twelve months ending December 31 of the following years:
| 2023 | | $ | 41,870 | |
| 2024 | | | 83,740 | |
| 2025 | | | 83,740 | |
| 2026 | | | 82,953 | |
| 2027 | | | 82,690 | |
| Thereafter | | | 3,501,034 | |
| | | $ | 3,876,027 | |
As of June 30, 2023 and December 31, 2022, the Company pledged land use rights to secure bank borrowings to the Company as disclosed in Note 7.
6. Investment
On March 3, 2011, Yada invested RMB 6 million into Yangzhou Juyuan Guarantee Co., Ltd. (“Juyuan”) and obtained 12% equity interest of Juyuan. Juyuan mainly provides financing guarantee services and relevant consulting services to customers. Juyuan has only one executive director and one supervisor. Neither the executive director nor supervisor is related to Yada. Therefore, Yada has neither control nor significant influence over Juyuan. For the Company’s passive and without significant influence or control equity investment in a private company which does not have readily determinable fair values, the Company has elected the measurement alternative defined as cost, less impairment, plus or minus adjustments resulting from observable price changes in orderly transactions for the identical or a similar investment of the same issuer. On January 5, 2023, majority shareholder of Juyuan purchased 5% equity interest of Juyuan from Yada for a consideration of $360,839(RMB 2.5 million). The carrying value of the investment amounted to approximately $0.5 million as of June 30, 2023.
On December 1, 2022, Huadong invested RMB40 million into Zhongxiangxin, and obtained 25% ownership interest of Zhongxiangxin. Zhongxiangxin manufactures and sells medical materials in the PRC. The Company accounted for the investments using the equity method, because the Company has significant influence but does not own a majority equity interest or otherwise control over the equity investee. Under the equity method, the Company adjusts the carrying amount of the investment and recognizes investment income or loss for its share of the earnings or loss of the investee after the date of investment. When the Company’s share of losses in the equity investee equals or exceeds its interest in the equity investee, the Company does not recognize further losses, unless the Company has incurred obligations or made payments or guarantees on behalf of the equity investee. For the six months ended June 30, 2023 and 2022, the investment loss from Zhongxiangxin was $1,632 and $nil.
For the six months ended June 30, 2023 and 2022, no impairment indicators were identified related to revaluation of its investment in the private company was recorded.
7. Bank Borrowings
Bank borrowings are working capital loans from banks in China. Short-term bank borrowings as of June 30, 2023 consisted of the following:
| Lender | | Company | | Rate | | | Issuance
Date | | Expiration
Date | | Amount-
RMB | | | Amount-
US$ | |
| Bank of Communications | | Huadong | | | 3.55 | % | | 1/18/2023 | | 5/25/2024 | | | 4,000,000 | | | | 551,625 | |
| Bank of Communications | | Huadong | | | 3.50 | % | | 11/3/2022 | | 4/25/2024 | | | 5,000,000 | | | | 689,532 | |
| Agricultural Bank of China | | Huadong | | | 3.60 | % | | 8/12/2022 | | 7/12/2023 | | | 9,000,000 | | | | 1,241,157 | |
| Jiangsu Yangzhou Rural Commercial Bank | | Huadong | | | 3.95 | % | | 1/30/2023 | | 2/15/2024 | | | 5,000,000 | | | | 689,532 | |
| Bank of China | | Huadong | | | 3.80 | % | | 3/10/2023 | | 3/9/2024 | | | 10,000,000 | | | | 1,379,063 | |
| Agricultural Bank of China | | Yada | | | 3.60 | % | | 12/8/2022 | | 12/6/2023 | | | 10,000,000 | | | | 1,379,063 | |
| Industrial and Commercial Bank of China* | | Yada | | | 3.45 | % | | 2/17/2022 | | 2/16/2024 | | | 9,000,000 | | | | 1,241,156 | |
| Total | | | | | | | | | | | | | 52,000,000 | | | | 7,171,128 | |
Short-term bank borrowings as of December 31, 2022 consisted of the following:
| Lender | | Company | | Rate | | | Issuance
Date | | Expiration
Date | | Amount-
RMB | | | Amount-
US$ | |
| Bank of Communications | | Huadong | | | 3.55 | % | | 3/9/2022 | | 1/19/2023* | | | 4,000,000 | | | | 579,946 | |
| Agricultural Bank of China | | Huadong | | | 3.40 | % | | 12/8/2022 | | 12/7/2023* | | | 9,000,000 | | | | 1,304,877 | |
| Jiangsu Yangzhou Rural Commercial Bank | | Huadong | | | 3.95 | % | | 2/17/2022 | | 3/2/2023* | | | 5,000,000 | | | | 724,932 | |
| Bank of China | | Huadong | | | 3.55 | % | | 3/9/2022 | | 1/19/2023* | | | 5,000,000 | | | | 724,932 | |
| Agricultural Bank of China | | Yada | | | 3.60 | % | | 12/8/2022 | | 12/6/2023* | | | 10,000,000 | | | | 1,449,864 | |
| Industrial and Commercial Bank of China | | Yada | | | 3.70 | % | | 2/18/2022 | | 2/21/2023* | | | 9,000,000 | | | | 1,304,877 | |
| Total | | | | | | | | | | | | | 42,000,000 | | | | 6,089,428 | |
| * | These loans were renewed upon maturity. |
Interest expense was $128,973, and $98,805 for the six months ended June 30, 2023 and 2022, respectively.
The Company’s short-term bank borrowings are pledged by the Company’s assets and guaranteed by the Company’s major shareholders Yongjun Liu, Yin Liu and its subsidiary Yada.
The carrying values of the Company’s pledged assets to secure short-term borrowings by the Company are as follows:
| | | June 30, 2023 | | | December 31,
2022 | |
| | | US$ | | | US$ | |
| Buildings, net | | | 3,432,150 | | | | 2,777,379 | |
| Land use right, net | | | 90,322 | | | | 96,416 | |
| Total | | | 3,522,472 | | | | 2,873,795 | |
8. Long-term bank loan
There was no long-term bank loan as of June 30, 2023.
Long-term bank borrowings as of December 31, 2022 consisted of the following:
| Lender | | Company | | Rate | | | Issuance
Date | | Expiration
Date | | Amount-
RMB | | | Amount-
US$ | |
| Bank of Communications | | Huadong | | | 3.50 | % | | 11/3/2022 | | 4/25/2024 | | | 5,000,000 | | | | 724,932 | |
| Total | | | | | | | | | | | | | 5,000,000 | | | | 724,932 | |
On November 3, 2022, the Company signed a loan agreement with Bank of Communications to obtain a two-year loan of RMB5 million ($724,932). The loan bears a floating interest rate of a benchmark rate (3.50%). Huada mortgages the property and land for guaranteed repayment of the loan. The principal shall be repaid on April 25, 2024. The balance was reclassified to short-term bank loan as of June 30, 2023.
9. Taxes Payable
Taxes payable consisted of the following:
| | | June 30, 2023 | | | December 31,
2022 | |
| | | US$ | | | US$ | |
| VAT payable | | | 368,195 | | | | 380,926 | |
| Income tax payable | | | 1,012,775 | | | | 690,824 | |
| Other tax payable | | | 71,348 | | | | 59,526 | |
| Total | | | 1,452,318 | | | | 1,131,276 | |
10. Income Taxes
Cayman Islands
Under the current laws of the Cayman Islands, the Company is not subject to tax on income or capital gain. Additionally, upon payments of dividends to the shareholders, no Cayman Islands withholding tax is imposed.
Hong Kong
Under the current Hong Kong Inland Revenue Ordinance, the Company’s Hong Kong subsidiary, Kang Fu, is subject to 16.5% income tax on its taxable income generated from operations in Hong Kong. On December 29, 2017, the Hong Kong government announced a two-tiered profit tax rate regime. Under the two-tiered tax rate regime, the first HK$2.0 million earned in assessable profits will be subject to an 8.25% lower tax rate and the remaining taxable income will continue to be taxed at the existing 16.5% tax rate. The two-tiered tax regime becomes effective from the assessment year of 2018 and 2019, which is on or after April 1, 2018. The application of the two-tiered rates is restricted to only one nominated enterprise among connected entities. Kang Fu has been nominated by the Company as the entity to apply the two-tiered rates among the group for the assessment years of 2023 and 2022.
PRC
Provisions for income tax are as follows:
| | | June 30, 2023 | | | June 30,
2022 | |
| | | US$ | | | US$ | |
| Provisions for current income tax | | | 2,064,697 | | | | 2,433,772 | |
| Provisions for deferred income tax | | | - | | | | - | |
| Total | | | 2,064,697 | | | | 2,433,772 | |
The following is a reconciliation of the Company’s total income tax expense to the income before income taxes for the six months ended June 30, 2023 and 2022, respectively:
| | | June 30, 2023 | | | June 30,
2022 | |
| | | US$ | | | US$ | |
| Income before income tax provision | | | 9,097,681 | | | | 8,988,658 | |
| Tax at the PRC EIT tax rates | | | 2,203,896 | | | | 2,689,271 | |
| Change in valuation allowance | | | 16,934 | | | | - | |
| Tax effect of non-deductible expenses | | | 208,961 | | | | 157,007 | |
| Tax effect of R&D expenses additional deduction* | | | (365,094 | ) | | | (412,506 | ) |
| Income tax expense | | | 2,064,697 | | | | 2,433,772 | |
| * | According to PRC tax regulations, an additional of 100% of current year R&D expenses may be deducted from tax income. |
Under the Enterprise Income Tax Law (“EIT Law”), Foreign Investment Enterprises (“FIEs”) and domestic companies are subject to Enterprise Income Tax (“EIT”) at a uniform rate of 25%.
Huadong was granted a High and New Technology Enterprise (“HNTE”) certificate and received a preferential tax rate of 15% for a three-year validity period from November 30, 2016 and the HNTE certificate was renewed on December 22, 2022 with a three-year validity period. Thus, Huadong will remain eligible for a 15% preferential tax rate from January 1, 2016 through December 31, 2025.
The EIT Law also provides that an enterprise established under the laws of a foreign country or region but whose “de facto management body” is located in the PRC be treated as a resident enterprise for PRC tax purposes and consequently be subject to the PRC income tax at the rate of 25% for its global income. The Implementing Rules of the EIT Law define the location of the “de facto management body” as “the place where the exercising, in substance, of the overall management and control of the production and business operation, personnel, accounting, properties, etc., of a non-PRC company is located.” Based on a review of surrounding facts and circumstances, the Company does not believe that it is likely that its entities registered outside of the PRC should be considered as resident enterprises for the PRC tax purposes.
The EIT Law also imposes a withholding income tax on dividends distributed by a FIE to its immediate holding company outside of the PRC. As a result, Kang Fu, which is the parent of Huada, Yada and Huadong, is therefore subject to a maximum withholding tax of 10% on dividends distributed by Huada, Yada and Huadong. In accordance with accounting guidance, all undistributed earnings are presumed to be transferred to the parent company and are subject to the withholding taxes. The presumption may be overcome if the Company has sufficient evidence to demonstrate that the undistributed dividends will be re-invested and the remittance of the dividends will be postponed indefinitely. As of June 30, 2023, the Company has determined that the undistributed earnings in Huada, Yada and Huadong will be re-invested into the subsidiary for the expansion of the Company’s business in mainland China and hence the remittance of dividends will be postponed indefinitely.
Uncertain tax positions
The Company evaluates each uncertain tax position (including the potential application of interest and penalties) based on the technical merits, and measure the unrecognized benefits associated with the tax positions. As of June 30, 2023, and 2022, the Company did not have any significant unrecognized uncertain tax positions.
11. Commitments and Contingencies
Operating lease
The Company has an operating lease to rent an office space in Shanghai. The lease term is 12 months, with the option to renew annually. Rent expense was $5,856 and $5,856 and is included in general and administrative expenses for the six months ended June 30, 2023 and 2022, respectively. The Company has renewed the same operating lease with a term from January 1, 2023 to December 31, 2023, with all other lease terms remaining the same.
Other commitments
The Company did not have other significant commitments, long-term obligations or guarantees as of June 30, 2023 and 2022.
Contingencies
The Company is subject to legal proceedings and regulatory actions in the ordinary course of business. The results of such proceedings cannot be predicted with certainty, but the Company does not anticipate that the final outcome arising out of any such matter will have a material adverse effect on our consolidated business, financial position, cash flows or results of operations taken as a whole.
On February 4, 2022, Macias Gini & O’Connell, LLP (“Plaintiff”) initiated a lawsuit in San Francisco Superior Court. Plaintiff, a certified public accounting firm based in the U.S., was hired by Kang Fu International Medical Co, and subsequently by Meihua International Medical Technologies Co, Ltd. (collectively, “Meihua”), to audit Meihua’s consolidated financial statements for the 2018 and 2019 calendar years. Plaintiff seeks damages from Meihua for its alleged failure to pay for services rendered in the amount of $210,000, plus interest and attorneys’ fees. The case was dismissed with prejudice in August of 2023.
On August 29, 2023, Zhu Cheng initiated a lawsuit against Yada, Huada, Huadong and Kang Fu in Yangzhou Economic Development Zone Court. Zhu Cheng seeks damages from the above entities for service fee of approximately $2.3 million (RMB 17.0 million). The Company is preparing to file a motion to dismiss the case. No contingent liability has been accrued since the Company has deemed the possibility of loss to be remote.
12. Statutory Surplus Reserves and Restricted Net Assets
Pursuant to laws applicable to entities incorporated in the PRC, the Company is required to make appropriations to certain reserve funds, comprising the statutory surplus reserve and the discretionary surplus reserve, based on after-tax net income determined in accordance with generally accepted accounting principles of the PRC (“PRC GAAP”). Appropriations to the statutory surplus reserve are required to be at least 10% of the after-tax net income determined in accordance with PRC GAAP until the reserve is equal to 50% of the entity’s registered capital. Appropriations to the discretionary surplus reserve are made at the discretion of the Board of Directors. As of December 31, 2022 and June 30, 2023, the Company did not have a discretionary surplus reserve. As of December 31, 2022, all of the Company’s PRC subsidiaries reserves had reached 50% of their registered capital threshold and, as a result, the Company stopped being required to allocate after-tax profits to this reserve.
As a result of these PRC laws and regulations and the requirement that distributions by PRC entities can only be paid out of distributable profits computed in accordance with PRC GAAP, the PRC entities are restricted from transferring a portion of their net assets to the Company. Amounts restricted include paid-in capital and the statutory reserves of the Company’s PRC subsidiaries. The aggregate amounts of capital and statutory reserves restricted which represented the amount of net assets of the relevant subsidiaries in the Company not available for distribution was $15,665,860 as of June 30, 2023 and December 31, 2022.
Under PRC laws and regulations, statutory surplus reserves are restricted to set-off against losses, expansion of production and operation and increasing registered capital of the respective company and are not distributable other than upon liquidation. The reserves are not allowed to be transferred to the Company in terms of cash dividends, loans or advances, nor allowed for distribution except under liquidation.
13. Related Party Transactions and Balances
Related Parties:
| Name of related parties | | Relationship with the Company |
| Shanghai Xinya Pharmaceutical Hanjiang Co., Ltd. | | An entity controlled by Kai Liu, son of Yongjun Liu |
| Yangzhou Meihua Import and Export Co., Ltd. | | An entity controlled by Kai Liu, son of Yongjun Liu |
Related Party Sales
The Company sells products to its related parties and the sales amount from related parties for the six months end 2023 and 2022 are as follows:
Sales:
| | | For the Six Months ended
June 30, | |
| Name of related party | | 2023 | | | 2022 | |
| Yangzhou Meihua Import and Export Co., Ltd. | | $ | 11,751 | | | $ | 18,849 | |
| Shanghai Xinya Pharmaceutical Hanjiang Co., Ltd. | | | - | | | | 10,818 | |
| Total | | $ | 11,751 | | | $ | 29,667 | |
14. Subsequent Events
The Company has evaluated the impact of events that have occurred subsequent to June 30, 2023, through the issuance date of the consolidated financial statements, and concluded that no subsequent events have occurred that would require recognition in the consolidated financial statements or disclosure in the notes to the consolidated financial statements.
F-26
22873370 23940000 0.29 0.29 false --12-31 Q2 2023-06-30 0001835615 0001835615 2023-01-01 2023-06-30 0001835615 2023-06-30 0001835615 2022-12-31 0001835615 2022-01-01 2022-06-30 0001835615 us-gaap:CommonStockMember 2021-12-31 0001835615 us-gaap:AdditionalPaidInCapitalMember 2021-12-31 0001835615 mhua:OrdinarySharesSubscribedMember 2021-12-31 0001835615 us-gaap:RetainedEarningsAppropriatedMember 2021-12-31 0001835615 us-gaap:RetainedEarningsMember 2021-12-31 0001835615 us-gaap:AccumulatedOtherComprehensiveIncomeMember 2021-12-31 0001835615 mhua:NonControllingInterestsMember 2021-12-31 0001835615 2021-12-31 0001835615 us-gaap:CommonStockMember 2022-01-01 2022-06-30 0001835615 us-gaap:AdditionalPaidInCapitalMember 2022-01-01 2022-06-30 0001835615 mhua:OrdinarySharesSubscribedMember 2022-01-01 2022-06-30 0001835615 us-gaap:RetainedEarningsAppropriatedMember 2022-01-01 2022-06-30 0001835615 us-gaap:RetainedEarningsMember 2022-01-01 2022-06-30 0001835615 us-gaap:AccumulatedOtherComprehensiveIncomeMember 2022-01-01 2022-06-30 0001835615 mhua:NonControllingInterestsMember 2022-01-01 2022-06-30 0001835615 us-gaap:CommonStockMember 2022-06-30 0001835615 us-gaap:AdditionalPaidInCapitalMember 2022-06-30 0001835615 mhua:OrdinarySharesSubscribedMember 2022-06-30 0001835615 us-gaap:RetainedEarningsAppropriatedMember 2022-06-30 0001835615 us-gaap:RetainedEarningsMember 2022-06-30 0001835615 us-gaap:AccumulatedOtherComprehensiveIncomeMember 2022-06-30 0001835615 mhua:NonControllingInterestsMember 2022-06-30 0001835615 2022-06-30 0001835615 us-gaap:CommonStockMember 2022-12-31 0001835615 us-gaap:AdditionalPaidInCapitalMember 2022-12-31 0001835615 mhua:OrdinarySharesSubscribedMember 2022-12-31 0001835615 us-gaap:RetainedEarningsAppropriatedMember 2022-12-31 0001835615 us-gaap:RetainedEarningsMember 2022-12-31 0001835615 us-gaap:AccumulatedOtherComprehensiveIncomeMember 2022-12-31 0001835615 mhua:NonControllingInterestsMember 2022-12-31 0001835615 us-gaap:CommonStockMember 2023-01-01 2023-06-30 0001835615 us-gaap:AdditionalPaidInCapitalMember 2023-01-01 2023-06-30 0001835615 mhua:OrdinarySharesSubscribedMember 2023-01-01 2023-06-30 0001835615 us-gaap:RetainedEarningsAppropriatedMember 2023-01-01 2023-06-30 0001835615 us-gaap:RetainedEarningsMember 2023-01-01 2023-06-30 0001835615 us-gaap:AccumulatedOtherComprehensiveIncomeMember 2023-01-01 2023-06-30 0001835615 mhua:NonControllingInterestsMember 2023-01-01 2023-06-30 0001835615 us-gaap:CommonStockMember 2023-06-30 0001835615 us-gaap:AdditionalPaidInCapitalMember 2023-06-30 0001835615 mhua:OrdinarySharesSubscribedMember 2023-06-30 0001835615 us-gaap:RetainedEarningsAppropriatedMember 2023-06-30 0001835615 us-gaap:RetainedEarningsMember 2023-06-30 0001835615 us-gaap:AccumulatedOtherComprehensiveIncomeMember 2023-06-30 0001835615 mhua:NonControllingInterestsMember 2023-06-30 0001835615 2015-10-13 0001835615 mhua:KangFuMember 2023-06-30 0001835615 mhua:KangFuMember 2001-12-24 0001835615 mhua:HuadaMember 1991-12-05 0001835615 mhua:YadaMember 2000-11-18 0001835615 2021-10-07 2021-10-07 0001835615 mhua:HainanMember 2021-10-07 0001835615 mhua:MeihuaInternationalMedicalTechnologiesCoLtdMember 2023-01-01 2023-06-30 0001835615 mhua:KangFuInternationalMedicalCoLtdMember 2023-01-01 2023-06-30 0001835615 mhua:YangzhouHuadaMedicalEquipmentCoLtdMember 2023-01-01 2023-06-30 0001835615 mhua:JiangsuYadaTechnologyGroupCoLtdMember 2023-01-01 2023-06-30 0001835615 mhua:JiangsuHuadongMedicalDeviceIndustryCoLtdMember 2023-01-01 2023-06-30 0001835615 mhua:YangzhouGuanghuiMedicalTechnologyCoLtdMember 2023-01-01 2023-06-30 0001835615 mhua:HainanGuoxieTechnologyGroupCoLtdMember 2023-01-01 2023-06-30 0001835615 mhua:RevenueMember 2023-01-01 2023-06-30 0001835615 srt:MaximumMember mhua:RevenueMember 2023-06-30 0001835615 srt:MinimumMember mhua:RevenueMember 2023-06-30 0001835615 mhua:RevenueMember 2022-01-01 2022-06-30 0001835615 srt:MaximumMember mhua:RevenueMember 2022-06-30 0001835615 srt:MinimumMember mhua:RevenueMember 2022-06-30 0001835615 us-gaap:AccountsReceivableMember 2023-01-01 2023-06-30 0001835615 us-gaap:AccountsReceivableMember 2023-06-30 0001835615 srt:MaximumMember us-gaap:AccountsReceivableMember 2023-06-30 0001835615 us-gaap:AccountsReceivableMember 2022-01-01 2022-12-31 0001835615 srt:MaximumMember us-gaap:AccountsReceivableMember 2022-12-31 0001835615 srt:MinimumMember us-gaap:AccountsReceivableMember 2022-12-31 0001835615 2023-08-31 0001835615 2022-01-01 2022-12-31 0001835615 mhua:InvestmentMember 2011-03-03 0001835615 mhua:InvestmentMember 2023-01-05 0001835615 2023-01-05 2023-01-05 0001835615 mhua:JiangsuHuadongMedicalDeviceIndustrialsCoLtdMember 2022-12-01 0001835615 mhua:ZhongxiangxinMember 2022-12-01 2022-12-01 0001835615 srt:MinimumMember 2023-01-01 2023-06-30 0001835615 srt:MaximumMember 2023-01-01 2023-06-30 0001835615 us-gaap:BuildingMember 2023-06-30 0001835615 us-gaap:BuildingMember 2023-01-01 2023-06-30 0001835615 us-gaap:MachineryAndEquipmentMember 2023-06-30 0001835615 us-gaap:MachineryAndEquipmentMember 2023-01-01 2023-06-30 0001835615 us-gaap:VehiclesMember 2023-06-30 0001835615 us-gaap:VehiclesMember 2023-01-01 2023-06-30 0001835615 us-gaap:ElectricGenerationEquipmentMember 2023-06-30 0001835615 us-gaap:ElectricGenerationEquipmentMember 2023-01-01 2023-06-30 0001835615 us-gaap:OfficeEquipmentMember 2023-06-30 0001835615 us-gaap:OfficeEquipmentMember 2023-01-01 2023-06-30 0001835615 mhua:InspectionEquipmentMember 2023-06-30 0001835615 mhua:InspectionEquipmentMember 2023-01-01 2023-06-30 0001835615 us-gaap:CopyrightsMember 2023-06-30 0001835615 us-gaap:PatentsMember 2023-06-30 0001835615 us-gaap:TrademarksMember 2023-06-30 0001835615 mhua:SelfManufacturedProductsMember 2023-01-01 2023-06-30 0001835615 mhua:SelfManufacturedProductsMember 2022-01-01 2022-06-30 0001835615 mhua:ResalesOfSourcedDisposableMedicalDevicesFromThirdPartyManufacturersMember 2023-01-01 2023-06-30 0001835615 mhua:ResalesOfSourcedDisposableMedicalDevicesFromThirdPartyManufacturersMember 2022-01-01 2022-06-30 0001835615 mhua:ClassIMember 2023-01-01 2023-06-30 0001835615 mhua:ClassIMember 2022-01-01 2022-06-30 0001835615 mhua:ClassIIMember 2023-01-01 2023-06-30 0001835615 mhua:ClassIIMember 2022-01-01 2022-06-30 0001835615 mhua:ClassIIIMember 2023-01-01 2023-06-30 0001835615 mhua:ClassIIIMember 2022-01-01 2022-06-30 0001835615 mhua:OtherMember 2023-01-01 2023-06-30 0001835615 mhua:OtherMember 2022-01-01 2022-06-30 0001835615 mhua:EyeDropsBottleMember 2023-01-01 2023-06-30 0001835615 mhua:EyeDropsBottleMember 2022-01-01 2022-06-30 0001835615 mhua:OralMedicineBottleMember 2023-01-01 2023-06-30 0001835615 mhua:OralMedicineBottleMember 2022-01-01 2022-06-30 0001835615 mhua:AnalBagMember 2023-01-01 2023-06-30 0001835615 mhua:AnalBagMember 2022-01-01 2022-06-30 0001835615 mhua:OtherClassIMember 2023-01-01 2023-06-30 0001835615 mhua:OtherClassIMember 2022-01-01 2022-06-30 0001835615 mhua:ClassIMember 2023-01-01 2023-06-30 0001835615 mhua:ClassIMember 2022-01-01 2022-06-30 0001835615 mhua:MasksMember 2023-01-01 2023-06-30 0001835615 mhua:MasksMember 2022-01-01 2022-06-30 0001835615 mhua:IdentificationTapeMember 2023-01-01 2023-06-30 0001835615 mhua:IdentificationTapeMember 2022-01-01 2022-06-30 0001835615 mhua:DisposableMedicalBrushMember 2023-01-01 2023-06-30 0001835615 mhua:DisposableMedicalBrushMember 2022-01-01 2022-06-30 0001835615 mhua:GynecologicalInspectionKitsMember 2023-01-01 2023-06-30 0001835615 mhua:GynecologicalInspectionKitsMember 2022-01-01 2022-06-30 0001835615 mhua:SurgicalKitMember 2023-01-01 2023-06-30 0001835615 mhua:SurgicalKitMember 2022-01-01 2022-06-30 0001835615 mhua:MedicalBrushMember 2023-01-01 2023-06-30 0001835615 mhua:MedicalBrushMember 2022-01-01 2022-06-30 0001835615 mhua:MedicalKitMember 2023-01-01 2023-06-30 0001835615 mhua:MedicalKitMember 2022-01-01 2022-06-30 0001835615 mhua:OtherClassIIMember 2023-01-01 2023-06-30 0001835615 mhua:OtherClassIIMember 2022-01-01 2022-06-30 0001835615 mhua:ClassIIMember 2023-01-01 2023-06-30 0001835615 mhua:ClassIIMember 2022-01-01 2022-06-30 0001835615 mhua:ElectronicPumpMember 2023-01-01 2023-06-30 0001835615 mhua:ElectronicPumpMember 2022-01-01 2022-06-30 0001835615 mhua:AnesthesiaPunctureKitMember 2023-01-01 2023-06-30 0001835615 mhua:AnesthesiaPunctureKitMember 2022-01-01 2022-06-30 0001835615 mhua:DisposableInfusionPumpMember 2023-01-01 2023-06-30 0001835615 mhua:DisposableInfusionPumpMember 2022-01-01 2022-06-30 0001835615 mhua:InfusionPumpMember 2023-01-01 2023-06-30 0001835615 mhua:InfusionPumpMember 2022-01-01 2022-06-30 0001835615 mhua:ElectronicInfusionPumpOneMember 2023-01-01 2023-06-30 0001835615 mhua:ElectronicInfusionPumpOneMember 2022-01-01 2022-06-30 0001835615 mhua:LaparoscopicTrocarMember 2023-01-01 2023-06-30 0001835615 mhua:LaparoscopicTrocarMember 2022-01-01 2022-06-30 0001835615 mhua:OtherClassIIIMember 2023-01-01 2023-06-30 0001835615 mhua:OtherClassIIIMember 2022-01-01 2022-06-30 0001835615 mhua:ClassIIIMember 2023-01-01 2023-06-30 0001835615 mhua:ClassIIIMember 2022-01-01 2022-06-30 0001835615 2018-10-22 2018-10-22 0001835615 2020-04-20 0001835615 mhua:LandUseRightsMember 2023-06-30 0001835615 mhua:LandUseRightsMember 2022-12-31 0001835615 us-gaap:PatentsMember 2022-12-31 0001835615 mhua:SoftwareMember 2023-06-30 0001835615 mhua:SoftwareMember 2022-12-31 0001835615 us-gaap:TrademarksMember 2022-12-31 0001835615 mhua:YangzhouJuyuanGuaranteeCoLtdMember 2011-03-03 0001835615 us-gaap:SeriesOfIndividuallyImmaterialBusinessAcquisitionsMember 2011-03-03 0001835615 us-gaap:SeriesOfIndividuallyImmaterialBusinessAcquisitionsMember 2023-01-05 0001835615 mhua:JiangsuHuadongMedicalDeviceIndustrialCoLtdMember 2022-12-01 0001835615 2022-12-01 0001835615 mhua:BankOfCommunicationsMember 2023-01-01 2023-06-30 0001835615 mhua:BankOfCommunicationsMember 2023-06-30 0001835615 mhua:BankOfCommunicationsOneMember 2023-01-01 2023-06-30 0001835615 mhua:BankOfCommunicationsOneMember 2023-06-30 0001835615 mhua:AgriculturalBankOfChinaMember 2023-01-01 2023-06-30 0001835615 mhua:AgriculturalBankOfChinaMember 2023-06-30 0001835615 mhua:JiangsuYangzhouRuralCommercialBankMember 2023-01-01 2023-06-30 0001835615 mhua:JiangsuYangzhouRuralCommercialBankMember 2023-06-30 0001835615 mhua:BankOfChinaMember 2023-01-01 2023-06-30 0001835615 mhua:BankOfChinaMember 2023-06-30 0001835615 mhua:AgriculturalBankOfChinaOneMember 2023-01-01 2023-06-30 0001835615 mhua:AgriculturalBankOfChinaOneMember 2023-06-30 0001835615 mhua:IndustrialAndCommercialBankOfChinaMember 2023-01-01 2023-06-30 0001835615 mhua:IndustrialAndCommercialBankOfChinaMember 2023-06-30 0001835615 mhua:BankOfCommunicationsMember 2022-01-01 2022-12-31 0001835615 mhua:BankOfCommunicationsMember 2022-12-31 0001835615 mhua:AgriculturalBankOfChinaMember 2022-01-01 2022-12-31 0001835615 mhua:AgriculturalBankOfChinaMember 2022-12-31 0001835615 mhua:JiangsuYangzhouRuralCommercialBankMember 2022-01-01 2022-12-31 0001835615 mhua:JiangsuYangzhouRuralCommercialBankMember 2022-12-31 0001835615 mhua:BankOfChinaMember 2022-01-01 2022-12-31 0001835615 mhua:BankOfChinaMember 2022-12-31 0001835615 mhua:AgriculturalBankOfChinaOneMember 2022-01-01 2022-12-31 0001835615 mhua:AgriculturalBankOfChinaOneMember 2022-12-31 0001835615 mhua:IndustrialAndCommercialBankOfChinaMember 2022-01-01 2022-12-31 0001835615 mhua:IndustrialAndCommercialBankOfChinaMember 2022-12-31 0001835615 2022-11-03 2022-11-03 0001835615 2022-11-03 0001835615 mhua:BankOfCommunicationsMember 2022-01-01 2022-12-31 0001835615 2017-12-29 2017-12-29 0001835615 2017-12-29 0001835615 2016-11-30 0001835615 2023-08-01 2023-08-29 0001835615 mhua:ShanghaiXinyaPharmaceuticalHanjiangCoLtdMember 2023-01-01 2023-06-30 0001835615 mhua:YangzhouMeihuaImportAndExportCoLtdMember 2023-01-01 2023-06-30 0001835615 mhua:YangzhouMeihuaImportAndExportCoLtdMember 2022-01-01 2022-06-30 0001835615 mhua:ShanghaiXinyaPharmaceuticalHanjiangCoLtdMember 2022-01-01 2022-06-30 iso4217:USD iso4217:USD xbrli:shares xbrli:shares iso4217:HKD xbrli:pure iso4217:CNY