
Q2 2022 Financial Results�August 15, 2022
Forward-Looking Statements�Certain statements made in this presentation are “forward-looking statements” within the meaning of the “safe harbor” provisions of the United States Private Securities Litigation Reform Act of 1995. Words such as “estimates,” “projects,” “expects,” “anticipates,” “forecasts,” “plans,” “intends,” “believes,” “seeks,” “may,” “will,” “would,” “should,” “future,” “propose,” “target,” “goal,” “objective,” “outlook” and variations of these words or similar expressions (or the negative versions of such words or expressions) are intended to identify forward-looking statements. These forward-looking statements are not guarantees of future performance, conditions or results, and involve a number of known and unknown risks, uncertainties, assumptions and other important factors, many of which are outside the control of Fathom Digital Manufacturing Corporation (“Fathom”) that could cause actual results or outcomes to differ materially from those discussed in the forward-looking statements. Important factors, among others, that may affect actual results or outcomes include: the inability to recognize the anticipated benefits of our business combination with Altimar Acquisition Corp. II; changes in general economic conditions, including as a result of the COVID-19 pandemic; the outcome of litigation related to or arising out of the business combination, or any adverse developments therein or delays or costs resulting therefrom; the ability to meet the New York Stock Exchange’s listing standards following the consummation of the business combination; costs related to the business combination and additional factors discussed in Fathom’s Annual Report on Form 10-K for the fiscal year ended December 31, 2021, filed with the Securities and Exchange Commission (the “SEC”) on April 8, 2022 as well as Fathom’s other filings with the SEC. If any of the risks described above materialize or our assumptions prove incorrect, actual results could differ materially from the results implied by our forward-looking statements. There may be additional risks that Fathom does not presently know or that Fathom currently believes are immaterial that could also cause actual results to differ from those contained in the forward-looking statements. In addition, forward-looking statements reflect Fathom’s expectations, plans or forecasts of future events and views as of the date of this presentation. These forward-looking statements should not be relied upon as representing Fathom’s assessments as of any date subsequent to the date of this presentation. Accordingly, undue reliance should not be placed upon the forward-looking statements. Fathom undertakes no obligation to update or revise any forward-looking statements made by management or on its behalf, including with respect to the revised financial guidance for full year 2022 contained herein, whether as a result of future developments, subsequent events or circumstances or otherwise, except as required by law. Non-GAAP Information �This presentation includes Adjusted Net Income, Adjusted EBITDA and Adjusted EBITDA margin, which are non-GAAP financial measures that we use to supplement our results presented in accordance with U.S. GAAP. We believe Adjusted Net Income, Adjusted EBITDA and Adjusted EBITDA margin are useful in evaluating our operating performance, as they are similar to measures reported by our public competitors and regularly used by security analysts, institutional investors and other interested parties in analyzing operating performance and prospects. Adjusted Net Income, Adjusted EBITDA and Adjusted EBITDA margin are not intended to be a substitute for any U.S. GAAP financial measure and, as calculated, may not be comparable to other similarly titled measures of performance of other companies in other industries or within the same industry. We define and calculate Adjusted Net Income as net income (loss) before the impact of any increase or decrease in the estimated fair value of the company’s warrants or earnout shares. We define and calculate Adjusted EBITDA as net income (loss) before the impact of interest income or expense, income tax expense and depreciation and amortization, and further adjusted for the following items: stock-based compensation, transaction-related costs, and certain other non-cash and non-core items, as described in the reconciliation included in the appendix to this presentation. Adjusted EBITDA excludes certain expenses that are required in accordance with U.S. GAAP because they are non-recurring (for example, in the case of transaction-related costs), non-cash (for example, in the case of depreciation, amortization and stock-based compensation) or are not related to our underlying business performance (for example, in the case of interest income and expense). Adjusted EBITDA margin represents Adjusted EBITDA divided by total revenue. We include these non-GAAP financial measures because they are used by management to evaluate Fathom’s core operating performance and trends and to make strategic decisions regarding the allocation of capital and new investments. Information reconciling forward-looking Adjusted EBITDA to GAAP financial measures is unavailable to Fathom without unreasonable effort. The company is not able to provide reconciliations of forward-looking Adjusted EBITDA to GAAP financial measures because certain items required for such reconciliations are outside of Fathom's control and/or cannot be reasonably predicted, such as the provision for income taxes. Preparation of such reconciliations would require a forward-looking balance sheet, statement of income and statement of cash flow, prepared in accordance with GAAP, and such forward-looking financial statements are unavailable to Fathom without unreasonable effort. Fathom provides a range for its Adjusted EBITDA forecast that it believes will be achieved, however it cannot accurately predict all the components of the Adjusted EBITDA calculation. Fathom provides an Adjusted EBITDA forecast because it believes that Adjusted EBITDA, when viewed with the company's results under GAAP, provides useful information for the reasons noted above. However, Adjusted EBITDA is not a measure of financial performance or liquidity under GAAP and, accordingly, should not be considered as an alternative to net income or cash flow from operating activities as an indicator of operating performance or liquidity. Disclaimers
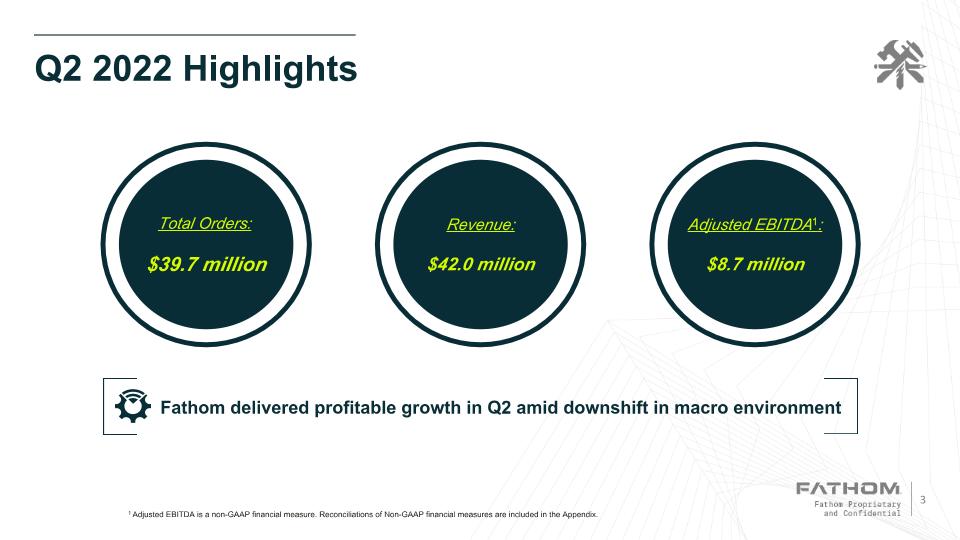
Q2 2022 Highlights 1 Adjusted EBITDA is a non-GAAP financial measure. Reconciliations of Non-GAAP financial measures are included in the Appendix. Total Orders: $39.7 million Revenue: $42.0 million Adjusted EBITDA1: $8.7 million Fathom delivered profitable growth in Q2 amid downshift in macro environment
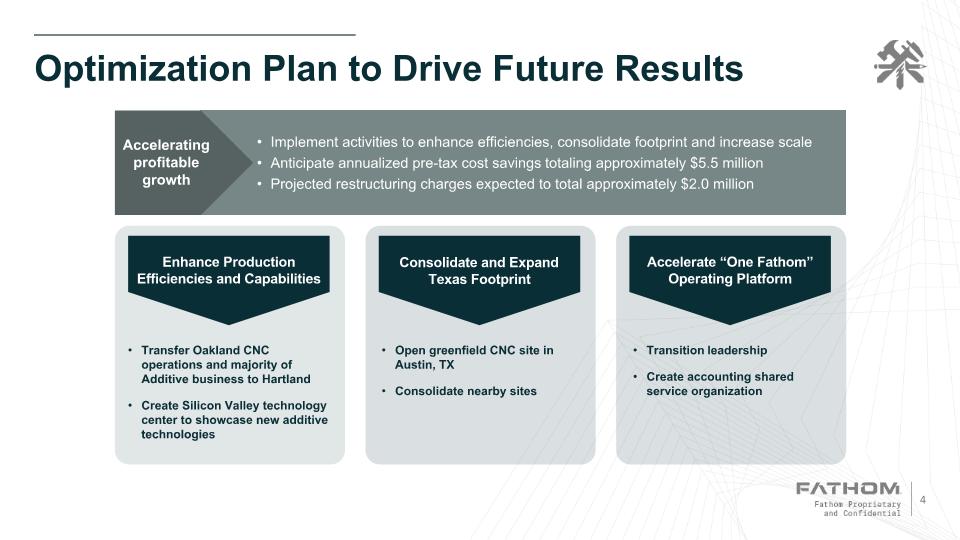
Optimization Plan to Drive Future Results Enhance Production Efficiencies and Capabilities Transfer Oakland CNC operations and majority of Additive business to Hartland Create Silicon Valley technology center to showcase new additive technologies Consolidate and Expand Texas Footprint Open greenfield CNC site in Austin, TX Consolidate nearby sites Accelerate “One Fathom” Operating Platform Transition leadership Create accounting shared service organization Accelerating profitable growth Implement activities to enhance efficiencies, consolidate footprint and increase scale Anticipate annualized pre-tax cost savings totaling approximately $5.5 million Projected restructuring charges expected to total approximately $2.0 million
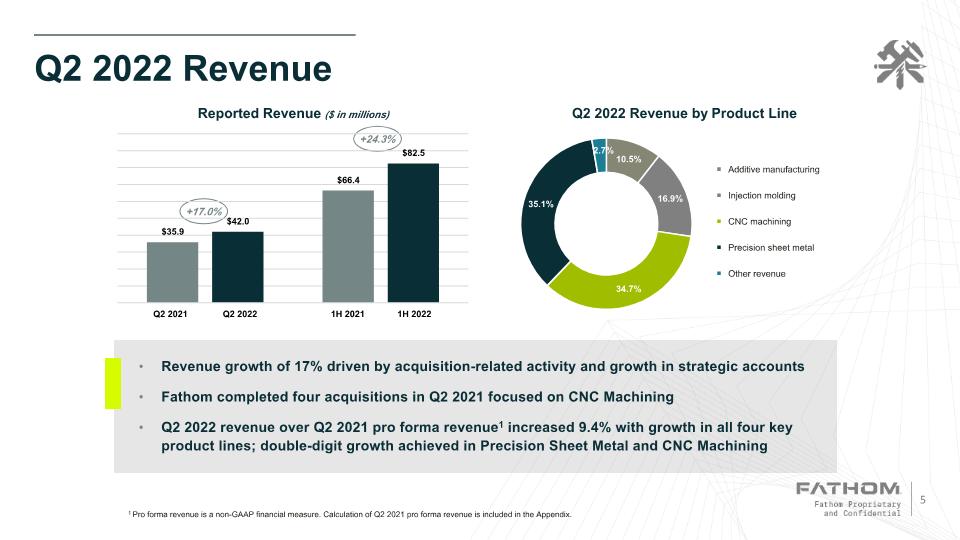
Q2 2022 Revenue 1 Pro forma revenue is a non-GAAP financial measure. Calculation of Q2 2021 pro forma revenue is included in the Appendix. Revenue growth of 17% driven by acquisition-related activity and growth in strategic accounts Fathom completed four acquisitions in Q2 2021 focused on CNC Machining Q2 2022 revenue over Q2 2021 pro forma revenue1 increased 9.4% with growth in all four key product lines; double-digit growth achieved in Precision Sheet Metal and CNC Machining +17.0% +24.3%
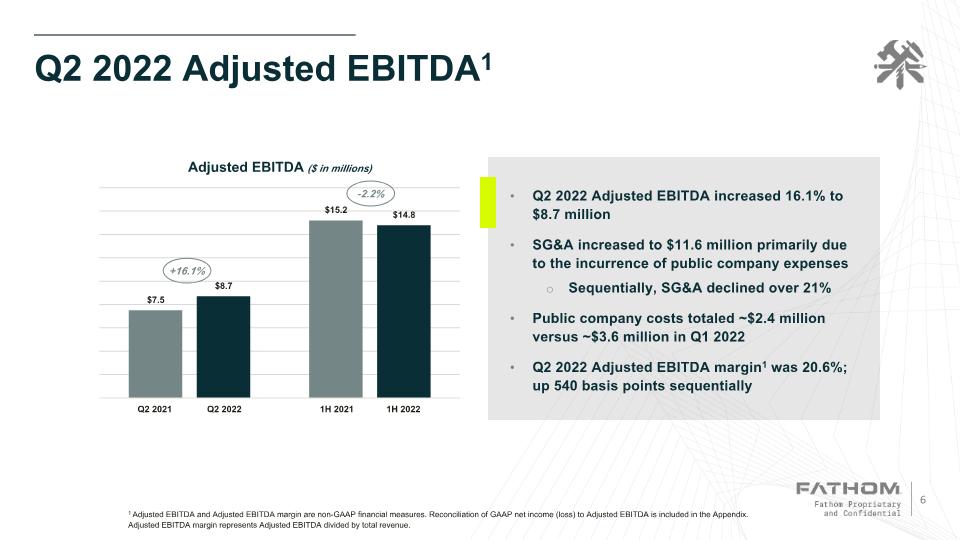
Q2 2022 Adjusted EBITDA1 1 Adjusted EBITDA and Adjusted EBITDA margin are non-GAAP financial measures. Reconciliation of GAAP net income (loss) to Adjusted EBITDA is included in the Appendix. Adjusted EBITDA margin represents Adjusted EBITDA divided by total revenue. Q2 2022 Adjusted EBITDA increased 16.1% to $8.7 million SG&A increased to $11.6 million primarily due to the incurrence of public company expenses Sequentially, SG&A declined over 21% Public company costs totaled ~$2.4 million versus ~$3.6 million in Q1 2022 Q2 2022 Adjusted EBITDA margin1 was 20.6%; up 540 basis points sequentially -2.2% +16.1%
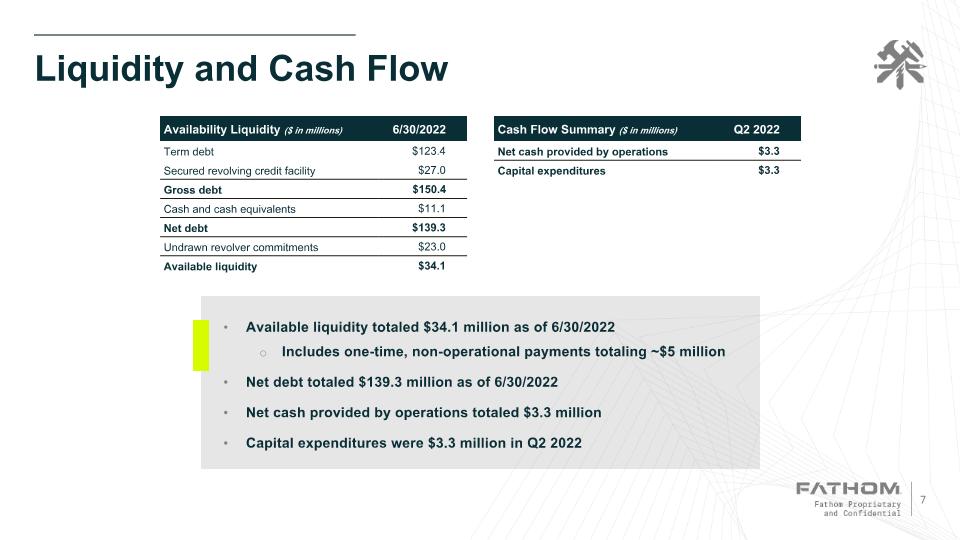
Liquidity and Cash Flow Availability Liquidity ($ in millions) 6/30/2022 Term debt $123.4 Secured revolving credit facility $27.0 Gross debt $150.4 Cash and cash equivalents $11.1 Net debt $139.3 Undrawn revolver commitments $23.0 Available liquidity $34.1 Cash Flow Summary ($ in millions) Q2 2022 Net cash provided by operations $3.3 Capital expenditures $3.3 Available liquidity totaled $34.1 million as of 6/30/2022 Includes one-time, non-operational payments totaling ~$5 million Net debt totaled $139.3 million as of 6/30/2022 Net cash provided by operations totaled $3.3 million Capital expenditures were $3.3 million in Q2 2022
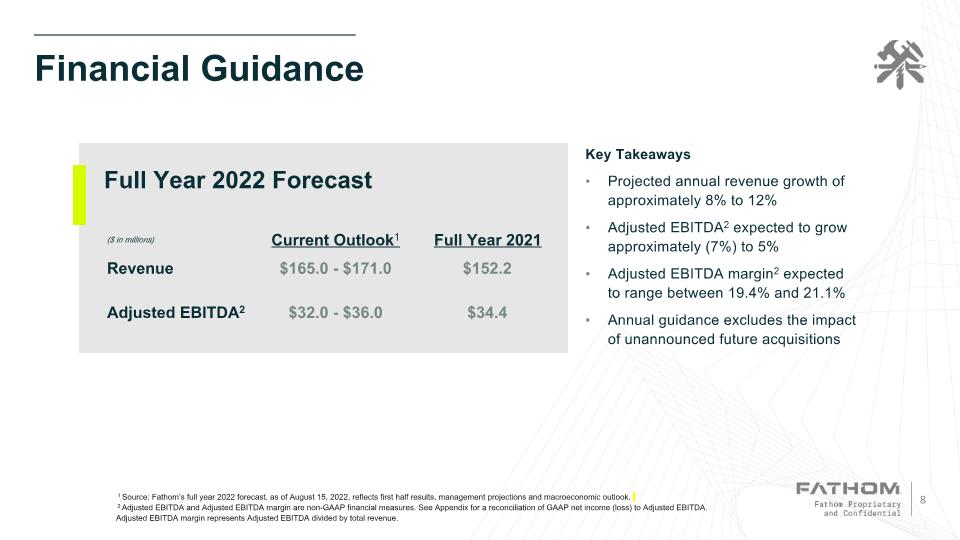
Financial Guidance 1 Source: Fathom’s full year 2022 forecast, as of August 15, 2022, reflects first half results, management projections and macroeconomic outlook. 2 Adjusted EBITDA and Adjusted EBITDA margin are non-GAAP financial measures. See Appendix for a reconciliation of GAAP net income (loss) to Adjusted EBITDA. Adjusted EBITDA margin represents Adjusted EBITDA divided by total revenue. ($ in millions) Current Outlook1 Full Year 2021 Revenue $165.0 - $171.0 $152.2 Adjusted EBITDA2 $32.0 - $36.0 $34.4 Full Year 2022 Forecast Key Takeaways Projected annual revenue growth of approximately 8% to 12% Adjusted EBITDA2 expected to grow approximately (7%) to 5% Adjusted EBITDA margin2 expected to range between 19.4% and 21.1% Annual guidance excludes the impact of unannounced future acquisitions
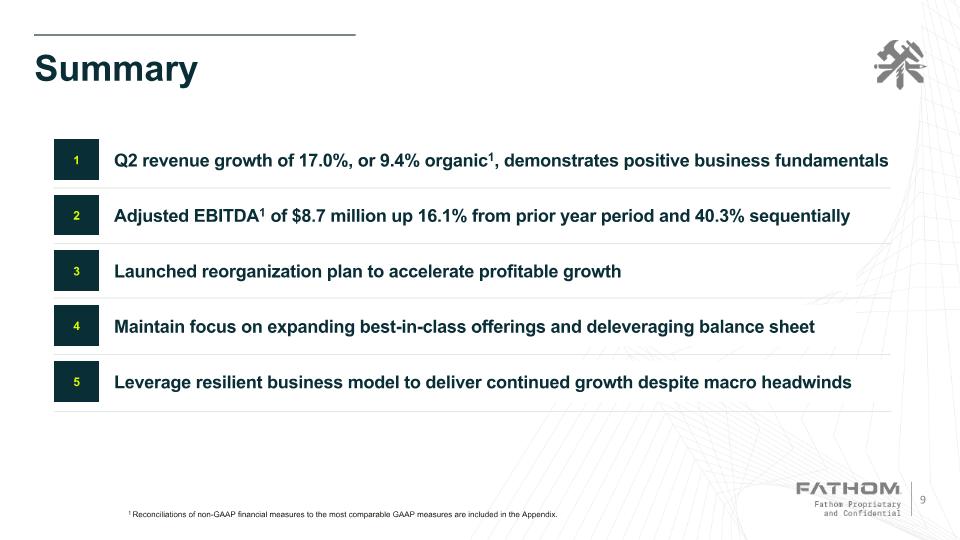
Summary 1 Reconciliations of non-GAAP financial measures to the most comparable GAAP measures are included in the Appendix. Q2 revenue growth of 17.0%, or 9.4% organic1, demonstrates positive business fundamentals 1 2 4 5 3 Adjusted EBITDA1 of $8.7 million up 16.1% from prior year period and 40.3% sequentially Maintain focus on expanding best-in-class offerings and deleveraging balance sheet Leverage resilient business model to deliver continued growth despite macro headwinds Launched reorganization plan to accelerate profitable growth
Appendix
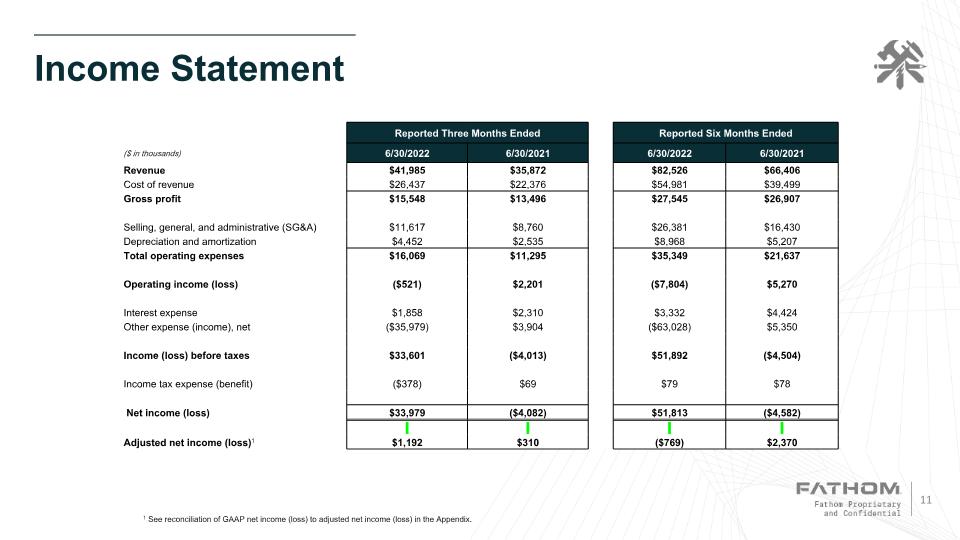
Income Statement 1 See reconciliation of GAAP net income (loss) to adjusted net income (loss) in the Appendix. Reported Three Months Ended Reported Six Months Ended ($ in thousands) 6/30/2022 6/30/2021 6/30/2022 6/30/2021 Revenue $41,985 $35,872 $82,526 $66,406 Cost of revenue $26,437 $22,376 $54,981 $39,499 Gross profit $15,548 $13,496 $27,545 $26,907 Selling, general, and administrative (SG&A) $11,617 $8,760 $26,381 $16,430 Depreciation and amortization $4,452 $2,535 $8,968 $5,207 Total operating expenses $16,069 $11,295 $35,349 $21,637 Operating income (loss) ($521) $2,201 ($7,804) $5,270 Interest expense $1,858 $2,310 $3,332 $4,424 Other expense (income), net ($35,979) $3,904 ($63,028) $5,350 Income (loss) before taxes $33,601 ($4,013) $51,892 ($4,504) Income tax expense (benefit) ($378) $69 $79 $78 Net income (loss) $33,979 ($4,082) $51,813 ($4,582) Adjusted net income (loss)1 $1,192 $310 ($769) $2,370
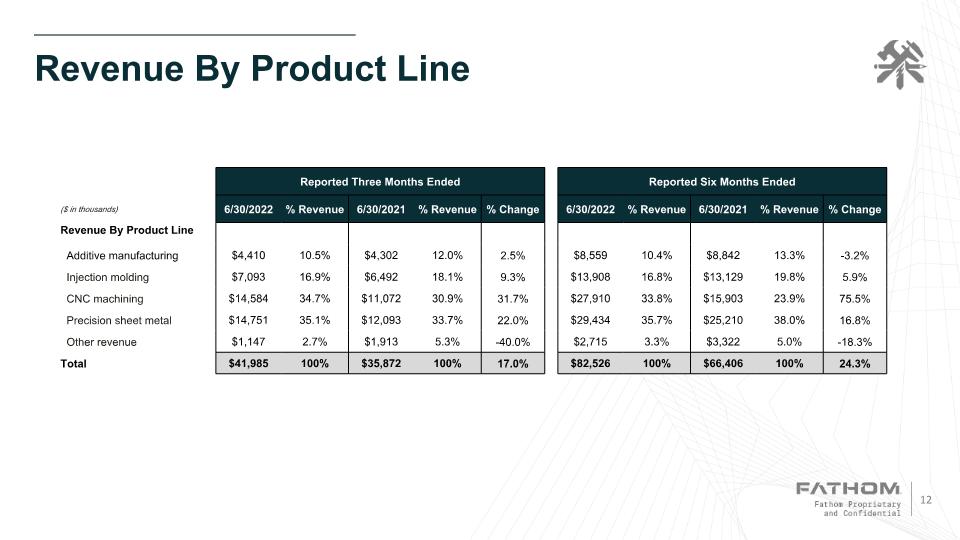
Revenue By Product Line Reported Three Months Ended Reported Six Months Ended ($ in thousands) 6/30/2022 % Revenue 6/30/2021 % Revenue % Change 6/30/2022 % Revenue 6/30/2021 % Revenue % Change Revenue By Product Line Additive manufacturing $4,410 10.5% $4,302 12.0% 2.5% $8,559 10.4% $8,842 13.3% -3.2% Injection molding $7,093 16.9% $6,492 18.1% 9.3% $13,908 16.8% $13,129 19.8% 5.9% CNC machining $14,584 34.7% $11,072 30.9% 31.7% $27,910 33.8% $15,903 23.9% 75.5% Precision sheet metal $14,751 35.1% $12,093 33.7% 22.0% $29,434 35.7% $25,210 38.0% 16.8% Other revenue $1,147 2.7% $1,913 5.3% -40.0% $2,715 3.3% $3,322 5.0% -18.3% Total $41,985 100% $35,872 100% 17.0% $82,526 100% $66,406 100% 24.3%
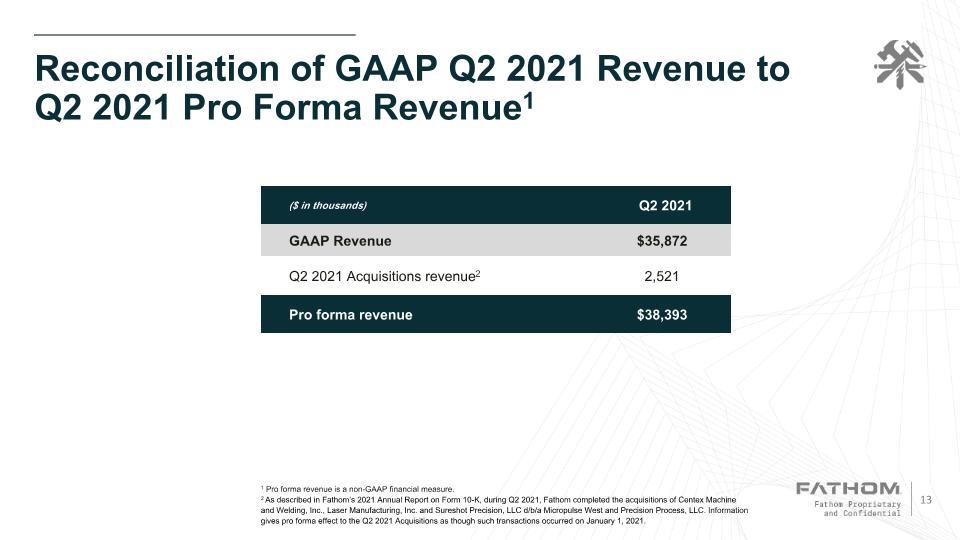
Reconciliation of GAAP Q2 2021 Revenue to Q2 2021 Pro Forma Revenue1 ($ in thousands) Q2 2021 GAAP Revenue $35,872 Q2 2021 Acquisitions revenue2 2,521 Pro forma revenue $38,393 1 Pro forma revenue is a non-GAAP financial measure. 2 As described in Fathom’s 2021 Annual Report on Form 10-K, during Q2 2021, Fathom completed the acquisitions of Centex Machine and Welding, Inc., Laser Manufacturing, Inc. and Sureshot Precision, LLC d/b/a Micropulse West and Precision Process, LLC. Information gives pro forma effect to the Q2 2021 Acquisitions as though such transactions occurred on January 1, 2021.
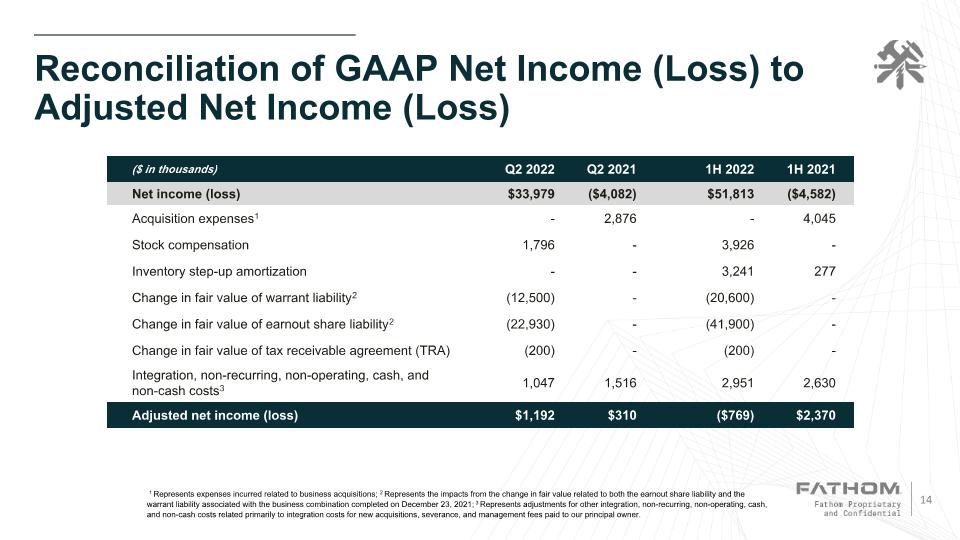
Reconciliation of GAAP Net Income (Loss) to Adjusted Net Income (Loss) ($ in thousands) Q2 2022 Q2 2021 1H 2022 1H 2021 Net income (loss) $33,979 ($4,082) $51,813 ($4,582) Acquisition expenses1 - 2,876 - 4,045 Stock compensation 1,796 - 3,926 - Inventory step-up amortization - - 3,241 277 Change in fair value of warrant liability2 (12,500) - (20,600) - Change in fair value of earnout share liability2 (22,930) - (41,900) - Change in fair value of tax receivable agreement (TRA) (200) - (200) - Integration, non-recurring, non-operating, cash, and non-cash costs3 1,047 1,516 2,951 2,630 Adjusted net income (loss) $1,192 $310 ($769) $2,370 1 Represents expenses incurred related to business acquisitions; 2 Represents the impacts from the change in fair value related to both the earnout share liability and the warrant liability associated with the business combination completed on December 23, 2021; 3 Represents adjustments for other integration, non-recurring, non-operating, cash, and non-cash costs related primarily to integration costs for new acquisitions, severance, and management fees paid to our principal owner.
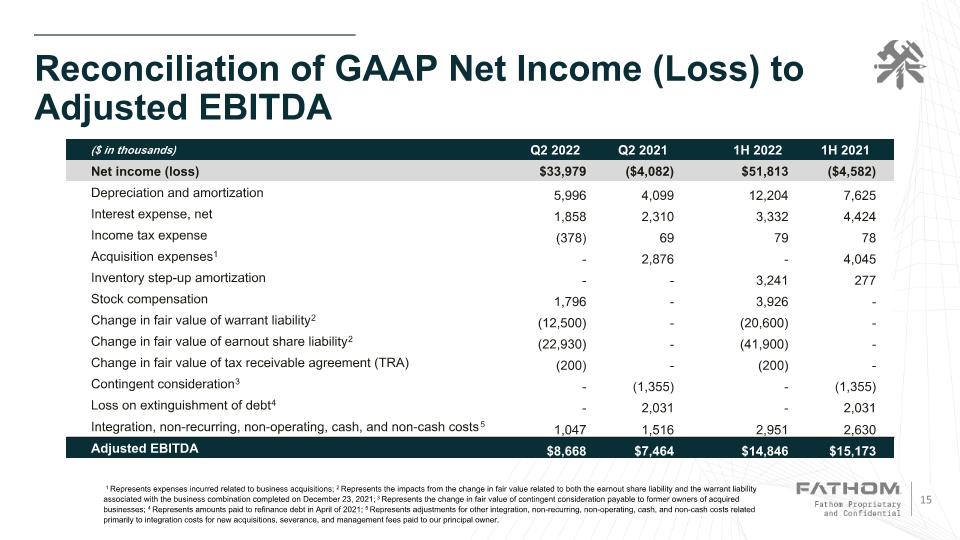
Reconciliation of GAAP Net Income (Loss) to Adjusted EBITDA ($ in thousands) Q2 2022 Q2 2021 1H 2022 1H 2021 Net income (loss) $33,979 ($4,082) $51,813 ($4,582) Depreciation and amortization 5,996 4,099 12,204 7,625 Interest expense, net 1,858 2,310 3,332 4,424 Income tax expense (378) 69 79 78 Acquisition expenses1 - 2,876 - 4,045 Inventory step-up amortization - - 3,241 277 Stock compensation 1,796 - 3,926 - Change in fair value of warrant liability2 (12,500) - (20,600) - Change in fair value of earnout share liability2 (22,930) - (41,900) - Change in fair value of tax receivable agreement (TRA) (200) - (200) - Contingent consideration3 - (1,355) - (1,355) Loss on extinguishment of debt4 - 2,031 - 2,031 Integration, non-recurring, non-operating, cash, and non-cash costs5 1,047 1,516 2,951 2,630 Adjusted EBITDA $8,668 $7,464 $14,846 $15,173 1 Represents expenses incurred related to business acquisitions; 2 Represents the impacts from the change in fair value related to both the earnout share liability and the warrant liability associated with the business combination completed on December 23, 2021; 3 Represents the change in fair value of contingent consideration payable to former owners of acquired businesses; 4 Represents amounts paid to refinance debt in April of 2021; 5 Represents adjustments for other integration, non-recurring, non-operating, cash, and non-cash costs related primarily to integration costs for new acquisitions, severance, and management fees paid to our principal owner.
