Q4 and Full Year 2022 Financial Results�March 31, 2023
Forward-Looking Statements�Certain statements made in this presentation are “forward-looking statements” within the meaning of the “safe harbor” provisions of the United States Private Securities Litigation Reform Act of 1995. Words such as “estimates,” “projects,” “expects,” “anticipates,” “forecasts,” “plans,” “intends,” “believes,” “seeks,” “may,” “will,” “would,” “should,” “future,” “propose,” “target,” “goal,” “objective,” “outlook” and variations of these words or similar expressions (or the negative versions of such words or expressions) are intended to identify forward-looking statements. These forward-looking statements are not guarantees of future performance, conditions or results, and involve a number of known and unknown risks, uncertainties, assumptions and other important factors, many of which are outside the control of Fathom Digital Manufacturing Corporation (“Fathom”) that could cause actual results or outcomes to differ materially from those discussed in the forward-looking statements. Important factors, among others, that may affect actual results or outcomes include: the inability to recognize the anticipated benefits of our business combination with Altimar Acquisition Corp. II; changes in general economic conditions, including as a result of the COVID-19 pandemic; the implementation of our optimization plan could result in greater costs and fewer benefits than we anticipate; the outcome of litigation related to or arising out of the business combination, or any adverse developments therein or delays or costs resulting therefrom; the ability to meet the New York Stock Exchange’s listing standards following the consummation of the business combination; costs related to the business combination and additional factors discussed in Fathom’s Annual Report on Form 10-K for the fiscal year ended December 31, 2021, filed with the Securities and Exchange Commission (the “SEC”) on April 8, 2022 as well as Fathom’s other filings with the SEC. If any of the risks described above materialize or our assumptions prove incorrect, actual results could differ materially from the results implied by our forward-looking statements. There may be additional risks that Fathom does not presently know or that Fathom currently believes are immaterial that could also cause actual results to differ from those contained in the forward-looking statements. In addition, forward-looking statements reflect Fathom’s expectations, plans or forecasts of future events and views as of the date of this presentation. These forward-looking statements should not be relied upon as representing Fathom’s assessments as of any date subsequent to the date of this presentation. Accordingly, undue reliance should not be placed upon the forward-looking statements. Fathom undertakes no obligation to update or revise any forward-looking statements made by management or on its behalf, including with respect to the financial guidance for first quarter of 2023 contained herein, whether as a result of future developments, subsequent events or circumstances or otherwise, except as required by law. Disclaimers
Non-GAAP Information �This presentation includes Adjusted Net Income, Adjusted EBITDA and Adjusted EBITDA margin, which are non-GAAP financial measures that we use to supplement our results presented in accordance with U.S. GAAP. We believe Adjusted Net Income, Adjusted EBITDA and Adjusted EBITDA margin are useful in evaluating our operating performance, as they are similar to measures reported by our public competitors and regularly used by security analysts, institutional investors and other interested parties in analyzing operating performance and prospects. Adjusted Net Income, Adjusted EBITDA and Adjusted EBITDA margin are not intended to be a substitute for any U.S. GAAP financial measure and, as calculated, may not be comparable to other similarly titled measures of performance of other companies in other industries or within the same industry. We define and calculate Adjusted Net Income as net income (loss) before the impact of any change in the estimated fair value of the company’s warrant, earnout shares and tax receivable agreement liabilities, reorganization expenses, goodwill impairment, stock-based compensation, and certain other non-cash and non-core items, as described in the reconciliation included in the appendix to this presentation. We define and calculate Adjusted EBITDA as net income (loss) before the impact of interest income or expense, income tax expense and depreciation and amortization, and further adjusted for the following items: change in the estimated fair value of the company’s warrant, earnout shares and tax receivable agreement liabilities, reorganization expenses, goodwill impairment, stock-based compensation, and certain other non-cash and non-core items, as described in the reconciliation included in the appendix to this presentation. Adjusted EBITDA excludes certain expenses that are required in accordance with U.S. GAAP because they are non-recurring (for example, in the case of reorganization expenses), non-cash (for example, in the case of depreciation, amortization, goodwill impairment, and stock-based compensation) or are not related to our underlying business performance (for example, in the case of interest income and expense). Adjusted EBITDA margin represents Adjusted EBITDA divided by total revenue. We include these non-GAAP financial measures because they are used by management to evaluate Fathom’s core operating performance and trends and to make strategic decisions regarding the allocation of capital and new investments. Information reconciling forward-looking Adjusted EBITDA to GAAP financial measures is unavailable to Fathom without unreasonable effort. The company is not able to provide reconciliations of forward-looking Adjusted EBITDA to GAAP financial measures because certain items required for such reconciliations are outside of Fathom's control and/or cannot be reasonably predicted, such as the provision for income taxes. Preparation of such reconciliations would require a forward-looking balance sheet, statement of income and statement of cash flow, prepared in accordance with GAAP, and such forward-looking financial statements are unavailable to Fathom without unreasonable effort. Fathom provides a range for its Adjusted EBITDA forecast that it believes will be achieved, however it cannot accurately predict all the components of the Adjusted EBITDA calculation. Fathom provides an Adjusted EBITDA forecast because it believes that Adjusted EBITDA, when viewed with the company's results under GAAP, provides useful information for the reasons noted above. However, Adjusted EBITDA is not a measure of financial performance or liquidity under GAAP and, accordingly, should not be considered as an alternative to net income or cash flow from operating activities as an indicator of operating performance or liquidity. Financial Disclosure Disclaimer Fathom has not yet completed its reporting process for the three and twelve months ended December 31, 2022. The company expects to submit a notification of late filing on Form 12b-25 with the SEC on March 31, 2023. The preliminary unaudited results presented herein are based on Fathom’s reasonable estimates and the information available at this time. The amounts reported herein are subject to various adjustments that are still under review and relate specifically to potential changes in the provision for income taxes. Such adjustments may be material and could impact the results reported herein. Disclaimers
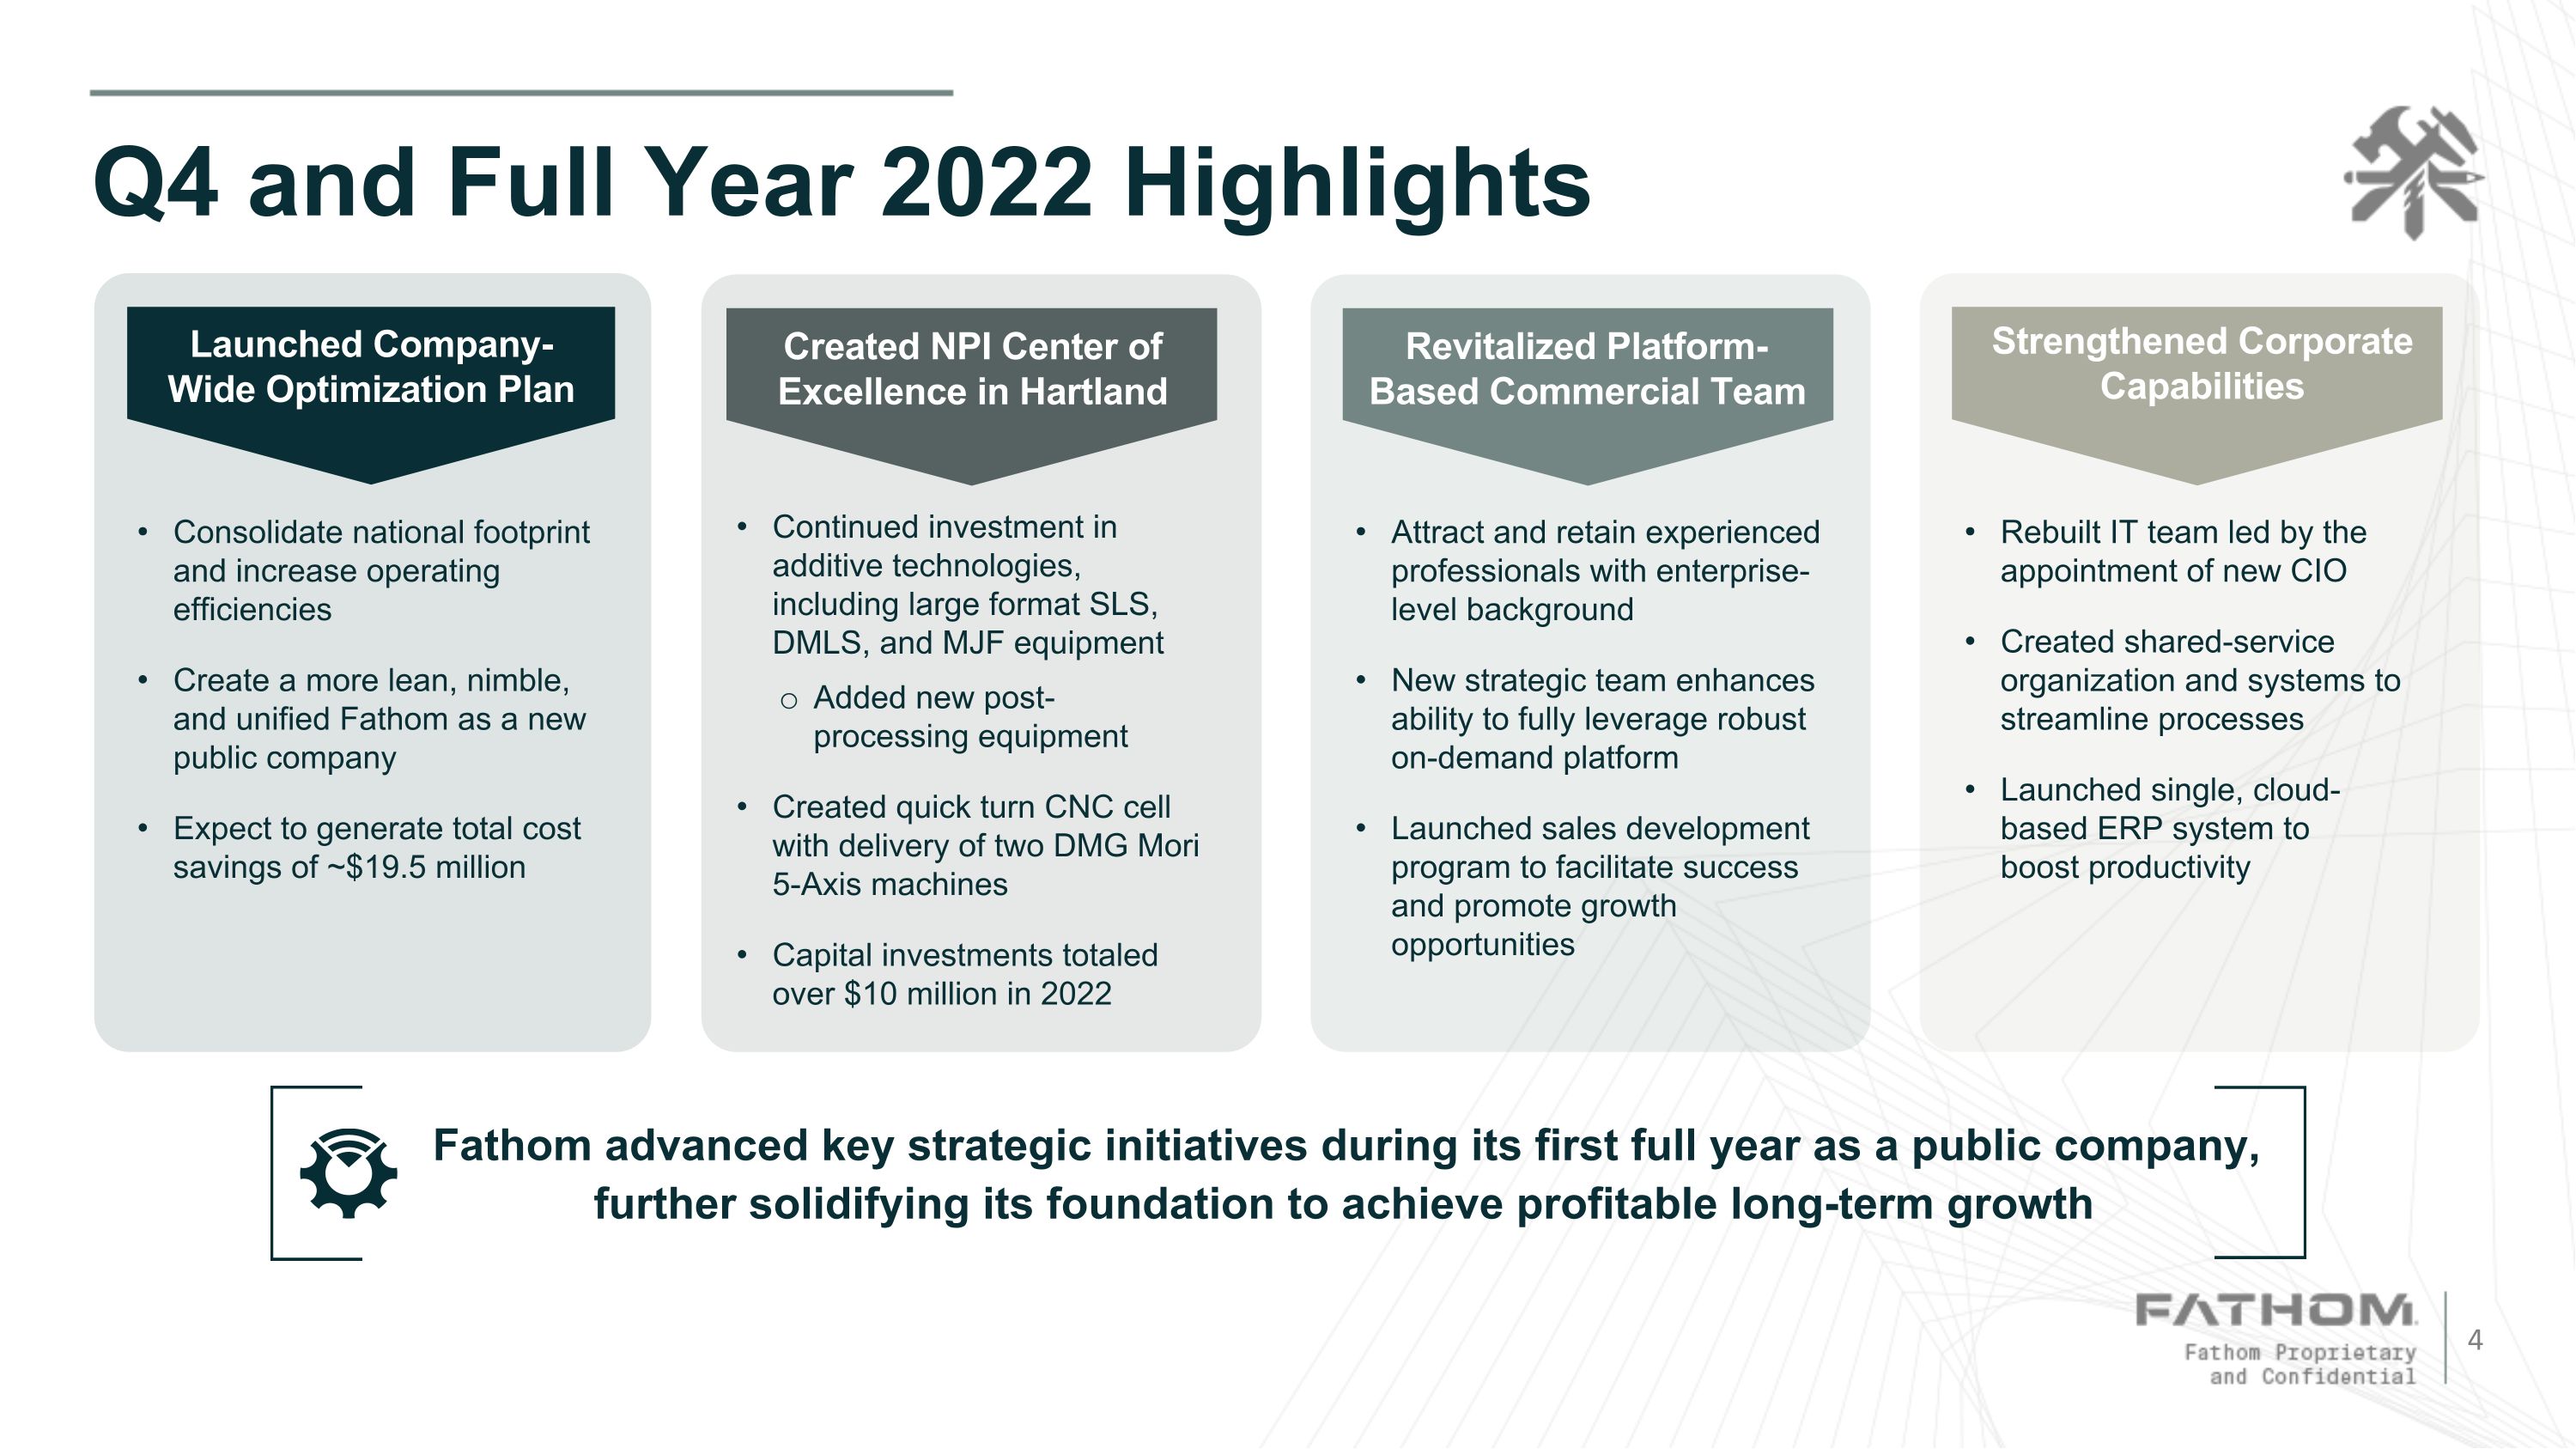
Q4 and Full Year 2022 Highlights Revitalized Platform-Based Commercial Team Attract and retain experienced professionals with enterprise-level background New strategic team enhances ability to fully leverage robust on-demand platform Launched sales development program to facilitate success and promote growth opportunities Created NPI Center of Excellence in Hartland Continued investment in additive technologies, including large format SLS, DMLS, and MJF equipment Added new post-processing equipment Created quick turn CNC cell with delivery of two DMG Mori 5-Axis machines Capital investments totaled over $10 million in 2022 Launched Company-Wide Optimization Plan Consolidate national footprint and increase operating efficiencies Create a more lean, nimble, and unified Fathom as a new public company Expect to generate total cost savings of ~$19.5 million Fathom advanced key strategic initiatives during its first full year as a public company, further solidifying its foundation to achieve profitable long-term growth Strengthened Corporate Capabilities Rebuilt IT team led by the appointment of new CIO Created shared-service organization and systems to streamline processes Launched single, cloud-based ERP system to boost productivity
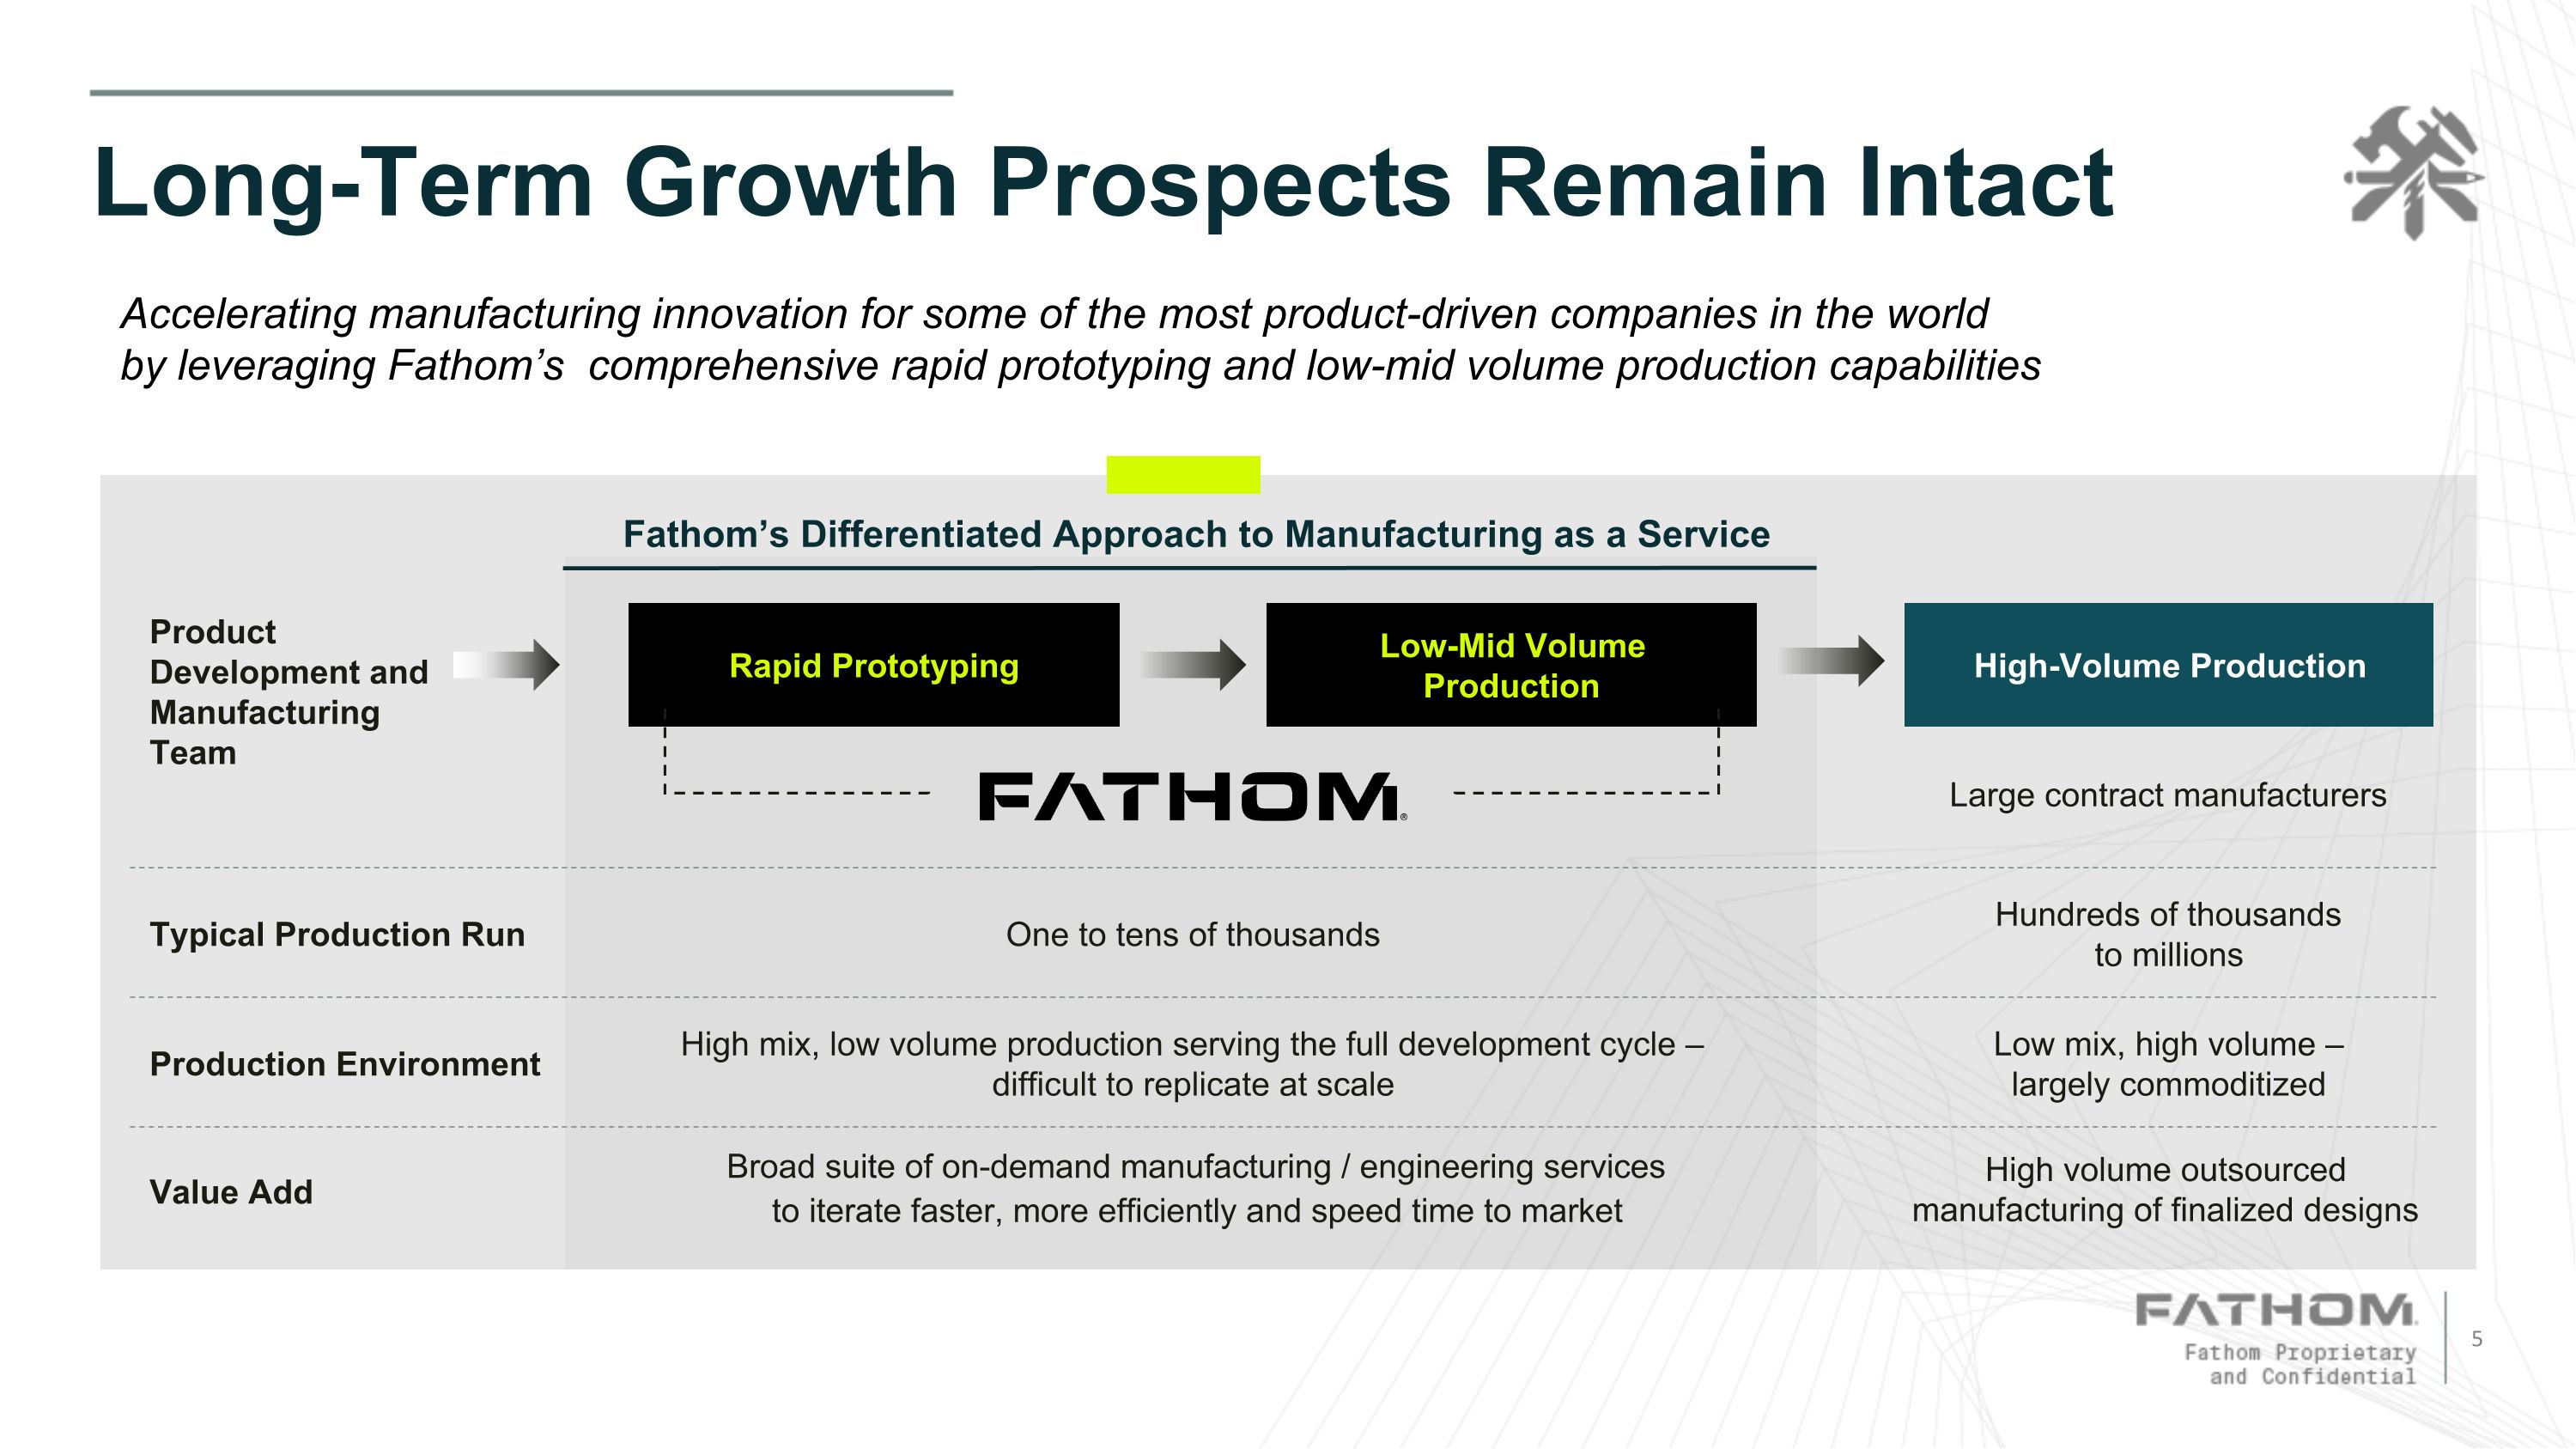
Accelerating manufacturing innovation for some of the most product-driven companies in the world by leveraging Fathom’s comprehensive rapid prototyping and low-mid volume production capabilities Long-Term Growth Prospects Remain Intact Fathom’s Differentiated Approach to Manufacturing as a Service Rapid Prototyping Low-Mid Volume Production High-Volume Production Typical Production Run Production Environment Value Add One to tens of thousands High mix, low volume production serving the full development cycle – difficult to replicate at scale Broad suite of on-demand manufacturing / engineering services to iterate faster, more efficiently and speed time to market Hundreds of thousands to millions Low mix, high volume – largely commoditized High volume outsourced manufacturing of finalized designs Product Development and Manufacturing Team Large contract manufacturers
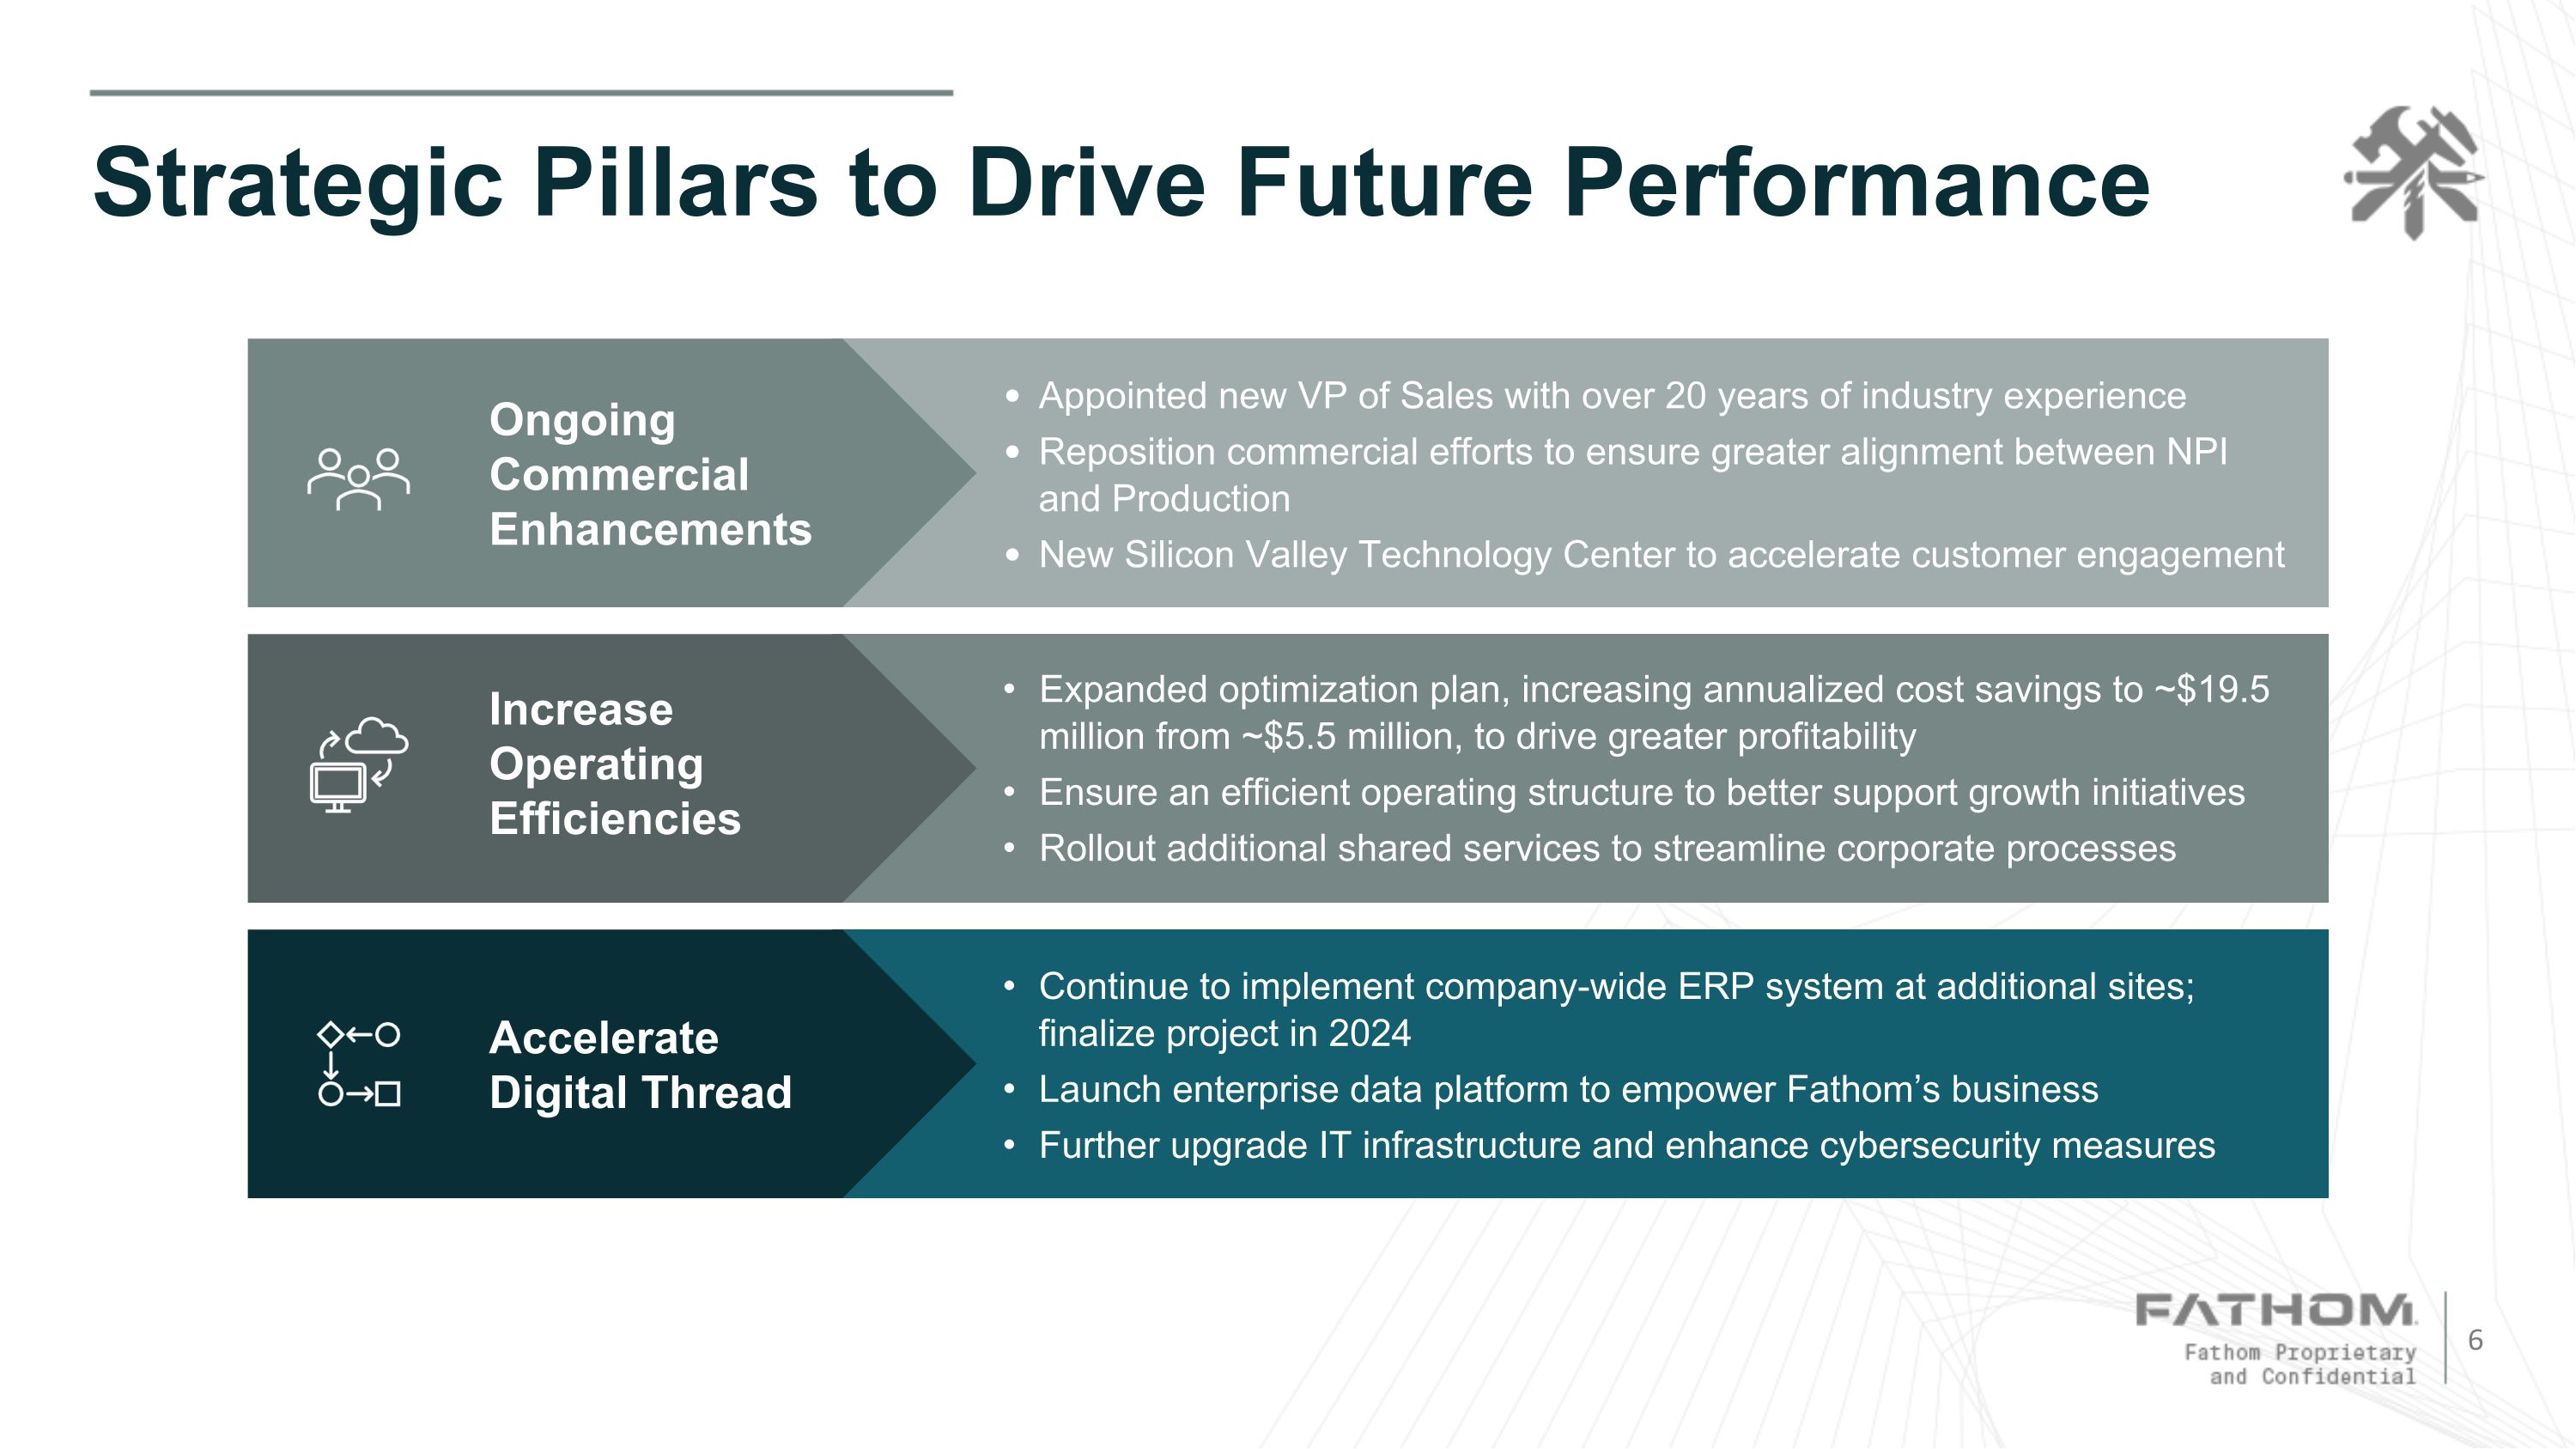
Strategic Pillars to Drive Future Performance Ongoing Commercial Enhancements Appointed new VP of Sales with over 20 years of industry experience Reposition commercial efforts to ensure greater alignment between NPI and Production New Silicon Valley Technology Center to accelerate customer engagement Increase Operating Efficiencies Expanded optimization plan, increasing annualized cost savings to ~$19.5 million from ~$5.5 million, to drive greater profitability Ensure an efficient operating structure to better support growth initiatives Rollout additional shared services to streamline corporate processes Accelerate Digital Thread Continue to implement company-wide ERP system at additional sites; finalize project in 2024 Launch enterprise data platform to empower Fathom’s business Further upgrade IT infrastructure and enhance cybersecurity measures
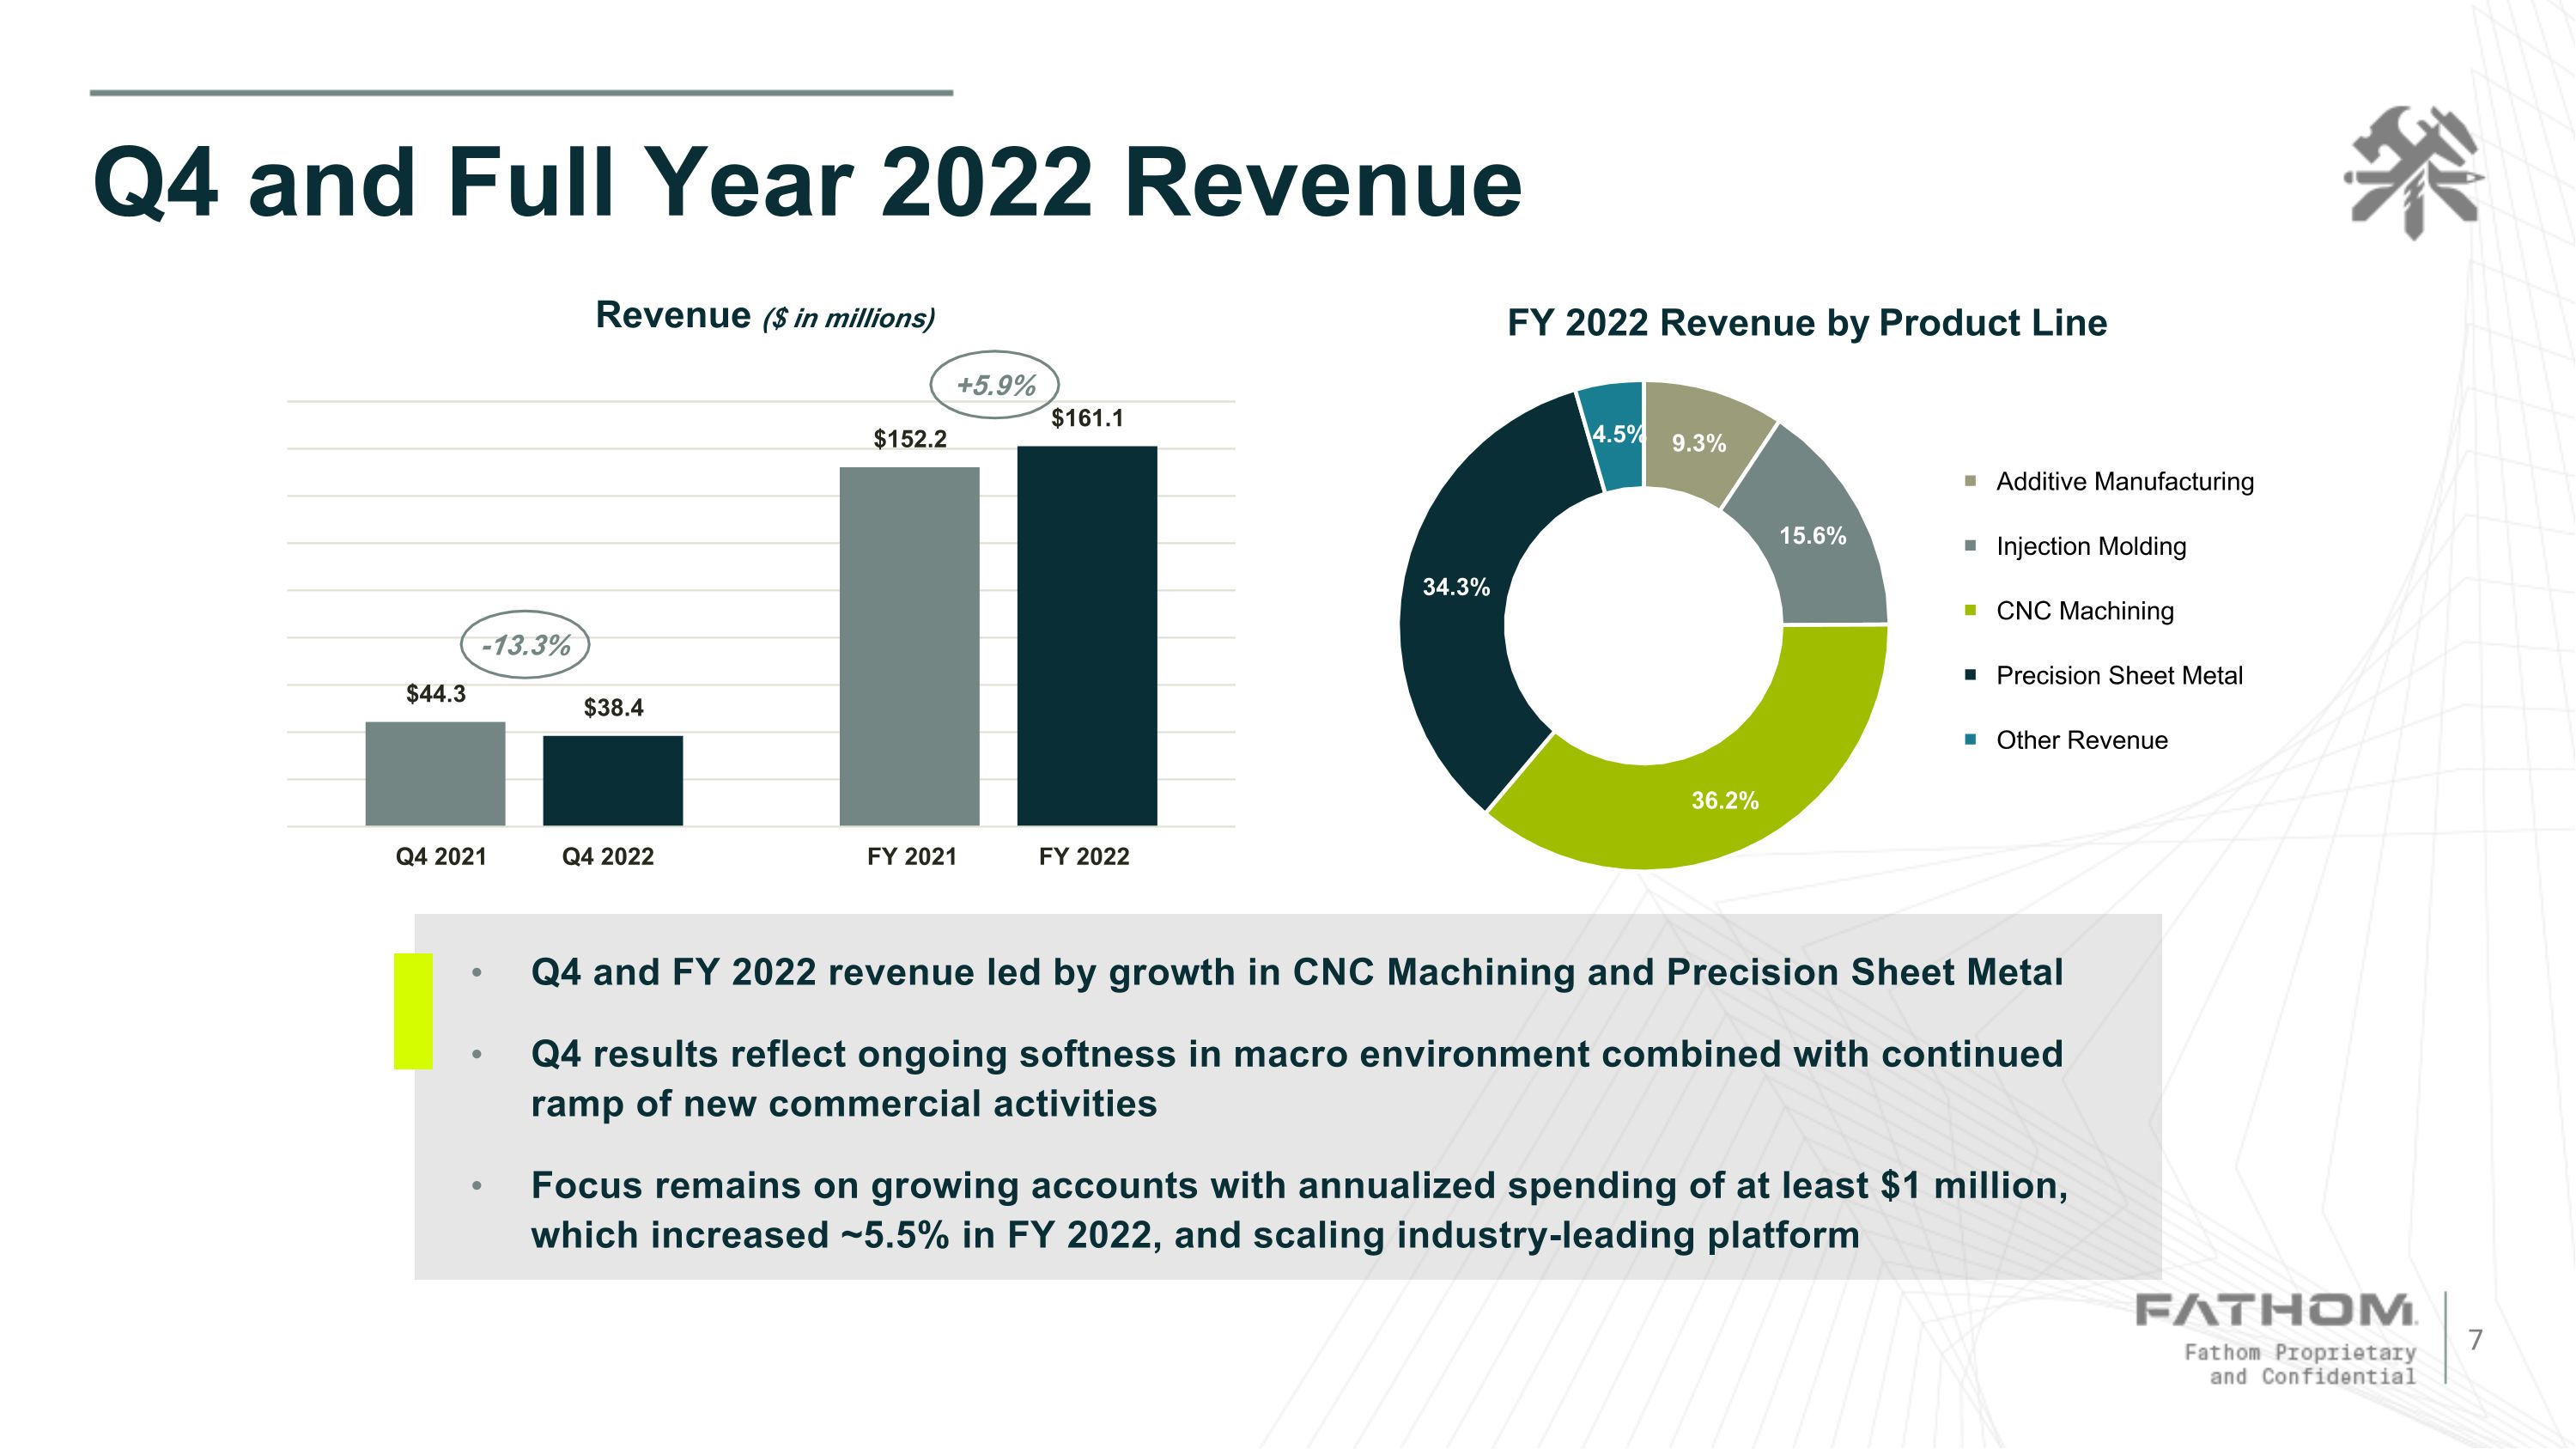
Q4 and Full Year 2022 Revenue Q4 and FY 2022 revenue led by growth in CNC Machining and Precision Sheet Metal Q4 results reflect ongoing softness in macro environment combined with continued ramp of new commercial activities Focus remains on growing accounts with annualized spending of at least $1 million, which increased ~5.5% in FY 2022, and scaling industry-leading platform +5.9% -13.3%
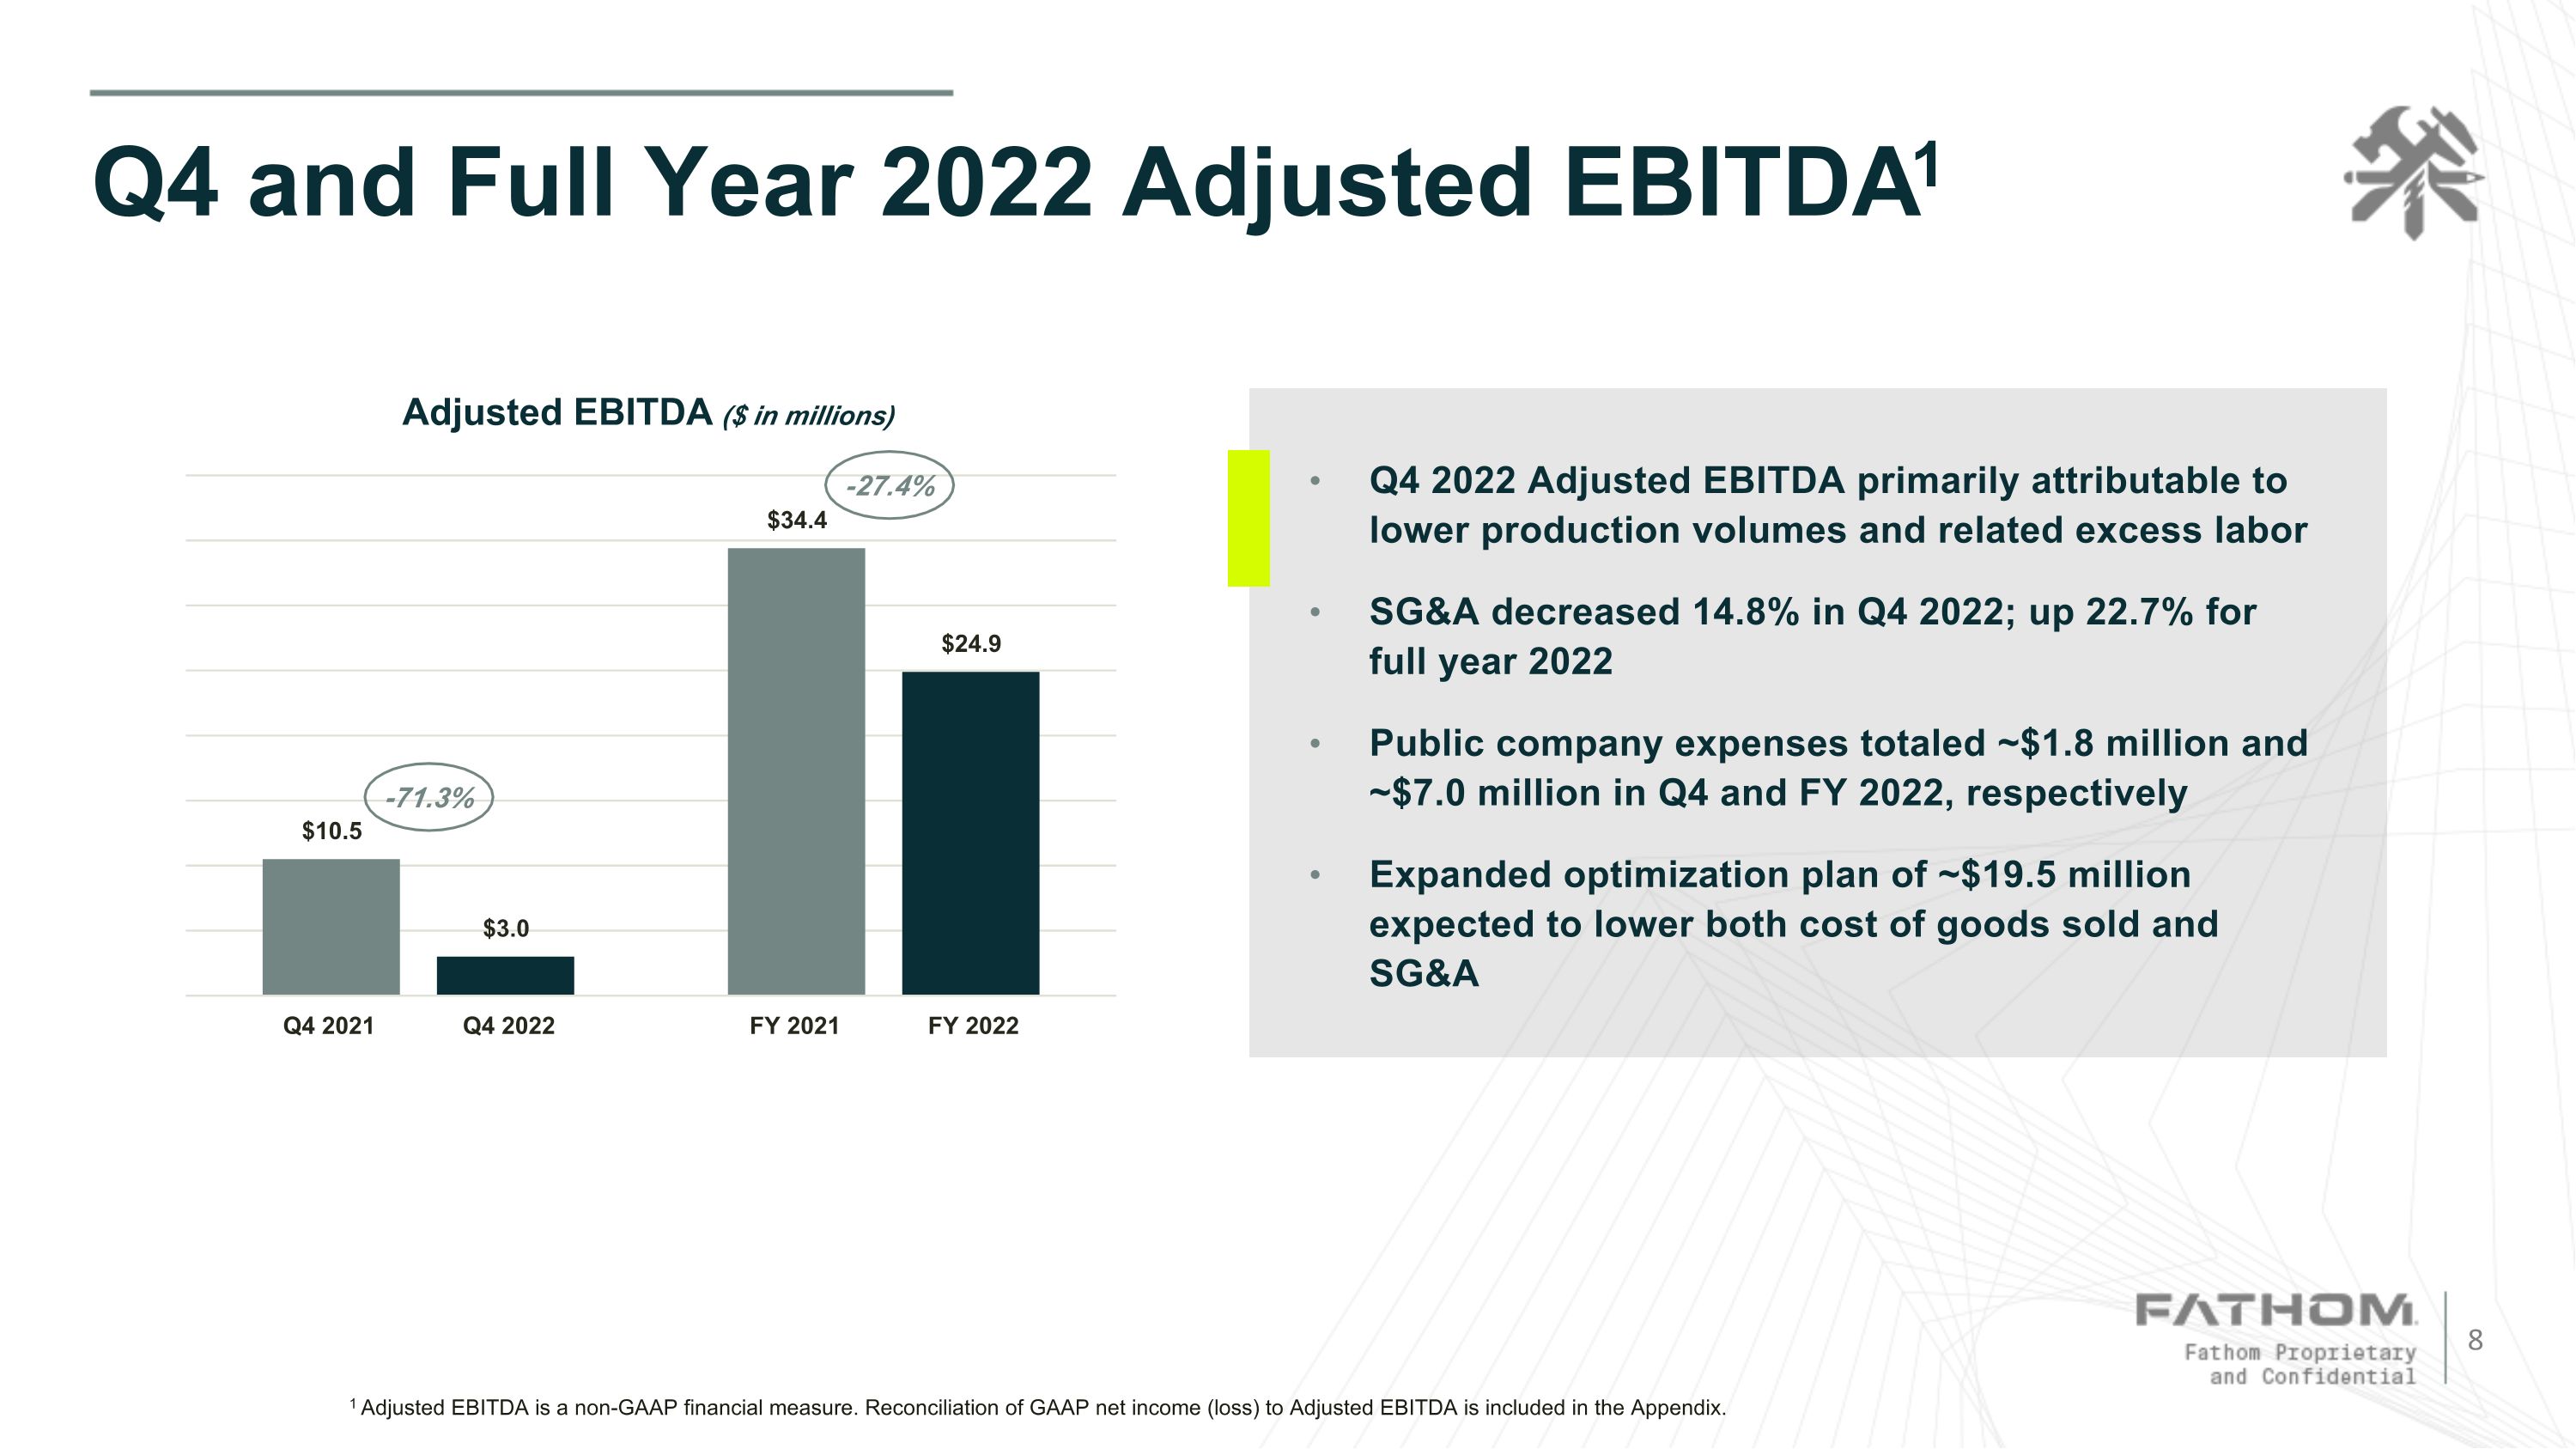
Q4 and Full Year 2022 Adjusted EBITDA1 1 Adjusted EBITDA is a non-GAAP financial measure. Reconciliation of GAAP net income (loss) to Adjusted EBITDA is included in the Appendix. Q4 2022 Adjusted EBITDA primarily attributable to lower production volumes and related excess labor SG&A decreased 14.8% in Q4 2022; up 22.7% for full year 2022 Public company expenses totaled ~$1.8 million and ~$7.0 million in Q4 and FY 2022, respectively Expanded optimization plan of ~$19.5 million expected to lower both cost of goods sold and SG&A -27.4% -71.3%
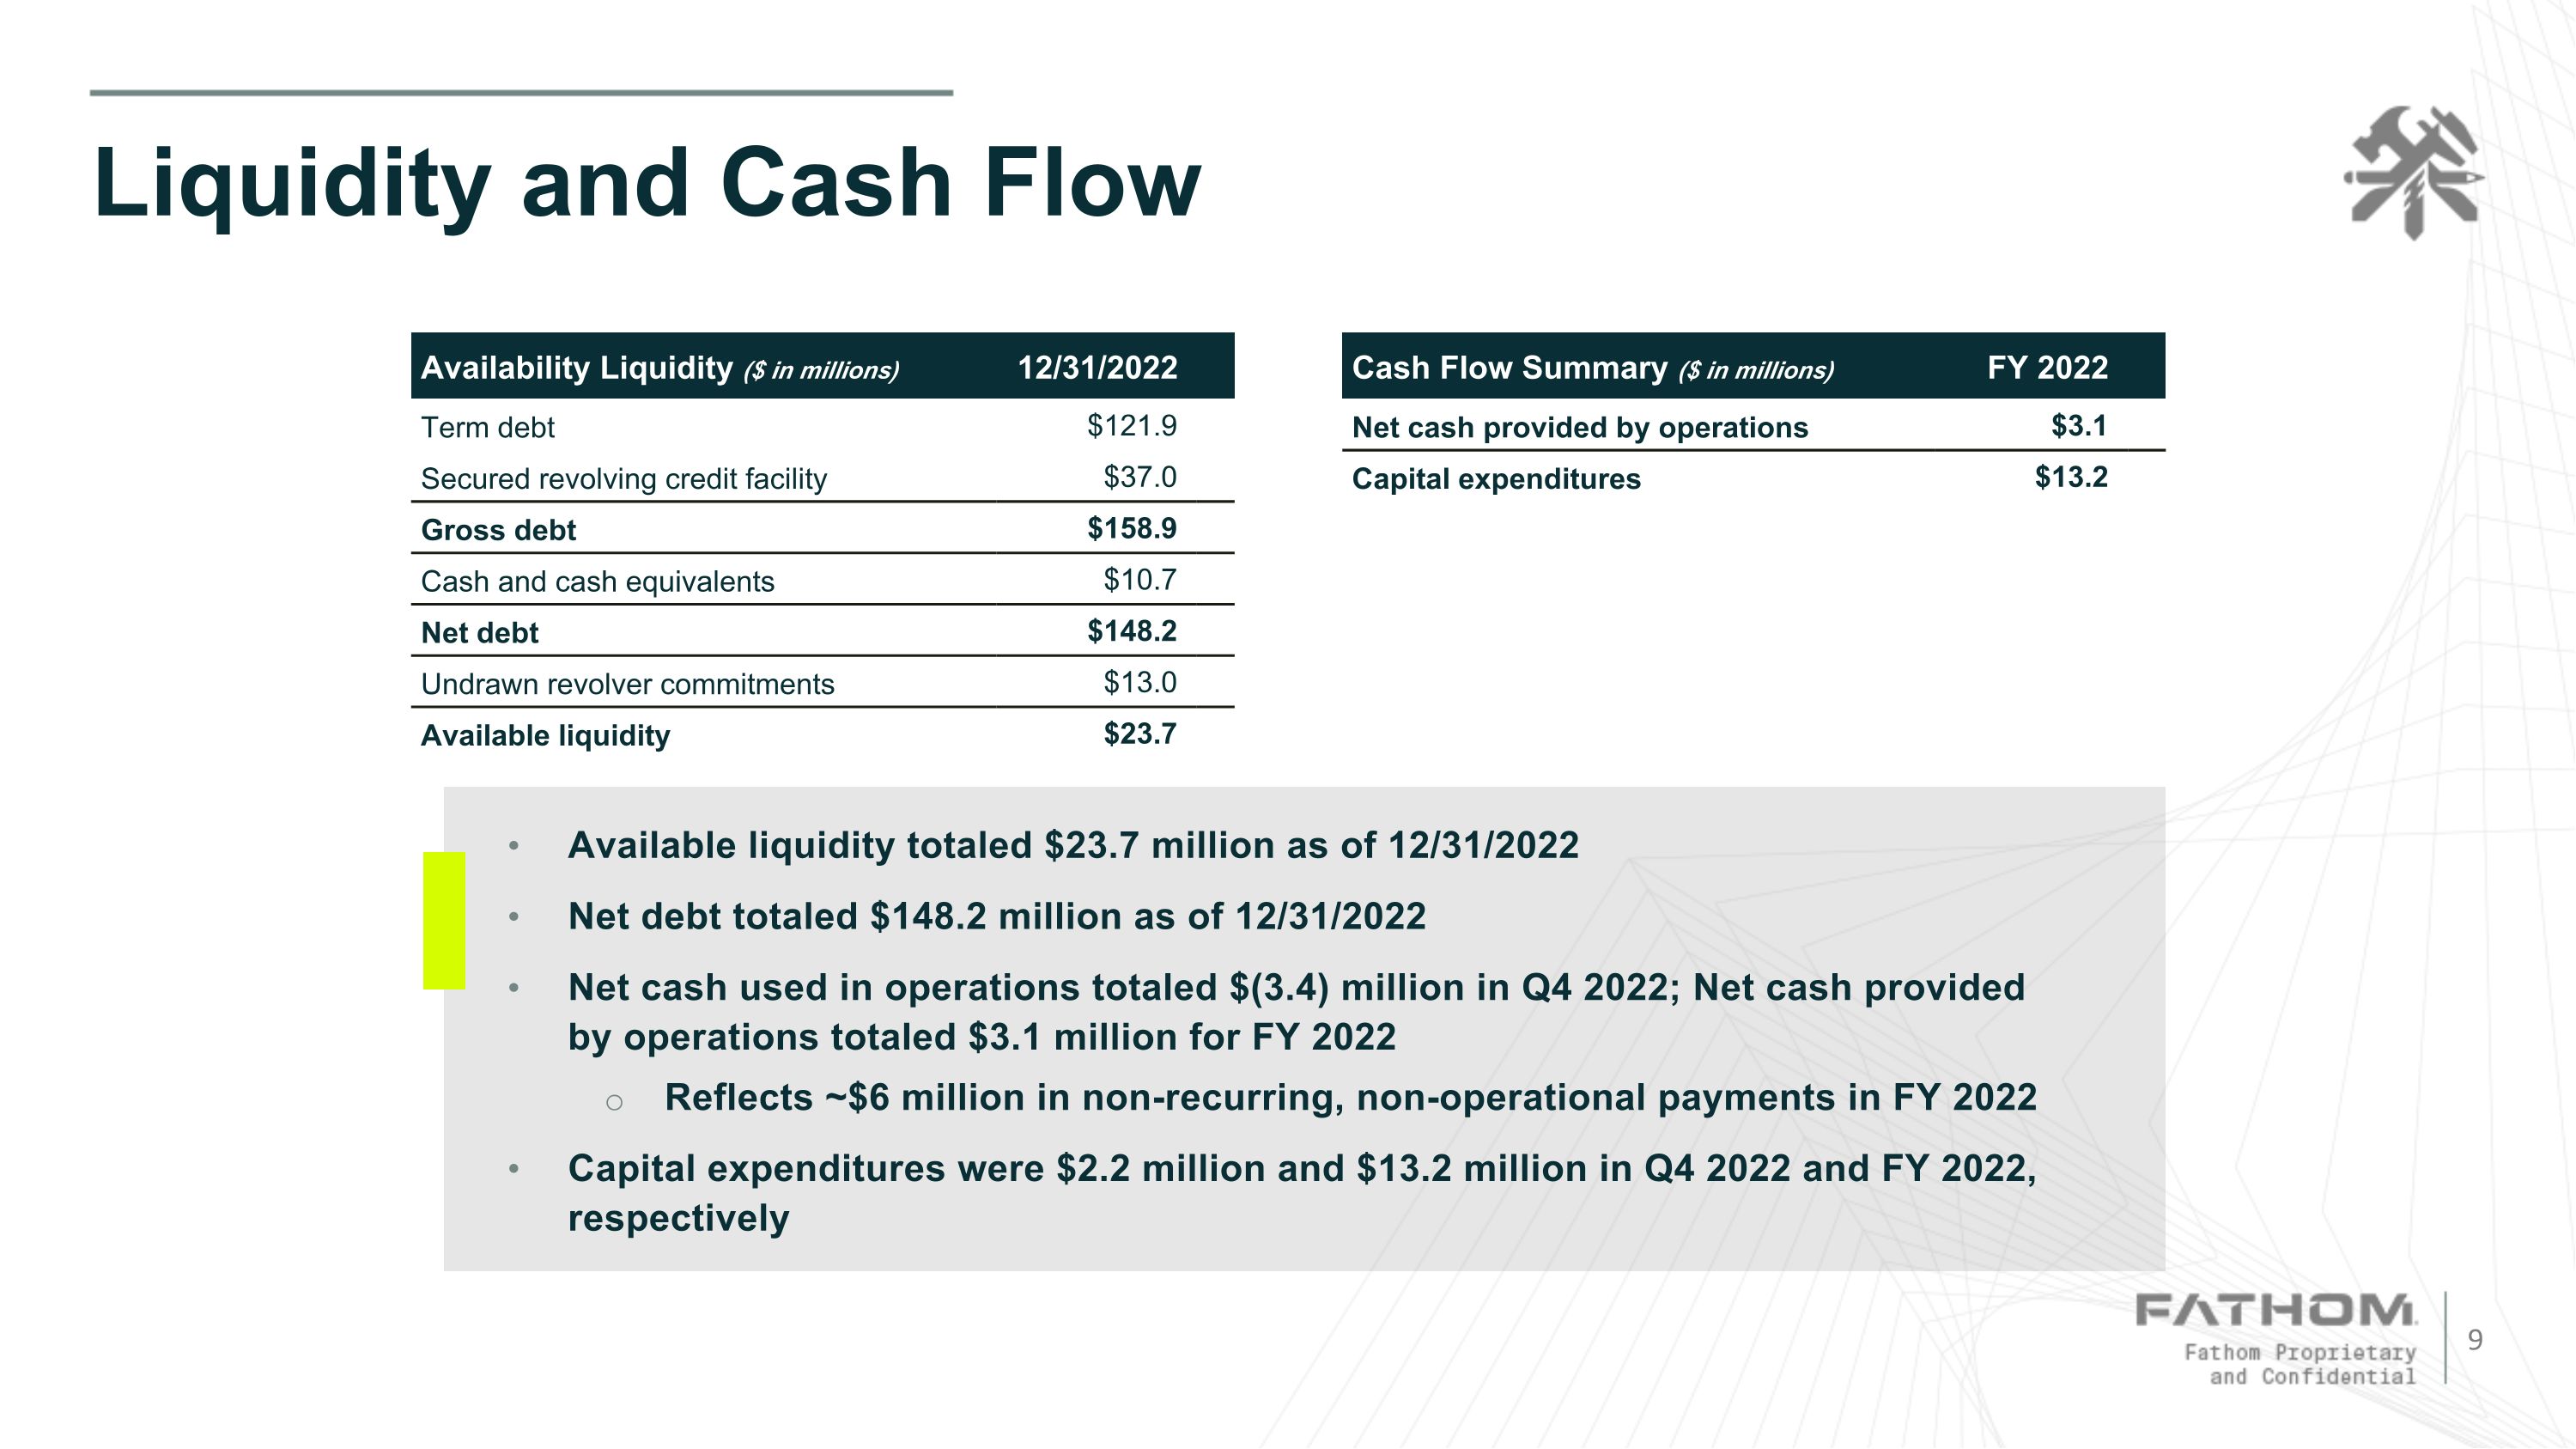
Liquidity and Cash Flow Availability Liquidity ($ in millions) 12/31/2022 Term debt $121.9 Secured revolving credit facility $37.0 Gross debt $158.9 Cash and cash equivalents $10.7 Net debt $148.2 Undrawn revolver commitments $13.0 Available liquidity $23.7 Cash Flow Summary ($ in millions) FY 2022 Net cash provided by operations $3.1 Capital expenditures $13.2 Available liquidity totaled $23.7 million as of 12/31/2022 Net debt totaled $148.2 million as of 12/31/2022 Net cash used in operations totaled $(3.4) million in Q4 2022; Net cash provided by operations totaled $3.1 million for FY 2022 Reflects ~$6 million in non-recurring, non-operational payments in FY 2022 Capital expenditures were $2.2 million and $13.2 million in Q4 2022 and FY 2022, respectively
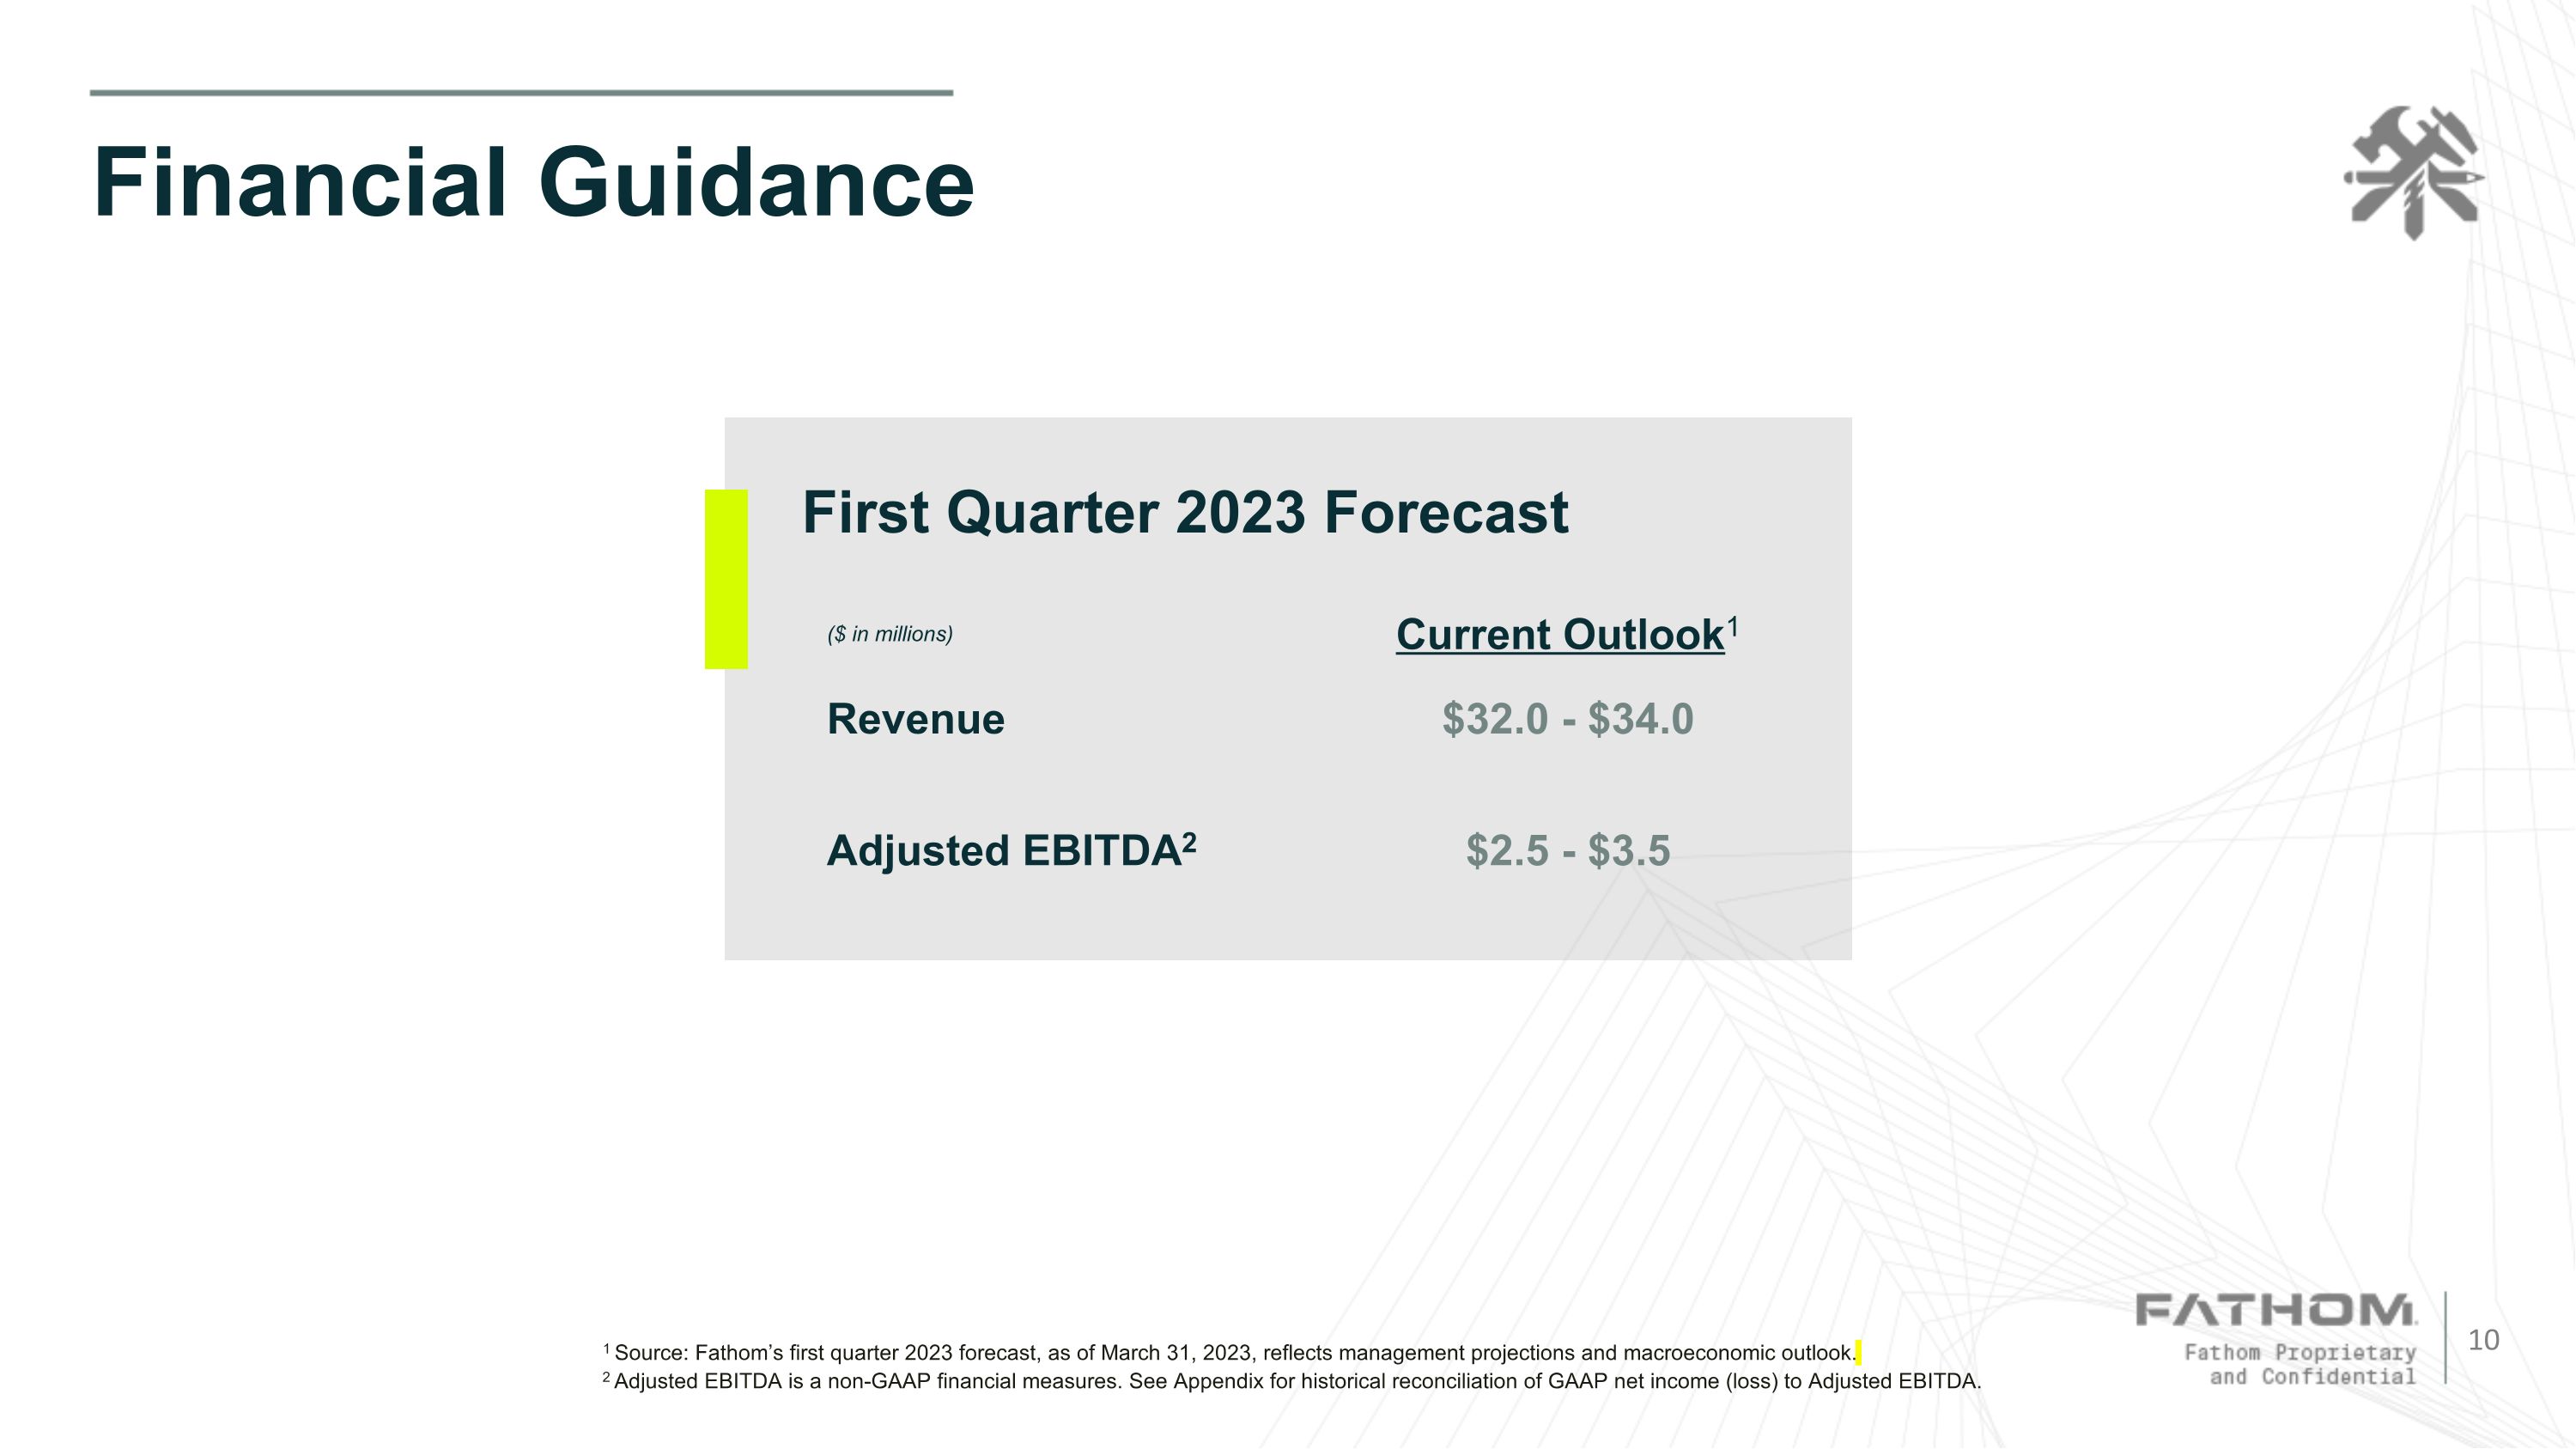
Financial Guidance 1 Source: Fathom’s first quarter 2023 forecast, as of March 31, 2023, reflects management projections and macroeconomic outlook. 2 Adjusted EBITDA is a non-GAAP financial measures. See Appendix for historical reconciliation of GAAP net income (loss) to Adjusted EBITDA. ($ in millions) Current Outlook1 Revenue $32.0 - $34.0 Adjusted EBITDA2 $2.5 - $3.5 First Quarter 2023 Forecast
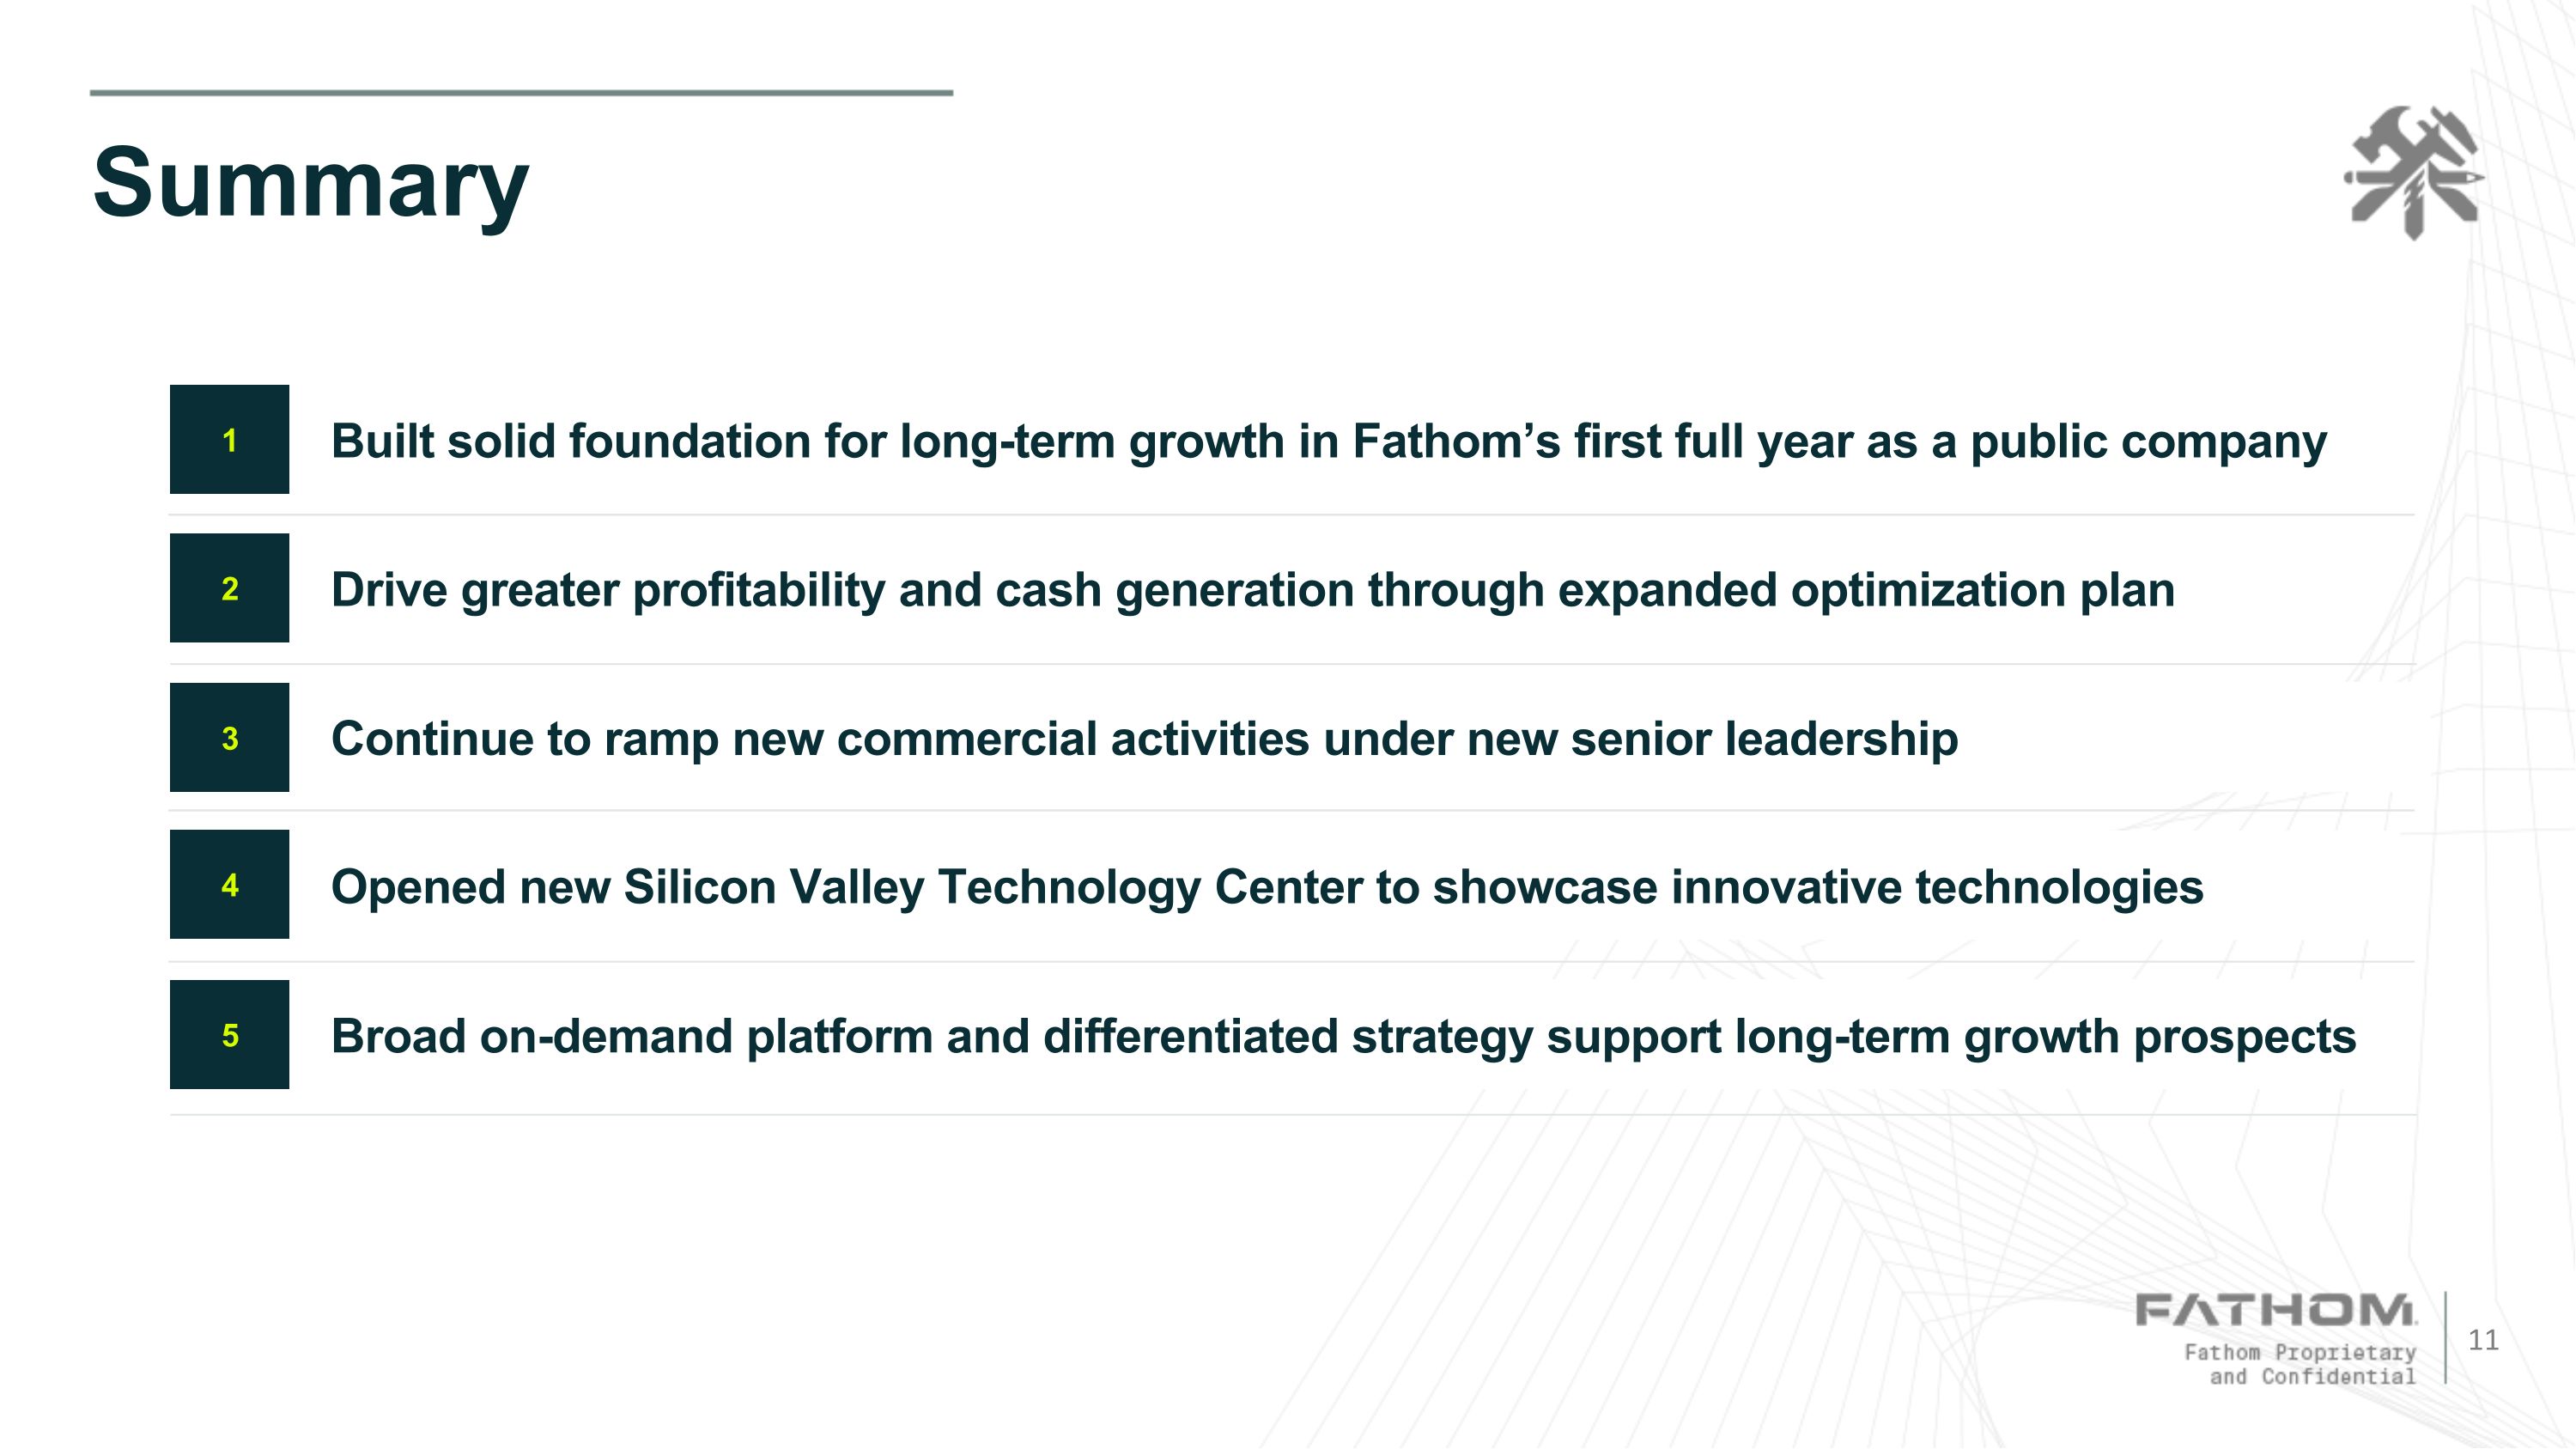
Summary Built solid foundation for long-term growth in Fathom’s first full year as a public company 1 2 4 5 3 Drive greater profitability and cash generation through expanded optimization plan Opened new Silicon Valley Technology Center to showcase innovative technologies Broad on-demand platform and differentiated strategy support long-term growth prospects Continue to ramp new commercial activities under new senior leadership
Appendix
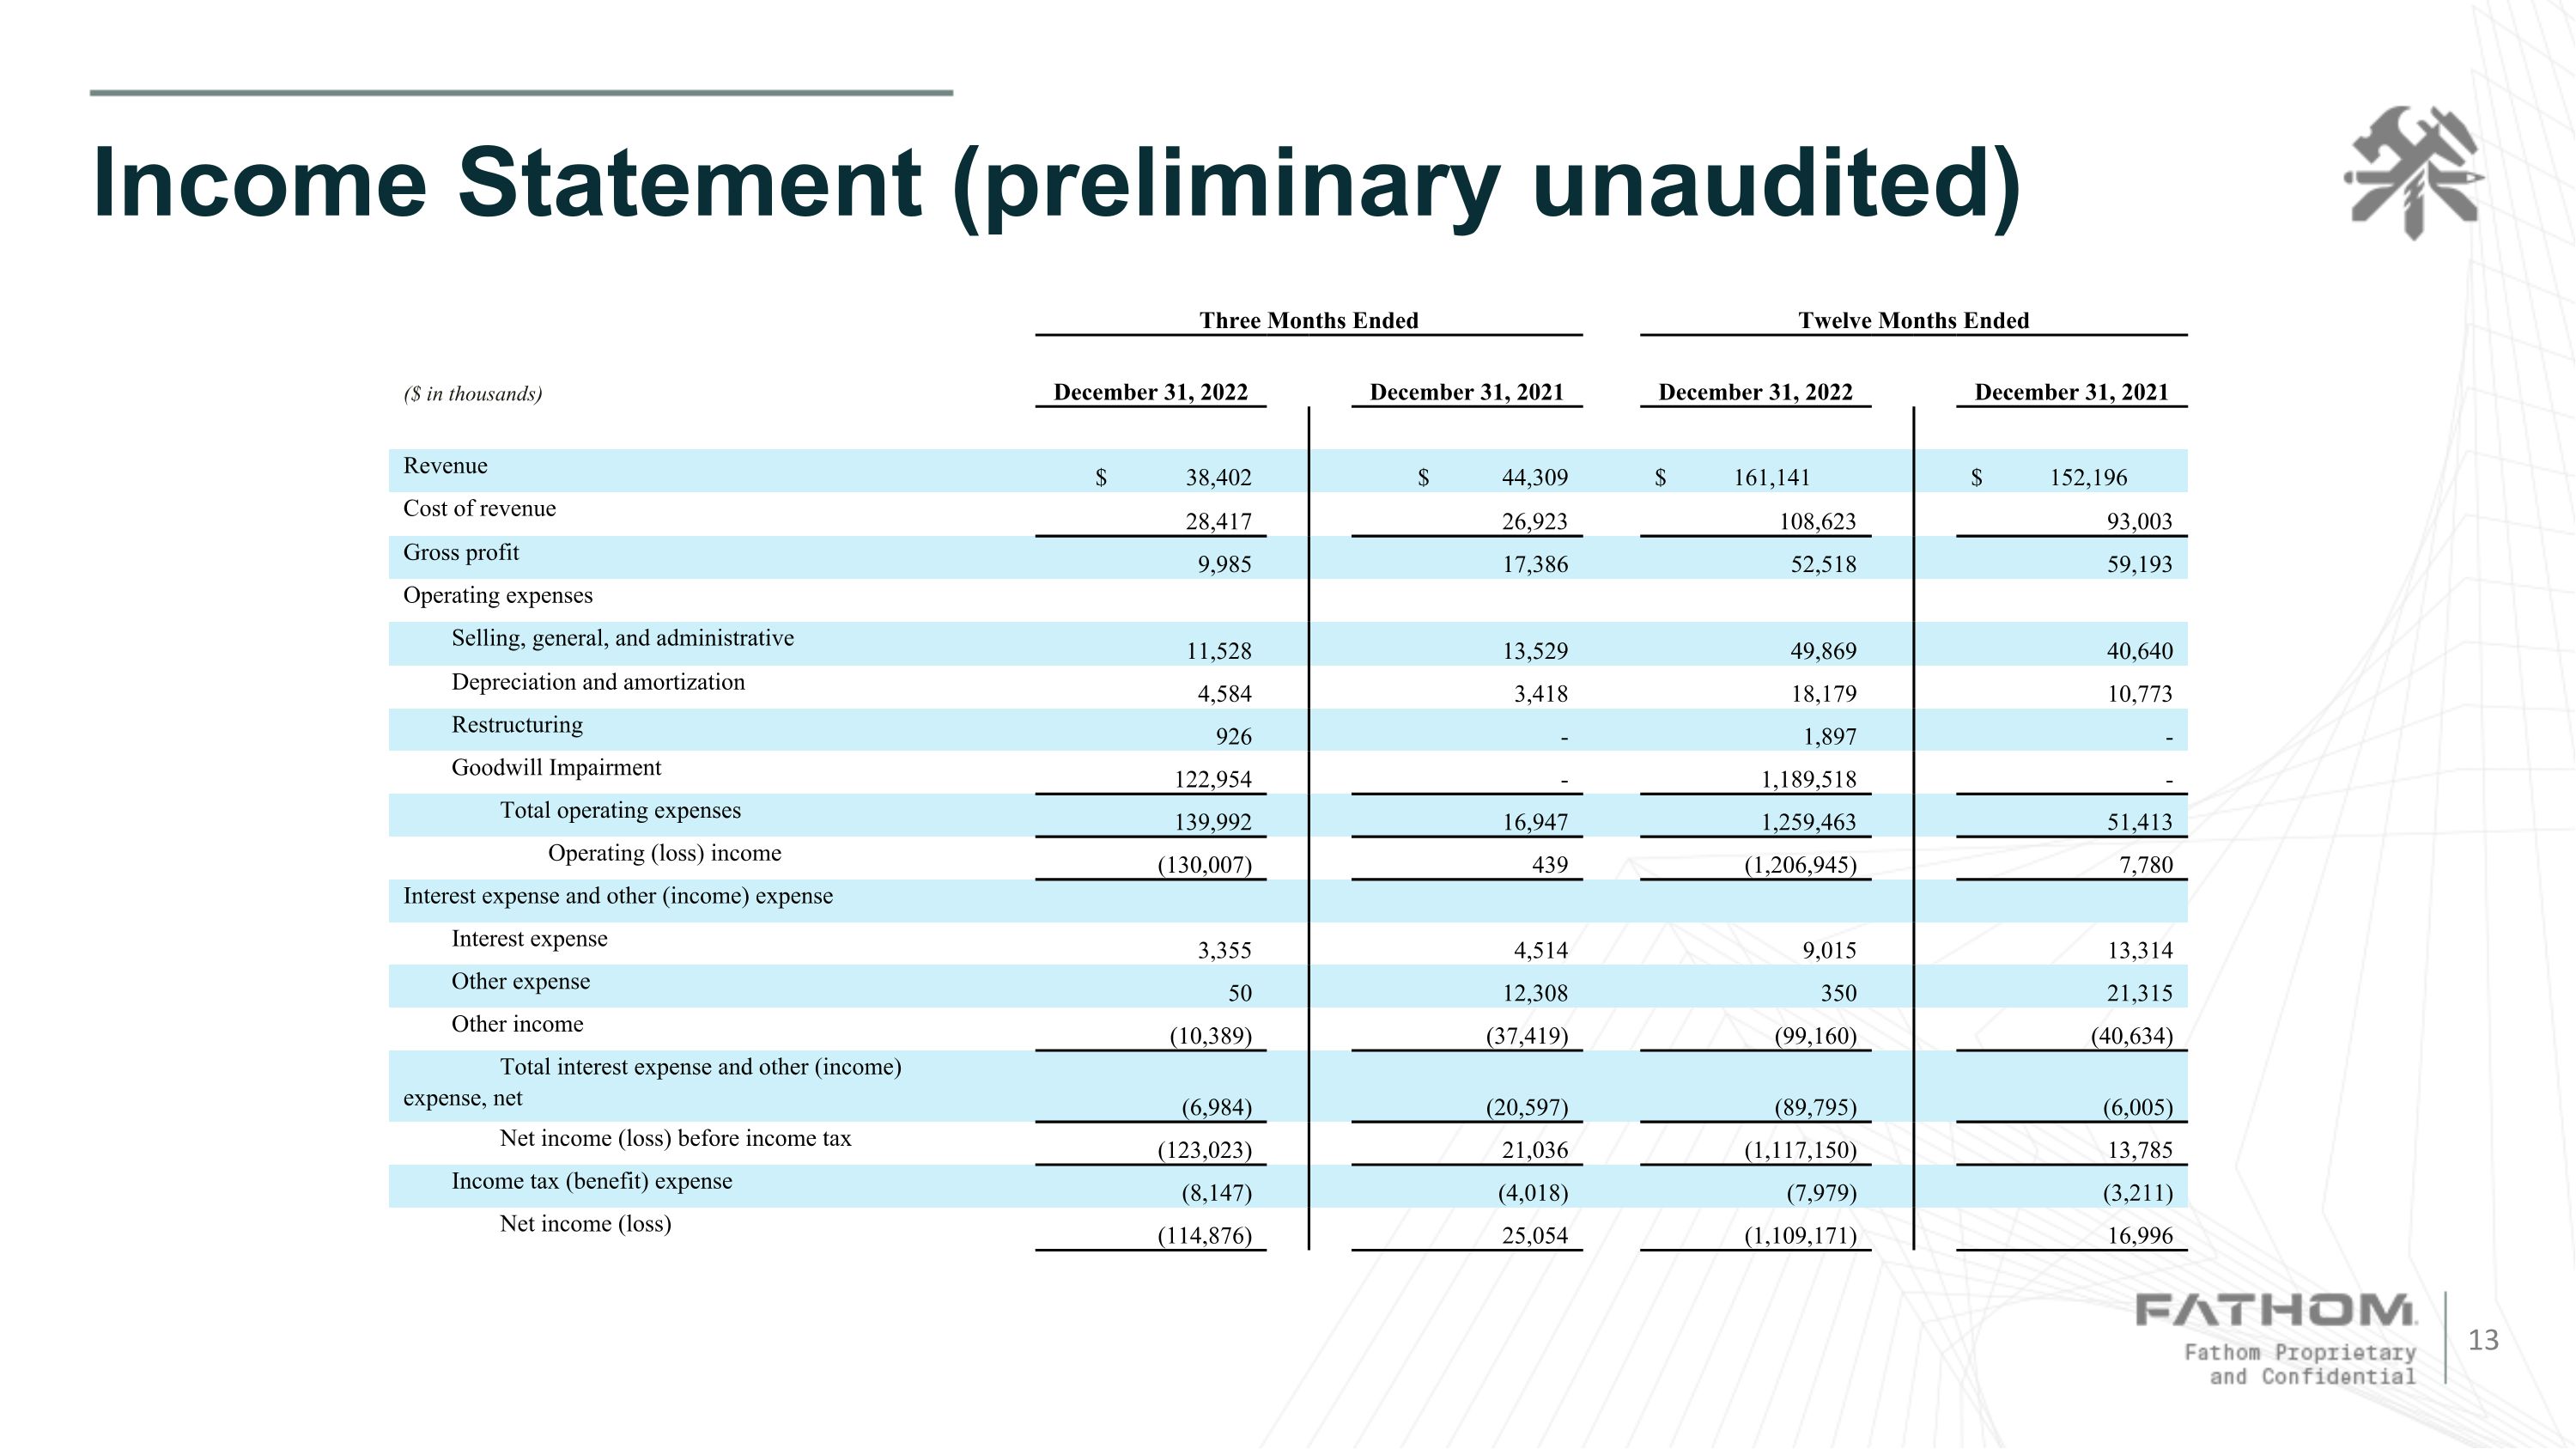
Income Statement (preliminary unaudited) Three Months Ended Twelve Months Ended ($ in thousands) December 31, 2022 December 31, 2021 December 31, 2022 December 31, 2021 Revenue $ 38,402 $ 44,309 $ 161,141 $ 152,196 Cost of revenue 28,417 26,923 108,623 93,003 Gross profit 9,985 17,386 52,518 59,193 Operating expenses Selling, general, and administrative 11,528 13,529 49,869 40,640 Depreciation and amortization 4,584 3,418 18,179 10,773 Restructuring 926 - 1,897 - Goodwill Impairment 122,954 - 1,189,518 - Total operating expenses 139,992 16,947 1,259,463 51,413 Operating (loss) income (130,007) 439 (1,206,945) 7,780 Interest expense and other (income) expense Interest expense 3,355 4,514 9,015 13,314 Other expense 50 12,308 350 21,315 Other income (10,389) (37,419) (99,160) (40,634) Total interest expense and other (income) expense, net (6,984) (20,597) (89,795) (6,005) Net income (loss) before income tax (123,023) 21,036 (1,117,150) 13,785 Income tax (benefit) expense (8,147) (4,018) (7,979) (3,211) Net income (loss) (114,876) 25,054 (1,109,171) 16,996
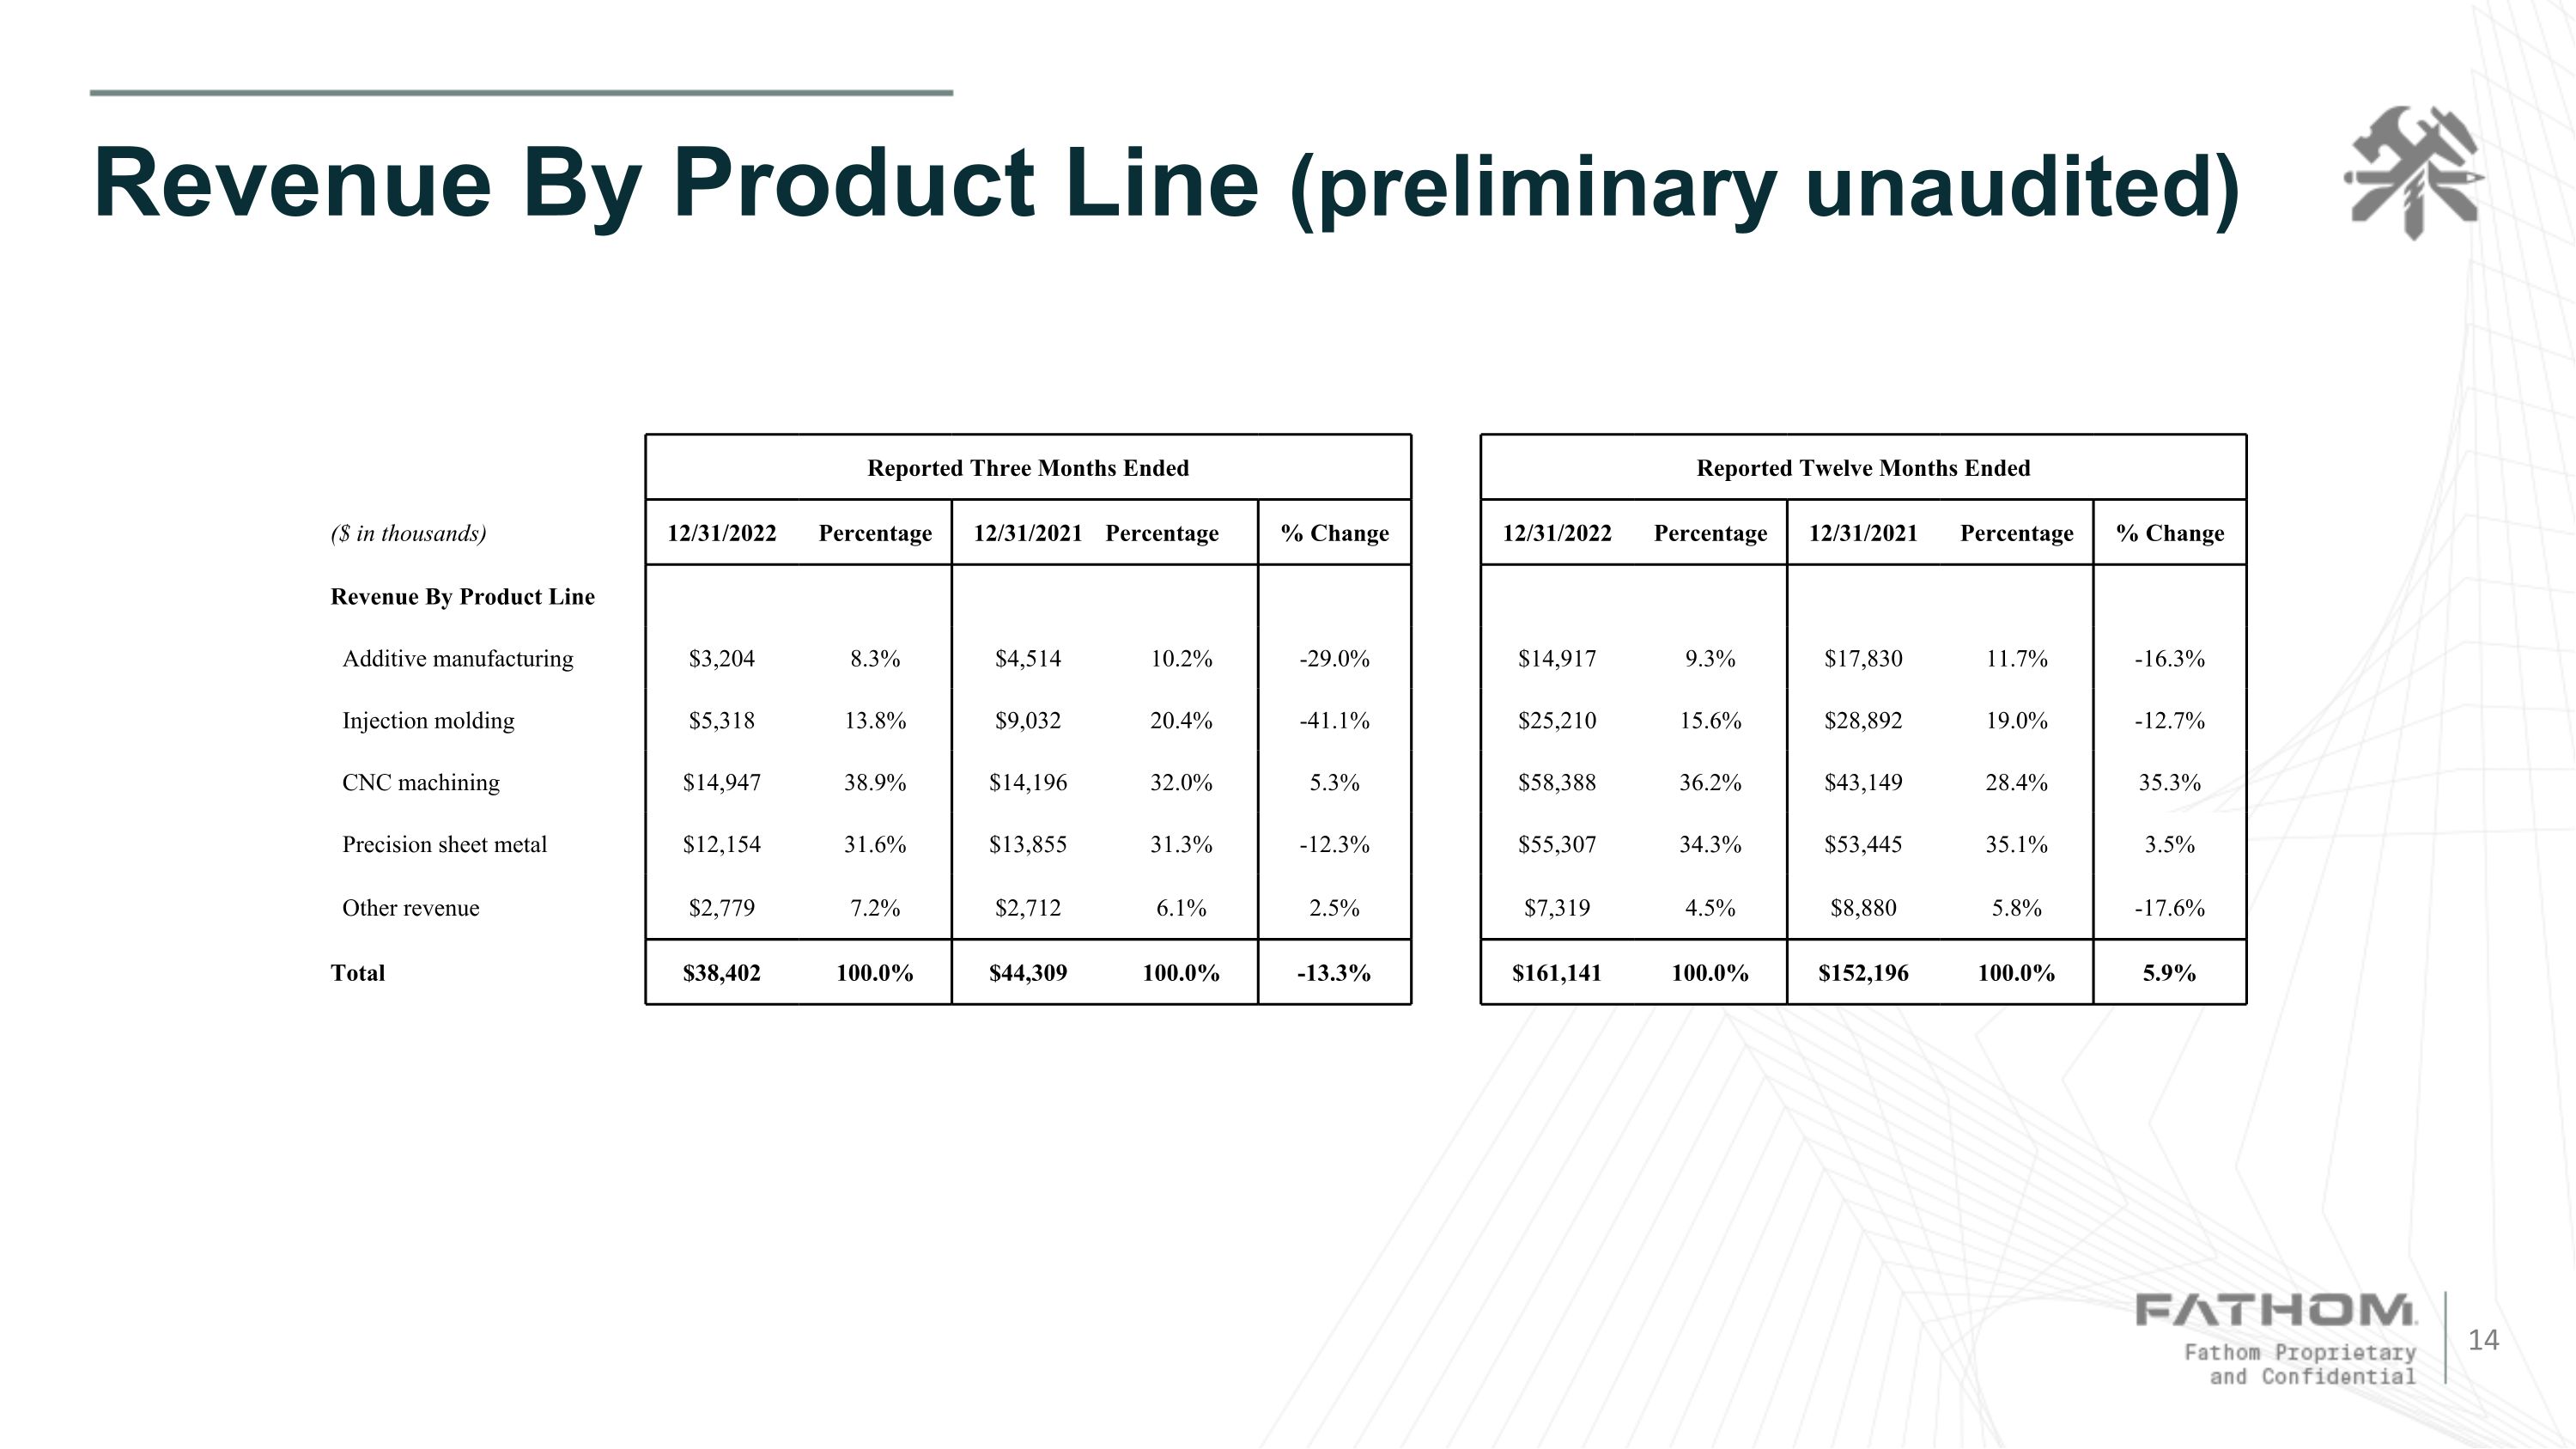
Revenue By Product Line (preliminary unaudited) Reported Three Months Ended Reported Twelve Months Ended ($ in thousands) 12/31/2022 Percentage 12/31/2021 Percentage % Change 12/31/2022 Percentage 12/31/2021 Percentage % Change Revenue By Product Line Additive manufacturing $3,204 8.3% $4,514 10.2% -29.0% $14,917 9.3% $17,830 11.7% -16.3% Injection molding $5,318 13.8% $9,032 20.4% -41.1% $25,210 15.6% $28,892 19.0% -12.7% CNC machining $14,947 38.9% $14,196 32.0% 5.3% $58,388 36.2% $43,149 28.4% 35.3% Precision sheet metal $12,154 31.6% $13,855 31.3% -12.3% $55,307 34.3% $53,445 35.1% 3.5% Other revenue $2,779 7.2% $2,712 6.1% 2.5% $7,319 4.5% $8,880 5.8% -17.6% Total $38,402 100.0% $44,309 100.0% -13.3% $161,141 100.0% $152,196 100.0% 5.9%
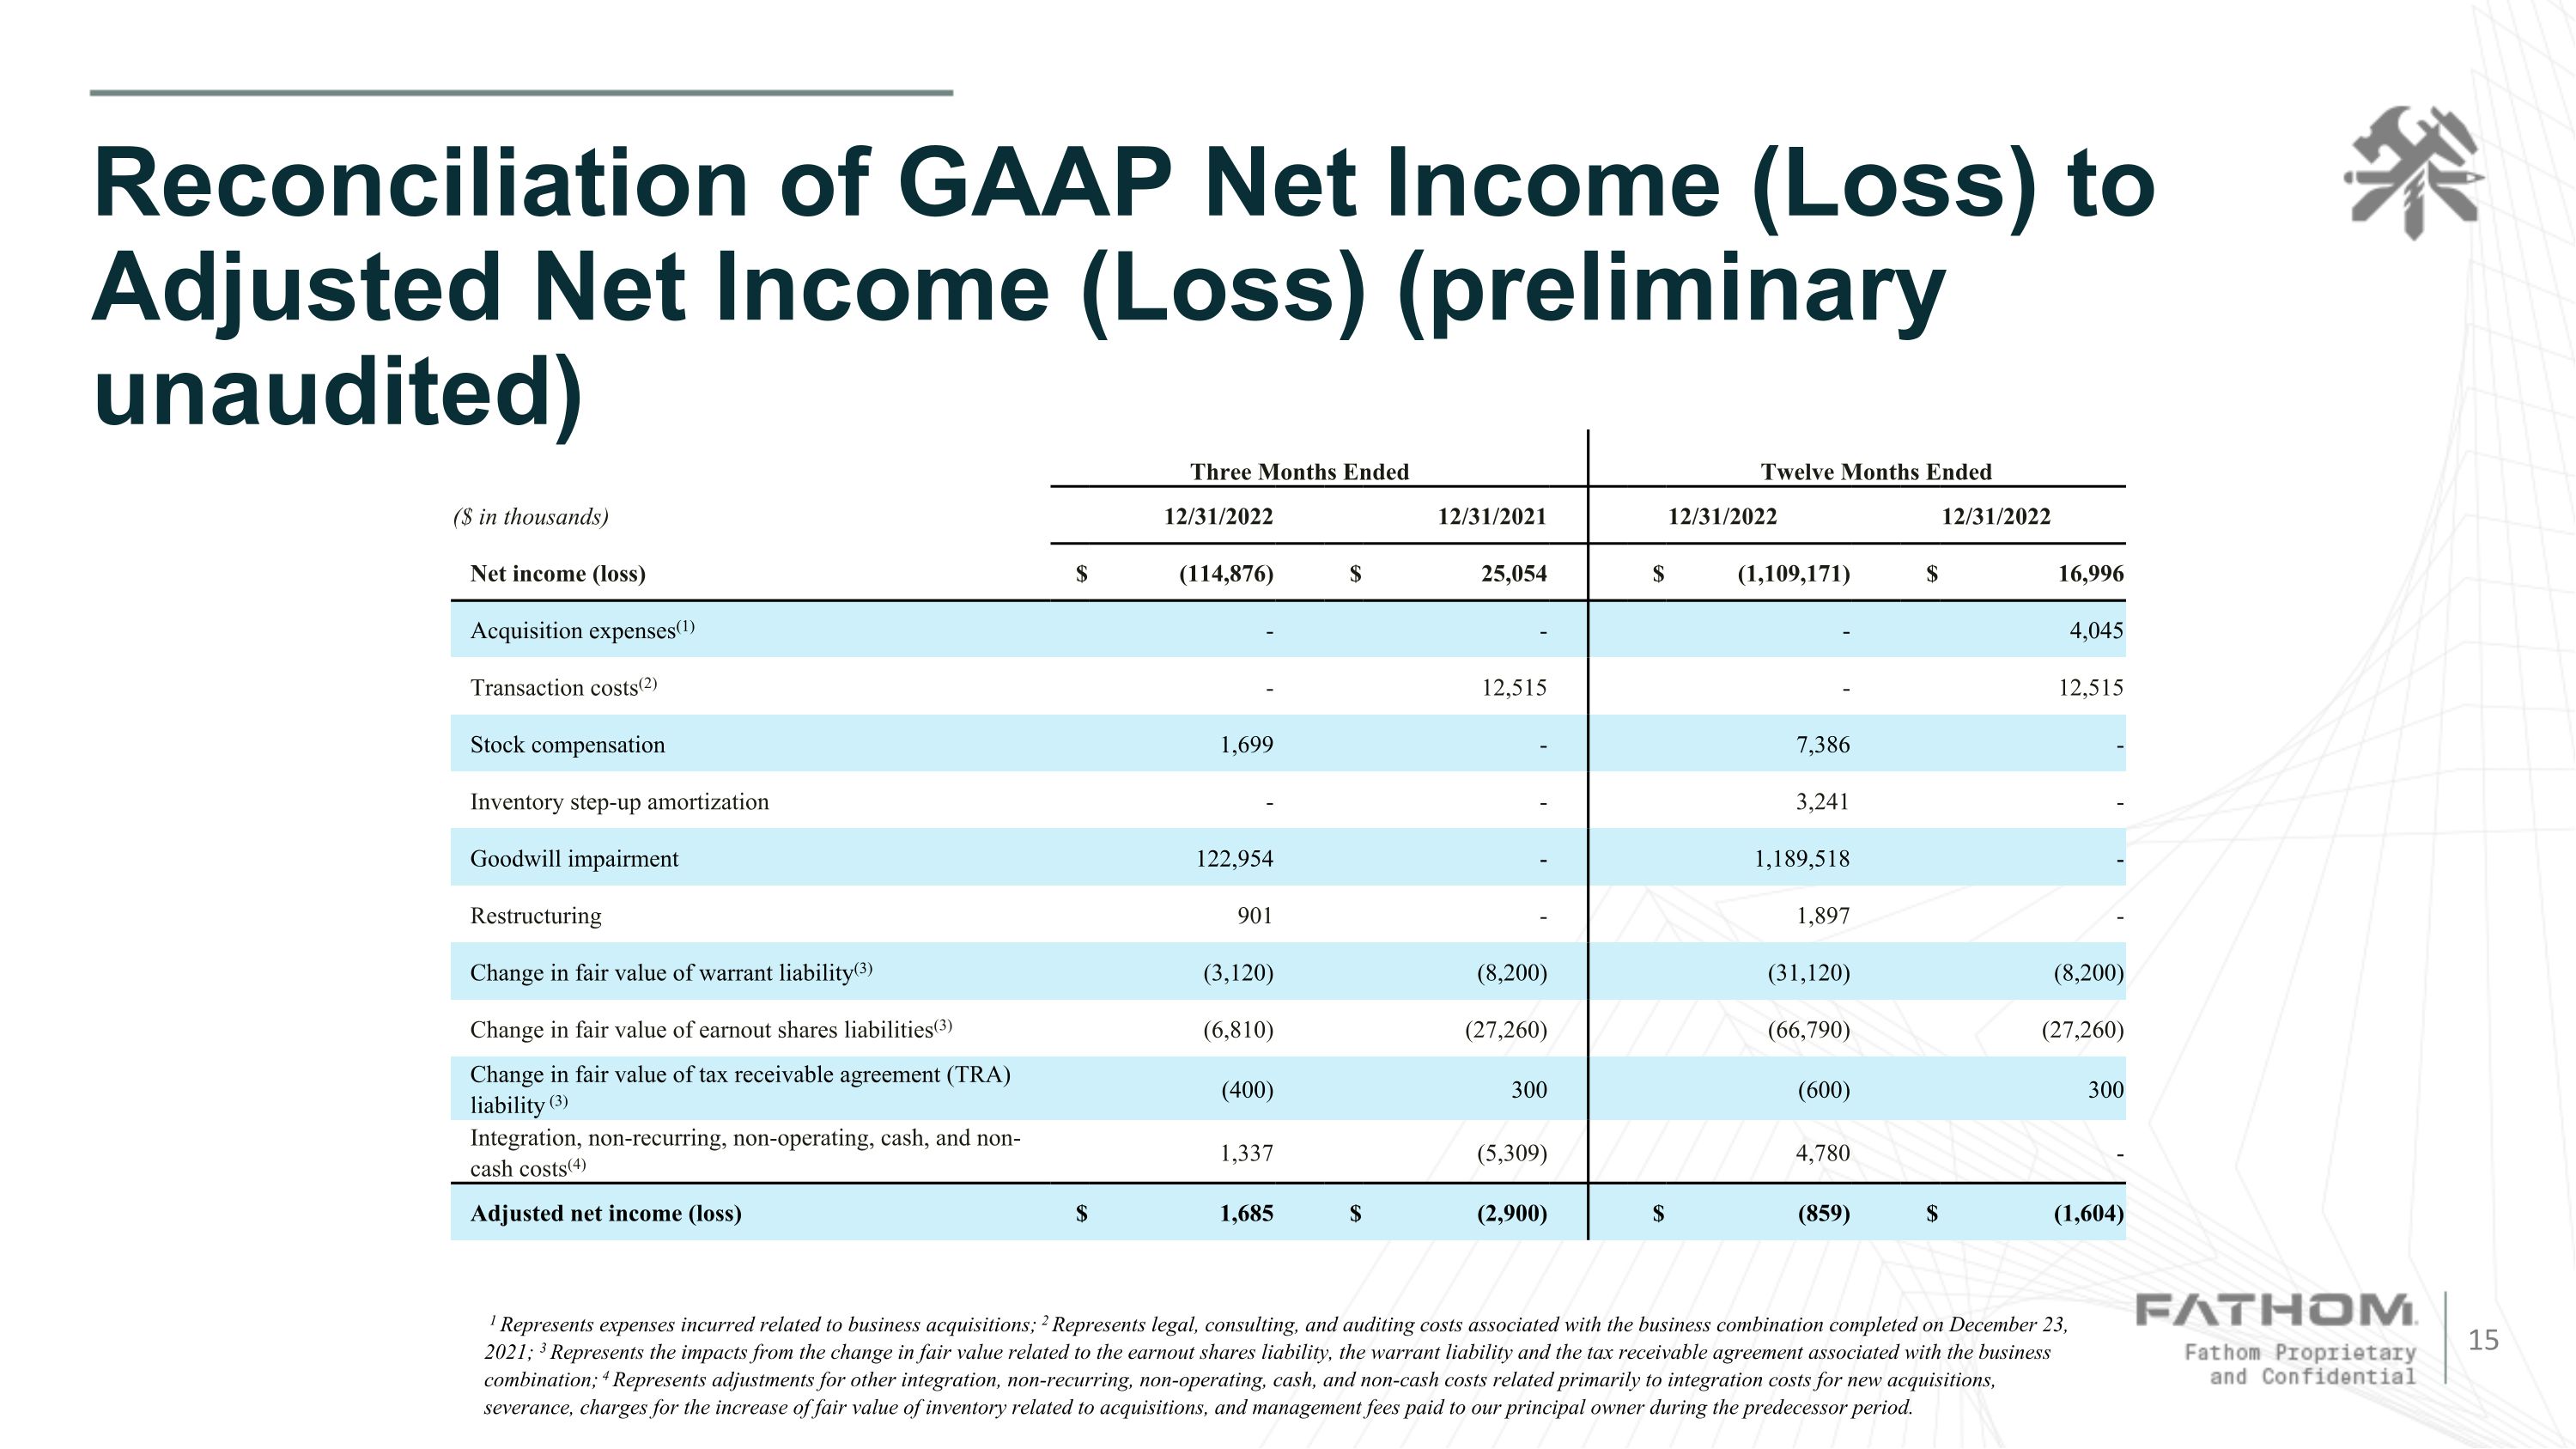
Reconciliation of GAAP Net Income (Loss) to Adjusted Net Income (Loss) (preliminary unaudited) 1 Represents expenses incurred related to business acquisitions; 2 Represents legal, consulting, and auditing costs associated with the business combination completed on December 23, 2021; 3 Represents the impacts from the change in fair value related to the earnout shares liability, the warrant liability and the tax receivable agreement associated with the business combination; 4 Represents adjustments for other integration, non-recurring, non-operating, cash, and non-cash costs related primarily to integration costs for new acquisitions, severance, charges for the increase of fair value of inventory related to acquisitions, and management fees paid to our principal owner during the predecessor period. Three Months Ended Twelve Months Ended ($ in thousands) 12/31/2022 12/31/2021 12/31/2022 12/31/2022 Net income (loss) $ (114,876) $ 25,054 $ (1,109,171) $ 16,996 Acquisition expenses(1) - - - 4,045 Transaction costs(2) - 12,515 - 12,515 Stock compensation 1,699 - 7,386 - Inventory step-up amortization - - 3,241 - Goodwill impairment 122,954 - 1,189,518 - Restructuring 901 - 1,897 - Change in fair value of warrant liability(3) (3,120) (8,200) (31,120) (8,200) Change in fair value of earnout shares liabilities(3) (6,810) (27,260) (66,790) (27,260) Change in fair value of tax receivable agreement (TRA) liability (3) (400) 300 (600) 300 Integration, non-recurring, non-operating, cash, and non-cash costs(4) 1,337 (5,309) 4,780 - Adjusted net income (loss) $ 1,685 $ (2,900) $ (859) $ (1,604)
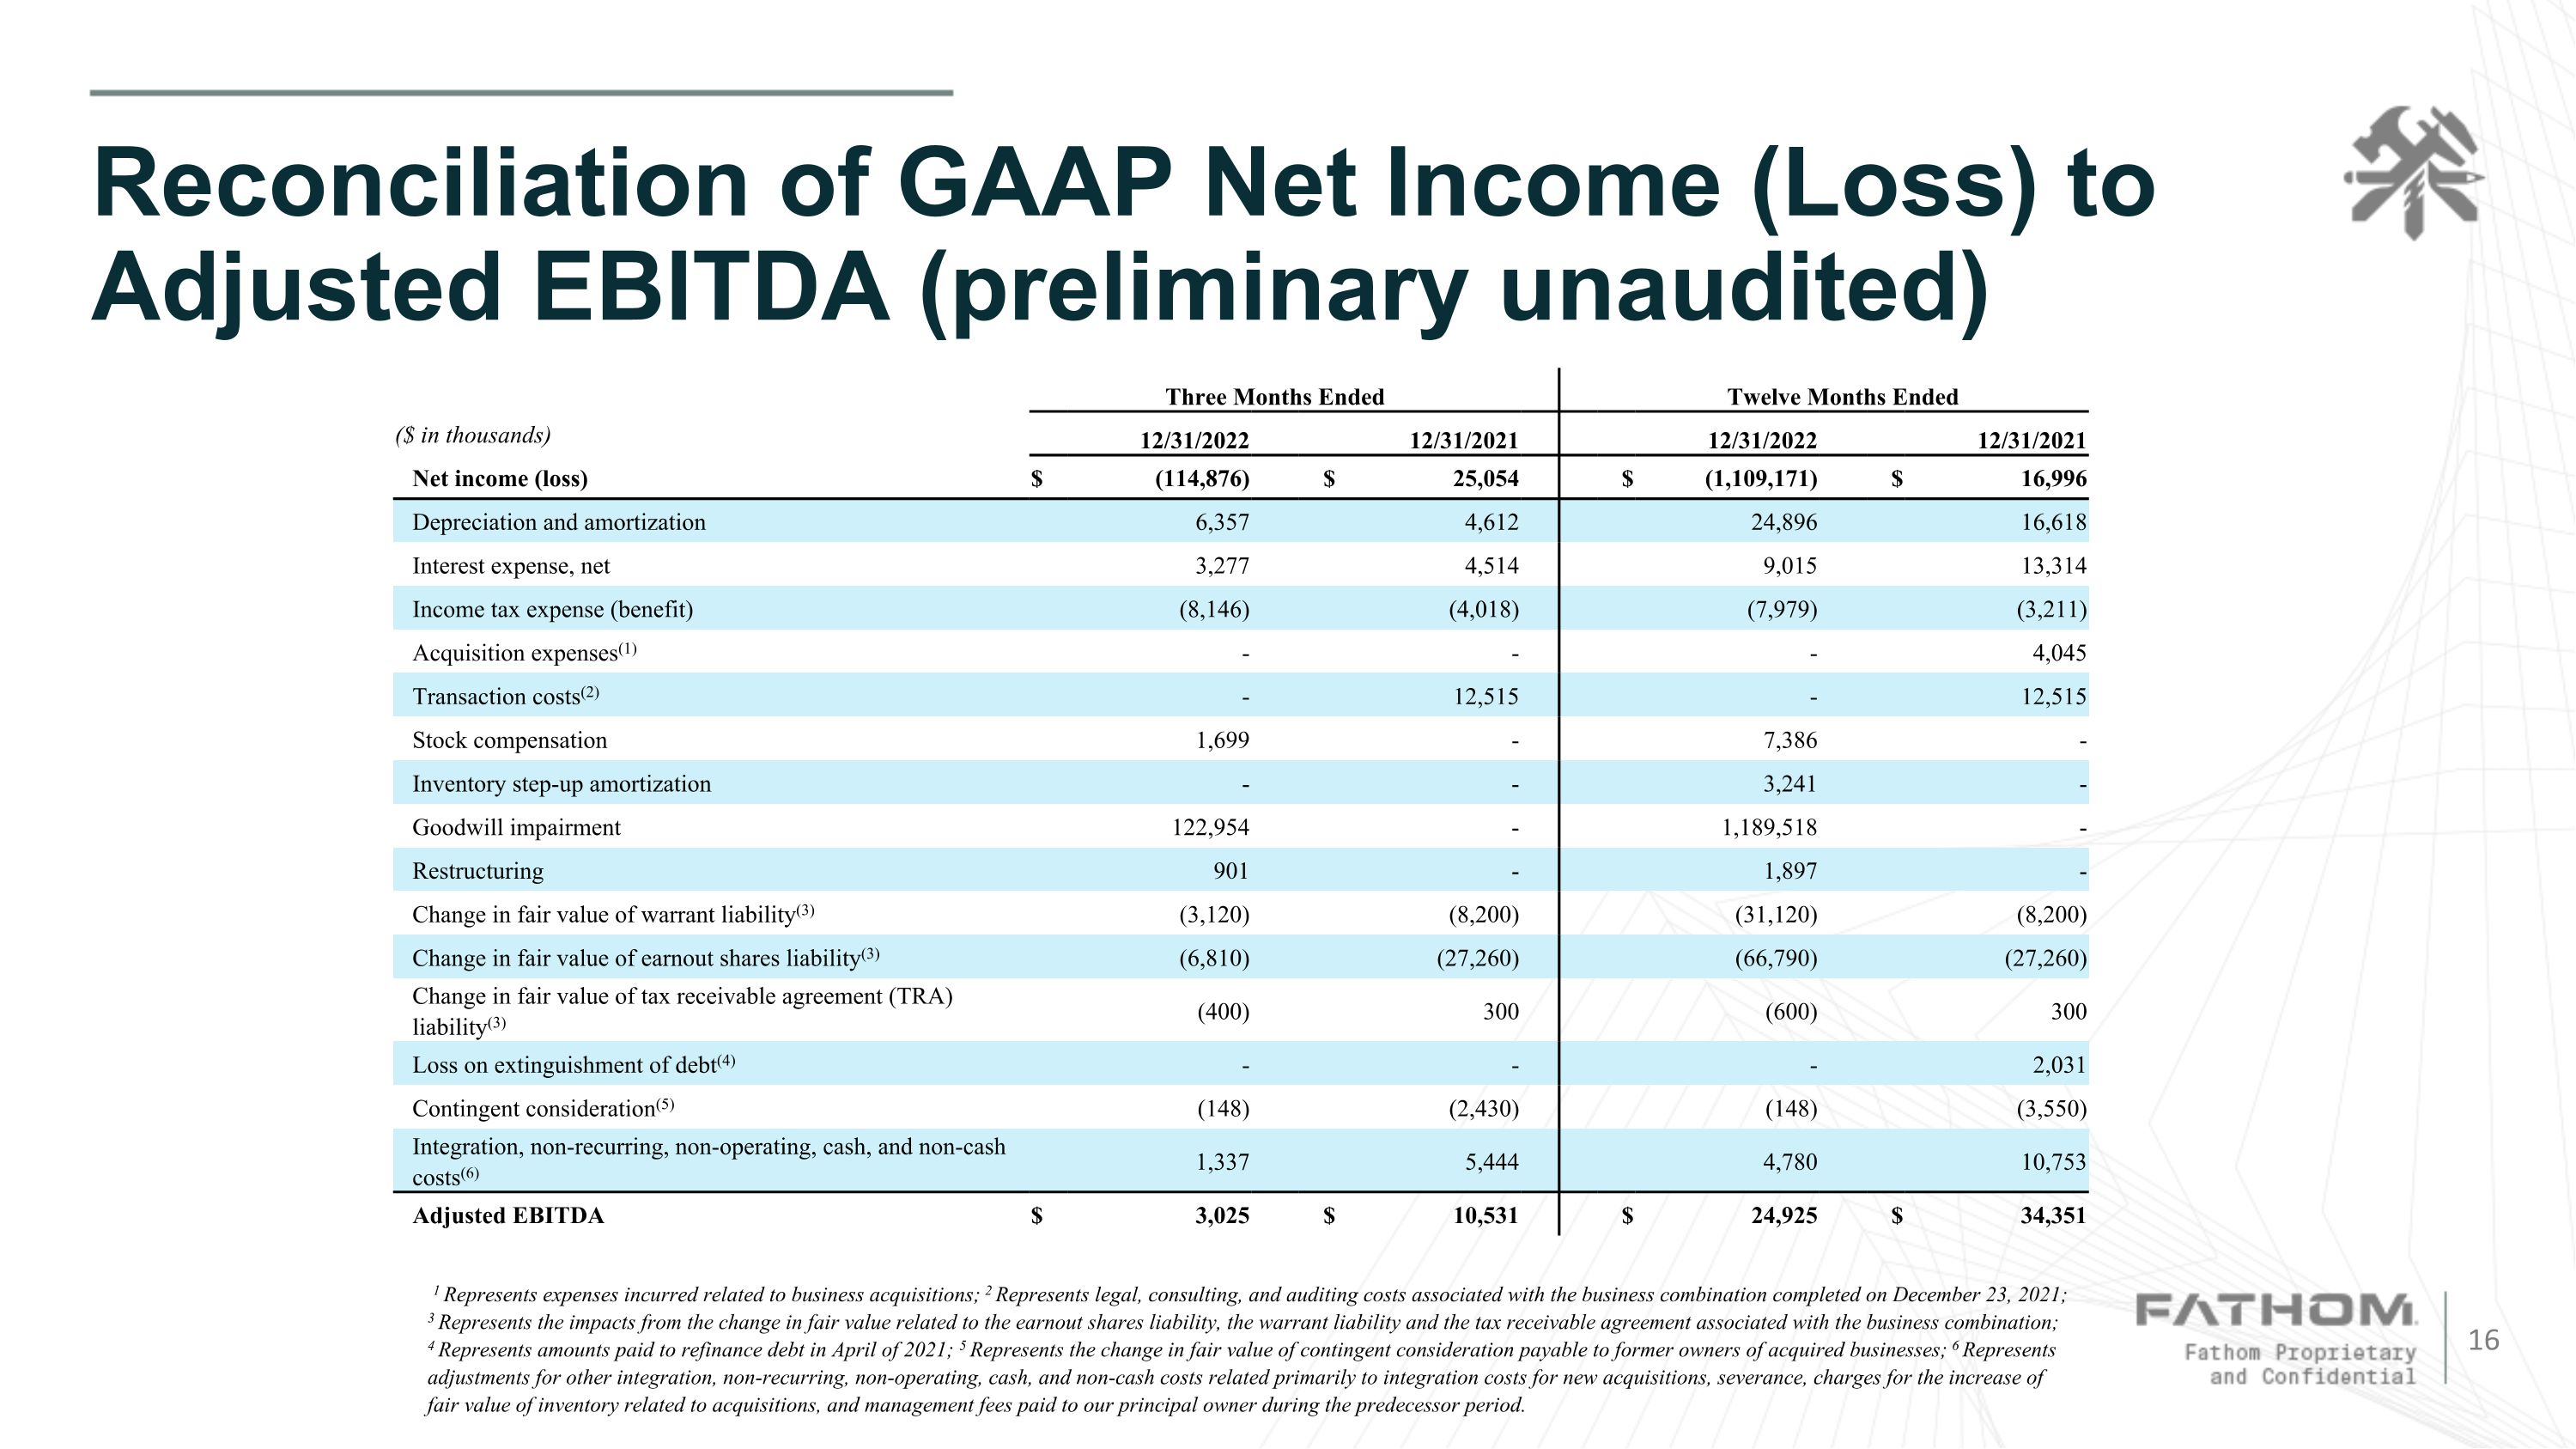
Reconciliation of GAAP Net Income (Loss) to Adjusted EBITDA (preliminary unaudited) 1 Represents expenses incurred related to business acquisitions; 2 Represents legal, consulting, and auditing costs associated with the business combination completed on December 23, 2021; 3 Represents the impacts from the change in fair value related to the earnout shares liability, the warrant liability and the tax receivable agreement associated with the business combination; 4 Represents amounts paid to refinance debt in April of 2021; 5 Represents the change in fair value of contingent consideration payable to former owners of acquired businesses; 6 Represents adjustments for other integration, non-recurring, non-operating, cash, and non-cash costs related primarily to integration costs for new acquisitions, severance, charges for the increase of fair value of inventory related to acquisitions, and management fees paid to our principal owner during the predecessor period. Three Months Ended Twelve Months Ended ($ in thousands) 12/31/2022 12/31/2021 12/31/2022 12/31/2021 Net income (loss) $ (114,876) $ 25,054 $ (1,109,171) $ 16,996 Depreciation and amortization 6,357 4,612 24,896 16,618 Interest expense, net 3,277 4,514 9,015 13,314 Income tax expense (benefit) (8,146) (4,018) (7,979) (3,211) Acquisition expenses(1) - - - 4,045 Transaction costs(2) - 12,515 - 12,515 Stock compensation 1,699 - 7,386 - Inventory step-up amortization - - 3,241 - Goodwill impairment 122,954 - 1,189,518 - Restructuring 901 - 1,897 - Change in fair value of warrant liability(3) (3,120) (8,200) (31,120) (8,200) Change in fair value of earnout shares liability(3) (6,810) (27,260) (66,790) (27,260) Change in fair value of tax receivable agreement (TRA) liability(3) (400) 300 (600) 300 Loss on extinguishment of debt(4) - - - 2,031 Contingent consideration(5) (148) (2,430) (148) (3,550) Integration, non-recurring, non-operating, cash, and non-cash costs(6) 1,337 5,444 4,780 10,753 Adjusted EBITDA $ 3,025 $ 10,531 $ 24,925 $ 34,351
